UNITED STATES
SECURITIES AND EXCHANGE COMMISSION
Washington, D.C. 20549
FORM N-CSR
CERTIFIED SHAREHOLDER REPORT OF REGISTERED
MANAGEMENT INVESTMENT COMPANIES
| | |
| Investment Company Act file number: | | 811-03623 |
| |
| Exact name of registrant as specified in charter: | | The Prudential Series Fund |
| |
| Address of principal executive offices: | | Gateway Center 3, 100 Mulberry Street, Newark, New Jersey 07102 |
| |
| Name and address of agent for service: | | Deborah A. Docs Gateway Center 3, 100 Mulberry Street, Newark, New Jersey 07102 |
| |
| Registrant’s telephone number, including area code: | | 973-367-7521 |
| |
| Date of fiscal year end: | | 12/31/2007 |
| |
| Date of reporting period: | | 12/31/2007 |
Item 1 – Reports to Stockholders
ANNUAL REPORT
DECEMBER 31, 2007
The Prudential Series Fund

| n | | Conservative Balanced Portfolio |
| n | | Diversified Bond Portfolio |
| n | | Flexible Managed Portfolio |
| n | | Government Income Portfolio |
| n | | High Yield Bond Portfolio |
| n | | Natural Resources Portfolio |
| n | | Small Capitalization Stock Portfolio |
Please note that inside is a Prospectus supplement dated November 27, 2007. This is separate from and not a part of the annual report.
IFS-A114446

T | his report is one of several that provide financial information about certain investment choices available on variable life insurance and variable annuity contracts. Based on the variable contract you own or the portfolios you invested in, you may receive additional reports that provide financial information on those investment choices. Please refer to your variable life insurance or variable annuity contract prospectus to determine which portfolios are available to you. |
This report must be preceded or accompanied by the current prospectuses for the Prudential Series Fund portfolios and the applicable variable life or annuity contract. The prospectuses contain information on the investment objectives, risks, and charges and expenses of the portfolios and the contract and should be read carefully.
The contract’s prospectus contains hypothetical performance illustrations that show the effect of various assumptions regarding the cost of insurance protection. You may also obtain a personalized illustration of historical performance that reflects the cost of your contract’s insurance protection.
A description of the Fund’s proxy voting policies and procedures is available, without charge, upon request. Owners of variable annuity contracts should call 888-778-2888 and owners of variable life insurance contracts should call 800-778-2255 to obtain descriptions of the Fund’s proxy voting policies and procedures. The description is also available on the website of the Securities and Exchange Commission (the “Commission”) at www.sec.gov. Information regarding how the Fund voted proxies relating to portfolio securities during the most recent 12-month period ended June 30, is available on the website of the Commission at www.sec.gov and on the Fund’s website.
The Fund files with the Commission a complete listing of portfolio holdings as of its first and third quarter-end on Form N-Q. Form N-Q is available on the Commission’s website at www.sec.gov or by visiting the Commission’s Public Reference Room. For more information on the Commission’s Public Reference Room, please visit the Commission’s website or call 1-800-SEC-0330. Form N-Q is also available on the Fund’s website at www.prudential.com or by calling the telephone numbers referenced above.
The Fund’s Statement of Additional Information contains additional information about the Fund’s Trustees and is available without charge upon request by calling 888-778-2888.
This report may include financial information pertaining to certain portfolios that are not available through the variable life insurance policy or variable annuity contract that you have chosen. Please refer to your variable life insurance or variable annuity prospectus to determine which portfolios are available to you.
The Prudential Series Fund
Glossary of Benchmark Definitions
December 31, 2007
Conservative Balanced Custom Blended Index consists of a blend of the S&P 500 Index (50%), the Lehman Brothers Aggregate Bond Index (40%), and the 3-Month T-Bill (10%).
Flexible Managed Custom Blended Index consists of a blend of the S&P 500 Index (60%), the Lehman Brothers Aggregate Bond Index (35%), and the 3-Month T-Bill (5%).
Lehman Brothers U.S. Aggregate Bond Index is an unmanaged index comprised of more than 5,000 government and corporate bonds.
Lehman Brothers U.S. Corporate High Yield Index is an unmanaged index of fixed-rate, non-investment-grade debt securities with at least one year remaining to maturity. It gives a broad look at how high yield (“junk”) bonds have performed.
Lehman Brothers U.S. Corporate High Yield 2% Issuer Capped index covers the universe of U.S. dollar denominated, non-convertible, fixed-rate, non-investment-grade debt. Issuers are capped at 2% of the Index. Index holdings must have at least one year to final maturity, at least $150 million par amount outstanding, and be publicly issued with a rating of Ba1 or lower.
Lehman Brothers Government Bond Index is an unmanaged index comprised of securities issued or backed by the U.S. government, its agencies, and instrumentalities with a remaining maturity of 1 to 30 years.
The Lipper Variable Insurance Products (VIP) Funds Averages are calculated by Lipper Analytical Services, Inc., and reflect the investment return of certain portfolios underlying variable life and annuity products.
| | | | |
| General U.S. Government Funds Average | | Large-Cap Growth Funds Average | | Small-Cap Core Funds Average |
| Global Growth Funds Average | | Large-Cap Value Funds Average | | Large-Cap Core Funds Average |
| High Current Yield Funds Average | | Money Market Funds Average | | |
| International Growth Funds Average | | Multi-Cap Value Funds Average | | |
| Mixed Asset Target Allocation Growth Funds Avg. | | Natural Resources Funds Average | | |
| Mixed Asset Target Allocation Moderate Funds Avg. | | S&P 500 Index Objective Funds Average | | |
Lipper Variable Underlying Funds (VUF) Natural Resources Funds Index consists of an equal dollar-weighted composite of the 10 largest funds in the Lipper VUF Natural Resources fund classification. The index is rebalanced quarterly. Natural Resources funds are defined as funds that invest primarily in the equity securities of domestic and foreign companies engaged in natural resources.
Morgan Stanley Capital International Europe, Australasia, and the Far East (MSCI EAFE) Index (GD) — The Morgan Stanley Capital International Europe, Australasia, Far East Index is an unmanaged capitalization-weighted index generally accepted as a benchmark for major overseas markets. The GD version does not reflect the impact of withholding taxes on reinvested dividends. These returns do not include the effect of any investment management expenses. These returns would have been lower if they included the effect of these expenses.
Morgan Stanley Capital International (MSCI) World Index (GD) — The Morgan Stanley Capital International World Index is an unmanaged capitalization weighted index which includes the equity markets of Australia, Austria, Belgium, Canada, Denmark, Finland, France, Germany, Hong Kong, Ireland, Italy, Japan, Malaysia, Netherlands, New Zealand, Norway, Singapore, Spain, Sweden, Switzerland, United Kingdom and United States. The GD version does not reflect the impact of withholding taxes on reinvested dividends. These returns do not include the effect of any investment management expenses. These returns would have been lower if they included the effect of these expenses.
Russell 1000 Growth Index is a market cap-weighted index that measures the performance of those Russell 1000 companies with higher price-to-book ratios and higher forecasted growth values.
Russell 1000 Index is a market cap-weighted index that measures the performance of the 1,000 largest companies in the Russell 3000 Index, which represents approximately 92% of the total market.
Russell 1000 Value Index is a market cap-weighted index that measures the performance of those Russell 1000 companies with lower price-to-book ratios and lower forecasted growth values.
Russell 3000 Index is a market cap-weighted index that measures the performance of the 3,000 largest U.S. companies based on total market capitalization, which represents approximately 98% of the investable U.S. equity market.
S&P 500 Index is an unmanaged, market value-weighted index of 500 stocks generally representative of the broad stock market.
S&P SmallCap 600 Index is an unmanaged index representing the aggregate market value of the common equity of 600 small-company stocks.
This page may include certain benchmarks not applicable to the portfolios available in this particular report. Investors cannot invest directly in a market index or average. These returns are net of investment fees and fund expenses, but not product charges.
The Prudential Series Fund
Annual Report
December 31, 2007
Table of Contents
| n | | LETTER TO CONTRACT OWNERS |
| n | | FEES AND EXPENSES TABLE |
A1 Schedule of Investments and Financial Statements
B1 Notes to Financial Statements
C1 Financial Highlights
D1 Report of Independent Registered Accounting Firm
E1 Management of the Prudential Series Fund
| n | | APPROVAL OF ADVISORY AGREEMENTS |
This report may include financial information pertaining to certain portfolios that are not available through the variable life insurance policy or variable annuity contract that you have chosen. Please refer to your variable life insurance or variable annuity prospectus to determine which portfolios are available to you.
The Prudential Series Fund
Letter to Contract Owners
Annual Report
December 31, 2007
At Prudential, it is our goal to help our clients achieve and maintain financial success. We hope you find the Prudential Series Fund annual report both informative and useful.
We would also like to remind you about the benefits of diversifying your investment portfolio. In today’s volatile markets, diversification is key to protecting your investments. It helps position your investments when asset classes rotate in and out of favor, and is the best way to balance risk and return. In addition, diversification can help you meet your long-term investment goals although it does not assure against loss in declining markets.
Take the first step and contact your financial professional for help in creating a diversified investment portfolio. A comprehensive mix of assets that is evaluated periodically over time can help you maintain focus on your financial objectives.
Thank you for selecting our products. We value the opportunity to manage your investments as you plan for the future.
Sincerely,

David R. Odenath, Jr.
President,
The Prudential Series Fund | January 31, 2008 |

PRESIDENT
DAVID R. ODENATH, JR.
The Prudential Series Fund, Conservative Balanced Portfolio
Subadvised by: Prudential Investment Management, Inc., Quantitative Management Associates LLC
December 31, 2007
Investment Manager’s Report
Performance Summary - As of December 31, 2007
Average Annual Total Return Percentages
| | | | | | | | | |
| | | 1-Year | | | 5-Year | | | 10-Year | |
Conservative Balanced Portfolio | | 6.12 | % | | 9.24 | % | | 5.11 | % |
S&P 500 Index | | 5.49 | | | 12.82 | | | 5.91 | |
Conservative Balanced Custom Blended Index | | 6.10 | | | 8.51 | | | 6.02 | |
Lipper Mixed Asset Target Allocation Growth Funds Avg. | | 6.78 | | | 10.68 | | | 6.02 | |
Portfolio inception: 5/13/1983.
$10,000 INVESTED OVER 10 YEARS

Past performance does not guarantee future returns. Portfolio performance is net of investment fees and fund expenses, but not product charges, which, if included, would significantly lower the performance quoted. The investment return and principal value of an investment will fluctuate, so that an investor’s shares, when redeemed, may be worth more or less than their original cost. Current performance may be lower or higher than the past performance data quoted.
Unless noted otherwise, Lipper Average and Index returns reflect performance beginning the closest month-end date to the Portfolio’s inception. Performance figures may reflect fee waivers and/or expense reimbursements. In the absence of such fee waivers and/or expense reimbursements, total returns would be lower.
For the year ended December 31, 2007, the Conservative Balanced Portfolio had a total return that was in line with its Blended Index (50% stock, 40% bond, 10% cash) but below the average return of its peer group.
Quantitative Management Associates LLC (QMA) uses its proprietary asset allocation model to construct portfolios that invest in the three major classes of assets – stocks, debt securities, and cash. The latter may also include money market funds, U.S. Treasury bills, and other cash-equivalent securities.
QMA manages the portion of the Portfolio that invests in stocks. The Portfolio performed in line with its Blend Index, helped by its exposure to the stock of a foreign corporation. Foreign stock exposure accounted for about 8% of its assets at the end of the year. Shares of foreign companies are not included in the Blend Index as its equity component, the S&P 500 Index, is composed of shares of companies based in the United States. Foreign stock markets, as measured by the Morgan Stanley Capital International Europe, Australasia, and Far East (MSCI EAFE) Index, outperformed the S&P 500 Index in 2007. Much of the rise in the MSCI EAFE Index was attributable to the decline in the value of the U.S. dollar versus the euro. The U.S. dollar weakened as the Federal Reserve repeatedly cut short-term interest rates to stimulate growth in a U.S. economy that had begun to lose steam. At the end of the year, QMA continued to favor investing in stocks over investing in cash equivalent securities.
Prudential Investment Management, Inc. manages the portion of the Portfolio that invests in debt securities and cash. In 2007, that portion of the Portfolio outperformed the Lehman Brothers U.S. Aggregate Bond Index, which is the fixed income component of the Blend Index.
Prudential Investments LLC (PI), an indirect, wholly owned subsidiary of Prudential Financial, Inc., serves as the investment manager for the Fund.
For average and index definitions, refer to the Glossary of Benchmark Definitions page. Investors cannot invest directly in a market index or average. For a complete list of holdings refer to the Schedule of Investments section of this report.
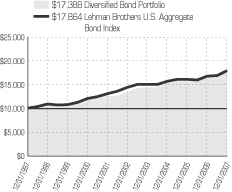
The Prudential Series Fund, Diversified Bond Portfolio
Subadvised by: Prudential Investment Management, Inc.
December 31, 2007
Investment Manager’s Report
Performance Summary - As of December 31, 2007
Average Annual Total Return Percentages
| | | | | | | | | |
| | | 1-Year | | | 5-Year | | | 10-Year | |
Diversified Bond Portfolio | | 5.71 | % | | 5.40 | % | | 5.69 | % |
Lehman Brothers U.S Aggregate Bond Index | | 6.97 | | | 4.42 | | | 5.97 | |
Lipper VP Intermediate Investment Grade Debt Funds Avg. | | 6.25 | | | 4.39 | | | 5.57 | |
Portfolio inception: 5/13/1983.
$10,000 INVESTED OVER 10 YEARS
Past performance does not guarantee future returns. Portfolio performance is net of investment fees and fund expenses, but not product charges, which, if included, would significantly lower the performance quoted. The investment return and principal value of an investment will fluctuate, so that an investor’s shares, when redeemed, may be worth more or less than their original cost. Current performance may be lower or higher than the past performance data quoted.
Unless noted otherwise, Lipper Average and Index returns reflect performance beginning the closest month-end date to the Portfolio’s inception. Performance figures may reflect fee waivers and/or expense reimbursements. In the absence of such fee waivers and/or expense reimbursements, total returns would be lower.
For the year ended December 31, 2007, the Diversified Bond Portfolio had a total return that was below its benchmark index and the average of its peer group.
The Federal Reserve (the Fed) held monetary policy steady during the first half of the year, but it repeatedly cut short-term interest rates in the second half, as a meltdown in debt securities linked to risky mortgages escalated into a full-fledged credit crisis that threatened the U.S. economic expansion. Investors seeking refuge from turmoil in the financial markets favored highly rated investment grade bonds such as U.S. Treasury securities. Consequently, Treasurys outperformed all other sectors of the U.S. bond market, including federal agency securities, investment-grade corporate bonds, high yield corporate “junk” bonds, residential mortgage-backed securities, commercial mortgage-backed securities, and asset-backed securities, which are backed by underlying pools of assets such as home equity loans and auto loans. Wall Street refers to these debt securities as “spread product” because the difference between their yield and the yield of a comparable Treasury security is called the spread.
The Portfolio underperformed its benchmark index because of its overweight exposure to spread product such as high-quality corporate bonds and asset-backed securities. Its exposure to high yield corporate bonds and emerging market bonds, which are not included in the benchmark, also hurt its relative performance.
The Portfolio’s relative performance benefited from its participation in a type of two-party contract called a credit default swap. Under this contract, the Portfolio paid a fee to the seller of the swap who agreed to pay the Portfolio an amount equal to the face value of certain BBB-rated asset-backed securities backed by home equity loans held by the Portfolio if the securities failed to pay interest and principal. As the subprime mortgage crisis worsened, the credit default swap gained in value, reflecting the growing risk associated with investing in debt securities backed by home equity loans. However, the positive impact from this strategy was partially offset by poor security selection among residential mortgage-backed securities, investment-grade corporate bonds, Treasurys, and emerging market bonds.
Prudential Investments LLC (PI), an indirect, wholly owned subsidiary of Prudential Financial, Inc., serves as the investment manager for the Fund.
For average and index definitions, refer to the Glossary of Benchmark Definitions page. Investors cannot invest directly in a market index or average. For a complete list of holdings refer to the Schedule of Investments section of this report.
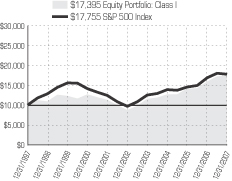
The Prudential Series Fund, Equity Portfolio
Subadvised by: Jennison Associates LLC, ClearBridge Advisors, LLC
December 31, 2007
Investment Manager’s Report
Performance Summary - As of December 31, 2007
Average Annual Total Return Percentages
| | | | | | | | | | | | |
| | | 1-Year | | | 5-Year | | | 10-Year | | | Since
Inception | |
Equity Portfolio: Class I | | 9.32 | % | | 14.70 | % | | 5.69 | % | | N/A | |
Equity Portfolio: Class II | | 8.91 | | | 14.25 | | | N/A | | | 3.62 | % |
S&P 500 Index | | 5.49 | | | 12.82 | | | 5.91 | | | 2.76 | |
Russell 1000® Index | | 5.77 | | | 13.43 | | | 6.20 | | | 3.29 | |
Lipper Large-Cap Core Funds Avg. | | 5.78 | | | 12.19 | | | 5.06 | | | 2.57 | |
Portfolio (Class I) inception: 5/13/1983. Portfolio (Class II) inception: 5/4/1999.
$10,000 INVESTED OVER 10 YEARS1
Past performance does not guarantee future returns. Portfolio performance is net of investment fees and fund expenses, but not product charges, which, if included, would significantly lower the performance quoted. The investment return and principal value of an investment will fluctuate, so that an investor’s shares, when redeemed, may be worth more or less than their original cost. Current performance may be lower or higher than the past performance data quoted.
Unless noted otherwise, Lipper Average and Index returns reflect performance beginning the closest month-end date to the Portfolio’s inception (Class II).
The Russell 1000® Index is a trademark/service mark of the Frank Russell Company. Russell® is a trademark of the Frank Russell Company. Performance figures may reflect fee waivers and/or expense reimbursements. In the absence of such fee waivers and/or expense reimbursements, total returns would be lower.
For the year ended December 31, 2007, the Equity Portfolio had a total return that was above its benchmarks and the average return of its peer group.
Jennison Associates managed half the Portfolio, and ClearBridge Advisors managed the other half. Both portions contributed favorable stock selection, which was the primary reason the Portfolio outperformed its benchmarks for the year. Holdings in the energy sector, the consumer services sector (the media industry), and the technology sector (the electronic equipment and computer hardware industries) boosted the Portfolio’s performance.
The market environment generally favored growth stocks, which outperformed value stocks in 2007. Therefore, the Portfolio’s underweight exposure to stocks with value characteristics such as high dividend yields, low price-to-book ratios, and low price-to-earnings ratios had a slightly positive impact on its relative performance.
Allocation to various sectors of the stock market also had a slightly positive impact on the Portfolio’s performance due to the portion managed by Jennison. Compared to its benchmarks, the Portfolio had an underweight exposure to the financials sector, which was beset by problems as a meltdown in mortgages of less creditworthy borrowers escalated into a full-fledged financial crisis.
Prudential Investments LLC (PI), an indirect, wholly owned subsidiary of Prudential Financial, Inc., serves as the investment manager for the Fund.
1 | The graph is based on the performance of Class I shares. Performance of Class II shares will be lower due to differences in the fee structure. Class II shares have associated 12b-1 and administrative fees at an annual rate of 0.25% and 0.15% respectively of the average daily net assets of the Class II shares. |
For average and index definitions, refer to the Glossary of Benchmark Definitions page. Investors cannot invest directly in a market index or average. For a complete list of holdings, refer to the Schedule of Investments section of this report.
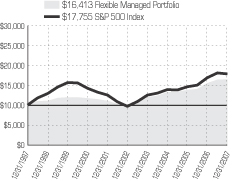
The Prudential Series Fund, Flexible Managed Portfolio
Subadvised by: Prudential Investment Management, Inc., Quantitative Management Associates, LLC
December 31, 2007
Investment Manager’s Report
Performance Summary - As of December 31, 2007
Average Annual Total Return Percentages
| | | | | | | | | |
| | | 1-Year | | | 5-Year | | | 10-Year | |
Flexible Managed Portfolio | | 6.36 | % | | 11.24 | % | | 5.08 | % |
S&P 500 Index | | 5.49 | | | 12.82 | | | 5.91 | |
Flexible Managed Custom Blended Index | | 6.08 | | | 9.42 | | | 6.13 | |
Lipper Mixed Target Allocation Growth Funds Avg. | | 6.78 | | | 10.68 | | | 6.02 | |
Portfolio inception: 5/13/1983.
$10,000 INVESTED OVER 10 YEARS
Past performance does not guarantee future returns. Portfolio performance is net of investment fees and fund expenses, but not product charges, which, if included, would significantly lower the performance quoted. The investment return and principal value of an investment will fluctuate, so that an investor’s shares, when redeemed, may be worth more or less than their original cost. Current performance may be lower or higher than the past performance data quoted.
Unless noted otherwise, Lipper Average and Index returns reflect performance beginning the closest month-end date to the Portfolio’s inception. Performance figures may reflect fee waivers and/or expense reimbursements. In the absence of such fee waivers and/or expense reimbursements, total returns would be lower.
For the year ended December 31, 2007, the Flexible Managed Portfolio had a total return that was above its Blended Index (60% stocks, 35% bonds, 5% cash).
The Portfolio’s stock holdings are actively managed with risk characteristics similar to those of the S&P 500 Index. Its bond holdings are also actively managed and focus on high-grade bonds, relative to the Lehman Brothers Aggregate Bond index. Allocations to these asset classes are managed within a fairly wide range to take advantage of different market conditions. The more bullish management is on the equity market, the more their allocation will favor equities. As management becomes more bearish, allocations to debt and money markets will increase. The portfolio may also contain an allocation to the MSCI EAFE Index, when the managers believe it is warranted.
An overweight position in equities, which performed quite well during the first part of the year, drove the Portfolio’s outperformance relative to its benchmark. Stocks continued an upward trend in the third quarter, with the S&P 500 index rising to new peaks. U.S. exporters within the S&P 500 benefited from a fall in the dollar against the euro. However, a sharp acceleration in home mortgage defaults jolted financial markets. As markets moved downward in the latter part of the year, the S&P 500 index fell from its record highs. While some international markets, mostly those in Europe, were shaken by the ripple effect of the mortgage crisis and credit crunch, foreign markets were able to outpace U.S. returns. As a result, the MSCI EAFE index effectively doubled the return of the S&P 500 index.
The Portfolio’s bond holdings exceeded the returns of its benchmark. Despite underperforming in the fourth quarter, returns were ahead of the benchmark for the overall year. At year-end, the manager continued to favor equities over cash, a positioning that was consistent with its proprietary asset allocation model.
Prudential Investments LLC (PI), an indirect, wholly owned subsidiary of Prudential Financial, Inc., serves as the investment manager for the Fund.
For average and index definitions, refer to the Glossary of Benchmark Definitions page. Investors cannot invest directly in a market index or average. For a complete list of holdings refer to the Schedule of Investments section of this report.
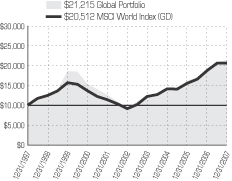
The Prudential Series Fund, Global Portfolio
Subadvised by: William Blair & Company LLC, LSV Asset Management, Marsico Capital Management, LLC, T. Rowe Price Associates, Inc.
December 31, 2007
Investment Manager’s Report
Performance Summary - As of December 31, 2007
Average Annual Total Return Percentages
| | | | | | | | | |
| | | 1-Year | | | 5-Year | | | 10-Year | |
Global Portfolio | | 10.48 | % | | 17.65 | % | | 7.81 | % |
MSCI World Index (GD) | | 9.57 | | | 17.53 | | | 7.45 | |
Lipper (VIP) Global Growth Funds Avg. | | 12.32 | | | 18.70 | | | 8.90 | |
Portfolio inception: 9/19/1988.
$10,000 INVESTED OVER 10 YEARS
Past performance does not guarantee future returns. Portfolio performance is net of investment fees and fund expenses, but not product charges, which, if included, would significantly lower the performance quoted. The investment return and principal value of an investment will fluctuate, so that an investor’s shares, when redeemed, may be worth more or less than their original cost. Current performance may be lower or higher than the past performance data quoted.
Unless noted otherwise, Lipper Average and Index returns reflect performance beginning the closest month-end date to the Portfolio’s inception. Performance figures may reflect fee waivers and/or expense reimbursements. In the absence of such fee waivers and/or expense reimbursements, total returns would be lower.
For the year ended December 31, 2007, the Global Portfolio outperformed its benchmark, the MSCI World Index, but was below the average of its peer group.
The Portfolio is co-managed by four specialist subadvisers. Marsico Capital Management manages large-cap domestic growth stocks. T. Rowe Price manages large-cap domestic value stocks. William Blair & Company manages international growth stocks. LSV Asset Management manages international value stocks. Each firm is responsible for approximately a quarter of the Portfolio’s assets. We expect this diversified structure to reduce style and risk exposures, so that most of the Portfolio’s variance from its benchmark will be due to its co-managers’ stock selection. The major exception is that William Blair has the flexibility to invest in emerging markets stocks, which are not part of the Portfolio’s benchmark.
During 2007, the Portfolio benefited from an overweight allocation toward international equities, as well as an overweight position to growth stocks within the Portfolio’s domestic equity allocation. In the second half of the year, the market took a turn that favored firms with large capitalizations. This trend picked up steam when a financial crisis tied to risky mortgages sent investors fleeing to shares of companies with consistent earnings growth. As a result, international growth stocks significantly outperformed international value stocks. This was evident in the MSCI EAFE Index (the Index), as value stocks underperformed growth stocks by the widest margin since the EAFE Value and Growth indexes were created.
Accordingly, the portions of the Portfolio that outperformed mostly did so by taking positions in companies exhibiting growth attributes. Positions within specific emerging market countries also augmented performance relative to the Index. The Marsico Large-Cap Growth portion gained from strong stock selection, particularly within the financials, basic materials, telecommunications, and consumer services sectors. The T. Rowe Price Large Cap Value portion was rewarded as growth-oriented stocks outperformed “deep value” companies, as did companies with less debt on their balance sheets, due to the market turmoil related to the mortgage crisis. The William Blair International Growth portion outperformed the Index by a wide margin. The manager’s exposure to emerging markets countries Brazil and China helped to enhance the Portfolio’s value. Additionally, stock selection, particularly within financials, energy, and technology, contributed positively to relative performance.
The LSV International Value portion’s deep value approach and below-benchmark market cap exposure, however, underperformed the Index.
Prudential Investments LLC (PI), an indirect, wholly owned subsidiary of Prudential Financial, Inc., serves as the investment manager for the Fund.
For average and index definitions, refer to the Glossary of Benchmark Definitions page. Investors cannot invest directly in a market index or average. For a complete list of holdings refer to the Schedule of Investments section of this report.
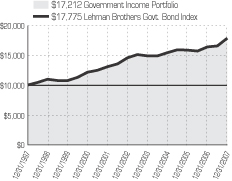
The Prudential Series Fund, Government Income Portfolio
Subadvised by: Prudential Investment Management, Inc.
December 31, 2007
Investment Manager’s Report
Performance Summary - As of December 31, 2007
Average Annual Total Return Percentages
| | | | | | | | | |
| | | 1-Year | | | 5-Year | | | 10-Year | |
Government Income Portfolio | | 5.70 | % | | 3.50 | % | | 5.58 | % |
Lehman Brothers Govt. Bond Index | | 8.66 | | | 4.10 | | | 5.92 | |
Lipper (VIP) General U.S. Govt. Funds Avg. | | 7.34 | | | 3.72 | | | 5.25 | |
Portfolio inception: 5/1/1989.
$10,000 INVESTED OVER 10 YEARS
Past performance does not guarantee future returns. Portfolio performance is net of investment fees and fund expenses, but not product charges, which, if included, would significantly lower the performance quoted. The investment return and principal value of an investment will fluctuate, so that an investor’s shares, when redeemed, may be worth more or less than their original cost. Current performance may be lower or higher than the past performance data quoted.
Unless noted otherwise, Lipper Average and Index returns reflect performance beginning the closest month-end date to the Portfolio’s inception. Performance figures may reflect fee waivers and/or expense reimbursements. In the absence of such fee waivers and/or expense reimbursements, total returns would be lower.
For the year ended December 31, 2007, the Government Income Portfolio had a total return that was below its benchmark index and the average of its peer group.
The Federal Reserve (the Fed) held monetary policy steady during the first half of the year, but it repeatedly cut short-term interest rates in the second half, as a meltdown in debt securities linked to risky mortgages escalated into a full-fledged credit crisis that threatened the U.S. economic expansion. Investors seeking refuge from turmoil in the financial markets favored highly rated investment grade bonds such as U.S. Treasury securities. Consequently, Treasurys outperformed all other sectors of the U.S. bond market, including federal agency securities, investment-grade corporate bonds, high yield corporate “junk” bonds, residential mortgage-backed securities, commercial mortgage-backed securities, and asset-backed securities. The latter pay interest based upon the cash flow of an underlying pool of assets such as home equity loans, automobile loans, or credit card receivables. Wall Street refers to these types of debt securities as “spread product” because the difference between their yield and the yield of a comparable Treasury security is called the spread.
Three key factors caused the Portfolio to underperform its benchmark index. The first was its exposure to spread product, including federal agency securities, residential mortgage-backed securities, investment-grade corporate bonds, and emerging market bonds. The second was its strategy concerning the yield curve, a graph that depicts the relationship between yields on short- and long-term bonds. The slope of the U.S. yield curve became steeper in response to the Fed’s rate cuts. Therefore, Prudential Investment Management’s strategy that anticipated a flatter yield curve detracted from the Portfolio’s relative performance. The third factor was poor security selection among Treasurys, residential mortgage-backed securities, emerging market bonds, and swap transactions. However, this was partially offset by favorable security selection among federal agency securities, investment-grade corporate bonds, AAA-rated asset-backed securities, and AAA-rated commercial mortgage-backed securities.
Prudential Investments LLC (PI), an indirect, wholly owned subsidiary of Prudential Financial, Inc., serves as the investment manager for the Fund.
For average and index definitions, refer to the Glossary of Benchmark Definitions page. Investors cannot invest directly in a market index or average. For a complete list of holdings refer to the Schedule of Investments section of this report.
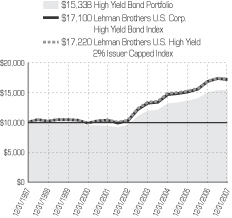
The Prudential Series Fund, High Yield Bond Portfolio
Subadvised by: Prudential Investment Management, Inc.
December 31, 2007
Investment Manager’s Report
Performance Summary - As of December 31, 2007
Average Annual Total Return Percentages
| | | | | | | | | |
| | | 1-Year | | | 5-Year | | | 10-Year | |
High Yield Bond Portfolio | | 2.62 | % | | 10.04 | % | | 4.37 | % |
Lehman Brothers U.S. Corp. High Yield Bond Index | | 1.87 | | | 10.90 | | | 5.51 | |
Lehman Brothers U.S. High Yield 2% Issuer Capped Index | | 2.27 | | | 10.74 | | | 5.59 | |
Lipper (VIP) High Current Yield Funds Average | | 2.56 | | | 9.62 | | | 4.09 | |
Portfolio inception: 2/23/1987.
$10,000 INVESTED OVER 10 YEARS
Past performance does not guarantee future returns. Portfolio performance is net of investment fees and fund expenses, but not product charges, which, if included, would significantly lower the performance quoted. The investment return and principal value of an investment will fluctuate, so that an investor’s shares, when redeemed, may be worth more or less than their original cost. Current performance may be lower or higher than the past performance data quoted.
Unless noted otherwise, Lipper Average and Index returns reflect performance beginning the closest month-end date to the Portfolio’s inception. Performance figures may reflect fee waivers and/or expense reimbursements. In the absence of such fee waivers and/or expense reimbursements, total returns would be lower.
For the year ended December 31, 2007, the High Yield Bond Portfolio had a total return that was above its benchmark index and the average of its peer group.
The Federal Reserve (the Fed) held monetary policy steady during the first half of the year, but it repeatedly cut short-term interest rates in the second half, as a meltdown in debt securities linked to risky mortgages escalated into a full-fledged credit crisis that threatened the U.S. economic expansion. Investors seeking refuge from turmoil in the financial markets favored highly rated investment grade bonds such as U.S. Treasury securities, which substantially outperformed high yield corporate bonds, commonly called “junk” bonds because they are rated below investment grade. Among high yield corporate bonds, return varied widely across sectors and industries. For example, home construction, building materials, and financial institutions posted losses for the year, while aerospace/defense, energy, pharmaceuticals, healthcare, and chemicals posted gains.
Prudential Investment Management’s sector allocation strategy helped the Portfolio outperform its benchmark index. Compared to its benchmark, the Portfolio had underweight exposures to autos, home construction, financial institutions, and retailers, which are more susceptible to the subprime mortgage meltdown and slower economic growth in the United States. The Portfolio had overweight exposures to healthcare, aerospace/defense, and metals and mining, areas that are generally less susceptible to a U.S. economic slowdown. In addition, the Portfolio also benefited from holding government bonds of certain emerging market nations, which are not included in its benchmark. On the other hand, its exposure to energy, natural gas pipelines, and media cable detracted from its relative performance.
Favorable security selection contributed to the Portfolio’s relative performance, particularly its underweight exposures to a financial company and a building materials supplier that declined in value and its overweight exposure to a chemical company that performed well. However, this positive impact was partially offset by exposure to a poorly performing bond of a residential real estate company.
Prudential Investments LLC (PI), an indirect, wholly owned subsidiary of Prudential Financial, Inc., serves as the investment manager for the Fund.
For average and index definitions, refer to the Glossary of Benchmark Definitions page. Investors cannot invest directly in a market index or average. For a complete list of holdings refer to the Schedule of Investments section of this report.
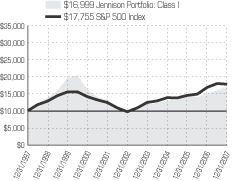
The Prudential Series Fund, Jennison Portfolio
Subadvised by: Jennison Associates LLC
December 31, 2007
Investment Manager’s Report
Performance Summary - As of December 31, 2007
Average Annual Total Return Percentages
| | | | | | | | | | | | |
| | | 1-Year | | | 5-Year | | | 10-Year | | | Since
Inception | |
Jennison Portfolio: Class I | | 12.00 | % | | 13.27 | % | | 5.45 | % | | N/A | |
Jennison Portfolio: Class II | | 11.56 | | | 12.79 | | | N/A | | | -2.85 | % |
S&P 500 Index | | 5.49 | | | 12.82 | | | 5.91 | | | 2.34 | |
Russell 1000® Growth Index | | 11.81 | | | 12.11 | | | 3.83 | | | -2.37 | |
Lipper (VIP) Large-Cap Growth Funds Avg. | | 12.78 | | | 12.34 | | | 5.22 | | | -0.80 | |
Portfolio (Class I) inception: 4/25/1995. Portfolio (Class II) inception: 2/10/2000.
$10,000 INVESTED OVER 10 YEARS1
Past performance does not guarantee future returns. Portfolio performance is net of investment fees and fund expenses, but not product charges, which, if included, would significantly lower the performance quoted. The investment return and principal value of an investment will fluctuate, so that an investor’s shares, when redeemed, may be worth more or less than their original cost. Current performance may be lower or higher than the past performance data quoted.
Unless noted otherwise, Lipper Average and Index returns reflect performance beginning the closest month-end date to the Portfolio’s inception (Class II).
The Russell® 1000 Growth Index is a trademark/service of the Frank Russell Company. Russell® is a trademark of the Frank Russell Company. Performance figures may reflect fee waivers and/or expense reimbursements. In the absence of such fee waivers and/or expense reimbursements, total returns would be lower.
For the year ended December 31, 2007, the Jennison Portfolio had a total return that was above its benchmark indexes but below the average return of its peer group.
The challenging market environment in 2007 generally favored growth stocks, shares of companies expected to continue to generate faster-than-average increases in earnings. To identify attractive growth companies, Jennison relies heavily on in-house research analysis. The Portfolio is constructed from the bottom up, one stock at a time, based on the fundamentals of individual companies rather than on overarching themes.
Compared to its benchmark, the Portfolio had an overweight exposure to shares with strong price momentum that benefited its performance relative to its benchmark. It also benefited from its underweight exposure to leverage, which measures the amount of borrowed money to capital on the balance sheet of each stock held in the Portfolio. On the other hand, its overweight exposure to larger stocks as measured by market capitalization detracted from the Portfolio’s relative performance.
Jennison’s selection of stocks, overall, had a negative impact on the Portfolio’s relative performance. Specifically, stock selection in the consumer services sector had a negative effect. One example was a company in the hotel industry whose shares may have declined in value because some investors believe that weakness in the housing and financial services areas could hurt the travel industry. Yet Jennison believes the company is well insulated from a consumer slowdown since the vast majority of its revenues come from business rather than consumer travel. On the other hand, stock selection in the computer hardware and electronic equipment industries had a positive effect on the Portfolio’s relative performance. Specifically, a technology company’s third-quarter revenues and earnings beat Wall Street expectations, as its growth continued to be driven by the strength of portable media player sales and an impressive resurgence in personal computer sales. Introduction of its integrated wireless handset gave the shares an additional boost. Jennison believes the company will continue to benefit from its creativity and innovation in product design and marketing.
Prudential Investments LLC (PI), an indirect, wholly owned subsidiary of Prudential Financial, Inc., serves as the investment manager for the Fund.
1 | The graph is based on the performance of Class I shares. Performance of Class II shares will be lower due to differences in the fee structure. Class II shares have associated 12b-1 and administrative fees at an annual rate of 0.25% and 0.15%, respectively, of the average daily net assets of the Class II shares. |
For average and index definitions, refer to the Glossary of Benchmark Definitions page. Investors cannot invest directly in a market index or average. For a complete list of holdings, refer to the Schedule of Investments section of this report.
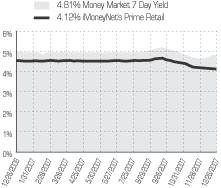
The Prudential Series Fund, Money Market Portfolio
Subadvised by: Prudential Investment Management, Inc.
December 31, 2007
Investment Manager’s Report
Performance Summary - As of December 31, 2007
Average Annual Total Return Percentages
| | | | | | | | | | | | |
| | | 7-Day*
Current
Net Yield | | | 1-Year | | | 5-Year | | | 10-Year | |
Money Market Portfolio | | 4.81 | % | | 5.06 | % | | 2.90 | % | | 3.66 | % |
Lipper (VIP) Money Market Funds Avg. | | N/A | | | 4.78 | | | 2.67 | | | 3.46 | |
Portfolio inception: 5/13/1983.
SEVEN-DAY CURRENT NET YIELD *
Past performance does not guarantee future returns. Portfolio performance is net of investment fees and fund expenses, but not product charges, which, if included, would significantly lower the performance quoted. The investment return and principal value of an investment will fluctuate, so that an investor’s shares, when redeemed, may be worth more or less than their original cost. Current performance may be lower or higher than the past performance data quoted.
The yield quotation more closely reflects the current earnings of the Portfolio than the total return quotation. Unless noted otherwise, Lipper Average and Index returns reflect performance beginning the closest month-end date to the Portfolio’s inception. Performance figures may reflect fee waivers and/or expense reimbursements. In the absence of such fee waivers and/or expense reimbursements, total returns would be lower.
For the year ended December 31, 2007, the Money Market Portfolio had a total return of 5.06% that was above the average of its peer group. On December 25, 2007, the Portfolio’s 7-day current net yield was 4.81%, down from 4.98% on December 26, 2006. The yield more closely reflects the current earnings of the Portfolio than the total return.
The reporting period began with the target for the federal funds rate charged on overnight loans between banks at 5.25%, as the Federal Reserve (the Fed) held monetary policy steady after gradually increasing short-term rates to remove excess monetary stimulus from the U.S. economy. Meanwhile, the housing sector exhibited signs of weakness, raising expectations that the Fed would cut short-term rates to keep the economy growing.
Economic growth did slow during the first three months of 2007. Additionally, key data pointed to a steady decline in the housing sector. By summer, concerns about the credit quality of debt securities containing subprime mortgages (home loans made to borrowers with poor credit histories) spilled into the broader financial markets. Deepening concern about these debt securities and the financial institutions that held them severely hindered liquidity in the credit markets, and a flight to quality ensued that favored U.S. Treasury bills. Furthermore, the rates banks charge each other to borrow funds spiked higher amid fear that some banks might be overexposed to subprime mortgages and trading in some short-term debt securities came to a standstill.
During this time, the Fed aggressively added reserves to the financial system to ease the liquidity crunch. Conditions in the money markets improved somewhat when it unexpectedly cut the discount rate charged on direct Fed loans to banks by 50 basis points (a one hundredth of a percent) on August 17. It continued to ease stress in the markets by cutting its target for the federal funds rate by 50 basis points to 4.75% and the discount rate by the same amount on September 18.
Despite lower rates, credit quality concerns continued as the fourth quarter began. Additionally, many investors feared the economy was headed for a recession as consumers cut back on spending and the severe decline in the housing market continued. To avoid a recession and to further ease the liquidity crunch gripping the credit markets, the Fed reduced short-term rates in increments of 25 basis points in October and December, bringing the targeted federal funds rate to 4.25%. It also introduced a program to provide extended short-term loans to banks via auctions in December.
The Portfolio benefited from its large holdings in variable-rate debt securities that reset periodically based on formulas tied to either the one- or three-month London interbank offered rates as these rates spiked higher during the second half of the year due to the liquidity crunch.
Prudential Investments LLC (PI), an indirect, wholly owned subsidiary of Prudential Financial, Inc., serves as the investment manager for the Fund.
| * | Source: iMoneyNet, Inc. based on 346 funds in the iMoneyNet Prime Retail universe. Weekly 7-day current net yields of the Money Market Portfolio and the iMoneyNet Prime Retail universe as of 12/25/07. Prudential Investment Management, Inc. is the source for Money Market Portfolio information. |
For average and index definitions, refer to the Glossary of Benchmark Definitions page. Investors cannot invest directly in a market index or average. For a complete list of holdings refer to the Schedule of Investments section of this report.
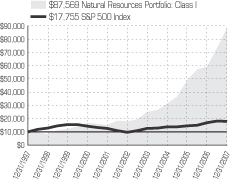
The Prudential Series Fund, Natural Resources Portfolio
Subadvised by: Jennison Associates LLC
December 31, 2007
Investment Manager’s Report
Performance Summary - As of December 31, 2007
Average Annual Total Return Percentages
| | | | | | | | | | | | |
| | | 1-Year | | | 5-Year | | | 10-Year | | | Since
Inception | |
Natural Resources Portfolio: Class I | | 48.30 | % | | 37.50 | % | | 24.23 | % | | N/A | |
Natural Resources Portfolio: Class II | | 47.70 | | | N/A | | | N/A | | | 45.05 | % |
S&P 500 Index | | 5.49 | | | 12.82 | | | 5.91 | | | 11.44 | |
Lipper (VIP) Natural Resources Funds Avg. | | 37.47 | | | 28.77 | | | 16.10 | | | 34.89 | |
Lipper (VUF) Natural Resources Funds Index | | 39.08 | | | 29.97 | | | N/A | | | 36.69 | |
Portfolio (Class I) inception: 5/1/1988. Portfolio (Class II) inception: 4/28/2005.
$10,000 INVESTED OVER 10 YEARS1
Past performance does not guarantee future returns. Portfolio performance is net of investment fees and fund expenses, but not product charges, which, if included, would significantly lower the performance quoted. The investment return and principal value of an investment will fluctuate, so that an investor’s shares, when redeemed, may be worth more or less than their original cost. Current performance may be lower or higher than the past performance data quoted.
Unless noted otherwise, Lipper Average and Index returns reflect performance beginning the closest month-end date to the Portfolio’s inception (Class II). Performance figures may reflect fee waivers and/or expense reimbursements. In the absence of such fee waivers and/or expense reimbursements, total returns would be lower.
For the year ended December 31, 2007, the Natural Resources Portfolio had a total return that was higher than both its benchmark index and the average of its peer group.
The Portfolio manager, Jennison Associates, seeks to invest in low-cost producers of natural resources using a contrarian value-driven investment style, focusing on stocks that are undervalued relative to other natural resource stocks. The investment process incorporates a combination of top-down and bottom-up analyses. The team looks for stocks and sectors that are out-of-favor, either due to temporary problems or an over reaction by the market. The managers then seek a catalyst that indicates that a rebound in the stock’s prospects may be forthcoming.
In a robust metals market, select positions within the materials sector helped to strengthen the Portfolio’s relative performance. Specifically, a top performer included an Arizona-based company that engages in the exploration, mining, and production of copper, gold, and silver. A strong copper market enabled the company to expand its leverage, allowing it to make an acquisition earlier this year. Other positions in the industrials and energy sectors also contributed significantly to the Portfolio’s high return.
Stock selection in the gold, mining, and metals industries detracted from relative performance. A company specializing in the acquisition, exploration, and development of gold and silver properties in Mexico weakened returns. Other underperforming companies included a Canadian-based resource business engaged in the exploration and development of mineral properties in Romania and a Canadian coalbed methane producer.
Continuing global economic expansion has kept long-term supply and demand imbalances for oil, natural gas, gold, copper, and other metals firmly intact. While the managers believe this will continue, they caution that market corrections are likely from time to time as investors become focused on near-term supply and demand and economic data.
The managers believe that the most easily exploited producing areas for many commodities have largely been tapped. Subsequently, incremental production will accompany increased operational costs that will contribute to both higher prices and higher levels of volatility. Historically, volatility often increases when there is little slack in supply. Today’s increased volatility only reinforces the manager’s belief.
Prudential Investments LLC (PI), an indirect, wholly owned subsidiary of Prudential Financial, Inc., serves as the investment manager for the Fund.
1 | The graph is based on the performance of Class I shares. Performance of Class II shares will be lower due to differences in the fee structure. Class II shares have associated 12b-1 and administrative fees at an annual rate of 0.25% and 0.15% respectively of the average daily net assets of the Class II shares. |
For average and index definitions, refer to the Glossary of Benchmark Definitions page. Investors cannot invest directly in a market index or average. For a complete list of holdings, refer to the Schedule of Investments section of this report.
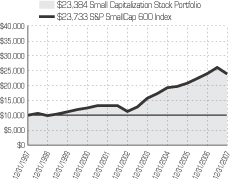
The Prudential Series Fund, Small Capitalization Stock Portfolio
Subadvised by: Quantitative Management Associates LLC
December 31, 2007
Investment Manager’s Report
Performance Summary - As of December 31, 2007
Average Annual Total Return Percentages
| | | | | | | | | |
| | | 1-Year | | | 5-Year | | | 10-Year | |
Small Capitalization Stock Portfolio | | -0.53 | % | | 15.60 | % | | 8.87 | % |
S&P SmallCap 600 Index | | -0.30 | | | 16.04 | | | 9.03 | |
Lipper (VIP) Small-Cap Core Funds Avg. | | -1.64 | | | 15.15 | | | 8.88 | |
Portfolio inception: 4/25/1995.
$10,000 INVESTED OVER 10 YEARS
Past performance does not guarantee future returns. Portfolio performance is net of investment fees and fund expenses, but not product charges, which, if included, would significantly lower the performance quoted. The investment return and principal value of an investment will fluctuate, so that an investor’s shares, when redeemed, may be worth more or less than their original cost. Current performance may be lower or higher than the past performance data quoted.
Unless noted otherwise, Lipper Average and Index returns reflect performance beginning the closest month-end date to the Portfolio’s inception. Performance figures may reflect fee waivers and/or expense reimbursements. In the absence of such fee waivers and/or expense reimbursements, total returns would be lower.
For the year ending December 31, 2007, the Small Capitalization Stock Portfolio posted a return that was slightly below the S&P SmallCap 600 Index, and was above the average of its peer group.
Prudential’s research group monitors and reports upon the performance of all Series Fund Portfolios. In 2007, Quantitative Management Associates, LLC (QMA), a unit of Prudential Financial Investment managed the Small Capitalization Stock Portfolio. It is managed with the goal of having a return that is close to that of the S&P SmallCap 600 Index (“the Index”).
The Portfolio performed as expected, essentially matching the benchmark before fees. The minimal difference in performance between the Portfolio and the Index was not material. All positions and weights were functionally the same as those in the benchmark at the end of 2007, which is expected for this index strategy.
After large gains in previous years, small cap stocks struggled in 2007. During a volatile year in which value stocks suffered across the board, a market shift that occurred in the second half of the year heavily favored securities with growth attributes in all capitalization ranges.
Prudential Investments LLC (PI), an indirect, wholly owned subsidiary of Prudential Financial, Inc., serves as the investment manager for the Fund.
For average and index definitions, refer to the Glossary of Benchmark Definitions page. Investors cannot invest directly in a market index or average. For a complete list of holdings refer to the Schedule of Investments section of this report.
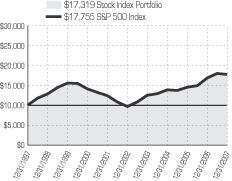
The Prudential Series Fund, Stock Index Portfolio
Subadvised by: Prudential Investment Management, Inc., Quantitative Management Associates LLC
December 31, 2007
Investment Manager’s Report
Performance Summary - As of December 31, 2007
Average Annual Total Return Percentages
| | | | | | | | | |
| | | 1-Year | | | 5-Year | | | 10-Year | |
Stock Index Portfolio | | 5.10 | % | | 12.44 | % | | 5.65 | % |
S&P 500 Index | | 5.49 | | | 12.82 | | | 5.91 | |
Lipper (VIP) S&P 500 Index Objective Funds Avg. | | 5.12 | | | 12.39 | | | 5.59 | |
Portfolio inception: 10/19/1987.
$10,000 INVESTED OVER 10 YEARS
Past performance does not guarantee future returns. Portfolio performance is net of investment fees and fund expenses, but not product charges, which, if included, would significantly lower the performance quoted. The investment return and principal value of an investment will fluctuate, so that an investor’s shares, when redeemed, may be worth more or less than their original cost. Current performance may be lower or higher than the past performance data quoted.
Unless noted otherwise, Lipper Average and Index returns reflect performance beginning the closest month-end date to the Portfolio’s inception. Performance figures may reflect fee waivers and/or expense reimbursements. In the absence of such fee waivers and/or expense reimbursements, total returns would be lower.
For the year ended December 31, 2007, the Stock Index Portfolio had a total return that was below the S&P 500 Index (the Index) and in line with the average return of its peer group. The average index fund based on the Index generally trails the Index primarily because funds have fees and expenses that indexes do not have.
The Index posted a total return for 2007 that was below its historical average, and sector returns varied widely. The strongest performing sectors in the Index were energy, materials, utilities, information technology, and consumer staples, all of which posted double-digit gains for the year. The industrials, healthcare, and telecommunications services sectors posted single-digit gains. The energy sector benefited as supply and demand factors coupled with political developments in oil-rich regions helped boost crude oil to nearly $100 a barrel in 2007. Industries in the materials sector benefited from the voracious appetite for raw materials in emerging market nations. Concern that the U.S. economy will soon tumble into a recession helped less cyclical sectors such as utilities and consumer staples, which tend to do relatively well during economically challenging times.
The weakest sectors in the Index were more vulnerable to economic woes in the United States, particularly the troubled housing and mortgage industries. The financials sector registered the largest decline in 2007, as some prominent banks and Wall Street firms took multibillion dollar write-downs on securities linked to risky mortgages. Consumer discretionary was the other sector that posted a loss, as shares of homebuilders, retailers, auto manufacturers, and others were hard hit by the housing industry problems and recession fears.
Although the Index finished the year in the black, it declined during the fourth quarter of 2007, which is a time of year when share prices tend to gain. The fourth-quarter decline resulted in a modest return in 2007 for the Index and the Stock Index Portfolio.
Prudential Investments LLC (PI), an indirect, wholly owned subsidiary of Prudential Financial, Inc., serves as the investment manager for the Fund.
For average and index definitions, refer to the Glossary of Benchmark Definitions page. Investors cannot invest directly in a market index or average. For a complete list of holdings refer to the Schedule of Investments section of this report.
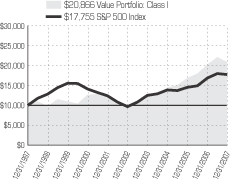
The Prudential Series Fund, Value Portfolio
Subadvised by: Jennison Associates LLC
December 31, 2007
Investment Manager’s Report
Performance Summary - As of December 31, 2007
Average Annual Total Return Percentages
| | | | | | | | | | | | |
| | | 1-Year | | | 5-Year | | | 10-Year | | | Since
Inception | |
Value Portfolio: Class I | | 3.19 | % | | 16.55 | % | | 7.63 | % | | N/A | |
Value Portfolio: Class II | | 2.82 | | | 16.10 | | | N/A | | | 7.01 | % |
S&P 500 Index | | 5.49 | | | 12.82 | | | 5.91 | | | 4.26 | |
Russell 1000® Value Index | | -0.17 | | | 14.63 | | | 7.68 | | | 7.29 | |
Lipper (VIP) Large Cap Value Funds Avg. | | 1.69 | | | 12.95 | | | 6.39 | | | 5.81 | |
Lipper (VIP) Multi Cap Value Funds Avg. | | -0.43 | | | 13.21 | | | 6.60 | | | 6.25 | |
Portfolio (Class I) inception: 2/19/1988. Portfolio (Class II) inception: 5/14/2001.
$10,000 INVESTED OVER 10 YEARS1
Past performance does not guarantee future returns. Portfolio performance is net of investment fees and fund expenses, but not product charges, which, if included, would significantly lower the performance quoted. The investment return and principal value of an investment will fluctuate, so that an investor’s shares, when redeemed, may be worth more or less than their original cost. Current performance may be lower or higher than the past performance data quoted.
Unless noted otherwise, Lipper Average and Index returns reflect performance beginning the closest month-end date to the Portfolio’s inception (Class II). Although Lipper classifies the Portfolio within the Multi-Cap Value Funds Average, the returns for the Large-Cap Value Funds Average are also shown, because the management of the portfolios included in the Large-Cap Value Funds Average is more consistent with the management of the Portfolio. The Russell 1000® Value Index is a trademark/service mark of the Frank Russell Company. Russell® is a trademark of the Frank Russell Company. Performance figures may reflect fee waivers and/or expense reimbursements. In the absence of such fee waivers and/or expense reimbursements, total returns would be lower.
For the year ended December 31, 2007, the Value Portfolio had a total return that was above its style-specific benchmark index and the average return of its peer group.
Jennison seeks to invest in undervalued stocks that its believes have potential for near-term price appreciation. It uses a bottom-up approach to portfolio construction in which it selects stocks one at a time based on in-house analysis of individual company fundamentals and a set of valuation screens.
Jennison’s strategy worked well in 2007, as stock selection, particularly in the energy, utility, and consumer cyclical sectors, helped the Portfolio outperform its style-specific benchmark. For example, the Portfolio held shares of a merchant power generation company that benefited from the potential acquisition of a Texas-based utility company by private equity investors. The proposed deal demonstrated that private equity investors were valuing energy generation assets at a higher level than the public market. On the negative side, stock selection within the healthcare sector detracted from the Portfolio’s relative performance.
Sector allocation was also beneficial, though it is a result of Jennison’s selection of individual stocks and not a separate strategic decision. The Portfolio’s marginally greater exposure to the energy and consumer non-cyclical sectors than its style-specific benchmark contributed to its relative performance, as did its underweight exposure to the financials sector. The latter, beset by problems related to the subprime mortgage crisis and its widening ramifications, was the weakest performing sector of the year. Alternatively, the Portfolio’s overweight exposure to the consumer cyclical sector was the largest detractor from its relative performance as the sector is more exposed to economic troubles in the United States.
In general, the market environment did not favor shares with value characteristics such as high dividend yields, low price-to-book ratios, and low price-to-earnings (P/E) ratios. Therefore, the Portfolio’s underweight exposure to shares with high dividend yields and low P/E ratios helped its relative performance. Compared to its benchmark, the Portfolio had overweight exposures to leverage, which measures the amount of borrowed money to capital on the balance sheet of each stock held in the Portfolio, and to volatility, which measures the variability of a stock’s price. Both detracted from its returns. It is important to note these risk characteristics are by-products of Jennison’s investment strategy and are not considered in the security selection process.
Prudential Investments LLC (PI), an indirect, wholly owned subsidiary of Prudential Financial, Inc., serves as the investment manager for the Fund.
1 | The graph is based on the performance of Class I shares. Performance of Class II shares will be lower due to differences in the fee structure. Class II shares have associated 12b-1 and administrative fees at an annual rate of 0.25% and 0.15% respectively of the average daily net assets of the Class II shares. |
For average and index definitions, refer to the Glossary of Benchmark Definitions page. Investors cannot invest directly in a market index or average. For a complete list of holdings, refer to the Schedule of Investments section of this report.
The Prudential Series Fund
Presentation of Portfolio Holdings — unaudited
December 31, 2007
| | |
| Conservative Balanced | | |
| Five Largest Holdings/Issues | | (% of Net Assets) |
Federal National Mortgage Association,
5.00%, TBA 30 YR | | 2.0% |
Exxon Mobil Corp. | | 1.7% |
Federal National Mortgage Association,
5.50%, TBA 30 YR | | 1.4% |
Federal Home Loan Mortgage Corp.,
5.50%, TBA 30 YR | | 1.3% |
General Electric Co. | | 1.3% |
| | |
| Diversified Bond | | |
| Five Largest Issues | | (% of Net Assets) |
Federal National Mortgage Association,
5.00%, TBA 30 YR | | 5.9% |
Federal Home Loan Mortgage Corp.,
5.50%, TBA 30 YR | | 3.9% |
Federal National Mortgage Association,
5.50%, TBA 30 YR | | 2.8% |
Federal National Mortgage Association,
6.00%, TBA 30 YR | | 2.7% |
Federal Home Loan Mortgage Corp.,
6.00%, TBA 30 YR | | 2.0% |
| | |
| Equity | | |
| Five Largest Holdings | | (% of Net Assets) |
Microsoft Corp. | | 2.61% |
General Electric Co. | | 2.24% |
Cisco Systems, Inc. | | 1.87% |
QUALCOMM, Inc. | | 1.81% |
American International Group, Inc. | | 1.69% |
| | |
| Flexible Managed | | |
| Five Largest Holdings/Issues | | (% of Net Assets) |
Exxon Mobil Corp. | | 2.5% |
Microsoft Corp. | | 1.6% |
General Electric Co. | | 1.6% |
Federal National Mortgage Association,
5.00%, TBA 30 YR | | 1.5% |
AT&T, Inc. | | 1.4% |
| | |
| Global | | |
| Five Largest Holdings | | (% of Net Assets) |
Merck & Co., Inc. | | 1.4% |
McDonald's Corp. | | 1.3% |
UnitedHealth Group, Inc. | | 1.2% |
AT&T, Inc. | | 1.1% |
Goldman Sachs Group, Inc. (The) | | 1.1% |
| | |
| Government Income | | |
| Five Largest Issues | | (% of Net Assets) |
Federal National Mortgage Association,
5.50%, 1/01/33 | | 6.9% |
Federal Home Loan Mortgage Association,
Zero, 2/19/08 | | 5.1% |
Federal National Mortgage Association,
5.30%, 2/22/11 | | 4.3% |
Federal National Mortgage Association,
3.496%, 6/01/34 | | 3.4% |
Federal Home Loan Mortgage Association,
6.00%, TBA 30 YR | | 3.0% |
| | |
| High Yield Bond | | |
| Five Largest Issues | | (% of Net Assets) |
Texas Competitive Electric Holdings Co. LLC,
Zero, 10/10/14 | | 1.8% |
| Ford Motor Credit Co., 7.875%, 6/15/10 | | 1.1% |
Freescale Semiconductor, Inc.,
9.125%, 12/15/14 | | 1.0% |
General Motors Acceptance Corp.,
6.875%, 8/28/12 | | 1.0% |
| General Motors Corp., 7.20%, 1/15/11 | | 0.9% |
| | |
| Jennison | | |
| Five Largest Holdings | | (% of Net Assets) |
Google, Inc., Class A | | 4.7% |
| Gilead Sciences, Inc. | | 3.9% |
Apple, Inc. | | 3.5% |
Microsoft Corp. | | 3.5% |
| Research In Motion Ltd. | | 3.1% |
| | |
| Natural Resources | | |
| Five Largest Holdings | | (% of Net Assets) |
MMX Mineracao e Metalicos SA (Brazil) | | 3.6% |
| Freeport-McMoRan Copper & Gold, Inc. | | 3.1% |
Suncor Energy, Inc. | | 2.5% |
Southwestern Energy Co. | | 2.1% |
| Transocean, Inc. | | 2.1% |
| | |
| Small Capitalization Stock | | |
| Five Largest Holdings | | (% of Net Assets) |
| Shaw Group, Inc. (The) | | 0.9% |
| Respironics, Inc. | | 0.9% |
| FLIR Systems, Inc. | | 0.8% |
| Cabot Oil & Gas Corp. (Class A Stock) | | 0.7% |
| Helix Energy Solutions Group, Inc. | | 0.7% |
| | |
| Stock Index | | |
| Five Largest Holdings | | (% of Net Assets) |
| Exxon Mobil Corp. | | 3.9% |
| General Electric Co. | | 2.9% |
| Microsoft Corp. | | 2.2% |
| AT&T Inc. | | 1.9% |
| Procter & Gamble Co. | | 1.8% |
| | |
| Value | | |
| Five Largest Holdings | | (% of Net Assets) |
| Occidental Petroleum Corp. | | 3.0% |
| Cadbury Schweppes PLC, ADR (United Kingdom) | | 2.7% |
| Suncor Energy, Inc. | | 2.5% |
| Comcast Corp. (Class A Stock) | | 2.5% |
| Petroleo Brasileiro SA, ADR (Brazil) | | 2.3% |
For a complete list of holdings, please refer to the Schedule of Investments section of this report. Holdings reflect only long-term investments. Holdings/Issues/Industries/Sectors are subject to change.
The Prudential Series Fund
Fees and Expenses — unaudited
December 31, 2007
As a contract owner investing in Portfolios of the Fund through a variable annuity or variable life contract, you incur ongoing costs, including management fees, and other Portfolio expenses. This example is intended to help you understand your ongoing costs (in dollars) of investing in the Fund and to compare these costs with the ongoing costs of investing in other investment options. This example does not reflect fees and charges under your variable annuity or variable life contract. If contract charges were included, the costs shown below would be higher. Please consult the prospectus for your contract for more information about contract fees and charges.
The example is based on an investment of $1,000 invested at the beginning of the period and held for the entire period July 1, 2007 through December 31, 2007.
Actual Expenses
The first line of the table below provides information about actual account values and actual expenses. You may use this information, together with the amount you invested, to estimate the Portfolio expenses that you paid over the period. Simply divide your account value by $1,000 (for example, an $8,600 account value divided by $1,000 = 8.6), then multiply the result by the number in the first line under the heading entitled “Expenses Paid During Period” to estimate the Portfolio expenses you paid on your account during this period. As noted above, the table does not reflect variable contract fees and charges.
Hypothetical Example for Comparison Purposes
The second line of the table below provides information about hypothetical account values and hypothetical expenses based on the Portfolio’s actual expense ratio and an assumed rate of return of 5% per year before expenses, which is not the Portfolio’s actual return. The hypothetical account values and expenses may not be used to estimate the actual ending account balance or expenses you paid for the period. You may use this information to compare the ongoing costs of investing in the Portfolio and other investment options. To do so, compare this 5% hypothetical example with the 5% hypothetical examples that appear in the shareholder reports of the other investment options.
Please note that the expenses shown in the table are meant to highlight your ongoing Portfolio costs only and do not reflect any contract fees and charges, such as sales charges (loads), insurance charges or administrative charges. Therefore the second line of the table is useful to compare ongoing investment option costs only, and will not help you determine the relative total costs of owning different contracts. In addition, if these contract fee and charges were included, your costs would have been higher.
| | | | | | | | | | |
| The Prudential Series Fund Portfolios | | Beginning
Account Value
July 1, 2007 | | Ending
Account Value
December 31, 2007 | | Annualized Expense
Ratio based on the
Six-Month period | | Expenses Paid
During the
Six-Month period |
| | | | | | | | | | | |
| Conservative Balanced (Class I) | | Actual | | $1,000.00 | | $1,014.30 | | 0.59% | | $3.00 |
| | | Hypothetical | | $1,000.00 | | $1,022.23 | | 0.59% | | $3.01 |
| Diversified Bond (Class I) | | Actual | | $1,000.00 | | $1,042.80 | | 0.44% | | $2.27 |
| | | Hypothetical | | $1,000.00 | | $1,022.99 | | 0.44% | | $2.24 |
| Equity (Class I) | | Actual | | $1,000.00 | | $1,014.90 | | 0.46% | | $2.34
|
| | | Hypothetical | | $1,000.00 | | $1,022.89 | | 0.46% | | $2.35 |
| Equity (Class II) | | Actual | | $1,000.00 | | $1,012.90 | | 0.86% | | $4.36 |
| | | Hypothetical | | $1,000.00 | | $1,020.87 | | 0.86% | | $4.38 |
| Flexible Managed (Class I) | | Actual | | $1,000.00 | | $1,005.00 | | 0.63% | | $3.18 |
| | | Hypothetical | | $1,000.00 | | $1,022.03 | | 0.63% | | $3.21 |
| Global (Class I) | | Actual | | $1,000.00 | | $1,017.20 | | 0.82% | | $4.17 |
| | | Hypothetical | | $1,000.00 | | $1,021.07 | | 0.82% | | $4.18 |
| Government Income (Class I) | | Actual | | $1,000.00 | | $1,049.60 | | 0.55% | | $2.84 |
| | | Hypothetical | | $1,000.00 | | $1,022.43 | | 0.55% | | $2.80 |
| High Yield Bond (Class I) | | Actual | | $1,000.00 | | $ 998.50 | | 0.58% | | $2.92 |
| | | Hypothetical | | $1,000.00 | | $1,022.28 | | 0.58% | | $2.96 |
| Jennison (Class I) | | Actual | | $1,000.00 | | $1,067.80 | | 0.62% | | $3.23 |
| | | Hypothetical | | $1,000.00 | | $1,022.08 | | 0.62% | | $3.16 |
| Jennison (Class II) | | Actual | | $1,000.00 | | $1,065.80 | | 1.02% | | $5.31 |
| | | Hypothetical | | $1,000.00 | | $1,020.06 | | 1.02% | | $5.19 |
| Money Market (Class I) | | Actual | | $1,000.00 | | $1,025.30 | | 0.43% | | $2.20 |
| | | Hypothetical | | $1,000.00 | | $1,023.04 | | 0.43% | | $2.19 |
The Prudential Series Fund
Fees and Expenses — unaudited (continued)
December 31, 2007
| | | | | | | | | | |
The Prudential Series Fund Portfolios | | Beginning
Account Value
July 1, 2007 | | Ending
Account Value
December 31, 2007 | | Annualized Expense
Ratio based on the
Six-Month period | | Expenses Paid
During the
Six-Month period |
| | | | | | | | | | | |
| Natural Resources (Class I) | | Actual | | $1,000.00 | | $1,207.30 | | 0.48% | | $2.67 |
| | | Hypothetical | | $1,000.00 | | $1,022.79 | | 0.48% | | $2.45 |
| Natural Resources (Class II) | | Actual | | $1,000.00 | | $1,204.80 | | 0.88% | | $4.89 |
| | | Hypothetical | | $1,000.00 | | $1,020.77 | | 0.88% | | $4.48 |
| Small Capitalization Stock (Class I) | | Actual | | $1,000.00 | | $ 917.90 | | 0.46% | | $2.22 |
| | | Hypothetical | | $1,000.00 | | $1,022.89 | | 0.46% | | $2.35 |
| Stock Index (Class I) | | Actual | | $1,000.00 | | $ 984.70 | | 0.36% | | $1.80 |
| | | Hypothetical | | $1,000.00 | | $1,023.39 | | 0.36% | | $1.84 |
| Value (Class I) | | Actual | | $1,000.00 | | $ 946.70 | | 0.43% | | $2.11 |
| | | Hypothetical | | $1,000.00 | | $1,023.04 | | 0.43% | | $2.19 |
| Value (Class II) | | Actual | | $1,000.00 | | $ 945.10 | | 0.83% | | $4.07 |
| | | Hypothetical | | $1,000.00 | | $1,021.02 | | 0.83% | | $4.23 |
| * | Portfolio expenses (net of fee waivers or subsidies, if any) for each share class are equal to the annualized expense ratio for each share class (provided in the table), multiplied by the average account value over the period, multiplied by the 184 days in the six-month period ended December 31, 2007, and divided by the 365 days in each Portfolio’s fiscal year ended December 31, 2007 (to reflect the six-month period). Expenses presented in the table include the expenses of any underlying portfolios in which the Portfolio may invest. |
| | | | |
| | | CONSERVATIVE BALANCED PORTFOLIO | | |
SCHEDULE OF INVESTMENTS | December 31, 2007 |
| | | | | |
| LONG-TERM INVESTMENTS — 87.3% | | Value
(Note 2)
|
| COMMON STOCKS — 51.4% | | Shares
| |
| | | | | | |
Aerospace & Defense — 1.3% | | | | | |
Boeing Co. | | 73,200 | | $ | 6,402,072 |
European Aeronautic Defence and Space Co. (Netherlands) | | 19,108 | | | 609,862 |
General Dynamics Corp. | | 37,400 | | | 3,328,226 |
Goodrich Corp. | | 11,300 | | | 797,893 |
Honeywell International, Inc. | | 70,912 | | | 4,366,052 |
L-3 Communications Holdings, Inc. | | 11,600 | | | 1,228,904 |
Lockheed Martin Corp. | | 33,300 | | | 3,505,158 |
Northrop Grumman Corp. | | 33,362 | | | 2,623,588 |
Precision Castparts Corp. | | 13,400 | | | 1,858,580 |
Raytheon Co. | | 41,300 | | | 2,506,910 |
Rockwell Collins, Inc. | | 15,400 | | | 1,108,338 |
United Technologies Corp. | | 90,600 | | | 6,934,524 |
| | | | |
|
|
| | | | | | 35,270,107 |
| | | | |
|
|
Air Freight & Logistics — 0.4% | | | | | |
C.H. Robinson Worldwide, Inc. | | 15,900 | | | 860,508 |
Expeditors International of Washington, Inc. | | 19,600 | | | 875,728 |
FedEx Corp. | | 27,500 | | | 2,452,175 |
TNT Post Group N.V. | | 11,504 | | | 475,149 |
United Parcel Service, Inc. | | 95,900 | | | 6,782,048 |
| | | | |
|
|
| | | | | | 11,445,608 |
| | | | |
|
|
Airlines — 0.1% | | | | | |
Air France KLM (France) | | 13,091 | | | 460,310 |
British Airways PLC (United Kingdom)(a) | | 11,347 | | | 69,964 |
Deutsche Lufthansa AG (Germany) | | 16,946 | | | 450,674 |
Japan Airlines Corp. (Japan) | | 27,000 | | | 61,229 |
Qantas Airways Ltd. (Australia) | | 229,453 | | | 1,090,210 |
Southwest Airlines Co. | | 70,800 | | | 863,761 |
| | | | |
|
|
| | | | | | 2,996,148 |
| | | | |
|
|
Auto Components — 0.2% | | | | | |
Aisin Seiki Co. Ltd. (Japan) | | 21,100 | | | 873,588 |
Bridgestone Corp. (Japan) | | 36,000 | | | 635,581 |
Denso Corp. (Japan) | | 14,700 | | | 598,205 |
Goodyear Tire & Rubber Co. (The)(a)(b) | | 19,500 | | | 550,290 |
Johnson Controls, Inc. | | 54,600 | | | 1,967,783 |
Rieter Holding AG (Switzerland) | | 239 | | | 105,551 |
Tokai Rika Co. Ltd. (Japan) | | 13,100 | | | 403,885 |
Toyota Industries Corp. (Japan) | | 11,300 | | | 458,145 |
| | | | |
|
|
| | | | | | 5,593,028 |
| | | | |
|
|
Automobiles — 0.4% | | | | | |
Daimler AG (Germany) | | 11,444 | | | 1,107,808 |
Fiat SpA (Italy) | | 29,473 | | | 762,712 |
Ford Motor Co.(a)(b) | | 178,995 | | | 1,204,636 |
General Motors Corp.(b) | | 53,791 | | | 1,338,858 |
Harley-Davidson, Inc. | | 23,100 | | | 1,079,001 |
Honda Motor Co. Ltd. (Japan) | | 12,800 | | | 422,846 |
Nissan Motor Co. Ltd. (Japan) | | 18,200 | | | 198,644 |
Peugeot SA (France) | | 15,551 | | | 1,178,881 |
Renault SA (France) | | 4,890 | | | 693,567 |
Toyota Motor Corp. (Japan) | | 62,400 | | | 3,323,343 |
Volkswagen AG (Germany) | | 581 | | | 132,880 |
| | | | |
|
|
| | | | | | 11,443,176 |
| | | | |
|
|
Beverages — 1.1% | | | | | |
Anheuser-Busch Cos., Inc. | | 68,500 | | | 3,585,290 |
Brown-Forman Corp.
(Class B Stock) | | 7,700 | | | 570,647 |
SEE NOTES TO FINANCIAL STATEMENTS.
A1
| | | | |
| | | CONSERVATIVE BALANCED PORTFOLIO (Continued) | | |
SCHEDULE OF INVESTMENTS | December 31, 2007 |
| | | | | |
COMMON STOCKS
(continued) | | Shares
| | Value
(Note 2)
|
Beverages (continued) | | | | | |
| | | | | | |
Carlsberg A/S (Denmark) | | 4,450 | | $ | 538,357 |
Coca-Cola Co. (The) | | 181,800 | | | 11,157,066 |
Coca-Cola Enterprises, Inc.(b) | | 25,400 | | | 661,162 |
Coca-Cola Hellenic Bottling Co. SA (Greece) | | 11,018 | | | 476,823 |
Coca-Cola West Japan Co. Ltd. (Japan) | | 33,400 | | | 737,379 |
Constellation Brands, Inc.(a)(b) | | 19,100 | | | 451,524 |
Molson Coors Brewing Co.
(Class B Stock)(b) | | 13,000 | | | 671,060 |
Pepsi Bottling Group, Inc. | | 11,600 | | | 457,736 |
PepsiCo, Inc. | | 148,530 | | | 11,273,428 |
| | | | |
|
|
| | | | | | 30,580,472 |
| | | | |
|
|
Biotechnology — 0.5% | | | | | |
Amgen, Inc.(a) | | 100,660 | | | 4,674,650 |
Biogen Idec, Inc.(a) | | 27,190 | | | 1,547,655 |
Celgene Corp.(a) | | 35,000 | | | 1,617,350 |
CSL Ltd. (Australia) | | 25,269 | | | 800,519 |
Genzyme Corp.(a) | | 23,300 | | | 1,734,452 |
Gilead Sciences, Inc.(a) | | 85,800 | | | 3,947,658 |
| | | | |
|
|
| | | | | | 14,322,284 |
| | | | |
|
|
Building Products — 0.2% | | | | | |
Asahi Glass Co. Ltd. (Japan) | | 54,000 | | | 714,171 |
Cie de Saint-Gobain (France) | | 11,886 | | | 1,120,704 |
Masco Corp. | | 34,800 | | | 752,028 |
Nippon Sheet Glass Co. Ltd. (Japan) | | 163,000 | | | 822,831 |
Sanwa Shutter Corp. (Japan) | | 29,000 | | | 142,374 |
Trane, Inc. | | 16,300 | | | 761,373 |
| | | | |
|
|
| | | | | | 4,313,481 |
| | | | |
|
|
Capital Markets — 1.7% | | | | | |
3i Group PLC | | 9,786 | | | 195,385 |
American Capital Strategies Ltd.(b) | | 16,000 | | | 527,360 |
Ameriprise Financial, Inc. | | 22,620 | | | 1,246,588 |
Bank of New York Mellon Corp. (The) | | 105,758 | | | 5,156,760 |
Bear Stearns Cos., Inc. (The)(b) | | 10,616 | | | 936,862 |
Charles Schwab Corp. (The) | | 88,550 | | | 2,262,453 |
Credit Suisse Group (Switzerland) | | 33,126 | | | 1,992,563 |
Deutsche Bank AG (Germany) | | 15,824 | | | 2,070,166 |
E*Trade Financial Corp.(a)(b) | | 41,500 | | | 147,325 |
Federated Investors, Inc.
(Class B Stock) | | 9,000 | | | 370,440 |
Franklin Resources, Inc. | | 15,200 | | | 1,739,336 |
Goldman Sachs Group, Inc.(b) | | 37,800 | | | 8,128,890 |
Investec PLC (United Kingdom) | | 29,721 | | | 266,380 |
Janus Capital Group, Inc.(b) | | 19,800 | | | 650,430 |
Legg Mason, Inc. | | 11,900 | | | 870,485 |
Lehman Brothers Holdings, Inc.(b) | | 48,600 | | | 3,180,384 |
Macquarie Group Ltd. (Australia) | | 4,941 | | | 330,589 |
Merrill Lynch & Co., Inc.(b) | | 82,300 | | | 4,417,864 |
Morgan Stanley | | 96,780 | | | 5,139,986 |
Northern Trust Corp.(b) | | 17,300 | | | 1,324,834 |
State Street Corp. | | 35,500 | | | 2,882,600 |
T. Rowe Price Group, Inc. | | 24,600 | | | 1,497,648 |
UBS AG (Switzerland) | | 15,427 | | | 714,017 |
| | | | |
|
|
| | | | | | 46,049,345 |
| | | | |
|
|
SEE NOTES TO FINANCIAL STATEMENTS.
A2
| | | | |
| | | CONSERVATIVE BALANCED PORTFOLIO (Continued) | | |
SCHEDULE OF INVESTMENTS | December 31, 2007 |
| | | | | |
COMMON STOCKS
(continued) | | Shares
| | Value
(Note 2)
|
| | | | | | |
Chemicals — 1.0% | | | | | |
Air Products and Chemicals, Inc. | | 20,100 | | $ | 1,982,463 |
Altana AG (Germany) | | 10,180 | | | 247,069 |
Ashland, Inc. | | 4,500 | | | 213,435 |
BASF AG (Germany) | | 8,845 | | | 1,309,480 |
Daicel Chemical Industries Ltd. (Japan) | | 12,000 | | | 71,757 |
Dainippon Ink & Chemicals, Inc. (Japan) | | 91,000 | | | 453,683 |
Dow Chemical Co. (The) | | 87,431 | | | 3,446,530 |
E. I. Du Pont de Nemours & Co. | | 84,620 | | | 3,730,896 |
Eastman Chemical Co. | | 7,400 | | | 452,066 |
Ecolab, Inc. | | 16,100 | | | 824,481 |
Hercules, Inc. | | 11,500 | | | 222,525 |
International Flavors & Fragrances, Inc. | | 8,300 | | | 399,479 |
Koninklijke DSM NV (Netherlands) | | 23,520 | | | 1,111,747 |
Kuraray Co. Ltd. (Japan) | | 53,000 | | | 639,409 |
Mitsubishi Chemical Holdings Corp. (Japan) | | 131,000 | | | 999,488 |
Mitsubishi Gas Chemical Co., Inc. (Japan) | | 31,000 | | | 301,573 |
Mitsui Chemicals, Inc. (Japan) | | 8,000 | | | 51,935 |
Monsanto Co. | | 50,494 | | | 5,639,674 |
Nippon Shokubai Co. Ltd. (Japan) | | 24,000 | | | 229,967 |
PPG Industries, Inc. | | 15,500 | | | 1,088,565 |
Praxair, Inc. | | 28,300 | | | 2,510,493 |
Rohm & Haas Co.(b) | | 11,611 | | | 616,196 |
Shin-Etsu Chemical Co. Ltd. (Japan) | | 2,200 | | | 136,821 |
Sigma-Aldrich Corp. | | 12,000 | | | 655,200 |
Zeon Corp. (Japan) | | 23,000 | | | 137,195 |
| | | | |
|
|
| | | | | | 27,472,127 |
| | | | |
|
|
Commercial Banks — 2.5% | | | | | |
Allied Irish Banks PLC (Ireland) | | 8,599 | | | 197,019 |
Alpha Bank AE (Greece) | | 27,684 | | | 1,007,839 |
Australia & New Zealand Banking Group Ltd. (Australia) | | 4,867 | | | 116,474 |
Banco Bilbao Vizcaya Argentaria SA (Spain) | | 93,717 | | | 2,296,441 |
Banco BPI SA (Portugal) | | 29,904 | | | 234,346 |
Banco Espirito Santo SA (Portugal) | | 46,470 | | | 1,019,124 |
Banco Popolare Scarl (Italy)(a) | | 5,772 | | | 127,935 |
Banco Santander Central Hispano SA (Spain) | | 151,989 | | | 3,286,573 |
Barclay’s PLC (United Kingdom) | | 85,086 | | | 853,638 |
BB&T Corp.(b) | | 53,100 | | | 1,628,577 |
BNP Paribas (France) | | 21,683 | | | 2,352,899 |
Chiba Bank Ltd. (The) (Japan) | | 24,000 | | | 193,113 |
Comerica, Inc. | | 15,200 | | | 661,656 |
Commerce Bancorp, Inc. | | 16,700 | | | 636,938 |
Commerzbank AG (Germany) | | 35,915 | | | 1,380,478 |
Commonwealth Bank of Australia (Australia) | | 6,069 | | | 312,910 |
Credit Agricole SA (France) | | 4,328 | | | 145,981 |
Danske Bank A/S (Denmark) | | 31,080 | | | 1,217,288 |
Dexia (Belgium) | | 42,152 | | | 1,061,858 |
DNB NOR ASA (Norway) | | 81,400 | | | 1,244,270 |
EFG Eurobank Ergasias (Greece) | | 1,964 | | | 69,145 |
Fifth Third Bancorp | | 55,221 | | | 1,387,704 |
First Horizon National Corp.(b) | | 13,600 | | | 246,840 |
Hachijuni Bank Ltd. (The) (Japan) | | 12,000 | | | 80,628 |
HBOS PLC (United Kingdom) | | 81,542 | | | 1,193,036 |
HSBC Holdings PLC (United Kingdom) | | 120,067 | | | 2,012,430 |
Huntington Bancshares, Inc. | | 41,936 | | | 618,975 |
Hypo Real Estate Holding AG (Germany) | | 17,708 | | | 939,549 |
Intesa Sanpaolo SpA (Italy) | | 44,757 | | | 354,015 |
Jyske Bank A/S (Denmark)(a) | | 1,475 | | | 116,264 |
KeyCorp | | 37,100 | | | 869,995 |
SEE NOTES TO FINANCIAL STATEMENTS.
A3
| | | | |
| | | CONSERVATIVE BALANCED PORTFOLIO (Continued) | | |
SCHEDULE OF INVESTMENTS | December 31, 2007 |
| | | | | |
COMMON STOCKS
(continued) | | Shares
| | Value
(Note 2)
|
| | | | | | |
Commercial Banks (continued) | | | | | |
Lloyds TSB Group PLC (United Kingdom) | | 60,232 | | $ | 565,919 |
M&T Bank Corp. | | 8,300 | | | 677,031 |
Marshall & Ilsley Corp.(b) | | 24,900 | | | 659,352 |
Mitsubishi Financial Group, Inc. (Japan) | | 17,900 | | | 168,796 |
National Australia Bank Ltd. (Australia) | | 9,565 | | | 315,066 |
National Bank of Greece SA (Greece) | | 2,435 | | | 167,253 |
National City Corp.(b) | | 59,900 | | | 985,954 |
Nishi-Nippon City Bank Ltd. (The) (Japan) | | 16,000 | | | 39,629 |
PNC Financial Services Group, Inc. | | 32,000 | | | 2,100,800 |
Regions Financial Corp.(b) | | 70,203 | | | 1,660,301 |
Royal Bank of Scotland Group PLC
(United Kingdom) | | 221,819 | | | 1,960,499 |
Skandinaviska Enskilda Banken AB
(Class A Stock) (Sweden) | | 23,400 | | | 599,192 |
Societe Generale (France) | | 6,767 | | | 978,785 |
Sumitomo Mitsui Financial Group, Inc. (Japan) | | 99 | | | 732,628 |
SunTrust Banks, Inc. | | 33,000 | | | 2,062,170 |
Svenska Handelbanken
(Class A Stock) (Sweden) | | 27,900 | | | 893,567 |
Swedbank AB
(Class A Stock) (Sweden) | | 1,900 | | | 53,797 |
Sydbank A/S (Denmark) | | 3,072 | | | 132,065 |
Synovus Financial Corp.(b) | | 29,750 | | | 716,380 |
U.S. Bancorp | | 159,085 | | | 5,049,357 |
UniCredito Italiano SpA (Italy) | | 193,178 | | | 1,604,239 |
Wachovia Corp.(b) | | 181,640 | | | 6,907,768 |
Wells Fargo & Co. | | 308,500 | | | 9,313,614 |
Westpac Banking Corp. (Australia) | | 28,463 | | | 692,134 |
Zions Bancorporation | | 11,350 | | | 529,932 |
| | | | |
|
|
| | | | | | 67,430,166 |
| | | | |
|
|
Commercial Services & Supplies — 0.2% | | | | | |
Allied Waste Industries, Inc.(a)(b) | | 26,400 | | | 290,928 |
Avery Dennison Corp. | | 9,100 | | | 483,574 |
Cintas Corp.(b) | | 11,200 | | | 376,544 |
Downer EDI Ltd. | | 114,678 | | | 538,535 |
Equifax, Inc. | | 13,700 | | | 498,132 |
Michael Page International PLC
(United Kingdom) | | 27,692 | | | 158,757 |
Monster Worldwide, Inc.(a) | | 13,100 | | | 424,440 |
Pitney Bowes, Inc. | | 21,600 | | | 821,664 |
Robert Half International, Inc. | | 15,500 | | | 419,120 |
RR Donnelley & Sons Co. | | 19,500 | | | 735,930 |
Waste Management, Inc. | | 48,542 | | | 1,585,867 |
| | | | |
|
|
| | | | | | 6,333,491 |
| | | | |
|
|
Communications Equipment — 1.3% | | | | | |
Ciena Corp.(a)(b) | | 9,142 | | | 311,834 |
Cisco Systems, Inc.(a) | | 560,200 | | | 15,164,613 |
Corning, Inc. | | 141,900 | | | 3,404,181 |
JDS Uniphase Corp.(a)(b) | | 14,075 | | | 187,198 |
Juniper Networks, Inc.(a) | | 51,500 | | | 1,709,800 |
Motorola, Inc.(b) | | 207,225 | | | 3,323,889 |
Nokia Corp. (Finland) | | 91,855 | | | 3,561,552 |
QUALCOMM, Inc. | | 152,900 | | | 6,016,615 |
Tellabs, Inc.(a)(b) | | 45,800 | | | 299,532 |
| | | | |
|
|
| | | | | | 33,979,214 |
| | | | |
|
|
SEE NOTES TO FINANCIAL STATEMENTS.
A4
| | | | |
| | | CONSERVATIVE BALANCED PORTFOLIO (Continued) | | |
SCHEDULE OF INVESTMENTS | December 31, 2007 |
| | | | | |
COMMON STOCKS
(continued) | | Shares
| | Value
(Note 2)
|
| | | | | | |
Computers & Peripherals — 2.0% | | | | | |
Apple, Inc.(a) | | 80,300 | | $ | 15,905,823 |
Dell, Inc.(a) | | 206,600 | | | 5,063,766 |
EMC Corp.(a) | | 191,550 | | | 3,549,422 |
Hewlett-Packard Co. | | 239,548 | | | 12,092,383 |
International Business Machines Corp.(b) | | 126,800 | | | 13,707,080 |
Lexmark International, Inc.(a)(b) | | 9,833 | | | 342,778 |
Network Appliance, Inc.(a) | | 38,800 | | | 968,448 |
QLogic Corp.(a) | | 16,600 | | | 235,720 |
SanDisk Corp.(a)(b) | | 19,500 | | | 646,815 |
Sun Microsystems, Inc.(a)(b) | | 81,575 | | | 1,478,955 |
Teradata Corp.(a) | | 17,600 | | | 482,416 |
Toshiba Corp. (Japan) | | 12,000 | | | 88,560 |
Wincor Nixdorf AG (Germany) | | 2,194 | | | 207,477 |
| | | | |
|
|
| | | | | | 54,769,643 |
| | | | |
|
|
Construction & Engineering — 0.1% | | | | | |
ACS Actividades de Construccion y Servicios SA (Spain) | | 12,580 | | | 747,660 |
COMSYS Holdings Corp. (Japan) | | 34,000 | | | 276,741 |
Fluor Corp. | | 8,100 | | | 1,180,332 |
Jacobs Engineering Group, Inc.(a)(b) | | 10,000 | | | 956,100 |
JGC Corp. (Japan) | | 6,000 | | | 102,877 |
YIT OYJ (Finland) | | 5,508 | | | 120,714 |
| | | | |
|
|
| | | | | | 3,384,424 |
| | | | |
|
|
Construction Materials — 0.1% | | | | | |
Cimpor Cimentos de Portugal SGPS SA (Portugal) | | 14,789 | | | 129,734 |
Holcim Ltd. (Switzerland) | | 7,861 | | | 842,238 |
Italcementi SpA (Italy) | | 5,480 | | | 117,216 |
Lafarge SA (France) | | 9,406 | | | 1,712,132 |
Vulcan Materials Co. | | 9,100 | | | 719,719 |
| | | | |
|
|
| | | | | | 3,521,039 |
| | | | |
|
|
Consumer Finance — 0.4% | | | | | |
American Express Co. | | 108,800 | | | 5,659,776 |
Capital One Financial Corp.(b) | | 38,761 | | | 1,831,845 |
Discover Financial Services | | 42,740 | | | 644,519 |
SLM Corp.(b) | | 41,900 | | | 843,866 |
Takefuji Corp. (Japan) | | 17,860 | | | 428,972 |
| | | | |
|
|
| | | | | | 9,408,978 |
| | | | |
|
|
Containers & Packaging | | | | | |
Ball Corp. | | 10,000 | | | 450,000 |
Bemis Co. | | 11,300 | | | 309,394 |
Pactiv Corp.(a) | | 10,900 | | | 290,267 |
Sealed Air Corp. | | 13,200 | | | 305,448 |
| | | | |
|
|
| | | | | | 1,355,109 |
| | | | |
|
|
Distributors — 0.1% | | | | | |
Genuine Parts Co. | | 15,200 | | | 703,760 |
Li & Fung Ltd. (Hong Kong) | | 62,000 | | | 247,177 |
Pacific Brands Ltd. (Australia) | | 220,957 | | | 627,502 |
| | | | |
|
|
| | | | | | 1,578,439 |
| | | | |
|
|
Diversified Consumer Services — 0.1% | | | | | |
Apollo Group, Inc.(a)(b) | | 13,000 | | | 911,950 |
H&R Block, Inc.(b) | | 29,100 | | | 540,387 |
| | | | |
|
|
| | | | | | 1,452,337 |
| | | | |
|
|
Diversified Financial Services — 2.1% | | | | | |
Babcock & Brown Ltd. (Australia) | | 5,925 | | | 139,370 |
Bank of America Corp. | | 408,238 | | | 16,843,899 |
SEE NOTES TO FINANCIAL STATEMENTS.
A5
| | | | |
| | | CONSERVATIVE BALANCED PORTFOLIO (Continued) | | |
SCHEDULE OF INVESTMENTS | December 31, 2007 |
| | | | | |
COMMON STOCKS
(continued) | | Shares
| | Value
(Note 2)
|
| | | | | | |
Diversified Financial Services (continued) | | | | | |
Challenger Financial Services Group Ltd. (Australia) | | 52,584 | | $ | 227,769 |
CIT Group, Inc.(b) | | 19,000 | | | 456,570 |
Citigroup, Inc.(b) | | 463,258 | | | 13,638,316 |
CME Group, Inc. | | 4,990 | | | 3,423,140 |
Fortis (Belgium) | | 34,966 | | | 920,709 |
Hong Kong Exchanges and Clearing Ltd. (Hong Kong) | | 34,000 | | | 953,149 |
ING Groep NV (Netherlands) | | 51,545 | | | 2,015,920 |
IntercontinentalExchange, Inc.(a) | | 6,100 | | | 1,174,250 |
JPMorgan Chase & Co. | | 313,201 | | | 13,671,224 |
Leucadia National Corp.(b) | | 14,600 | | | 687,660 |
Moody’s Corp.(b) | | 21,100 | | | 753,270 |
NYSE Euronext | | 23,800 | | | 2,088,926 |
OKO Bank PLC (Finland) | | 22,256 | | | 425,290 |
Singapore Exchange Ltd. (Singapore) | | 71,000 | | | 650,398 |
| | | | |
|
|
| | | | | | 58,069,860 |
| | | | |
|
|
Diversified Telecommunication Services — 1.7% |
AT&T, Inc. | | 562,168 | | | 23,363,702 |
Belgacom SA (Belgium) | | 22,824 | | | 1,125,900 |
BT Group PLC (United Kingdom) | | 126,583 | | | 687,266 |
CenturyTel, Inc. | | 10,400 | | | 431,184 |
Citizens Communications Co. | | 31,000 | | | 394,630 |
Embarq Corp. | | 14,343 | | | 710,409 |
France Telecom SA (France) | | 42,304 | | | 1,522,763 |
Nippon Telegraph & Telephone Corp. (Japan) | | 88 | | | 437,442 |
Qwest Communications International, Inc.(a)(b) | | 151,257 | | | 1,060,312 |
Swisscom AG (Switzerland) | | 1,076 | | | 420,079 |
Tele2 AB (Class B Stock) (Sweden) | | 33,600 | | | 673,227 |
Telecom Corp. of New Zealand Ltd. (New Zealand) | | 99,674 | | | 332,965 |
Telecom Italia SpA (Italy) | | 38,827 | | | 120,630 |
Telecom Italia SpA (Italy) | | 534,665 | | | 1,271,058 |
Telefonica SA (Spain) | | 37,323 | | | 1,212,505 |
Verizon Communications Group, Inc.(b) | | 265,176 | | | 11,585,539 |
Windstream Corp. | | 45,857 | | | 597,058 |
| | | | |
|
|
| | | | | | 45,946,669 |
| | | | |
|
|
Electric Utilities — 1.2% | | | | | |
Allegheny Energy, Inc. | | 14,900 | | | 947,789 |
American Electric Power Co., Inc. | | 36,160 | | | 1,683,610 |
CLP Holdings Ltd. (Hong Kong) | | 71,500 | | | 485,772 |
Duke Energy Corp. | | 112,824 | | | 2,275,660 |
E.ON AG (Germany) | | 16,525 | | | 3,517,998 |
Edison International | | 29,800 | | | 1,590,426 |
Enel SpA (Italy) | | 94,789 | | | 1,127,401 |
Entergy Corp. | | 18,200 | | | 2,175,264 |
Exelon Corp. | | 62,474 | | | 5,100,378 |
FirstEnergy Corp. | | 27,401 | | | 1,982,188 |
FPL Group, Inc. | | 38,000 | | | 2,575,640 |
Hong Kong Electric Holdings (Hong Kong) | | 20,000 | | | 114,457 |
Pepco Holdings, Inc. | | 15,800 | | | 463,414 |
Pinnacle West Capital Corp. | | 9,700 | | | 411,377 |
PPL Corp. | | 36,000 | | | 1,875,240 |
Progress Energy, Inc. | | 24,583 | | | 1,190,555 |
Public Power Corp. SA (Greece) | | 6,658 | | | 350,436 |
Scottish & Southern Energy PLC (United Kingdom) | | 6,522 | | | 212,657 |
Southern Co. (The) | | 69,500 | | | 2,693,125 |
Union Fenosa SA (Spain) | | 13,943 | | | 941,601 |
| | | | |
|
|
| | | | | | 31,714,988 |
| | | | |
|
|
SEE NOTES TO FINANCIAL STATEMENTS.
A6
| | | | |
| | | CONSERVATIVE BALANCED PORTFOLIO (Continued) | | |
SCHEDULE OF INVESTMENTS | December 31, 2007 |
| | | | | |
COMMON STOCKS
(continued) | | Shares
| | Value
(Note 2)
|
| | | | | | |
Electrical Equipment — 0.4% | | | | | |
ABB Ltd. (Switzerland) | | 48,358 | | $ | 1,393,312 |
Alstom (France) | | 2,486 | | | 534,295 |
Cooper Industries Ltd. | | 17,400 | | | 920,112 |
Emerson Electric Co. | | 72,200 | | | 4,090,852 |
Hitachi Cable Ltd. (Japan) | | 48,000 | | | 283,252 |
Rockwell Automation, Inc. | | 16,200 | | | 1,117,152 |
Schneider Electric SA (France) | | 8,148 | | | 1,104,079 |
Sumitomo Electric Industries Ltd. (Japan) | | 13,700 | | | 216,070 |
Vestas Wind Systems A/S (Denmark)(a) | | 5,042 | | | 545,717 |
| | | | |
|
|
| | | | | | 10,204,841 |
| | | | |
|
|
Electronic Equipment & Instruments — 0.2% | | | | | |
Agilent Technologies, Inc.(a) | | 35,314 | | | 1,297,436 |
FUJIFILM Holdings Corp. (Japan) | | 2,400 | | | 100,453 |
Hitachi Ltd. (Japan) | | 46,000 | | | 341,750 |
Jabil Circuit, Inc. | | 21,600 | | | 329,832 |
Kyocera Corp. (Japan) | | 2,500 | | | 220,936 |
Molex, Inc. | | 11,700 | | | 319,410 |
Omron Corp. (Japan) | | 28,800 | | | 678,050 |
Tyco Electronics Ltd. (Bermuda) | | 46,315 | | | 1,719,677 |
Venture Manufacturing Ltd. Corp. (Singapore) | | 13,000 | | | 114,018 |
| | | | |
|
|
| | | | | | 5,121,562 |
| | | | |
|
|
Energy Equipment & Services — 1.2% | | | | | |
B.J. Services Co. | | 26,500 | | | 642,890 |
Baker Hughes, Inc.(b) | | 29,150 | | | 2,364,065 |
ENSCO International, Inc. | | 13,500 | | | 804,870 |
Halliburton Co. | | 85,500 | | | 3,241,305 |
Nabors Industries Ltd. (Bermuda)(a) | | 24,500 | | | 671,055 |
National Oilwell Varco, Inc.(a)(b) | | 33,600 | | | 2,468,256 |
Noble Corp. | | 25,200 | | | 1,424,052 |
Rowan Cos., Inc.(b) | | 8,200 | | | 323,572 |
Schlumberger Ltd. | | 109,000 | | | 10,722,330 |
Smith International, Inc. | | 17,900 | | | 1,321,915 |
Transocean, Inc. | | 28,247 | | | 4,043,558 |
Weatherford International Ltd.(a) | | 30,500 | | | 2,092,300 |
WorleyParsons Ltd. (Australia) | | 37,735 | | | 1,699,939 |
| | | | |
|
|
| | | | | | 31,820,107 |
| | | | |
|
|
Exchange Traded Fund | | | | | |
Ishares Msci Eafe Index Fund | | 4,400 | | | 345,400 |
| | | | |
|
|
Food & Staples Retailing — 1.2% | | | | | |
Casino GuichardPerrachon SA (France) | | 7,748 | | | 842,689 |
Circle K Sunkus Co. Ltd. (Japan) | | 5,100 | | | 75,383 |
Costco Wholesale Corp. | | 40,000 | | | 2,790,400 |
CVS Corp. | | 135,248 | | | 5,376,108 |
FamilyMart Co. Ltd. (Japan) | | 5,100 | | | 159,704 |
Koninklijke Ahold NV (Netherlands) | | 4,470 | | | 62,282 |
Kroger Co. (The) | | 65,846 | | | 1,758,747 |
Matsumotokiyoshi Holdings Co. Ltd. (Japan) | | 4,300 | | | 104,695 |
Safeway, Inc. | | 40,100 | | | 1,371,821 |
Supervalu, Inc. | | 20,010 | | | 750,775 |
Sysco Corp. | | 56,100 | | | 1,750,881 |
UNY Co. Ltd. | | 42,000 | | | 354,764 |
Walgreen Co.(b) | | 93,100 | | | 3,545,248 |
Wal-Mart Stores, Inc.(b) | | 220,800 | | | 10,494,624 |
Wesfarmers Ltd. (Australia)(a) | | 2,092 | | | 74,761 |
SEE NOTES TO FINANCIAL STATEMENTS.
A7
| | | | |
| | | CONSERVATIVE BALANCED PORTFOLIO (Continued) | | |
SCHEDULE OF INVESTMENTS | December 31, 2007 |
| | | | | |
COMMON STOCKS
(continued) | | Shares
| | Value
(Note 2)
|
| | | | | | |
Food & Staples Retailing (continued) | | | | | |
Whole Foods Market, Inc.(b) | | 14,100 | | $ | 575,280 |
Woolworths Ltd. (Australia) | | 52,604 | | | 1,560,025 |
| | | | |
|
|
| | | | | | 31,648,187 |
| | | | |
|
|
Food Products — 0.9% | | | | | |
Archer-Daniels-Midland Co. | | 57,126 | | | 2,652,360 |
Campbell Soup Co. | | 20,700 | | | 739,611 |
ConAgra Foods, Inc. | | 47,300 | | | 1,125,267 |
Danisco A/S (Denmark) | | 3,150 | | | 223,277 |
Dean Foods Co. | | 12,000 | | | 310,320 |
East Asiatic Co. Ltd. A/S (Denmark) | | 8,500 | | | 662,494 |
Futuris Corp. Ltd. (Australia) | | 100,391 | | | 188,315 |
General Mills, Inc. | | 29,400 | | | 1,675,800 |
Goodman Fielder Ltd. | | 505,016 | | | 834,865 |
H.J. Heinz Co. | | 28,000 | | | 1,307,040 |
Hershey Co. (The)(b) | | 15,300 | | | 602,820 |
Kellogg Co.(b) | | 24,400 | | | 1,279,292 |
Kraft Foods, Inc. | | 144,053 | | | 4,700,449 |
McCormick & Co., Inc. | | 11,000 | | | 417,010 |
Nestle SA (Class B Stock) (Switzerland) | | 4,773 | | | 2,192,254 |
Sara Lee Corp. | | 68,000 | | | 1,092,080 |
Tyson Foods, Inc. (Class A Stock)(b) | | 22,700 | | | 347,991 |
Unilever NV (Netherlands) | | 19,389 | | | 712,946 |
Unilever PLC (United Kingdom) | | 37,773 | | | 1,421,112 |
Wilmar International Ltd. (Singapore) | | 228,000 | | | 847,230 |
WM Wrigley Jr. Co. | | 20,000 | | | 1,171,000 |
| | | | |
|
|
| | | | | | 24,503,533 |
| | | | |
|
|
Gas Utilities — 0.1% | | | | | |
Gas Natural SDG SA (Spain) | | 7,157 | | | 418,766 |
Nicor, Inc. | | 4,600 | | | 194,810 |
Questar Corp. | | 15,200 | | | 822,320 |
| | | | |
|
|
| | | | | | 1,435,896 |
| | | | |
|
|
Healthcare Equipment & Supplies — 0.8% | | | | | |
Baxter International, Inc. | | 58,900 | | | 3,419,145 |
Becton Dickinson & Co. | | 22,400 | | | 1,872,192 |
Boston Scientific Corp.(a)(b) | | 114,967 | | | 1,337,066 |
C.R. Bard, Inc. | | 9,100 | | | 862,680 |
Covidien Ltd. (Bermuda) | | 46,315 | | | 2,051,291 |
Hospira, Inc.(a) | | 12,560 | | | 535,558 |
Medtronic, Inc. | | 103,600 | | | 5,207,973 |
Olympus Corp. (Japan) | | 15,000 | | | 611,325 |
St. Jude Medical, Inc.(a) | | 31,200 | | | 1,267,968 |
Stryker Corp. | | 21,700 | | | 1,621,424 |
Varian Medical Systems, Inc.(a) | | 11,600 | | | 605,056 |
Zimmer Holdings, Inc.(a) | | 22,500 | | | 1,488,375 |
| | | | |
|
|
| | | | | | 20,880,053 |
| | | | |
|
|
Healthcare Providers & Services — 1.1% | | | | | |
Aetna, Inc. | | 46,500 | | | 2,684,445 |
AmerisourceBergen Corp. | | 18,600 | | | 834,582 |
Cardinal Health, Inc. | | 34,250 | | | 1,977,938 |
Cigna Corp. | | 28,400 | | | 1,525,932 |
Coventry Health Care, Inc.(a) | | 13,950 | | | 826,538 |
Express Scripts, Inc.(a) | | 26,300 | | | 1,919,900 |
Humana, Inc.(a)(b) | | 15,900 | | | 1,197,429 |
Laboratory Corp. of America Holdings(a)(b) | | 11,200 | | | 845,936 |
McKesson Corp. | | 26,930 | | | 1,764,184 |
SEE NOTES TO FINANCIAL STATEMENTS.
A8
| | | | |
| | | CONSERVATIVE BALANCED PORTFOLIO (Continued) | | |
SCHEDULE OF INVESTMENTS | December 31, 2007 |
| | | | | |
COMMON STOCKS
(continued) | | Shares
| | Value
(Note 2)
|
| | | | | | |
Healthcare Providers & Services (continued) | | | | | |
Medco Health Solutions, Inc.(a)(b) | | 24,749 | | $ | 2,509,549 |
Parkway Holdings Ltd. (Singapore) | | 78,000 | | | 211,969 |
Patterson Cos., Inc.(a)(b) | | 10,000 | | | 339,500 |
Quest Diagnostics, Inc.(b) | | 15,100 | | | 798,790 |
Suzuken Co. Ltd. (Japan) | | 10,900 | | | 387,979 |
Tenet Healthcare Corp.(a)(b) | | 44,600 | | | 226,568 |
UnitedHealth Group, Inc. | | 121,700 | | | 7,082,939 |
WellPoint, Inc.(a) | | 54,600 | | | 4,790,058 |
| | | | |
|
|
| | | | | | 29,924,236 |
| | | | |
|
|
Healthcare Technology | | | | | |
IMS Health, Inc. | | 17,200 | | | 396,288 |
| | | | |
|
|
Hotels, Restaurants & Leisure — 0.6% | | | | | |
Carnival Corp. | | 41,400 | | | 1,841,886 |
Darden Restaurants, Inc.(b) | | 13,050 | | | 361,616 |
Enterprise Inns PLC (United Kingdom) | | 29,615 | | | 287,095 |
Harrah’s Entertainment, Inc. | | 17,500 | | | 1,553,125 |
International Game Technology | | 29,300 | | | 1,287,149 |
Marriott International, Inc. (Class A Stock) | | 30,300 | | | 1,035,654 |
McDonald’s Corp.(b) | | 108,900 | | | 6,415,299 |
OPAP SA (Greece) | | 2,290 | | | 91,805 |
Starbucks Corp.(a) | | 67,300 | | | 1,377,631 |
Starwood Hotels & Resorts Worldwide, Inc. | | 18,000 | | | 792,540 |
Wendy’s International, Inc. | | 9,600 | | | 248,064 |
Wyndham Worldwide Corp. | | 16,420 | | | 386,855 |
Yum! Brands, Inc. | | 48,200 | | | 1,844,614 |
| | | | |
|
|
| | | | | | 17,523,333 |
| | | | |
|
|
Household Durables — 0.3% | | | | | |
Barratt Developments PLC (United Kingdom) | | 34,117 | | | 309,346 |
Bellway PLC (United Kingdom) | | 7,664 | | | 127,159 |
Black & Decker Corp. | | 6,900 | | | 480,585 |
Bovis Homes Group PLC (United Kingdom) | | 7,894 | | | 96,797 |
Centex Corp. | | 8,700 | | | 219,762 |
D.R. Horton, Inc.(b) | | 23,700 | | | 312,129 |
Fortune Brands, Inc. | | 14,000 | | | 1,013,040 |
Harman International Industries, Inc. | | 6,400 | | | 471,744 |
KB Home(b) | | 5,700 | | | 123,120 |
Leggett & Platt, Inc. | | 14,800 | | | 258,112 |
Lennar Corp.(b) | | 13,300 | | | 237,937 |
Matsushita Electric Industrial Co. Ltd. (Japan) | | 25,000 | | | 512,272 |
Newell Rubbermaid, Inc. | | 26,414 | | | 683,594 |
Pulte Homes, Inc. | | 16,100 | | | 169,694 |
Sekisui Chemical Co. Ltd. (Japan) | | 108,000 | | | 721,391 |
Sekisui House Ltd. (Japan) | | 90,000 | | | 961,953 |
Snap-On, Inc. | | 4,900 | | | 236,376 |
Stanley Works (The) | | 7,900 | | | 382,992 |
Taylor Wimpey PLC (United Kingdom) | | 161,898 | | | 655,024 |
TomTom NV (Netherlands)(a) | | 993 | | | 74,769 |
Whirlpool Corp. | | 7,526 | | | 614,347 |
| | | | |
|
|
| | | | | | 8,662,143 |
| | | | |
|
|
Household Products — 1.1% | | | | | |
Clorox Co. | | 13,800 | | | 899,346 |
Colgate-Palmolive Co. | | 45,700 | | | 3,562,772 |
Kimberly-Clark Corp. | | 41,600 | | | 2,884,544 |
Procter & Gamble Co. | | 287,025 | | | 21,073,375 |
Reckitt Benckiser Group PLC (United Kingdom) | | 28,625 | | | 1,660,428 |
| | | | |
|
|
| | | | | | 30,080,465 |
| | | | |
|
|
SEE NOTES TO FINANCIAL STATEMENTS.
A9
| | | | |
| | | CONSERVATIVE BALANCED PORTFOLIO (Continued) | | |
SCHEDULE OF INVESTMENTS | December 31, 2007 |
| | | | | |
COMMON STOCKS
(continued) | | Shares
| | Value
(Note 2)
|
| | | | | | |
Independent Power Producers & Energy Traders — 0.1% |
AES Corp. (The)(a) | | 61,100 | | $ | 1,306,929 |
Constellation Energy Group, Inc. | | 17,100 | | | 1,753,263 |
Dynegy, Inc. (Class A Stock)(a) | | 37,500 | | | 267,750 |
| | | | |
|
|
| | | | | | 3,327,942 |
| | | | |
|
|
Industrial Conglomerates — 1.7% | | | | | |
3M Co. | | 65,400 | | | 5,514,528 |
Cookson Group PLC (United Kingdom) | | 9,396 | | | 130,365 |
General Electric Co. | | 939,000 | | | 34,808,729 |
Keppel Corp. Ltd. (Singapore) | | 80,000 | | | 712,854 |
Koninklijke (Royal) Philips Electronics NV (Netherlands) | | 1,202 | | | 51,878 |
Rheinmetall AG (Germany) | | 626 | | | 50,174 |
SembCorp Industries Ltd. (Singapore) | | 77,000 | | | 306,041 |
Siemens AG (Germany) | | 4,593 | | | 728,063 |
Textron, Inc. | | 21,700 | | | 1,547,210 |
Tyco International Ltd. (Bermuda) | | 46,315 | | | 1,836,390 |
Wendel (France) | | 3,596 | | | 520,181 |
| | | | |
|
|
| | | | | | 46,206,413 |
| | | | |
|
|
Insurance — 2.2% | | | | | |
ACE Ltd. (Bermuda) | | 31,000 | | | 1,915,180 |
Aegon NV (Netherlands) | | 23,250 | | | 410,972 |
Aflac, Inc. | | 44,600 | | | 2,793,298 |
Allianz AG (Germany) | | 11,366 | | | 2,460,747 |
Allstate Corp. (The) | | 56,200 | | | 2,935,326 |
AMBAC Financial Group, Inc.(b) | | 13,400 | | | 345,318 |
American International Group, Inc. | | 236,888 | | | 13,810,569 |
AON Corp.(b) | | 26,400 | | | 1,259,016 |
Assurant, Inc.(b) | | 10,300 | | | 689,070 |
Aviva PLC (United Kingdom) | | 71,913 | | | 963,402 |
AXA SA (France) | | 32,807 | | | 1,313,777 |
Chubb Corp. | | 36,700 | | | 2,003,086 |
Cincinnati Financial Corp. | | 17,837 | | | 705,275 |
CNP Assurances (France) | | 2,969 | | | 386,291 |
Genworth Financial, Inc. | | 42,900 | | | 1,091,805 |
Hartford Financial Services Group, Inc. | | 30,000 | | | 2,615,700 |
Legal & General Group PLC (United Kingdom) | | 85,000 | | | 220,977 |
Lincoln National Corp. | | 26,117 | | | 1,520,532 |
Loews Corp. | | 41,400 | | | 2,084,076 |
Marsh & McLennan Cos., Inc. | | 50,600 | | | 1,339,382 |
MBIA, Inc.(b) | | 12,250 | | | 228,218 |
MetLife, Inc. | | 68,500 | | | 4,220,969 |
Muenchener Rueckversicherungs-Gesellschaft AG (Germany) | | 9,036 | | | 1,755,095 |
Old Mutual PLC (United Kingdom) | | 64,863 | | | 216,399 |
Principal Financial Group | | 25,400 | | | 1,748,536 |
Progressive Corp. (The) | | 70,100 | | | 1,343,116 |
Royal & Sun Alliance Insurance Group PLC (United Kingdom) | | 277,795 | | | 819,516 |
SAFECO Corp. | | 11,000 | | | 612,480 |
SCOR (France) | | 17,548 | | | 448,982 |
Suncorp-Metway Ltd. (Australia) | | 17,009 | | | 251,053 |
Swiss Life Holding (Switzerland) | | 1,397 | | | 349,204 |
Swiss Reinsurance (Switzerland) | | 15,947 | | | 1,133,186 |
Torchmark Corp. | | 9,000 | | | 544,770 |
Travelers Cos., Inc. (The) | | 60,235 | | | 3,240,643 |
UnumProvident Corp. | | 32,210 | | | 766,276 |
XL Capital Ltd. (Class A Stock) (Bermuda) | | 18,300 | | | 920,673 |
Zurich Financial Services AG (Switzerland) | | 4,088 | | | 1,200,601 |
| | | | |
|
|
| | | | | | 60,663,516 |
| | | | |
|
|
SEE NOTES TO FINANCIAL STATEMENTS.
A10
| | | | |
| | | CONSERVATIVE BALANCED PORTFOLIO (Continued) | | |
SCHEDULE OF INVESTMENTS | December 31, 2007 |
| | | | | |
COMMON STOCKS
(continued) | | Shares
| | Value
(Note 2)
|
| | | | | | |
Internet & Catalog Retail — 0.2% | | | | | |
Amazon.com, Inc.(a)(b) | | 27,300 | | $ | 2,529,072 |
Expedia, Inc.(a)(b) | | 16,300 | | | 515,406 |
Home Retail Group PLC (United Kingdom) | | 162,348 | | | 1,060,000 |
IAC/InterActive Corp.(a)(b) | | 16,900 | | | 454,948 |
| | | | |
|
|
| | | | | | 4,559,426 |
| | | | |
|
|
Internet Software & Services — 0.8% | | | | | |
Akamai Technologies, Inc.(a)(b) | | 12,200 | | | 422,120 |
eBay, Inc.(a) | | 107,700 | | | 3,574,563 |
Google, Inc. (Class A Stock)(a) | | 21,250 | | | 14,693,950 |
Tencent Holdings Ltd. (China) | | 57,000 | | | 425,726 |
Verisign, Inc.(a)(b) | | 19,500 | | | 733,395 |
Yahoo!, Inc.(a) | | 123,100 | | | 2,863,306 |
| | | | |
|
|
| | | | | | 22,713,060 |
| | | | |
|
|
IT Services — 0.4% | | | | | |
Affiliated Computer Services, Inc.(a) | | 10,400 | | | 469,040 |
Automatic Data Processing, Inc. | | 51,500 | | | 2,293,295 |
Cognizant Technology Solutions Corp.(a) | | 27,200 | | | 923,168 |
Computer Sciences Corp.(a) | | 14,300 | | | 707,421 |
Convergys Corp.(a) | | 14,800 | | | 243,608 |
Electronic Data Systems Corp. | | 47,700 | | | 988,821 |
Fidelity National Information Services, Inc. | | 14,600 | | | 607,214 |
Fiserv, Inc.(a)(b) | | 15,700 | | | 871,193 |
Paychex, Inc.(b) | | 32,100 | | | 1,162,662 |
Unisys Corp.(a)(b) | | 31,500 | | | 148,995 |
Western Union Co. | | 72,110 | | | 1,750,831 |
| | | | |
|
|
| | | | | | 10,166,248 |
| | | | |
|
|
Leisure Equipment & Products — 0.1% | | | | | |
Brunswick Corp.(b) | | 7,200 | | | 122,760 |
Eastman Kodak Co.(b) | | 22,400 | | | 489,888 |
Hasbro, Inc. | | 15,800 | | | 404,164 |
Mattel, Inc. | | 36,451 | | | 694,027 |
Nikon Corp. (Japan) | | 24,000 | | | 816,439 |
Sankyo Co. Ltd. (Japan) | | 2,400 | | | 110,887 |
Yamaha Corp. (Japan) | | 5,100 | | | 116,364 |
| | | | |
|
|
| | | | | | 2,754,529 |
| | | | |
|
|
Life Sciences, Tools & Services — 0.2% | | | | | |
Applera Corp. – Applied Biosystems Group | | 17,300 | | | 586,816 |
Millipore Corp.(a)(b) | | 4,700 | | | 343,946 |
PerkinElmer, Inc. | | 12,800 | | | 333,056 |
Thermo Electron Corp.(a) | | 39,900 | | | 2,301,432 |
Waters Corp.(a) | | 9,200 | | | 727,444 |
| | | | |
|
|
| | | | | | 4,292,694 |
| | | | |
|
|
Machinery — 1.0% | | | | | |
Caterpillar, Inc.(b) | | 58,000 | | | 4,208,480 |
Charter PLC (United Kingdom)(a) | | 34,331 | | | 542,273 |
Cummins, Inc. | | 9,600 | | | 1,222,752 |
Danaher Corp. | | 22,300 | | | 1,956,602 |
Deere & Co. | | 40,600 | | | 3,780,672 |
Dover Corp. | | 19,300 | | | 889,537 |
Eaton Corp. | | 12,900 | | | 1,250,655 |
Illinois Tool Works, Inc. | | 38,400 | | | 2,055,936 |
Ingersoll-Rand Co. Ltd. (Class A Stock) (Bermuda) | | 29,200 | | | 1,356,924 |
ITT Corp. | | 16,500 | | | 1,089,660 |
Komatsu Ltd. (Japan) | | 50,700 | | | 1,359,732 |
SEE NOTES TO FINANCIAL STATEMENTS.
A11
| | | | |
| | | CONSERVATIVE BALANCED PORTFOLIO (Continued) | | |
SCHEDULE OF INVESTMENTS | December 31, 2007 |
| | | | | |
COMMON STOCKS
(continued) | | Shares
| | Value
(Note 2)
|
| | | | | | |
Machinery (continued) | | | | | |
Komori Corp. (Japan) | | 23,000 | | $ | 506,837 |
Konecranes OYJ (Finland) | | 11,581 | | | 399,257 |
Kubota Corp. (Japan) | | 33,000 | | | 222,074 |
MAN AG (Germany) | | 5,531 | | | 923,168 |
Manitowoc Co., Inc. (The)(b) | | 10,600 | | | 517,598 |
NSK Ltd. (Japan) | | 15,000 | | | 153,756 |
Paccar, Inc. | | 33,843 | | | 1,843,767 |
Pall Corp. | | 10,000 | | | 403,200 |
Parker Hannifin Corp. | | 16,065 | | | 1,209,855 |
Sandvik AB (Sweden) | | 27,499 | | | 473,336 |
Sumitomo Heavy Industries Ltd. (Japan) | | 10,000 | | | 91,176 |
Terex Corp.(a) | | 9,400 | | | 616,358 |
Trelleborg AB (Class B Stock) (Sweden) | | 13,200 | | | 276,736 |
| | | | |
|
|
| | | | | | 27,350,341 |
| | | | |
|
|
Marine — 0.1% | | | | | |
Cosco Corp. (Singapore) Ltd. (Singapore) | | 43,000 | | | 169,761 |
Kawasaki Kisen Kaisha Ltd. (Japan) | | 35,000 | | | 339,777 |
Mitsui O.S.K. Lines Ltd. (Japan) | | 96,000 | | | 1,213,661 |
Neptune Orient Lines Ltd. | | 19,000 | | | 51,075 |
Nippon Yusen KK (Japan) | | 55,000 | | | 433,290 |
Orient Overseas International Ltd. (Hong Kong) | | 12,000 | | | 87,915 |
| | | | |
|
|
| | | | | | 2,295,479 |
| | | | |
|
|
Media — 1.3% | | | | | |
CBS Corp. (Class B Stock)(b) | | 62,534 | | | 1,704,052 |
Clear Channel Communications, Inc. | | 45,700 | | | 1,577,564 |
Comcast Corp. (Class A Stock)(a)(b) | | 282,290 | | | 5,154,615 |
Daily Mail & General Trust PLC | | 18,954 | | | 187,423 |
DIRECTV Group, Inc. (The)(a) | | 69,200 | | | 1,599,904 |
E.W. Scripps Co. | | 8,600 | | | 387,086 |
Gannett Co., Inc.(b) | | 22,100 | | | 861,900 |
Gestevision Telecinco SA (Spain) | | 20,419 | | | 522,737 |
Interpublic Group of Cos., Inc.(a)(b) | | 37,200 | | | 301,692 |
Lagardere SCA (France) | | 4,545 | | | 340,824 |
McGraw-Hill Cos., Inc. (The) | | 32,500 | | | 1,423,825 |
Meredith Corp. | | 2,700 | | | 148,446 |
New York Times Co. (The) (Class A Stock)(b) | | 10,700 | | | 187,571 |
News Corp. (Class A Stock) | | 209,500 | | | 4,292,655 |
Omnicom Group, Inc. | | 31,400 | | | 1,492,442 |
Time Warner, Inc. | | 340,700 | | | 5,624,957 |
Viacom, Inc. (Class B Stock)(a) | | 63,734 | | | 2,799,197 |
Vivendi (France) | | 43,117 | | | 1,978,174 |
Walt Disney Co. (The) | | 177,300 | | | 5,723,244 |
Washington Post Co. (The) (Class B Stock) | | 200 | | | 158,286 |
| | | | |
|
|
| | | | | | 36,466,594 |
| | | | |
|
|
Metals & Mining — 0.9% | | | | | |
Acerinox SA (Spain) | | 11,138 | | | 274,065 |
Alcoa, Inc. | | 81,140 | | | 2,965,667 |
Allegheny Technologies, Inc.(b) | | 8,600 | | | 743,040 |
Anglo American PLC (United Kingdom) | | 4,919 | | | 301,587 |
ArcelorMittal (France) | | 7,301 | | | 587,094 |
BHP Billiton Ltd. (Australia) | | 67,974 | | | 2,376,237 |
BHP Billiton PLC (United Kingdom) | | 65,732 | | | 2,022,885 |
Boliden AB (Sweden) | | 4,350 | | | 54,685 |
Freeport-McMoRan Copper & Gold, Inc.(b) | | 34,694 | | | 3,554,053 |
Kobe Steel Ltd. (Japan) | | 142,000 | | | 457,788 |
SEE NOTES TO FINANCIAL STATEMENTS.
A12
| | | | |
| | | CONSERVATIVE BALANCED PORTFOLIO (Continued) | | |
SCHEDULE OF INVESTMENTS | December 31, 2007 |
| | | | | |
COMMON STOCKS
(continued) | | Shares
| | Value
(Note 2)
|
| | | | | | |
Metals & Mining (continued) | | | | | |
Mitsubishi Materials Corp. (Japan) | | 79,000 | | $ | 333,582 |
Newmont Mining Corp. (Netherlands) | | 42,500 | | | 2,075,275 |
Nippon Steel Corp. (Japan) | | 25,000 | | | 153,024 |
Nisshin Steel Co. Ltd. (Japan) | | 80,000 | | | 276,412 |
Nucor Corp. | | 27,400 | | | 1,622,628 |
Outokumpu OYJ (Class A Stock) (Finland) | | 12,357 | | | 383,192 |
Rio Tinto Group PLC (United Kingdom) | | 25,934 | | | 2,744,866 |
Salzgitter AG (Germany) | | 6,516 | | | 964,582 |
Sumitomo Metal Mining Co. Ltd. | | 13,000 | | | 219,785 |
ThyssenKrupp AG (Germany) | | 25,213 | | | 1,414,054 |
Titanium Metals Corp.(b) | | 4,000 | | | 105,800 |
United States Steel Corp. | | 11,400 | | | 1,378,374 |
Voestalpine AG (Australia) | | 4,504 | | | 325,632 |
Xstrata PLC (Switzerland) | | 1,622 | | | 114,621 |
Yamato Kogyo Co. Ltd. (Japan) | | 4,000 | | | 161,949 |
| | | | |
|
|
| | | | | | 25,610,877 |
| | | | |
|
|
Multiline Retail — 0.4% | | | | | |
Big Lots, Inc.(a)(b) | | 9,200 | | | 147,108 |
Dillard’s, Inc. | | 3,000 | | | 56,340 |
Family Dollar Stores, Inc.(b) | | 13,700 | | | 263,451 |
J.C. Penney Co., Inc. | | 21,100 | | | 928,189 |
Kohl’s Corp.(a) | | 28,400 | | | 1,300,720 |
Macy’s, Inc. | | 39,974 | | | 1,034,127 |
Marks & Spencer Group PLC (United Kingdom) | | 66,968 | | | 746,518 |
Next PLC (United Kingdom) | | 4,240 | | | 137,068 |
Nordstrom, Inc. | | 16,900 | | | 620,737 |
Ryohin Keikaku Co. Ltd. (Japan) | | 1,100 | | | 66,031 |
Sears Holding Corp.(a)(b) | | 6,342 | | | 647,201 |
Target Corp. | | 75,400 | | | 3,770,001 |
| | | | |
|
|
| | | | | | 9,717,491 |
| | | | |
|
|
Multi-Utilities — 0.6% | | | | | |
AGL Energy Ltd. (Australia) | | 5,626 | | | 65,493 |
Ameren Corp.(b) | | 18,100 | | | 981,201 |
CenterPoint Energy, Inc. | | 27,800 | | | 476,214 |
Centrica PLC (United Kingdom) | | 156,299 | | | 1,116,177 |
CMS Energy Corp.(b) | | 22,000 | | | 382,360 |
Consolidated Edison, Inc.(b) | | 25,000 | | | 1,221,250 |
Dominion Resources, Inc. | | 51,832 | | | 2,459,428 |
DTE Energy Co.(b) | | 16,800 | | | 738,528 |
Integrys Energy Group, Inc. | | 7,020 | | | 362,864 |
National Grid PLC (United Kingdom) | | 93,691 | | | 1,555,424 |
NiSource, Inc. | | 26,900 | | | 508,141 |
PG&E Corp. | | 33,400 | | | 1,439,206 |
Public Service Enterprise Group, Inc. | | 23,100 | | | 2,269,344 |
RWE AG (Germany) | | 2,040 | | | 287,671 |
Sempra Energy | | 24,219 | | | 1,498,672 |
Suez SA (France) | | 9,814 | | | 668,213 |
TECO Energy, Inc. | | 15,500 | | | 266,755 |
Xcel Energy, Inc. | | 39,110 | | | 882,713 |
| | | | |
|
|
| | | | | | 17,179,654 |
| | | | |
|
|
Office Electronics — 0.1% | | | | | |
Canon, Inc. (Japan) | | 13,600 | | | 622,426 |
Konica Minolta Holdings, Inc. (Japan) | | 15,000 | | | 262,965 |
Ricoh Co. Ltd. (Japan) | | 64,000 | | | 1,168,406 |
Xerox Corp. | | 90,900 | | | 1,471,670 |
| | | | |
|
|
| | | | | | 3,525,467 |
| | | | |
|
|
SEE NOTES TO FINANCIAL STATEMENTS.
A13
| | | | |
| | | CONSERVATIVE BALANCED PORTFOLIO (Continued) | | |
SCHEDULE OF INVESTMENTS | December 31, 2007 |
| | | | | |
COMMON STOCKS
(continued) | | Shares
| | Value
(Note 2)
|
| | | | | | |
Oil, Gas & Consumable Fuels — 5.1% | | | | | |
Anadarko Petroleum Corp.(b) | | 42,254 | | $ | 2,775,665 |
Apache Corp. | | 31,014 | | | 3,335,246 |
BP PLC (United Kingdom) | | 317,921 | | | 3,892,058 |
Chesapeake Energy Corp. | | 40,800 | | | 1,599,360 |
Chevron Corp. | | 196,722 | | | 18,360,064 |
ConocoPhillips | | 149,577 | | | 13,207,649 |
CONSOL Energy, Inc.(b) | | 17,300 | | | 1,237,296 |
Devon Energy Corp. | | 41,600 | | | 3,698,656 |
El Paso Corp. | | 64,336 | | | 1,109,153 |
ENI SpA (Italy) | | 31,149 | | | 1,140,814 |
EOG Resources, Inc. | | 22,800 | | | 2,034,900 |
Exxon Mobil Corp. | | 507,440 | | | 47,542,053 |
Hess Corp.(b) | | 25,800 | | | 2,602,188 |
Idemitsu Kosan Co. Ltd. (Japan) | | 2,300 | | | 242,247 |
Marathon Oil Corp. | | 65,782 | | | 4,003,493 |
Murphy Oil Corp. | | 16,900 | | | 1,433,796 |
Nippon Oil Corp. (Japan) | | 157,000 | | | 1,269,247 |
Noble Energy | | 14,500 | | | 1,153,040 |
Occidental Petroleum Corp. | | 76,300 | | | 5,874,337 |
OMV AG (Austria) | | 17,321 | | | 1,403,468 |
Peabody Energy Corp.(b) | | 22,800 | | | 1,405,392 |
Range Resources Corp. | | 10,800 | | | 554,688 |
Repsol YPF SA (Spain) | | 30,682 | | | 1,093,655 |
Royal Dutch Shell PLC (Netherlands) | | 34,918 | | | 1,467,312 |
Royal Dutch Shell PLC (Class B Stock) (Netherlands) | | 57,915 | | | 2,409,474 |
Singapore Petroleum Co. Ltd. (Singapore) | | 151,000 | | | 788,307 |
Spectra Energy Corp. | | 58,762 | | | 1,517,235 |
Sunoco, Inc. | | 11,000 | | | 796,840 |
Tesoro Corp. | | 12,600 | | | 601,020 |
Total SA (France) | | 32,825 | | | 2,727,378 |
Valero Energy Corp. | | 51,000 | | | 3,571,530 |
Williams Cos., Inc. | | 55,500 | | | 1,985,790 |
XTO Energy, Inc. | | 44,541 | | | 2,287,626 |
| | | | |
|
|
| | | | | | 139,120,977 |
| | | | |
|
|
Paper & Forest Products — 0.1% | | | | | |
International Paper Co. | | 39,473 | | | 1,278,136 |
MeadWestvaco Corp.(b) | | 16,314 | | | 510,628 |
Mondi Ltd. (South Africa) | | 3,086 | | | 29,125 |
Mondi PLC (United Kingdom) | | 39,537 | | | 334,486 |
Sonae Industria-SGPS SA (Portugal)(a) | | 31,903 | | | 310,182 |
Weyerhaeuser Co.(b) | | 19,100 | | | 1,408,433 |
| | | | |
|
|
| | | | | | 3,870,990 |
| | | | |
|
|
Personal Products — 0.1% | | | | | |
Avon Products, Inc. | | 40,500 | | | 1,600,965 |
Estee Lauder Cos., Inc. (The) (Class A Stock)(b) | | 10,400 | | | 453,544 |
Oriflame Cosmetics SA (Luxembourg) | | 2,300 | | | 146,971 |
| | | | |
|
|
| | | | | | 2,201,480 |
| | | | |
|
|
Pharmaceuticals — 3.1% | | | | | |
Abbott Laboratories | | 141,200 | | | 7,928,380 |
Allergan, Inc.(b) | | 26,900 | | | 1,728,056 |
Astellas Pharma, Inc. (Japan) | | 10,200 | | | 442,380 |
AstraZeneca PLC (United Kingdom) | | 40,585 | | | 1,748,267 |
Barr Pharmaceuticals, Inc.(a)(b) | | 8,400 | | | 446,040 |
Bristol-Myers Squibb Co. | | 183,000 | | | 4,853,160 |
Eli Lilly & Co. | | 90,100 | | | 4,810,439 |
Forest Laboratories, Inc.(a) | | 29,500 | | | 1,075,275 |
GlaxoSmithKline PLC (United Kingdom) | | 96,025 | | | 2,444,780 |
H Lundbeck A/S (Denmark) | | 4,600 | | | 124,469 |
SEE NOTES TO FINANCIAL STATEMENTS.
A14
| | | | |
| | | CONSERVATIVE BALANCED PORTFOLIO (Continued) | | |
SCHEDULE OF INVESTMENTS | December 31, 2007 |
| | | | | |
COMMON STOCKS
(continued) | | Shares
| | Value
(Note 2)
|
| | | | | | |
Pharmaceuticals (continued) | | | | | |
Johnson & Johnson | | 265,948 | | $ | 17,738,733 |
King Pharmaceuticals, Inc.(a) | | 23,566 | | | 241,316 |
Kyowa Hakko Kogyo Co. Ltd. (Japan) | | 33,000 | | | 352,442 |
Merck & Co., Inc. | | 199,300 | | | 11,581,323 |
Mylan Laboratories, Inc.(b) | | 20,900 | | | 293,854 |
Novartis AG (Switzerland) | | 15,158 | | | 831,437 |
Pfizer, Inc. | | 638,745 | | | 14,518,675 |
Roche Holding AG (Switzerland) | | 6,631 | | | 1,145,629 |
Sanofi-Aventis (France) | | 20,404 | | | 1,878,802 |
Schering-Plough Corp. | | 146,800 | | | 3,910,752 |
Shire PLC (United Kingdom) | | 14,574 | | | 333,337 |
Takeda Pharmaceutical Co. Ltd. (Japan) | | 7,600 | | | 443,998 |
Watson Pharmaceuticals, Inc.(a) | | 12,200 | | | 331,108 |
Wyeth | | 122,800 | | | 5,426,532 |
| | | | |
|
|
| | | | | | 84,629,184 |
| | | | |
|
|
Real Estate Investment Trusts — 0.5% | | | | | |
Apartment Investment & Management Co. (Class A Stock)(b) | | 10,800 | | | 375,084 |
AvalonBay Communities, Inc. | | 7,400 | | | 696,636 |
Boston Properties, Inc.(b) | | 11,800 | | | 1,083,358 |
Developers Diversified Realty Corp. | | 11,300 | | | 432,677 |
Equity Residential(b) | | 27,100 | | | 988,337 |
General Growth Properties, Inc.(b) | | 24,000 | | | 988,320 |
Host Hotels & Resorts, Inc.(b) | | 52,500 | | | 894,600 |
ING Industrial Fund (Australia) | | 304,765 | | | 675,227 |
Kimco Realty Corp.(b) | | 23,500 | | | 855,400 |
Mirvac Group (Australia) | | 76,695 | | | 400,814 |
Plum Creek Timber Co., Inc.(b) | | 15,100 | | | 695,204 |
ProLogis(b) | | 24,400 | | | 1,546,472 |
Public Storage, Inc. | | 10,900 | | | 800,169 |
Simon Property Group, Inc.(b) | | 20,600 | | | 1,789,316 |
Vornado Realty Trust | | 13,000 | | | 1,143,350 |
Westfield Group (Australia) | | 2,690 | | | 49,180 |
| | | | |
|
|
| | | | | | 13,414,144 |
| | | | |
|
|
Real Estate Management & Development — 0.1% | | | | | |
CB Richard Ellis Group, Inc.(a)(b) | | 18,800 | | | 405,140 |
Cheung Kong Holdings Ltd. (Hong Kong) | | 35,000 | | | 639,431 |
City Developments Ltd. (Singapore) | | 11,000 | | | 107,127 |
Forestar Real Estate Group, Inc.(a) | | 3,233 | | | 76,274 |
K.K. DaVinci Advisors (Japan)(a) | | 332 | | | 287,629 |
Leopalace21 Corp. (Japan) | | 11,400 | | | 306,292 |
Swire Pacific Ltd. (Hong Kong) | | 28,000 | | | 383,687 |
Wharf (Holdings) Ltd. (The) (Hong Kong) | | 139,000 | | | 719,051 |
Wihlborgs Fastigheter AB (Sweden) | | 2,924 | | | 52,366 |
| | | | |
|
|
| | | | | | 2,976,997 |
| | | | |
|
|
Road & Rail — 0.3% | | | | | |
Burlington Northern Santa Fe Corp. | | 27,500 | | | 2,288,825 |
CSX Corp. | | 40,600 | | | 1,785,588 |
Norfolk Southern Corp. | | 34,800 | | | 1,755,312 |
Ryder System, Inc. | | 6,900 | | | 324,369 |
Seino Transportation Co. Ltd. (Japan) | | 27,000 | | | 181,676 |
Union Pacific Corp. | | 24,600 | | | 3,090,252 |
| | | | |
|
|
| | | | | | 9,426,022 |
| | | | |
|
|
Semiconductors & Semiconductor Equipment — 1.2% | | | | | |
Advanced Micro Devices, Inc.(a)(b) | | 45,100 | | | 338,250 |
Altera Corp. | | 33,500 | | | 647,220 |
SEE NOTES TO FINANCIAL STATEMENTS.
A15
| | | | |
| | | CONSERVATIVE BALANCED PORTFOLIO (Continued) | | |
SCHEDULE OF INVESTMENTS | December 31, 2007 |
| | | | | |
COMMON STOCKS
(continued) | | Shares
| | Value
(Note 2)
|
| | | | | | |
Semiconductors & Semiconductor Equipment (continued) | | | | | |
Analog Devices, Inc. | | 27,400 | | $ | 868,580 |
Applied Materials, Inc.(b) | | 124,900 | | | 2,218,224 |
ASML Holding N.V. (Netherlands)(a) | | 4,934 | | | 156,250 |
Broadcom Corp. (Class A Stock)(a)(b) | | 43,950 | | | 1,148,853 |
Intel Corp. | | 540,700 | | | 14,415,062 |
KLA-Tencor Corp. | | 17,600 | | | 847,616 |
Linear Technology Corp.(b) | | 20,300 | | | 646,149 |
LSI Logic Corp.(a) | | 58,800 | | | 312,228 |
MEMC Electronic Materials, Inc.(a) | | 19,700 | | | 1,743,253 |
Microchip Technology, Inc.(b) | | 17,800 | | | 559,276 |
Micron Technology, Inc.(a)(b) | | 58,400 | | | 423,400 |
National Semiconductor Corp.(b) | | 23,900 | | | 541,096 |
Novellus Systems, Inc.(a) | | 10,400 | | | 286,728 |
NVIDIA Corp.(a)(b) | | 51,450 | | | 1,750,329 |
Teradyne, Inc.(a)(b) | | 19,300 | | | 199,562 |
Texas Instruments, Inc.(b) | | 130,100 | | | 4,345,340 |
Xilinx, Inc. | | 25,400 | | | 555,498 |
| | | | |
|
|
| | | | | | 32,002,914 |
| | | | |
|
|
Software — 1.7% | | | | | |
Adobe Systems, Inc.(a) | | 54,700 | | | 2,337,331 |
Autodesk, Inc.(a)(b) | | 21,800 | | | 1,084,768 |
BMC Software, Inc.(a) | | 18,500 | | | 659,340 |
CA, Inc. | | 35,664 | | | 889,817 |
Citrix Systems, Inc.(a)(b) | | 16,400 | | | 623,364 |
Compuware Corp.(a) | | 34,000 | | | 301,920 |
Electronic Arts, Inc.(a)(b) | | 27,500 | | | 1,606,275 |
Intuit, Inc.(a) | | 31,100 | | | 983,071 |
Microsoft Corp. | | 746,500 | | | 26,575,400 |
Nintendo Co. Ltd. (Japan) | | 3,500 | | | 2,055,032 |
Novell, Inc.(a) | | 24,200 | | | 166,254 |
Oracle Corp.(a) | | 362,500 | | | 8,185,250 |
Symantec Corp.(a)(b) | | 85,078 | | | 1,373,159 |
| | | | |
|
|
| | | | | | 46,840,981 |
| | | | |
|
|
Specialty Retail — 0.7% | | | | | |
Abercrombie & Fitch Co. | | 8,700 | | | 695,739 |
AutoNation, Inc.(a)(b) | | 16,974 | | | 265,813 |
AutoZone, Inc.(a) | | 4,800 | | | 575,568 |
Bed Bath & Beyond, Inc.(a) | | 26,700 | | | 784,713 |
Belle International Holdings Ltd. (China) | | 32,000 | | | 47,873 |
Best Buy Co., Inc.(b) | | 35,225 | | | 1,854,596 |
Circuit City Stores, Inc. | | 10,000 | | | 42,000 |
Esprit Holdings Ltd. (Hong Kong) | | 38,800 | | | 571,340 |
GameStop Corp. (Class A Stock)(a) | | 12,500 | | | 776,375 |
Gap, Inc. (The)(b) | | 43,200 | | | 919,296 |
Hennes & Mauritz AB (Class B Stock) (Sweden) | | 1,550 | | | 94,369 |
Hikari Tsushin, Inc. (Japan) | | 3,800 | | | 128,941 |
Home Depot, Inc. | | 154,250 | | | 4,155,496 |
Limited Brands, Inc.(b) | | 31,106 | | | 588,837 |
Lowe’s Cos., Inc. | | 135,100 | | | 3,055,962 |
Office Depot, Inc.(a) | | 27,800 | | | 386,698 |
OfficeMax, Inc. | | 7,500 | | | 154,950 |
RadioShack Corp.(b) | | 11,200 | | | 188,832 |
Sherwin-Williams Co. (The)(b) | | 9,500 | | | 551,380 |
Shimachu Co. Ltd. (Japan) | | 2,700 | | | 76,070 |
Staples, Inc. | | 67,549 | | | 1,558,355 |
Tiffany & Co. | | 11,600 | | | 533,948 |
TJX Cos., Inc. (The) | | 40,600 | | | 1,166,438 |
| | | | |
|
|
| | | | | | 19,173,589 |
| | | | |
|
|
SEE NOTES TO FINANCIAL STATEMENTS.
A16
| | | | |
| | | CONSERVATIVE BALANCED PORTFOLIO (Continued) | | |
SCHEDULE OF INVESTMENTS | December 31, 2007 |
| | | | | |
COMMON STOCKS
(continued) | | Shares
| | Value
(Note 2)
|
| | | | | | |
Textiles, Apparel & Luxury Goods — 0.2% | | | | | |
Coach, Inc.(a) | | 34,000 | | $ | 1,039,720 |
Jones Apparel Group, Inc. | | 12,600 | | | 201,474 |
Liz Claiborne, Inc.(b) | | 10,900 | | | 221,815 |
NIKE, Inc. (Class B Stock) | | 35,000 | | | 2,248,400 |
Nisshinbo Industries, Inc. (Japan) | | 15,000 | | | 182,902 |
Polo Ralph Lauren Corp. | | 5,300 | | | 327,487 |
Swatch Group AG (Switzerland) | | 6,606 | | | 390,064 |
VF Corp. | | 8,100 | | | 556,146 |
| | | | |
|
|
| | | | | | 5,168,008 |
| | | | |
|
|
Thrifts & Mortgage Finance — 0.3% | | | | | |
Countrywide Financial Corp.(b) | | 56,200 | | | 502,428 |
Fannie Mae | | 88,800 | | | 3,550,224 |
Freddie Mac | | 60,100 | | | 2,047,607 |
Guaranty Financial Group, Inc.(a) | | 3,233 | | | 51,733 |
Hudson City Bancorp, Inc. | | 59,500 | | | 893,690 |
MGIC Investment Corp.(b) | | 8,800 | | | 197,384 |
Sovereign Bancorp, Inc.(b) | | 38,955 | | | 444,087 |
Washington Mutual, Inc.(b) | | 81,178 | | | 1,104,833 |
| | | | |
|
|
| | | | | | 8,791,986 |
| | | | |
|
|
Tobacco — 0.7% | | | | | |
Altria Group, Inc. | | 193,500 | | | 14,624,730 |
British American Tobacco (United Kingdom) | | 15,561 | | | 608,674 |
Imperial Tobacco Group (United Kingdom) | | 34,579 | | | 1,866,754 |
Reynolds American, Inc.(b) | | 17,700 | | | 1,167,492 |
UST, Inc. | | 15,100 | | | 827,480 |
| | | | |
|
|
| | | | | | 19,095,130 |
| | | | |
|
|
Trading Companies & Distributors — 0.2% | | | | | |
Itochu Corp. (Japan) | | 67,000 | | | 646,526 |
Marubeni Corp. (Japan) | | 86,000 | | | 602,603 |
Mitsubishi Corp. (Japan) | | 24,000 | | | 649,553 |
Mitsui & Co. Ltd. (Japan) | | 61,000 | | | 1,273,840 |
Sumitomo Corp. (Japan) | | 39,200 | | | 548,461 |
W.W. Grainger, Inc. | | 6,900 | | | 603,888 |
| | | | |
|
|
| | | | | | 4,324,871 |
| | | | |
|
|
Transportation Infrastructure | | | | | |
Hopewell Holdings (Hong Kong) | | 77,000 | | | 353,036 |
Kamigumi Co. Ltd. (Japan) | | 13,000 | | | 93,813 |
| | | | |
|
|
| | | | | | 446,849 |
| | | | |
|
|
Wireless Telecommunication Services — 0.4% | | | | | |
American Tower Corp. (Class A Stock)(a) | | 34,800 | | | 1,482,480 |
KDDI Corp. (Japan) | | 97 | | | 717,710 |
Sprint Nextel Corp. | | 260,077 | | | 3,414,811 |
Vodafone Group PLC (United Kingdom) | | 1,132,143 | | | 4,232,353 |
| | | | |
|
|
| | | | | | 9,847,354 |
| | | | |
|
|
TOTAL COMMON STOCKS
(cost $956,454,065) | | | 1,399,137,384 |
| | | | |
|
|
| PREFERRED STOCKS | | | | | |
Automobiles | | | | | |
Porsche AG (Germany) | | 372 | | | 751,158 |
| | | | |
|
|
Diversified Financial Services | | | | | |
Istituto Finanziario Industriale SpA (Italy)(a) | | 1,432 | | | 48,782 |
| | | | |
|
|
TOTAL PREFERRED STOCKS
(cost $427,189) | | | 799,940 |
| | | | |
|
|
| RIGHTS | | | | | |
Real Estate Management & Development | | | | | |
Wharf (Holdings) Ltd. (The) (Hong Kong), expiring 1/8/08 (a)
(cost $0) | | 17,375 | | | 23,843 |
| | | | |
|
|
SEE NOTES TO FINANCIAL STATEMENTS.
A17
| | | | |
| | | CONSERVATIVE BALANCED PORTFOLIO (Continued) | | |
SCHEDULE OF INVESTMENTS | December 31, 2007 |
| | | | | | | | | | |
Description
| | Maturity
Date
| | Moody’s
Rating
(Unaudited)
| | Principal
Amount
(000)
| | Value
(Note 2)
|
| | | | | | | | | | | |
| LONG-TERM BONDS — 35.9% | | | |
Aerospace/Defense — 0.2% | | | |
BAE Systems Holdings, Inc., 144A | | | |
4.75% | | 08/15/10 | | Baa2 | | $ | 2,000 | | $ | 2,014,174 |
Boeing Capital Corp.(b) | | | |
6.10% | | 03/01/11 | | A2 | | | 975 | | | 1,021,960 |
Goodrich Corp. | | | |
6.80% | | 07/01/36 | | Baa2 | | | 811 | | | 866,613 |
Northrop Grumman Corp. | | | |
7.125% | | 02/15/11 | | Baa1 | | | 1,025 | | | 1,092,390 |
Raytheon Co. | | | |
5.50% | | 11/15/12 | | Baa1 | | | 625 | | | 650,746 |
| | | | | | | | | |
|
|
| | | | | | | | | | | 5,645,883 |
| | | | | | | | | |
|
|
Airlines — 0.2% | | | |
American Airlines, Inc.(b) | | | |
6.817% | | 05/23/11 | | Ba1 | | | 2,420 | | | 2,344,375 |
Continental Airlines, Inc. | | | |
6.648% | | 09/15/17 | | Baa2 | | | 326 | | | 327,384 |
6.703% | | 06/15/21 | | Baa2 | | | 168 | | | 168,493 |
Delta Air Lines, Inc., 144A(b) | | | |
6.821% | | 08/10/22 | | Baa1 | | | 500 | | | 472,550 |
Southwest Airlines Co. | | | |
6.50% | | 03/01/12 | | Baa1 | | | 965 | | | 999,259 |
| | | | | | | | | |
|
|
| | | | | | | | | | | 4,312,061 |
| | | | | | | | | |
|
|
Asset Backed Securities — 1.2% | | | |
American Express Credit Account Master Trust I, 144A(g), | | | |
Series 2004-4, Class C | | | | | | | | | | |
5.4975% | | 03/15/12 | | Baa1 | | | 1,510 | | | 1,486,166 |
Series 2004-C, Class C | | | | | | | | | | |
5.5275% | | 02/15/12 | | Baa1 | | | 502 | | | 502,240 |
Amortizing Residential Collateral Trust(g), | | | |
Series 2002-BC9, Class M1 | | | | | | | | | | |
6.515% | | 12/25/32 | | Aa2 | | | 2,664 | | | 2,398,609 |
Bank of America Credit Card Trust(g), | | | |
Series 2006-C5, Class C5 | | | | | | | | | | |
5.4275% | | 01/15/16 | | Baa2 | | | 4,159 | | | 3,851,582 |
Bank One Issuance Trust, | | | |
Series 2003-C1, Class C1 | | | | | | | | | | |
4.54% | | 09/15/10 | | Baa2 | | | 2,445 | | | 2,444,828 |
CDC Mortgage Capital Trust(g), | | | |
Series 2002-HE3, Class M1 | | | | | | | | | | |
6.515% | | 03/25/33 | | A1 | | | 1,003 | | | 796,552 |
Series 2003-HE1, Class M2 | | | | | | | | | | |
7.79% | | 08/25/33 | | Baa2 | | | 81 | | | 39,560 |
Centex Home Equity(g), | | | |
Series 2005-A, Class M2 | | | | | | | | | | |
5.365% | | 01/25/35 | | Aa2 | | | 2,250 | | | 2,054,964 |
Citibank Credit Card Issuance Trust(g), | | | |
Series 2006-C1, Class C1 | | | | | | | | | | |
5.3488% | | 02/20/15 | | Baa2 | | | 1,500 | | | 1,378,934 |
Credit-Based Asset Servicing and Securitization LLC, | | | |
Series 2005-CB6, Class A3 | | | | | | | | | | |
5.12% | | 07/25/35 | | Aaa | | | 1,740 | | | 1,730,541 |
Equity One ABS, Inc., | | | |
Series 2004-3, Class M1 | | | | | | | | | | |
5.70% | | 07/25/34 | | Aa2 | | | 1,660 | | | 1,525,603 |
SEE NOTES TO FINANCIAL STATEMENTS.
A18
| | | | |
| | | CONSERVATIVE BALANCED PORTFOLIO (Continued) | | |
SCHEDULE OF INVESTMENTS | December 31, 2007 |
| | | | | | | | | | |
Description
| | Maturity
Date
| | Moody’s
Rating
(Unaudited)
| | Principal
Amount
(000)
| | Value
(Note 2)
|
| | | | | | | | | | | |
| LONG-TERM BONDS (continued) | | | |
Asset Backed Securities (continued) | | | |
First Franklin Mortgage Loan Trust(g), | | | |
Series 2005-FFH1, Class M2 | | | | | | | | | | |
5.385% | | 06/25/36 | | Aa2 | | $ | 1,800 | | $ | 1,611,268 |
HFC Home Equity Loan Trust(g), | | | |
Series 2005-2, Class M2 | | | | | | | | | | |
5.4388% | | 01/20/35 | | Aa1 | | | 662 | | | 579,260 |
MBNA Master Credit Card Trust, | | | |
Series 1999-J, Class A | | | | | | | | | | |
7.00% | | 02/15/12 | | Aaa | | | 2,370 | | | 2,481,649 |
Morgan Stanley ABS Capital I(g), | | | |
Series 2004-NC3, Class M2 | | | | | | | | | | |
5.965% | | 03/25/34 | | A2 | | | 1,183 | | | 1,090,030 |
Morgan Stanley Dean Witter Capital I(g), | | | |
Series 2002-HE1, Class M1 | | | | | | | | | | |
5.765% | | 07/25/32 | | Aa2 | | | 1,721 | | | 1,643,423 |
Series 2002-NC4, Class M1 | | | | | | | | | | |
6.14% | | 09/25/32 | | Aaa | | | 1,548 | | | 1,500,912 |
Saxon Asset Securities Trust(g), | | | |
Series 2005-2, Class M2 | | | | | | | | | | |
5.305% | | 10/25/35 | | Aa2 | | | 1,480 | | | 1,427,023 |
Securitized Asset Backed Receivables LLC(g), | | | |
Series 2004-OP1, Class M1 | | | | | | | | | | |
5.375% | | 02/25/34 | | Aa2 | | | 1,660 | | | 1,618,409 |
Series 2006-FR3, Class A3 | | | | | | | | | | |
5.115% | | 05/25/36 | | Aaa | | | 1,400 | | | 1,092,000 |
SVO VOI Mortgage Corp., | | | |
Series 2005-AA, Class A, 144A | | | | | | | | | | |
5.25% | | 02/20/21 | | Aaa | | | 771 | | | 764,559 |
WFS Financial Owner Trust, | | | |
Series 2004-4, Class D | | | | | | | | | | |
3.58% | | 05/17/12 | | A2 | | | 296 | | | 294,207 |
| | | | | | | | | |
|
|
| | | | | | | | | | | 32,312,319 |
| | | | | | | | | |
|
|
Automotive — 0.1% | | | | | | | | | | |
Johnson Controls, Inc. | | | |
5.50% | | 01/15/16 | | Baa1 | | | 235 | | | 231,554 |
Oshkosh Truck Corp., Bank Loan(j) | | | |
6.90% | | 12/06/13 | | Ba3 | | | 1,975 | | | 1,893,307 |
| | | | | | | | | |
|
|
| | | | | | | | | | | 2,124,861 |
| | | | | | | | | |
|
|
Banking — 0.7% | | | | | | | | | | |
Banco Bradesco (Cayman Islands) | | | |
8.75% | | 10/24/13 | | A2 | | | 1,690 | | | 1,913,925 |
Bank of America NA | | | |
5.30% | | 03/15/17 | | Aa1 | | | 850 | | | 826,520 |
6.00%(b) | | 10/15/36 | | Aa1 | | | 1,300 | | | 1,243,353 |
Bank One Corp. | | | |
7.875% | | 08/01/10 | | Aa3 | | | 2,500 | | | 2,696,662 |
Citigroup, Inc. | | | |
5.625%(b) | | 08/27/12 | | A1 | | | 1,900 | | | 1,924,664 |
6.125% | | 08/25/36 | | A1 | | | 725 | | | 686,205 |
DEPFA ACS Bank (Ireland), 144A | | | |
5.125% | | 03/16/37 | | Aaa | | | 1,325 | | | 1,309,660 |
HSBC Bank USA, Senior Notes | | | |
3.875% | | 09/15/09 | | Aa2 | | | 250 | | | 247,662 |
ICICI Bank Ltd. (India), 144A(g) | | | |
5.7875% | | 01/12/10 | | Baa2 | | | 1,880 | | | 1,855,748 |
SEE NOTES TO FINANCIAL STATEMENTS.
A19
| | | | |
| | | CONSERVATIVE BALANCED PORTFOLIO (Continued) | | |
SCHEDULE OF INVESTMENTS | December 31, 2007 |
| | | | | | | | | | |
Description
| | Maturity
Date
| | Moody’s
Rating
(Unaudited)
| | Principal
Amount
(000)
| | Value
(Note 2)
|
| | | | | | | | | | | |
| LONG-TERM BONDS (continued) | | | |
Banking (continued) | | | | | | | | | | |
ICICI Bank Ltd. (Singapore), 144A | | | |
5.75% | | 11/16/10 | | Baa2 | | $ | 1,670 | | $ | 1,656,638 |
J.P. Morgan Chase & Co. | | | |
4.60% | | 01/17/11 | | Aa2 | | | 975 | | | 972,166 |
6.50% | | 01/15/09 | | Aa3 | | | 1,100 | | | 1,109,854 |
MUFG Capital Finance Group Ltd. (Cayman Islands)(g) | | | |
6.346% | | 07/29/49 | | A2 | | | 800 | | | 757,707 |
Santander Central Hispano Issuances Ltd. (Cayman Islands) | | | |
7.625% | | 09/14/10 | | Aa2 | | | 805 | | | 861,879 |
Wells Fargo Bank | | | |
6.45% | | 02/01/11 | | Aa1 | | | 90 | | | 95,216 |
| | | | | | | | | |
|
|
| | | | | | | | | | | 18,157,859 |
| | | | | | | | | |
|
|
Brokerage — 0.6% | | | | | | | | | | |
Bear Stearns Companies, Inc. (The) | | | |
5.30% | | 10/30/15 | | A2 | | | 550 | | | 503,884 |
6.40%(c) | | 10/02/17 | | A2 | | | 270 | | | 260,863 |
Goldman Sachs Group, Inc. (The) | | | |
5.45%(b) | | 11/01/12 | | Aa3 | | | 580 | | | 591,287 |
5.625% | | 01/15/17 | | A1 | | | 765 | | | 747,081 |
6.45% | | 05/01/36 | | A1 | | | 1,770 | | | 1,662,902 |
6.75% | | 10/01/37 | | A1 | | | 678 | | | 664,289 |
Lehman Brothers Holdings, Inc. | | | |
5.25%(b) | | 02/06/12 | | A1 | | | 1,850 | | | 1,830,552 |
6.50% | | 07/19/17 | | A2 | | | 514 | | | 520,095 |
Merrill Lynch & Co., Inc. | | | |
4.25% | | 02/08/10 | | A1 | | | 1,470 | | | 1,441,038 |
4.79% | | 08/04/10 | | A1 | | | 375 | | | 371,579 |
5.00% | | 01/15/15 | | A1 | | | 190 | | | 179,175 |
5.77% | | 07/25/11 | | A1 | | | 355 | | | 356,074 |
6.40%(b) | | 08/28/17 | | A1 | | | 1,285 | | | 1,305,506 |
Morgan Stanley Group, Inc. | | | |
4.75% | | 04/01/14 | | A1 | | | 1,510 | | | 1,414,650 |
5.25%, M.T.N.(b) | | 11/02/12 | | Aa3 | | | 870 | | | 869,710 |
5.45%, M.T.N. | | 01/09/17 | | Aa3 | | | 670 | | | 649,948 |
5.75%, M.T.N. | | 10/18/16 | | Aa3 | | | 1,860 | | | 1,835,386 |
5.95%, M.T.N. | | 12/28/17 | | Aa3 | | | 600 | | | 599,572 |
| | | | | | | | | |
|
|
| | | | | | | | | | | 15,803,591 |
| | | | | | | | | |
|
|
Building Materials & Construction — 0.2% | | | |
American Standard, Inc. | | | |
7.625% | | 02/15/10 | | Baa3 | | | 1,000 | | | 1,050,066 |
Centex Corp.(b) | | | |
6.50% | | 05/01/16 | | Ba1 | | | 315 | | | 279,964 |
Hanson PLC (United Kingdom) | | | |
7.875% | | 09/27/10 | | Baa3 | | | 1,270 | | | 1,377,896 |
Lafarge SA (France) | | | |
6.15% | | 07/15/11 | | Baa2 | | | 1,100 | | | 1,131,539 |
Ryland Group, Inc. | | | |
5.375% | | 06/01/08 | | Ba1 | | | 201 | | | 199,807 |
| | | | | | | | | |
|
|
| | | | | | | | | | | 4,039,272 |
| | | | | | | | | |
|
|
Cable — 0.3% | | | |
AT&T Broadband | | | |
9.455% | | 11/15/22 | | Baa2 | | | 115 | | | 146,239 |
Cox Communications, Inc. | | | |
6.75% | | 03/15/11 | | Baa3 | | | 1,195 | | | 1,253,620 |
7.875% | | 08/15/09 | | Baa3 | | | 1,160 | | | 1,213,612 |
SEE NOTES TO FINANCIAL STATEMENTS.
A20
| | | | |
| | | CONSERVATIVE BALANCED PORTFOLIO (Continued) | | |
SCHEDULE OF INVESTMENTS | December 31, 2007 |
| | | | | | | | | | |
Description
| | Maturity
Date
| | Moody’s
Rating
(Unaudited)
| | Principal
Amount
(000)
| | Value
(Note 2)
|
| | | | | | | | | | | |
| LONG-TERM BONDS (continued) | | | |
Cable (continued) | | | |
Insight Midwest Holdings LLC, Bank Loan(j) | | | |
6.753% | | 10/06/13 | | Ba2 | | $ | 1,800 | | $ | 1,724,999 |
Tele-Communications, Inc. | | | |
9.875% | | 06/15/22 | | Baa2 | | | 1,440 | | | 1,951,921 |
Time Warner Cable, Inc. | | | |
5.40% | | 07/02/12 | | Baa2 | | | 2,410 | | | 2,414,844 |
| | | | | | | | | |
|
|
| | | | | | | | | | | 8,705,235 |
| | | | | | | | | |
|
|
Capital Goods — 0.4% | | | |
Caterpillar Financial Service Corp. | | | |
5.50% | | 03/15/16 | | A2 | | | 780 | | | 784,778 |
Caterpillar, Inc. | | | |
7.25% | | 09/15/09 | | A2 | | | 1,000 | | | 1,046,765 |
Erac USA Finance Co., 144A | | | |
5.80% | | 10/15/12 | | Baa2 | | | 460 | | | 456,352 |
6.375% | | 10/15/17 | | Baa2 | | | 1,198 | | | 1,157,403 |
7.00% | | 10/15/37 | | Baa2 | | | 470 | | | 426,868 |
7.35% | | 06/15/08 | | Baa2 | | | 2,450 | | | 2,470,910 |
FedEx Corp. | | | |
7.25% | | 02/15/11 | | Baa2 | | | 480 | | | 510,990 |
General Electric Co. | | | |
5.25% | | 12/06/17 | | Aaa | | | 115 | | | 114,755 |
Honeywell International, Inc. | | | |
6.125% | | 11/01/11 | | A2 | | | 1,120 | | | 1,172,616 |
Sensata Technologies, Bank Loan(j) | | | |
6.93% | | 04/27/13 | | Ba3 | | | 1,393 | | | 1,320,298 |
United Technologies Corp.(e) | | | |
6.35% | | 03/01/11 | | A2 | | | 810 | | | 862,478 |
8.875% | | 11/15/19 | | A2 | | | 375 | | | 486,244 |
| | | | | | | | | |
|
|
| | | | | | | | | | | 10,810,457 |
| | | | | | | | | |
|
|
Chemicals — 0.1% | | | |
Dow Chemical Co. | | | |
5.97% | | 01/15/09 | | A3 | | | 430 | | | 435,593 |
6.125% | | 02/01/11 | | A3 | | | 690 | | | 715,876 |
ICI Wilmington, Inc. | | | |
5.625% | | 12/01/13 | | Baa2 | | | 780 | | | 802,147 |
Lubrizol Corp. | | | |
4.625% | | 10/01/09 | | Baa3 | | | 1,090 | | | 1,094,637 |
Union Carbide Corp. | | | |
7.50% | | 06/01/25 | | Ba2 | | | 500 | | | 518,133 |
| | | | �� | | | | | |
|
|
| | | | | | | | | | | 3,566,386 |
| | | | | | | | | |
|
|
Collateralized Mortgage Obligations — 0.7% | | | |
Bank of America Alternative Loan Trust, | | | |
Series 2005-12, Class 3CB1 | | | | | | | | | | |
6.00% | | 01/25/36 | | Aaa | | | 3,930 | | | 3,762,568 |
Bank of America Mortgage Securities, Inc.(g), | | | |
Series 2005-A, Class 2A1(g) | | | | | | | | | | |
4.4612% | | 02/25/35 | | Aaa | | | 1,272 | | | 1,258,769 |
Series 2005-B, Class 2A1 | | | |
4.3819% | | 03/25/35 | | Aaa | | | 1,191 | | | 1,181,409 |
Chase Mortgage Finance Corp.(g), | | | |
Series 2007-A1, Class 1A5 | | | |
4.356% | | 02/25/37 | | Aaa | | | 4,222 | | | 4,169,715 |
Countrywide Alternative Loan Trust, | | | |
Pass-Thru Certificates, Series 2004-18CB, Class 3A1 | | | | | | | | | | |
5.25% | | 09/25/19 | | Aaa | | | 1,902 | | | 1,859,805 |
SEE NOTES TO FINANCIAL STATEMENTS.
A21
| | | | |
| | | CONSERVATIVE BALANCED PORTFOLIO (Continued) | | |
SCHEDULE OF INVESTMENTS | December 31, 2007 |
| | | | | | | | | | | |
Description
| | Maturity
Date
| | Moody’s
Rating
(Unaudited)
| | | Principal
Amount
(000)
| | Value
(Note 2)
|
| | | | | | | | | | | | |
| LONG-TERM BONDS (continued) | | | |
Collateralized Mortgage Obligations (continued) | | | |
J.P. Morgan Chase Commercial Mortgage Securities Corp.(g), | | | |
Series 2007-A1, Class 4A1 | | | | | | | | | | | |
4.071% | | 07/25/35 | | Aaa | | | $ | 2,632 | | $ | 2,613,069 |
Master Alternative Loans Trust, | | | |
Pass-Thru Certificates, Series 2004-4, Class 4A1 | | | | | | | | | | | |
5.00% | | 04/25/19 | | Aaa | | | | 496 | | | 492,867 |
Structured Adjustable Rate Mortgage Loan(g), | | | |
Series 2004-1, Class 4A3 | | | | | | | | | | | |
4.17% | | 02/25/34 | | Aaa | | | | 1,146 | | | 1,167,378 |
Washington Mutual Alternative Loan Trust, | | | |
Mortgage Pass-Thru Certificates, Series 2005-1, Class 3A | | | | | | | | | | | |
5.00% | | 03/25/20 | | AAA | (d) | | | 1,118 | | | 1,091,784 |
| | | | | | | | | | |
|
|
| | | | | | | | | | | | 17,597,364 |
| | | | | | | | | | |
|
|
Commercial Mortgage Backed Securities — 4.6% |
Bank of America Commercial Mortgage, Inc., | | | |
Series 2003-2, Class A3(g) | | | | | | | | | | | |
4.873% | | 03/11/41 | | AAA | (d) | | | 3,350 | | | 3,355,720 |
Series 2004-2, Class A4 | | | |
4.153% | | 11/10/38 | | Aaa | | | | 3,680 | | | 3,618,124 |
Series 2004-3, Class A4 | | | |
5.176% | | 06/10/39 | | Aaa | | | | 2,000 | | | 2,025,422 |
Series 2005-1, Class ASB(g) | | | |
4.85% | | 11/10/42 | | AAA | (d) | | | 1,100 | | | 1,101,273 |
Series 2006-2 A4(g) | | | |
5.7401% | | 05/10/45 | | AAA | (d) | | | 4,400 | | | 4,547,625 |
Series 2007-1, Class A4 | | | |
5.451% | | 01/15/49 | | Aaa | | | | 3,500 | | | 3,517,117 |
Bear Stearns Commercial Mortgage Securities(g), | | | |
Series 2004-T16, Class A6 | | | | | | | | | | | |
4.75% | | 02/13/46 | | AAA | (d) | | | 3,500 | | | 3,444,704 |
Series 2005-T18, Class AAB | | | |
4.823% | | 02/13/42 | | Aaa | | | | 2,250 | | | 2,208,650 |
Series 2005-T20, Class AAB | | | |
5.1387% | | 10/12/42 | | Aaa | | | | 3,000 | | | 3,000,968 |
Commercial Mortgage Acceptance Corp.(g), | | | |
Series 1998-C2, Class F, 144A | | | | | | | | | | | |
5.44% | | 09/15/30 | | A- | (d) | | | 890 | | | 925,291 |
Commercial Mortgage Pass-Thru Certificate, | | | |
Series 2004-LB2A, Class X2, I/O, 144A(g) | | | | | | | | | | | |
0.935% | | 03/10/39 | | AAA | (d) | | | 15,294 | | | 309,065 |
Credit Suisse First Boston Mortgage Securities Corp., | | | |
Series 2004-C4, Class A4 | | | | | | | | | | | |
4.283% | | 10/15/39 | | Aaa | | | | 1,500 | | | 1,476,743 |
Credit Suisse Mortgage Capital Certificates, | | | |
Series 2006-C1, Class A4(g) | | | | | | | | | | | |
5.5546% | | 02/15/39 | | AAA | (d) | | | 4,330 | | | 4,395,627 |
Series 2006-C5, Class A3 | | | |
5.311% | | 12/15/39 | | Aaa | | | | 2,205 | | | 2,197,332 |
DLJ Commercial Mortgage Corp., | | | |
Series 2000-CF1, Class A1B | | | | | | | | | | | |
7.62% | | 06/10/33 | | AAA | (d) | | | 3,114 | | | 3,290,767 |
GE Commercial Mortgage Corp., | | | |
Series 2004-C2, Class X2, I/O, 144A(g) | | | |
0.574% | | 03/10/40 | | Aaa | | | | 27,771 | | | 422,600 |
SEE NOTES TO FINANCIAL STATEMENTS.
A22
| | | | |
| | | CONSERVATIVE BALANCED PORTFOLIO (Continued) | | |
SCHEDULE OF INVESTMENTS | December 31, 2007 |
| | | | | | | | | | | |
Description
| | Maturity
Date
| | Moody’s
Rating
(Unaudited)
| | | Principal
Amount
(000)
| | Value
(Note 2)
|
| | | | | | | | | | | | |
| LONG-TERM BONDS (continued) | | | |
Commercial Mortgage Backed Securities (continued) |
GMAC Commercial Mortgage Securities, Inc., | | | |
Series 2005-C1, Class A5 | | | |
4.697% | | 05/10/43 | | AAA | (d) | | $ | 2,610 | | $ | 2,490,726 |
Greenwich Capital Commercial Funding Corp., | | | |
Series 2005-GG5, Class A5(g) | | | |
5.224% | | 04/10/37 | | Aaa | | | | 10,330 | | | 10,248,461 |
Series 2003-C1, Class A4 | | | |
4.111% | | 07/05/35 | | Aaa | | | | 5,000 | | | 4,818,519 |
J.P. Morgan Chase Commercial Mortgage Securities Corp., |
Series 2000-C10, Class A2(g) | | | |
7.371% | | 08/15/32 | | Aaa | | | | 5,978 | | | 6,242,450 |
Series 2005-CB13, Class A4(g) | | | |
5.2948% | | 01/12/43 | | Aaa | | | | 2,800 | | | 2,799,294 |
Series 2005-LDP1, Class ASB(g) | | | |
4.853% | | 03/15/46 | | Aaa | | | | 4,000 | | | 3,955,742 |
Series 2005-LDP2, Class ASB | | | |
4.659% | | 07/15/42 | | Aaa | | | | 6,380 | | | 6,245,589 |
Series 2005-LDP5, Class A4(g) | | | |
5.1793% | | 12/15/44 | | Aaa | | | | 3,630 | | | 3,614,869 |
Series 2006-CB16, Class ASB | | | |
5.523% | | 05/12/45 | | Aaa | | | | 2,000 | | | 2,023,250 |
Series 2006-LDP6, Class X2, I/O(g) | | | |
0.0772% | | 04/15/43 | | Aaa | | | | 156,383 | | | 730,105 |
Series 2006-LDP8, Class ASB | | | |
5.37% | | 05/15/45 | | Aaa | | | | 2,000 | | | 2,006,315 |
Keycorp.(g), | | | |
Series 2000-C1, Class A2 | | | |
7.727% | | 05/17/32 | | Aaa | | | | 10,027 | | | 10,519,384 |
LB-UBS Commercial Mortgage Trust, | | | |
Series 2003-C8, Class A3 | | | |
4.83% | | 11/15/27 | | Aaa | | | | 2,720 | | | 2,725,225 |
Series 2004-C6, Class A5(g) | | | |
4.826% | | 08/15/29 | | AAA | (d) | | | 5,000 | | | 4,992,277 |
Series 2005-C3, Class A5 | | | |
4.739% | | 07/15/30 | | Aaa | | | | 695 | | | 666,435 |
Ser 2006-C6, AAB | | | |
5.341% | | 09/15/39 | | Aaa | | | | 2,380 | | | 2,388,398 |
Merrill Lynch Mortgage Trust, | | | |
Series 2004-Key 2, Class A3 | | | |
4.615% | | 08/12/39 | | Aaa | | | | 1,900 | | | 1,882,012 |
Merrill Lynch/Countrywide Commercial Mortgage Trust(g), |
Series 2006-2, Class A4 | | | |
5.9095% | | 06/12/46 | | Aaa | | | | 2,210 | | | 2,306,585 |
Merrill Lynch/Countrywide Commerical Mortgage Trust, |
Series 2007-5, Class A4 | | | |
5.378% | | 08/12/48 | | Aaa | | | | 3,400 | | | 3,400,633 |
Morgan Stanley Capital I, | | | |
Series 2006-IQ11, Class A4(g) | | | |
5.773% | | 10/15/42 | | AAA | (d) | | | 2,600 | | | 2,678,148 |
Series 2007-HQ11, Class AAB | | | |
5.444% | | 02/12/44 | | Aaa | | | | 4,400 | | | 4,418,695 |
Series 2007-T27, Class AAB(g) | | | |
5.651% | | 06/11/42 | | AAA | (d) | | | 1,040 | | | 1,060,487 |
SEE NOTES TO FINANCIAL STATEMENTS.
A23
| | | | |
| | | CONSERVATIVE BALANCED PORTFOLIO (Continued) | | |
SCHEDULE OF INVESTMENTS | December 31, 2007 |
| | | | | | | | | | |
Description
| | Maturity
Date
| | Moody’s
Rating
(Unaudited)
| | Principal
Amount
(000)
| | Value
(Note 2)
|
| | | | | | | | | | | |
| LONG-TERM BONDS (continued) | | | |
Commercial Mortgage Backed Securities (continued) |
Wachovia Bank Commercial Mortgage Trust, | | | |
Series 2002-C2, Class A4 | | | |
4.98% | | 11/15/34 | | Aaa | | $ | 1,700 | | $ | 1,706,316 |
| | | | | | | | | |
|
|
| | | | | | | | | | | 123,756,943 |
| | | | | | | | | |
|
|
Consumer | | | |
Whirlpool Corp. | | | |
6.125% | | 06/15/11 | | Baa2 | | | 1,045 | | | 1,088,287 |
| | | | | | | | | |
|
|
Electric — 1.0% | | | |
Appalachian Power Co. | | | |
4.40% | | 06/01/10 | | Baa2 | | | 790 | | | 784,137 |
Arizona Public Service Co. | | | |
6.25% | | 08/01/16 | | Baa2 | | | 170 | | | 172,989 |
6.375% | | 10/15/11 | | Baa2 | | | 1,250 | | | 1,293,248 |
Baltimore Gas & Electric Co. | | | |
6.35% | | 10/01/36 | | Baa2 | | | 530 | | | 525,644 |
Carolina Power & Light Co. | | | |
5.25% | | 12/15/15 | | A2 | | | 660 | | | 656,425 |
CenterPoint Energy Houston Electric LLC | | | |
5.70% | | 03/15/13 | | Baa2 | | | 1,070 | | | 1,080,231 |
6.95% | | 03/15/33 | | Baa2 | | | 300 | | | 327,973 |
Consolidated Edison, Inc. | | | |
5.375% | | 12/15/15 | | A1 | | | 820 | | | 816,883 |
Consumers Energy Co., First Mortgage Bonds, Series D |
5.375% | | 04/15/13 | | Baa1 | | | 435 | | | 433,797 |
Dominion Resources, Inc. | | | |
5.125% | | 12/15/09 | | Baa2 | | | 1,255 | | | 1,266,759 |
Duke Energy Carolinas LLC | | | |
6.10% | | 06/01/37 | | A3 | | | 920 | | | 924,709 |
El Paso Electric Co. | | | |
6.00% | | 05/15/35 | | Baa2 | | | 845 | | | 789,986 |
Empresa Nacional de Electricidad S.A. (Chile) | | | |
8.50% | | 04/01/09 | | Baa3 | | | 1,350 | | | 1,411,263 |
8.625% | | 08/01/15 | | Baa3 | | | 1,160 | | | 1,338,218 |
Energy East Corp. | | | |
6.75% | | 09/15/33 | | Baa2 | | | 140 | | | 141,488 |
Exelon Corp. | | | |
4.90% | | 06/15/15 | | Baa1 | | | 195 | | | 183,557 |
Florida Power & Light Co. | | | |
5.95% | | 10/01/33 | | Aa3 | | | 380 | | | 384,375 |
Georgia Power Co., Series B | | | |
5.70% | | 06/01/17 | | A2 | | | 470 | | | 482,570 |
Indiana Michigan Power Co. | | | |
5.05% | | 11/15/14 | | Baa2 | | | 575 | | | 551,327 |
Midamerican Energy Holdings Co. | | | |
5.95% | | 05/15/37 | | Baa1 | | | 450 | | | 436,490 |
Nevada Power Co. | | | |
6.50% | | 05/15/18 | | Baa3 | | | 1,210 | | | 1,238,821 |
NiSource Finance Corp. | | | |
5.45% | | 09/15/20 | | Baa3 | | | 500 | | | 447,423 |
NRG Energy, Bank Loan(j) | | | |
6.48% | | 02/01/13 | | Ba1 | | | 439 | | | 418,563 |
6.58% | | 02/01/13 | | Ba1 | | | 951 | | | 906,577 |
NSTAR Electric Co. | | | |
4.875% | | 04/15/14 | | A1 | | | 730 | | | 712,258 |
SEE NOTES TO FINANCIAL STATEMENTS.
A24
| | | | |
| | | CONSERVATIVE BALANCED PORTFOLIO (Continued) | | |
SCHEDULE OF INVESTMENTS | December 31, 2007 |
| | | | | | | | | | |
Description
| | Maturity
Date
| | Moody’s
Rating
(Unaudited)
| | Principal
Amount
(000)
| | Value
(Note 2)
|
| | | | | | | | | | | |
| LONG-TERM BONDS (continued) | | | |
Electric (continued) | | | |
Oncor Electric Delivery Co. | | | |
6.375% | | 01/15/15 | | Ba1 | | $ | 465 | | $ | 476,101 |
7.00% | | 09/01/22 | | Ba1 | | | 545 | | | 564,589 |
Pacific Gas & Electric Co. | | | |
6.05% | | 03/01/34 | | A3 | | | 1,610 | | | 1,607,324 |
PPL Electric Utilities Corp. | | | |
6.25% | | 08/15/09 | | A3 | | | 1,900 | | | 1,946,179 |
Public Service Electric & Gas Co., M.T.N. | | | |
5.80% | | 05/01/37 | | A3 | | | 515 | | | 503,455 |
Southern California Edison Co. | | | |
4.65% | | 04/01/15 | | A2 | | | 610 | | | 586,222 |
Texas Competitive Electric Holdings Co. LLC, Bank Loan(j) | | | |
8.60% | | 10/10/14 | | Ba3 | | | 1,000 | | | 981,251 |
Virginia Electric and Power Co. | | | |
6.00% | | 05/15/37 | | Baa1 | | | 715 | | | 699,301 |
Xcel Energy, Inc. | | | |
3.40% | | 07/01/08 | | Baa1 | | | 785 | | | 777,978 |
5.613% | | 04/01/17 | | Baa1 | | | 263 | | | 259,789 |
6.50% | | 07/01/36 | | Baa1 | | | 445 | | | 441,460 |
| | | | | | | | | |
|
|
| | | | | | | | | | | 26,569,360 |
| | | | | | | | | |
|
|
Energy – Integrated — 0.1% | | | |
Lukoil International Finance BV (Netherlands), 144A | | | |
6.356% | | 06/07/17 | | Baa2 | | | 530 | | | 501,751 |
Phillips Petroleum Co. | | | |
8.75% | | 05/25/10 | | A1 | | | 1,900 | | | 2,081,562 |
TNK-BP Finance SA (Luxembourg), 144A | | | |
7.50% | | 07/18/16 | | Baa2 | | | 1,365 | | | 1,322,344 |
| | | | | | | | | |
|
|
| | | | | | | | | | | 3,905,657 |
| | | | | | | | | |
|
|
Energy – Other — 0.2% | | | |
Devon Energy Corp. | | | |
7.875% | | 09/30/31 | | Baa1 | | | 280 | | | 338,647 |
Halliburton Co. | | | |
5.50% | | 10/15/10 | | A2 | | | 200 | | | 205,590 |
Nexen, Inc. (Canada) | | | |
6.40% | | 05/15/37 | | Baa2 | | | 195 | | | 194,673 |
Pioneer Natural Resources Co. | | | |
6.875% | | 05/01/18 | | Ba1 | | | 1,450 | | | 1,402,187 |
Talisman Energy, Inc. (Canada) | | | |
6.25% | | 02/01/38 | | Baa2 | | | 160 | | | 155,929 |
Valero Energy Corp. | | | |
6.125% | | 06/15/17 | | Baa3 | | | 820 | | | 833,337 |
6.625% | | 06/15/37 | | Baa3 | | | 250 | | | 251,768 |
Weatherford International, Inc., 144A | | | |
6.35% | | 06/15/17 | | Baa1 | | | 895 | | | 925,122 |
Weatherford International, Inc. (Bermuda) | | | |
6.50% | | 08/01/36 | | Baa1 | | | 25 | | | 24,966 |
Woodside Finance Ltd. (Australia), 144A | | | |
5.00% | | 11/15/13 | | Baa1 | | | 1,660 | | | 1,653,942 |
XTO Energy, Inc. | | | |
6.25% | | 08/01/17 | | Baa2 | | | 565 | | | 592,752 |
| | | | | | | | | |
|
|
| | | | | | | | | | | 6,578,913 |
| | | | | | | | | |
|
|
SEE NOTES TO FINANCIAL STATEMENTS.
A25
| | | | |
| | | CONSERVATIVE BALANCED PORTFOLIO (Continued) | | |
SCHEDULE OF INVESTMENTS | December 31, 2007 |
| | | | | | | | | | |
Description
| | Maturity
Date
| | Moody’s
Rating
(Unaudited)
| | Principal
Amount
(000)
| | Value
(Note 2)
|
| | | | | | | | | | | |
| LONG-TERM BONDS (continued) | | | |
Foods — 0.6% | | | |
Aramark Corp., Bank Loan(j) | | | |
7.036% | | 01/26/14 | | Ba3 | | $ | 1,658 | | $ | 1,574,688 |
7.036% | | 01/26/14 | | Ba3 | | | 119 | | | 112,544 |
Bunge Ltd. Finance Corp. | | | |
5.35% | | 04/15/14 | | Baa2 | | | 1,000 | | | 968,230 |
Cadbury Schweppes American Finance, Inc., 144A | | | |
3.875% | | 10/01/08 | | Baa2 | | | 1,050 | | | 1,043,639 |
Cargill, Inc., 144A | | | |
6.00% | | 11/27/17 | | A2 | | | 650 | | | 648,515 |
Coca-Cola Co. (The) | | | |
5.35% | | 11/15/17 | | Aa3 | | | 1,430 | | | 1,465,095 |
ConAgra Foods, Inc. | | | |
7.875% | | 09/15/10 | | Baa2 | | | 585 | | | 627,911 |
Delhaize Group (Belgium) | | | |
6.50% | | 06/15/17 | | Baa3 | | | 460 | | | 470,592 |
Diageo Capital PLC (United Kingdom)(b) | | | |
5.75% | | 10/23/17 | | A3 | | | 970 | | | 975,509 |
HJ Heinz Co., 144A | | | |
6.428% | | 12/01/08 | | Baa2 | | | 1,620 | | | 1,649,242 |
Kellogg Co. | | | |
6.60% | | 04/01/11 | | A3 | | | 1,285 | | | 1,361,664 |
Kraft Foods, Inc. | | | |
5.625% | | 11/01/11 | | Baa2 | | | 965 | | | 986,880 |
6.125% | | 02/01/18 | | Baa2 | | | 940 | | | 947,186 |
Kroger Co. (The) | | | |
6.75% | | 04/15/12 | | Baa2 | | | 215 | | | 228,212 |
6.80%(b) | | 04/01/11 | | Baa2 | | | 575 | | | 605,124 |
McDonald’s Corp. | | | |
5.80% | | 10/15/17 | | A3 | | | 690 | | | 714,411 |
Tricon Global Restaurants, Inc. | | | |
8.875% | | 04/15/11 | | Baa2 | | | 235 | | | 259,211 |
Tyson Foods, Inc. | | | |
6.85% | | 04/01/16 | | Ba1 | | | 785 | | | 805,532 |
Whitman Corp. | | | |
6.375% | | 05/01/09 | | Baa1 | | | 1,645 | | | 1,695,246 |
| | | | | | | | | |
|
|
| | | | | | | | | | | 17,139,431 |
| | | | | | | | | |
|
|
Foreign Government Bonds — 0.2% | | | |
DP World Ltd., 144A | | | |
6.85% | | 07/02/37 | | A1 | | | 1,610 | | | 1,530,537 |
Gaz Capital for Gazprom (Luxembourg), 144A | | | |
7.288% | | 08/16/37 | | A3 | | | 1,200 | | | 1,211,160 |
Pemex Project Funding Master Trust | | | |
8.625% | | 12/01/23 | | Baa1 | | | 350 | | | 435,313 |
Petrobras International Finance Co. (PIFCO) | | | |
(Cayman Islands) | | | | | | | | | | |
8.375% | | 12/10/18 | | Baa1 | | | 1,140 | | | 1,356,600 |
RSHB Capital SA for OJSC Russian | | | |
Agricultural Bank (Luxembourg), 144A | | | | | | | | | | |
6.299% | | 05/15/17 | | A3 | | | 2,100 | | | 1,989,749 |
| | | | | | | | | |
|
|
| | | | | | | | | | | 6,523,359 |
| | | | | | | | | |
|
|
Gaming | | | |
Harrah’s Operating Co., Inc. | | | |
5.50% | | 07/01/10 | | Baa3 | | | 970 | | | 902,100 |
Mandalay Resort Group | | | |
9.375% | | 02/15/10 | | B1 | | | 12 | | | 12,420 |
| | | | | | | | | |
|
|
| | | | | | | | | | | 914,520 |
| | | | | | | | | |
|
|
SEE NOTES TO FINANCIAL STATEMENTS.
A26
| | | | |
| | | CONSERVATIVE BALANCED PORTFOLIO (Continued) | | |
SCHEDULE OF INVESTMENTS | December 31, 2007 |
| | | | | | | | | | |
Description
| | Maturity
Date
| | Moody’s
Rating
(Unaudited)
| | Principal
Amount
(000)
| | Value
(Note 2)
|
| | | | | | | | | | | |
| LONG-TERM BONDS (continued) | | | |
Healthcare & Pharmaceutical — 0.7% | | | |
Abbott Laboratories | | | |
5.875% | | 05/15/16 | | A1 | | $ | 1,100 | | $ | 1,149,004 |
AmerisourceBergen Corp., Series WI | | | |
5.625% | | 09/15/12 | | Ba1 | | | 915 | | | 927,940 |
AstraZeneca PLC (United Kingdom) | | | |
6.45% | | 09/15/37 | | A1 | | | 480 | | | 525,924 |
Baxter International, Inc. | | | |
5.196% | | 02/16/08 | | Baa1 | | | 1,085 | | | 1,084,768 |
Bristol-Myers Squibb Co. | | | |
5.875% | | 11/15/36 | | A2 | | | 265 | | | 263,337 |
Community Health Systems, Inc., Bank Loans(j) | | | |
7.493% | | 07/25/14 | | Ba3 | | | 81 | | | 78,051 |
7.493% | | 07/25/14 | | Ba3 | | | 1,615 | | | 1,551,920 |
Covidien International Finance SA (Luxembourg), 144A | | | |
6.00% | | 10/15/17 | | Baa1 | | | 1,100 | | | 1,138,207 |
Genentech, Inc. | | | |
4.75% | | 07/15/15 | | A1 | | | 270 | | | 265,694 |
HCA, Inc. | | | |
9.25% | | 11/15/16 | | B2 | | | 1,925 | | | 2,021,251 |
HCA, Inc., Bank Loan(j) | | | |
7.08% | | 11/17/13 | | Ba3 | | | 1,980 | | | 1,905,256 |
Health Management Associate Term B, Bank Loan(j) | | | |
6.62% | | 02/28/14 | | Ba3 | | | 1,201 | | | 1,118,194 |
Laboratory Corp. of America Holdings | | | |
5.625% | | 12/15/15 | | Baa3 | | | 560 | | | 551,140 |
Merck & Co., Inc. | | | |
5.75% | | 11/15/36 | | Aa3 | | | 65 | | | 64,632 |
5.95% | | 12/01/28 | | Aa3 | | | 205 | | | 209,787 |
Schering-Plough Corp. | | | |
5.55% | | 12/01/13 | | Baa1 | | | 695 | | | 703,186 |
6.00% | | 09/15/17 | | Baa1 | | | 1,050 | | | 1,087,833 |
6.55%(b) | | 09/15/37 | | Baa1 | | | 330 | | | 349,653 |
Teva Pharmaceutical Finance LLC (Israel) | | | |
6.15% | | 02/01/36 | | Baa2 | | | 115 | | | 114,202 |
Wyeth | | | |
5.50% | | 03/15/13 | | A3 | | | 915 | | | 941,098 |
5.50% | | 02/01/14 | | A3 | | | 210 | | | 213,290 |
5.95% | | 04/01/37 | | A3 | | | 1,645 | | | 1,649,364 |
6.45% | | 02/01/24 | | A3 | | | 60 | | | 63,650 |
| | | | | | | | | |
|
|
| | | | | | | | | | | 17,977,381 |
| | | | | | | | | |
|
|
Healthcare Insurance — 0.3% | | | |
Aetna, Inc. | | | |
5.75% | | 06/15/11 | | A3 | | | 430 | | | 441,958 |
6.625% | | 06/15/36 | | A3 | | | 480 | | | 475,203 |
Cigna Corp. | | | |
6.15% | | 11/15/36 | | Baa2 | | | 640 | | | 593,802 |
Coventry Health Care, Inc. | | | |
6.125% | | 01/15/15 | | Ba1 | | | 2,200 | | | 2,207,662 |
UnitedHealth Group, Inc. | | | |
5.25% | | 03/15/11 | | A3 | | | 1,470 | | | 1,486,445 |
6.00%, 144A | | 06/15/17 | | A3 | | | 115 | | | 116,151 |
6.50%, 144A | | 06/15/37 | | A3 | | | 400 | | | 401,551 |
6.625%, 144A | | 11/15/37 | | A3 | | | 410 | | | 416,138 |
SEE NOTES TO FINANCIAL STATEMENTS.
A27
| | | | |
| | | CONSERVATIVE BALANCED PORTFOLIO (Continued) | | |
SCHEDULE OF INVESTMENTS | December 31, 2007 |
| | | | | | | | | | |
Description
| | Maturity
Date
| | Moody’s
Rating
(Unaudited)
| | Principal
Amount
(000)
| | Value
(Note 2)
|
| | | | | | | | | | | |
| LONG-TERM BONDS (continued) | | | |
Healthcare Insurance (continued) | | | |
WellPoint, Inc. | | | |
5.00% | | 12/15/14 | | Baa1 | | $ | 1,085 | | $ | 1,039,333 |
5.25% | | 01/15/16 | | Baa1 | | | 335 | | | 324,340 |
5.95% | | 12/15/34 | | Baa1 | | | 210 | | | 197,673 |
| | | | | | | | | |
|
|
| | | | | | | | | | | 7,700,256 |
| | | | | | | | | |
|
|
Insurance — 0.3% | | | |
American International Group, Inc. | | | |
4.25%(c) | | 05/15/13 | | Aa2 | | | 1,355 | | | 1,288,970 |
5.05% | | 10/01/15 | | Aa2 | | | 125 | | | 120,716 |
5.85%, M.T.N. | | 01/16/18 | | Aa2 | | | 1,620 | | | 1,630,607 |
6.25% | | 03/15/37 | | Aa3 | | | 260 | | | 232,549 |
AXA SA (France)(c) | | | |
8.60% | | 12/15/30 | | A3 | | | 230 | | | 282,020 |
Berkshire Hathaway, Inc.(b) | | | |
4.75% | | 05/15/12 | | Aaa | | | 425 | | | 430,328 |
Liberty Mutual Group, 144A | | | |
7.00% | | 03/15/34 | | Baa2 | | | 910 | | | 887,505 |
Lincoln National Corp. | | | |
6.30% | | 10/09/37 | | A3 | | | 476 | | | 462,867 |
Marsh & McLennan Cos., Inc. | | | |
5.15% | | 09/15/10 | | Baa2 | | | 335 | | | 334,626 |
MetLife, Inc. | | | |
5.70% | | 06/15/35 | | A2 | | | 1,185 | | | 1,082,084 |
6.125% | | 12/01/11 | | A2 | | | 435 | | | 451,079 |
6.375% | | 06/15/34 | | A2 | | | 85 | | | 83,941 |
St. Paul Travelers Cos., Inc. | | | |
6.75% | | 06/20/36 | | A3 | | | 740 | | | 772,238 |
W.R. Berkley Corp. | | | |
5.60% | | 05/15/15 | | Baa2 | | | 705 | | | 682,853 |
6.15% | | 08/15/19 | | Baa2 | | | 575 | | | 556,457 |
XL Capital Ltd. (Cayman Islands) | | | |
5.25% | | 09/15/14 | | A3 | | | 110 | | | 106,967 |
| | | | | | | | | |
|
|
| | | | | | | | | | | 9,405,807 |
| | | | | | | | | |
|
|
Lodging | | | |
Starwood Hotels & Resorts Worldwide, Inc. | | | |
6.25% | | 02/15/13 | | Baa3 | | | 370 | | | 370,225 |
| | | | | | | | | |
|
|
Media & Entertainment — 0.3% | | | |
Chancellor Media Corp. | | | |
8.00% | | 11/01/08 | | Baa3 | | | 745 | | | 770,023 |
Idearc, Inc. Bank Loan(j) | | | |
6.83% | | 11/17/14 | | Ba2 | | | 1,485 | | | 1,412,776 |
News America Holdings, Inc. | | | |
7.625% | | 11/30/28 | | Baa2 | | | 1,360 | | | 1,507,087 |
Time Warner, Inc. | | | |
6.75% | | 04/15/11 | | Baa2 | | | 725 | | | 755,114 |
7.25% | | 10/15/17 | | Baa2 | | | 745 | | | 796,892 |
9.15% | | 02/01/23 | | Baa2 | | | 625 | | | 764,664 |
Viacom, Inc. | | | |
6.875% | | 04/30/36 | | Baa3 | | | 865 | | | 867,358 |
| | | | | | | | | |
|
|
| | | | | | | | | | | 6,873,914 |
| | | | | | | | | |
|
|
Metals — 0.1% | | | |
Alcan, Inc. (Canada) | | | |
4.50% | | 05/15/13 | | A3 | | | 255 | | | 248,968 |
5.00% | | 06/01/15 | | A3 | | | 755 | | | 731,387 |
SEE NOTES TO FINANCIAL STATEMENTS.
A28
| | | | |
| | | CONSERVATIVE BALANCED PORTFOLIO (Continued) | | |
SCHEDULE OF INVESTMENTS | December 31, 2007 |
| | | | | | | | | | |
Description
| | Maturity
Date
| | Moody’s
Rating
(Unaudited)
| | Principal
Amount
(000)
| | Value
(Note 2)
|
| | | | | | | | | | | |
| LONG-TERM BONDS (continued) | | | |
Metals (continued) | | | |
Alcoa, Inc. | | | |
5.90% | | 02/01/27 | | Baa1 | | $ | 110 | | $ | 103,868 |
Peabody Energy Corp. | | | |
7.375% | | 11/01/16 | | Ba1 | | | 1,150 | | | 1,178,750 |
Southern Copper Corp. | | | |
7.50% | | 07/27/35 | | Baa2 | | | 120 | | | 127,093 |
United States Steel Corp. | | | |
5.65% | | 06/01/13 | | Baa3 | | | 540 | | | 523,083 |
| | | | | | | | | |
|
|
| | | | | | | | | | | 2,913,149 |
| | | | | | | | | |
|
|
Non Captive Finance — 0.3% | | | |
Capital One Bank | | | |
6.50% | | 06/13/13 | | A3 | | | 10 | | | 9,809 |
Capital One Financial Corp., M.T.N. | | | |
5.70% | | 09/15/11 | | A3 | | | 570 | | | 550,655 |
CIT Group, Inc. | | | |
4.25% | | 02/01/10 | | A2 | | | 480 | | | 461,835 |
Countrywide Financial Corp., M.T.N. | | | |
5.80% | | 06/07/12 | | Baa3 | | | 1,160 | | | 847,379 |
General Electric Capital Corp., M.T.N. | | | |
5.55% | | 05/04/20 | | Aaa | | | 1,875 | | | 1,928,204 |
5.625% | | 09/15/17 | | Aaa | | | 205 | | | 210,325 |
GMAC LLC(g) | | | |
6.1188% | | 05/15/09 | | Ba3 | | | 640 | | | 596,086 |
Household Finance Corp. | | | |
4.75% | | 05/15/09 | | Aa3 | | | 370 | | | 368,771 |
HSBC Finance Corp. | | | |
5.70% | | 06/01/11 | | Aa3 | | | 585 | | | 588,257 |
International Lease Finance Corp. | | | |
3.50% | | 04/01/09 | | A1 | | | 750 | | | 737,172 |
Residential Capital LLC | | | |
7.50% | | 02/22/11 | | Ba3 | | | 240 | | | 149,400 |
7.875% | | 06/30/10 | | Ba3 | | | 610 | | | 390,400 |
8.00% | | 04/17/13 | | Ba3 | | | 910 | | | 559,650 |
| | | | | | | | | |
|
|
| | | | | | | | | | | 7,397,943 |
| | | | | | | | | |
|
|
Paper | | | | | | |
Plum Creek Timberlands LP | | | | | | |
5.875% | | 11/15/15 | | Baa3 | | | 515 | | | 507,771 |
| | | | | | | | | |
|
|
Pipelines & Other — 0.3% | | | | | | |
Atmos Energy Corp. | | | |
4.00% | | 10/15/09 | | Baa3 | | | 1,815 | | | 1,788,421 |
Duke Energy Field Services Corp. | | | |
7.875% | | 08/16/10 | | Baa2 | | | 1,830 | | | 1,963,058 |
Enterprise GP Holdings LP, Bank Loan(j) | | | |
7.161% | | 11/08/14 | | Ba2 | | | 1,000 | | | 994,375 |
Enterprise Products Operating LP | | | |
4.625% | | 10/15/09 | | Baa3 | | | 710 | | | 708,883 |
6.875% | | 03/01/33 | | Baa3 | | | 140 | | | 146,266 |
Kinder Morgan, Inc., Bank Loan(j) | | | |
6.35% | | 05/30/14 | | Ba2 | | | 1,161 | | | 1,152,295 |
Oneok, Inc. | | | |
5.51% | | 02/16/08 | | Baa2 | | | 1,630 | | | 1,628,995 |
Oneok Partners LP | | | |
6.65% | | 10/01/36 | | Baa2 | | | 455 | | | 460,087 |
Sempra Energy | | | |
6.00% | | 02/01/13 | | Baa1 | | | 80 | | | 82,643 |
SEE NOTES TO FINANCIAL STATEMENTS.
A29
| | | | |
| | | CONSERVATIVE BALANCED PORTFOLIO (Continued) | | |
SCHEDULE OF INVESTMENTS | December 31, 2007 |
| | | | | | | | | | |
Description
| | Maturity
Date
| | Moody’s
Rating
(Unaudited)
| | Principal
Amount
(000)
| | Value
(Note 2)
|
| | | | | | | | | | | |
| LONG-TERM BONDS (continued) | | | |
Pipelines & Other (continued) | | | | | | |
Spectra Energy Capital LLC | | | | | | |
6.25% | | 02/15/13 | | Baa1 | | $ | 205 | | $ | 212,518 |
| | | | | | | | | |
|
|
| | | | | | | | | | | 9,137,541 |
| | | | | | | | | |
|
|
Railroads — 0.2% | | | | | | |
Burlington Northern Santa Fe Corp. | | | | | | |
6.70% | | 08/01/28 | | Baa1 | | | 735 | | | 765,131 |
CSX Corp. | | | | | | |
6.15% | | 05/01/37 | | Baa3 | | | 690 | | | 644,820 |
6.25% | | 03/15/18 | | Baa3 | | | 375 | | | 376,915 |
Norfolk Southern Corp. | | | | | | |
5.59% | | 05/17/25 | | Baa1 | | | 630 | | | 583,748 |
7.80% | | 05/15/27 | | Baa1 | | | 24 | | | 28,604 |
Union Pacific Corp. | | | | | | |
3.625% | | 06/01/10 | | Baa2 | | | 1,395 | | | 1,354,751 |
6.625% | | 02/01/08 | | Baa2 | | | 1,755 | | | 1,756,407 |
6.65% | | 01/15/11 | | Baa2 | | | 760 | | | 790,084 |
| | | | | | | | | |
|
|
| | | | | | | | | | | 6,300,460 |
| | | | | | | | | |
|
|
Real Estate Investments Trusts — 0.2% | | | |
Brandywine Operating Partnership LP | | | | | | |
5.75% | | 04/01/12 | | Baa3 | | | 1,405 | | | 1,390,826 |
Mack-Cali Realty Corp. | | | | | | |
7.25% | | 03/15/09 | | Baa2 | | | 1,595 | | | 1,637,920 |
Post Apartment Homes LP | | | | | | |
5.45% | | 06/01/12 | | Baa3 | | | 545 | | | 553,452 |
6.30% | | 06/01/13 | | Baa3 | | | 650 | | | 682,166 |
Simon Property Group LP | | | | | | |
5.75% | | 05/01/12 | | A3 | | | 1,625 | | | 1,634,721 |
| | | | | | | | | |
|
|
| | | | | | | | | | | 5,899,085 |
| | | | | | | | | |
|
|
Retailers — 0.2% | | | | | | |
CVS Caremark Corp. | | | | | | |
5.75% | | 08/15/11 | | Baa2 | | | 1,240 | | | 1,270,179 |
5.75% | | 06/01/17 | | Baa2 | | | 1,580 | | | 1,590,169 |
Federated Retail Holdings, Inc. | | | | | | |
5.35% | | 03/15/12 | | Baa2 | | | 815 | | | 794,051 |
5.90% | | 12/01/16 | | Baa2 | | | 100 | | | 94,180 |
Home Depot, Inc. | | | | | | |
5.875% | | 12/16/36 | | Baa1 | | | 315 | | | 265,829 |
May Department Stores Co. | | | | | | |
6.65% | | 07/15/24 | | Baa2 | | | 60 | | | 55,424 |
Wal-Mart Stores, Inc. | | | | | | |
5.25% | | 09/01/35 | | Aa2 | | | 235 | | | 208,448 |
| | | | | | | | | |
|
|
| | | | | | | | | | | 4,278,280 |
| | | | | | | | | |
|
|
Sovereign — 0.2% | | | | | | |
United Mexican States (Mexico) | | | | | | |
5.875%, M.T.N. | | 01/15/14 | | Baa1 | | | 4,050 | | | 4,212,000 |
7.50% | | 01/14/12 | | Baa1 | | | 1,630 | | | 1,789,740 |
| | | | | | | | | |
|
|
| | | | | | | | | | | 6,001,740 |
| | | | | | | | | |
|
|
Structured Notes — 0.1% | | | | | | |
CDX North America High Yield, | | | | | | |
Series 9-T1, 144A(b) | | | | | | | | | | |
8.75% | | 12/29/12 | | B3 | | | 2,200 | | | 2,169,750 |
| | | | | | | | | |
|
|
SEE NOTES TO FINANCIAL STATEMENTS.
A30
| | | | |
| | | CONSERVATIVE BALANCED PORTFOLIO (Continued) | | |
SCHEDULE OF INVESTMENTS | December 31, 2007 |
| | | | | | | | | | |
Description
| | Maturity
Date
| | Moody’s
Rating
(Unaudited)
| | Principal
Amount
(000)
| | Value
(Note 2)
|
| | | | | | | | | | | |
| LONG-TERM BONDS (continued) | | | |
Technology — 0.3% | | | | | | |
Electronic Data Systems Corp. | | | | | | |
7.45% | | 10/15/29 | | Ba1 | | $ | 120 | | $ | 123,121 |
First Data Corp., Bank Loans(j) | | | | | | |
7.981% | | 09/24/14 | | Ba3 | | | 1,497 | | | 1,424,072 |
7.981% | | 09/24/14 | | Ba3 | | | 1,096 | | | 1,039,314 |
Fiserv, Inc. | | | | | | |
6.125% | | 11/20/12 | | Baa2 | | | 960 | | | 977,087 |
Flextronics International Ltd. (Singapore), Bank Loans(j) | | | | | | |
7.234% | | 10/01/14 | | Ba1 | | | 223 | | | 217,090 |
7.474% | | 10/01/14 | | Ba1 | | | 777 | | | 755,588 |
Freescale Semiconductor, Inc. | | | | | | |
8.875% | | 12/15/14 | | B2 | | | 550 | | | 490,875 |
International Business Machines Corp. | | | | | | |
5.70% | | 09/14/17 | | A1 | | | 500 | | | 516,881 |
Intuit, Inc. | | | | | | |
5.40% | | 03/15/12 | | Baa2 | | | 575 | | | 584,000 |
Jabil Circuit, Inc. | | | | | | |
5.875% | | 07/15/10 | | Ba1 | | | 1,800 | | | 1,821,493 |
Metavante Corp., Bank Loan(j) | | | | | | |
6.644% | | 11/01/14 | | Ba2 | | | 1,000 | | | 971,875 |
Motorola, Inc. | | | | | | |
8.00% | | 11/01/11 | | Baa1 | | | 128 | | | 137,979 |
| | | | | | | | | |
|
|
| | | | | | | | | | | 9,059,375 |
| | | | | | | | | |
|
|
Telecommunications — 0.9% | | | | | | |
America Movil SA de CV (Mexico) | | | | | | |
6.375% | | 03/01/35 | | A3 | | | 630 | | | 622,957 |
AT&T Corp. | | | | | | |
8.00% | | 11/15/31 | | A2 | | | 1,930 | | | 2,370,181 |
AT&T Wireless Services, Inc. | | | | | | |
8.125% | | 05/01/12 | | A2 | | | 800 | | | 889,535 |
8.75% | | 03/01/31 | | A3 | | | 1,235 | | | 1,600,539 |
BellSouth Corp. | | | | | | |
4.20% | | 09/15/09 | | A2 | | | 1,365 | | | 1,356,874 |
British Telecommunications PLC (United Kingdom) | | | | | | |
9.125% | | 12/15/30 | | Baa1 | | | 1,415 | | | 1,872,929 |
Cingular Wireless LLC | | | | | | |
7.125% | | 12/15/31 | | A3 | | | 535 | | | 590,443 |
Deutsche Telekom International Finance BV (Netherlands)(c) | | | | | | |
8.25% | | 06/15/30 | | A3 | | | 345 | | | 430,474 |
Embarq Corp. | | | | | | |
7.082% | | 06/01/16 | | Baa3 | | | 350 | | | 360,633 |
7.995% | | 06/01/36 | | Baa3 | | | 1,645 | | | 1,733,560 |
France Telecom SA (France) | | | | | | |
8.50% | | 03/01/31 | | A3 | | | 360 | | | 466,797 |
Nextel Communications, Inc.(b) | | | | | | |
5.95% | | 03/15/14 | | Baa3 | | | 1,475 | | | 1,386,454 |
PCCW HKT Capital Ltd., 144A | | | | | | |
8.00% | | 11/15/11 | | Baa2 | | | 2,275 | | | 2,500,261 |
Qwest Corp. | | | | | | |
8.875% | | 03/15/12 | | Ba1 | | | 2,000 | | | 2,140,000 |
Royal KPN NV (Netherlands) | | | | | | |
8.00% | | 10/01/10 | | Baa2 | | | 645 | | | 691,741 |
SBC Communications, Inc. | | | | | | |
4.125% | | 09/15/09 | | A2 | | | 1,335 | | | 1,326,511 |
5.30% | | 11/15/10 | | A2 | | | 1,180 | | | 1,200,971 |
SEE NOTES TO FINANCIAL STATEMENTS.
A31
| | | | |
| | | CONSERVATIVE BALANCED PORTFOLIO (Continued) | | |
SCHEDULE OF INVESTMENTS | December 31, 2007 |
| | | | | | | | | | |
Description
| | Maturity
Date
| | Moody’s
Rating
(Unaudited)
| | Principal
Amount
(000)
| | Value
(Note 2)
|
| | | | | | | | | | | |
| LONG-TERM BONDS (continued) | | | |
Telecommunications (continued) | | | | | | |
Telecom Italia Finance (Luxembourg) | | | | | | |
5.25% | | 11/15/13 | | Baa2 | | $ | 170 | | $ | 168,016 |
Telefonica Emisiones SAU (Spain) | | | | | | |
7.045% | | 06/20/36 | | Baa1 | | | 210 | | | 234,735 |
TELUS Corp. (Cananda) | | | | | | |
8.00% | | 06/01/11 | | Baa1 | | | 1,500 | | | 1,625,204 |
US Cellular Corp. | | | | | | |
6.70% | | 12/15/33 | | Baa3 | | | 600 | | | 551,050 |
Verizon Communications, Inc. | | | | | | |
6.25% | | 04/01/37 | | A3 | | | 105 | | | 107,676 |
Vodafone Group PLC (United Kingdom) | | | | | | |
6.15%(b) | | 02/27/37 | | Baa1 | | | 435 | | | 429,615 |
7.75% | | 02/15/10 | | Baa1 | | | 950 | | | 1,002,145 |
| | | | | | | | | |
|
|
| | | | | | | | | | | 25,659,301 |
| | | | | | | | | |
|
|
Tobacco — 0.1% | | | |
Altria Group, Inc. | | | | | | |
7.65% | | 07/01/08 | | Baa1 | | | 765 | | | 777,294 |
Reynolds American, Inc. | | | | | | |
6.75% | | 06/15/17 | | Ba1 | | | 910 | | | 926,856 |
7.25% | | 06/15/37 | | Ba1 | | | 410 | | | 414,379 |
| | | | | | | | | |
|
|
| | | | | | | | | | | 2,118,529 |
| | | | | | | | | |
|
|
Mortgage Backed Securities — 15.2% | | | |
Federal Home Loan Mortgage Corp. | | | | | | |
4.50% | | 02/01/19-07/01/20 | | | | | 7,511 | | | 7,382,884 |
5.00% | | 07/01/18-05/01/34 | | | | | 13,494 | | | 13,414,484 |
5.238%(g) | | 12/01/35 | | | | | 3,684 | | | 3,690,578 |
5.50% | | 12/01/33-07/01/34 | | | | | 11,169 | | | 11,160,929 |
5.50% | | TBA 30 YR | | | | | 36,500 | | | 36,420,138 |
6.00% | | 03/01/32-12/01/33 | | | | | 3,338 | | | 3,403,360 |
6.00% | | TBA 30 YR | | | | | 21,000 | | | 21,308,448 |
6.50% | | 12/01/14-09/01/16 | | | | | 602 | | | 620,866 |
7.00% | | 05/01/31-09/01/33 | | | | | 5,514 | | | 5,786,366 |
Federal National Mortgage Association | | | |
4.00% | | 06/01/19 | | | | | 2,614 | | | 2,507,239 |
4.366%(g) | | 11/01/35 | | | | | 4,193 | | | 4,181,711 |
4.50% | | 11/01/18-01/01/35 | | | | | 17,001 | | | 16,519,238 |
4.96%(g) | | 07/01/33 | | | | | 1,287 | | | 1,293,772 |
5.00% | | 10/01/18-02/01/36 | | | | | 8,059 | | | 7,965,996 |
5.00% | | TBA 30 YR | | | | | 55,500 | | | 54,147,187 |
5.50% | | 03/01/16-04/01/37 | | | | | 63,903 | | | 63,981,858 |
5.50% | | TBA 15 YR | | | | | 9,500 | | | 9,621,714 |
5.50% | | TBA 30 YR | | | | | 38,000 | | | 37,952,500 |
5.914%(g) | | 06/01/37 | | | | | 6,999 | | | 7,126,217 |
5.977%(g) | | 07/01/37 | | | | | 5,353 | | | 5,440,929 |
6.00% | | 04/01/13-09/01/36 | | | | | 32,754 | | | 33,346,862 |
6.00% | | TBA 30 YR | | | | | 11,500 | | | 11,676,088 |
6.50% | | 07/01/17-01/01/37 | | | | | 12,560 | | | 12,938,031 |
7.00% | | 08/01/11-07/01/32 | | | | | 1,252 | | | 1,316,796 |
7.50% | | 05/01/12-05/01/32 | | | | | 973 | | | 1,024,927 |
Government National Mortgage Association | | | |
5.50% | | 08/15/33-04/15/36 | | | | | 15,862 | | | 15,982,633 |
6.00% | | 11/15/23-07/15/37 | | | | | 6,679 | | | 6,838,139 |
6.00% | | TBA 30 YR | | | | | 8,000 | | | 8,190,000 |
6.50% | | 10/15/23-09/15/36 | | | | | 7,102 | | | 7,364,536 |
7.00% | | 09/15/31 | | | | | 166 | | | 176,128 |
8.00% | | 01/15/24-04/15/25 | | | | | 195 | | | 210,384 |
| | | | | | | | | |
|
|
| | | | | | | | | | | 412,990,938 |
| | | | | | | | | |
|
|
SEE NOTES TO FINANCIAL STATEMENTS.
A32
| | | | |
| | | CONSERVATIVE BALANCED PORTFOLIO (Continued) | | |
SCHEDULE OF INVESTMENTS | December 31, 2007 |
| | | | | | | | |
Description
| | Maturity
Date
| | Principal
Amount
(000)
| | Value
(Note 2)
|
| | | | | | | | | |
| LONG-TERM BONDS (continued) |
U.S. Government Agency Obligations — 1.9% |
Federal Farm Credit Bank |
4.75% | | 05/07/10 | | $ | 280 | | $ | 287,206 |
4.875% | | 01/17/17 | | | 845 | | | 866,862 |
Federal Home Loan Bank |
3.625% | | 12/17/10 | | | 215 | | | 215,028 |
4.375% | | 10/03/08 | | | 7,925 | | | 7,921,743 |
4.50% | | 10/09/09 | | | 4,715 | | | 4,787,785 |
4.75% | | 06/11/08-04/24/09 | | | 11,175 | | | 11,227,467 |
5.00% | | 10/16/09 | | | 10,270 | | | 10,332,493 |
Federal Home Loan Mortgage Corp. |
4.75% | | 01/18/11 | | | 180 | | | 185,774 |
5.125%(b) | | 11/17/17 | | | 8,210 | | | 8,566,651 |
5.25% | | 07/18/11 | | | 3,100 | | | 3,257,709 |
Federal National Mortgage Association |
5.00% | | 03/15/16 | | | 2,485 | | | 2,596,835 |
6.125% | | 03/15/12 | | | 1,220 | | | 1,325,454 |
Tennessee Valley Authority, |
Series B 5.88% | | 04/01/36 | | | 85 | | | 97,632 |
| | | | | | | |
|
|
| | | | | | | | | 51,668,639 |
| | | | | | | |
|
|
U.S. Treasury Securities — 2.9% |
United States Treasury Bonds |
4.75%(b) | | 02/15/37 | | | 10,616 | | | 11,110,303 |
6.625% | | 02/15/27 | | | 1,015 | | | 1,288,178 |
7.875%(b) | | 02/15/21 | | | 1,900 | | | 2,555,500 |
8.125%(b)(c) | | 05/15/21-08/15/21 | | | 2,395 | | | 3,292,105 |
8.875%(b) | | 08/15/17 | | | 3,350 | | | 4,609,392 |
United States Treasury Inflation Index |
0.875%(b) | | 04/15/10 | | | 1,764 | | | 1,758,569 |
1.625% | | 01/15/15 | | | 1,209 | | | 1,213,841 |
1.875% | | 07/15/13-07/15/15 | | | 2,355 | | | 2,415,065 |
2.00%(b) | | 01/15/14-01/15/26 | | | 5,691 | | | 5,795,365 |
2.375% | | 04/15/11-01/15/27 | | | 3,473 | | | 3,646,670 |
2.50% | | 07/15/16 | | | 1,024 | | | 1,092,176 |
2.625% | | 07/15/17 | | | 454 | | | 489,442 |
3.00% | | 07/15/12 | | | 1,389 | | | 1,503,869 |
3.375% | | 01/15/12-04/15/32 | | | 730 | | | 858,493 |
3.50% | | 01/15/11 | | | 732 | | | 787,499 |
3.625% | | 04/15/28 | | | 1,072 | | | 1,358,241 |
3.875% | | 01/15/09-04/15/29 | | | 2,201 | | | 2,629,674 |
4.25% | | 01/15/10 | | | 745 | | | 795,004 |
United States Treasury Notes |
3.375% | | 09/15/09 | | | 420 | | | 422,198 |
4.25% | | 11/15/17 | | | 605 | | | 615,540 |
4.75% | | 02/15/10 | | | 3,220 | | | 3,331,190 |
4.875%(b) | | 08/15/16 | | | 11,770 | | | 12,533,215 |
United States Treasury Strips |
Zero | | 02/15/19-11/15/21 | | | 27,610 | | | 15,497,639 |
| | | | | | | |
|
|
| | | | | | | | | 79,599,168 |
| | | | | | | |
|
|
TOTAL LONG-TERM BONDS
(cost $976,561,516) | | | 977,581,010 |
| | | | | | | |
|
|
TOTAL LONG-TERM INVESTMENTS
(cost $1,933,442,770) | | | 2,377,542,177 |
| | | | | | | |
|
|
SEE NOTES TO FINANCIAL STATEMENTS.
A33
| | | | |
| | | CONSERVATIVE BALANCED PORTFOLIO (Continued) | | |
SCHEDULE OF INVESTMENTS | December 31, 2007 |
| | | | | | | | | |
Description
| | Maturity
Date
| | Principal
Amount
(000)
| | Value
(Note 2)
| |
| | | | | | | | | | |
| SHORT-TERM INVESTMENTS — 27.7% | |
U.S. Treasury Security — 0.3% | |
United States Treasury Bills(c)(f)
(cost $7,054,793) | | | | | | | | | |
2.90% | | 03/20/08 | | $ | 7,100 | | $ | 7,051,542 | |
| | | | | | | |
|
|
|
| | | |
| | | | | Shares
| | | |
Affiliated Mutual Funds — 27.4% | |
Dryden Core Investment Fund — Dryden Short-Term Bond Series(i)
(cost $154,777,278) | | | | | 15,510,033 | | | 146,414,713 | |
Dryden Core Investment Fund — Taxable Money Market Series (cost $600,361,400; includes $241,495,833 of cash collateral received for securities on loan)(h)(i) | | | | | 600,361,400 | | | 600,361,400 | |
| | | | | | | |
|
|
|
TOTAL AFFILIATED MUTUAL FUNDS
(cost $755,138,678) | | | | | | | | 746,776,113 | |
| | | | | | | |
|
|
|
TOTAL SHORT-TERM INVESTMENTS
(cost $762,193,471) | | | | | | | | 753,827,655 | |
| | | | | | | |
|
|
|
TOTAL INVESTMENTS — 115.0%
(cost $2,695,636,241) | | | 3,131,369,832 | |
| | | | | | | |
|
|
|
LIABILITIES IN EXCESS OF
OTHER ASSETS(k) — (15.0%) | | | (409,517,752 | ) |
| | | | | | | |
|
|
|
TOTAL NET ASSETS — 100.0% | | $ | 2,721,852,080 | |
| | | | | | | |
|
|
|
The following abbreviations are used in portfolio descriptions:
| | |
| 144A | | Security was purchased pursuant to Rule 144A under the Securities Act of 1933 and may not be resold subject to that rule except to qualified institutional buyers. Unless otherwise noted, 144A securities are deemed to be liquid. |
| I/O | | Interest Only |
| M.T.N. | | Medium Term Note |
| TBA | | To Be Announced |
| (a) | Non-income producing security. |
| (b) | All or portion of security is on loan. The aggregate market value of such securities is $232,883,257; cash collateral of $241,495,833 (included in liabilities) was received with which the Portfolio purchased highly liquid short-term investments. |
| (c) | Security segregated as collateral for futures contracts. |
| (d) | Standard & Poor’s rating. |
| (e) | Increase/decrease in rate variable upon increase/decrease in Moody’s or Standard & Poor’s rating. |
| (f) | Rate quoted represents yield-to-maturity as of purchase date. |
| (g) | Indicates a variable rate security. |
| (h) | Represents security, or a portion thereof, purchased with cash collateral for securities on loan. |
| (i) | Prudential Investments LLC, the manager of the Portfolio, also serves as manager of the Dryden Core Investment Fund—Taxable Money Market Series and Dryden Core Investment Fund – Short-Term Bond Series. |
| (j) | Indicates a security that has been deemed illiquid. |
| (k) | Liabilities in excess of other assets include unrealized appreciation (depreciation) on financial futures, interest rate swaps and credit default swaps as follows: |
Open futures contracts outstanding at December 31, 2007:
| | | | | | | | | | | | | | |
Number of
Contracts
| | Type
| | Expiration
Date
| | Value at
Trade Date
| | Value at
December 31, 2007
| | Unrealized
Appreciation/
(Depreciation)
| |
| Long Positions: | | | | | | | | | | | | | | |
| 15 | | U.S. Treasury 2 Yr. Notes | | Mar. 2008 | | $ | 3,143,846 | | $ | 3,153,750 | | $ | 9,904 | |
| 969 | | U.S. Treasury 5 Yr. Notes | | Mar. 2008 | | | 106,705,711 | | | 106,862,531 | | | 156,820 | |
| 225 | | U.S. Treasury 10 Yr. Notes | | Mar. 2008 | | | 25,467,997 | | | 25,512,891 | | | 44,894 | |
| 150 | | U.S. Treasury 30 Yr. Bond | | Mar. 2008 | | | 17,417,169 | | | 17,456,250 | | | 39,081 | |
| 300 | | S&P 500 Index | | Mar. 2008 | | | 111,610,571 | | | 110,790,000 | | | (820,571 | ) |
| | | | | | | | | | | | |
|
|
|
| | | | | | | | | | | | | $ | (569,872 | ) |
| | | | | | | | | | | | |
|
|
|
SEE NOTES TO FINANCIAL STATEMENTS.
A34
| | | | |
| | | CONSERVATIVE BALANCED PORTFOLIO (Continued) | | |
SCHEDULE OF INVESTMENTS | December 31, 2007 |
Interest rate swap agreements outstanding at December 31, 2007:
| | | | | | | | | | | | | |
Counterparty
| | Termination
Date
| | Notional
Amount
(000)
| | Fixed
Rate
| | | Floating Rate
| | Unrealized
Appreciation/
(Depreciation)
| |
Merrill Lynch Capital Services, Inc.(a) | | 08/14/2012 | | 6,486 | | 5.20857 | % | | 3 month LIBOR | | $ | 372,723 | |
Morgan Stanley Capital Services, Inc.(a) | | 09/12/2012 | | 3,510 | | 4.7357 | % | | 3 month LIBOR | | | 125,760 | |
Morgan Stanley Capital Services, Inc.(a) | | 09/25/2012 | | 3,550 | | 4.94079 | % | | 3 month LIBOR | | | 161,785 | |
Morgan Stanley Capital Services, Inc.(a) | | 10/23/2012 | | 4,680 | | 4.7945 | % | | 3 month LIBOR | | | 123,012 | |
Morgan Stanley Capital Services, Inc.(a) | | 12/07/2012 | | 3,250 | | 4.15033 | % | | 3 month LIBOR | | | 2,563 | |
Morgan Stanley Capital Services, Inc.(a) | | 12/13/2012 | | 3,500 | | 4.34666 | % | | 3 month LIBOR | | | 30,891 | |
Merrill Lynch Capital Services, Inc.(b) | | 12/14/2012 | | 4,930 | | 4.35284 | % | | 3 month LIBOR | | | (47,467 | ) |
Morgan Stanley Capital Services, Inc.(b) | | 12/11/2037 | | 1,650 | | 5.08438 | % | | 3 month LIBOR | | | (19,881 | ) |
Merrill Lynch Capital Services, Inc.(b) | | 12/11/2037 | | 4,075 | | 5.08938 | % | | 3 month LIBOR | | | (62,994 | ) |
| | | | | | | | | | | |
|
|
|
| | | | | | | | | | | | $ | 686,392 | |
| | | | | | | | | | | |
|
|
|
| (a) | Portfolio pays the floating rate and receives the fixed rate. |
| (b) | Portfolio pays the fixed rate and receives the floating rate. |
Credit default swap agreements outstanding at December 31, 2007:
| | | | | | | | | | | | | |
Counterparty
| | Termination
Date
| | Notional
Amount
(000)
| | Fixed
Rate
| | | Reference Entity/Obligation
| | Unrealized
Appreciation/
(Depreciation)
| |
JPMorgan Chase Bank(a) | | 06/20/2012 | | 3,500 | | 0.30 | % | | PPG Industries, Inc.,
7.05%, 08/15/09 | | $ | 1,425 | |
JPMorgan Chase Bank(a) | | 09/20/2012 | | 2,190 | | 1.52 | % | | Residential Capital LLC, 6.50%, 04/17/13 | | | 1,031,268 | |
Citibank NA(a) | | 09/20/2012 | | 3,200 | | 0.32 | % | | Altria Group, Inc.,
7.00%, 11/04/13 | | | (1,398 | ) |
Morgan Stanley Capital Services, Inc.(a) | | 09/20/2012 | | 2,600 | | 0.45 | % | | Sara Lee Corp.,
6.125%, 11/01/32 | | | (15,867 | ) |
Barclays Bank PLC(a) | | 09/20/2012 | | 2,800 | | 0.595 | % | | Fortune Brands, Inc.,
6.25%, 04/01/08 | | | 25,934 | |
JPMorgan Chase Bank(a) | | 06/20/2014 | | 1,110 | | 0.65 | % | | Bunge Ltd. Finance Corp., 5.35%, 04/15/14 | | | (767 | ) |
Credit Suisse International(a) | | 09/20/2017 | | 2,750 | | 0.99 | % | | Gannett Co., Inc.,
6.375%, 04/01/12 | | | 19,987 | |
Citibank NA(a) | | 03/25/2035 | | 1,000 | | 3.00 | % | | Centex Home Equity,
6.215%, 03/25/35 | | | (1,250 | ) |
Citibank NA(a) | | 03/25/2035 | | 1,000 | | 3.00 | % | | Morgan Stanley ABS Capital I, 6.765%, 01/25/35 | | | (1,500 | ) |
Barclays Bank PLC(a) | | 09/25/2035 | | 1,000 | | 3.35 | % | | Accredited Mortgage Loan Trust,
7.02%, 09/25/35 | | | 460,932 | |
Merrill Lynch Capital Services, Inc.(b) | | 03/25/2036 | | 1,000 | | 3.72 | % | | AmeriQuest Mortgage Securities, Inc.,
7.82%, 03/25/36 | | | 744,827 | |
Merrill Lynch Capital Services, Inc.(a) | | 03/25/2036 | | 1,000 | | 9.00 | % | | AmeriQuest Mortgage Securities Inc.,
7.82%, 03/25/36 | | | (654,500 | ) |
| | | | | | | | | | | |
|
|
|
| | | | | | | | | | | | $ | 1,609,091 | |
| | | | | | | | | | | |
|
|
|
| (a) | The Portfolio pays the fixed rate and receives from the counterparty par in the event that the underlying bond defaults. |
| (b) | The Portfolio receives the fixed rate and pays the counterparty par in the event that the underlying bond defaults. |
SEE NOTES TO FINANCIAL STATEMENTS.
A35
| | | | |
| | | CONSERVATIVE BALANCED PORTFOLIO (Continued) | | |
SCHEDULE OF INVESTMENTS | December 31, 2007 |
The industry classification of portfolio holdings and liabilities in excess of other assets shown as a percentage of net assets as of December 31, 2007 were as follows:
| | | |
Affiliated Mutual Funds (including 8.9% of collateral received for securities on loan) | | 27.4 | % |
Mortgage Backed Securities | | 15.2 | |
Oil, Gas & Consumable Fuels | | 5.1 | |
Commercial Mortgage Backed Securities | | 4.6 | |
U.S. Treasury Securities | | 3.2 | |
Pharmaceuticals | | 3.1 | |
Commercial Banks | | 2.5 | |
Insurance | | 2.5 | |
Diversified Financial Services | | 2.1 | |
Computers & Peripherals | | 2.0 | |
U.S. Government Agency Obligations | | 1.9 | |
Capital Markets | | 1.7 | |
Diversified Telecommunication Services | | 1.7 | |
Industrial Conglomerates | | 1.7 | |
Software | | 1.7 | |
Aerospace & Defense | | 1.5 | |
Communications Equipment | | 1.3 | |
Media | | 1.3 | |
Asset Backed Securities | | 1.2 | |
Electric Utilities | | 1.2 | |
Energy Equipment & Services | | 1.2 | |
Food & Staples Retailing | | 1.2 | |
Semiconductors & Semiconductor Equipment | | 1.2 | |
Beverages | | 1.1 | |
Chemicals | | 1.1 | |
Healthcare Providers & Services | | 1.1 | |
Household Products | | 1.1 | |
Electric | | 1.0 | |
Machinery | | 1.0 | |
Food Products | | 0.9 | |
Metals & Mining | | 0.9 | |
Telecommunications | | 0.9 | |
Healthcare Equipment & Supplies | | 0.8 | |
Internet Software & Services | | 0.8 | |
Tobacco | | 0.8 | |
Banking | | 0.7 | |
Collateralized Mortgage Obligations | | 0.7 | |
Healthcare & Pharmaceutical | | 0.7 | |
Real Estate Investment Trust | | 0.7 | |
Specialty Retail | | 0.7 | |
Brokerage | | 0.6 | |
Foods | | 0.6 | |
Hotels, Restaurants & Leisure | | 0.6 | |
Multi-Utilities | | 0.6 | |
Biotechnology | | 0.5 | |
Air Freight & Logistics | | 0.4 | |
Automobiles | | 0.4 | |
Capital Goods | | 0.4 | |
Consumer Finance | | 0.4 | |
Electrical Equipment | | 0.4 | |
IT Services | | 0.4 | |
Multiline Retail | | 0.4 | |
Wireless Telecommunication Services | | 0.4 | |
Airlines | | 0.3 | |
Cable | | 0.3 | |
Healthcare Insurance | | 0.3 | |
Household Durables | | 0.3 | |
Media & Entertainment | | 0.3 | |
SEE NOTES TO FINANCIAL STATEMENTS.
A36
| | | | |
| | | CONSERVATIVE BALANCED PORTFOLIO (Continued) | | |
SCHEDULE OF INVESTMENTS | December 31, 2007 |
| | | |
Non Captive Finance | | 0.3 | % |
Pipelines & Other | | 0.3 | |
Road & Rail | | 0.3 | |
Technology | | 0.3 | |
Thrifts & Mortgage Finance | | 0.3 | |
Auto Components | | 0.2 | |
Building Materials & Construction | | 0.2 | |
Building Products | | 0.2 | |
Commercial Services & Supplies | | 0.2 | |
Electronic Equipment & Instruments | | 0.2 | |
Energy – Other | | 0.2 | |
Foreign Government Bonds | | 0.2 | |
Internet & Catalog Retail | | 0.2 | |
Life Sciences Tools & Services | | 0.2 | |
Railroads | | 0.2 | |
Retailers | | 0.2 | |
Sovereign | | 0.2 | |
Textiles, Apparel & Luxury Goods | | 0.2 | |
Trading Companies & Distributors | | 0.2 | |
Automotive | | 0.1 | |
Construction & Engineering | | 0.1 | |
Construction Materials | | 0.1 | |
Distributors | | 0.1 | |
Diversified Consumer Services | | 0.1 | |
Energy – Integrated | | 0.1 | |
Gas Utilities | | 0.1 | |
Independent Power Producers & Energy Traders | | 0.1 | |
Leisure Equipment & Products | | 0.1 | |
Marine | | 0.1 | |
Metals | | 0.1 | |
Office Electronics | | 0.1 | |
Paper & Forest Products | | 0.1 | |
Personal Products | | 0.1 | |
Real Estate Management & Development | | 0.1 | |
Structured Notes | | 0.1 | |
| | |
|
|
| | | 115.0 | |
Liabilities in excess of other assets | | (15.0 | ) |
| | |
|
|
| | | 100.0 | % |
| | |
|
|
SEE NOTES TO FINANCIAL STATEMENTS.
A37
| | | | |
| | | CONSERVATIVE BALANCED PORTFOLIO (Continued) | | |
STATEMENT OF ASSETS AND LIABILITIES
December 31, 2007
| | | |
| ASSETS | | | |
Investments, at value including securities on loan of $232,883,257: | | | |
Unaffiliated investments (cost $1,940,497,563) | | $ | 2,384,593,719 |
Affiliated investments (cost $755,138,678) | | | 746,776,113 |
Cash | | | 165,829 |
Foreign currency, at value (cost $21,242) | | | 21,464 |
Receivable for investments sold | | | 49,039,288 |
Dividends and interest receivable | | | 9,905,825 |
Unrealized appreciation on swaps | | | 3,101,107 |
Premium for swaps purchased | | | 590,000 |
Receivable for Series shares sold | | | 312,337 |
Foreign tax reclaim receivable | | | 212,268 |
Prepaid expenses | | | 30,257 |
| | |
|
|
Total Assets | | | 3,194,748,207 |
| | |
|
|
| LIABILITIES | | | |
Collateral for securities on loan | | | 241,495,833 |
Payable for investments purchased | | | 228,417,844 |
Management fee payable | | | 1,273,758 |
Unrealized depreciation on swaps | | | 805,624 |
Accrued expenses and other liabilities | | | 361,753 |
Payable for Series shares repurchased | | | 326,852 |
Due to broker—variation margin | | | 121,465 |
Payable to custodian | | | 92,369 |
Transfer agent fee payable | | | 629 |
| | |
|
|
Total Liabilities | | | 472,896,127 |
| | |
|
|
| NET ASSETS | | $ | 2,721,852,080 |
| | |
|
|
Net assets were comprised of: | | | |
Paid-in capital | | $ | 2,241,152,474 |
Retained earnings | | | 480,699,606 |
| | |
|
|
Net assets, December 31, 2007 | | $ | 2,721,852,080 |
| | |
|
|
Net asset value and redemption price per share, $2,721,852,080 / 163,109,835 outstanding shares of beneficial interest (authorized 525,000,000 shares) | | $ | 16.69 |
| | |
|
|
STATEMENT OF OPERATIONS
Year Ended December 31, 2007
| | | | |
| INVESTMENT INCOME | | | | |
Interest | | $ | 39,962,768 | |
Unaffiliated dividend income (net of foreign withholding taxes of $645,661) | | | 31,503,942 | |
Affiliated dividend income | | | 26,021,881 | |
Affiliated income from securities loaned, net | | | 537,541 | |
| | |
|
|
|
| | | | 98,026,132 | |
| | |
|
|
|
| EXPENSES | | | | |
Management fee | | | 15,239,010 | |
Custodian’s fees and expenses | | | 474,000 | |
Shareholders’ reports | | | 290,000 | |
Insurance expenses | | | 60,000 | |
Trustees’ fees | | | 46,000 | |
Audit fee | | | 24,000 | |
Interest expense | | | 20,128 | |
Legal fees and expenses | | | 15,000 | |
Commitment fee on syndicated credit agreement | | | 9,000 | |
Transfer agent’s fee and expenses (including affiliated expense of $3,000) (Note 4) | | | 3,000 | |
Miscellaneous | | | 34,279 | |
| | |
|
|
|
Total expenses | | | 16,214,417 | |
| | |
|
|
|
| NET INVESTMENT INCOME | | | 81,811,715 | |
| | |
|
|
|
| NET REALIZED AND UNREALIZED GAIN (LOSS) ON INVESTMENTS, SWAPS AND FOREIGN CURRENCIES | | | | |
Net realized gain (loss) on: | | | | |
Investment transactions | | | 73,478,627 | |
Short sale transactions | | | (86,484 | ) |
Futures transactions | | | 10,360,031 | |
Swap agreement transactions | | | 7,452,989 | |
Options written transactions | | | (75,988 | ) |
Foreign currency transactions | | | (10,876 | ) |
| | |
|
|
|
| | | | 91,118,299 | |
| | |
|
|
|
Net change in unrealized appreciation (depreciation) on: | | | | |
Investments | | | (11,397,618 | ) |
Futures | | | 286,234 | |
Swaps | | | 2,317,152 | |
Foreign currencies | | | 9,039 | |
| | |
|
|
|
| | | | (8,785,193 | ) |
| | |
|
|
|
| NET GAIN ON INVESTMENTS, SWAPS AND FOREIGN CURRENCIES | | | 82,333,106 | |
| | |
|
|
|
| NET INCREASE IN NET ASSETS RESULTING FROM OPERATIONS | | $ | 164,144,821 | |
| | |
|
|
|
STATEMENT OF CHANGES IN NET ASSETS
| | | | | | | | |
| | | Year Ended December 31,
| |
| | | 2007
| | | 2006
| |
| INCREASE (DECREASE) IN NET ASSETS | | | | | | | | |
| OPERATIONS: | | | | | | | | |
Net investment income | | $ | 81,811,715 | | | $ | 80,839,902 | |
Net realized gain (loss) on investment, swap agreement and foreign currency transactions | | | 91,118,299 | | | | (105,478,541 | ) |
Net change in unrealized appreciation (depreciation) on investments, swaps and foreign currencies | | | (8,785,193 | ) | | | 295,289,511 | |
| | |
|
|
| |
|
|
|
NET INCREASE IN NET ASSETS RESULTING FROM OPERATIONS | | | 164,144,821 | | | | 270,650,872 | |
| | |
|
|
| |
|
|
|
| DISTRIBUTIONS | | | (80,805,076 | ) | | | (75,726,414 | ) |
| SERIES SHARE TRANSACTIONS: | | | | | | | | |
Series shares sold [894,544 and 1,557,565 shares, respectively] | | | 14,946,386 | | | | 23,668,066 | |
Series shares issued in reinvestment of distributions [4,870,710 and 5,014,994 shares, respectively] | | | 80,805,076 | | | | 75,726,414 | |
Series shares repurchased [13,534,553 and 17,938,730 shares, respectively] | | | (227,819,116 | ) | | | (273,531,887 | ) |
| | |
|
|
| |
|
|
|
NET DECREASE IN NET ASSETS RESULTING FROM SERIES SHARE TRANSACTIONS | | | (132,067,654 | ) | | | (174,137,407 | ) |
| | |
|
|
| |
|
|
|
| TOTAL INCREASE (DECREASE) IN NET ASSETS | | | (48,727,909 | ) | | | 20,787,051 | |
| NET ASSETS: | | | | | | | | |
Beginning of year | | | 2,770,579,989 | | | | 2,749,792,938 | |
| | |
|
|
| |
|
|
|
End of year | | $ | 2,721,852,080 | | | $ | 2,770,579,989 | |
| | |
|
|
| |
|
|
|
SEE NOTES TO FINANCIAL STATEMENTS.
A38
| | | | |
| | | DIVERSIFIED BOND PORTFOLIO | | |
SCHEDULE OF INVESTMENTS | December 31, 2007 |
| | | | | | | | | | | | |
LONG-TERM INVESTMENTS — 97.4% LONG-TERM BONDS — 91.8% | | Moody’s
Rating
(Unaudited)
| | Interest
Rate
| | Maturity
Date
| | Principal
Amount
(000)#
| | Value
(Note 2)
|
| | | | | | | | | | | | | |
Airlines — 1.4% | | | | | | | | | | | | |
American Airlines, Inc., Pass-Thru Certificates, Series 2001-1(a) | | Ba1 | | 6.817% | | 05/23/11 | | $ | 2,750 | | $ | 2,664,062 |
Continental Airlines, Inc., Pass-Thru Certificates, Series 2000-1, Class A-1 | | Ba1 | | 7.373% | | 12/15/15 | | | 1,134 | | | 1,091,384 |
Continental Airlines, Inc., Pass-Thru Certificates, Series A(a) | | Baa1 | | 5.983% | | 04/19/22 | | | 1,850 | | | 1,728,992 |
Continental Airlines, Inc., Series 2000-1, Class A-1 | | Baa2 | | 6.703% | | 06/15/21 | | | 3 | | | 3,179 |
Continental Airlines, Inc., Series 2000-1, Class A-1 | | Baa2 | | 7.487% | | 10/02/10 | | | 7,954 | | | 8,033,539 |
Delta Air Lines, Inc., Pass-Thru Certificates, 144A(a) | | Baa1 | | 6.821% | | 08/10/22 | | | 1,855 | | | 1,753,161 |
United Airlines, Inc., Pass-Thru Certificates, Series 2007-1, Class A | | Baa2 | | 6.636% | | 07/02/22 | | | 1,300 | | | 1,220,700 |
| | | | | | | | | | | |
|
|
| | | | | | | | | | | | | 16,495,017 |
| | | | | | | | | | | |
|
|
Asset-Backed Securities — 3.6% | | | | | | | | | | | | |
American Express Credit Account Master Trust, Series 2004-C, Class C, 144A(g) | | Baa1 | | 5.527% | | 02/15/12 | | | 634 | | | 634,273 |
AmeriQuest Mortgage Securities, Inc., Series 2001-2, Class M3(g) | | Baa2 | | 7.79% | | 10/25/31 | | | 725 | | | 599,817 |
AmeriQuest Mortgage Securities, Inc., Series 2003-AR3, Class M6(g)(h) | | Baa3 | | 7.835% | | 10/25/33 | | | 1,600 | | | 352,630 |
Amortizing Residential Collateral Trust, Series 2002-BC7, Class M2(g) | | BB(f) | | 6.215% | | 10/25/32 | | | 148 | | | 80,153 |
Bank of America Credit Card Trust, Series 2006-C5, Class C5(g) | | Baa2 | | 5.428% | | 01/15/16 | | | 5,750 | | | 5,324,980 |
Bank One Issuance Trust, Series 2003-C1, Class C1 | | Baa2 | | 4.54% | | 09/15/10 | | | 2,980 | | | 2,979,791 |
CDC Mortgage Capital Trust, Series 2002-HE3, Class M2(g) | | Ba3 | | 8.24% | | 03/25/33 | | | 370 | | | 100,247 |
Centex Home Equity, Asset-Backed Certificates, Series 2005-A, Class M4(g) | | A1 | | 5.665% | | 01/25/35 | | | 2,400 | | | 2,048,274 |
Citibank Credit Card Issuance Trust, Series 2003-C4, Class C-4 | | Baa2 | | 5.00% | | 06/10/15 | | | 6,500 | | | 6,113,335 |
Citigroup Mortgage Loan Trust, Inc., Series 2004-RES1, Class M3(g) | | Aa3 | | 5.585% | | 11/25/34 | | | 1,240 | | | 1,061,877 |
Countrywide Asset-Backed Certificates, Series 2002-BC3, Class M2(g) | | Baa1 | | 6.59% | | 05/25/32 | | | 1,907 | | | 1,162,292 |
Countrywide Asset-Backed Certificates, Series 2004-12, Class MV3(g) | | Aa3 | | 5.525% | | 03/25/35 | | | 2,670 | | | 2,487,389 |
CS First Boston Mortgage Securities Corp., Series 2002-HE4, Class M2(g) | | Baa3 | | 7.115% | | 08/25/32 | | | 201 | | | 79,363 |
Equity One ABS, Inc., Series 2004-3, Class M1 | | Aa2 | | 5.70% | | 07/25/34 | | | 2,100 | | | 1,929,980 |
First Franklin Mortgage Loan Asset-Backed Certificates, Series 2005-FF6, Class M2(g) | | Aa2 | | 5.305% | | 05/25/36 | | | 2,575 | | | 2,343,883 |
Ford Credit Auto Owner Trust, Series 2006-B, Class C | | Baa1 | | 5.68% | | 06/15/12 | | | 2,100 | | | 2,087,853 |
Fremont Home Loan Trust, Series 2003-B, Class M1(g) | | Aa1 | | 5.565% | | 12/25/33 | | | 499 | | | 473,699 |
IXIS Real Estate Capital Trust, Series 2006-HE1, Class A4(g) | | Aaa | | 5.165% | | 03/25/36 | | | 3,200 | | | 2,902,881 |
Morgan Stanley ABS Capital I, Series 2002-NC6, Class M2(g) | | A2 | | 8.015% | | 11/25/32 | | | 174 | | | 47,442 |
Morgan Stanley ABS Capital I, Series 2003-HE1, Class M1(g) | | Aa2 | | 5.665% | | 05/25/33 | | | 2,187 | | | 1,968,607 |
New Century Home Equity Loan Trust, Series 2004-4, Class M1(g) | | Aa1 | | 5.375% | | 02/25/35 | | | 3,680 | | | 3,316,011 |
Residential Asset Mortgage Products, Inc., Series 2004-RS12, Class MII2(g)(h) | | Aa3 | | 5.665% | | 12/25/34 | | | 2,100 | | | 1,815,789 |
Saxon Asset Securities Trust, Series 2002-3, Class M1(g) | | Aaa | | 5.615% | | 12/25/32 | | | 1,469 | | | 1,428,948 |
Securitized Asset Backed Receivables LLC Trust, Series 2006-FR1, Class M1(g) | | Aa2 | | 5.265% | | 11/25/35 | | | 2,000 | | | 1,444,655 |
Structured Asset Securities Corp., Series 2002-HF2, Class M3(g)(h) | | BBB(f) | | 6.865% | | 07/25/32 | | | 1,345 | | | 535,531 |
| | | | | | | | | | | |
|
|
| | | | | | | | | | | | | 43,319,700 |
| | | | | | | | | | | |
|
|
Automotive — 0.3% | | | | | | | | | | | | |
Ford Motor Credit Co. | | B1 | | 6.625% | | 06/16/08 | | | 3,500 | | | 3,449,005 |
| | | | | | | | | | | |
|
|
Banking — 3.3% | | | | | | | | | | | | |
Alfa MTN Markets Ltd. for ABH Financial Ltd. (Cypress), 144A | | Ba1 | | 8.20% | | 06/25/12 | | | 2,000 | | | 1,870,000 |
Banco ABN Amro Real SA (Cayman Islands), 144A | | NR | | 16.20% | | 02/22/10 | | B | RL4,000 | | | 2,410,112 |
Chuo Mitsui Trust & Banking Co. Ltd. (Japan), 144A(g) | | A2 | | 5.506% | | 12/29/49 | | | 3,050 | | | 2,804,445 |
Depfa ACS Bank (Ireland), 144A | | Aaa | | 5.125% | | 03/16/37 | | | 3,065 | | | 3,029,517 |
Dresdner Kleinwort Wasserstein for CJSC (The) (Ukraine) | | Ba2 | | 7.75% | | 09/23/09 | | | 1,400 | | | 1,417,080 |
HSBK Europe BV (Netherlands), 144A | | Baa3 | | 7.25% | | 05/03/17 | | | 2,230 | | | 1,940,100 |
ICICI Bank Ltd. (India), 144A(a)(g) | | Baa2 | | 7.25% | | 12/31/49 | | | 2,380 | | | 2,154,014 |
ICICI Bank Ltd. (Singapore), 144A | | Baa2 | | 5.75% | | 11/16/10 | | | 2,500 | | | 2,479,998 |
SEE NOTES TO FINANCIAL STATEMENTS.
A39
| | | | |
| | | DIVERSIFIED BOND PORTFOLIO (Continued) | | |
SCHEDULE OF INVESTMENTS | December 31, 2007 |
| | | | | | | | | | | | |
LONG-TERM BONDS
(continued) | | Moody’s
Rating
(Unaudited)
| | Interest
Rate
| | Maturity
Date
| | Principal
Amount
(000)#
| | Value
(Note 2)
|
| | | | | | | | | | | | | |
Banking (continued) | | | | | | | | | | | | |
Kazkommerts International BV (Netherlands), 144A | | Ba1 | | 7.875% | | 04/07/14 | | | 2,610 | | $ | 2,225,025 |
Kazkommerts International BV (Netherlands), 144A | | Ba1 | | 8.00% | | 11/03/15 | | | 1,360 | | | 1,114,928 |
KBC Bank Funding Trust III, 144A(g) | | A1 | | 9.86% | | 11/29/49 | | | 5,000 | | | 5,371,560 |
Krung Thai Bank PCL (Thailand)(g) | | Baa3 | | 7.378% | | 12/31/49 | | | 1,590 | | | 1,489,520 |
Northern Rock PLC (United Kingdom), 144A(a)(g)(h) | | B3 | | 6.594% | | 12/31/49 | | | 920 | | | 570,400 |
Resona Bank Ltd., 144A(a)(g) | | A2 | | 5.85% | | 09/29/49 | | | 2,900 | | | 2,695,991 |
Russian Standard Finance Bank SA, 144A | | Ba2 | | 7.50% | | 10/07/10 | | | 3,000 | | | 2,685,000 |
Sumitomo Mitsui Banking Corp. (Japan), 144A(a)(g) | | Aa3 | | 5.625% | | 07/29/49 | | | 6,380 | | | 5,957,247 |
| | | | | | | | | | | |
|
|
| | | | | | | | | | | | | 40,214,937 |
| | | | | | | | | | | |
|
|
Brokerage — 1.1% | | | | | | | | | | | | |
Goldman Sachs Group, Inc.(a) | | A1 | | 6.45% | | 05/01/36 | | | 1,975 | | | 1,855,499 |
Goldman Sachs Group, Inc. | | A1 | | 6.75% | | 10/01/37 | | | 2,380 | | | 2,331,872 |
Lehman Brothers Holdings, Inc. | | A2 | | 6.50% | | 07/19/17 | | | 1,210 | | | 1,224,347 |
Merrill Lynch & Co., Inc. | | A2 | | 6.11% | | 01/29/37 | | | 2,200 | | | 1,943,018 |
Merrill Lynch & Co., Inc., MTN(a) | | A1 | | 6.05% | | 08/15/12 | | | 1,500 | | | 1,528,793 |
Morgan Stanley, MTN | | Aa3 | | 5.45% | | 01/09/17 | | | 4,435 | | | 4,302,264 |
| | | | | | | | | | | |
|
|
| | | | | | | | | | | | | 13,185,793 |
| | | | | | | | | | | |
|
|
Building Materials & Construction — 0.8% | | | | | | | | | | | | |
American Standard, Inc. | | Baa3 | | 7.625% | | 02/15/10 | | | 3,800 | | | 3,990,251 |
Centex Corp.(a) | | Ba1 | | 6.50% | | 05/01/16 | | | 320 | | | 284,408 |
RPM International, Inc. | | Baa3 | | 4.45% | | 10/15/09 | | | 5,150 | | | 5,100,740 |
Ryland Group, Inc. | | Ba1 | | 5.375% | | 06/01/08 | | | 606 | | | 602,404 |
| | | | | | | | | | | |
|
|
| | | | | | | | | | | | | 9,977,803 |
| | | | | | | | | | | |
|
|
Cable — 0.4% | | | | | | | | | | | | |
AT&T Broadband | | Baa2 | | 9.455% | | 11/15/22 | | | 1,065 | | | 1,354,300 |
TCI Communications, Inc. | | Baa2 | | 7.875% | | 02/15/26 | | | 750 | | | 847,540 |
Time Warner Cable, Inc. | | Baa2 | | 5.40% | | 07/02/12 | | | 1,545 | | | 1,548,105 |
Time Warner Cable, Inc. | | Baa2 | | 5.85% | | 05/01/17 | | | 975 | | | 977,406 |
| | | | | | | | | | | |
|
|
| | | | | | | | | | | | | 4,727,351 |
| | | | | | | | | | | |
|
|
Capital Goods — 0.8% | | | | | | | | | | | | |
Honeywell International, Inc. | | A2 | | 5.70% | | 03/15/37 | | | 370 | | | 365,299 |
Rockwell International Co. | | A2 | | 5.20% | | 01/15/98 | | | 6,500 | | | 5,236,185 |
United Technologies Corp.(a) | | A2 | | 6.05% | | 06/01/36 | | | 2,055 | | | 2,114,361 |
Waste Management, Inc. | | Baa3 | | 7.65% | | 03/15/11 | | | 2,100 | | | 2,301,594 |
| | | | | | | | | | | |
|
|
| | | | | | | | | | | | | 10,017,439 |
| | | | | | | | | | | |
|
|
Chemicals — 1.5% | | | | | | | | | | | | |
Huntsman International LLC | | Ba1 | | 11.625% | | 10/15/10 | | | 2,100 | | | 2,226,000 |
ICI Wilmington, Inc. | | Baa2 | | 4.375% | | 12/01/08 | | | 2,040 | | | 2,037,191 |
Lubrizol Corp. | | Baa3 | | 4.625% | | 10/01/09 | | | 5,600 | | | 5,623,822 |
Lubrizol Corp. | | Baa3 | | 5.875% | | 12/01/08 | | | 550 | | | 552,702 |
Potash Corp. of Saskatchewan (Canada) | | Baa1 | | 5.875% | | 12/01/36 | | | 4,545 | | | 4,197,489 |
Union Carbide Chemical & Plastics Co. | | Ba2 | | 7.875% | | 04/01/23 | | | 3,058 | | | 3,199,751 |
| | | | | | | | | | | |
|
|
| | | | | | | | | | | | | 17,836,955 |
| | | | | | | | | | | |
|
|
Collateralized Mortgage Obligations — 0.6% | | | | | | | | | | | | |
Countrywide Alternative Loan Trust, Series 2004-18CB, Class 3A1 | | Aaa | | 5.25% | | 09/25/19 | | | 2,353 | | | 2,300,285 |
Master Alternative Loan Trust, Series 2004-4, Class 4A1 | | Aaa | | 5.00% | | 04/25/19 | | | 496 | | | 492,866 |
Structured Adjustable Rate Mortgage Loan Trust, Series 2004-1, Class 4A3(g) | | Aaa | | 4.17% | | 02/25/34 | | | 3,209 | | | 3,268,658 |
Washington Mutual Mortgage Pass-Through Certificates, Series 2005-1, Class 3A | | AAA(f) | | 5.00% | | 03/25/20 | | | 1,714 | | | 1,674,896 |
| | | | | | | | | | | |
|
|
| | | | | | | | | | | | | 7,736,705 |
| | | | | | | | | | | |
|
|
Commercial Mortgage-Backed Securities — 8.2% | | | | | | | | | | | | |
Banc of America Commercial Mortgage, Inc., Series 2005-1, Class ASB(g) | | AAA(f) | | 4.85% | | 11/10/42 | | | 5,950 | | | 5,956,888 |
Banc of America Commercial Mortgage, Inc., Series 2006-2, Class A4(g) | | AAA(f) | | 5.74% | | 05/10/45 | | | 9,400 | | | 9,715,381 |
SEE NOTES TO FINANCIAL STATEMENTS.
A40
| | | | |
| | | DIVERSIFIED BOND PORTFOLIO (Continued) | | |
SCHEDULE OF INVESTMENTS | December 31, 2007 |
| | | | | | | | | | | | |
LONG-TERM BONDS
(continued) | | Moody’s
Rating
(Unaudited)
| | Interest
Rate
| | Maturity
Date
| | Principal
Amount
(000)#
| | Value
(Note 2)
|
| | | | | | | | | | | | | |
Commercial Mortgage-Backed Securities (continued) | | | | | | | | | | | | |
Bear Stearns Commercial Mortgage Securities, Inc., Series 2005-T18, Class AAB(g) | | Aaa | | 4.823% | | 02/13/42 | | | 2,475 | | $ | 2,429,515 |
Bear Stearns Commercial Mortgage Securities, Inc., Series 2005-T20, Class AAB(g) | | Aaa | | 5.138% | | 10/12/42 | | | 3,400 | | | 3,401,097 |
Credit Suisse Mortgage Capital Certificates, Series 2006-C5, Class A3 | | Aaa | | 5.311% | | 12/15/39 | | | 2,330 | | | 2,321,897 |
GMAC Commercial Mortgage Securities, Inc., Series 2002-C3, Class A2 | | Aaa | | 4.93% | | 07/10/39 | | | 8,500 | | | 8,522,104 |
Greenwich Capital Commercial Funding Corp., Series 2003-C1, Class A4 | | Aaa | | 4.111% | | 07/05/35 | | | 12,700 | | | 12,239,038 |
JP Morgan Chase Commercial Mortgage Securities Corp., Series 2003-ML1A, Class A2 | | Aaa | | 4.767% | | 03/12/39 | | | 4,969 | | | 4,931,258 |
JP Morgan Chase Commercial Mortgage Securities Corp., Series 2005-CB13, Class A4(g) | | Aaa | | 5.294% | | 01/12/43 | | | 3,275 | | | 3,274,174 |
JP Morgan Chase Commercial Mortgage Securities Corp., Series 2005-LDP2, Class ASB | | Aaa | | 4.659% | | 07/15/42 | | | 9,300 | | | 9,104,072 |
JP Morgan Chase Commercial Mortgage Securities Corp., Series 2005-LDP4, Class A4(g) | | Aaa | | 4.918% | | 10/15/42 | | | 3,700 | | | 3,589,682 |
LB-UBS Commercial Mortgage Trust, Series 2003-C8, Class A3 | | Aaa | | 4.83% | | 11/15/27 | | | 3,375 | | | 3,381,483 |
LB-UBS Commercial Mortgage Trust, Series 2004-C8, Class A6(g) | | Aaa | | 4.799% | | 12/15/29 | | | 4,200 | | | 4,150,594 |
LB-UBS Commercial Mortgage Trust, Series 2006-C4, Class A4(g) | | Aaa | | 5.883% | | 06/15/38 | | | 6,130 | | | 6,397,118 |
Merrill Lynch/Countrywide Commercial Mortgage Trust, Series 2006-2, Class A4(g) | | Aaa | | 5.909% | | 06/12/46 | | | 2,325 | | | 2,426,611 |
PNC Mortgage Acceptance Corp., Series 2001-C1, Class A1 | | Aaa | | 5.91% | | 03/12/34 | | | 2,292 | | | 2,307,865 |
Wachovia Bank Commercial Mortgage Trust, Series 2002-C2, Class A4 | | Aaa | | 4.98% | | 11/15/34 | | | 2,500 | | | 2,509,288 |
Wachovia Bank Commercial Mortgage Trust, Series 2003-C3, Class A2 | | AAA(f) | | 4.867% | | 02/15/35 | | | 7,330 | | | 7,313,045 |
Wachovia Bank Commercial Mortgage Trust, Series 2003-C9, Class A3 | | AAA(f) | | 4.608% | | 12/15/35 | | | 4,750 | | | 4,734,107 |
Wachovia Bank Commercial Mortgage Trust, Series 2005-C18, Class APB | | Aaa | | 4.807% | | 04/15/42 | | | 1,500 | | | 1,474,389 |
| | | | | | | | | | | |
|
|
| | | | | | | | | | | | | 100,179,606 |
| | | | | | | | | | | |
|
|
Consumer — 0.1% | | | | | | | | | | | | |
Realogy Corp., PIK, 144A(a) | | Caa1 | | 11.00% | | 04/15/14 | | | 2,000 | | | 1,390,000 |
| | | | | | | | | | | |
|
|
Electric — 3.0% | | | | | | | | | | | | |
CenterPoint Energy Houston Electric LLC | | Baa2 | | 5.70% | | 03/15/13 | | | 2,950 | | | 2,978,208 |
Consumers Energy Co. | | Baa1 | | 5.375% | | 04/15/13 | | | 1,000 | | | 997,234 |
EDP Finance BV (Netherlands), 144A | | A2 | | 6.00% | | 02/02/18 | | | 1,170 | | | 1,141,143 |
El Paso Electric Co. | | Baa2 | | 6.00% | | 05/15/35 | | | 2,325 | | | 2,173,631 |
Empresa Nacional de Electricidad SA (Chile) | | Baa3 | | 8.35% | | 08/01/13 | | | 625 | | | 708,081 |
Energy East Corp. | | Baa2 | | 6.75% | | 06/15/12 | | | 750 | | | 795,632 |
Energy East Corp. | | Baa2 | | 6.75% | | 09/15/33 | | | 1,150 | | | 1,162,219 |
Enersis SA (Chile) | | Baa3 | | 7.375% | | 01/15/14 | | | 3,700 | | | 3,961,101 |
Exelon Corp. | | Baa1 | | 4.90% | | 06/15/15 | | | 500 | | | 470,659 |
Exelon Generation Co. LLC | | A3 | | 6.20% | | 10/01/17 | | | 1,930 | | | 1,918,090 |
Georgia Power Co., Series B | | A2 | | 5.70% | | 06/01/17 | | | 1,285 | | | 1,319,367 |
Korea East-West Power Co. Ltd. (South Korea), 144A | | A1 | | 4.875% | | 04/21/11 | | | 1,700 | | | 1,707,895 |
NiSource Finance Corp. | | Baa3 | | 5.45% | | 09/15/20 | | | 1,345 | | | 1,203,567 |
Northern States Power Co. | | A2 | | 8.00% | | 08/28/12 | | | 2,800 | | | 3,144,771 |
Orion Power Holdings, Inc. | | B2 | | 12.00% | | 05/01/10 | | | 1,920 | | | 2,092,800 |
Sierra Pacific Power Co., Series P(a) | | Baa3 | | 6.75% | | 07/01/37 | | | 2,325 | | | 2,403,339 |
Southern California Edison Co. | | A3 | | 7.625% | | 01/15/10 | | | 1,100 | | | 1,167,553 |
Texas Competitive Electric Holdings Co. LLC, 144A | | B3 | | 10.25% | | 11/01/15 | | | 2,650 | | | 2,623,500 |
Virginia Electric and Power Co., Series A | | Baa1 | | 6.00% | | 05/15/37 | | | 1,720 | | | 1,682,236 |
Xcel Energy, Inc. | | Baa1 | | 3.40% | | 07/01/08 | | | 1,330 | | | 1,318,103 |
Xcel Energy, Inc. | | Baa1 | | 5.613% | | 04/01/17 | | | 1,947 | | | 1,923,229 |
| | | | | | | | | | | |
|
|
| | | | | | | | | | | | | 36,892,358 |
| | | | | | | | | | | |
|
|
SEE NOTES TO FINANCIAL STATEMENTS.
A41
| | | | |
| | | DIVERSIFIED BOND PORTFOLIO (Continued) | | |
SCHEDULE OF INVESTMENTS | December 31, 2007 |
| | | | | | | | | | | | |
LONG-TERM BONDS
(continued) | | Moody’s
Rating
(Unaudited)
| | Interest
Rate
| | Maturity
Date
| | Principal
Amount
(000)#
| | Value
(Note 2)
|
| | | | | | | | | | | | | |
Emerging Markets — 0.2% | | | | | | | | | | | | |
Alfa Diversified Payment Rights Finance Co., | | | | | | | | | | | | |
Series 1A, Class A, 144A(g) | | Baa3 | | 6.591% | | 03/15/11 | | | 2,480 | | $ | 2,389,983 |
| | | | | | | | | | | |
|
|
Energy – Integrated — 0.2% | | | | | | | | | | | | |
Suncor Energy, Inc. (Canada)(a) | | A3 | | 6.50% | | 06/15/38 | | | 1,900 | | | 2,031,518 |
| | | | | | | | | | | |
|
|
Energy – Other — 1.4% | | | | | | | | | | | | |
EnCana Corp. (Canada) | | Baa2 | | 5.90% | | 12/01/17 | | | 2,500 | | | 2,557,438 |
GS Caltex Corp. (South Korea), 144A | | Baa1 | | 7.75% | | 07/25/11 | | | 3,250 | | | 3,484,444 |
Halliburton Co.(a) | | A2 | | 5.50% | | 10/15/10 | | | 625 | | | 642,470 |
Newfield Exploration Co. | | Ba3 | | 6.625% | | 04/15/16 | | | 320 | | | 313,600 |
Nexen, Inc. (Canada) | | Baa2 | | 6.40% | | 05/15/37 | | | 1,890 | | | 1,886,829 |
Occidental Petroleum Corp., MTN | | A3 | | 4.25% | | 03/15/10 | | | 3,250 | | | 3,231,904 |
Pioneer Natural Resources Co. | | Ba1 | | 6.875% | | 05/01/18 | | | 1,750 | | | 1,692,294 |
Talisman Energy, Inc. (Canada) | | Baa2 | | 6.25% | | 02/01/38 | | | 230 | | | 224,149 |
Transocean, Inc. (Cayman Islands) | | Baa2 | | 6.80% | | 03/15/38 | | | 1,200 | | | 1,224,418 |
Western Oil Sand, Inc. (Canada) | | Baa3 | | 8.375% | | 05/01/12 | | | 1,900 | | | 2,119,081 |
| | | | | | | | | | | |
|
|
| | | | | | | | | | | | | 17,376,627 |
| | | | | | | | | | | |
|
|
Foods — 1.5% | | | | | | | | | | | | |
Cadbury Schweppes US Finance LLC, 144A | | Baa2 | | 3.875% | | 10/01/08 | | | 2,600 | | | 2,584,249 |
Delhaize Group (Belgium) | | Baa3 | | 6.50% | | 06/15/17 | | | 715 | | | 731,464 |
HJ Heinz Co., 144A | | Baa2 | | 6.428% | | 12/01/08 | | | 3,550 | | | 3,614,077 |
Kraft Foods, Inc. | | Baa2 | | 5.625% | | 11/01/11 | | | 860 | | | 879,500 |
Kraft Foods, Inc. | | Baa2 | | 6.125% | | 02/01/18 | | | 2,770 | | | 2,791,177 |
McDonald’s Corp.(a) | | A3 | | 6.30% | | 10/15/37 | | | 1,400 | | | 1,451,852 |
Tyson Foods, Inc. | | Ba1 | | 6.85% | | 04/01/16 | | | 1,000 | | | 1,026,155 |
Tyson Foods, Inc. | | Ba2 | | 8.25% | | 10/01/11 | | | 2,550 | | | 2,770,539 |
Yum! Brands, Inc. | | Baa2 | | 8.875% | | 04/15/11 | | | 1,705 | | | 1,880,661 |
| | | | | | | | | | | |
|
|
| | | | | | | | | | | | | 17,729,674 |
| | | | | | | | | | | |
|
|
Gaming — 0.5% | | | | | | | | | | | | |
Harrah’s Operating Co., Inc. | | Baa3 | | 5.625% | | 06/01/15 | | | 2,500 | | | 1,825,000 |
Mandalay Resorts Group | | B1 | | 9.375% | | 02/15/10 | | | 33 | | | 34,155 |
MGM Mirage, Inc. | | Ba2 | | 6.875% | | 04/01/16 | | | 3,000 | | | 2,827,500 |
Station Casinos, Inc. | | B2 | | 6.00% | | 04/01/12 | | | 1,930 | | | 1,717,700 |
| | | | | | | | | | | |
|
|
| | | | | | | | | | | | | 6,404,355 |
| | | | | | | | | | | |
|
|
Health Care & Pharmaceutical — 1.7% | | | | | | | | | | | | |
Abbott Laboratories(a) | | A1 | | 5.60% | | 11/30/17 | | | 1,950 | | | 2,003,471 |
Accellent, Inc. | | Caa3 | | 10.50% | | 12/01/13 | | | 670 | | | 562,800 |
Alliance Imaging, Inc., Sr. Sub. Notes | | B3 | | 7.25% | | 12/15/12 | | | 1,500 | | | 1,425,000 |
AmerisourceBergen Corp. | | Ba1 | | 5.875% | | 09/15/15 | | | 2,325 | | | 2,281,274 |
Cardinal Health, Inc., 144A | | Baa2 | | 6.30% | | 10/15/16 | | | 265 | | | 271,606 |
Community Health Systems, Inc. | | B3 | | 8.875% | | 07/15/15 | | | 800 | | | 815,000 |
HCA, Inc., MTN | | Caa1 | | 8.70% | | 02/10/10 | | | 1,700 | | | 1,704,432 |
HCA, Inc., PIK(a) | | B2 | | 9.625% | | 11/15/16 | | | 2,200 | | | 2,326,500 |
Hospira, Inc. | | Baa3 | | 5.55% | | 03/30/12 | | | 2,500 | | | 2,542,185 |
Schering-Plough Corp. | | Baa1 | | 5.55% | | 12/01/13 | | | 2,735 | | | 2,767,215 |
Teva Pharmaceutical Finance LLC | | Baa2 | | 6.15% | | 02/01/36 | | | 750 | | | 744,799 |
Wyeth(a)(b) | | A3 | | 5.45% | | 04/01/17 | | | 1,460 | | | 1,476,774 |
Wyeth(b) | | A3 | | 5.95% | | 04/01/37 | | | 2,360 | | | 2,366,261 |
| | | | | | | | | | | |
|
|
| | | | | | | | | | | | | 21,287,317 |
| | | | | | | | | | | |
|
|
Health Care Insurance — 1.5% | | | | | | | | | | | | |
Aetna, Inc. | | A3 | | 6.75% | | 12/15/37 | | | 1,900 | | | 1,895,244 |
Cigna Corp. | | Baa2 | | 5.375% | | 03/15/17 | | | 2,125 | | | 2,034,226 |
Cigna Corp. | | Baa2 | | 6.15% | | 11/15/36 | | | 2,300 | | | 2,133,975 |
Coventry Health Care, Inc.(a) | | Ba1 | | 6.125% | | 01/15/15 | | | 4,025 | | | 4,039,019 |
Health Net, Inc. | | Ba2 | | 6.375% | | 06/01/17 | | | 1,315 | | | 1,282,387 |
UnitedHealthcare Group, Inc., 144A | | A3 | | 6.00% | | 06/15/17 | | | 3,775 | | | 3,812,773 |
Wellpoint, Inc.(a) | | Baa1 | | 5.875% | | 06/15/17 | | | 2,625 | | | 2,642,855 |
| | | | | | | | | | | |
|
|
| | | | | | | | | | | | | 17,840,479 |
| | | | | | | | | | | |
|
|
SEE NOTES TO FINANCIAL STATEMENTS.
A42
| | | | |
| | | DIVERSIFIED BOND PORTFOLIO (Continued) | | |
SCHEDULE OF INVESTMENTS | December 31, 2007 |
| | | | | | | | | | | | |
LONG-TERM BONDS
(continued) | | Moody’s
Rating
(Unaudited)
| | Interest
Rate
| | Maturity
Date
| | Principal
Amount
(000)#
| | Value
(Note 2)
|
| | | | | | | | | | | | | |
Insurance — 1.0% | | | | | | | | | | | | |
Ace INA Holdings, Inc. | | A3 | | 5.70% | | 02/15/17 | | | 1,135 | | $ | 1,124,783 |
Allied World Insurance Holdings Ltd. (Bermuda) | | Baa1 | | 7.50% | | 08/01/16 | | | 1,700 | | | 1,779,023 |
American International Group, Inc.(a) | | Aa2 | | 4.25% | | 05/15/13 | | | 1,820 | | | 1,731,310 |
American International Group, Inc. | | Aa2 | | 5.05% | | 10/01/15 | | | 315 | | | 304,203 |
Axis Capital Holdings Ltd. (Bermuda) | | Baa1 | | 5.75% | | 12/01/14 | | | 3,350 | | | 3,283,746 |
Travelers Cos., Inc., MTN | | A3 | | 6.25% | | 06/15/37 | | | 1,890 | | | 1,830,677 |
XL Capital Ltd. (Cayman Islands)(a)(g) | | Baa2 | | 6.50% | | 12/31/49 | | | 1,880 | | | 1,643,799 |
XL Capital Ltd., Class A (Cayman Islands) | | A3 | | 5.25% | | 09/15/14 | | | 140 | | | 136,139 |
| | | | | | | | | | | |
|
|
| | | | | | | | | | | | | 11,833,680 |
| | | | | | | | | | | |
|
|
Lodging — 0.4% | | | | | | | | | | | | |
Felcore Lodging LP(g) | | Ba3 | | 6.787% | | 12/01/11 | | | 1,800 | | | 1,759,500 |
Royal Caribbean Cruises Ltd. (Liberia), Sr. Notes | | Ba1 | | 8.00% | | 05/15/10 | | | 1,730 | | | 1,788,517 |
Starwood Hotels & Resorts Worldwide, Inc. | | Baa3 | | 6.25% | | 02/15/13 | | | 980 | | | 980,595 |
| | | | | | | | | | | |
|
|
| | | | | | | | | | | | | 4,528,612 |
| | | | | | | | | | | |
|
|
Media & Entertainment — 1.4% | | | | | | | | | | | | |
Clear Channel Communications, Inc. | | Baa3 | | 8.00% | | 11/01/08 | | | 4,720 | | | 4,878,536 |
Dex Media West LLC, Series B | | B1 | | 9.875% | | 08/15/13 | | | 2,560 | | | 2,662,400 |
News America, Inc. | | Baa2 | | 7.625% | | 11/30/28 | | | 1,415 | | | 1,568,035 |
RH Donnelley Corp., 144A | | B3 | | 8.875% | | 10/15/17 | | | 1,600 | | | 1,480,000 |
Thomson Corp. (Canada) | | Baa1 | | 5.75% | | 02/01/08 | | | 2,750 | | | 2,753,136 |
Time Warner, Inc. | | Baa2 | | 5.875% | | 11/15/16 | | | 1,595 | | | 1,585,200 |
Viacom, Inc. | | Baa3 | | 6.75% | | 10/05/37 | | | 720 | | | 714,239 |
Viacom, Inc. | | Baa3 | | 6.875% | | 04/30/36 | | | 1,090 | | | 1,092,971 |
| | | | | | | | | | | |
|
|
| | | | | | | | | | | | | 16,734,517 |
| | | | | | | | | | | |
|
|
Metals — 0.5% | | | | | | | | | | | | |
Russel Metals, Inc., Sr. Notes (Canada) | | Ba2 | | 6.375% | | 03/01/14 | | | 685 | | | 634,481 |
United States Steel Corp. | | Baa3 | | 7.00% | | 02/01/18 | | | 2,000 | | | 1,986,624 |
Xstrata Finance Canada Ltd. (Canada), 144A | | Baa2 | | 5.50% | | 11/16/11 | | | 3,430 | | | 3,489,476 |
| | | | | | | | | | | |
|
|
| | | | | | | | | | | | | 6,110,581 |
| | | | | | | | | | | |
|
|
Non-Captive Finance — 2.3% | | | | | | | | | | | | |
Bosphorus Financial Services Ltd. (Cayman Islands), 144A(g) | | Baa2 | | 6.6688% | | 02/15/12 | | | 2,225 | | | 2,222,998 |
Capital One Financial Corp. | | Baa1 | | 6.15% | | 09/01/16 | | | 700 | | | 621,145 |
CIT Group, Inc. | | A2 | | 5.65% | | 02/13/17 | | | 5,650 | | | 4,959,801 |
Countrywide Financial Corp., MTN | | Baa3 | | 5.80% | | 06/07/12 | | | 1,775 | | | 1,296,636 |
General Electric Capital Australia Funding Pty Ltd. (Australia), MTN | | Aaa | | 6.00% | | 04/15/15 | | AUD | 4,440 | | | 3,434,116 |
Nelnet, Inc.(g) | | Baa3 | | 7.40% | | 09/29/36 | | | 6,500 | | | 6,244,491 |
Preferred Term Securities X, Class A-1 (Cayman Islands), 144A(g)(h) | | Aaa | | 5.92% | | 07/03/33 | | | 3,863 | | | 3,954,015 |
Residential Capital LLC(a) | | Ba3 | | 8.00% | | 04/17/13 | | | 4,270 | | | 2,626,050 |
Residential Capital LLC, MTN | | Ba3 | | 9.375% | | 07/01/14 | | GBP | 2,400 | | | 2,723,147 |
| | | | | | | | | | | |
|
|
| | | | | | | | | | | | | 28,082,399 |
| | | | | | | | | | | |
|
|
Non-Corporate Foreign Agency — 1.2% | | | | | | | | | | | | |
Credit Suisse First Boston International for CJSC (The) (Ukraine) | | Ba2 | | 6.80% | | 10/04/12 | | | 1,400 | | | 1,359,540 |
Gazprom International SA (Luxembourg), 144A | | BBB+(f) | | 7.201% | | 02/01/20 | | | 2,175 | | | 2,205,281 |
Gazprom OAO (Russia) | | A3 | | 10.50% | | 10/21/09 | | | 1,685 | | | 1,822,580 |
National Power Corp. (Philippines), 144A(a)(g) | | BB-(f) | | 9.265% | | 08/23/11 | | | 1,530 | | | 1,659,438 |
Petronas Capital Ltd. (Malaysia), 144A | | A1 | | 7.00% | | 05/22/12 | | | 7,300 | | | 7,936,859 |
| | | | | | | | | | | |
|
|
| | | | | | | | | | | | | 14,983,698 |
| | | | | | | | | | | |
|
|
Non-Corporate Sovereign — 4.9% | | | | | | | | | | | | |
Buoni Poliennali Del Tesoro (Italy) | | Aa2 | | 4.00% | | 02/01/37 | | EUR | 2,215 | | | 2,771,210 |
Deutsche Bundesrepublik (Denmark) | | Aaa | | 4.00% | | 01/04/37 | | EUR | 3,128 | | | 4,137,974 |
Federal Republic of Argentina (Argentina)(g) | | B3 | | 3.00% | | 04/30/13 | | | 2,115 | | | 1,319,337 |
Federal Republic of Argentina (Argentina)(g) | | B3 | | 5.389% | | 08/03/12 | | | 2,000 | | | 1,778,700 |
Federal Republic of Brazil (Brazil) | | Ba1 | | 9.25% | | 10/22/10 | | | 5,325 | | | 5,910,750 |
SEE NOTES TO FINANCIAL STATEMENTS.
A43
| | | | |
| | | DIVERSIFIED BOND PORTFOLIO (Continued) | | |
SCHEDULE OF INVESTMENTS | December 31, 2007 |
| | | | | | | | | | | | |
LONG-TERM BONDS
(continued) | | Moody’s
Rating
(Unaudited)
| | Interest
Rate
| | Maturity
Date
| | Principal
Amount
(000)#
| | Value
(Note 2)
|
Non-Corporate Sovereign (continued) | | | | | | | | | | | | |
| | | | | | | | | | | | | |
Federal Republic of Brazil (Brazil)(a) | | Ba1 | | 12.50% | | 01/05/16 | | BRL | 750 | | $ | 458,006 |
Government of Hungary (Hungary) | | A2 | | 8.00% | | 02/12/15 | | HUF | 1,054,880 | | | 6,325,170 |
Government of Jamaica (Jamaica) | | B1 | | 11.00% | | 07/27/12 | | EUR | 995 | | | 1,629,311 |
Peru Government International Bond (Peru), 144A | | Ba2 | | Zero% | | 05/31/18 | | | 1,837 | | | 1,267,530 |
Republic of Panama (Panama) | | Ba1 | | 9.375% | | 07/23/12 | | | 1,295 | | | 1,508,675 |
Republic of Poland (Poland) | | A2 | | 6.25% | | 10/24/15 | | PLN | 23,360 | | | 9,637,197 |
Republic of Turkey (Turkey) | | Ba3 | | 9.875% | | 03/19/08 | | | 1,845 | | | 1,847,399 |
Republic of Uruguay (Uruguay) | | B1 | | 7.25% | | 02/15/11 | | | 660 | | | 693,000 |
Republic of Venezuela (Venezuela) | | B2 | | 10.75% | | 09/19/13 | | | 2,385 | | | 2,551,950 |
Russian Government International Bond (Russia), 144A | | Baa2 | | 8.25% | | 03/31/10 | | | 2,883 | | | 2,991,590 |
Sweden Government Bond (Sweden) | | Aaa | | 6.50% | | 05/05/08 | | SEK | 7,810 | | | 1,216,768 |
United Mexican States (Mexico)(g) | | Baa1 | | 5.942% | | 01/13/09 | | | 2,090 | | | 2,094,180 |
United Mexican States (Mexico) | | Baa1 | | 7.50% | | 01/14/12 | | | 4,250 | | | 4,666,500 |
United Mexican States (Mexico) | | Baa1 | | 8.00% | | 12/24/08 | | MXN | 77,200 | | | 7,085,314 |
| | | | | | | | | | | |
|
|
| | | | | | | | | | | | | 59,890,561 |
| | | | | | | | | | | |
|
|
Paper — 0.7% | | | | | | | | | | | | |
Catalyst Paper Corp. (Canada) | | B2 | | 8.625% | | 06/15/11 | | | 1,800 | | | 1,494,000 |
Graphic Packaging International, Inc. | | B2 | | 8.50% | | 08/15/11 | | | 2,970 | | | 2,940,300 |
International Paper Co. | | Baa3 | | 4.00% | | 04/01/10 | | | 2,815 | | | 2,787,213 |
Norampac, Inc., Sr. Notes (Canada) | | Ba3 | | 6.75% | | 06/01/13 | | | 1,400 | | | 1,277,500 |
| | | | | | | | | | | |
|
|
| | | | | | | | | | | | | 8,499,013 |
| | | | | | | | | | | |
|
|
Pipelines & Other — 1.0% | | | | | | | | | | | | |
Atmos Energy Corp.(e) | | Baa3 | | 4.00% | | 10/15/09 | | | 5,300 | | | 5,222,387 |
CenterPoint Energy Resources Corp. | | Baa3 | | 6.125% | | 11/01/17 | | | 1,340 | | | 1,363,703 |
Oneok, Inc. | | Baa2 | | 5.51% | | 02/16/08 | | | 6,000 | | | 5,996,302 |
| | | | | | | | | | | |
|
|
| | | | | | | | | | | | | 12,582,392 |
| | | | | | | | | | | |
|
|
Railroads — 0.3% | | | | | | | | | | | | |
CSX Corp. | | Baa3 | | 5.75% | | 03/15/13 | | | 2,600 | | | 2,632,219 |
Union Pacific Corp. | | Baa2 | | 5.45% | | 01/31/13 | | | 1,500 | | | 1,513,082 |
| | | | | | | | | | | |
|
|
| | | | | | | | | | | | | 4,145,301 |
| | | | | | | | | | | |
|
|
Real Estate Investments Trusts — 0.4% | | | | | | | | | | | | |
Equity One, Inc. | | Baa3 | | 3.875% | | 04/15/09 | | | 1,450 | | | 1,404,226 |
Post Apartment Homes LP | | Baa3 | | 5.45% | | 06/01/12 | | | 2,300 | | | 2,335,669 |
Realty Income Corp. | | Baa1 | | 6.75% | | 08/15/19 | | | 1,545 | | | 1,593,851 |
| | | | | | | | | | | |
|
|
| | | | | | | | | | | | | 5,333,746 |
| | | | | | | | | | | |
|
|
Retailers — 0.6% | | | | | | | | | | | | |
CVS Caremark Corp.(a) | | Baa2 | | 6.25% | | 06/01/27 | | | 3,020 | | | 3,026,532 |
Neiman-Marcus Group, Inc., PIK | | B2 | | 9.00% | | 10/15/15 | | | 2,750 | | | 2,835,938 |
Target Corp. | | A2 | | 6.50% | | 10/15/37 | | | 800 | | | 804,081 |
| | | | | | | | | | | |
|
|
| | | | | | | | | | | | | 6,666,551 |
| | | | | | | | | | | |
|
|
Structured Notes — 1.7% | | | | | | | | | | | | |
CDX North America High Yield, Ser. 9-T1, 144A(a) | | B3 | | 8.75% | | 12/29/12 | | | 2,000 | | | 1,972,500 |
Dow Jones CDX High Yield, 144A | | B3 | | 8.25% | | 12/29/10 | | | 8,500 | | | 8,776,250 |
Dow Jones CDX High Yield, 144A(a) | | B3 | | 8.625% | | 06/29/11 | | | 10,128 | | | 10,444,191 |
| | | | | | | | | | | |
|
|
| | | | | | | | | | | | | 21,192,941 |
| | | | | | | | | | | |
|
|
Technology — 0.8% | | | | | | | | | | | | |
Fidelity National Information Services, Inc. | | Ba1 | | 4.75% | | 09/15/08 | | | 1,900 | | | 1,873,875 |
Fiserv, Inc. | | Baa2 | | 6.125% | | 11/20/12 | | | 1,600 | | | 1,628,478 |
Freescale Semiconductor, Inc., PIK | | B2 | | 9.125% | | 12/15/14 | | | 1,600 | | | 1,360,000 |
Freescale Semiconductor, Inc.(a) | | B3 | | 10.125% | | 12/15/16 | | | 1,500 | | | 1,237,500 |
Jabil Circuit, Inc. | | Ba1 | | 5.875% | | 07/15/10 | | | 2,000 | | | 2,023,881 |
Motorola, Inc. | | Baa1 | | 8.00% | | 11/01/11 | | | 121 | | | 130,433 |
SunGard Data Systems, Inc. | | B3 | | 3.75% | | 01/15/09 | | | 720 | | | 698,400 |
Xerox Corp. | | Baa2 | | 5.50% | | 05/15/12 | | | 870 | | | 884,457 |
| | | | | | | | | | | |
|
|
| | | | | | | | | | | | | 9,837,024 |
| | | | | | | | | | | |
|
|
SEE NOTES TO FINANCIAL STATEMENTS.
A44
| | | | |
| | | DIVERSIFIED BOND PORTFOLIO (Continued) | | |
SCHEDULE OF INVESTMENTS | December 31, 2007 |
| | | | | | | | | | | | |
LONG-TERM BONDS
(continued) | | Moody’s
Rating
(Unaudited)
| | Interest
Rate
| | Maturity
Date
| | Principal
Amount
(000)#
| | Value
(Note 2)
|
| | | | | | | | | | | | | |
Telecommunications — 2.1% | | | | | | | | | | | | |
AT&T Corp. | | A2 | | 8.00% | | 11/15/31 | | | 2,475 | | $ | 3,039,481 |
Embarq Corp. | | Baa3 | | 7.082% | | 06/01/16 | | | 5,600 | | | 5,770,133 |
New Cingular Wireless Services, Inc. | | A2 | | 8.125% | | 05/01/12 | | | 1,810 | | | 2,012,573 |
New Cingular Wireless Services, Inc. | | A3 | | 8.75% | | 03/01/31 | | | 2,375 | | | 3,077,960 |
Qwest Corp. | | Ba1 | | 8.875% | | 03/15/12 | | | 3,300 | | | 3,531,000 |
Sprint Nextel Corp.(a) | | Baa3 | | 6.00% | | 12/01/16 | | | 1,335 | | | 1,278,654 |
Telecom Italia Capital (Luxembourg) | | Baa2 | | 4.875% | | 10/01/10 | | | 3,400 | | | 3,382,283 |
Telefonica Emisiones SAU (Spain) | | Baa1 | | 7.045% | | 06/20/36 | | | 5 | | | 5,589 |
TELUS Corp. (Canada) | | Baa1 | | 8.00% | | 06/01/11 | | | 150 | | | 162,520 |
Suncom Wireless, Inc. | | Caa2 | | 8.50% | | 06/01/13 | | | 3,200 | | | 3,312,000 |
| | | | | | | | | | | |
|
|
| | | | | | | | | | | | | 25,572,193 |
| | | | | | | | | | | |
|
|
Tobacco — 0.4% | | | | | | | | | | | | |
Altria Group, Inc. | | Baa1 | | 7.65% | | 07/01/08 | | | 1,100 | | | 1,117,678 |
Reynolds American, Inc. | | Ba1 | | 6.50% | | 07/15/10 | | | 4,000 | | | 4,095,284 |
| | | | | | | | | | | |
|
|
| | | | | | | | | | | | | 5,212,962 |
| | | | | | | | | | | |
|
|
U.S. Government Agency Obligations — 0.2% | | | | | | | | | | | | |
Federal Farm Credit Bank | | Aaa | | 4.875% | | 01/17/17 | | | 580 | | | 595,006 |
Federal Home Loan Mortgage Corp. | | Aaa | | 5.50% | | 07/18/16 | | | 120 | | | 129,181 |
Federal National Mortgage Association | | Aaa | | 5.00% | | 03/15/16 | | | 1,685 | | | 1,760,831 |
Federal National Mortgage Association | | Aaa | | 5.625% | | 07/15/37 | | | 165 | | | 182,865 |
| | | | | | | | | | | |
|
|
| | | | | | | | | | | | | 2,667,883 |
| | | | | | | | | | | |
|
|
U.S. Government Mortgage-Backed Securities — 38.8% | | | | | | | | | | | | |
Federal Home Loan Mortgage Corp. | | Aaa | | 4.50% | | 02/01/19-07/01/19 | | | 15,048 | | | 14,791,360 |
Federal Home Loan Mortgage Corp. | | Aaa | | 5.00% | | 07/01/19-05/01/34 | | | 7,572 | | | 7,511,692 |
Federal Home Loan Mortgage Corp. | | Aaa | | 5.50% | | 10/01/33-06/01/34 | | | 5,268 | | | 5,273,151 |
Federal Home Loan Mortgage Corp. | | Aaa | | 5.50% | | TBA 30 YR | | | 47,500 | | | 47,396,070 |
Federal Home Loan Mortgage Corp. | | Aaa | | 6.00% | | 11/01/33-06/01/34 | | | 6,081 | | | 6,182,107 |
Federal Home Loan Mortgage Corp. | | Aaa | | 6.00% | | TBA 30 YR | | | 23,500 | | | 23,845,168 |
Federal Home Loan Mortgage Corp. | | Aaa | | 6.50% | | 07/01/32-09/01/32 | | | 3,032 | | | 3,134,506 |
Federal Home Loan Mortgage Corp. | | Aaa | | 7.00% | | 10/01/32-11/01/33 | | | 5,856 | | | 6,143,182 |
Federal National Mortgage Association | | Aaa | | 4.00% | | 05/01/19-06/01/19 | | | 7,191 | | | 6,897,898 |
Federal National Mortgage Association | | Aaa | | 4.50% | | 06/01/18-02/01/35 | | | 29,104 | | | 28,386,084 |
Federal National Mortgage Association | | Aaa | | 5.00% | | 01/01/19-01/01/20 | | | 8,593 | | | 8,612,588 |
Federal National Mortgage Association | | Aaa | | 5.00% | | TBA 30 YR | | | 74,000 | | | 72,196,250 |
Federal National Mortgage Association(g) | | Aaa | | 5.228% | | 10/01/37 | | | 11,415 | | | 11,507,417 |
Federal National Mortgage Association(g) | | Aaa | | 5.287% | | 01/01/36 | | | 3,485 | | | 3,490,344 |
Federal National Mortgage Association | | Aaa | | 5.50% | | 12/01/16-09/01/34 | | | 34,108 | | | 34,256,223 |
Federal National Mortgage Association | | Aaa | | 5.50% | | TBA 15 YR | | | 10,000 | | | 10,128,120 |
Federal National Mortgage Association | | Aaa | | 5.50% | | TBA 30 YR | | | 34,000 | | | 33,957,500 |
Federal National Mortgage Association(g) | | Aaa | | 5.914% | | 06/01/37 | | | 3,999 | | | 4,072,124 |
Federal National Mortgage Association | | Aaa | | 6.00% | | 09/01/17-02/01/35 | | | 22,570 | | | 23,008,743 |
Federal National Mortgage Association | | Aaa | | 6.00% | | TBA 30 YR | | | 32,000 | | | 32,489,984 |
Federal National Mortgage Association(g) | | Aaa | | 6.044% | | 09/01/37 | | | 11,226 | | | 11,444,012 |
Federal National Mortgage Association | | Aaa | | 6.50% | | 11/01/09-10/01/37 | | | 23,864 | | | 24,575,369 |
Federal National Mortgage Association | | Aaa | | 7.00% | | 05/01/32-06/01/32 | | | 522 | | | 550,046 |
Federal National Mortgage Association | | Aaa | | 9.00% | | 10/01/16 | | | 3 | | | 3,524 |
Government National Mortgage Association | | Aaa | | 5.50% | | 01/15/33-01/15/36 | | | 16,251 | | | 16,342,875 |
Government National Mortgage Association | | Aaa | | 6.00% | | 12/15/32-11/15/34 | | | 9,717 | | | 9,946,912 |
Government National Mortgage Association | | Aaa | | 6.00% | | TBA 30 YR | | | 20,000 | | | 20,475,000 |
Government National Mortgage Association | | Aaa | | 6.50% | | 09/15/32-11/15/33 | | | 5,211 | | | 5,401,391 |
Government National Mortgage Association | | Aaa | | 7.50% | | 10/15/25-02/15/26 | | | 166 | | | 177,556 |
| | | | | | | | | | | |
|
|
| | | | | | | | | | | | | 472,197,196 |
| | | | | | | | | | | |
|
|
U.S. Government Treasury Securities — 1.0% | | | | | | | | | | | | |
U.S. Treasury Bonds(a) | | Aaa | | 4.75% | | 02/15/37 | | | 11,084 | | | 11,600,093 |
| | | | | | | | | | | |
|
|
TOTAL LONG-TERM BONDS
(cost $1,126,566,844) | | | 1,118,153,965 |
| | | | | | | | | | | |
|
|
SEE NOTES TO FINANCIAL STATEMENTS.
A45
| | | | |
| | | DIVERSIFIED BOND PORTFOLIO (Continued) | | |
SCHEDULE OF INVESTMENTS | December 31, 2007 |
| | | | | | | | | | | | |
| BANK LOANS — 5.6% | | Moody’s
Rating
(Unaudited)
| | Interest
Rate
| | Maturity
Date
| | Principal
Amount
(000)#
| | Value
(Note 2)
|
| | | | | | | | | | | | | |
Aerospace/Defense — 0.2% | | | | | | | | | | | | |
Hawker Beechcraft, Inc.(h) | | Ba3 | | 7.244% | | 03/26/14 | | | 167 | | $ | 158,797 |
Hawker Beechcraft, Inc.(h) | | Ba3 | | 7.244% | | 03/26/14 | | | 1,963 | | | 1,862,621 |
| | | | | | | | | | | |
|
|
| | | | | | | | | | | | | 2,021,418 |
| | | | | | | | | | | |
|
|
Automotive — 0.6% | | | | | | | | | | | | |
Ford Motor Co.(h) | | Ba3 | | 8.00% | | 12/15/13 | | | 3,861 | | | 3,567,915 |
Oshkosh Truck Corp.(h) | | Ba3 | | 6.90% | | 12/06/13 | | | 3,629 | | | 3,478,950 |
| | | | | | | | | | | |
|
|
| | | | | | | | | | | | | 7,046,865 |
| | | | | | | | | | | |
|
|
Cable — 0.4% | | | | | | | | | | | | |
Insight Midwest Holding LLC(h) | | Ba3 | | 6.753% | | 10/06/13 | | | 4,750 | | | 4,552,082 |
| | | | | | | | | | | |
|
|
Capital Goods — 0.3% | | | | | | | | | | | | |
Capital Safety Group Ltd.(h) | | B1 | | 7.631% | | 07/20/15 | | | 409 | | | 395,947 |
Capital Safety Group Ltd.(h) | | B1 | | 8.131% | | 07/20/16 | | | 1,091 | | | 1,060,756 |
Hertz Corp.(h) | | Ba1 | | 6.66% | | 12/21/12 | | | 278 | | | 272,004 |
Hertz Corp.(h) | | Ba1 | | 6.894% | | 12/21/12 | | | 1,315 | | | 1,286,311 |
| | | | | | | | | | | |
|
|
| | | | | | | | | | | | | 3,015,018 |
| | | | | | | | | | | |
|
|
Consumer — 0.2% | | | | | | | | | | | | |
Huish Detergents, Inc.(h) | | B1 | | 6.878% | | 04/26/14 | | | 2,985 | | | 2,590,553 |
| | | | | | | | | | | |
|
|
Electric — 0.6% | | | | | | | | | | | | |
NRG Energy, Inc.(h) | | Ba1 | | 6.48% | | 02/01/13 | | | 1,171 | | | 1,116,168 |
NRG Energy, Inc.(h) | | Ba1 | | 6.58% | | 02/01/13 | | | 2,537 | | | 2,417,540 |
Reliant Energy, Inc.(h) | | B2 | | 5.105% | | 06/30/14 | | | 2,500 | | | 2,350,000 |
Texas Competitive Electric Holdings Co. LLC(h) | | Ba3 | | 8.60% | | 10/10/14 | | | 1,995 | | | 1,957,596 |
| | | | | | | | | | | |
|
|
| | | | | | | | | | | | | 7,841,304 |
| | | | | | | | | | | |
|
|
Foods — 0.2% | | | | | | | | | | | | |
Supervalu, Inc.(h) | | Ba3 | | 6.584% | | 06/02/11 | | | 2,538 | | | 2,483,108 |
| | | | | | | | | | | |
|
|
Gaming — 0.2% | | | | | | | | | | | | |
Las Vegas Sands LLC(h) | | Ba3 | | 6.58% | | 05/23/14 | | | 2,189 | | | 2,048,705 |
Las Vegas Sands LLC(h) | | Ba3 | | 7.11% | | 05/23/14 | | | 550 | | | 514,750 |
| | | | | | | | | | | |
|
|
| | | | | | | | | | | | | 2,563,455 |
| | | | | | | | | | | |
|
|
Health Care & Pharmaceutical — 1.1% | | | | | | | | | | | | |
Community Health Systems, Inc.(h) | | Ba3 | | 7.493% | | 07/25/14 | | | 135 | | | 129,342 |
Community Health Systems, Inc.(h) | | Ba3 | | 7.493% | | 07/25/14 | | | 2,676 | | | 2,571,753 |
HCA, Inc.(h) | | Ba3 | �� | 7.08% | | 11/17/13 | | | 2,475 | | | 2,381,569 |
Health Management Associates Term B(h) | | Ba2 | | 6.62% | | 02/28/14 | | | 2,045 | | | 1,904,307 |
Inverness Medical Innovations(h) | | B1 | | 7.243% | | 06/26/14 | | | 2,985 | | | 2,832,019 |
PTS Acquisition Corp.(h) | | Ba3 | | 7.459% | | 04/10/14 | | | 3,881 | | | 3,605,632 |
| | | | | | | | | | | |
|
|
| | | | | | | | | | | | | 13,424,622 |
| | | | | | | | | | | |
|
|
Media & Entertainment — 0.4% | | | | | | | | | | | | |
Idearc, Inc.(h) | | Ba2 | | 6.33% | | 11/17/13 | | | 1,000 | | | 939,250 |
Idearc, Inc.(h) | | Ba2 | | 6.83% | | 11/17/14 | | | 1,733 | | | 1,648,238 |
Univision Communications, Inc.(h) | | Ba3 | | 7.207% | | 09/29/14 | | | 2,899 | | | 2,639,598 |
Univision Communications, Inc.(h) | | Ba3 | | 7.45% | | 09/29/14 | | | 101 | | | 91,653 |
| | | | | | | | | | | |
|
|
| | | | | | | | | | | | | 5,318,739 |
| | | | | | | | | | | |
|
|
Paper — 0.1% | | | | | | | | | | | | |
Domtar, Inc.(h) | | Ba1 | | 6.4025% | | 03/05/14 | | | 1,608 | | | 1,540,329 |
| | | | | | | | | | | |
|
|
Pipelines & Other — 0.4% | | | | | | | | | | | | |
Enterprise GP Holdings LP(h) | | Ba2 | | 7.161% | | 11/08/14 | | | 1,535 | | | 1,526,366 |
Kinder Morgan, Inc.(h) | | Ba2 | | 6.35% | | 05/30/14 | | | 2,798 | | | 2,777,515 |
| | | | | | | | | | | |
|
|
| | | | | | | | | | | | | 4,303,881 |
| | | | | | | | | | | |
|
|
Technology — 0.8% | | | | | | | | | | | | |
First Data Corp.(h) | | Ba3 | | 7.981% | | 09/24/14 | | | 1,047 | | | 992,977 |
First Data Corp.(h) | | Ba3 | | 7.981% | | 09/24/14 | | | 1,995 | | | 1,897,494 |
SEE NOTES TO FINANCIAL STATEMENTS.
A46
| | | | |
| | | DIVERSIFIED BOND PORTFOLIO (Continued) | | |
SCHEDULE OF INVESTMENTS | December 31, 2007 |
| | | | | | | | | | | | | |
BANK LOANS
(continued) | | Moody’s
Rating
(Unaudited)
| | Interest
Rate
| | Maturity
Date
| | Principal
Amount
(000)#
| | Value
(Note 2)
| |
| | | | | | | | | | | | | | |
Technology (continued) | | | | | | | | | | | | | |
Flextronics International Ltd. (h) | | Ba1 | | 7.234% | | 10/01/14 | | | 668 | | $ | 651,269 | |
Flextronics International Ltd. (h) | | Ba1 | | 7.474% | | 10/01/14 | | | 2,325 | | | 2,266,763 | |
Metavante Corp.(h) | | Ba2 | | 6.644% | | 11/01/14 | | | 2,500 | | | 2,429,687 | |
Sungard Data Systems, Inc.(h) | | Ba3 | | 6.897% | | 02/28/14 | | | 1,497 | | | 1,443,561 | |
| | | | | | | | | | | |
|
|
|
| | | | | | | | | | | | | 9,681,751 | |
| | | | | | | | | | | |
|
|
|
Telecommunications — 0.1% | | | | | | | | | | | | | |
Alltel Communications, Inc.(h) | | Ba3 | | 7.699 | | 05/16/15 | | | 1,596 | | | 1,535,928 | |
| | | | | | | | | | | |
|
|
|
TOTAL BANK LOANS
(cost $70,749,449) | | | 67,919,053 | |
| | | | | | | | | | | |
|
|
|
TOTAL LONG-TERM INVESTMENTS
(cost $1,197,316,293) | | | 1,186,073,018 | |
| | | | | | | | | | | |
|
|
|
| | | | | |
| SHORT-TERM INVESTMENTS — 25.2% | | | | | | | | Shares
| | | |
Affiliated Mutual Funds | | | | | | | | | | | | | |
Dryden Core Investment Fund — Short-Term Bond Series(d) | | | | | | | | | 15,922,245 | | | 150,305,993 | |
| | | | | | | | | | | |
|
|
|
Dryden Core Investment Fund — Taxable Money Market Fund Series
(includes $51,702,846 of cash collateral received for securities on loan) (Note 4)(c)(d) | | | | | | | | | 156,711,969 | | | 156,711,969 | |
| | | | | | | | | | | |
|
|
|
TOTAL AFFILIATED MUTUAL FUNDS
(cost $315,303,189) | | | 307,017,962 | |
| | | | | | | | | | | |
|
|
|
TOTAL INVESTMENTS, BEFORE SECURITY SOLD SHORT 122.6%
(cost $1,512,619,482) | | | 1,493,090,980 | |
| | | | | | | | | | | |
|
|
|
| | | | | |
| SECURITY SOLD SHORT — (0.5)% | | | | | | | | Principal
Amount
(000)#
| | | |
U.S. Government Mortgage-Backed Security | | | | | | | | | | | | | |
Federal National Mortgage Association
(proceeds $5,371,094) | | Aaa | | 4.50% | | TBA 15 YR | | | 5,500 | | | (5,412,341 | ) |
| | | | | | | | | | | |
|
|
|
TOTAL INVESTMENTS, NET OF SECURITY SOLD SHORT — 122.1%
(cost $1,507,248,388) | | | 1,487,678,639 | |
| | | | | | | | | | | |
|
|
|
LIABILITIES IN EXCESS OF OTHER ASSETS(i) — (22.1)% | | | (269,387,949 | ) |
| | | | | | | | | | | |
|
|
|
TOTAL NET ASSETS — 100.0% | | $ | 1,218,290,690 | |
| | | | | | | | | | | |
|
|
|
The following abbreviations are used in portfolio descriptions:
| | |
| 144A | | Security was purchased pursuant to Rule 144A under the Securities Act of 1933 and may not be resold subject to that rule except to qualified institutional buyers. Unless otherwise noted, 144A securities are deemed to be liquid. |
| MTN | | Medium Term Note |
| NR | | Not Rated by Moody’s or Standard & Poor’s |
| PIK | | Payment-in-kind |
| TBA | | To Be Announced |
| AUD | | Australian Dollar |
| BRL | | Brazilian Real |
| EUR | | Euro |
| GBP | | British Pound |
| HUF | | Hungarian Forint |
| MXN | | Mexican Peso |
| NZD | | New Zealand Dollar |
| PLN | | Polish Zloty |
| SEK | | Swedish Krona |
| # | Principal amount shown in U.S. dollars unless otherwise stated. |
| (a) | All or portion of security is on loan. The aggregate market value of such securities is $50,482,738; cash collateral of $51,702,846 (included in liabilities) was received with which the Portfolio purchased highly liquid short-term investments. |
SEE NOTES TO FINANCIAL STATEMENTS.
A47
| | | | |
| | | DIVERSIFIED BOND PORTFOLIO (Continued) | | |
SCHEDULE OF INVESTMENTS | December 31, 2007 |
| (b) | Increase/decrease in rate variable upon increase/decrease in Moody’s or Standard & Poor’s rating. |
| (c) | Represents security, or a portion thereof, purchased with cash collateral received for securities on loan. |
| (d) | Prudential Investments LLC, the manager of the Portfolio, also serves as manager of the Dryden Core Investment Fund — Taxable Money Market Series and the Dryden Core Investment Fund — Short-Term Bond Series. |
| (e) | Security segregated as collateral for futures contracts. |
| (f) | Standard & Poor’s rating. |
| (g) | Indicates a variable rate security. The maturity date presented for these instruments is the latter of the next date on which the security can be redeemed at par or the next date on which the rate of interest is adjusted. The interest rate shown reflects the rate in effect at December 31, 2007. |
| (h) | Indicates a security that has been deemed illiquid. |
| (i) | Liabilities in excess of other assets include net unrealized appreciation (depreciation) on futures contracts, forward foreign currency exchange contracts, interest rate and credit default swap agreements as follows: |
Open future contracts outstanding at December 31, 2007:
| | | | | | | | | | | | | | |
Number of
Contracts
| | Type
| | Expiration
Date
| | Value at
Trade Date
| | Value at
December 31, 2007
| | Unrealized
Appreciation
(Depreciation)
| |
| Long Positions: | | | | | | | | | | | | | | |
| 26 | | 2 Yr. Euro Schatz | | Mar. 2008 | | $ | 3,956,880 | | $ | 3,928,871 | | $ | (28,009 | ) |
| 5 | | New Zealand 3 Mo. Bill | | Mar. 2008 | | | 3,511,109 | | | 3,508,765 | | | (2,344 | ) |
| 872 | | U.S. 10 Yr. Treasury Notes | | Mar. 2008 | | | 98,340,815 | | | 98,876,625 | | | 535,810 | |
| 395 | | U.S. 30 Yr. Treasury Bonds | | Mar. 2008 | | | 45,783,582 | | | 45,968,125 | | | 184,543 | |
| | | | | | | | | | | | |
|
|
|
| | | | | | | | | | | | | | 690,000 | |
| | | | | | | | | | | | |
|
|
|
| Short Positions: | | | | | | | | | | | | | | |
| 20 | | Australian 10 Yr. Bond | | Mar. 2008 | | | 1,646,364 | | | 1,645,198 | | | 1,166 | |
| 44 | | Euro 10 Yr. Bond | | Mar. 2008 | | | 7,445,087 | | | 7,276,401 | | | 168,686 | |
| 8 | | U.K. 10 Yr. Gilt | | Mar. 2008 | | | 1,755,455 | | | 1,755,395 | | | 60 | |
| 213 | | U.S. 2 Yr. Treasury Notes | | Mar. 2008 | | | 44,744,869 | | | 44,783,250 | | | (38,381 | ) |
| 617 | | U.S. 5 Yr. Treasury Notes | | Mar. 2008 | | | 67,979,348 | | | 68,043,531 | | | (64,183 | ) |
| | | | | | | | | | | | |
|
|
|
| | | | | | | | | | | | | | 67,348 | |
| | | | | | | | | | | | |
|
|
|
| | | | | | | | | | | | | $ | 757,348 | |
| | | | | | | | | | | | |
|
|
|
Forward foreign currency exchange contracts outstanding at December 31, 2007:
| | | | | | | | | | | | | | |
Foreign Currency Contract
| | | | Notional
Amount
(000)
| | Value at
Settlement Date
| | Current
Value
| | Unrealized
Appreciation/
(Depreciation)
| |
Purchased: | | | | | | | | | | | | | | |
Australian Dollar, expiring 01/18/08 | | AUD | | 703 | | $ | 609,100 | | $ | 616,503 | | $ | 7,403 | |
Brazilian Real, expiring 10/23/08 | | BRL | | 6,806 | | | 2,775,000 | | | 3,723,533 | | | 948,533 | |
British Pound, expiring 01/25/08 | | GBP | | 491 | | | 974,500 | | | 977,025 | | | 2,525 | |
Euro, expiring 01/25/08 | | EUR | | 835 | | | 1,209,800 | | | 1,221,034 | | | 11,234 | |
Hungarian Forint, expiring 01/24/08 | | HUF | | 231,835 | | | 1,312,100 | | | 1,338,263 | | | 26,163 | |
New Zealand Dollar, expiring 01/18/08 | | NZD | | 2,379 | | | 1,872,281 | | | 1,826,527 | | | (45,754 | ) |
Swedish Krona, expiring 01/24/08 | | SEK | | 15,906 | | | 2,435,300 | | | 2,461,564 | | | 26,264 | |
| | | | | | |
|
| |
|
| |
|
|
|
| | | | | | | | 11,188,081 | | | 12,164,449 | | | 976,368 | |
| | | | | | |
|
| |
|
| |
|
|
|
Sold: | | | | | | | | | | | | | | |
Australian Dollar, expiring 01/18/08 | | AUD | | 1,905 | | | 1,684,557 | | | 1,671,112 | | | 13,445 | |
British Pound, expiring 01/25/08 | | GBP | | 1,466 | | | 2,950,059 | | | 2,916,150 | | | 33,909 | |
Euro, expiring 01/25/08 | | EUR | | 5,512 | | | 7,957,584 | | | 8,062,268 | | | (104,684 | ) |
Hungarian Forint, expiring 01/24/08 | | HUF | | 1,178,283 | | | 6,794,617 | | | 6,801,614 | | | (6,997 | ) |
Mexican Peso, expiring 01/16/08 | | MXN | | 77,280 | | | 7,137,383 | | | 7,072,593 | | | 64,790 | |
Polish Zloty, expiring 01/24/08 | | PLN | | 20,822 | | | 8,510,291 | | | 8,462,141 | | | 48,150 | |
Swedish Krona, expiring 01/24/08 | | SEK | | 15,845 | | | 2,445,728 | | | 2,452,189 | | | (6,461 | ) |
| | | | | | |
|
| |
|
| |
|
|
|
| | | | | | | | 37,480,219 | | | 37,438,067 | | | 42,152 | |
| | | | | | |
|
| |
|
| |
|
|
|
| | | | | | | | | | | | | $ | 1,018,520 | |
| | | | | | | | | | | | |
|
|
|
SEE NOTES TO FINANCIAL STATEMENTS.
A48
| | | | |
| | | DIVERSIFIED BOND PORTFOLIO (Continued) | | |
SCHEDULE OF INVESTMENTS | December 31, 2007 |
Interest rate swap agreements outstanding at December 31, 2007:
| | | | | | | | | | | | | | |
Counterparty
| | Termination
Date
| | Notional
Amount
(000)
| | Fixed
Rate
| | | Floating Rate
| | Unrealized
Appreciation/
(Depreciation)
| |
Merrill Lynch Capital Services, Inc.(a) | | 8/14/2012 | | $ | 19,829 | | 5.20857 | % | | 3 month LIBOR | | $ | 1,139,594 | |
Morgan Stanley Capital Services(a) | | 9/12/2012 | | | 8,410 | | 4.7357 | % | | 3 month LIBOR | | | 301,323 | |
Morgan Stanley Capital Services(a) | | 9/25/2012 | | | 8,450 | | 4.94079 | % | | 3 month LIBOR | | | 385,094 | |
Morgan Stanley Capital Services(a) | | 10/23/2012 | | | 5,520 | | 4.7945 | % | | 3 month LIBOR | | | 145,092 | |
Morgan Stanley Capital Services(a) | | 12/7/2012 | | | 6,145 | | 4.1503 | % | | 3 month LIBOR | | | 4,845 | |
Morgan Stanley Capital Services(a) | | 12/13/2012 | | | 15,000 | | 4.34666 | % | | 3 month LIBOR | | | 132,391 | |
Merrill Lynch Capital Services(b) | | 12/14/2012 | | | 11,540 | | 4.35284 | % | | 3 month LIBOR | | | (111,111 | ) |
Merrill Lynch Capital Services, Inc.(a) | | 8/2/2017 | | | 7,500 | | 5.52959 | % | | 3 month LIBOR | | | 633,991 | |
Morgan Stanley Capital Services(b) | | 12/11/2037 | | | 3,115 | | 5.08438 | % | | 3 month LIBOR | | | (37,533 | ) |
Merrill Lynch Capital Services(b) | | 12/11/2037 | | | 15,280 | | 5.08938 | % | | 3 month LIBOR | | | (236,208 | ) |
| | | | | | | | | | | | |
|
|
|
| | | | | | | | | | | | | $ | 2,357,478 | |
| | | | | | | | | | | | |
|
|
|
| (a) | Portfolio pays the floating rate and receives the fixed rate. |
| (b) | Portfolio pays the fixed rate and receives the floating rate. |
Credit default swap agreements outstanding at December 31, 2007:
| | | | | | | | | | | | | | |
Counterparty
| | Termination
Date
| | Notional
Amount
(000)
| | Fixed
Rate
| | | Reference Entity/Obligation
| | Unrealized
Appreciation/
(Depreciation)
| |
Morgan Stanley Capital Services, Inc.(a) | | 6/20/2009 | | $ | 1,334 | | 0.82 | % | | Tyco International Group SA, 6.00%, due 11/15/13 | | $ | 2,001 | |
Morgan Stanley Capital Services, Inc.(a) | | 6/20/2009 | | | 1,333 | | 0.82 | % | | Tyco Electronics Ltd.,
6.00%, due 10/01/12 | | | (577 | ) |
Morgan Stanley Capital Services, Inc.(a) | | 6/20/2009 | | | 1,333 | | 0.82 | % | | Covidien Ltd.,
6.00%, due 10/15/17 | | | 2,865 | |
Merrill Lynch Capital Services, Inc.(a) | | 12/20/2009 | | | 4,000 | | 4.55 | % | | General Motors Corp.,
7.125%, 07/15/13 | | | (68,593 | ) |
Morgan Stanley Capital Services, Inc.(b) | | 12/20/2009 | | | 3,295 | | 0.60 | % | | RPM International, Inc.,
6.25%, due 12/15/13 | | | (15,581 | ) |
Morgan Stanley Capital Services, Inc.(b) | | 12/20/2009 | | | 1,855 | | 0.75 | % | | RPM International, Inc.,
6.25%, due 12/15/13 | | | (14,255 | ) |
Morgan Stanley Capital Services, Inc.(b) | | 9/20/2012 | | | 5,600 | | 1.70 | % | | CIT Group, Inc.
7.75%, due 04/02/12 | | | 455,228 | |
Merrill Lynch Capital Services, Inc.(b) | | 9/20/2012 | | | 1,500 | | 3.75 | % | | American Axle & Manufacturing, Inc.,
5.25%, due 02/11/14 | | | 2,013 | |
Morgan Stanley Capital Services, Inc.(a) | | 9/20/2012 | | | 1,500 | | 3.70 | % | | American Axle & Manufacturing, Inc.,
5.25%, due 02/11/14 | | | 12,350 | |
Morgan Stanley Capital Services, Inc.(a) | | 12/20/2014 | | | 2,500 | | 1.17 | % | | Nextel Communications, Inc., 7.375%, due 8/1/15 | | | 59,413 | |
Citibank, N.A.(b) | | 3/25/2035 | | | 1,000 | | 3.00 | % | | Centex Home Equity, Ser. 2005-B, Class B, 6.215%, 03/25/35 | | | (1,250 | ) |
Citibank, N.A.(b) | | 3/25/2035 | | | 1,000 | | 3.00 | % | | Morgan Stanley ABS Capital 1, Ser. 2005-HE2, Class B2, 6.165%, 01/25/35 | | | (1,500 | ) |
Citibank, N.A.(b) | | 3/25/2035 | | | 1,000 | | 3.00 | % | | Morgan Stanley ABS Capital 1, Ser. 2005-HE2, Class B3, 6.765%, 01/25/35 | | | (1,500 | ) |
Barclays Bank PLC(a) | | 9/25/2035 | | | 1,000 | | 3.35 | % | | Accredited Mortgage Loan Trust,
Ser. 2005-3, Class M9
7.02%, 09/25/35 | | | 460,932 | |
Merrill Lynch Capital Services, Inc.(b) | | 3/25/2036 | | | 1,000 | | 3.72 | % | | Ameriquest Mortgage Securities, Inc.
Ser. 2006-R1, Class M9, 7.82%, 03/25/36 | | | 744,827 | |
SEE NOTES TO FINANCIAL STATEMENTS.
A49
| | | | |
| | | DIVERSIFIED BOND PORTFOLIO (Continued) | | |
SCHEDULE OF INVESTMENTS | December 31, 2007 |
| | | | | | | | | | | | | | |
Counterparty
| | Termination
Date
| | Notional
Amount
(000)
| | Fixed
Rate
| | | Underlying Bond
| | Unrealized
Appreciation/
(Depreciation)
| |
Merrill Lynch Capital Services, Inc.(a) | | 3/25/2036 | | $ | 1,000 | | 9.00 | % | | Ameriquest Mortgage Securities, Inc.
Ser. 2006-R1, Class M9, 7.82%, 03/25/36 | | $ | (654,500 | ) |
Merrill Lynch Capital Services, Inc.(b) | | 4/25/2036 | | | 1,000 | | 2.78 | % | | Accredited Mortgage Loan Trust,
Ser. 2006-1, Class M8,
6.47%, 04/25/36 | | | 652,009 | |
Morgan Stanley Capital Services, Inc.(b) | | 5/25/2036 | | | 1,000 | | 3.23 | % | | Countrywide Asset-Backed Certificates,
Ser. 2005-16, Class MV8, 7.57%, 05/25/36 | | | 539,289 | |
| | | | | | | | | | | | |
|
|
|
| | | | | | | | | | | | | $ | 2,173,171 | |
| | | | | | | | | | | | |
|
|
|
| (a) | The Portfolio receives the fixed rate and pays the counterparty par in the event that the underlying bond defaults. |
| (b) | The Portfolio pays the fixed rate and receives from the counterparty par in the event that the underlying bond defaults. |
The industry classification of portfolio holdings and liabilities in excess of other assets shown as a percentage of net assets as of December 31, 2007 was as follows:
| | | |
U.S. Government Mortgage-Backed Securities | | 38.8 | % |
Affiliated Mutual Funds (including 4.2% of collateral received for securities on loan) | | 25.2 | |
Commercial Mortgage – Backed Securities | | 8.2 | |
Non-Corporate Sovereign | | 4.9 | |
Asset-Backed Securities | | 3.6 | |
Electric | | 3.6 | |
Banking | | 3.3 | |
Health Care & Pharmaceutical | | 2.8 | |
Non-Captive Finance | | 2.3 | |
Telecommunications | | 2.2 | |
Media & Entertainment | | 1.8 | |
Foods | | 1.7 | |
Structured Notes | | 1.7 | |
Technology | | 1.6 | |
Chemicals | | 1.5 | |
Health Care Insurance | | 1.5 | |
Airlines | | 1.4 | |
Energy – Other | | 1.4 | |
Pipelines & Other | | 1.4 | |
Non-Corporate Foreign Agency | | 1.2 | |
Brokerage | | 1.1 | |
Capital Goods | | 1.1 | |
Insurance | | 1.0 | |
U.S. Government Treasury Securities | | 1.0 | |
Automotive | | 0.9 | |
Building Materials & Construction | | 0.8 | |
Cable | | 0.8 | |
Paper | | 0.8 | |
Gaming | | 0.7 | |
Collateralized Mortgage Obligations | | 0.6 | |
Retailers | | 0.6 | |
Metals | | 0.5 | |
Lodging | | 0.4 | |
Real Estate Investment Trusts | | 0.4 | |
Tobacco | | 0.4 | |
Consumer | | 0.3 | |
Railroads | | 0.3 | |
Aerospace/Defense | | 0.2 | |
Emerging Markets | | 0.2 | |
Energy – Integrated | | 0.2 | |
U.S. Government Agency Obligations | | 0.2 | |
| | |
|
|
| | | 122.6 | |
Security Sold Short | | (0.5 | ) |
Liabilities in excess of other assets | | (22.1 | ) |
| | |
|
|
| | | 100.0 | % |
| | |
|
|
SEE NOTES TO FINANCIAL STATEMENTS.
A50
| | | | |
| | | DIVERSIFIED BOND PORTFOLIO (Continued) | | |
STATEMENT OF ASSETS AND LIABILITIES
December 31, 2007
| | | |
| ASSETS | | | |
Investments, at value including securities on loan of $50,482,738: | | | |
Unaffiliated investments (cost $1,197,316,293) | | $ | 1,186,073,018 |
Affiliated investments (cost $315,303,189) | | | 307,017,962 |
Cash | | | 976,125 |
Foreign currency, at value (cost $286,527) | | | 286,211 |
Interest receivable | | | 10,669,861 |
Unrealized appreciation on swaps | | | 5,673,257 |
Receivable for investments sold | | | 5,437,840 |
Unrealized appreciation on forward foreign currency exchange contracts | | | 1,182,416 |
Premium for swaps purchased | | | 875,925 |
Due from broker — variation margin | | | 371,490 |
Receivable for Series shares sold | | | 33,856 |
Prepaid expenses | | | 12,256 |
| | |
|
|
Total Assets | | | 1,518,610,217 |
| | |
|
|
| LIABILITIES | | | |
Payable for investments purchased | | | 240,908,091 |
Collateral for securities on loan | | | 51,702,846 |
Securities sold short, at value (proceeds $5,371,094) | | | 5,412,341 |
Unrealized depreciation on swaps | | | 1,142,608 |
Management fee payable | | | 412,694 |
Accrued expenses and other liabilities | | | 315,873 |
Payable for Series shares repurchased | | | 253,237 |
Unrealized depreciation on forward foreign currency exchange contracts | | | 163,896 |
Deferred trustees’ fees | | | 7,242 |
Transfer agent fee payable | | | 699 |
| | |
|
|
Total Liabilities | | | 300,319,527 |
| | |
|
|
| NET ASSETS | | $ | 1,218,290,690 |
| | |
|
|
Net assets were comprised of: | | | |
Paid-in capital | | $ | 1,215,813,705 |
Retained earnings | | | 2,476,985 |
| | |
|
|
Net assets, December 31, 2007 | | $ | 1,218,290,690 |
| | |
|
|
Net asset value and redemption price per share, $1,218,238,977 / 111,811,903 outstanding shares of beneficial interest (authorized 275,000,000 shares) | | $ | 10.90 |
| | |
|
|
STATEMENT OF OPERATIONS
Year Ended December 31, 2007
| | | | |
| INVESTMENT INCOME | | | | |
Interest | | $ | 57,500,479 | |
Affiliated dividend income | | | 10,447,770 | |
Affiliated income from securities loaned, net | | | 237,953 | |
| | |
|
|
|
| | | | 68,186,202 | |
| | |
|
|
|
| EXPENSES | | | | |
Management fee | | | 4,675,348 | |
Custodian’s fees and expenses | | | 236,000 | |
Shareholders’ reports | | | 80,000 | |
Insurance expenses | | | 33,000 | |
Trustees’ fees | | | 24,000 | |
Audit fee | | | 13,000 | |
Interest expense | | | 9,805 | |
Legal fees and expenses | | | 9,000 | |
Transfer agent’s fee and expenses (including affiliated expense of $3,600) (Note 4) | | | 4,000 | |
Commitment fee on syndicated credit agreement | | | 1,000 | |
Miscellaneous | | | 5,968 | |
| | |
|
|
|
Total expenses | | | 5,091,121 | |
| | |
|
|
|
| NET INVESTMENT INCOME | | | 63,095,081 | |
| | |
|
|
|
| NET REALIZED AND UNREALIZED GAIN (LOSS) ON INVESTMENTS, SWAPS AND FOREIGN CURRENCIES | | | | |
Net realized gain (loss) on: | | | | |
Investment transactions | | | 8,117,137 | |
Short sale transactions | | | (1,418,731 | ) |
Futures transactions | | | 3,753,688 | |
Swap transactions | | | 14,135,672 | |
Options written transactions | | | 4,684 | |
Foreign currency transactions | | | (2,516,828 | ) |
| | |
|
|
|
| | | | 22,075,622 | |
| | |
|
|
|
Net change in unrealized appreciation (depreciation) on: | | | | |
Investments | | | (24,606,666 | ) |
Securities sold short | | | (178,747 | ) |
Futures | | | 528,332 | |
Swaps | | | 4,177,788 | |
Foreign currencies | | | 616,432 | |
| | |
|
|
|
| | | | (19,462,861 | ) |
| | |
|
|
|
| NET GAIN ON INVESTMENTS, SWAPS AND FOREIGN CURRENCIES | | | 2,612,761 | |
| | |
|
|
|
| NET INCREASE IN NET ASSETS RESULTING FROM OPERATIONS | | $ | 65,707,842 | |
| | |
|
|
|
STATEMENT OF CHANGES IN NET ASSETS
| | | | | | | | |
| | | Year Ended December 31,
| |
| | | 2007
| | | 2006
| |
| INCREASE (DECREASE) IN NET ASSETS | | | | | | | | |
| OPERATIONS: | | | | | | | | |
Net investment income | | $ | 63,095,081 | | | $ | 60,783,991 | |
Net realized gain (loss) on investment, swap and foreign currency transactions | | | 22,075,622 | | | | (9,657,555 | ) |
Net change in unrealized appreciation (depreciation) on investments, swaps and foreign currencies | | | (19,462,861 | ) | | | 4,826,702 | |
| | |
|
|
| |
|
|
|
NET INCREASE IN NET ASSETS RESULTING FROM OPERATIONS | | | 65,707,842 | | | | 55,953,138 | |
| | |
|
|
| |
|
|
|
| DISTRIBUTIONS | | | (59,479,872 | ) | | | (68,284,295 | ) |
| | |
|
|
| |
|
|
|
| SERIES SHARE TRANSACTIONS: | | | | | | | | |
Series shares sold [12,326,563 and 3,007,043 shares, respectively] | | | 133,636,466 | | | | 32,538,204 | |
Series shares issued in reinvestment of distributions [5,514,681 and 6,373,024 shares, respectively] | | | 59,479,872 | | | | 68,284,295 | |
Series shares repurchased [12,074,002 and 15,646,812 shares, respectively] | | | (131,418,698 | ) | | | (168,772,245 | ) |
| | |
|
|
| |
|
|
|
NET INCREASE (DECREASE) IN NET ASSETS RESULTING FROM SERIES SHARE TRANSACTIONS | | | 61,697,640 | | | | (67,949,746 | ) |
| | |
|
|
| |
|
|
|
| TOTAL INCREASE (DECREASE) IN NET ASSETS | | | 67,925,610 | | | | (80,280,903 | ) |
| NET ASSETS: | | | | | | | | |
Beginning of year | | | 1,150,365,080 | | | | 1,230,645,983 | |
| | |
|
|
| |
|
|
|
End of year | | $ | 1,218,290,690 | | | $ | 1,150,365,080 | |
| | |
|
|
| |
|
|
|
SEE NOTES TO FINANCIAL STATEMENTS.
A51
SCHEDULE OF INVESTMENTS | December 31, 2007 |
| | | | | |
| LONG-TERM INVESTMENTS — 97.6% | | Value
(Note 2)
|
| COMMON STOCKS | | Shares
| |
| | | | | | |
Aerospace & Defense — 1.9% | | | | | |
Honeywell International, Inc. | | 374,200 | | $ | 23,039,494 |
Lockheed Martin Corp. | | 1,326 | | | 139,575 |
Orbital Sciences Corp.*(a) | | 1,075,700 | | | 26,376,164 |
United Technologies Corp. | | 454,100 | | | 34,756,814 |
| | | | |
|
|
| | | | | | 84,312,047 |
| | | | |
|
|
Air Freight & Logistics | | | | | |
United Parcel Service, Inc.
(Class B Stock) | | 891 | | | 63,012 |
| | | | |
|
|
Auto Components | | | | | |
WABCO Holdings, Inc.(a) | | 10 | | | 501 |
| | | | |
|
|
Auto Related — 0.2% | | | | | |
Tenneco, Inc.*(a) | | 322,000 | | | 8,394,540 |
| | | | |
|
|
Beverages — 1.5% | | | | | |
PepsiCo, Inc.(a) | | 881,123 | | | 66,877,236 |
| | | | |
|
|
Biotechnology — 2.6% | | | | | |
Amgen, Inc.* | | 508,800 | | | 23,628,672 |
Genentech, Inc.* | | 278,700 | | | 18,692,409 |
Genzyme Corp.*(a) | | 317,100 | | | 23,604,924 |
Gilead Sciences, Inc.*(a) | | 1,104,600 | | | 50,822,646 |
| | | | |
|
|
| | | | | | 116,748,651 |
| | | | |
|
|
Building Materials — 0.7% | | | | | |
Masco Corp. | | 1,547,562 | | | 33,442,815 |
| | | | |
|
|
Capital Goods — 0.9% | | | | | |
Illinois Tool Works, Inc. | | 443,100 | | | 23,723,574 |
Parker Hannifin Corp. | | 189,420 | | | 14,265,220 |
| | | | |
|
|
| | | | | | 37,988,794 |
| | | | |
|
|
Capital Markets — 4.1% | | | | | |
Bank of New York Mellon Corp. (The) | | 523,978 | | | 25,549,167 |
Goldman Sachs Group, Inc. (The) | | 260,812 | | | 56,087,620 |
Lehman Brothers Holdings, Inc. | | 161,240 | | | 10,551,546 |
Merrill Lynch & Co., Inc.(a) | | 654,800 | | | 35,149,664 |
Schwab, (Charles) Corp. | | 1,098,600 | | | 28,069,230 |
UBS AG(a) | | 569,100 | | | 26,178,600 |
| | | | |
|
|
| | | | | | 181,585,827 |
| | | | |
|
|
Chemicals — 1.3% | | | | | |
Air Products & Chemicals, Inc. | | 900 | | | 88,767 |
Monsanto Co. | | 332,500 | | | 37,136,925 |
Potash Corp. of Saskatchewan, Inc. (Canada)(a) | | 134,200 | | | 19,319,432 |
| | | | |
|
|
| | | | | | 56,545,124 |
| | | | |
|
|
Commercial Banks — 1.5% | | | | | |
Bank of America Corp. | | 421,648 | | | 17,397,196 |
Wells Fargo & Co. | | 1,605,414 | | | 48,467,449 |
| | | | |
|
|
| | | | | | 65,864,645 |
| | | | |
|
|
Commercial Services & Supplies — 1.1% | | | |
Monster Worldwide, Inc.*(a) | | 556,300 | | | 18,024,120 |
Waste Management, Inc. | | 883,600 | | | 28,867,212 |
| | | | |
|
|
| | | | | | 46,891,332 |
| | | | |
|
|
Communication Equipment — 6.5% | | | | | |
Ciena Corp.*(a) | | 333,300 | | | 11,368,863 |
Cisco Systems, Inc.*(a) | | 3,063,889 | | | 82,939,475 |
| | | | | |
COMMON STOCKS
(continued) | | Shares
| | Value
(Note 2)
|
| | | | | | |
Communication Equipment | | | |
Corning, Inc. | | 1,237,575 | | $ | 29,689,424 |
Motorola, Inc. | | 1,104,664 | | | 17,718,811 |
Nokia Corp., ADR (Finland) | | 450,200 | | | 17,283,178 |
QUALCOMM, Inc. | | 2,033,860 | | | 80,032,391 |
Research In Motion Ltd. (Canada)*(a) | | 415,800 | | | 47,151,720 |
| | | | |
|
|
| | | | | | 286,183,862 |
| | | | |
|
|
Computer Software — 0.6% | | | | | |
Network Appliance, Inc.* | | 1,112,300 | | | 27,763,008 |
| | | | |
|
|
Computers & Peripherals — 3.2% | | | | | |
Apple, Inc.* | | 256,000 | | | 50,708,480 |
Dell, Inc.*(a) | | 5,010 | | | 122,795 |
Hewlett-Packard Co. | | 790,000 | | | 39,879,200 |
Lexmark International, Inc.
(Class A Stock)*(a) | | 752,000 | | | 26,214,720 |
Seagate Technology
(Cayman Islands)(a) | | 1,028,000 | | | 26,214,000 |
| | | | |
|
|
| | | | | | 143,139,195 |
| | | | |
|
|
Construction — 0.9% | | | | | |
Toll Brothers, Inc.*(a) | | 1,940,260 | | | 38,921,616 |
| | | | |
|
|
Consumer Finance — 1.4% | | | | | |
American Express Co. | | 757,168 | | | 39,387,879 |
SLM Corp. | | 1,132,600 | | | 22,810,564 |
| | | | |
|
|
| | | | | | 62,198,443 |
| | | | |
|
|
Consumer Products & Services — 0.4% | | | |
Fortune Brands, Inc.(a) | | 236,600 | | | 17,120,376 |
| | | | |
|
|
Diversified Consumer Services — 1.1% | | | |
Career Education Corp.* | | 939,500 | | | 23,619,030 |
H&R Block, Inc.(a) | | 1,425,700 | | | 26,475,249 |
| | | | |
|
|
| | | | | | 50,094,279 |
| | | | |
|
|
Diversified Financial Services — 2.4% | | | | | |
Citigroup, Inc.(a) | | 415,204 | | | 12,223,606 |
CME Group, Inc. | | 24,800 | | | 17,012,800 |
JPMorgan Chase & Co. | | 1,061,547 | | | 46,336,526 |
KKR Private Equity Investors LLP(c) | | 1,295,700 | | | 23,529,912 |
KKR Private Equity Investors LLP, RDU (cost $7,567,532; purchased
7/18/06-8/3/06)(c)(e) | | 334,700 | | | 6,078,152 |
| | | | |
|
|
| | | | | | 105,180,996 |
| | | | |
|
|
Electric Utilities — 2.2% | | | | | |
Dominion Resources, Inc.(a) | | 485,400 | | | 23,032,230 |
Entergy Corp.(a) | | 178,600 | | | 21,346,272 |
Exelon Corp. | | 326,100 | | | 26,622,804 |
Progress Energy, Inc. | | 539,200 | | | 26,113,456 |
| | | | |
|
|
| | | | | | 97,114,762 |
| | | | |
|
|
Electrical Equipment — 0.8% | | | | | |
ABB Ltd., ADR (Switzerland) | | 419,500 | | | 12,081,600 |
First Solar, Inc.*(a) | | 94,200 | | | 25,164,588 |
| | | | |
|
|
| | | | | | 37,246,188 |
| | | | |
|
|
Electronic Components — 0.7% | | | | | |
Dolby Laboratories, Inc.
(Class A Stock)* | | 667,058 | | | 33,166,124 |
SEE NOTES TO FINANCIAL STATEMENTS.
A52
| | | | |
| | | EQUITY PORTFOLIO (Continued) | | |
SCHEDULE OF INVESTMENTS | December 31, 2007 |
| | | | | |
COMMON STOCKS
(continued) | | Shares
| | Value
(Note 2)
|
| | | | | | |
Electronic Components (continued) | | | | | |
Tyco Electronics Ltd. (Bermuda) | | 2,368 | | $ | 87,924 |
| | | | |
|
|
| | | | | | 33,254,048 |
| | | | |
|
|
Energy Equipment & Services — 2.4% | | | |
BJ Services Co. | | 3,340 | | | 81,028 |
Cameron International Corp.* | | 9,720 | | | 467,824 |
Diamond Offshore Drilling, Inc.(a) | | 274,620 | | | 38,996,040 |
Halliburton Co. | | 372,400 | | | 14,117,684 |
Schlumberger Ltd. | | 294,300 | | | 28,950,291 |
Tenaris SA, ADR (Luxembourg)(a) | | 510,500 | | | 22,834,665 |
| | | | |
|
|
| | | | | | 105,447,532 |
| | | | |
|
|
Financial – Bank & Trust — 0.4% | | | | | |
Hudson City Bancorp, Inc.(a) | | 1,329,500 | | | 19,969,090 |
| | | | |
|
|
Food & Staples Retailing — 2.9% | | | | | |
Costco Wholesale Corp.(a) | | 186,000 | | | 12,975,360 |
CVS / Caremark Corp. | | 428,400 | | | 17,028,900 |
Kroger Co. (The) | | 1,035,500 | | | 27,658,205 |
Wal-Mart Stores, Inc. | | 1,227,292 | | | 58,333,189 |
Whole Foods Market, Inc.(a) | | 327,800 | | | 13,374,240 |
| | | | |
|
|
| | | | | | 129,369,894 |
| | | | |
|
|
Food Products — 2.4% | | | | | |
Cadbury Schweppes PLC, ADR
(United Kingdom) | | 700,800 | | | 34,598,496 |
ConAgra Foods, Inc.(a) | | 1,198,200 | | | 28,505,178 |
Kellogg Co.(a) | | 385,515 | | | 20,212,551 |
McCormick & Co., Inc. | | 572,823 | | | 21,715,720 |
| | | | |
|
|
| | | | | | 105,031,945 |
| | | | |
|
|
Healthcare Equipment & Supplies — 1.6% | | | |
Alcon, Inc.(a) | | 172,200 | | | 24,631,488 |
Baxter International, Inc. | | 472,700 | | | 27,440,235 |
Covidien Ltd. (Bermuda) | | 2,368 | | | 104,879 |
Medtronic, Inc. | | 377,086 | | | 18,956,113 |
| | | | |
|
|
| | | | | | 71,132,715 |
| | | | |
|
|
Healthcare Providers & Services — 0.9% | | | |
Coventry Health Care, Inc.* | | 348,623 | | | 20,655,913 |
Omnicare, Inc.(a) | | 770,300 | | | 17,570,543 |
| | | | |
|
|
| | | | | | 38,226,456 |
| | | | |
|
|
Hotels, Restaurants & Leisure — 1.0% | | | |
Burger King Holdings, Inc. | | 250,800 | | | 7,150,308 |
McDonald’s Corp.(a) | | 672,005 | | | 39,587,815 |
| | | | |
|
|
| | | | | | 46,738,123 |
| | | | |
|
|
Household Products — 1.8% | | | | | |
Colgate-Palmolive Co. | | 365,700 | | | 28,509,972 |
Kimberly-Clark Corp. | | 387,500 | | | 26,869,250 |
Procter & Gamble Co. | | 318,178 | | | 23,360,629 |
| | | | |
|
|
| | | | | | 78,739,851 |
| | | | |
|
|
Independent Power Producers & Energy Traders — 0.7% |
NRG Energy, Inc.*(a) | | 692,200 | | | 29,999,948 |
| | | | |
|
|
Industrial Conglomerates — 3.5% | | | | | |
General Electric Co. | | 2,674,793 | | | 99,154,576 |
Textron, Inc.(a) | | 756,412 | | | 53,932,176 |
Tyco International Ltd. (Bermuda) | | 2,368 | | | 93,891 |
| | | | |
|
|
| | | | | | 153,180,643 |
| | | | |
|
|
| | | | | |
COMMON STOCKS
(continued) | | Shares
| | Value
(Note 2)
|
| | | | | | |
Insurance — 5.0% | | | | | |
AFLAC, Inc. | | 643,870 | | $ | 40,325,578 |
American International Group, Inc. | | 1,285,131 | | | 74,923,137 |
Berkshire Hathaway, Inc.
(Class A Stock)* | | 207 | | | 29,311,200 |
Loews Corp. | | 763,000 | | | 38,409,420 |
MBIA, Inc.(a) | | 1,188,200 | | | 22,136,166 |
Progressive Corp. (The) | | 852,200 | | | 16,328,152 |
| | | | |
|
|
| | | | | | 221,433,653 |
| | | | |
|
|
Internet & Catalog Retail — 0.5% | | | | | |
Amazon.com, Inc.*(a) | | 247,200 | | | 22,900,608 |
| | | | |
|
|
Internet Software & Services — 1.6% | | | | | |
Akamai Technologies, Inc.*(a) | | 310,800 | | | 10,753,680 |
Google, Inc. (Class A Stock)* | | 86,000 | | | 59,467,280 |
| | | | |
|
|
| | | | | | 70,220,960 |
| | | | |
|
|
Life Science Tools & Services — 0.7% | | | |
Thermo Fisher Scientific, Inc.* | | 549,000 | | | 31,666,320 |
| | | | |
|
|
Media — 4.5% | | | | | |
Comcast Corp. (Class A Stock)*(a) | | 1,864,250 | | | 34,041,205 |
EchoStar Communications Corp.
(Class A Stock)* | | 504,619 | | | 19,034,229 |
Liberty Global, Inc.
(Class C Stock)* | | 729,150 | | | 26,679,598 |
News Corp. (Class A Stock) | | 1,443,826 | | | 29,583,995 |
News Corp. (Class B Stock) | | 1,735,538 | | | 36,880,182 |
Walt Disney Co. (The)(a) | | 925,000 | | | 29,859,000 |
XM Satellite Radio Holdings, Inc.
(Class A Stock)*(a) | | 1,802,000 | | | 22,056,480 |
| | | | |
|
|
| | | | | | 198,134,689 |
| | | | |
|
|
Metals & Mining — 1.4% | | | | | |
Barrick Gold Corp. (Canada) | | 1,003,274 | | | 42,187,672 |
Freeport-McMoRan Copper & Gold, Inc.(a) | | 182,500 | | | 18,695,300 |
| | | | |
|
|
| | | | | | 60,882,972 |
| | | | |
|
|
Multi-Line Retail — 0.9% | | | | | |
Staples, Inc.(a) | | 1,667,863 | | | 38,477,599 |
| | | | |
|
|
Multi-Utilities — 1.6% | | | | | |
Sempra Energy | | 1,183,846 | | | 73,256,390 |
| | | | |
|
|
Oil, Gas & Consumable Fuels — 11.0% | | | |
ConocoPhillips | | 235,586 | | | 20,802,244 |
Exxon Mobil Corp. | | 549,228 | | | 51,457,171 |
Hess Corp. | | 247,500 | | | 24,962,850 |
Marathon Oil Corp. | | 1,005,900 | | | 61,219,074 |
Murphy Oil Corp.(a) | | 329,400 | | | 27,946,296 |
Newfield Exploration Co.*(a) | | 937,380 | | | 49,399,926 |
Nexen, Inc. | | 1,039,000 | | | 33,528,530 |
Occidental Petroleum Corp.(a) | | 559,500 | | | 43,075,905 |
Petroleo Brasileiro SA, ADR (Brazil)(a) | | 411,000 | | | 47,363,640 |
Sandridge Energy, Inc.*(a) | | 78,730 | | | 2,823,258 |
Suncor Energy, Inc. (Canada) | | 404,746 | | | 44,253,651 |
Total SA, ADR (France)(a) | | 628,726 | | | 51,932,768 |
Williams Cos., Inc. | | 756,600 | | | 27,071,148 |
| | | | |
|
|
| | | | | | 485,836,461 |
| | | | |
|
|
SEE NOTES TO FINANCIAL STATEMENTS.
A53
| | | | |
| | | EQUITY PORTFOLIO (Continued) | | |
SCHEDULE OF INVESTMENTS | December 31, 2007 |
| | | | | |
COMMON STOCKS
(continued) | | Shares
| | Value
(Note 2)
|
| | | | | | |
Pharmaceuticals — 5.9% | | | | | |
Abbott Laboratories(a) | | 1,176,355 | | $ | 66,052,333 |
Elan Corp. PLC, ADR (Ireland)*(a) | | 2,036,900 | | | 44,771,062 |
Eli Lilly & Co. | | 1,697 | | | 90,603 |
Merck & Co., Inc. | | 533,400 | | | 30,995,874 |
Roche Holdings Ltd., ADR (Switzerland) | | 200,500 | | | 17,122,700 |
Schering-Plough Corp. | | 1,786,500 | | | 47,592,360 |
Teva Pharmaceutical Industries Ltd., ADR (Israel)(a) | | 534,300 | | | 24,834,264 |
Wyeth | | 647,900 | | | 28,630,701 |
| | | | |
|
|
| | | | | | 260,089,897 |
| | | | |
|
|
Semiconductors & Semiconductor Equipment — 1.8% |
ASML Holding NV (Netherlands)*(a) | | 994,858 | | | 31,129,107 |
Spansion, Inc. (Class A Stock)*(a) | | 2,861,500 | | | 11,245,695 |
Texas Instruments, Inc.(a) | | 1,122,455 | | | 37,489,997 |
| | | | |
|
|
| | | | | | 79,864,799 |
| | | | |
|
|
Software — 4.4% | | | | | |
Adobe Systems, Inc.* | | 1,200,013 | | | 51,276,556 |
Microsoft Corp. | | 3,250,208 | | | 115,707,405 |
Symantec Corp.* | | 1,614,410 | | | 26,056,577 |
| | | | |
|
|
| | | | | | 193,040,538 |
| | | | |
|
|
Specialty Retail — 0.8% | | | | | |
Bed Bath & Beyond, Inc.* | | 770 | | | 22,630 |
Best Buy Co., Inc.(a) | | 663,100 | | | 34,912,215 |
| | | | |
|
|
| | | | | | 34,934,845 |
| | | | |
|
|
Telecommunications — 0.3% | | | | | |
Comverse Technology, Inc.* | | 23,803 | | | 410,602 |
Juniper Networks, Inc.*(a) | | 375,100 | | | 12,453,320 |
| | | | |
|
|
| | | | | | 12,863,922 |
| | | | |
|
|
Textiles, Apparel & Luxury Goods — 0.5% |
NIKE, Inc. (Class B Stock)(a) | | 370,000 | | | 23,768,800 |
| | | | |
|
|
Thrifts & Mortgage Finance — 0.7% | | | | | |
Fannie Mae(a) | | 731,100 | | | 29,229,378 |
| | | | |
|
|
Tobacco — 1.4% | | | | | |
Altria Group, Inc. | | 819,500 | | | 61,937,810 |
| | | | |
|
|
Wireless Telecommunication Services — 1.0% |
NII Holdings, Inc.*(a) | | 446,300 | | | 21,565,216 |
Sprint Nextel Corp. | | 1,856,216 | | | 24,372,116 |
| | | | |
|
|
| | | | | | 45,937,332 |
| | | | |
|
|
TOTAL LONG-TERM INVESTMENTS
(cost $3,528,659,749) | | | 4,319,244,467 |
| | | | |
|
|
| | | | | | |
| | | Shares
| | Value
(Note 2)
| |
| | | | | | | |
| SHORT-TERM INVESTMENT — 14.5% | | | | |
AFFILIATED MONEY MARKET MUTUAL FUND | |
Dryden Core Investment Fund — Taxable Money Market Series (cost $642,456,158; includes $549,843,233 of cash collateral for securities on loan)(b)(w) (Note 4) | | 642,456,158 | | $ | 642,456,158 | |
| | | | |
|
|
|
TOTAL INVESTMENTS — 112.1%
(cost $4,171,115,907) | | | 4,961,700,625 | |
| | | | |
|
|
|
LIABILITIES IN EXCESS OF
OTHER ASSETS — (12.1)% | | | (536,499,233 | ) |
| | | | |
|
|
|
NET ASSETS — 100.0% | | $ | 4,425,201,392 | |
| | |
|
|
|
The following abbreviations are used in portfolio descriptions:
| | |
| ADR | | American Depositary Receipt |
| RDU | | Restricted Depositary Unit |
| * | Non-income producing security. |
| (a) | All or a portion of security is on loan. The aggregate market value of such securities is $525,086,153; cash collateral of $549,843,233 (included with liabilities) was received with which the portfolio purchased highly liquid short-term investments. |
| (b) | Represents security, or a portion thereof, purchased with cash collateral received for securities on loan. |
| (c) | Securities were purchased pursuant to Rule 144A under the Securities Act of 1933 and may not be resold subject to that rule except to qualified institutional buyers. Unless otherwise noted, 144A securities are deemed to be liquid. |
| (e) | Indicates a security illiquid and restricted as to resale. The aggregated cost of such security was $7,567,532. The aggregated value of $6,078,152 is approximately 0.14% of net assets. |
| (w) | Prudential Investments LLC, the manager of the Portfolio, also serves as manager of the Dryden Core Investment Fund-Taxable Money Market Series. |
SEE NOTES TO FINANCIAL STATEMENTS.
A54
| | | | |
| | | EQUITY PORTFOLIO (Continued) | | |
SCHEDULE OF INVESTMENTS | December 31, 2007 |
The industry classification of investments and liabilities in excess of other assets shown as a percentage of net assets as of December 31, 2007 were as follows:
| | | |
Affiliated Money Market Mutual Fund (12.4% represents investments purchased with collateral from securities on loan) | | 14.5 | % |
Oil, Gas & Consumable Fuels | | 11.0 | |
Communication Equipment | | 6.5 | |
Pharmaceuticals | | 5.9 | |
Insurance | | 5.0 | |
Media | | 4.5 | |
Software | | 4.4 | |
Capital Markets | | 4.1 | |
Industrial Conglomerates | | 3.5 | |
Computers & Peripherals | | 3.2 | |
Food & Staples Retailing | | 2.9 | |
Biotechnology | | 2.6 | |
Energy Equipment & Services | | 2.4 | |
Diversified Financial Services | | 2.4 | |
Food Products | | 2.4 | |
Electric Utilities | | 2.2 | |
Aerospace & Defense | | 1.9 | |
Semiconductors & Semiconductor Equipment | | 1.8 | |
Household Products | | 1.8 | |
Multi-Utilities | | 1.6 | |
Healthcare Equipment & Supplies | | 1.6 | |
Internet Software & Services | | 1.6 | |
Beverages | | 1.5 | |
Commercial Banks | | 1.5 | |
Consumer Finance | | 1.4 | |
Tobacco | | 1.4 | |
Metals & Mining | | 1.4 | |
Chemicals | | 1.3 | |
Diversified Consumer Services | | 1.1 | |
Commercial Services & Supplies | | 1.1 | |
Hotels, Restaurants & Leisure | | 1.0 | |
Wireless Telecommunication Services | | 1.0 | |
Construction | | 0.9 | |
Multi-Line Retail | | 0.9 | |
Healthcare Providers & Services | | 0.9 | |
Capital Goods | | 0.9 | |
Electrical Equipment | | 0.8 | |
Specialty Retail | | 0.8 | |
Building Materials | | 0.7 | |
Electronic Components | | 0.7 | |
Life Science Tools & Services | | 0.7 | |
Independent Power Producers & Energy Traders | | 0.7 | |
Thrifts & Mortgage Finance | | 0.7 | |
Computer Software | | 0.6 | |
Textiles, Apparel & Luxury Goods | | 0.5 | |
Internet & Catalog Retail | | 0.5 | |
Financial – Bank & Trust | | 0.4 | |
Consumer Products & Services | | 0.4 | |
Telecommunications | | 0.3 | |
Auto Related | | 0.2 | |
| | |
|
|
| | | 112.1 | |
Liabilities in excess of other assets | | (12.1 | ) |
| | |
|
|
| | | 100.0 | % |
| | |
|
|
SEE NOTES TO FINANCIAL STATEMENTS.
A55
| | | | |
| | | EQUITY PORTFOLIO (Continued) | | |
STATEMENT OF ASSETS AND LIABILITIES
December 31, 2007
| | | |
| ASSETS | | | |
Investments at value, including securities on loan of $525,086,153: | | | |
Unaffiliated investments (cost $3,528,659,749) | | $ | 4,319,244,467 |
Affiliated investments (cost $642,456,158) | | | 642,456,158 |
Cash | | | 8,981,906 |
Receivable for investments sold | | | 6,956,203 |
Dividends and interest receivable | | | 6,157,776 |
Receivable for Series shares sold | | | 240,720 |
Prepaid expenses | | | 30,912 |
| | |
|
|
Total Assets | | | 4,984,068,142 |
| | |
|
|
| LIABILITIES | | | |
Collateral for securities on loan | | | 549,843,233 |
Payable for investments purchased | | | 5,841,986 |
Management fee payable | | | 1,705,632 |
Payable for Series shares repurchased | | | 1,118,432 |
Accrued expenses and other liabilities | | | 352,932 |
Transfer agent fees payable | | | 2,091 |
Deferred trustees’ fees | | | 1,928 |
Distribution fee payable | | | 322 |
Administration fee payable | | | 194 |
| | |
|
|
Total Liabilities | | | 558,866,750 |
| | |
|
|
| NET ASSETS | | $ | 4,425,201,392 |
| | |
|
|
Net assets were comprised of: | | | |
Paid-in capital | | $ | 3,281,472,950 |
Retained earnings | | | 1,143,728,442 |
| | |
|
|
Net assets, December 31, 2007 | | $ | 4,425,201,392 |
| | |
|
|
| Class I: | | | |
Net asset value and redemption price per share, $4,423,930,480 / 149,088,920 outstanding shares of beneficial interest (authorized 525,000,000 shares) | | $ | 29.67 |
| | |
|
|
| Class II: | | | |
Net asset value and redemption price per share, $1,270,912 / 42,631 outstanding shares of beneficial interest (authorized 50,000,000 shares) | | $ | 29.81 |
| | |
|
|
STATEMENT OF OPERATIONS
Year Ended December 31, 2007
| | | | |
| INVESTMENT INCOME | | | | |
Unaffiliated dividend income (net of $1,672,611 foreign withholding tax) | | $ | 66,237,534 | |
Affiliated dividend income | | | 4,641,175 | |
Affiliated income from securities lending, net | | | 1,846,798 | |
Interest | | | 53 | |
| | |
|
|
|
| | | | 72,725,560 | |
| | |
|
|
|
| EXPENSES | | | | |
Management fee | | | 20,151,275 | |
Distribution fee—Class II | | | 4,353 | |
Administration fee—Class II | | | 2,612 | |
Custodian’s fees and expenses | | | 389,000 | |
Insurance expenses | | | 96,000 | |
Shareholders’ reports | | | 90,000 | |
Trustees’ fees | | | 66,000 | |
Audit fee | | | 19,000 | |
Commitment fee on syndicated credit agreement | | | 10,000 | |
Legal fees and expenses | | | 9,000 | |
Transfer agent’s fees and expenses (including affiliated expense of $5,000) (Note 4) | | | 5,000 | |
Miscellaneous | | | 46,736 | |
| | |
|
|
|
Total expenses | | | 20,888,976 | |
| | |
|
|
|
| NET INVESTMENT INCOME | | | 51,836,584 | |
| | |
|
|
|
| NET REALIZED AND UNREALIZED GAIN (LOSS) ON INVESTMENTS AND FOREIGN CURRENCIES | | | | |
Net realized gain (loss) on: | | | | |
Investment transactions | | | 385,358,041 | |
Foreign currency transactions | | | (167,742 | ) |
| | |
|
|
|
| | | | 385,190,299 | |
| | |
|
|
|
Net change in unrealized appreciation (depreciation) on: | | | | |
Investments | | | (37,721,616 | ) |
Foreign currencies | | | 1,027 | |
| | |
|
|
|
| | | | (37,720,589 | ) |
| | |
|
|
|
| NET GAIN ON INVESTMENTS AND FOREIGN CURRENCIES | | | 347,469,710 | |
| | |
|
|
|
| NET INCREASE IN NET ASSETS RESULTING FROM OPERATIONS | | $ | 399,306,294 | |
| | |
|
|
|
STATEMENT OF CHANGES IN NET ASSETS
| | | | | | | | |
| | | Year Ended
December 31, 2007
| | | Year Ended
December 31, 2006
| |
| INCREASE (DECREASE) IN NET ASSETS | | | | | | | | |
| OPERATIONS: | | | | | | | | |
Net investment income | | $ | 51,836,584 | | | $ | 47,026,456 | |
Net realized gain on investment and foreign currency transactions | | | 385,190,299 | | | | 333,212,503 | |
Net change in unrealized appreciation (depreciation) on investments and foreign currencies | | | (37,720,589 | ) | | | 125,859,212 | |
| | |
|
|
| |
|
|
|
NET INCREASE IN NET ASSETS RESULTING FROM OPERATIONS | | | 399,306,294 | | | | 506,098,171 | |
| | |
|
|
| |
|
|
|
| Distributions | | | | | | | | |
Class I | | | (49,976,890 | ) | | | (46,000,931 | ) |
Class II | | | (9,549 | ) | | | (11,345 | ) |
| | |
|
|
| |
|
|
|
TOTAL DISTRIBUTIONS | | | (49,986,439 | ) | | | (46,012,276 | ) |
| | |
|
|
| |
|
|
|
| SERIES SHARE TRANSACTIONS (NOTE 7): | | | | | | | | |
Series shares sold | | | 29,826,206 | | | | 56,539,838 | |
Series shares issued in reinvestment of distributions | | | 49,986,439 | | | | 46,012,276 | |
Series shares repurchased | | | (408,578,092 | ) | | | (443,931,719 | ) |
| | |
|
|
| |
|
|
|
DECREASE IN NET ASSETS RESULTING FROM SERIES SHARE TRANSACTIONS | | | (328,765,447 | ) | | | (341,379,605 | ) |
| | |
|
|
| |
|
|
|
| TOTAL INCREASE IN NET ASSETS | | | 20,554,408 | | | | 118,706,290 | |
| NET ASSETS: | | | | | | | | |
Beginning of year | | | 4,404,646,984 | | | | 4,285,940,694 | |
| | |
|
|
| |
|
|
|
End of year | | $ | 4,425,201,392 | | | $ | 4,404,646,984 | |
| | |
|
|
| |
|
|
|
SEE NOTES TO FINANCIAL STATEMENTS.
A56
| | | | |
| | | FLEXIBLE MANAGED PORTFOLIO | | |
SCHEDULE OF INVESTMENTS | December 31, 2007 |
| | | | | |
| LONG-TERM INVESTMENTS — 92.0% |
| COMMON STOCKS — 64.5% | | Shares
| | Value
(Note 2)
|
| | | | | | |
Aerospace & Defense — 2.0% | | | | | |
Boeing Co. (The) | | 188,700 | | $ | 16,503,702 |
European Aeronautic Defence and Space Co. (Netherlands) | | 32,645 | | | 1,041,918 |
General Dynamics Corp. | | 15,100 | | | 1,343,749 |
Honeywell International, Inc. | | 200,000 | | | 12,314,000 |
Lockheed Martin Corp. | | 174,600 | | | 18,378,396 |
Northrop Grumman Corp. | | 213,200 | | | 16,766,048 |
Raytheon Co. | | 43,300 | | | 2,628,310 |
United Technologies Corp. | | 83,800 | | | 6,414,052 |
| | | | |
|
|
| | | | | | 75,390,175 |
| | | | |
|
|
Air Freight & Logistics — 0.2% | | | | | |
Atlas Air Worldwide Holdings, Inc.(a) | | 9,200 | | | 498,824 |
Pacer International, Inc. | | 17,200 | | | 251,120 |
TNT NV (Netherlands) | | 22,436 | | | 926,674 |
United Parcel Service, Inc. (Class B Stock) | | 61,000 | | | 4,313,920 |
| | | | |
|
|
| | | | | | 5,990,538 |
| | | | |
|
|
Airlines — 0.1% | | | | | |
Air France KLM (France) | | 19,362 | | | 680,814 |
British Airways PLC (United Kingdom)(a) | | 35,460 | | | 218,643 |
Deutsche Lufthansa AG (Germany) | | 24,172 | | | 642,848 |
Japan Airlines Corp. (Japan) | | 47,000 | | | 106,585 |
Qantas Airways Ltd. (Australia) | | 365,105 | | | 1,734,736 |
| | | | |
|
|
| | | | | | 3,383,626 |
| | | | |
|
|
Auto Components — 0.1% | | | | | |
Aisin Seiki Co. Ltd. (Japan) | | 32,400 | | | 1,341,434 |
Bridgestone Corp. (Japan) | | 41,100 | | | 725,621 |
Denso Corp. (Japan) | | 20,500 | | | 834,233 |
NOK Corp. (Japan) | | 5,700 | | | 119,931 |
Rieter Holding AG (Switzerland) | | 577 | | | 254,825 |
Tokai Rika Co. Ltd. (Japan) | | 14,800 | | | 456,297 |
Toyota Industries Corp. (Japan) | | 16,600 | | | 673,026 |
| | | | |
|
|
| | | | | | 4,405,367 |
| | | | |
|
|
Automobiles — 0.4% | | | | | |
Daimler AG (Germany) | | 13,787 | | | 1,334,616 |
Fiat S.p.A. (Italy) | | 50,575 | | | 1,308,796 |
Harley-Davidson, Inc. | | 71,900 | | | 3,358,449 |
Honda Motor Co. Ltd. (Japan) | | 26,900 | | | 888,637 |
Nissan Motor Co. Ltd. (Japan) | | 28,700 | | | 313,246 |
Peugeot SA (France) | | 24,754 | | | 1,876,537 |
Renault SA (France) | | 7,304 | | | 1,035,953 |
Toyota Motor Corp. (Japan) | | 99,100 | | | 5,277,939 |
Volkswagen AG (Germany) | | 1,333 | | | 304,869 |
| | | | |
|
|
| | | | | | 15,699,042 |
| | | | |
|
|
Beverages — 1.5% | | | | | |
Anheuser-Busch Cos., Inc. | | 331,800 | | | 17,366,412 |
Asahi Breweries Ltd. (Japan) | | 6,400 | | | 107,955 |
Carlsberg A/S (Denmark) | | 7,400 | | | 895,246 |
Coca-Cola Co. (The) | | 156,700 | | | 9,616,679 |
Coca-Cola Hellenic Bottling Co. SA (Greece) | | 19,135 | | | 828,101 |
Coca-Cola West Holdings Co. Ltd. (Japan) | | 37,000 | | | 816,857 |
Molson Coors Brewing Co. (Class B Stock)(b) | | 24,200 | | | 1,249,204 |
Pepsi Bottling Group, Inc. | | 48,400 | | | 1,909,864 |
PepsiCo, Inc. | | 303,220 | | | 23,014,398 |
| | | | |
|
|
| | | | | | 55,804,716 |
| | | | |
|
|
SEE NOTES TO FINANCIAL STATEMENTS.
A57
| | | | |
| | | FLEXIBLE MANAGED PORTFOLIO (Continued) | | |
SCHEDULE OF INVESTMENTS | December 31, 2007 |
| | | | | |
COMMON STOCKS
(continued) | | Shares
| | Value
(Note 2)
|
| | | | | | |
Biotechnology — 0.6% | | | | | |
Amgen, Inc.(a) | | 181,708 | | $ | 8,438,520 |
CSL Limited (Australia) | | 47,568 | | | 1,506,948 |
Cubist Pharmaceuticals, Inc.(a)(b) | | 130,500 | | | 2,676,555 |
Millennium Pharmaceuticals, Inc.(a)(b) | | 108,500 | | | 1,625,330 |
OSI Pharmaceuticals, Inc.(a)(b) | | 102,600 | | | 4,977,126 |
PDL BioPharma, Inc.(a)(b) | | 55,900 | | | 979,368 |
| | | | |
|
|
| | | | | | 20,203,847 |
| | | | |
|
|
Building Products — 0.1% | | | | | |
Apogee Enterprises, Inc. | | 11,400 | | | 195,054 |
Asahi Glass Co. Ltd. (Japan) | | 100,000 | | | 1,322,539 |
Cie de Saint-Gobain (France) | | 19,285 | | | 1,818,339 |
Nippon Sheet Glass Co. Ltd. (Japan) | | 211,000 | | | 1,065,137 |
Sanwa Shutter Corp. (Japan) | | 49,000 | | | 240,563 |
| | | | |
|
|
| | | | | | 4,641,632 |
| | | | |
|
|
Capital Markets — 2.5% | | | | | |
3i Group PLC (United Kingdom) | | 15,656 | | | 312,584 |
Apollo Investment Corp. | | 44,300 | | | 755,315 |
Charles Schwab Corp. (The) | | 219,200 | | | 5,600,560 |
Credit Suisse Group (Switzerland) | | 52,665 | | | 3,167,855 |
Deutsche Bank AG (Germany) | | 25,177 | | | 3,293,767 |
Franklin Resources, Inc. | | 45,200 | | | 5,172,236 |
Goldman Sachs Group, Inc. (The)(b) | | 122,600 | | | 26,365,130 |
Investec PLC (United Kingdom) | | 46,075 | | | 412,956 |
Janus Capital Group, Inc.(b) | | 342,400 | | | 11,247,840 |
Lazard Ltd. (Class A Stock) (Bermuda) | | 77,200 | | | 3,140,496 |
Macquarie Bank Ltd. (Australia) | | 7,418 | | | 496,318 |
MCG Capital Corp. | | 27,600 | | | 319,884 |
Merrill Lynch & Co., Inc.(b) | | 274,200 | | | 14,719,056 |
MF Global Ltd. (Bermuda)(a) | | 18,100 | | | 569,607 |
Morgan Stanley(b) | | 223,490 | | | 11,869,554 |
TD Ameritrade Holding Corp.(a)(b) | | 178,000 | | | 3,570,680 |
UBS AG (Switzerland) | | 19,523 | | | 903,595 |
| | | | |
|
|
| | | | | | 91,917,433 |
| | | | |
|
|
Chemicals — 0.9% | | | | | |
Altana AG (Germany) | | 14,803 | | | 359,270 |
BASF AG (Germany) | | 15,021 | | | 2,223,820 |
Daicel Chemical Industries Ltd. (Japan) | | 17,000 | | | 101,656 |
Dainippon Ink and Chemicals, Inc. (Japan) | | 124,000 | | | 618,205 |
Dow Chemical Co. (The) | | 309,800 | | | 12,212,317 |
E. I. du Pont de Nemours & Co. | | 76,000 | | | 3,350,840 |
Eastman Chemical Co. | | 55,900 | | | 3,414,931 |
Koninklijke DSM NV (Netherlands) | | 37,404 | | | 1,768,018 |
Kuraray Co. Ltd. (Japan) | | 83,500 | | | 1,007,370 |
Mitsubishi Chemical Holdings Corp. (Japan) | | 205,000 | | | 1,564,085 |
Mitsubishi Gas Chemical Co., Inc. (Japan) | | 56,000 | | | 544,777 |
Nippon Shokubai Co. Ltd. (Japan) | | 36,000 | | | 344,951 |
Olin Corp. | | 139,600 | | | 2,698,468 |
OM Group, Inc.(a)(b) | | 21,900 | | | 1,260,126 |
Shin-Etsu Chemical Co. Ltd. (Japan) | | 6,000 | | | 373,147 |
Terra Industries, Inc.(a)(b) | | 49,800 | | | 2,378,448 |
Tosoh Corp. (Japan) | | 41,000 | | | 174,770 |
Zeon Corp. (Japan) | | 34,000 | | | 202,810 |
Zep, Inc.(a)(b) | | 24,600 | | | 341,202 |
| | | | |
|
|
| | | | | | 34,939,211 |
| | | | |
|
|
SEE NOTES TO FINANCIAL STATEMENTS.
A58
| | | | |
| | | FLEXIBLE MANAGED PORTFOLIO (Continued) | | |
SCHEDULE OF INVESTMENTS | December 31, 2007 |
| | | | | |
COMMON STOCKS
(continued) | | Shares
| | Value
(Note 2)
|
| | | | | | |
Commercial Banks — 2.6% | | | | | |
Allied Irish Banks PLC (Ireland) | | 15,749 | | $ | 360,838 |
Alpha Bank A.E. (Greece) | | 43,288 | | | 1,575,904 |
Australia & New Zealand Banking Group Ltd. (Australia) | | 3,496 | | | 83,664 |
Banco Bilbao Vizcaya Argentaria SA (Spain) | | 151,957 | | | 3,723,554 |
Banco BPI SA (Portugal) | | 45,911 | | | 359,786 |
Banco Espirito Santo SA (Portugal) | | 74,933 | | | 1,643,340 |
Banco Popolare Scarl (Italy)(a) | | 6,532 | | | 144,780 |
Banco Santander Central Hispano SA (Spain) | | 244,950 | | | 5,296,739 |
Barclays PLC (United Kingdom) | | 136,015 | | | 1,364,590 |
BB&T Corp.(b) | | 159,500 | | | 4,891,865 |
BNP Paribas (France) | | 35,500 | | | 3,852,230 |
Central Pacific Financial Corp. | | 15,100 | | | 278,746 |
Chiba Bank Ltd. (The) (Japan) | | 57,000 | | | 458,643 |
Comerica, Inc. | | 55,300 | | | 2,407,209 |
Comerzbank AG (Germany) | | 57,115 | | | 2,195,350 |
Commonwealth Bank of Australia (Australia) | | 10,915 | | | 562,764 |
Danske Bank A/S (Denmark) | | 50,500 | | | 1,977,897 |
Dexia (Belgium) | | 67,112 | | | 1,690,629 |
DNB NOR ASA (Norway) | | 129,500 | | | 1,979,521 |
Fifth Third Bancorp | | 61,300 | | | 1,540,469 |
Hachijuni Bank Ltd. (The) (Japan) | | 18,000 | | | 120,942 |
HBOS PLC (United Kingdom) | | 135,366 | | | 1,980,532 |
HSBC Holdings PLC (United Kingdom) | | 191,011 | | | 3,201,514 |
Huntington Bancshares, Inc.(b) | | 267,400 | | | 3,946,824 |
Hypo Real Estate Holding AG (Germany) | | 26,676 | | | 1,415,372 |
Intesa Sanpaolo S.p.A (Italy) | | 73,808 | | | 583,799 |
Jyske Bank A/S (Denmark)(a) | | 3,450 | | | 271,939 |
KeyCorp | | 231,700 | | | 5,433,365 |
Lloyds TSB Group PLC (United Kingdom) | | 101,341 | | | 952,165 |
Mitsubishi UFJ Financial Group, Inc. (Japan) | | 28,400 | | | 267,810 |
National Australia Bank Ltd. (Australia) | | 18,628 | | | 613,597 |
National Bank of Greece SA (Greece) | | 6,265 | | | 430,325 |
Regions Financial Corp.(b) | | 167,600 | | | 3,963,740 |
Royal Bank of Scotland Group PLC (United Kingdom) | | 352,939 | | | 3,119,375 |
Skandinaviska Enskilda Banken AB (Class A Stock) (Sweden) | | 36,900 | | | 944,880 |
Societe Generale (France) | | 10,640 | | | 1,538,979 |
Sumitomo Mitsui Financial Group, Inc. (Japan) | | 136 | | | 1,006,438 |
Svenska Handelbanken (Class A Stock) (Sweden) | | 46,600 | | | 1,492,481 |
Sydbank A/S (Denmark) | | 7,756 | | | 333,429 |
U.S. Bancorp | | 149,732 | | | 4,752,494 |
UniCredito Italiano S.p.A (Italy) | | 298,052 | | | 2,475,160 |
Wachovia Corp.(b) | | 119,600 | | | 4,548,388 |
Wells Fargo & Co. | | 510,700 | | | 15,418,034 |
Westpac Banking Corp. (Australia) | | 49,528 | | | 1,204,371 |
Zions Bancorporation | | 14,000 | | | 653,660 |
| | | | |
|
|
| | | | | | 97,058,131 |
| | | | |
|
|
Commercial Services & Supplies — 0.4% | | | | | |
Administaff, Inc. | | 56,900 | | | 1,609,132 |
American Reprographics Co.(a) | | 23,100 | | | 380,688 |
CRA International, Inc.(a) | | 14,700 | | | 699,867 |
Downer EDI Ltd. (Australia) | | 116,025 | | | 544,861 |
Hays PLC (United Kingdom) | | 45,694 | | | 105,057 |
Herman Miller, Inc. | | 25,500 | | | 825,945 |
Michael Page International PLC (United Kingdom) | | 49,957 | | | 286,401 |
PeopleSupport, Inc.(a)(b) | | 41,000 | | | 560,880 |
Robert Half International, Inc. | | 140,800 | | | 3,807,232 |
Steelcase, Inc. (Class A Stock) | | 81,400 | | | 1,291,818 |
Stericycle, Inc.(a)(b) | | 56,900 | | | 3,379,860 |
SEE NOTES TO FINANCIAL STATEMENTS.
A59
| | | | |
| | | FLEXIBLE MANAGED PORTFOLIO (Continued) | | |
SCHEDULE OF INVESTMENTS | December 31, 2007 |
| | | | | |
COMMON STOCKS
(continued) | | Shares
| | Value
(Note 2)
|
| | | | | | |
Commercial Services & Supplies (continued) | | | | | |
TrueBlue, Inc.(a) | | 108,500 | | $ | 1,571,080 |
Waste Management, Inc. | | 17,200 | | | 561,924 |
| | | | |
|
|
| | | | | | 15,624,745 |
| | | | |
|
|
Communications Equipment — 1.3% | | | | | |
Cisco Systems, Inc.(a) | | 619,900 | | | 16,780,693 |
CommScope, Inc.(a) | | 28,400 | | | 1,397,564 |
Juniper Networks, Inc.(a)(b) | | 419,500 | | | 13,927,400 |
Nokia Corp. OYJ (Finland) | | 145,344 | | | 5,635,515 |
QUALCOMM, Inc. | | 218,400 | | | 8,594,040 |
Uniden Corp. (Japan) | | 12,000 | | | 69,323 |
| | | | |
|
|
| | | | | | 46,404,535 |
| | | | |
|
|
Computers & Peripherals — 2.6% | | | | | |
Apple, Inc.(a) | | 57,000 | | | 11,290,560 |
Dell, Inc.(a) | | 142,400 | | | 3,490,224 |
Emulex Corp.(a) | | 17,800 | | | 290,496 |
Hewlett-Packard Co. | | 647,865 | | | 32,704,225 |
International Business Machines Corp.(b) | | 315,700 | | | 34,127,170 |
Network Appliance, Inc.(a) | | 454,700 | | | 11,349,312 |
Seagate Technology (Cayman Islands) | | 124,200 | | | 3,167,100 |
Wincor Nixdorf AG (Germany) | | 4,206 | | | 397,743 |
| | | | |
|
|
| | | | | | 96,816,830 |
| | | | |
|
|
Construction & Engineering — 0.1% | | | | | |
ACS Actividades de Construccion y Servicios SA (Spain) | | 19,800 | | | 1,176,763 |
COMSYS Holdings Corp. (Japan) | | 57,000 | | | 463,948 |
Granite Construction, Inc.(b) | | 32,300 | | | 1,168,614 |
JGC Corp. | | 16,000 | | | 274,339 |
Vinci SA (France) | | 1,312 | | | 97,157 |
YIT OYJ (Finland) | | 9,597 | | | 210,329 |
| | | | |
|
|
| | | | | | 3,391,150 |
| | | | |
|
|
Construction Materials — 0.1% | | | | | |
Cimpor Cimentos de Portugal SGPS SA (Portugal) | | 20,887 | | | 183,227 |
Holcim Ltd. (Switzerland) | | 10,060 | | | 1,077,841 |
Italcementi S.p.A (Italy) | | 14,698 | | | 314,388 |
Lafarge SA (France) | | 14,955 | | | 2,722,192 |
| | | | |
|
|
| | | | | | 4,297,648 |
| | | | |
|
|
Consumer Finance — 0.1% | | | | | |
American Express Co. | | 30,100 | | | 1,565,802 |
AmeriCredit Corp.(a)(b) | | 139,500 | | | 1,784,205 |
Capital One Financial Corp.(b) | | 23,200 | | | 1,096,432 |
Cash America International, Inc. | | 5,800 | | | 187,340 |
Takefuji Corp. (Japan) | | 24,170 | | | 580,530 |
| | | | |
|
|
| | | | | | 5,214,309 |
| | | | |
|
|
Containers & Packaging — 0.2% | | | | | |
Ball Corp. | | 40,000 | | | 1,800,000 |
Pactiv Corp.(a)(b) | | 233,900 | | | 6,228,757 |
Rock-Tenn Co. (Class A Stock) | | 8,900 | | | 226,149 |
| | | | |
|
|
| | | | | | 8,254,906 |
| | | | |
|
|
Distributors | | | | | |
Jardine Cycle & Carriage Ltd. | | 17,548 | | | 262,022 |
Li & Fung Ltd. (Bermuda) | | 98,000 | | | 390,699 |
Pacific Brands Ltd. (Australia) | | 228,356 | | | 648,514 |
| | | | |
|
|
| | | | | | 1,301,235 |
| | | | |
|
|
Diversified Consumer Services | | | | | |
ITT Educational Services, Inc.(a) | | 11,200 | | | 955,024 |
| | | | |
|
|
SEE NOTES TO FINANCIAL STATEMENTS.
A60
| | | | |
| | | FLEXIBLE MANAGED PORTFOLIO (Continued) | | |
SCHEDULE OF INVESTMENTS | December 31, 2007 |
| | | | | |
COMMON STOCKS
(continued) | | Shares
| | Value
(Note 2)
|
| | | | | | |
Diversified Financial Services — 2.5% | | | | | |
Babcock & Brown Ltd. (Australia) | | 9,982 | | $ | 234,800 |
Bank of America Corp. | | 725,782 | | | 29,945,765 |
Challenger Financial Services Group Ltd. (Australia) | | 85,589 | | | 370,731 |
CIT Group, Inc.(b) | | 30,400 | | | 730,512 |
Citigroup, Inc. | | 959,562 | | | 28,249,505 |
Deutsche Boerse AG (Germany) | | 940 | | | 185,534 |
Fortis (Belgium) | | 51,208 | | | 1,348,387 |
Hong Kong Exchanges and Clearing Ltd. (Hong Kong) | | 56,000 | | | 1,569,892 |
ING Groep NV (Netherlands) | | 82,449 | | | 3,224,572 |
JPMorgan Chase & Co. | | 576,494 | | | 25,163,963 |
Moody’s Corp.(b) | | 53,100 | | | 1,895,670 |
OKO Bank PLC (Finland) | | 36,730 | | | 701,875 |
Singapore Exchange Ltd. (Singapore) | | 100,000 | | | 916,054 |
| | | | |
|
|
| | | | | | 94,537,260 |
| | | | |
|
|
Diversified Telecommunication Services — 2.4% | | | | | |
AT&T, Inc. | | 1,244,147 | | | 51,706,749 |
Belgacom SA (Belgium) | | 33,817 | | | 1,668,181 |
BT Group PLC (United Kingdom) | | 210,438 | | | 1,142,546 |
CenturyTel, Inc. | | 162,200 | | | 6,724,812 |
France Telecom SA (France) | | 65,900 | | | 2,372,119 |
Nippon Telegraph & Telephone Corp. (Japan) | | 183 | | | 909,680 |
Portugal Telecom SGPS SA (Portugal) | | 16,268 | | | 212,397 |
Swisscom AG (Switzerland) | | 1,952 | | | 762,076 |
Tele2 AB (Class B Stock) (Sweden) | | 47,500 | | | 951,734 |
Telecom Corp. of New Zealand Ltd. (New Zealand) | | 251,523 | | | 840,223 |
Telecom Italia S.p.A (Italy) | | 850,031 | | | 2,020,776 |
Telefonica SA (Spain) | | 46,067 | | | 1,496,570 |
Verizon Communications, Inc. | | 317,388 | | | 13,866,682 |
Windstream Corp. | | 402,300 | | | 5,237,946 |
| | | | |
|
|
| | | | | | 89,912,491 |
| | | | |
|
|
Electrical Equipment — 0.9% | | | | | |
ABB Ltd. (Switzerland) | | 82,764 | | | 2,384,633 |
Acuity Brands, Inc.(b) | | 47,300 | | | 2,128,500 |
Alstom (France) | | 3,811 | | | 819,067 |
Emerson Electric Co. | | 183,400 | | | 10,391,443 |
First Solar, Inc.(a)(b) | | 2,400 | | | 641,136 |
Hitachi Cable Ltd. (Japan) | | 66,000 | | | 389,472 |
Prysmian SpA (Italy)(a) | | 4,590 | | | 113,346 |
Rockwell Automation, Inc. | | 151,500 | | | 10,447,439 |
Schneider Electric SA (France) | | 15,126 | | | 2,049,619 |
Sumitomo Electric Industries Ltd. (Japan) | | 30,400 | | | 479,455 |
Thomas & Betts Corp.(a)(b) | | 29,700 | | | 1,456,488 |
Vestas Wind Systems A/S (Denmark)(a) | | 7,474 | | | 808,943 |
| | | | |
|
|
| | | | | | 32,109,541 |
| | | | |
|
|
Electric Utilities — 1.3% | | | | | |
American Electric Power Co., Inc. | | 177,700 | | | 8,273,712 |
CLP Holdings Ltd. (Hong Kong) | | 89,500 | | | 608,065 |
Duke Energy Corp. | | 613,900 | | | 12,382,363 |
E.On AG (Germany) | | 26,290 | | | 5,596,864 |
Edison International | | 210,100 | | | 11,213,037 |
Enel S.p.A (Italy) | | 134,410 | | | 1,598,645 |
Energias de Portugal SA (Portugal) | | 24,101 | | | 157,509 |
FirstEnergy Corp. | | 49,600 | | | 3,588,064 |
Hokkaido Electric Power Co., Inc. (Japan) | | 4,100 | | | 88,380 |
Hong Kong Electric Holdings Ltd. (Hong Kong) | | 28,000 | | | 160,239 |
Portland General Electric Co. | | 32,900 | | | 913,962 |
PPL Corp. | | 10,300 | | | 536,527 |
SEE NOTES TO FINANCIAL STATEMENTS.
A61
| | | | |
| | | FLEXIBLE MANAGED PORTFOLIO (Continued) | | |
SCHEDULE OF INVESTMENTS | December 31, 2007 |
| | | | | |
COMMON STOCKS
(continued) | | Shares
| | Value
(Note 2)
|
| | | | | | |
Electric Utilities (continued) | | | | | |
Public Power Corp. SA (Greece) | | 9,825 | | $ | 517,128 |
Scottish & Southern Energy PLC (United Kingdom) | | 11,871 | | | 387,067 |
Union Fenosa, SA (Spain) | | 21,457 | | | 1,449,038 |
| | | | |
|
|
| | | | | | 47,470,600 |
| | | | |
|
|
Electronic Equipment & Instruments — 0.5% | | | | | |
Agilent Technologies, Inc.(a) | | 344,700 | | | 12,664,278 |
FUJIFILM Holdings Corp. (Japan) | | 8,500 | | | 355,772 |
Hitachi Cable Ltd. (Japan) | | 72,000 | | | 534,913 |
Jabil Circuit, Inc. | | 286,500 | | | 4,374,855 |
Kyocera Corp. (Japan) | | 4,400 | | | 388,847 |
Omron Corp. (Japan) | | 49,100 | | | 1,155,982 |
Venture Co. Ltd. (Singapore) | | 22,000 | | | 192,953 |
| | | | |
|
|
| | | | | | 19,667,600 |
| | | | |
|
|
Energy Equipment & Services — 1.0% | | | | | |
Halliburton Co. | | 534,300 | | | 20,255,313 |
Hornbeck Offshore Services, Inc.(a)(b) | | 121,100 | | | 5,443,445 |
National-Oilwell Varco, Inc.(a)(b) | | 58,600 | | | 4,304,756 |
Schlumberger Ltd. (Netherlands) | | 42,700 | | | 4,200,399 |
SEACOR Holdings, Inc.(a)(b) | | 18,200 | | | 1,687,868 |
Unit Corp.(a) | | 10,400 | | | 481,000 |
WorleyParsons Ltd. (Australia) | | 60,044 | | | 2,704,946 |
| | | | |
|
|
| | | | | | 39,077,727 |
| | | | |
|
|
Exchange Traded Fund | | | |
iShares MSCI EAFE Index Fund | | 4,800 | | | 376,800 |
| | | | |
|
|
Food & Staples Retailing — 1.4% | | | |
Casino Guichard-Perrachon SA (France) | | 12,240 | | | 1,331,248 |
Circle K Sunkus Co. Ltd. (Japan) | | 8,800 | | | 130,073 |
CVS Caremark Corp. | | 59,800 | | | 2,377,050 |
FamilyMart Co. Ltd. (Japan) | | 6,900 | | | 216,071 |
Koninklijke Ahold NV (Netherlands) | | 12,963 | | | 180,618 |
Kroger Co. (The) | | 374,100 | | | 9,992,210 |
Matsumotokiyoshi Holdings Co. Ltd. (Japan) | | 13,000 | | | 316,520 |
Safeway, Inc. | | 45,300 | | | 1,549,713 |
SUPERVALU, Inc. | | 66,600 | | | 2,498,832 |
Sysco Corp. | | 46,400 | | | 1,448,144 |
UNY Co. Ltd. (Japan) | | 62,000 | | | 523,699 |
Wal-Mart Stores, Inc. | | 614,600 | | | 29,211,937 |
Wesfarmers Ltd. (Australia)(a) | | 4,488 | | | 160,386 |
Woolworths Ltd. (Australia) | | 83,507 | | | 2,476,485 |
| | | | |
|
|
| | | | | | 52,412,986 |
| | | | |
|
|
Food Products — 0.9% | | | |
Archer-Daniels-Midland Co. | | 143,200 | | | 6,648,775 |
ConAgra Foods, Inc. | | 133,300 | | | 3,171,207 |
Danisco A/S (Denmark) | | 5,850 | | | 414,658 |
East Asiatic Co. Ltd. A/S (Denmark) | | 8,750 | | | 681,979 |
Ebro Puleva SA (Spain) | | 20,374 | | | 373,540 |
Futuris Corp. Ltd. (Australia) | | 144,676 | | | 271,386 |
General Mills, Inc. | | 179,500 | | | 10,231,499 |
Goodman Fielder Ltd. (Australia) | | 688,032 | | | 1,137,418 |
Nestle SA (Class B Stock) (Switzerland) | | 7,935 | | | 3,644,570 |
Pilgrim’s Pride Corp.(b) | | 71,900 | | | 2,081,505 |
Unilever NV (Netherlands) | | 28,858 | | | 1,061,127 |
Unilever PLC (United Kingdom) | | 61,219 | | | 2,303,207 |
Wilmar International Ltd. (Singapore) | | 306,000 | | | 1,137,072 |
| | | | |
|
|
| | | | | | 33,157,943 |
| | | | |
|
|
SEE NOTES TO FINANCIAL STATEMENTS.
A62
| | | | |
| | | FLEXIBLE MANAGED PORTFOLIO (Continued) | | |
SCHEDULE OF INVESTMENTS | December 31, 2007 |
| | | | | |
COMMON STOCKS
(continued) | | Shares
| | Value
(Note 2)
|
| | | | | | |
Gas Utilities | | | |
AGL Resources, Inc. | | 10,800 | | $ | 406,512 |
Gas Natural SDG SA (Spain) | | 10,522 | | | 615,656 |
Nicor, Inc. | | 5,400 | | | 228,690 |
Southwest Gas Corp. | | 8,000 | | | 238,160 |
| | | | |
|
|
| | | | | | 1,489,018 |
| | | | |
|
|
Healthcare Equipment & Supplies — 1.1% | | | |
Analogic Corp. | | 8,800 | | | 595,936 |
Baxter International, Inc. | | 168,900 | | | 9,804,645 |
Becton, Dickinson & Co. | | 136,200 | | | 11,383,596 |
Covidien Ltd. (Bermuda) | | 85,200 | | | 3,773,508 |
Invacare Corp. | | 12,800 | | | 322,560 |
Medtronic, Inc. | | 157,100 | | | 7,897,417 |
Mentor Corp.(b) | | 53,600 | | | 2,095,760 |
Olympus Corp. (Japan) | | 23,000 | | | 937,365 |
Stryker Corp. | | 26,000 | | | 1,942,720 |
Terumo Corp. (Japan) | | 1,800 | | | 93,839 |
| | | | |
|
|
| | | | | | 38,847,346 |
| | | | |
|
|
Healthcare Providers & Services — 1.8% | | | |
Cardinal Health, Inc. | | 4,700 | | | 271,425 |
Chemed Corp. | | 21,300 | | | 1,190,244 |
Express Scripts, Inc.(a)(b) | | 238,600 | | | 17,417,800 |
Medco Health Solutions, Inc.(a) | | 4,600 | | | 466,440 |
Parkway Holdings Ltd. (Singapore) | | 89,000 | | | 241,863 |
Suzuken Co. Ltd. (Japan) | | 13,100 | | | 466,286 |
UnitedHealth Group, Inc. | | 439,200 | | | 25,561,440 |
WellPoint, Inc.(a) | | 241,900 | | | 21,221,887 |
| | | | |
|
|
| | | | | | 66,837,385 |
| | | | |
|
|
Hotels, Restaurants & Leisure — 1.1% | | | |
Brinker International, Inc. (Australia) | | 209,350 | | | 4,094,886 |
Darden Restaurants, Inc.(b) | | 198,000 | | | 5,486,580 |
Enterprise Inns PLC (United Kingdom) | | 54,540 | | | 528,724 |
Jack in the Box, Inc.(a)(b) | | 106,400 | | | 2,741,928 |
McDonald’s Corp.(b) | | 130,100 | | | 7,664,191 |
OPAP SA (Greece) | | 1,723 | | | 69,074 |
Panera Bread Co. (Class A Stock)(a)(b) | | 9,600 | | | 343,872 |
Sonic Corp.(a)(b) | | 96,700 | | | 2,117,730 |
Wyndham Worldwide Corp. | | 94,200 | | | 2,219,352 |
Yum! Brands, Inc. | | 367,900 | | | 14,079,533 |
| | | | |
|
|
| | | | | | 39,345,870 |
| | | | |
|
|
Household Durables — 0.3% | | | |
Barratt Developments PLC (United Kingdom) | | 46,780 | | | 424,164 |
Bellway PLC (United Kingdom) | | 22,614 | | | 375,204 |
Bovis Homes Group PLC (United Kingdom) | | 9,954 | | | 122,057 |
Harman International Industries, Inc. | | 29,600 | | | 2,181,816 |
Makita Corp. (Japan) | | 4,100 | | | 171,409 |
Matsushita Electric Industrial Co. Ltd. (Japan) | | 49,000 | | | 1,004,053 |
Persimmon PLC (United Kingdom) | | 2,974 | | | 47,360 |
Sekisui Chemical Co. Ltd. (Japan) | | 190,000 | | | 1,269,114 |
Sekisui House Ltd. (Japan) | | 130,000 | | | 1,389,488 |
Stanley Works (The) | | 36,800 | | | 1,784,064 |
Taylor Wimpey PLC (United Kingdom) | | 252,607 | | | 1,022,024 |
Whirlpool Corp. | | 15,800 | | | 1,289,754 |
| | | | |
|
|
| | | | | | 11,080,507 |
| | | | |
|
|
Household Products — 1.4% | | | |
Clorox Co. (The)(b) | | 40,100 | | | 2,613,317 |
Kimberly-Clark Corp. | | 245,400 | | | 17,016,036 |
SEE NOTES TO FINANCIAL STATEMENTS.
A63
| | | | |
| | | FLEXIBLE MANAGED PORTFOLIO (Continued) | | |
SCHEDULE OF INVESTMENTS | December 31, 2007 |
| | | | | |
COMMON STOCKS
(continued) | | Shares
| | Value
(Note 2)
|
| | | | | | |
Household Products (continued) | | | |
Procter & Gamble Co. | | 390,905 | | $ | 28,700,245 |
Reckitt Benckiser Group PLC (United Kingdom) | | 46,355 | | | 2,688,878 |
| | | | |
|
|
| | | | | | 51,018,476 |
| | | | |
|
|
Independent Power Producers & Energy Traders — 0.4% | | | |
AES Corp. (The)(a) | | 258,200 | | | 5,522,898 |
Constellation Energy Group, Inc. | | 74,000 | | | 7,587,220 |
| | | | |
|
|
| | | | | | 13,110,118 |
| | | | |
|
|
Industrial Conglomerates — 2.1% | | | |
3M Co. | | 172,200 | | | 14,519,904 |
Cookson Group PLC (United Kingdom) | | 15,018 | | | 208,367 |
General Electric Co. | | 1,603,900 | | | 59,456,573 |
Keppel Corp. Ltd. (Singapore) | | 115,000 | | | 1,024,728 |
Koninklijke (Royal) Philips Electronics NV (Netherlands) | | 5,309 | | | 229,135 |
Rheinmetall AG (Germany) | | 932 | | | 74,700 |
SembCorp Industries Ltd. (Singapore) | | 159,000 | | | 631,955 |
Siemens AG (Germany) | | 7,405 | | | 1,173,809 |
Wendel (France) | | 4,135 | | | 598,150 |
| | | | |
|
|
| | | | | | 77,917,321 |
| | | | |
|
|
Insurance — 3.3% | | | |
ACE Ltd. (Cayman Islands) | | 182,000 | | | 11,243,960 |
Aegon NV (Netherlands) | | 44,331 | | | 783,604 |
Allianz AG (Germany) | | 18,076 | | | 3,913,467 |
Allstate Corp. (The) | | 289,000 | | | 15,094,470 |
AMBAC Financial Group, Inc.(b) | | 57,200 | | | 1,474,044 |
American Financial Group, Inc.(b) | | 120,300 | | | 3,474,264 |
American International Group, Inc. | | 461,435 | | | 26,901,660 |
Arch Capital Group Ltd. (Bermuda)(a) | | 20,200 | | | 1,421,070 |
Aviva PLC (United Kingdom) | | 106,705 | | | 1,429,502 |
AXA SA (France) | | 52,158 | | | 2,088,699 |
Chubb Corp. (The) | | 145,100 | | | 7,919,558 |
CNP Assurances (France) | | 4,013 | | | 522,124 |
Endurance Specialty Holdings Ltd. (Bermuda) | | 20,200 | | | 842,946 |
Hartford Financial Services Group, Inc. | | 65,100 | | | 5,676,069 |
Legal & General Group PLC (United Kingdom) | | 141,000 | | | 366,562 |
MBIA, Inc.(b) | | 66,000 | | | 1,229,580 |
MetLife, Inc.(b) | | 62,900 | | | 3,875,898 |
Montpelier Re Holdings Ltd. (Bermuda) | | 42,700 | | | 726,327 |
Muenchener Rueckversicherungs — Gesellschaft AG (Germany) | | 14,375 | | | 2,792,109 |
Old Mutual PLC (United Kingdom) | | 90,996 | | | 303,586 |
PartnerRe Ltd. (Bermuda) | | 11,900 | | | 982,107 |
Platinum Underwriters Holdings Ltd. (Bermuda) | | 23,500 | | | 835,660 |
Royal & Sun Alliance Insurance Group (United Kingdom) | | 464,556 | | | 1,370,475 |
SCOR SE (France) | | 24,865 | | | 636,194 |
Suncorp-Metway Ltd. (Australia) | | 32,346 | | | 477,427 |
Swiss Life Holding (Switzerland) | | 2,430 | | | 607,420 |
Swiss Reinsurance (Switzerland) | | 25,784 | | | 1,832,198 |
Travelers Cos, Inc. (The) | | 326,000 | | | 17,538,799 |
XL Capital Ltd. (Class A Stock) | | 79,400 | | | 3,994,614 |
Zurich Financial Services AG (Switzerland) | | 6,305 | | | 1,851,709 |
| | | | |
|
|
| | | | | | 122,206,102 |
| | | | |
|
|
Internet & Catalog Retail | | | |
Home Retail Group (United Kingdom) | | 221,881 | | | 1,448,701 |
| | | | |
|
|
Internet Software & Services — 0.8% | | | |
EarthLink, Inc.(a)(b) | | 322,600 | | | 2,280,782 |
eBay, Inc.(a) | | 496,100 | | | 16,465,559 |
SEE NOTES TO FINANCIAL STATEMENTS.
A64
| | | | |
| | | FLEXIBLE MANAGED PORTFOLIO (Continued) | | |
SCHEDULE OF INVESTMENTS | December 31, 2007 |
| | | | | |
COMMON STOCKS
(continued) | | Shares
| | Value
(Note 2)
|
| | | | | | |
Internet Software & Services (continued) | | | |
Google, Inc. (Class A Stock)(a) | | 14,800 | | $ | 10,233,904 |
Tencent Holdings Ltd. (China) | | 79,000 | | | 590,041 |
| | | | |
|
|
| | | | | | 29,570,286 |
| | | | |
|
|
IT Services — 0.5% | | | |
Accenture Ltd. (Class A Stock) (Bermuda) | | 32,400 | | | 1,167,372 |
Automatic Data Processing, Inc. | | 313,800 | | | 13,973,514 |
MasterCard, Inc. (Class A Stock)(b) | | 15,000 | | | 3,228,000 |
SYKES Enterprises, Inc.(a) | | 30,100 | | | 541,800 |
| | | | |
|
|
| | | | | | 18,910,686 |
| | | | |
|
|
Leisure Equipment & Products — 0.1% | | | |
Nikon Corp. (Japan) | | 39,000 | | | 1,326,714 |
Sankyo Co. Ltd. (Japan) | | 3,300 | | | 152,469 |
Yamaha Corp. (Japan) | | 14,500 | | | 330,839 |
| | | | |
|
|
| | | | | | 1,810,022 |
| | | | |
|
|
Life Sciences, Tools & Services — 0.4% | | | |
Applera Corp. – Applied Biosystems Group | | 43,300 | | | 1,468,736 |
Invitrogen Corp.(a)(b) | | 21,600 | | | 2,017,656 |
Thermo Fisher Scientific, Inc.(a) | | 9,500 | | | 547,960 |
Waters Corp.(a) | | 130,500 | | | 10,318,635 |
| | | | |
|
|
| | | | | | 14,352,987 |
| | | | |
|
|
Machinery — 1.0% | | | |
Charter PLC (United Kingdom)(a) | | 45,541 | | | 719,340 |
Cummins, Inc. | | 22,000 | | | 2,802,140 |
Eaton Corp. | | 89,500 | | | 8,677,025 |
EnPro Industries, Inc.(a)(b) | | 16,400 | | | 502,660 |
Illinois Tool Works, Inc. | | 68,300 | | | 3,656,782 |
Ingersoll-Rand Co. (Class A Stock) (Bermuda) | | 222,600 | | | 10,344,223 |
Komatsu Ltd. (Japan) | | 81,800 | | | 2,193,808 |
Komori Corp. (Japan) | | 30,000 | | | 661,091 |
Konecranes Oyj (Finland) | | 16,512 | | | 569,254 |
Kubota Corp. (Japan) | | 36,000 | | | 242,263 |
MAN AG (Germany) | | 8,304 | | | 1,386,003 |
NSK Ltd. (Japan) | | 43,000 | | | 440,768 |
Sandvik AB (Sweden) | | 30,007 | | | 516,506 |
Sumitomo Heavy Industries Ltd. (Japan) | | 20,000 | | | 182,352 |
Trelleborg AB (Class B Stock) (Sweden) | | 22,700 | | | 475,902 |
Trinity Industries, Inc.(b) | | 87,200 | | | 2,420,672 |
| | | | |
|
|
| | | | | | 35,790,789 |
| | | | |
|
|
Marine — 0.1% | | | |
Cosco Corp (Singapore) Ltd. (Singapore) | | 70,000 | | | 276,355 |
Kawasaki Kisen Kaisha Ltd. (Japan) | | 52,000 | | | 504,812 |
Mitsui OSK Lines Ltd. (Japan) | | 153,000 | | | 1,934,271 |
Neptune Orient Lines Ltd. (Singapore) | | 71,000 | | | 190,861 |
Nippon Yusen Kabushiki Kaish (Japan) | | 84,000 | | | 661,751 |
Orient Overseas International Ltd. (Hong Kong) | | 21,000 | | | 153,852 |
TBS International Ltd. (Class A Stock) (Bermuda)(a) | | 8,900 | | | 294,234 |
| | | | |
|
|
| | | | | | 4,016,136 |
| | | | |
|
|
Media — 2.1% | | | |
CBS Corp. (Class B Stock)(b) | | 362,019 | | | 9,865,018 |
Comcast Corp. (Class A Stock)(a)(b) | | 111,073 | | | 2,028,193 |
Daily Mail & General Trust (United Kingdom) | | 30,597 | | | 302,553 |
DIRECTV Group, Inc. (The)(a) | | 183,300 | | | 4,237,896 |
Gestevision Telecinco SA (Spain) | | 33,559 | | | 859,128 |
Lagardere SCA (France) | | 7,997 | | | 599,684 |
Marvel Entertainment, Inc.(a)(b) | | 97,800 | | | 2,612,238 |
Time Warner, Inc. | | 1,124,850 | | | 18,571,274 |
SEE NOTES TO FINANCIAL STATEMENTS.
A65
| | | | |
| | | FLEXIBLE MANAGED PORTFOLIO (Continued) | | |
SCHEDULE OF INVESTMENTS | December 31, 2007 |
| | | | | |
COMMON STOCKS
(continued) | | Shares
| | Value
(Note 2)
|
| | | | | | |
Media (continued) | | | |
Valassis Communications, Inc.(a)(b) | | 78,600 | | $ | 918,834 |
Viacom, Inc. (Class B Stock)(a) | | 324,900 | | | 14,269,608 |
Vivendi Universal SA (France) | | 68,790 | | | 3,156,031 |
Walt Disney Co. | | 676,000 | | | 21,821,280 |
Yell Group PLC (United Kingdom) | | 17,095 | | | 136,458 |
| | | | |
|
|
| | | | | | 79,378,195 |
| | | | |
|
|
Metals & Mining — 1.4% | | | |
Acerinox SA (Spain) | | 20,192 | | | 496,851 |
Alcoa, Inc. | | 424,800 | | | 15,526,440 |
Anglo American PLC (United Kingdom) | | 7,561 | | | 463,570 |
ArcelorMittal (Luxembourg) | | 11,115 | | | 893,789 |
BHP Billiton Ltd. (Australia) | | 105,439 | | | 3,685,940 |
BHP Billiton PLC (United Kingdom) | | 99,994 | | | 3,077,290 |
Boliden AB (Sweden) | | 13,100 | | | 164,682 |
Kobe Steel Ltd. (Japan) | | 217,000 | | | 699,577 |
Mitsubishi Materials Corp. (Japan) | | 150,000 | | | 633,384 |
Newmont Mining Corp. | | 186,600 | | | 9,111,678 |
Nippon Steel Corp. (Japan) | | 84,000 | | | 514,159 |
Nisshin Steel Co. Ltd. (Japan) | | 97,000 | | | 335,149 |
Nucor Corp. | | 8,000 | | | 473,760 |
Outokumpu OYJ (Finland) | | 26,454 | | | 820,342 |
Rio Tinto PLC (United Kingdom) | | 39,715 | | | 4,203,453 |
Salzgitter AG (Germany) | | 9,598 | | | 1,420,819 |
Sumitomo Metal Mining Co. Ltd. (Japan) | | 29,000 | | | 490,289 |
Thyssenkrupp AG (Germany) | | 40,662 | | | 2,280,501 |
United States Steel Corp. | | 45,900 | | | 5,549,769 |
Voestalpine AG (Austria) | | 9,193 | | | 664,640 |
Yamato Kogyo Co. Ltd. (Japan) | | 6,000 | | | 242,923 |
| | | | |
|
|
| | | | | | 51,749,005 |
| | | | |
|
|
Multiline Retail — 0.2% | | | |
Big Lots, Inc.(a)(b) | | 84,600 | | | 1,352,754 |
Dollar Tree Stores, Inc.(a) | | 45,500 | | | 1,179,360 |
J.C. Penney Co., Inc. | | 98,800 | | | 4,346,212 |
Marks & Spencer Group PLC (United Kingdom) | | 113,014 | | | 1,259,810 |
Next PLC (United Kingdom) | | 8,270 | | | 267,348 |
Ryohin Keikaku Co. Ltd. (Japan) | | 1,200 | | | 72,034 |
| | | | |
|
|
| | | | | | 8,477,518 |
| | | | |
|
|
Multi-Utilities — 0.4% | | | |
AGL Energy Ltd. (Australia) | | 10,777 | | | 125,456 |
Centerpoint Energy, Inc. | | 38,800 | | | 664,644 |
Centrica PLC (United Kingdom) | | 302,580 | | | 2,160,812 |
Consolidated Edison, Inc. | | 132,300 | | | 6,462,855 |
Integrys Energy Group, Inc. | | 8,100 | | | 418,689 |
National Grid PLC (United Kingdom) | | 150,205 | | | 2,493,649 |
NiSource, Inc. | | 61,300 | | | 1,157,957 |
RWE AG (Germany) | | 3,184 | | | 448,992 |
Suez SA (France) | | 13,041 | | | 887,933 |
| | | | |
|
|
| | | | | | 14,820,987 |
| | | | |
|
|
Office Electronics — 0.4% | | | |
Canon, Inc. (Japan) | | 20,700 | | | 947,368 |
Konica Minolta Holdings, Inc. (Japan) | | 21,000 | | | 368,151 |
Ricoh Co. Ltd. (Japan) | | 102,000 | | | 1,862,147 |
Xerox Corp. | | 763,500 | | | 12,361,065 |
| | | | |
|
|
| | | | | | 15,538,731 |
| | | | |
|
|
SEE NOTES TO FINANCIAL STATEMENTS.
A66
| | | | |
| | | FLEXIBLE MANAGED PORTFOLIO (Continued) | | |
SCHEDULE OF INVESTMENTS | December 31, 2007 |
| | | | | |
COMMON STOCKS
(continued) | | Shares
| | Value
(Note 2)
|
| | | | | | |
Oil, Gas & Consumable Fuels — 6.8% | | | |
BP PLC (United Kingdom) | | 521,181 | | $ | 6,380,411 |
Chesapeake Energy Corp. | | 292,000 | | | 11,446,400 |
Chevron Corp. | | 464,856 | | | 43,385,010 |
ConocoPhillips (Class B Stock) | | 348,434 | | | 30,766,722 |
EFG Eurobank Ergasias (Greece) | | 5,761 | | | 202,823 |
ENI S.p.A (Italy) | | 57,232 | | | 2,096,088 |
Exxon Mobil Corp. | | 983,716 | | | 92,164,352 |
Holly Corp. | | 28,400 | | | 1,445,276 |
Idemitsu Kosan Co. Ltd. (Japan) | | 2,400 | | | 252,780 |
Marathon Oil Corp.(b) | | 246,300 | | | 14,989,818 |
Nippon Oil Corp. (Japan) | | 249,000 | | | 2,013,009 |
Occidental Petroleum Corp. | | 124,600 | | | 9,592,954 |
OMV AG (Austria) | | 21,788 | | | 1,765,415 |
Repsol YPF SA (Spain) | | 48,540 | | | 1,730,200 |
Royal Dutch Shell PLC (Class B Stock) (United Kingdom) | | 90,079 | | | 3,747,613 |
Royal Dutch Shell PLC (United Kingdom) | | 55,023 | | | 2,312,158 |
Singapore Petroleum Co. Ltd. (Singapore) | | 220,000 | | | 1,148,527 |
Sunoco, Inc. | | 39,000 | | | 2,825,160 |
Swift Energy Co.(a) | | 10,900 | | | 479,927 |
Total SA (France) | | 53,410 | | | 4,437,754 |
Valero Energy Corp. | | 248,100 | | | 17,374,443 |
Williams Cos., Inc. (The) | | 88,700 | | | 3,173,686 |
| | | | |
|
|
| | | | | | 253,730,526 |
| | | | |
|
|
Paper & Forest Products — 0.2% | | | |
International Paper Co. | | 151,400 | | | 4,902,332 |
Mondi Ltd. (South Africa) | | 4,889 | | | 46,141 |
Mondi PLC (United Kingdom) | | 58,887 | | | 498,188 |
Sonae Industria SGPS SA (Portugal)(a) | | 36,170 | | | 351,668 |
| | | | |
|
|
| | | | | | 5,798,329 |
| | | | |
|
|
Personal Products | | | |
Herbalife Ltd. (Cayman Islands) | | 17,100 | | | 688,788 |
Oriflame Cosmetics SA (Sweden) | | 8,200 | | | 523,982 |
| | | | |
|
|
| | | | | | 1,212,770 |
| | | | |
|
|
Pharmaceuticals — 3.9% | | | |
Abbott Laboratories | | 180,500 | | | 10,135,075 |
Astellas Pharma, Inc. (Japan) | | 17,900 | | | 776,334 |
AstraZeneca PLC (United Kingdom) | | 60,598 | | | 2,610,361 |
Bristol-Myers Squibb Co. | | 40,000 | | | 1,060,800 |
Eli Lilly & Co. | | 279,400 | | | 14,917,166 |
GlaxoSmithKline PLC (United Kingdom) | | 152,103 | | | 3,872,516 |
H Lundbeck A/S (Denmark) | | 9,600 | | | 259,762 |
Johnson & Johnson | | 523,998 | | | 34,950,667 |
King Pharmaceuticals, Inc.(a) | | 308,600 | | | 3,160,064 |
Kyowa Hakko Kogyo Co. Ltd. (Japan) | | 53,000 | | | 566,044 |
Merck & Co., Inc. | | 298,700 | | | 17,357,457 |
Novartis AG (Switzerland) | | 24,679 | | | 1,353,677 |
Pfizer, Inc. | | 1,525,565 | | | 34,676,092 |
Roche Holding AG-Genusshein (Switzerland) | | 9,449 | | | 1,632,491 |
Sanofi-Aventis (France) | | 35,875 | | | 3,303,372 |
Shire PLC (United Kingdom) | | 18,472 | | | 422,492 |
Takeda Pharmaceutical Co. Ltd. (Japan) | | 11,100 | | | 648,471 |
Wyeth | | 279,300 | | | 12,342,267 |
| | | | |
|
|
| | | | | | 144,045,108 |
| | | | |
|
|
Real Estate Investment Trusts — 0.4% | | | |
Annaly Capital Management, Inc.(b) | | 221,400 | | | 4,025,053 |
Ashford Hospitality Trust, Inc. | | 81,600 | | | 586,704 |
SEE NOTES TO FINANCIAL STATEMENTS.
A67
| | | | |
| | | FLEXIBLE MANAGED PORTFOLIO (Continued) | | |
SCHEDULE OF INVESTMENTS | December 31, 2007 |
| | | | | |
COMMON STOCKS
(continued) | | Shares
| | Value
(Note 2)
|
| | | | | | |
Real Estate Investment Trusts (continued) | | | |
Brandywine Realty Trust | | 87,400 | | $ | 1,567,082 |
CBL & Associates Properties, Inc. | | 32,000 | | | 765,120 |
Centro Properties Group | | 15,744 | | | 13,771 |
First Industrial Realty Trust, Inc.(b) | | 47,000 | | | 1,626,200 |
Host Hotels & Resorts, Inc. | | 123,700 | | | 2,107,848 |
ING Industrial Fund (Australia) | | 386,508 | | | 856,334 |
Mirvac Group (Australia) | | 149,661 | | | 782,140 |
NorthStar Realty Finance Corp.(b) | | 87,400 | | | 779,608 |
Strategic Hotels & Resorts, Inc.(b) | | 39,200 | | | 655,816 |
Sunstone Hotel Investors, Inc. | | 9,300 | | | 170,097 |
Westfield Group (Australia) | | 4,445 | | | 81,266 |
| | | | |
|
|
| | | | | | 14,017,039 |
| | | | |
|
|
Real Estate Management & Development — 0.1% | | | |
Cheung Kong Holdings Ltd. (Hong Kong) | | 57,000 | | | 1,041,359 |
City Developments Ltd. (Singapore) | | 25,000 | | | 243,470 |
Jones Lang LaSalle, Inc. | | 9,100 | | | 647,556 |
K.K. DaVinci Advisors (Japan)(a) | | 404 | | | 350,006 |
Leopalace21 Corp. (Japan) | | 16,400 | | | 440,631 |
Swire Pacific Ltd. (Hong Kong) | | 40,000 | | | 548,125 |
Wharf (Holdings) Ltd. (The) (Hong Kong)(a) | | 241,000 | | | 1,246,698 |
| | | | |
|
|
| | | | | | 4,517,845 |
| | | | |
|
|
Road & Rail — 0.2% | | | |
Nippon Express Co. Ltd. (Japan) | | 19,000 | | | 96,940 |
Ryder System, Inc. | | 12,000 | | | 564,120 |
Seino Holdings Co. Ltd. (Japan) | | 39,000 | | | 262,421 |
Union Pacific Corp. | | 40,300 | | | 5,062,487 |
| | | | |
|
|
| | | | | | 5,985,968 |
| | | | |
|
|
Semiconductors & Semiconductor Equipment — 1.4% | | | |
ASML Holding NV (Netherlands) | | 7,334 | | | 232,254 |
Integrated Device Technology, Inc.(a) | | 58,400 | | | 660,504 |
Intel Corp. | | 832,700 | | | 22,199,782 |
Lam Research Corp.(a) | | 121,100 | | | 5,235,153 |
Linear Technology Corp.(b) | | 182,500 | | | 5,808,975 |
NVIDIA Corp.(a)(b) | | 340,600 | | | 11,587,212 |
Semtech Corp.(a)(b) | | 46,000 | | | 713,920 |
Texas Instruments, Inc.(b) | | 25,300 | | | 845,020 |
Varian Semiconductor Equipment Associates, Inc.(a) | | 59,700 | | | 2,208,900 |
Zoran Corp.(a)(b) | | 135,400 | | | 3,047,854 |
| | | | |
|
|
| | | | | | 52,539,574 |
| | | | |
|
|
Software — 2.6% | | | |
Adobe Systems, Inc.(a) | | 150,800 | | | 6,443,684 |
Advent Software, Inc.(a)(b) | | 18,000 | | | 973,800 |
BMC Software, Inc.(a) | | 56,200 | | | 2,002,968 |
Intuit, Inc.(a) | | 193,500 | | | 6,116,535 |
Lawson Software, Inc.(a) | | 27,200 | | | 278,528 |
Microsoft Corp. | | 1,703,100 | | | 60,630,360 |
Nintendo Co. Ltd. (Japan) | | 5,700 | | | 3,346,766 |
Oracle Corp.(a) | | 203,000 | | | 4,583,740 |
Symantec Corp.(a)(b) | | 701,100 | | | 11,315,754 |
| | | | |
|
|
| | | | | | 95,692,135 |
| | | | |
|
|
Specialty Retail — 1.1% | | | |
AnnTaylor Stores Corp.(a)(b) | | 44,300 | | | 1,132,308 |
Asbury Automotive Group | | 58,500 | | | 880,425 |
Belle International Holdings Ltd. (China) | | 51,000 | | | 76,298 |
Best Buy Co., Inc.(b) | | 220,200 | | | 11,593,530 |
Christopher & Banks Corp. | | 31,900 | | | 365,255 |
Esprit Holdings Ltd. (Hong Kong) | | 65,400 | | | 963,032 |
SEE NOTES TO FINANCIAL STATEMENTS.
A68
| | | | |
| | | FLEXIBLE MANAGED PORTFOLIO (Continued) | | |
SCHEDULE OF INVESTMENTS | December 31, 2007 |
| | | | | |
COMMON STOCKS
(continued) | | Shares
| | Value
(Note 2)
|
| | | | | | |
Specialty Retail (continued) | | | |
Group 1 Automotive, Inc.(b) | | 14,200 | | $ | 337,250 |
Gymboree Corp.(a)(b) | | 129,000 | | | 3,929,340 |
Hennes & Mauritz AB (Class B Stock) (Sweden) | | 5,200 | | | 316,592 |
Hikari Tsushin, Inc. (Japan) | | 3,200 | | | 108,582 |
Home Depot, Inc. | | 496,750 | | | 13,382,446 |
Limited Brands, Inc.(b) | | 317,000 | | | 6,000,810 |
Rent-A-Center, Inc.(a) | | 177,400 | | | 2,575,848 |
Shimachu Co. Ltd. (Japan) | | 2,900 | | | 81,705 |
| | | | |
|
|
| | | | | | 41,743,421 |
| | | | |
|
|
Textiles, Apparel & Luxury Goods — 0.3% | | | |
Jones Apparel Group, Inc.(b) | | 196,100 | | | 3,135,639 |
Liz Claiborne, Inc.(b) | | 45,800 | | | 932,030 |
Nisshinbo Industries, Inc. (Japan) | | 21,000 | | | 256,062 |
Swatch Group AG (Switzerland) | | 11,058 | | | 652,941 |
VF Corp. | | 40,900 | | | 2,808,194 |
Warnaco Group, Inc. (The)(a)(b) | | 97,900 | | | 3,406,921 |
| | | | |
|
|
| | | | | | 11,191,787 |
| | | | |
|
|
Thrifts & Mortgage Finance — 0.3% | | | |
Hudson City Bancorp, Inc. | | 617,300 | | | 9,271,846 |
Washington Mutual, Inc.(b) | | 41,300 | | | 562,093 |
| | | | |
|
|
| | | | | | 9,833,939 |
| | | | |
|
|
Tobacco — 0.9% | | | |
Altria Group, Inc. | | 187,100 | | | 14,141,017 |
British American Tobacco PLC (United Kingdom) | | 21,293 | | | 832,884 |
Imperial Tobacco Group PLC (United Kingdom) | | 55,194 | | | 2,979,659 |
Reynolds American, Inc.(b) | | 210,600 | | | 13,891,176 |
| | | | |
|
|
| | | | | | 31,844,736 |
| | | | |
|
|
Trading Companies & Distributors — 0.2% | | | |
Itochu Corp. (Japan) | | 119,000 | | | 1,148,307 |
Marubeni Corp. (Japan) | | 146,000 | | | 1,023,023 |
Mitsubishi Corp. (Japan) | | 33,000 | | | 893,135 |
Mitsui & Co. Ltd. (Japan) | | 93,000 | | | 1,942,086 |
Sumitomo Corp. (Japan) | | 66,100 | | | 924,830 |
| | | | |
|
|
| | | | | | 5,931,381 |
| | | | |
|
|
Transportation Infrastructure | | | |
Hopewell Holdings (Hong Kong) | | 119,000 | | | 545,602 |
Kamigumi Co. Ltd. (Japan) | | 31,000 | | | 223,708 |
| | | | |
|
|
| | | | | | 769,310 |
| | | | |
|
|
Wireless Telecommunication Services — 0.5% | | | |
KDDI Corp. (Japan) | | 96 | | | 710,311 |
Sprint Nextel Corp. | | 959,100 | | | 12,592,983 |
Vodafone Group PLC (United Kingdom) | | 1,794,633 | | | 6,708,975 |
| | | | |
|
|
| | | | | | 20,012,269 |
| | | | |
|
|
TOTAL COMMON STOCKS
(cost $2,104,931,744) | | | 2,396,999,371 |
| | | | |
|
|
| PREFERRED STOCK — 0.1% | | | | | |
Automobiles — 0.1% | | | | | |
Porsche AG (Germany)
(cost $685,818) | | 649 | | | 1,310,487 |
| | | | |
|
|
| RIGHTS | | | | | |
Real Estate Management & Development | | | | | |
Wharf (Holdings) Ltd. (The) (Hong Kong)(a)
(cost $0) | | 30,125 | | | 41,339 |
| | | | |
|
|
SEE NOTES TO FINANCIAL STATEMENTS.
A69
| | | | |
| | | FLEXIBLE MANAGED PORTFOLIO (Continued) | | |
SCHEDULE OF INVESTMENTS | December 31, 2007 |
| | | | | | | | | | |
Interest
Rate
| | Maturity
Date
| | Moody’s
Rating
(Unaudited)
| | Principal
Amount
(000)
| | Value
(Note 2)
|
| | | | | | | | | | | |
| LONG-TERM BONDS — 27.4% |
Aerospace & Defense — 0.2% |
BAE Systems Holdings, Inc., | | | | | | | | | | |
Notes, 144A | | | | | | | | | | |
4.75% | | 08/15/10 | | Baa2 | | $ | 2,150 | | $ | 2,165,237 |
Boeing Capital Corp.,(b) | | | | | | | | | | |
Sr. Notes | | | | | | | | | | |
6.10% | | 03/01/11 | | A2 | | | 925 | | | 969,552 |
Goodrich Corp., | | | | | | | | | | |
Notes | | | | | | | | | | |
6.80% | | 07/01/36 | | Baa2 | | | 848 | | | 906,150 |
Northrop Grumman Corp., | | | | | | | | | | |
Gtd. Notes | | | | | | | | | | |
7.125% | | 02/15/11 | | Baa1 | | | 3,500 | | | 3,730,111 |
Raytheon Co., | | | | | | | | | | |
Sr. Notes | | | | | | | | | | |
5.50% | | 11/15/12 | | Baa1 | | | 595 | | | 619,510 |
| | | | | | | | | |
|
|
| | | | | | | | | | | 8,390,560 |
| | | | | | | | | |
|
|
Airlines — 0.1% | | | | | | | | | | |
American Airlines, Inc., | | | | | | | | | | |
Pass-thru Certs., Ser. 01-1 | | | | | | | | | | |
6.817% | | 05/23/11 | | Ba1 | | | 2,520 | | | 2,441,249 |
Continental Airlines, Inc., | | | | | | | | | | |
Pass-thru Certs., Ser. 981A | | | | | | | | | | |
6.648% | | 09/15/17 | | Baa2 | | | 357 | | | 358,729 |
Delta Air Lines, Inc.,(b) | | | | | | | | | | |
Pass-thru Certs., 144A | | | | | | | | | | |
6.821% | | 08/10/22 | | Baa1 | | | 520 | | | 491,452 |
Southwest Airlines Co., | | | | | | | | | | |
Notes | | | | | | | | | | |
6.50% | | 03/01/12 | | Baa1 | | | 1,005 | | | 1,040,680 |
| | | | | | | | | |
|
|
| | | | | | | | | | | 4,332,110 |
| | | | | | | | | |
|
|
Asset Backed Securities — 0.7% | | | | | | | | | | |
American Express Credit Account Master Trust,(g) | | | | | | | | |
Ser. 2004-4, Class C, 144A | | | | | | | | | | |
5.4975% | | 03/15/12 | | Baa1 | | | 1,170 | | | 1,151,533 |
Ser. 2004-C, Class C, 144A | | | | | | | | | | |
5.5275% | | 02/15/12 | | Baa1 | | | 386 | | | 385,741 |
Amortizing Residential Collateral Trust,(g) | | | | | | | | |
Ser. 2002-BC7, Class M2 | | | | | | | | | | |
6.215% | | 10/25/32 | | BB(f) | | | 118 | | | 63,890 |
Ser. 2002-BC9, Class M1 | | | | | | | | | | |
6.515% | | 12/25/32 | | Aa2 | | | 2,498 | | | 2,248,696 |
Bank of America Credit Card Trust,(g) | | | | | | | | |
Ser. 2006-C5, Class C5 | | | | | | | | | | |
5.4275% | | 01/15/16 | | Baa2 | | | 3,209 | | | 2,971,802 |
Bank One Issuance Trust, | | | | | | | | | | |
Ser. 2003-C1, Class C1 | | | | | | | | | | |
4.54% | | 09/15/10 | | Baa2 | | | 1,820 | | | 1,819,872 |
CDC Mortgage Capital Trust,(g) | | | | | | | | | | |
Ser. 2002-HE3, Class M1 | | | | | | | | | | |
6.515% | | 03/25/33 | | A1 | | | 796 | | | 632,263 |
Centex Home Equity,(g) | | | | | | | | | | |
Ser. 2005-A, Class M2 | | | | | | | | | | |
5.365% | | 01/25/35 | | Aa2 | | | 1,790 | | | 1,634,838 |
Citibank Credit Card Insurance Trust,(g) | | | | | | | | |
Ser. 2006-C1, Class C1 | | | | | | | | | | |
5.3488% | | 02/20/15 | | Baa2 | | | 1,350 | | | 1,241,041 |
SEE NOTES TO FINANCIAL STATEMENTS.
A70
| | | | |
| | | FLEXIBLE MANAGED PORTFOLIO (Continued) | | |
SCHEDULE OF INVESTMENTS | December 31, 2007 |
| | | | | | | | | | |
Interest
Rate
| | Maturity
Date
| | Moody’s
Rating
(Unaudited)
| | Principal
Amount
(000)
| | Value
(Note 2)
|
| | | | | | | | | | | |
| LONG-TERM BONDS (continued) |
Asset Backed Securities (continued) |
Credit-Based Asset Servicing and Securitization LLC, | | | | | | | | |
Ser. 2005-CB6, Class A3 | | | | | | | | | | |
5.12% | | 07/25/35 | | Aaa | | $ | 1,400 | | $ | 1,392,390 |
Equity One ABS, Inc., | | | | | | | | | | |
Ser. 2004-3, Class M1 | | | | | | | | | | |
5.70% | | 07/25/34 | | Aa2 | | | 1,280 | | | 1,176,369 |
First Franklin Mortgage Loan Trust,(g) | | | | | | | | |
Ser. 2005-FFH1, Class M2 | | | | | | | | | | |
5.385% | | 06/25/36 | | Aa2 | | | 1,450 | | | 1,297,966 |
Household Home Equity Loan Trust,(g) | | | | | | | | |
Ser. 2005-2, Class M2 | | | | | | | | | | |
5.4388% | | 01/20/35 | | Aa1 | | | 534 | | | 467,864 |
MBNA Master Credit Card Trust, | | | | | | | | | | |
Ser. 1999-J, Class A | | | | | | | | | | |
7.00% | | 02/15/12 | | Aaa | | | 1,830 | | | 1,916,209 |
Morgan Stanley ABS Capital I,(g) | | | | | | | | | | |
Ser. 2004-NC3, Class M2 | | | | | | | | | | |
5.965% | | 03/25/34 | | A2 | | | 959 | | | 884,135 |
Morgan Stanley Dean Witter Capital I,(g) | | | | | | | | |
Ser. 2002-HE1, Class M1 | | | | | | | | | | |
5.765% | | 07/25/32 | | Aa2 | | | 1,585 | | | 1,513,679 |
Ser. 2002-NC2, Class M2, 144A | | | | | | | | | | |
7.19% | | 04/25/32 | | A(f) | | | 381 | | | 136,622 |
Ser. 2002-NC4, Class M1 | | | | | | | | | | |
6.14% | | 09/25/32 | | Aaa | | | 1,179 | | | 1,143,552 |
Saxon Asset Securities Trust,(g) | | | | | | | | | | |
Ser. 2005-2, Class M2 | | | | | | | | | | |
5.305% | | 10/25/35 | | Aa2 | | | 1,170 | | | 1,128,119 |
Securitized Asset Backed Receivables LLC,(g) | | | | | | | | |
Ser. 2004-OP1, Class M1 | | | | | | | | | | |
5.375% | | 02/25/34 | | Aa2 | | | 1,325 | | | 1,291,039 |
Ser. 2006-FR3, Class A3 | | | | | | | | | | |
5.115% | | 05/25/36 | | Aaa | | | 1,100 | | | 858,000 |
SVO VOI Mortgage Corp., | | | | | | | | | | |
Ser. 2005-AA, Class A, 144A | | | | | | | | | | |
5.25% | | 02/20/21 | | Aaa | | | 617 | | | 611,647 |
WFS Financial Owner Trust, | | | | | | | | | | |
Ser. 2004-4, Class D | | | | | | | | | | |
3.58% | | 05/17/12 | | A2 | | | 236 | | | 234,065 |
| | | | | | | | | |
|
|
| | | | | | | | | | | 26,201,332 |
| | | | | | | | | |
|
|
Automotive — 0.1% | | | | | | | | | | |
Johnson Controls, Inc., | | | | | | | | | | |
Sr. Notes | | | | | | | | | | |
5.50% | | 01/15/16 | | Baa1 | | | 245 | | | 241,408 |
Oshkosh Truck Corp.,(h) | | | | | | | | | | |
Bank Loan | | | | | | | | | | |
6.90% | | 12/06/13 | | Ba3 | | | 1,975 | | | 1,893,306 |
| | | | | | | | | |
|
|
| | | | | | | | | | | 2,134,714 |
| | | | | | | | | |
|
|
Banking — 0.6% | | | | | | | | | | |
Banco Bradesco (Cayman Islands), | | | | | | | | | | |
Notes | | | | | | | | | | |
8.75% | | 10/24/13 | | A2 | | | 1,760 | | | 1,993,200 |
Bank of America Corp.,(b) | | | | | | | | | | |
Sub. Notes | | | | | | | | | | |
5.75% | | 08/15/16 | | Aa2 | | | 1,775 | | | 1,778,165 |
SEE NOTES TO FINANCIAL STATEMENTS.
A71
| | | | |
| | | FLEXIBLE MANAGED PORTFOLIO (Continued) | | |
SCHEDULE OF INVESTMENTS | December 31, 2007 |
| | | | | | | | | | |
Interest
Rate
| | Maturity
Date
| | Moody’s
Rating
(Unaudited)
| | Principal
Amount
(000)
| | Value
(Note 2)
|
| | | | | | | | | | | |
| LONG-TERM BONDS (continued) |
Banking (continued) |
Bank of America NA, | | | | | | | | | | |
Sub. Notes | | | | | | | | | | |
5.30%(b) | | 03/15/17 | | Aa1 | | $ | 930 | | $ | 904,310 |
6.00% | | 10/15/36 | | Aa1 | | | 410 | | | 392,134 |
Bank One Corp., | | | | | | | | | | |
Sub. Notes | | | | | | | | | | |
7.875% | | 08/01/10 | | Aa3 | | | 2,250 | | | 2,426,995 |
Citigroup, Inc., | | | | | | | | | | |
Sub. Notes | | | | | | | | | | |
5.00% | | 09/15/14 | | A1 | | | 454 | | | 432,591 |
5.625%(b) | | 08/27/12 | | A1 | | | 2,800 | | | 2,836,346 |
6.125% | | 08/25/36 | | A1 | | | 570 | | | 539,499 |
DEPFA ACS Bank (Ireland), | | | | | | | | | | |
Notes, 144A | | | | | | | | | | |
5.125% | | 03/16/37 | | Aaa | | | 1,380 | | | 1,364,024 |
First Union National Bank, | | | | | | | | | | |
Sub. Notes | | | | | | | | | | |
7.80% | | 08/18/10 | | Aa2 | | | 2,100 | | | 2,263,212 |
HSBC Bank USA, | | | | | | | | | | |
Sr. Notes | | | | | | | | | | |
3.875% | | 09/15/09 | | Aa2 | | | 250 | | | 247,662 |
ICICI Bank Ltd. (India),(g) | | | | | | | | | | |
Notes, 144A | | | | | | | | | | |
5.7875% | | 01/12/10 | | Baa2 | | | 2,385 | | | 2,354,234 |
ICICI Bank Ltd. (Singapore), | | | | | | | | | | |
Notes, 144A | | | | | | | | | | |
5.75% | | 11/16/10 | | Baa2 | | | 1,410 | | | 1,398,719 |
JPMorgan Chase & Co., | | | | | | | | | | |
Sub. Notes | | | | | | | | | | |
4.60% | | 01/17/11 | | Aa2 | | | 720 | | | 717,907 |
6.50% | | 01/15/09 | | Aa3 | | | 1,100 | | | 1,109,854 |
MUFG Capital Finance 1 Ltd., (Cayman Islands),(g) | | | | | | | | |
Gtd. Notes | | | | | | | | | | |
6.346% | | 07/25/49 | | A2 | | | 800 | | | 757,707 |
Santander Central Hispano Issuances (Cayman Islands), | | | | | | |
Bank Gtd. Notes | | | | | | | | | | |
7.625% | | 09/14/10 | | Aa2 | | | 695 | | | 744,107 |
Wells Fargo Bank, | | | | | | | | | | |
Sub. Notes | | | | | | | | | | |
4.75% | | 02/09/15 | | Aa1 | | | 585 | | | 558,743 |
6.45% | | 02/01/11 | | Aa1 | | | 65 | | | 68,767 |
| | | | | | | | | | | |
| | | | | | | | | |
|
|
| | | | | | | | | | | 22,888,176 |
| | | | | | | | | |
|
|
Brokerage — 0.4% | | | | | | | | | | |
Bear Stearns Co., Inc. (The), | | | | | | | | | | |
Sr. Unsec. Notes | | | | | | | | | | |
6.40% | | 10/02/17 | | A2 | | | 330 | | | 318,833 |
Unsec. Notes | | | | | | | | | | |
5.30% | | 10/30/15 | | A2 | | | 515 | | | 471,818 |
Goldman Sachs Group, Inc. (The), | | | | | | | | | | |
Sr. Notes(b) | | | | | | | | | | |
5.45% | | 11/01/12 | | Aa3 | | | 600 | | | 611,677 |
Sub. Notes | | | | | | | | | | |
5.625% | | 01/15/17 | | A1 | | | 1,190 | | | 1,162,126 |
6.45% | | 05/01/36 | | A1 | | | 1,615 | | | 1,517,281 |
6.75% | | 10/01/37 | | A1 | | | 694 | | | 679,966 |
SEE NOTES TO FINANCIAL STATEMENTS.
A72
| | | | |
| | | FLEXIBLE MANAGED PORTFOLIO (Continued) | | |
SCHEDULE OF INVESTMENTS | December 31, 2007 |
| | | | | | | | | | |
Interest
Rate
| | Maturity
Date
| | Moody’s
Rating
(Unaudited)
| | Principal
Amount
(000)
| | Value
(Note 2)
|
| | | | | | | | | | | |
| LONG-TERM BONDS (continued) |
Brokerage (continued) |
Lehman Brothers Holdings, Inc., | | | | | | | | | | |
Sr. Notes(b) | | | | | | | | | | |
5.25% | | 02/06/12 | | A1 | | $ | 1,715 | | $ | 1,696,972 |
Sub. Notes | | | | | | | | | | |
6.50% | | 07/19/17 | | A2 | | | 582 | | | 588,901 |
Merrill Lynch & Co., Inc., | | | | | | | | | | |
Notes | | | | | | | | | | |
4.25% | | 02/08/10 | | A1 | | | 1,170 | | | 1,146,949 |
4.79% | | 08/04/10 | | A1 | | | 295 | | | 292,309 |
5.00% | | 01/15/15 | | A1 | | | 615 | | | 579,960 |
Notes, M.T.N | | | | | | | | | | |
5.77% | | 07/25/11 | | A1 | | | 520 | | | 521,573 |
Sr. Unsec. Notes(b) | | | | | | | | | | |
6.40% | | 08/28/17 | | A1 | | | 1,100 | | | 1,117,554 |
Morgan Stanley, | | | | | | | | | | |
Notes | | | | | | | | | | |
5.30% | | 03/01/13 | | Aa3 | | | 845 | | | 842,874 |
5.45%, M.T.N. | | 01/09/17 | | Aa3 | | | 1,045 | | | 1,013,724 |
Sr. Notes, M.T.N.(b) | | | | | | | | | | |
5.25% | | 11/02/12 | | Aa3 | | | 930 | | | 929,690 |
Sr. Unsec. Notes, M.T.N. | | | | | | | | | | |
5.75% | | 10/18/16 | | Aa3 | | | 1,300 | | | 1,282,797 |
5.95% | | 12/28/17 | | Aa3 | | | 620 | | | 619,558 |
Sub. Notes | | | | | | | | | | |
4.75% | | 04/01/14 | | A1 | | | 1,170 | | | 1,096,119 |
| | | | | | | | | |
|
|
| | | | | | | | | | | 16,490,681 |
| | | | | | | | | |
|
|
Building Materials & Construction — 0.1% | | | | | | | | |
American Standard, Inc., | | | | | | | | | | |
Gtd. Notes | | | | | | | | | | |
7.625% | | 02/15/10 | | Baa3 | | | 770 | | | 808,551 |
Centex Corp.,(b) | | | | | | | | | | |
Sr. Unsec. Notes | | | | | | | | | | |
6.50% | | 05/01/16 | | Ba1 | | | 325 | | | 288,852 |
Hanson PLC (United Kingdom), | | | | | | | | | | |
Sr. Unsub. Notes | | | | | | | | | | |
7.875% | | 09/27/10 | | Baa3 | | | 1,000 | | | 1,084,956 |
Lafarge SA (France), | | | | | | | | | | |
Notes | | | | | | | | | | |
6.15% | | 07/15/11 | | Baa2 | | | 910 | | | 936,091 |
Ryland Group, Inc. (The), | | | | | | | | | | |
Sr. Notes | | | | | | | | | | |
5.375% | | 06/01/08 | | Ba1 | | | 160 | | | 159,051 |
| | | | | | | | | |
|
|
| | | | | | | | | | | 3,277,501 |
| | | | | | | | | |
|
|
Cable — 0.2% | | | | | | | | | | |
AT&T Broadband LLC,(e) | | | | | | | | | | |
Gtd. Notes | | | | | | | | | | |
9.455% | | 11/15/22 | | Baa2 | | | 255 | | | 324,269 |
Comcast Corp., | | | | | | | | | | |
Gtd. Notes | | | | | | | | | | |
6.45% | | 03/15/37 | | Baa2 | | | 220 | | | 224,000 |
Sr. Unsec. Notes | | | | | | | | | | |
6.50% | | 11/15/35 | | Baa2 | | | 450 | | | 459,198 |
Cox Communications, Inc., | | | | | | | | | | |
Notes, Class A | | | | | | | | | | |
6.75% | | 03/15/11 | | Baa3 | | | 950 | | | 996,601 |
7.875% | | 08/15/09 | | Baa3 | | | 1,275 | | | 1,333,927 |
SEE NOTES TO FINANCIAL STATEMENTS.
A73
| | | | |
| | | FLEXIBLE MANAGED PORTFOLIO (Continued) | | |
SCHEDULE OF INVESTMENTS | December 31, 2007 |
| | | | | | | | | | |
Interest
Rate
| | Maturity
Date
| | Moody’s
Rating
(Unaudited)
| | Principal
Amount
(000)
| | Value
(Note 2)
|
| | | | | | | | | | | |
| LONG-TERM BONDS (continued) |
Cable (continued) |
Insight Midwest Holdings LLC,(h) | | | | | | | | | | |
Bank Loan | | | | | | | | | | |
6.753% | | 10/06/13 | | Ba3 | | $ | 1,800 | | $ | 1,724,999 |
Time Warner Cable, Inc., | | | | | | | | | | |
Sr. Unsec. Notes | | | | | | | | | | |
5.40% | | 07/02/12 | | Baa2 | | | 2,510 | | | 2,515,045 |
| | | | | | | | | |
|
|
| | | | | | | | | | | 7,578,039 |
| | | | | | | | | |
|
|
Capital Goods — 0.3% | | | | | | | | | | |
Caterpillar Financial Services Corp., | | | | | | | | | | |
Notes, M.T.N. | | | | | | | | | | |
5.50% | | 03/15/16 | | A2 | | | 825 | | | 830,053 |
Caterpillar, Inc., | | | | | | | | | | |
Debs. | | | | | | | | | | |
7.25% | | 09/15/09 | | A2 | | | 700 | | | 732,736 |
ERAC USA Finance Co., | | | | | | | | | | |
Gtd. Notes, 144A | | | | | | | | | | |
5.80% | | 10/15/12 | | Baa2 | | | 460 | | | 456,352 |
6.375% | | 10/15/17 | | Baa2 | | | 1,302 | | | 1,257,879 |
7.00% | | 10/15/37 | | Baa2 | | | 490 | | | 445,032 |
7.35% | | 06/15/08 | | Baa2 | | | 1,950 | | | 1,966,643 |
FedEx Corp., | | | | | | | | | | |
Gtd. Notes | | | | | | | | | | |
7.25% | | 02/15/11 | | Baa2 | | | 400 | | | 425,825 |
General Electric Co., | | | | | | | | | | |
Sr. Unsec. Notes | | | | | | | | | | |
5.25% | | 12/06/17 | | Aaa | | | 70 | | | 69,851 |
Honeywell International, Inc., | | | | | | | | | | |
Sr. Unsec. Notes | | | | | | | | | | |
5.70% | | 03/15/37 | | A2 | | | 140 | | | 138,221 |
Sr. Unsub. Notes | | | | | | | | | | |
6.125% | | 11/01/11 | | A2 | | | 1,095 | | | 1,146,442 |
Sensata Technologies,(h) | | | | | | | | | | |
Bank Loan | | | | | | | | | | |
6.93% | | 04/27/13 | | Ba3 | | | 1,393 | | | 1,320,298 |
United Technologies Corp., | | | | | | | | | | |
Debs. | | | | | | | | | | |
8.875% | | 11/15/19 | | A2 | | | 390 | | | 505,694 |
Notes | | | | | | | | | | |
6.35% | | 03/01/11 | | A2 | | | 825 | | | 878,450 |
| | | | | | | | | |
|
|
| | | | | | | | | | | 10,173,476 |
| | | | | | | | | |
|
|
Chemicals — 0.1% | | | | | | | | | | |
Dow Chemical Co. (The), | | | | | | | | | | |
Debs. | | | | | | | | | | |
5.97% | | 01/15/09 | | A3 | | | 390 | | | 395,072 |
Sr. Notes | | | | | | | | | | |
6.125% | | 02/01/11 | | A3 | | | 685 | | | 710,689 |
ICI Wilmington, Inc., | | | | | | | | | | |
Gtd. Notes | | | | | | | | | | |
5.625% | | 12/01/13 | | Baa2 | | | 720 | | | 740,444 |
Lubrizol Corp., | | | | | | | | | | |
Sr. Notes | | | | | | | | | | |
4.625% | | 10/01/09 | | Baa3 | | | 860 | | | 863,659 |
Union Carbide Corp., | | | | | | | | | | |
Debs. | | | | | | | | | | |
7.50% | | 06/01/25 | | Ba2 | | | 460 | | | 476,682 |
| | | | | | | | | |
|
|
| | | | | | | | | | | 3,186,546 |
| | | | | | | | | |
|
|
SEE NOTES TO FINANCIAL STATEMENTS.
A74
| | | | |
| | | FLEXIBLE MANAGED PORTFOLIO (Continued) | | |
SCHEDULE OF INVESTMENTS | December 31, 2007 |
| | | | | | | | | | |
Interest
Rate
| | Maturity
Date
| | Moody’s
Rating
(Unaudited)
| | Principal
Amount
(000)
| | Value
(Note 2)
|
| | | | | | | | | | | |
| LONG-TERM BONDS (continued) |
Collateralized Mortgage Obligations — 0.4% | | | | | | | | |
Banc of America Mortgage Securities, Inc.,(g) | | | | | | | | | | |
Ser. 2005-A, Class 2A1 | | | | | | | | | | |
4.461% | | 02/25/35 | | Aaa | | $ | 1,391 | | $ | 1,376,255 |
Ser. 2005-B, Class 2A1 | | | | | | | | | | |
4.382% | | 03/25/35 | | Aaa | | | 984 | | | 976,632 |
Bank of America Alternative Loan Trust, | | | | | | | | | | |
Ser. 2005-12, Class 3CB1 | | | | | | | | | | |
6.00% | | 01/25/36 | | Aaa | | | 3,930 | | | 3,762,567 |
Chase Mortgage Finance Corp.,(g) | | | | | | | | | | |
Ser. 2007-A1, Class 1A5 | | | | | | | | | | |
4.356% | | 02/25/37 | | Aaa | | | 4,391 | | | 4,336,503 |
Countrywide Alternative Loan Trust, | | | | | | | | | | |
Ser. 2004-18CB, Class 3A1 | | | | | | | | | | |
5.25% | | 09/25/19 | | Aaa | | | 1,502 | | | 1,468,267 |
JPMorgan Mortgage Trust,(g) | | | | | | | | | | |
Ser. 2007-A1, Class 4A1 | | | | | | | | | | |
4.071% | | 07/25/35 | | Aaa | | | 2,723 | | | 2,703,175 |
Master Alternative Loan Trust, | | | | | | | | | | |
Ser. 2004-4, Class 4A1 | | | | | | | | | | |
5.00% | | 04/25/19 | | Aaa | | | 496 | | | 492,866 |
Structured Adjustable Rate Mortgage Loan,(g) | | | | | | | | | | |
Ser. 2004-1, Class 4A3 | | | | | | | | | | |
4.17% | | 02/25/34 | | Aaa | | | 917 | | | 933,902 |
Washington Mutual Alternative Mortgage, | | | | | | | | | | |
Pass-Through Certificates, Ser. 2005-1, Class 3A | | | | | | | | | | |
5.00% | | 03/25/20 | | AAA(f) | | | 571 | | | 558,299 |
| | | | | | | | | |
|
|
| | | | | | | | | | | 16,608,466 |
| | | | | | | | | |
|
|
Commercial Mortgage Backed Securities — 3.5% | | | | | | | | |
Banc of America Commercial Mortgage, Inc., | | | | | | | | | | |
Ser. 2003-2, Class A3(g) | | | | | | | | | | |
4.873% | | 03/11/41 | | AAA(f) | | | 2,500 | | | 2,504,269 |
Ser. 2004-2, Class A4 | | | | | | | | | | |
4.153% | | 11/10/38 | | Aaa | | | 2,800 | | | 2,752,921 |
Ser. 2005-1, Class ASB(g) | | | | | | | | | | |
4.85% | | 11/10/42 | | AAA(f) | | | 900 | | | 901,042 |
Ser. 2006-2, Class A4(g) | | | | | | | | | | |
5.7401% | | 05/10/45 | | AAA(f) | | | 2,300 | | | 2,377,168 |
Ser. 2007-1, Class A4 | | | | | | | | | | |
5.451% | | 01/15/49 | | Aaa | | | 3,600 | | | 3,617,606 |
Bear Stearns Commercial Mortgage Securities,(g) | | | | | | | | | | |
Ser. 2004-T16, Class A-6 | | | | | | | | | | |
4.75% | | 02/13/46 | | AAA(f) | | | 4,500 | | | 4,428,905 |
Ser. 2005-T18, Class AAB | | | | | | | | | | |
4.823% | | 02/13/42 | | Aaa | | | 1,775 | | | 1,742,379 |
Ser. 2005-T20, Class AAB | | | | | | | | | | |
5.138% | | 10/12/42 | | Aaa | | | 2,400 | | | 2,400,774 |
Commercial Mortgage Acceptance Corp.,(g) | | | | | | | | | | |
Ser. 1998-C2, Class F, 144A | | | | | | | | | | |
5.44% | | 09/15/30 | | A-(f) | | | 890 | | | 925,291 |
Commercial Mortgage Pass-Through Certificates, I/O,(g) | | | | | | | | | | |
Ser. 2004-LB2A, Class X2, 144A | | | | | | | | | | |
0.94% | | 03/10/39 | | AAA(f) | | | 11,751 | | | 237,482 |
Credit Suisse Mortgage Capital Certificates, | | | | | | | | | | |
Ser. 2006-C1, Class A4(g) | | | | | | | | | | |
5.5546% | | 02/15/39 | | AAA(f) | | | 2,700 | | | 2,740,922 |
Ser. 2006-C5, Class A3 | | | | | | | | | | |
5.311% | | 12/15/39 | | Aaa | | | 1,790 | | | 1,783,775 |
SEE NOTES TO FINANCIAL STATEMENTS.
A75
| | | | |
| | | FLEXIBLE MANAGED PORTFOLIO (Continued) | | |
SCHEDULE OF INVESTMENTS | December 31, 2007 |
| | | | | | | | | | |
Interest
Rate
| | Maturity
Date
| | Moody’s
Rating
(Unaudited)
| | Principal
Amount
(000)
| | Value
(Note 2)
|
| | | | | | | | | | | |
| LONG-TERM BONDS (continued) |
Commercial Mortgage Backed Securities (continued) | | | | | | | | |
CS First Boston Mortgage Securities Corp., | | | | | | | | | | |
Ser. 2004-C3, Class A4 | | | | | | | | | | |
4.835% | | 07/15/36 | | Aaa | | $ | 880 | | $ | 880,274 |
Ser. 2004-C4, Class A4 | | | | | | | | | | |
4.283% | | 10/15/39 | | Aaa | | | 1,400 | | | 1,378,294 |
DLJ Commercial Mortgage Corp., | | | | | | | | | | |
Ser. 2000-CF1, Class A1B | | | | | | | | | | |
7.62% | | 06/10/33 | | AAA(f) | | | 2,637 | | | 2,786,868 |
General Electric Capital Commercial Mortgage Corp., I/O,(g) | | | | | | | | | | |
Ser. 2004-C2, Class X2, 144A | | | | | | | | | | |
0.57% | | 03/10/40 | | Aaa | | | 21,605 | | | 328,765 |
GMAC Commercial Mortgage Securities, Inc., | | | | | | | | | | |
Ser. 2005-C1, Class A5 | | | | | | | | | | |
4.697% | | 05/10/43 | | AAA(f) | | | 2,720 | | | 2,595,699 |
Greenwich Capital Commercial Funding Corp., | | | | | | | | | | |
Ser. 2003-C1, Class A4 | | | | | | | | | | |
4.111% | | 07/05/35 | | Aaa | | | 7,700 | | | 7,420,519 |
Ser. 2005-GG5, Class A5(g) | | | | | | | | | | |
5.224% | | 04/10/37 | | Aaa | | | 9,550 | | | 9,474,619 |
GS Mortgage Securities Corp. II,(g) | | | | | | | | | | |
Ser. 2006-GG6, Class AAB | | | | | | | | | | |
5.587% | | 04/10/38 | | AAA(f) | | | 6,650 | | | 6,742,051 |
JPMorgan Chase & Co.,(g) | | | | | | | | | | |
Ser. 2005-CB13, Class A4 | | | | | | | | | | |
5.294% | | 01/12/43 | | Aaa | | | 2,340 | | | 2,339,410 |
Ser. 2005-LDP5, Class A4 | | | | | | | | | | |
5.1793% | | 12/15/44 | | Aaa | | | 5,000 | | | 4,979,159 |
JPMorgan Chase Commercial Mortgage Securities Corp., | | | | | | | | | | |
Ser. 2005-LDP1, Class ASB(g) | | | | | | | | | | |
4.853% | | 03/15/46 | | Aaa | | | 4,200 | | | 4,153,529 |
Ser. 2005-LDP2, Class ASB | | | | | | | | | | |
4.659% | | 07/15/42 | | Aaa | | | 6,350 | | | 6,216,221 |
Ser. 2005-LDP4, Class A4(g) | | | | | | | | | | |
4.918% | | 10/15/42 | | Aaa | | | 2,500 | | | 2,425,461 |
Ser. 2006-CB16, Class ASB | | | | | | | | | | |
5.523% | | 05/12/45 | | Aaa | | | 3,900 | | | 3,945,338 |
Ser. 2006-LDP6, Class X2, I/O(g) | | | | | | | | | | |
0.077% | | 04/15/43 | | Aaa | | | 142,166 | | | 663,732 |
Ser. 2006-LDP8, Class ASB | | | | | | | | | | |
5.37% | | 05/15/45 | | Aaa | | | 3,700 | | | 3,711,682 |
JPMorgan Commercial Mortgage Finance Corp.,(g) | | | | | | | | | | |
Ser. 2000-C10, Class A2 | | | | | | | | | | |
7.371% | | 08/15/32 | | Aaa | | | 7,587 | | | 7,923,109 |
Ser. 2003-CB6, Class A2 | | | | | | | | | | |
5.255% | | 07/12/37 | | Aaa | | | 2,100 | | | 2,130,673 |
KeyCorp.,(g) | | | | | | | | | | |
Ser. 2000-C1, Class A2 | | | | | | | | | | |
7.727% | | 05/17/32 | | Aaa | | | 8,072 | | | 8,468,200 |
LB-UBS Commercial Mortgage Trust, | | | | | | | | | | |
Ser. 2003-C8, Class A3 | | | | | | | | | | |
4.83% | | 11/15/27 | | Aaa | | | 1,460 | | | 1,462,804 |
Ser. 2004-C6, Class A5(g) | | | | | | | | | | |
4.826% | | 08/15/29 | | AAA(f) | | | 3,910 | | | 3,903,960 |
Ser. 2006-C6, Class AAB | | | | | | | | | | |
5.341% | | 09/15/39 | | Aaa | | | 2,480 | | | 2,488,751 |
SEE NOTES TO FINANCIAL STATEMENTS.
A76
| | | | |
| | | FLEXIBLE MANAGED PORTFOLIO (Continued) | | |
SCHEDULE OF INVESTMENTS | December 31, 2007 |
| | | | | | | | | | |
Interest
Rate
| | Maturity
Date
| | Moody’s
Rating
(Unaudited)
| | Principal
Amount
(000)
| | Value
(Note 2)
|
| | | | | | | | | | | |
| LONG-TERM BONDS (continued) |
Commercial Mortgage Backed Securities (continued) | | | | | | | | |
Merrill Lynch Mortgage Trust, | | | | | | | | | | |
Ser. 2004-KEY2, Class A3 | | | | | | | | | | |
4.615% | | 08/12/39 | | Aaa | | $ | 2,000 | | $ | 1,981,065 |
Merrill Lynch/Countrywide Commercial Mortgage Trust, | | | | | | | | | | |
Ser. 2006-2, Class A4(g) | | | | | | | | | | |
5.9095% | | 06/12/46 | | Aaa | | | 1,795 | | | 1,873,448 |
Ser. 2007-5, Class A4 | | | | | | | | | | |
5.378% | | 08/12/48 | | Aaa | | | 3,500 | | | 3,500,651 |
Morgan Stanley Capital I, | | | | | | | | | | |
Ser. 2006-IQ11, Class A4(g) | | | | | | | | | | |
5.773% | | 10/15/42 | | AAA(f) | | | 2,600 | | | 2,678,148 |
Ser. 2007-HQ11, Class AAB | | | | | | | | | | |
5.444% | | 02/12/44 | | Aaa | | | 4,600 | | | 4,619,545 |
Ser. 2007-T27, AAB(g) | | | | | | | | | | |
5.65% | | 06/11/42 | | AAA(f) | | | 1,105 | | | 1,126,767 |
| | | | | | | | | |
|
|
| | | | | | | | | | | 128,611,276 |
| | | | | | | | | |
|
|
Consumer | | | | | | | | |
Whirlpool Corp., | | | | | | | | | | |
Notes | | | | | | | | | | |
6.125% | | 06/15/11 | | Baa2 | | | 965 | | | 1,004,973 |
| | | | | | | | | |
|
|
Electric — 0.7% | | | | | | | | | | |
Appalachian Power Co., | | | | | | | | | | |
Sr. Notes, Ser. J | | | | | | | | | | |
4.40% | | 06/01/10 | | Baa2 | | | 620 | | | 615,398 |
Arizona Public Service Co., | | | | | | | | | | |
Sr. Unsec. Notes | | | | | | | | | | |
6.375% | | 10/15/11 | | Baa2 | | | 1,305 | | | 1,350,150 |
Unsec. Notes | | | | | | | | | | |
6.25% | | 08/01/16 | | Baa2 | | | 175 | | | 178,077 |
Baltimore Gass & Electric Co., | | | | | | | | | | |
Sr. Unsec. Notes | | | | | | | | | | |
6.35% | | 10/01/36 | | Baa2 | | | 550 | | | 545,480 |
Carolina Power & Light Co., | | | | | | | | | | |
First Mtge. Bonds | | | | | | | | | | |
5.25% | | 12/15/15 | | A2 | | | 525 | | | 522,157 |
CenterPoint Energy Houston Electric LLC, | | | | | | | | | | |
Mtge. Bonds, Ser. J2 | | | | | | | | | | |
5.70% | | 03/15/13 | | Baa2 | | | 740 | | | 747,076 |
Mtge. Bonds, Ser. K2 | | | | | | | | | | |
6.95% | | 03/15/33 | | Baa2 | | | 590 | | | 645,013 |
Consolidated Edison Co. of New York, | | | | | | | | | | |
Sr. Unsec. Notes | | | | | | | | | | |
5.375% | | 12/15/15 | | A1 | | | 730 | | | 727,225 |
Consumers Energy Co., | | | | | | | | | | |
First Mtge. Bonds, Ser. B | | | | | | | | | | |
5.375% | | 04/15/13 | | Baa1 | | | 325 | | | 324,101 |
Dominion Resources, Inc., | | | | | | | | | | |
Sr. Notes, Ser. D | | | | | | | | | | |
5.125% | | 12/15/09 | | Baa2 | | | 970 | | | 979,089 |
Duke Energy Carolinas LLC, | | | | | | | | | | |
Sr. Unsub. Notes | | | | | | | | | | |
6.10% | | 06/01/37 | | A3 | | | 960 | | | 964,913 |
El Paso Electric Co., | | | | | | | | | | |
Sr. Unsec. Notes | | | | | | | | | | |
6.00% | | 05/15/35 | | Baa2 | | | 670 | | | 626,380 |
SEE NOTES TO FINANCIAL STATEMENTS.
A77
| | | | |
| | | FLEXIBLE MANAGED PORTFOLIO (Continued) | | |
SCHEDULE OF INVESTMENTS | December 31, 2007 |
| | | | | | | | | | |
Interest
Rate
| | Maturity
Date
| | Moody’s
Rating
(Unaudited)
| | Principal
Amount
(000)
| | Value
(Note 2)
|
| | | | | | | | | | | |
| LONG-TERM BONDS (continued) |
Electric (continued) | | | | | | | | |
Empresa Nacional de Electricidad S.A. (Chile), | | | | | | | | | | |
Bonds, Ser. B | | | | | | | | | | |
8.50% | | 04/01/09 | | Baa3 | | $ | 1,070 | | $ | 1,118,557 |
Notes | | | | | | | | | | |
8.625% | | 08/01/15 | | Baa3 | | | 1,295 | | | 1,493,959 |
Energy East Corp., | | | | | | | | | | |
Notes | | | | | | | | | | |
6.75% | | 09/15/33 | | Baa2 | | | 145 | | | 146,541 |
Exelon Corp., | | | | | | | | | | |
Notes | | | | | | | | | | |
4.90% | | 06/15/15 | | Baa1 | | | 155 | | | 145,904 |
Florida Power & Light Co., | | | | | | | | | | |
First Mtge. Bonds | | | | | | | | | | |
5.95% | | 10/01/33 | | Aa3 | | | 295 | | | 298,396 |
Georgia Power Co., | | | | | | | | | | |
Unsub. Notes | | | | | | | | | | |
5.70% | | 06/01/17 | | A2 | | | 495 | | | 508,239 |
Indiana Michigan Power Co., | | | | | | | | | | |
Sr. Notes | | | | | | | | | | |
5.05% | | 11/15/14 | | Baa2 | | | 460 | | | 441,061 |
Midamerican Energy Holdings Co., | | | | | | | | | | |
Sr. Unsec. Notes | | | | | | | | | | |
5.95% | | 05/15/37 | | Baa1 | | | 420 | | | 407,391 |
National Rural Utilities Cooperative Finance Corp., | | | | | | | | |
Notes, Ser. C, M.T.N. | | | | | | | | | | |
7.25% | | 03/01/12 | | A2 | | | 185 | | | 200,444 |
Nevada Power Co., | | | | | | | | | | |
Mtge. Bonds, Ser. O | | | | | | | | | | |
6.50% | | 05/15/18 | | Baa3 | | | 1,260 | | | 1,290,012 |
NiSource Finance Corp., | | | | | | | | | | |
Gtd. Notes | | | | | | | | | | |
5.25% | | 09/15/17 | | Baa3 | | | 245 | | | 225,232 |
5.45% | | 09/15/20 | | Baa3 | | | 350 | | | 313,196 |
NRG Energy,(h) | | | | | | | | | | |
Bank Loan | | | | | | | | | | |
6.48% | | 02/01/13 | | Ba1 | | | 439 | | | 418,563 |
6.58% | | 02/01/13 | | Ba1 | | | 951 | | | 906,577 |
NSTAR Electric Co., | | | | | | | | | | |
Debs. | | | | | | | | | | |
4.875% | | 04/15/14 | | A1 | | | 565 | | | 551,268 |
Oncor Electric Delivery Co., | | | | | | | | | | |
Debs. | | | | | | | | | | |
7.00% | | 09/01/22 | | Ba1 | | | 475 | | | 492,073 |
Sec. Notes | | | | | | | | | | |
6.375% | | 01/15/15 | | Ba1 | | | 345 | | | 353,236 |
Pacific Gas & Electric Co., | | | | | | | | | | |
Unsec. Notes | | | | | | | | | | |
6.05% | | 03/01/34 | | A3 | | | 1,550 | | | 1,547,424 |
PPL Electric Utilities Corp., | | | | | | | | | | |
Sec. Notes | | | | | | | | | | |
6.25% | | 08/15/09 | | A3 | | | 1,500 | | | 1,536,458 |
Public Service Electric & Gas Co., | | | | | | | | | | |
Mtge. Bonds | | | | | | | | | | |
5.80% | | 05/01/37 | | A3 | | | 535 | | | 523,007 |
Southern California Edison Co., | | | | | | | | | | |
First Mtge. Bonds | | | | | | | | | | |
4.65% | | 04/01/15 | | A2 | | | 470 | | | 451,679 |
SEE NOTES TO FINANCIAL STATEMENTS.
A78
| | | | |
| | | FLEXIBLE MANAGED PORTFOLIO (Continued) | | |
SCHEDULE OF INVESTMENTS | December 31, 2007 |
| | | | | | | | | | |
Interest
Rate
| | Maturity
Date
| | Moody’s
Rating
(Unaudited)
| | Principal
Amount
(000)
| | Value
(Note 2)
|
| | | | | | | | | | | |
| LONG-TERM BONDS (continued) |
Electric (continued) | | | | | | | | |
Texas Competitive Electric Holdings Co. LLC,(h) | | | | | | | | |
Bank Loan | | | | | | | | | | |
8.60% | | 10/10/14 | | Ba3 | | $ | 998 | | $ | 978,798 |
Virginia Electric Power Co., | | | | | | | | | | |
Sr. Unsec. Notes, Ser. A | | | | | | | | | | |
6.00% | | 05/15/37 | | Baa1 | | | 795 | | | 777,545 |
Xcel Energy, Inc., | | | | | | | | | | |
Sr. Notes | | | | | | | | | | |
3.40% | | 07/01/08 | | Baa1 | | | 605 | | | 599,588 |
5.613% | | 04/01/17 | | Baa1 | | | 199 | | | 196,570 |
6.50% | | 07/01/36 | | Baa1 | | | 445 | | | 441,460 |
| | | | | | | | | |
|
|
| | | | | | | | | | | 24,588,237 |
| | | | | | | | | |
|
|
Energy – Integrated — 0.1% | | | | | | | | | | |
ConocoPhillips, | | | | | | | | | | |
Notes | | | | | | | | | | |
8.75% | | 05/25/10 | | A1 | | | 1,505 | | | 1,648,816 |
Lukoil International Finance BV (Netherlands), | | | | | | | | |
Gtd Notes, 144A | | | | | | | | | | |
6.356% | | 06/07/17 | | Baa2 | | | 560 | | | 530,152 |
TNK-BP Finance SA (Luxembourg), | | | | | | | | |
Gtd. Notes, 144A | | | | | | | | | | |
7.50% | | 07/18/16 | | Baa2 | | | 1,425 | | | 1,380,469 |
| | | | | | | | | |
|
|
| | | | | | | | | | | 3,559,437 |
| | | | | | | | | |
|
|
Energy – Other — 0.2% | | | | | | | | | | |
Devon Financing Corp. ULC, | | | | | | | | | | |
Gtd. Notes | | | | | | | | | | |
7.875% | | 09/30/31 | | Baa1 | | | 225 | | | 272,127 |
Halliburton Co., | | | | | | | | | | |
Sr. Unsec. Notes | | | | | | | | | | |
5.50% | | 10/15/10 | | A2 | | | 150 | | | 154,193 |
Nexen, Inc. (Canada), | | | | | | | | | | |
Unsec. Notes | | | | | | | | | | |
6.40% | | 05/15/37 | | Baa2 | | | 200 | | | 199,665 |
Pioneer Natural Resources Co., | | | | | | | | | | |
Bonds | | | | | | | | | | |
6.875% | | 05/01/18 | | Ba1 | | | 1,500 | | | 1,450,538 |
Talisman Energy, Inc. (Canada), | | | | | | | | | | |
Sr. Unsec. Notes | | | | | | | | | | |
6.25% | | 02/01/38 | | Baa2 | | | 170 | | | 165,675 |
Valero Energy Corp., | | | | | | | | | | |
Sr. Notes | | | | | | | | | | |
6.125% | | 06/15/17 | | Baa3 | | | 860 | | | 873,988 |
6.625% | | 06/15/37 | | Baa3 | | | 255 | | | 256,804 |
Weatherford International, Inc., | | | | | | | | | | |
Gtd. Notes, 144A | | | | | | | | | | |
6.35% | | 06/15/17 | | Baa1 | | | 970 | | | 1,002,646 |
Western Oil Sands, Inc. (Canada), | | | | | | | | | | |
Sec. Notes | | | | | | | | | | |
8.375% | | 05/01/12 | | Baa3 | | | 360 | | | 401,510 |
Woodside Finance Ltd. (Australia), | | | | | | | | | | |
Gtd. Notes, 144A | | | | | | | | | | |
5.00% | | 11/15/13 | | Baa1 | | | 1,315 | | | 1,310,200 |
XTO Energy, Inc., | | | | | | | | | | |
Sr. Unsec. Notes | | | | | | | | | | |
6.25% | | 08/01/17 | | Baa2 | | | 585 | | | 613,735 |
| | | | | | | | | |
|
|
| | | | | | | | | | | 6,701,081 |
| | | | | | | | | |
|
|
SEE NOTES TO FINANCIAL STATEMENTS.
A79
| | | | |
| | | FLEXIBLE MANAGED PORTFOLIO (Continued) | | |
SCHEDULE OF INVESTMENTS | December 31, 2007 |
| | | | | | | | | | |
Interest
Rate
| | Maturity
Date
| | Moody’s
Rating
(Unaudited)
| | Principal
Amount
(000)
| | Value
(Note 2)
|
| | | | | | | | | | | |
| LONG-TERM BONDS (continued) |
Foods — 0.5% | | | | | | | | | | |
Aramark Corp.,(h) | | | | | | | | | | |
Bank Loans | | | | | | | | | | |
7.036% | | 01/26/14 | | Ba3 | | $ | 1,658 | | $ | 1,574,688 |
7.036% | | 01/26/14 | | Ba3 | | | 119 | | | 112,544 |
Bunge Ltd. Finance Corp., | | | | | | | | | | |
Notes | | | | | | | | | | |
5.35% | | 04/15/14 | | Baa2 | | | 1,040 | | | 1,006,959 |
Cadbury Schweppes U.S. Finance LLC, | | | | | | | | |
Gtd. Notes, 144A | | | | | | | | | | |
3.875% | | 10/01/08 | | Baa2 | | | 810 | | | 805,093 |
Cargill, Inc., 144A, | | | | | | | | | | |
Notes | | | | | | | | | | |
3.625% | | 03/04/09 | | A2 | | | 1,875 | | | 1,847,524 |
Sr. Unsec. Notes | | | | | | | | | | |
6.00% | | 11/27/17 | | A2 | | | 670 | | | 668,470 |
Coca-Cola Co. (The), | | | | | | | | | | |
Sr. Unsec. Notes | | | | | | | | | | |
5.35% | | 11/15/17 | | Aa3 | | | 1,490 | | | 1,526,568 |
ConAgra Foods, Inc., | | | | | | | | | | |
Notes | | | | | | | | | | |
7.875% | | 09/15/10 | | Baa2 | | | 430 | | | 461,541 |
Delhaize Group (Belgium), | | | | | | | | | | |
Notes | | | | | | | | | | |
6.50% | | 06/15/17 | | Baa3 | | | 480 | | | 491,053 |
Diageo Capital PLC (United Kingdom),(b) | | | | | | | | |
Gtd. Notes | | | | | | | | | | |
5.75% | | 10/23/17 | | A3 | | | 1,005 | | | 1,010,707 |
Heinz Co., | | | | | | | | | | |
Notes, 144A | | | | | | | | | | |
6.428% | | 12/01/08 | | Baa2 | | | 1,290 | | | 1,313,285 |
Kellogg Co., | | | | | | | | | | |
Notes, Ser. B | | | | | | | | | | |
6.60% | | 04/01/11 | | A3 | | | 1,875 | | | 1,986,865 |
Kraft Foods, Inc., | | | | | | | | | | |
Sr. Unsec. Notes | | | | | | | | | | |
5.625% | | 11/01/11 | | Baa2 | | | 850 | | | 869,273 |
6.125% | | 02/01/18 | | Baa2 | | | 980 | | | 987,492 |
Kroger Co. (The), | | | | | | | | | | |
Gtd. Notes | | | | | | | | | | |
6.75% | | 04/15/12 | | Baa2 | | | 45 | | | 47,765 |
6.80%(b) | | 04/01/11 | | Baa2 | | | 670 | | | 705,101 |
McDonald’s Corp., | | | | | | | | | | |
Sr. Unsec. Notes | | | | | | | | | | |
5.80% | | 10/15/17 | | A3 | | | 720 | | | 745,472 |
Tricon Global Restaurants, | | | | | | | | | | |
Sr. Notes. | | | | | | | | | | |
8.875% | | 04/15/11 | | Baa2 | | | 180 | | | 198,545 |
Tyson Foods, Inc., | | | | | | | | | | |
Sr. Unsec. Notes | | | | | | | | | | |
6.85% | | 04/01/16 | | Ba1 | | | 735 | | | 754,224 |
Whitman Corp., | | | | | | | | | | |
Notes | | | | | | | | | | |
6.375% | | 05/01/09 | | Baa1 | | | 1,530 | | | 1,576,732 |
| | | | | | | | | |
|
|
| | | | | | | | | | | 18,689,901 |
| | | | | | | | | |
|
|
SEE NOTES TO FINANCIAL STATEMENTS.
A80
| | | | |
| | | FLEXIBLE MANAGED PORTFOLIO (Continued) | | |
SCHEDULE OF INVESTMENTS | December 31, 2007 |
| | | | | | | | | | |
Interest
Rate
| | Maturity
Date
| | Moody’s
Rating
(Unaudited)
| | Principal
Amount
(000)
| | Value
(Note 2)
|
| | | | | | | | | | | |
| LONG-TERM BONDS (continued) |
Gaming | | | | | | | | | | |
Harrah’s Operating Co., Inc., | | | | | | | | | | |
Gtd. Notes | | | | | | | | | | |
5.50% | | 07/01/10 | | Baa3 | | $ | 625 | | $ | 581,250 |
Mandalay Resorts Group, | | | | | | | | | | |
Sr. Sub. Notes | | | | | | | | | | |
9.375% | | 02/15/10 | | B1 | | | 10 | | | 10,350 |
| | | | | | | | | |
|
|
| | | | | | | | | | | 591,600 |
| | | | | | | | | |
|
|
Healthcare & Pharmaceutical — 0.5% | | | | | | | | |
Abbott Laboratories,(e) | | | | | | | | | | |
Notes | | | | | | | | | | |
5.875% | | 05/15/16 | | A1 | | | 1,145 | | | 1,196,009 |
AmerisourceBergen Corp., | | | | | | | | | | |
Gtd. Notes | | | | | | | | | | |
5.625% | | 09/15/12 | | Ba1 | | | 915 | | | 927,940 |
AstraZeneca PLC (United Kingdom), | | | | | | | | |
Sr. Unsub. Notes | | | | | | | | | | |
6.45% | | 09/15/37 | | A1 | | | 495 | | | 542,360 |
Baxter International, Inc., | | | | | | | | | | |
Sr. Unsec. Notes | | | | | | | | | | |
5.196% | | 02/16/08 | | Baa1 | | | 860 | | | 859,816 |
Bristol-Myers Squibb Co., | | | | | | | | | | |
Unsub. Notes | | | | | | | | | | |
5.875% | | 11/15/36 | | A2 | | | 275 | | | 273,274 |
Community Health Systems,(h) | | | | | | | | | | |
Bank Loan | | | | | | | | | | |
7.493% | | 07/25/14 | | Ba3 | | | 81 | | | 78,051 |
7.493% | | 07/25/14 | | Ba3 | | | 1,615 | | | 1,551,920 |
Covidien International Finance SA (Luxembourg), | | | | | | | | |
Gtd. Notes, 144A | | | | | | | | | | |
6.00% | | 10/15/17 | | Baa1 | | | 1,150 | | | 1,189,944 |
Genentech, Inc., | | | | | | | | | | |
Sr. Notes | | | | | | | | | | |
4.75% | | 07/15/15 | | A1 | | | 280 | | | 275,534 |
HCA, Inc. | | | | | | | | | | |
Bank Loan(h) | | | | | | | | | | |
7.08% | | 11/17/13 | | Ba3 | | | 1,980 | | | 1,905,255 |
Sec. Notes | | | | | | | | | | |
9.25% | | 11/15/16 | | B2 | | | 1,925 | | | 2,021,249 |
Health Managment Association,(h) | | | | | | | | | | |
Bank Loan | | | | | | | | | | |
6.62% | | 02/28/14 | | Ba2 | | | 1,201 | | | 1,118,194 |
Laboratory Corp. of America Holdings, | | | | | | | | |
Sr. Unsec. Notes | | | | | | | | | | |
5.625% | | 12/15/15 | | Baa3 | | | 580 | | | 570,824 |
Merck & Co., Inc., | | | | | | | | | | |
Bonds | | | | | | | | | | |
5.75% | | 11/15/36 | | Aa3 | | | 110 | | | 109,378 |
Debs. | | | | | | | | | | |
5.95% | | 12/01/28 | | Aa3 | | | 165 | | | 168,853 |
Schering-Plough Corp., | | | | | | | | | | |
Sr. Notes | | | | | | | | | | |
5.55% | | 12/01/13 | | Baa1 | | | 720 | | | 728,481 |
Sr. Unsec. Notes | | | | | | | | | | |
6.00% | | 09/15/17 | | Baa1 | | | 1,090 | | | 1,129,274 |
6.55%(b) | | 09/15/37 | | Baa1 | | | 340 | | | 360,249 |
SEE NOTES TO FINANCIAL STATEMENTS.
A81
| | | | |
| | | FLEXIBLE MANAGED PORTFOLIO (Continued) | | |
SCHEDULE OF INVESTMENTS | December 31, 2007 |
| | | | | | | | | | |
Interest
Rate
| | Maturity
Date
| | Moody’s
Rating
(Unaudited)
| | Principal
Amount
(000)
| | Value
(Note 2)
|
| | | | | | | | | | | |
| LONG-TERM BONDS (continued) |
Healthcare & Pharmaceutical (continued) | | | | | | | | |
Teva Pharmaceutical Finance LLC, | | | | | | | | | | |
Gtd. Notes | | | | | | | | | | |
6.15% | | 02/01/36 | | Baa2 | | $ | 120 | | $ | 119,168 |
Wyeth, | | | | | | | | | | |
Notes | | | | | | | | | | |
5.95% | | 04/01/37 | | A3 | | | 1,715 | | | 1,719,550 |
Unsub. Notes | | | | | | | | | | |
5.50% | | 03/15/13 | | A3 | | | 910 | | | 935,955 |
5.50% | | 02/01/14 | | A3 | | | 255 | | | 258,995 |
6.45% | | 02/01/24 | | A3 | | | 60 | | | 63,650 |
| | | | | | | | | |
|
|
| | | | | | | | | | | 18,103,923 |
| | | | | | | | | |
|
|
Healthcare Insurance — 0.2% | | | | | | | | | | |
Aetna, Inc., | | | | | | | | | | |
Sr. Unsub. Notes | | | | | | | | | | |
5.75% | | 06/15/11 | | A3 | | | 390 | | | 400,846 |
6.625% | | 06/15/36 | | A3 | | | 515 | | | 509,853 |
Cigna Corp., | | | | | | | | | | |
Sr. Unsec. Notes | | | | | | | | | | |
6.15% | | 11/15/36 | | Baa2 | | | 670 | | | 621,636 |
Coventry Health Care, Inc., | | | | | | | | | | |
Sr. Notes | | | | | | | | | | |
6.125% | | 01/15/15 | | Ba1 | | | 2,290 | | | 2,297,977 |
UnitedHealth Group, Inc., | | | | | | | | | | |
Bonds, 144A | | | | | | | | | | |
6.00% | | 06/15/17 | | A3 | | | 195 | | | 196,951 |
6.50% | | 06/15/37 | | A3 | | | 420 | | | 421,628 |
6.625% | | 11/15/37 | | A3 | | | 420 | | | 426,287 |
Sr. Unsec. Notes | | | | | | | | | | |
5.25% | | 03/15/11 | | A3 | | | 1,350 | | | 1,365,103 |
Wellpoint, Inc., | | | | | | | | | | |
Notes | | | | | | | | | | |
5.00%(b) | | 12/15/14 | | Baa1 | | | 860 | | | 823,804 |
5.95% | | 12/15/34 | | Baa1 | | | 635 | | | 597,726 |
| | | | | | | | | |
|
|
| | | | | | | | | | | 7,661,811 |
| | | | | | | | | |
|
|
Insurance — 0.2% | | | | | | | | | | |
American International Group, Inc., | | | | | | | | | | |
Jr. Sub. Notes | | | | | | | | | | |
6.25% | | 03/15/37 | | Aa3 | | | 420 | | | 375,656 |
Notes | | | | | | | | | | |
4.25% | | 05/15/13 | | Aa2 | | | 1,080 | | | 1,027,372 |
Sr. Notes | | | | | | | | | | |
5.05% | | 10/01/15 | | Aa2 | | | 180 | | | 173,830 |
Sr. Unsec. Notes, M.T.N. | | | | | | | | | | |
5.85% | | 01/16/18 | | Aa2 | | | 1,660 | | | 1,670,871 |
AXA SA (France), | | | | | | | | | | |
Sub. Notes | | | | | | | | | | |
8.60% | | 12/15/30 | | A3 | | | 155 | | | 190,057 |
Berkshire Hathaway Finance Corp.,(b) | | | | | | | | | | |
Gtd. Notes | | | | | | | | | | |
4.75% | | 05/15/12 | | Aaa | | | 440 | | | 445,516 |
Liberty Mutual Group, Inc., | | | | | | | | | | |
Bonds, 144A | | | | | | | | | | |
7.00% | | 03/15/34 | | Baa2 | | | 850 | | | 828,988 |
Lincoln National Corp., | | | | | | | | | | |
Sr. Unsec. Notes | | | | | | | | | | |
6.30% | | 10/09/37 | | A3 | | | 492 | | | 478,425 |
SEE NOTES TO FINANCIAL STATEMENTS.
A82
| | | | |
| | | FLEXIBLE MANAGED PORTFOLIO (Continued) | | |
SCHEDULE OF INVESTMENTS | December 31, 2007 |
| | | | | | | | | | |
Interest
Rate
| | Maturity
Date
| | Moody’s
Rating
(Unaudited)
| | Principal
Amount
(000)
| | Value
(Note 2)
|
| | | | | | | | | | | |
| LONG-TERM BONDS (continued) |
Insurance (continued) | | | | | | | | |
Marsh & McLennan Cos., Inc., | | | | | | | | | | |
Sr. Unsec. Notes | | | | | | | | | | |
5.15% | | 09/15/10 | | Baa2 | | $ | 265 | | $ | 264,704 |
MetLife, Inc., | | | | | | | | | | |
Sr. Notes | | | | | | | | | | |
5.70% | | 06/15/35 | | A2 | | | 1,020 | | | 931,414 |
6.125% | | 12/01/11 | | A2 | | | 335 | | | 347,383 |
6.375% | | 06/15/34 | | A2 | | | 400 | | | 395,014 |
St. Paul Travelers Cos., Inc. (The), | | | | | | | | | | |
Sr. Unsec. Notes | | | | | | | | | | |
6.75% | | 06/20/36 | | A3 | | | 685 | | | 714,842 |
W.R. Berkley Corp., | | | | | | | | | | |
Sr. Notes | | | | | | | | | | |
5.60% | | 05/15/15 | | Baa2 | | | 555 | | | 537,565 |
6.15% | | 08/15/19 | | Baa2 | | | 460 | | | 445,165 |
XL Capital Ltd. (Cayman Islands), | | | | | | | | | | |
Sr. Notes | | | | | | | | | | |
5.25% | | 09/15/14 | | A3 | | | 85 | | | 82,656 |
| | | | | | | | | |
|
|
| | | | | | | | | | | 8,909,458 |
| | | | | | | | | |
|
|
Lodging | | | | | | | | | | |
Starwood Hotels & Resorts Worldwide, Inc., | | | | | | | | | | |
Sr. Unsec. Notes | | | | | | | | | | |
6.25% | | 02/15/13 | | Baa3 | | | 385 | | | 385,234 |
| | | | �� | | | | | |
|
|
Media & Entertainment — 0.2% | | | | | | | | | | |
Chancellor Media Corp., | | | | | | | | | | |
Gtd. Notes | | | | | | | | | | |
8.00% | | 11/01/08 | | Baa3 | | | 575 | | | 594,313 |
Idearc, Inc.(h) | | | | | | | | | | |
Bank Loan | | | | | | | | | | |
6.83% | | 11/17/14 | | Ba2 | | | 1,485 | | | 1,412,775 |
News America, Inc., | | | | | | | | | | |
Gtd. Notes | | | | | | | | | | |
7.625% | | 11/30/28 | | Baa2 | | | 1,050 | | | 1,163,559 |
Time Warner, Inc., | | | | | | | | | | |
Debs. | | | | | | | | | | |
9.15% | | 02/01/23 | | Baa2 | | | 505 | | | 617,849 |
Gtd. Notes | | | | | | | | | | |
6.75% | | 04/15/11 | | Baa2 | | | 640 | | | 666,584 |
7.25% | | 10/15/17 | | Baa2 | | | 790 | | | 845,027 |
Viacom, Inc., | | | | | | | | | | |
Sr. Notes | | | | | | | | | | |
6.875% | | 04/30/36 | | Baa3 | | | 895 | | | 897,440 |
| | | | | | | | | |
|
|
| | | | | | | | | | | 6,197,547 |
| | | | | | | | | |
|
|
Metals — 0.1% | | | | | | | | | | |
Alcan, Inc. (Canada), | | | | | | | | | | |
Notes | | | | | | | | | | |
4.50% | | 05/15/13 | | A3 | | | 115 | | | 112,280 |
5.00% | | 06/01/15 | | A3 | | | 600 | | | 581,234 |
Alcoa, Inc., | | | | | | | | | | |
Sr. Notes | | | | | | | | | | |
5.90% | | 02/01/27 | | Baa1 | | | 115 | | | 108,590 |
Peabody Energy Corp., | | | | | | | | | | |
Gtd. Notes | | | | | | | | | | |
7.375% | | 11/01/16 | | Ba1 | | | 1,200 | | | 1,230,000 |
SEE NOTES TO FINANCIAL STATEMENTS.
A83
| | | | |
| | | FLEXIBLE MANAGED PORTFOLIO (Continued) | | |
SCHEDULE OF INVESTMENTS | December 31, 2007 |
| | | | | | | | | | |
Interest
Rate
| | Maturity
Date
| | Moody’s
Rating
(Unaudited)
| | Principal
Amount
(000)
| | Value
(Note 2)
|
| | | | | | | | | | | |
| LONG-TERM BONDS (continued) |
Metals (continued) | | | | | | | | |
Southern Copper Corp., | | | | | | | | | | |
Sr. Notes | | | | | | | | | | |
7.50% | | 07/27/35 | | Baa2 | | $ | 125 | | $ | 132,389 |
United States Steel Corp., | | | | | | | | | | |
Sr. Unsub. Notes | | | | | | | | | | |
5.65% | | 06/01/13 | | Baa3 | | | 580 | | | 561,830 |
| | | | | | | | | |
|
|
| | | | | | | | | | | 2,726,323 |
| | | | | | | | | |
|
|
Non-Captive Finance — 0.3% | | | | | | | | | | |
Capital One Bank Corp., | | | | | | | | | | |
Sub. Notes | | | | | | | | | | |
6.50% | | 06/13/13 | | A3 | | | 20 | | | 19,618 |
Capital One Financial Corp., | | | | | | | | | | |
Sr. Notes, M.T.N. | | | | | | | | | | |
5.70% | | 09/15/11 | | A3 | | | 600 | | | 579,637 |
CIT Group Funding Co. (Canada), | | | | | | | | | | |
Gtd. Notes | | | | | | | | | | |
5.20% | | 06/01/15 | | A2 | | | 680 | | | 582,187 |
CIT Group, Inc., | | | | | | | | | | |
Sr. Notes | | | | | | | | | | |
4.25% | | 02/01/10 | | A2 | | | 400 | | | 384,863 |
Countrywide Financial Corp., | | | | | | | | | | |
Gtd. Notes, M.T.N. | | | | | | | | | | |
5.80% | | 06/07/12 | | Baa3 | | | 1,190 | | | 869,294 |
General Electric Capital Corp., | | | | | | | | | | |
Notes | | | | | | | | | | |
5.55% | | 05/04/20 | | Aaa | | | 1,190 | | | 1,223,765 |
Notes, M.T.N. | | | | | | | | | | |
4.875% | | 10/21/10 | | Aaa | | | 1,070 | | | 1,085,906 |
5.50%(b) | | 04/28/11 | | Aaa | | | 2,895 | | | 2,977,941 |
Notes, Ser. A, M.T.N | | | | | | | | | | |
6.125% | | 02/22/11 | | Aaa | | | 5 | | | 5,227 |
Sr. Unsec. Notes, M.T.N. | | | | | | | | | | |
5.625% | | 09/15/17 | | Aaa | | | 130 | | | 133,377 |
GMAC LLC,(g) | | | | | | | | | | |
Unsub. Notes | | | | | | | | | | |
6.1188% | | 05/15/09 | | Ba3 | | | 660 | | | 614,714 |
Household Finance Corp., | | | | | | | | | | |
Notes | | | | | | | | | | |
4.75% | | 05/15/09 | | Aa3 | | | 370 | | | 368,771 |
HSBC Finance Corp., | | | | | | | | | | |
Sr. Notes | | | | | | | | | | |
5.70% | | 06/01/11 | | Aa3 | | | 440 | | | 442,450 |
International Lease Finance Corp., | | | | | | | | | | |
Unsub. Notes | | | | | | | | | | |
3.50% | | 04/01/09 | | A1 | | | 580 | | | 570,080 |
Residential Capital LLC, | | | | | | | | | | |
Gtd. Notes | | | | | | | | | | |
7.50% | | 02/22/11 | | Ba3 | | | 410 | | | 255,225 |
7.875% | | 06/30/10 | | Ba3 | | | 480 | | | 307,200 |
8.00% | | 04/17/13 | | Ba3 | | | 950 | | | 584,250 |
| | | | | | | | | |
|
|
| | | | | | | | | | | 11,004,505 |
| | | | | | | | | |
|
|
Paper | | | | | | | | | | |
Plum Creek Timberlands LP, | | | | | | | | | | |
Gtd. Notes | | | | | | | | | | |
5.875% | | 11/15/15 | | Baa3 | | | 535 | | | 527,491 |
| | | | | | | | | |
|
|
SEE NOTES TO FINANCIAL STATEMENTS.
A84
| | | | |
| | | FLEXIBLE MANAGED PORTFOLIO (Continued) | | |
SCHEDULE OF INVESTMENTS | December 31, 2007 |
| | | | | | | | | | |
Interest
Rate
| | Maturity
Date
| | Moody’s
Rating
(Unaudited)
| | Principal
Amount
(000)
| | Value
(Note 2)
|
| | | | | | | | | | | |
| LONG-TERM BONDS (continued) |
Pipelines & Other — 0.2% | | | | | | | | | | |
Atmos Energy Corp., | | | | | | | | | | |
Notes | | | | | | | | | | |
4.00% | | 10/15/09 | | Baa3 | | $ | 1,680 | | $ | 1,655,398 |
Duke Energy Field Services LLC, | | | | | | | | | | |
Notes | | | | | | | | | | |
7.875% | | 08/16/10 | | Baa2 | | | 1,760 | | | 1,887,968 |
Enterprise GP Holdings LP, | | | | | | | | | | |
Bank Loan(h) | | | | | | | | | | |
7.161% | | 11/08/14 | | Ba2 | | | 1,000 | | | 994,375 |
Gtd. Notes, Ser. B | | | | | | | | | | |
6.875% | | 03/01/33 | | Baa3 | | | 140 | | | 146,266 |
Sr. Notes | | | | | | | | | | |
4.625% | | 10/15/09 | | Baa3 | | | 740 | | | 738,836 |
Kinder Morgan, Inc.,(h) | | | | | | | | | | |
Bank Loan | | | | | | | | | | |
6.35% | | 05/30/14 | | Ba2 | | | 1,158 | | | 1,149,316 |
Oneok Inc., | | | | | | | | | | |
Sr. Unsec. Notes | | | | | | | | | | |
5.51% | | 02/16/08 | | Baa2 | | | 1,290 | | | 1,289,205 |
Oneok Partners LP, | | | | | | | | | | |
Notes | | | | | | | | | | |
6.65% | | 10/01/36 | | Baa2 | | | 475 | | | 480,311 |
Sempra Energy, | | | | | | | | | | |
Sr. Unsec. Notes | | | | | | | | | | |
6.00% | | 02/01/13 | | Baa1 | | | 90 | | | 92,973 |
Spectra Energy Capital LLC, | | | | | | | | | | |
Sr. Unsub. Notes | | | | | | | | | | |
6.25% | | 02/15/13 | | Baa1 | | | 235 | | | 243,618 |
| | | | | | | | | |
|
|
| | | | | | | | | | | 8,678,266 |
| | | | | | | | | |
|
|
Railroads — 0.1% | | | | | | | | | | |
Burlington Northern Santa Fe Corp., | | | | | | | | | | |
Debs. | | | | | | | | | | |
6.70% | | 08/01/28 | | Baa1 | | | 670 | | | 697,466 |
CSX Corp., | | | | | | | | | | |
Sr. Notes | | | | | | | | | | |
6.25% | | 03/15/18 | | Baa3 | | | 395 | | | 397,017 |
Sr. Unsub. Notes | | | | | | | | | | |
6.15% | | 05/01/37 | | Baa3 | | | 715 | | | 668,183 |
Norfolk Southern Corp., | | | | | | | | | | |
Sr. Notes | | | | | | | | | | |
7.80% | | 05/15/27 | | Baa1 | | | 18 | | | 21,453 |
Sr. Unsec. Notes | | | | | | | | | | |
5.59% | | 05/17/25 | | Baa1 | | | 525 | | | 486,457 |
Union Pacific Corp., | | | | | | | | | | |
Notes | | | | | | | | | | |
3.625% | | 06/01/10 | | Baa2 | | | 1,375 | | | 1,335,329 |
6.625% | | 02/01/08 | | Baa2 | | | 1,390 | | | 1,391,114 |
6.65% | | 01/15/11 | | Baa2 | | | 750 | | | 779,688 |
| | | | | | | | | |
|
|
| | | | | | | | | | | 5,776,707 |
| | | | | | | | | |
|
|
Real Estate Investment Trusts — 0.1% | | | | | | | | |
Brandywine Operating Partners LP, | | | | | | | | | | |
Gtd. Notes | | | | | | | | | | |
5.75% | | 04/01/12 | | Baa3 | | | 1,295 | | | 1,281,936 |
Mack-Cali Realty LP, | | | | | | | | | | |
Notes | | | | | | | | | | |
7.25% | | 03/15/09 | | Baa2 | | | 1,270 | | | 1,304,175 |
SEE NOTES TO FINANCIAL STATEMENTS.
A85
| | | | |
| | | FLEXIBLE MANAGED PORTFOLIO (Continued) | | |
SCHEDULE OF INVESTMENTS | December 31, 2007 |
| | | | | | | | | | |
Interest
Rate
| | Maturity
Date
| | Moody’s
Rating
(Unaudited)
| | Principal
Amount
(000)
| | Value
(Note 2)
|
| | | | | | | | | | | |
| LONG-TERM BONDS (continued) |
Real Estate Investment Trusts (continued) | | | | | | | | |
Post Apartment Homes LP, | | | | | | | | | | |
Notes | | | | | | | | | | |
6.30% | | 06/01/13 | | Baa3 | | $ | 660 | | $ | 692,661 |
Sr. Notes | | | | | | | | | | |
5.45% | | 06/01/12 | | Baa3 | | | 435 | | | 441,746 |
Simon Property Group LP, | | | | | | | | | | |
Unsec. Notes | | | | | | | | | | |
5.75% | | 05/01/12 | | A3 | | | 1,500 | | | 1,508,973 |
| | | | | | | | | |
|
|
| | | | | | | | | | | 5,229,491 |
| | | | | | | | | |
|
|
Retailers — 0.2% | | | | | | | | | | |
CVS Caremark Corp., | | | | | | | | | | |
Sr. Unsec. Notes | | | | | | | | | | |
5.75%(b) | | 08/15/11 | | Baa2 | | | 1,000 | | | 1,024,338 |
5.75% | | 06/01/17 | | Baa2 | | | 1,640 | | | 1,650,555 |
Federated Retail Holdings, Inc., | | | | | | | | | | |
Gtd. Notes | | | | | | | | | | |
5.35% | | 03/15/12 | | Baa2 | | | 850 | | | 828,152 |
5.90% | | 12/01/16 | | Baa2 | | | 5 | | | 4,709 |
Home Depot, Inc. (The), | | | | | | | | | | |
Sr. Unsec. Notes | | | | | | | | | | |
5.875% | | 12/16/36 | | Baa1 | | | 325 | | | 274,268 |
May Department Stores Co. (The), | | | | | | | | | | |
Notes | | | | | | | | | | |
6.65% | | 07/15/24 | | Baa2 | | | 135 | | | 124,705 |
Wal-Mart Stores, Inc. (The), | | | | | | | | | | |
Bonds | | | | | | | | | | |
5.25% | | 09/01/35 | | Aa2 | | | 245 | | | 217,318 |
| | | | | | | | | |
|
|
| | | | | | | | | | | 4,124,045 |
| | | | | | | | | |
|
|
Structured Note — 0.1% | | | | | | | | | | |
CDX North America High Yield,(b) | | | | | | | | | | |
Gtd. Notes, Ser. 9-T1, 144A | | | | | | | | | | |
8.75% | | 12/29/12 | | B3 | | | 2,300 | | | 2,268,375 |
| | | | | | | | | |
|
|
Technology — 0.3% | | | | | | | | | | |
Electronic Data Systems Corp., | | | | | | | | | | |
Notes | | | | | | | | | | |
7.45% | | 10/15/29 | | Ba1 | | | 120 | | | 123,121 |
First Data Corp.,(h) | | | | | | | | | | |
Bank Loan | | | | | | | | | | |
7.981% | | 09/24/14 | | Ba3 | | | 1,496 | | | 1,423,122 |
7.981% | | 09/24/14 | | Ba3 | | | 1,197 | | | 1,134,831 |
Fiserv, Inc., | | | | | | | | | | |
Gtd. Notes | | | | | | | | | | |
6.125% | | 11/20/12 | | Baa2 | | | 1,000 | | | 1,017,799 |
Flextronics International Ltd. (Singapore),(h) | | | | | | | | |
Bank Loans | | | | | | | | | | |
7.234% | | 10/01/14 | | Ba1 | | | 289 | | | 282,217 |
7.474% | | 10/01/14 | | Ba1 | | | 1,007 | | | 982,264 |
Freescale Semiconductor, Inc., | | | | | | | | | | |
Sr. Notes | | | | | | | | | | |
8.875% | | 12/15/14 | | B2 | | | 550 | | | 490,875 |
International Business Machines Corp., | | | | | | | | |
Sr. Unsec. Notes | | | | | | | | | | |
5.70% | | 09/14/17 | | A1 | | | 500 | | | 516,881 |
Intuit, Inc., | | | | | | | | | | |
Sr. Unsec. Notes | | | | | | | | | | |
5.40% | | 03/15/12 | | Baa2 | | | 600 | | | 609,392 |
SEE NOTES TO FINANCIAL STATEMENTS.
A86
| | | | |
| | | FLEXIBLE MANAGED PORTFOLIO (Continued) | | |
SCHEDULE OF INVESTMENTS | December 31, 2007 |
| | | | | | | | | | |
Interest
Rate
| | Maturity
Date
| | Moody’s
Rating
(Unaudited)
| | Principal
Amount
(000)
| | Value
(Note 2)
|
| | | | | | | | | | | |
| LONG-TERM BONDS (continued) |
Technology (continued) | | | | | | | | |
Jabil Circuit, Inc., | | | | | | | | | | |
Sr. Notes | | | | | | | | | | |
5.875% | | 07/15/10 | | Ba1 | | $ | 1,875 | | $ | 1,897,388 |
Metavante Corp.,(h) | | | | | | | | | | |
Bank Loan | | | | | | | | | | |
6.644% | | 11/01/14 | | Ba2 | | | 1,000 | | | 971,875 |
Motorola, Inc., | | | | | | | | | | |
Sr. Notes | | | | | | | | | | |
8.00% | | 11/01/11 | | Baa1 | | | 99 | | | 106,718 |
| | | | | | | | | |
|
|
| | | | | | | | | | | 9,556,483 |
| | | | | | | | | |
|
|
Telecommunications — 0.7% | | | | | | | | | | |
America Movil SAB de CV (Mexico), | | | | | | | | | | |
Unsec. Notes | | | | | | | | | | |
6.375% | | 03/01/35 | | A3 | | | 580 | | | 573,516 |
AT&T Corp., | | | | | | | | | | |
Sr. Notes | | | | | | | | | | |
8.00% | | 11/15/31 | | A2 | | | 2,035 | | | 2,499,128 |
AT&T Wireless Services, Inc., | | | | | | | | | | |
Notes | | | | | | | | | | |
8.125% | | 05/01/12 | | A2 | | | 640 | | | 711,628 |
Sr. Notes | | | | | | | | | | |
8.75% | | 03/01/31 | | A3 | | | 1,339 | | | 1,735,321 |
AT&T, Inc., | | | | | | | | | | |
Notes | | | | | | | | | | |
4.125% | | 09/15/09 | | A2 | | | 1,070 | | | 1,063,196 |
5.30% | | 11/15/10 | | A2 | | | 1,260 | | | 1,282,393 |
BellSouth Corp., | | | | | | | | | | |
Notes | | | | | | | | | | |
4.20% | | 09/15/09 | | A2 | | | 1,175 | | | 1,168,005 |
British Telecom PLC (United Kingdom),(b) | | | | | | | | |
Bonds | | | | | | | | | | |
9.125% | | 12/15/30 | | Baa1 | | | 1,475 | | | 1,952,347 |
Cingular Wireless LLC, | | | | | | | | | | |
Sr. Notes | | | | | | | | | | |
7.125% | | 12/15/31 | | A3 | | | 505 | | | 557,334 |
Deutsche Telekom International Finance BV (Netherlands), | | | | | | |
Gtd. Notes | | | | | | | | | | |
8.25% | | 06/15/30 | | A3 | | | 295 | | | 368,087 |
Embarq Corp., | | | | | | | | | | |
Notes | | | | | | | | | | |
7.082% | | 06/01/16 | | Baa3 | | | 350 | | | 360,633 |
7.995% | | 06/01/36 | | Baa3 | | | 1,600 | | | 1,686,138 |
France Telecom SA (France), | | | | | | | | | | |
Notes | | | | | | | | | | |
8.50% | | 03/01/31 | | A3 | | | 375 | | | 486,246 |
Koninklijke (Royal) KPN NV (Netherlands), | | | | | | | | |
Sr. Unsub. Notes | | | | | | | | | | |
8.00% | | 10/01/10 | | Baa2 | | | 530 | | | 568,407 |
Nextel Communications, Inc.,(b) | | | | | | | | | | |
Sr. Notes, Ser. F | | | | | | | | | | |
5.95% | | 03/15/14 | | Baa3 | | | 1,160 | | | 1,090,364 |
PCCW-HKT Capital Ltd., | | | | | | | | | | |
Gtd. Notes, 144A | | | | | | | | | | |
8.00% | | 11/15/11 | | Baa2 | | | 2,370 | | | 2,604,667 |
Qwest Corp., | | | | | | | | | | |
Notes | | | | | | | | | | |
8.875% | | 03/15/12 | | Ba1 | | | 2,000 | | | 2,140,000 |
SEE NOTES TO FINANCIAL STATEMENTS.
A87
| | | | |
| | | FLEXIBLE MANAGED PORTFOLIO (Continued) | | |
SCHEDULE OF INVESTMENTS | December 31, 2007 |
| | | | | | | | | | |
Interest
Rate
| | Maturity
Date
| | Moody’s
Rating
(Unaudited)
| | Principal
Amount
(000)
| | Value
(Note 2)
|
| | | | | | | | | | | |
| LONG-TERM BONDS (continued) |
Telecommunications (continued) | | | | | | | | |
Telecom Italia Capital SA (Italy), | | | | | | | | | | |
Gtd. Notes | | | | | | | | | | |
5.25% | | 11/15/13 | | Baa2 | | $ | 320 | | $ | 316,266 |
Telefonica Emisiones SAU (Spain), | | | | | | | | | | |
Gtd. Notes | | | | | | | | | | |
7.045% | | 06/20/36 | | Baa1 | | | 210 | | | 234,735 |
TELUS Corp. (Canada), | | | | | | | | | | |
Notes | | | | | | | | | | |
8.00% | | 06/01/11 | | Baa1 | | | 1,255 | | | 1,359,754 |
U.S. Cellular Corp.,
Sr. Notes | | | | | | | | | | |
6.70% | | 12/15/33 | | Baa3 | | | 470 | | | 431,656 |
Vodafone Group PLC (United Kingdom), | | | | | | | | |
Sr. Notes | | | | | | | | | | |
7.75% | | 02/15/10 | | Baa1 | | | 800 | | | 843,911 |
Unsec. Notes(b) | | | | | | | | | | |
6.15% | | 02/27/37 | | Baa1 | | | 485 | | | 478,996 |
| | | | | | | | | |
|
|
| | | | | | | | | | | 24,512,728 |
| | | | | | | | | |
|
|
Tobacco | | | | | | | | | | |
Altria Group, Inc., | | | | | | | | | | |
Debs. | | | | | | | | | | |
7.75% | | 01/15/27 | | Baa1 | | | 7 | | | 9,019 |
Notes | | | | | | | | | | |
7.65% | | 07/01/08 | | Baa1 | | | 590 | | | 599,482 |
Reynolds American, Inc., | | | | | | | | | | |
Bonds | | | | | | | | | | |
6.75% | | 06/15/17 | | Ba1 | | | 950 | | | 967,596 |
7.25% | | 06/15/37 | | Ba1 | | | 410 | | | 414,379 |
| | | | | | | | | |
|
|
| | | | | | | | | | | 1,990,476 |
| | | | | | | | | |
|
|
Foreign Government Bonds — 0.4% | | | | | | | | |
DP World Ltd., | | | | | | | | | | |
Bonds, 144A | | | | | | | | | | |
6.85% | | 07/02/37 | | A1 | | | 1,680 | | | 1,597,082 |
Gaz Capital for Gazprom (Luxembourg), | | | | | | | | |
Sr. Unsec. Notes, 144A | | | | | | | | | | |
7.288% | | 08/16/37 | | A3 | | | 1,300 | | | 1,312,090 |
Pemex Project Funding Master Trust (Mexico), | | | | | | | | |
Gtd. Notes | | | | | | | | | | |
8.625% | | 12/01/23 | | Baa1 | | | 350 | | | 435,313 |
Petrobras International Finance Co. (Cayman Islands), | | | | | | | | |
Bonds | | | | | | | | | | |
8.375% | | 12/10/18 | | Baa1 | | | 1,185 | | | 1,410,150 |
Quebec Province (Canada), | | | | | | | | | | |
Notes(b) | | | | | | | | | | |
4.60% | | 05/26/15 | | Aa2 | | | 735 | | | 734,330 |
Sr. Unsec. Notes | | | | | | | | | | |
5.75% | | 02/15/09 | | Aa2 | | | 500 | | | 509,060 |
Republic of Italy (Italy), | | | | | | | | | | |
Notes | | | | | | | | | | |
5.375% | | 06/15/33 | | A+(f) | | | 800 | | | 820,520 |
RSHB Capital SA for OJSC Russian Agricultural Bank (Russia), | | | | | | |
Bonds, 144A | | | | | | | | | | |
6.299% | | 05/15/17 | | A3 | | | 2,190 | | | 2,075,024 |
SEE NOTES TO FINANCIAL STATEMENTS.
A88
| | | | |
| | | FLEXIBLE MANAGED PORTFOLIO (Continued) | | |
SCHEDULE OF INVESTMENTS | December 31, 2007 |
| | | | | | | | | | |
Interest
Rate
| | Maturity
Date
| | Moody’s
Rating
(Unaudited)
| | Principal
Amount
(000)
| | Value
(Note 2)
|
| | | | | | | | | | | |
| LONG-TERM BONDS (continued) |
Foreign Government Bonds (continued) | | | | | | | | |
United Mexican States Global Bond (Mexico), | | | | | | |
Notes | | | | | | | | | | |
5.875% | | 01/15/14 | | Baa1 | | $ | 4,245 | | $ | 4,414,800 |
7.50% | | 01/14/12 | | Baa1 | | | 1,290 | | | 1,416,420 |
| | | | | | | | | |
|
|
| | | | | | | | | | | 14,724,789 |
| | | | | | | | | |
|
|
Mortgage Backed Securities — 11.6% | | | | | | | | |
Federal Home Loan Mortgage Corp., | | | | | | | | |
4.50% | | 02/01/19-07/01/20 | | | | | 6,403 | | | 6,292,932 |
5.00% | | 07/01/18-05/01/34 | | | | | 10,856 | | | 10,789,796 |
5.238%(g) | | 12/01/35 | | | | | 3,422 | | | 3,428,138 |
5.50% | | 12/01/33-06/01/34 | | | | | 9,105 | | | 9,096,982 |
5.50% | | TBA 30 YR | | | | | 41,000 | | | 40,910,292 |
6.00% | | 03/01/32-12/01/33 | | | | | 3,338 | | | 3,403,359 |
6.00% | | TBA 30 YR | | | | | 22,000 | | | 22,323,136 |
6.50% | | 12/01/14 | | | | | 379 | | | 392,440 |
7.00% | | 01/01/31-11/01/33 | | | | | 4,307 | | | 4,518,789 |
Federal National Mortgage Assn., | | | | | | | | | | |
4.00% | | 06/01/19 | | | | | 1,960 | | | 1,880,429 |
4.50% | | 11/01/18-01/01/35 | | | | | 13,604 | | | 13,231,990 |
4.366%(g) | | 11/01/35 | | | | | 4,193 | | | 4,181,711 |
4.96%(g) | | 07/01/33 | | | | | 1,054 | | | 1,060,106 |
5.00% | | 10/01/18-05/01/37 | | | | | 10,394 | | | 10,218,970 |
5.00% | | TBA 30 YR | | | | | 55,500 | | | 54,147,187 |
5.50% | | 03/01/16-04/01/37 | | | | | 67,775 | | | 67,830,137 |
5.50% | | TBA 15 YR | | | | | 20,500 | | | 20,762,646 |
5.50% | | TBA 30 YR | | | | | 50,000 | | | 49,937,500 |
5.914%(g) | | 06/01/37 | | | | | 13,016 | | | 13,252,742 |
6.00% | | 04/01/13-09/01/36 | | | | | 25,757 | | | 26,227,631 |
6.00% | | TBA 30 YR | | | | | 12,000 | | | 12,183,744 |
6.50% | | 07/01/17-09/01/37 | | | | | 13,918 | | | 14,327,436 |
7.00% | | 08/01/11-07/01/32 | | | | | 1,147 | | | 1,206,807 |
7.50% | | 06/01/12-05/01/32 | | | | | 901 | | | 943,780 |
Government National Mortgage Assn., | | | | | | | | |
5.50% | | 11/15/32-02/15/36 | | | | | 13,800 | | | 13,906,440 |
6.00% | | 02/15/33-08/15/37 | | | | | 8,149 | | | 8,346,705 |
6.00% | | TBA 30 YR | | | | | 11,000 | | | 11,261,250 |
6.50% | | 10/15/23-07/15/35 | | | | | 6,118 | | | 6,347,256 |
8.00% | | 01/15/24-04/15/25 | | | | | 228 | | | 246,395 |
| | | | | | | | | |
|
|
| | | | | | | | | | | 432,656,726 |
| | | | | | | | | |
|
|
U.S. Government Agency Obligations — 1.6% | | | | | | | | |
Federal Farm Credit Bank, | | | | | | | | | | |
4.75% | | 05/07/10 | | | | | 415 | | | 425,680 |
4.875% | | 01/17/17 | | | | | 855 | | | 877,121 |
Federal Home Loan Bank, | | | | | | | | | | |
3.625% | | 12/17/10 | | | | | 320 | | | 320,042 |
4.375% | | 10/03/08 | | | | | 8,140 | | | 8,136,653 |
4.50% | | 10/09/09-05/13/11 | | | | | 5,060 | | | 5,139,694 |
4.75% | | 06/11/08-04/24/09 | | | | | 13,660 | | | 13,724,159 |
5.00% | | 10/16/09 | | | | | 14,165 | | | 14,251,193 |
Federal Home Loan Mortgage Corp., | | | | | | | | | | |
4.75% | | 01/18/11 | | | | | 325 | | | 335,425 |
5.125%(b) | | 11/17/17 | | | | | 6,850 | | | 7,147,571 |
5.25% | | 07/18/11 | | | | | 4,300 | | | 4,518,758 |
SEE NOTES TO FINANCIAL STATEMENTS.
A89
| | | | |
| | | FLEXIBLE MANAGED PORTFOLIO (Continued) | | |
SCHEDULE OF INVESTMENTS | December 31, 2007 |
| | | | | | | | |
Interest
Rate
| | Maturity
Date
| | Principal
Amount
(000)
| | Value
(Note 2)
|
| | | | | | | | | |
| LONG-TERM BONDS (continued) |
U.S. Government Agency Obligations (continued) | | | | | | |
Federal National Mortgage Assn., | | | | | | | | |
5.00% | | 03/15/16 | | $ | 2,505 | | $ | 2,617,735 |
6.125% | | 03/15/12 | | | 1,275 | | | 1,385,208 |
| | | | | | | |
|
|
| | | | | | | | | 58,879,239 |
| | | | | | | |
|
|
U.S. Government Treasury Obligations — 2.4% | | | | | | |
United States Treasury Bonds, | | | | | | | | |
4.75%(b) | | 02/15/37 | | | 9,981 | | | 10,445,734 |
6.625% | | 02/15/27 | | | 1,155 | | | 1,465,858 |
6.875% | | 08/15/25 | | | 545 | | | 700,751 |
7.875%(b) | | 02/15/21 | | | 2,290 | | | 3,080,050 |
8.125%(b) | | 08/15/21 | | | 3,665 | | | 5,048,252 |
8.75% | | 08/15/20 | | | 1,270 | | | 1,808,262 |
8.875%(b) | | 08/15/17 | | | 5,505 | | | 7,574,538 |
9.00% | | 11/15/18 | | | 987 | | | 1,395,525 |
9.125% | | 05/15/18 | | | 730 | | | 1,032,323 |
United States Treasury Inflation Index Bonds, | | | | | | | | |
0.875%(b) | | 04/15/10 | | | 2,018 | | | 2,011,363 |
1.625% | | 01/15/15 | | | 1,439 | | | 1,444,526 |
1.875% | | 07/15/13-07/15/15 | | | 2,787 | | | 2,858,290 |
2.00%(b) | | 01/15/14-01/15/26 | | | 6,742 | | | 6,865,245 |
2.375% | | 04/15/11-01/15/27 | | | 4,006 | | | 4,204,691 |
2.50% | | 07/15/16 | | | 1,216 | | | 1,296,269 |
2.625% | | 07/15/17 | | | 534 | | | 576,454 |
3.00% | | 07/15/12 | | | 1,644 | | | 1,780,732 |
3.375% | | 01/15/12-04/15/32 | | | 853 | | | 1,004,461 |
3.50% | | 01/15/11 | | | 846 | | | 910,142 |
3.625% | | 04/15/28 | | | 1,272 | | | 1,611,889 |
3.875% | | 01/15/09-04/15/29 | | | 2,614 | | | 3,120,668 |
4.25% | | 01/15/10 | | | 820 | | | 874,505 |
United States Treasury Notes, | | | | | | | | |
4.25% | | 11/15/17 | | | 650 | | | 661,324 |
4.75% | | 02/15/10 | | | 520 | | | 537,956 |
4.875%(b) | | 08/15/16 | | | 15,710 | | | 16,728,698 |
United States Treasury Strips, I/O, | | | | | | | | |
Zero | | 11/15/18-05/15/20 | | | 18,435 | | | 11,038,894 |
| | | | | | | |
|
|
| | | | | | | | | 90,077,400 |
| | | | | | | |
|
|
TOTAL LONG-TERM BONDS
(cost $1,016,624,918) | | | | | | 1,018,999,123 |
| | | | | | | |
|
|
TOTAL LONG-TERM INVESTMENTS
(cost $3,122,242,480) | | | | | | 3,417,350,320 |
| | | | | | | |
|
|
| SHORT-TERM INVESTMENTS — 22.5% | | | | | | | | |
U.S. Government Treasury Obligation — 0.2% | | | | | | | | |
United States Treasury Bill(e)
(cost $7,452,501) 2.90% | | 03/20/08 | | | 7,500 | | | 7,448,813 |
| | | | | | | |
|
|
SEE NOTES TO FINANCIAL STATEMENTS.
A90
| | | | |
| | | FLEXIBLE MANAGED PORTFOLIO (Continued) | | |
SCHEDULE OF INVESTMENTS | December 31, 2007 |
| | | | | | |
| | | Shares
| | Value
(Note 2)
| |
| | | | | | | |
Affiliated Mutual Funds — 22.3% | | | | | | |
Dryden Core Investment Fund — Short-Term Bond Series(d) | | 17,757,821 | | $ | 167,633,826 | |
Dryden Core Investment Fund — Taxable Money Market Series
(cost $660,990,589; includes $339,524,711 of cash collateral received for securities on loan)(c)(d) | | 660,990,589 | | | 660,990,589 | |
| | | | |
|
|
|
TOTAL AFFILIATED MUTUAL FUNDS
(cost $838,214,760) | | | | | 828,624,415 | |
| | | | |
|
|
|
TOTAL SHORT-TERM INVESTMENTS
(cost $845,667,261) | | | | | 836,073,228 | |
| | | | |
|
|
|
TOTAL INVESTMENTS — 114.5%
(cost $3,967,909,741) | | | | | 4,253,423,548 | |
LIABILITIES IN EXCESS OF OTHER
ASSETS(i) — (14.5%) | | | | | (537,099,684 | ) |
| | | | |
|
|
|
TOTAL NET ASSETS — 100.0% | | | | $ | 3,716,323,864 | |
| | | | |
|
|
|
The following abbreviations are used in portfolio descriptions:
| | |
| 144A | | Security was purchased pursuant to Rule 144A under the Securities Act of 1933 and may not be resold subject to that rule except to qualified institutional buyers. Unless otherwise noted, 144A securities are deemed to be liquid. |
| I/O | | Interest Only |
| M.T.N. | | Medium Term Note |
| TBA | | To Be Announced |
| (a) | Non income-producing security. |
| (b) | All or portion of security is on loan. The aggregate market value of such securities is $327,959,761; cash collateral of $339,524,711 (included in liabilities) was received with which the Portfolio purchased highly liquid short-term investments. |
| (c) | Represents security, or portion thereof, purchased with cash collateral received for securities on loan. |
| (d) | Prudential Investments LLC, the manager of the Portfolio, also serves as manager of the Dryden Core Investment Fund–Taxable Money Market Series and the Dryden Core Investment Fund–Short-Term Bond Series. |
| (e) | Security segregated as collateral for futures contracts. |
| (f) | Standard & Poor’s rating. |
| (g) | Indicates a variable rate security. |
| (h) | Indicates a security that has been deemed illiquid. |
| (i) | Liabilities in excess of other assets include net unrealized appreciation (depreciation) on financial futures, interest rate and credit default swap agreements as follows: |
Open futures contracts outstanding at December 31, 2007:
| | | | | | | | | | | | | | |
Number of
Contracts
| | Type
| | Expiration
Date
| | Value at
December 31, 2007
| | Value at
Trade Date
| | Unrealized
Appreciation
(Depreciation)
| |
| Long Positions: | | | | | | | | | | | | | | |
| 44 | | 2-Yr. U.S. T-Notes | | Mar. 08 | | $ | 9,251,000 | | $ | 9,222,007 | | $ | 28,993 | |
| 1,043 | | 5-Yr. U.S. T-Notes | | Mar. 08 | | | 115,023,344 | | | 114,858,697 | | | 164,647 | |
| 96 | | 10-Yr. U.S. T-Notes | | Mar. 08 | | | 10,885,500 | | | 10,849,938 | | | 35,562 | |
| 250 | | S&P 500 Index | | Mar. 08 | | | 92,325,000 | | | 93,280,754 | | | (955,754 | ) |
| 228 | | U.S. Long Bond | | Mar. 08 | | | 26,533,500 | | | 26,545,011 | | | (11,511 | ) |
| | | | | | | | | | | | |
|
|
|
| | | | | | | | | | | | | $ | (738,063 | ) |
| | | | | | | | | | | | |
|
|
|
SEE NOTES TO FINANCIAL STATEMENTS.
A91
| | | | |
| | | FLEXIBLE MANAGED PORTFOLIO (Continued) | | |
SCHEDULE OF INVESTMENTS | December 31, 2007 |
Interest rate swap agreements outstanding at December 31, 2007:
| | | | | | | | | | | | | | |
Counterparty
| | Termination
Date
| | Notional
Amount
(000)
| | Fixed
Rate
| | | Floating Rate
| | Unrealized
Appreciation
(Depreciation)
| |
Merrill Lynch Capital Services, Inc.(a) | | 08/14/2012 | | $ | 6,850 | | 5.20857 | % | | 3 month LIBOR | | $ | 393,694 | |
Morgan Stanley Capital Services, Inc.(a) | | 09/12/2012 | | | 3,660 | | 4.7357 | % | | 3 month LIBOR | | | 131,134 | |
Morgan Stanley Capital Services, Inc.(a) | | 09/25/2012 | | | 3,700 | | 4.94079 | % | | 3 month LIBOR | | | 168,621 | |
Morgan Stanley Capital Services, Inc.(a) | | 10/23/2012 | | | 4,880 | | 4.7945 | % | | 3 month LIBOR | | | 128,269 | |
Morgan Stanley Capital Services, Inc.(a) | | 12/07/2012 | | | 3,500 | | 4.15033 | % | | 3 month LIBOR | | | 2,760 | |
Morgan Stanley Capital Services, Inc.(a) | | 12/13/2012 | | | 3,900 | | 4.34666 | % | | 3 month LIBOR | | | 34,422 | |
Merrill Lynch Capital Services, Inc.(b) | | 12/14/2012 | | | 5,125 | | 4.35284 | % | | 3 month LIBOR | | | (49,345 | ) |
Morgan Stanley Capital Services, Inc.(b) | | 12/11/2037 | | | 1,775 | | 5.08438 | % | | 3 month LIBOR | | | (21,387 | ) |
Merrill Lynch Capital Services, Inc.(b) | | 12/11/2037 | | | 4,240 | | 5.08938 | % | | 3 month LIBOR | | | (65,545 | ) |
| | | | | | | | | | | | |
|
|
|
| | | | | | | | | | | | | $ | 722,623 | |
| | | | | | | | | | | | |
|
|
|
| (a) | The Portfolio pays the floating rate and receives the fixed rate. |
| (b) | The Portfolio pays the fixed rate and receives the floating rate. |
Credit default swap agreements outstanding at December 31, 2007:
| | | | | | | | | | | | | | |
Counterparty
| | Termination
Date
| | Notional
Amount
(000)
| | Fixed
Rate
| | | Reference Entity/Obligation
| | Unrealized
Appreciation
(Depreciation)
| |
JPMorgan Chase Bank(a) | | 06/20/2012 | | $ | 3,500 | | 0.30 | % | | PPG Industries, Inc.,
7.05%, 08/15/09 | | $ | 1,425 | |
Citibank NA(a) | | 09/20/2012 | | | 3,200 | | 0.32 | % | | Altria Group, Inc.,
7.00%, 11/04/13 | | | (1,398 | ) |
Morgan Stanley Capital Services, Inc.(a) | | 09/20/2012 | | | 2,700 | | 0.45 | % | | Sara Lee Corp.,
6.125%, 11/01/32 | | | (16,477 | ) |
Barclays Bank PLC(a) | | 09/20/2012 | | | 2,900 | | 0.595 | % | | Fortune Brands, Inc.,
6.25%, 04/01/08 | | | 26,861 | |
JPMorgan Chase Bank(a) | | 09/20/2012 | | | 2,275 | | 1.52 | % | | Residential Capital LLC, 6.50%, 04/17/13 | | | 1,071,294 | |
JPMorgan Chase Bank(a) | | 06/20/2014 | | | 1,150 | | 0.65 | % | | Bunge Ltd. Finance Corp., 5.35%, 04/15/14 | | | (795 | ) |
Credit Suisse International(a) | | 09/20/2017 | | | 3,000 | | 0.99 | % | | Gannett Co., Inc.,
6.375%, 04/01/12 | | | 21,804 | |
Barclays Bank PLC(a) | | 09/25/2035 | | | 1,000 | | 3.35 | % | | Accredited Mortgage Loan Trust, Ser. 2005-3, Class M9, 7.02%, 09/25/35 | | | 460,932 | |
Merrill Lynch Capital Services(b) | | 03/25/2036 | | | 1,000 | | 3.72 | % | | Ameriquest Mortgage Securities, Inc., Ser. 2006-R1, Class M9
7.82%, 03/25/36 | | | 744,827 | |
Merrill Lynch Capital Services(a) | | 03/25/2036 | | | 1,000 | | 9.00 | % | | AmeriQuest Mortgage Securities, Inc., Ser. 2006-R1, Class M9,
7.82%, 03/25/36 | | | (654,500 | ) |
Citibank, NA(a) | | 03/25/2035 | | | 1,000 | | 3.00 | % | | Centex Home Equity, Ser. 2005-B, Class MB,
6.215%, 03/25/35 | | | (1,250 | ) |
Citibank, NA(a) | | 03/25/2035 | | | 1,000 | | 3.00 | % | | Morgan Stanley ABS Capital I, Ser. 2005-HE2, Class B3, 6.765%, 01/25/35 | | | (1,500 | ) |
| | | | | | | | | | | | |
|
|
|
| | | | | | | | | | | | | $ | 1,651,223 | |
| | | | | | | | | | | | |
|
|
|
| (a) | The Portfolio pays the fixed rate and receives from the counterparty par in the event that the underlying bond defaults. |
| (b) | The Portfolio receives the fixed rate and pays the counterparty par in the event that the underlying bond defaults. |
SEE NOTES TO FINANCIAL STATEMENTS.
A92
| | | | |
| | | FLEXIBLE MANAGED PORTFOLIO (Continued) | | |
SCHEDULE OF INVESTMENTS | December 31, 2007 |
The industry classification of portfolio holdings and liabilities in excess of other assets shown as a percentage of net assets as of December 31, 2007 was as follows:
| | | |
Affiliated Money Market Mutual Funds (including 9.1% of collateral received for securities on loan | | 22.3 | % |
Mortgage Backed Securities | | 11.6 | |
Oil, Gas & Consumable Fuels | | 6.8 | |
Pharmaceuticals | | 3.9 | |
Commercial Mortgage Backed Securities | | 3.5 | |
Insurance | | 3.5 | |
Commercial Banks | | 2.6 | |
Computers & Peripherals | | 2.6 | |
Software | | 2.6 | |
U.S. Government Treasury Obligations | | 2.6 | |
Capital Markets | | 2.5 | |
Diversified Financial Services | | 2.5 | |
Diversified Telecommunication Services | | 2.4 | |
Aerospace & Defense | | 2.2 | |
Industrial Conglomerates | | 2.1 | |
Media | | 2.1 | |
Healthcare Providers & Services | | 1.8 | |
U.S. Government Agency Obligations | | 1.6 | |
Beverages | | 1.5 | |
Food & Staples Retailing | | 1.4 | |
Household Products | | 1.4 | |
Metals & Mining | | 1.4 | |
Semiconductors & Semiconductor Equipment | | 1.4 | |
Communications Equipment | | 1.3 | |
Electric Utilities | | 1.3 | |
Healthcare Equipment & Supplies | | 1.1 | |
Hotels, Restaurants & Leisure | | 1.1 | |
Specialty Retail | | 1.1 | |
Chemicals | | 1.0 | |
Energy Equipment & Services | | 1.0 | |
Machinery | | 1.0 | |
Electrical Equipment | | 0.9 | |
Food Products | | 0.9 | |
Tobacco | | 0.9 | |
Internet Software & Services | | 0.8 | |
Asset Backed Securities | | 0.7 | |
Electric | | 0.7 | |
Telecommunications | | 0.7 | |
Banking | | 0.6 | |
Biotechnology | | 0.6 | |
Automobiles | | 0.5 | |
Electronic Equipment & Instruments | | 0.5 | |
Foods | | 0.5 | |
Healthcare & Pharmaceutical | | 0.5 | |
IT Services | | 0.5 | |
Real Estate Investment Trusts | | 0.5 | |
Wireless Telecommunication Services | | 0.5 | |
Brokerage | | 0.4 | |
Collateralized Mortgage Obligations | | 0.4 | |
Commercial Services & Supplies | | 0.4 | |
Foreign Government Bonds | | 0.4 | |
Independent Power Producers & Energy Traders | | 0.4 | |
Life Sciences, Tools & Services | | 0.4 | |
Multi-Utilities | | 0.4 | |
Office Electronics | | 0.4 | |
Capital Goods | | 0.3 | |
Household Durables | | 0.3 | |
Non Captive Finance | | 0.3 | |
Technology | | 0.3 | |
SEE NOTES TO FINANCIAL STATEMENTS.
A93
| | | | |
| | | FLEXIBLE MANAGED PORTFOLIO (Continued) | | |
SCHEDULE OF INVESTMENTS | December 31, 2007 |
| | | |
Textiles, Apparel & Luxury Goods | | 0.3 | % |
Thrifts & Mortgage Finance | | 0.3 | |
Air Freight & Logistics | | 0.2 | |
Airlines | | 0.2 | |
Cable | | 0.2 | |
Containers & Packaging | | 0.2 | |
Energy – Other | | 0.2 | |
Healthcare Insurance | | 0.2 | |
Media & Entertainment | | 0.2 | |
Multiline Retail | | 0.2 | |
Paper & Forest Products | | 0.2 | |
Pipelines & Other | | 0.2 | |
Retailers | | 0.2 | |
Road & Rail | | 0.2 | |
Trading Companies & Distributors | | 0.2 | |
Auto Components | | 0.1 | |
Automotive | | 0.1 | |
Building Materials & Construction | | 0.1 | |
Building Products | | 0.1 | |
Construction & Engineering | | 0.1 | |
Construction Materials | | 0.1 | |
Consumer Finance | | 0.1 | |
Energy – Integrated | | 0.1 | |
Leisure Equipment & Products | | 0.1 | |
Marine | | 0.1 | |
Metals | | 0.1 | |
Railroads | | 0.1 | |
Real Estate Management & Development | | 0.1 | |
Structured Note | | 0.1 | |
| | |
|
|
| | | 114.5 | |
Liabilities in excess of other assets | | (14.5 | ) |
| | |
|
|
| | | 100.0 | % |
| | |
|
|
SEE NOTES TO FINANCIAL STATEMENTS.
A94
| | | | |
| | | FLEXIBLE MANAGED PORTFOLIO (Continued) | | |
STATEMENT OF ASSETS AND LIABILITIES
December 31, 2007
| | | |
| ASSETS | | | |
Investments, at value including securities on loan of $327,959,761: | | | |
Unaffiliated investments (cost $3,129,694,981) | | $ | 3,424,799,133 |
Affiliated investments (cost $838,214,760) | | | 828,624,415 |
Foreign currency, at value (cost $24,896) | | | 25,132 |
Receivable for investments sold | | | 55,537,930 |
Dividends and interest receivable | | | 12,270,196 |
Unrealized appreciation on swaps | | | 3,186,043 |
Premium for swaps purchased | | | 590,000 |
Foreign tax reclaim receivable | | | 351,180 |
Receivable for Series shares sold | | | 228,207 |
Due from broker—variation margin | | | 2,327 |
Prepaid expenses | | | 41,439 |
| | |
|
|
Total Assets | | | 4,325,656,002 |
| | |
|
|
| LIABILITIES | | | |
Collateral for securities on loan | | | 339,524,711 |
Payable for investments purchased | | | 266,467,119 |
Management fee payable | | | 1,892,636 |
Unrealized depreciation on swaps | | | 812,197 |
Accrued expenses and other liabilities | | | 421,046 |
Payable for Series shares repurchased | | | 203,469 |
Payable to custodian | | | 10,330 |
Transfer agent fee payable | | | 630 |
| | |
|
|
Total Liabilities | | | 609,332,138 |
| | |
|
|
| NET ASSETS | | $ | 3,716,323,864 |
| | |
|
|
Net assets were comprised of: | | | |
Paid-in capital | | $ | 3,098,697,814 |
Retained earnings | | | 617,626,050 |
| | |
|
|
Net assets, December 31, 2007 | | $ | 3,716,323,864 |
| | |
|
|
Net asset value and redemption price per share,
$3,716,323,864 / 203,028,780 outstanding shares of beneficial interest (authorized 600,000,000 shares) | | $ | 18.30 |
| | |
|
|
STATEMENT OF OPERATIONS
Year Ended December 31, 2007
| | | | |
| INVESTMENT INCOME | | | | |
Unaffiliated dividend income (net of foreign withholding taxes of $1,041,084) | | $ | 50,986,587 | |
Unaffiliated Interest | | | 39,419,396 | |
Affiliated dividend income | | | 27,564,769 | |
Affiliated income from securities loaned, net | | | 899,705 | |
| | |
|
|
|
| | | | 118,870,457 | |
| | |
|
|
|
| EXPENSES | | | | |
Management fee | | | 22,616,106 | |
Custodian’s fees and expenses | | | 600,000 | |
Shareholders’ reports | | | 180,000 | |
Insurance expenses | | | 102,000 | |
Trustees’ fees | | | 58,000 | |
Interest expense | | | 32,816 | |
Audit fee | | | 24,000 | |
Legal fees and expenses | | | 18,000 | |
Commitment fee on syndicated credit agreement | | | 12,000 | |
Transfer agent’s fee and expenses (including affiliated expense of $3,000) (Note 4) | | | 3,000 | |
Miscellaneous | | | 30,852 | |
| | |
|
|
|
Total expenses | | | 23,676,774 | |
| | |
|
|
|
| NET INVESTMENT INCOME | | | 95,193,683 | |
| | |
|
|
|
| NET REALIZED AND UNREALIZED GAIN (LOSS) ON INVESTMENTS, SWAPS AND FOREIGN CURRENCIES | | | | |
Net realized gain (loss) on: | | | | |
Investment transactions | | | 236,563,126 | |
Futures transactions | | | 15,655,198 | |
Swap agreement transactions | | | 7,447,348 | |
Short sale transactions | | | (1,182,871 | ) |
Written options transactions | | | (80,697 | ) |
Foreign currency transactions | | | (21,990 | ) |
| | |
|
|
|
| | | | 258,380,114 | |
| | |
|
|
|
Net change in unrealized appreciation (depreciation) on: | | | | |
Investments | | | (125,723,550 | ) |
Futures | | | 668,156 | |
Swaps | | | 2,396,211 | |
Foreign currencies | | | 16,009 | |
| | |
|
|
|
| | | | (122,643,174 | ) |
| | |
|
|
|
| NET GAIN ON INVESTMENTS, SWAPS AND FOREIGN CURRENCIES | | | 135,736,940 | |
| | |
|
|
|
| NET INCREASE IN NET ASSETS RESULTING FROM OPERATIONS | | $ | 230,930,623 | |
| | |
|
|
|
STATEMENT OF CHANGES IN NET ASSETS
| | | | | | | | |
| | | Year Ended December 31,
| |
| | | 2007
| | | 2006
| |
| INCREASE (DECREASE) IN NET ASSETS | | | | | | | | |
| OPERATIONS: | | | | | | | | |
Net investment income | | $ | 95,193,683 | | | $ | 88,775,653 | |
Net realized gain on investment, swap and foreign currency transactions | | | 258,380,114 | | | | 142,489,644 | |
Net change in unrealized appreciation (depreciation) on investments, swaps and foreign currencies | | | (122,643,174 | ) | | | 186,244,474 | |
| | |
|
|
| |
|
|
|
NET INCREASE IN NET ASSETS RESULTING FROM OPERATIONS | | | 230,930,623 | | | | 417,509,771 | |
| | |
|
|
| |
|
|
|
| DISTRIBUTIONS | | | (231,155,961 | ) | | | (122,314,562 | ) |
| | |
|
|
| |
|
|
|
| SERIES SHARE TRANSACTIONS: | | | | | | | | |
Series shares sold [986,911 and 1,352,364 shares, respectively] | | | 18,632,642 | | | | 23,240,485 | |
Series shares issued in reinvestment of distributions [12,679,976 and 7,199,209 shares, respectively] | | | 231,155,961 | | | | 122,314,562 | |
Series shares repurchased [13,414,705 and 15,165,926 shares, respectively] | | | (256,790,391 | ) | | | (261,128,310 | ) |
| | |
|
|
| |
|
|
|
NET DECREASE IN NET ASSETS RESULTING FROM SERIES SHARE TRANSACTIONS | | | (7,001,788 | ) | | | (115,573,263 | ) |
| | |
|
|
| |
|
|
|
| TOTAL INCREASE (DECREASE) IN NET ASSETS | | | (7,227,126 | ) | | | 179,621,946 | |
| NET ASSETS: | | | | | | | | |
Beginning of year | | | 3,723,550,990 | | | | 3,543,929,044 | |
| | |
|
|
| |
|
|
|
End of year | | $ | 3,716,323,864 | | | $ | 3,723,550,990 | |
| | |
|
|
| |
|
|
|
SEE NOTES TO FINANCIAL STATEMENTS.
A95
SCHEDULE OF INVESTMENTS | December 31, 2007 |
| | | | | |
LONG-TERM INVESTMENTS — 96.3% COMMON STOCKS | | Shares
| | Value
(Note 2)
|
| | | | | | |
Australia — 3.4% | | | | | |
AWB Ltd. | | 271,500 | | $ | 694,230 |
BHP Billiton Ltd. | | 88,300 | | | 3,086,794 |
BlueScope Steel Ltd. | | 218,400 | | | 1,833,311 |
Commonwealth Bank of Australia | | 25,700 | | | 1,325,061 |
CSR Ltd. | | 173,200 | | | 468,999 |
Macquarie Bank Ltd. | | 45,200 | | | 3,024,208 |
OneSteel Ltd. | | 100,400 | | | 538,469 |
Pacific Brands Ltd. | | 460,600 | | | 1,308,071 |
QBE Insurance Group Ltd. | | 110,000 | | | 3,193,605 |
Quantas Airways Ltd. | | 582,700 | | | 2,768,605 |
Santos Ltd. | | 82,000 | | | 1,007,635 |
Telstra Corp. Ltd. | | 341,300 | | | 1,398,688 |
Toll Holdings Ltd. | | 185,900 | | | 1,856,047 |
Woolworths Ltd. | | 205,300 | | | 6,088,380 |
WorleyParsons Ltd. | | 86,100 | | | 3,878,752 |
Zinifex Ltd. | | 84,000 | | | 901,045 |
| | | | |
|
|
| | | | | | 33,371,900 |
| | | | |
|
|
Austria — 0.2% | | | | | |
Raiffeisen International Bank Holding AG | | 11,858 | | | 1,796,115 |
Voestalpine AG | | 9,500 | | | 686,836 |
| | | | |
|
|
| | | | | | 2,482,951 |
| | | | |
|
|
Belgium — 0.7% | | | | | |
AGFA-Gevaert NV | | 62,200 | | | 953,957 |
Fortis | | 74,100 | | | 1,951,169 |
InBev NV | | 44,000 | | | 3,666,827 |
| | | | |
|
|
| | | | | | 6,571,953 |
| | | | |
|
|
Bermuda — 0.6% | | | | | |
Covidien Ltd. | | 52,300 | | | 2,316,367 |
Tyco Electronics Ltd. | | 50,200 | | | 1,863,926 |
Tyco International Ltd. | | 55,000 | | | 2,180,750 |
| | | | |
|
|
| | | | | | 6,361,043 |
| | | | |
|
|
Brazil — 1.8% | | | | | |
Bolsa de Mercadorias e Futuros — BM&F | | 19,600 | | | 275,281 |
Bovespa Holding SA | | 86,900 | | | 1,674,534 |
Cia Vale do Rio Doce, ADR(b) | | 153,600 | | | 5,018,112 |
Net Servicos de Comunicacao SA(a) | | 99,500 | | | 1,213,006 |
Petroleo Brasileiro SA, ADR (Common Shares) | | 65,553 | | | 7,554,327 |
Petroleo Brasilerio SA, ADR (Preference Shares)(b) | | 16,300 | | | 1,568,386 |
| | | | |
|
|
| | | | | | 17,303,646 |
| | | | |
|
|
Canada — 1.5% | | | | | |
AbitibiBowater, Inc.(b) | | 24,200 | | | 498,762 |
Agnico-Eagle Mines Ltd. | | 51,189 | | | 2,796,455 |
Brookfield Asset Management, Inc. (Class A Stock) | | 76,100 | | | 2,733,416 |
Research In Motion Ltd.(a) | | 18,500 | | | 2,097,900 |
Rogers Communications, Inc. | | 83,000 | | | 3,783,546 |
Shoppers Drug Mart Corp. | | 46,600 | | | 2,514,733 |
| | | | |
|
|
| | | | | | 14,424,812 |
| | | | |
|
|
Chile — 0.1% | | | | | |
Cencosud SA, ADR, 144A | | 21,600 | | | 1,303,938 |
| | | | |
|
|
China — 1.3% | | | | | |
China Communications Construction Co. Ltd. (Class H Stock) | | 1,023,600 | | | 2,646,291 |
China Merchants Bank Co. Ltd. (Class H Stock) | | 264,500 | | | 1,064,151 |
China Oilfield Services Ltd. (Class H Stock) | | 528,000 | | | 1,179,182 |
SEE NOTES TO FINANCIAL STATEMENTS.
A96
| | | | |
| | | GLOBAL PORTFOLIO (Continued) | | |
SCHEDULE OF INVESTMENTS | December 31, 2007 |
| | | | | |
COMMON STOCKS
(continued) | | Shares
| | Value
(Note 2)
|
| | | | | | |
China (continued) | | | | | |
Country Garden Holdings Co. Ltd.(a) | | 545,000 | | $ | 621,046 |
Industrial & Commercial Bank of China | | 9,354,000 | | | 6,640,394 |
Shandong Weigao Group Medical Polymer Co. Ltd. (Class H Stock) | | 412,000 | | | 943,565 |
| | | | |
|
|
| | | | | | 13,094,629 |
| | | | |
|
|
Denmark — 0.4% | | | | | |
Danske Bank A/S | | 36,600 | | | 1,433,486 |
H Lundbeck A/S | | 78,800 | | | 2,132,214 |
| | | | |
|
|
| | | | | | 3,565,700 |
| | | | |
|
|
Egypt — 0.3% | | | | | |
Egyptian Financial Group — Hermes Holding Co. | | 228,300 | | | 2,730,288 |
| | | | |
|
|
Finland — 0.6% | | | | | |
Nokia Oyj | | 83,400 | | | 3,233,722 |
Rautaruukki Oyj | | 31,500 | | | 1,365,520 |
Tietoenator Oyj | | 56,200 | | | 1,262,090 |
| | | | |
|
|
| | | | | | 5,861,332 |
| | | | |
|
|
France — 6.0% | | | | | |
Arkema(a) | | 530 | | | 34,823 |
AXA SA | | 63,500 | | | 2,542,897 |
BNP Paribas | | 41,600 | | | 4,514,163 |
Cie Generale D’Optique Essilor International SA | | 39,800 | | | 2,539,980 |
Ciments Francais SA | | 5,200 | | | 894,911 |
Compagnie Generale des Etablissements Michelin (Class B Stock) | | 20,200 | | | 2,318,377 |
Credit Agricole SA | | 41,000 | | | 1,382,912 |
Eurazeo | | 14,152 | | | 1,815,632 |
Iliad SA | | 14,500 | | | 1,560,302 |
L’Oreal SA | | 39,200 | | | 5,615,474 |
Natixis | | 57,000 | | | 1,095,048 |
Peugeot SA | | 33,400 | | | 2,531,968 |
Rallye SA | | 13,400 | | | 950,188 |
Renault SA | | 11,800 | | | 1,673,638 |
Sanofi-Aventis SA | | 51,500 | | | 4,742,123 |
Schneider Electric SA | | 42,700 | | | 5,785,979 |
Societe Generale | | 5,300 | | | 766,596 |
Thales SA | | 13,700 | | | 816,227 |
Thomson | | 80,000 | | | 1,138,062 |
Total SA | | 29,100 | | | 2,417,874 |
Total SA, ADR | | 75,400 | | | 6,228,039 |
Valeo SA | | 30,700 | | | 1,265,757 |
Veolia Environnement | | 56,275 | | | 5,138,199 |
Vivendi | | 38,000 | | | 1,743,410 |
| | | | |
|
|
| | | | | | 59,512,579 |
| | | | |
|
|
Germany — 3.6% | | | | | |
BASF AG | | 39,300 | | | 5,818,264 |
Beiersdorf AG | | 34,600 | | | 2,674,535 |
Daimler AG | | 31,900 | | | 3,087,999 |
Deutsche Bank AG | | 30,000 | | | 3,924,734 |
Deutsche Boerse AG | | 25,600 | | | 5,052,853 |
Hannover Rueckversicherung AG | | 25,500 | | | 1,182,223 |
Heidelberger Druckmaschinen AG | | 61,200 | | | 2,063,354 |
Muenchener Rueckversicherungs AG | | 13,900 | | | 2,699,848 |
Q-Cells AG(a) | | 20,700 | | | 2,961,380 |
ThyssenKrupp AG | | 60,200 | | | 3,376,277 |
TUI AG(a) | | 26,800 | | | 751,138 |
Volkswagen AG | | 6,600 | | | 1,509,478 |
| | | | |
|
|
| | | | | | 35,102,083 |
| | | | |
|
|
SEE NOTES TO FINANCIAL STATEMENTS.
A97
| | | | |
| | | GLOBAL PORTFOLIO (Continued) | | |
SCHEDULE OF INVESTMENTS | December 31, 2007 |
| | | | | |
COMMON STOCKS
(continued) | | Shares
| | Value
(Note 2)
|
| | | | | | |
Greece — 0.3% | | | | | |
National Bank of Greece SA, ADR(b) | | 202,800 | | $ | 2,796,612 |
| | | | |
|
|
Hong Kong — 2.0% | | | | | |
Chaoda Modern Agriculture | | 1,218,645 | | | 1,090,243 |
China Mobile Ltd. | | 407,500 | | | 7,096,411 |
China Mobile Ltd., ADR(b) | | 7,200 | | | 625,464 |
Citic Pacific Ltd. | | 523,500 | | | 2,894,239 |
Esprit Holdings Ltd. | | 212,000 | | | 3,121,756 |
HongKong Electric Holdings | | 312,500 | | | 1,788,383 |
Li & Fung Ltd. | | 749,600 | | | 2,988,447 |
| | | | |
|
|
| | | | | | 19,604,943 |
| | | | |
|
|
India — 0.3% | | | | | |
HDFC Bank Ltd., ADR | | 22,000 | | | 2,869,900 |
| | | | |
|
|
Indonesia — 0.1% | | | | | |
Bank Rakyat Indonesia | | 1,818,500 | | | 1,413,639 |
| | | | |
|
|
Ireland — 0.3% | | | | | |
Allied Irish Banks PLC | | 77,300 | | | 1,771,084 |
Irish Life & Permanent PLC | | 86,900 | | | 1,513,194 |
| | | | |
|
|
| | | | | | 3,284,278 |
| | | | |
|
|
Italy — 1.7% | | | | | |
ENI SpA | | 121,400 | | | 4,446,204 |
Finmeccanica SpA | | 35,500 | | | 1,140,306 |
Fondiaria-Sai SpA | | 26,800 | | | 1,104,961 |
Geox SpA | | 57,400 | | | 1,153,925 |
Indesit Co. SpA | | 51,100 | | | 793,430 |
Intesa Sanpaolo SpA | | 237,900 | | | 1,881,719 |
Saipem SpA | | 137,200 | | | 5,502,281 |
Unione di Banche Italiane Scpa | | 33,200 | | | 913,040 |
| | | | |
|
|
| | | | | | 16,935,866 |
| | | | |
|
|
Japan — 8.8% | | | | | |
Aeon Mall Co. Ltd. | | 52,000 | | | 1,364,657 |
Alpine Electronics, Inc. | | 41,600 | | | 697,027 |
Alps Electric Co. Ltd. | | 49,700 | | | 642,080 |
Asahi Kasei Corp. | | 226,100 | | | 1,492,141 |
Circle K Sunkus Co. Ltd. | | 89,500 | | | 1,322,898 |
Cosmo Oil Co. Ltd. | | 303,300 | | | 1,121,115 |
Daiwa Securities Group, Inc. | | 75,400 | | | 676,915 |
Denki Kagaku Kogyo K K | | 224,900 | | | 972,113 |
Fanuc Ltd. | | 35,300 | | | 3,422,269 |
Fuji Heavy Industries Ltd. | | 347,000 | | | 1,607,284 |
Fukuoka Financial Group, Inc. | | 433,000 | | | 2,528,730 |
Hokkaido Electric Power Co., Inc. | | 18,400 | | | 396,631 |
Honda Motor Co. Ltd. | | 95,400 | | | 3,151,524 |
Jupiter Telecommunications Co.(a) | | 2,190 | | | 1,842,499 |
KK DaVinci Advisors(a) | | 941 | | | 815,237 |
Komatsu Ltd. | | 112,700 | | | 3,022,521 |
Kurabo Industries Ltd. | | 173,100 | | | 388,314 |
Kyushu Electric Power Co., Inc. | | 8,700 | | | 213,575 |
Marubeni Corp. | | 248,700 | | | 1,742,643 |
Matsushita Electric Industrial Co., Ltd. | | 74,000 | | | 1,516,325 |
Mitsubishi Chemical Holdings Corp. | | 162,000 | | | 1,236,008 |
Mitsubishi Tanabe Pharma Corp. | | 85,600 | | | 795,159 |
Mitsui & Co. Ltd. | | 176,000 | | | 3,675,345 |
Mitsui Chemicals, Inc. | | 148,000 | | | 960,793 |
NGK Insulators Ltd. | | 125,000 | | | 3,351,414 |
Nifco, Inc. | | 33,400 | | | 775,079 |
Nintendo Co. Ltd. | | 11,900 | | | 6,987,108 |
SEE NOTES TO FINANCIAL STATEMENTS.
A98
| | | | |
| | | GLOBAL PORTFOLIO (Continued) | | |
SCHEDULE OF INVESTMENTS | December 31, 2007 |
| | | | | |
COMMON STOCKS
(continued) | | Shares
| | Value
(Note 2)
|
| | | | | | |
Japan (continued) | | | | | |
Nippon Electric Glass Co. Ltd. | | 84,000 | | $ | 1,366,432 |
Nippon Oil Corp. | | 185,600 | | | 1,500,460 |
Nippon Paper Group, Inc. | | 400 | | | 1,204,917 |
Nippon Shokubai Co. Ltd. | | 85,000 | | | 814,467 |
Nippon Telegraph and Telephone Corp. | | 600 | | | 2,982,559 |
Nipro Corp. | | 57,000 | | | 1,140,699 |
Nissan Motor Co. Ltd. | | 317,000 | | | 3,459,895 |
Nomura Holdings, Inc. | | 75,600 | | | 1,266,667 |
NTT DoCoMo, Inc. | | 1,600 | | | 2,634,096 |
OJI Paper Co. Ltd. | | 37,000 | | | 181,781 |
Okasan Holdings, Inc. | | 63,100 | | | 355,386 |
Promise Co. Ltd. | | 5,100 | | | 125,572 |
Ricoh Co. Ltd. | | 95,600 | | | 1,745,306 |
Santen Pharmaceutical Co. Ltd. | | 26,700 | | | 658,423 |
Sanwa Holdings Corp. | | 281,000 | | | 1,379,553 |
Seiko Epson Corp. | | 5,600 | | | 119,274 |
Shin-Etsu Chemical Co. Ltd. | | 34,600 | | | 2,151,816 |
Sumitomo Corp. | | 115,400 | | | 1,614,605 |
Sumitomo Realty & Development Co. Ltd. | | 90,000 | | | 2,201,047 |
Sumitomo Trust & Banking Co. Ltd. (The) | | 194,000 | | | 1,278,605 |
Suruga Bank Ltd. | | 187,000 | | | 2,034,323 |
Takefuji Corp. | | 19,000 | | | 456,354 |
Toppan Printing Co. Ltd. | | 85,000 | | | 833,583 |
Toyota Motor Corp. | | 42,900 | | | 2,284,799 |
Toyota Motor Corp., ADR | | 45,817 | | | 4,864,390 |
Yokohama Rubber Co. Ltd. (The) | | 174,300 | | | 1,030,125 |
| | | | |
|
|
| | | | | | 86,402,538 |
| | | | |
|
|
Mexico — 0.8% | | | | | |
America Movil — Ser. L, ADR | | 128,309 | | | 7,876,890 |
| | | | |
|
|
Netherlands — 1.6% | | | | | |
Aegon NV | | 56,800 | | | 1,004,009 |
CSM | | 40,200 | | | 1,357,691 |
Heineken NV, ADR | | 132,745 | | | 4,291,115 |
ING Groep NV | | 87,500 | | | 3,422,116 |
OCE NV | | 85,700 | | | 1,551,188 |
Royal Dutch Shell PLC, ADR | | 29,600 | | | 2,492,320 |
Royal KPN NV | | 114,200 | | | 2,077,062 |
| | | | |
|
|
| | | | | | 16,195,501 |
| | | | |
|
|
New Zealand — 0.2% | | | | | |
Air New Zealand Ltd. | | 737,900 | | | 1,063,574 |
Fisher & Paykel Appliances Holdings Ltd. | | 319,700 | | | 842,116 |
| | | | |
|
|
| | | | | | 1,905,690 |
| | | | |
|
|
Norway — 0.2% | | | | | |
Norsk Hydro ASA | | 54,500 | | | 778,880 |
StatoilHydro ASA | | 46,989 | | | 1,462,497 |
| | | | |
|
|
| | | | | | 2,241,377 |
| | | | |
|
|
Russia — 0.2% | | | | | |
PIK Group, GDR, 144A(a) | | 65,400 | | | 1,912,950 |
| | | | |
|
|
Singapore — 1.0% | | | | | |
CapitaLand Ltd. | | 759,000 | | | 3,265,525 |
MobileOne Ltd. | | 390,330 | | | 513,206 |
Neptune Orient Lines Ltd. | | 313,800 | | | 843,550 |
Singapore Airlines Ltd. | | 178,266 | | | 2,141,547 |
Wilmar International Ltd. | | 810,100 | | | 3,010,268 |
| | | | |
|
|
| | | | | | 9,774,096 |
| | | | |
|
|
SEE NOTES TO FINANCIAL STATEMENTS.
A99
| | | | |
| | | GLOBAL PORTFOLIO (Continued) | | |
SCHEDULE OF INVESTMENTS | December 31, 2007 |
| | | | | |
COMMON STOCKS
(continued) | | Shares
| | Value
(Note 2)
|
| | | | | | |
South Africa — 0.4% | | | | | |
MTN Group Ltd. | | 149,000 | | $ | 2,791,917 |
Naspers Ltd. | | 45,600 | | | 1,080,893 |
| | | | |
|
|
| | | | | | 3,872,810 |
| | | | |
|
|
South Korea — 0.2% | | | | | |
Samsung Electronics Co. Ltd., GDR | | 5,050 | | | 1,478,388 |
| | | | |
|
|
Spain — 1.7% | | | | | |
Banco Bilbao Vizcaya Argentaria SA | | 137,000 | | | 3,357,048 |
Banco Santander SA | | 241,900 | | | 5,230,786 |
Inditex SA | | 57,100 | | | 3,507,964 |
Repsol YPF SA | | 93,200 | | | 3,322,099 |
Telefonica SA | | 55,700 | | | 1,809,515 |
| | | | |
|
|
| | | | | | 17,227,412 |
| | | | |
|
|
Sweden — 0.6% | | | | | |
Electrolux AB, Ser. B | | 83,600 | | | 1,403,422 |
Nordea Bank AB | | 244,700 | | | 4,088,935 |
Volvo AB (Class B Stock) | | 44,800 | | | 752,073 |
| | | | |
|
|
| | | | | | 6,244,430 |
| | | | |
|
|
Switzerland — 4.6% | | | | | |
ABB Ltd. | | 286,300 | | | 8,249,000 |
Actelion Ltd.(a) | | 27,200 | | | 1,250,506 |
Baloise Holding AG | | 13,600 | | | 1,339,398 |
Ciba Specialty Chemicals AG | | 11,600 | | | 537,915 |
Credit Suisse Group | | 68,700 | | | 4,132,376 |
EFG International | | 32,600 | | | 1,310,162 |
Geberit AG | | 7,200 | | | 988,915 |
Georg Fischer AG(a) | | 2,500 | | | 1,539,107 |
Julius Baer Holding AG | | 28,700 | | | 2,372,760 |
Kuehne & Nagel International AG | | 22,700 | | | 2,175,463 |
Nestle SA | | 11,100 | | | 5,098,264 |
Rieter Holding AG | | 2,200 | | | 971,603 |
Roche Holdings AG | | 14,750 | | | 2,548,337 |
SGS SA | | 1,470 | | | 1,751,561 |
Sonova Holding AG | | 10,480 | | | 1,183,935 |
Swiss Reinsurance | | 35,300 | | | 2,508,400 |
Swisscom AG | | 6,200 | | | 2,420,527 |
UBS AG | | 19,400 | | | 897,902 |
Verwalt & Privat-Bank AG | | 2,578 | | | 638,153 |
Zurich Financial Services AG | | 10,400 | | | 3,054,366 |
| | | | |
|
|
| | | | | | 44,968,650 |
| | | | |
|
|
Taiwan — 0.4% | | | | | |
HON HAI Precision Industry Co. Ltd., GDR | | 197,678 | | | 2,451,207 |
MediaTek, Inc. | | 114,000 | | | 1,461,235 |
| | | | |
|
|
| | | | | | 3,912,442 |
| | | | |
|
|
United Arab Emirates — 0.1% | | | | | |
DP World Ltd.(a) | | 494,700 | | | 588,693 |
| | | | |
|
|
United Kingdom — 10.5% | | | | | |
Alliance & Leicester PLC(a) | | 76,000 | | | 980,333 |
AstraZeneca PLC | | 90,900 | | | 3,915,670 |
Aviva PLC(a) | | 60,000 | | | 803,806 |
Barclays PLC | | 299,200 | | | 3,001,768 |
Beazley Group PLC | | 411,400 | | | 1,332,816 |
BG Group PLC | | 267,100 | | | 6,114,440 |
BP PLC | | 452,600 | | | 5,540,827 |
Bradford & Bingley PLC(a) | | 178,100 | | | 950,131 |
Brit Insurance Holdings PLC | | 227,200 | | | 1,035,688 |
SEE NOTES TO FINANCIAL STATEMENTS.
A100
| | | | |
| | | GLOBAL PORTFOLIO (Continued) | | |
SCHEDULE OF INVESTMENTS | December 31, 2007 |
| | | | | |
COMMON STOCKS
(continued) | | Shares
| | Value
(Note 2)
|
| | | | | | |
United Kingdom (continued) | | | | | |
British Sky Broadcasting PLC | | 273,200 | | $ | 3,366,327 |
BT Group PLC | | 756,400 | | | 4,106,778 |
Capita Group PLC | | 186,083 | | | 2,585,515 |
Carphone Warehouse Group PLC | | 158,100 | | | 1,084,192 |
Davis Service Group PLC | | 69,100 | | | 707,011 |
Drax Group PLC | | 43,281 | | | 521,240 |
DS Smith PLC | | 308,000 | | | 1,282,925 |
DSG International PLC | | 566,000 | | | 1,118,232 |
GKN PLC | | 302,000 | | | 1,695,278 |
GlaxoSmithKline PLC | | 55,000 | | | 1,400,291 |
HBOS PLC | | 210,900 | | | 3,085,666 |
Legal & General Group PLC | | 498,500 | | | 1,295,965 |
Lloyds TSB Group PLC | | 346,200 | | | 3,252,775 |
Man Group PLC | | 209,875 | | | 2,377,157 |
Northern Foods PLC | | 211,500 | | | 395,752 |
Old Mutual PLC | | 319,100 | | | 1,064,598 |
Reckitt Benckiser Group PLC | | 110,000 | | | 6,380,683 |
Rolls-Royce Group PLC(a) | | 488,787 | | | 5,312,479 |
Rolls-Royce Group PLC (Class B Stock)(a) | | 21,237,754 | | | 42,276 |
Rotork PLC | | 48,800 | | | 939,358 |
Royal & Sun Alliance Insurance Group PLC | | 300,200 | | | 885,613 |
Royal Bank of Scotland Group PLC (The)(a) | | 257,100 | | | 2,272,323 |
Royal Dutch Shell PLC (Class B Stock) | | 211,400 | | | 8,795,007 |
Standard Chartered PLC | | 53,700 | | | 1,971,152 |
Tate & Lyle PLC | | 71,300 | | | 631,589 |
Taylor Wimpey PLC | | 148,300 | | | 600,007 |
Tesco PLC(a) | | 698,100 | | | 6,632,060 |
Tomkins PLC | | 113,100 | | | 397,930 |
Tullow Oil PLC | | 165,500 | | | 2,146,334 |
Vedanta Resources PLC | | 77,600 | | | 3,160,475 |
Vodafone Group PLC | | 1,716,200 | | | 6,415,765 |
Xstrata PLC | | 55,600 | | | 3,929,055 |
| | | | |
|
|
| | | | | | 103,527,287 |
| | | | |
|
|
United States — 39.8% | | | | | |
3M Co. | | 24,600 | | | 2,074,272 |
Air Products & Chemicals, Inc. | | 25,309 | | | 2,496,227 |
Altria Group, Inc. | | 20,400 | | | 1,541,832 |
American Express Co. | | 32,000 | | | 1,664,640 |
American International Group, Inc. | | 60,400 | | | 3,521,320 |
Ameriprise Financial, Inc. | | 33,500 | | | 1,846,185 |
Amgen, Inc.(a) | | 28,800 | | | 1,337,472 |
Amylin Pharmaceuticals, Inc.(a)(b) | | 69,351 | | | 2,565,987 |
Anheuser-Busch Cos., Inc. | | 78,300 | | | 4,098,222 |
Apple, Inc.(a) | | 50,725 | | | 10,047,608 |
AT&T, Inc. | | 261,037 | | | 10,848,698 |
Avon Products, Inc. | | 56,100 | | | 2,217,633 |
Baker Hughes, Inc. | | 61,600 | | | 4,995,760 |
Bank of America Corp. | | 101,300 | | | 4,179,638 |
Bank of New York Mellon Corp. (The) | | 64,300 | | | 3,135,268 |
Boeing Co. | | 21,418 | | | 1,873,218 |
Boston Scientific Corp.(a)(b) | | 68,600 | | | 797,818 |
Cablevision Systems Corp. (Class A Stock)(a) | | 49,300 | | | 1,207,850 |
Cameron International Corp.(a) | | 36,788 | | | 1,770,606 |
CBS Corp. (Class B Stock)(b) | | 30,700 | | | 836,575 |
Chevron Corp. | | 64,900 | | | 6,057,117 |
Citigroup, Inc. | | 77,400 | | | 2,278,656 |
Coca-Cola Co. (The) | | 61,836 | | | 3,794,875 |
Comcast Corp. (Class A Stock)(a)(b) | | 48,300 | | | 881,958 |
SEE NOTES TO FINANCIAL STATEMENTS.
A101
| | | | |
| | | GLOBAL PORTFOLIO (Continued) | | |
SCHEDULE OF INVESTMENTS | December 31, 2007 |
| | | | | |
COMMON STOCKS
(continued) | | Shares
| | Value
(Note 2)
|
| | | | | | |
United States (continued) | | | | | |
CVS Caremark Corp. | | 56,675 | | $ | 2,252,831 |
Dell, Inc.(a) | | 72,000 | | | 1,764,720 |
Duke Energy Corp. | | 70,200 | | | 1,415,934 |
E.I. du Pont de Nemours & Co. | | 53,200 | | | 2,345,588 |
Entergy Corp. | | 25,200 | | | 3,011,904 |
Exxon Mobil Corp. | | 68,000 | | | 6,370,920 |
Fannie Mae | | 39,600 | | | 1,583,208 |
FedEx Corp. | | 6,236 | | | 556,064 |
Fifth Third Bancorp | | 61,400 | | | 1,542,982 |
Genentech, Inc.(a) | | 107,686 | | | 7,222,500 |
General Dynamics Corp. | | 85,774 | | | 7,633,028 |
General Electric Co. | | 181,700 | | | 6,735,619 |
General Mills, Inc. | | 30,600 | | | 1,744,200 |
General Motors Corp.(b) | | 40,700 | | | 1,013,023 |
Genworth Financial, Inc. | | 114,900 | | | 2,924,205 |
Goldman Sachs Group, Inc. (The)(b) | | 49,085 | | | 10,555,729 |
Google, Inc. (Class A Stock)(a) | | 10,116 | | | 6,995,012 |
H&R Block, Inc. | | 105,400 | | | 1,957,278 |
Hartford Financial Services Group, Inc. | | 10,500 | | | 915,495 |
Hess Corp. | | 24,526 | | | 2,473,692 |
Hewlett-Packard Co. | | 69,827 | | | 3,524,867 |
Home Depot, Inc. (The) | | 131,500 | | | 3,542,610 |
Illinois Tool Works, Inc. | | 54,200 | | | 2,901,868 |
Intel Corp. | | 313,104 | | | 8,347,353 |
International Business Machines Corp. | | 27,800 | | | 3,005,180 |
International Paper Co. | | 89,900 | | | 2,910,962 |
Johnson & Johnson | | 50,600 | | | 3,375,020 |
JPMorgan Chase & Co. | | 123,500 | | | 5,390,775 |
Kraft Foods, Inc. (Class A Stock) | | 36,500 | | | 1,190,995 |
Las Vegas Sands Corp.(a)(b) | | 66,250 | | | 6,827,063 |
Lehman Brothers Holdings, Inc.(b) | | 90,147 | | | 5,899,220 |
Liberty Media Holdings Corp. — Capital (Class A Stock)(a) | | 17,100 | | | 1,991,979 |
Liberty Media Holdings Corp. — Interactive (Class A Stock)(a) | | 80,100 | | | 1,528,308 |
Lincoln National Corp. | | 25,000 | | | 1,455,500 |
Lockheed Martin Corp. | | 80,170 | | | 8,438,694 |
Lowe’s Cos., Inc. | | 177,308 | | | 4,010,707 |
Marsh & McLennan Cos., Inc. | | 135,500 | | | 3,586,685 |
Mastercard, Inc. (Class A Stock)(b) | | 40,278 | | | 8,667,826 |
McDonald’s Corp. | | 212,737 | | | 12,532,336 |
Merck & Co., Inc. | | 242,386 | | | 14,085,049 |
Merrill Lynch & Co., Inc.(b) | | 68,266 | | | 3,664,519 |
MGM Mirage(a) | | 38,574 | | | 3,240,987 |
Microsoft Corp. | | 295,376 | | | 10,515,386 |
Monsanto Co. | | 89,813 | | | 10,031,214 |
Morgan Stanley | | 36,500 | | | 1,938,515 |
Murphy Oil Corp. | | 44,000 | | | 3,732,960 |
New York Times Co. (The) (Class A Stock)(b) | | 62,200 | | | 1,090,366 |
Newell Rubbermaid, Inc. | | 92,700 | | | 2,399,076 |
NiSource, Inc. | | 76,300 | | | 1,441,307 |
Nucor Corp. | | 10,500 | | | 621,810 |
Pfizer, Inc. | | 141,300 | | | 3,211,749 |
Praxair, Inc. | | 91,780 | | | 8,141,804 |
Procter & Gamble Co. | | 13,500 | | | 991,170 |
QUALCOMM, Inc. | | 44,566 | | | 1,753,672 |
Qwest Communications International, Inc.(a)(b) | | 149,100 | | | 1,045,191 |
Raytheon Co. | | 41,000 | | | 2,488,700 |
Schering-Plough Corp.(b) | | 156,497 | | | 4,169,080 |
Schlumberger Ltd. | | 85,370 | | | 8,397,847 |
Southwest Airlines Co. | | 184,900 | | | 2,255,780 |
SEE NOTES TO FINANCIAL STATEMENTS.
A102
| | | | |
| | | GLOBAL PORTFOLIO (Continued) | | |
SCHEDULE OF INVESTMENTS | December 31, 2007 |
| | | | | | |
COMMON STOCKS
(continued) | | Shares
| | Value
(Note 2)
| |
| | | | | | | |
United States (continued) | | | | | | |
Spectra Energy Corp. | | 67,000 | | $ | 1,729,940 | |
Sprint Nextel Corp. | | 159,800 | | | 2,098,174 | |
St. Joe Co. (The)(b) | | 21,400 | | | 759,914 | |
State Street Corp. | | 36,700 | | | 2,980,040 | |
Time Warner, Inc. | | 241,100 | | | 3,980,561 | |
Transocean, Inc.(a)(b) | | 61,385 | | | 8,787,263 | |
U.S. Bancorp | | 98,800 | | | 3,135,912 | |
Union Pacific Corp. | | 75,222 | | | 9,449,388 | |
UnitedHealth Group, Inc. | | 210,016 | | | 12,222,931 | |
Verizon Communications, Inc. | | 44,100 | | | 1,926,729 | |
Viacom, Inc. (Class B Stock)(a) | | 23,000 | | | 1,010,160 | |
Wal-Mart Stores, Inc. | | 57,400 | | | 2,728,222 | |
Walt Disney Co. (The) | | 52,700 | | | 1,701,156 | |
Waste Management, Inc. | | 77,200 | | | 2,522,124 | |
Wyeth | | 52,500 | | | 2,319,975 | |
Wynn Resorts Ltd.(a) | | 71,544 | | | 8,022,229 | |
Yum! Brands, Inc. | | 132,140 | | | 5,056,998 | |
| | | | |
|
|
|
| | | | | | 391,859,213 | |
| | | | |
|
|
|
TOTAL LONG-TERM INVESTMENTS
(cost $780,759,091) | | | 948,580,459 | |
| | | | |
|
|
|
| SHORT-TERM INVESTMENTS — 6.9% | |
Affiliated Money Market Mutual Fund | | | | |
Dryden Core Investment Fund — Taxable Money Market Series (cost $68,236,783; includes $42,679,550 of cash collateral received for securities on loan)(Note 4)(c)(d) | | 68,236,783 | | | 68,236,783 | |
| | | | |
|
|
|
| | |
| | | Principal
Amount
(000)
| | | |
| U.S. Government Treasury Obligations | | | | | | |
United States | | | | | | |
United States Treasury Bill
2.80%, 03/13/08(e)
(cost $298,343) | | $300 | | | 298,181 | |
| | | | |
|
|
|
TOTAL SHORT-TERM INVESTMENTS
(cost $68,535,126) | | | 68,534,964 | |
| | | | |
|
|
|
TOTAL INVESTMENTS(f) — 103.2%
(cost $849,294,217) | | | 1,017,115,423 | |
LIABILITIES IN EXCESS OF OTHER ASSETS — (3.2%) | | | (32,106,030 | ) |
| | | | |
|
|
|
NET ASSETS — 100.0% | | $ | 985,009,393 | |
| | | | |
|
|
|
The following abbreviations are used in portfolio descriptions:
| | |
| ADR | | American Depositary Receipt |
| GDR | | Global Depositary Receipt |
| 144A | | Security was purchased pursuant to rule 144A under the Securities Act of 1933 and may not be resold subject to that rule except to qualified institutional buyers. Unless otherwise noted, 144A securities are deemed to be liquid. |
| (a) | Non-income producing security. |
| (b) | All or a portion of security is on loan. The aggregate market value of such securities is $41,229,381; cash collateral of $42,679,550 (included in liabilities) was received with which the Portfolio purchased highly liquid short-term investments. |
| (c) | Represents security, or a portion thereof, purchased with cash collateral for securities on loan. |
| (d) | Prudential Investments LLC, the manager of the Portfolio, also serves as manager of the Dryden Core Investment Fund — Taxable Money Market Series. |
| (e) | Rate quoted represents yield-to-maturity at purchase date. |
| (f) | As of December 31, 2007, 88 securities representing $158,514,607 and 16.1% of net assets were fair valued in accordance with policies adopted by the Board of Trustees. |
SEE NOTES TO FINANCIAL STATEMENTS.
A103
| | | | |
| | | GLOBAL PORTFOLIO (Continued) | | |
SCHEDULE OF INVESTMENTS | December 31, 2007 |
The industry classification of portfolio holdings and liabilities in excess of other assets shown as a percentage of net assets as of December 31, 2007 were as follows:
| | | |
Oil, Gas & Consumable Fuels | | 8.1 | % |
Affiliated Money Market Mutual Fund (including 4.3% of collateral received for securities on loan) | | 6.9 | |
Commercial Banks | | 6.5 | |
Capital Markets | | 5.7 | |
Pharmaceuticals | | 4.7 | |
Chemicals | | 3.8 | |
Hotels, Restaurants & Leisure | | 3.7 | |
Insurance | | 3.5 | |
Diversified Financial Services | | 3.4 | |
Diversified Telecommunication | | 3.4 | |
Wireless Telecommunication Services | | 3.1 | |
Energy Equipment & Services | | 3.0 | |
Metals & Mining | | 2.9 | |
Aerospace & Defense | | 2.6 | |
Automobiles | | 2.6 | |
Food & Staples Retailing | | 2.5 | |
Media | | 2.2 | |
Computers & Peripherals | | 1.9 | |
Machinery | | 1.9 | |
Electrical Equipment | | 1.8 | |
Software | | 1.8 | |
Industrial Conglomerates | | 1.7 | |
Specialty Retail | | 1.7 | |
Beverages | | 1.6 | |
Food Products | | 1.5 | |
Health Care Providers & Services | | 1.2 | |
Real Estate Management & Development | | 1.2 | |
Household Durables | | 1.1 | |
Personal Products | | 1.1 | |
Semiconductors & Semiconductor Equipment | | 1.1 | |
Biotechnology | | 1.0 | |
IT Services | | 1.0 | |
Road & Rail | | 1.0 | |
Commercial Services & Supplies | | 0.9 | |
Health Care Equipment & Supplies | | 0.9 | |
Airlines | | 0.8 | |
Auto Components | | 0.7 | |
Communications Equipment | | 0.7 | |
Electric Utilities | | 0.7 | |
Electronic Equipment & Instruments | | 0.7 | |
Household Products | | 0.7 | |
Internet Software & Services | | 0.7 | |
Multi-Utilities | | 0.7 | |
Trading Companies & Distributors | | 0.7 | |
Paper & Forest Products | | 0.6 | |
Distributors | | 0.4 | |
Construction & Engineering | | 0.3 | |
Marine | | 0.3 | |
Office Electronics | | 0.3 | |
Thrifts & Mortgage Finance | | 0.3 | |
Air Freight & Logistics | | 0.2 | |
Building Products | | 0.2 | |
Internet & Catalog Retail | | 0.2 | |
Textiles, Apparel & Luxury Goods | | 0.2 | |
Tobacco | | 0.2 | |
Construction Materials | | 0.1 | |
Consumer Finance | | 0.1 | |
Health Care Technology | | 0.1 | |
SEE NOTES TO FINANCIAL STATEMENTS.
A104
| | | | |
| | | GLOBAL PORTFOLIO (Continued) | | |
SCHEDULE OF INVESTMENTS | December 31, 2007 |
| | | |
Independent Power Producers & Energy Traders | | 0.1 | % |
Transportation Infrastructure | | 0.1 | |
Water Utilities | | 0.1 | |
| | |
|
|
| | | 103.2 | |
Liabilities in excess of other assets | | (3.2 | ) |
| | |
|
|
| | | 100.0 | % |
| | |
|
|
SEE NOTES TO FINANCIAL STATEMENTS.
A105
| | | | |
| | | GLOBAL PORTFOLIO (Continued) | | |
STATEMENT OF ASSETS AND LIABILITIES
December 31, 2007
| | | |
| ASSETS | | | |
Investments, at value including securities on loan of $41,229,381: | | | |
Unaffiliated investments (cost $781,057,434) | | $ | 948,878,640 |
Affiliated investments (cost $68,236,783) | | | 68,236,783 |
Cash | | | 440,876 |
Foreign currency, at value (cost $8,074,610) | | | 8,200,987 |
Receivable for investments sold | | | 4,308,808 |
Dividends and interest receivable | | | 780,184 |
Foreign tax reclaim receivable | | | 587,565 |
Receivable for Series shares sold | | | 313,455 |
Prepaid expenses | | | 10,795 |
| | |
|
|
Total Assets | | | 1,031,758,093 |
| | |
|
|
| LIABILITIES | | | |
Collateral for securities on loan | | | 42,679,550 |
Payable for investments purchased | | | 3,046,829 |
Management fee payable | | | 633,098 |
Accrued expenses and other liabilities | | | 271,002 |
Payable for Series shares repurchased | | | 117,342 |
Transfer agent fee payable | | | 879 |
| | |
|
|
Total Liabilities | | | 46,748,700 |
| | |
|
|
| NET ASSETS | | $ | 985,009,393 |
| | |
|
|
Net assets were comprised of: | | | |
Paid-in capital | | $ | 758,331,291 |
Retained earnings | | | 226,678,102 |
| | |
|
|
Net assets, December 31, 2007 | | $ | 985,009,393 |
| | |
|
|
Net asset value and redemption price per share, $985,009,393 / 40,014,249 outstanding shares of beneficial interest (authorized 125,000,000 shares) | | $ | 24.62 |
| | |
|
|
STATEMENT OF OPERATIONS
Year Ended December 31, 2007
| | | | |
| INVESTMENT INCOME | | | | |
Unaffiliated dividend income (net of foreign withholding taxes of $1,209,389) | | $ | 20,115,894 | |
Affiliated dividend income | | | 1,533,729 | |
Affiliated income from securities loaned, net | | | 210,276 | |
Interest | | | 112,942 | |
| | |
|
|
|
| | | | 21,972,841 | |
| | |
|
|
|
| EXPENSES | | | | |
Management fee | | | 7,345,354 | |
Custodian’s fees and expenses | | | 312,000 | |
Shareholders’ reports | | | 181,000 | |
Audit fee | | | 24,000 | |
Trustees’ fees | | | 20,000 | |
Insurance expenses | | | 20,000 | |
Interest expense | | | 19,797 | |
Legal fees and expenses | | | 9,000 | |
Transfer agent’s fees and expenses (including affiliated expense of $4,600) (Note 4) | | | 5,000 | |
Miscellaneous | | | 16,268 | |
| | |
|
|
|
Total expenses | | | 7,952,419 | |
| | |
|
|
|
| NET INVESTMENT INCOME | | | 14,020,422 | |
| | |
|
|
|
| NET REALIZED AND UNREALIZED GAIN (LOSS) ON INVESTMENTS AND FOREIGN CURRENCIES | | | | |
Net realized gain (loss) on: | | | | |
Investment transactions | | | 64,048,253 | |
Futures transactions | | | 71,128 | |
Foreign currency transactions | | | (219,166 | ) |
| | |
|
|
|
| | | | 63,900,215 | |
| | |
|
|
|
Net change in unrealized appreciation (depreciation) on: | | | | |
Investments | | | 17,935,646 | |
Foreign currencies | | | 29,281 | |
| | |
|
|
|
| | | | 17,964,927 | |
| | |
|
|
|
| NET GAIN ON INVESTMENTS AND FOREIGN CURRENCIES | | | 81,865,142 | |
| | |
|
|
|
| NET INCREASE IN NET ASSETS RESULTING FROM OPERATIONS | | $ | 95,885,564 | |
| | |
|
|
|
STATEMENT OF CHANGES IN NET ASSETS
| | | | | | | | |
| | | Year Ended December 31,
| |
| | | 2007
| | | 2006
| |
INCREASE (DECREASE) IN NET ASSETS
OPERATIONS: | | | | | | | | |
Net investment income | | $ | 14,020,422 | | | $ | 10,692,630 | |
Net realized gain on investment and foreign currency transactions | | | 63,900,215 | | | | 32,439,736 | |
Net change in unrealized appreciation (depreciation) on investments, futures and foreign currencies | | | 17,964,927 | | | | 112,256,288 | |
| | |
|
|
| |
|
|
|
NET INCREASE IN NET ASSETS RESULTING FROM OPERATIONS | | | 95,885,564 | | | | 155,388,654 | |
| | |
|
|
| |
|
|
|
| DISTRIBUTIONS | | | (10,692,295 | ) | | | (5,516,655 | ) |
| | |
|
|
| |
|
|
|
| SERIES SHARE TRANSACTIONS: | | | | | | | | |
Series shares sold [1,809,090 and 2,609,905 shares, respectively] | | | 43,514,915 | | | | 53,367,041 | |
Series shares issued in reinvestment of distributions [435,886 and 272,832 shares, respectively] | | | 10,692,295 | | | | 5,516,655 | |
Series shares repurchased [3,630,416 and 4,426,740 shares, respectively] | | | (87,249,982 | ) | | | (90,036,644 | ) |
| | |
|
|
| |
|
|
|
| NET DECREASE IN NET ASSETS RESULTING FROM SERIES SHARE TRANSACTIONS | | | (33,042,772 | ) | | | (31,152,948 | ) |
| | |
|
|
| |
|
|
|
| TOTAL INCREASE IN NET ASSETS | | | 52,150,497 | | | | 118,719,051 | |
| NET ASSETS: | | | | | | | | |
Beginning of year | | | 932,858,896 | | | | 814,139,845 | |
| | |
|
|
| |
|
|
|
End of year | | $ | 985,009,393 | | | $ | 932,858,896 | |
| | |
|
|
| |
|
|
|
SEE NOTES TO FINANCIAL STATEMENTS.
A106
| | | | |
| | | GOVERNMENT INCOME PORTFOLIO | | |
SCHEDULE OF INVESTMENTS | December 31, 2007 |
| | | | | | | | | | |
| LONG-TERM INVESTMENTS — 91.2% | | Interest
Rate
| | Maturity
Date
| | Principal
Amount
(000)
| | Value
(Note 2)
|
| | | | | | | | | | | |
Asset Backed Securities — 3.5% | | | | | | | | | | |
Citibank Credit Card Issuance Trust, | | | | | | | | | | |
Series 2007-A8, Class A8 | | 5.65% | | 09/20/19 | | $ | 1,500 | | $ | 1,501,501 |
Small Business Administration Participation Certificates, | | | | | | | | | | |
Series 1996-20J, Class 1 | | 7.20% | | 10/01/16 | | | 3,169 | | | 3,291,124 |
Series 1997-20A, Class 1 | | 7.15% | | 01/01/17 | | | 3,235 | | | 3,356,743 |
Series 1997-20G, Class 1 | | 6.85% | | 07/01/17 | | | 1,184 | | | 1,226,355 |
Series 1998-20I, Class 1 | | 6.00% | | 09/01/18 | | | 2,452 | | | 2,518,025 |
| | | | | | | | | |
|
|
| | | | | | | | | | | 11,893,748 |
| | | | | | | | | |
|
|
Collateralized Mortgage Obligations — 6.8% | | | | | | | | | | |
Federal Home Loan Mortgage Corp., | | | | | | | | | | |
Series 2496, Class PM | | 5.50% | | 09/15/17 | | | 2,819 | | | 2,840,987 |
Series 2501, Class MC | | 5.50% | | 09/15/17 | | | 1,851 | | | 1,883,525 |
Series 2513, Class HC | | 5.00% | | 10/15/17 | | | 2,339 | | | 2,333,691 |
Series 2518, Class PV | | 5.50% | | 06/15/19 | | | 1,920 | | | 1,922,128 |
Federal National Mortgage Association, | | | | | | | | | | |
Series 2002-18, Class PC | | 5.50% | | 04/25/17 | | | 5,000 | | | 5,098,177 |
Series 2002-57, Class ND | | 5.50% | | 09/25/17 | | | 2,115 | | | 2,152,482 |
Series 2002-94, Class HQ | | 4.50% | | 01/25/18 | | | 6,419 | | | 6,226,330 |
Merrill Lynch Mortgage Investors, Inc., | | | | | | | | | | |
Series 2003-E, Class A1(a) | | 5.175% | | 10/25/28 | | | 156 | | | 155,411 |
Structured Adjustable Rate Mortgage Loan, | | | | | | | | | | |
Series 2004-1, Class 4A-3(a) | | 4.17% | | 02/25/34 | | | 527 | | | 536,993 |
| | | | | | | | | |
|
|
| | | | | | | | | | | 23,149,724 |
| | | | | | | | | |
|
|
Commercial Mortgage Backed Securities ��� 7.4% | | | | | | | | | | |
Bear Stearns Commercial Mortgage Securities, Inc., | | | | | | | | | | |
Series 2000-WF1, Class A1 | | 7.64% | | 02/15/32 | | | 366 | | | 369,116 |
Series 2004-T16, Class A5 | | 4.60% | | 02/13/46 | | | 4,200 | | | 4,134,532 |
Series 2006-PW11, Class A4(a) | | 5.457% | | 03/11/39 | | | 860 | | | 872,819 |
Series 2006-T22, Class A4(a) | | 5.465% | | 04/12/38 | | | 2,700 | | | 2,755,827 |
First Union National Bank Commercial Mortgage Trust, | | | | | | | | | | |
Series 2000-C1, Class A1 | | 7.739% | | 05/17/32 | | | 84 | | | 83,652 |
GS Mortgage Securities Corp. II, | | | | | | | | | | |
Series 2003-C1, Class A3 | | 4.608% | | 01/10/40 | | | 6,800 | | | 6,718,658 |
Merrill Lynch Mortgage Trust, | | | | | | | | | | |
Series 2006-C1, Class ASB(a) | | 5.659% | | 05/12/39 | | | 1,500 | | | 1,534,238 |
Merrill Lynch/Countrywide Commercial Mortgage Trust, | | | | | | | | | | |
Series 2007-5, Class A4 | | 5.378% | | 08/12/48 | | | 2,000 | | | 2,000,372 |
Morgan Stanley Capital I, | | | | | | | | | | |
Series 2005-IQ9, Class AAB | | 4.51% | | 07/15/56 | | | 2,500 | | | 2,444,488 |
Series 2005-T19, Class AAB | | 4.852% | | 06/12/47 | | | 1,375 | | | 1,353,261 |
Series 2006-IQ11, Class A4(a) | | 5.773% | | 10/15/42 | | | 2,800 | | | 2,884,159 |
Morgan Stanley Dean Witter I, | | | | | | | | | | |
Series 2001-TOP1, Class A2 | | 6.32% | | 02/15/33 | | | 71 | | | 71,007 |
| | | | | | | | | |
|
|
| | | | | | | | | | | 25,222,129 |
| | | | | | | | | |
|
|
Corporate Bond — 0.5% | | | | | | | | | | |
DEPFA ACS Bank, 144A(b) | | 5.125% | | 03/16/37 | | | 1,520 | | | 1,502,403 |
| | | | | | | | | |
|
|
Foreign Government Bonds — 0.7% | | | | | | | | | | |
Hungary Government Bonds | | 8.00% | | 02/12/15 | | HUF | 198,540 | | | 1,190,467 |
Poland Government Bond, Series 1015 | | 6.25% | | 10/24/15 | | PLN | 2,660 | | | 1,097,386 |
Sweden Government Bond, Series 1040 | | 6.50% | | 05/05/08 | | SEK | 1,080 | | | 168,260 |
| | | | | | | | | |
|
|
| | | | | | | | | | | 2,456,113 |
| | | | | | | | | |
|
|
Mortgage Backed Securities — 56.3% | | | | | | | | | | |
Federal Home Loan Mortgage Corp.(a) | | 3.531% | | 05/01/34 | | $ | 1,681 | | | 1,696,967 |
Federal Home Loan Mortgage Corp.(a) | | 3.788% | | 06/01/34 | | | 3,917 | | | 3,871,818 |
Federal Home Loan Mortgage Corp. | | 5.00% | | 06/01/33-05/01/34 | | | 10,048 | | | 9,816,810 |
SEE NOTES TO FINANCIAL STATEMENTS.
A107
| | | | |
| | | GOVERNMENT INCOME PORTFOLIO (Continued) | | |
SCHEDULE OF INVESTMENTS | December 31, 2007 |
| | | | | | | | | | |
| LONG-TERM INVESTMENTS (continued) | | Interest
Rate
| | Maturity
Date
| | Principal
Amount
(000)
| | Value
(Note 2)
|
| | | | | | | | | | | |
Mortgage Backed Securities (continued) | | | | | | | | | | |
Federal Home Loan Mortgage Corp. | | 5.50% | | TBA 30 YR | | $ | 4,500 | | $ | 4,490,154 |
Federal Home Loan Mortgage Corp. | | 6.00% | | 09/01/34 | | | 619 | | | 629,236 |
Federal Home Loan Mortgage Corp. | | 6.00% | | TBA 30 YR | | | 10,000 | | | 10,146,880 |
Federal Home Loan Mortgage Corp. | | 6.50% | | 06/01/08-09/01/32 | | | 748 | | | 770,310 |
Federal Home Loan Mortgage Corp. | | 7.00% | | 08/01/11-10/01/32 | | | 573 | | | 587,211 |
Federal National Mortgage Association(a) | | 3.496% | | 06/01/34 | | | 11,492 | | | 11,633,147 |
Federal National Mortgage Association(a) | | 3.592% | | 07/01/33 | | | 5,445 | | | 5,437,755 |
Federal National Mortgage Association(a) | | 3.789% | | 04/01/34 | | | 688 | | | 678,068 |
Federal National Mortgage Association(a) | | 4.046% | | 08/01/33 | | | 2,810 | | | 2,800,103 |
Federal National Mortgage Association(a) | | 4.241% | | 04/01/34 | | | 1,922 | | | 1,915,225 |
Federal National Mortgage Association(a) | | 4.479% | | 06/01/34 | | | 1,553 | | | 1,562,690 |
Federal National Mortgage Association(a) | | 4.869% | | 10/01/34 | | | 2,584 | | | 2,568,497 |
Federal National Mortgage Association(a) | | 4.986% | | 06/01/36 | | | 3,940 | | | 3,977,652 |
Federal National Mortgage Association | | 5.00% | | 07/01/18-12/01/31 | | | 8,700 | | | 8,715,572 |
Federal National Mortgage Association | | 5.00% | | TBA 30 YR | | | 5,500 | | | 5,365,938 |
Federal National Mortgage Association | | 5.50% | | 01/01/17-04/01/36 | | | 43,820 | | | 43,820,592 |
Federal National Mortgage Association | | 5.50% | | TBA 15 YR | | | 4,500 | | | 4,557,654 |
Federal National Mortgage Association | | 5.50% | | TBA 30 YR | | | 23,500 | | | 23,470,625 |
Federal National Mortgage Association | | 6.00% | | 11/01/14-01/01/36 | | | 8,695 | | | 8,850,127 |
Federal National Mortgage Association | | 6.00% | | TBA 30 YR | | | 6,900 | | | 7,005,653 |
Federal National Mortgage Association | | 6.276% | | 03/01/11 | | | 1,146 | | | 1,198,216 |
Federal National Mortgage Association | | 6.50% | | 11/01/09-10/01/37 | | | 7,190 | | | 7,414,552 |
Federal National Mortgage Association | | 7.00% | | 02/01/12-01/01/36 | | | 1,801 | | | 1,887,258 |
Federal National Mortgage Association | | 7.50% | | 05/01/08-10/01/12 | | | 166 | | | 171,440 |
Federal National Mortgage Association | | 8.00% | | 03/01/22-02/01/26 | | | 51 | | | 54,448 |
Federal National Mortgage Association | | 9.00% | | 02/01/25-04/01/25 | | | 217 | | | 236,337 |
Government National Mortgage Association | | 5.00% | | 07/15/33-04/15/34 | | | 3,956 | | | 3,899,294 |
Government National Mortgage Association | | 5.50% | | 03/15/34-03/15/36 | | | 4,250 | | | 4,282,477 |
Government National Mortgage Association | | 6.00% | | TBA 30 YR | | | 4,000 | | | 4,095,000 |
Government National Mortgage Association | | 6.50% | | 07/15/32-08/15/32 | | | 837 | | | 867,594 |
Government National Mortgage Association | | 7.00% | | 03/15/23-08/15/28 | | | 1,920 | | | 2,038,801 |
Government National Mortgage Association | | 7.50% | | 12/15/25-02/15/26 | | | 365 | | | 389,440 |
Government National Mortgage Association | | 8.50% | | 09/15/24-04/15/25 | | | 478 | | | 521,962 |
| | | | | | | | | |
|
|
| | | | | | | | | | | 191,425,503 |
| | | | | | | | | |
|
|
U.S. Government Agency Obligations — 13.1% | | | | | | | | | | |
Federal Farm Credit Bank | | 4.875% | | 01/17/17 | | | 980 | | | 1,005,355 |
Federal Home Loan Bank | | 3.625% | | 12/17/10 | | | 2,595 | | | 2,595,340 |
Federal Home Loan Bank | | 4.625% | | 10/10/12 | | | 9,530 | | | 9,808,571 |
Federal Home Loan Mortgage Corp. | | 5.35% | | 11/14/11 | | | 1,210 | | | 1,221,117 |
Federal National Mortgage Association | | 5.00% | | 03/15/16 | | | 2,870 | | | 2,999,161 |
Federal National Mortgage Association | | 5.30% | | 02/22/11 | | | 14,630 | | | 14,636,540 |
FICO Strip Principal | | Zero | | 05/11/18 | | | 4,000 | | | 2,487,216 |
Tennessee Valley Authority, Series B | | 4.375% | | 06/15/15 | | | 9,850 | | | 9,862,815 |
| | | | | | | | | |
|
|
| | | | | | | | | | | 44,616,115 |
| | | | | | | | | |
|
|
U.S. Government Treasury Securities — 2.9% | | | | | | | | | | |
United States Treasury Bonds(c) | | 4.75% | | 02/15/37 | | | 355 | | | 371,530 |
United States Treasury Bonds | | 6.25% | | 08/15/23 | | | 2,500 | | | 2,993,165 |
United States Treasury Notes | | 3.625% | | 12/31/12 | | | 15 | | | 15,113 |
United States Treasury Notes | | 4.125% | | 08/15/08 | | | 15 | | | 15,063 |
United States Treasury Notes | | 4.875% | | 08/15/16 | | | 900 | | | 958,360 |
United States Treasury Strips(b) | | Zero | | 05/15/20-05/15/21 | | | 10,100 | | | 5,560,008 |
| | | | | | | | | |
|
|
| | | | | | | | | | | 9,913,239 |
| | | | | | | | | |
|
|
TOTAL LONG-TERM INVESTMENTS
(cost $307,402,062) | | | 310,178,974 |
| | | | | | | | | |
|
|
SEE NOTES TO FINANCIAL STATEMENTS.
A108
| | | | |
| | | GOVERNMENT INCOME PORTFOLIO (Continued) | | |
SCHEDULE OF INVESTMENTS | December 31, 2007 |
| | | | | | | | | | |
| SHORT-TERM INVESTMENTS — 25.5% | | Interest
Rate
| | Maturity
Date
| | Principal
Amount
(000)
| | Value
(Note 2)
| |
| | | | | | | | | | | |
U.S. Government Agency Obligation — 5.1% | | | | | | | | | | |
Federal Home Loan Mortgage Corp., Discount Note
(cost $17,326,910) | | Zero | | 02/19/08 | | $ 17,500 | | $ | 17,403,873 | |
| | | | | | | | |
|
|
|
| | | | | | | Shares
| | | |
| | | | | | | | | | | |
Affiliated Mutual Funds — 20.4% | | | | | | | | | | |
Dryden Core Investment Fund — Short-Term Bond Series
(cost $50,892,138)(e) | | | | | | 5,119,361 | | | 48,326,772 | |
Dryden Core Investment Fund — Taxable Money Market Series
(cost $21,203,483; includes $350,649 of cash collateral received for securities on loan) (Note 4)(d)(e) | | | | | | 21,203,483 | | | 21,203,483 | |
| | | | | | | | |
|
|
|
| | | | | | | | | | | |
TOTAL AFFILIATED MUTUAL FUNDS
(cost $72,095,621) | | | 69,530,255 | |
| | | | | | | | |
|
|
|
| | | | |
| OUTSTANDING OPTION PURCHASED | | | | | | Contracts
| | | |
Call Option | | | | | | | | | | |
Iceland Krona, expiring 08/05/08 @ $67.75
(cost $18,866) | | | | | | 336,900 | | | 20,888 | |
| | | | | | | | |
|
|
|
TOTAL SHORT-TERM INVESTMENTS
(cost $89,441,397) | | | 86,955,016 | |
| | |
|
|
|
TOTAL INVESTMENTS 116.7%
(cost $396,843,459) | | | 397,133,990 | |
OTHER LIABILITIES IN EXCESS OF OTHER ASSETS(f) (16.7%) | | | (56,826,576 | ) |
| | |
|
|
|
TOTAL NET ASSETS 100.0% | | $ | 340,307,414 | |
| | | | | | | | |
|
|
|
The following abbreviations are used in portfolio descriptions:
| | |
| 144A | | Security was purchased pursuant to Rule 144A under the Securities Act of 1933 and may not be subject to that rule except to qualified institutional buyers. Unless otherwise noted, 144A securities are deemed to be liquid. |
| AUD | | Australian Dollar |
| EUR | | Euro |
| FICO | | Financing Corporation |
| GBP | | British Pound |
| HUF | | Hungarian Forint |
| ISK | | Iceland Krona |
| NZD | | New Zealand Dollar |
| PLN | | Polish Zloty |
| SEK | | Swedish Krona |
| TBA | | To be announced |
| (a) | Indicates a variable rate security. The maturity date presented for these instruments is the later of the next date on which the security can be redeemed at par or the next date on which the rate of interest is adjusted. The interest rate shown reflects the rate in effect at December 31, 2007. |
| (b) | Security segregated as collateral for futures contracts. |
| (c) | All or portion of security is on loan. The aggregate market value of such securities is $346,006; cash collateral of $350,649 (included in liabilities) was received with which the Portfolio purchased highly liquid short-term investments. |
| (d) | Represents security, or a portion thereof, purchased with cash collateral received for securities on loan. |
| (e) | Prudential Investments LLC, the manager of the Portfolio, also serves as manager of the Dryden Core Investment Fund — Taxable Money Market Series and the Dryden Core Investment Fund — Short-Term Bond Series. |
| (f) | Other liabilities in excess of other assets include net unrealized appreciation (depreciation) on financial futures contracts, forward foreign currency contracts and interest rate swap agreements as follows: |
SEE NOTES TO FINANCIAL STATEMENTS.
A109
| | | | |
| | | GOVERNMENT INCOME PORTFOLIO (Continued) | | |
SCHEDULE OF INVESTMENTS | December 31, 2007 |
Open futures contracts outstanding at December 31, 2007:
| | | | | | | | | | | | | | |
Number of
Contracts
| | Type
| | Expiration
Date
| | Value at
December 31, 2007
| | Value at
Trade Date
| | Unrealized
Appreciation
(Depreciation)
| |
| Long Positions: | | | | | | | | | | | | | | |
| 6 | | Australian 10 Yr. Bond | | Mar. 08 | | $ | 493,560 | | $ | 493,938 | | $ | (378 | ) |
| 13 | | 2 Yr. Euro Schatz | | Mar. 08 | | | 1,964,435 | | | 1,978,449 | | | (14,014 | ) |
| 9 | | Euro Bund | | Mar. 08 | | | 1,488,355 | | | 1,523,160 | | | (34,805 | ) |
| 2 | | Long-Term U.K. Gilt | | Mar. 08 | | | 438,849 | | | 438,992 | | | (143 | ) |
| 1 | | New Zealand 3 Mo. Bill | | Mar. 08 | | | 701,753 | | | 702,222 | | | (469 | ) |
| 222 | | U.S. 30 Yr. Bond | | Mar. 08 | | | 25,835,250 | | | 25,807,087 | | | 28,163 | |
| | | | | | | | | | | | |
|
|
|
| | | | | | | | | | | | | | (21,646 | ) |
| | | | | | | | | | | | |
|
|
|
| Short Positions: | | | | | | | | | | | | | | |
| 31 | | U.S. Treasury 2 Yr. Notes | | Mar. 08 | | | 6,517,750 | | | 6,521,026 | | | 3,276 | |
| 190 | | U.S. Treasury 5 Yr. Notes | | Mar. 08 | | | 20,953,437 | | | 20,883,561 | | | (69,876 | ) |
| 25 | | U.S. Treasury 10 Yr. Notes | | Mar. 08 | | | 2,834,766 | | | 2,808,235 | | | (26,531 | ) |
| | | | | | | | | | | | |
|
|
|
| | | | | | | | | | | | | | (93,131 | ) |
| | | | | | | | | | | | |
|
|
|
| | | | | | | | | | | | | $ | (114,777 | ) |
| | | | | | | | | | | | |
|
|
|
Open forward foreign currency exchange contracts outstanding at December 31, 2007:
| | | | | | | | | | | | | |
Purchase Contracts:
| | Notional
Amount
(000)
| | Payable at
Statement Date
| | Value at
December 31, 2007
| | Unrealized
Appreciation
(Depreciation)
| |
| Australian Dollar expiring 01/18/08 | | AUD | 474,841 | | $ | 417,090 | | $ | 416,503 | | $ | (587 | ) |
| Euro expiring 01/25/08 | | EUR | 521,185 | | | 753,451 | | | 762,362 | | | 8,911 | |
| Hungarian Forint expiring 01/24/08 | | HUF | 29,524,899 | | | 167,100 | | | 170,432 | | | 3,332 | |
| Iceland Krona expiring 01/16/08 | | ISK | 22,045,836 | | | 355,732 | | | 350,014 | | | (5,718 | ) |
| Iceland Krona expiring 01/18/08 | | ISK | 13,056,227 | | | 203,900 | | | 207,182 | | | 3,282 | |
| New Zealand Dollar expiring 01/18/08 | | NZD | 669,906 | | | 520,553 | | | 514,398 | | | (6,155 | ) |
| Pound Sterling expiring 01/25/08 | | GBP | 244,021 | | | 488,264 | | | 485,386 | | | (2,878 | ) |
| Swedish Krona expiring 01/24/08 | | SEK | 2,223,234 | | | 340,400 | | | 344,071 | | | 3,671 | |
| | | | | | | | | | | |
|
|
|
| | | | | | | | | | | | $ | 3,858 | |
| | | | | | | | | | | |
|
|
|
| | | | | | | | | | | | | |
Sales Contracts:
| | Notional
Amount
(000)
| | Receivable at
Statement
Date
| | Value at
December 31, 2007
| | Unrealized
Appreciation
(Depreciation)
| |
| Euro expiring 01/25/08 | | EUR | 234,937 | | $ | 339,100 | | $ | 343,654 | | $ | (4,554 | ) |
| Hungarian Forint expiring 01/24/08 | | HUF | 218,676,559 | | | 1,263,312 | | | 1,262,306 | | | 1,006 | |
| Iceland Krona expiring 01/16/08 | | ISK | 13,160,726 | | | 203,900 | | | 208,948 | | | (5,048 | ) |
| New Zealand Dollar expiring 01/18/08 | | NZD | 218,758 | | | 170,500 | | | 167,977 | | | 2,523 | |
| Polish Zloty expiring 01/24/08 | | PLN | 1,872,293 | | | 765,232 | | | 760,902 | | | 4,330 | |
| Pound Sterling expiring 01/25/08 | | GBP | 83,043 | | | 167,100 | | | 165,182 | | | 1,918 | |
| Swedish Krona expiring 01/24/08 | | SEK | 2,215,372 | | | 341,951 | | | 342,854 | | | (903 | ) |
| | | | | | | | | | | |
|
|
|
| | | | | | | | | | | | | (728 | ) |
| | | | | | | | | | | |
|
|
|
| | | | | | | | | | | | $ | 3,130 | |
| | | | | | | | | | | |
|
|
|
SEE NOTES TO FINANCIAL STATEMENTS.
A110
| | | | |
| | | GOVERNMENT INCOME PORTFOLIO (Continued) | | |
SCHEDULE OF INVESTMENTS | December 31, 2007 |
Interest rate swap agreements outstanding at December 31, 2007:
| | | | | | | | | | | | | | |
Counterparty
| | Termination
Date
| | Notional
Amount
(000)
| | Fixed
Rate
| | | Floating Rate
| | Unrealized
Appreciation
(Depreciation)
| |
Merrill Lynch Capital Services(1) | | 08/14/12 | | $ | 3,410 | | 5.20857 | % | | 3 month LIBOR | | $ | 195,908 | |
Deutsche Bank AG(1) | | 11/16/12 | | | 13,500 | | 4.65517 | % | | 3 month LIBOR | | | 273,624 | |
Morgan Stanley Capital Services(1) | | 12/07/12 | | | 2,145 | | 4.15033 | % | | 3 month LIBOR | | | 1,691 | |
Morgan Stanley Capital Services(1) | | 12/11/12 | | | 7,500 | | 4.37022 | % | | 3 month LIBOR | | | 75,863 | |
Merrill Lynch Capital Services(2) | | 12/14/12 | | | 4,040 | | 4.35284 | % | | 3 month LIBOR | | | (38,898 | ) |
Merrill Lynch Capital Services(1) | | 08/02/17 | | | 2,250 | | 5.52959 | % | | 3 month LIBOR | | | 190,197 | |
Deutsche Bank AG(1) | | 11/19/17 | | | 28,840 | | 5.585 | % | | 3 month LIBOR | | | 96,880 | |
Deutsche Bank AG(2) | | 11/19/27 | | | 12,320 | | 5.69 | % | | 3 month LIBOR | | | (43,432 | ) |
Morgan Stanley Capital Services(2) | | 12/11/37 | | | 1,090 | | 5.08438 | % | | 3 month LIBOR | | | (13,133 | ) |
Merrill Lynch Capital Services(2) | | 12/11/37 | | | 6,385 | | 5.08938 | % | | 3 month LIBOR | | | (98,703 | ) |
| | | | | | | | | | | | |
|
|
|
| | | | | | | | | | | | | $ | 639,997 | |
| | | | | | | | | | | | |
|
|
|
| (1) | The Portfolio pays the floating rate and receives the fixed rate. |
| (2) | The Portfolio pays the fixed rate and receives the floating rate. |
The industry classification of portfolio holdings and other liabilities in excess of other assets shown as a percentage of net assets as of December 31, 2007 were as follows:
| | | |
Mortgage Backed Securities | | 56.3 | % |
Affiliated Mutual Funds (including 0.1% of collateral received for securities on loan) | | 20.4 | |
U.S. Government Agency Obligations | | 18.2 | |
Commercial Mortgage Backed Securities | | 7.4 | |
Collateralized Mortgage Obligations | | 6.8 | |
Asset Backed Securities | | 3.5 | |
U.S. Government Treasury Securities | | 2.9 | |
Foreign Government Bonds | | 0.7 | |
Corporate Bond | | 0.5 | |
| | |
|
|
| | | 116.7 | |
Other liabilities in excess of other assets | | (16.7 | ) |
| | |
|
|
| | | 100.0 | % |
| | |
|
|
SEE NOTES TO FINANCIAL STATEMENTS.
A111
| | | | |
| | | GOVERNMENT INCOME PORTFOLIO (Continued) | | |
STATEMENT OF ASSETS AND LIABILITIES
December 31, 2007
| | | | |
| ASSETS | | | | |
Investments, at value including securities on loan of $346,006: | | | | |
Unaffiliated investments (cost $324,747,838) | | $ | 327,603,735 | |
Affiliated investments (cost $72,095,621) | | | 69,530,255 | |
Foreign currency (cost $22) | | | 22 | |
Receivable for investments sold | | | 121,320,939 | |
Interest receivable | | | 1,969,659 | |
Unrealized appreciation on swaps | | | 834,163 | |
Due from broker — variation margin | | | 54,812 | |
Unrealized appreciation on forward currency contracts | | | 28,973 | |
Receivable for Series shares sold | | | 24,899 | |
Prepaid expenses | | | 3,666 | |
| | |
|
|
|
Total Assets | | | 521,371,123 | |
| | |
|
|
|
| LIABILITIES | | | | |
Payable for investments purchased | | | 180,102,861 | |
Collateral for securities on loan | | | 350,649 | |
Unrealized depreciation on swaps | | | 194,166 | |
Accrued expenses and other liabilities | | | 140,941 | |
Payable for Series shares repurchased | | | 125,241 | |
Management fee payable | | | 115,450 | |
Unrealized depreciation on forward currency contracts | | | 25,843 | |
Payable to custodian | | | 4,792 | |
Deferred trustees’ fees | | | 3,206 | |
Transfer agent fee payable | | | 560 | |
| | |
|
|
|
Total Liabilities | | | 181,063,709 | |
| | |
|
|
|
| NET ASSETS | | $ | 340,307,414 | |
| | |
|
|
|
Net assets were comprised of: | | | | |
Paid-in capital | | $ | 345,517,435 | |
Retained earnings | | | (5,210,021 | ) |
| | |
|
|
|
Net assets, December 31, 2007 | | $ | 340,307,414 | |
| | |
|
|
|
Net asset value and redemption price per share, ($340,307,414 / 29,903,156 outstanding shares of beneficial interest (authorized 100,000,000 shares) | | $ | 11.38 | |
| | |
|
|
|
STATEMENT OF OPERATIONS
Year Ended December 31, 2007
| | | | |
| INVESTMENT INCOME | | | | |
Unaffiliated interest income | | $ | 13,665,484 | |
Affiliated dividend income | | | 3,883,421 | |
Affiliated income from securities loaned, net | | | 67,551 | |
| | |
|
|
|
| | | | 17,616,456 | |
| | |
|
|
|
| EXPENSES | | | | |
Management fee | | | 1,372,156 | |
Shareholders’ reports | | | 140,000 | |
Interest expense | | | 104,905 | |
Custodian’s fees and expenses | | | 94,000 | |
Audit fee | | | 22,000 | |
Trustees’ fees | | | 14,000 | |
Insurance expenses | | | 8,000 | |
Legal fees and expenses | | | 8,000 | |
Transfer agent’s fees and expenses (including affiliated expense of $2,700) (Note 4) | | | 3,000 | |
Miscellaneous | | | 9,508 | |
| | |
|
|
|
Total expenses | | | 1,775,569 | |
| | |
|
|
|
| NET INVESTMENT INCOME | | | 15,840,887 | |
| | |
|
|
|
| NET REALIZED AND UNREALIZED GAIN (LOSS) ON INVESTMENTS AND FOREIGN CURRENCIES | | | | |
Net realized gain (loss) on: | | | | |
Investment transactions | | | (13,554 | ) |
Foreign currency transactions | | | (105,672 | ) |
Futures transactions | | | (842,040 | ) |
Short sale transactions | | | (106,461 | ) |
Swap transactions | | | 430,047 | |
Options written transactions | | | 19,009 | |
| | |
|
|
|
| | | | (618,671 | ) |
| | |
|
|
|
Net change in unrealized appreciation (depreciation) on: | | | | |
Investments | | | 3,002,493 | |
Foreign currencies | | | (159 | ) |
Futures | | | (102,540 | ) |
Short sales | | | (3,281 | ) |
Swaps | | | 684,435 | |
| | |
|
|
|
| | | | 3,580,948 | |
| | |
|
|
|
| NET GAIN ON INVESTMENTS AND FOREIGN CURRENCIES | | | 2,962,277 | |
| | |
|
|
|
| NET INCREASE IN NET ASSETS RESULTING FROM OPERATIONS | | $ | 18,803,164 | |
| | |
|
|
|
STATEMENT OF CHANGES IN NET ASSETS
| | | | | | | | |
| | | Year Ended December 31,
| |
| | | 2007
| | | 2006
| |
| INCREASE (DECREASE) IN NET ASSETS | | | | | | | | |
| OPERATIONS: | | | | | | | | |
Net investment income | | $ | 15,840,887 | | | $ | 17,134,336 | |
Net realized loss on investments and foreign currency transactions | | | (618,671 | ) | | | (2,865,056 | ) |
Net change in unrealized appreciation (depreciation) on investments and foreign currencies | | | 3,580,948 | | | | (1,250,146 | ) |
| | |
|
|
| |
|
|
|
NET INCREASE IN NET ASSETS RESULTING FROM OPERATIONS | | | 18,803,164 | | | | 13,019,134 | |
| | |
|
|
| |
|
|
|
| DISTRIBUTIONS | | | (15,181,670 | ) | | | (17,558,195 | ) |
| | |
|
|
| |
|
|
|
| SERIES SHARE TRANSACTIONS: | | | | | | | | |
Series share sold [722,847 and 1,318,889 shares, respectively] | | | 8,166,048 | | | | 14,867,273 | |
Series share issued in reinvestment of distributions [1,353,614 and 1,568,051 shares, respectively] | | | 15,181,670 | | | | 17,558,195 | |
Series share repurchased [3,624,503 and 4,593,356 shares, respectively] | | | (40,920,583 | ) | | | (51,789,971 | ) |
| | |
|
|
| |
|
|
|
NET DECREASE IN NET ASSETS RESULTING FROM SERIES SHARE TRANSACTIONS | | | (17,572,865 | ) | | | (19,364,503 | ) |
| | |
|
|
| |
|
|
|
| TOTAL DECREASE IN NET ASSETS | | | (13,951,371 | ) | | | (23,903,564 | ) |
| NET ASSETS: | | | | | | | | |
Beginning of year | | | 354,258,785 | | | | 378,162,349 | |
| | |
|
|
| |
|
|
|
End of year | | $ | 340,307,414 | | | $ | 354,258,785 | |
| | |
|
|
| |
|
|
|
SEE NOTES TO FINANCIAL STATEMENTS.
A112
| | | | |
| | | HIGH YIELD BOND PORTFOLIO | | |
SCHEDULE OF INVESTMENTS | December 31, 2007 |
| | | | | | | | | | | | |
LONG-TERM INVESTMENTS — 90.9% CORPORATE BONDS — 90.0% | | Moody’s
Rating
(Unaudited)
| | Interest
Rate
| | Maturity
Date
| | Principal
Amount
(000)
| | Value
(Note 2)
|
| | | | | | | | | | | | | |
Aerospace/Defense — 2.1% | | | | | | | | | | | | |
Bombardier, Inc., Notes (Canada), 144A | | Ba2 | | 6.30% | | 05/01/14 | | $ | 1,000 | | $ | 977,500 |
DRS Technologies, Inc., Gtd. Notes | | B1 | | 6.625% | | 02/01/16 | | | 4,600 | | | 4,542,500 |
DRS Technologies, Inc., Gtd. Notes | | B3 | | 6.875% | | 11/01/13 | | | 2,000 | | | 1,990,000 |
DRS Technologies, Inc., Gtd. Notes(b) | | B3 | | 7.625% | | 02/01/18 | | | 4,375 | | | 4,429,688 |
Esterline Technologies Corp., Sr. Notes | | Ba3 | | 6.625% | | 03/01/17 | | | 750 | | | 742,500 |
Esterline Technologies Corp., Sr. Sub. Notes | | B1 | | 7.75% | | 06/15/13 | | | 4,500 | | | 4,612,500 |
L-3 Communications Corp., Gtd. Notes | | Ba3 | | 7.625% | | 06/15/12 | | | 6,800 | | | 6,961,500 |
L-3 Communications Corp., Gtd. Notes, Ser. B | | Ba3 | | 6.375% | | 10/15/15 | | | 5,200 | | | 5,122,000 |
L-3 Communications Corp., Sr. Unsec’d. Notes | | Ba3 | | 6.125% | | 01/15/14 | | | 1,180 | | | 1,156,400 |
Moog, Inc., Sr. Sub. Notes | | Ba3 | | 6.25% | | 01/15/15 | | | 2,000 | | | 1,945,000 |
TransDigm, Inc., Gtd. Notes | | B3 | | 7.75% | | 07/15/14 | | | 3,025 | | | 3,070,375 |
| | | | | | | | | | | |
|
|
| | | | | | | | | | | | | 35,549,963 |
| | | | | | | | | | | |
|
|
Airlines — 0.5% | | | | | | | | | | | | |
AMR Corp., Notes, MTN | | CCC+(g) | | 10.40% | | 03/10/11 | | | 1,000 | | | 997,500 |
AMR Corp., Notes, MTN | | CCC+(g) | | 10.40% | | 03/15/11 | | | 1,000 | | | 997,500 |
AMR Corp., Notes, MTN | | NR | | 10.55% | | 03/12/21 | | | 1,425 | | | 1,364,438 |
Calair Capital Corp., Gtd. Notes | | B3 | | 8.125% | | 04/01/08 | | | 2,828 | | | 2,827,999 |
Continental Airlines, Inc., Pass-thru Certs., | | | | | | | | | | | | |
Ser. 98-1, Class B | | Ba2 | | 6.748% | | 03/15/17 | | | 1,245 | | | 1,188,847 |
Ser. 99-2, Class B | | Ba2 | | 7.566% | | 03/15/20 | | | 468 | | | 453,969 |
| | | | | | | | | | | |
|
|
| | | | | | | | | | | | | 7,830,253 |
| | | | | | | | | | | |
|
|
Automotive — 3.4% | | | | | | | | | | | | |
Ford Motor Co., Bank Loan(f) | | Ba3 | | 8.00% | | 12/15/13 | | | 12,870 | | | 11,893,051 |
Ford Motor Credit Co., Notes(b) | | B1 | | 7.875% | | 06/15/10 | | | 19,130 | | | 17,650,619 |
Ford Motor Credit Co., Sr. Notes(b) | | B1 | | 9.875% | | 08/10/11 | | | 2,250 | | | 2,128,113 |
General Motors Corp., Notes(b) | | Caa1 | | 7.20% | | 01/15/11 | | | 17,175 | | | 15,801,000 |
General Motors Corp., Sr. Notes(b) | | Caa1 | | 7.125% | | 07/15/13 | | | 1,125 | | | 975,938 |
Goodyear Tire & Rubber Co., Sr. Notes(b) | | Ba3 | | 9.00% | | 07/01/15 | | | 27 | | | 28,620 |
Lear Corp., Sr. Notes, Ser. B | | B3 | | 8.75% | | 12/01/16 | | | 2,175 | | | 1,979,250 |
TRW Automotive, Inc., Gtd. Notes, 144A(b) | | Ba3 | | 7.25% | | 03/15/17 | | | 4,675 | | | 4,195,813 |
Visteon Corp., Sr. Notes(b) | | Caa2 | | 7.00% | | 03/10/14 | | | 2,595 | | | 1,946,250 |
| | | | | | | | | | | |
|
|
| | | | | | | | | | | | | 56,598,654 |
| | | | | | | | | | | |
|
|
Banking — 0.7% | | | | | | | | | | | | |
Banco BMG SA, Notes (Brazil), 144A(b) | | Ba1 | | 9.15% | | 01/15/16 | | | 5,000 | | | 5,070,000 |
Halyk Savings Bank of Kazakhstan, Notes (Kazakhstan), 144A
(cost $1,313,962; purchased 10/22/04)(k) | | Baa3 | | 8.125% | | 10/07/09 | | | 1,305 | | | 1,305,000 |
HSBK Europe BV, Gtd. Notes (Netherlands), 144A | | Baa3 | | 7.25% | | 05/03/17 | | | 3,500 | | | 3,045,000 |
Kazkommerts International BV, Gtd. Notes (Netherlands), 144A | | Ba1 | | 7.00% | | 11/03/09 | | | 1,685 | | | 1,575,475 |
| | | | | | | | | | | |
|
|
| | | | | | | | | | | | | 10,995,475 |
| | | | | | | | | | | |
|
|
Building Materials & Construction — 0.6% | | | | | | | | | | | | |
Goodman Global Holdings, Inc., Sr. Notes, Ser. B(h) | | B1 | | 7.9906% | | 06/15/12 | | | 1,759 | | | 1,750,205 |
KB Home, Notes | | Ba1 | | 6.375% | | 08/15/11 | | | 700 | | | 640,500 |
Nortek, Inc., Sr. Sub. Notes(b) | | B3 | | 8.50% | | 09/01/14 | | | 4,850 | | | 3,880,000 |
Toll Corp., Sr. Sub. Notes | | Ba2 | | 8.25% | | 02/01/11 | | | 4,150 | | | 3,932,125 |
| | | | | | | | | | | |
|
|
| | | | | | | | | | | | | 10,202,830 |
| | | | | | | | | | | |
|
|
Cable — 3.4% | | | | | | | | | | | | |
Charter Communications Holdings I LLC, Gtd. Notes(b) | | Caa3 | | 10.00% | | 05/15/14 | | | 2,517 | | | 1,488,176 |
Charter Communications Holdings I LLC, Gtd. Notes(b) | | NR | | 11.00% | | 10/01/15 | | | 3,265 | | | 2,644,650 |
Charter Communications Holdings I LLC, Gtd. Notes | | Caa3 | | 11.125% | | 01/15/14 | | | 1,515 | | | 918,469 |
Charter Communications Holdings I LLC, Gtd. Notes(b) | | Caa3 | | 11.75% | | 05/15/14 | | | 3,150 | | | 1,992,375 |
Charter Communications Holdings I LLC, Gtd. Notes(b) | | Caa3 | | 13.50% | | 01/15/14 | | | 1,000 | | | 716,250 |
Charter Communications Holdings I LLC, Sec’d. Notes(b) | | Caa2 | | 11.00% | | 10/01/15 | | | 7,828 | | | 6,379,819 |
Charter Communications Holdings II LLC, Gtd. Notes | | NR | | 10.25% | | 10/01/13 | | | 1,683 | | | 1,611,473 |
Charter Communications Holdings LLC, Bank Loan(f) | | B1 | | 6.984% | | 09/06/14 | | | 8,500 | | | 7,934,426 |
Charter Communications Operating LLC, Sr. Notes, 144A | | B2 | | 8.375% | | 04/30/14 | | | 1,750 | | | 1,693,125 |
SEE NOTES TO FINANCIAL STATEMENTS.
A113
| | | | |
| | | HIGH YIELD BOND PORTFOLIO (Continued) | | |
SCHEDULE OF INVESTMENTS | December 31, 2007 |
| | | | | | | | | | | | | |
CORPORATE BONDS
(continued) | | Moody’s
Rating
(Unaudited)
| | Interest
Rate
| | Maturity
Date
| | Principal
Amount
(000)
| | | Value
(Note 2)
|
| | | | | | | | | | | | | | |
Cable (continued) | | | | | | | | | | | | | |
Comcast Cable Communications Holdings, Inc., Gtd. Notes | | Baa2 | | 8.375% | | 03/15/13 | | $ | 100 | (i) | | $ | 112 |
CSC Holdings, Inc., Debs. | | B2 | | 7.625% | | 07/15/18 | | | 3,800 | | | | 3,491,250 |
CSC Holdings, Inc., Debs. | | B2 | | 7.875% | | 02/15/18 | | | 800 | | | | 748,000 |
CSC Holdings, Inc., Debs., Ser. B | | B2 | | 8.125% | | 08/15/09 | | | 5,450 | | | | 5,545,375 |
CSC Holdings, Inc., Sr. Notes, Ser. B | | B2 | | 7.625% | | 04/01/11 | | | 350 | | | | 349,125 |
CSC Holdings, Inc., Sr. Notes, Ser. B | | B2 | | 8.125% | | 07/15/09 | | | 2,410 | | | | 2,449,163 |
Mediacom Broadband LLC, Sr. Notes | | B3 | | 8.50% | | 10/15/15 | | | 1,975 | | | | 1,750,344 |
Mediacom LLC, Sr. Notes(b) | | B3 | | 9.50% | | 01/15/13 | | | 4,275 | | | | 3,970,406 |
UPC Broadbank Holding BV, Bank Loan(f) | | Ba3 | | 7.13% | | 12/31/14 | | | 5,000 | | | | 4,726,565 |
Videotron Ltee, Gtd. Notes (Canada) | | Ba1 | | 6.375% | | 12/15/15 | | | 3,450 | | | | 3,238,688 |
Videotron Ltee, Gtd. Notes (Canada) | | Ba1 | | 6.875% | | 01/15/14 | | | 3,570 | | | | 3,494,138 |
Virgin Media Finance PLC, Gtd. Notes (United Kingdom) | | B2 | | 9.125% | | 08/15/16 | | | 1,275 | | | | 1,262,250 |
| | | | | | | | | | | | |
|
|
| | | | | | | | | | | | | | 56,404,179 |
| | | | | | | | | | | | |
|
|
Capital Goods — 7.5% | | | | | | | | | | | | | |
Actuant Corp., Sr. Notes, 144A(b) | | Ba2 | | 6.875% | | 06/15/17 | | | 3,375 | | | | 3,341,250 |
ALH Finance LLC, Sr. Sub. Notes(b) | | B3 | | 8.50% | | 01/15/13 | | | 2,400 | | | | 2,304,000 |
Allied Waste of North America, Inc., Sec’d. Notes, Ser. B | | B1 | | 5.75% | | 02/15/11 | | | 5,320 | | | | 5,213,600 |
Allied Waste of North America, Inc., Sr. Notes | | B1 | | 6.875% | | 06/01/17 | | | 500 | | | | 487,500 |
Allied Waste of North America, Inc., Sr. Notes | | B1 | | 7.25% | | 03/15/15 | | | 900 | | | | 895,500 |
Allied Waste of North America, Inc., Sr. Notes | | B1 | | 7.875% | | 04/15/13 | | | 675 | | | | 690,188 |
Ashtead Capital, Inc., Notes, 144A(b) | | B1 | | 9.00% | | 08/15/16 | | | 6,270 | | | | 5,548,950 |
Ashtead Holdings PLC, Sec’d. Notes (United Kingdom), 144A(b) | | B1 | | 8.625% | | 08/01/15 | | | 6,375 | | | | 5,578,125 |
Baldor Electric Co., Sr. Notes(b) | | B3 | | 8.625% | | 02/15/17 | | | 5,235 | | | | 5,392,050 |
Blount, Inc., Sr. Sub. Notes | | B2 | | 8.875% | | 08/01/12 | | | 8,865 | | | | 8,887,162 |
Capital Safety Group Ltd., Bank Loan(f) | | B1 | | 7.63% | | 07/20/15 | | | 2,728 | | | | 2,639,654 |
Capital Safety Group Ltd., Bank Loan(f) | | B1 | | 8.31% | | 07/20/16 | | | 7,272 | | | | 7,071,704 |
Columbus Mckinnon Corp., Sr. Sub. Notes | | B1 | | 8.875% | | 11/01/13 | | | 5,300 | | | | 5,485,500 |
GrafTech Finance, Inc., Gtd. Notes | | B2 | | 10.25% | | 02/15/12 | | | 6,139 | | | | 6,330,844 |
Hertz Corp., Gtd. Notes(b) | | B2 | | 10.50% | | 01/01/16 | | | 950 | | | | 983,250 |
Hertz Corp., Sr. Notes(b) | | B1 | | 8.875% | | 01/01/14 | | | 11,211 | | | | 11,365,150 |
Invensys PLC, Sr. Notes (United Kingdom), 144A | | B2 | | 9.875% | | 03/15/11 | | | 360 | | | | 380,229 |
Johnsondiversey Holdings, Inc., Disc. Notes | | Caa1 | | 10.67% | | 05/15/13 | | | 4,331 | | | | 4,374,310 |
Johnsondiversey, Inc., Gtd. Notes, Ser. B | | B3 | | 9.625% | | 05/15/12 | | | 2,715 | | | | 2,776,088 |
Mobile Mini, Inc., Sr. Notes | | B1 | | 6.875% | | 05/01/15 | | | 3,800 | | | | 3,458,000 |
RBS Global, Inc. And Rexnord Corp., Gtd. Notes(b) | | B3 | | 9.50% | | 08/01/14 | | | 8,205 | | | | 8,122,950 |
Rental Service Corp., Gtd. Notes(b) | | Caa1 | | 9.50% | | 12/01/14 | | | 5,845 | | | | 5,231,275 |
SPX Corp., Sr. Notes, 144A(b) | | Ba2 | | 7.625% | | 12/15/14 | | | 6,250 | | | | 6,375,000 |
Stena AB, Sr. Notes (Sweden) | | Ba3 | | 7.50% | | 11/01/13 | | | 6,675 | | | | 6,583,219 |
Terex Corp., Gtd. Notes(b) | | Ba2 | | 7.375% | | 01/15/14 | | | 2,790 | | | | 2,824,875 |
Terex Corp., Sr. Sub. Notes | | Ba3 | | 8.00% | | 11/15/17 | | | 5,000 | | | | 5,062,500 |
United Rentals North America, Inc., Gtd. Notes | | B1 | | 6.50% | | 02/15/12 | | | 1,420 | | | | 1,288,650 |
United Rentals North America, Inc., Sr. Sub. Notes | | B3 | | 7.75% | | 11/15/13 | | | 3,150 | | | | 2,740,500 |
Valmont Industries, Inc., Gtd. Notes | | Ba3 | | 6.875% | | 05/01/14 | | | 4,920 | | | | 4,870,800 |
| | | | | | | | | | | | |
|
|
| | | | | | | | | | | | | | 126,302,823 |
| | | | | | | | | | | | |
|
|
Chemicals — 2.6% | | | | | | | | | | | | | |
Arco Chemical Co., Debs. | | B3 | | 10.25% | | 11/01/10 | | | 1,000 | | | | 1,040,000 |
Hercules, Inc., Gtd. Notes | | Ba3 | | 6.75% | | 10/15/29 | | | 5,500 | | | | 5,293,750 |
Huntsman International LLC, Gtd. Notes | | Ba1 | | 11.625% | | 10/15/10 | | | 5,301 | | | | 5,619,060 |
Ineos Group Holdings PLC, Notes (United Kingdom), 144A(b) | | B3 | | 8.50% | | 02/15/16 | | | 1,700 | | | | 1,513,000 |
Koppers, Inc., Gtd. Notes | | B2 | | 9.875% | | 10/15/13 | | | 8,380 | | | | 8,819,950 |
Momentive Performance Materials, Inc., Sr. Notes, 144A(b) | | B3 | | 9.75% | | 12/01/14 | | | 6,810 | | | | 6,265,200 |
Momentive Performance Materials, Inc., Sr. Sub. Notes, 144A(b) | | Caa2 | | 11.50% | | 12/01/16 | | | 2,650 | | | | 2,292,250 |
Mosaic Co., Sr. Notes, 144A(b) | | Ba1 | | 7.625% | | 12/01/14 | | | 2,375 | | | | 2,541,250 |
Mosaic Co., Sr. Notes, 144A(b) | | Ba1 | | 7.875% | | 12/01/16 | | | 2,375 | | | | 2,565,000 |
Nalco Co., Sr. Notes | | B1 | | 7.75% | | 11/15/11 | | | 5,480 | | | | 5,548,500 |
Nalco Co., Sr. Sub. Notes(b) | | B3 | | 8.875% | | 11/15/13 | | | 1,720 | | | | 1,793,100 |
| | | | | | | | | | | | |
|
|
| | | | | | | | | | | | | | 43,291,060 |
| | | | | | | | | | | | |
|
|
SEE NOTES TO FINANCIAL STATEMENTS.
A114
| | | | |
| | | HIGH YIELD BOND PORTFOLIO (Continued) | | |
SCHEDULE OF INVESTMENTS | December 31, 2007 |
| | | | | | | | | | | | |
CORPORATE BONDS
(continued) | | Moody’s
Rating
(Unaudited)
| | Interest
Rate
| | Maturity
Date
| | Principal
Amount
(000)
| | Value
(Note 2)
|
| | | | | | | | | | | | | |
Consumer — 2.3% | | | | | | | | | | | | |
Levi Strauss & Co., Sr. Unsub. Notes(b) | | B2 | | 9.75% | | 01/15/15 | | $ | 4,870 | | $ | 4,857,825 |
Mac-Gray Corp., Sr. Notes | | B2 | | 7.625% | | 08/15/15 | | | 2,950 | | | 2,876,250 |
Realogy Corp., Sr. Notes, 144A(b) | | Caa1 | | 10.50% | | 04/15/14 | | | 1,950 | | | 1,457,625 |
Realogy Corp., Sr. Notes, PIK, 144A(b) | | Caa1 | | 11.00% | | 04/15/14 | | | 8,200 | | | 5,699,000 |
Realogy Corp., Sr. Sub. Notes, 144A | | Caa2 | | 12.375% | | 04/15/15 | | | 19,050 | | | 12,001,500 |
Service Corp. International, Debs. | | B1 | | 7.875% | | 02/01/13 | | | 2,000 | | | 2,010,550 |
Service Corp. International, Sr. Notes | | B1 | | 6.75% | | 04/01/16 | | | 4,975 | | | 4,788,438 |
Service Corp. International, Sr. Notes | | B1 | | 7.00% | | 06/15/17 | | | 2,100 | | | 2,010,750 |
Stewart Enterprises, Inc., Sr. Notes | | Ba3 | | 6.25% | | 02/15/13 | | | 3,450 | | | 3,243,000 |
| | | | | | | | | | | |
|
|
| | | | | | | | | | | | | 38,944,938 |
| | | | | | | | | | | |
|
|
Electric — 8.8% | | | | | | | | | | | | |
AES Corp., Sec’d. Notes, 144A | | Ba3 | | 8.75% | | 05/15/13 | | | 3,550 | | | 3,705,313 |
AES Corp., Sr. Notes(b) | | B1 | | 9.375% | | 09/15/10 | | | 6,700 | | | 7,035,000 |
AES Corp., Sr. Notes(b) | | B1 | | 9.50% | | 06/01/09 | | | 1,805 | | | 1,868,175 |
AES Eastern Energy LP, Pass-thru-Certs.,
Ser. 99-A(f) | | Ba1 | | 9.00% | | 01/02/17 | | | 2,758 | | | 2,985,907 |
Ser. 99-B(f) | | Ba1 | | 9.67% | | 01/02/29 | | | 2,000 | | | 2,380,000 |
CMS Energy Corp., Sr. Notes(b) | | Ba1 | | 8.50% | | 04/15/11 | | | 1,310 | | | 1,411,145 |
Dynegy Holdings, Inc., Debs. | | B2 | | 7.125% | | 05/15/18 | | | 675 | | | 597,375 |
Dynegy Holdings, Inc., Sr. Notes | | B2 | | 6.875% | | 04/01/11 | | | 528 | | | 509,520 |
Dynegy Holdings, Inc., Sr. Unsec’d. Notes | | B2 | | 7.50% | | 06/01/15 | | | 3,575 | | | 3,342,625 |
Dynegy Holdings, Inc., Sr. Unsec’d. Notes(b) | | B2 | | 8.375% | | 05/01/16 | | | 5,370 | | | 5,249,175 |
Edison Mission Energy, Sr. Unsec’d. Notes | | B1 | | 7.00% | | 05/15/17 | | | 7,500 | | | 7,368,749 |
Edison Mission Energy, Sr. Unsec’d. Notes | | B1 | | 7.625% | | 05/15/27 | | | 855 | | | 803,700 |
Edison Mission Energy, Sr. Unsec’d. Notes | | B1 | | 7.75% | | 06/15/16 | | | 3,750 | | | 3,862,500 |
Energy Future Holdings Corp., Gtd. Notes, 144A(b) | | B3 | | 10.875% | | 11/01/17 | | | 5,675 | | | 5,703,375 |
Energy Future Holdings Corp., Ser. C, Sr. Unsec’d. Notes | | Caa1 | | 6.375% | | 01/01/08 | | | 4,000 | | | 3,999,895 |
Intergen NV, Sec’d. Notes (Netherlands), 144A
(cost $6,224,110; purchased 7/23/07-9/06/07)(b)(k) | | Ba3 | | 9.00% | | 06/30/17 | | | 6,275 | | | 6,604,438 |
Midwest Generation LLC, Pass-thru Certs.,
Ser. A | | Baa3 | | 8.30% | | 07/02/09 | | | 2,885 | | | 2,927,946 |
Ser. B | | Baa3 | | 8.56% | | 01/02/16 | | | 1,102 | | | 1,176,317 |
Mirant Americas Generation LLC, Sr. Notes | | B3 | | 8.30% | | 05/01/11 | | | 7,075 | | | 7,092,688 |
Mirant Corp., Sr. Notes, 144A(c)(f) | | NR | | 7.40% | | 07/15/49 | | | 1,825 | | | 1,825 |
Mirant North America LLC, Sr. Notes(b) | | B1 | | 7.375% | | 12/31/13 | | | 2,605 | | | 2,611,513 |
Nevada Power Co., Gen Ref. Mtge. Notes, Ser. A | | Baa3 | | 8.25% | | 06/01/11 | | | 1,675 | | | 1,819,345 |
NRG Energy, Inc., Bank Loan(f) | | Ba1 | | 6.48% | | 02/01/13 | | | 2,343 | | | 2,232,337 |
NRG Energy, Inc., Bank Loan(f) | | Ba1 | | 6.58% | | 02/01/13 | | | 5,074 | | | 4,835,082 |
NRG Energy, Inc., Gtd. Notes | | B1 | | 7.375% | | 02/01/16 | | | 10,250 | | | 9,993,749 |
NRG Energy, Inc., Gtd. Notes | | B1 | | 7.375% | | 02/15/17 | | | 4,300 | | | 4,192,500 |
Orion Power Holdings, Inc., Sr. Notes | | B2 | | 12.00% | | 05/01/10 | | | 5,355 | | | 5,836,950 |
Reliant Energy Mid-Atlantic Power Holdings LLC, Pass-thru Certs.,
Ser. B(f) | | Ba2 | | 9.237% | | 07/02/17 | | | 1,562 | | | 1,632,683 |
Ser. C(f) | | Ba2 | | 9.681% | | 07/02/26 | | | 250 | | | 271,563 |
Sierra Pacific Resources, Inc., Sr. Notes(b) | | Ba3 | | 8.625% | | 03/15/14 | | | 1,530 | | | 1,634,854 |
Texas Competitive Electric Holdings Co. LLC, Bank Loan(f) | | Ba3 | | Zero% | | 10/10/14 | | | 30,000 | | | 29,466,479 |
Texas Competitive Electric Holdings Co. LLC, Gtd. Notes, 144A(b) | | B3 | | 10.25% | | 11/01/15 | | | 3,000 | | | 2,970,000 |
Texas Competitive Electric Holdings Co. LLC, Gtd. Notes, 144A | | B3 | | 10.25% | | 11/01/15 | | | 11,575 | | | 11,459,249 |
| | | | | | | | | | | |
|
|
| | | | | | | | | | | | | 147,581,972 |
| | | | | | | | | | | |
|
|
Energy – Integrated — 0.2% | | | | | | | | | | | | |
TNK-BP Finance SA, Gtd. Notes (Luxembourg), 144A | | Baa2 | | 7.50% | | 07/18/16 | | | 3,000 | | | 2,906,250 |
| | | | | | | | | | | |
|
|
Energy – Other — 3.4% | | | | | | | | | | |
Chesapeake Energy Corp., Gtd. Notes | | Ba3 | | 6.50% | | 08/15/17 | | | 1,275 | | | 1,230,375 |
Chesapeake Energy Corp., Gtd. Notes(b) | | Ba3 | | 7.75% | | 01/15/15 | | | 1,604 | | | 1,636,080 |
Chesapeake Energy Corp., Sr. Notes | | Ba3 | | 6.375% | | 06/15/15 | | | 3,950 | | | 3,821,625 |
Chesapeake Energy Corp., Sr. Notes(b) | | Ba3 | | 7.00% | | 08/15/14 | | | 2,350 | | | 2,361,750 |
Compagnie Generale De Geophysique-Veritas, Gtd. Notes (France) | | Ba3 | | 7.50% | | 05/15/15 | | | 780 | | | 789,750 |
SEE NOTES TO FINANCIAL STATEMENTS.
A115
| | | | |
| | | HIGH YIELD BOND PORTFOLIO (Continued) | | |
SCHEDULE OF INVESTMENTS | December 31, 2007 |
| | | | | | | | | | | | |
CORPORATE BONDS
(continued) | | Moody’s
Rating
(Unaudited)
| | Interest
Rate
| | Maturity
Date
| | Principal
Amount
(000)
| | Value
(Note 2)
|
| | | | | | | | | | | | | |
Energy – Other (continued) | | | | | | | | | | |
Forest Oil Corp., Sr. Notes, 144A(b) | | B1 | | 7.25% | | 06/15/19 | | $ | 4,000 | | $ | 4,020,000 |
Forest Oil Corp., Sr. Notes | | B1 | | 8.00% | | 06/15/08 | | | 440 | | | 444,400 |
McMoran Exploration Co., Gtd. Notes | | Caa1 | | 11.875% | | 11/15/14 | | | 4,250 | | | 4,265,938 |
Newfield Exploration Co., Sr. Sub. Notes | | Ba3 | | 6.625% | | 09/01/14 | | | 4,175 | | | 4,133,250 |
Newfield Exploration Co., Sr. Sub. Notes | | Ba3 | | 6.625% | | 04/15/16 | | | 3,600 | | | 3,528,000 |
Parker Drilling Co., Sr. Notes | | B2 | | 9.625% | | 10/01/13 | | | 4,030 | | | 4,281,875 |
Petrohawk Energy Corp., Gtd. Notes | | B3 | | 9.125% | | 07/15/13 | | | 5,525 | | | 5,815,062 |
Petroplus Finance Ltd., Gtd. Notes (Bermuda), 144A(b) | | B1 | | 6.75% | | 05/01/14 | | | 2,850 | | | 2,654,063 |
Petroplus Finance Ltd., Gtd. Notes (Bermuda), 144A | | B1 | | 7.00% | | 05/01/17 | | | 1,675 | | | 1,532,625 |
Pioneer Natural Resources Co., Sr. Notes | | Ba1 | | 5.875% | | 07/15/16 | | | 1,950 | | | 1,795,057 |
Pioneer Natural Resources Co., Sr. Unsec’d. Notes | | Ba1 | | 6.65% | | 03/15/17 | | | 6,430 | | | 6,200,872 |
Plains Exploration & Production Co., Gtd. Notes | | B1 | | 7.00% | | 03/15/17 | | | 1,000 | | | 956,250 |
Plains Exploration & Production Co., Gtd. Notes | | B1 | | 7.75% | | 06/15/15 | | | 1,800 | | | 1,800,000 |
Pride International, Inc., Sr. Unsec’d. Notes | | Ba2 | | 7.375% | | 07/15/14 | | | 1,525 | | | 1,566,938 |
Tesoro Corp., Gtd. Notes | | Ba1 | | 6.25% | | 11/01/12 | | | 55 | | | 55,000 |
Tesoro Corp., Gtd. Notes | | Ba1 | | 6.50% | | 06/01/17 | | | 2,150 | | | 2,128,500 |
Tesoro Corp., Gtd. Notes | | Ba1 | | 6.625% | | 11/01/15 | | | 1,175 | | | 1,163,250 |
| | | | | | | | | | | |
|
|
| | | | | | | | | | | | | 56,180,660 |
| | | | | | | | | | | |
|
|
Foods — 2.1% | | | | | | | | | | | | |
Ahold Finance USA, Inc., Gtd. Notes(b) | | Baa3 | | 6.875% | | 05/01/29 | | | 1,780 | | | 1,874,854 |
Ahold Finance USA, Inc., Notes | | Baa3 | | 8.25% | | 07/15/10 | | | 1,120 | | | 1,217,558 |
Albertson’s LLC, Debs.(b) | | B1 | | 7.45% | | 08/01/29 | | | 3,775 | | | 3,633,207 |
Albertson’s LLC, Debs. | | B1 | | 8.70% | | 05/01/30 | | | 2,050 | | | 2,184,045 |
Aramark Corp., Sr. Notes(b) | | B3 | | 8.50% | | 02/01/15 | | | 8,500 | | | 8,606,250 |
Carrols Corp., Gtd. Notes | | B3 | | 9.00% | | 01/15/13 | | | 500 | | | 455,000 |
Del Monte Corp., Sr. Sub. Notes | | B2 | | 8.625% | | 12/15/12 | | | 625 | | | 629,688 |
Dole Food Co., Inc., Gtd. Notes | | Caa1 | | 7.25% | | 06/15/10 | | | 1,757 | | | 1,598,870 |
National Beef Packing Co. LLC, Sr. Notes | | Caa1 | | 10.50% | | 08/01/11 | | | 4,284 | | | 4,069,800 |
Pathmark Stores, Inc., Gtd. Notes | | Caa2 | | 8.75% | | 02/01/12 | | | 1,590 | | | 1,636,380 |
Smithfield Foods, Inc., Sr. Notes, Ser. B | | Ba3 | | 8.00% | | 10/15/09 | | | 2,040 | | | 2,060,400 |
Stater Brothers Holdings, Sr. Notes | | B2 | | 7.75% | | 04/15/15 | | | 3,500 | | | 3,377,500 |
Stater Brothers Holdings, Sr. Notes | | B2 | | 8.125% | | 06/15/12 | | | 2,890 | | | 2,853,875 |
Supervalu, Inc., Sr. Notes(b) | | B1 | | 7.50% | | 11/15/14 | | | 1,625 | | | 1,665,625 |
| | | | | | | | | | | |
|
|
| | | | | | | | | | | | | 35,863,052 |
| | | | | | | | | | | |
|
|
Gaming — 5.7% | | | | | | | | | | | | |
Boyd Gaming Corp., Sr. Sub. Notes | | B1 | | 6.75% | | 04/15/14 | | | 3,559 | | | 3,389,948 |
Caesars Entertainment, Inc., Sr. Sub. Notes(b) | | Ba1 | | 8.125% | | 05/15/11 | | | 4,430 | | | 4,119,900 |
CCM Merger, Inc., Notes, 144A | | B3 | | 8.00% | | 08/01/13 | | | 9,940 | | | 9,368,449 |
Downstream Development Authority of the Quapaw Tribe of Oklahoma, Sr. Notes, 144A | | B3 | | 12.00% | | 10/15/15 | | | 3,050 | | | 2,851,750 |
Fontainebleau Las Vegas Holdings LLC, Mortgage Backed, 144A(b) | | Caa1 | | 10.25% | | 06/15/15 | | | 7,750 | | | 6,723,125 |
Harrah’s Operating Co., Inc., Gtd. Notes | | Baa3 | | 5.50% | | 07/01/10 | | | 1,200 | | | 1,116,000 |
Harrah’s Operating Co., Inc., Gtd. Notes | | Baa3 | | 5.625% | | 06/01/15 | | | 5,010 | | | 3,657,300 |
Harrah’s Operating Co., Inc., Gtd. Notes | | Baa3 | | 6.50% | | 06/01/16 | | | 775 | | | 577,375 |
Isle of Capri Casinos, Inc., Sr. Sub. Notes | | B3 | | 7.00% | | 03/01/14 | | | 1,750 | | | 1,435,000 |
Mandalay Resort Group, Sr. Notes | | Ba2 | | 9.50% | | 08/01/08 | | | 845 | | | 861,900 |
Mandalay Resort Group, Sr. Sub. Notes | | B1 | | 9.375% | | 02/15/10 | | | 581 | | | 601,335 |
MGM Mirage, Inc., Gtd. Notes | | Ba2 | | 6.00% | | 10/01/09 | | | 7,965 | | | 7,925,174 |
MGM Mirage, Inc., Gtd. Notes | | Ba2 | | 6.875% | | 04/01/16 | | | 3,000 | | | 2,827,500 |
MGM Mirage, Inc., Gtd. Notes | | Ba2 | | 7.50% | | 06/01/16 | | | 6,000 | | | 5,940,000 |
MGM Mirage, Inc., Gtd. Notes(b) | | Ba2 | | 7.625% | | 01/15/17 | | | 2,225 | | | 2,197,188 |
MGM Mirage, Inc., Gtd. Notes(b) | | B1 | | 8.375% | | 02/01/11 | | | 5,967 | | | 6,101,258 |
MGM Mirage, Inc., Gtd. Notes | | Ba2 | | 8.50% | | 09/15/10 | | | 1,200 | | | 1,245,000 |
MGM Mirage, Inc., Sr. Notes | | Ba2 | | 5.875% | | 02/27/14 | | | 2,750 | | | 2,516,250 |
MGM Mirage, Inc., Sr. Notes | | Ba2 | | 6.75% | | 09/01/12 | | | 750 | | | 730,313 |
Mohegan Tribal Gaming Authority, Sr. Notes | | Baa3 | | 6.125% | | 02/15/13 | | | 3,750 | | | 3,665,625 |
Mohegan Tribal Gaming Authority, Sr. Sub. Notes | | Ba2 | | 8.00% | | 04/01/12 | | | 2,845 | | | 2,887,675 |
Mohegan Tribal Gaming Authority, Sr. Sub. Notes | | Ba2 | | 8.375% | | 07/01/11 | | | 400 | | | 406,000 |
SEE NOTES TO FINANCIAL STATEMENTS.
A116
| | | | |
| | | HIGH YIELD BOND PORTFOLIO (Continued) | | |
SCHEDULE OF INVESTMENTS | December 31, 2007 |
| | | | | | | | | | | | |
CORPORATE BONDS
(continued) | | Moody’s
Rating
(Unaudited)
| | Interest
Rate
| | Maturity
Date
| | Principal
Amount
(000)
| | Value
(Note 2)
|
| | | | | | | | | | | | | |
Gaming (continued) | | | | | | | | | | | | |
River Rock Entertainment Authority (The), Sec’d. Notes | | B2 | | 9.75% | | 11/01/11 | | $ | 1,000 | | $ | 1,045,000 |
Seneca Gaming Corp., Sr. Unsec’d. Notes, Ser. B | | Ba2 | | 7.25% | | 05/01/12 | | | 5,125 | | | 5,163,438 |
Shingle Springs Tribal Gaming Authority, Sr. Notes, 144A | | B3 | | 9.375% | | 06/15/15 | | | 5,523 | | | 5,357,310 |
Station Casinos, Inc., Sr. Notes | | B2 | | 6.00% | | 04/01/12 | | | 4,960 | | | 4,414,400 |
Station Casinos, Inc., Sr. Sub. Notes(b) | | Caa1 | | 6.50% | | 02/01/14 | | | 3,650 | | | 2,737,500 |
Station Casinos, Inc., Sr. Sub. Notes(b) | | Caa1 | | 6.625% | | 03/15/18 | | | 2,200 | | | 1,507,000 |
Station Casinos, Inc., Sr. Unsec’d. Notes | | B2 | | 7.75% | | 08/15/16 | | | 200 | | | 180,500 |
Tropicana Entertainment LLC, Sr. Sub. Notes(b) | | Caa3 | | 9.625% | | 12/15/14 | | | 6,700 | | | 4,254,500 |
| | | | | | | | | | | |
|
|
| | | | | | | | | | | | | 95,803,713 |
| | | | | | | | | | | |
|
|
Healthcare & Pharmaceutical — 11.1% | | | | | | | | | | | | |
Accellent, Inc., Gtd. Notes | | Caa3 | | 10.50% | | 12/01/13 | | | 15,088 | | | 12,673,919 |
Alliance Imaging, Inc., Sr. Sub. Notes, 144A | | B3 | | 7.25% | | 12/15/12 | | | 4,805 | | | 4,564,750 |
Alliance Imaging, Inc., Sr. Sub. Notes | | B3 | | 7.25% | | 12/15/12 | | | 2,775 | | | 2,636,250 |
Columbia/HCA Healthcare Corp., Debs. | | Caa1 | | 7.50% | | 12/15/23 | | | 600 | | | 491,329 |
Columbia/HCA Healthcare Corp., MTN | | Caa1 | | 8.70% | | 02/10/10 | | | 1,800 | | | 1,804,693 |
Columbia/HCA Healthcare Corp., MTN | | Caa1 | | 9.00% | | 12/15/14 | | | 4,365 | | | 4,207,812 |
Community Health Systems, Inc., Bank Loan(f) | | Ba3 | | Zero | | 07/25/14 | | | 464 | | | 446,008 |
Community Health Systems, Inc., Bank Loan(f) | | Ba3 | | 7.493% | | 07/25/14 | | | 9,227 | | | 8,868,114 |
Community Health Systems, Inc., Gtd. Notes | | B3 | | 8.875% | | 07/15/15 | | | 11,800 | | | 12,021,249 |
Concentra, Inc., Bank Loan(f) | | Caa1 | | 10.86% | | 06/25/15 | | | 2,000 | | | 1,840,000 |
Davita, Inc., Gtd. Notes | | B1 | | 6.625% | | 03/15/13 | | | 1,400 | | | 1,393,000 |
Elan Finance PLC, Gtd. Notes (Ireland)(h) | | B3 | | 8.8688% | | 11/15/11 | | | 1,020 | | | 969,000 |
Elan Finance PLC, Sr. Notes (Ireland) | | B3 | | 7.75% | | 11/15/11 | | | 4,800 | | | 4,512,000 |
Elan Finance PLC, Sr. Unsec’d. Notes (Ireland) | | B3 | | 8.875% | | 12/01/13 | | | 4,500 | | | 4,432,500 |
Hanger Orthopedic Group, Inc., Sr. Notes | | Caa1 | | 10.25% | | 06/01/14 | | | 4,500 | | | 4,612,500 |
HCA, Inc., Bank Loan(f) | | Ba3 | | 7.08% | | 11/17/13 | | | 16,209 | | | 15,597,275 |
HCA, Inc., Sec’d. Notes | | B2 | | 9.125% | | 11/15/14 | | | 1,000 | | | 1,040,000 |
HCA, Inc., Sec’d. Notes | | B2 | | 9.25% | | 11/15/16 | | | 6,875 | | | 7,218,750 |
HCA, Inc., Sec’d. Notes, PIK(b) | | B2 | | 9.625% | | 11/15/16 | | | 11,025 | | | 11,658,938 |
HCA, Inc., Sr. Unsec’d. Notes | | Caa1 | | 8.75% | | 09/01/10 | | | 2,200 | | | 2,219,250 |
LVB Acquisition Merger Sub., Inc., Gtd. Notes, 144A(b) | | B3 | | 10.00% | | 10/15/17 | | | 6,200 | | | 6,324,000 |
LVB Acquisition Merger Sub., Inc., Gtd. Notes, 144A | | Caa1 | | 11.625% | | 10/15/17 | | | 7,950 | | | 7,830,750 |
Medco Health Solutions, Inc., Sr. Notes | | Baa3 | | 7.25% | | 08/15/13 | | | 455 | | | 498,431 |
Mylan, Inc., Bank Loan(f) | | B1 | | 8.191% | | 12/20/14 | | | 7,500 | | | 7,417,185 |
Omega Healthcare Investors, Inc., Gtd. Notes | | Ba3 | | 7.00% | | 04/01/14 | | | 500 | | | 495,000 |
Omnicare, Inc., Sr. Sub. Notes | | Ba3 | | 6.125% | | 06/01/13 | | | 2,500 | | | 2,325,000 |
PTS Acquisition Corp., Bank Loan(f) | | Ba3 | | 7.4481% | | 04/10/14 | | | 6,965 | | | 6,475,649 |
PTS Acquisition Corp., Sr. Notes, PIK, 144A(b) | | Caa1 | | 9.50% | | 04/15/15 | | | 5,525 | | | 5,124,438 |
Res-Care, Inc., Sr. Notes(f) | | B1 | | 7.75% | | 10/15/13 | | | 4,800 | | | 4,752,000 |
Select Medical Corp., Gtd. Notes(b) | | B3 | | 7.625% | | 02/01/15 | | | 1,925 | | | 1,645,875 |
Senior Housing Properties Trust, Sr. Notes | | Ba1 | | 7.875% | | 04/15/15 | | | 3,300 | | | 3,442,976 |
Senior Housing Properties Trust, Sr. Notes | | Ba1 | | 8.625% | | 01/15/12 | | | 3,730 | | | 3,953,800 |
Skilled Healthcare Group, Inc., Sr. Sub. Notes | | Caa1 | | 11.00% | | 01/15/14 | | | 6,957 | | | 7,443,990 |
Sun Healthcare Group, Inc., Gtd. Notes | | B3 | | 9.125% | | 04/15/15 | | | 1,950 | | | 1,964,625 |
Surgical Care Affiliates, Inc., Sr. Sub. Notes, 144A
(cost $4,149,333; purchased 6/21/07- 12/19/07)(b)(k) | | Caa1 | | 10.00% | | 07/15/17 | | | 4,300 | | | 3,913,000 |
Ventas Realty LP, Gtd. Notes | | Ba1 | | 7.125% | | 06/01/15 | | | 1,550 | | | 1,565,500 |
Ventas Realty LP, Gtd. Notes | | Ba1 | | 8.75% | | 05/01/09 | | | 1,400 | | | 1,435,000 |
Ventas Realty LP, Gtd. Notes | | Ba1 | | 9.00% | | 05/01/12 | | | 3,648 | | | 3,921,600 |
Viant Holdings, Inc., Gtd Notes, 144A | | Caa1 | | 10.125% | | 07/15/17 | | | 13,517 | | | 12,368,054 |
| | | | | | | | | | | |
|
|
| | | | | | | | | | | | | 186,104,210 |
| | | | | | | | | | | |
|
|
Healthcare Insurance — 0.1% | | | | | | | | | | | | |
Coventry Health Care, Inc., Sr. Notes(b) | | Ba1 | | 6.125% | | 01/15/15 | | | 1,000 | | | 1,003,483 |
| | | | | | | | | | | |
|
|
Lodging — 1.5% | | | | | | | | | | | | |
Felcor Lodging LP, Gtd. Notes(b) | | Ba3 | | 8.50% | | 06/01/11 | | | 6,275 | | | 6,541,688 |
Gaylord Entertainment Co., Sr. Notes | | B3 | | 8.00% | | 11/15/13 | | | 155 | | | 154,225 |
SEE NOTES TO FINANCIAL STATEMENTS.
A117
| | | | |
| | | HIGH YIELD BOND PORTFOLIO (Continued) | | |
SCHEDULE OF INVESTMENTS | December 31, 2007 |
| | | | | | | | | | | | |
CORPORATE BONDS
(continued) | | Moody’s
Rating
(Unaudited)
| | Interest
Rate
| | Maturity
Date
| | Principal
Amount
(000)
| | Value
(Note 2)
|
| | | | | | | | | | | | | |
Lodging (continued) | | | | | | | | | | | | |
Host Hotels & Resorts, Sr. Notes(b) | | BB(g) | | 6.875% | | 11/01/14 | | $ | 925 | | $ | 920,375 |
Host Marriott LP, Sr. Notes | | Ba1 | | 6.75% | | 06/01/16 | | | 5,100 | | | 5,023,500 |
Host Marriott LP, Sr. Notes(b) | | Ba1 | | 7.125% | | 11/01/13 | | | 3,890 | | | 3,919,175 |
Host Marriott LP, Sr. Notes, Ser. M | | Ba1 | | 7.00% | | 08/15/12 | | | 8,150 | | | 8,149,999 |
Royal Caribbean Cruises, Ltd., Sr. Notes (Liberia) | | Ba1 | | 8.75% | | 02/02/11 | | | 1,150 | | | 1,199,087 |
| | | | | | | | | | | |
|
|
| | | | | | | | | | | | | 25,908,049 |
| | | | | | | | | | | |
|
|
Media & Entertainment — 7.1% | | | | | | | | | | | | |
AMC Entertainment, Inc., Gtd Notes(b) | | B2 | | 11.00% | | 02/01/16 | | | 2,465 | | | 2,594,413 |
AMC Entertainment, Inc., Gtd. Notes, Ser. B | | Ba3 | | 8.625% | | 08/15/12 | | | 2,125 | | | 2,167,500 |
AMC Entertainment, Inc., Sr. Sub. Notes | | B2 | | 8.00% | | 03/01/14 | | | 675 | | | 634,500 |
Cinemark, Inc., Sr. Disc. Notes(j) | | B3 | | 9.75% | | 03/15/14 | | | 1,855 | | | 1,727,469 |
Clear Channel Communications, Inc., Debs. | | Baa3 | | 6.875% | | 06/15/18 | | | 625 | | | 501,349 |
Clear Channel Communications, Inc., Sr. Notes | | Baa3 | | 5.50% | | 09/15/14 | | | 1,735 | | | 1,322,478 |
Clear Channel Communications, Inc., Sr. Notes | | Baa3 | | 5.75% | | 01/15/13 | | | 4,725 | | | 3,912,480 |
CMP Susquehanna Corp., Gtd. Notes | | Caa1 | | 9.875% | | 05/15/14 | | | 2,550 | | | 1,912,500 |
Dex Media West LLC, Sr. Sub. Notes, Ser. B | | B1 | | 9.875% | | 08/15/13 | | | 7,725 | | | 8,033,999 |
Dex Media, Inc., Notes | | B2 | | 8.00% | | 11/15/13 | | | 2,825 | | | 2,655,500 |
DirecTV Holdings LLC, Gtd. Notes | | Ba3 | | 6.375% | | 06/15/15 | | | 3,659 | | | 3,512,640 |
DirecTV Holdings LLC, Sr. Notes | | Ba3 | | 8.375% | | 03/15/13 | | | 425 | | | 442,000 |
Echostar DBS Corp., Gtd. Notes | | Ba3 | | 6.625% | | 10/01/14 | | | 4,675 | | | 4,651,625 |
Echostar DBS Corp., Gtd. Notes | | Ba3 | | 7.00% | | 10/01/13 | | | 1,075 | | | 1,085,750 |
Echostar DBS Corp., Gtd. Notes | | Ba3 | | 7.125% | | 02/01/16 | | | 8,050 | | | 8,210,999 |
Idearc, Inc., Bank Loan(f) | | Ba2 | | 6.83% | | 11/17/14 | | | 8,280 | | | 7,877,139 |
Idearc, Inc., Sr. Notes | | B2 | | 8.00% | | 11/15/16 | | | 5,115 | | | 4,693,013 |
Intelsat Bermuda Ltd., Gtd. Notes (Bermuda) | | B2 | | 9.25% | | 06/15/16 | | | 2,475 | | | 2,487,375 |
Intelsat Bermuda Ltd., Sr. Notes (Bermuda) | | Caa1 | | 11.25% | | 06/15/16 | | | 10,660 | | | 11,006,449 |
Intelsat Ltd., Sr. Unsec’d. Notes (Bermuda)(b) | | Caa1 | | 5.25% | | 11/01/08 | | | 1,700 | | | 1,678,750 |
Intelsat Subsidiary Holding Co., Ltd., Sr. Notes (Bermuda) | | B2 | | 8.25% | | 01/15/13 | | | 7,610 | | | 7,648,050 |
Medianews Group, Inc., Sr. Sub. Notes | | B3 | | 6.375% | | 04/01/14 | | | 2,375 | | | 1,425,000 |
Medianews Group, Inc., Sr. Sub. Notes | | B3 | | 6.875% | | 10/01/13 | | | 1,375 | | | 859,375 |
Morris Publishing Group LLC, Gtd. Notes | | B1 | | 7.00% | | 08/01/13 | | | 1,050 | | | 762,563 |
Quebecor Media, Inc., Notes, 144A (Canada) | | B2 | | 7.75% | | 03/15/16 | | | 2,550 | | | 2,448,000 |
Quebecor Media, Inc., Sr. Notes (Canada)(b) | | B2 | | 7.75% | | 03/15/16 | | | 2,930 | | | 2,812,800 |
R.H. Donnelley Corp., Sr. Disc. Notes, Ser. A-1 | | B3 | | 6.875% | | 01/15/13 | | | 1,300 | | | 1,163,500 |
R.H. Donnelley Corp., Sr. Disc. Notes, Ser. A-2 | | B3 | | 6.875% | | 01/15/13 | | | 7,700 | | | 6,891,500 |
R.H. Donnelley Corp., Sr. Notes, 144A(b) | | B3 | | 8.875% | | 10/15/17 | | | 2,000 | | | 1,850,000 |
R.H. Donnelley Corp., Sr. Notes, Ser. A-3(b) | | B3 | | 8.875% | | 01/15/16 | | | 1,310 | | | 1,224,850 |
Radio One, Inc., Gtd. Notes, Ser. B(b) | | B3 | | 8.875% | | 07/01/11 | | | 3,400 | | | 3,183,250 |
Rainbow National Services LLC, Sr. Notes, 144A | | B2 | | 8.75% | | 09/01/12 | | | 2,000 | | | 2,057,500 |
Rainbow National Services LLC, Sr. Sub. Debs., 144A | | B3 | | 10.375% | | 09/01/14 | | | 205 | | | 222,169 |
Universal City Florida Holding Co. I/II, Sr. Notes | | B3 | | 8.375% | | 05/01/10 | | | 4,050 | | | 4,070,250 |
Univision Communications, Inc., Bank Loan(f) | | Ba3 | | 7.45% | | 09/29/14 | | | 134 | | | 122,204 |
Univision Communications, Inc., Bank Loan(f) | | Ba3 | | 7.207% | | 09/29/14 | | | 3,866 | | | 3,519,464 |
Univision Communications, Inc., Sr. Notes, PIK, 144A(b) | | B3 | | 9.75% | | 03/15/15 | | | 7,680 | | | 6,998,400 |
| | | | | | | | | | | |
|
|
| | | | | | | | | | | | | 118,366,803 |
| | | | | | | | | | | |
|
|
Metals — 4.9% | | | | | | | | | | | | |
AK Steel Corp., Gtd. Notes(b) | | B1 | | 7.75% | | 06/15/12 | | | 5,242 | | | 5,268,210 |
Aleris International, Inc., Sr. Notes, PIK | | B3 | | 9.00% | | 12/15/14 | | | 2,200 | | | 1,837,000 |
Aleris International, Inc., Sr. Sub. Notes(b) | | Caa1 | | 10.00% | | 12/15/16 | | | 2,100 | | | 1,701,000 |
Arch Western Finance LLC, Sr. Notes | | B1 | | 6.75% | | 07/01/13 | | | 3,085 | | | 2,992,450 |
Century Aluminum Co., Gtd. Notes | | B1 | | 7.50% | | 08/15/14 | | | 3,952 | | | 3,892,720 |
CSN Islands VII Corp., Gtd. Notes (Cayman Islands), 144A | | BB(g) | | 10.75% | | 09/12/08 | | | 4,945 | | | 5,093,350 |
FMG Finance Pty Ltd., Sec’d. Notes (Australia), 144A
(cost $4,624,450; purchased 4/23/07- 7/19/07)(b)(k) | | B1 | | 10.625% | | 09/01/16 | | | 3,900 | | | 4,465,500 |
Freeport-McMoRan Copper & Gold, Inc., Sr. Unsec’d. Notes(b) | | Ba3 | | 8.375% | | 04/01/17 | | | 10,425 | | | 11,180,812 |
Freeport-McMoRan Copper & Gold, Inc., Sr. Unsec’d. Notes(h) | | Ba3 | | 8.394% | | 04/01/15 | | | 3,500 | | | 3,552,500 |
Gerdau AmeriSteel Corp., Sr. Notes | | Ba1 | | 10.375% | | 07/15/11 | | | 4,225 | | | 4,446,813 |
SEE NOTES TO FINANCIAL STATEMENTS.
A118
| | | | |
| | | HIGH YIELD BOND PORTFOLIO (Continued) | | |
SCHEDULE OF INVESTMENTS | December 31, 2007 |
| | | | | | | | | | | | |
CORPORATE BONDS
(continued) | | Moody’s
Rating
(Unaudited)
| | Interest
Rate
| | Maturity
Date
| | Principal
Amount
(000)
| | Value
(Note 2)
|
| | | | | | | | | | | | | |
Metals (continued) | | | | | | | | | | | | |
Ispat Inland ULC, Sec’d. Notes (Canada) | | Baa3 | | 9.75% | | 04/01/14 | | $ | 8,165 | | $ | 8,846,484 |
Metals USA, Inc., Sec’d. Notes | | B3 | | 11.125% | | 12/01/15 | | | 9,575 | | | 9,910,124 |
Novelis, Inc., Sr. Notes (Canada) | | B3 | | 7.25% | | 02/15/15 | | | 2,615 | | | 2,458,100 |
Peabody Energy Corp., Ser. B, Gtd. Notes | | Ba1 | | 6.875% | | 03/15/13 | | | 3,000 | | | 3,015,000 |
PNA Group, Inc., Sr. Notes | | B3 | | 10.75% | | 09/01/16 | | | 3,700 | | | 3,478,000 |
Ryerson, Inc., Sec’d. Notes, 144A
(cost $7,564,132; purchased 10/3/07-10/26/07)(b)(k) | | B2 | | 12.00% | | 11/01/15 | | | 7,500 | | | 7,406,250 |
Southern Copper Corp., Sr. Notes | | Baa2 | | 7.50% | | 07/27/35 | | | 3,550 | | | 3,759,841 |
| | | | | | | | | | | |
|
|
| | | | | | | | | | | | | 83,304,154 |
| | | | | | | | | | | |
|
|
Non Captive Finance — 2.0% | | | | | | | | | | | | |
General Motors Acceptance Corp., Notes | | Ba3 | | 6.75% | | 12/01/14 | | | 2,075 | | | 1,673,589 |
General Motors Acceptance Corp., Notes | | Ba3 | | 6.875% | | 09/15/11 | | | 5,980 | | | 5,115,854 |
General Motors Acceptance Corp., Notes | | Ba3 | | 6.875% | | 08/28/12 | | | 19,540 | | | 16,373,817 |
GMAC LLC, Unsub. Notes | | Ba3 | | 6.625% | | 05/15/12 | | | 3,000 | | | 2,493,951 |
Residential Capital Corp., Sr. Unsec’d. Notes | | Ba3 | | 7.875% | | 06/30/10 | | | 6,725 | | | 4,304,000 |
Residential Capital LLC, Gtd. Notes | | Ba3 | | 8.00% | | 06/01/12 | | | 5,725 | | | 3,520,875 |
| | | | | | | | | | | |
|
|
| | | | | | | | | | | | | 33,482,086 |
| | | | | | | | | | | |
|
|
Packaging — 2.5% | | | | | | | | | | | | |
Ball Corp., Gtd. Notes | | Ba1 | | 6.625% | | 03/15/18 | | | 5,205 | | | 5,165,962 |
Berry Plastics Holding Corp., Sec’d. Notes(h) | | B3 | | 8.8656% | | 09/15/14 | | | 2,025 | | | 1,893,375 |
Berry Plastics Holding Corp., Sec’d. Notes(b) | | B3 | | 8.875% | | 09/15/14 | | | 4,600 | | | 4,370,000 |
Crown Americas LLC, Sr. Notes | | B1 | | 7.625% | | 11/15/13 | | | 8,000 | | | 8,179,999 |
Exopack Holding Corp., Sr. Notes | | B3 | | 11.25% | | 02/01/14 | | | 4,965 | | | 4,865,700 |
Graham Packaging Co., Inc., Gtd. Notes(b) | | Caa1 | | 8.50% | | 10/15/12 | | | 2,950 | | | 2,758,250 |
Graham Packaging Co., Inc., Sub. Notes | | Caa1 | | 9.875% | | 10/15/14 | | | 2,650 | | | 2,438,000 |
Greif Brothers Corp., Gtd. Notes | | Ba2 | | 6.75% | | 02/01/17 | | | 7,075 | | | 6,915,813 |
Owens-Brockway Glass Container, Inc., Gtd. Notes(b) | | B3 | | 8.25% | | 05/15/13 | | | 2,425 | | | 2,515,938 |
Silgan Holdings, Inc., Sr. Sub. Notes | | B1 | | 6.75% | | 11/15/13 | | | 3,250 | | | 3,152,500 |
| | | | | | | | | | | |
|
|
| | | | | | | | | | | | | 42,255,537 |
| | | | | | | | | | | |
|
|
Paper — 3.2% | | | | | | | | | | | | |
Abitibi-Consolidated, Inc., Notes (Canada)(b) | | B3 | | 5.25% | | 06/20/08 | | | 1,617 | | | 1,548,278 |
Cascades, Inc., Sr. Notes (Canada)(b) | | Ba3 | | 7.25% | | 02/15/13 | | | 5,025 | | | 4,710,938 |
Catalyst Paper Corp., Gtd. Notes, Ser. D (Canada) | | B2 | | 8.625% | | 06/15/11 | | | 5,950 | | | 4,938,500 |
Cellu Tissue Holdings, Inc., Sr. Sec’d. Notes | | B2 | | 9.75% | | 03/15/10 | | | 2,500 | | | 2,412,500 |
Domtar Corp., Gtd. Notes (Canada) | | B1 | | 5.375% | | 12/01/13 | | | 1,200 | | | 1,083,000 |
Domtar Corp., Gtd. Notes (Canada)(b) | | B+(g) | | 7.875% | | 10/15/11 | | | 1,525 | | | 1,557,406 |
Georgia-Pacific, Corp., Debs. | | B2 | | 9.50% | | 12/01/11 | | | 500 | | | 525,000 |
Georgia-Pacific, Corp., Notes(b) | | B2 | | 8.125% | | 05/15/11 | | | 1,440 | | | 1,461,600 |
Georgia-Pacific, Corp., Gtd. Notes, 144A
(cost $4,800,000; purchased 12/13/06)(b)(k) | | Ba3 | | 7.125% | | 01/15/17 | | | 4,800 | | | 4,668,000 |
Glatfelter, Gtd. Notes | | Ba2 | | 7.125% | | 05/01/16 | | | 320 | | | 315,200 |
Graphic Packaging International Corp., Sr. Notes | | B2 | | 8.50% | | 08/15/11 | | | 7,155 | | | 7,083,449 |
Graphic Packaging International Corp., Sr. Sub. Notes(b) | | B3 | | 9.50% | | 08/15/13 | | | 2,525 | | | 2,493,438 |
Jefferson Smurfit Corp., Gtd. Notes | | B3 | | 8.25% | | 10/01/12 | | | 1,000 | | | 985,000 |
Millar Western Forest Products Ltd., Sr. Notes (Canada) | | B2 | | 7.75% | | 11/15/13 | | | 375 | | | 279,375 |
NewPage Corp., Gtd. Notes | | B2 | | 10.00% | | 05/01/12 | | | 1,800 | | | 1,809,000 |
Norampac, Inc., Sr. Notes (Canada) | | Ba3 | | 6.75% | | 06/01/13 | | | 1,630 | | | 1,487,375 |
Smurfit-Stone Container Enterprises, Inc., Sr. Notes(b) | | B3 | | 8.00% | | 03/15/17 | | | 1,845 | | | 1,782,731 |
Smurfit-Stone Container Enterprises, Inc., Sr. Notes(b) | | B3 | | 8.375% | | 07/01/12 | | | 4,290 | | | 4,257,825 |
Stone Container Finance, Gtd. Notes.(b) | | B3 | | 7.375% | | 07/15/14 | | | 1,585 | | | 1,493,863 |
Verso Paper Holdings LLC, Sec’d. Notes, Ser. B(h) | | B2 | | 8.6613% | | 08/01/14 | | | 430 | | | 419,250 |
Verso Paper Holdings LLC, Ser. B, Sec’d. Notes | | B2 | | 9.125% | | 08/01/14 | | | 1,700 | | | 1,717,000 |
Verso Paper Holdings LLC, Sr. Sub. Notes, Ser. B(b) | | B3 | | 11.375% | | 08/01/16 | | | 6,775 | | | 6,876,625 |
| | | | | | | | | | | |
|
|
| | | | | | | | | | | | | 53,905,353 |
| | | | | | | | | | | |
|
|
SEE NOTES TO FINANCIAL STATEMENTS.
A119
| | | | |
| | | HIGH YIELD BOND PORTFOLIO (Continued) | | |
SCHEDULE OF INVESTMENTS | December 31, 2007 |
| | | | | | | | | | | | |
CORPORATE BONDS
(continued) | | Moody’s
Rating
(Unaudited)
| | Interest
Rate
| | Maturity
Date
| | Principal
Amount
(000)
| | Value
(Note 2)
|
| | | | | | | | | | | | | |
Pipelines & Others — 2.0% | | | | | | | | | | | | |
AmeriGas Partners LP, Sr. Notes | | B1 | | 7.125% | | 05/20/16 | | $ | 4,125 | | $ | 4,001,250 |
El Paso Corp., Sr. Notes(b) | | Ba3 | | 7.75% | | 01/15/32 | | | 1,200 | | | 1,218,092 |
Ferrellgas Partners LP, Sr. Notes | | Ba3 | | 6.75% | | 05/01/14 | | | 1,175 | | | 1,152,969 |
Inergy LP, Sr. Notes | | B1 | | 6.875% | | 12/15/14 | | | 3,000 | | | 2,917,500 |
Inergy LP/Inergy Finance Corp., Gtd. Notes | | B1 | | 8.25% | | 03/01/16 | | | 1,050 | | | 1,086,750 |
Kinder Morgan Finance Co., Notes | | Ba2 | | 5.70% | | 01/05/16 | | | 2,200 | | | 1,991,442 |
Kinder Morgan Finance Co., Notes | | Ba2 | | 6.40% | | 01/05/36 | | | 3,825 | | | 3,158,880 |
Pacific Energy Partners LP, Sr. Notes | | Baa3 | | 7.125% | | 06/15/14 | | | 1,475 | | | 1,534,934 |
Sonat, Inc., Notes | | Ba3 | | 7.625% | | 07/15/11 | | | 1,840 | | | 1,881,164 |
Targa Resources, Inc., Gtd. Notes, 144A | | B3 | | 8.50% | | 11/01/13 | | | 1,475 | | | 1,423,375 |
Williams Cos., Inc., Notes(b) | | Baa3 | | 7.125% | | 09/01/11 | | | 4,475 | | | 4,726,719 |
Williams Cos., Inc., Sr. Unsec’d. Notes | | Baa3 | | 8.125% | | 03/15/12 | | | 7,445 | | | 8,105,744 |
| | | | | | | | | | | |
|
|
| | | | | | | | | | | | | 33,198,819 |
| | | | | | | | | | | |
|
|
Railroads — 0.2% | | | | | | | | | | | | |
Kansas City Southern Railway, Gtd. Notes | | B3 | | 7.50% | | 06/15/09 | | | 2,750 | | | 2,753,438 |
| | | | | | | | | | | |
|
|
Retailers — 1.8% | | | | | | | | | | | | |
Couche-Tard Finance Corp., Sr. Sub. Notes | | Ba2 | | 7.50% | | 12/15/13 | | | 2,475 | | | 2,468,813 |
GSC Holdings Corp., Gtd. Notes | | Ba3 | | 8.00% | | 10/01/12 | | | 1,620 | | | 1,686,825 |
Michaels Stores, Inc., Sr. Notes(b) | | B2 | | 10.00% | | 11/01/14 | | | 2,625 | | | 2,493,750 |
Neiman Marcus Group, Inc., Gtd. Notes, PIK | | B2 | | 9.00% | | 10/15/15 | | | 8,535 | | | 8,801,718 |
Pantry, Inc., Sr. Sub. Notes(f) | | B3 | | 7.75% | | 02/15/14 | | | 2,025 | | | 1,863,000 |
Rite Aid Corp., Sec’d. Notes | | B3 | | 8.125% | | 05/01/10 | | | 7,595 | | | 7,443,100 |
Susser Holdings, LLC, Sr. Notes, 144A | | B3 | | 10.625% | | 12/15/13 | | | 2,640 | | | 2,732,400 |
Susser Holdings, LLC, Gtd. Notes | | B3 | | 10.625% | | 12/15/13 | | | 3,000 | | | 3,105,000 |
| | | | | | | | | | | |
|
|
| | | | | | | | | | | | | 30,594,606 |
| | | | | | | | | | | |
|
|
Structured Notes — 0.2% | | | | | | | | | | | | |
CDX North America High Yield, Ser. 9-T1, Gtd. Notes, 144A(b) | | B3 | | 8.75% | | 12/29/12 | | | 3,500 | | | 3,451,875 |
| | | | | | | | | | | |
|
|
Technology — 5.4% | | | | | | | | | | | | |
Amkor Technology, Inc., Sr. Notes | | B1 | | 7.125% | | 03/15/11 | | | 800 | | | 762,000 |
Ampex Corp., Sec’d. Notes, PIK(f) | | NR | | 12.00% | | 08/15/08 | | | 729 | | | 546,803 |
Avago Technologies, Sr. Notes (Singapore) | | B2 | | 10.125% | | 12/01/13 | | | 2,260 | | | 2,364,525 |
Avago Technologies, Sr. Sub. Notes (Singapore) | | Caa1 | | 11.875% | | 12/01/15 | | | 1,600 | | | 1,710,000 |
First Data Corp., Bank Loan(f) | | Ba3 | | 7.981% | | 09/24/14 | | | 4,988 | | | 4,743,736 |
First Data Corp., Bank Loan(f) | | Ba3 | | 7.981% | | 09/24/15 | | | 4,988 | | | 4,728,464 |
First Data Corp., Gtd. Notes, 144A | | B3 | | 9.875% | | 09/24/15 | | | 2,950 | | | 2,743,500 |
Flextronics International Ltd., Bank Loan (Singapore)(f) | | Ba1 | | 7.234% | | 10/01/14 | | | 1,336 | | | 1,302,540 |
Flextronics International Ltd., Bank Loan (Singapore)(f) | | Ba1 | | 7.474% | | 10/01/14 | | | 4,650 | | | 4,533,526 |
Flextronics International Ltd., Sr. Sub. Notes (Singapore) | | Ba2 | | 6.25% | | 11/15/14 | | | 200 | | | 190,500 |
Flextronics International Ltd., Sr. Sub. Notes (Singapore) | | Ba2 | | 6.50% | | 05/15/13 | | | 5,690 | | | 5,519,300 |
Freescale Semiconductor, Inc., Sr. Notes(b) | | B2 | | 8.875% | | 12/15/14 | | | 2,480 | | | 2,213,400 |
Freescale Semiconductor, Inc., Sr. Notes, PIK | | B2 | | 9.125% | | 12/15/14 | | | 20,650 | | | 17,552,499 |
Freescale Semiconductor, Inc., Sr. Sub. Notes(b) | | B3 | | 10.125% | | 12/15/16 | | | 1,865 | | | 1,538,625 |
Iron Mountain, Inc., Gtd. Notes | | B3 | | 8.625% | | 04/01/13 | | | 6,600 | | | 6,682,500 |
Nortel Networks Corp., Gtd. Notes (Canada)(b) | | B3 | | 4.25% | | 09/01/08 | | | 1,022 | | | 1,002,838 |
Nortel Networks Ltd., Gtd. Notes (Canada), 144A(b) | | B3 | | 10.125% | | 07/15/13 | | | 1,200 | | | 1,236,000 |
NXP BV, Gtd. Notes (Netherlands)(b) | | B3 | | 9.50% | | 10/15/15 | | | 675 | | | 618,469 |
NXP BV, Sec’d. Notes (Netherlands) | | Ba3 | | 7.875% | | 10/15/14 | | | 2,035 | | | 1,933,250 |
Open Solutions, Inc., Sr. Sub. Notes, 144A | | Caa1 | | 9.75% | | 02/01/15 | | | 2,600 | | | 2,369,250 |
Seagate Technology HDD Holdings, Gtd. Notes (Cayman Islands) | | Ba1 | | 6.375% | | 10/01/11 | | | 4,600 | | | 4,536,750 |
Seagate Technology HDD Holdings, Gtd. Notes (Cayman Islands) | | Ba1 | | 6.80% | | 10/01/16 | | | 2,750 | | | 2,681,250 |
Sensata Technologies BV, Sr. Notes (Netherlands)(b) | | B3 | | 8.00% | | 05/01/14 | | | 5,600 | | | 5,264,000 |
Serena Software, Inc., Sr. Sub. Notes(b) | | Caa1 | | 10.375% | | 03/15/16 | | | 8,840 | | | 8,707,400 |
STATS ChipPAC Ltd., Gtd. Notes (Singapore) | | Ba1 | | 6.75% | | 11/15/11 | | | 1,810 | | | 1,814,525 |
Unisys Corp., Sr. Notes | | B2 | | 6.875% | | 03/15/10 | | | 195 | | | 184,763 |
Unisys Corp., Sr. Notes | | B2 | | 8.00% | | 10/15/12 | | | 465 | | | 406,875 |
Xerox Corp., Gtd. Notes | | Baa2 | | 9.75% | | 01/15/09 | | | 590 | | | 616,792 |
Xerox Corp., Sr. Notes | | Baa2 | | 6.875% | | 08/15/11 | | | 1,350 | | | 1,412,274 |
| | | | | | | | | | | |
|
|
| | | | | | | | | | | | | 89,916,354 |
| | | | | | | | | | | |
|
|
SEE NOTES TO FINANCIAL STATEMENTS.
A120
| | | | |
| | | HIGH YIELD BOND PORTFOLIO (Continued) | | |
SCHEDULE OF INVESTMENTS | December 31, 2007 |
| | | | | | | | | | | | |
CORPORATE BONDS
(continued) | | Moody’s
Rating
(Unaudited)
| | Interest
Rate
| | Maturity
Date
| | Principal
Amount
(000)
| | Value
(Note 2)
|
| | | | | | | | | | | | | |
Telecommunications — 4.7% | | | | | | | | | | | | |
Alltel Corp., Sr. Notes(b) | | Caa1 | | 7.00% | | 07/01/12 | | $ | 525 | | $ | 452,813 |
Centennial Cellullar Operating Co., Gtd Notes | | B2 | | 10.125% | | 06/15/13 | | | 1,975 | | | 2,073,750 |
Cincinnati Bell, Inc., Gtd. Notes | | Ba3 | | 7.25% | | 07/15/13 | | | 1,275 | | | 1,278,188 |
Cincinnati Bell, Inc., Sr. Sub. Notes(b) | | B2 | | 8.375% | | 01/15/14 | | | 3,415 | | | 3,329,625 |
Citizens Communications Co., Notes | | Ba2 | | 9.25% | | 05/15/11 | | | 2,475 | | | 2,679,188 |
Citizens Communications Co., Sr. Notes | | Ba2 | | 6.25% | | 01/15/13 | | | 4,400 | | | 4,262,500 |
Citizens Communications Co., Sr. Notes | | Ba2 | | 9.00% | | 08/15/31 | | | 3,135 | | | 3,127,163 |
Cricket Communications, Inc., Gtd. Notes, 144A | | Caa1 | | 9.375% | | 11/01/14 | | | 2,200 | | | 2,062,500 |
Hawaiian Telcom Communications, Inc., Gtd. Notes, Ser. B(h) | | Caa1 | | 10.3181% | | 05/01/13 | | | 5,800 | | | 5,843,500 |
Hawaiian Telcom Communications, Inc., Gtd. Notes, Ser. B(b) | | Caa1 | | 12.50% | | 05/01/15 | | | 3,725 | | | 3,846,063 |
Level 3 Financing, Inc., Sr. Notes | | Caa1 | | 12.25% | | 03/15/13 | | | 10,950 | | | 11,059,499 |
Nordic Telephone Co., Holdings ApS, Sr. Notes, (Denmark), 144A | | B2 | | 8.875% | | 05/01/16 | | | 4,950 | | | 5,073,750 |
PAETEC Holding Corp., Sr. Notes, 144A | | Caa1 | | 9.50% | | 07/15/15 | | | 3,075 | | | 2,998,125 |
Qwest Communications International, Inc., Gtd. Notes, Ser. B(b) | | Ba3 | | 7.50% | | 02/15/14 | | | 5,900 | | | 5,885,250 |
Qwest Corp., Debs.(b) | | Ba1 | | 6.875% | | 09/15/33 | | | 1,030 | | | 950,175 |
Qwest Corp., Sr. Notes | | Ba1 | | 7.625% | | 06/15/15 | | | 5,115 | | | 5,204,513 |
Qwest Corp., Sr. Unsec’d. Notes(b) | | Ba1 | | 7.50% | | 10/01/14 | | | 3,575 | | | 3,628,625 |
Rural Cellular Corp., Sr. Notes | | B3 | | 9.875% | | 02/01/10 | | | 20 | | | 20,750 |
Time Warner Telecom Holdings, Inc., Gtd. Notes | | B3 | | 9.25% | | 02/15/14 | | | 5,825 | | | 5,956,062 |
Windstream Corp., Gtd. Notes | | Ba3 | | 8.125% | | 08/01/13 | | | 2,500 | | | 2,587,500 |
Windstream Corp., Sr. Notes | | Ba3 | | 8.625% | | 08/01/16 | | | 5,950 | | | 6,247,499 |
| | | | | | | | | | | |
|
|
| | | | | | | | | | | | | 78,567,038 |
| | | | | | | | | | | |
|
|
TOTAL CORPORATE BONDS
(cost $ 1,555,908,895) | | | 1,507,267,627 |
| | | | | | | | | | | |
|
|
FOREIGN GOVERNMENT OBLIGATIONS — 0.7% | | | | | | | | | | | | |
Federal Republic of Argentina, Bonds(h) | | B3 | | 5.389% | | 08/03/12 | | | 2,238 | | | 1,989,921 |
Federal Republic of Argentina, Bonds | | B+(g) | | 7.00% | | 10/03/15 | | | 4,450 | | | 3,597,825 |
Federal Republic of Brazil, Unsub. Notes | | Ba1 | | 10.00% | | 08/07/11 | | | 1,920 | | | 2,251,200 |
Federal Republic of Peru, Bonds | | Ba2 | | 8.375% | | 05/03/16 | | | 3,330 | | | 3,904,425 |
| | | | | | | | | | | |
|
|
TOTAL FOREIGN GOVERNMENT OBLIGATIONS
(cost $11,554,836) | | | 11,743,371 |
| | | | | | | | | | | |
|
|
| | | | | |
| COMMON STOCKS — 0.2% | | | | | | | | Shares
| | |
Cable | | | | | | | | | | | | |
Adelphia Recovery Trust(a)(f) | | | | | | | | | 500,000 | | | 500 |
| | | | | | | | | | | |
|
|
Electric | | | | | | | | | | | | |
Mirant Corp.(a) | | | | | | | | | 2,240 | | | 87,315 |
| | | | | | | | | | | |
|
|
Media | | | | | | | | | | | | |
Virgin Media, Inc. | | | | | | | | | 8,521 | | | 146,050 |
| | | | | | | | | | | |
|
|
Technology — 0.2% | | | | | | | | | | | | |
Xerox Corp. | | | | | | | | | 137,561 | | | 2,227,113 |
| | | | | | | | | | | |
|
|
Telecommunications | | | | | | | | | | | | |
Netia SA (Poland)(a) | | | | | | | | | 238,168 | | | 367,999 |
| | | | | | | | | | | |
|
|
TOTAL COMMON STOCKS
(cost $2,249,158) | | | 2,828,977 |
| | | | | | | | | | | |
|
|
| | | | | |
| PREFERRED STOCKS | | | | | | | | | | | | |
Building Materials & Construction | | | | | | | | | | | | |
New Millenium Homes LLC
(cost $0; purchased 7/28/05)(a)(f)(k) | | | | | | | | | 3,000 | | | 555,000 |
| | | | | | | | | | | |
|
|
Cable | | | | | | | | | | | | |
Adelphia Communications Corp., PIK, 13.00%(a)(f) | | | | | | | | | 5,000 | | | 5 |
PTV, Inc., Ser. A, 10.00% | | | | | | | | | 13 | | | 18 |
| | | | | | | | | | | |
|
|
| | | | | | | | | | | | | 23 |
| | | | | | | | | | | |
|
|
TOTAL PREFERRED STOCKS
(cost $4,765) | | | 555,023 |
| | | | | | | | | | | |
|
|
SEE NOTES TO FINANCIAL STATEMENTS.
A121
| | | | |
| | | HIGH YIELD BOND PORTFOLIO (Continued) | | |
SCHEDULE OF INVESTMENTS | December 31, 2007 |
| | | | | | | | | | | | |
| WARRANTS(a)(f) | |
| |
| | Expiration
Date
| | Units
| | Value
(Note 2)
| |
| | | | | | | | | | | | | |
Cable | | | | | | | | | | | | |
TVN Entertainment
(cost $1,215,008; purchased 3/30/01-3/15/04)(k) | | | | | | 8/21/11 | | 9,347 | | $ | 5,420 | |
| | | | | | | | | | |
|
|
|
Chemicals | | | | | | | | | | | | |
Sterling Chemical Holdings, Inc. | | | | | | 8/15/08 | | 560 | | | 1 | |
| | | | | | | | | | |
|
|
|
Consumer | | | | | | | | | | | | |
ICON Fitness Corp. | | | | | | 9/27/09 | | 18,093 | | | 181 | |
| | | | | | | | | | |
|
|
|
Media & Entertainment | | | | | | | | | | | | |
XM Satellite Radio, Inc., 144A | | | | | | 3/15/10 | | 5,005 | | | 5 | |
| | | | | | | | | | |
|
|
|
Technology | | | | | | | | | | | | |
Viasystems Group, Inc. | | | | | | 1/31/10 | | 45,109 | | | 5 | |
| | | | | | | | | | |
|
|
|
Telecommunications | | | | | | | | | | | | |
GT Group Telecommunications, Inc. (Canada), 144A | | | | | | 2/01/10 | | 3,050 | | | 3 | |
Verado Holdings, Inc., Ser. B | | | | | | 4/15/08 | | 1,175 | | | 511 | |
Versatel Telecommunications | | | | | | 5/15/08 | | 2,000 | | | 2 | |
| | | | | | | | | | |
|
|
|
| | | | | | | | | | | | 516 | |
| | | | | | | | | | |
|
|
|
TOTAL WARRANTS
(cost $4,213,592) | | | 6,128 | |
| | | | | | | | | | |
|
|
|
TOTAL LONG-TERM INVESTMENTS
(cost $1,573,931,246) | | | 1,522,401,126 | |
| | | | | | | | | | |
|
|
|
| | | | | |
| SHORT-TERM INVESTMENTS — 25.1% | | | | | | | | Shares
| | | |
AFFILIATED MUTUAL FUNDS | | | | | | | | | | | | |
Dryden Core Investment Fund — Short-Term Bond Series(e) | | 3,278,690 | | | 30,950,833 | |
Dryden Core Investment Fund — Taxable Money Market Series
(cost $388,277,903 includes $292,851,315 of cash collateral received for securities lending) (Note 4)(d)(e) | | 388,277,903 | | | 388,277,903 | |
| | | | | | | | | | |
|
|
|
TOTAL SHORT-TERM INVESTMENTS
(cost $ 421,028,447) | | | 419,228,736 | |
| | | | | | | | | | |
|
|
|
TOTAL INVESTMENTS(l) — 116.0%
(cost $1,994,959,693) | | | 1,941,629,862 | |
LIABILITIES IN EXCESS OF OTHER ASSETS(m) — (16.0)% | | | (267,663,999 | ) |
| | | | | | | | | | |
|
|
|
NET ASSETS — 100.0% | | $ | 1,673,965,863 | |
| | | | | | | | | | |
|
|
|
The following abbreviations are used in portfolio descriptions:
| | |
| MTN | | Medium Term Note |
| NR | | Not Rated by Moody’s or Standard & Poor’s |
| PIK | | Payment-in-kind |
| 144A | | Security was purchased pursuant to Rule 144A under the Securities Act of 1933 and may not be resold subject to that rule except to qualified institutional buyers. Unless otherwise noted, 144A securities are deemed to be liquid. |
| (a) | Non-income producing security. |
| (b) | All or portion of security is on loan. The aggregate market value of such securities is $284,492,577; cash collateral of $292,851,315 (included in liabilities) was received with which the portfolio purchased highly liquid short-term investments. |
| (c) | Represents issuer in default on interest payments and/or principal repayment; non-income producing security. |
| (d) | Represents security, or a portion thereof, purchased with cash collateral received for securities on loan. |
| (e) | Prudential Investments LLC, the manager of the Portfolio, also serves as manager of the Dryden Core Investment Fund — Short-Term Bond Series and the Dryden Core Investment Fund — Taxable Money Market Series. |
| (f) | Indicates a security that has been deemed illiquid. |
| (g) | Standard & Poor’s rating. |
| (h) | Indicates a variable rate security. The maturity date presented for these instruments is the latter of the next date on which the security can be redeemed at par or the next date on which the rate of interest is adjusted. The interest rate shown reflects the rate in effect at December 31, 2007. |
SEE NOTES TO FINANCIAL STATEMENTS.
A122
| | | | |
| | | HIGH YIELD BOND PORTFOLIO (Continued) | | |
SCHEDULE OF INVESTMENTS | December 31, 2007 |
| (i) | Amount is actual; not rounded to thousands. |
| (j) | Interest rate reflected represents the rate that would be in effect from the date the bond steps up from zero to an interest paying bond. |
| (k) | Indicates a restricted security; the aggregate cost of such securities is $29,890,995. The aggregate value of $28,922,608 is approximately 1.7% of net assets. |
| (l) | As of December 31, 2007, 8 securities representing $1,109,740 and 0.1% of net assets were fair valued in accordance with the policies adopted by the Board of Trustees. |
| (m) | Liabilities in excess of other assets include net unrealized appreciation (depreciation) on credit default swap agreements as follows: |
Credit default swap agreements outstanding at December 31, 2007:
| | | | | | | | | | | | | | |
Counterparty
| | Termination
Date
| | Notional
Amount
(000)
| | Fixed
Rate
| | | Reference Entity/Obligation
| | Unrealized
Appreciation/
(Depreciation)
| |
Merrill Lynch Capital Services(1) | | 9/20/2009 | | $ | 2,000 | | 4.65 | % | | General Motors Corp.
7.125%, 7/15/13 | | $ | (21,065 | ) |
Morgan Stanley Capital Services, Inc.(1) | | 9/20/2010 | | | 2,500 | | 4.20 | % | | Lear Corp.,
8.11%, 5/15/09 | | | 12,488 | |
Citibank, NA(2) | | 12/20/2012 | | | 4,250 | �� | 2.85 | % | | American Axle & Manufacturing, Inc., 5.25%, 2/11/14 | | | 158,637 | |
| | | | | | | | | | | | |
|
|
|
| | | | | | | | | | | | | $ | 150,060 | |
| | | | | | | | | | | | |
|
|
|
| (1) | The portfolio receives the fixed rate and pays the counterparty par in the event that the underlying bond defaults. |
| (2) | The portfolio pays the fixed rate and receives from the counterparty par in the event that the underlying bond defaults. |
The industry classification of portfolio holdings and liabilities in excess of other assets shown as a percentage of net assets as of December 31, 2007 was as follows:
| | | |
Affiliated Mutual Funds (including 17.5% of collateral received for securities on loan) | | 25.1 | % |
Healthcare & Pharmaceutical | | 11.1 | |
Electric | | 8.8 | |
Capital Goods | | 7.5 | |
Media & Entertainment | | 7.1 | |
Gaming | | 5.7 | |
Technology | | 5.6 | |
Metals | | 4.9 | |
Telecommunications | | 4.7 | |
Automotive | | 3.4 | |
Cable | | 3.4 | |
Energy – Other | | 3.4 | |
Paper | | 3.2 | |
Chemicals | | 2.6 | |
Packaging | | 2.5 | |
Consumer | | 2.3 | |
Aerospace/Defense | | 2.1 | |
Foods | | 2.1 | |
Non Captive Finance | | 2.0 | |
Pipelines & Others | | 2.0 | |
Retailers | | 1.8 | |
Lodging | | 1.5 | |
Banking | | 0.7 | |
Foreign Government Obligations | | 0.7 | |
Building Materials & Construction | | 0.6 | |
Airlines | | 0.5 | |
Energy – Integrated | | 0.2 | |
Railroads | | 0.2 | |
Structured Notes | | 0.2 | |
Healthcare Insurance | | 0.1 | |
| | |
|
|
| | | 116.0 | |
Liabilities in excess of other assets | | (16.0 | ) |
| | |
|
|
| | | 100.0 | % |
| | |
|
|
SEE NOTES TO FINANCIAL STATEMENTS.
A123
| | | | |
| | | HIGH YIELD BOND PORTFOLIO (Continued) | | |
STATEMENT OF ASSETS AND LIABILITIES
December 31, 2007
| | | | |
| ASSETS | | | | |
Investments, at value including securities on loan of $284,492,577: | | | | |
Unaffiliated investments (cost $1,573,931,246) | | $ | 1,522,401,126 | |
Affiliated investments (cost $421,028,447) | | | 419,228,736 | |
Cash | | | 1,498,460 | |
Foreign currency, at value (cost $1,247,606) | | | 1,430,472 | |
Dividends and interest receivable | | | 31,550,398 | |
Receivable for investments sold | | | 1,852,696 | |
Unrealized appreciation on swaps | | | 171,125 | |
Receivable for Series shares sold | | | 42,944 | |
Prepaid expenses | | | 28,831 | |
| | |
|
|
|
Total Assets | | | 1,978,204,788 | |
| | |
|
|
|
| LIABILITIES | | | | |
Collateral for securities on loan | | | 292,851,315 | |
Payable for investments purchased | | | 10,111,828 | |
Management fee payable | | | 780,409 | |
Payable for Series shares repurchased | | | 306,423 | |
Accrued expenses and other liabilities | | | 162,604 | |
Unrealized depreciation on swaps | | | 21,065 | |
Deferred trustees’ fees | | | 4,652 | |
Transfer agent fee payable | | | 629 | |
| | |
|
|
|
Total Liabilities | | | 304,238,925 | |
| | |
|
|
|
| NET ASSETS | | $ | 1,673,965,863 | |
| | |
|
|
|
Net assets were comprised of: | | | | |
Paid-in capital | | $ | 1,972,559,068 | |
Retained earnings | | | (298,593,205 | ) |
| | |
|
|
|
Net assets, December 31, 2007 | | $ | 1,673,965,863 | |
| | |
|
|
|
Net asset value and redemption price per share, $1,673,965,863 / 329,028,857 outstanding shares of beneficial interest (authorized 600,000,000 shares) | | $ | 5.09 | |
| | |
|
|
|
STATEMENT OF OPERATIONS
Year Ended December 31, 2007
| | | | |
| INVESTMENT INCOME | | | | |
Interest | | $ | 125,648,776 | |
Unaffiliated dividend income | | | 5,671,571 | |
Affiliated dividend income | | | 5,663,500 | |
Affiliated income from securities loaned, net | | | 896,337 | |
| | |
|
|
|
Total income | | | 137,880,184 | |
| | |
|
|
|
| EXPENSES | | | | |
Management fee | | | 9,400,109 | |
Custodian’s fees and expenses | | | 219,000 | |
Shareholders’ reports | | | 125,000 | |
Insurance expenses | | | 37,000 | |
Trustees’ fees | | | 31,000 | |
Audit fee | | | 22,000 | |
Legal fees and expenses | | | 8,000 | |
Commitment fee on syndicated credit agreement | | | 6,000 | |
Transfer agent’s fee and expenses (including affiliated expense of $3,000) (Note 4) | | | 3,000 | |
Loan interest expense (Note 8) | | | 2,061 | |
Miscellaneous | | | 12,805 | |
| | |
|
|
|
Total expenses | | | 9,865,975 | |
| | |
|
|
|
| NET INVESTMENT INCOME | | | 128,014,209 | |
| | |
|
|
|
| NET REALIZED AND UNREALIZED GAIN (LOSS) ON INVESTMENTS, SWAPS AND FOREIGN CURRENCIES | | | | |
Net realized gain (loss) on: | | | | |
Investment transactions | | | 8,479,292 | |
Swap transactions | | | 204,787 | |
Foreign currency transactions | | | 9 | |
Futures transactions | | | (12 | ) |
| | |
|
|
|
| | | | 8,684,076 | |
| | |
|
|
|
Net change in unrealized appreciation (depreciation) on: | | | | |
Investments | | | (93,231,100 | ) |
Swaps | | | (39,184 | ) |
Foreign currencies | | | 47,359 | |
| | |
|
|
|
| | | | (93,222,925 | ) |
| | |
|
|
|
| NET LOSS ON INVESTMENTS, SWAPS AND FOREIGN CURRENCIES | | | (84,538,849 | ) |
| | |
|
|
|
| NET INCREASE IN NET ASSETS RESULTING FROM OPERATIONS | | $ | 43,475,360 | |
| | |
|
|
|
STATEMENT OF CHANGES IN NET ASSETS
| | | | | | | | |
| | | Year Ended December 31,
| |
| | | 2007
| | | 2006
| |
| INCREASE (DECREASE) IN NET ASSETS | | | | | | | | |
| OPERATIONS: | | | | | | | | |
Net investment income | | $ | 128,014,209 | | | $ | 121,654,591 | |
Net realized gain on investment, swap and foreign currency transactions | | | 8,684,076 | | | | 4,434,124 | |
Net change in unrealized appreciation (depreciation) on investments and foreign currencies | | | (93,222,925 | ) | | | 35,353,214 | |
| | |
|
|
| |
|
|
|
NET INCREASE IN NET ASSETS RESULTING FROM OPERATIONS | | | 43,475,360 | | | | 161,441,929 | |
| | |
|
|
| |
|
|
|
DISTRIBUTIONS: | | | (121,240,261 | ) | | | (129,163,904 | ) |
| | |
|
|
| |
|
|
|
| SERIES SHARES TRANSACTIONS: | | | | | | | | |
Series shares sold (8,066,804 and 6,501,981 shares, respectively) | | | 42,674,086 | | | | 34,504,776 | |
Series shares issued in reinvestment of distributions (23,224,719 and 24,614,532 shares, respectively) | | | 121,240,261 | | | | 129,163,904 | |
Series shares repurchased (25,105,500 and 20,932,126 shares, respectively) | | | (133,249,807 | ) | | | (110,629,621 | ) |
| | |
|
|
| |
|
|
|
NET INCREASE IN NET ASSETS RESULTING FROM SERIES SHARES TRANSACTIONS | | | 30,664,540 | | | | 53,039,059 | |
| | |
|
|
| |
|
|
|
TOTAL INCREASE (DECREASE) IN NET ASSETS | | | (47,100,361 | ) | | | 85,317,084 | |
| NET ASSETS: | | | | | | | | |
Beginning of year | | | 1,721,066,224 | | | | 1,635,749,140 | |
| | |
|
|
| |
|
|
|
End of year | | $ | 1,673,965,863 | | | $ | 1,721,066,224 | |
| | |
|
|
| |
|
|
|
SEE NOTES TO FINANCIAL STATEMENTS.
A124
SCHEDULE OF INVESTMENTS | December 31, 2007 |
| | | | | |
| LONG-TERM INVESTMENTS — 99.8% | | Shares
| | Value
(Note 2)
|
| COMMON STOCKS | | |
| | | | | | |
Aerospace & Defense — 3.2% | | | | | |
Boeing Co. | | 247,700 | | $ | 21,663,842 |
United Technologies Corp. | | 589,700 | | | 45,135,638 |
| | | | |
|
|
| | | | | | 66,799,480 |
| | | | |
|
|
Beverages — 2.3% | | | | | |
PepsiCo, Inc. | | 651,000 | | | 49,410,900 |
| | | | |
|
|
Biotechnology — 5.4% | | | | | |
Genentech, Inc.(a) | | 461,900 | | | 30,979,633 |
Gilead Sciences, Inc.(a)(b) | | 1,811,100 | | | 83,328,711 |
| | | | |
|
|
| | | | | | 114,308,344 |
| | | | |
|
|
Capital Markets — 5.5% | | | | | |
Charles Schwab Corp. (The) | | 1,804,400 | | | 46,102,420 |
Goldman Sachs Group, Inc. (The) | | 149,700 | | | 32,192,985 |
Lazard Ltd. (Class A)(b) | | 562,600 | | | 22,886,568 |
Merrill Lynch & Co., Inc.(b) | | 289,200 | | | 15,524,256 |
| | | | |
|
|
| | | | | | 116,706,229 |
| | | | |
|
|
Chemicals — 4.4% | | | | | |
Monsanto Co. | | 524,100 | | | 58,536,729 |
Mosaic Co. (The)(a) | | 97,000 | | | 9,150,980 |
Potash Corp. of Saskatchewan(b) | | 179,500 | | | 25,840,820 |
| | | | |
|
|
| | | | | | 93,528,529 |
| | | | |
|
|
Communications Equipment — 10.2% | | | | | |
Ciena Corp.(a)(b) | | 460,200 | | | 15,697,422 |
Cisco Systems, Inc.(a) | | 2,152,800 | | | 58,276,296 |
Juniper Networks, Inc.(a) | | 688,800 | | | 22,868,160 |
Nokia OYJ ADR (Finland) | | 552,300 | | | 21,202,797 |
QUALCOMM, Inc. | | 801,900 | | | 31,554,765 |
Research In Motion Ltd.(a)(b) | | 584,800 | | | 66,316,320 |
| | | | |
|
|
| | | | | | 215,915,760 |
| | | | |
|
|
Computers & Peripherals — 6.0% | | | | | |
Apple, Inc.(a) | | 378,600 | | | 74,993,088 |
Hewlett-Packard Co. | | 1,051,200 | | | 53,064,576 |
| | | | |
|
|
| | | | | | 128,057,664 |
| | | | |
|
|
Consumer Finance — 0.9% | | | | | |
American Express Co. | | 382,800 | | | 19,913,256 |
| | | | |
|
|
Diversified Financial Services — 3.0% | | | | | |
Bolsa DE Mercadorias E Futur 144A (Brazil)(a) | | 1,188,600 | | | 16,693,820 |
CME Group, Inc. | | 32,600 | | | 22,363,600 |
NYSE Euronext | | 285,100 | | | 25,023,227 |
| | | | |
|
|
| | | | | | 64,080,647 |
| | | | |
|
|
Electrical Equipment — 2.7% | | | | | |
Abb Ltd ADR (Switzerland)(b) | | 692,600 | | | 19,946,880 |
First Solar, Inc.(a)(b) | | 97,200 | | | 25,966,008 |
Sunpower Corp.(a)(b) | | 89,500 | | | 11,669,905 |
| | | | |
|
|
| | | | | | 57,582,793 |
| | | | |
|
|
Energy Equipment & Services — 1.6% | | | | | |
Schlumberger Ltd. | | 332,900 | | | 32,747,373 |
| | | | |
|
|
Food & Staples Retailing — 2.7% | | | | | |
Costco Wholesale Corp. | | 333,600 | | | 23,271,936 |
CVS Caremark Corp. | | 534,900 | | | 21,262,275 |
Whole Foods Market, Inc.(b) | | 315,500 | | | 12,872,400 |
| | | | |
|
|
| | | | | | 57,406,611 |
| | | | |
|
|
SEE NOTES TO FINANCIAL STATEMENTS.
A125
| | | | |
| | | JENNISON PORTFOLIO (Continued) | | |
SCHEDULE OF INVESTMENTS | December 31, 2007 |
| | | | | |
COMMON STOCKS
(continued) | | Shares
| | Value
(Note 2)
|
| | | | | | |
Health Care Equipment & Supplies — 5.5% | | | | | |
Alcon, Inc.(b) | | 285,500 | | $ | 40,837,920 |
Baxter International, Inc. | | 550,700 | | | 31,968,135 |
Holologic, Inc.(a) | | 261,900 | | | 17,976,816 |
St. Jude Medical, Inc.(a) | | 655,100 | | | 26,623,264 |
| | | | |
|
|
| | | | | | 117,406,135 |
| | | | |
|
|
Hotels, Restaurants & Leisure — 1.4% | | | | | |
Marriott International, Inc. (Class A) | | 839,000 | | | 28,677,020 |
| | | | |
|
|
Household Products — 3.1% | | | | | |
Colgate-Palmolive Co. | | 544,400 | | | 42,441,424 |
Procter & Gamble Co. (The) | | 311,300 | | | 22,855,646 |
| | | | |
|
|
| | | | | | 65,297,070 |
| | | | |
|
|
Industrial Conglomerates — 2.0% | | | | | |
General Electric Co. | | 1,156,900 | | | 42,886,283 |
| | | | |
|
|
Internet & Catalog Retail — 1.7% | | | | | |
Amazon.com, Inc.(a)(b) | | 391,800 | | | 36,296,352 |
| | | | |
|
|
Internet Software & Services — 8.0% | | | | | |
Akamai Technologies, Inc.(a)(b) | | 613,900 | | | 21,240,940 |
ALIBABA.COM Ltd. (China)(a) | | 275,000 | | | 975,150 |
ALIBABA.COM Ltd . 144A (China)(a) | | 156,200 | | | 553,908 |
eBay, Inc.(a) | | 860,200 | | | 28,550,038 |
Google, Inc., Class A(a) | | 144,800 | | | 100,126,305 |
Yahoo!, Inc.(a)(b) | | 794,600 | | | 18,482,396 |
| | | | |
|
|
| | | | | | 169,928,737 |
| | | | |
|
|
IT Services — 0.6% | | | | | |
Infosys Technologies Ltd. ADR (India) | | 259,500 | | | 11,770,920 |
| | | | |
|
|
Life Sciences, Tools & Services — 1.8% | | | | | |
Thermo Fisher Scientfic, Inc.(a) | | 676,800 | | | 39,037,824 |
| | | | |
|
|
Media — 3.7% | | | | | |
News Corp., Class A | | 1,432,300 | | | 29,347,827 |
Walt Disney Co. (The) | | 1,519,400 | | | 49,046,232 |
| | | | |
|
|
| | | | | | 78,394,059 |
| | | | |
|
|
Multiline Retail — 0.8% | | | | | |
Saks Inc.(a)(b) | | 821,000 | | | 17,043,960 |
| | | | |
|
|
Oil, Gas & Consumable Fuels — 3.6% | | | | | |
Marathon Oil Corp. | | 521,000 | | | 31,708,060 |
Occidental Petroleum Corp. | | 365,600 | | | 28,147,544 |
Southwestern Energy Co.(a) | | 98,200 | | | 5,471,704 |
Suncor Energy, Inc. | | 104,600 | | | 11,373,158 |
| | | | |
|
|
| | | | | | 76,700,466 |
| | | | |
|
|
Pharmaceuticals — 10.0% | | | | | |
Abbott Laboratories | | 899,100 | | | 50,484,465 |
Elan Corp. PLC ADR (Ireland)(a)(b) | | 561,100 | | | 12,332,978 |
Merck & Co., Inc. | | 548,300 | | | 31,861,713 |
Mylan Inc.(b) | | 735,900 | | | 10,346,754 |
Roche Holdings Group, ADR (Switzerland) | | 375,900 | | | 32,101,860 |
Schering-Plough Corp. | | 605,700 | | | 16,135,848 |
Teva Pharmaceutical Industries Ltd. (ADR) (Israel)(b) | | 817,800 | | | 38,011,344 |
Wyeth | | 479,000 | | | 21,167,010 |
| | | | |
|
|
| | | | | | 212,441,972 |
| | | | |
|
|
Semiconductors & Semiconductor Equipment — 0.5% | | | | | |
NVIDIA Corp.(a)(b) | | 331,550 | | | 11,279,331 |
| | | | |
|
|
SEE NOTES TO FINANCIAL STATEMENTS.
A126
| | | | |
| | | JENNISON PORTFOLIO (Continued) | | |
SCHEDULE OF INVESTMENTS | December 31, 2007 |
| | | | | | |
COMMON STOCKS
(continued) | | Shares
| | Value
(Note 2)
| |
| | | | | | | |
Software — 6.0% | | | | | | |
Adobe Systems, Inc.(a) | | 1,186,600 | | $ | 50,703,418 | |
Microsoft Corp. | | 2,070,100 | | | 73,695,560 | |
Vmware, Inc. (Class A)(a)(b) | | 35,200 | | | 2,991,648 | |
| | | | |
|
|
|
| | | | | | 127,390,626 | |
| | | | |
|
|
|
Specialty Retail — 0.3% | | | | | | |
Urban Outfitters, Inc.(a)(b) | | 230,000 | | | 6,269,800 | |
| | | | |
|
|
|
Textiles, Apparel & Luxury Goods — 2.9% | | | | | | |
Coach, Inc.(a) | | 888,900 | | | 27,182,562 | |
NIKE, Inc., Class B | | 528,200 | | | 33,931,568 | |
| | | | |
|
|
|
| | | | | | 61,114,130 | |
| | | | |
|
|
|
TOTAL LONG-TERM INVESTMENTS
(cost $1,537,996,898) | | | 2,118,392,271 | |
| | | | |
|
|
|
| SHORT-TERM INVESTMENTS — 14.6% | | | | | | |
Affiliated Money Market Mutual Fund | | | | | | |
Dryden Core Investment Fund — Taxable Money Market Series
(cost $310,452,785; includes $308,808,287 of cash collateral received for securities on loan)(c)(d) | | 310,452,785 | | | 310,452,785 | |
| | | | |
|
|
|
TOTAL INVESTMENTS — 114.4%
(cost $1,848,449,683) | | | 2,428,845,056 | |
LIABILITIES IN EXCESS OF OTHER ASSETS — (14.4)% | | | (306,487,151 | ) |
| | | | |
|
|
|
TOTAL NET ASSETS — 100.0% | | $ | 2,122,357,905 | |
| | | | |
|
|
|
The following abbreviation is used in portfolio descriptions:
| | |
| ADR | | American Depositary Receipt. |
| 144A | | Securities were purchased pursuant to Rule 144A under the Securities Act of 1933 and may not be resold subject to that rule except to qualified institutional buyers. Unless otherwise noted, 144A securities are deemed to be liquid. |
| (a) | Non-income producing security. |
| (b) | All or portion of security is on loan. The aggregate market value of such securities is $296,808,548; cash collateral of $308,808,287 (included in liabilities) was received with which the Portfolio purchased highly liquid short-term investments. |
| (c) | Represents security, or a portion thereof, purchased with cash collateral received for securities on loan. |
| (d) | Prudential Investments LLC, the manager of the portfolio, also serves as manager of the Dryden Core Investment Fund-Taxable Money Market Series. |
SEE NOTES TO FINANCIAL STATEMENTS.
A127
| | | | |
| | | JENNISON PORTFOLIO (Continued) | | |
SCHEDULE OF INVESTMENTS | December 31, 2007 |
The industry classification of portfolio holdings and liabilities in excess of other assets shown as a percentage of net assets as of December 31, 2007 were as follows:
| | | |
Affiliated Money Market Mutual Fund (including 14.6% of collateral received for securities on loan) | | 14.6 | % |
Communications Equipment | | 10.2 | |
Pharmaceuticals | | 10.0 | |
Internet Software & Services | | 8.0 | |
Computers & Peripherals | | 6.0 | |
Software | | 6.0 | |
Capital Markets | | 5.5 | |
Health Care Equipment & Supplies | | 5.5 | |
Biotechnology | | 5.4 | |
Chemicals | | 4.4 | |
Media | | 3.7 | |
Oil, Gas & Consumable Fuels | | 3.6 | |
Aerospace & Defense | | 3.2 | |
Household Products | | 3.1 | |
Diversified Financial Services | | 3.0 | |
Textiles, Apparel & Luxury Goods | | 2.9 | |
Electrical Equipment | | 2.7 | |
Food & Staples Retailing | | 2.7 | |
Beverages | | 2.3 | |
Industrial Conglomerates | | 2.0 | |
Life Sciences, Tools & Services | | 1.8 | |
Internet & Catalog Retail | | 1.7 | |
Energy Equipment & Services | | 1.6 | |
Hotels, Restaurants & Leisure | | 1.4 | |
Consumer Finance | | 0.9 | |
Multiline Retail | | 0.8 | |
IT Services | | 0.6 | |
Semiconductors & Semiconductor Equipment | | 0.5 | |
Specialty Retail | | 0.3 | |
| | |
|
|
| | | 114.4 | |
Liabilities in excess of other assets | | (14.4 | ) |
| | |
|
|
| | | 100.0 | % |
| | |
|
|
SEE NOTES TO FINANCIAL STATEMENTS.
A128
| | | | |
| | | JENNISON PORTFOLIO (Continued) | | |
STATEMENT OF ASSETS AND LIABILITIES
December 31, 2007
| | | | |
| ASSETS | | | | |
Investments, at value including securities on loan of $296,808,548: | | | | |
Unaffiliated investments (cost $1,537,996,898) | | $ | 2,118,392,271 | |
Affiliated investments (cost $310,452,785) | | | 310,452,785 | |
Cash | | | 855,227 | |
Receivable for investments sold | | | 14,850,180 | |
Dividends receivable | | | 2,217,793 | |
Foreign tax reclaim receivable | | | 425,442 | |
Receivable for Series shares sold | | | 135,691 | |
Prepaid expenses | | | 17,296 | |
| | |
|
|
|
Total Assets | | | 2,447,346,685 | |
| | |
|
|
|
| LIABILITIES | | | | |
Collateral for securities on loan | | | 308,808,287 | |
Payable for investments purchased | | | 12,510,172 | |
Loan payable | | | 1,696,000 | |
Management fee payable | | | 1,090,319 | |
Payable for Series shares repurchased | | | 656,908 | |
Accrued expenses | | | 217,146 | |
Distribution fee payable | | | 4,600 | |
Administration fee payable | | | 2,760 | |
Transfer agent fee payable | | | 1,463 | |
Loan interest payable | | | 1,125 | |
| | |
|
|
|
Total Liabilities | | | 324,988,780 | |
| | |
|
|
|
| NET ASSETS | | $ | 2,122,357,905 | |
| | |
|
|
|
Net assets were comprised of: | | | | |
Paid-in capital | | | 2,337,504,477 | |
Retained earnings | | | (215,146,572 | ) |
| | |
|
|
|
Net assets, December 31, 2007 | | $ | 2,122,357,905 | |
| | |
|
|
|
| Class I: | | | | |
Net asset value and redemption price per share, $2,100,461,604 / 89,281,772 outstanding shares of beneficial interest (authorized 275,000,000 shares) | | $ | 23.53 | |
| | |
|
|
|
| Class II: | | | | |
Net asset value and redemption price per share, $21,896,301 / 945,131 outstanding shares of beneficial interest (authorized 75,000,000 shares) | | $ | 23.17 | |
| | |
|
|
|
STATEMENT OF OPERATIONS
Year Ended December 31, 2007
| | | | |
| INVESTMENT INCOME | | | | |
Unaffiliated dividend income (net of foreign withholding taxes of $396,486) | | $ | 19,470,043 | |
Affiliated income from securities loaned, net | | | 1,593,014 | |
Affiliated dividend income | | | 721,265 | |
| | |
|
|
|
| | | | 21,784,322 | |
| | |
|
|
|
| EXPENSES | | | | |
Management fee | | | 12,588,687 | |
Distribution fee—Class II | | | 51,742 | |
Administration fee—Class II | | | 31,045 | |
Custodian’s fees and expenses | | | 206,000 | |
Shareholders’ reports | | | 120,000 | |
Trustees’ fees | | | 37,000 | |
Insurance expenses | | | 36,000 | |
Audit fee | | | 17,000 | |
Loan interest expense (Note 8) | | | 7,366 | |
Commitment fee on syndicated credit agreement | | | 7,000 | |
Transfer agent’s fees and expenses (including affiliated expense of $7,000) (Note 4) | | | 7,000 | |
Legal fees and expenses | | | 6,000 | |
Interest expense | | | 1,717 | |
Miscellaneous | | | 9,738 | |
| | |
|
|
|
Total expenses | | | 13,126,295 | |
| | |
|
|
|
| NET INVESTMENT INCOME | | | 8,658,027 | |
| | |
|
|
|
| NET REALIZED AND UNREALIZED GAIN (LOSS) ON INVESTMENTS AND FOREIGN CURRENCIES | | | | |
Net realized gain (loss) on: | | | | |
Investment transactions | | | 134,798,762 | |
Foreign currency transactions | | | (49,122 | ) |
| | |
|
|
|
| | | | 134,749,640 | |
| | |
|
|
|
Net change in unrealized appreciation (depreciation) on investments | | | 94,375,405 | |
| | |
|
|
|
| NET GAIN ON INVESTMENTS AND FOREIGN CURRENCIES | | | 229,125,045 | |
| | |
|
|
|
| NET INCREASE IN NET ASSETS RESULTING FROM OPERATIONS | | $ | 237,783,072 | |
| | |
|
|
|
STATEMENT OF CHANGES IN NET ASSETS
| | | | | | | | |
| | | Year Ended December 31,
| |
| | | 2007
| | | 2006
| |
| INCREASE (DECREASE) IN NET ASSETS | | | | | | | | |
| OPERATIONS: | | | | | | | | |
Net investment income | | $ | 8,658,027 | | | $ | 6,070,737 | |
Net realized gain on investment and foreign currency transactions | | | 134,749,640 | | | | 88,302,644 | |
Net change in unrealized appreciation (depreciation) on investments | | | 94,375,405 | | | | (65,722,336 | ) |
| | |
|
|
| |
|
|
|
NET INCREASE IN NET ASSETS RESULTING FROM OPERATIONS | | | 237,783,072 | | | | 28,651,045 | |
| | |
|
|
| |
|
|
|
| DISTRIBUTIONS: | | | | | | | | |
Class I | | | (6,070,485 | ) | | | (6,106,593 | ) |
| | |
|
|
| |
|
|
|
| SERIES SHARE TRANSACTIONS (Note 7): | | | | | | | | |
Series shares sold [4,033,362 and 6,012,576 shares, respectively] | | | 91,274,690 | | | | 123,017,264 | |
Series shares issued in reinvestment of distributions [259,312 and 286,560 shares, respectively] | | | 6,070,485 | | | | 6,106,593 | |
Series shares repurchased [13,603,127 and 18,306,413 shares, respectively] | | | (303,588,872 | ) | | | (370,019,866 | ) |
| | |
|
|
| |
|
|
|
NET DECREASE IN NET ASSETS RESULTING FROM SERIES SHARE TRANSACTIONS | | | (206,243,697 | ) | | | (240,896,009 | ) |
| | |
|
|
| |
|
|
|
| TOTAL INCREASE (DECREASE) IN NET ASSETS | | | 25,468,890 | | | | (218,351,557 | ) |
| NET ASSETS: | | | | | | | | |
Beginning of year | | | 2,096,889,015 | | | | 2,315,240,572 | |
| | |
|
|
| |
|
|
|
End of year | | $ | 2,122,357,905 | | | $ | 2,096,889,015 | |
| | |
|
|
| |
|
|
|
SEE NOTES TO FINANCIAL STATEMENTS.
A129
SCHEDULE OF INVESTMENTS | December 31, 2007 |
| | | | | | | | | | |
| | | Interest
Rate
| | Maturity
Rate
| | Principal
Amount
(000)
| | Value
(Note 2)
|
| | | | | | | | | | | |
Certificates of Deposit — 21.9% | | | | | | | | | | |
Bank of Scotland PLC | | 5.050% | | 03/14/08 | | $ | 40,000 | | $ | 40,001,919 |
Barclays Bank PLC | | 5.140% | | 02/22/08 | | | 25,000 | | | 25,000,000 |
Barclays Bank PLC | | 5.200% | | 04/11/08 | | | 25,000 | | | 25,000,000 |
Barclays Bank PLC | | 5.370% | | 06/04/08 | | | 13,000 | | | 13,000,000 |
Citibank NA | | 4.810% | | 01/25/08 | | | 20,000 | | | 20,000,000 |
HBOS Treasury Services PLC | | 5.400% | | 06/11/08 | | | 10,000 | | | 10,000,000 |
Marshall & Ilsley Bank | | 4.820% | | 02/11/08 | | | 10,000 | | | 10,000,000 |
Regions Bank | | 4.850% | | 02/20/08 | | | 15,000 | | | 15,000,000 |
Royal Bank of Canada(a) | | 5.181% | | 04/04/08 | | | 15,000 | | | 14,998,667 |
Societe Generale NY(a) | | 4.815% | | 03/26/08 | | | 19,200 | | | 19,198,891 |
UBS AG | | 5.400% | | 02/27/08 | | | 25,000 | | | 25,000,000 |
Unicredito Italiano Bank | | 5.190% | | 02/19/08 | | | 50,000 | | | 50,000,000 |
Unicredito Italiano Bank | | 5.030% | | 01/25/08 | | | 15,000 | | | 15,000,296 |
| | | | | | | | | |
|
|
| | | | | | | | | | | 282,199,773 |
| | | | | | | | | |
|
|
Commercial Paper — 35.3% | | | | | | | | | | |
Amsterdam Funding Corp. 144A(c)(d) | | 6.150% | | 01/07/08 | | | 5,000 | | | 4,994,875 |
Amsterdam Funding Corp. 144A(c)(d) | | 6.150% | | 01/08/08 | | | 20,000 | | | 19,976,083 |
Bank of America Corp.(d) | | 4.985% | | 02/08/08 | | | 2,312 | | | 2,299,834 |
Bank of America Corp.(d) | | 4.985% | | 03/10/08 | | | 40,000 | | | 39,617,817 |
Bank of America Corp.(d) | | 4.670% | | 03/17/08 | | | 3,000 | | | 2,970,423 |
Barton Capital Corp. 144A(c)(d) | | 6.150% | | 01/09/08 | | | 9,385 | | | 9,372,174 |
Barton Capital Corp. 144A(c)(d) | | 5.700% | | 01/10/08 | | | 16,000 | | | 15,977,200 |
CAFCO LLC 144A(c)(d) | | 6.200% | | 01/10/08 | | | 17,000 | | | 16,973,650 |
Ciesco LP 144A(c)(d) | | 6.000% | | 01/10/08 | | | 14,000 | | | 13,979,000 |
Citigroup Funding, Inc.(d) | | 4.740% | | 02/06/08 | | | 20,051 | | | 19,944,402 |
Citigroup Funding, Inc.(d) | | 4.900% | | 04/21/08 | | | 20,000 | | | 19,697,833 |
Falcon Asset Securitization Corp. 144A(c)(d) | | 5.500% | | 01/22/08 | | | 9,763 | | | 9,731,677 |
Falcon Asset Securitization Corp. 144A(c)(d) | | 5.500% | | 01/25/08 | | | 7,000 | | | 6,974,333 |
ING America Insurance Holdings, Inc. | | 5.050% | | 01/15/08 | | | 14,620 | | | 14,591,288 |
ING America Insurance Holdings, Inc. 144A(c)(d) | | 4.800% | | 03/11/08 | | | 14,000 | | | 13,869,333 |
Irish Life & Permanent PLC 144A(c)(d) | | 5.140% | | 01/28/08 | | | 20,000 | | | 19,922,900 |
JPMorgan Chase & Co.(d) | | 5.030% | | 02/01/08 | | | 9,000 | | | 8,961,018 |
Long Lane Master Trust 144A(c)(d) | | 5.200% | | 01/31/08 | | | 10,000 | | | 9,956,667 |
Old Line Funding Corp. 144A(c)(d) | | 6.100% | | 01/11/08 | | | 42,676 | | | 42,603,688 |
Swedbank AB(d) | | 5.300% | | 01/28/08 | | | 1,750 | | | 1,743,044 |
Swedbank AB(d) | | 5.300% | | 02/04/08 | | | 1,200 | | | 1,193,993 |
Swedbank Mortgage AB(d) | | 5.135% | | 02/22/08 | | | 10,000 | | | 9,925,828 |
Swedbank Mortgage AB(d) | | 5.155% | | 01/15/08 | | | 40,000 | | | 39,919,811 |
Swiss RE Financial Product 144A(c)(d) | | 5.200% | | 01/25/08 | | | 16,000 | | | 15,944,533 |
Toyota Motor Credit Corp.(d) | | 4.770% | | 02/25/08 | | | 48,000 | | | 47,650,200 |
Tulip Funding Corp. 144A(c)(d) | | 5.880% | | 01/10/08 | | | 15,000 | | | 14,977,950 |
Tulip Funding Corp. 144A(c)(d) | | 5.400% | | 01/25/08 | | | 8,000 | | | 7,971,200 |
UBS Finance Delaware LLC(d) | | 5.310% | | 02/20/08 | | | 23,400 | | | 23,227,425 |
| | | | | | | | | |
|
|
| | | | | | | | | | | 454,968,179 |
| | | | | | | | | |
|
|
Loan Participations — 1.1% | | | | | | | | | | |
Cargill Global Funding PLC(b) | | 4.970% | | 01/23/08 | | | 15,000 | | | 15,000,000 |
| | | | | | | | | |
|
|
Other Corporate Obligations — 38.7% | | | | | | | | | | |
American Express Credit Corp. M.T.N.(a) | | 5.346% | | 03/05/08 | | | 27,000 | | | 27,000,801 |
Banco Espanol DE Credit 144A(a)(c) | | 5.199% | | 08/11/08 | | | 37,000 | | | 37,000,001 |
BMW US Capital LLC 144A(a)(c) | | 5.246% | | 09/04/08 | | | 10,000 | | | 10,000,000 |
BNP Paribas(a) | | 5.165% | | 07/03/08 | | | 3,600 | | | 3,599,101 |
Caja de Ahorro y Monte de Piedad de Madrid, S.A. 144A(a)(c) | | 5.349% | | 08/12/08 | | | 13,000 | | | 13,000,000 |
Caterpillar Finance Service M.T.N.(a) | | 5.213% | | 03/04/08 | | | 7,000 | | | 7,000,000 |
Fortis Bank NY 144A(a)(c) | | 5.169% | | 07/18/08 | | | 25,000 | | | 24,997,307 |
General Electric Capital Corp. M.T.N.(a) | | 5.111% | | 07/28/08 | | | 10,000 | | | 10,006,952 |
Genworth Life Insurance Co. (a)(b)(e)
(cost $11,000,000; purchased 8/24/07) | | 4.976% | | 08/22/08 | | | 11,000 | | | 11,000,000 |
SEE NOTES TO FINANCIAL STATEMENTS.
A130
| | | | |
| | | MONEY MARKET PORTFOLIO (Continued) | | |
SCHEDULE OF INVESTMENTS | December 31, 2007 |
| | | | | | | | | | |
| | | Interest
Rate
| | Maturity
Rate
| | Principal
Amount
(000)
| | Value
(Note 2)
|
| | | | | | | | | | | |
Other Corporate Obligations (continued) | | | | | | | | | | |
HSBC USA, Inc. M.T.N.(a) | | 5.037% | | 08/14/08 | | $ | 30,000 | | $ | 30,000,000 |
Irish Life And Permanent PLC M.T.N. 144A(a)(c) | | 4.982% | | 08/20/08 | | | 25,000 | | | 24,999,511 |
John Deere Capital Corp. MTN(a) | | 5.037% | | 09/25/08 | | | 9,000 | | | 8,995,863 |
JPMorgan Chase & Co. M.T.N.(a) | | 5.154% | | 01/25/08 | | | 14,000 | | | 13,997,870 |
JPMorgan Chase & Co. M.T.N.(a) | | 5.218% | | 08/11/08 | | | 30,000 | | | 30,000,000 |
JPMorgan Chase & Co. M.T.N.(a) | | 5.215% | | 09/02/08 | | | 13,000 | | | 13,000,000 |
Kommunalkredit Austria AG 144A(a)(c) | | 4.916% | | 08/22/08 | | | 6,000 | | | 6,000,000 |
Merrill Lynch & Co.(a) | | 5.036% | | 08/22/08 | | | 20,000 | | | 19,977,829 |
Metlife Insurance Co. of Connecticut(a)(b)(e)
(cost $6,000,000; purchased 7/09/07) | | 5.293% | | 07/07/08 | | | 6,000 | | | 6,000,000 |
Metropolitan Life Insurance Co.(a)(b)(e)
(cost $9,000,000; purchased 2/01/07) | | 4.971% | | 02/01/08 | | | 9,000 | | | 9,000,000 |
Morgan Stanley M.T.N.(a) | | 5.350% | | 10/31/08 | | | 31,000 | | | 31,000,000 |
National City Bank(a) | | 5.064% | | 01/25/08 | | | 16,000 | | | 16,000,154 |
National City Bank(a) | | 4.869% | | 02/13/08 | | | 20,000 | | | 20,000,572 |
Nationwide Building Society 144A(a)(c) | | 4.923% | | 07/28/08 | | | 15,000 | | | 15,002,571 |
Nordea Bank AB 144A(a)(c) | | 5.258% | | 08/08/08 | | | 20,000 | | | 20,000,000 |
Nordea Bank AB(a) | | 5.168% | | 04/02/08 | | | 3,000 | | | 2,999,718 |
Nordea Bank AB(a) | | 4.787% | | 03/31/08 | | | 2,800 | | | 2,799,604 |
Paccar Financial Corp. M.T.N.(a) | | 5.215% | | 09/02/08 | | | 10,000 | | | 10,000,000 |
Royal Bank of Canada(a) | | 4.841% | | 03/24/08 | | | 5,000 | | | 4,999,663 |
Royal Bank of Canada M.T.N.(a) | | 5.303% | | 09/10/08 | | | 5,000 | | | 5,000,000 |
Royal Bank of Canada(a) | | 4.790% | | 06/30/08 | | | 5,900 | | | 5,898,411 |
Royal Bank of Scotland(a) | | 5.165% | | 07/03/08 | | | 4,200 | | | 4,198,744 |
Skandinaviska Enskilda Banken AB 144A(a)(c) | | 5.016% | | 08/19/08 | | | 36,000 | | | 36,000,000 |
Wal-Mart Stores(a) | | 4.891% | | 06/16/08 | | | 7,000 | | | 6,998,533 |
Westpac Banking Corp. M.T.N.(a) | | 5.201% | | 07/11/08 | | | 13,000 | | | 12,999,974 |
| | | | | | | | | |
|
|
| | | | | | | | | | | 499,473,179 |
| | | | | | | | | |
|
|
Repurchase Agreement — 1.5% | | | | | | | | | | |
Greenwich Capital Markets, Inc. 4.75%, dated 12/31/07, due 1/02/08 in the amount of $20,085,299 (cost $20,080,000; the value of collateral plus accrued interest was $20,483,154)(g) | | | | | | | 20,080 | | | 20,080,000 |
| | | | | | | | | |
|
|
U.S. Government Agency — 1.2% | | | | | | | | | | |
Federal Home Loan Bank | | Zero | | 02/22/08 | | | 15,000 | | | 14,906,833 |
| | | | | | | | | |
|
|
TOTAL INVESTMENTS — 99.7%
(amortized cost $1,286,627,964(f)) | | | 1,286,627,964 |
OTHER ASSETS IN EXCESS OF LIABILITIES — 0.3% | | | 3,301,686 |
| | | | | | | | | |
|
|
NET ASSETS — 100.0% | | $ | 1,289,929,650 |
| | | | | | | | | |
|
|
The following abbreviation is used in portfolio descriptions:
| (a) | Indicates a variable rate security. The maturity date presented for these instruments is the later of the next date on which the security can be redeemed at par or the next date on which the rate of interest is adjusted. The interest rate shown reflects the rate in effect at December 31, 2007. |
| (b) | Indicates an illiquid security. |
| (c) | Securities were purchased pursuant to Rule 144A under the Securities Act of 1933 and may not be resold subject to that rule except to qualified institutional buyers. Unless otherwise noted, 144A securities are deemed to be liquid. |
| (d) | Rate quoted represents yield-to-maturity as of purchase date. |
| (e) | Indicates a restricted security; the aggregate cost of such securities is $26,000,000. The aggregate value of $26,000,000 is approximately 2.0% of net assets. |
| (f) | The cost of securities for federal income tax purposes is substantially the same as for financial reporting purposes. |
| (g) | Repurchase agreement is collateralized by United States Treasuries or federal agency obligations. |
SEE NOTES TO FINANCIAL STATEMENTS.
A131
| | | | |
| | | MONEY MARKET PORTFOLIO (Continued) | | |
SCHEDULE OF INVESTMENTS | December 31, 2007 |
The industry classification of portfolio holdings and other assets in excess of liabilities shown as a percentage of net assets as of December 31, 2007 was as follows:
| | | |
Commercial Banks | | 30.0 | % |
Foreign Banks | | 26.4 | |
Asset Backed Securities | | 15.7 | |
Finance Services | | 9.6 | |
Automotive | | 4.5 | |
Insurance | | 4.2 | |
Security Broker & Dealers | | 4.0 | |
Non Captive Finance | | 3.6 | |
Capital Goods | | 1.2 | |
Retail | | 0.5 | |
| | |
|
|
| | | 99.7 | |
Other assets in excess of liabilities | | 0.3 | |
| | |
|
|
| | | 100.00 | % |
| | |
|
|
SEE NOTES TO FINANCIAL STATEMENTS.
A132
| | | | |
| | | MONEY MARKET PORTFOLIO (Continued) | | |
STATEMENT OF ASSETS AND LIABILITIES
December 31, 2007
| | | |
| ASSETS | | | |
Investments, at value (amortized cost $1,286,627,964) | | $ | 1,286,627,964 |
Interest receivable | | | 5,366,492 |
Receivable for Series shares sold | | | 1,328,856 |
Prepaid expenses | | | 13,523 |
| | |
|
|
Total Assets | | | 1,293,336,835 |
| | |
|
|
| LIABILITIES | | | |
Payable for Series shares repurchased | | | 2,790,392 |
Management fee payable | | | 437,556 |
Accrued expenses and other liabilities | | | 175,501 |
Payable to custodian | | | 2,861 |
Transfer agent fee payable | | | 875 |
| | |
|
|
Total Liabilities | | | 3,407,185 |
| | |
|
|
| NET ASSETS | | $ | 1,289,929,650 |
| | |
|
|
Net assets were comprised of: | | | |
Paid-in capital | | $ | 1,289,929,650 |
| | |
|
|
Net assets, December 31, 2007 | | $ | 1,289,929,650 |
| | |
|
|
Net asset value and redemption price per share, $1,289,929,650 / 128,992,964 outstanding shares of beneficial interest (authorized 275,000,000 shares) | | $ | 10.00 |
| | |
|
|
STATEMENT OF OPERATIONS
For the Ended December 31, 2007
| | | |
| INVESTMENT INCOME | | | |
Interest | | $ | 67,487,743 |
| | |
|
|
| EXPENSES | | | |
Management fee | | | 5,028,598 |
Shareholders’ reports | | | 165,000 |
Custodian’s fees and expenses | | | 121,000 |
Insurance expenses | | | 27,000 |
Trustees’ fees | | | 23,000 |
Audit fee | | | 15,000 |
Legal fees and expenses | | | 8,000 |
Transfer agent’s fee and expenses (including affiliated expense of $5,800) (Note 4) | | | 7,000 |
Miscellaneous | | | 2,881 |
| | |
|
|
Total expenses | | | 5,397,479 |
| | |
|
|
| NET INVESTMENT INCOME | | | 62,090,264 |
| | |
|
|
| NET REALIZED GAIN ON INVESTMENT TRANSACTIONS | | | 25,015 |
| | |
|
|
| NET INCREASE IN NET ASSETS RESULTING FROM OPERATIONS | | $ | 62,115,279 |
| | |
|
|
STATEMENT OF CHANGES IN NET ASSETS
| | | | | | | | |
| | | Year Ended December 31,
| |
| | | 2007
| | | 2006
| |
| INCREASE (DECREASE) IN NET ASSETS | | | | | | | | |
| OPERATIONS: | | | | | | | | |
Net investment income | | $ | 62,090,264 | | | $ | 47,626,445 | |
Net realized gain (loss) on investment transactions | | | 25,015 | | | | (1,731 | ) |
| | |
|
|
| |
|
|
|
NET INCREASE IN NET ASSETS RESULTING FROM OPERATIONS | | | 62,115,279 | | | | 47,624,714 | |
| | |
|
|
| |
|
|
|
| DISTRIBUTIONS: | | | (62,115,279 | ) | | | (47,624,714 | ) |
| | |
|
|
| |
|
|
|
| SERIES SHARE TRANSACTIONS: | | | | | | | | |
Series shares sold [70,927,906 and 76,634,918 shares, respectively] | | | 709,279,065 | | | | 766,349,174 | |
Series shares issued in reinvestment of distributions [6,211,703 and 4,772,689 shares, respectively] | | | 62,117,029 | | | | 47,726,894 | |
Series shares repurchased [54,199,025 and 60,549,475 shares, respectively] | | | (541,990,247 | ) | | | (605,494,752 | ) |
| | |
|
|
| |
|
|
|
NET INCREASE IN NET ASSETS RESULTING FROM SERIES SHARE TRANSACTIONS | | | 229,405,847 | | | | 208,581,316 | |
| | |
|
|
| |
|
|
|
| TOTAL INCREASE IN NET ASSETS | | | 229,405,847 | | | | 208,581,316 | |
| NET ASSETS: | | | | | | | | |
Beginning of year | | | 1,060,523,803 | | | | 851,942,487 | |
| | |
|
|
| |
|
|
|
End of year | | $ | 1,289,929,650 | | | $ | 1,060,523,803 | |
| | |
|
|
| |
|
|
|
SEE NOTES TO FINANCIAL STATEMENTS.
A133
| | | | |
| | | NATURAL RESOURCES PORTFOLIO | | |
SCHEDULE OF INVESTMENTS | December 31, 2007 |
| | | | | |
| LONG-TERM INVESTMENTS — 97.7% | | Value
(Note 2)
|
| COMMON STOCKS — 95.9% | | Shares
| |
| | | | | | |
Aluminum — 1.3% | | | | | |
Century Aluminum Co.(a)(b) | | 411,300 | | $ | 22,185,522 |
| | | | |
|
|
Basic Metals — 1.2% | | | | | |
Cameco Corp. (Canada) | | 442,300 | | | 17,733,230 |
Platmin Ltd., 144A (South Africa)(a) | | 276,900 | | | 2,668,138 |
| | | | |
|
|
| | | | | | 20,401,368 |
| | | | |
|
|
Coal — 1.9% | | | | | |
CONSOL Energy, Inc. | | 451,900 | | | 32,319,888 |
| | | | |
|
|
Copper — 5.3% | | | | | |
First Quantum Minerals Ltd. (Canada) | | 322,600 | | | 27,806,456 |
Freeport-McMoRan Copper & Gold, Inc. (Class B)(b) | | 521,519 | | | 53,424,407 |
Southern Copper Corp.(b) | | 96,900 | | | 10,187,097 |
| | | | |
|
|
| | | | | | 91,417,960 |
| | | | |
|
|
Diversified Exploration & Production — 9.2% | | | | | |
Anadarko Petroleum Corp. | | 408,800 | | | 26,854,072 |
Cairn Energy PLC (United Kingdom) | | 398,000 | | | 24,354,089 |
Concho Resources, Inc.(a) | | 505,700 | | | 10,422,477 |
Denbury Resources, Inc.(a) | | 704,200 | | | 20,949,950 |
Devon Energy Corp. | | 218,400 | | | 19,417,944 |
Newfield Exploration Co.(a) | | 315,500 | | | 16,626,850 |
OGX Petroleo e Gas Participacoes SA (Brazil)(Private)(a)(f)(g)
(cost $7; purchased 12/11/07) | | 2 | | | 6 |
Talisman Energy, Inc. | | 818,900 | | | 15,166,028 |
Woodside Petroleum Ltd. (Australia) | | 569,462 | | | 24,960,517 |
| | | | |
|
|
| | | | | | 158,751,933 |
| | | | |
|
|
Diversified Metals & Mining — 4.0% | | | | | |
African Rainbow Minerals Ltd. (South Africa) | | 545,850 | | | 12,140,028 |
First Uranium Corp. (South Africa)(a) | | 390,800 | | | 3,741,892 |
First Uranium Corp., 144A (South Africa)(a) | | 400,000 | | | 3,829,981 |
FNX Mining Co., Inc. (Canada)(a) | | 351,100 | | | 10,761,209 |
FNX Mining Co., Inc., 144A (Canada)(a) | | 56,300 | | | 1,725,594 |
Northern Dynasty Minerals Ltd.(a)(b) | | 859,700 | | | 11,287,861 |
Sterlite Industries India Ltd., ADR (India)(a)(b) | | 992,800 | | | 25,882,296 |
| | | | |
|
|
| | | | | | 69,368,861 |
| | | | |
|
|
Diversified Resources — 2.3% | | | | | |
Cia Vale do Rio Doce, ADR (Brazil)(b) | | 718,500 | | | 23,473,395 |
Newcrest Mining Ltd. (Australia) | | 566,691 | | | 16,340,549 |
| | | | |
|
|
| | | | | | 39,813,944 |
| | | | |
|
|
Drillers — 3.9% | | | | | |
Nabors Industries Ltd.(a)(b) | | 198,400 | | | 5,434,176 |
Noble Corp. | | 453,200 | | | 25,610,332 |
Transocean, Inc. | | 246,403 | | | 35,272,589 |
| | | | |
|
|
| | | | | | 66,317,097 |
| | | | |
|
|
Energy Services — 12.5% | | | | | |
Baker Hughes, Inc. | | 183,900 | | | 14,914,290 |
Cameron International Corp.(a)(b) | | 527,000 | | | 25,364,510 |
Exterran Holdings, Inc.(a)(b) | | 181,000 | | | 14,805,800 |
FMC Technologies, Inc.(a) | | 225,000 | | | 12,757,500 |
Halliburton Co. | | 453,000 | | | 17,173,230 |
Integra Group Holdings, GDR(a) | | 513,800 | | | 8,693,496 |
National-Oilwell Varco, Inc.(a)(b) | | 116,400 | | | 8,550,744 |
Petroleum Geo-Services ASA, ADR (Norway)(b) | | 548,100 | | | 15,812,685 |
Schlumberger Ltd. | | 211,900 | | | 20,844,603 |
SEACOR Holdings, Inc.(a)(b) | | 131,400 | | | 12,186,036 |
SEE NOTES TO FINANCIAL STATEMENTS.
A134
| | | | |
| | | NATURAL RESOURCES PORTFOLIO (Continued) | | |
SCHEDULE OF INVESTMENTS | December 31, 2007 |
| | | | | |
| COMMON STOCKS | | Value
(Note 2)
|
| (continued) | | Shares
| |
| | | | | | |
Energy Services (continued) | | | | | |
Smith International, Inc. | | 232,800 | | $ | 17,192,280 |
Superior Energy Services, Inc.(a) | | 394,900 | | | 13,592,458 |
Tenaris SA, ADR (Luxembourg)(b) | | 556,100 | | | 24,874,353 |
W-H Energy Services, Inc.(a) | | 136,600 | | | 7,678,286 |
| | | | |
|
|
| | | | | | 214,440,271 |
| | | | |
|
|
Foods — 1.1% | | | | | |
Agrenco Ltd., 144A (Brazil)(a) | | 1,253,800 | | | 6,776,155 |
Cosan Ltd. (Class A)(a)(b) | | 972,400 | | | 12,252,240 |
| | | | |
|
|
| | | | | | 19,028,395 |
| | | | |
|
|
Forest Products — 0.9% | | | | | |
Plum Creek Timber Co., Inc. (REIT)(b) | | 222,900 | | | 10,262,316 |
Rayonier, Inc. (REIT) | | 106,100 | | | 5,012,164 |
| | | | |
|
|
| | | | | | 15,274,480 |
| | | | |
|
|
Gold — 13.5% | | | | | |
AGNICO-EAGLE Mines Ltd.(b) | | 457,100 | | | 24,971,372 |
AXMIN, Inc. (Canada)(a) | | 4,338,700 | | | 3,780,619 |
Barrick Gold Corp. | | 568,394 | | | 23,900,967 |
Centerra Gold, Inc. (Canada)(a) | | 597,600 | | | 7,611,158 |
Cia de Minas Buenaventura SA, ADR (Peru)(b) | | 416,500 | | | 23,573,900 |
Crystallex International Corp.(a)(b) | | 2,345,700 | | | 5,348,196 |
Eldorado Gold Corp. (Canada)(a) | | 2,220,500 | | | 13,116,688 |
European Goldfields Ltd. (Canada)(a) | | 2,960,300 | | | 16,436,946 |
Gabriel Resources Ltd. (Canada)(a) | | 1,758,800 | | | 3,510,650 |
Gold Reserve, Inc. (Canada)(a) | | 131,900 | | | 696,286 |
Gold Reserve, Inc.(a)(b) | | 596,000 | | | 3,099,200 |
Goldcorp, Inc.(b) | | 414,277 | | | 14,056,419 |
Greystar Resources Ltd. (Canada)(a) | | 756,000 | | | 4,825,776 |
Highland Gold Mining Ltd. (United Kingdom)(a) | | 427,900 | | | 1,354,330 |
Kinross Gold Corp.(a)(b) | | 1,470,800 | | | 27,062,719 |
Lihir Gold Ltd., 144A (Papua New Guinea)(a) | | 2,344,983 | | | 7,295,619 |
Lihir Gold Ltd., ADR (Papua New Guinea)(b) | | 570,300 | | | 17,787,657 |
Nevsun Resources Ltd. (Canada)(a) | | 1,110,200 | | | 2,587,223 |
Newcrest Mining Ltd., 144A (Australia) | | 245,627 | | | 7,082,660 |
Newmont Mining Corp. | | 318,600 | | | 15,557,238 |
Orezone Resources, Inc. (Canada)(a) | | 1,464,300 | | | 1,780,394 |
Seabridge Gold, Inc.(a)(b) | | 62,300 | | | 1,834,112 |
SEMAFO, Inc. (Canada)(a) | | 1,302,800 | | | 1,333,227 |
SEMAFO, Inc., 144A (Canada)(a) | | 3,216,300 | | | 3,291,416 |
| | | | |
|
|
| | | | | | 231,894,772 |
| | | | |
|
|
Integrated Oil/Domestic — 6.1% | | | | | |
Hess Corp. | | 252,300 | | | 25,446,978 |
Marathon Oil Corp. | | 368,700 | | | 22,439,082 |
Murphy Oil Corp. | | 312,300 | | | 26,495,532 |
Occidental Petroleum Corp. | | 402,100 | | | 30,957,679 |
| | | | |
|
|
| | | | | | 105,339,271 |
| | | | |
|
|
Integrated Oil/International — 4.6% | | | | | |
Gazprom OAO, ADR (Russia) | | 319,950 | | | 18,141,165 |
Petroleo Brasileiro SA, ADR (Brazil) | | 304,000 | | | 35,032,960 |
Sasol Ltd., ADR (South Africa)(b) | | 515,200 | | | 25,486,944 |
| | | | |
|
|
| | | | | | 78,661,069 |
| | | | |
|
|
Iron & Steel — 5.9% | | | | | |
Cleveland-Cliffs, Inc.(b) | | 233,300 | | | 23,516,640 |
MMX Mineracao e Metalicos SA (Brazil)(a) | | 118,200 | | | 62,420,225 |
Nucor Corp. | | 254,400 | | | 15,065,568 |
| | | | |
|
|
| | | | | | 101,002,433 |
| | | | |
|
|
SEE NOTES TO FINANCIAL STATEMENTS.
A135
| | | | |
| | | NATURAL RESOURCES PORTFOLIO (Continued) | | |
SCHEDULE OF INVESTMENTS | December 31, 2007 |
| | | | | | |
| COMMON STOCKS | | Value
(Note 2)
|
| (continued) | | Shares
| |
| | | | | | | |
Mineral Sands — 4.6% | | | | | | |
OPTI Canada, Inc. (Canada)(a) | | | 1,290,248 | | $ | 21,701,319 |
Suncor Energy, Inc. | | | 388,300 | | | 42,219,859 |
UTS Energy Corp. (Canada)(a) | | | 2,738,900 | | | 14,930,120 |
| | | | | |
|
|
| | | | | | | 78,851,298 |
| | | | | |
|
|
Natural Gas Production — 10.1% | | | | | | |
BPI Energy Holdings, Inc.(a) | | | 2,800,000 | | | 784,000 |
Cabot Oil & Gas Corp. | | | 186,600 | | | 7,533,042 |
CNX Gas Corp.(a) | | | 260,400 | | | 8,319,780 |
CNX Gas Corp., 144A(a) | | | 89,800 | | | 2,869,110 |
Equitable Resources, Inc. | | | 309,000 | | | 16,463,520 |
Petrohawk Energy Corp.(a)(b) | | | 919,500 | | | 15,916,545 |
Quicksilver Resources, Inc.(a)(b) | | | 288,700 | | | 17,203,633 |
Range Resources Corp. | | | 590,550 | | | 30,330,648 |
Southwestern Energy Co.(a) | | | 651,800 | | | 36,318,296 |
Trident Resources Corp. (Canada)(Private)
(cost $4,402,178; purchased 12/4/03)(a)(f)(g) | | | 412,657 | | | 4,181,134 |
Ultra Petroleum Corp.(a)(b) | | | 251,500 | | | 17,982,250 |
XTO Energy, Inc. | | | 307,125 | | | 15,773,940 |
| | | | | |
|
|
| | | | | | | 173,675,898 |
| | | | | |
|
|
Non-Natural Resources Industry — 1.5% | | | | | | |
DP World Ltd., 144A(a) | | | 2,930,000 | | | 3,486,700 |
NRG Energy, Inc.(a)(b) | | | 537,000 | | | 23,273,580 |
| | | | | |
|
|
| | | | | | | 26,760,280 |
| | | | | |
|
|
Oil & Gas Refining & Marketing — 2.0% | | | | | | |
Frontier Oil Corp. | | | 376,900 | | | 15,294,602 |
Holly Corp. | | | 182,900 | | | 9,307,781 |
Valero Energy Corp. | | | 145,600 | | | 10,196,368 |
| | | | | |
|
|
| | | | | | | 34,798,751 |
| | | | | |
|
|
Oil & Gas Storage & Transportation — 0.9% | | | | | | |
Williams Cos., Inc. | | | 431,700 | | | 15,446,226 |
| | | | | |
|
|
Platinum — 1.4% | | | | | | |
Impala Platinum Holdings Ltd., ADR (South Africa)(b) | | | 685,400 | | | 24,057,540 |
| | | | | |
|
|
Silver — 1.7% | | | | | | |
Apex Silver Mines Ltd.(a)(b) | | | 430,100 | | | 6,554,724 |
Coeur d’Alene Mines Corp.(a)(b) | | | 1,455,600 | | | 7,190,664 |
Pan American Silver Corp. (Canada)(a) | | | 80,672 | | | 2,860,037 |
Pan American Silver Corp.(a)(b) | | | 346,900 | | | 12,117,217 |
| | | | | |
|
|
| | | | | | | 28,722,642 |
| | | | | |
|
|
TOTAL COMMON STOCKS
(cost $938,476,456) | | | 1,648,529,899 |
| | | | | |
|
|
| | |
| CORPORATE BONDS — 0.9% | | Principal
Amount
(000)#
| | |
Natural Gas Production — 0.9% | | | | | | |
Trident Subordinated Unsecured Note, PIK, 12.396%, due 8/12/12
(cost $14,785,418; purchased 8/20/07-12/24/07)(Canada)(Private)(f)(g) | | $ | 15,542 | | | 15,747,129 |
| | | | | |
|
|
| | |
| PREFERRED STOCK — 0.8% | | Shares
| | |
Diversified Exploration & Production — 0.8% | | | | | | |
OGX Petroleo e Gas Participacoes SA (Class A)(Brazil)(Private)(a)(f)(g)
(cost $13,332,356; purchased 12/17/07) | | | 13,364,000 | | | 13,601,999 |
| | | | | |
|
|
SEE NOTES TO FINANCIAL STATEMENTS.
A136
| | | | |
| | | NATURAL RESOURCES PORTFOLIO (Continued) | | |
SCHEDULE OF INVESTMENTS | December 31, 2007 |
| | | | | | |
| WARRANTS(a) — 0.1% | | Units
| | Value
(Note 2)
| |
| | | | | | | |
Natural Gas Production | | | | | | |
Trident Warrant, expiring 1/01/15 (Canada)(Private)
(cost $0; purchased 8/20/07)(f)(g) | | 1,476,143 | | $ | 150 | |
| | | | |
|
|
|
Silver — 0.1% | | | | | | |
Pan American Silver Corp. (Canada), expiring 2/20/08
(cost $139,820) | | 49,786 | | | 1,159,714 | |
| | | | |
|
|
|
TOTAL WARRANTS
(cost $139,820) | | | 1,159,864 | |
| | | | |
|
|
|
TOTAL LONG-TERM INVESTMENTS
(cost $966,734,050) | | | 1,679,038,891 | |
| | | | |
|
|
|
| | |
| SHORT-TERM INVESTMENT — 19.3% | | Shares
| | | |
Affiliated Money Market Mutual Fund | | | | | | |
Dryden Core Investment Fund — Taxable Money Market Series
(cost $331,576,943; includes $289,698,998 of cash collateral received for securities on loan)(Note 4)(c)(d) | | 331,576,943 | | | 331,576,943 | |
| | | | |
|
|
|
TOTAL INVESTMENTS(e) — 117.0%
(cost $1,298,310,993) | | | 2,010,615,834 | |
LIABILITIES IN EXCESS OF OTHER ASSETS — (17.0%) | | | (292,818,670 | ) |
| | | | |
|
|
|
NET ASSETS — 100.0% | | $ | 1,717,797,164 | |
| | | | |
|
|
|
The following abbreviations are used in portfolio descriptions:
| | |
| 144A | | Security was purchased pursuant to Rule 144A under the Securities Act of 1933 and may not be resold subject to that rule except to qualified institutional buyers. Unless otherwise noted, 144A securities are deemed to be liquid. |
| ADR | | American Depositary Receipt |
| GDR | | Global Depositary Receipt |
| PIK | | Payment in Kind |
| REIT | | Real Estate Investment Trust |
| # | Principal amount shown in U.S. dollars unless otherwise stated. |
| (a) | Non-income producing security. |
| (b) | All or portion of security is on loan. The aggregate market value of such securities is $273,753,391; cash collateral of $289,698,998 (included in liabilities) was received with which the Portfolio purchased highly liquid short-term investments. |
| (c) | Represents security, or portion thereof, purchased with cash collateral for securities on loan. |
| (d) | Prudential Investments LLC, the manager of the Portfolio, also serves as manager of the Dryden Core Investment Fund-Taxable Money Market Series. |
| (e) | As of December 31, 2007, 8 securities representing $89,209,763 and 5.2% of net assets were fair valued in accordance with the policies adopted by the Board of Trustees. |
| (f) | Indicates illiquid securities. |
| (g) | Indicates a security restricted to resale. The aggregate cost of such securities was $32,519,959. The aggregate value of $33,530,418 is approximately 2.0% of net assets. |
SEE NOTES TO FINANCIAL STATEMENTS.
A137
| | | | |
| | | NATURAL RESOURCES PORTFOLIO (Continued) | | |
SCHEDULE OF INVESTMENTS | December 31, 2007 |
The industry classification of portfolio holdings and liabilities in excess of other assets shown as a percentage of net assets as of December 31, 2007 was as follows:
| | | |
Affiliated Money Market Mutual Fund (including 16.9% of collateral received for securities on loan) | | 19.3 | % |
Gold | | 14.4 | |
Energy Services | | 12.5 | |
Natural Gas Production | | 11.0 | |
Diversified Exploration & Production | | 10.0 | |
Integrated Oil/Domestic | | 6.1 | |
Iron & Steel | | 5.9 | |
Copper | | 5.3 | |
Integrated Oil/International | | 4.6 | |
Mineral Sands | | 4.6 | |
Diversified Metals & Mining | | 4.0 | |
Drillers | | 3.9 | |
Oil & Gas Refining & Marketing | | 2.0 | |
Coal | | 1.9 | |
Silver | | 1.8 | |
Non-Natural Resources | | 1.5 | |
Diversified Resources | | 1.4 | |
Platinum | | 1.4 | |
Aluminum | | 1.3 | |
Basic Metals | | 1.2 | |
Food | | 1.1 | |
Forest Products | | 0.9 | |
Oil & Gas Storage & Transportation | | 0.9 | |
| | |
|
|
| | | 117.0 | |
Liabilities in excess of other assets | | (17.0 | ) |
| | |
|
|
| | | 100.0 | % |
| | |
|
|
SEE NOTES TO FINANCIAL STATEMENTS.
A138
| | | | |
| | | NATURAL RESOURCES PORTFOLIO (Continued) | | |
STATEMENT OF ASSETS AND LIABILITIES
December 31, 2007
| | | |
| ASSETS | | | |
Investments, at value, including securities on loan of $273,753,391: | | | |
Unaffiliated investments (cost $966,734,050) | | $ | 1,679,038,891 |
Affiliated investments (cost $331,576,943) | | | 331,576,943 |
Cash | | | 221,398 |
Dividends and interest receivable | | | 1,199,001 |
Receivable for Series shares sold | | | 249,192 |
Tax reclaims receivable | | | 70,516 |
Prepaid expenses | | | 15,074 |
Foreign currency, at value (cost $1,954) | | | 1,880 |
| | |
|
|
Total Assets | | | 2,012,372,895 |
| | |
|
|
| LIABILITIES | | | |
Collateral for securities on loan | | | 289,698,998 |
Payable for investments purchased | | | 3,764,824 |
Management fee payable | | | 626,924 |
Payable for Series shares repurchased | | | 295,818 |
Accrued expenses and other liabilities | | | 172,864 |
Distribution fee payable | | | 9,556 |
Administration fee payable | | | 5,733 |
Transfer agent fee payable | | | 1,014 |
| | |
|
|
Total Liabilities | | | 294,575,731 |
| | |
|
|
| NET ASSETS | | $ | 1,717,797,164 |
| | |
|
|
Net assets were comprised of: | | | |
Paid-in capital in excess of par | | $ | 824,426,452 |
Retained earnings | | | 893,370,712 |
| | |
|
|
Net assets, December 31, 2007 | | $ | 1,717,797,164 |
| | |
|
|
| Class I: | | | |
Net asset value and redemption price per share, $1,669,874,032 / 29,669,800 outstanding shares of beneficial interest (authorized 100,000,000 shares) | | $ | 56.28 |
| | |
|
|
| Class II: | | | |
Net asset value and redemption price per share, $47,923,132 / 856,966 outstanding shares of beneficial interest (authorized 10,000,000 shares) | | $ | 55.92 |
| | |
|
|
STATEMENT OF OPERATIONS
Year Ended December 31, 2007
| | | | |
| INVESTMENT INCOME | | | | |
Unaffiliated dividend income (net of foreign withholding taxes of $235,504) | | $ | 15,071,103 | |
Affiliated income from securities loaned, net | | | 1,209,592 | |
Affiliated dividend income | | | 1,037,366 | |
Interest | | | 709,976 | |
| | |
|
|
|
| | | | 18,028,037 | |
| | |
|
|
|
| EXPENSES | | | | |
Management fee | | | 6,318,386 | |
Distribution fee—Class II | | | 75,674 | |
Administration fee—Class II | | | 45,404 | |
Custodian’s fees and expenses | | | 204,000 | |
Shareholders’ reports | | | 157,000 | |
Transfer agent’s fee and expenses (including affiliated expense of $4,500) (Note 4) | | | 28,000 | |
Insurance expenses | | | 28,000 | |
Trustees’ fees | | | 26,000 | |
Audit fee | | | 17,000 | |
Loan interest expense (Note 8) | | | 10,138 | |
Legal fees and expenses | | | 6,000 | |
Commitment fee on syndicated credit agreement | | | 4,000 | |
Miscellaneous | | | 8,572 | |
| | |
|
|
|
Total expenses | | | 6,928,174 | |
| | |
|
|
|
| NET INVESTMENT INCOME | | | 11,099,863 | |
| | |
|
|
|
| NET REALIZED AND UNREALIZED GAIN (LOSS) ON INVESTMENTS AND FOREIGN CURRENCIES | | | | |
Net realized gain (loss) on: | | | | |
Investment transactions | | | 192,587,046 | |
Foreign currency transactions | | | (250,716 | ) |
| | |
|
|
|
| | | | 192,336,330 | |
| | |
|
|
|
Net change in unrealized appreciation (depreciation) on: | | | | |
Investments | | | 354,652,185 | |
Foreign currencies | | | 190 | |
| | |
|
|
|
| | | | 354,652,375 | |
| | |
|
|
|
| NET GAIN ON INVESTMENTS AND FOREIGN CURRENCIES | | | 546,988,705 | |
| | |
|
|
|
| NET INCREASE IN NET ASSETS RESULTING FROM OPERATIONS | | $ | 558,088,568 | |
| | |
|
|
|
STATEMENT OF CHANGES IN NET ASSETS
| | | | | | | | |
| | | Year Ended December 31,
| |
| | | 2007
| | | 2006
| |
INCREASE (DECREASE) IN NET ASSETS
OPERATIONS: | | | | | | | | |
Net investment income | | $ | 11,099,863 | | | $ | 9,007,327 | |
Net realized gain on investment and foreign currency transactions | | | 192,336,330 | | | | 268,127,992 | |
Net change in unrealized appreciation (depreciation) on investments and foreign currencies | | | 354,652,375 | | | | (53,352,901 | ) |
| | |
|
|
| |
|
|
|
NET INCREASE IN NET ASSETS RESULTING FROM OPERATIONS | | | 558,088,568 | | | | 223,782,418 | |
| | |
|
|
| |
|
|
|
| DISTRIBUTIONS: | | | | | | | | |
Distributions | | | | | | | | |
Class I | | | (269,445,554 | ) | | | (195,926,670 | ) |
Class II | | | (7,597,067 | ) | | | (2,153,216 | ) |
| | |
|
|
| |
|
|
|
TOTAL DISTRIBUTIONS | | | (277,042,621 | ) | | | (198,079,886 | ) |
| | |
|
|
| |
|
|
|
| SERIES SHARE TRANSACTIONS (Note 7): | | | | | | | | |
Series shares sold [2,086,590 and 2,190,005 shares, respectively] | | | 120,995,195 | | | | 98,062,879 | |
Series shares issued in reinvestment of distributions [5,163,802 and 4,866,801 shares, respectively] | | | 277,042,621 | | | | 198,079,886 | |
Series shares repurchased [3,216,652 and 3,033,953 shares, respectively] | | | (171,222,869 | ) | | | (133,276,101 | ) |
| | |
|
|
| |
|
|
|
NET INCREASE IN NET ASSETS RESULTING FROM SERIES SHARE TRANSACTIONS | | | 226,814,947 | | | | 162,866,664 | |
| | |
|
|
| |
|
|
|
| TOTAL INCREASE IN NET ASSETS | | | 507,860,894 | | | | 188,569,196 | |
| NET ASSETS: | | | | | | | | |
Beginning of year | | | 1,209,936,270 | | | | 1,021,367,074 | |
| | |
|
|
| |
|
|
|
End of year | | $ | 1,717,797,164 | | | $ | 1,209,936,270 | |
| | |
|
|
| |
|
|
|
SEE NOTES TO FINANCIAL STATEMENTS.
A139
| | | | |
| | | SMALL CAPITALIZATION STOCK PORTFOLIO | | |
SCHEDULE OF INVESTMENTS | December 31, 2007 |
| | | | | |
| LONG-TERM INVESTMENTS — 99.1% |
| COMMON STOCKS | | Shares
| | Value
(Note 2)
|
| | | | | | |
Aerospace & Defense — 2.5% | | | | | |
AAR Corp.(a)(b) | | 49,695 | | $ | 1,889,901 |
Applied Signal Technology, Inc. | | 16,189 | | | 219,847 |
Ceradyne, Inc.(a)(b) | | 35,826 | | | 1,681,314 |
Cubic Corp.(b) | | 20,369 | | | 798,465 |
Curtiss-Wright Corp. | | 58,280 | | | 2,925,655 |
Esterline Technologies Corp.(a)(b) | | 38,405 | | | 1,987,459 |
GenCorp, Inc.(a) | | 74,045 | | | 863,365 |
Moog, Inc. (Class A Stock)(a)(b) | | 55,655 | | | 2,549,555 |
Teledyne Technologies, Inc.(a)(b) | | 46,045 | | | 2,455,580 |
Triumph Group, Inc. | | 21,888 | | | 1,802,477 |
| | | | |
|
|
| | | | | | 17,173,618 |
| | | | |
|
|
Air Freight & Logistics — 0.4% | | | | | |
Forward Air Corp. | | 39,578 | | | 1,233,646 |
HUB Group, Inc.(a)(b) | | 50,846 | | | 1,351,487 |
| | | | |
|
|
| | | | | | 2,585,133 |
| | | | |
|
|
Airlines — 0.4% | | | | | |
Frontier Airlines, Inc.(a)(b) | | 47,986 | | | 252,406 |
Mesa Air Group, Inc.(a) | | 37,565 | | | 116,076 |
SkyWest, Inc. | | 79,822 | | | 2,143,221 |
| | | | |
|
|
| | | | | | 2,511,703 |
| | | | |
|
|
Auto Components — 0.2% | | | | | |
Drew Industries, Inc.(a)(b) | | 23,823 | | | 652,750 |
Spartan Motors, Inc.(b) | | 42,700 | | | 326,228 |
Standard Motor Products, Inc.(b) | | 15,647 | | | 127,680 |
Superior Industries International, Inc. | | 30,343 | | | 551,332 |
| | | | |
|
|
| | | | | | 1,657,990 |
| | | | |
|
|
Automobiles — 0.3% | | | | | |
Coachmen Industries, Inc. | | 20,652 | | | 122,879 |
Fleetwood Enterprises, Inc.(a)(b) | | 84,172 | | | 503,349 |
Monaco Coach Corp. | | 39,239 | | | 348,442 |
Winnebago Industries, Inc.(b) | | 38,710 | | | 813,684 |
| | | | |
|
|
| | | | | | 1,788,354 |
| | | | |
|
|
Beverages — 0.1% | | | | | |
Boston Beer Co., Inc.(a) | | 13,400 | | | 504,510 |
| | | | |
|
|
Biotechnology — 0.9% | | | | | |
ArQule, Inc.(a) | | 45,265 | | | 262,537 |
LifeCell Corp.(a)(b) | | 40,100 | | | 1,728,711 |
Martek Biosciences Corp.(a)(b) | | 42,300 | | | 1,251,234 |
Regeneron Pharmaceuticals, Inc.(a)(b) | | 86,702 | | | 2,093,853 |
Savient Pharmaceuticals, Inc.(a) | | 57,508 | | | 1,320,959 |
| | | | |
|
|
| | | | | | 6,657,294 |
| | | | |
|
|
Building Products — 1.1% | | | | | |
Apogee Enterprises, Inc.(b) | | 38,138 | | | 652,541 |
Gibraltar Industries, Inc. | | 39,100 | | | 602,922 |
Griffon Corp.(a) | | 34,401 | | | 428,292 |
Lennox International, Inc. | | 83,891 | | | 3,474,765 |
NCI Building Systems, Inc.(a) | | 26,359 | | | 758,876 |
Simpson Manufacturing Co., Inc.(b) | | 48,813 | | | 1,297,938 |
Universal Forest Products, Inc. | | 24,887 | | | 733,171 |
| | | | |
|
|
| | | | | | 7,948,505 |
| | | | |
|
|
Capital Markets — 1.0% | | | | | |
Investment Technology Group, Inc.(a)(b) | | 57,489 | | | 2,735,902 |
LaBranche & Co., Inc.(a)(b) | | 70,878 | | | 357,225 |
SEE NOTES TO FINANCIAL STATEMENTS.
A140
| | | | |
| | | SMALL CAPITALIZATION STOCK PORTFOLIO (Continued) | | |
SCHEDULE OF INVESTMENTS | December 31, 2007 |
| | | | | |
COMMON STOCKS
(continued) | | Shares
| | Value
(Note 2)
|
| | | | | | |
Capital Markets (continued) | | | | | |
OptionsXpress Holdings, Inc. | | 57,800 | | $ | 1,954,796 |
Piper Jaffray Cos., Inc.(a)(b) | | 22,921 | | | 1,061,701 |
SWS Group, Inc. | | 29,441 | | | 373,017 |
TradeStation Group, Inc.(a) | | 37,594 | | | 534,211 |
| | | | |
|
|
| | | | | | 7,016,852 |
| | | | |
|
|
Chemicals — 1.3% | | | | | |
A. Schulman, Inc. | | 36,622 | | | 789,204 |
Arch Chemicals, Inc. | | 32,433 | | | 1,191,913 |
Georgia Gulf Corp.(b) | | 45,034 | | | 298,125 |
H.B. Fuller Co.(b) | | 78,719 | | | 1,767,241 |
Material Sciences Corp.(a) | | 16,328 | | | 121,317 |
OM Group, Inc.(a)(b) | | 39,907 | | | 2,296,248 |
Omnova Solutions, Inc.(a) | | 55,649 | | | 245,412 |
Penford Corp. | | 14,605 | | | 373,742 |
PolyOne Corp.(a)(b) | | 121,934 | | | 802,326 |
Quaker Chemical Corp. | | 13,210 | | | 290,224 |
Tronox, Inc. (Class B Stock) | | 54,311 | | | 469,790 |
Zep, Inc.(a)(b) | | 28,019 | | | 388,624 |
| | | | |
|
|
| | | | | | 9,034,166 |
| | | | |
|
|
Commercial Banks — 5.8% | | | | | |
Alabama National Bancorp | | 22,200 | | | 1,727,382 |
Boston Private Financial Holdings, Inc.(b) | | 49,067 | | | 1,328,734 |
Cascade Bancorp(b) | | 37,300 | | | 519,216 |
Central Pacific Financial Corp. | | 39,176 | | | 723,189 |
Chittenden Corp. | | 65,318 | | | 2,326,628 |
Columbia Banking Systems Inc | | 23,500 | | | 698,655 |
Community Bank System, Inc.(b) | | 38,917 | | | 773,281 |
East West Bancorp, Inc.(b) | | 82,570 | | | 2,000,671 |
First BanCorp/Puerto Rico(b) | | 99,391 | | | 724,560 |
First Commonwealth Financial Corp.(b) | | 83,306 | | | 887,209 |
First Financial Bancorp | | 40,100 | | | 457,140 |
First Indiana Corp. | | 16,931 | | | 541,792 |
First Midwest Bancorp, Inc. | | 63,733 | | | 1,950,230 |
Frontier Financial Corp.(b) | | 54,500 | | | 1,012,065 |
Glacier Bancorp, Inc.(b) | | 70,239 | | | 1,316,279 |
Hancock Holding Co.(b) | | 32,400 | | | 1,237,680 |
Hanmi Financial Corp. | | 51,648 | | | 445,206 |
Independent Bank Corp. | | 25,972 | | | 246,734 |
Irwin Financial Corp. | | 24,593 | | | 180,759 |
Nara Bancorp, Inc. | | 28,463 | | | 332,163 |
PrivateBancorp, Inc.(b) | | 25,034 | | | 817,360 |
Prosperity Bancshares, Inc. | | 50,310 | | | 1,478,611 |
Provident Bankshares Corp. | | 41,755 | | | 893,139 |
Signature Bank(a)(b) | | 38,900 | | | 1,312,875 |
South Financial Group, Inc. (The) | | 94,932 | | | 1,483,787 |
Sterling Bancorp | | 23,259 | | | 317,253 |
Sterling Bancshares, Inc. | | 95,664 | | | 1,067,610 |
Sterling Financial Corp. | | 67,427 | | | 1,132,099 |
Susquehanna Bancshares, Inc.(b) | | 111,736 | | | 2,060,412 |
UCBH Holdings, Inc. | | 136,772 | | | 1,936,692 |
UMB Financial Corp. | | 47,600 | | | 1,825,936 |
Umpqua Holdings Corp. | | 78,516 | | | 1,204,435 |
United Bankshares, Inc. | | 50,603 | | | 1,417,896 |
United Community Banks, Inc.(b) | | 52,300 | | | 826,340 |
Whitney Holding Corp. | | 88,706 | | | 2,319,662 |
Wilshire Bancorp, Inc. | | 23,056 | | | 180,990 |
Wintrust Financial Corp.(b) | | 30,731 | | | 1,018,118 |
| | | | |
|
|
| | | | | | 40,722,788 |
| | | | |
|
|
SEE NOTES TO FINANCIAL STATEMENTS.
A141
| | | | |
| | | SMALL CAPITALIZATION STOCK PORTFOLIO (Continued) | | |
SCHEDULE OF INVESTMENTS | December 31, 2007 |
| | | | | |
COMMON STOCKS
(continued) | | Shares
| | Value
(Note 2)
|
| | | | | | |
Commercial Services & Supplies — 3.4% | | | | | |
ABM Industries, Inc. | | 57,561 | | $ | 1,173,669 |
Administaff, Inc.(b) | | 30,858 | | | 872,664 |
Angelica Corp. | | 12,772 | | | 243,945 |
Bowne & Co., Inc.(b) | | 34,979 | | | 615,630 |
Brady Corp. | | 71,308 | | | 2,502,198 |
CDI Corp. | | 17,842 | | | 432,847 |
Consolidated Graphics, Inc.(a) | | 15,890 | | | 759,860 |
G&K Services, Inc. (Class A Stock) | | 27,750 | | | 1,041,180 |
Healthcare Services Group, Inc.(b) | | 55,723 | | | 1,180,213 |
Heidrick & Struggles International, Inc. | | 23,098 | | | 857,167 |
Interface, Inc. | | 71,495 | | | 1,166,798 |
Mobile Mini, Inc.(a)(b) | | 45,202 | | | 838,045 |
On Assignment, Inc.(a)(b) | | 46,425 | | | 325,439 |
School Specialty, Inc.(a)(b) | | 23,123 | | | 798,900 |
Spherion Corp.(a) | | 73,333 | | | 533,864 |
Standard Register Co. (The) | | 16,468 | | | 192,017 |
Tetra Tech, Inc.(a)(b) | | 76,598 | | | 1,646,857 |
Trueblue Inc.(a)(b) | | 57,586 | | | 833,845 |
United Stationers, Inc.(a)(b) | | 32,799 | | | 1,515,642 |
Viad Corp. | | 26,936 | | | 850,639 |
Volt Information Sciences, Inc.(a) | | 17,940 | | | 327,584 |
Waste Connections, Inc.(a)(b) | | 89,105 | | | 2,753,345 |
Watson Wyatt Worldwide, Inc. | | 55,693 | | | 2,584,712 |
| | | | |
|
|
| | | | | | 24,047,060 |
| | | | |
|
|
Communications Equipment — 1.7% | | | | | |
Arris Group, Inc.(a)(b) | | 175,683 | | | 1,753,319 |
Bel Fuse, Inc. (Class B Stock) | | 15,567 | | | 455,646 |
Black Box Corp. | | 23,212 | | | 839,578 |
Blue Coat Systems, Inc.(a)(b) | | 49,866 | | | 1,639,095 |
Comtech Telecommunications Corp.(a)(b) | | 31,499 | | | 1,701,262 |
Digi International, Inc.(a) | | 33,606 | | | 476,869 |
Ditech Networks, Inc.(a) | | 33,996 | | | 117,966 |
Harmonic, Inc.(a) | | 122,305 | | | 1,281,756 |
NETGEAR, Inc.(a)(b) | | 46,133 | | | 1,645,564 |
Network Equipment Technologies, Inc.(a)(b) | | 35,793 | | | 301,377 |
PC-Tel, Inc.(a) | | 28,753 | | | 197,246 |
Symmetricom, Inc.(a) | | 59,671 | | | 281,050 |
Tollgrade Communications, Inc.(a) | | 17,315 | | | 138,866 |
ViaSat, Inc.(a) | | 34,636 | | | 1,192,517 |
| | | | |
|
|
| | | | | | 12,022,111 |
| | | | |
|
|
Computers & Peripherals — 0.8% | | | | | |
Adaptec, Inc.(a)(b) | | 158,637 | | | 536,193 |
Avid Technology, Inc.(a)(b) | | 45,798 | | | 1,297,915 |
Hutchinson Technology, Inc.(a)(b) | | 34,496 | | | 907,935 |
Intevac, Inc.(a) | | 28,200 | | | 410,028 |
Novatel Wireless, Inc.(a)(b) | | 41,954 | | | 679,655 |
Stratasys, Inc.(a) | | 27,500 | | | 710,600 |
Synaptics, Inc.(a)(b) | | 33,673 | | | 1,385,981 |
| | | | |
|
|
| | | | | | 5,928,307 |
| | | | |
|
|
Construction & Engineering — 1.3% | | | | | |
EMCOR Group, Inc.(a) | | 85,088 | | | 2,010,629 |
Insituform Technologies, Inc. (Class A Stock)(a)(b) | | 35,911 | | | 531,483 |
Shaw Group, Inc. (The)(a)(b) | | 106,365 | | | 6,428,701 |
| | | | |
|
|
| | | | | | 8,970,813 |
| | | | |
|
|
SEE NOTES TO FINANCIAL STATEMENTS.
A142
| | | | |
| | | SMALL CAPITALIZATION STOCK PORTFOLIO (Continued) | | |
SCHEDULE OF INVESTMENTS | December 31, 2007 |
| | | | | |
COMMON STOCKS
(continued) | | Shares
| | Value
(Note 2)
|
| | | | | | |
Construction Materials — 0.4% | | | | | |
Headwaters, Inc.(a)(b) | | 55,525 | | $ | 651,864 |
Texas Industries, Inc.(b) | | 35,836 | | | 2,512,103 |
| | | | |
|
|
| | | | | | 3,163,967 |
| | | | |
|
|
Consumer Finance — 0.4% | | | | | |
Cash America International, Inc. | | 38,285 | | | 1,236,605 |
First Cash Financial Services, Inc.(a)(b) | | 37,800 | | | 554,904 |
Rewards Network, Inc.(a) | | 35,136 | | | 174,626 |
World Acceptance Corp.(a) | | 22,123 | | | 596,879 |
| | | | |
|
|
| | | | | | 2,563,014 |
| | | | |
|
|
Containers & Packaging — 0.8% | | | | | |
Aptargroup, Inc.(b) | | 89,590 | | | 3,665,127 |
Caraustar Industries, Inc.(a)(b) | | 38,599 | | | 119,271 |
Chesapeake Corp. | | 25,986 | | | 134,867 |
Myers Industries, Inc. | | 36,849 | | | 533,205 |
Rock-Tenn Co. (Class A Stock) | | 43,799 | | | 1,112,933 |
| | | | |
|
|
| | | | | | 5,565,403 |
| | | | |
|
|
Distributors — 0.5% | | | | | |
Audiovox Corp.(a) | | 23,884 | | | 296,162 |
Building Materials Holding Corp.(b) | | 38,478 | | | 212,783 |
LKQ Corp.(a)(b) | | 148,400 | | | 3,119,368 |
| | | | |
|
|
| | | | | | 3,628,313 |
| | | | |
|
|
Diversified Consumer Services — 0.5% | | | | | |
Bright Horizons Family Solutions, Inc.(a)(b) | | 34,457 | | | 1,190,144 |
Coinstar, Inc.(a)(b) | | 36,633 | | | 1,031,219 |
CPI Corp. | | 6,890 | | | 162,260 |
Pre-Paid Legal Services, Inc.(a) | | 11,517 | | | 637,466 |
Universal Technical Institute, Inc.(a)(b) | | 30,730 | | | 522,410 |
| | | | |
|
|
| | | | | | 3,543,499 |
| | | | |
|
|
Diversified Financial Services — 0.3% | | | | | |
Financial Federal Corp. | | 33,572 | | | 748,320 |
Guaranty Financial Group, Inc.(a) | | 47,200 | | | 755,200 |
Portfolio Recovery Associates, Inc.(b) | | 19,842 | | | 787,132 |
| | | | |
|
|
| | | | | | 2,290,652 |
| | | | |
|
|
Diversified Telecommunication Services — 0.1% | | | | | |
General Communication, Inc. (Class A Stock)(a)(b) | | 59,238 | | | 518,333 |
| | | | |
|
|
Electric Utilities — 1.2% | | | | | |
ALLETE, Inc. | | 33,936 | | | 1,343,187 |
Central Vermont Public Services Corp.(b) | | 13,356 | | | 411,899 |
Cleco Corp.(b) | | 78,655 | | | 2,186,609 |
El Paso Electric Co.(a) | | 59,201 | | | 1,513,770 |
UIL Holdings Corp. | | 32,953 | | | 1,217,613 |
Unisource Energy Corp. | | 46,297 | | | 1,460,670 |
| | | | |
|
|
| | | | | | 8,133,748 |
| | | | |
|
|
Electrical Equipment — 1.9% | | | | | |
Acuity Brands, Inc.(b) | | 55,439 | | | 2,494,755 |
Baldor Electric Co. | | 60,127 | | | 2,023,875 |
Belden, Inc.(b) | | 59,284 | | | 2,638,137 |
C&D Technologies, Inc.(a)(b) | | 33,636 | | | 222,334 |
Magnetek, Inc.(a) | | 39,577 | | | 169,390 |
Regal Beloit Corp. | | 42,085 | | | 1,891,721 |
Smith (A.O.) Corp. | | 29,115 | | | 1,020,481 |
Vicor Corp. | | 24,990 | | | 389,594 |
Woodward Governor Co.(b) | | 38,621 | | | 2,624,297 |
| | | | |
|
|
| | | | | | 13,474,584 |
| | | | |
|
|
SEE NOTES TO FINANCIAL STATEMENTS.
A143
| | | | |
| | | SMALL CAPITALIZATION STOCK PORTFOLIO (Continued) | | |
SCHEDULE OF INVESTMENTS | December 31, 2007 |
| | | | | |
COMMON STOCKS
(continued) | | Shares
| | Value
(Note 2)
|
| | | | | | |
Electronic Equipment & Instruments — 5.7% | | | | | |
Agilysys, Inc.(b) | | 34,533 | | $ | 522,139 |
Anixter International, Inc.(a)(b) | | 41,817 | | | 2,603,945 |
Bell Microproducts, Inc. (Class B Stock)(a) | | 39,822 | | | 239,330 |
Benchmark Electronics, Inc.(a)(b) | | 93,712 | | | 1,661,514 |
Brightpoint, Inc.(a)(b) | | 67,129 | | | 1,031,101 |
Checkpoint Systems, Inc.(a) | | 52,053 | | | 1,352,337 |
Cognex Corp.(b) | | 56,782 | | | 1,144,157 |
CTS Corp. | | 46,138 | | | 458,150 |
Daktronics, Inc.(b) | | 43,862 | | | 989,965 |
Electro Scientific Industries, Inc.(a)(b) | | 36,415 | | | 722,838 |
FARO Technologies, Inc.(a)(b) | | 21,700 | | | 589,806 |
FLIR Systems, Inc.(a) | | 177,968 | | | 5,570,399 |
Gerber Scientific, Inc.(a) | | 30,666 | | | 331,193 |
Insight Enterprises, Inc.(a)(b) | | 63,419 | | | 1,156,763 |
Itron, Inc.(a)(b) | | 40,147 | | | 3,852,908 |
Keithley Instruments, Inc. | | 18,457 | | | 178,664 |
Littelfuse, Inc.(a) | | 29,340 | | | 967,046 |
LoJack Corp.(a) | | 24,283 | | | 408,197 |
Mercury Computer Systems, Inc.(a) | | 29,685 | | | 478,225 |
Methode Electronics, Inc. (Class A Stock)(b) | | 49,726 | | | 817,495 |
MTS Systems Corp. | | 23,209 | | | 990,328 |
Newport Corp.(a)(b) | | 48,600 | | | 621,594 |
Park Electrochemical Corp. | | 26,673 | | | 753,246 |
Photon Dynamics, Inc.(a) | | 21,807 | | | 180,998 |
Planar Systems, Inc.(a) | | 23,074 | | | 147,674 |
Plexus Corp.(a)(b) | | 60,900 | | | 1,599,234 |
Radisys Corp.(a) | | 29,036 | | | 389,082 |
Rogers Corp.(a)(b) | | 23,480 | | | 1,018,328 |
Scansource, Inc.(a)(b) | | 33,951 | | | 1,098,315 |
SYNNEX Corp.(a) | | 21,900 | | | 429,240 |
Technitrol, Inc. | | 53,555 | | | 1,530,602 |
Trimble Navigation, Ltd.(a) | | 158,992 | | | 4,807,918 |
TTM Technologies Inc.(a) | | 55,500 | | | 647,130 |
X-Rite, Inc.(b) | | 38,305 | | | 445,104 |
| | | | |
|
|
| | | | | | 39,734,965 |
| | | | |
|
|
Energy Equipment & Services — 5.2% | | | | | |
Atwood Oceanics, Inc.(a)(b) | | 36,160 | | | 3,624,678 |
Basic Energy Services Inc.(a)(b) | | 29,500 | | | 647,525 |
Bristow Group, Inc.(a)(b) | | 31,123 | | | 1,763,118 |
CARBO Ceramics, Inc.(b) | | 26,679 | | | 992,459 |
Drill-Quip, Inc.(a)(b) | | 35,528 | | | 1,977,488 |
Gulf Island Fabrication, Inc. | | 14,300 | | | 453,453 |
Helix Energy Solutions Group, Inc.(a)(b) | | 119,738 | | | 4,969,126 |
Hornbeck Offshore Services, Inc.(a)(b) | | 30,275 | | | 1,360,861 |
ION Geophysical Corp.(a)(b) | | 107,901 | | | 1,702,678 |
Lufkin Industries, Inc. | | 19,282 | | | 1,104,666 |
Matrix Service Co.(a) | | 34,900 | | | 761,518 |
NATCO Group, Inc.(a) | | 24,200 | | | 1,310,430 |
Oceaneering International, Inc.(a) | | 72,175 | | | 4,860,987 |
Pioneer Drilling Co.(a)(b) | | 65,000 | | | 772,200 |
SEACOR Holdings, Inc.(a)(b) | | 30,412 | | | 2,820,409 |
Superior Well Services, Inc.(a) | | 20,600 | | | 437,132 |
Tetra Technologies, Inc.(a)(b) | | 97,423 | | | 1,516,876 |
Unit Corp.(a) | | 60,773 | | | 2,810,751 |
W-H Energy Services, Inc.(a)(b) | | 40,221 | | | 2,260,822 |
| | | | |
|
|
| | | | | | 36,147,177 |
| | | | |
|
|
SEE NOTES TO FINANCIAL STATEMENTS.
A144
| | | | |
| | | SMALL CAPITALIZATION STOCK PORTFOLIO (Continued) | | |
SCHEDULE OF INVESTMENTS | December 31, 2007 |
| | | | | |
COMMON STOCKS
(continued) | | Shares
| | Value
(Note 2)
|
| | | | | | |
Exchange Traded Fund — 0.2% | | | | | |
iShares S&P SmallCap 600 Index | | 18,769 | | $ | 1,220,360 |
| | | | |
|
|
Food & Staples Retailing — 1.5% | | | | | |
Andersons, Inc. (The) | | 23,500 | | | 1,052,800 |
Casey’s General Stores, Inc. | | 66,446 | | | 1,967,466 |
Great Atlantic & Pacific Tea Co.(a)(b) | | 30,091 | | | 942,751 |
Longs Drug Stores Corp.(b) | | 41,522 | | | 1,951,534 |
Nash-Finch Co.(b) | | 17,763 | | | 626,679 |
Performance Food Group Co.(a)(b) | | 46,537 | | | 1,250,449 |
Spartan Stores, Inc. | | 28,700 | | | 655,795 |
United Natural Foods, Inc.(a)(b) | | 56,114 | | | 1,779,936 |
| | | | |
|
|
| | | | | | 10,227,410 |
| | | | |
|
|
Food Products — 1.3% | | | | | |
Flowers Foods, Inc.(b) | | 102,559 | | | 2,400,906 |
Hain Celestial Group, Inc.(a)(b) | | 52,056 | | | 1,665,792 |
J&J Snack Foods Corp. | | 18,399 | | | 575,521 |
Lance, Inc.(b) | | 40,887 | | | 834,913 |
Ralcorp Holdings, Inc.(a)(b) | | 33,686 | | | 2,047,772 |
Sanderson Farms, Inc. | | 20,044 | | | 677,086 |
TreeHouse Foods, Inc.(a) | | 40,918 | | | 940,705 |
| | | | |
|
|
| | | | | | 9,142,695 |
| | | | |
|
|
Gas Utilities — 3.1% | | | | | |
Atmos Energy Corp. | | 117,637 | | | 3,298,541 |
Laclede Group, Inc. (The)(b) | | 28,381 | | | 971,765 |
New Jersey Resources Corp. | | 36,404 | | | 1,820,928 |
Northwest Natural Gas Co. | | 34,661 | | | 1,686,604 |
Piedmont Natural Gas Co., Inc.(b) | | 97,143 | | | 2,541,261 |
South Jersey Industries, Inc.(b) | | 38,814 | | | 1,400,797 |
Southern Union Co. | | 157,323 | | | 4,619,004 |
Southwest Gas Corp. | | 55,911 | | | 1,664,470 |
UGI Corp. | | 139,816 | | | 3,809,987 |
| | | | |
|
|
| | | | | | 21,813,357 |
| | | | |
|
|
Healthcare Equipment & Supplies — 5.1% | | | | | |
American Medical Systems Holdings, Inc.(a)(b) | | 94,688 | | | 1,369,188 |
Analogic Corp. | | 17,561 | | | 1,189,231 |
Arthrocare Corp.(a)(b) | | 36,577 | | | 1,757,525 |
Biolase Technology, Inc.(a) | | 31,312 | | | 73,896 |
CONMED Corp.(a)(b) | | 37,476 | | | 866,070 |
Cooper Companies, Inc. (The) | | 58,721 | | | 2,231,398 |
CryoLife, Inc.(a) | | 32,460 | | | 258,057 |
Cyberonics, Inc.(a)(b) | | 29,352 | | | 386,272 |
Datascope Corp. | | 17,021 | | | 619,564 |
Greatbatch, Inc.(a)(b) | | 29,456 | | | 588,825 |
Haemonetics Corp.(a) | | 33,338 | | | 2,100,961 |
ICU Medical, Inc.(a)(b) | | 16,235 | | | 584,622 |
IDEXX Laboratories, Inc.(a) | | 80,290 | | | 4,707,403 |
Immucor, Inc.(a)(b) | | 91,696 | | | 3,116,747 |
Integra LifeSciences Holdings Corp.(a)(b) | | 24,172 | | | 1,013,532 |
Invacare Corp. | | 41,894 | | | 1,055,729 |
Kensey Nash Corp.(a) | | 16,036 | | | 479,797 |
Mentor Corp.(b) | | 44,546 | | | 1,741,749 |
Meridian Bioscience, Inc.(b) | | 52,297 | | | 1,573,094 |
Merit Medical Systems, Inc.(a) | | 35,715 | | | 496,439 |
Osteotech, Inc.(a) | | 23,108 | | | 180,705 |
Palomar Medical Technologies, Inc.(a)(b) | | 23,952 | | | 366,945 |
Possis Medical, Inc.(a) | | 22,231 | | | 324,128 |
SEE NOTES TO FINANCIAL STATEMENTS.
A145
| | | | |
| | | SMALL CAPITALIZATION STOCK PORTFOLIO (Continued) | | |
SCHEDULE OF INVESTMENTS | December 31, 2007 |
| | | | | |
COMMON STOCKS
(continued) | | Shares
| | Value
(Note 2)
|
| | | | | | |
Healthcare Equipment & Supplies (continued) | | | |
Respironics, Inc.(a) | | 97,082 | | $ | 6,356,930 |
SurModics, Inc.(a)(b) | | 19,804 | | | 1,074,763 |
Symmetry Medical, Inc.(a)(b) | | 46,400 | | | 808,752 |
Theragenics Corp.(a) | | 43,540 | | | 155,873 |
Vital Signs, Inc. | | 10,435 | | | 533,437 |
| | | | |
|
|
| | | | | | 36,011,632 |
| | | | |
|
|
Healthcare Providers & Services — 4.9% | | | | | |
Amedisys, Inc.(a)(b) | | 34,404 | | | 1,669,282 |
AMERIGROUP Corp.(a) | | 69,756 | | | 2,542,606 |
AMN Healthcare Services, Inc.(a) | | 39,457 | | | 677,477 |
AmSurg Corp.(a)(b) | | 40,780 | | | 1,103,507 |
Centene Corp.(a)(b) | | 57,010 | | | 1,564,354 |
Chemed Corp.(b) | | 31,426 | | | 1,756,085 |
Cross Country Healthcare, Inc.(a) | | 41,802 | | | 595,260 |
Gentiva Health Services, Inc.(a) | | 36,680 | | | 698,387 |
HealthExtras, Inc.(a)(b) | | 48,500 | | | 1,264,880 |
Healthways, Inc.(a)(b) | | 46,688 | | | 2,728,447 |
Hooper Holmes, Inc.(a) | | 89,893 | | | 154,616 |
inVentiv Health, Inc.(a)(b) | | 42,317 | | | 1,310,134 |
LCA-Vision, Inc.(b) | | 24,918 | | | 497,612 |
LHC Group, Inc.(a) | | 18,900 | | | 472,122 |
Matria Healthcare, Inc.(a)(b) | | 28,085 | | | 667,580 |
Medcath Corp.(a)(b) | | 17,800 | | | 437,168 |
Molina Healthcare, Inc.(a)(b) | | 18,600 | | | 719,820 |
Odyssey Healthcare, Inc.(a) | | 42,785 | | | 473,202 |
Owens & Minor, Inc. | | 53,590 | | | 2,273,824 |
Pediatrix Medical Group, Inc.(a) | | 63,518 | | | 4,328,753 |
Pharmerica Corp.(a)(b) | | 39,800 | | | 552,424 |
PSS World Medical, Inc.(a)(b) | | 84,750 | | | 1,658,558 |
RehabCare Group, Inc.(a) | | 22,611 | | | 510,104 |
Res-Care, Inc.(a) | | 33,300 | | | 837,828 |
Sierra Health Services, Inc.(a) | | 73,722 | | | 3,093,375 |
Sunrise Senior Living, Inc.(a)(b) | | 58,725 | | | 1,801,683 |
| | | | |
|
|
| | | | | | 34,389,088 |
| | | | |
|
|
Healthcare Technology — 0.5% | | | | | |
Allscripts Healthcare Solutions, Inc.(a)(b) | | 74,400 | | | 1,444,848 |
Omnicell, Inc.(a) | | 45,200 | | | 1,217,236 |
Phase Forward, Inc.(a)(b) | | 55,400 | | | 1,204,950 |
| | | | |
|
|
| | | | | | 3,867,034 |
| | | | |
|
|
Hotels, Restaurants & Leisure — 2.9% | | | | | |
Buffalo Wild Wings, Inc.(a)(b) | | 20,100 | | | 466,722 |
California Pizza Kitchen, Inc.(a)(b) | | 38,200 | | | 594,774 |
CEC Entertainment, Inc.(a)(b) | | 38,511 | | | 999,746 |
CKE Restaurants, Inc.(b) | | 71,638 | | | 945,622 |
IHOP Corp.(b) | | 19,617 | | | 717,590 |
Jack in the Box, Inc.(a)(b) | | 78,518 | | | 2,023,408 |
Landry’s Restaurants, Inc.(b) | | 16,314 | | | 321,386 |
Marcus Corp. | | 28,247 | | | 436,416 |
Monarch Casino & Resort, Inc.(a) | | 18,500 | | | 445,480 |
Multimedia Games, Inc.(a) | | 30,206 | | | 251,918 |
O’Charleys, Inc. | | 29,053 | | | 435,214 |
P.F. Chang’s China Bistro, Inc.(a)(b) | | 34,082 | | | 778,433 |
Panera Bread Co. (Class A Stock)(a)(b) | | 42,280 | | | 1,514,470 |
Papa John’s International, Inc.(a)(b) | | 27,073 | | | 614,557 |
Peet’s Coffee & Tea, Inc.(a)(b) | | 16,378 | | | 476,108 |
SEE NOTES TO FINANCIAL STATEMENTS.
A146
| | | | |
| | | SMALL CAPITALIZATION STOCK PORTFOLIO (Continued) | | |
SCHEDULE OF INVESTMENTS | December 31, 2007 |
| | | | | |
COMMON STOCKS
(continued) | | Shares
| | Value
(Note 2)
|
| | | | | | |
Hotels, Restaurants & Leisure (continued) | | | |
Pinnacle Entertainment, Inc.(a)(b) | | 78,467 | | $ | 1,848,683 |
Red Robin Gourmet Burgers, Inc.(a)(b) | | 21,965 | | | 702,660 |
Ruth’s Chris Steak House(a) | | 24,900 | | | 222,606 |
Shuffle Master, Inc.(a)(b) | | 46,166 | | | 553,530 |
Sonic Corp.(a)(b) | | 79,650 | | | 1,744,335 |
Steak N Shake Co. (The)(a)(b) | | 37,139 | | | 404,815 |
Texas Roadhouse, Inc.(a)(b) | | 70,500 | | | 779,730 |
Triarc Cos., Inc. (Class B Stock)(b) | | 82,690 | | | 724,364 |
WMS Industries, Inc.(a)(b) | | 54,334 | | | 1,990,798 |
| | | | |
|
|
| | | | | | 19,993,365 |
| | | | |
|
|
Household Durables — 0.8% | | | | | |
Bassett Furniture Industries, Inc. | | 15,396 | | | 143,799 |
Champion Enterprises, Inc.(a)(b) | | 101,093 | | | 952,296 |
Ethan Allen Interiors, Inc.(b) | | 38,978 | | | 1,110,873 |
La-Z-Boy, Inc.(b) | | 67,391 | | | 534,411 |
Libbey, Inc. | | 19,074 | | | 302,132 |
M/I Homes, Inc. | | 16,137 | | | 169,439 |
Meritage Home Corp.(a)(b) | | 34,320 | | | 500,042 |
National Presto Industries, Inc. | | 6,250 | | | 329,125 |
Russ Berrie & Co., Inc.(a) | | 21,867 | | | 357,744 |
Skyline Corp. | | 8,894 | | | 261,039 |
Standard Pacific Corp.(b) | | 85,081 | | | 285,021 |
Universal Electronics, Inc.(a)(b) | | 19,100 | | | 638,704 |
| | | | |
|
|
| | | | | | 5,584,625 |
| | | | |
|
|
Household Products — 0.2% | | | | | |
Central Garden & Pet Co. (Class A Stock)(a)(b) | | 94,100 | | | 504,376 |
Spectrum Brands, Inc.(a)(b) | | 53,492 | | | 285,112 |
WD-40 Co. | | 22,061 | | | 837,657 |
| | | | |
|
|
| | | | | | 1,627,145 |
| | | | |
|
|
Industrial Conglomerates — 0.1% | | | | | |
Standex International Corp. | | 16,319 | | | 284,767 |
Tredegar Corp. | | 30,409 | | | 488,976 |
| | | | |
|
|
| | | | | | 773,743 |
| | | | |
|
|
Insurance — 3.0% | | | | | |
Delphi Financial Group, Inc. | | 57,721 | | | 2,036,397 |
Hilb, Rogal & Hobbs Co. | | 48,566 | | | 1,970,323 |
Infinity Property & Casualty Corp. | | 21,429 | | | 774,230 |
LandAmerica Financial Group, Inc.(b) | | 20,400 | | | 682,380 |
Navigators Group, Inc.(a) | | 17,500 | | | 1,137,500 |
Philadelphia Consolidated Holding Corp.(a) | | 76,401 | | | 3,006,378 |
Presidential Life Corp.(b) | | 28,208 | | | 493,922 |
ProAssurance Corp.(a)(b) | | 42,834 | | | 2,352,443 |
RLI Corp. | | 25,359 | | | 1,440,138 |
Safety Insurance Group, Inc. | | 21,244 | | | 777,955 |
SCPIE Holdings, Inc.(a) | | 10,793 | | | 296,484 |
Selective Insurance Group | | 69,608 | | | 1,600,288 |
Stewart Information Services Corp. | | 23,648 | | | 616,976 |
Tower Group, Inc. | | 26,500 | | | 885,100 |
United Fire & Casualty Co. | | 29,040 | | | 844,774 |
Zenith National Insurance Corp. | | 48,648 | | | 2,176,025 |
| | | | |
|
|
| | | | | | 21,091,313 |
| | | | |
|
|
Internet & Catalog Retail — 0.3% | | | | | |
Blue Nile, Inc.(a)(b) | | 21,025 | | | 1,430,962 |
PetMed Express, Inc.(a)(b) | | 31,992 | | | 387,103 |
Stamps.com, Inc.(a) | | 21,240 | | | 258,703 |
| | | | |
|
|
| | | | | | 2,076,768 |
| | | | |
|
|
SEE NOTES TO FINANCIAL STATEMENTS.
A147
| | | | |
| | | SMALL CAPITALIZATION STOCK PORTFOLIO (Continued) | | |
SCHEDULE OF INVESTMENTS | December 31, 2007 |
| | | | | |
COMMON STOCKS
(continued) | | Shares
| | Value
(Note 2)
|
| | | | | | |
Internet Software & Services — 1.1% | | | | | |
Bankrate, Inc.(a)(b) | | 16,938 | | $ | 814,548 |
Dealertrack Holdings Inc.(a) | | 39,000 | | | 1,305,330 |
Infospace, Inc. | | 43,548 | | | 818,702 |
j2 Global Communications, Inc.(a)(b) | | 64,666 | | | 1,368,979 |
Knot, Inc. (The)(a) | | 36,400 | | | 580,216 |
Perficient Inc.(a) | | 40,200 | | | 632,748 |
United Online, Inc.(b) | | 88,641 | | | 1,047,737 |
Websense, Inc.(a)(b) | | 59,479 | | | 1,009,953 |
| | | | |
|
|
| | | | | | 7,578,213 |
| | | | |
|
|
IT Services — 1.3% | | | | | |
CACI International, Inc. (Class A Stock)(a)(b) | | 39,369 | | | 1,762,550 |
Ciber, Inc.(a) | | 71,085 | | | 434,329 |
Cybersource Corp.(a) | | 89,896 | | | 1,597,453 |
Gevity HR, Inc. | | 30,516 | | | 234,668 |
Mantech International Corp. (Class A Stock)(a)(b) | | 25,650 | | | 1,123,983 |
MAXIMUS, Inc. | | 24,269 | | | 937,026 |
SI International, Inc.(a) | | 17,300 | | | 475,231 |
Startek, Inc. | | 14,828 | | | 138,049 |
Sykes Enterprises, Inc.(a) | | 42,842 | | | 771,156 |
Wright Express Corp.(a)(b) | | 52,100 | | | 1,849,029 |
| | | | |
|
|
| | | | | | 9,323,474 |
| | | | |
|
|
Leisure Equipment & Products — 0.9% | | | | | |
Arctic Cat, Inc. | | 15,693 | | | 187,374 |
JAKKS Pacific, Inc.(a) | | 36,968 | | | 872,814 |
MarineMax, Inc.(a)(b) | | 24,182 | | | 374,821 |
Nautilus Group, Inc.(b) | | 41,317 | | | 200,387 |
Polaris Industries, Inc.(b) | | 45,900 | | | 2,192,644 |
Pool Corp.(b) | | 62,206 | | | 1,233,546 |
RC2 Corp.(a) | | 24,885 | | | 698,522 |
Sturm Ruger & Co., Inc.(a) | | 29,830 | | | 246,992 |
| | | | |
|
|
| | | | | | 6,007,100 |
| | | | |
|
|
Life Sciences Tools & Services — 0.9% | | | | | |
Cambrex Corp. | | 37,909 | | | 317,677 |
Dionex Corp.(a)(b) | | 24,496 | | | 2,029,739 |
Enzo Biochem, Inc.(a)(b) | | 40,913 | | | 521,232 |
Kendle International, Inc.(a)(b) | | 16,872 | | | 825,378 |
Parexel International Corp.(a)(b) | | 36,446 | | | 1,760,342 |
PharmaNet Development Group, Inc.(a)(b) | | 24,826 | | | 973,427 |
| | | | |
|
|
| | | | | | 6,427,795 |
| | | | |
|
|
Machinery — 3.6% | | | | | |
Albany International Corp. (Class A Stock)(b) | | 34,489 | | | 1,279,542 |
Astec Industries, Inc.(a)(b) | | 25,182 | | | 936,519 |
ASV, Inc.(a)(b) | | 26,605 | | | 368,479 |
Barnes Group, Inc.(b) | | 59,212 | | | 1,977,089 |
Briggs & Stratton Corp. | | 64,960 | | | 1,471,994 |
Cascade Corp.(b) | | 12,000 | | | 557,520 |
CLARCOR, Inc.(b) | | 65,370 | | | 2,482,098 |
EnPro Industries, Inc.(a)(b) | | 28,321 | | | 868,039 |
Gardner Denver, Inc.(a) | | 70,168 | | | 2,315,543 |
Kaydon Corp.(b) | | 37,128 | | | 2,024,961 |
Lindsay Manufacturing Co.(b) | | 15,481 | | | 1,094,352 |
Lydall, Inc.(a) | | 21,606 | | | 227,295 |
Mueller Industries, Inc. | | 48,545 | | | 1,407,320 |
Robbins & Myers, Inc.(b) | | 22,498 | | | 1,701,524 |
SEE NOTES TO FINANCIAL STATEMENTS.
A148
| | | | |
| | | SMALL CAPITALIZATION STOCK PORTFOLIO (Continued) | | |
SCHEDULE OF INVESTMENTS | December 31, 2007 |
| | | | | |
COMMON STOCKS
(continued) | | Shares
| | Value
(Note 2)
|
| | | | | | |
Machinery (continued) | | | | | |
Toro Co.(b) | | 52,111 | | $ | 2,836,922 |
Valmont Industries, Inc. | | 22,656 | | | 2,019,103 |
Wabash National Corp. | | 39,706 | | | 305,339 |
Watts Water Technologies, Inc. (Class A Stock)(b) | | 41,161 | | | 1,226,598 |
| | | | |
|
|
| | | | | | 25,100,237 |
| | | | |
|
|
Marine — 0.5% | | | | | |
Kirby Corp.(a)(b) | | 70,164 | | | 3,261,223 |
| | | | |
|
|
Media — 0.5% | | | | | |
4Kids Entertainment, Inc.(a) | | 17,288 | | | 227,337 |
Arbitron, Inc.(b) | | 37,033 | | | 1,539,462 |
Live Nation, Inc.(a)(b) | | 96,150 | | | 1,396,098 |
Radio One, Inc. (Class D Stock)(a) | | 106,325 | | | 251,990 |
| | | | |
|
|
| | | | | | 3,414,887 |
| | | | |
|
|
Metals & Mining — 1.3% | | | | | |
AMCOL International Corp. | | 29,212 | | | 1,052,508 |
Brush Engineered Materials, Inc.(a) | | 26,735 | | | 989,730 |
Castle (A.M.) & Co. | | 21,416 | | | 582,301 |
Century Aluminum Co.(a)(b) | | 38,145 | | | 2,057,541 |
Quanex Corp.(b) | | 48,750 | | | 2,530,125 |
RTI International Metals, Inc.(a)(b) | | 30,256 | | | 2,085,546 |
| | | | |
|
|
| | | | | | 9,297,751 |
| | | | |
|
|
Multiline Retail — 0.1% | | | | | |
Fred’s, Inc.(b) | | 52,735 | | | 507,838 |
Tuesday Morning Corp.(b) | | 39,024 | | | 197,852 |
| | | | |
|
|
| | | | | | 705,690 |
| | | | |
|
|
Multi-Utilities — 0.3% | | | | | |
Avista Corp. | | 69,293 | | | 1,492,571 |
CH Energy Group, Inc. | | 17,818 | | | 793,614 |
| | | | |
|
|
| | | | | | 2,286,185 |
| | | | |
|
|
Oil, Gas & Consumable Fuels — 3.1% | | | | | |
Cabot Oil & Gas Corp. (Class A Stock) | | 127,276 | | | 5,138,131 |
Massey Energy Corp. | | 104,382 | | | 3,731,657 |
Patriot Coal Corp.(a) | | 34,700 | | | 1,448,378 |
Penn Virginia Corp.(a)(b) | | 49,706 | | | 2,168,673 |
Petroleum Development Corp.(a)(b) | | 19,528 | | | 1,154,691 |
St. Mary Land & Exploration Co. | | 82,401 | | | 3,181,503 |
Stone Energy Corp.(a) | | 36,766 | | | 1,724,693 |
Swift Energy Co.(a)(b) | | 39,521 | | | 1,740,110 |
World Fuel Services Corp. | | 37,460 | | | 1,087,464 |
| | | | |
|
|
| | | | | | 21,375,300 |
| | | | |
|
|
Paper & Forest Products — 0.4% | | | | | |
Buckeye Technologies, Inc.(a) | | 51,227 | | | 640,338 |
Deltic Timber Corp. | | 13,971 | | | 719,366 |
Neenah Paper, Inc. | | 19,621 | | | 571,952 |
Schweitzer-Mauduit International, Inc. | | 20,370 | | | 527,787 |
Wausau Paper Corp. | | 66,499 | | | 597,826 |
| | | | |
|
|
| | | | | | 3,057,269 |
| | | | |
|
|
Personal Products — 0.3% | | | | | |
Chattem, Inc.(a)(b) | | 24,900 | | | 1,880,946 |
Mannatech, Inc.(b) | | 20,425 | | | 129,086 |
USANA Health Sciences, Inc.(a)(b) | | 10,988 | | | 407,435 |
| | | | |
|
|
| | | | | | 2,417,467 |
| | | | |
|
|
SEE NOTES TO FINANCIAL STATEMENTS.
A149
| | | | |
| | | SMALL CAPITALIZATION STOCK PORTFOLIO (Continued) | | |
SCHEDULE OF INVESTMENTS | December 31, 2007 |
| | | | | |
COMMON STOCKS
(continued) | | Shares
| | Value
(Note 2)
|
| | | | | | |
Pharmaceuticals — 1.2% | | | | | |
Alpharma, Inc. (Class A Stock)(a)(b) | | 57,194 | | $ | 1,152,459 |
Bradley Pharmaceuticals, Inc.(a)(b) | | 17,764 | | | 349,951 |
MGI Pharma, Inc.(a)(b) | | 105,650 | | | 4,281,994 |
Noven Pharmaceuticals, Inc.(a) | | 32,132 | | | 445,992 |
Salix Pharmaceuticals Ltd.(a)(b) | | 62,300 | | | 490,924 |
Scielle Pharma, Inc.(a)(b) | | 46,730 | | | 955,629 |
ViroPharma, Inc.(a)(b) | | 91,600 | | | 727,304 |
| | | | |
|
|
| | | | | | 8,404,253 |
| | | | |
|
|
Real Estate Investment Trusts (REITs) — 4.5% | | | | | |
Acadia Realty Trust.(b) | | 42,219 | | | 1,081,229 |
Biomed Realty Trust, Inc. | | 85,800 | | | 1,987,986 |
Colonial Properties Trust.(b) | | 61,619 | | | 1,394,438 |
Diamondrock Hospitality Co. | | 124,100 | | | 1,859,018 |
EastGroup Properties, Inc.(b) | | 31,196 | | | 1,305,553 |
Entertainment Properties Trust.(b) | | 36,821 | | | 1,730,587 |
Essex Property Trust, Inc.(b) | | 33,080 | | | 3,224,969 |
Extra Space Storage, Inc. | | 86,200 | | | 1,231,798 |
Inland Real Estate Corp.(b) | | 76,413 | | | 1,082,008 |
Kilroy Realty Corp.(b) | | 42,972 | | | 2,361,741 |
Kite Realty Group Trust(b) | | 37,900 | | | 578,733 |
Lexington Corporate Properties Trust(b) | | 83,460 | | | 1,213,508 |
LTC Properties, Inc.(b) | | 26,492 | | | 663,625 |
Medical Properties Trust, Inc.(b) | | 65,900 | | | 671,521 |
Mid-America Apartment Communities, Inc.(b) | | 33,535 | | | 1,433,621 |
National Retail Properties, Inc.(b) | | 94,210 | | | 2,202,630 |
Parkway Properties, Inc. | | 20,234 | | | 748,253 |
PS Business Parks, Inc. | | 21,002 | | | 1,103,655 |
Senior Housing Properties Trust(b) | | 116,259 | | | 2,636,754 |
Sovran Self Storage, Inc.(b) | | 28,356 | | | 1,137,076 |
Tanger Factory Outlet Centers(b) | | 41,100 | | | 1,549,881 |
| | | | |
|
|
| | | | | | 31,198,584 |
| | | | |
|
|
Real Estate Management & Development — 0.2% | | | | | |
Forestar Real Estate Group, Inc.(a) | | 47,200 | | | 1,113,448 |
| | | | |
|
|
Road & Rail — 1.0% | | | | | |
Arkansas Best Corp.(b) | | 32,958 | | | 723,099 |
Heartland Express, Inc.(b) | | 74,946 | | | 1,062,734 |
Knight Transportation, Inc.(b) | | 76,006 | | | 1,125,649 |
Landstar System, Inc. | | 70,535 | | | 2,973,050 |
Old Dominion Freight Line, Inc.(a) | | 37,092 | | | 857,196 |
| | | | |
|
|
| | | | | | 6,741,728 |
| | | | |
|
|
Semiconductors & Semiconductor Equipment — 3.8% | | | | | |
Actel Corp.(a) | | 34,134 | | | 466,270 |
Advanced Energy Industries, Inc.(a)(b) | | 46,844 | | | 612,720 |
AMIS Holdings, Inc.(a) | | 85,500 | | | 856,710 |
ATMI, Inc.(a)(b) | | 44,153 | | | 1,423,934 |
Axcelis Technologies, Inc.(a)(b) | | 133,973 | | | 616,276 |
Brooks Automation, Inc.(a)(b) | | 92,814 | | | 1,226,073 |
Cabot Microelectronics Corp.(a) | | 31,519 | | | 1,131,847 |
Cohu, Inc. | | 30,137 | | | 461,096 |
Cymer, Inc.(a)(b) | | 40,056 | | | 1,559,380 |
Diodes, Inc.(a)(b) | | 40,943 | | | 1,231,156 |
DSP Group, Inc.(a)(b) | | 42,497 | | | 518,463 |
Exar Corp.(a) | | 63,520 | | | 506,254 |
FEI Co.(a) | | 47,535 | | | 1,180,294 |
Kopin Corp.(a) | | 88,903 | | | 280,933 |
SEE NOTES TO FINANCIAL STATEMENTS.
A150
| | | | |
| | | SMALL CAPITALIZATION STOCK PORTFOLIO (Continued) | | |
SCHEDULE OF INVESTMENTS | December 31, 2007 |
| | | | | |
COMMON STOCKS
(continued) | | Shares
| | Value
(Note 2)
|
| | | | | | |
Semiconductors & Semiconductor Equipment (continued) | | | | | |
Kulicke & Soffa Industries, Inc.(a)(b) | | 69,767 | | $ | 478,602 |
Micrel, Inc.(b) | | 71,600 | | | 605,020 |
Microsemi Corp.(a)(b) | | 101,300 | | | 2,242,782 |
MKS Instruments, Inc.(a) | | 65,400 | | | 1,251,756 |
Pericom Semiconductor Corp.(a) | | 33,989 | | | 635,594 |
Phototronics, Inc.(a) | | 54,814 | | | 683,531 |
Rudolph Technologies, Inc.(a)(b) | | 38,156 | | | 431,926 |
Skyworks Solutions, Inc.(a)(b) | | 211,881 | | | 1,800,989 |
Standard Microsystems Corp.(a)(b) | | 30,648 | | | 1,197,417 |
Supertex, Inc.(a)(b) | | 17,857 | | | 558,746 |
Ultratech, Inc.(a) | | 30,369 | | | 344,384 |
Varian Semiconductor Equipment Associates, Inc.(a)(b) | | 99,531 | | | 3,682,648 |
Veeco Instruments, Inc.(a)(b) | | 41,636 | | | 695,321 |
| | | | |
|
|
| | | | | | 26,680,122 |
| | | | |
|
|
Software — 4.5% | | | | | |
Ansoft Corp.(a) | | 20,900 | | | 540,265 |
ANSYS, Inc.(a)(b) | | 102,680 | | | 4,257,112 |
Blackbaud, Inc. | | 58,000 | | | 1,626,320 |
Captaris, Inc.(a) | | 34,889 | | | 150,720 |
Catapult Communications Corp.(a) | | 12,043 | | | 90,925 |
Concur Technologies(a)(b) | | 56,100 | | | 2,031,381 |
Epicor Software Corp.(a)(b) | | 76,508 | | | 901,264 |
EPIQ Systems, Inc.(a)(b) | | 34,873 | | | 607,139 |
FactSet Research Systems, Inc.(b) | | 56,166 | | | 3,128,446 |
Informatica Corp.(a)(b) | | 114,900 | | | 2,070,498 |
JDA Software Group, Inc.(a)(b) | | 34,801 | | | 712,028 |
Manhattan Associates, Inc.(a)(b) | | 33,493 | | | 882,875 |
MICROS Systems, Inc.(a)(b) | | 53,773 | | | 3,772,714 |
Napster, Inc.(a) | | 60,477 | | | 119,140 |
Phoenix Technologies, Ltd.(a) | | 35,537 | | | 457,717 |
Progress Software Corp.(a)(b) | | 55,145 | | | 1,857,284 |
Quality Systems, Inc.(b) | | 22,992 | | | 701,026 |
Radiant Systems, Inc.(a)(b) | | 34,982 | | | 602,740 |
Secure Computing Corp.(a)(b) | | 74,416 | | | 714,394 |
Smith Micro Software, Inc.(a) | | 39,600 | | | 335,412 |
Sonic Solutions, Inc.(a)(b) | | 34,067 | | | 353,956 |
SPSS, Inc.(a)(b) | | 25,076 | | | 900,479 |
Take — Two Interactive Software, Inc.(a)(b) | | 96,986 | | | 1,789,392 |
THQ, Inc.(a)(b) | | 86,632 | | | 2,442,156 |
Tyler Technologies, Inc.(a)(b) | | 45,800 | | | 590,362 |
| | | | |
|
|
| | | | | | 31,635,745 |
| | | | |
|
|
Specialty Retail — 3.1% | | | | | |
Aaron Rents, Inc. | | 71,096 | | | 1,367,887 |
Big 5 Sporting Goods Corp.(b) | | 28,900 | | | 416,738 |
Brown Shoe Co., Inc. | | 57,916 | | | 878,586 |
Cabela’s Inc.(a)(b) | | 51,700 | | | 779,119 |
Cato Corp. (The) (Class A Stock) | | 40,891 | | | 640,353 |
Charlotte Russe Holdings, Inc.(a) | | 32,700 | | | 528,105 |
Children’s Place Retail Stores, Inc. (The)(a)(b) | | 30,838 | | | 799,629 |
Christopher & Banks Corp. | | 46,403 | | | 531,314 |
Dress Barn, Inc.(a)(b) | | 59,112 | | | 739,491 |
Finish Line, Inc. (Class A Stock) | | 55,607 | | | 134,569 |
Genesco, Inc.(a) | | 29,863 | | | 1,128,821 |
Group 1 Automotive, Inc.(b) | | 29,819 | | | 708,201 |
Gymboree Corp.(a)(b) | | 37,621 | | | 1,145,936 |
SEE NOTES TO FINANCIAL STATEMENTS.
A151
| | | | |
| | | SMALL CAPITALIZATION STOCK PORTFOLIO (Continued) | | |
SCHEDULE OF INVESTMENTS | December 31, 2007 |
| | | | | |
COMMON STOCKS
(continued) | | Shares
| | Value
(Note 2)
|
| | | | | | |
Specialty Retail (continued) | | | | | |
Haverty Furniture Cos., Inc.(b) | | 28,561 | | $ | 256,763 |
Hibbett Sports, Inc.(a)(b) | | 40,762 | | | 814,425 |
Hot Topic, Inc.(a) | | 57,050 | | | 332,031 |
Jo-Ann Stores, Inc.(a)(b) | | 32,706 | | | 427,794 |
Jos. A. Bank Clothiers, Inc.(a)(b) | | 23,844 | | | 678,362 |
Lithia Motors, Inc.(b) | | 20,900 | | | 286,957 |
Men’s Wearhouse, Inc. | | 68,585 | | | 1,850,424 |
Midas, Inc.(a)(b) | | 18,724 | | | 274,494 |
Pep Boys-Manny, Moe & Jack(b) | | 54,328 | | | 623,685 |
Select Comfort Corp.(a)(b) | | 61,362 | | | 430,148 |
Sonic Automotive, Inc.(b) | | 40,746 | | | 788,843 |
Stage Stores, Inc. | | 54,241 | | | 802,767 |
Stein Mart, Inc. | | 33,846 | | | 160,430 |
Tractor Supply Co.(a)(b) | | 43,999 | | | 1,581,324 |
Tween Brands, Inc.(a)(b) | | 32,302 | | | 855,357 |
Zale Corp.(a)(b) | | 58,401 | | | 937,920 |
Zumiez, Inc.(a)(b) | | 23,600 | | | 574,896 |
| | | | |
|
|
| | | | | | 21,475,369 |
| | | | |
|
|
Textiles, Apparel & Luxury Goods — 2.6% | | | | | |
Crocs, Inc.(a)(b) | | 108,120 | | | 3,979,896 |
Deckers Outdoor Corp.(a)(b) | | 17,062 | | | 2,645,633 |
Fossil, Inc.(a)(b) | | 60,925 | | | 2,557,632 |
Iconix Brand Group, Inc.(a)(b) | | 74,600 | | | 1,466,636 |
Kellwood Co. | | 33,859 | | | 563,414 |
K-Swiss, Inc. | | 35,067 | | | 634,713 |
Maidenform Brands, Inc.(a) | | 24,600 | | | 332,838 |
Movado Group, Inc. | | 25,300 | | | 639,837 |
Oxford Industries, Inc.(b) | | 20,418 | | | 526,172 |
Quiksilver, Inc.(a)(b) | | 161,196 | | | 1,383,062 |
Skechers USA, Inc., (Class A Stock)(a) | | 42,541 | | | 829,975 |
Unifirst Corp. | | 18,700 | | | 710,600 |
Volcom, Inc.(a)(b) | | 19,100 | | | 420,773 |
Wolverine World Wide, Inc. | | 68,482 | | | 1,679,179 |
| | | | |
|
|
| | | | | | 18,370,360 |
| | | | |
|
|
Thrifts & Mortgage Finance — 1.0% | | | | | |
Anchor Bancorp Wisconsin, Inc.(b) | | 23,159 | | | 544,700 |
Bank Mutual Corp. | | 68,935 | | | 728,643 |
BankAtlantic Bancorp, Inc. (Class A Stock) | | 54,466 | | | 223,311 |
BankUnited Financial Corp. (Class A Stock)(b) | | 41,070 | | | 283,383 |
Brookline Bancorp, Inc. | | 77,312 | | | 785,490 |
Corus Bankshares, Inc.(b) | | 42,700 | | | 455,609 |
Dime Community Bancshares | | 33,021 | | | 421,678 |
Downey Financial Corp.(b) | | 25,565 | | | 795,327 |
FirstFed Financial Corp.(a)(b) | | 17,924 | | | 642,038 |
Flagstar Bancorp, Inc.(b) | | 48,187 | | | 335,863 |
Franklin Bank Corp.(a)(b) | | 33,196 | | | 143,075 |
Fremont General Corp.(b) | | 90,773 | | | 317,706 |
Triad Guaranty, Inc.(a)(b) | | 16,200 | | | 158,760 |
TrustCo Bank Corp.(b) | | 98,651 | | | 978,617 |
| | | | |
|
|
| | | | | | 6,814,200 |
| | | | |
|
|
Tobacco — 0.1% | | | | | |
Alliance One International, Inc.(a) | | 116,646 | | | 474,749 |
| | | | |
|
|
Trading Companies & Distributors — 0.6% | | | | | |
Applied Industrial Technologies, Inc. | | 48,254 | | | 1,400,331 |
Kaman Corp. (Class A Stock) | | 32,336 | | | 1,190,288 |
SEE NOTES TO FINANCIAL STATEMENTS.
A152
| | | | |
| | | SMALL CAPITALIZATION STOCK PORTFOLIO (Continued) | | |
SCHEDULE OF INVESTMENTS | December 31, 2007 |
| | | | | | | |
COMMON STOCKS
(continued) | | Shares
| | Value
(Note 2)
| |
| | | | | | | | |
Trading Companies & Distributors (continued) | | | | |
Lawson Products | | | 5,440 | | $ | 206,285 | |
Watsco, Inc.(b) | | | 32,231 | | | 1,184,812 | |
| | | | | |
|
|
|
| | | | | | | 3,981,716 | |
| | | | | |
|
|
|
Water Utilites — 0.1% | | | | | | | |
American States Water Co.(b) | | | 22,529 | | | 848,893 | |
| | | | | |
|
|
|
TOTAL LONG-TERM INVESTMENTS
(cost $529,003,189) | | | | | | 693,143,152 | |
| | | | | |
|
|
|
SHORT-TERM INVESTMENTS — 49.1% | | | | | | | |
Affiliated Money Market Mutual Fund — 49.0% | | | | | | | |
Dryden Core Investment Fund—Taxable Money Market Series (cost $342,698,945; includes $333,969,685 of cash collateral received for securities on loan)(Note 4)(c)(d) | | | 342,698,945 | | | 342,698,945 | |
| | | | | |
|
|
|
| | |
| | | Principal
Amount
(000)
| | | |
| U.S. Government Obligation — 0.1% | | | | |
U.S. Treasury Bills(e)(f)
(cost $993,768) 5.05%, 3/20/08 | | $ | 1,000 | | | 993,175 | |
TOTAL SHORT-TERM INVESTMENTS
(cost $343,632,713) | | | | | | 343,692,120 | |
| | | | | |
|
|
|
TOTAL INVESTMENTS — 148.2%
(cost $872,695,902) | | | | | | 1,036,835,272 | |
LIABILITIES IN EXCESS OF OTHER ASSETS(g) — (48.2 %) | | | | | | (337,265,792 | ) |
| | | | | |
|
|
|
NET ASSETS — 100.0% | | | | | $ | 699,569,480 | |
| | | | | |
|
|
|
The following abbreviation is used in the Portfolio descriptions:
| | |
| ADR | | American Depositary Receipt |
| (a) | Non-income producing security. |
| (b) | All or a portion of security is on loan. The aggregate market value of such securities is $317,232,041; cash collateral of $333,969,685 (included in liabilities) was received with which the Portfolio purchased highly liquid short-term investments. |
| (c) | Represents security, or a portion thereof, purchased with cash collateral received for securities on loan. |
| (d) | Prudential Investments LLC, the manager of the Portfolio, also serves as manager of the Dryden Core Investment Fund-Taxable Money Market Series. |
| (e) | Security segregated as collateral for futures contracts. |
| (f) | Rate quoted represents yield-to-maturity as of purchase date. |
| (g) | Liabilities in excess of other assets include net unrealized depreciation on financial futures as follows: |
Open future contracts outstanding at December 31, 2007:
| | | | | | | | | | | | | | |
Number of
Contracts
| | Type
| | Expiration
Date
| | Value at
December 31, 2007
| | Value at
Trade Date
| | Unrealized
Appreciation
(Depreciation)
| |
| Long Positions: | | | | | | | | | | | | | | |
| 21 | | Russell 2000 | | Mar. 08 | | $ | 8,108,100 | | $ | 8,170,050 | | $ | (61,950 | ) |
| 2 | | Russell Mini 2000 | | Mar. 08 | | | 154,440 | | | 153,570 | | | 870 | |
| | | | | | | | | | | | |
|
|
|
| | | | | | | | | | | | | $ | (61,080 | ) |
| | | | | | | | | | | | |
|
|
|
SEE NOTES TO FINANCIAL STATEMENTS.
A153
| | | | |
| | | SMALL CAPITALIZATION STOCK PORTFOLIO (Continued) | | |
SCHEDULE OF INVESTMENTS | December 31, 2007 |
The industry classification of portfolio holdings and liabilities in excess of other assets shown as a percentage of net assets as of December 31, 2007 were as follows:
| | | |
Affiliated Money Market Mutual Fund (including 47.7% of collateral received for securities on loan) | | 49.1 | % |
Commercial Banks | | 5.8 | |
Electronic Equipment & Instruments | | 5.7 | |
Energy Equipment & Services | | 5.2 | |
Healthcare Equipment & Supplies | | 5.1 | |
Healthcare Providers & Services | | 4.9 | |
Real Estate Investment Trusts (REITs) | | 4.5 | |
Software | | 4.5 | |
Semiconductors & Semiconductor Equipment | | 3.8 | |
Machinery | | 3.6 | |
Commercial Services & Supplies | | 3.4 | |
Gas Utilities | | 3.1 | |
Oil, Gas & Consumable Fuels | | 3.1 | |
Specialty Retail | | 3.1 | |
Insurance | | 3.0 | |
Hotels, Restaurants & Leisure | | 2.9 | |
Textiles, Apparel & Luxury Goods | | 2.6 | |
Aerospace & Defense | | 2.5 | |
Electrical Equipment | | 1.9 | |
Communications Equipment | | 1.7 | |
Food & Staples Retailing | | 1.5 | |
Chemicals | | 1.3 | |
Construction & Engineering | | 1.3 | |
Food Products | | 1.3 | |
IT Services | | 1.3 | |
Metals & Mining | | 1.3 | |
Electric Utilities | | 1.2 | |
Pharmaceuticals | | 1.2 | |
Building Products | | 1.1 | |
Internet Software & Services | | 1.1 | |
Biotechnology | | 0.9 | |
Capital Markets | | 1.0 | |
Road & Rail | | 1.0 | |
Thrifts & Mortgage Finance | | 1.0 | |
Leisure Equipment & Products | | 0.9 | |
Life Sciences Tools & Services | | 0.9 | |
Computers & Peripherals | | 0.8 | |
Containers & Packaging | | 0.8 | |
Household Durables | | 0.8 | |
Trading Companies & Distributors | | 0.6 | |
Distributors | | 0.5 | |
Diversified Consumer Services | | 0.5 | |
Healthcare Technology | | 0.5 | |
Marine | | 0.5 | |
Media | | 0.5 | |
Air Freight & Logistics | | 0.4 | |
Airlines | | 0.4 | |
Construction Materials | | 0.4 | |
Consumer Finance | | 0.4 | |
Automobiles | | 0.3 | |
Diversified Financial Services | | 0.3 | |
Internet & Catalog Retail | | 0.3 | |
Multi-Utilities | | 0.3 | |
Paper & Forest Products | | 0.4 | |
Personal Products | | 0.3 | |
Auto Components | | 0.2 | |
Exchange Traded Fund | | 0.2 | |
Household Products | | 0.2 | |
SEE NOTES TO FINANCIAL STATEMENTS.
A154
| | | | |
| | | SMALL CAPITALIZATION STOCK PORTFOLIO (Continued) | | |
SCHEDULE OF INVESTMENTS | December 31, 2007 |
| | | |
Real Estate Management & Development | | 0.2 | % |
Beverages | | 0.1 | |
Diversified Telecommunication Services | | 0.1 | |
Industrial Conglomerates | | 0.1 | |
Multiline Retail | | 0.1 | |
Tobacco | | 0.1 | |
Water Utilities | | 0.1 | |
| | |
|
|
| | | 148.2 | |
Liabilities in excess of other assets | | (48.2 | ) |
| | |
|
|
| | | 100.0 | % |
| | |
|
|
SEE NOTES TO FINANCIAL STATEMENTS.
A155
| | | | |
| | | SMALL CAPITALIZATION STOCK PORTFOLIO (Continued) | | |
STATEMENT OF ASSETS AND LIABILITIES
December 31, 2007
| | | |
| ASSETS | | | |
Investments, at value including securities on loan of $317,232,041: | | | |
Unaffiliated investments (cost $529,996,957) | | $ | 694,136,327 |
Affiliated investments (cost $342,698,945) | | | 342,698,945 |
Cash | | | 270,384 |
Dividends and interest receivable | | | 1,151,694 |
Receivable for investments sold | | | 128,361 |
Receivable for Series shares sold | | | 2,372 |
Prepaid expenses | | | 8,812 |
| | |
|
|
Total Assets | | | 1,038,396,895 |
| | |
|
|
| LIABILITIES | | | |
Collateral for securities on loan | | | 333,969,685 |
Payable for investments purchased | | | 4,127,798 |
Payable for Series shares repurchased | | | 356,840 |
Management fee payable | | | 239,380 |
Accrued expenses and other liabilities | | | 117,083 |
Due to broker — variation margin | | | 16,070 |
Transfer agent fee payable | | | 559 |
| | |
|
|
Total Liabilities | | | 338,827,415 |
| | |
|
|
| NET ASSETS | | $ | 699,569,480 |
| | |
|
|
Net assets were comprised of: | | | |
Paid-in capital | | $ | 447,354,703 |
Retained earnings | | | 252,214,777 |
| | |
|
|
Net assets, December 31, 2007 | | $ | 699,569,480 |
| | |
|
|
Net asset value and redemption price per share, $699,569,480 / 32,823,635 outstanding shares of beneficial interest (authorized 100,000,000 shares) | | $ | 21.31 |
| | |
|
|
STATEMENT OF OPERATIONS
Year Ended December 31, 2007
| | | | |
| INVESTMENT INCOME | | | | |
Unaffiliated dividend income (net of foreign withholding taxes of $3,045) | | $ | 7,806,774 | |
Affiliated income from securities loaned, net | | | 1,569,333 | |
Affiliated dividend income | | | 887,160 | |
Interest | | | 48,542 | |
| | |
|
|
|
| | | | 10,311,809 | |
| | |
|
|
|
| EXPENSES | | | | |
Management fee | | | 3,121,694 | |
Shareholders’ reports | | | 173,000 | |
Custodian’s fees and expenses | | | 142,000 | |
Trustees’ fees | | | 20,000 | |
Insurance expenses | | | 17,000 | |
Audit fee | | | 17,000 | |
Legal fees and expenses | | | 9,000 | |
Commitment fee on syndicated credit agreement | | | 3,000 | |
Transfer agent’s fee and expenses (including affiliated expense of $2,800) (Note 4) | | | 3,000 | |
Miscellaneous | | | 63,142 | |
| | |
|
|
|
Total expenses | | | 3,568,836 | |
| | |
|
|
|
| NET INVESTMENT INCOME | | | 6,742,973 | |
| | |
|
|
|
| NET REALIZED AND UNREALIZED GAIN ON INVESTMENTS | | | | |
Net realized gain (loss) on: | | | | |
Investment transactions | | | 90,888,867 | |
Futures transactions | | | (880,624 | ) |
| | |
|
|
|
| | | | 90,008,243 | |
| | |
|
|
|
Net change in unrealized appreciation (depreciation) on: | | | | |
Investments | | | (96,759,064 | ) |
Futures | | | (82,905 | ) |
| | |
|
|
|
| | | | (96,841,969 | ) |
| | |
|
|
|
| NET LOSS ON INVESTMENTS | | | (6,833,726 | ) |
| | |
|
|
|
| NET DECREASE IN NET ASSETS RESULTING FROM OPERATIONS | | $ | (90,753 | ) |
| | |
|
|
|
STATEMENT OF CHANGES IN NET ASSETS
| | | | | | | | |
| | | Year Ended December 31,
| |
| | | 2007
| | | 2006
| |
| INCREASE (DECREASE) IN NET ASSETS | | | | | | | | |
| OPERATIONS: | | | | | | | | |
Net investment income | | $ | 6,742,973 | | | $ | 4,489,036 | |
Net realized gain on investment transactions | | | 90,008,243 | | | | 51,116,609 | |
Net change in unrealized appreciation (depreciation) on investments | | | (96,841,969 | ) | | | 48,085,403 | |
| | |
|
|
| |
|
|
|
NET INCREASE (DECREASE) IN NET ASSETS RESULTING FROM OPERATIONS | | | (90,753 | ) | | | 103,691,048 | |
| | |
|
|
| |
|
|
|
| DISTRIBUTIONS: | | | (55,581,459 | ) | | | (39,883,482 | ) |
| | |
|
|
| |
|
|
|
| SERIES SHARE TRANSACTIONS: | | | | | | | | |
Series shares sold [1,460,342 and 1,425,583 shares, respectively] | | | 34,590,005 | | | | 32,193,709 | |
Series shares issued in reinvestment of distributions [2,642,961 and 1,770,000 shares, respectively] | | | 55,581,459 | | | | 39,883,482 | |
Series shares repurchased [4,643,527 and 4,365,943 shares, respectively] | | | (112,066,691 | ) | | | (97,080,147 | ) |
| | |
|
|
| |
|
|
|
NET DECREASE IN NET ASSETS RESULTING FROM SERIES SHARE TRANSACTIONS | | | (21,895,227 | ) | | | (25,002,956 | ) |
| | |
|
|
| |
|
|
|
| TOTAL INCREASE (DECREASE) IN NET ASSETS | | | (77,567,439 | ) | | | 38,804,610 | |
| NET ASSETS: | | | | | | | | |
Beginning of year | | | 777,136,919 | | | | 738,332,309 | |
| | |
|
|
| |
|
|
|
End of year | | $ | 699,569,480 | | | $ | 777,136,919 | |
| | |
|
|
| |
|
|
|
SEE NOTES TO FINANCIAL STATEMENTS.
A156
SCHEDULE OF INVESTMENTS | December 31, 2007 |
| | | | | |
| LONG-TERM INVESTMENTS — 98.3% | | Value
(Note 2)
|
| COMMON STOCKS | | Shares
| |
| | | | | | |
Aerospace/Defense — 2.9% | | | | | |
Boeing Co. | | 189,636 | | $ | 16,585,565 |
General Dynamics Corp. | | 96,100 | | | 8,551,939 |
Goodrich Corp. | | 28,600 | | | 2,019,446 |
Honeywell International, Inc. | | 178,750 | | | 11,005,638 |
L-3 Communications Holdings, Inc. | | 30,700 | | | 3,252,358 |
Lockheed Martin Corp. | | 85,698 | | | 9,020,571 |
Northrop Grumman Corp. | | 85,626 | | | 6,733,629 |
Precision Castparts Corp. | | 33,500 | | | 4,646,450 |
Raytheon Co. | | 108,318 | | | 6,574,903 |
Rockwell Collins, Inc. | | 41,500 | | | 2,986,755 |
United Technologies Corp. | | 240,500 | | | 18,407,870 |
| | | | |
|
|
| | | | | | 89,785,124 |
| | | | |
|
|
Air Freight & Logistics — 0.9% | | | | | |
C.H. Robinson Worldwide, Inc. | | 36,800 | | | 1,991,616 |
Expeditors International of Washington, Inc. | | 45,200 | | | 2,019,536 |
FedEx Corp. | | 74,240 | | | 6,619,981 |
United Parcel Service, Inc. (Class B Stock) | | 248,300 | | | 17,559,776 |
| | | | |
|
|
| | | | | | 28,190,909 |
| | | | |
|
|
Airlines — 0.1% | | | | | |
Southwest Airlines Co. | | 176,637 | | | 2,154,971 |
| | | | |
|
|
Auto Components — 0.2% | | | | | |
Goodyear Tire & Rubber Co.(a)(b) | | 44,200 | | | 1,247,324 |
Johnson Controls, Inc. | | 138,300 | | | 4,984,332 |
| | | | |
|
|
| | | | | | 6,231,656 |
| | | | |
|
|
Automobiles — 0.3% | | | | | |
Ford Motor Co.(a)(b) | | 471,545 | | | 3,173,498 |
General Motors Corp.(b) | | 131,100 | | | 3,263,079 |
Harley-Davidson, Inc. | | 63,100 | | | 2,947,401 |
| | | | |
|
|
| | | | | | 9,383,978 |
| | | | |
|
|
Beverages — 2.4% | | | | | |
Anheuser-Busch Cos., Inc. | | 185,900 | | | 9,730,006 |
Brown-Forman Corp. (Class B Stock) | | 16,200 | | | 1,200,582 |
Coca-Cola Co. (The) | | 470,900 | | | 28,899,133 |
Coca-Cola Enterprises, Inc.(b) | | 71,800 | | | 1,868,954 |
Constellation Brands, Inc. (Class A Stock)(a)(b) | | 38,200 | | | 903,048 |
Molson Coors Brewing Co. (Class B Stock)(b) | | 31,600 | | | 1,631,192 |
Pepsi Bottling Group, Inc. | | 33,600 | | | 1,325,856 |
PepsiCo, Inc. | | 382,640 | | | 29,042,376 |
| | | | |
|
|
| | | | | | 74,601,147 |
| | | | |
|
|
Biotechnology — 1.1% | | | | | |
Amgen, Inc.(a)(b) | | 263,164 | | | 12,221,336 |
Biogen Idec, Inc.(a) | | 64,525 | | | 3,672,763 |
Celgene Corp.(a) | | 87,200 | | | 4,029,512 |
Genzyme Corp.(a) | | 58,600 | | | 4,362,184 |
Gilead Sciences, Inc.(a)(b) | | 219,800 | | | 10,112,998 |
| | | | |
|
|
| | | | | | 34,398,793 |
| | | | |
|
|
Building Products — 0.1% | | | | | |
Masco Corp. | | 81,300 | | | 1,756,893 |
Trane, Inc. | | 38,900 | | | 1,817,019 |
| | | | |
|
|
| | | | | | 3,573,912 |
| | | | |
|
|
Capital Markets — 3.4% | | | | | |
American Capital Strategies Ltd.(b) | | 40,400 | | | 1,331,584 |
Ameriprise Financial, Inc. | | 59,800 | | | 3,295,578 |
SEE NOTES TO FINANCIAL STATEMENTS.
A157
| | | | |
| | | STOCK INDEX PORTFOLIO (Continued) | | |
SCHEDULE OF INVESTMENTS | December 31, 2007 |
| | | | | |
| COMMON STOCKS | | Value
(Note 2)
|
| (continued) | | Shares
| |
| | | | | | |
Capital Markets (continued) | | | | | |
Bank of New York Mellon Corp. (The)(b) | | 267,589 | | $ | 13,047,640 |
Bear Stearns Cos., Inc.(b) | | 29,610 | | | 2,613,083 |
Charles Schwab Corp. | | 238,000 | | | 6,080,900 |
E*Trade Financial Corp.(a)(b) | | 106,800 | | | 379,140 |
Federated Investors, Inc. (Class B Stock) | | 22,600 | | | 930,216 |
Franklin Resources, Inc. | | 39,900 | | | 4,565,757 |
Goldman Sachs Group, Inc.(b) | | 97,600 | | | 20,988,880 |
Janus Capital Group, Inc.(b) | | 54,200 | | | 1,780,470 |
Legg Mason, Inc. | | 32,800 | | | 2,399,320 |
Lehman Brothers Holdings, Inc.(b) | | 128,500 | | | 8,409,040 |
Merrill Lynch & Co., Inc.(b) | | 209,400 | | | 11,240,592 |
Morgan Stanley | | 254,010 | | | 13,490,471 |
Northern Trust Corp. | | 44,700 | | | 3,423,126 |
State Street Corp. | | 94,000 | | | 7,632,800 |
T. Rowe Price Group, Inc. | | 62,600 | | | 3,811,088 |
| | | | |
|
|
| | | | | | 105,419,685 |
| | | | |
|
|
Chemicals — 1.8% | | | | | |
Air Products & Chemicals, Inc. | | 50,800 | | | 5,010,404 |
Ashland, Inc. | | 16,000 | | | 758,880 |
Dow Chemical Co. | | 229,961 | | | 9,065,063 |
E.I. du Pont de Nemours & Co. | | 220,291 | | | 9,712,630 |
Eastman Chemical Co. | | 20,900 | | | 1,276,781 |
Ecolab, Inc. | | 43,600 | | | 2,232,756 |
Hercules, Inc. | | 27,900 | | | 539,865 |
International Flavors & Fragrances, Inc. | | 18,700 | | | 900,031 |
Monsanto Co. | | 128,696 | | | 14,374,056 |
PPG Industries, Inc. | | 41,000 | | | 2,879,430 |
Praxair, Inc. | | 75,200 | | | 6,670,992 |
Rohm and Haas Co.(b) | | 30,300 | | | 1,608,021 |
Sigma-Aldrich Corp.(b) | | 25,600 | | | 1,397,760 |
| | | | |
|
|
| | | | | | 56,426,669 |
| | | | |
|
|
Commercial Banks — 3.1% | | | | | |
BB&T Corp.(b) | | 136,000 | | | 4,171,120 |
Comerica, Inc. | | 43,250 | | | 1,882,673 |
Commerce Bancorp, Inc. | | 41,700 | | | 1,590,438 |
Fifth Third Bancorp | | 138,949 | | | 3,491,788 |
First Horizon National Corp.(b) | | 29,600 | | | 537,240 |
Huntington Bancshares, Inc. | | 103,475 | | | 1,527,291 |
KeyCorp.(b) | | 105,500 | | | 2,473,975 |
M&T Bank Corp. | | 20,100 | | | 1,639,557 |
Marshall & Ilsley Corp.(b) | | 58,698 | | | 1,554,323 |
National City Corp.(b) | | 152,500 | | | 2,510,150 |
PNC Financial Services Group, Inc. | | 84,300 | | | 5,534,295 |
Regions Financial Corp. | | 184,712 | | | 4,368,439 |
SunTrust Banks, Inc. | | 85,100 | | | 5,317,899 |
Synovus Financial Corp.(b) | | 71,900 | | | 1,731,352 |
US Bancorp | | 411,181 | | | 13,050,885 |
Wachovia Corp.(b) | | 471,455 | | | 17,929,434 |
Wells Fargo & Co. | | 800,620 | | | 24,170,718 |
Zions Bancorporation | | 27,700 | | | 1,293,313 |
| | | | |
|
|
| | | | | | 94,774,890 |
| | | | |
|
|
Commercial Services & Supplies — 0.5% | | | | | |
Allied Waste Industries, Inc.(a)(b) | | 71,800 | | | 791,236 |
Avery Dennison Corp.(b) | | 25,400 | | | 1,349,756 |
Cintas Corp.(b) | | 28,500 | | | 958,170 |
SEE NOTES TO FINANCIAL STATEMENTS.
A158
| | | | |
| | | STOCK INDEX PORTFOLIO (Continued) | | |
SCHEDULE OF INVESTMENTS | December 31, 2007 |
| | | | | |
| COMMON STOCKS | | Value
(Note 2)
|
| (continued) | | Shares
| |
| | | | | | |
Commercial Services & Supplies (continued) | | | | | |
Equifax, Inc. | | 31,100 | | $ | 1,130,796 |
Monster Worldwide, Inc.(a) | | 22,900 | | | 741,960 |
Pitney Bowes, Inc. | | 47,900 | | | 1,822,116 |
R.R. Donnelley & Sons Co. | | 54,200 | | | 2,045,508 |
Robert Half International, Inc. | | 43,200 | | | 1,168,128 |
Waste Management, Inc. | | 126,130 | | | 4,120,667 |
| | | | |
|
|
| | | | | | 14,128,337 |
| | | | |
|
|
Communications Equipment — 2.5% | | | | | |
Ciena Corp.(a)(b) | | 19,657 | | | 670,500 |
Cisco Systems, Inc.(a) | | 1,461,300 | | | 39,557,391 |
Corning, Inc. | | 371,500 | | | 8,912,285 |
JDS Uniphase Corp.(a)(b) | | 29,387 | | | 390,847 |
Juniper Networks, Inc.(a) | | 128,900 | | | 4,279,480 |
Motorola, Inc. | | 549,595 | | | 8,815,504 |
QUALCOMM, Inc. | | 396,100 | | | 15,586,535 |
Tellabs, Inc.(a) | | 88,000 | | | 575,520 |
| | | | |
|
|
| | | | | | 78,788,062 |
| | | | |
|
|
Computers & Peripherals — 4.4% | | | | | |
Apple, Inc.(a) | | 206,600 | | | 40,923,328 |
Dell, Inc.(a) | | 533,000 | | | 13,063,830 |
EMC Corp.(a)(b) | | 503,674 | | | 9,333,079 |
Hewlett-Packard Co. | | 621,116 | | | 31,353,936 |
International Business Machines Corp. | | 327,100 | | | 35,359,510 |
Lexmark International, Inc.(a)(b) | | 23,614 | | | 823,184 |
Network Appliance, Inc.(a) | | 92,100 | | | 2,298,816 |
QLogic Corp.(a) | | 36,100 | | | 512,620 |
SanDisk Corp.(a)(b) | | 47,800 | | | 1,585,526 |
Sun Microsystems, Inc.(a)(b) | | 204,450 | | | 3,706,679 |
| | | | |
|
|
| | | | | | 138,960,508 |
| | | | |
|
|
Construction & Engineering — 0.2% | | | | | |
Fluor Corp. | | 22,700 | | | 3,307,844 |
Jacobs Engineering Group, Inc.(a)(b) | | 25,100 | | | 2,399,811 |
| | | | |
|
|
| | | | | | 5,707,655 |
| | | | |
|
|
Construction Materials — 0.1% | | | | | |
Vulcan Materials Co. | | 22,800 | | | 1,803,252 |
| | | | |
|
|
Consumer Finance — 0.7% | | | | | |
American Express Co. | | 278,700 | | | 14,497,974 |
Capital One Financial Corp.(b) | | 98,069 | | | 4,634,741 |
Discover Financial Services | | 127,405 | | | 1,921,267 |
SLM Corp.(b) | | 98,400 | | | 1,981,776 |
| | | | |
|
|
| | | | | | 23,035,758 |
| | | | |
|
|
Containers & Packaging — 0.1% | | | | | |
Ball Corp. | | 23,400 | | | 1,053,000 |
Bemis Co. | | 22,900 | | | 627,002 |
Pactiv Corp.(a) | | 33,000 | | | 878,790 |
Sealed Air Corp. | | 39,820 | | | 921,435 |
| | | | |
|
|
| | | | | | 3,480,227 |
| | | | |
|
|
Distributors — 0.1% | | | | | |
Genuine Parts Co.(b) | | 37,325 | | | 1,728,148 |
| | | | |
|
|
Diversified Consumer Services — 0.1% | | | | | |
Apollo Group, Inc. (Class A Stock)(a)(b) | | 31,300 | | | 2,195,695 |
H&R Block, Inc. | | 79,500 | | | 1,476,315 |
| | | | |
|
|
| | | | | | 3,672,010 |
| | | | |
|
|
SEE NOTES TO FINANCIAL STATEMENTS.
A159
| | | | |
| | | STOCK INDEX PORTFOLIO (Continued) | | |
SCHEDULE OF INVESTMENTS | December 31, 2007 |
| | | | | |
| COMMON STOCKS | | Value
(Note 2)
|
| (continued) | | Shares
| |
| | | | | | |
Diversified Financial Services — 4.4% | | | | | |
Bank of America Corp. | | 1,058,907 | | $ | 43,690,503 |
CIT Group, Inc.(b) | | 52,300 | | | 1,256,769 |
Citigroup, Inc. | | 1,200,776 | | | 35,350,845 |
CME Group, Inc. | | 12,870 | | | 8,828,820 |
IntercontinentalExchange, Inc.(a) | | 15,700 | | | 3,022,250 |
JPMorgan Chase & Co. | | 804,385 | | | 35,111,405 |
Leucadia National Corp.(b) | | 38,500 | | | 1,813,350 |
Moody’s Corp.(b) | | 58,420 | | | 2,085,594 |
NYSE Euronext | | 61,700 | | | 5,415,409 |
| | | | |
|
|
| | | | | | 136,574,945 |
| | | | |
|
|
Diversified Telecommunication Services — 3.2% | | | | | |
AT&T, Inc. | | 1,454,711 | | | 60,457,789 |
CenturyTel, Inc. | | 30,000 | | | 1,243,800 |
Citizens Communications Co.(b) | | 90,300 | | | 1,149,519 |
Embarq Corp. | | 35,176 | | | 1,742,267 |
Qwest Communications International, Inc.(a)(b) | | 391,647 | | | 2,745,445 |
Verizon Communications, Inc. | | 688,438 | | | 30,077,856 |
Windstream Corp. | | 117,565 | | | 1,530,696 |
| | | | |
|
|
| | | | | | 98,947,372 |
| | | | |
|
|
Electric Utilities — 2.0% | | | | | |
Allegheny Energy, Inc. | | 37,600 | | | 2,391,736 |
American Electric Power Co., Inc. | | 96,640 | | | 4,499,558 |
Duke Energy Corp. | | 303,482 | | | 6,121,232 |
Edison International | | 79,300 | | | 4,232,241 |
Entergy Corp. | | 45,600 | | | 5,450,112 |
Exelon Corp. | | 156,550 | | | 12,780,742 |
FirstEnergy Corp. | | 72,336 | | | 5,232,786 |
FPL Group, Inc. | | 95,700 | | | 6,486,546 |
Pepco Holdings, Inc. | | 39,400 | | | 1,155,602 |
Pinnacle West Capital Corp. | | 26,000 | | | 1,102,660 |
PPL Corp. | | 90,500 | | | 4,714,145 |
Progress Energy, Inc. | | 59,414 | | | 2,877,420 |
Southern Co. | | 179,100 | | | 6,940,125 |
| | | | |
|
|
| | | | | | 63,984,905 |
| | | | |
|
|
Electrical Equipment — 0.5% | | | | | |
Cooper Industries, Ltd. (Class A Stock) | | 46,000 | | | 2,432,480 |
Emerson Electric Co. | | 188,400 | | | 10,674,744 |
Rockwell Automation, Inc. | | 42,000 | | | 2,896,320 |
| | | | |
|
|
| | | | | | 16,003,544 |
| | | | |
|
|
Electronic Equipment & Instruments — 0.3% | | | | | |
Agilent Technologies, Inc.(a) | | 101,382 | | | 3,724,775 |
Jabil Circuit, Inc. | | 44,000 | | | 671,880 |
Molex, Inc. | | 26,600 | | | 726,180 |
Tyco Electronics Ltd. | | 120,960 | | | 4,491,245 |
| | | | |
|
|
| | | | | | 9,614,080 |
| | | | |
|
|
Energy Equipment & Services — 2.5% | | | | | |
Baker Hughes, Inc. | | 73,630 | | | 5,971,393 |
BJ Services Co. | | 59,300 | | | 1,438,618 |
ENSCO International, Inc. | | 32,200 | | | 1,919,764 |
Halliburton Co. | | 216,600 | | | 8,211,306 |
Nabors Industries Ltd.(a) | | 65,600 | | | 1,796,784 |
National-Oilwell Varco, Inc.(a)(b) | | 86,400 | | | 6,346,944 |
Noble Corp. | | 60,600 | | | 3,424,506 |
Rowan Cos., Inc.(b) | | 17,100 | | | 674,766 |
SEE NOTES TO FINANCIAL STATEMENTS.
A160
| | | | |
| | | STOCK INDEX PORTFOLIO (Continued) | | |
SCHEDULE OF INVESTMENTS | December 31, 2007 |
| | | | | |
| COMMON STOCKS | | Value
(Note 2)
|
| (continued) | | Shares
| |
| | | | | | |
Energy Equipment & Services (continued) | | | | | |
Schlumberger Ltd. | | 282,900 | | $ | 27,828,873 |
Smith International, Inc. | | 43,900 | | | 3,242,015 |
Transocean, Inc. | | 72,836 | | | 10,426,473 |
Weatherford International Ltd.(a) | | 77,500 | | | 5,316,500 |
| | | | |
|
|
| | | | | | 76,597,942 |
| | | | |
|
|
Food & Staples Retailing — 2.3% | | | | | |
Costco Wholesale Corp. | | 104,432 | | | 7,285,176 |
CVS Caremark Corp.(b) | | 355,138 | | | 14,116,736 |
Kroger Co. | | 178,000 | | | 4,754,380 |
Safeway, Inc. | | 103,900 | | | 3,554,419 |
SUPERVALU, Inc. | | 50,508 | | | 1,895,060 |
Sysco Corp. | | 144,300 | | | 4,503,603 |
Walgreen Co.(b) | | 230,300 | | | 8,769,824 |
Wal-Mart Stores, Inc. | | 571,900 | | | 27,182,407 |
Whole Foods Market, Inc.(b) | | 28,300 | | | 1,154,640 |
| | | | |
|
|
| | | | | | 73,216,245 |
| | | | |
|
|
Food Products — 1.4% | | | | | |
Archer-Daniels-Midland Co. | | 154,938 | | | 7,193,771 |
Campbell Soup Co. | | 48,800 | | | 1,743,624 |
ConAgra Food, Inc. | | 114,000 | | | 2,712,060 |
Dean Foods Co. | | 31,800 | | | 822,348 |
General Mills, Inc. | | 78,500 | | | 4,474,500 |
H.J. Heinz Co. | | 77,350 | | | 3,610,698 |
Hershey Co. (The)(b) | | 43,300 | | | 1,706,020 |
Kellogg Co.(b) | | 59,000 | | | 3,093,370 |
Kraft Foods, Inc. | | 372,611 | | | 12,158,297 |
McCormick & Co., Inc. | | 31,300 | | | 1,186,583 |
Sara Lee Corp. | | 176,400 | | | 2,832,984 |
Tyson Foods, Inc. (Class A Stock)(b) | | 49,800 | | | 763,434 |
Wm. Wrigley Jr. Co. | | 49,100 | | | 2,874,805 |
| | | | |
|
|
| | | | | | 45,172,494 |
| | | | |
|
|
Gas Utilities — 0.1% | | | | | |
Nicor, Inc. | | 12,200 | | | 516,670 |
Questar Corp. | | 39,800 | | | 2,153,180 |
| | | | |
|
|
| | | | | | 2,669,850 |
| | | | |
|
|
Healthcare Equipment & Supplies — 1.7% | | | | | |
Baxter International, Inc. | | 156,500 | | | 9,084,825 |
Becton Dickinson & Co. | | 57,700 | | | 4,822,566 |
Boston Scientific Corp.(a)(b) | | 289,799 | | | 3,370,362 |
C.R. Bard, Inc. | | 24,600 | | | 2,332,080 |
Covidien Ltd. | | 113,960 | | | 5,047,288 |
Hospira, Inc.(a)(b) | | 39,920 | | | 1,702,189 |
Medtronic, Inc. | | 277,700 | | | 13,959,979 |
St. Jude Medical, Inc.(a) | | 83,100 | | | 3,377,184 |
Stryker Corp. | | 57,500 | | | 4,296,400 |
Varian Medical Systems, Inc.(a)(b) | | 23,200 | | | 1,210,112 |
Zimmer Holdings, Inc.(a) | | 57,286 | | | 3,789,469 |
| | | | |
|
|
| | | | | | 52,992,454 |
| | | | |
|
|
Healthcare Providers & Services — 2.4% | | | | | |
Aetna, Inc. | | 121,448 | | | 7,011,193 |
AmerisourceBergen Corp. | | 46,200 | | | 2,072,994 |
Cardinal Health, Inc. | | 87,975 | | | 5,080,556 |
CIGNA Corp. | | 71,700 | | | 3,852,441 |
Coventry Health Care, Inc.(a) | | 38,450 | | | 2,278,163 |
SEE NOTES TO FINANCIAL STATEMENTS.
A161
| | | | |
| | | STOCK INDEX PORTFOLIO (Continued) | | |
SCHEDULE OF INVESTMENTS | December 31, 2007 |
| | | | | |
| COMMON STOCKS | | Value
(Note 2)
|
| (continued) | | Shares
| |
| | | | | | |
Healthcare Providers & Services (continued) | | | | | |
Express Scripts, Inc.(a) | | 64,000 | | $ | 4,672,000 |
Humana, Inc.(a) | | 40,800 | | | 3,072,648 |
Laboratory Corp. of America Holdings(a)(b) | | 27,600 | | | 2,084,628 |
McKesson Corp. | | 68,107 | | | 4,461,690 |
Medco Health Solutions, Inc.(a) | | 64,296 | | | 6,519,614 |
Patterson Cos., Inc.(a)(b) | | 24,300 | | | 824,985 |
Quest Diagnostics, Inc.(b) | | 38,300 | | | 2,026,070 |
Tenet Healthcare Corp.(a)(b) | | 90,000 | | | 457,200 |
UnitedHealth Group, Inc. | | 314,900 | | | 18,327,180 |
WellPoint, Inc.(a) | | 140,700 | | | 12,343,611 |
| | | | |
|
|
| | | | | | 75,084,973 |
| | | | |
|
|
Healthcare Technology | | | | | |
IMS Health, Inc. | | 51,320 | | | 1,182,413 |
| | | | |
|
|
Hotels, Restaurants & Leisure — 1.4% | | | | | |
Carnival Corp. | | 103,800 | | | 4,618,062 |
Darden Restaurants, Inc.(b) | | 38,650 | | | 1,070,992 |
Harrah’s Entertainment, Inc. | | 41,950 | | | 3,723,063 |
International Game Technology | | 73,000 | | | 3,206,890 |
Marriott International, Inc. (Class A Stock)(b) | | 72,600 | | | 2,481,468 |
McDonald’s Corp.(b) | | 282,300 | | | 16,630,293 |
Starbucks Corp.(a) | | 167,100 | | | 3,420,537 |
Starwood Hotels & Resorts Worldwide, Inc. | | 48,500 | | | 2,135,455 |
Wendy’s International, Inc. | | 21,700 | | | 560,728 |
Wyndham Worldwide Corp. | | 44,763 | | | 1,054,616 |
Yum! Brands, Inc.(b) | | 124,600 | | | 4,768,442 |
| | | | |
|
|
| | | | | | 43,670,546 |
| | | | |
|
|
Household Durables — 0.4% | | | | | |
Black & Decker Corp. | | 16,500 | | | 1,149,225 |
Centex Corp. | | 24,600 | | | 621,396 |
D.R. Horton, Inc.(b) | | 52,200 | | | 687,474 |
Fortune Brands, Inc. | | 33,000 | | | 2,387,880 |
Harman International Industries, Inc. | | 14,100 | | | 1,039,311 |
KB Home(b) | | 17,232 | | | 372,211 |
Leggett & Platt, Inc. | | 44,300 | | | 772,592 |
Lennar Corp. (Class A Stock)(b) | | 29,000 | | | 518,810 |
Newell Rubbermaid, Inc. | | 64,649 | | | 1,673,116 |
Pulte Homes, Inc. | | 35,700 | | | 376,278 |
Snap-On, Inc. | | 12,300 | | | 593,352 |
Stanley Works | | 19,100 | | | 925,968 |
Whirlpool Corp. | | 17,507 | | | 1,429,096 |
| | | | |
|
|
| | | | | | 12,546,709 |
| | | | |
|
|
Household Products — 2.4% | | | | | |
Clorox Co.(b) | | 32,600 | | | 2,124,542 |
Colgate-Palmolive Co. | | 120,200 | | | 9,370,792 |
Kimberly-Clark Corp. | | 108,588 | | | 7,529,492 |
Procter & Gamble Co. | | 745,781 | | | 54,755,241 |
| | | | |
|
|
| | | | | | 73,780,067 |
| | | | |
|
|
Independent Power Producers & Energy Traders — 0.3% | | | | | |
AES Corp.(a) | | 159,700 | | | 3,415,983 |
Constellation Energy Group, Inc. | | 43,450 | | | 4,454,929 |
Dynegy, Inc.(a) | | 87,800 | | | 626,892 |
| | | | |
|
|
| | | | | | 8,497,804 |
| | | | |
|
|
SEE NOTES TO FINANCIAL STATEMENTS.
A162
| | | | |
| | | STOCK INDEX PORTFOLIO (Continued) | | |
SCHEDULE OF INVESTMENTS | December 31, 2007 |
| | | | | |
| COMMON STOCKS | | Value
(Note 2)
|
| (continued) | | Shares
| |
| | | | | | |
Industrial Conglomerates — 3.6% | | | | | |
3M Co. | | 170,200 | | $ | 14,351,264 |
General Electric Co. | | 2,421,500 | | | 89,765,004 |
Textron, Inc. | | 57,800 | | | 4,121,140 |
Tyco International Ltd. | | 120,960 | | | 4,796,064 |
| | | | |
|
|
| | | | | | 113,033,472 |
| | | | |
|
|
Insurance — 4.0% | | | | | |
ACE Ltd. | | 81,700 | | | 5,047,426 |
AFLAC, Inc. | | 114,700 | | | 7,183,661 |
Allstate Corp. | | 143,488 | | | 7,494,378 |
Ambac Financial Group, Inc.(b) | | 31,800 | | | 819,486 |
American International Group, Inc.(b) | | 610,987 | | | 35,620,542 |
Aon Corp.(b) | | 66,925 | | | 3,191,653 |
Assurant, Inc.(b) | | 24,500 | | | 1,639,050 |
Chubb Corp. | | 99,300 | | | 5,419,794 |
Cincinnati Financial Corp. | | 43,228 | | | 1,709,235 |
Genworth Financial, Inc. (Class A Stock) | | 112,300 | | | 2,858,035 |
Hartford Financial Services Group, Inc. | | 78,300 | | | 6,826,977 |
Lincoln National Corp. | | 68,063 | | | 3,962,628 |
Loews Corp. | | 105,800 | | | 5,325,972 |
Marsh & McLennan Co., Inc. | | 123,100 | | | 3,258,457 |
MBIA, Inc.(b) | | 36,550 | | | 680,927 |
MetLife, Inc. | | 180,500 | | | 11,122,410 |
Principal Financial Group, Inc. | | 61,300 | | | 4,219,892 |
Progressive Corp. | | 165,100 | | | 3,163,316 |
SAFECO Corp. | | 26,600 | | | 1,481,088 |
Torchmark Corp. | | 24,100 | | | 1,458,773 |
Travelers Cos., Inc | | 160,398 | | | 8,629,412 |
UnumProvident Corp. | | 86,456 | | | 2,056,788 |
XL Capital Ltd. (Class A Stock) | | 46,300 | | | 2,329,353 |
| | | | |
|
|
| | | | | | 125,499,253 |
| | | | |
|
|
Internet & Catalog Retail — 0.3% | | | | | |
Amazon.Com, Inc.(a)(b) | | 69,500 | | | 6,438,480 |
Expedia, Inc.(a)(b) | | 40,400 | | | 1,277,448 |
IAC/InterActiveCorp(a)(b) | | 45,200 | | | 1,216,784 |
| | | | |
|
|
| | | | | | 8,932,712 |
| | | | |
|
|
Internet Software & Services — 1.8% | | | | | |
Akamai Technologies, Inc.(a)(b) | | 30,400 | | | 1,051,840 |
eBay, Inc.(a)(b) | | 277,100 | | | 9,196,949 |
Google, Inc. (Class A Stock)(a) | | 54,750 | | | 37,858,530 |
VeriSign, Inc.(a)(b) | | 47,500 | | | 1,786,475 |
Yahoo!, Inc.(a) | | 310,900 | | | 7,231,534 |
| | | | |
|
|
| | | | | | 57,125,328 |
| | | | |
|
|
IT Services — 0.8% | | | | | |
Affiliated Computer Services, Inc. (Class A Stock)(a) | | 25,300 | | | 1,141,030 |
Automatic Data Processing, Inc. | | 136,000 | | | 6,056,080 |
Cognizant Technology Solutions Corp. (Class A Stock)(a) | | 64,600 | | | 2,192,524 |
Computer Sciences Corp.(a) | | 42,700 | | | 2,112,369 |
Convergys Corp.(a) | | 37,600 | | | 618,896 |
Electronic Data Systems Corp. | | 123,300 | | | 2,556,009 |
Fidelity National Information Services, Inc. | | 34,400 | | | 1,430,696 |
Fiserv, Inc.(a)(b) | | 36,700 | | | 2,036,483 |
Paychex, Inc. | | 78,950 | | | 2,859,569 |
Unisys Corp.(a)(b) | | 67,000 | | | 316,910 |
Western Union Co. | | 172,404 | | | 4,185,969 |
| | | | |
|
|
| | | | | | 25,506,535 |
| | | | |
|
|
SEE NOTES TO FINANCIAL STATEMENTS.
A163
| | | | |
| | | STOCK INDEX PORTFOLIO (Continued) | | |
SCHEDULE OF INVESTMENTS | December 31, 2007 |
| | | | | |
| COMMON STOCKS | | Value
(Note 2)
|
| (continued) | | Shares
| |
| | | | | | |
Leisure Equipment & Products — 0.1% | | | | | |
Brunswick Corp.(b) | | 21,300 | | $ | 363,165 |
Eastman Kodak Co.(b) | | 57,000 | | | 1,246,590 |
Hasbro, Inc. | | 42,650 | | | 1,090,987 |
Mattel, Inc. | | 92,881 | | | 1,768,454 |
| | | | |
|
|
| | | | | | 4,469,196 |
| | | | |
|
|
Life Sciences, Tools & Services — 0.4% | | | | | |
Applera Corp.-Applied Biosystems Group | | 39,600 | | | 1,343,232 |
Millipore Corp.(a)(b) | | 10,800 | | | 790,344 |
PerkinElmer, Inc. | | 31,000 | | | 806,620 |
Thermo Fisher Scientific, Inc.(a) | | 103,500 | | | 5,969,880 |
Waters Corp.(a) | | 27,600 | | | 2,182,332 |
| | | | |
|
|
| | | | | | 11,092,408 |
| | | | |
|
|
Machinery — 1.9% | | | | | |
Caterpillar, Inc.(b) | | 153,300 | | | 11,123,448 |
Cummins, Inc. | | 24,800 | | | 3,158,776 |
Danaher Corp. | | 55,800 | | | 4,895,892 |
Deere & Co. | | 106,800 | | | 9,945,216 |
Dover Corp. | | 50,500 | | | 2,327,545 |
Eaton Corp. | | 35,500 | | | 3,441,725 |
Illinois Tool Works, Inc. | | 99,100 | | | 5,305,814 |
Ingersoll-Rand Co. Ltd. (Class A Stock) | | 76,100 | | | 3,536,367 |
ITT Corp. | | 43,500 | | | 2,872,740 |
Manitowoc Co., Inc. (The)(b) | | 22,900 | | | 1,118,207 |
PACCAR, Inc. | | 88,228 | | | 4,806,661 |
Pall Corp.(b) | | 23,200 | | | 935,424 |
Parker Hannifin Corp. | | 42,187 | | | 3,177,103 |
Terex Corp.(a) | | 24,200 | | | 1,586,794 |
| | | | |
|
|
| | | | | | 58,231,712 |
| | | | |
|
|
Media — 2.8% | | | | | |
CBS Corp. (Class B Stock)(b) | | 181,368 | | | 4,942,278 |
Clear Channel Communications, Inc. | | 114,100 | | | 3,938,732 |
Comcast Corp. (Class A Stock)(a)(b) | | 738,045 | | | 13,476,702 |
DIRECTV Group, Inc. (The)(a) | | 181,500 | | | 4,196,280 |
E.W. Scripps Co. (The) (Class A Stock) | | 16,700 | | | 751,667 |
Gannett Co., Inc.(b) | | 59,100 | | | 2,304,900 |
Interpublic Group of Cos., Inc.(a) | | 84,700 | | | 686,917 |
McGraw-Hill Cos., Inc. | | 77,700 | | | 3,404,037 |
Meredith Corp. | | 11,000 | | | 604,780 |
New York Times Co. (Class A Stock)(b) | | 36,500 | | | 639,845 |
News Corp. (Class A Stock) | | 536,000 | | | 10,982,640 |
Omnicom Group, Inc. | | 80,600 | | | 3,830,918 |
Time Warner, Inc. | | 891,020 | | | 14,710,740 |
Viacom, Inc. (Class B Stock)(a) | | 166,768 | | | 7,324,451 |
Walt Disney Co. (The) | | 460,901 | | | 14,877,884 |
Washington Post Co. (The) (Class B Stock) | | 600 | | | 474,858 |
| | | | |
|
|
| | | | | | 87,147,629 |
| | | | |
|
|
Metals & Mining — 1.0% | | | | | |
Alcoa, Inc. | | 211,476 | | | 7,729,448 |
Allegheny Technologies, Inc.(b) | | 22,640 | | | 1,956,096 |
Freeport-McMoRan Copper & Gold, Inc. (Class B Stock) | | 89,006 | | | 9,117,775 |
Newmont Mining Corp. | | 107,703 | | | 5,259,137 |
Nucor Corp. | | 70,700 | | | 4,186,854 |
Titanium Metals Corp.(b) | | 7,100 | | | 187,795 |
United States Steel Corp. | | 27,740 | | | 3,354,043 |
| | | | |
|
|
| | | | | | 31,791,148 |
| | | | |
|
|
SEE NOTES TO FINANCIAL STATEMENTS.
A164
| | | | |
| | | STOCK INDEX PORTFOLIO (Continued) | | |
SCHEDULE OF INVESTMENTS | December 31, 2007 |
| | | | | |
| COMMON STOCKS | | Value
(Note 2)
|
| (continued) | | Shares
| |
| | | | | | |
Multiline Retail — 0.7% | | | | | |
Big Lots, Inc.(a)(b) | | 26,200 | | $ | 418,938 |
Dillard’s, Inc. | | 4,650 | | | 87,327 |
Family Dollar Stores, Inc.(b) | | 37,100 | | | 713,433 |
J.C. Penney Co., Inc. | | 54,400 | | | 2,393,056 |
Kohl’s Corp.(a) | | 77,500 | | | 3,549,500 |
Macy’s, Inc. | | 103,420 | | | 2,675,475 |
Nordstrom, Inc. | | 48,000 | | | 1,763,040 |
Sears Holdings Corp.(a)(b) | | 15,812 | | | 1,613,615 |
Target Corp. | | 194,168 | | | 9,708,400 |
| | | | |
|
|
| | | | | | 22,922,784 |
| | | | |
|
|
Multi-Utilities — 1.1% | | | | | |
Ameren Corp.(b) | | 47,100 | | | 2,553,291 |
CenterPoint Energy, Inc. | | 79,010 | | | 1,353,441 |
CMS Energy Corp.(b) | | 43,000 | | | 747,340 |
Consolidated Edison, Inc.(b) | | 62,800 | | | 3,067,780 |
Dominion Resources, Inc. | | 138,884 | | | 6,590,046 |
DTE Energy Co.(b) | | 39,200 | | | 1,723,232 |
Integrys Energy Group, Inc. | | 17,750 | | | 917,498 |
NiSource, Inc. | | 73,000 | | | 1,378,970 |
PG&E Corp. | | 80,600 | | | 3,473,054 |
Public Service Enterprise Group, Inc. | | 60,300 | | | 5,923,872 |
Sempra Energy | | 60,754 | | | 3,759,458 |
TECO Energy, Inc. | | 42,100 | | | 724,541 |
Xcel Energy, Inc. | | 104,895 | | | 2,367,480 |
| | | | |
|
|
| | | | | | 34,580,003 |
| | | | |
|
|
Office Electronics — 0.1% | | | | | |
Xerox Corp. | | 246,892 | | | 3,997,181 |
| | | | |
|
|
Oil, Gas & Consumable Fuels — 10.1% | | | | | |
Anadarko Petroleum Corp.(b) | | 112,226 | | | 7,372,126 |
Apache Corp. | | 78,750 | | | 8,468,775 |
Chesapeake Energy Corp. | | 104,700 | | | 4,104,240 |
Chevron Corp. | | 507,992 | | | 47,410,893 |
ConocoPhillips | | 387,079 | | | 34,179,076 |
Consol Energy, Inc. | | 40,000 | | | 2,860,800 |
Devon Energy Corp. | | 107,200 | | | 9,531,152 |
El Paso Corp. | | 168,611 | | | 2,906,854 |
EOG Resources, Inc.(b) | | 59,700 | | | 5,328,225 |
Exxon Mobil Corp. | | 1,307,770 | | | 122,524,970 |
Hess Corp. | | 66,000 | | | 6,656,760 |
Marathon Oil Corp. | | 172,094 | | | 10,473,641 |
Murphy Oil Corp. | | 43,100 | | | 3,656,604 |
Noble Energy, Inc. | | 37,300 | | | 2,966,096 |
Occidental Petroleum Corp. | | 199,600 | | | 15,367,204 |
Peabody Energy Corp.(b) | | 57,300 | | | 3,531,972 |
Range Resources Corp. | | 27,600 | | | 1,417,536 |
Spectra Energy Corp. | | 154,242 | | | 3,982,528 |
Sunoco, Inc. | | 27,000 | | | 1,955,880 |
Tesoro Corp. | | 27,100 | | | 1,292,670 |
Valero Energy Corp. | | 133,900 | | | 9,377,017 |
Williams Cos., Inc. | | 150,000 | | | 5,367,000 |
XTO Energy, Inc. | | 112,500 | | | 5,778,000 |
| | | | |
|
|
| | | | | | 316,510,019 |
| | | | |
|
|
SEE NOTES TO FINANCIAL STATEMENTS.
A165
| | | | |
| | | STOCK INDEX PORTFOLIO (Continued) | | |
SCHEDULE OF INVESTMENTS | December 31, 2007 |
| | | | | |
| COMMON STOCKS | | Value
(Note 2)
|
| (continued) | | Shares
| |
| | | | | | |
Paper & Forest Products — 0.3% | | | | | |
International Paper Co. | | 107,267 | | $ | 3,473,305 |
MeadWestvaco Corp.(b) | | 45,589 | | | 1,426,936 |
Weyerhaeuser Co. | | 48,000 | | | 3,539,520 |
| | | | |
|
|
| | | | | | 8,439,761 |
| | | | |
|
|
Personal Products — 0.2% | | | | | |
Avon Products, Inc. | | 104,100 | | | 4,115,073 |
Estee Lauder Cos., Inc. (The)(b) | | 25,500 | | | 1,112,055 |
| | | | |
|
|
| | | | | | 5,227,128 |
| | | | |
|
|
Pharmaceuticals — 6.2% | | | | | |
Abbott Laboratories | | 367,200 | | | 20,618,280 |
Allergan, Inc.(b) | | 68,800 | | | 4,419,712 |
Barr Pharmaceuticals, Inc.(a)(b) | | 19,900 | | | 1,056,690 |
Bristol-Myers Squibb Co. | | 475,660 | | | 12,614,503 |
Eli Lilly & Co. | | 242,300 | | | 12,936,397 |
Forest Laboratories, Inc.(a) | | 76,500 | | | 2,788,425 |
Johnson & Johnson | | 687,771 | | | 45,874,326 |
King Pharmaceuticals, Inc.(a) | | 62,033 | | | 635,218 |
Merck & Co., Inc. | | 518,100 | | | 30,106,791 |
Mylan Laboratories, Inc.(b) | | 50,500 | | | 710,030 |
Pfizer, Inc. | | 1,653,408 | | | 37,581,964 |
Schering-Plough Corp.(b) | | 379,600 | | | 10,112,544 |
Watson Pharmaceuticals, Inc.(a)(b) | | 27,900 | | | 757,206 |
Wyeth | | 318,900 | | | 14,092,191 |
| | | | |
|
|
| | | | | | 194,304,277 |
| | | | |
|
|
Real Estate Investment Trust — 1.0% | | | | | |
Apartment Investment & Management Co. (Class A Stock)(b) | | 23,100 | | | 802,263 |
AvalonBay Communities, Inc.(b) | | 17,900 | | | 1,685,106 |
Boston Properties, Inc.(b) | | 27,600 | | | 2,533,956 |
Developers Diversified Realty Corp. | | 26,400 | | | 1,010,856 |
Equity Residential Properties Trust(b) | | 66,700 | | | 2,432,549 |
General Growth Properties, Inc.(b) | | 56,400 | | | 2,322,552 |
Host Hotels & Resorts, Inc.(b) | | 129,000 | | | 2,198,160 |
Kimco Realty Corp.(b) | | 57,100 | | | 2,078,440 |
Plum Creek Timber Co., Inc.(b) | | 37,000 | | | 1,703,480 |
ProLogis(b) | | 63,000 | | | 3,992,940 |
Public Storage, Inc. | | 28,700 | | | 2,106,867 |
Simon Property Group, Inc.(b) | | 52,800 | | | 4,586,208 |
Vornado Realty Trust | | 30,400 | | | 2,673,680 |
| | | | |
|
|
| | | | | | 30,127,057 |
| | | | |
|
|
Real Estate Management & Development | | | | | |
CB Richard Ellis Group, Inc. (Class A Stock)(a)(b) | | 45,100 | | | 971,905 |
| | | | |
|
|
Road & Rail — 0.8% | | | | | |
Burlington Northern Santa Fe Corp. | | 69,826 | | | 5,811,618 |
CSX Corp.(b) | | 103,624 | | | 4,557,384 |
Norfolk Southern Corp.(b) | | 91,600 | | | 4,620,304 |
Ryder System, Inc. | | 12,800 | | | 601,728 |
Union Pacific Corp. | | 62,900 | | | 7,901,498 |
| | | | |
|
|
| | | | | | 23,492,532 |
| | | | |
|
|
Semiconductors & Semiconductor Equipment — 2.6% | | | | | |
Advanced Micro Devices, Inc.(a)(b) | | 106,900 | | | 801,750 |
Altera Corp.(b) | | 82,700 | | | 1,597,764 |
Analog Devices, Inc. | | 75,700 | | | 2,399,690 |
Applied Materials, Inc.(b) | | 304,500 | | | 5,407,920 |
Broadcom Corp. (Class A Stock)(a)(b) | | 103,550 | | | 2,706,797 |
SEE NOTES TO FINANCIAL STATEMENTS.
A166
| | | | |
| | | STOCK INDEX PORTFOLIO (Continued) | | |
SCHEDULE OF INVESTMENTS | December 31, 2007 |
| | | | | |
| COMMON STOCKS | | Value
(Note 2)
|
| (continued) | | Shares
| |
| | | | | | |
Semiconductors & Semiconductor Equipment (continued) | | | | | |
Intel Corp. | | 1,402,800 | | $ | 37,398,648 |
KLA-Tencor Corp.(b) | | 42,400 | | | 2,041,984 |
Linear Technology Corp.(b) | | 56,800 | | | 1,807,944 |
LSI Logic Corp.(a)(b) | | 135,700 | | | 720,567 |
MEMC Electronic Materials, Inc.(a) | | 51,000 | | | 4,512,990 |
Microchip Technology, Inc.(b) | | 44,200 | | | 1,388,764 |
Micron Technology, Inc.(a)(b) | | 154,900 | | | 1,123,025 |
National Semiconductor Corp.(b) | | 60,700 | | | 1,374,248 |
Novellus Systems, Inc.(a) | | 30,400 | | | 838,128 |
NVIDIA Corp.(a)(b) | | 129,850 | | | 4,417,497 |
Teradyne, Inc.(a)(b) | | 40,800 | | | 421,872 |
Texas Instruments, Inc.(b) | | 343,100 | | | 11,459,540 |
Xilinx, Inc. | | 75,700 | | | 1,655,559 |
| | | | |
|
|
| | | | | | 82,074,687 |
| | | | |
|
|
Software — 3.8% | | | | | |
Adobe Systems, Inc.(a) | | 141,700 | | | 6,054,841 |
Autodesk, Inc.(a)(b) | | 50,400 | | | 2,507,904 |
BMC Software, Inc.(a) | | 57,900 | | | 2,063,556 |
CA, Inc. | | 105,773 | | | 2,639,036 |
Citrix Systems, Inc.(a)(b) | | 35,900 | | | 1,364,559 |
Compuware Corp.(a)(b) | | 78,400 | | | 696,192 |
Electronic Arts, Inc.(a)(b) | | 68,200 | | | 3,983,562 |
Intuit, Inc.(a) | | 91,600 | | | 2,895,476 |
Microsoft Corp.(b) | | 1,928,400 | | | 68,651,040 |
Novell, Inc.(a) | | 73,100 | | | 502,197 |
Oracle Corp.(a) | | 951,320 | | | 21,480,806 |
Symantec Corp.(a) | | 238,111 | | | 3,843,112 |
Teradata Corp.(a) | | 46,300 | | | 1,269,083 |
| | | | |
|
|
| | | | | | 117,951,364 |
| | | | |
|
|
Specialty Retail — 1.5% | | | | | |
Abercrombie & Fitch Co. | | 20,500 | | | 1,639,385 |
AutoNation, Inc.(a)(b) | | 40,589 | | | 635,624 |
AutoZone, Inc.(a) | | 11,700 | | | 1,402,947 |
Bed Bath & Beyond, Inc.(a) | | 59,100 | | | 1,736,949 |
Best Buy Co., Inc. | | 91,925 | | | 4,839,851 |
Circuit City Stores, Inc. | | 12,000 | | | 50,400 |
GameStop Corp. (Class A Stock)(a) | | 31,900 | | | 1,981,309 |
Gap, Inc.(b) | | 115,587 | | | 2,459,692 |
Home Depot, Inc. | | 400,219 | | | 10,781,900 |
Limited Brands, Inc.(b) | | 76,796 | | | 1,453,748 |
Lowe’s Cos., Inc. | | 342,000 | | | 7,736,040 |
Office Depot, Inc.(a)(b) | | 68,800 | | | 957,008 |
OfficeMax, Inc. | | 16,786 | | | 346,799 |
RadioShack Corp.(b) | | 31,760 | | | 535,474 |
Sherwin-Williams Co.(b) | | 27,000 | | | 1,567,080 |
Staples, Inc. | | 163,000 | | | 3,760,410 |
Tiffany & Co. | | 28,300 | | | 1,302,649 |
TJX Cos., Inc. | | 107,100 | | | 3,076,983 |
| | | | |
|
|
| | | | | | 46,264,248 |
| | | | |
|
|
Textiles, Apparel & Luxury Goods — 0.4% | | | | | |
Coach, Inc.(a) | | 84,200 | | | 2,574,836 |
Jones Apparel Group, Inc.(b) | | 28,000 | | | 447,720 |
Liz Claiborne, Inc.(b) | | 26,400 | | | 537,240 |
NIKE, Inc., (Class B Stock) | | 88,600 | | | 5,691,664 |
Polo Ralph Lauren Corp. | | 13,200 | | | 815,628 |
V.F. Corp. | | 22,536 | | | 1,547,322 |
| | | | |
|
|
| | | | | | 11,614,410 |
| | | | |
|
|
SEE NOTES TO FINANCIAL STATEMENTS.
A167
| | | | |
| | | STOCK INDEX PORTFOLIO (Continued) | | |
SCHEDULE OF INVESTMENTS | December 31, 2007 |
| | | | | | | |
| COMMON STOCKS | | Value
(Note 2)
| |
| (continued) | | Shares
| |
| | | | | | | | |
Thrifts & Mortgage Finance — 0.7% | | | | | | | |
Countrywide Financial Corp.(b) | | | 151,098 | | $ | 1,350,816 | |
Fannie Mae | | | 230,000 | | | 9,195,400 | |
Freddie Mac | | | 149,300 | | | 5,086,651 | |
Hudson City Bancorp, Inc. | | | 145,800 | | | 2,189,916 | |
MGIC Investment Corp.(b) | | | 23,600 | | | 529,348 | |
Sovereign Bancorp, Inc.(b) | | | 87,405 | | | 996,417 | |
Washington Mutual, Inc.(b) | | | 218,126 | | | 2,968,695 | |
| | | | | |
|
|
|
| | | | | | | 22,317,243 | |
| | | | | |
|
|
|
Tobacco — 1.4% | | | | | | | |
Altria Group, Inc. | | | 500,000 | | | 37,790,000 | |
Reynolds American, Inc.(b) | | | 46,400 | | | 3,060,544 | |
UST, Inc. | | | 37,400 | | | 2,049,520 | |
| | | | | |
|
|
|
| | | | | | | 42,900,064 | |
| | | | | |
|
|
|
Trading Companies & Distributors | | | | | | | |
W.W. Grainger, Inc. | | | 14,800 | | | 1,295,296 | |
| | | | | |
|
|
|
Wireless Telecommunication Services — 0.4% | | | | | | | |
American Tower Corp. (Class A Stock)(a) | | | 88,000 | | | 3,748,800 | |
Sprint Nextel Corp. | | | 688,522 | | | 9,040,294 | |
| | | | | |
|
|
|
| | | | | | | 12,789,094 | |
| | | | | |
|
|
|
TOTAL LONG-TERM INVESTMENTS
(cost $1,632,553,686) | | | 3,067,390,480 | |
| | | | | |
|
|
|
| | |
| SHORT-TERM INVESTMENTS — 15.3% | | | | | |
Affiliated Money Market Mutual Fund — 15.2% | | | | | | | |
Dryden Core Investment Fund — Taxable Money Market Series
(cost $476,101,440; includes $428,571,796 of cash collateral received for securities on loan) (Note 4)(c)(f) | | | 476,101,440 | | | 476,101,440 | |
| | | | | |
|
|
|
| | |
| | | Principal
Amount
(000)
| | | |
U.S. Government Obligation — 0.1% | | | | | | | |
United States Treasury Bills(d)(e)
2.84%, 03/20/2008
(cost $ 2,981,303) | | $ | 3,000 | | | 2,979,525 | |
TOTAL SHORT-TERM INVESTMENTS
(cost $479,082,743) | | | 479,080,965 | |
| | | | | |
|
|
|
TOTAL INVESTMENTS — 113.6%
(cost $2,111,636,429) | | | 3,546,471,445 | |
LIABILITIES IN EXCESS OF OTHER ASSETS(g) — (13.6%) | | | (424,075,228 | ) |
| | | | | |
|
|
|
NET ASSETS — 100.0% | | $ | 3,122,396,217 | |
| | | | | |
|
|
|
| (a) | Non income-producing security. |
| (b) | All or portion of security is on loan. The aggregate market value of such securities is $411,116,874 cash collateral of $428,571,796 (included in liabilities) was received with which the Portfolio purchased highly liquid short-term investments. |
| (c) | Represents security, or portion thereof, purchased with cash collateral received for securities on loan. |
| (d) | Security segregated as collateral for futures contracts. |
| (e) | Rate quoted represents yield-to-maturity at purchase date. |
| (f) | Prudential Investments LLC, the manager of the Portfolio, also serves as manager of the Dryden Core Investment Fund — Taxable Money Market Series. |
SEE NOTES TO FINANCIAL STATEMENTS.
A168
| | | | |
| | | STOCK INDEX PORTFOLIO (Continued) | | |
SCHEDULE OF INVESTMENTS | December 31, 2007 |
| (g) | Liabilities in excess of other assets include net unrealized appreciation on financial futures as follows: |
Open futures contract outstanding at December 31, 2007:
| | | | | | | | | | | | | |
Number of
Contracts
| | Type
| | Expiration
Date
| | Value at
December 31, 2007
| | Value at
Trade Date
| | Unrealized
Appreciation
|
| Long Position: | | | | | | | | | | | | | |
| 145 | | S&P 500 Index | | Mar. 2008 | | $ | 53,548,500 | | $ | 53,023,450 | | $ | 525,050 |
The industry classification of portfolio holdings and liabilities in excess of other assets shown as a percentage of net assets as of December 31, 2007 was as follows:
| | | |
Affiliated Money Market Mutual Fund (including 13.7% of collateral received for securities on loan) | | 15.2 | % |
Oil, Gas & Consumable Fuels | | 10.1 | |
Pharmaceuticals | | 6.2 | |
Computers & Peripherals | | 4.4 | |
Diversified Financial Services | | 4.4 | |
Insurance | | 4.0 | |
Software | | 3.8 | |
Industrial Conglomerates | | 3.6 | |
Capital Markets | | 3.4 | |
Diversified Telecommunication Services | | 3.2 | |
Commercial Banks | | 3.1 | |
Aerospace/Defense | | 2.9 | |
Media | | 2.8 | |
Semiconductors & Semiconductor Equipment | | 2.6 | |
Communications Equipment | | 2.5 | |
Energy Equipment & Services | | 2.5 | |
Beverages | | 2.4 | |
Healthcare Providers & Services | | 2.4 | |
Household Products | | 2.4 | |
Food & Staples Retailing | | 2.3 | |
Electric Utilities | | 2.0 | |
Machinery | | 1.9 | |
Chemicals | | 1.8 | |
Internet Software & Services | | 1.8 | |
Healthcare Equipment & Supplies | | 1.7 | |
Specialty Retail | | 1.5 | |
Food Products | | 1.4 | |
Hotels, Restaurants & Leisure | | 1.4 | |
Tobacco | | 1.4 | |
Biotechnology | | 1.1 | |
Multi-Utilities | | 1.1 | |
Metals & Mining | | 1.0 | |
Real Estate Investment Trust | | 1.0 | |
Air Freight & Logistics | | 0.9 | |
IT Services | | 0.8 | |
Road & Rail | | 0.8 | |
Consumer Finance | | 0.7 | |
Multiline Retail | | 0.7 | |
Thrifts & Mortgage Finance | | 0.7 | |
Commercial Services & Supplies | | 0.5 | |
Electrical Equipment | | 0.5 | |
Household Durables | | 0.4 | |
Life Sciences, Tools & Services | | 0.4 | |
Textiles, Apparel & Luxury Goods | | 0.4 | |
Wireless Telecommunication Services | | 0.4 | |
Automobiles | | 0.3 | |
Electronic Equipment & Instruments | | 0.3 | |
Independent Power Producers & Energy Traders | | 0.3 | |
Internet & Catalog Retail | | 0.3 | |
Paper & Forest Products | | 0.3 | |
Auto Components | | 0.2 | |
SEE NOTES TO FINANCIAL STATEMENTS.
A169
| | | | |
| | | STOCK INDEX PORTFOLIO (Continued) | | |
SCHEDULE OF INVESTMENTS | December 31, 2007 |
| | | |
Construction & Engineering | | 0.2 | % |
Personal Products | | 0.2 | |
Airlines | | 0.1 | |
Building Products | | 0.1 | |
Construction Materials | | 0.1 | |
Containers & Packaging | | 0.1 | |
Distributors | | 0.1 | |
Diversified Consumer Services | | 0.1 | |
Gas Utilities | | 0.1 | |
Leisure Equipment & Products | | 0.1 | |
Office Electronics | | 0.1 | |
U.S. Government Obligation | | 0.1 | |
| | |
|
|
| | | 113.6 | |
Liabilities in excess of other assets | | (13.6 | ) |
| | |
|
|
| | | 100.0 | % |
| | |
|
|
SEE NOTES TO FINANCIAL STATEMENTS.
A170
| | | | |
| | | STOCK INDEX PORTFOLIO (Continued) | | |
STATEMENT OF ASSETS AND LIABILITIES
December 31, 2007
| | | |
| ASSETS | | | |
Investments, at value including securities on loan of $411,116,874: | | | |
Unaffiliated investments (cost $1,635,534,989) | | $ | 3,070,370,005 |
Affiliated investments (cost $476,101,440) | | | 476,101,440 |
Cash | | | 354,725 |
Dividends receivable | | | 4,811,425 |
Receivable for investments sold | | | 4,284,034 |
Receivable for Series shares sold | | | 59,056 |
Prepaid expenses | | | 36,474 |
| | |
|
|
Total Assets | | | 3,556,017,159 |
| | |
|
|
| LIABILITIES | | | |
Collateral for securities on loan | | | 428,571,796 |
Payable for investments purchased | | | 2,577,225 |
Management fee payable | | | 937,923 |
Payable for Series shares repurchased | | | 790,890 |
Accrued expenses | | | 446,254 |
Due to broker-variation margin | | | 296,225 |
Transfer agent fee payable | | | 629 |
| | |
|
|
Total Liabilities | | | 433,620,942 |
| | |
|
|
| NET ASSETS | | $ | 3,122,396,217 |
| | |
|
|
Net assets were comprised of: | | | |
Paid-in capital | | $ | 1,689,955,955 |
Retained earnings | | | 1,432,440,262 |
| | |
|
|
Net assets, December 31, 2007 | | $ | 3,122,396,217 |
| | |
|
|
Net asset value and redemption price per share, $3,122,396,217 / 84,766,386 outstanding shares of beneficial interest (authorized 275,000,000 shares) | | $ | 36.84 |
| | |
|
|
STATEMENT OF OPERATIONS
Year Ended December 31, 2007
| | | |
| INVESTMENT INCOME | | | |
Unaffiliated dividend income | | $ | 65,139,259 |
Affiliated dividend income | | | 2,788,704 |
Affiliated income from securities loaned, net | | | 946,420 |
Interest | | | 155,761 |
| | |
|
|
| | | | 69,030,144 |
| | |
|
|
| EXPENSES | | | |
Management fee | | | 11,519,701 |
Custodian’s fees and expenses | | | 324,000 |
Insurance expenses | | | 71,000 |
Trustees’ fees | | | 53,000 |
Shareholders’ reports | | | 37,000 |
Legal fees and expenses | | | 18,000 |
Audit fee | | | 16,000 |
Commitment fee on syndicated credit agreement | | | 12,000 |
Transfer agent’s fee and expenses (including affiliated expense of $4,300) (Note 4) | | | 5,000 |
Miscellaneous | | | 14,500 |
| | |
|
|
Total expenses | | | 12,070,201 |
| | |
|
|
| NET INVESTMENT INCOME | | | 56,959,943 |
| | |
|
|
| NET REALIZED AND UNREALIZED GAIN (LOSS) ON INVESTMENTS | | | |
Net realized gain on: | | | |
Investment transactions | | | 76,496,272 |
Futures transactions | | | 263,093 |
| | |
|
|
| | | | 76,759,365 |
| | |
|
|
Net change in unrealized appreciation (depreciation) on: | | | |
Investments | | | 34,182,519 |
Futures | | | 419,812 |
| | |
|
|
| | | | 34,602,331 |
| | |
|
|
| NET GAIN ON INVESTMENTS | | | 111,361,696 |
| | |
|
|
| NET INCREASE IN NET ASSETS RESULTING FROM OPERATIONS | | $ | 168,321,639 |
| | |
|
|
STATEMENT OF CHANGES IN NET ASSETS
| | | | | | | | |
| | | Year Ended December 31,
| |
| | | 2007
| | | 2006
| |
| INCREASE (DECREASE) IN NET ASSETS | | | | | | | | |
| OPERATIONS: | | | | | | | | |
Net investment income | | $ | 56,959,943 | | | $ | 51,532,817 | |
Net realized gain (loss) on investment transactions | | | 76,759,365 | | | | (66,612,227 | ) |
Net change in unrealized appreciation (depreciation) on investments | | | 34,602,331 | | | | 477,113,399 | |
| | |
|
|
| |
|
|
|
NET INCREASE IN NET ASSETS RESULTING FROM OPERATIONS | | | 168,321,639 | | | | 462,033,989 | |
| | |
|
|
| |
|
|
|
| DISTRIBUTIONS | | | (51,529,141 | ) | | | (59,982,933 | ) |
| | |
|
|
| |
|
|
|
| SERIES SHARE TRANSACTIONS: | | | | | | | | |
Series shares sold [1,884,280 and 2,413,005 shares, respectively] | | | 70,200,353 | | | | 80,048,346 | |
Series shares issued in reinvestment of distributions [1,400,248 and 1,700,891 shares, respectively] | | | 51,529,141 | | | | 59,982,933 | |
Series shares repurchased [11,303,103 and 13,622,829 shares, respectively] | | | (422,534,751 | ) | | | (448,417,431 | ) |
| | |
|
|
| |
|
|
|
NET DECREASE IN NET ASSETS RESULTING FROM SERIES SHARE TRANSACTIONS | | | (300,805,257 | ) | | | (308,386,152 | ) |
| | |
|
|
| |
|
|
|
| TOTAL INCREASE (DECREASE) IN NET ASSETS | | | (184,012,759 | ) | | | 93,664,904 | |
| NET ASSETS: | | | | | | | | |
Beginning of year | | | 3,306,408,976 | | | | 3,212,744,072 | |
| | |
|
|
| |
|
|
|
End of year | | $ | 3,122,396,217 | | | $ | 3,306,408,976 | |
| | |
|
|
| |
|
|
|
SEE NOTES TO FINANCIAL STATEMENTS.
A171
SCHEDULE OF INVESTMENTS | December 31, 2007 |
| | | | | |
| LONG-TERM INVESTMENTS — 96.8% | | Shares
| | Value
(Note 2)
|
| COMMON STOCKS | | |
| | | | | | |
Biotechnology — 1.6% | | | | | |
Amgen, Inc.(a)(b) | | 624,900 | | $ | 29,020,356 |
| | | | |
|
|
Capital Markets — 3.9% | | | | | |
Bank of New York Mellon Corp. (The) | | 532,195 | | | 25,949,828 |
TD Ameritrade Holding Corp.(a)(b) | | 773,100 | | | 15,508,386 |
UBS AG | | 628,500 | | | 28,911,000 |
| | | | |
|
|
| | | | | | 70,369,214 |
| | | | |
|
|
Commercial Banks — 1.2% | | | | | |
Royal Bank of Scotland Group PLC (United Kingdom) | | 2,525,604 | | | 22,322,004 |
| | | | |
|
|
Commercial Services & Supplies — 1.7% | | | | | |
Waste Management, Inc. | | 975,000 | | | 31,853,250 |
| | | | |
|
|
Communications Equipment — 1.2% | | | | | |
QUALCOMM, Inc. | | 555,500 | | | 21,858,925 |
| | | | |
|
|
Computers & Peripherals — 3.0% | | | | | |
Lexmark International, Inc.(a)(b) | | 607,000 | | | 21,160,020 |
Seagate Technology | | 1,345,200 | | | 34,302,600 |
| | | | |
|
|
| | | | | | 55,462,620 |
| | | | |
|
|
Consumer Finance — 2.2% | | | | | |
American Express Co. | | 315,000 | | | 16,386,300 |
SLM Corp.(b) | | 1,175,400 | | | 23,672,556 |
| | | | |
|
|
| | | | | | 40,058,856 |
| | | | |
|
|
Diversified Consumer Services — 3.3% | | | | | |
Career Education Corp.(a)(b) | | 800,700 | | | 20,129,598 |
H&R Block, Inc. | | 2,187,600 | | | 40,623,732 |
| | | | |
|
|
| | | | | | 60,753,330 |
| | | | |
|
|
Diversified Financial Services — 3.7% | | | | | |
Bank of America Corp. | | 536,272 | | | 22,126,583 |
Citigroup, Inc. | | 886,600 | | | 26,101,504 |
KKR Private Equity Investors LLP | | 176,100 | | | 3,197,976 |
KKR Private Equity Investors LLP, RDU, Private Placement, 144A(f)(g)
(cost $22,639,596; purchased 5/03/06-05/05/06) | | 907,900 | | | 16,487,464 |
| | | | |
|
|
| | | | | | 67,913,527 |
| | | | |
|
|
Diversified Telecommunication Services — 0.8% | | | | | |
Verizon Communications, Inc. | | 353,700 | | | 15,453,153 |
| | | | |
|
|
Electric Utilities — 2.7% | | | | | |
Entergy Corp. | | 255,900 | | | 30,585,168 |
Progress Energy, Inc. | | 386,200 | | | 18,703,666 |
| | | | |
|
|
| | | | | | 49,288,834 |
| | | | |
|
|
Electronic Equipment & Instruments — 1.5% | | | | | |
Sony Corp., ADR (Japan) | | 498,700 | | | 27,079,410 |
| | | | |
|
|
Food & Staples Retailing — 3.6% | | | | | |
Kroger Co. (The) | | 1,493,300 | | | 39,886,043 |
Wal-Mart Stores, Inc. | | 546,300 | | | 25,965,639 |
| | | | |
|
|
| | | | | | 65,851,682 |
| | | | |
|
|
Food Products — 4.7% | | | | | |
Cadbury Schweppes PLC, ADR (United Kingdom) | | 982,800 | | | 48,520,836 |
ConAgra Foods, Inc. | | 1,589,500 | | | 37,814,205 |
| | | | |
|
|
| | | | | | 86,335,041 |
| | | | |
|
|
Healthcare Providers & Services — 1.3% | | | | | |
Omnicare, Inc. | | 1,039,100 | | | 23,701,871 |
| | | | |
|
|
SEE NOTES TO FINANCIAL STATEMENTS.
A172
| | | | |
| | | VALUE PORTFOLIO (Continued) | | |
SCHEDULE OF INVESTMENTS | December 31, 2007 |
| | | | | |
| COMMON STOCKS | | Shares
| | Value
(Note 2)
|
| (continued) | | |
| | | | | | |
Household Products — 1.7% | | | | | |
Kimberly-Clark Corp. | | 446,200 | | $ | 30,939,508 |
| | | | |
|
|
Independent Power Producers & Energy Traders — 1.8% | | | | | |
NRG Energy, Inc.(a)(b) | | 744,300 | | | 32,257,962 |
| | | | |
|
|
Industrial Conglomerates — 1.7% | | | | | |
General Electric Co. | | 849,700 | | | 31,498,379 |
| | | | |
|
|
Insurance — 6.0% | | | | | |
American International Group, Inc. | | 684,600 | | | 39,912,180 |
Axis Capital Holdings Ltd. | | 495,300 | | | 19,301,841 |
Loews Corp. | | 766,400 | | | 38,580,576 |
MBIA, Inc.(b) | | 569,700 | | | 10,613,511 |
| | | | |
|
|
| | | | | | 108,408,108 |
| | | | |
|
|
Internet & Catalog Retail — 1.6% | | | | | |
IAC/InterActiveCorp(a)(b) | | 1,098,800 | | | 29,579,696 |
| | | | |
|
|
Media — 6.0% | | | | | |
Comcast Corp. (Class A Stock)(a)(b) | | 2,475,000 | | | 45,193,500 |
Liberty Global, Inc., Series C(a) | | 998,735 | | | 36,543,713 |
XM Satellite Radio Holdings, Inc. (Class A Stock)(a) | | 2,127,800 | | | 26,044,272 |
| | | | |
|
|
| | | | | | 107,781,485 |
| | | | |
|
|
Metals & Mining — 0.6% | | | | | |
Freeport-McMoRan Copper & Gold, Inc. (Class B Stock)(b) | | 115,918 | | | 11,874,640 |
| | | | |
|
|
Multi-Utilities — 2.0% | | | | | |
Sempra Energy | | 601,900 | | | 37,245,572 |
| | | | |
|
|
Office Electronics — 1.3% | | | | | |
Xerox Corp. | | 1,466,400 | | | 23,741,016 |
| | | | |
|
|
Oil, Gas & Consumable Fuels — 18.4% | | | | | |
Anadarko Petroleum Corp. | | 501,300 | | | 32,930,397 |
Devon Energy Corp. | | 337,100 | | | 29,971,561 |
Hess Corp. | | 177,400 | | | 17,892,564 |
Marathon Oil Corp. | | 577,000 | | | 35,116,220 |
Murphy Oil Corp. | | 314,900 | | | 26,716,116 |
Nexen, Inc. | | 898,000 | | | 28,978,460 |
Occidental Petroleum Corp. | | 714,100 | | | 54,978,559 |
Petroleo Brasileiro SA, ADR (Brazil)(b) | | 370,400 | | | 42,684,896 |
Suncor Energy, Inc. | | 417,700 | | | 45,416,521 |
Trident Resources Corp. (Canada)(a)(f)(g)
(cost $16,980,633; purchased 3/11/05-1/05/06) | | 404,537 | | | 4,098,860 |
Williams Cos., Inc. | | 460,500 | | | 16,476,690 |
| | | | |
|
|
| | | | | | 335,260,844 |
| | | | |
|
|
Paper & Forest Products — 1.0% | | | | | |
Domtar Corp(a) | | 2,340,700 | | | 17,999,983 |
| | | | |
|
|
Pharmaceuticals — 4.3% | | | | | |
Abbott Laboratories | | 375,000 | | | 21,056,250 |
Novartis AG, ADR (Switzerland)(b) | | 544,600 | | | 29,577,226 |
Wyeth | | 618,000 | | | 27,309,420 |
| | | | |
|
|
| | | | | | 77,942,896 |
| | | | |
|
|
Semiconductors & Semiconductor Equipment — 0.7% | | | | | |
Spansion, Inc.(a) | | 3,482,800 | | | 13,687,404 |
| | | | |
|
|
Software — 3.0% | | | | | |
Microsoft Corp. | | 655,800 | | | 23,346,480 |
Symantec Corp.(a) | | 1,943,500 | | | 31,368,090 |
| | | | |
|
|
| | | | | | 54,714,570 |
| | | | |
|
|
Specialty Retail — 2.1% | | | | | |
Best Buy Co., Inc. | | 732,800 | | | 38,581,920 |
| | | | |
|
|
SEE NOTES TO FINANCIAL STATEMENTS.
A173
| | | | |
| | | VALUE PORTFOLIO (Continued) | | |
SCHEDULE OF INVESTMENTS | December 31, 2007 |
| | | | | | | |
| COMMON STOCKS | | Shares
| | Value
(Note 2)
| |
| (continued) | | |
| | | | | | | | |
Thrifts & Mortgage Finance — 2.5% | | | | | | | |
Federal National Mortgage Association | | | 623,800 | | $ | 24,939,524 | |
People’s United Financial, Inc.(b) | | | 1,188,860 | | | 21,161,708 | |
| | | | | |
|
|
|
| | | | | | | 46,101,232 | |
| | | | | |
|
|
|
Tobacco—1.1% | | | | | | | |
Altria Group, Inc. | | | 269,000 | | | 20,331,020 | |
| | | | | |
|
|
|
Wireless Telecommunication Services — 4.0% | | | | | | | |
NII Holdings, Inc.(a) | | | 539,900 | | | 26,087,968 | |
Sprint Nextel Corp. | | | 2,068,436 | | | 27,158,565 | |
Virgin Mobile USA Inc.(a)(b) | | | 2,231,400 | | | 19,837,146 | |
| | | | | |
|
|
|
| | | | | | | 73,083,679 | |
| | | | | |
|
|
|
TOTAL COMMON STOCKS
(cost $1,568,880,641) | | | 1,758,351,987 | |
| | | | | |
|
|
|
| | |
| | | Principal
Amount
(000)
| | | |
| CORPORATE BOND— 0.6% | | | | | | | |
Oil, Gas & Consumable Fuels | | | | | | | |
Trident Resources Corp. (Canada), Private Placement, PIK, 12.396%, due 8/12/12(f)(g)
(cost $10,601,085; purchased 8/20/07-12/24/07) | | $ | 11,143 | | | 11,290,628 | |
| | | | | |
|
|
|
| | |
| WARRANT | | Units
| | | |
Oil, Gas & Consumable Fuels | | | | | | | |
Trident Resources Corp. (Canada), Private Placement, expiring 1/01/15(a)(f)(g)
(cost $0; purchased 8/20/07) | | | 1,058,389 | | | 107 | |
| | | | | |
|
|
|
TOTAL LONG-TERM INVESTMENTS
(cost $1,579,481,726) | | | 1,769,642,722 | |
| | | | | |
|
|
|
| | |
| | | Shares
| | | |
| SHORT-TERM INVESTMENT — 17.0% | | | | | | | |
Affiliated Money Market Mutual Fund | | | | | | | |
Dryden Core Investment Fund — Taxable Money Market Series
(cost $310,645,400 includes $249,408,402 of cash collateral for securities on loan) (Note 4)(c)(d) | | | 310,645,400 | | | 310,645,400 | |
| | | | | |
|
|
|
TOTAL INVESTMENTS(e) 113.8%
(cost $1,890,127,126) | | | 2,080,288,122 | |
LIABILITIES IN EXCESS OF OTHER ASSETS — (13.8%) | | | (252,665,592 | ) |
| | | | | |
|
|
|
NET ASSETS — 100.0% | | $ | 1,827,622,530 | |
| | | | | |
|
|
|
The following abbreviations are used in portfolio descriptions:
| | |
| ADR | | American Depositary Receipt |
| PIK | | Payment in Kind |
| RDU | | Restricted Depositary Unit |
| 144A | | Securities were purchased pursuant to Rule 144A under the Securities Act of 1933 and may not be resold subject to that rule except to qualified institutional buyers. Unless otherwise noted, 144A securities are deemed to be liquid. |
| (a) | Non-income producing security. |
| (b) | All or a portion of security is on loan. The aggregate market value of such securities is $237,202,994; cash collateral of $249,408,402 (included in liabilities) was received with which the Portfolio purchased highly liquid short-term investments. |
| (c) | Represents security, or portion thereof, purchased with cash collateral for securities on loan. |
| (d) | Prudential Investments LLC, the Manager of the Portfolio, also serves as Manager of the Dryden Core Investment Fund — Taxable Money Market Series. |
| (e) | As of December 31, 2007, four securities valued at $31,877,059 and representing 1.7% of net assets were fair valued in accordance with the policies adopted by the Board of Trustees. |
| (f) | Indicates an illiquid security. |
| (g) | Indicates securities restricted to resale. The aggregate cost of such securities was $50,221,314. The aggregate value of $31,887,059 is approximately 1.7% of net assets. |
SEE NOTES TO FINANCIAL STATEMENTS.
A174
| | | | |
| | | VALUE PORTFOLIO (Continued) | | |
SCHEDULE OF INVESTMENTS | December 31, 2007 |
The industry classification of portfolio holdings and liabilities in excess of other assets shown as a percentage of net assets as of December 31, 2007 was as follows:
| | | |
Oil, Gas & Consumable Fuels | | 19.0 | % |
Affiliated Money Market Mutual Fund (including 13.6% of collateral received for securities on loan) | | 17.0 | |
Insurance | | 6.0 | |
Media | | 6.0 | |
Food Products | | 4.7 | |
Pharmaceuticals | | 4.3 | |
Wireless Telecommunication Services | | 4.0 | |
Capital Markets | | 3.9 | |
Diversified Financial Services | | 3.7 | |
Food & Staples Retailing | | 3.6 | |
Diversified Consumer Services | | 3.3 | |
Computers & Peripherals | | 3.0 | |
Software | | 3.0 | |
Electric Utilities | | 2.7 | |
Thrifts & Mortgage Finance | | 2.5 | |
Consumer Finance | | 2.2 | |
Specialty Retail | | 2.1 | |
Multi-Utilities | | 2.0 | |
Independent Power Producers & Energy Traders | | 1.8 | |
Commercial Services & Supplies | | 1.7 | |
Household Products | | 1.7 | |
Industrial Conglomerates | | 1.7 | |
Biotechnology | | 1.6 | |
Internet & Catalog Retail | | 1.6 | |
Electronic Equipment & Instruments | | 1.5 | |
Healthcare Providers & Services | | 1.3 | |
Office Electronics | | 1.3 | |
Commercial Banks | | 1.2 | |
Communications Equipment | | 1.2 | |
Tobacco | | 1.1 | |
Paper & Forest Products | | 1.0 | |
Diversified Telecommunications Services | | 0.8 | |
Semiconductors & Semiconductor Equipment | | 0.7 | |
Metals & Mining | | 0.6 | |
| | |
|
|
| | | 113.8 | |
Liabilities in excess of other assets | | (13.8 | ) |
| | |
|
|
| | | 100.0 | % |
| | |
|
|
SEE NOTES TO FINANCIAL STATEMENTS.
A175
| | | | |
| | | VALUE PORTFOLIO (Continued) | | |
STATEMENT OF ASSETS AND LIABILITIES
December 31, 2007
| | | |
| ASSETS | | | |
Investments, at value including securities on loan of $237,202,994: | | | |
Unaffiliated investments (cost $1,579,481,726) | | $ | 1,769,642,722 |
Affiliated investments (cost $310,645,400) | | | 310,645,400 |
Cash | | | 258,487 |
Foreign currency, at value (cost $14,582) | | | 14,689 |
Dividends and interest receivable | | | 2,810,472 |
Receivable for investments sold | | | 7,087,248 |
Foreign tax reclaim receivable | | | 261,649 |
Receivable for Series shares sold | | | 48,643 |
Prepaid expenses | | | 22,272 |
| | |
|
|
Total Assets | | | 2,090,791,582 |
| | |
|
|
| LIABILITIES | | | |
Collateral for securities on loan | | | 249,408,402 |
Payable for investments purchased | | | 11,766,157 |
Payable for Series shares repurchased | | | 792,330 |
Management fee payable | | | 619,807 |
Accrued expenses and other liabilities | | | 580,315 |
Transfer agent fee payable | | | 1,064 |
Distribution fee payable | | | 611 |
Administration fee payable | | | 366 |
| | |
|
|
Total Liabilities | | | 263,169,052 |
| | |
|
|
| NET ASSETS | | $ | 1,827,622,530 |
| | |
|
|
Net assets were comprised of: | | | |
Paid-in capital | | $ | 1,333,540,055 |
Retained earnings | | | 494,082,475 |
| | |
|
|
Net assets, December 31, 2007 | | $ | 1,827,622,530 |
| | |
|
|
| Class I: | | | |
Net asset value and redemption price per share, $1,824,896,044 / 77,846,430 outstanding shares of beneficial interest (authorized 275,000,000 shares) | | $ | 23.44 |
| | |
|
|
| Class II: | | | |
Net asset value and redemption price per share, $2,726,486 / 115,982 outstanding shares of beneficial interest (authorized 50,000,000 shares) | | $ | 23.51 |
| | |
|
|
STATEMENT OF OPERATIONS
Year Ended December 31, 2007
| | | | |
| INVESTMENT INCOME | | | | |
Unaffiliated dividend income (net of foreign withholding taxes of $348,727) | | $ | 31,979,441 | |
Affiliated dividend income | | | 1,935,907 | |
Affiliated income from securities loaned, net | | | 637,902 | |
Interest | | | 517,497 | |
| | |
|
|
|
| | | | 35,070,747 | |
| | |
|
|
|
| EXPENSES | | | | |
Management fee | | | 7,863,691 | |
Distribution fee—Class II | | | 7,856 | |
Administration fee—Class II | | | 4,714 | |
Custodian’s fees and expenses | | | 187,000 | |
Shareholders’ reports | | | 175,000 | |
Dividends on securities sold short | | | 91,775 | |
Insurance expenses | | | 42,000 | |
Trustees’ fees | | | 35,000 | |
Audit fee | | | 16,000 | |
Legal fees and expenses | | | 10,000 | |
Transfer agent’s fee and expenses (including affiliated expense of $5,800) (Note 4) | | | 6,000 | |
Loan interest expense (Note 8) | | | 2,361 | |
Miscellaneous | | | 17,768 | |
| | |
|
|
|
Total expenses | | | 8,459,165 | |
| | |
|
|
|
| NET INVESTMENT INCOME | | | 26,611,582 | |
| | |
|
|
|
| NET REALIZED AND UNREALIZED GAIN (LOSS) ON INVESTMENTS AND FOREIGN CURRENCIES | | | | |
Net realized gain on: | | | | |
Investment transactions | | | 304,291,126 | |
Foreign currency transactions | | | 175,378 | |
Short sales | | | 635,761 | |
| | |
|
|
|
| | | | 305,102,265 | |
| | |
|
|
|
Net change in unrealized appreciation (depreciation) on: | | | | |
Investments | | | (265,627,306 | ) |
Foreign currencies | | | (159 | ) |
| | |
|
|
|
| | | | (265,627,465 | ) |
| | |
|
|
|
| NET GAIN ON INVESTMENTS AND FOREIGN CURRENCIES | | | 39,474,800 | |
| | |
|
|
|
| NET INCREASE IN NET ASSETS RESULTING FROM OPERATIONS | | $ | 66,086,382 | |
| | |
|
|
|
STATEMENT OF CHANGES IN NET ASSETS
| | | | | | | | |
| | | Year Ended December 31,
| |
| | | 2007
| | | 2006
| |
INCREASE (DECREASE) IN NET ASSETS OPERATIONS: | | | | | | | | |
Net investment income | | $ | 26,611,582 | | | $ | 26,717,918 | |
Net realized gain on investment and foreign currency transactions | | | 305,102,265 | | | | 215,956,646 | |
Net change in unrealized appreciation (depreciation) on investments and foreign currencies | | | (265,627,465 | ) | | | 94,560,137 | |
| | |
|
|
| |
|
|
|
NET INCREASE IN NET ASSETS RESULTING FROM OPERATIONS | | | 66,086,382 | | | | 337,234,701 | |
| | |
|
|
| |
|
|
|
| DISTRIBUTIONS: | | | | | | | | |
Class I | | | (242,165,135 | ) | | | (90,953,391 | ) |
Class II | | | (373,906 | ) | | | (140,456 | ) |
| | |
|
|
| |
|
|
|
TOTAL DISTRIBUTIONS | | | (242,539,041 | ) | | | (91,093,847 | ) |
| | |
|
|
| |
|
|
|
| SERIES SHARE TRANSACTIONS (Note 7): | | | | | | | | |
Series shares sold [1,101,337 and 3,470,511 shares, respectively] | | | 29,566,166 | | | | 84,008,078 | |
Series shares issued in reinvestment of distributions [10,431,739 and 3,735,884 shares, respectively] | | | 242,539,041 | | | | 91,093,847 | |
Series shares repurchased [9,083,303 and 8,082,223 shares, respectively] | | | (246,981,367 | ) | | | (195,543,964 | ) |
| | |
|
|
| |
|
|
|
NET INCREASE (DECREASE) IN NET ASSETS RESULTING FROM SERIES SHARE TRANSACTIONS | | | 25,123,840 | | | | (20,442,039 | ) |
| | |
|
|
| |
|
|
|
| TOTAL INCREASE (DECREASE) IN NET ASSETS | | | (151,328,819 | ) | | | 225,698,815 | |
| | |
|
|
| |
|
|
|
| NET ASSETS: | | | | | | | | |
Beginning of year | | | 1,978,951,349 | | | | 1,753,252,534 | |
| | |
|
|
| |
|
|
|
End of year | | $ | 1,827,622,530 | | | $ | 1,978,951,349 | |
| | |
|
|
| |
|
|
|
SEE NOTES TO FINANCIAL STATEMENTS.
A176
NOTES TO THE FINANCIAL STATEMENTS OF
THE PRUDENTIAL SERIES FUND
The Prudential Series Fund (“Series Fund”), organized as a Delaware statutory trust, is a diversified open-end management investment company registered under the Investment Company Act of 1940, as amended. On January 2, 2006, each Portfolio of the Fund changed its federal income tax status from a regulated investment company to a partnership. As a result of that conversion, the Series Fund was reorganized from a Maryland corporation to a Delaware statutory trust. Pursuant to this reorganization, the Fund has been renamed “The Prudential Series Fund.” The Series Fund is composed of thirty-two Portfolios (“Portfolio” or “Portfolios”), each with separate series shares. The information presented in these financial statements pertains to thirteen Portfolios: Conservative Balanced Portfolio, Diversified Bond Portfolio, Equity Portfolio, Flexible Managed Portfolio, Global Portfolio, Government Income Portfolio, High Yield Bond Portfolio, Jennison Portfolio, Money Market Portfolio, Natural Resources Portfolio, Small Capitalization Stock Portfolio, Stock Index Portfolio and Value Portfolio.
The Portfolios of the Series Fund have the following as investment objectives:
Conservative Balanced Portfolio: Total investment return consistent with a conservatively managed diversified portfolio by investing in a mix of equity-related securities, debt obligations and money market instruments.
Diversified Bond Portfolio: High level of income over a longer term while providing reasonable safety of capital by investing in intermediate and long-term debt obligations that are rated investment grade and high quality money market instruments. The types of debt obligations in which the Portfolio can invest include U.S. government securities, mortgage-related securities and corporate bonds.
Equity Portfolio: Capital appreciation by investing primarily in stocks of major, established corporations as well as small companies.
Flexible Managed Portfolio: High total return consistent with an aggressively managed diversified portfolio by investing in a mix of equity and equity-related securities, debt obligations and money market instruments.
Global Portfolio: Long-term growth of capital by investing primarily in equity and equity-related securities of foreign and U.S. companies.
Government Income Portfolio: High level of income over the long-term consistent with the preservation of capital by investing primarily in intermediate and long-term U.S. government securities, including U.S. treasuries, government agency and mortgage-related securities.
High Yield Bond Portfolio: High total return by investing primarily in medium to lower rated debt securities.
Jennison Portfolio: Long-term growth of capital by investing primarily in equity securities of established companies that the Portfolio manager believes offer above-average growth prospects.
Money Market Portfolio: Maximum current income consistent with the stability of capital and maintenance of liquidity by investing in high quality short-term money market securities issued by the U.S. government and its agencies, as well as commercial paper, asset backed securities, certificates of deposit and other obligations issued by banks, corporations and other companies, that generally mature in 13 months or less.
Natural Resources Portfolio: Long-term growth of capital by investing primarily in stocks of companies that operate within, or do business with, the natural resources sector of the economy.
Small Capitalization Stock Portfolio: Long-term growth of capital that corresponds to the price and yield performance of the Standard & Poor’s Small Capitalization Stock Index (the “S&P 600 SmallCap Index”) by investing primarily in stocks of the S&P 600 SmallCap Index.
Stock Index Portfolio: Investment results that generally correspond to the price and yield performance of the S&P 500 Index by investing primarily in stocks in the S&P 500 Index.
Value Portfolio: Capital appreciation by investing in equity and equity-related securities that are considered to be undervalued.
B1
The ability of issuers of debt securities (other than those issued or guaranteed by the U.S. Government) held by the Portfolios to meet their obligations may be affected by the economic or political developments in a specific industry, region or country.
Foreign security and currency transactions may involve certain considerations and risks not typically associated with those of domestic origin as a result of, among other factors, the possibility of political and economic instability or the level of governmental supervision and regulation of foreign securities markets.
| Note 2: | | Accounting Policies |
The following is a summary of significant accounting policies followed by the Series Fund and the Portfolios in preparation of their financial statements.
Securities Valuation: Securities listed on a securities exchange are valued at the last sale price on such exchange on the day of valuation or, if there was no sale on such day, at the mean between the last reported bid and asked prices, or at the last bid price on such day in the absence of an asked price. Securities traded via NASDAQ are valued at the official closing price provided by NASDAQ. Securities that are actively traded in the over-the-counter market, including listed securities for which the primary market is believed by Prudential Investments LLC (“PI” or “Manager”) in consultation with the subadvisor, to be over-the-counter, are valued at market value using prices provided by an independent pricing agent or principal market maker. Options on securities and indices traded on an exchange are valued at the last sale price as of the close of trading on the applicable exchange or, if there was no sale, at the mean between the most recently quoted bid and asked prices on such exchange, or at the last bid price in the absence of an asked price. Futures contracts and options thereon traded on a commodities exchange or board of trade are valued at the last sale price at the close of trading on such exchange or board of trade or, if there was no sale on the applicable commodities exchange or board of trade on such day, at the mean between the most recently quoted bid and asked prices on such exchange or board of trade or at the last bid price in the absence of an asked price. Prices may be obtained from independent pricing services which use information provided by market makers or estimates of market values obtained from yield data relating to investments or securities with similar characteristics. Securities for which reliable market quotations are not readily available, or whose values have been affected by events occurring after the close of the security’s foreign market and before the Series Fund’s normal pricing time, are valued at fair value in accordance with Board of Trustees approved fair valuation procedures. When determining the fair value of securities, some of the factors influencing the valuation include, the nature of any restrictions on disposition of the securities; assessment of the general liquidity of the securities; the issuer’s financial condition and the markets in which it does business; the cost of the investment; the size of the holding and the capitalization of the issuer; the prices of any recent transactions or bids/offers for such securities or any comparable securities; any available analyst media or other reports or information deemed reliable by the investment advisor regarding the issuer or the markets or industry in which it operates. Using fair value to price securities may result in a value that is different from a security’s most recent closing price and from the price used by other mutual funds to calculate their net asset values. As of December 31, 2007, Global Portfolio, High Yield Portfolio, Natural Resources Portfolio and Value Portfolio held foreign securities whose value required adjustment in accordance with such procedures.
Investments in mutual funds are valued at their net asset value as of the close of the New York Stock Exchange on the date of valuation.
The Money Market Portfolio values all of its securities at amortized cost. The Conservative Balanced and Flexible Managed Portfolios use amortized cost to value their short-term debt securities. Short-term debt securities that are held in the other Portfolios which mature in more than 60 days are valued at current market quotations and those short-term debt securities which mature in 60 days or less are valued at amortized cost which approximates market value. The amortized cost method involves valuing a security at its cost at the time of purchase and thereafter assumes a constant amortization to maturity of any discount or premium.
The Diversified Bond, High Yield Bond and Natural Resources Portfolios may hold up to 15% of their net assets in illiquid securities, including those which are restricted as to disposition under securities law (“restricted securities”). Certain issues of restricted securities held by these portfolios at December 31, 2007 include registration rights, under which the portfolios may demand registration by the issuer, of which the portfolios may bear the cost of such registration. Restricted securities, including private placements, are valued pursuant to the valuation procedures noted above.
B2
Repurchase Agreements: In connection with transactions in repurchase agreements with United States financial institutions, it is the Series Fund’s policy that its custodian or designated subcustodians, as the case may be, under triparty repurchase agreements, take possession of the underlying collateral securities, the value of which exceeds the principal amount of the repurchase transaction, including accrued interest. To the extent that any repurchase transaction exceeds one business day, the value of the collateral is marked to market on a daily basis to ensure the adequacy of the collateral. If the seller defaults and the value of the collateral declines, or if bankruptcy proceedings are commenced with respect to the seller of the security, realization of the collateral by the Series Fund may by delayed or limited.
Foreign Currency Translation: The books and records of the Series Fund are maintained in U.S. dollars. Foreign currency amounts are translated into U.S. dollars on the following basis:
(i) market value of investment securities, other assets and liabilities at the current daily rates of exchange.
(ii) purchases and sales of investment securities, income and expenses at the rates of exchange prevailing on the respective dates of such transactions.
Although the net assets of the Series Fund are presented at the foreign exchange rates and market values at the close of the period, the Series Fund does not isolate that portion of the results of operations arising as a result of changes in the foreign exchange rates from the fluctuations arising from changes in the market prices of securities held at the end of the period. Similarly, the Series Fund does not isolate the effect of changes in foreign exchange rates from the fluctuations arising from changes in the market prices of portfolio securities sold during the period. Accordingly, these realized foreign currency gains (losses) are included in the reported net realized gains (losses) on investment transactions.
Net realized gains (losses) on foreign currency transactions represent net foreign exchange gains (losses) from the holding of foreign currencies, currency gains (losses) realized between the trade date and settlement date on securities transactions, and the difference between the amounts of dividends, interest and foreign withholding taxes recorded on the Series Fund’s books and the U.S. dollar equivalent amounts actually received or paid. Net unrealized currency gains (losses) from valuing foreign currency denominated assets and liabilities (other than investments) at period end exchange rates are reflected as a component of net unrealized appreciation (depreciation) on investments and foreign currencies.
Forward Currency Contracts: A forward currency contract is a commitment to purchase or sell a foreign currency at a future date at a negotiated forward rate. Certain Portfolios of the Series Fund may enter into forward currency contracts in order to hedge their exposure to changes in foreign currency exchange rates on their foreign portfolio holdings or on specific receivables and payables denominated in a foreign currency. The contracts are valued daily at current forward exchange rates and any unrealized gain (loss) is included in net unrealized appreciation (depreciation) on investments and foreign currencies. Gain (loss) is realized on the settlement date of the contract equal to the difference between the settlement value of the original and negotiated forward contracts. This gain (loss), if any, is included in net realized gain (loss) on foreign currency transactions. Risks may arise upon entering into these contracts from the potential inability of the counterparties to meet the terms of their contracts.
Short Sales: Certain portfolios of the Series Fund may sell a security it does not own in anticipation of a decline in the market value of that security (short sale). When a Portfolio makes a short sale, it must borrow the security sold short and deliver it to the broker-dealer through which it made the short sale as collateral for its obligation to deliver the security upon conclusion of the transaction. The Portfolio may have to pay a fee to borrow the particular security and may be obligated to remit any interest or dividends received on such borrowed securities. Dividends declared on short positions open are recorded on the ex-date and interest payable is accrued daily on fixed income securities sold short, both of which are recorded as an expense. A gain, limited to the price at which the Portfolio sold the security short, or a loss, unlimited in magnitude, will be recognized upon the termination of a short sale if the market price at termination is less than or greater than, respectively, the proceeds originally received.
Loan Participations: The High Yield Bond and Money Market Portfolios may invest in loan participations. When the Portfolio purchases a loan participation, the Portfolio typically enters into a contractual relationship with the lender or third party selling such participations (“Selling Participant”), but not the borrower. As a result, the Portfolio assumes the credit risk of the borrower and any other persons interpositioned between the Portfolio and the borrower. The Portfolio may not directly benefit from the collateral supporting the senior loan in which it has purchased the loan participation.
B3
Options: The Series Fund may either purchase or write options in order to hedge against adverse market movements or fluctuations in value caused by changes in prevailing interest rates or foreign currency exchange rates or currencies with respect to securities which the Series Fund currently owns or intends to purchase. The Series Fund’s principal reason for writing options is to realize, through receipt of premiums, a greater current return than would be realized on the underlying security alone. When the Series Fund purchases an option, it pays a premium and an amount equal to that premium is recorded as an asset. When the Series Fund writes an option, it receives a premium and an amount equal to that premium is recorded as a liability. The asset or liability is adjusted daily to reflect the current market value of the option. If an option expires unexercised, the Series Fund realizes a gain (loss) to the extent of the premium received or paid. If an option is exercised, the premium received or paid is recorded as an adjustment to the proceeds from the sale or the cost basis of the purchase, in determining whether the Series Fund has realized a gain (loss). The difference between the premium and the amount received or paid on effecting a closing purchase or sale transaction is also treated as a realized gain (loss). Gains (losses) on purchased options are included in net realized gains (losses) on investment transactions. Gains (losses) on written options are presented separately as net realized gains (losses) on written option transactions.
The Series Fund, as writer of an option, may have no control over whether the contract may be exercised. As a result, the Series Fund bears the market risk of an unfavorable change in the price of the security underlying the written option. The Series Fund, as purchaser of an over-the-counter option, bears the risk of the potential inability of the counterparties to meet the terms of their contracts.
Financial Futures Contracts: A financial futures contract is an agreement to purchase (long) or sell (short) an agreed amount of securities at a set price for delivery on a future date. Upon entering into a financial futures contract, the Series Fund is required to pledge to the broker an amount of cash and/or other assets equal to a certain percentage of the contract amount. This amount is known as the initial margin . Subsequent payments, known as variation margin, are made or received by the Series Fund each day, depending on the daily fluctuations in the value of the underlying security. Such variation margin is recorded for financial statement purposes on a daily basis as unrealized gain (loss). When the contract expires or is closed, the gain (loss) is realized and is presented in the Statement of Operations as net realized gain (loss) on financial futures contracts.
The Series Fund invests in financial futures contracts in order to hedge its existing portfolio securities, or securities the Series Fund intends to purchase, against fluctuations in value caused by changes in prevailing rates or market conditions. Under a variety of circumstances, the Series Fund may not achieve the anticipated benefits of the financial futures contracts and may realize a loss. The use of futures transactions involves the risk of imperfect correlation in movements in the price of futures contracts and the underlying hedged assets.
Swap Agreements: The Portfolios may enter into interest rate swap agreements, forward swap spread lock agreements, credit default swap agreements and total return swap agreements. A swap agreement is an agreement to exchange the return generated by one instrument for the return generated by another instrument. Interest rate swap agreements involve the exchange by the Portfolio with another party of their respective commitments to pay or receive interest. Forward spread lock swap agreements involve commitments to pay or receive a settlement amount calculated as the difference between the swap spread and a fixed spread, multiplied by the notional amount times the duration of the swap. The swap spread is the difference between the benchmark swap rate (market rate) and the specific treasury rate. In a credit default swap agreement, one party (the protection buyer) makes a stream of payments to another party (the protection seller) in exchange for the right to receive a specified payment in the event of a default by a third party, typically corporate issues or sovereign issues of an emerging country, on its obligation. The maximum amount of the payment may equal the notional, at par, of the underlying index or security as a result of a default (or “credit event”). In addition to bearing the risk that the credit event will occur, the Portfolios could be exposed to market risk due to unfavorable changes in interest rates or in the price of the underlying security or index, the possibility that the fund may be unable to close out its position at the same time or at the same price as if it had purchased comparable publicly traded securities, or that the counterparty may default on it s obligation to perform. Total return swap agreements are contracts in which one party agrees to make periodic payments based on the change in market value of the underlying assets, which may include a specified security, basket of securities or securities indices during the specified period, in return for periodic payments based on a fixed or variable interest rate or the total return from other underlying assets. Total return swap agreements may be used to obtain exposure to a security or market without owning or taking physical custody of such security or market. The swaps are valued daily at current market value and any change in value is
B4
included in net unrealized appreciation or depreciation on investments. Payments received or paid by the Portfolio are recorded as realized gains or losses. Risk of loss may exceed amounts recognized on the statements of assets and liabilities. Swap agreements outstanding at period end, if any, are listed on the Schedule of Investments.
Forward currency contracts, written options, short sales, swaps and financial futures contracts may involve elements of both market and credit risk in excess of the amounts reflected on the Statement of Assets and Liabilities.
Securities Lending: Each Portfolio of the Series Fund may lend its portfolio securities to broker-dealers. The loans are secured by collateral at least equal at all times to the market value of the securities loaned. Loans are subject to termination at the option of the borrower or the Portfolio. Upon termination of the loan, the borrower will return to the Portfolio securities identical to the loaned securities. Should the borrower of the securities fail financially, the Portfolio has the right to repurchase the securities using the collateral in the open market. The Portfolio recognizes income, net of any rebate and securities lending agent fees, for lending its securities in the form of fees or interest on the investment of any cash received as collateral. The Portfolio also continues to receive interest and dividends or amounts equivalent thereto on the securities loaned and recognizes any unrealized gain or loss in the market price of the securities loaned that may occur during the term of the loan.
Dollar Rolls: The Fund enters into mortgage dollar rolls in which the Fund sells mortgage securities for delivery in the current month, realizing a gain (loss), and simultaneously contracts to repurchase somewhat similar (same type, coupon and maturity) securities on a specified future date. During the roll period, the Fund forgoes principal and interest paid on the securities. The Fund is compensated by the interest earned on the cash proceeds of the initial sale and by the lower repurchase price at the future date. The difference between the sales proceeds and the lower repurchase price is recorded as a realized gain. The Fund maintains a segregated account, the dollar value of which is a least equal to its obligations, with respect to dollar rolls.
When-Issued/Delayed Delivery Securities: Securities purchased or sold on a when-issued or delayed-delivery basis may be settled a month or more after trade date; interest income is not accrued until settlement date. At the time a Portfolio enters into such transactions, it instructs the custodian to segregate assets with a current value at least equal to the amount of its when-issued or delayed-delivery purchase commitments.
Securities Transactions and Net Investment Income: Securities transactions are recorded on the trade date. Realized gains (losses) on sales of securities are calculated on the identified cost basis. Dividend income is recorded on the ex-dividend date; interest income, which is comprised of four elements: stated coupon, original issue discount, market discount and market premium, is recorded on the accrual basis. Expenses are recorded on the accrual basis. The Series Fund’s expenses are allocated to the respective Portfolios on the basis of relative net assets except for Portfolio specific expenses which are attributable directly to a Portfolio or class level.
For Portfolios with multiple classes of shares, net investment income (loss) (other than administration and distribution fees, which are charged to the respective class) and unrealized and realized gains (losses) are allocated daily to each class of shares based upon the relative proportion of net assets of each class at the beginning of the day.
Taxes: For federal income tax purposes, each Portfolio in the Series is treated as a separate taxpaying entity. The Portfolios are treated as partnerships for tax purposes. No provision has been made in the financial statements for U.S. federal, state, or local taxes, as any tax liability arising from operations of the Portfolios are the responsibility of their partners. The Portfolios are not subject to income tax. Partners of each Portfolio are subject to taxes on their distributive share of partnership earnings.
Withholding taxes on foreign dividends, interest and capital gains have been provided for in accordance with the Trust’s understanding of the applicable country’s tax rules and regulations.
Distributions: Distributions from each Portfolio are made in cash and automatically reinvested in additional shares of the same Portfolio. The Money Market Portfolio declares and reinvests distributions daily. The Diversified Bond, Government Income and High Yield Bond Portfolios make distributions, if any, quarterly. All other Portfolios’ distributions are generally made on an annual basis. Distributions are recorded on the ex-date.
B5
Estimates: The preparation of financial statements requires management to make estimates and assumptions that affect the reported amounts and disclosures in the financial statements. Actual results could differ from these estimates.
The Series Fund has a management agreement with PI. Pursuant to this agreement PI has responsibility for all investment advisory services and supervises the subadvisors performance of such services. PI has entered into subadvisory agreements with Prudential Investment Management, Inc. (“PIM”), Jennison Associates LLC (“Jennison”), LSV Asset Management (“LSV”), Marsico Capital Management, LLC (“Marsico”), Quantitative Management Associates LLC (“QMA”), ClearBridge Advisors LLC (“ClearBridge”), T. Rowe Price Associates, Inc. (“T. Rowe”) and William Blair & Company, L.L.C. (“William Blair”) (collectively, the “Subadvisors”), under which each provides investment advisory services for certain Portfolios of the Series Fund. PI pays for the services of the Subadvisors, compensation of officers of the Series Fund, occupancy and certain clerical and administrative expenses of the Series Fund. The Portfolios bear all other costs and expenses.
The management fee paid to PI is computed daily and payable monthly, at the annual rates specified below, of the value of each of the Portfolio’s average daily net assets.
| | | | | |
Portfolio
| | Management Fee
| | Effective
Management Fee
| |
Conservative Balanced Portfolio | | 0.55% | | 0.55 | % |
Diversified Bond Portfolio | | 0.40 | | 0.40 | |
Equity Portfolio | | 0.45 | | 0.45 | |
Flexible Managed Portfolio | | 0.60 | | 0.60 | |
Global Portfolio | | 0.75 | | 0.75 | |
Government Income Portfolio | | 0.40 | | 0.40 | |
High Yield Bond Portfolio | | 0.55 | | 0.55 | |
Jennison Portfolio | | 0.60 | | 0.60 | |
Money Market Portfolio | | 0.40 | | 0.40 | |
Natural Resources Portfolio | | 0.45 | | 0.45 | |
Small Capitalization Stock Portfolio | | 0.40 | | 0.40 | |
Stock Index Portfolio | | 0.35% up to $4 billion 0.30% over $4 billion | | 0.35 | |
Value Portfolio | | 0.40 | | 0.40 | |
At December 31, 2007, the Subadvisors that provide investment advisory services to the Portfolios are as follows. Where more than one Subadvisor is listed, each Subadvisor provides services to a segment of the Portfolio:
| | |
Portfolio
| | Subadvisor(s)
|
Conservative Balanced Portfolio | | PIM, QMA |
Diversified Bond Portfolio | | PIM |
Equity Portfolio | | Jennison, ClearBridge |
Flexible Managed Portfolio | | PIM, QMA |
Global Portfolio | | LSV, Marsico, T. Rowe & William Blair |
Government Income Portfolio | | PIM |
High Yield Bond Portfolio | | PIM |
Jennison Portfolio | | Jennison |
Money Market Portfolio | | PIM |
Natural Resources Portfolio | | Jennison |
Small Capitalization Stock Portfolio | | QMA |
Stock Index Portfolio | | QMA |
Value Portfolio | | Jennison |
The Series Fund has a distribution agreement with Prudential Investment Management Services LLC (“PIMS”) which acts as the distributor of the Class I and Class II shares of the Series Fund. The Series Fund compensates PIMS for distributing and servicing the Series Fund’s Class II shares pursuant to a plan of distribution (the “Class II Plan”), regardless of expenses actually incurred by PIMS. The distribution fees are
B6
accrued daily and payable monthly. No distribution or service fees are paid to PIMS as distributor of the Class I shares of the Series Fund. Pursuant to the Class II Plan, the Class II shares of each Portfolio compensate PIMS for distribution-related activities at an annual rate of 0.25% of the average daily net assets of the Class II shares.
The Series Fund has an administration agreement with PI which acts as the administrator of the Class II shares of the Series Fund. The administration fee paid to PI is accrued daily and payable monthly, at the annual rate of 0.15% of the average daily net assets of the Class II shares.
PI has agreed to reimburse each Portfolio (other than Global Portfolio) the portion of the management fee for that Portfolio equal to the amount that the aggregate annual ordinary operating expenses (excluding interest, taxes, and brokerage commissions) exceed the percentage stated below.
| | | | | | |
Portfolio
| | Class I
Expense Limit
| | | Class II
Expense Limit
| |
Conservative Balanced Portfolio | | 0.75 | %* | | N/A | |
Diversified Bond Portfolio | | 0.75 | * | | N/A | |
Equity Portfolio | | 0.75 | * | | 1.15 | %* |
Flexible Managed Portfolio | | 0.75 | * | | N/A | |
Government Income Portfolio | | 0.75 | | | N/A | |
High Yield Bond Portfolio | | 0.75 | * | | N/A | |
Jennison Portfolio | | 0.75 | * | | 1.15 | * |
Money Market Portfolio | | 0.75 | * | | N/A | |
Natural Resources Portfolio | | 0.75 | * | | 1.15 | * |
Small Capitalization Stock Portfolio | | 0.75 | * | | N/A | |
Stock Index Portfolio | | 0.75 | | | N/A | |
Value Portfolio | | 0.75 | | | 1.15 | |
N/A – Not applicable – There are no Class II shares outstanding for this Portfolio.
PIMS, PI, PIM, QMA and Jennison are indirect, wholly-owned subsidiaries of Prudential Financial, Inc. (“Prudential”).
* Effective July 1, 2007, the expense limitation was removed.
| Note 4: | | Other Transactions with Affiliates |
Prudential Mutual Fund Services LLC (“PMFS”), an affiliate of PI and an indirect, wholly-owned subsidiary of Prudential, serves as the Series Fund’s transfer agent. Transfer agent’s fees and expenses in the Statements of Operations include certain out-of-pocket expenses paid to non-affiliates, where applicable.
PIM also serves as the Series Fund’s security lending agent. For the year ended December 31, 2007, PIM was compensated as follows for these services by the Series Fund Portfolios:
| | | |
Portfolio
| | PIM
|
Conservative Balanced Portfolio | | $ | 230,375 |
Diversified Bond Portfolio | | | 101,608 |
Equity Portfolio | | | 795,224 |
Flexible Managed Portfolio | | | 385,184 |
Global Portfolio | | | 90,118 |
Government Income Portfolio | | | 28,951 |
High Yield Bond Portfolio | | | 384,181 |
Jennison Portfolio | | | 682,720 |
Natural Resources Portfolio | | | 518,396 |
Small Capitalization Stock Portfolio | | | 672,570 |
Stock Index Portfolio | | | 405,608 |
Value Portfolio | | | 273,387 |
B7
For the year ended December 31, 2007, Prudential Equity Group, LLC, an indirect, wholly-owned subsidiary of Prudential, and Wachovia Securities, LLC, an affiliate of PI, earned brokerage commissions from transactions executed on behalf of the Series Fund Portfolios as follows:
| | | | | | |
Portfolio
| | Prudential
Equity Group
| | Wachovia
|
Jennison Portfolio | | $ | 24,612 | | $ | 820 |
Value Portfolio | | | — | | | 49,792 |
Pursuant to an exemptive order received from the Securities and Exchange Commission, certain Portfolios invest in the Taxable Money Market Series and Short-Term Bond Series, both registered under the Investment Company Act of 1940, as amended, and managed by PI and both of which are portfolios of Dryden Core Investment Fund.
| Note 5: | | Portfolio Securities |
The aggregate cost of purchases and the proceeds from the sales of securities (excluding government securities and short-term issues) for the year ended December 31, 2007 were as follows:
Cost of Purchases:
| | | |
Portfolio
| | |
Conservative Balanced Portfolio | | $ | 539,110,792 |
Diversified Bond Portfolio | | | 721,092,875 |
Equity Portfolio | | | 2,479,277,686 |
Flexible Managed Portfolio | | | 2,299,279,757 |
Global Portfolio | | | 450,420,343 |
Government Income Portfolio | | | 4,913,674,626 |
High Yield Bond Portfolio | | | 917,485,993 |
Jennison Portfolio | | | 1,438,452,085 |
Natural Resources Portfolio | | | 544,981,044 |
Small Capitalization Stock Portfolio | | | 123,700,090 |
Stock Index Portfolio | | | 106,087,187 |
Value Portfolio | | | 989,883,263 |
Proceeds from Sales:
| | | |
Portfolio
| | |
Conservative Balanced Portfolio | | $ | 737,650,431 |
Diversified Bond Portfolio | | | 789,737,347 |
Equity Portfolio | | | 2,854,047,095 |
Flexible Managed Portfolio | | | 2,459,530,154 |
Global Portfolio | | | 485,346,725 |
Government Income Portfolio | | | 4,904,138,704 |
High Yield Bond Portfolio | | | 926,090,136 |
Jennison Portfolio | | | 1,630,702,015 |
Natural Resources Portfolio | | | 605,140,794 |
Small Capitalization Stock Portfolio | | | 195,658,946 |
Stock Index Portfolio | | | 391,257,978 |
Value Portfolio | | | 1,174,243,315 |
B8
The Conservative Balanced, Diversified Bond, Flexible Managed and Government Income Portfolios’ written options activity for the year ended December 31, 2007 were as follows:
| | | | | | | |
| Conservative Balanced Portfolio | | | | | | | |
| | | Contracts
| | | Premiums
| |
Balance as of December 31, 2006 | | — | | | $ | — | |
Options written | | 365 | | | | 100,360 | |
Options terminated in closing purchase transactions | | (115 | ) | | | (60,375 | ) |
Options expired | | (250 | ) | | | (39,985 | ) |
| | |
|
| |
|
|
|
Balance as of December 31, 2007 | | — | | | $ | — | |
| | |
|
| |
|
|
|
| Diversified Bond Portfolio | | | | | | | |
| | | Contracts
| | | Premiums
| |
Balance as of December 31, 2006 | | — | | | $ | — | |
Options written | | 932 | | | | 316,838 | |
Options terminated in closing purchase transactions | | (314 | ) | | | (204,566 | ) |
Options expired | | (618 | ) | | | (112,272 | ) |
| | |
|
| |
|
|
|
Balance as of December 31, 2007 | | — | | | $ | — | |
| | |
|
| |
|
|
|
| | | | | | | |
| Flexible Managed Portfolio | | | | | | | |
| | | Contracts
| | | Premiums
| |
Balance as of December 31, 2006 | | — | | | $ | — | |
Options written | | 380 | | | | 104,326 | |
Options terminated in closing purchase transactions | | (120 | ) | | | (62,742 | ) |
Options expired | | (260 | ) | | | (41,584 | ) |
| | |
|
| |
|
|
|
Balance as of December 31, 2007 | | — | | | $ | — | |
| | |
|
| |
|
|
|
| Government Income Portfolio | | | | | | | |
| | | Contracts
| | | Premiums
| |
Balance as of December 31, 2006 | | — | | | $ | — | |
Options written | | 324 | | | | 114,824 | |
Options terminated in closing purchase transactions | | (97 | ) | | | (63,357 | ) |
Options expired | | (227 | ) | | | (51,467 | ) |
| | |
|
| |
|
|
|
Balance as of December 31, 2007 | | — | | | $ | — | |
| | |
|
| |
|
|
|
For federal income tax purposes, each Portfolio in the Trust is treated as a separate taxpaying entity. After January 2, 2006, the Portfolios are treated as partnerships for tax purposes. No provision has been made in the financial statements for U.S. Federal, state, or local taxes, as any tax liability arising from operations of the Portfolios are the responsibility of their partners. The Portfolios are not subject to tax. Partners of each Portfolio are subject to taxes on their distributive share of partnership items. The Portfolios’ federal and state income tax returns for tax years for which the applicable statutes of limitations have not expired are subject to examination by the Internal Revenue Service and state departments of revenue.
Prior to January 2, 2006 each Portfolio qualified as a regulated investment company under the Internal Revenue Code and distributed all of its taxable income, including any net realized gains on investments, to shareholders.
With respect to the Portfolios, book cost of assets differs from tax cost of assets as a result of each Portfolio’s adoption of a mark to market method of accounting for tax purposes. Under this method, tax cost of assets will approximate its fair market value.
B9
The Series Fund offers Class I and Class II shares. Neither Class I nor Class II shares of a Portfolio are subject to any sales charge or redemption charge and are sold at the net asset value of the Portfolio. Class I shares are sold only to certain separate accounts of Prudential to fund benefits under certain variable life insurance and variable annuity contracts (“contracts”). Class II shares are sold only to separate accounts of non-Prudential insurance companies as investment options under certain contracts. The separate accounts invest in shares of the Series Fund through subaccounts that correspond to the Portfolios. The separate accounts will redeem shares of the Series Fund to the extent necessary to provide benefits under the contracts or for such other purposes as may be consistent with the contracts. As of December 31, 2007, the Equity, Jennison, Natural Resources and Value Portfolios have Class II shares outstanding.
Transactions in shares of beneficial interest of the Equity, Jennison, Natural Resources and Value Portfolios were as follows:
| | | | | | | |
| | |
| Equity Portfolio: | | | | | | | |
Class I
| | Shares
| | | Amount
| |
Year ended December 31, 2007: | | | | | | | |
Series shares sold | | 1,031,862 | | | $ | 29,740,507 | |
Series shares issued in reinvestment of distributions | | 1,691,265 | | | | 49,976,890 | |
Series shares repurchased | | (14,024,490 | ) | | | (407,692,362 | ) |
| | |
|
| |
|
|
|
Net increase (decrease) in shares outstanding | | (11,301,363 | ) | | $ | (327,974,965 | ) |
| | |
|
| |
|
|
|
Year ended December 31, 2006: | | | | | | | |
Series shares sold | | 2,168,346 | | | $ | 55,202,137 | |
Series shares issued in reinvestment of distributions | | 1,669,920 | | | | 46,000,931 | |
Series shares repurchased | | (17,323,133 | ) | | | (442,264,123 | ) |
| | |
|
| |
|
|
|
Net increase (decrease) in shares outstanding | | (13,484,867 | ) | | $ | (341,061,055 | ) |
| | |
|
| |
|
|
|
| | |
Class II
| | | | | | |
Year ended December 31, 2007: | | | | | | | |
Series shares sold | | 2,870 | | | $ | 85,699 | |
Series shares issued in reinvestment of distributions | | 322 | | | | 9,549 | |
Series shares repurchased | | (29,757 | ) | | | (885,730 | ) |
| | |
|
| |
|
|
|
Net increase (decrease) in shares outstanding | | (26,565 | ) | | $ | (790,482 | ) |
| | |
|
| |
|
|
|
Year ended December 31, 2006: | | | | | | | |
Series shares sold | | 50,883 | | | $ | 1,337,701 | |
Series shares issued in reinvestment of distributions | | 409 | | | | 11,345 | |
Series shares repurchased | | (65,345 | ) | | | (1,667,596 | ) |
| | |
|
| |
|
|
|
Net increase (decrease) in shares outstanding | | (14,053 | ) | | $ | (318,550 | ) |
| | |
|
| |
|
|
|
B10
| | | | | | | |
| | |
| Jennison Portfolio: | | | | | | | |
Class I
| | Shares
| | | Amount
| |
Year ended December 31, 2007: | | | | | | | |
Series shares sold | | 3,875,996 | | | $ | 87,806,461 | |
Series shares issued in reinvestment of distributions | | 259,312 | | | | 6,070,485 | |
Series shares repurchased | | (13,447,590 | ) | | | (300,176,044 | ) |
| | |
|
| |
|
|
|
Net increase (decrease) in shares outstanding | | (9,312,282 | ) | | $ | (206,299,098 | ) |
| | |
|
| |
|
|
|
Year ended December 31, 2006: | | | | | | | |
Series shares sold | | 5,774,164 | | | $ | 118,209,162 | |
Series shares issued in reinvestment of distributions | | 286,560 | | | | 6,106,593 | |
Series shares repurchased | | (18,119,531 | ) | | | (366,233,433 | ) |
| | |
|
| |
|
|
|
Net increase (decrease) in shares outstanding | | (12,058,807 | ) | | $ | (241,917,678 | ) |
| | |
|
| |
|
|
|
| | |
Class II
| | | | | | |
Year ended December 31, 2007: | | | | | | | |
Series shares sold | | 157,366 | | | $ | 3,468,229 | |
Series shares repurchased | | (155,537 | ) | | | (3,412,828 | ) |
| | |
|
| |
|
|
|
Net increase (decrease) in shares outstanding | | 1,829 | | | $ | 55,401 | |
| | |
|
| |
|
|
|
Year ended December 31, 2006: | | | | | | | |
Series shares sold | | 238,412 | | | $ | 4,808,102 | |
Series shares repurchased | | (186,882 | ) | | | (3,786,433 | ) |
| | |
|
| |
|
|
|
Net increase (decrease) in shares outstanding | | 51,530 | | | $ | 1,021,669 | |
| | |
|
| |
|
|
|
| | |
| Natural Resources Portfolio: | | | | | | | |
Class I
| | Shares
| | | Amount
| |
Year ended December 31, 2007: | | | | | | | |
Series shares sold | | 1,540,804 | | | $ | 90,988,390 | |
Series shares issued in reinvestment of distributions | | 5,021,348 | | | | 269,445,554 | |
Series shares repurchased | | (3,014,255 | ) | | | (159,841,129 | ) |
| | |
|
| |
|
|
|
Net increase (decrease) in shares outstanding | | 3,547,897 | | | $ | 200,592,815 | |
| | |
|
| |
|
|
|
Year ended December 31, 2006: | | | | | | | |
Series shares sold | | 1,747,285 | | | $ | 77,626,709 | |
Series shares issued in reinvestment of distributions | | 4,813,923 | | | | 195,926,670 | |
Series shares repurchased | | (2,797,966 | ) | | | (123,046,940 | ) |
| | |
|
| |
|
|
|
Net increase (decrease) in shares outstanding | | 3,763,242 | | | $ | 150,506,439 | |
| | |
|
| |
|
|
|
| | |
Class II
| | | | | | |
Year ended December 31, 2007: | | | | | | | |
Series shares sold | | 545,786 | | | $ | 30,006,805 | |
Series shares issued in reinvestment of distributions | | 142,454 | | | | 7,597,067 | |
Series shares repurchased | | (202,397 | ) | | | (11,381,740 | ) |
| | |
|
| |
|
|
|
Net increase (decrease) in shares outstanding | | 485,843 | | | $ | 26,222,132 | |
| | |
|
| |
|
|
|
Year ended December 31, 2006: | | | | | | | |
Series shares sold | | 442,720 | | | $ | 20,436,170 | |
Series shares issued in reinvestment of distributions | | 52,878 | | | | 2,153,216 | |
Series shares repurchased | | (235,987 | ) | | | (10,229,161 | ) |
| | |
|
| |
|
|
|
Net increase (decrease) in shares outstanding | | 259,611 | | | $ | 12,360,225 | |
| | |
|
| |
|
|
|
B11
| | | | | | | |
| | |
| Value Portfolio: | | | | | | | |
Class I
| | Shares
| | | Amount
| |
Year ended December 31, 2007: | | | | | | | |
Series shares sold | | 1,095,975 | | | $ | 29,415,525 | |
Series shares issued in reinvestment of distributions | | 10,415,705 | | | | 242,165,135 | |
Series shares repurchased | | (9,054,986 | ) | | | (246,234,280 | ) |
| | |
|
| |
|
|
|
Net increase (decrease) in shares outstanding | | 2,456,694 | | | $ | 25,346,380 | |
| | |
|
| |
|
|
|
Year ended December 31, 2006: | | | | | | | |
Series shares sold | | 3,460,122 | | | $ | 83,754,259 | |
Series shares issued in reinvestment of distributions | | 3,730,095 | | | | 90,953,391 | |
Series shares repurchased | | (8,052,454 | ) | | | (194,820,384 | ) |
| | |
|
| |
|
|
|
Net increase (decrease) in shares outstanding | | (862,237 | ) | | $ | (20,112,734 | ) |
| | |
|
| |
|
|
|
| | |
Class II
| | | | | | |
Year ended December 31, 2007: | | | | | | | |
Series shares sold | | 5,362 | | | $ | 150,641 | |
Series shares issued in reinvestment of distributions | | 16,034 | | | | 373,906 | |
Series shares repurchased | | (28,317 | ) | | | (747,087 | ) |
| | |
|
| |
|
|
|
Net increase (decrease) in shares outstanding | | (6,921 | ) | | $ | (222,540 | ) |
| | |
|
| |
|
|
|
Year ended December 31, 2006: | | | | | | | |
Series shares sold | | 10,389 | | | $ | 253,819 | |
Series shares issued in reinvestment of distributions | | 5,789 | | | | 140,456 | |
Series shares repurchased | | (29,769 | ) | | | (723,580 | ) |
| | |
|
| |
|
|
|
Net increase (decrease) in shares outstanding | | (13,591 | ) | | $ | (329,305 | ) |
| | |
|
| |
|
|
|
The Series Fund (excluding the Money Market Portfolio), along with other affiliated registered investment companies (the “Funds”), is a party to a Syndicated Credit Agreement (“SCA”) with two banks. The SCA provides for a commitment of $500 million. Interest on any borrowings under the SCA is incurred at contracted market rates and a commitment fee for the unused amount is accrued daily and paid quarterly. Effective October 26, 2007, the Funds renewed the SCA with the banks. The Funds pay a commitment fee of .06 of 1% of the unused portion of the renewed SCA. The expiration date of the renewed SCA will be October 24, 2008. For the period from October 27, 2006 through October 26, 2007, the Funds paid a commitment fee of .07 of 1% of the unused portion of the agreement. The purpose of the SCA is to provide an alternative source of temporary funding for capital share redemptions.
The following Portfolios utilized the line of credit during the year ended December 31, 2007. The average balance outstanding is for the number of days the Portfolio had utilized the credit facility.
| | | | | | | | | | |
Portfolio
| | Approximate
Average
Balance
Outstanding
| | Number of
Days
Outstanding
| | Weighted
Average
Interest
Rates
| | | Amount
Outstanding at
December 31,
2007
|
High Yield Bond Portfolio | | $ | 7,540,000 | | 2 | | 4.92 | % | | — |
Jennison Portfolio | | | 2,120,667 | | 24 | | 5.21 | | | 1,696,000 |
Natural Resources Portfolio | | | 2,219,552 | | 29 | | 5.67 | | | — |
Value Portfolio | | | 769,850 | | 20 | | 5.52 | | | — |
| Note 9: | | Ownership and Affiliates |
As of December 31, 2007, all of Class I shares of each Portfolio were owned of record by the Prudential Insurance Company of America (“PICA”) on behalf of the owners of the variable insurance products issued by PICA.
B12
| Note 10: | | New Accounting Pronouncements |
On September 20, 2006, the Financial Accounting Standard Board (“FASB”) released Statement of Financial Accounting Standards No. 157 “Fair Value Measurements” (FAS 157). FAS 157 establishes an authoritative definition of fair value, sets out a framework for measuring fair value, and requires additional disclosures about fair-value measurements. The application of FAS 157 is required for fiscal years beginning after November 15, 2007 and interim periods within those fiscal years. At this time, management is evaluating the implications of FAS 157 and its impact, if any, in the financial statements has not yet been determined.
B13
Financial Highlights
| | | | | | | | | | | | | | | | | | | | |
| | | Conservative Balanced Portfolio
| |
| | | Year Ended December 31,
| |
| | | 2007(c)
| | | 2006
| | | 2005
| | | 2004
| | | 2003
| |
Per Share Operating Performance: | | | | | | | | | | | | | | | | | | | | |
Net Asset Value, beginning of year | | $ | 16.21 | | | $ | 15.09 | | | $ | 15.10 | | | $ | 14.34 | | | $ | 12.43 | |
| | |
|
|
| |
|
|
| |
|
|
| |
|
|
| |
|
|
|
Income From Investment Operations: | | | | | | | | | | | | | | | | | | | | |
Net investment income | | | .50 | | | | .48 | | | | .38 | | | | .34 | | | | .28 | |
Net realized and unrealized gain on investments | | | .49 | | | | 1.06 | | | | .11 | | | | .78 | | | | 1.99 | |
| | |
|
|
| |
|
|
| |
|
|
| |
|
|
| |
|
|
|
Total from investment operations | | | .99 | | | | 1.54 | | | | .49 | | | | 1.12 | | | | 2.27 | |
| | |
|
|
| |
|
|
| |
|
|
| |
|
|
| |
|
|
|
Less Dividends and Distributions: | | | | | | | | | | | | | | | | | | | | |
Dividends from net investment income | | | — | | | | — | | | | (.35 | ) | | | (.28 | ) | | | (.36 | ) |
Distributions from net realized gains | | | — | | | | — | | | | (.15 | ) | | | (.08 | ) | | | — | |
Distributions | | | (.51 | ) | | | (.42 | ) | | | — | | | | — | | | | — | |
| | |
|
|
| |
|
|
| |
|
|
| |
|
|
| |
|
|
|
Total dividends and distributions | | | (.51 | ) | | | (.42 | ) | | | (.50 | ) | | | (.36 | ) | | | (.36 | ) |
| | |
|
|
| |
|
|
| |
|
|
| |
|
|
| |
|
|
|
Net Asset Value, end of year | | $ | 16.69 | | | $ | 16.21 | | | $ | 15.09 | | | $ | 15.10 | | | $ | 14.34 | |
| | |
|
|
| |
|
|
| |
|
|
| |
|
|
| |
|
|
|
Total Return(a) | | | 6.12 | % | | | 10.44 | % | | | 3.43 | % | | | 8.04 | % | | | 18.77 | % |
Ratios/Supplemental Data: | | | | | | | | | | | | | | | | | | | | |
Net assets, end of year (in millions) | | $ | 2,721.9 | | | $ | 2,770.6 | | | $ | 2,749.8 | | | $ | 2,893.6 | | | $ | 2,895.0 | |
Ratios to average net assets(b): | | | | | | | | | | | | | | | | | | | | |
Expenses | | | .59 | % | | | .57 | % | | | .58 | % | | | .59 | % | | | .58 | % |
Net investment income | | | 2.95 | % | | | 2.97 | % | | | 2.45 | % | | | 2.27 | % | | | 2.02 | % |
Portfolio turnover rate | | | 178 | % | | | 114 | % | | | 110 | % | | | 153 | % | | | 248 | % |
| (a) | Total return is calculated assuming a purchase of a share on the first day and a sale on the last day of each year reported and includes reinvestment of dividends and distributions and does not reflect the effect of insurance contract charges. Total return does not reflect expenses associated with the separate account such as administrative fees, account charges and surrender charges which, if reflected, would reduce the total returns for all periods shown. Performance figures may reflect voluntary fee waivers and/or expense reimbursements. In the absence of voluntary fee waivers and/or expense reimbursements, the total return would be lower. Past performance is no guarantee of future results. Total returns may reflect adjustments to conform to generally accepted accounting principles. |
| (b) | Does not include expenses of the underlying portfolios in which the Portfolio invests. |
| (c) | Calculated based upon average shares outstanding during the year. |
| | | | | | | | | | | | | | | | | | | | |
| | | Diversified Bond Portfolio
| |
| | | Year Ended December 31,
| |
| | | 2007
| | | 2006
| | | 2005
| | | 2004
| | | 2003
| |
Per Share Operating Performance: | | | | | | | | | | | | | | | | | | | | |
Net Asset Value, beginning of year | | $ | 10.85 | | | $ | 10.96 | | | $ | 11.28 | | | $ | 11.17 | | | $ | 10.82 | |
| | |
|
|
| |
|
|
| |
|
|
| |
|
|
| |
|
|
|
Income From Investment Operations: | | | | | | | | | | | | | | | | | | | | |
Net investment income | | | .58 | | | | .57 | | | | .55 | | | | .52 | | | | .45 | |
Net realized and unrealized gain (loss) on investments | | | .02 | | | | (.05 | ) | | | (.20 | ) | | | .09 | | | | .35 | |
| | |
|
|
| |
|
|
| |
|
|
| |
|
|
| |
|
|
|
Total from investment operations | | | .60 | | | | .52 | | | | .35 | | | | .61 | | | | .80 | |
| | |
|
|
| |
|
|
| |
|
|
| |
|
|
| |
|
|
|
Less Dividends and Distributions: | | | | | | | | | | | | | | | | | | | | |
Dividends from net investment income | | | — | | | | — | | | | (.59 | ) | | | (.50 | ) | | | (.45 | ) |
Distributions from net realized gains | | | — | | | | — | | | | (.08 | ) | | | — | | | | — | |
Distributions | | | (.55 | ) | | | (.63 | ) | | | — | | | | — | | | | — | |
| | |
|
|
| |
|
|
| |
|
|
| |
|
|
| |
|
|
|
Total dividends and distributions | | | (.55 | ) | | | (.63 | ) | | | (.67 | ) | | | (.50 | ) | | | (.45 | ) |
| | |
|
|
| |
|
|
| |
|
|
| |
|
|
| |
|
|
|
Net Asset Value, end of year | | $ | 10.90 | | | $ | 10.85 | | | $ | 10.96 | | | $ | 11.28 | | | $ | 11.17 | |
| | |
|
|
| |
|
|
| |
|
|
| |
|
|
| |
|
|
|
Total Return(a) | | | 5.71 | % | | | 4.98 | % | | | 3.28 | % | | | 5.59 | % | | | 7.49 | % |
Ratios/Supplemental Data: | | | | | | | | | | | | | | | | | | | | |
Net assets, end of year (in millions) | | $ | 1,218.3 | | | $ | 1,150.4 | | | $ | 1,230.6 | | | $ | 1,283.7 | | | $ | 1,418.0 | |
Ratios to average net assets(b): | | | | | | | | | | | | | | | | | | | | |
Expenses | | | .44 | % | | | .45 | % | | | .45 | % | | | .45 | % | | | .44 | % |
Net investment income | | | 5.39 | % | | | 5.18 | % | | | 4.81 | % | | | 4.57 | % | | | 4.02 | % |
Portfolio turnover rate | | | 476 | % | | | 393 | % | | | 278 | % | | | 382 | % | | | 706 | % |
| (a) | Total return is calculated assuming a purchase of a share on the first day and a sale on the last day of each year reported and includes reinvestment of dividends and distributions and does not reflect the effect of insurance contract charges. Total return does not reflect expenses associated with the separate account such as administrative fees, account charges and surrender charges which, if reflected, would reduce the total returns for all periods shown. Performance figures may reflect voluntary fee waivers and/or expense reimbursements. In the absence of voluntary fee waivers and/or expense reimbursements, the total return would be lower. Past performance is no guarantee of future results. Total returns may reflect adjustments to conform to generally accepted accounting principles. |
| (b) | Does not include expenses of the underlying portfolios in which the Portfolio invests. |
SEE NOTES TO FINANCIAL STATEMENTS.
C1
Financial Highlights
| | | | | | | | | | | | | | | | | | | | |
| | | Equity Portfolio Class I
| |
| | | Year Ended December 31,
| |
| | | 2007
| | | 2006
| | | 2005
| | | 2004
| | | 2003
| |
Per Share Operating Performance: | | | | | | | | | | | | | | | | | | | | |
Net Asset Value, beginning of year | | $ | 27.45 | | | $ | 24.64 | | | $ | 22.31 | | | $ | 20.55 | | | $ | 15.75 | |
| | |
|
|
| |
|
|
| |
|
|
| |
|
|
| |
|
|
|
Income From Investment Operations: | | | | | | | | | | | | | | | | | | | | |
Net investment income | | | .35 | | | | .30 | | | | .24 | | | | .28 | | | | .17 | |
Net realized and unrealized gain on investments | | | 2.21 | | | | 2.80 | | | | 2.32 | | | | 1.75 | | | | 4.81 | |
| | |
|
|
| |
|
|
| |
|
|
| |
|
|
| |
|
|
|
Total from investment operations | | | 2.56 | | | | 3.10 | | | | 2.56 | | | | 2.03 | | | | 4.98 | |
| | |
|
|
| |
|
|
| |
|
|
| |
|
|
| |
|
|
|
Less Dividends and Distributions: | | | | | | | | | | | | | | | | | | | | |
Dividends from net investment income | | | — | | | | — | | | | (.23 | ) | | | (.27 | ) | | | (.18 | ) |
Distributions | | | (.34 | ) | | | (.29 | ) | | | — | | | | — | | | | — | |
| | |
|
|
| |
|
|
| |
|
|
| |
|
|
| |
|
|
|
Total dividends and distributions | | | (.34 | ) | | | (.29 | ) | | | (.23 | ) | | | (.27 | ) | | | (.18 | ) |
| | |
|
|
| |
|
|
| |
|
|
| |
|
|
| |
|
|
|
Net Asset Value, end of year | | $ | 29.67 | | | $ | 27.45 | | | $ | 24.64 | | | $ | 22.31 | | | $ | 20.55 | |
| | |
|
|
| |
|
|
| |
|
|
| |
|
|
| |
|
|
|
Total Return(a) | | | 9.32 | % | | | 12.57 | % | | | 11.47 | % | | | 9.93 | % | | | 31.65 | % |
Ratios/Supplemental Data: | | | | | | | | | | | | | | | | | | | | |
Net assets, end of year (in millions) | | $ | 4,423.9 | | | $ | 4,402.7 | | | $ | 4,283.9 | | | $ | 4,135.7 | | | $ | 4,012.3 | |
Ratios to average net asset(b): | | | | | | | | | | | | | | | | | | | | |
Expenses | | | .47 | % | | | .47 | % | | | .47 | % | | | .48 | % | | | .49 | % |
Net investment income | | | 1.16 | % | | | 1.10 | % | | | 1.01 | % | | | 1.29 | % | | | .96 | % |
Portfolio turnover rate | | | 57 | % | | | 60 | % | | | 77 | % | | | 50 | % | | | 54 | % |
| (a) | Total return is calculated assuming a purchase of a share on the first day and a sale on the last day of each year reported and includes reinvestment of dividends and distributions and does not reflect the effect of insurance contract charges. Total return does not reflect expenses associated with the separate account such as administrative fees, account charges and surrender charges which, if reflected, would reduce the total returns for all periods shown. Performance figures may reflect voluntary fee waivers and/or expense reimbursements. In the absence of voluntary fee waivers and/or expense reimbursements, the total return would be lower. Past performance is no guarantee of future results. Total returns may reflect adjustments to conform to generally accepted accounting principles. |
| (b) | Does not include expenses of the underlying portfolio in which the Portfolio invests. |
| | | | | | | | | | | | | | | | | | | | |
| | | Equity Portfolio Class II
| |
| | | Year Ended December 31,
| |
| | | 2007
| | | 2006
| | | 2005
| | | 2004
| | | 2003
| |
Per Share Operating Performance: | | | | | | | | | | | | | | | | | | | | |
Net Asset Value, beginning of year | | $ | 27.52 | | | $ | 24.69 | | | $ | 22.34 | | | $ | 20.58 | | | $ | 15.76 | |
| | |
|
|
| |
|
|
| |
|
|
| |
|
|
| |
|
|
|
Income From Investment Operations: | | | | | | | | | | | | | | | | | | | | |
Net investment income | | | .28 | | | | .19 | | | | .12 | | | | .20 | | | | .08 | |
Net realized and unrealized gain on investments | | | 2.20 | | | | 2.80 | | | | 2.35 | | | | 1.74 | | | | 4.83 | |
| | |
|
|
| |
|
|
| |
|
|
| |
|
|
| |
|
|
|
Total from investment operations | | | 2.48 | | | | 2.99 | | | | 2.47 | | | | 1.94 | | | | 4.91 | |
| | |
|
|
| |
|
|
| |
|
|
| |
|
|
| |
|
|
|
Less Dividends and Distributions: | | | | | | | | | | | | | | | | | | | | |
Dividends from net investment income | | | — | | | | — | | | | (.12 | ) | | | (.18 | ) | | | (.09 | ) |
Distributions | | | (.19 | ) | | | (.16 | ) | | | — | | | | — | | | | — | |
| | |
|
|
| |
|
|
| |
|
|
| |
|
|
| |
|
|
|
Total dividends and distributions | | | (.19 | ) | | | (.16 | ) | | | (.12 | ) | | | (.18 | ) | | | (.09 | ) |
| | |
|
|
| |
|
|
| |
|
|
| |
|
|
| |
|
|
|
Net Asset Value, end of year | | $ | 29.81 | | | $ | 27.52 | | | $ | 24.69 | | | $ | 22.34 | | | $ | 20.58 | |
| | |
|
|
| |
|
|
| |
|
|
| |
|
|
| |
|
|
|
Total Return(a) | | | 8.91 | % | | | 12.13 | % | | | 11.04 | % | | | 9.51 | % | | | 31.11 | % |
Ratios/Supplemental Data: | | | | | | | | | | | | | | | | | | | | |
Net assets, end of year (in millions) | | $ | 1.3 | | | $ | 1.9 | | | $ | 2.1 | | | $ | 1.1 | | | $ | 0.8 | |
Ratios to average net asset(b): | | | | | | | | | | | | | | | | | | | | |
Expenses | | | .87 | % | | | .87 | % | | | .87 | % | | | .88 | % | | | .89 | % |
Net investment income | | | .74 | % | | | .71 | % | | | .64 | % | | | .91 | % | | | .54 | % |
Portfolio turnover rate | | | 57 | % | | | 60 | % | | | 77 | % | | | 50 | % | | | 54 | % |
| (a) | Total return is calculated assuming a purchase of a share on the first day and a sale on the last day of each year reported and includes reinvestment of dividends and distributions and does not reflect the effect of insurance contract charges. Total return does not reflect expenses associated with the separate account such as administrative fees, account charges and surrender charges which, if reflected, would reduce the total returns for all periods shown. Performance figures may reflect voluntary fee waivers and/or expense reimbursements. In the absence of voluntary fee waivers and/or expense reimbursements, the total return would be lower. Past performance is no guarantee of future results. Total returns may reflect adjustments to conform to generally accepted accounting principles. |
| (b) | Does not include expenses of the underlying portfolio in which the Portfolio invests. |
SEE NOTES TO FINANCIAL STATEMENTS.
C2
Financial Highlights
| | | | | | | | | | | | | | | | | | | | |
| | | Flexible Managed Portfolio
| |
| | | Year Ended December 31,
| |
| | | 2007
| | | 2006
| | | 2005(b)
| | | 2004
| | | 2003
| |
Per Share Operating Performance: | | | | | | | | | | | | | | | | | | | | |
Net Asset Value, beginning of year | | $ | 18.36 | | | $ | 16.92 | | | $ | 16.58 | | | $ | 15.19 | | | $ | 12.55 | |
| | |
|
|
| |
|
|
| |
|
|
| |
|
|
| |
|
|
|
Income From Investment Operations: | | | | | | | | | | | | | | | | | | | | |
Net investment income | | | .50 | | | | .44 | | | | .32 | | | | .29 | | | | .22 | |
Net realized and unrealized gain on investments | | | .65 | | | | 1.59 | | | | .34 | | | | 1.32 | | | | 2.70 | |
| | |
|
|
| |
|
|
| |
|
|
| |
|
|
| |
|
|
|
Total from investment operations | | | 1.15 | | | | 2.03 | | | | .66 | | | | 1.61 | | | | 2.92 | |
| | |
|
|
| |
|
|
| |
|
|
| |
|
|
| |
|
|
|
Less Dividends and Distributions: | | | | | | | | | | | | | | | | | | | | |
Dividends from net investment income | | | — | | | | — | | | | (.32 | ) | | | (.22 | ) | | | (.28 | ) |
Distributions | | | (1.21 | ) | | | (.59 | ) | | | — | | | | — | | | | — | |
| | |
|
|
| |
|
|
| |
|
|
| |
|
|
| |
|
|
|
Total dividends and distributions | | | (1.21 | ) | | | (.59 | ) | | | (.32 | ) | | | (.22 | ) | | | (.28 | ) |
| | |
|
|
| |
|
|
| |
|
|
| |
|
|
| |
|
|
|
Net Asset Value, end of year | | $ | 18.30 | | | $ | 18.36 | | | $ | 16.92 | | | $ | 16.58 | | | $ | 15.19 | |
| | |
|
|
| |
|
|
| |
|
|
| |
|
|
| |
|
|
|
Total Return(a) | | | 6.30 | % | | | 12.17 | % | | | 4.16 | % | | | 10.74 | % | | | 23.76 | % |
Ratios/Supplemental Data: | | | | | | | | | | | | | | | | | | | | |
Net assets, end of year (in millions) | | $ | 3,716.3 | | | $ | 3,723.6 | | | $ | 3,543.9 | | | $ | 3,883.5 | | | $ | 3,693.6 | |
Ratios to average net asset(c): | | | | | | | | | | | | | | | | | | | | |
Expenses | | | .63 | % | | | .62 | % | | | .63 | % | | | .62 | % | | | .62 | % |
Net investment income | | | 2.53 | % | | | 2.48 | % | | | 1.95 | % | | | 1.83 | % | | | 1.55 | % |
Portfolio turnover rate | | | 212 | % | | | 153 | % | | | 126 | % | | | 150 | % | | | 204 | % |
| (a) | Total return is calculated assuming a purchase of a share on the first day and a sale on the last day of each year reported and includes reinvestment of dividends and distributions and does not reflect the effect of insurance contract charges. Total return does not reflect expenses associated with the separate account such as administrative fees, account charges and surrender charges which, if reflected, would reduce the total returns for all periods shown. Performance figures may reflect voluntary fee waivers and/or expense reimbursements. In the absence of voluntary fee waivers and/or expense reimbursements, the total return would be lower. Past performance is no guarantee of future results. Total returns may reflect adjustments to conform to generally accepted accounting principles. |
| (b) | Calculated based upon average shares outstanding during the year. |
| (c) | Does not include expenses of the underlying portfolios in which the Portfolio invests. |
| | | | | | | | | | | | | | | | | | | | |
| | | Global Portfolio
| |
| | | Year Ended December 31,
| |
| | | 2007
| | | 2006
| | | 2005
| | | 2004
| | | 2003
| |
Per Share Operating Performance: | | | | | | | | | | | | | | | | | | | | |
Net Asset Value, beginning of year | | $ | 22.53 | | | $ | 18.96 | | | $ | 16.43 | | | $ | 15.14 | | | $ | 11.35 | |
| | |
|
|
| |
|
|
| |
|
|
| |
|
|
| |
|
|
|
Income From Investment Operations: | | | | | | | | | | | | | | | | | | | | |
Net investment income | | | .36 | | | | .26 | | | | .13 | | | | .11 | | | | .10 | |
Net realized and unrealized gain on investments | | | 2.00 | | | | 3.44 | | | | 2.50 | | | | 1.33 | | | | 3.74 | |
| | |
|
|
| |
|
|
| |
|
|
| |
|
|
| |
|
|
|
Total from investment operations | | | 2.36 | | | | 3.70 | | | | 2.63 | | | | 1.44 | | | | 3.84 | |
| | |
|
|
| |
|
|
| |
|
|
| |
|
|
| |
|
|
|
Less Dividends and Distributions: | | | | | | | | | | | | | | | | | | | | |
Dividends from net investment income | | | — | | | | — | | | | (.10 | ) | | | (.15 | ) | | | (.05 | ) |
Distributions | | | (.27 | ) | | | (.13 | ) | | | — | | | | — | | | | — | |
| | |
|
|
| |
|
|
| |
|
|
| |
|
|
| |
|
|
|
Total dividends and distributions | | | (.27 | ) | | | (.13 | ) | | | (.10 | ) | | | (.15 | ) | | | (.05 | ) |
| | |
|
|
| |
|
|
| |
|
|
| |
|
|
| |
|
|
|
Net Asset Value, end of year | | $ | 24.62 | | | $ | 22.53 | | | $ | 18.96 | | | $ | 16.43 | | | $ | 15.14 | |
| | |
|
|
| |
|
|
| |
|
|
| |
|
|
| |
|
|
|
Total Return(a) | | | 10.48 | % | | | 19.65 | % | | | 16.06 | % | | | 9.59 | % | | | 34.07 | % |
Ratios/Supplemental Data: | | | | | | | | | | | | | | | | | | | | |
Net assets, end of year (in millions) | | $ | 985.0 | | | $ | 932.9 | | | $ | 814.1 | | | $ | 691.1 | | | $ | 665.6 | |
Ratios to average net asset(b): | | | | | | | | | | | | | | | | | | | | |
Expenses | | | .81 | % | | | .84 | % | | | .82 | % | | | .84 | % | | | .87 | % |
Net investment income | | | 1.43 | % | | | 1.24 | % | | | .77 | % | | | .67 | % | | | .78 | % |
Portfolio turnover rate | | | 48 | % | | | 50 | % | | | 155 | % | | | 128 | % | | | 88 | % |
| (a) | Total return is calculated assuming a purchase of a share on the first day and a sale on the last day of each year reported and includes reinvestment of dividends and distributions and does not reflect the effect of insurance contract charges. Total return does not reflect expenses associated with the separate account such as administrative fees, account charges and surrender charges which, if reflected, would reduce the total returns for all periods shown, Performance figures may reflect voluntary fee waivers and/or expense reimbursements. In the absence of voluntary fee waivers and/or expense reimbursements, the total return would be lower. Past performance is no guarantee of future results. Total returns may reflect adjustments to conform to generally accepted accounting principles. |
| (b) | Does not include expenses of the underlying portfolio in which the Portfolio invests. |
SEE NOTES TO FINANCIAL STATEMENTS.
C3
Financial Highlights
| | | | | | | | | | | | | | | | | | | | |
| | | Government Income Portfolio
| |
| | | Year Ended December 31,
| |
| | | 2007
| | | 2006
| | | 2005
| | | 2004
| | | 2003
| |
Per Share Operating Performance: | | | | | | | | | | | | | | | | | | | | |
Net Asset Value, beginning of year | | $ | 11.26 | | | $ | 11.40 | | | $ | 11.65 | | | $ | 11.92 | | | $ | 12.50 | |
| | |
|
|
| |
|
|
| |
|
|
| |
|
|
| |
|
|
|
Income From Investment Operations: | | | | | | | | | | | | | | | | | | | | |
Net investment income | | | .53 | | | | .54 | | | | .49 | | | | .49 | | | | .46 | |
Net realized and unrealized gain (loss) on investments | | | .10 | | | | (.13 | ) | | | (.20 | ) | | | (.13 | ) | | | (.15 | ) |
| | |
|
|
| |
|
|
| |
|
|
| |
|
|
| |
|
|
|
Total from investment operations | | | .63 | | �� | | .41 | | | | .29 | | | | .36 | | | | .31 | |
| | |
|
|
| |
|
|
| |
|
|
| |
|
|
| |
|
|
|
Less Dividends and Distributions: | | | | | | | | | | | | | | | | | | | | |
Dividends from net investment income | | | — | | | | — | | | | (.54 | ) | | | (.44 | ) | | | (.46 | ) |
Distributions from net realized gains | | | — | | | | — | | | | — | | | | (.19 | ) | | | (.43 | ) |
Distributions | | | (.51 | ) | | | (.55 | ) | | | — | | | | — | | | | — | |
| | |
|
|
| |
|
|
| |
|
|
| |
|
|
| |
|
|
|
Total dividends and distributions | | | (.51 | ) | | | (.55 | ) | | | (.54 | ) | | | (.63 | ) | | | (.89 | ) |
| | |
|
|
| |
|
|
| |
|
|
| |
|
|
| |
|
|
|
Net Asset Value, end of year | | $ | 11.38 | | | $ | 11.26 | | | $ | 11.40 | | | $ | 11.65 | | | $ | 11.92 | |
| | |
|
|
| |
|
|
| |
|
|
| |
|
|
| |
|
|
|
Total Return(a) | | | 5.70 | % | | | 3.74 | % | | | 2.51 | % | | | 3.12 | % | | | 2.46 | % |
Ratios/Supplemental Data: | | | | | | | | | | | | | | | | | | | | |
Net assets, end of year (in millions) | | $ | 340.3 | | | $ | 354.3 | | | $ | 378.2 | | | $ | 420.2 | | | $ | 461.5 | |
Ratios to average net asset(b): | | | | | | | | | | | | | | | | | | | | |
Expenses | | | .52 | % | | | .50 | % | | | .47 | % | | | .47 | % | | | .46 | % |
Net investment income | | | 4.62 | % | | | 4.75 | % | | | 4.16 | % | | | 4.07 | % | | | 3.76 | % |
Portfolio turnover rate | | | 2377 | % | | | 734 | % | | | 507 | % | | | 617 | % | | | 695 | % |
| (a) | Total return is calculated assuming a purchase of a share on the first day and a sale on the last day of each year reported and includes reinvestment of dividends and distributions and does not reflect the effect of insurance contract charges. Total return does not reflect expenses associated with the separate account such as administrative fees, account charges and surrender charges which, if reflected, would reduce the total returns for all periods shown. Performance figures may reflect voluntary fee waivers and/or expense reimbursements. In the absense of voluntary fee waivers and /or expense reimbursements, the total return would be lower. Past performance is no guarantee of future results. Total returns may reflect adjustments to conform to generally accepted accounting principles. |
| (b) | Does not include expenses of the underlying portfolios in which the Portfolio invests. |
| | | | | | | | | | | | | | | | | | | | |
| | | High Yield Bond Portfolio
| |
| | | Year Ended December 31,
| |
| | | 2007
| | | 2006
| | | 2005
| | | 2004
| | | 2003
| |
Per Share Operating Performance: | | | | | | | | | | | | | | | | | | | | |
Net Asset Value, beginning of year | | $ | 5.33 | | | $ | 5.23 | | | $ | 5.42 | | | $ | 5.29 | | | $ | 4.59 | |
| | |
|
|
| |
|
|
| |
|
|
| |
|
|
| |
|
|
|
Income From Investment Operations: | | | | | | | | | | | | | | | | | | | | |
Net investment income | | | .40 | | | | .39 | | | | .38 | | | | .39 | | | | .41 | |
Net realized and unrealized gain (loss) on investments | | | (.26 | ) | | | .13 | | | | (.20 | ) | | | .13 | | | | .71 | |
| | |
|
|
| |
|
|
| |
|
|
| |
|
|
| |
|
|
|
Total from investment operations | | | .14 | | | | .52 | | | | .18 | | | | .52 | | | | 1.12 | |
| | |
|
|
| |
|
|
| |
|
|
| |
|
|
| |
|
|
|
Less Dividends and Distributions: | | | | | | | | | | | | | | | | | | | | |
Dividends from net investment income | | | — | | | | — | | | | (.37 | ) | | | (.39 | ) | | | (.42 | ) |
Distributions | | | (.38 | ) | | | (.42 | ) | | | — | | | | — | | | | — | |
| | |
|
|
| |
|
|
| |
|
|
| |
|
|
| |
|
|
|
Total dividends and distributions | | | (.38 | ) | | | (.42 | ) | | | (.37 | ) | | | (.39 | ) | | | (.42 | ) |
| | |
|
|
| |
|
|
| |
|
|
| |
|
|
| |
|
|
|
Net Asset Value, end of year | | $ | 5.09 | | | $ | 5.33 | | | $ | 5.23 | | | $ | 5.42 | | | $ | 5.29 | |
| | |
|
|
| |
|
|
| |
|
|
| |
|
|
| |
|
|
|
Total Return(a) | | | 2.62 | % | | | 10.25 | % | | | 3.41 | % | | | 10.30 | % | | | 25.04 | % |
Ratios/Supplemental Data: | | | | | | | | | | | | | | | | | | | | |
Net assets, end of year (in millions) | | $ | 1,674.0 | | | $ | 1,721.1 | | | $ | 1,635.7 | | | $ | 1,595.7 | | | $ | 1,466.7 | |
Ratios to average net asset(b): | | | | | | | | | | | | | | | | | | | | |
Expenses | | | .58 | % | | | .58 | % | | | .58 | % | | | .59 | % | | | .60 | % |
Net investment income | | | 7.49 | % | | | 7.39 | % | | | 7.14 | % | | | 7.42 | % | | | 8.11 | % |
Portfolio turnover rate | | | 58 | % | | | 49 | % | | | 56 | % | | | 65 | % | | | 93 | % |
| (a) | Total return is calculated assuming a purchase of a share on the first day and a sale on the last day of each year reported and includes reinvestment of dividends and distributions and does not reflect the effect of insurance contract charges. Total return does not reflect expenses associated with the separate account such as administrative fees, account charges and surrender charges which, if reflected, would reduce the total returns for all periods shown. Performance figures may reflect voluntary fee waivers and/or expense reimbursements. In the absence of voluntary fee waivers and/or expense reimbursements, the total return would be lower. Past performance is no guarantee of future results. Total returns may reflect adjustments to conform to generally accepted accounting principles. |
| (b) | Does not include expenses of the underlying portfolios in which the Portfolio invests. |
SEE NOTES TO FINANCIAL STATEMENTS.
C4
Financial Highlights
| | | | | | | | | | | | | | | | | | | | |
| | | Jennison Portfolio
| |
| | | Class I
| |
| | | Year Ended December 31,
| |
| | | 2007
| | | 2006(b)
| | | 2005(b)
| | | 2004
| | | 2003
| |
Per Share Operating Performance: | | | | | | | | | | | | | | | | | | | | |
Net Asset Value, beginning of year | | $ | 21.07 | | | $ | 20.76 | | | $ | 18.14 | | | $ | 16.62 | | | $ | 12.79 | |
| | |
|
|
| |
|
|
| |
|
|
| |
|
|
| |
|
|
|
Income From Investment Operations: | | | | | | | | | | | | | | | | | | | | |
Net investment income | | | .10 | | | | .06 | | | | .02 | | | | .08 | | | | .04 | |
Net realized and unrealized gain on investments | | | 2.43 | | | | .31 | | | | 2.62 | | | | 1.52 | | | | 3.83 | |
| | |
|
|
| |
|
|
| |
|
|
| |
|
|
| |
|
|
|
Total from investment operations | | | 2.53 | | | | .37 | | | | 2.64 | | | | 1.60 | | | | 3.87 | |
| | |
|
|
| |
|
|
| |
|
|
| |
|
|
| |
|
|
|
Less Dividends and Distributions: | | | | | | | | | | | | | | | | | | | | |
Dividends from net investment income | | | — | | | | — | | | | (.02 | ) | | | (.08 | ) | | | (.04 | ) |
Distributions | | | (.07 | ) | | | (.06 | ) | | | — | | | | — | | | | — | |
| | |
|
|
| |
|
|
| |
|
|
| |
|
|
| |
|
|
|
Total dividends and distributions | | | (.07 | ) | | | (.06 | ) | | | (.02 | ) | | | (.08 | ) | | | (.04 | ) |
| | |
|
|
| |
|
|
| |
|
|
| |
|
|
| |
|
|
|
Net Asset Value, end of year | | $ | 23.53 | | | $ | 21.07 | | | $ | 20.76 | | | $ | 18.14 | | | $ | 16.62 | |
| | |
|
|
| |
|
|
| |
|
|
| |
|
|
| |
|
|
|
Total Return(a) | | | 12.00 | % | | | 1.79 | % | | | 14.55 | % | | | 9.63 | % | | | 30.25 | % |
Ratios/Supplemental Data: | | | | | | | | | | | | | | | | | | | | |
Net assets, end of year (in millions) | | $ | 2,100.5 | | | $ | 2,077.3 | | | $ | 2,297.0 | | | $ | 2,044.1 | | | $ | 1,772.4 | |
Ratios to average net asset(c): | | | | | | | | | | | | | | | | | | | | |
Expenses | | | .62 | % | | | .63 | % | | | .63 | % | | | .64 | % | | | .64 | % |
Net investment income | | | .42 | % | | | .29 | % | | | .10 | % | | | .50 | % | | | .28 | % |
Portfolio turnover rate | | | 69 | % | | | 67 | % | | | 57 | % | | | 74 | % | | | 69 | % |
| (a) | Total return is calculated assuming a purchase of a share on the first day and a sale on the last day of each year reported and includes reinvestment of dividends and distributions and does not reflect the effect of insurance contract charges. Total return does not reflect expenses associated with the separate account such as administrative fees, account charges and surrender charges which, if reflected, would reduce the total returns for all periods shown. Performance figures may reflect voluntary fee waivers and/or expense reimbursements. In the absence of voluntary fee waivers and/or expense reimbursements, the total return would be lower. Past performance is no guarantee of future results. Total returns may reflect adjustments to conform to generally accepted accounting principles. |
| (b) | Calculated based upon average shares outstanding during the year. |
| (c) | Does not include expenses of the underlying portfolio in which the Portfolio invests. |
| | | | | | | | | | | | | | | | | | | | |
| | | Jennison Portfolio
| |
| | | Class II
| |
| | | Year Ended December 31,
| |
| | | 2007
| | | 2006(c)
| | | 2005(c)
| | | 2004
| | | 2003
| |
Per Share Operating Performance: | | | | | | | | | | | | | | | | | | | | |
Net Asset Value, beginning of year | | $ | 20.77 | | | $ | 20.49 | | | $ | 17.97 | | | $ | 16.46 | | | $ | 12.70 | |
| | |
|
|
| |
|
|
| |
|
|
| |
|
|
| |
|
|
|
Income From Investment Operations: | | | | | | | | | | | | | | | | | | | | |
Net investment income (loss) | | | — | (b) | | | (.02 | ) | | | (.05 | ) | | | .02 | | | | (.01 | ) |
Net realized and unrealized gain on investments | | | 2.40 | | | | .30 | | | | 2.57 | | | | 1.50 | | | | 3.77 | |
| | |
|
|
| |
|
|
| |
|
|
| |
|
|
| |
|
|
|
Total from investment operations | | | 2.40 | | | | .28 | | | | 2.52 | | | | 1.52 | | | | 3.76 | |
| | |
|
|
| |
|
|
| |
|
|
| |
|
|
| |
|
|
|
Less Dividends: | | | | | | | | | | | | | | | | | | | | |
Dividends from net investment income | | | — | | | | — | | | | — | | | | (.01 | ) | | | — | |
| | |
|
|
| |
|
|
| |
|
|
| |
|
|
| |
|
|
|
Net Asset Value, end of year | | $ | 23.17 | | | $ | 20.77 | | | $ | 20.49 | | | $ | 17.97 | | | $ | 16.46 | |
| | |
|
|
| |
|
|
| |
|
|
| |
|
|
| |
|
|
|
Total Return(a) | | | 11.56 | % | | | 1.37 | % | | | 14.02 | % | | | 9.22 | % | | | 29.61 | % |
Ratios/Supplemental Data: | | | | | | | | | | | | | | | | | | | | |
Net assets, end of year (in millions) | | $ | 21.9 | | | $ | 19.6 | | | $ | 18.2 | | | $ | 84.9 | | | $ | 74.3 | |
Ratios to average net asset(d): | | | | | | | | | | | | | | | | | | | | |
Expenses | | | 1.02 | % | | | 1.03 | % | | | 1.03 | % | | | 1.04 | % | | | 1.04 | % |
Net investment income (loss) | | | .02 | % | | | (.12 | )% | | | (.27 | )% | | | .11 | % | | | (.13 | )% |
Portfolio turnover rate | | | 69 | % | | | 67 | % | | | 57 | % | | | 74 | % | | | 69 | % |
| (a) | Total return is calculated assuming a purchase of a share on the first day and a sale on the last day of each year reported and includes reinvestment of dividends and distributions and does not reflect the effect of insurance contract charges. Total return does not reflect expenses associated with the separate account such as administrative fees, account charges and surrender charges which, if reflected, would reduce the total returns for all periods shown. Performance figures may reflect voluntary fee waivers and/or expense reimbursements. In the absence of voluntary fee waivers and/or expense reimbursements, the total return would be lower. Past performance is no guarantee of future results. Total returns may reflect adjustments to conform to generally accepted accounting principles. |
| (b) | Less than $.005 per share. |
| (c) | Calculated based upon average shares outstanding during the year. |
| (d) | Does not include expenses of the underlying portfolio in which the Portfolio invests. |
SEE NOTES TO FINANCIAL STATEMENTS.
C5
Financial Highlights
| | | | | | | | | | | | | | | | | | | | |
| | | Money Market Portfolio
| |
| | | Year Ended December 31,
| |
| | | 2007
| | | 2006
| | | 2005
| | | 2004
| | | 2003
| |
Per Share Operating Performance: | | | | | | | | | | | | | | | | | | | | |
Net Asset Value, beginning of year | | $ | 10.00 | | | $ | 10.00 | | | $ | 10.00 | | | $ | 10.00 | | | $ | 10.00 | |
| | |
|
|
| |
|
|
| |
|
|
| |
|
|
| |
|
|
|
Income From Investment Operations: | | | | | | | | | | | | | | | | | | | | |
Net investment income and realized gains | | | .49 | | | | .46 | | | | .28 | | | | .10 | | | | .08 | |
Dividends and distributions | | | — | | | | — | | | | (.28 | ) | | | (.10 | ) | | | (.08 | ) |
Distributions | | | (.49 | ) | | | (.46 | ) | | | — | | | | — | | | | — | |
| | |
|
|
| |
|
|
| |
|
|
| |
|
|
| |
|
|
|
Net Asset Value, end of year | | $ | 10.00 | | | $ | 10.00 | | | $ | 10.00 | | | $ | 10.00 | | | $ | 10.00 | |
| | |
|
|
| |
|
|
| |
|
|
| |
|
|
| |
|
|
|
Total Return(a) | | | 5.06 | % | | | 4.74 | % | | | 2.85 | % | | | 1.01 | % | | | .84 | % |
Ratios/Supplemental Data: | | | | | | | | | | | | | | | | | | | | |
Net assets, end of year (in millions) | | $ | 1,289.9 | | | $ | 1,060.5 | | | $ | 851.9 | | | $ | 885.4 | | | $ | 933.7 | |
Ratios to average net assets: | | | | | | | | | | | | | | | | | | | | |
Expenses | | | .43 | % | | | .43 | % | | | .45 | % | | | .45 | % | | | .44 | % |
Net investment income | | | 4.94 | % | | | 4.68 | % | | | 2.86 | % | | | 1.01 | % | | | .84 | % |
| (a) | Total return is calculated assuming a purchase of a share on the first day and a sale on the last day of each period reported and includes reinvestment of dividends and distributions and does not reflect the effect of insurance contract charges. Total return does not reflect expenses associated with the separate account such as administrative fees, account charges and surrender charges which, if reflected, would reduce the total returns for all periods shown. Performance figures may reflect voluntary fee waivers and/or expense reimbursements. In the absense of voluntary fee waivers and /or expense reimbursements, the total return would be lower. Past performance is no guarantee of future results. Total returns may reflect adjustments to conform to generally accepted accounting principles. |
| | | | | | | | | | | | | | | | | | | | |
| | | Natural Resources Portfolio
| |
| | | Class I
| |
| | | Year Ended December 31,
| |
| | | 2007(a)
| | | 2006(a)
| | | 2005
| | | 2004
| | | 2003
| |
Per Share Operating Performance: | | | | | | | | | | | | | | | | | | | | |
Net Asset Value, beginning of year | | $ | 45.67 | | | $ | 45.46 | | | $ | 31.88 | | | $ | 27.49 | | | $ | 22.35 | |
| | |
|
|
| |
|
|
| |
|
|
| |
|
|
| |
|
|
|
Income From Investment Operations: | | | | | | | | | | | | | | | | | | | | |
Net investment income | | | .43 | | | | .35 | | | | .33 | | | | .19 | | | | .25 | |
Net realized and unrealized gain on investments | | | 21.09 | | | | 8.65 | | | | 16.27 | | | | 6.28 | | | | 7.38 | |
| | |
|
|
| |
|
|
| |
|
|
| |
|
|
| |
|
|
|
Total from investment operations | | | 21.52 | | | | 9.00 | | | | 16.60 | | | | 6.47 | | | | 7.63 | |
| | |
|
|
| |
|
|
| |
|
|
| |
|
|
| |
|
|
|
Less Dividends and Distributions: | | | | | | | | | | | | | | | | | | | | |
Dividends from net investment income | | | — | | | | — | | | | — | (b) | | | (1.00 | ) | | | (.98 | ) |
Distributions from net realized gains | | | — | | | | — | | | | (3.02 | ) | | | (1.08 | ) | | | (1.51 | ) |
Distributions | | | (10.91 | ) | | | (8.79 | ) | | | — | | | | — | | | | — | |
| | |
|
|
| |
|
|
| |
|
|
| |
|
|
| |
|
|
|
Total dividends and distributions | | | (10.91 | ) | | | (8.79 | ) | | | (3.02 | ) | | | (2.08 | ) | | | (2.49 | ) |
| | |
|
|
| |
|
|
| |
|
|
| |
|
|
| |
|
|
|
Net Asset Value, end of year | | $ | 56.28 | | | $ | 45.67 | | | $ | 45.46 | | | $ | 31.88 | | | $ | 27.49 | |
| | |
|
|
| |
|
|
| |
|
|
| |
|
|
| |
|
|
|
Total Return(c) | | | 48.30 | % | | | 22.20 | % | | | 55.91 | % | | | 25.17 | % | | | 39.00 | % |
Ratios/Supplemental Data: | | | | | | | | | | | | | | | | | | | | |
Net assets, end of year (in millions) | | $ | 1,669.9 | | | $ | 1,193.0 | | | $ | 1,016.3 | | | $ | 622.6 | | | $ | 498.7 | |
Ratios to average net assets(d): | | | | | | | | | | | | | | | | | | | | |
Expenses | | | .48 | % | | | .49 | % | | | .49 | % | | | .51 | % | | | .51 | % |
Net investment income | | | .80 | % | | | .78 | % | | | .66 | % | | | .49 | % | | | .80 | % |
Portfolio turnover rate | | | 39 | % | | | 58 | % | | | 59 | % | | | 24 | % | | | 24 | % |
| (a) | Calculated based upon average shares outstanding during the year. |
| (b) | Amount is less than $0.01 per share. |
| (c) | Total return is calculated assuming a purchase of a share on the first day and a sale on the last day of each year reported and includes reinvestment of dividends and distributions and does not reflect the effect of insurance contract charges. Total return does not reflect expenses associated with the separate account such as administrative fees, account charges and surrender charges which, if reflected, would reduce the total returns for all periods shown, Performance figures may reflect voluntary fee waivers and/or expense reimbursements. In the absence of voluntary fee waivers and/or expense reimbursements, the total return would be lower. Past performance is no guarantee of future results. Total returns may reflect adjustments to conform to generally accepted accounting principles. |
| (d) | Does not include expenses of the underlying portfolio in which the Portfolio invests. |
SEE NOTES TO FINANCIAL STATEMENTS.
C6
Financial Highlights
| | | | | | | | | | | | |
| | | Natural Resources Portfolio
| |
| | | Class II
| |
| | | Year Ended
December 31,
| | | April 28, 2005(b)
through
December 31, 2005
| |
| | | 2007(a)
| | | 2006(a)
| | |
Per Share Operating Performance: | | | | | | | | | | | | |
Net Asset Value, beginning of period | | $ | 45.55 | | | $ | 45.32 | | | $ | 30.10 | |
| | |
|
|
| |
|
|
| |
|
|
|
Income From Investment Operations: | | | | | | | | | | | | |
Net investment income | | | .28 | | | | .18 | | | | .05 | |
Net realized and unrealized gain on investments | | | 20.92 | | | | 8.64 | | | | 15.17 | |
| | |
|
|
| |
|
|
| |
|
|
|
Total from investment operations | | | 21.20 | | | | 8.82 | | | | 15.22 | |
| | |
|
|
| |
|
|
| |
|
|
|
Less Distributions: | | | — | | | | — | | | | — | |
Distributions | | | (10.83 | ) | | | (8.59 | ) | | | — | |
| | |
|
|
| |
|
|
| |
|
|
|
Total dividends and distributions | | | (10.83 | ) | | | (8.59 | ) | | | — | |
| | |
|
|
| |
|
|
| |
|
|
|
Net Asset Value, end of period | | $ | 55.92 | | | $ | 45.55 | | | $ | 45.32 | |
| | |
|
|
| |
|
|
| |
|
|
|
Total Return(c) | | | 47.70 | % | | | 21.72 | % | | | 50.56 | %(e) |
Ratios/Supplemental Data: | | | | | | | | | | | | |
Net assets, end of period (in millions) | | $ | 47.9 | | | $ | 16.9 | | | $ | 5.1 | |
Ratios to average net assets(f): | | | | | | | | | | | | |
Expenses | | | .88 | % | | | .89 | % | | | .89 | %(d) |
Net investment income | | | .51 | % | | | .40 | % | | | .33 | %(d) |
Portfolio turnover rate | | | 39 | % | | | 58 | % | | | 59 | %(e) |
| (a) | Calculated based upon average shares outstanding during the year. |
| (b) | Commencement of offering of Class II shares. |
| (c) | Total return is calculated assuming a purchase of a share on the first day and a sale on the last day of each period reported and includes reinvestment of dividends and distributions and does not reflect the effect of insurance contract charges. Total return does not reflect expenses associated with the separate account such as administrative fees, account charges and surrender charges which, if reflected, would reduce the total returns for all periods shown, Performance figures may reflect voluntary fee waivers and/or expense reimbursements. In the absence of voluntary fee waivers and/or expense reimbursements, the total return would be lower. Past performance is no guarantee of future results. Total returns may reflect adjustments to conform to generally accepted accounting principles. Total returns for periods less than one full year are not annualized. |
| (f) | Does not include expenses of the underlying portfolio in which the Portfolio invests. |
| | | | | | | | | | | | | | | | | | | | |
| | | Small Capitalization Stock Portfolio
| |
| | | Year Ended December 31,
| |
| | | 2007
| | | 2006
| | | 2005
| | | 2004
| | | 2003
| |
Per Share Operating Performance: | | | | | | | | | | | | | | | | | | | | |
Net Asset Value, beginning of year | | $ | 23.29 | | | $ | 21.38 | | | $ | 21.33 | | | $ | 17.64 | | | $ | 12.91 | |
| | |
|
|
| |
|
|
| |
|
|
| |
|
|
| |
|
|
|
Income (Loss) From Investment Operations: | | | | | | | | | | | | | | | | | | | | |
Net investment income | | | .21 | | | | .14 | | | | .13 | | | | .12 | | | | .07 | |
Net realized and unrealized gain (loss) on investments | | | (.36 | ) | | | 2.95 | | | | 1.30 | | | | 3.75 | | | | 4.82 | |
| | |
|
|
| |
|
|
| |
|
|
| |
|
|
| |
|
|
|
Total from investment operations | | | (.15 | ) | | | 3.09 | | | | 1.43 | | | | 3.87 | | | | 4.89 | |
| | |
|
|
| |
|
|
| |
|
|
| |
|
|
| |
|
|
|
Less Dividends and Distributions: | | | | | | | | | | | | | | | | | | | | |
Dividends from net investment income | | | — | | | | — | | | | (.13 | ) | | | (.11 | ) | | | (.07 | ) |
Distributions from net realized gains | | | — | | | | — | | | | (1.25 | ) | | | (.07 | ) | | | (.09 | ) |
Distributions | | | (1.83 | ) | | | (1.18 | ) | | | — | | | | — | | | | — | |
| | |
|
|
| |
|
|
| |
|
|
| |
|
|
| |
|
|
|
Total dividends and distributions | | | (1.83 | ) | | | (1.18 | ) | | | (1.38 | ) | | | (.18 | ) | | | (.16 | ) |
| | |
|
|
| |
|
|
| |
|
|
| |
|
|
| |
|
|
|
Net Asset Value, end of year | | $ | 21.31 | | | $ | 23.29 | | | $ | 21.38 | | | $ | 21.33 | | | $ | 17.64 | |
| | |
|
|
| |
|
|
| |
|
|
| |
|
|
| |
|
|
|
Total Return(a) | | | (.53 | )% | | | 14.67 | % | | | 7.26 | % | | | 22.04 | % | | | 38.27 | % |
Ratios/Supplemental Data: | | | | | | | | | | | | | | | | | | | | |
Net assets, end of year (in millions) | | $ | 699.6 | | | $ | 777.1 | | | $ | 738.3 | | | $ | 743.2 | | | $ | 619.9 | |
Ratios to average net assets(b): | | | | | | | | | | | | | | | | | | | | |
Expenses | | | .46 | % | | | .45 | % | | | .46 | % | | | .47 | % | | | .48 | % |
Net investment income | | | .86 | % | | | .59 | % | | | .62 | % | | | .62 | % | | | .47 | % |
Portfolio turnover rate | | | 16 | % | | | 12 | % | | | 16 | % | | | 18 | % | | | 15 | % |
| (a) | Total return is calculated assuming a purchase of a share on the first day and a sale on the last day of each year reported and includes reinvestment of dividends and distributions and does not reflect the effect of insurance contract charges. Total return does not reflect expenses associated with the separate account such as administrative fees, account charges and surrender charges which, if reflected, would reduce the total returns for all periods shown. Performance figures may reflect voluntary fee waivers and/or expense reimbursements. In the absence of voluntary fee waivers and/or expense reimbursements, the total return would be lower. Past performance is no guarantee of future results. Total returns may reflect adjustments to conform to generally accepted accounting principles. |
| (b) | Does not include expenses of the underlying portfolio in which the Portfolio invests. |
SEE NOTES TO FINANCIAL STATEMENTS.
C7
Financial Highlights
| | | | | | | | | | | | | | | | | | | | |
| | | Stock Index Portfolio
| |
| | | Year Ended December 31,
| |
| | | 2007
| | | 2006
| | | 2005
| | | 2004
| | | 2003
| |
Per Share Operating Performance: | | | | | | | | | | | | | | | | | | | | |
Net Asset Value, beginning of year | | $ | 35.64 | | | $ | 31.41 | | | $ | 31.29 | | | $ | 29.29 | | | $ | 24.09 | |
| | |
|
|
| |
|
|
| |
|
|
| |
|
|
| |
|
|
|
Income From Investment Operations: | | | | | | | | | | | | | | | | | | | | |
Net investment income | | | .68 | | | | .56 | | | | .48 | | | | .50 | | | | .36 | |
Net realized and unrealized gain on investments | | | 1.14 | | | | 4.31 | | | | .88 | | | | 2.50 | | | | 6.14 | |
| | |
|
|
| |
|
|
| |
|
|
| |
|
|
| |
|
|
|
Total from investment operations | | | 1.82 | | | | 4.87 | | | | 1.36 | | | | 3.00 | | | | 6.50 | |
| | |
|
|
| |
|
|
| |
|
|
| |
|
|
| |
|
|
|
Less Dividends and Distributions: | | | | | | | | | | | | | | | | | | | | |
Dividends from net investment income | | | — | | | | — | | | | (.47 | ) | | | (.49 | ) | | | (.37 | ) |
Distributions from net realized gains | | | — | | | | — | | | | (.77 | ) | | | (.51 | ) | | | (.93 | ) |
Distributions | | | (.62 | ) | | | (.64 | ) | | | — | | | | — | | | | — | |
| | |
|
|
| |
|
|
| |
|
|
| |
|
|
| |
|
|
|
Total dividends and distributions | | | (.62 | ) | | | (.64 | ) | | | (1.24 | ) | | | (1.00 | ) | | | (1.30 | ) |
| | |
|
|
| |
|
|
| |
|
|
| |
|
|
| |
|
|
|
Net Asset Value, end of year | | $ | 36.84 | | | $ | 35.64 | | | $ | 31.41 | | | $ | 31.29 | | | $ | 29.29 | |
| | |
|
|
| |
|
|
| |
|
|
| |
|
|
| |
|
|
|
Total Return(a) | | | 5.10 | % | | | 15.54 | % | | | 4.54 | % | | | 10.45 | % | | | 28.18 | % |
Ratios/Supplemental Data: | | | | | | | | | | | | | | | | | | | | |
Net assets, end of year (in millions) | | $ | 3,122.4 | | | $ | 3,306.4 | | | $ | 3,212.7 | | | $ | 3,094.7 | | | $ | 2,940.9 | |
Ratios to average net assets(b): | | | | | | | | | | | | | | | | | | | | |
Expenses | | | .37 | % | | | .37 | % | | | .38 | % | | | .38 | % | | | .37 | % |
Net investment income | | | 1.73 | % | | | 1.61 | % | | | 1.52 | % | | | 1.64 | % | | | 1.42 | % |
Portfolio turnover rate | | | 3 | % | | | 3 | % | | | 7 | % | | | 3 | % | | | 2 | % |
| (a) | Total return is calculated assuming a purchase of a share on the first day and a sale on the last day of each year reported and includes reinvestment of dividends and distributions and does not reflect the effect of insurance contract charges. Total return does not reflect expenses associated with the separate account such as administrative fees, account charges and surrender charges which, if reflected, would reduce the total returns for all periods shown. Performance figures may reflect voluntary fee waivers and/or expense reimbursements. In the absence of voluntary fee waivers and/or expense reimbursements, the total return would be lower. Past performance is no guarantee of future results. Total returns may reflect adjustments to conform to generally accepted accounting principles. |
| (b) | Does not include expenses of the underlying portfolio in which the Portfolio invests. |
| | | | | | | | | | | | | | | | | | | | |
| | | Value Portfolio
| |
| | | Class I
| |
| | | Year Ended December 31,
| |
| | | 2007
| | | 2006
| | | 2005
| | | 2004
| | | 2003
| |
Per Share Operating Performance: | | | | | | | | | | | | | | | | | | | | |
Net Asset Value, beginning of year | | $ | 26.21 | | | $ | 22.95 | | | $ | 19.93 | | | $ | 17.36 | | | $ | 13.75 | |
| | |
|
|
| |
|
|
| |
|
|
| |
|
|
| |
|
|
|
Income From Investment Operations: | | | | | | | | | | | | | | | | | | | | |
Net investment income | | | .39 | | | | .36 | | | | .29 | | | | .28 | | | | .23 | |
Net realized and unrealized gain on investments | | | .42 | | | | 4.11 | | | | 3.03 | | | | 2.55 | | | | 3.62 | |
| | |
|
|
| |
|
|
| |
|
|
| |
|
|
| |
|
|
|
Total from investment operations | | | .81 | | | | 4.47 | | | | 3.32 | | | | 2.83 | | | | 3.85 | |
| | |
|
|
| |
|
|
| |
|
|
| |
|
|
| |
|
|
|
Less Dividends and Distributions: | | | | | | | | | | | | | | | | | | | | |
Dividends from net investment income | | | — | | | | — | | | | (.30 | ) | | | (.26 | ) | | | (.24 | ) |
Distributions | | | (3.58 | ) | | | (1.21 | ) | | | — | | | | — | | | | — | |
Tax return of capital distributions | | | — | | | | — | | | | — | | | | — | | | | — | (a) |
| | |
|
|
| |
|
|
| |
|
|
| |
|
|
| |
|
|
|
Total dividends and distributions | | | (3.58 | ) | | | (1.21 | ) | | | (.30 | ) | | | (.26 | ) | | | (.24 | ) |
| | |
|
|
| |
|
|
| |
|
|
| |
|
|
| |
|
|
|
Net Asset Value, end of year | | $ | 23.44 | | | $ | 26.21 | | | $ | 22.95 | | | $ | 19.93 | | | $ | 17.36 | |
| | |
|
|
| |
|
|
| |
|
|
| |
|
|
| |
|
|
|
Total Return(b) | | | 3.19 | % | | | 19.94 | % | | | 16.66 | % | | | 16.31 | % | | | 28.07 | % |
Ratios/Supplemental Data: | | | | | | | | | | | | | | | | | | | | |
Net assets, end of year (in millions) | | $ | 1,824.9 | | | $ | 1,975.7 | | | $ | 1,750.1 | | | $ | 1,595.6 | | | $ | 1,456.1 | |
Ratios to average net assets(c): | | | | | | | | | | | | | | | | | | | | |
Expenses | | | .43 | % | | | .43 | % | | | .43 | % | | | .44 | % | | | .44 | % |
Net investment income | | | 1.35 | % | | | 1.45 | % | | | 1.35 | % | | | 1.48 | % | | | 1.49 | % |
Portfolio turnover rate | | | 52 | % | | | 49 | % | | | 56 | % | | | 52 | % | | | 72 | % |
| (a) | Less than $.005 per share. |
| (b) | Total return is calculated assuming a purchase of a share on the first day and a sale on the last day of each period reported and includes reinvestment of dividends and distributions and does not reflect the effect of insurance contract charges. Total returns for periods of less than one full year are not annualized. Total return does not reflect expenses associated with the separate account such as administrative fees, account charges and surrender charges which, if reflected, would reduce the total returns for all periods shown. Performance figures may reflect voluntary fee waivers and/or expense reimbursements. In the absence of voluntary fee waivers and/or expense reimbursements, the total return would be lower. Past performance is no guarantee of future results. Total returns may reflect adjustments to conform to generally accepted accounting principles. |
| (c) | Does not include expenses of the underlying portfolio in which the Portfolio invests. |
SEE NOTES TO FINANCIAL STATEMENTS.
C8
Financial Highlights
| | | | | | | | | | | | | | | | | | | | |
| | | Value Portfolio
| |
| | | Class II
| |
| | | Year Ended December 31,
| |
| | | 2007
| | | 2006
| | | 2005
| | | 2004
| | | 2003(a)
| |
Per Share Operating Performance: | | | | | | | | | | | | | | | | | | | | |
Net Asset Value, beginning of year | | $ | 26.26 | | | $ | 22.98 | | | $ | 19.94 | | | $ | 17.37 | | | $ | 13.75 | |
| | |
|
|
| |
|
|
| |
|
|
| |
|
|
| |
|
|
|
Income From Investment Operations: | | | | | | | | | | | | | | | | | | | | |
Net investment income | | | .29 | | | | .27 | | | | .21 | | | | .20 | | | | .16 | |
Net realized and unrealized gain on investments | | | .42 | | | | 4.11 | | | | 3.01 | | | | 2.55 | | | | 3.62 | |
| | |
|
|
| |
|
|
| |
|
|
| |
|
|
| |
|
|
|
Total from investment operations | | | .71 | | | | 4.38 | | | | 3.22 | | | | 2.75 | | | | 3.78 | |
| | |
|
|
| |
|
|
| |
|
|
| |
|
|
| |
|
|
|
Less Dividends and Distributions: | | | | | | | | | | | | | | | | | | | | |
Dividends from net investment income | | | — | | | | — | | | | (.18 | ) | | | (.18 | ) | | | (.16 | ) |
Distributions | | | (3.46 | ) | | | (1.10 | ) | | | — | | | | — | | | | — | |
Tax return of capital distributions | | | — | | | | — | | | | — | | | | — | | | | — | (b) |
| | |
|
|
| |
|
|
| |
|
|
| |
|
|
| |
|
|
|
Total dividends and distributions | | | (3.46 | ) | | | (1.10 | ) | | | (.18 | ) | | | (.18 | ) | | | (.16 | ) |
| | |
|
|
| |
|
|
| |
|
|
| |
|
|
| |
|
|
|
Net Asset Value, end of year | | $ | 23.51 | | | $ | 26.26 | | | $ | 22.98 | | | $ | 19.94 | | | $ | 17.37 | |
| | |
|
|
| |
|
|
| |
|
|
| |
|
|
| |
|
|
|
Total Return(c) | | | 2.82 | % | | | 19.43 | % | | | 16.21 | % | | | 15.83 | % | | | 27.63 | % |
Ratios/Supplemental Data: | | | | | | | | | | | | | | | | | | | | |
Net assets, end of year (in millions) | | $ | 2.7 | | | $ | 3.2 | | | $ | 3.1 | | | $ | 3.0 | | | $ | 2.9 | |
Ratios to average net assets(d): | | | | | | | | | | | | | | | | | | | | |
Expenses | | | .83 | % | | | .83 | % | | | .83 | % | | | .84 | % | | | .84 | % |
Net investment income | | | .96 | % | | | 1.04 | % | | | .95 | % | | | 1.08 | % | | | 1.10 | % |
Portfolio turnover rate | | | 52 | % | | | 49 | % | | | 56 | % | | | 52 | % | | | 72 | % |
| (a) | Calculated based upon weighted average shares outstanding during the year. |
| (b) | Less than $.005 per share. |
| (c) | Total return is calculated assuming a purchase of a share on the first day and a sale on the last day of each period reported and includes reinvestment of dividends and distributions and does not reflect the effect of insurance contract charges. Total investment returns for periods of less than one full year are not annualized. Total return does not reflect expenses associated with the separate account such as administrative fees, account charges and surrender charges which, if reflected, would reduce the total returns for all periods shown. Performance figures may reflect voluntary fee waivers and/or expense reimbursements. In the absence of voluntary fee waivers and/or expense reimbursements, the total return would be lower. Past performance is no guarantee of future results. Total returns may reflect adjustments to conform to generally accepted accounting principles. |
| (d) | Does not include expenses of the underlying portfolio in which the Portfolio invests. |
SEE NOTES TO FINANCIAL STATEMENTS.
C9
Report Of Independent Registered Public Accounting Firm
THE BOARD OF TRUSTEES AND SHAREHOLDERS OF THE PRUDENTIAL SERIES FUND:
We have audited the accompanying statements of assets and liabilities of The Prudential Series Fund (comprised of Conservative Balanced Portfolio, Diversified Bond Portfolio, Equity Portfolio, Flexible Managed Portfolio, Global Portfolio, Government Income Portfolio, High Yield Bond Portfolio, Jennison Portfolio, Money Market Portfolio, Natural Resources Portfolio, Small Capitalization Stock Portfolio, Stock Index Portfolio and Value Portfolio, hereafter referred to as the “Funds”), including the portfolios of investments, as of December 31, 2007, and the related statements of operations for the year then ended, the statements of changes in net assets for each of the years in the two-year period then ended and the financial highlights for each of the years in the four-year period then ended. These financial statements and financial highlights are the responsibility of the Funds’ management. Our responsibility is to express an opinion on these financial statements and financial highlights based on our audits. The financial highlights for the year ended December 31, 2003 were audited by another independent registered public accounting firm, whose report dated February 13, 2004, expressed an unqualified opinion thereon.
We conducted our audits in accordance with the standards of the Public Company Accounting Oversight Board (United States). Those standards require that we plan and perform the audit to obtain reasonable assurance about whether the financial statements and financial highlights are free of material misstatement. An audit includes examining, on a test basis, evidence supporting the amounts and disclosures in the financial statements. Our procedures included confirmation of securities owned as of December 31, 2007, by correspondence with the custodian and brokers or by other appropriate auditing procedures where replies from brokers were not received. An audit also includes assessing the accounting principles used and significant estimates made by management, as well as evaluating the overall financial statement presentation. We believe that our audits provide a reasonable basis for our opinion.
In our opinion, the financial statements and financial highlights referred to above present fairly, in all material respects, the financial position of the Funds as of December 31, 2007, and the results of their operations for the year then ended, the changes in their net assets for each of the years in the two-year period then ended and the financial highlights for each of the years in the four-year period then ended, in conformity with U.S. generally accepted accounting principles.

New York, New York
February 19, 2008
D1
MANAGEMENT OF THE FUND
(Unaudited)
Information pertaining to the Trustees of the Fund is set forth below. Trustees who are not deemed to be “interested persons” of the Fund as defined in the Investment Company Act are referred to as “Independent Trustees.” Trustees who are deemed to be “interested persons” of the Fund are referred to as “Interested Trustees.” “Fund Complex” consists of the Fund and any other investment companies managed by PI.
| | | | | | |
Name, Address**,
and Age | | Position with Fund*
Term of Office***
Length of Time Served | | Number of Portfolios
In Fund Complex
Overseen by Trustee | | Other Directorships
Held by the Trustee**** |
| | | |
| Saul K. Fenster, Ph.D. (74) | | Trustee, Since 1983 | | 87 | | Member (since 2006), Board of The Ridgefield Foundation and The Leir Foundation; Board of Directors of IDT Corporation (2000-2006) |
|
| Principal Occupations During Past 5 Years – Currently President Emeritus of New Jersey Institute of Technology (since 2002); formerly President (1978-2002) of New Jersey Institute of Technology; Commissioner (1998-2002) of the Middle States Association Commission on Higher Education; Commissioner (1985-2002) of the New Jersey Commission on Science and Technology; formerly Director (1998-2005) of Society of Manufacturing Engineering Education Foundation; formerly Director of Prosperity New Jersey; formerly a director or trustee of Liberty Science Center, Research and Development Council of New Jersey, New Jersey State Chamber of Commerce, and National Action Council for Minorities in Engineering. |
| | | |
| Delayne Dedrick Gold (69) | | Trustee, Since 2001 | | 86 | | — |
|
| Principal Occupations During Past 5 Years – Marketing Consultant (1982-present); formerly Senior Vice President and Member of the Board of Directors, Prudential Bache Securities, Inc. |
| | | |
| W. Scott McDonald, Jr. (70) | | Independent Vice Chair since 2004 and Trustee, Since 1983 | | 87 | | — |
|
| Principal Occupations During Past 5 Years – Formerly Management Consultant (1997-2004) and of Counsel (2004-2005) at Kaludis Consulting Group, Inc. (company serving higher education); Formerly principal (1995-1997), Scott McDonald & Associates; Chief Operating Officer (1991-1995), Fairleigh Dickinson University; Executive Vice President and Chief Operating Officer (1975-1991), Drew University; interim President (1988-1990), Drew University; formerly Director of School, College and University Underwriters Ltd. |
| | | |
| Thomas T. Mooney (66) | | Independent Chair and Trustee, Since 2001 | | 86 | | — |
|
| Principal Occupations During Past 5 Years – Formerly Chief Executive Officer, Excell Partners, Inc.; formerly President of the Greater Rochester Metro Chamber of Commerce, Rochester City Manager; formerly Deputy Monroe County Executive. |
| | | |
| Thomas M. O’Brien (57) | | Trustee, Since 2003 | | 86 | | Formerly Director (December 1996-May 2000) of North Fork Bancorporation, Inc.; Formerly Director (May 2000-April 2006) of Atlantic Bank of New York; Director (since November 2006) of State Bancorp, Inc. (NASDAQ: STBC) and State Bank of Long Island. |
|
| Principal Occupations During Past 5 Years – President and COO (since November 2006) and CEO (since April 2007) of State Bancorp, Inc. and State Bank; Vice Chairman (January 1997-April 2000) of North Fork Bank; President and Chief Executive Officer (December 1984-December 1996) of North Side Savings Bank; formerly President and Chief Executive Officer (May 2000-June 2006) Atlantic Bank of New York. |
| | | |
| John A. Pileski (68) | | Trustee, Since 2003 | | 86 | | Director (since April 2001) of New York Bank Corp; Director (since May 1980) of Surf Club of Quogue, Inc. |
|
| Principal Occupations During Past 5 Years – Retired (June 2000) Tax Partner of KPMG, LLP. |
| | | |
| F. Don Schwartz (72) | | Trustee, Since 2003 | | 86 | | — |
|
| Principal Occupations During Past 5 Years – Management Consultant (since April 1985). |
E1
| | | | | | |
|
Interested Trustees
|
Name, Address**,
and Age | | Position with Fund*
Term of Office***
Length of Time Served | | Number of Portfolios
In Fund Complex
Overseen by Trustee | | Other Directorships
Held by the Trustee**** |
| | | |
| *David R. Odenath (50) | | President since 2002 and Trustee Since 1999 | | 86 | | — |
|
| Principal Occupations During Past 5 Years – President of Prudential Annuities (since August 2002); Senior Vice President (since June 1999) of Prudential; Director (since June 2005) and Executive Vice President (since March 2006) of AST Investment Services, Inc; formerly Executive Vice President (May 2003-November 2007) of Prudential Investment Management Services LLC; formerly President, Chief Executive Officer, Chief Operating Officer and Officer in Charge (June 2005-March 2006) of AST Investment Services, Inc. |
| | | |
| *Robert F. Gunia (61) | | Vice President and Trustee Since 2001 | | 149 | | Vice President and Director (since May 1989); Treasurer (since 1999) of The Asia Pacific Fund, Inc. and Vice President (since January 2007) of The Greater China Fund, Inc. |
|
| Principal Occupations During Past 5 Years – Chief Administrative Officer (since September 1999) and Executive Vice President (since December 1996) of Prudential Investments LLC; President (since April 1999) of Prudential Investment Management Services LLC; Executive Vice President (since March 1999) and Treasurer (since May 2000) of Prudential Mutual Fund Services LLC; Chief Administrative Officer, Executive Vice President and Director (since May 2003) of AST Investment Services, Inc. |
| | | | |
|
Officers
|
Name, Address**,
and Age | | Position with Fund*
Term of Office***
Length of Time Served | | Principal Occupations During Past 5 Years |
| | |
| Grace C. Torres (48) | | Treasurer and Principal Financial and Accounting Officer Since 1997 | | Assistant Treasurer (since March 1999) and Senior Vice President (since September 1999) of PI; Assistant Treasurer (since May 2003) and Vice President (since June 2005) of AST Investment Services, Inc.; Senior Vice President and Assistant Treasurer (since May 2003) of Prudential Annuities Advisory Services, Inc.; formerly Senior Vice President (May 2003-June 2005) of AST Investment Services, Inc. |
| | |
| Kathryn L. Quirk (55) | | Chief Legal Officer Since 2005 | | Vice President and Corporate Counsel (since September 2004) of Prudential; Executive Vice President, Chief Legal Officer and Secretary (since July 2005) of PI and Prudential Mutual Fund Services LLC; Vice President and Corporate Counsel (since June 2005) and Secretary (since February 2006) of AST Investment Services, Inc.; formerly Senior Vice President and Assistant Secretary (November 2004-August 2005) of PI; formerly Assistant Secretary (June 2005-February 2006) of AST Investment Services, Inc.; formerly Managing Director, General Counsel, Chief Compliance Officer, Chief Risk Officer and Corporate Secretary (1997-2002) of Zurich Scudder Investments, Inc. |
| | |
| Deborah A. Docs (50) | | Secretary Since 2005 | | Vice President and Corporate Counsel (since January 2001) of Prudential; Vice President (since December 1996) and Assistant Secretary (since March 1999) of PI; formerly Vice President and Assistant Secretary (May 2003-June 2005) of AST Investment Services, Inc. |
| | |
| Jonathan D. Shain (49) | | Assistant Secretary Since 2005 | | Vice President and Corporate Counsel (since August 1998) of Prudential; Vice President and Assistant Secretary (since May 2001) of PI; Vice President and Assistant Secretary (since February 2001) of PMFS; formerly Vice President and Assistant Secretary (May 2003-June 2005) of AST Investment Services, Inc. |
| | |
| Claudia DiGiacomo (33) | | Assistant Secretary Since 2005 | | Vice President and Corporate Counsel (since January 2005) of Prudential; Vice President and Assistant Secretary of PI (since December 2005); Associate at Sidley Austin Brown & Wood LLP (1999-2004). |
| | |
| John P. Schwartz (36) | | Assistant Secretary Since 2006 | | Vice President and Corporate Counsel (since April 2005) of Prudential; Vice President and Assistant Secretary of PI (since December 2005); Associate at Sidley Austin Brown & Wood LLP (1997-2005). |
| | |
| Timothy J. Knierim (49) | | Chief Compliance Officer Since 2007 | | Chief Compliance Officer of Prudential Investment Management, Inc. (since July 2007); formerly Chief Risk Officer of PIM and PI (2002-2007) and formerly Chief Ethics Officer of PIM and PI (2006-2007). |
E2
| | | | |
Name, Address**,
and Age | | Position with Fund*
Term of Office***
Length of Time Served | | Principal Occupations During Past 5 Years |
| | |
| Valerie M. Simpson (49) | | Deputy Chief Compliance Officer Since 2007 | | Chief Compliance Officer (since April 2007) of PI and AST Investment Services, Inc.; formerly Vice President-Financial Reporting (June 1999-March 2006) for Prudential Life and Annuities Finance. |
| | |
| M. Sadiq Peshimam (44) | | Assistant Treasurer Since 2006 | | Vice President (since 2005) and Director (2000-2005) within Prudential Mutual Fund Administration. |
| | |
| Peter Parrella (49) | | Assistant Treasurer Since 2007 | | Vice President (since 2007) and Director (2004-2007) within Prudential Mutual Fund Administration; formerly Tax Manager at SSB Citi Fund Management LLC (1997-2004). |
| | |
| Alan Fu (51) | | Assistant Treasurer Since 2006 | | Vice President – Tax, The Prudential Insurance Company of America (1999-October 2003); Vice President and Corporate Counsel – Tax, Prudential Financial, Inc. (since October 2003). |
| | |
| Andrew R. French (45) | | Assistant Secretary Since 2006 | | Director and Corporate Counsel (since May 2006) of Prudential; Vice President and Assistant Secretary (since January 2007) of PI; Vice President and Assistant Secretary (since January 2007) of PMFS; formerly Senior Legal Analyst of Prudential Mutual Fund Law Department (1997-2006). |
| | |
| Noreen M. Fierro (43) | | Anti-Money Laundering Compliance Officer Since 2006 | | Vice President, Corporate Compliance (since May 2006) of Prudential; formerly Corporate Vice President, Associate General Counsel (April 2002-May 2005) of UBS Financial Services, Inc., in their Money Laundering Prevention Group; Senior Manager (May 2005-May 2006) of Deloitte Financial Advisory Services, LLP, in their Forensic and Dispute Services, Anti-Money Laundering Group. |
* “Interested” Trustee, as defined in the Investment Company Act, by reason of employment with the Manager (as defined below), and/or the Distributor (as defined below).
** Unless otherwise noted, the address of the Trustees and Officers is c/o: Prudential Investments LLC, Gateway Center Three, 100 Mulberry Street, Newark, New Jersey 07102.
*** There is no set term of office for Trustees and Officers. The Independent Trustees have adopted a retirement policy, which calls for the retirement of Trustees on December 31 of the year in which they reach the age of 75. The table shows how long they have served as Trustee and/or Officer.
**** This column includes only directorships of companies required to register, or file reports with the SEC under the Securities Exchange Act of 1934 (i.e., “public companies”) or other investment companies registered under the Investment Company Act.
E3
The Prudential Series Fund
Approval of Advisory Agreements
At meetings of the Board held on September 12-13, 2007, the Trustees, including the Independent Trustees, unanimously approved the recommendations by Prudential Investments LLC (PI) to appoint Marsico Capital Management LLC (“Marsico”) as a subadviser with respect to the Global Portfolio and the SP International Growth Portfolio (each, a Portfolio, and collectively, the Portfolios) and to approve new subadvisory agreements between PI and Marsico (the “Subadvisory Agreements”).
The Board considered that, on June 14, 2007, Marsico and Bank of America Corporation (BAC) announced they had signed a definitive agreement by which Marsico would acquire ownership of the firm from BAC (the Transaction). The Transaction was completed on December 14, 2007, at which time Marsico began operating as an independent entity under the leadership of Thomas F. Marsico. The Board also considered that, although there were no changes in the Marsico portfolio management teams as a result of the Transaction, each Portfolio’s prior subadvisory agreement with Marsico would be automatically terminated as a result of a change in control.
Board Consideration of Subadvisory Agreement:
The Board of Trustees considered whether the approval of the Subadvisory Agreements with Marsico was in the best interests of each Portfolio and its shareholders. Before approving the Subadvisory Agreements, the Trustees reviewed performance, compliance and organization materials regarding Marsico and received presentations from PI. The Board also received materials relating to the Subadvisory Agreements and had the opportunity to ask questions and request further information in connection with its consideration. In making the determination to retain Marsico as a subadviser, the Trustees, including the Independent Trustees advised by independent legal counsel, considered the following information:
Nature, Quality and Extent of Services. The Board received and considered information regarding the nature and extent of services to be provided to each Portfolio by Marsico under the Subadvisory Agreements, namely, that Marsico would provide day-to-day portfolio management services and comply with all Portfolio policies and applicable rules and regulations. The Board also noted that the nature and extent of services provided to each Portfolio under the prior subadvisory agreement with Marsico were identical in all material respects to those to be provided by Marsico under the Subadvisory Agreements and generally similar to those provided by the other current subadvisers under their subadvisory agreements.
With respect to the quality of services, the Board considered, among other things, the background and experience of Marsico’s portfolio management team, which was not affected by the Transaction. In connection with the recent annual review of advisory agreements, the Board had reviewed the qualifications, backgrounds and responsibilities of the portfolio managers who are responsible for the day-to-day management of each Portfolio, and the Board was provided with information pertaining to Marsico’s organizational structure, senior management, investment operations, and other relevant information pertaining to Marsico. The Board noted that it received a favorable compliance report from the Trust’s Chief Compliance Officer (CCO) as to Marsico.
The Board concluded that it was satisfied with the nature, extent and quality of the investment subadvisory services provided to each Portfolio by Marsico under the prior subadvisory agreement and that there was a reasonable basis on which to conclude that the quality of investment subadvisory services to be provided by Marsico under the Subadvisory Agreements should equal the quality of similar services provided by Marsico under the prior subadvisory agreements.
Performance of Marsico. The Board noted that at its June 2007 meetings, it had reviewed the performance of each of the Portfolios subadvised by Marsico in connection with its annual consideration of the renewal of the Portfolios’ subadvisory agreements. As part of that review, the Board reviewed the performance record of each Portfolio, and at that time reached the following conclusions:
| | • | | With respect to the SP International Growth Portfolio, the Board noted that Marsico had assumed responsibility for a portion of the Portfolio’s assets in late 2006, and that in light of Marsico’s limited performance record, it was reasonable to approve Marsico’s subadvisory agreement. |
| | • | | With respect to the Global Portfolio, the Board noted that Marsico had assumed responsibility for a portion of the Portfolio’s assets in December 2005, and that in light of the limited performance history, it was reasonable to approve Marsico’s subadvisory agreement. |
Investment Subadvisory Fee Rate. The Board also considered, among other things, that the proposed fee rates payable under the Subadvisory Agreements are identical to the fee rates payable under the prior subadvisory agreement. The Board noted that it had recently reviewed the fee rates paid to Marsico in connection with the recent annual review of advisory agreements and determined that the fee rates were reasonable. The Board concluded that Marsico’s proposed subadvisory fee rates under the Subadvisory Agreements were reasonable.
Profitability. In connection with its recent annual review of advisory agreements, the Board considered the profitability of PI and subadvisers affiliated with PI. The Board concluded that the level of profitability of a subadviser not affiliated with PI, such as Marsico, may not be as significant as PI’s profitability given the arm’s length nature of the process by which the subadvisory fee rates were negotiated by PI and the unaffiliated subadvisers, as well as the fact that PI compensates the subadvisers out of its management fee.
Economies of Scale. In connection with its recent annual review of advisory agreements, the Board considered economies of scale. The Board noted that there was no proposed change in fee rates and breakpoints and that it would again review economies of scale at the next annual review of advisory agreements.
Other Benefits to the Subadviser or its Affiliates from Serving as Subadviser. The Board considered potential “fall-out” or ancillary benefits anticipated to be received by Marsico and its affiliates as a result of Marsico’s relationship with the Portfolios. The Board concluded that any potential benefits to be derived by Marsico included its ability to use soft dollar credits, brokerage commissions received by affiliates of Marsico, potential access to additional research resources, larger assets under management and benefits to the reputation, which were consistent with those generally derived by subadvisers to mutual funds.
Annuities are issued by Pruco Life Insurance Company, or in New York, Pruco Life Insurance Company of New Jersey, both located at 213 Washington Street, Newark, NJ 07102-2992, and Prudential Annuities Life Assurance Corporation, located at One Corporate Drive, Shelton, CT, 06484. Variable annuities are distributed by Prudential Annuities Distributors, Inc., also located in Shelton, CT. Prudential Annuities is a business unit of Prudential Financial.
Variable life insurance is issued by The Prudential Insurance Company of America, 751 Broad Street, Newark, NJ 07102-3777, Pruco Life Insurance Company, or in New York, Pruco Life Insurance Company of New Jersey, both located at 213 Washington Street, Newark, NJ 07102-2992. Pruco Life Insurance Company is not licensed to do business in New York. Variable life insurance is offered through Pruco Securities LLC, 751 Broad Street, Newark, NJ 07102-3777.
All are Prudential Financial companies and each is solely responsible for its financial condition and contractual obligations.
Life insurance and annuity contracts contain exclusions, limitations, reductions of benefits and terms for keeping them in force. Your licensed financial professional can provide you with costs and complete details. Contract guarantees are based on the claims-paying ability of the issuing company.
The 2007 Audited Financial Statements of Pruco Life Insurance Company, Pruco Life Insurance Company of New Jersey, and The Prudential Insurance Company of America will be available commencing April 30, 2008. You may call (888) 778-2888 to obtain a free copy of the audited financial statements of the insurance company that issued your contract.
To reduce costs, we now generally send only a single copy of prospectuses and shareholder reports to each household (“householding”) in lieu of sending a copy to each Contract Owner who resides in the household. You should be aware that by calling (877) 778-5008, you can revoke or “opt out” of householding at any time.
Pru, Prudential, Prudential Financial, Rock Solid, “The Rock”, the Rock Logo and the Rock Prudential Logo are registered service marks of The Prudential Insurance Company of America, Newark, NJ, and its affiliates.
The Prudential Insurance Company of America
751 Broad Street
Newark NJ 07102-3777
Presorted
Standard
U.S. Postage
PAID
Prudential
IFS-A114446 PSF-AR-A Ed. 02/2008

ANNUAL REPORT
DECEMBER 31, 2007
The Prudential Series Fund

| n | | SP Aggressive Growth Asset Allocation Portfolio |
| n | | SP AIM Core Equity Portfolio |
| n | | SP Balanced Asset Allocation Portfolio |
| n | | SP Conservative Asset Allocation Portfolio |
| n | | SP Davis Value Portfolio |
| n | | SP Growth Asset Allocation Portfolio |
| n | | SP International Growth Portfolio |
| n | | SP International Value Portfolio |
| n | | SP Large Cap Value Portfolio |
| n | | SP Mid Cap Growth Portfolio |
| n | | SP PIMCO High Yield Portfolio |
| n | | SP PIMCO Total Return Portfolio |
| n | | SP Prudential U.S. Emerging Growth Portfolio |
| n | | SP Small Cap Growth Portfolio |
| n | | SP Small Cap Value Portfolio |
| n | | SP Strategic Partners Focused Growth Portfolio |
| n | | SP T. Rowe Price Large Cap Growth Portfolio |
Please note that inside are Prospectus supplements dated October 26, November 27, and November 29, 2007, and February 4, 2008. These documents are separate from and not a part of the annual report.
IFS-A114669

| | This report is one of several that provide financial information about certain investment choices available on variable life insurance and variable annuity contracts. Based on the variable contract you own or the portfolios you invested in, you may receive additional reports that provide financial information on those investment choices. Please refer to your variable life insurance or variable annuity contract prospectus to determine which portfolios are available to you. |
This report must be preceded or accompanied by the current prospectuses for the Prudential Series Fund portfolios and the applicable variable life or annuity contract. The prospectuses contain information on the investment objectives, risks, and charges and expenses of the portfolios and the contract and should be read carefully.
The contract’s prospectus contains hypothetical performance illustrations that show the effect of various assumptions regarding the cost of insurance protection. You may also obtain a personalized illustration of historical performance that reflects the cost of your contract’s insurance protection.
A description of the Fund’s proxy voting policies and procedures is available, without charge, upon request. Owners of variable annuity contracts should call 888-778-2888 and owners of variable life insurance contracts should call 800-778-2255 to obtain descriptions of the Fund’s proxy voting policies and procedures. The description is also available on the website of the Securities and Exchange Commission (the “Commission”) at www.sec.gov. Information regarding how the Fund voted proxies relating to portfolio securities during the most recent 12-month period ended June 30, is available on the website of the Commission at www.sec.gov and on the Fund’s website.
The Fund files with the Commission a complete listing of portfolio holdings as of its first and third quarter-ends on Form N-Q. Form N-Q is available on the Commission’s website at www.sec.gov or by visiting the Commission’s Public Reference Room. For more information on the Commission’s Public Reference Room, please visit the Commission’s website or call 800-SEC-0330. Form N-Q is also available on the Fund’s website at www.prudential.com or by calling the telephone numbers referenced above.
The Fund’s Statement of Additional Information contains additional information about the Fund’s Trustees and is available without charge upon request by calling 888-778-2888.
This report may include financial information pertaining to certain portfolios that are not available through the variable life insurance policy or variable annuity contract that you have chosen. Please refer to your variable life insurance or variable annuity prospectus to determine which portfolios are available to you.
The Prudential Series Fund
Glossary of Benchmark Definitions
December 31, 2007
Aggressive Growth Asset Allocation Custom Blended Index (GD) consists of Russell 3000 Index (80%), and MSCI EAFE Index (GD) (20%).
Balanced Asset Allocation Custom Blended Index (GD) consists of Russell 3000 Index (48%), Lehman Brothers U.S. Aggregate Bond Index (40%) and MSCI EAFE Index (GD) (12%).
Conservative Asset Allocation Custom Blended Index (GD) consists of Russell 3000 Index (32%), Lehman Brothers U.S. Aggregate Bond Index (60%) and MSCI EAFE Index (GD) (8%).
Growth Asset Allocation Custom Blended Index (GD) consists of consists of Russell 3000 Index (64%), Lehman Brothers U.S. Aggregate Bond Index (20%) and MSCI EAFE Index (GD) (16%).
Lehman Brothers U.S. Aggregate Bond Index is an unmanaged index comprised of more than 5,000 government and corporate bonds.
Lehman Brothers U.S. Corporate High Yield Index is an unmanaged index of fixed-rate, non-investment-grade debt securities with at least one year remaining to maturity. It gives a broad look at how high yield (“junk”) bonds have performed.
Lehman Brothers Government Bond Index is an unmanaged index comprised of securities issued or backed by the U.S. government, its agencies, and instrumentalities with a remaining maturity of 1 to 30 years.
Lehman Brothers Intermediate BB Corporate Bond Index is an unmanaged index comprised of various fixed income securities rated BB.
The Lipper Variable Insurance Products (VIP) Funds Averages are calculated by Lipper Analytical Services, Inc., and reflect the investment return of certain portfolios underlying variable life and annuity products.
| | | | |
High Current Yield Funds Average International Growth Funds Average Intermediate Investment-Grade Debt Average International Value Funds Average Large-Cap Core Funds Average Large-Cap Growth Funds Average | | Large-Cap Value Funds Average Mid-Cap Growth Funds Average Mixed Asset Target Allocation Growth Funds Average Mixed Asset Target Allocation Moderate Funds Avg. Multi-Cap Core Funds Average Multi-Cap Growth Funds Average | | Multi-Cap Value Funds Average Small-Cap Core Funds Average Small-Cap Growth Funds Average Small-Cap Value Funds Average |
Merrill Lynch U.S. High Yield Master II BB-B Rated Index is a broad high yield index including high yield bonds across the maturity spectrum, within the BB-B rated credit quality spectrum, included in the below-investment-grade universe.
MSCI EAFE Index (GD) — The Morgan Stanley Capital International Europe, Australasia, Far East Index is an unmanaged capitalization-weighted index generally accepted as a benchmark for major overseas markets. The GD versions does not reflect the impact of withholding taxes on reinvested dividends. These returns do not include the effect of any investment management expenses. These returns would have been lower if they included the effect of these expenses.
MSCI World Index (GD) — The Morgan Stanley Capital International World Index is an unmanaged capitalization weighted index which includes the equity markets of Australia, Austria, Belgium, Canada, Denmark, Finland, France, Germany, Hong Kong, Ireland, Italy, Japan, Malaysia, Netherlands, New Zealand, Norway, Singapore, Spain, Sweden, Switzerland, United Kingdom and United States. The GD does not reflect the impact of withholding taxes on reinvested dividends. These returns do not include the effect of any investment management expenses. These returns would have been lower if they included the effect of these expenses.
Russell 1000 Growth Index is a market cap-weighted index that measures the performance of those Russell 1000 companies with higher price-to-book ratios and higher forecasted growth values.
Russell 1000 Index is a market cap-weighted index that measures the performance of the 1,000 largest companies in the Russell 3000 Index, which represents approximately 92% of the total market.
Russell 1000 Value Index is a market cap-weighted index that measures the performance of those Russell 1000 companies with lower price-to-book ratios and lower forecasted growth values.
Russell 2000 Growth Index is a market cap-weighted index that measures the performance of those Russell 2000 companies with higher price-to-book ratios and higher forecasted growth values.
Russell 2000 Index measures the performance of the 2,000 smallest companies in the Russell 3000 Index, which represents approximately 8% of the total market capitalization of the Russell 3000 Index.
Russell 2500 Growth Index is a market cap-weighted index that measures the performance of those Russell 2500TM companies with higher price-to-book ratios and higher forecasted growth values.
Russell 2500 Index is a market cap-weighted index that measures the performance of the 2,500 smallest companies in the Russell 3000 Index, which represents approximately 17% of the total market capitalization of the Russell 3000 Index.
Russell 2500 Value Index is a market cap-weighted index that measures the performance of those Russell 2500TM companies with lower price-to-book ratios and lower forecasted growth values.
Russell 3000 Index Measures the performance of the 3,000 largest U.S. companies based on total market capitalization, which represents approximately 98% of the investable U.S. equity market.
Russell Midcap Growth Index is a market cap-weighted index that measures the performance of those Russell MidCap companies with higher price-to-book ratios and higher forecasted growth values.
Russell Midcap Index is a market cap-weighted index that measures the performance of the 800 smallest companies in the Russell 1000 Index, which represents approximately 25% of the total market.
S&P 500 Index is an unmanaged, market value-weighted index of 500 stocks generally representative of the broad stock market.
S&P MidCap 400 Index is a widely accepted, unmanaged total return index of 400 domestic stocks measuring the performance of the midsize company segment of the U.S. stock market.
S&P SmallCap 600 Index is an unmanaged index representing the aggregate market value of the common equity of 600 small-company stocks.
This page may include certain benchmarks not applicable to the portfolios available in this particular report. Investors cannot invest directly in a market index or average. These returns are net of investment fees and fund expenses, but not product charges.
The Prudential Series Fund
Annual Report
December 31, 2007
Table of Contents
| n | | LETTER TO CONTRACT OWNERS |
| n | | FEES AND EXPENSES TABLE |
A1 Schedule of Investments and Financial Statements
B1 Notes to Financial Statements
C1 Financial Highlights
D1 Report of Independent Registered Accounting Firm
E1 Management of the Prudential Series Fund
| n | | APPROVAL OF ADVISORY AGREEMENTS |
This report may include financial information pertaining to certain portfolios that are not available through the variable life insurance policy or variable annuity contract that you have chosen. Please refer to your variable life insurance or variable annuity prospectus to determine which portfolios are available to you.
The Prudential Series Fund
Letter to Contract Owners
Annual Report
December 31, 2007
At Prudential, it is our goal to help our clients achieve and maintain financial success. We hope you find the Prudential Series Fund annual report both informative and useful.
We would also like to remind you about the benefits of diversifying your investment portfolio. In today’s volatile markets, diversification is key to protecting your investments. It helps position your investments when asset classes rotate in and out of favor, and is the best way to balance risk and return. In addition, diversification can help you meet your long-term investment goals although it does not assure against loss in declining markets.
Take the first step and contact your financial professional for help in creating a diversified investment portfolio. A comprehensive mix of assets that is evaluated periodically over time can help you maintain focus on your financial objectives.
Thank you for selecting our products. We value the opportunity to manage your investments as you plan for the future.
Sincerely,
David R. Odenath, Jr.
President,
The Prudential Series Fund | January 31, 2008 |
PRESIDENT
DAVID R. ODENATH, JR.
The Prudential Series Fund, SP Aggressive Growth Asset Allocation Portfolio
Advised by: Prudential Investments LLC
December 31, 2007
Investment Manager’s Report
Performance Summary - As of December 31, 2007
Average Annual Total Return Percentages
| | | | | | | | | |
| | | 1-Year | | | 5-Year | | | Since
Inception | |
SP Aggressive Growth Asset Allocation Portfolio | | 9.20 | % | | 16.00 | % | | 3.15 | % |
S&P 500 Index | | 5.49 | | | 12.82 | | | 2.03 | |
Aggressive Growth AA Custom Blended Index (GD) | | 6.44 | | | 15.31 | | | 3.65 | |
Lipper (VIP) Multi Cap Core Funds Avg. | | 6.22 | | | 13.76 | | | 3.94 | |
Portfolio inception: 9/22/2000.
$10,000 INVESTED SINCE INCEPTION
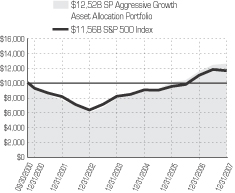
Past performance does not guarantee future returns. Portfolio performance is net of investment fees and fund expenses, but not product charges, which, if included, would significantly lower the performance quoted. The investment return and principal value of an investment will fluctuate, so that an investor’s shares, when redeemed, may be worth more or less than their original cost. Current performance may be lower or higher than the past performance data quoted.
Unless noted otherwise, Lipper Average and Index returns reflect performance beginning the closest month-end date to the Portfolio’s inception. Performance figures may reflect fee waivers and/or expense reimbursements. In the absence of such fee waivers and/or expense reimbursements, total returns would be lower.
For the year ended December 31, 2007, the SP Aggressive Growth Asset Allocation Portfolio had a total return that was above its Custom Index benchmark.
The Portfolio is the most aggressive of the four SP Asset Allocation Portfolios. It invests in shares of other Portfolios of the Prudential Series Fund and the Advanced Series Trust and attempts to outperform a blended benchmark consisting of 80% Russell 3000 Index (a measure of the broad U.S. equity market) and 20% MSCI EAFE Index (a measure of the broad developed-country international equity market). The Portfolio’s performance relative to this target is determined by its overweights and underweights compared to the target in different asset classes and by the performance of the Portfolios selected to invest in these asset classes.
From an asset allocation perspective, the Portfolio benefited from an overweight in non-U.S. equities relative to the benchmark. The MSCI EAFE Index outperformed the domestic equity market for the year. Developed countries around the world excluding Japan, Ireland, and Sweden finished in the black. Returns were positively impacted by a weakening U.S. dollar, which makes returns generated in foreign currencies more attractive when translated into greenbacks. The Portfolio’s domestic equity exposure emphasized growth over value stocks and this helped relative performance. Within the Russell family of indexes the growth style outperformed its respective value indexes across all market capitalizations by a double-digit spread. Value indexes were hurt by heavy exposure to financial stocks, which were beaten down in the wake of the subprime mortgage problems and the associated credit crunch that hit global markets hard in August and continued to plague world markets for the remainder of the year. The Portfolio’s emphasis on large capitalization versus small capitalization stocks also boosted relative performance. Large cap stocks benefited after risk-averse investors eschewed small cap stocks for larger companies with solid earnings growth and typically a more global footprint. An allocation to the PSF Natural Resources Portfolio was a positive as stocks within the natural resources sector benefited as the prices of energy and other commodities surged.
The performance of the individual constituents within the Portfolio was generally strong and seven out of the nine constituents matched or outperformed their respective style benchmarks. The largest contributors to relative returns were the SP International Growth Portfolio, SP International Value Portfolio, and the AST Marsico Capital Growth Portfolios.
Prudential Investments LLC (PI), an indirect, wholly owned subsidiary of Prudential Financial, Inc., serves as the investment manager for the Fund.
For average and index definitions, refer to the Glossary of Benchmark Definitions page. Investors cannot invest directly in a market index or average. For a complete list of holdings, refer to the Schedule of Investments section of this report.
The Prudential Series Fund, SP AIM Core Equity Portfolio
Subadvised by: A I M Capital Management, Inc.
December 31, 2007
Investment Manager’s Report
Performance Summary - As of December 31, 2007
Average Annual Total Return Percentages
| | | | | | | | | |
| | | 1-Year | | | 5-Year | | | Since
Inception | |
SP AIM Core Equity Portfolio | | 7.82 | % | | 11.99 | % | | -0.37 | % |
S&P 500 Index | | 5.49 | | | 12.82 | | | 2.03 | |
Russell 1000® Index | | 5.77 | | | 13.43 | | | 2.19 | |
Lipper (VIP) Large Cap Core Avg. | | 5.78 | | | 12.19 | | | 1.83 | |
Portfolio inception: 9/22/2000.
$10,000 INVESTED SINCE INCEPTION
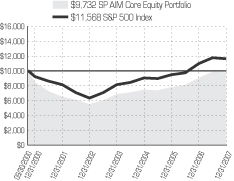
Past performance does not guarantee future returns. Portfolio performance is net of investment fees and fund expenses, but not product charges, which, if included, would significantly lower the performance quoted. The investment return and principal value of an investment will fluctuate, so that an investor’s shares, when redeemed, may be worth more or less than their original cost. Current performance may be lower or higher than the past performance data quoted.
Unless noted otherwise, Lipper Average and Index returns reflect performance beginning the closest month-end date to the Portfolio’s inception. The Russell 1000® Index is a trademark/service mark of the Frank Russell Company. Russell® is a trademark of the Frank Russell Company. Performance figures may reflect fee waivers and/or expense reimbursements. In the absence of such fee waivers and/or expense reimbursements, total returns would be lower.
For the year ended December 31, 2007, the SP AIM Core Equity Portfolio had a total return that was above its benchmark index and the average of its peer group.
The Portfolio’s manager prefers securities of companies that may have short-term firm-specific problems that have depressed their share price. AIM employs a bottom-up process in which management actively biases the Portfolio to sectors that offer compelling opportunities. Significant sector biases can be expected with the strategy, as exemplified by its underweight in financials. However, unfavorable exposures to these sectors can have a material impact on relative performance.
For the year, sector allocations helped the Portfolio’s relative performance. While the financial sector took a beating in the second half of the year due to the ripple effects of the mortgage crisis and the ensuing credit crunch, the Portfolio’s considerably large underexposure to financials benefited relative performance. The Portfolio’s overexposure to the thriving energy sector helped fuel positive returns as well. An underexposure to the consumer cyclicals sector and an overexposure to industrials further enhanced results. An underexposure to the strong performing utilities sector turned out to be the most significant detractor from relative performance.
The Portfolio’s underexposure to companies with high levels of debt turned out to be the most significant contribution from the perspective of risk factors. An underexposure to high yielding dividend stocks proved positive. The Portfolio’s holdings in companies with lower betas (a low beta means the stock is less volatile than the market) also helped. Conversely, an underexposure to momentum stocks (stocks with relative price strength) detracted for the year.
Stock selection in the industrials, healthcare and consumer non-cyclicals sectors detracted from relative performance. Conversely, assets held in the financials, consumer cyclicals and transportation sectors outperformed, but the overall impact of stock selection on relative performance was unfavorable for the year.
Prudential Investments LLC (PI), an indirect, wholly owned subsidiary of Prudential Financial, Inc., serves as the investment manager for the Fund.
For average and index definitions, refer to the Glossary of Benchmark Definitions page. Investors cannot invest directly in a market index or average. For a complete list of holdings, refer to the Schedule of Investments section of this report.
The Prudential Series Fund, SP Balanced Asset Allocation Portfolio
Advised by: Prudential Investments LLC
December 31, 2007
Investment Manager’s Report
Performance Summary - As of December 31, 2007
Average Annual Total Return Percentages
| | | | | | | | | |
| | | 1-Year | | | 5-Year | | | Since
Inception | |
SP Balanced Asset Allocation Portfolio | | 9.35 | % | | 12.20 | % | | 5.29 | % |
S&P 500 Index | | 5.49 | | | 12.82 | | | 2.03 | |
Balanced AA Custom Blended Index (GD) | | 6.79 | | | 10.96 | | | 4.95 | |
Lipper (VIP) Mixed Asset Target Allocation Growth Funds Avg. | | 6.78 | | | 10.68 | | | 4.23 | |
Portfolio inception: 9/22/2000.
$10,000 INVESTED SINCE INCEPTION
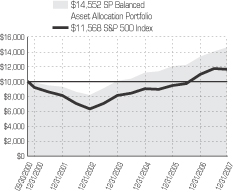
Past performance does not guarantee future returns. Portfolio performance is net of investment fees and fund expenses, but not product charges, which, if included, would significantly lower the performance quoted. The investment return and principal value of an investment will fluctuate, so that an investor’s shares, when redeemed, may be worth more or less than their original cost. Current performance may be lower or higher than the past performance data quoted.
Unless noted otherwise, Lipper Average and Index returns reflect performance beginning the closest month-end date to the Portfolio’s inception. Performance figures may reflect fee waivers and/or expense reimbursements. In the absence of such fee waivers and/or expense reimbursements, total returns would be lower.
For the year ended December 31, 2007, the SP Balanced Asset Allocation Portfolio had a total return that was above its Custom Index benchmark.
The Portfolio is one of the four SP Asset Allocation Portfolios. It invests in shares of other Portfolios of the Prudential Series Fund and the Advanced Series Trust and attempts to outperform a blended benchmark consisting of 48% Russell 3000 Index (a measure of the broad U.S. equity market), 12% MSCI EAFE Index (a measure of the broad developed-country international equity market), and 40% Lehman Aggregate Bond (a measure of the US investment grade bond market). The Portfolio’s performance relative to this target is determined by its overweights and underweights compared to the target in different asset classes and by the performance of the Portfolios selected to invest in these asset classes.
The Russell 3000 lagged the Lehman Aggregate Bond Index and the Portfolio’s underweight to bonds versus equities detracted from relative performance. After housing market problems escalated into a full-fledged credit crunch and concerns of a possible recession mounted, the Federal Reserve lowered key interest rates three times between September and December. Investors fled to higher quality bonds, particularly Treasuries. The interest rate cuts and flight to quality contributed to investment grade bond performance and for the year investment grade outperformed high yield bonds. Within the Portfolio’s fixed income allocation, non-benchmark exposures to cash and high yield assets detracted from performance as both underperformed investment grade bonds. Some equity exposure contributed positively to relative performance. An overweight to non-U.S. equities was rewarded as the MSCI EAFE outperformed the Russell 3000 Index, aided by the decline of the U.S. dollar against major currencies. Within the Russell family of indexes the growth style outperformed its respective value indexes across all market capitalizations by a double-digit spread and large capitalization stocks outperformed small caps. The Portfolio’s domestic equity exposure benefited from an emphasis on growth versus value stocks and large-cap versus small-cap stocks. A modest allocation to the PSF Natural Resources Portfolio was also a positive. Stocks within the natural resources sector benefited after the prices of energy and other commodity prices advanced.
The performance of the individual constituents within the Portfolio was generally strong and nine out of the eleven constituents matched or outperformed their respective style benchmarks. The largest contributors to relative returns were SP PIMCO Total Return, SP International Growth Portfolio, SP International Value Portfolio, and the AST Marsico Capital Growth Portfolios.
Prudential Investments LLC (PI), an indirect, wholly owned subsidiary of Prudential Financial, Inc., serves as the investment manager for the Fund.
For average and index definitions, refer to the Glossary of Benchmark Definitions page. Investors cannot invest directly in a market index or average. For a complete list of holdings, refer to the Schedule of Investments section of this report.
The Prudential Series Fund, SP Conservative Asset Allocation Portfolio
Advised by: Prudential Investments LLC
December 31, 2007
Investment Manager’s Report
Performance Summary - As of December 31, 2007
Average Annual Total Return Percentages
| | | | | | | | | |
| | | 1-Year | | | 5-Year | | | Since
Inception | |
SP Conservative Asset Allocation Portfolio | | 9.39 | % | | 9.81 | % | | 5.85 | % |
S&P 500 Index | | 5.49 | | | 12.82 | | | 2.03 | |
Conservative AA Custom Blended Index (GD) | | 6.89 | | | 8.79 | | | 5.46 | |
Lipper (VIP) Mixed Asset Target Allocation Moderate Funds Avg. | | 6.14 | | | 9.78 | | | 4.65 | |
Portfolio inception: 9/22/2000.
$10,000 INVESTED SINCE INCEPTION
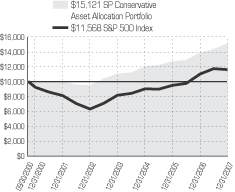
Past performance does not guarantee future returns. Portfolio performance is net of investment fees and fund expenses, but not product charges, which, if included, would significantly lower the performance quoted. The investment return and principal value of an investment will fluctuate, so that an investor’s shares, when redeemed, may be worth more or less than their original cost. Current performance may be lower or higher than the past performance data quoted.
Unless noted otherwise, Lipper Average and Index returns reflect performance beginning the closest month-end date to the Portfolio’s inception. Performance figures may reflect fee waivers and/or expense reimbursements. In the absence of such fee waivers and/or expense reimbursements, total returns would be lower.
For the year ended December 31, 2007, the SP Conservative Asset Allocation Portfolio had a total return that was above its Custom Index benchmark.
The Portfolio is the most conservative of the four SP Asset Allocation Portfolios. It invests in shares of other Portfolios of the Prudential Series Fund and the Advanced Series Trust and attempts to outperform a blended benchmark consisting of 32% Russell 3000 Index (a measure of the broad U.S. equity market), 8% MSCI EAFE Index (a measure of the broad developed-country international equity market), and 60% Lehman Aggregate Bond (a measure of the US investment grade bond market). The Portfolio’s performance relative to this target is determined by its overweights and underweights compared to the target in different asset classes and by the performance of the Portfolios selected to invest in these asset classes.
The Russell 3000 lagged the Lehman Aggregate Bond Index and the Portfolio’s underweight to bonds versus equities detracted from relative performance. After housing market problems escalated into a full-fledged credit crunch and concerns of a possible recession mounted, the Federal Reserve lowered key interest rates three times between September and December. Investors fled to higher quality bonds, particularly Treasuries. The interest rate cuts and flight to quality contributed to investment grade bond performance and for the year investment grade outperformed high yield bonds. Within the Portfolio’s fixed income allocation, non-benchmark exposures to cash and high yield assets detracted from performance as both underperformed investment grade bonds. Some equity exposure contributed positively to relative performance. An overweight to non-U.S. equities was rewarded as the MSCI EAFE outperformed the Russell 3000 Index, aided by the decline of the U.S. dollar against major currencies. Within the Russell family of indexes the growth style outperformed its respective value indexes across all market capitalizations by a double-digit spread and large capitalization stocks outperformed small caps. The Portfolio’s domestic equity exposure benefited from an emphasis on growth versus value stocks and large-cap versus small-cap stocks. A modest allocation to the PSF Natural Resources Portfolio was also a positive. Stocks within the natural resources sector benefited after the prices of energy and other commodity prices advanced.
The performance of the individual constituents within the Portfolio was generally strong and nine out of the eleven constituents matched or outperformed their respective style benchmarks. The largest contributors to relative returns were SP PIMCO Total Return, SP International Growth Portfolio, SP International Value Portfolio, and the AST Marsico Capital Growth Portfolio.
Prudential Investments LLC (PI), an indirect, wholly owned subsidiary of Prudential Financial, Inc., serves as the investment manager for the Fund.
For average and index definitions, refer to the Glossary of Benchmark Definitions page. Investors cannot invest directly in a market index or average. For a complete list of holdings, refer to the Schedule of Investments section of this report.
The Prudential Series Fund, SP Davis Value Portfolio
Subadvised by: Davis Advisors
December 31, 2007
Investment Manager’s Report
Performance Summary - As of December 31, 2007
Average Annual Total Return Percentages
| | | | | | | | | |
| | | 1-Year | | | 5-Year | | | Since
Inception | |
SP Davis Value Portfolio | | 4.58 | % | | 13.92 | % | | 5.46 | % |
S&P 500 Index | | 5.49 | | | 12.82 | | | 2.03 | |
Russell 1000® Value Index | | -0.17 | | | 14.63 | | | 7.02 | |
Lipper (VIP) Multi-Cap Value Funds Avg. | | -0.43 | | | 13.21 | | | 6.52 | |
Lipper (VIP) Large-Cap Value Funds Avg. | | 1.69 | | | 12.95 | | | 6.02 | |
Portfolio inception: 9/22/2000.
$10,000 INVESTED SINCE INCEPTION
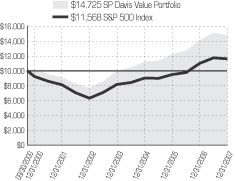
Past performance does not guarantee future returns. Portfolio performance is net of investment fees and fund expenses, but not product charges, which, if included, would significantly lower the performance quoted. The investment return and principal value of an investment will fluctuate, so that an investor’s shares, when redeemed, may be worth more or less than their original cost. Current performance may be lower or higher than the past performance data quoted.
Unless noted otherwise, Lipper Average and Index returns reflect performance beginning the closest month-end date to the Portfolio’s inception. Although Lipper classifies the Portfolio within the Multi-Cap Value Funds Average, the returns for the Large-Cap Value Funds Average are also shown, because the management of the portfolios included in the Large-Cap Value Funds Average is more consistent with the management of the Portfolio. The Russell 1000® Index is a trademark/service mark of the Frank Russell Company. Russell® is a trademark of the Frank Russell Company. Performance figures may reflect fee waivers and/or expense reimbursements. In the absence of such fee waivers and/or expense reimbursements, total returns would be lower.
For the year ended December 31, 2007, the SP Davis Value Portfolio had a total return that was above the Russell 1000 Value Index, its benchmark and was above the average of its peer group.
The Portfolio manager, Davis, uses top-down analysis to select industries that it believes are likely to benefit from economic developments and a bottom-up stock selection process to identify good quality firms that can sustain their growth over full market cycles, but are currently out of favor. It looks at both a company’s intrinsic value and its value relative to similar companies. This approach gives it a distinct profile with greater representation in sectors, such as technology, that are normally considered growth sectors.
Stocks held during the year benefited the Portfolio’s relative performance. Holdings in the energy, consumer cyclicals, technology, and financials sectors contributed positively. Conversely, assets held in the consumer services, consumer non-cyclicals, and basic materials sectors detracted from relative results.
Overall, sector allocations detracted for the year. An overexposure to the consumer cyclicals sector, in addition to underweight positions in the utilities, telecom, and basic materials sectors were the largest detractors. Overweight positions in the consumer non-cyclicals and energy sectors contributed positively, as did an underexposure to the financials sector.
Risk exposures also enhanced relative performance. Davis’ underexposure to dividend yielding stocks helped performance. Additionally, the manager benefited from holding stocks in companies that held lower levels of debt during the year. Underexposure to heavily traded stocks also had a positive effect on relative performance. Relative to the Portfolio’s benchmark, an underexposure to value stocks also benefited, as growth outperformed value by a wide margin for the year.
Prudential Investments LLC (PI), an indirect, wholly owned subsidiary of Prudential Financial, Inc., serves as the investment manager for the Fund.
For average and index definitions, refer to the Glossary of Benchmark Definitions page. Investors cannot invest directly in a market index or average. For a complete list of holdings, refer to the Schedule of Investments section of this report.
The Prudential Series Fund, SP Growth Asset Allocation Portfolio
Advised by: Prudential Investments LLC
December 31, 2007
Investment Manager’s Report
Performance Summary - As of December 31, 2007
Average Annual Total Return Percentages
| | | | | | | | | |
| | | 1-Year | | | 5-Year | | | Since
Inception | |
SP Growth Asset Allocation Portfolio | | 9.23 | % | | 14.33 | % | | 4.33 | % |
S&P 500 Index | | 5.49 | | | 12.82 | | | 2.03 | |
Growth AA Custom Blended Index (GD) | | 6.64 | | | 13.14 | | | 4.35 | |
Lipper (VIP) Multi-Cap Core Avg. | | 6.22 | | | 13.76 | | | 3.94 | |
Portfolio inception: 9/22/2000.
$10,000 INVESTED SINCE INCEPTION
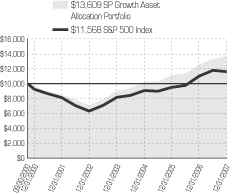
Past performance does not guarantee future returns. Portfolio performance is net of investment fees and fund expenses, but not product charges, which, if included, would significantly lower the performance quoted. The investment return and principal value of an investment will fluctuate, so that an investor’s shares, when redeemed, may be worth more or less than their original cost. Current performance may be lower or higher than the past performance data quoted.
Unless noted otherwise, Lipper Average and Index returns reflect performance beginning the closest month-end date to the Portfolio’s inception. Performance figures may reflect fee waivers and/or expense reimbursements. In the absence of such fee waivers and/or expense reimbursements, total returns would be lower.
For the year ended December 31, 2007, the SP Growth Asset Allocation Portfolio had a total return that was above its Custom Index benchmark.
The Portfolio is one of the four SP Asset Allocation Portfolios. It invests in shares of other Portfolios of the Prudential Series Fund and the Advanced Series Trust and attempts to outperform a blended benchmark consisting of 64% Russell 3000 Index (a measure of the broad U.S. equity market), 16% MSCI EAFE Index (a measure of the broad developed-country international equity market), and 20% Lehman Aggregate Bond (a measure of the US investment grade bond market). The Portfolio’s performance relative to this target is determined by its overweights and underweights compared to the target in different asset classes and by the performance of the Portfolios selected to invest in these asset classes.
The Russell 3000 lagged the Lehman Aggregate Bond Index and the Portfolio’s underweight to bonds versus equities detracted from relative performance. After housing market problems escalated into a full-fledged credit crunch and concerns of a possible recession mounted, the Federal Reserve lowered key interest rates three times between September and December. Investors fled to higher quality bonds, particularly Treasuries. The interest rate cuts and flight to quality contributed to investment grade bond performance and for the year investment grade outperformed high yield bonds. Within the Portfolio’s fixed income allocation, non-benchmark exposures to cash and high yield assets detracted from performance as both underperformed investment grade bonds. Some equity exposure contributed positively to relative performance. An overweight to non-U.S. equities was rewarded as the MSCI EAFE outperformed the Russell 3000 Index, aided by the decline of the U.S. dollar against major currencies. Within the Russell family of indexes the growth style outperformed its respective value indexes across all market capitalizations by a double-digit spread and large capitalization stocks outperformed small caps. The Portfolio’s domestic equity exposure benefited from an emphasis on growth versus value stocks and large-cap versus small-cap stocks. A modest allocation to the PSF Natural Resources Portfolio was also a positive. Stocks within the natural resources sector benefited after the prices of energy and other commodity prices advanced.
The performance of the individual constituents within the Portfolio was generally strong and nine out of the eleven constituents matched or outperformed their respective style benchmarks. The largest contributors to relative returns were SP PIMCO Total Return, SP International Growth Portfolio, SP International Value Portfolio, and the AST Marsico Capital Growth Portfolios.
Prudential Investments LLC (PI), an indirect, wholly owned subsidiary of Prudential Financial, Inc., serves as the investment manager for the Fund.
For average and index definitions, refer to the Glossary of Benchmark Definitions page. Investors cannot invest directly in a market index or average. For a complete list of holdings, refer to the Schedule of Investments section of this report.
The Prudential Series Fund, SP International Growth Portfolio
Subadvised by: William Blair & Company LLC, Marsico Capital Management
December 31, 2007
Investment Manager’s Report
Performance Summary - As of December 31, 2007
Average Annual Total Return Percentages
| | | | | | | | | |
| | | 1-Year | | | 5-Year | | | Since
Inception | |
SP International Growth Portfolio: Class I | | 19.55 | % | | 22.33 | % | | 2.07 | % |
SP International Growth Portfolio: Class II | | 19.12 | | | 21.83 | | | 1.96 | |
MSCI EAFE® Index (GD) | | 11.63 | | | 22.08 | | | 8.07 | |
Lipper (VIP) International Growth Funds Avg. | | 13.95 | | | 22.24 | | | 5.91 | |
Portfolio (Class I) inception: 9/22/2000. Portfolio (Class II) inception: 10/4/2000.
$10,000 INVESTED SINCE INCEPTION1
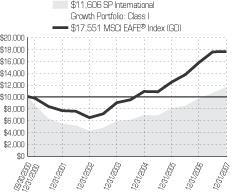
Past performance does not guarantee future returns. Portfolio performance is net of investment fees and fund expenses, but not product charges, which, if included, would significantly lower the performance quoted. The investment return and principal value of an investment will fluctuate, so that an investor’s shares, when redeemed, may be worth more or less than their original cost. Current performance may be lower or higher than the past performance data quoted.
Unless noted otherwise, Lipper Average and Index returns reflect performance beginning the closest month-end date to the Portfolio’s inception (Class I). Performance figures may reflect fee waivers and/or expense reimbursements. In the absence of such fee waivers and/or expense reimbursements, total returns would be lower.
For the year ended December 31, 2007, the SP International Growth Portfolio had a total return that was well above its benchmark indexes and the average of its peer group.
This traditional growth portfolio is currently made up of two portions, which are managed by William Blair and Marsico Capital Management. Blair manages approximately 70% of the Portfolio’s assets. Blair’s investment policies focus on a long-term approach to investing in quality growth companies that are well understood. Marsico employs an investment process that combines top-down macroeconomic analysis with bottom-up research when selecting international equities for the Portfolio.
The largest beneficial effect on the Portfolio involved its exposure to risk factors. During the second half of the year, the market took a turn that favored firms with large capitalizations. This trend picked up steam when a financial crisis tied to risky mortgages sent investors fleeing to shares of companies with consistent earnings growth. Subsequently, an underexposure to value-style equities, specifically stocks with lower price-to-book ratios (P/B), and an overexposure to stocks with price momentum (companies experiencing recent price strength) drove the Portfolio’s performance, as both managers held an overexposure to momentum stocks. Also, companies with lower P/B ratios underperformed those with higher P/B ratios.
Allocations to single countries played a positive role in enhancing returns. Specifically, the Portfolio’s positions in Canada and emerging markets countries such as China and Brazil (which are not in the MSCI EAFE Index) significantly helped performance. Also, an underweight position to Japan and an overweight position to Hong Kong proved positive for the year. While the Portfolio’s strategy primarily focuses on investments in developed economies (EAFE-based), the managers can invest in emerging markets, if potential opportunities arise.
Overall, the Portfolio gained from stock selection in all sectors, but the energy, financials and telecommunication services sectors contributed the most significant gains.
Prudential Investments LLC (PI), an indirect, wholly owned subsidiary of Prudential Financial, Inc., serves as the investment manager for the Fund.
| 1 | The graph is based on the performance of Class I shares. Performance of Class II shares will be lower due to differences in the fee structure. Class II shares have associated 12b-1 and administrative fees at an annual rate of 0.25% and 0.15% respectively of the average daily net assets of the Class II shares. |
For average and index definitions, refer to the Glossary of Benchmark Definitions page. Investors cannot invest directly in a market index or average. For a complete list of holdings, refer to the Schedule of Investments section of this report.
The Prudential Series Fund, SP International Value Portfolio
Subadvised by: LSV Asset Management, Thornburg Investment Management Inc.
December 31, 2007
Investment Manager’s Report
Performance Summary - As of December 31, 2007
Average Annual Total Return Percentages
| | | | | | | | | |
| | | 1-Year | | | 5-Year | | | Since
Inception | |
SP International Value Portfolio | | 18.08 | % | | 20.66 | % | | 6.36 | % |
MSCI EAFE® Index (GD) | | 11.63 | | | 22.08 | | | 8.07 | |
Lipper (VIP) International Value Funds Avg. | | 9.45 | | | 21.59 | | | 8.99 | |
Portfolio inception: 9/22/2000.
$10,000 INVESTED SINCE INCEPTION
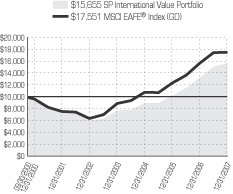
Past performance does not guarantee future returns. Portfolio performance is net of investment fees and fund expenses, but not product charges, which, if included, would significantly lower the performance quoted. The investment return and principal value of an investment will fluctuate, so that an investor’s shares, when redeemed, may be worth more or less than their original cost. Current performance may be lower or higher than the past performance data quoted.
Unless noted otherwise, Lipper Average and Index returns reflect performance beginning the closest month-end date to the Portfolio’s inception. Performance figures may reflect fee waivers and/or expense reimbursements. In the absence of such fee waivers and/or expense reimbursements, total returns would be lower.
For the year ended December 31, 2007, the SP International Value Portfolio had a total return that was above its benchmark index and the average of its peer group.
LSV Asset Management and Thornburg Investment Management subadvised the Portfolio. LSV is a deep value manager that deploys a quantitative investment strategy based on research into value investing and studies of investor behavior. Thornburg is a relative value manager that has the flexibility to invest in companies typically held by both “value” and “growth” managers. Also, we would note that the strategy’s exposure to emerging markets stocks has generally been higher than that of many other international equity managers.
During the second half of the year, the market took a turn that favored firms with large capitalizations. This trend picked up steam when a financial crisis tied to risky mortgages sent investors fleeing to shares of companies with consistent earnings growth. Within the MSCI EAFE Index (the Index), value stocks underperformed growth stocks by the widest margin since the EAFE Value and Growth indices were created. With an overweight to companies with growth attributes, a larger market cap bias versus the benchmark, and holdings in strong performing emerging markets, the Thornburg portion of the Portfolio significantly outperformed the Index. The LSV portion posted a positive return, but ended the year lagging the Index. As the market shifted away from traditional value investments, LSV faced a more difficult challenge, since it typically invests more heavily in companies with smaller market capitalizations that have lower valuation multiples than companies in the Index.
Overall, the Portfolio benefited from exposure to non-benchmark countries, such as China, Canada, Israel, and Mexico. Also helping performance was an underweight position in the poor performing Japanese market and an overweight position in the strong performing Hong Kong market.
Specific sector allocations contributed positively but marginally to performance relative to the Index. The Portfolio benefited from an underweight position in financials and from overweight positions in the telecommunications and materials sectors. Detracting slightly from performance were underweight positions in industrials and a small overweight in healthcare.
Stock selection in the materials, information technology, and financials sectors contributed positively to the Portfolio’s performance relative to the benchmark.
From a country perspective, the Portfolio benefited the most from holdings in Japan, where positions handily exceeded the return of the Japanese market. Additionally, holdings in Germany and Hong Kong helped performance, while positions in companies in Switzerland and the United Kingdom detracted from relative performance.
Prudential Investments LLC (PI), an indirect, wholly owned subsidiary of Prudential Financial, Inc., serves as the investment manager for the Fund.
For average and index definitions, refer to the Glossary of Benchmark Definitions page. Investors cannot invest directly in a market index or average. For a complete list of holdings, refer to the Schedule of Investments section of this report.
The Prudential Series Fund, SP Large Cap Value Portfolio
Subadvised by: JP Morgan Asset Management, Hotchkis and Wiley Capital Management LLC, Dremen Value Management LLC
December 31, 2007
Investment Manager’s Report
Performance Summary - As of December 31, 2007
Average Annual Total Return Percentages
| | | | | | | | | |
| | | 1-Year | | | 5-Year | | | Since
Inception | |
SP Large Cap Value Portfolio | | -2.83 | % | | 12.88 | % | | 5.41 | % |
Russell 1000® Index | | 5.77 | | | 13.43 | | | 2.19 | |
Russell 1000® Value Index | | -0.17 | | | 14.63 | | | 7.02 | |
Lipper (VIP) Large-Cap Value Funds Avg. | | 1.69 | | | 12.95 | | | 6.02 | |
Lipper (VIP) Multi-Cap Value Funds Avg. | | -0.43 | | | 13.21 | | | 6.52 | |
Portfolio inception: 9/22/2000.
$10,000 INVESTED SINCE INCEPTION
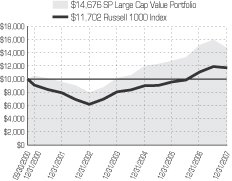
Past performance does not guarantee future returns. Portfolio performance is net of investment fees and fund expenses, but not product charges, which, if included, would significantly lower the performance quoted. The investment return and principal value of an investment will fluctuate, so that an investor’s shares, when redeemed, may be worth more or less than their original cost. Current performance may be lower or higher than the past performance data quoted.
Although Lipper classifies the Portfolio within the Multi-Cap Value Funds Average, the returns for the Large-Cap Value Funds Average are also shown because the management of the portfolios included in the Large-Cap Value Average is more consistent with the management of the Portfolio. Unless noted otherwise, Lipper Average and Index returns reflect performance beginning the closest month-end date to the Portfolio’s inception. The Russell 1000® and 1000® Value Indexes are trademarks of the Frank Russell Company. Russell® is a trademark of the Frank Russell Company. Performance figures may reflect fee waivers and/or expense reimbursements. In the absence of such fee waivers and/or expense reimbursements, total returns would be lower.
For the year ended December 31, 2007, the SP Large-Cap Value Portfolio had a total return below its style-specific benchmark, the Russell 1000 Value Index, a broad measure of large capitalization value stocks.
The Portfolio is managed by three subadvisers whose investment strategies are blended together to form a core plus investment objective. JP Morgan Asset Management, Dreman Value Management, and Hotchkis and Wiley Capital Management, are responsible for 50%, 30%, and 20% of the Portfolio’s total assets, respectively. JP Morgan follows a relative value or “growthier” investment style, Dreman follows a deep value approach; and Hotchkis and Wiley adheres to a value-oriented style. The Portfolio is expected to generate strong relative returns in markets that favor traditional value fundamentals including low price-to-earnings ratios (P/E) and high dividend yields. However, the Portfolio is expected to trail its benchmark in market environments when investors are less price-sensitive and more interested in companies with the greatest growth prospects.
In a sharp reversal from the previous year, growth stocks outperformed value stocks in 2007. Within the Russell family of indexes, after seven years of leadership, value style indexes underperformed their respective growth style indexes across all market capitalizations by a significant double-digit spread. And within the large cap universe measured by the Russell 1000 Index, value stocks lagged growth stocks by almost 12 percentage points. The relatively poor performance of financial services stocks, which represent a large portion of each value index, was partly responsible for the reversal. The housing downturn and ensuing credit crisis disproportionately affected the near-term business prospects of bank stocks.
The Portfolio’s style attributes in aggregate had a negligible effect on relative performance. Underperformance was mostly attributable to security selection by all three subadvisers, particularly in the financials, energy, basic materials, commercial services and industrial sectors. The savings-and-loan behemoth, Washington Mutual (1.3%), home-builder Lennar Corporation (0.4%), and bond insurers Ambac Financial Group (0.2%) and MBIA (0.2%) were among the greatest detractors from return.
Security and industry positioning were modest performance headwinds and were attributable to the Dreman and JP Morgan subadvisers. The Portfolio’s underweight position in the banking industry benefited relative return. Overweight positions in the tobacco, energy reserves, and computer software industries also helped performance. However, the positive excess return was completely offset by the Portfolio’s overweights in the specialty retail, financial services, thrifts, and construction and real property industries.
The Portfolio’s conservative risk profile, mainly attributable to the Dreman segment, had a positive impact on relative performance. A restrained sensitivity to market movements combined with a two percent average cash position propped up performance.
Prudential Investments LLC (PI), an indirect, wholly owned subsidiary of Prudential Financial, Inc., serves as the investment manager for the Fund.
For average and index definitions, refer to the Glossary of Benchmark Definitions page. Investors cannot invest directly in a market index or average. For a complete list of holdings, refer to the Schedule of Investments section of this report.
The Prudential Series Fund, SP Mid Cap Growth Portfolio
Subadvised by: Neuberger Berman Management, Inc.
December 31, 2007
Investment Manager’s Report
Performance Summary - As of December 31, 2007
Average Annual Total Return Percentages
| | | | | | | | | |
| | | 1-Year | | | 5-Year | | | Since
Inception | |
SP Mid Cap Growth Portfolio | | 16.21 | % | | 14.97 | % | | -2.48 | % |
Russell Midcap™ Index | | 5.60 | | | 18.21 | | | 8.12 | |
Russell Midcap Growth™ Index | | 11.43 | | | 17.90 | | | 0.18 | |
Lipper (VIP) Mid-Cap Growth Funds Avg. | | 16.48 | | | 17.01 | | | 0.55 | |
Lipper (VIP) Multi-Cap Growth Funds Avg. | | 12.70 | | | 15.06 | | | -1.70 | |
Portfolio inception: 9/22/2000.
$10,000 INVESTED SINCE INCEPTION
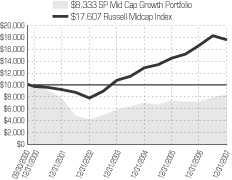
Past performance does not guarantee future returns. Portfolio performance is net of investment fees and fund expenses, but not product charges, which, if included, would significantly lower the performance quoted. The investment return and principal value of an investment will fluctuate, so that an investor’s shares, when redeemed, may be worth more or less than their original cost. Current performance may be lower or higher than the past performance data quoted.
Unless noted otherwise, Lipper Average and Index returns reflect performance beginning the closest month-end date to the Portfolio’s inception. Although Lipper classifies the Portfolio within the Multi-Cap Growth Funds Average, the returns for the Mid-Cap Growth Funds Average are also shown, because the management of the portfolios included in the Mid-Cap Growth Funds Average is more consistent with the management of the Portfolio. The Russell MidCap™ and MidCap Growth™ Indexes are trademarks/service marks of the Frank Russell Company. Russell® is a trademark of the Frank Russell Company. Performance figures may reflect fee waivers and/or expense reimbursements. In the absence of such fee waivers and/or expense reimbursements, total returns would be lower.
For the year ended December 31, 2007, the SP Mid Cap Growth Portfolio had a total return that was significantly above its benchmark index, the Russell Midcap Growth Index, and also above the average of its peer group.
Mid cap growth stocks enjoyed a banner year in 2007, significantly outperforming the broader domestic equity market as investors sought companies with stronger growth prospects. Historically mid caps have been perceived as having faster growth rates than large caps but more stable revenues than small cap stocks. In a sharp reversal from 2006, mid cap growth stocks also significantly outperformed mid cap value stocks. The Russell Midcap Value Index trailed its growth counterpart by almost 13 percentage points. The relatively poor performance of financial services stocks, which represent a large portion of the value indexes, was partly responsible for the growth style’s outperformance. Banks and other financial firms suffered huge losses related to subprime loans made to borrowers with poor credit. Gains in industries within the energy and technology sectors helped to offset weakness in industries hurt by the weakening housing and mortgage markets. Active managers generally benefited from being underweight in financials and by capitalizing on broader themes that drove market performance such as energy and technology.
Calamos Asset Management managed the Portfolio for most of 2007 with a top-down/bottom-up investment process that employs macroeconomic theme analysis to help set sector weights. An evaluation model focused on earnings sustainability and return on invested capital is used to select individual securities. On November 19, Neuberger Berman Asset Management took over as sub-adviser. Neuberger also uses a top-down/bottom-up process. The sub-advisor’s market outlook helps to determine active allocations at the sector, factor, and security levels. Bottom-up stock selection considers quantitative measures such as earnings, cash flow, and business fundamentals such as management quality and product/service line-up. A dividend discount model helps determine a stock’s relative valuation.
Most of the Portfolio’s 2007 performance was attributable to Calamos and much of the outperformance relative to the Index was attributable to style characteristics. Overexposure to stocks experiencing price strength and underexposures to stocks with high levels of debt and high dividend yields boosted relative returns. However, an overexposure to stocks with high price volatility detracted from relative results.
Overall stock selection was strong, particularly in the electronic equipment, semiconductors, and computer hardware industries of the technology sector. Stock-specific factors within technology, telecom, energy, consumer non-cyclicals, consumer services, and industrials sectors also helped performance. However, underperforming securities in the medical services and drug industries within the healthcare sector detracted from performance.
Prudential Investments LLC (PI), an indirect, wholly owned subsidiary of Prudential Financial, Inc., serves as the investment manager for the Fund.
For average and index definitions, refer to the Glossary of Benchmark Definitions page. Investors cannot invest directly in a market index or average. For a complete list of holdings, refer to the Schedule of Investments section of this report.
The Prudential Series Fund, SP PIMCO High Yield Portfolio
Subadvised by: Pacific Investment Management Company LLC
December 31, 2007
Investment Manager’s Report
Performance Summary - As of December 31, 2007
Average Annual Total Return Percentages
| | | | | | | | | |
| | | 1-Year | | | 5-Year | | | Since
Inception | |
SP PIMCO High Yield Portfolio | | 3.80 | % | | 9.61 | % | | 7.39 | % |
M-L U.S. High Yield Master II BB-B Rated Index | | 3.19 | | | 9.51 | | | 6.83 | |
Lehman Intermediate BB Corp. Index | | 2.02 | | | 8.00 | | | 6.75 | |
Lipper (VIP) High Current Yield Funds Avg. | | 2.56 | | | 9.62 | | | 5.61 | |
Portfolio inception: 9/22/2000.
$10,000 INVESTED SINCE INCEPTION
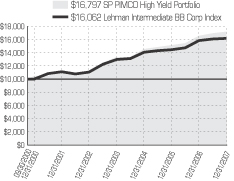
Past performance does not guarantee future returns. Portfolio performance is net of investment fees and fund expenses, but not product charges, which, if included, would significantly lower the performance quoted. The investment return and principal value of an investment will fluctuate, so that an investor’s shares, when redeemed, may be worth more or less than their original cost. Current performance may be lower or higher than the past performance data quoted.
Unless noted otherwise, Lipper Average and Index returns reflect performance beginning the closest month-end date to the Portfolio’s inception. Performance figures may reflect fee waivers and/or expense reimbursements. In the absence of such fee waivers and/or expense reimbursements, total returns would be lower.
For the year ended December 31, 2007, the Portfolio had a total return that was above its benchmark index.
The Federal Reserve (the Fed) held monetary policy steady during the first half of the year, but it repeatedly cut short-term interest rates in the second half, as a meltdown in debt securities linked to risky mortgages escalated into a full-fledged credit crisis that threatened the U.S. economic expansion. Investors seeking refuge from turmoil in the financial markets favored highly rated investment grade bonds such as U.S. Treasury securities, which substantially outperformed high yield corporate bonds, commonly called “junk” bonds because they are rated below investment grade. Among high yield corporate bonds, returns varied widely across sectors and industries. For example, the home construction, building products, and finance sectors posted losses for the year, while aerospace/defense, energy, pharmaceuticals, healthcare, and chemicals posted gains.
Overall, PIMCO’s sector allocation strategy helped the Portfolio outperform its benchmark index. Compared to its benchmark, the Portfolio had underweight exposures to the finance and building products sectors, both of which performed poorly as noted. The former was pressured as prominent banks took multibillion dollar write-downs on securities linked to risky mortgages in the United States. The latter, which was led lower by poorly performing construction companies, was pressured by deteriorating conditions in the housing market. On a negative note, the Portfolio’s underweight exposure to the consumer non-cyclical sector detracted from its relative performance, as the sector outperformed the broader high yield market primarily driven by the strong performance of the pharmaceutical industry. Exposure to CCC-rated bonds, one of the lower ratings categories in the high yield market, was another negative for the Portfolio. Lower-rated high yield bonds underperformed the broader high yield market in the risk-averse investment environment.
PIMCO’s security selection in the energy sector worked well, particularly among bonds of pipeline companies, which outperformed the broader energy sector and helped the Portfolio outperform its benchmark.
Prudential Investments LLC (PI), an indirect, wholly owned subsidiary of Prudential Financial, Inc., serves as the investment manager for the Fund.
For average and index definitions, refer to the Glossary of Benchmark Definitions page. Investors cannot invest directly in a market index or average. For a complete list of holdings, refer to the Schedule of Investments section of this report.
The Prudential Series Fund, SP PIMCO Total Return Portfolio
Subadvised by: Pacific Investment Management Company LLC
December 31, 2007
Investment Manager’s Report
Performance Summary - As of December 31, 2007
Average Annual Total Return Percentages
| | | | | | | | | |
| | | 1-Year | | | 5-Year | | | Since
Inception | |
SP PIMCO Total Return Portfolio | | 9.44 | % | | 5.30 | % | | 6.84 | % |
Lehman Brothers U.S. Aggregate Bond Index | | 6.97 | | | 4.42 | | | 6.20 | |
Lipper (VIP) Intermediate Investment Grade Debt Avg. | | 6.25 | | | 4.39 | | | 5.97 | |
Portfolio inception: 9/22/2000.
$10,000 INVESTED SINCE INCEPTION
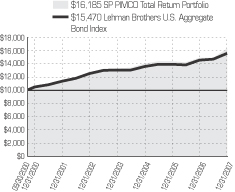
Past performance does not guarantee future returns. Portfolio performance is net of investment fees and fund expenses, but not product charges, which, if included, would significantly lower the performance quoted. The investment return and principal value of an investment will fluctuate, so that an investor’s shares, when redeemed, may be worth more or less than their original cost. Current performance may be lower or higher than the past performance data quoted.
Unless noted otherwise, Lipper Average and Index returns reflect performance beginning the closest month-end date to the Portfolio’s inception. Performance figures may reflect fee waivers and/or expense reimbursements. In the absence of such fee waivers and/or expense reimbursements, total returns would be lower.
For the year ended December 31, 2007, the total return of the SP PIMCO Total Return Portfolio was above its benchmark index.
The Federal Reserve (the Fed) held monetary policy steady during the first half of the year, but it repeatedly cut short-term interest rates in the second half, as a meltdown in debt securities linked to risky mortgages escalated into a full-fledged credit crisis that threatened the U.S. economic expansion. Investors seeking refuge from turmoil in the financial markets favored highly rated investment-grade bonds such as U.S. Treasury securities, which performed better than riskier alternatives such as corporate bonds and mortgage-backed securities in 2007.
PIMCO’s interest-rate strategy had a positive impact on the Portfolio’s performance relative to the benchmark index. The Portfolio’s duration, a measure of its sensitivity to changes in interest rates, was above that of the benchmark. This exposed the Portfolio more fully to the impact of falling interest rates, which pushed bond prices higher, as bond prices move inversely to interest rates. The Portfolio emphasized shorter-term bonds, which performed well as the slope of the yield curve – a graph that depicts the relationship between yields on short- and long-term bonds – became steeper in response to the Fed’s rate cuts.
PIMCO’s sector allocation strategy had a mixed impact on the Portfolio. On the one hand, a substantial underweight exposure to corporate bonds compared to the benchmark benefited the Portfolio. As noted, corporate bonds underperformed Treasurys as the flight to quality emerged in response to the subprime mortgage crisis. On the other hand, an overweight exposure to mortgage-backed securities detracted from the Portfolio’s relative performance. Mortgage-backed securities underperformed Treasurys on a duration-adjusted basis as the difference between yields on mortgage-backed securities and Treasurys widened as volatility increased in the financial markets.
PIMCO’s foreign exchange strategy had a positive impact on the Portfolio. The U.S. dollar lost ground to many foreign currencies in 2007, as lower short-term rates and slower economic growth in the United States made it a less attractive currency to investors. The Portfolio benefited from its exposure to foreign currencies, particularly those of emerging market countries.
Prudential Investments LLC (PI), an indirect, wholly owned subsidiary of Prudential Financial, Inc., serves as the investment manager for the Fund.
For average and index definitions, refer to the Glossary of Benchmark Definitions page. Investors cannot invest directly in a market index or average. For a complete list of holdings, refer to the Schedule of Investments section of this report.
The Prudential Series Fund, SP Prudential U.S. Emerging Growth Portfolio
Subadvised by: Jennison Associates LLC
December 31, 2007
Investment Manager’s Report
Performance Summary - As of December 31, 2007
Average Annual Total Return Percentages
| | | | | | | | | |
| | | 1-Year | | | 5-Year | | | Since
Inception | |
SP Prudential U.S. Emerging Growth Portfolio: Class I | | 16.82 | % | | 21.06 | % | | 2.75 | % |
SP Prudential U.S. Emerging Growth Portfolio: Class II | | 16.34 | | | 20.62 | | | 7.21 | |
S&P Midcap 400 Index | | 7.98 | | | 16.20 | | | 7.86 | |
Russell Midcap Growth™ Index | | 11.43 | | | 17.90 | | | 0.18 | |
Lipper (VIP) Mid-Cap Growth Funds Avg. | | 16.48 | | | 17.01 | | | 0.55 | |
Portfolio (Class I) inception: 9/22/2000. Portfolio (Class II) inception: 7/9/2001.
$10,000 INVESTED SINCE INCEPTION1
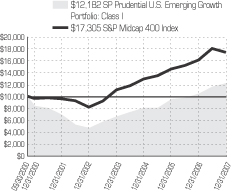
Past performance does not guarantee future returns. Portfolio performance is net of investment fees and fund expenses, but not product charges, which, if included, would significantly lower the performance quoted. The investment return and principal value of an investment will fluctuate, so that an investor’s shares, when redeemed, may be worth more or less than their original cost. Current performance may be lower or higher than the past performance data quoted.
Unless noted otherwise, Lipper Average and Index returns reflect performance beginning the closest month-end date to the Portfolio’s inception (Class I). The Russell MidCap Growth™ Index is a trademark/service mark of the Frank Russell Company. Russell® is a trademark of the Frank Russell Company. Performance figures may reflect fee waivers and/or expense reimbursements. In the absence of such fee waivers and/or expense reimbursements, total returns would be lower.
For the year ended December 31, 2007, the SP Prudential US Emerging Growth Portfolio delivered a return that was above its benchmark, the Russell Midcap Growth Index.
The Portfolio follows a traditional growth approach, seeking to identify rapidly growing small- and mid-cap growth stocks. Security selection is based primarily on a company’s ability to generate above average earnings growth. The manager reviews company fundamentals including valuations, free cash flow, balance sheets, and qualitative considerations such as the quality and experience of management teams and their potential for generating rapid growth. Quantitative models help identify areas of the market that have momentum or are undervalued.
The 2007 market was generally favorable to the Portfolio’s investment strategies. The bifurcated market benefited active managers and the Lipper average of mid-cap growth funds outperformed the Russell Midcap Growth Index by more than five percentage points. Generally stocks associated with the crumbling housing and mortgage markets plummeted while companies with a global footprint advanced. Active managers benefited from underweights to the financial services sector and by capitalizing on broader themes that drove the market such as the outperformance of energy and technology stocks.
Within the Portfolio, sector allocations were the main driver of outperformance in 2007. An overweight to technology and energy and an underweight to financials and consumer cyclicals contributed positively to relative performance. Conversely, an underweight to utilities and an overweight to basic materials were the largest detractors.
From time to time certain risk characteristics of the Portfolio may benefit or detract from relative performance. These characteristics are not “drivers” of performance but are rather by-products of the manager’s investment philosophy and process. In 2007 such exposures were generally favorable. The Portfolio’s avoidance of stocks that were heavily traded and those with higher dividend yields helped results. Conversely an overexposure to value stocks and underexposure to stocks exhibiting price momentum detracted from relative returns. Stocks with rapidly rising prices sometimes outperform during periods when the economy is showing signs of slowing.
Certain holdings also affected relative returns. Positions within the energy sector aided returns, particularly the shares of an international manufacturer of oil and gas equipment for drilling, which advanced throughout the year. High energy prices are encouraging companies to search for oil in hard-to-reach places, such as deeper waters. Holdings in the wireless telecommunications industry were a significant drag, most notably a Latin American wireless provider with a primarily business customer base.
Prudential Investments LLC (PI), an indirect, wholly owned subsidiary of Prudential Financial, Inc., serves as the investment manager for the Fund.
| 1 | The graph is based on the performance of Class I shares. Performance of Class II shares will be lower due to differences in the fee structure. Class II shares have associated 12b-1 and administrative fees at an annual rate of 0.25% and 0.15% respectively of the average daily net assets of the Class II shares. |
For average and index definitions, refer to the Glossary of Benchmark Definitions page. Investors cannot invest directly in a market index or average. For a complete list of holdings, refer to the Schedule of Investments section of this report.
The Prudential Series Fund, SP Small Cap Growth Portfolio
Subadvised by: Eagle Asset Management, Neuberger Berman Management Inc.
December 31, 2007
Investment Manager’s Report
Performance Summary - As of December 31, 2007
Average Annual Total Return Percentages
| | | | | | | | | |
| | | 1-Year | | | 5-Year | | | Since
Inception | |
SP Small Cap Growth Portfolio | | 6.37 | % | | 10.33 | % | | -3.17 | % |
Russell 2000® Index | | -1.57 | | | 16.25 | | | 6.79 | |
Russell 2000® Growth Index | | 7.05 | | | 16.50 | | | 1.12 | |
Lipper (VIP) Small-Cap Growth Funds Avg. | | 9.06 | | | 15.62 | | | 0.86 | |
Portfolio inception: 9/22/2000.
$10,000 INVESTED SINCE INCEPTION
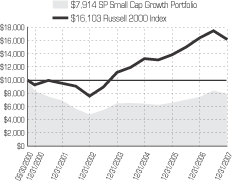
Past performance does not guarantee future returns. Portfolio performance is net of investment fees and fund expenses, but not product charges, which, if included, would significantly lower the performance quoted. The investment return and principal value of an investment will fluctuate, so that an investor’s shares, when redeemed, may be worth more or less than their original cost. Current performance may be lower or higher than the past performance data quoted.
Unless noted otherwise, Lipper Average and Index returns reflect performance beginning the closest month-end date to the Portfolio’s inception. The Russell 2000® and Russell 2000® Growth Indexes are trademarks/service marks of the Frank Russell Company. Russell® is a trademark of the Frank Russell Company. Performance figures may reflect fee waivers and/or expense reimbursements. In the absence of such fee waivers and/or expense reimbursements, total returns would be lower.
For the year ended December 31, 2007, the SP Small-Cap Growth Portfolio had a total return that slightly outperformed the Russell 2000 Growth Index benchmark.
The Portfolio is co-managed by Neuberger Berman and Eagle Asset Management. Neuberger Berman seeks small, undervalued but growing companies and attempts to hold them until they are valued correctly by the market. A core tenet of their strategy is to minimize downside risk. Eagle’s traditional growth approach emphasizes companies with rapid growth characteristics, including an accelerating, but sustainable earnings growth rate, a positive catalyst, a high or expanding return on equity, and sound management practices.
Performance for the year was in-line with the benchmark. The portion of the Portfolio managed by Eagle Asset Management outperformed, while the portion managed by Neuberger Berman underperformed. In 2007, no single factor contributed more than any other to relative performance.
Stock selection was marginally positive for the year. The Portfolio did well within the industrials, consumer cyclicals, and basic materials sectors. From an industry standpoint, positions in chemicals, consumer durables, and construction & real property benefited the Portfolio’s return. Holdings in the Internet, oil services, and apparel & textile industries exhibited some relative weakness.
As it has in the past, the Neuberger Berman portion maintained a lower beta than the Russell 2000 Growth Index, meaning that its holdings tend to move in the same direction as the Index, but with somewhat less volatility. Along with other risk-factor exposure, this helped the Portfolio weather a turbulent year, considering the market storms that affected stocks, most notably in February, June, July and November. Furthermore, an underexposure to stocks with price volatility enhanced the Portfolio’s value. However, this positive effect was offset by the Portfolio’s tendency to favor companies with “value” characteristics, for example, those with lower price to earnings or price to book ratios versus the benchmark.
Sector allocations were largely neutral to the Portfolio’s performance. The benefits from an overweight position to industrials were offset by a slight overweight position to the grossly underperforming financial sector.
Prudential Investments LLC (PI), an indirect, wholly owned subsidiary of Prudential Financial, Inc., serves as the investment manager for the Fund.
For average and index definitions, refer to the Glossary of Benchmark Definitions page. Investors cannot invest directly in a market index or average. For a complete list of holdings, refer to the Schedule of Investments section of this report.
The Prudential Series Fund, SP Small Cap Value Portfolio
Subadvised by: Goldman Sachs Asset Management L.P.
December 31, 2007
Investment Manager’s Report
Performance Summary - As of December 31, 2007
Average Annual Total Return Percentages
| | | | | | | | | |
| | | 1-Year | | | 5-Year | | | Since
Inception | |
SP Small Cap Value Portfolio | | -3.63 | % | | 13.17 | % | | 8.61 | % |
Russell 2500™ Index | | 1.38 | | | 16.99 | | | 8.08 | |
Lipper (VIP) Small-Cap Core Funds Avg. | | -1.64 | | | 15.15 | | | 8.15 | |
Lipper (VIP) Small-Cap Value Funds Avg. | | -6.61 | | | 15.74 | | | 10.68 | |
Although Lipper classifies the Portfolio within the Small-Cap Core Funds Average, the returns for the Small-Cap Value Funds Average are also shown, because the management of the portfolios included in the Small-Cap Value Funds Average is more consistent with the management of the Portfolio.
Portfolio inception: 9/22/2000.
$10,000 INVESTED SINCE INCEPTION
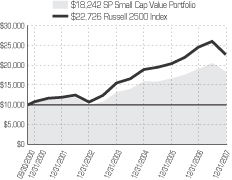
Past performance does not guarantee future returns. Portfolio performance is net of investment fees and fund expenses, but not product charges, which, if included, would significantly lower the performance quoted. The investment return and principal value of an investment will fluctuate, so that an investor’s shares, when redeemed, may be worth more or less than their original cost. Current performance may be lower or higher than the past performance data quoted.
Unless noted otherwise, Lipper Average and Index returns reflect performance beginning the closest month-end date to the Portfolio’s inception. The Russell 2500® Index is a trademark/service mark of the Frank Russell Company. Russell® is a trademark of the Frank Russell Company. Performance figures may reflect fee waivers and/or expense reimbursements. In the absence of such fee waivers and/or expense reimbursements, total returns would be lower.
For the year ended December 31, 2007, the SP Small Cap Value Portfolio had a total return that was above its benchmark index and slightly below the average of its peer group.
The Portfolio is co-managed by Goldman Sachs and ClearBridge Advisors. The Goldman portion follows a traditional small cap value strategy with an emphasis on quality, purchasing well-positioned businesses at attractive valuations, including strong cash flow and balance sheets. ClearBridge follows a relative value approach that seeks “undiscovered” companies at lower relative valuations compared to peers. The strategy utilizes both a top-down and bottom-up component; however, bottom-up security selection is expected to drive performance long-term.
During a volatile year in which value stocks suffered across the board, the Portfolio posted a return that outperformed its benchmark. A market shift that occurred in the second half of the year heavily favored securities with growth attributes in all capitalization ranges. Subsequently, at year’s end, growth stocks trounced value stocks by exceedingly wide margins in the Russell indexes.
Style factors drove performance relative to the Index. The Portfolio was underweight in value positions (stocks with above market book-to-price ratios), in leveraged stocks (stocks with above market debt-to-total asset ratios), and in stocks with high dividend yields, above market earnings variability, and high price volatility. The Portfolio has maintained these style biases over longer measurement periods. When market conditions are favorable for such style factors, as they were in 2007, they should help relative performance.
The Portfolio’s relatively low beta indicates that the Portfolio is less sensitive to price movements of the broad market than the Index. As the broad market experienced a setback, this defensive positioning contributed to the Portfolio’s relative performance.
An underexposure to the financial and consumer services sectors had a positive effect on relative performance during the year, as did an overexposure to the consumer cyclical sector.
Stock selection in the leisure, industrial parts, medical services, electronic equipment and computer hardware/software industries contributed positively to relative performance in 2007. However, assets held in the mining & metals and banks industries struggled, partially offsetting gains by the solid contributors.
Prudential Investments LLC (PI), an indirect, wholly owned subsidiary of Prudential Financial, Inc., serves as the investment manager for the Fund.
For average and index definitions, refer to the Glossary of Benchmark Definitions page. Investors cannot invest directly in a market index or average. For a complete list of holdings, refer to the Schedule of Investments section of this report.
The Prudential Series Fund, SP Strategic Partners Focused Growth Portfolio
Subadvised by: Jennison Associates LLC, Alliance Capital
December 31, 2007
Investment Manager’s Report
Performance Summary - As of December 31, 2007
Average Annual Total Return Percentages
| | | | | | | | | |
| | | 1-Year | | | 5-Year | | | Since
Inception | |
SP Strategic Partners Focused Growth Portfolio: Class I | | 15.24 | % | | 12.90 | % | | -1.09 | % |
SP Strategic Partners Focused Growth Portfolio: Class II | | 14.68 | | | 12.42 | | | 0.83 | |
S&P 500 Index | | 5.49 | | | 12.82 | | | 2.03 | |
Russell 1000 Index® Growth Index | | 11.81 | | | 12.11 | | | -3.04 | |
Lipper (VIP) Large-Cap Growth Funds Avg. | | 12.78 | | | 12.34 | | | -2.01 | |
Portfolio (Class I) inception: 9/22/2000. Portfolio (Class II) inception: 1/12/2001.
$10,000 INVESTED SINCE INCEPTION1
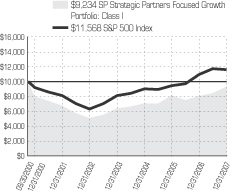
Past performance does not guarantee future returns. Portfolio performance is net of investment fees and fund expenses, but not product charges, which, if included, would significantly lower the performance quoted. The investment return and principal value of an investment will fluctuate, so that an investor’s shares, when redeemed, may be worth more or less than their original cost. Current performance may be lower or higher than the past performance data quoted.
Unless noted otherwise, Lipper Average and Index returns reflect performance beginning the closest month-end date to the Portfolio’s inception (Class I). The Russell 1000® Growth Index is a trademark/service mark of the Frank Russell Company. Russell® is a trademark of the Frank Russell Company. Performance figures may reflect fee waivers and/or expense reimbursements. In the absence of such fee waivers and/or expense reimbursements, total returns would be lower.
For the year ended December 31, 2007, the SP Strategic Partners Focused Growth Portfolio had a total return that was above the style-appropriate Russell 1000® Growth Index and the average of its peer group.
The Strategic Partners Focused Growth Portfolio is co-managed by Jennison Associates and AllianceBernstein L.P. Jennison Associates uses a bottom-up approach to identify attractive growth companies. AllianceBernstein Investment Research and Management is an “earnings driven” investor, focusing on the early recognition of change on the premise that value is created through the dynamics of changing company, industry and economic fundamentals.
The Jennison and AllianceBernstein portions combined to outperform the Russell 1000® Growth Index benchmark, but the results were derived from specific factors that affected each portion’s performance relative to the benchmark. For example, risk and style factors drove Jennison’s relative outperformance, while the AllianceBernstein portion benefited not only from risk attributes, but also from stock specific factors.
The majority of the Portfolio’s relative performance came from risk exposures. An overexposure to momentum stocks (stocks whose price has recently exhibited positive trends) was the largest single contributor to relative performance. This aggressive growth Portfolio benefited from risk exposures typical of the investment strategy, including an emphasis on stocks with larger market capitalizations, companies growing earnings faster than the Index average, and exposure to stocks with lower dividend yields relative to the Index. Despite these rather large exposures none, other than the Portfolio’s overweight to momentum stocks, had a significant impact on relative results.
Overall, stock selection contributed slightly to relative results. Driven largely by the AllianceBernstein portion, the Portfolio’s holdings within the healthcare and basic materials sectors boosted relative performance. Significantly helping performance were two positions, one in the computer hardware industry (which returned about 100%) and another in chemicals (that returned in excess of 100%) during the year. Both Jennison and AllianceBernstein held these positions for the entire period. Detracting from relative performance, were some holdings in the financial and technology (within the semiconductors and defense & aerospace industries in particular) sectors.
The Portfolio’s sector exposures turned out to be neutral. An underweight to energy and basic materials detracted from relative performance, which offset the positive results from the Portfolio’s sizeable overweight to technology and its underweight to consumer cyclicals.
Prudential Investments LLC (PI), an indirect, wholly owned subsidiary of Prudential Financial, Inc., serves as the investment manager for the Fund.
| 1 | The graph is based on the performance of Class I shares. Performance of Class II shares will be lower due to differences in the fee structure. Class II shares have associated 12b-1 and administrative fees at an annual rate of 0.25% and 0.15% respectively of the average daily net assets of the Class II shares. |
For average and index definitions, refer to the Glossary of Benchmark Definitions page. Investors cannot invest directly in a market index or average. For a complete list of holdings, refer to the Schedule of Investments section of this report.
The Prudential Series Fund, SP T. Rowe Price Large-Cap Growth Portfolio
Subadvised by: T Rowe Price Associates Inc
December 31, 2007
Investment Manager’s Report
Performance Summary - As of December 31, 2007
Average Annual Total Return Percentages
| | | | | | | | | |
| | | 1-Year | | | 5-Year | | | Since
Inception | |
SP T. Rowe Price Large-Cap Growth | | 8.21 | % | | 11.90 | % | | -1.69 | % |
Russell 1000® Index | | 5.77 | | | 13.43 | | | 2.19 | |
Russell 1000® Growth Index | | 11.81 | | | 12.11 | | | -3.04 | |
Lipper (VIP) Large Cap Core Funds Avg. | | 12.78 | | | 12.34 | | | -2.01 | |
Portfolio inception: 9/22/2000.
$10,000 INVESTED SINCE INCEPTION
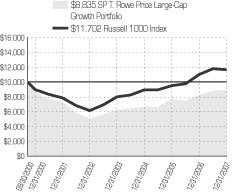
Past performance does not guarantee future returns. Portfolio performance is net of investment fees and fund expenses, but not product charges, which, if included, would significantly lower the performance quoted. The investment return and principal value of an investment will fluctuate, so that an investor’s shares, when redeemed, may be worth more or less than their original cost. Current performance may be lower or higher than the past performance data quoted.
Unless noted otherwise, Lipper Average and Index returns reflect performance beginning the closest month-end date to the Portfolio’s inception. The Russell 1000® and Russell 1000® Growth Indexes are trademarks/service marks of the Frank Russell Company. Russell® is a trademark of the Frank Russell Company. Performance figures may reflect fee waivers and/or expense reimbursements. In the absence of such fee waivers and/or expense reimbursements, total returns would be lower.
For the year ended December 31, 2007, the SP T. Rowe Price Large-Cap Growth Portfolio had a return that was below its benchmark index and also below the average return of its peer group.
The Portfolio manager looks for companies larger than $5 billion in market capitalization with the potential to increase their earnings by at least 10% a year. It is flexible in the valuation (share price in relation to measures of intrinsic value) it will accept, and takes sector and market conditions into account. Sector and industry allocation is a by-product of the manager’s bottom-up stock picking approach.
The Portfolio’s holdings within the healthcare sector, specifically biotech companies, detracted most from performance relative to the benchmark during the year. To a lesser extent stock selection within consumer cyclicals, particularly department and clothing stores, and hotel companies in the consumer services sector, limited performance. On a positive note, holdings within the technology sector helped performance.
Overweight positions in the leisure and bank industries, as well as underweight positions in energy reserves and defense & aerospace, had a negative effect on the Portfolio’s performance as well.
A high beta, which held back performance during a volatile year, indicates the Portfolio’s heightened sensitivity to market gyrations. However, the Portfolio’s underexposure to low P/E (price-to-earnings ratios) and high-yielding value stocks relative to the Russell 1000 Growth Index helped overall performance. Growth investing, especially in contrast to value investing, was in favor for much of 2007, which helped given the Portfolio’s large-cap these growth characteristics. The manager’s bias toward more volatile stocks with higher debt levels relative to the benchmark hurt performance.
Prudential Investments LLC (PI), an indirect, wholly owned subsidiary of Prudential Financial, Inc., serves as the investment manager for the Fund.
For average and index definitions, refer to the Glossary of Benchmark Definitions page. Investors cannot invest directly in a market index or average. For a complete list of holdings, refer to the Schedule of Investments section of this report.
The Prudential Series Fund
Presentation of Portfolio Holdings — Unaudited
December 31, 2007
| | |
| SP Aggressive Growth Asset Allocation Portfolio | | |
| Five Largest Holdings | | (% of Net Assets) |
| PSF-SP Large Cap Value Portfolio | | 29.1 |
| PSF-Jennison Portfolio (Class I) | | 20.7 |
| Advanced Series Trust-Marsico Capital Growth Portfolio | | 20.6 |
| PSF-SP International Growth Portfolio (Class I) | | 12.1 |
| PSF-SP International Value Portfolio | | 10.0 |
| | |
| SP AIM Core Equity Portfolio | | |
| Five Largest Holdings | | (% of Net Assets) |
| Amgen, Inc. | | 2.7 |
| Progressive Corp. (The) | | 2.7 |
| 3M Co. | | 2.5 |
| Motorola, Inc. | | 2.4 |
| Microsoft Corp. | | 2.4 |
| | |
| SP Balanced Asset Allocation Portfolio | | |
| Five Largest Holdings | | (% of Net Assets) |
| PSF-SP PIMCO Total Return Portfolio | | 30.5 |
| PSF-SP Large Cap Value Portfolio | | 19.1 |
| Advanced Series Trust—Marsico Capital Growth Portfolio | | 13.5 |
| PSF-Jennison Portfolio (Class I) | | 13.5 |
| PSF-SP International Growth Portfolio (Class I) | | 7.7 |
| | |
| SP Conservative Asset Allocation Portfolio | | |
| Five Largest Holdings | | (% of Net Assets) |
| PSF-SP PIMCO Total Return Portfolio | | 47.9 |
| PSF-SP Large Cap Value Portfolio | | 13.2 |
| Advanced Series Trust—Marisco Capital Growth Portfolio | | 9.3 |
| PSF-Jennison Portfolio (Class I) | | 9.2 |
| Advanced Series Trust—Western Asset Core Plus Bond Portfolio | | 6.2 |
| | |
| SP Davis Value Portfolio | | |
| Five Largest Holdings | | (% of Net Assets) |
| Costco Wholesale Corp. | | 4.7 |
| ConocoPhillips | | 4.6 |
| Berkshire Hathaway, Inc. | | 4.2 |
| American Express Co. | | 4.0 |
| Altria Group, Inc. | | 3.7 |
| | |
| SP Growth Asset Allocation Portfolio | | |
| Five Largest Holdings | | (% of Net Assets) |
| PSF-SP Large Cap Value Portfolio | | 25.1 |
| PSF-Jennison Portfolio (Class I) | | 17.6 |
| Advanced Series Trust-Marsico Capital Growth Portfolio | | 17.6 |
| PSF-SP PIMCO Total Return Portfolio | | 12.7 |
| PSF-SP International Growth Portfolio (Class I) | | 10.1 |
| | |
| SP International Growth Portfolio | | |
| Five Largest Holdings | | (% of Net Assets) |
| Tesco PLC | | 3.0 |
| ABB Ltd. | | 2.7 |
| Nintendo Co. Ltd. | | 2.6 |
| Veolia Environment | | 2.2 |
| Nestle SA | | 2.1 |
| | |
| SP International Value Portfolio | | |
| Five Largest Holdings | | (% of Net Assets) |
| Potash Corp. of Saskatchewan | | 2.3 |
| BASF AG | | 2.2 |
| Teva Pharmaceutical Industries Ltd., ADR | | 2.1 |
| E.ON AG | | 2.0 |
| Roche Holding AG | | 1.9 |
| | |
| SP Large Cap Value Portfolio | | |
| Five Largest Holdings | | (% of Net Assets) |
| Altria Group, Inc. | | 3.5 |
| ConocoPhillips | | 3.4 |
| Bank of America Corp. | | 3.3 |
| Exxon Mobil Corp. | | 3.1 |
| General Electric Co. | | 2.8 |
| | |
| SP Mid-Cap Growth Portfolio | | |
| Five Largest Holdings | | (% of Net Assets) |
| Precision Castparts Corp. | | 2.2 |
| Hologic, Inc. | | 2.1 |
| Denbury Resources, Inc. | | 2.1 |
| NII Holdings, Inc. | | 1.8 |
| Activision, Inc. | | 1.7 |
| | |
| SP PIMCO High Yield Portfolio | | |
| Five Largest Issues | | (% of Net Assets) |
| FNMA, 5.5%, 01/14/38 | | 7.0 |
| FNMA, 5.0%, 02/12/38 | | 3.1 |
| FNMA, 6.0%, 01/14/38 | | 3.1 |
| HCA, Inc., 9.25% 11/15/16 | | 2.9 |
| Ford Motor Credit Co. LLC, Notes, 7.8%, 06/01/12 | | 2.0 |
| | |
| SP PIMCO Total Return Portfolio | | |
| Five Largest Issues | | (% of Net Assets) |
| U.S. Treasury Bonds 5.0% 5/15/37 | | 17.6 |
| FNMA, 5.5%, 01/11/37 | | 17.2 |
| FNMA, 5.0%, 11/01/33 | | 8.5 |
| GNMA, 6.5%, 01/22/38 | | 5.2 |
| FNMA, 6.0%, 01/11/37 | | 4.4 |
| | |
| SP Prudential U.S. Emerging Growth Portfolio | | |
| Five Largest Holdings | | (% of Net Assets) |
| NII Holdings, Inc. | | 3.8 |
| Ametek, Inc. | | 2.6 |
| Southwestern Energy Co. | | 2.5 |
| DaVita, Inc. | | 2.3 |
| XTO Energy, Inc. | | 2.1 |
| | |
| SP Small Cap Growth Portfolio | | |
| Five Largest Holdings | | (% of Net Assets) |
| Bucyrus International, Inc. (Class A Stock) | | 2.8 |
| Eclipsys Corp. | | 2.1 |
| Actuant Corp. (Class A Stock) | | 1.9 |
| OYO Geospace Corp. | | 1.9 |
| Waste Connections, Inc. | | 1.9 |
| | |
| SP Small Cap Value Portfolio | | |
| Five Largest Holdings | | (% of Net Assets) |
| iShares Russell 2000 Value Index Fund | | 2.4 |
| Casey’s General Stores, Inc. | | 1.5 |
| RBC Bearings, Inc. | | 1.1 |
| Plantronics, Inc. | | 1.0 |
| El Paso Electric Co. | | 0.9 |
| | |
| SP Strategic Partners Focused Growth Portfolio | | |
| Five Largest Holdings | | (% of Net Assets) |
| Google, Inc. (Class A Stock) | | 7.0 |
| Apple, Inc. | | 6.8 |
| Monsanto Co. | | 5.7 |
| Gilead Sciences, Inc. | | 5.6 |
| Cisco Systems, Inc. | | 5.1 |
| | |
| SP T. Rowe Price Large Cap Growth Portfolio | | |
| Five Largest Holdings | | (% of Net Assets) |
| Microsoft Corp. | | 4.9 |
| Google, Inc. (Class A Stock) | | 4.0 |
| State Street Corp. | | 3.7 |
| American Tower Corp. (Class A Stock) | | 3.4 |
| Danaher Corp. | | 3.1 |
For a complete list of holdings, please refer to the Schedule of Investments section of this report. Holdings reflect only long-term investments. Holdings/Issues/Sectors are subject to change.
The Prudential Series Fund
Fees and Expenses — Unaudited
December 31, 2007
As a contract owner investing in Portfolios of the Fund through a variable annuity or variable life contract, you incur ongoing costs, including management fees, and other Portfolio expenses. This example is intended to help you understand your ongoing costs (in dollars) of investing in the Fund and to compare these costs with the ongoing costs of investing in other investment options. This example does not reflect fees and charges under your variable annuity or variable life contract. If contract charges were included, the costs shown below would be higher. Please consult the prospectus for your contract for more information about contract fees and charges.
The example is based on an investment of $1,000 invested at the beginning of the period and held for the entire period July 1, 2007 through December 31, 2007.
Actual Expenses
The first line of the table below provides information about actual account values and actual expenses. You may use this information, together with the amount you invested, to estimate the Portfolio expenses that you paid over the period. Simply divide your account value by $1,000 (for example, an $8,600 account value divided by $1,000 = 8.6), then multiply the result by the number in the first line under the heading entitled “Expenses Paid During Period” to estimate the Portfolio expenses you paid on your account during this period. As noted above, the table does not reflect variable contract fees and charges.
Hypothetical Example for Comparison Purposes
The second line of the table below provides information about hypothetical account values and hypothetical expenses based on the Portfolio’s actual expense ratio and an assumed rate of return of 5% per year before expenses, which is not the Portfolio’s actual return. The hypothetical account values and expenses may not be used to estimate the actual ending account balance or expenses you paid for the period. You may use this information to compare the ongoing costs of investing in the Portfolio and other investment options. To do so, compare this 5% hypothetical example with the 5% hypothetical examples that appear in the shareholder reports of the other investment options.
Please note that the expenses shown in the table are meant to highlight your ongoing Portfolio costs only and do not reflect any contract fees and charges, such as sales charges (loads), insurance charges or administrative charges. Therefore the second line of the table is useful to compare ongoing investment option costs only, and will not help you determine the relative total costs of owning different contracts. In addition, if these contract fee and charges were included, your costs would have been higher.
| | | | | | | | | | |
| The Prudential Series Fund Portfolios | | Beginning
Account Value
July 1, 2007 | | Ending
Account Value
December 31, 2007 | | Annualized Expense
Ratio Based on the
Six-Month period | | Expenses Paid
During the
Six-Month Period |
SP Aggressive Growth Asset Allocation (Class I) | | Actual | | $1,000.00 | | $1,016.80 | | 0.97% | | $4.93 |
| | | Hypothetical | | $1,000.00 | | $1,020.32 | | 0.97% | | $4.94 |
SP AIM Core Equity (Class I) | | Actual | | $1,000.00 | | $ 990.90 | | 1.00% | | $5.02 |
| | | Hypothetical | | $1,000.00 | | $1,020.16 | | 1.00% | | $5.09 |
SP Balanced Asset Allocation (Class I) | | Actual | | $1,000.00 | | $1,041.40 | | 0.84% | | $4.32 |
| | | Hypothetical | | $1,000.00 | | $1,020.97 | | 0.84% | | $4.28 |
SP Conservative Asset Allocation (Class I) | | Actual | | $1,000.00 | | $1,055.90 | | 0.80% | | $4.15 |
| | | Hypothetical | | $1,000.00 | | $1,021.17 | | 0.80% | | $4.08 |
SP Davis Value (Class I) | | Actual | | $1,000.00 | | $ 976.60 | | 0.80% | | $3.99 |
| | | Hypothetical | | $1,000.00 | | $1,021.17 | | 0.80% | | $4.08 |
SP Growth Asset Allocation (Class I) | | Actual | | $1,000.00 | | $1,027.00 | | 0.88% | | $4.50 |
| | | Hypothetical | | $1,000.00 | | $1,020.77 | | 0.88% | | $4.48 |
SP International Growth (Class I) | | Actual | | $1,000.00 | | $1,097.60 | | 0.95% | | $5.02 |
| | | Hypothetical | | $1,000.00 | | $1,020.42 | | 0.95% | | $4.84 |
SP International Growth (Class II) | | Actual | | $1,000.00 | | $1,094.80 | | 1.35% | | $7.13 |
| | | Hypothetical | | $1,000.00 | | $1,018.40 | | 1.35% | | $6.87 |
SP International Value (Class I) | | Actual | | $1,000.00 | | $1,035.50 | | 1.01% | | $5.18 |
| | | Hypothetical | | $1,000.00 | | $1,020.11 | | 1.01% | | $5.14 |
SP Large Cap Value (Class I) | | Actual | | $1,000.00 | | $ 921.70 | | 0.83% | | $4.02 |
| | | Hypothetical | | $1,000.00 | | $1,021.02 | | 0.83% | | $4.23 |
SP Mid Cap Growth (Class I) | | Actual | | $1,000.00 | | $1,062.90 | | 0.83% | | $4.32 |
| | | Hypothetical | | $1,000.00 | | $1,021.02 | | 0.83% | | $4.23 |
SP PIMCO High Yield (Class I) | | Actual | | $1,000.00 | | $1,013.90 | | 0.69% | | $3.50 |
| | | Hypothetical | | $1,000.00 | | $1,021.73 | | 0.69% | | $3.52 |
The Prudential Series Fund
Fees and Expenses — Unaudited (continued)
December 31, 2007
| | | | | | | | | | |
| The Prudential Series Fund Portfolios | | Beginning
Account Value
July 1, 2007 | | Ending
Account Value
December 31, 2007 | | Annualized Expense
Ratio Based on the
Six-Month period | | Expenses Paid
During the
Six-Month Period |
SP PIMCO Total Return (Class I) | | Actual | | $1,000.00 | | $1,092.40 | | 0.67% | | $3.53 |
| | | Hypothetical | | $1,000.00 | | $1,021.83 | | 0.67% | | $3.41 |
SP Prudential US Emerging Growth (Class I) | | Actual | | $1,000.00 | | $1,052.30 | | 0.63% | | $3.26 |
| | | Hypothetical | | $1,000.00 | | $1,022.03 | | 0.63% | | $3.21 |
SP Prudential US Emerging Growth (Class II) | | Actual | | $1,000.00 | | $1,050.20 | | 1.03% | | $5.32 |
| | | Hypothetical | | $1,000.00 | | $1,020.01 | | 1.03% | | $5.24 |
SP Small Cap Growth (Class I) | | Actual | | $1,000.00 | | $ 937.70 | | 1.04% | | $5.08 |
| | | Hypothetical | | $1,000.00 | | $1,019.96 | | 1.04% | | $5.30 |
SP Small Cap Value (Class I) | | Actual | | $1,000.00 | | $ 893.80 | | 0.97% | | $4.63 |
| | | Hypothetical | | $1,000.00 | | $1,020.32 | | 0.97% | | $4.94 |
SP Strategic Partners Focused Growth (Class I) | | Actual | | $1,000.00 | | $1,101.00 | | 1.19% | | $6.30 |
| | | Hypothetical | | $1,000.00 | | $1,019.21 | | 1.19% | | $6.06 |
SP Strategic Partners Focused Growth (Class II) | | Actual | | $1,000.00 | | $1,098.60 | | 1.59% | | $8.41 |
| | | Hypothetical | | $1,000.00 | | $1,017.19 | | 1.59% | | $8.08 |
SP T. Rowe Price Large-Cap Growth (Class I) | | Actual | | $1,000.00 | | $1,005.00 | | 1.01% | | $5.10 |
| | | Hypothetical | | $1,000.00 | | $1,020.11 | | 1.01% | | $5.14 |
Portfolio expenses (net of fee waivers or subsidies, if any) for each share class are equal to the annualized expense ratio for each share class (provided in the table), multiplied by the average account value over the period, multiplied by the 184 days in the six-month period ended December 31, 2007, and divided by the 365 days in each Portfolio's fiscal year ended December 31, 2007 (to reflect the six-month period). Expenses presented in the table include the expenses of any underlying portfolios in which the Portfolio may invest.
| | | | |
| | | SP AGGRESSIVE GROWTH ASSET ALLOCATION PORTFOLIO | | |
SCHEDULE OF INVESTMENTS | December 31, 2007 |
| | | | | | |
| LONG-TERM INVESTMENTS — 99.4% | | Shares
| | Value
(Note 2)
| |
| | | | | | | |
Affiliated Mutual Funds | | | | | | |
Advanced Series Trust — Marsico Capital Growth Portfolio | | 1,798,017 | | $ | 42,199,463 | |
The Prudential Series Fund —
Jennison Portfolio (Class I) | | 1,807,459 | | | 42,529,520 | |
Money Market Portfolio | | 197 | | | 1,971 | |
Natural Resources Portfolio (Class I) | | 122,469 | | | 6,892,541 | |
SP International Growth Portfolio (Class I) | | 2,914,229 | | | 24,829,233 | |
SP International Value Portfolio | | 1,923,470 | | | 20,446,482 | |
SP Large Cap Value Portfolio | | 5,071,536 | | | 59,844,129 | |
SP Small Cap Growth Portfolio | | 574,427 | | | 4,371,390 | |
SP Small Cap Value Portfolio | | 235,649 | | | 2,879,625 | |
| | | | |
|
|
|
TOTAL LONG-TERM INVESTMENTS
(cost $165,602,097) | | | 203,994,354 | |
| | | | |
|
|
|
| SHORT-TERM INVESTMENT — 0.6% | | | | | | |
Affiliated Money Market Mutual Fund | | | | | | |
Dryden Core Investment Fund — Taxable Money Market Series (cost $1,338,412) (Note 4) | | 1,338,412 | | | 1,338,412 | |
| | | | |
|
|
|
TOTAL INVESTMENTS — 100.0%
(cost $166,940,509)(a) | | | 205,332,766 | |
LIABILITIES IN EXCESS OF OTHER ASSETS | | | (43,112 | ) |
| | | | |
|
|
|
NET ASSETS — 100.0% | | $ | 205,289,654 | |
| | | | |
|
|
|
| (a) | Prudential Investments LLC, the manager of the Portfolio, also serves as manager of the underlying portfolios in which the Portfolio invests. |
The investment allocation of portfolio holdings and liabilities in excess of other assets shown as a percentage of net assets as of December 31, 2007 were as follows:
| | | |
Investment Type
| | | |
Large/Mid-Cap Growth | | 41.3 | % |
Large/Mid-Cap Value | | 29.1 | |
International Growth | | 12.1 | |
International Value | | 10.0 | |
Sector | | 3.4 | |
Small-Cap Growth | | 2.1 | |
Small-Cap Value | | 1.4 | |
| | |
|
|
| | | 99.4 | |
Short-Term Investment | | 0.6 | |
Liabilities in excess of other assets | | — | (b) |
| | |
|
|
| | | 100.0 | % |
| | |
|
|
SEE NOTES TO FINANCIAL STATEMENTS.
A1
| | | | |
| | | SP AGGRESSIVE GROWTH ASSET ALLOCATION PORTFOLIO (Continued) | | |
STATEMENT OF ASSETS AND LIABILITIES
December 31, 2007
| | | |
| ASSETS | | | |
Affiliated investments, at value (cost $166,940,509) | | $ | 205,332,766 |
Cash | | | 7,109 |
Receivable for Series shares sold | | | 25,991 |
Prepaid expenses | | | 2,279 |
Dividends receivable | | | 1,433 |
| | |
|
|
Total Assets | | | 205,369,578 |
| | |
|
|
| LIABILITIES | | | |
Accrued expenses and other liabilities | | | 45,125 |
Payable for Series shares repurchased | | | 25,050 |
Management fee payable | | | 8,731 |
Deferred trustees’ fees | | | 528 |
Transfer agent fee payable | | | 490 |
| | |
|
|
Total Liabilities | | | 79,924 |
| | |
|
|
| NET ASSETS | | $ | 205,289,654 |
| | |
|
|
Net assets were comprised of: | | | |
Paid-in capital | | $ | 148,424,171 |
Retained earnings | | | 56,865,483 |
| | |
|
|
Net assets, December 31, 2007 | | $ | 205,289,654 |
| | |
|
|
Net asset value and redemption price per share, $205,289,654 / 19,104,405 outstanding shares of beneficial interest | | $ | 10.75 |
| | |
|
|
STATEMENT OF OPERATIONS
For the Year Ended December 31, 2007
| | | | |
| INVESTMENT INCOME | | | | |
Affiliated dividend income | | $ | 1,937,441 | |
| | |
|
|
|
| EXPENSES | | | | |
Management fee | | | 103,809 | |
Custodian’s fees and expenses | | | 43,000 | |
Shareholders’ reports | | | 33,000 | |
Audit fee | | | 16,000 | |
Trustees’ fees | | | 7,000 | |
Legal fees and expenses | | | 5,000 | |
Transfer agent’s fee and expenses (including affiliated expense of $2,600) (Note 4) | | | 3,000 | |
Insurance expenses | | | 1,000 | |
Miscellaneous | | | 7,919 | |
| | |
|
|
|
Total expenses | | | 219,728 | |
| | |
|
|
|
| NET INVESTMENT INCOME | | | 1,717,713 | |
| | |
|
|
|
| NET REALIZED AND UNREALIZED GAIN ON AFFILIATED INVESTMENTS | | | | |
Net realized gain on investment transactions | | | 4,475,867 | |
Net capital gain distributions received | | | 12,563,866 | |
| | |
|
|
|
| | | | 17,039,733 | |
| | |
|
|
|
Net change in unrealized appreciation (depreciation) on investments | | | (738,074 | ) |
| | |
|
|
|
| NET GAIN ON INVESTMENTS | | | 16,301,659 | |
| | |
|
|
|
| NET INCREASE IN NET ASSETS RESULTING FROM OPERATIONS | | $ | 18,019,372 | |
| | |
|
|
|
STATEMENT OF CHANGES IN NET ASSETS
| | | | | | | | |
| | | Year Ended December 31,
| |
| | | 2007
| | | 2006
| |
| INCREASE (DECREASE) IN NET ASSETS | | | | | | | | |
| OPERATIONS: | | | | | | | | |
Net investment income | | $ | 1,717,713 | | | $ | 1,927,393 | |
Net realized gain on investment transactions | | | 17,039,733 | | | | 9,174,909 | |
Net change in unrealized appreciation (depreciation) on investments | | | (738,074 | ) | | | 14,717,473 | |
| | |
|
|
| |
|
|
|
NET INCREASE IN NET ASSETS RESULTING FROM OPERATIONS | | | 18,019,372 | | | | 25,819,775 | |
| | |
|
|
| |
|
|
|
| DISTRIBUTIONS: | | | (11,080,580 | ) | | | (8,113,969 | ) |
| | |
|
|
| |
|
|
|
| SERIES SHARE TRANSACTIONS: | | | | | | | | |
Series shares sold [1,251,048 and 2,144,659 shares, respectively] | | | 13,719,809 | | | | 20,790,257 | |
Series shares issued in reinvestment of distributions [1,036,537 and 843,448 shares, respectively] | | | 11,080,580 | | | | 8,113,969 | |
Series shares repurchased [2,543,081 and 3,440,817 shares respectively] | | | (28,055,738 | ) | | | (33,216,872 | ) |
| | |
|
|
| |
|
|
|
NET DECREASE IN NET ASSETS RESULTING FROM SERIES SHARE TRANSACTIONS | | | (3,255,349 | ) | | | (4,312,646 | ) |
| | |
|
|
| |
|
|
|
| TOTAL INCREASE IN NET ASSETS | | | 3,683,443 | | | | 13,393,160 | |
| NET ASSETS: | | | | | | | | |
Beginning of year | | | 201,606,211 | | | | 188,213,051 | |
| | |
|
|
| |
|
|
|
End of year | | $ | 205,289,654 | | | $ | 201,606,211 | |
| | |
|
|
| |
|
|
|
SEE NOTES TO FINANCIAL STATEMENTS.
A2
| | | | |
| | | SP AIM CORE EQUITY PORTFOLIO | | |
SCHEDULE OF INVESTMENTS | December 31, 2007 |
| | | | | |
| LONG-TERM INVESTMENTS — 80.4% | | Value
(Note 2)
|
| COMMON STOCKS | | Shares
| |
| | | | | | |
Aerospace — 2.1% | | | | | |
Northrop Grumman Corp. | | 4,060 | | $ | 319,278 |
United Technologies Corp. | | 5,914 | | | 452,658 |
| | | | |
|
|
| | | | | | 771,936 |
| | | | |
|
|
Automobiles — 0.7% | | | | | |
Renault SA (France) | | 1,728 | | | 245,089 |
| | | | |
|
|
Biotechnology — 2.7% | | | | | |
Amgen, Inc.* | | 22,031 | | | 1,023,120 |
| | | | |
|
|
Commercial Banks — 1.3% | | | | | |
Barclays PLC (United Kingdom) | | 11,923 | | | 119,619 |
Lloyds TSB Group PLC (United Kingdom) | | 38,609 | | | 362,757 |
| | | | |
|
|
| | | | | | 482,376 |
| | | | |
|
|
Communication Equipment — 3.2% | | | | | |
Corning, Inc. | | 11,925 | | | 286,081 |
Motorola, Inc. | | 56,733 | | | 909,997 |
| | | | |
|
|
| | | | | | 1,196,078 |
| | | | |
|
|
Computer Hardware — 1.0% | | | | | |
Fujitsu Ltd. (Japan) | | 56,000 | | | 374,611 |
| | | | |
|
|
Computer Services & Software — 7.0% | | | | | |
Cisco Systems, Inc.* | | 18,693 | | | 506,020 |
EMC Corp.* | | 19,694 | | | 364,930 |
Microsoft Corp. | | 24,963 | | | 888,683 |
Symantec Corp.* | | 54,039 | | | 872,189 |
| | | | |
|
|
| | | | | | 2,631,822 |
| | | | |
|
|
Computers — 0.8% | | | | | |
International Business Machines Corp. | | 2,925 | | | 316,192 |
| | | | |
|
|
Computers & Peripherals — 1.0% | | | | | |
Seagate Technology (Cayman Islands) | | 14,151 | | | 360,850 |
| | | | |
|
|
Consumer Products & Services — 2.4% | | | | | |
Avon Products, Inc. | | 11,267 | | | 445,384 |
Estee Lauder Cos., Inc. (Class A Stock) | | 9,278 | | | 404,614 |
Henkel KGaA (Germany) | | 1,350 | | | 68,983 |
| | | | |
|
|
| | | | | | 918,981 |
| | | | |
|
|
Diversified Manufacturing Operations — 1.4% | | | |
General Electric Co. | | 10,551 | | | 391,126 |
Tyco International Ltd. (Bermuda) | | 3,740 | | | 148,291 |
| | | | |
|
|
| | | | | | 539,417 |
| | | | |
|
|
Electronic Components — 2.6% | | | | | |
Koninklijke (Royal) Philips Electronics NV (Netherlands) | | 9,138 | | | 394,394 |
Tyco Electronics Ltd. (Bermuda) | | 15,263 | | | 566,715 |
| | | | |
|
|
| | | | | | 961,109 |
| | | | |
|
|
Electronic Equipment & Instruments — 1.8% | | | |
Agilent Technologies, Inc.* | | 18,500 | | | 679,690 |
| | | | |
|
|
Electronics — 0.8% | | | | | |
Analog Devices, Inc. | | 9,676 | | | 306,729 |
| | | | |
|
|
Entertainment & Leisure — 0.3% | | | | | |
Sega Sammy Holdings, Inc. (Japan) | | 8,000 | | | 99,072 |
| | | | |
|
|
Financial – Brokerage — 0.1% | | | | | |
Legg Mason, Inc. | | 595 | | | 43,524 |
| | | | |
|
|
| | | | | |
| COMMON STOCKS | | Value
(Note 2)
|
| (continued) | | Shares
| |
| | | | | | |
Financial Services — 2.6% | | | | | |
Citigroup, Inc. | | 7,016 | | $ | 206,551 |
Moody’s Corp. | | 5,200 | | | 185,640 |
UBS AG (Switzerland) | | 2,514 | | | 116,357 |
Wells Fargo & Co. | | 15,829 | | | 477,878 |
| | | | |
|
|
| | | | | | 986,426 |
| | | | |
|
|
Food & Beverage — 4.4% | | | | | |
Cadbury Schweppes PLC (United Kingdom) | | 67,984 | | | 840,395 |
Coca-Cola Co. | | 4,521 | | | 277,454 |
Unilever NV (Netherlands) | | 14,737 | | | 541,888 |
| | | | |
|
|
| | | | | | 1,659,737 |
| | | | |
|
|
Healthcare Equipment & Supplies — 0.9% | | | | | |
Covidien Ltd. (Bermuda) | | 7,639 | | | 338,331 |
| | | | |
|
|
Healthcare-Products — 2.3% | | | | | |
Medtronic, Inc. | | 16,962 | | | 852,680 |
| | | | |
|
|
Industrial Conglomerates — 2.5% | | | | | |
3M Co. | | 11,128 | | | 938,313 |
| | | | |
|
|
Insurance — 6.2% | | | | | |
Berkshire Hathaway, Inc. (Class A Stock)* | | 6 | | | 849,600 |
Genworth Financial, Inc. (Class A Stock) | | 6,452 | | | 164,203 |
Marsh & McLennan Cos., Inc. | | 11,406 | | | 301,917 |
Progressive Corp. (The) | | 53,100 | | | 1,017,396 |
| | | | |
|
|
| | | | | | 2,333,116 |
| | | | |
|
|
Iron / Steel — 0.6% | | | | | |
Tenaris SA, ADR (Luxembourg) | | 4,836 | | | 216,314 |
| | | | |
|
|
Media — 2.4% | | | | | |
Comcast Corp. (Class A Stock)* | | 31,004 | | | 566,133 |
News Corp. (Class A Stock) | | 16,130 | | | 330,504 |
| | | | |
|
|
| | | | | | 896,637 |
| | | | |
|
|
Metals & Mining — 0.9% | | | | | |
Transocean, Inc.* | | 2,426 | | | 347,282 |
| | | | |
|
|
Office Equipment — 1.0% | | | | | |
Xerox Corp. | | 24,084 | | | 389,920 |
| | | | |
|
|
Oil, Gas & Consumable Fuels — 10.3% | | | | | |
Apache Corp. | | 2,807 | | | 301,865 |
BJ Services Co. | | 30,344 | | | 736,145 |
Chesapeake Energy Corp. | | 13,287 | | | 520,850 |
Exxon Mobil Corp. | | 5,649 | | | 529,255 |
Schlumberger Ltd. | | 3,050 | | | 300,029 |
Smith International, Inc. | | 4,276 | | | 315,783 |
Total SA (Class B Stock) (France) | | 5,214 | | | 433,223 |
Weatherford International Ltd. (Bermuda)* | | 6,792 | | | 465,931 |
XTO Energy, Inc. | | 5,497 | | | 282,313 |
| | | | |
|
|
| | | | | | 3,885,394 |
| | | | |
|
|
Pharmaceuticals — 6.0% | | | | | |
GlaxoSmithKline PLC, ADR (United Kingdom) | | 7,348 | | | 370,266 |
Merck & Co., Inc. | | 4,843 | | | 281,427 |
Pfizer, Inc. | | 38,796 | | | 881,833 |
Sanofi-Aventis, ADR (France) | | 3,484 | | | 158,626 |
Teva Pharmaceutical Industries Ltd., ADR (Israel) | | 12,480 | | | 580,070 |
| | | | |
|
|
| | | | | | 2,272,222 |
| | | | |
|
|
SEE NOTES TO FINANCIAL STATEMENTS.
A3
| | | | |
| | | SP AIM CORE EQUITY PORTFOLIO (Continued) | | |
SCHEDULE OF INVESTMENTS | December 31, 2007 |
| | | | | | |
| COMMON STOCKS | | Value
(Note 2)
| |
| (continued) | | Shares
| |
| | | | | | | |
Printing & Publishing — 1.0% | | | | | | |
Washington Post Co. (The)
(Class B Stock) | | 482 | | $ | 381,469 | |
| | | | |
|
|
|
Railroads — 0.7% | | | | | | |
Union Pacific Corp. | | 2,209 | | | 277,495 | |
| | | | |
|
|
|
Retail — 3.2% | | | | | | |
Kohl’s Corp.* | | 3,147 | | | 144,133 | |
Wal-Mart Stores, Inc. | | 13,573 | | | 645,125 | |
Walgreen Co. | | 10,617 | | | 404,295 | |
| | | | |
|
|
|
| | | | | | 1,193,553 | |
| | | | |
|
|
|
Software — 1.6% | | | | | | |
Automatic Data Processing, Inc. | | 13,569 | | | 604,228 | |
| | | | |
|
|
|
Telecommunications — 1.1% | | | | | | |
Nokia Corp., ADR (Finland) | | 10,308 | | | 395,724 | |
| | | | |
|
|
|
Telecommunications Wireless — 0.6% | | | | | | |
SK Telecom Co. Ltd., ADR
(South Korea) | | 8,016 | | | 239,197 | |
| | | | |
|
|
|
Transportation — 1.6% | | | | | | |
United Parcel Service, Inc.
(Class B Stock) | | 8,645 | | | 611,374 | |
| | | | |
|
|
|
Waste Management — 1.3% | | | | | | |
Waste Management, Inc. | | 14,759 | | | 482,177 | |
| | | | |
|
|
|
TOTAL LONG-TERM INVESTMENTS
(cost $26,767,614) | | | | | 30,252,185 | |
| | | | |
|
|
|
| SHORT-TERM INVESTMENT — 19.8% | | | | |
AFFILIATED MONEY MARKET MUTUAL FUND | | | | |
Dryden Core Investment Fund — Taxable Money Market Series
(cost $7,449,406)(w) | | 7,449,406 | | | 7,449,406 | |
| | | | |
|
|
|
TOTAL INVESTMENTS(o) — 100.2%
(cost $34,217,020) | | | 37,701,591 | |
LIABILITIES IN EXCESS OF
OTHER ASSETS(x) — (0.2)% | | | (79,003 | ) |
| | | | |
|
|
|
NET ASSETS — 100.0% | | $ | 37,622,588 | |
| | | | |
|
|
|
The industry classification of portfolio holdings and liabilities in excess of other assets shown as a percentage of net assets as of December 31, 2007 were as follows:
| | | |
Affiliated Money Market Mutual Fund | | 19.8 | % |
Oil, Gas & Consumable Fuels | | 10.3 | |
Computer Services & Software | | 7.0 | |
Insurance | | 6.2 | |
Pharmaceuticals | | 6.0 | |
Food & Beverage | | 4.4 | |
Communication Equipment | | 3.2 | |
Retail | | 3.2 | |
Biotechnology | | 2.7 | |
Electronic Components | | 2.6 | |
Financial Services | | 2.6 | |
Industrial Conglomerates | | 2.5 | |
Consumer Products & Services | | 2.4 | |
Media | | 2.4 | |
Healthcare-Products | | 2.3 | |
Aerospace | | 2.1 | |
Electronic Equipment & Instruments | | 1.8 | |
Software | | 1.6 | |
Transportation | | 1.6 | |
Diversified Manufacturing Operations | | 1.4 | |
Commercial Banks | | 1.3 | |
Waste Management | | 1.3 | |
Telecommunications | | 1.1 | |
Computer Hardware | | 1.0 | |
Computers & Peripherals | | 1.0 | |
Office Equipment | | 1.0 | |
Printing & Publishing | | 1.0 | |
Healthcare Equipment & Supplies | | 0.9 | |
Metals & Mining | | 0.9 | |
Computers | | 0.8 | |
Electronics | | 0.8 | |
Automobiles | | 0.7 | |
Railroads | | 0.7 | |
Iron / Steel | | 0.6 | |
Telecommunications Wireless | | 0.6 | |
Entertainment & Leisure | | 0.3 | |
Financial-Brokerage | | 0.1 | |
| | |
|
|
| | | 100.2 | |
Liabilities in excess of other assets | | (0.2 | ) |
| | |
|
|
| | | 100.0 | % |
| | |
|
|
The following abbreviations are used in portfolio descriptions:
| | |
| ADR | | American Depositary Receipt |
| JPY | | Japanese Yen |
| * | Non-income producing security. |
| (o) | As of December 31, 2007, 2 securities representing $473,683 and 1.3% of net assets were fair valued in accordance with the policies adopted by the Board of Trustees. |
| (w) | Prudential Investments LLC, the manager of the Portfolio, also serves as manager of the Dryden Core Investment Fund-Taxable Money Market Series. |
| (x) | Liabilities in excess of other assets includes unrealized depreciation on forward foreign currency exchange contracts as follows: |
Forward foreign currency exchange contracts outstanding at December 31, 2007:
| | | | | | | | | | | | | |
Sale Contract
| | Notional
Amount
(000)
| | Value at Settlement
Date Receivable
| | Current
Value
| | Unrealized
Depreciation
| |
Japanese Yen, | | | | | | | | | | | | | |
expiring 01/04/08 | | JPY | 12,886 | | $ | 112,853 | | $ | 115,343 | | $ | (2,490 | ) |
| | | | | | | | | | | |
|
|
|
SEE NOTES TO FINANCIAL STATEMENTS.
A4
| | | | |
| | | SP AIM CORE EQUITY PORTFOLIO (Continued) | | |
STATEMENT OF ASSETS AND LIABILITIES
December 31, 2007
| | | |
| ASSETS | | | |
Investments at value: | | | |
Unaffiliated investments (cost $26,767,614) | | $ | 30,252,185 |
Affiliated investments (cost $7,449,406) | | | 7,449,406 |
Foreign currency, at value (cost $125,190) | | | 127,475 |
Dividends and interest receivable | | | 62,317 |
Receivable for Series shares sold | | | 19,486 |
Tax reclaim receivable | | | 13,678 |
Prepaid expenses | | | 271 |
| | |
|
|
Total Assets | | | 37,924,818 |
| | |
|
|
| LIABILITIES | | | |
Payable for investments purchased | | | 185,714 |
Payable to custodian | | | 51,089 |
Accrued expenses and other liabilities | | | 36,592 |
Management fee payable | | | 24,043 |
Unrealized depreciation on foreign currency forward contracts | | | 2,490 |
Deferred trustees’ fees | | | 1,930 |
Transfer agent fees payable | | | 372 |
| | |
|
|
Total Liabilities | | | 302,230 |
| | |
|
|
| NET ASSETS | | $ | 37,622,588 |
| | |
|
|
Net assets were comprised of: | | | |
Paid-in capital | | $ | 29,082,395 |
Retained earnings | | | 8,540,193 |
| | |
|
|
Net assets, December 31, 2007 | | $ | 37,622,588 |
| | |
|
|
Net asset value and redemption price per share,
$37,622,588 / 4,302,314 outstanding shares of
beneficial interest | | $ | 8.74 |
| | |
|
|
STATEMENT OF OPERATIONS
Year Ended December 31, 2007
| | | | |
| INVESTMENT INCOME | | | | |
Unaffiliated dividend income (net of $13,496 foreign withholding tax) | | $ | 657,176 | |
Affiliated dividend income | | | 306,944 | |
Interest | | | 1,933 | |
| | |
|
|
|
| | | | 966,053 | |
| | |
|
|
|
| EXPENSES | | | | |
Management fee | | | 330,721 | |
Custodian’s fees and expenses | | | 61,000 | |
Shareholders’ reports | | | 38,000 | |
Audit fee | | | 17,000 | |
Trustees’ fees | | | 10,000 | |
Legal fees and expenses | | | 7,000 | |
Transfer agent’s fees and expenses (including affiliated expense of $2,600 (Note 4) | | | 3,000 | |
Insurance expenses | | | 1,000 | |
Commitment fee on syndicated credit agreement | | | 200 | |
Miscellaneous | | | 7,975 | |
| | |
|
|
|
Total expenses | | | 475,896 | |
Less: advisory fee waivers and expense reimbursements | | | (86,812 | ) |
| | |
|
|
|
Net expenses | | | 389,084 | |
| | |
|
|
|
| NET INVESTMENT INCOME | | | 576,969 | |
| | |
|
|
|
| NET REALIZED AND UNREALIZED GAIN (LOSS) ON INVESTMENTS AND FOREIGN CURRENCIES | | | | |
Net realized gain (loss) on: | | | | |
Investment transactions | | | 4,624,318 | |
Options written transactions | | | (12,440 | ) |
Foreign currency transactions | | | 11,342 | |
| | |
|
|
|
| | | | 4,623,220 | |
| | |
|
|
|
Net change in unrealized appreciation (depreciation) on: | | | | |
Investments | | | (2,255,817 | ) |
Foreign currencies | | | 1,052 | |
| | |
|
|
|
| | | | (2,254,765 | ) |
| | |
|
|
|
| NET GAIN ON INVESTMENTS AND FOREIGN CURRENCIES | | | 2,368,455 | |
| | |
|
|
|
| NET INCREASE IN NET ASSETS RESULTING FROM OPERATIONS | | $ | 2,945,424 | |
| | |
|
|
|
STATEMENT OF CHANGES IN NET ASSETS
| | | | | | | | |
| | | Year Ended December 31,
| |
| | | 2007
| | | 2006
| |
| INCREASE (DECREASE) IN NET ASSETS | | | | | | | | |
| OPERATIONS: | | | | | | | | |
Net investment income | | $ | 576,969 | | | $ | 426,593 | |
Net realized gain on investment and foreign currency transactions | | | 4,623,220 | | | | 380,047 | |
Net change in unrealized appreciation (depreciation) on investments and foreign currencies | | | (2,254,765 | ) | | | 4,471,551 | |
| | |
|
|
| |
|
|
|
NET INCREASE IN NET ASSETS RESULTING FROM OPERATIONS | | | 2,945,424 | | | | 5,278,191 | |
| | |
|
|
| |
|
|
|
| DISTRIBUTIONS | | | (798,436 | ) | | | (2,267,062 | ) |
| | |
|
|
| |
|
|
|
| SERIES SHARE TRANSACTIONS: | | | | | | | | |
Series shares sold [372,513 and 592,562 shares, respectively] | | | 3,233,422 | | | | 4,594,030 | |
Series shares issued in reinvestment of distributions [91,250 and 300,671 shares, respectively] | | | 798,436 | | | | 2,267,062 | |
Series shares repurchased [738,975 and 807,651 shares, respectively] | | | (6,437,355 | ) | | | (6,219,674 | ) |
| | |
|
|
| |
|
|
|
INCREASE (DECREASE) IN NET ASSETS RESULTING FROM SERIES SHARE TRANSACTIONS | | | (2,405,497 | ) | | | 641,418 | |
| | |
|
|
| |
|
|
|
| TOTAL INCREASE (DECREASE) IN NET ASSETS | | | (258,509 | ) | | | 3,652,547 | |
| NET ASSETS: | | | | | | | | |
Beginning of year | | | 37,881,097 | | | | 34,228,550 | |
| | |
|
|
| |
|
|
|
End of year | | $ | 37,622,588 | | | $ | 37,881,097 | |
| | |
|
|
| |
|
|
|
SEE NOTES TO FINANCIAL STATEMENTS.
A5
| | | | |
| | | SP BALANCED ASSET ALLOCATION PORTFOLIO | | |
SCHEDULE OF INVESTMENTS | December 31, 2007 |
| | | | | | |
| LONG-TERM INVESTMENTS — 99.5% | | Shares
| | Value
(Note 2)
| |
Affiliated Mutual Funds | | | | | | |
Advanced Series Trust — Marsico Capital Growth Portfolio | | 8,015,073 | | $ | 188,113,767 | |
Advanced Series Trust — Western Asset Core Plus Bond Portfolio | | 4,938,704 | | | 49,387,043 | |
The Prudential Series Fund —
Jennison Portfolio (Class I) | | 7,989,903 | | | 188,002,424 | |
Money Market Portfolio | | 141,952 | | | 1,419,516 | |
Natural Resources Portfolio (Class I) | | 543,070 | | | 30,563,998 | |
SP Large Cap Value Portfolio | | 22,527,999 | | | 265,830,394 | |
SP International Value Portfolio | | 8,764,991 | | | 93,171,853 | |
SP PIMCO High Yield Portfolio | | 290,884 | | | 2,859,392 | |
SP PIMCO Total Return Portfolio | | 36,349,515 | | | 424,198,838 | |
SP Small Cap Growth Portfolio | | 2,666,903 | | | 20,295,129 | |
SP Small Cap Value Portfolio | | 1,090,802 | | | 13,329,595 | |
SP International Growth Portfolio (Class I) | | 12,627,058 | | | 107,582,537 | |
| | | | |
|
|
|
TOTAL LONG-TERM INVESTMENTS
(cost $1,198,402,380) | | | 1,384,754,486 | |
| | | | |
|
|
|
| SHORT-TERM INVESTMENT — 0.5% | | | | | | |
AFFILIATED MONEY MARKET MUTUAL FUND | | | | | | |
Dryden Core Investment Fund — Taxable Money Market Series (cost $6,796,617) (Note 4) | | 6,796,617 | | | 6,796,617 | |
| | | | |
|
|
|
TOTAL INVESTMENTS — 100.0%
(cost $1,205,198,997)(a) | | | 1,391,551,103 | |
LIABILITIES IN EXCESS OF OTHER ASSETS — (0.0%) | | | (521,703 | ) |
| | | | |
|
|
|
NET ASSETS — 100.0% | | $ | 1,391,029,400 | |
| | | | |
|
|
|
| (a) | Prudential Investments LLC, the manager of the Portfolio, also serves as manager of the underlying portfolios in which the Portfolio invests. |
The investment allocation of portfolio holdings and liabilities in excess of other assets shown as a percentage of net assets as of December 31, 2007 were as follows:
| | | |
Investment Type
| | | |
Core Bonds | | 34.0 | % |
Large/Mid-Cap Growth | | 27.0 | |
Large/Mid-Cap Value | | 19.1 | |
International Growth | | 7.7 | |
International Value | | 6.7 | |
Sector | | 2.2 | |
Small-Cap Growth | | 1.5 | |
Small-Cap Value | | 1.0 | |
High Yield | | 0.2 | |
Money Market | | 0.1 | |
| | |
|
|
| | | 99.5 | |
Short-Term Investment | | 0.5 | |
Liabilities in excess of other assets | | — | (c) |
| | |
|
|
| | | 100.0 | % |
| | |
|
|
SEE NOTES TO FINANCIAL STATEMENTS.
A6
| | | | |
| | | SP BALANCED ASSET ALLOCATION PORTFOLIO (Continued) | | |
STATEMENT OF ASSETS AND LIABILITIES
December 31, 2007
| | | |
| ASSETS | | | |
Affiliated investments, at value (cost $1,205,198,997) | | $ | 1,391,551,103 |
Cash | | | 6,738 |
Receivable for Series shares sold | | | 43,525 |
Prepaid expenses | | | 15,219 |
Dividends receivable | | | 8,595 |
| | |
|
|
Total Assets | | | 1,391,625,180 |
| | |
|
|
| LIABILITIES | | | |
Payable for Series shares repurchased | | | 489,555 |
Management fee payable | | | 59,059 |
Accrued expenses and other liabilities | | | 45,331 |
Deferred trustees’ fees | | | 858 |
Payable for investments purchased | | | 558 |
Transfer agent fee payable | | | 419 |
| | |
|
|
Total Liabilities | | | 595,780 |
| | |
|
|
| NET ASSETS | | $ | 1,391,029,400 |
| | |
|
|
Net assets were comprised of: | | | |
Paid-in capital | | $ | 1,092,557,394 |
Retained earnings | | | 298,472,006 |
| | |
|
|
Net assets, December 31, 2007 | | $ | 1,391,029,400 |
| | |
|
|
Net asset value and redemption price per share, $1,391,029,400 / 115,492,557 outstanding shares of beneficial interest | | $ | 12.04 |
| | |
|
|
STATEMENT OF OPERATIONS
Year ended December 31, 2007
| | | |
| INVESTMENT INCOME | | | |
Affiliated dividend income | | $ | 28,995,281 |
| | |
|
|
| EXPENSES | | | |
Management fee | | | 702,114 |
Custodian’s fees and expenses | | | 45,000 |
Shareholders’ reports | | | 31,000 |
Audit fee | | | 17,000 |
Insurance expense | | | 9,000 |
Trustees’ fees | | | 7,000 |
Legal fees and expenses | | | 4,000 |
Transfer agent’s fee and expenses (including affiliated expense of $3,500) (Note 4) | | | 4,000 |
Commitment fee on syndicated credit agreement | | | 4,000 |
Interest expense | | | 121 |
Miscellaneous | | | 8,376 |
| | |
|
|
Total expenses | | | 831,611 |
| | |
|
|
| NET INVESTMENT INCOME | | | 28,163,670 |
| | |
|
|
| NET REALIZED AND UNREALIZED GAIN ON AFFILIATED INVESTMENTS | | | |
Net realized gain on investment transactions | | | 29,336,446 |
Net capital gain distributions received | | | 56,037,666 |
| | |
|
|
| | | | 85,374,112 |
Net change in unrealized appreciation (depreciation) on investments | | | 12,573,441 |
| | |
|
|
| NET GAIN ON INVESTMENTS | | | 97,947,553 |
| | |
|
|
| NET INCREASE IN NET ASSETS RESULTING FROM OPERATIONS | | $ | 126,111,223 |
| | |
|
|
STATEMENT OF CHANGES IN NET ASSETS
| | | | | | | | |
| | | Year Ended December 31,
| |
| | | 2007
| | | 2006
| |
| INCREASE (DECREASE) IN NET ASSETS | | | | | | | | |
| OPERATIONS: | | | | | | | | |
Net investment income | | $ | 28,163,670 | | | $ | 30,744,688 | |
Net realized gain on investment transactions | | | 85,374,112 | | | | 38,465,433 | |
Net change in unrealized appreciation (depreciation) on investments | | | 12,573,441 | | | | 70,777,842 | |
| | |
|
|
| |
|
|
|
NET INCREASE IN NET ASSETS RESULTING FROM OPERATIONS | | | 126,111,223 | | | | 139,987,963 | |
| | |
|
|
| |
|
|
|
| DISTRIBUTIONS | | | (69,161,551 | ) | | | (58,270,528 | ) |
| | |
|
|
| |
|
|
|
| SERIES SHARE TRANSACTIONS: | | | | | | | | |
Series shares sold [2,822,407 and 8,743,179 shares, respectively] | | | 33,772,326 | | | | 96,425,347 | |
Series shares issued in reinvestment of distributions [5,792,424 and 5,365,610 shares, respectively] | | | 69,161,551 | | | | 58,270,528 | |
Series shares repurchased [14,463,180 and 18,390,492 shares, respectively] | | | (175,165,503 | ) | | | (201,870,744 | ) |
| | |
|
|
| |
|
|
|
NET DECREASE IN NET ASSETS RESULTING FROM SERIES SHARE TRANSACTIONS | | | (72,231,626 | ) | | | (47,174,869 | ) |
| | |
|
|
| |
|
|
|
| TOTAL INCREASE (DECREASE) IN NET ASSETS | | | (15,281,954 | ) | | | 34,542,566 | |
| NET ASSETS: | | | | | | | | |
Beginning of year | | | 1,406,311,354 | | | | 1,371,768,788 | |
| | |
|
|
| |
|
|
|
End of year | | $ | 1,391,029,400 | | | $ | 1,406,311,354 | |
| | |
|
|
| |
|
|
|
SEE NOTES TO FINANCIAL STATEMENTS.
A7
| | | | |
| | | SP CONSERVATIVE ASSET ALLOCATION PORTFOLIO | | |
SCHEDULE OF INVESTMENTS | December 31, 2007 |
| | | | | | |
| LONG-TERM INVESTMENTS — 99.6% | | Shares
| | Value
(Note 2)
| |
| | | | | | | |
Affiliated Mutual Funds | | | | | | |
Advanced Series Trust — Marsico Capital Growth Portfolio | | 2,456,289 | | $ | 57,649,106 | |
Advanced Series Trust — Western Asset Core Plus Bond Portfolio | | 3,829,583 | | | 38,295,828 | |
The Prudential Series Fund —
Jennison Portfolio (Class I) | | 2,427,790 | | | 57,125,905 | |
Money Market Portfolio | | 270,495 | | | 2,704,949 | |
Natural Resources Portfolio (Class I) | | 164,746 | | | 9,271,927 | |
SP International Growth Portfolio (Class I) | | 4,006,516 | | | 34,135,514 | |
SP International Value Portfolio | | 2,641,877 | | | 28,083,154 | |
SP Large Cap Value Portfolio | | 6,942,872 | | | 81,925,884 | |
SP PIMCO High Yield Portfolio | | 210,202 | | | 2,066,286 | |
SP PIMCO Total Return Portfolio | | 25,498,639 | | | 297,569,122 | |
SP Small Cap Growth Portfolio | | 808,484 | | | 6,152,566 | |
SP Small Cap Value Portfolio | | 305,536 | | | 3,733,655 | |
| | | | |
|
|
|
TOTAL LONG-TERM INVESTMENTS
(cost $556,274,809) | | | 618,713,896 | |
| | | | |
|
|
|
| SHORT-TERM INVESTMENT — 0.5% | | | | |
Affiliated Money Market Mutual Fund | | | | | | |
Dryden Core Investment Fund — Taxable Money Market Series (cost $2,959,798)(Note 4) | | 2,959,798 | | | 2,959,798 | |
| | | | |
|
|
|
TOTAL INVESTMENTS — 100.1%
(cost $559,234,607)(a) | | | 621,673,694 | |
LIABILITIES IN EXCESS OF OTHER ASSETS — (0.1%) | | | (336,857 | ) |
| | | | |
|
|
|
NET ASSETS — 100.0% | | $ | 621,336,837 | |
| | | | |
|
|
|
| (a) | Prudential Investments LLC, the manager of the Portfolio, also serves as manager of the underlying portfolios in which the Portfolio invests. |
The investment allocation of portfolio holdings and liabilities in excess of other assets shown as a percentage of net assets as of December 31, 2007 were as follows:
| | | |
Investment Type
| | | |
Core Bonds | | 54.1 | % |
Large/Mid-Cap Growth | | 18.5 | |
Large/Mid-Cap Value | | 13.2 | |
International Growth | | 5.5 | |
International Value | | 4.5 | |
Sector | | 1.5 | |
Small-Cap Growth | | 1.0 | |
Small-Cap Value | | 0.6 | |
Money Market | | 0.4 | |
High Yield | | 0.3 | |
| | |
|
|
| | | 99.6 | |
Short-Term Investment | | 0.5 | |
Liabilities in excess of other assets | | (0.1 | ) |
| | |
|
|
| | | 100.0 | % |
| | |
|
|
SEE NOTES TO FINANCIAL STATEMENTS.
A8
| | | | |
| | | SP CONSERVATIVE ASSET ALLOCATION PORTFOLIO (Continued) | | |
STATEMENT OF ASSETS AND LIABILITIES
December 31, 2007
| | | |
| ASSETS | | | |
Affiliated investments, at value (cost $559,234,607) | | $ | 621,673,694 |
Cash | | | 6,765 |
Receivable for Series shares sold | | | 17,942 |
Dividends receivable | | | 4,401 |
Prepaid expenses and other assets | | | 6,787 |
| | |
|
|
Total Assets | | | 621,709,589 |
| | |
|
|
| LIABILITIES | | | |
Payable for Series shares repurchased | | | 300,885 |
Accrued expenses and other liabilities | | | 43,189 |
Management fee payable | | | 26,340 |
Payable for investments purchased | | | 1,063 |
Deferred trustees’ fees | | | 857 |
Transfer agent fee payable | | | 418 |
| | |
|
|
Total Liabilities | | | 372,752 |
| | |
|
|
| NET ASSETS | | $ | 621,336,837 |
| | |
|
|
Net assets were comprised of: | | | |
Paid-in capital | | $ | 514,937,914 |
Retained earnings | | | 106,398,923 |
| | |
|
|
Net assets, December 31, 2007 | | $ | 621,336,837 |
| | |
|
|
Net asset value and redemption price per share, $621,336,837 / 51,388,032 outstanding shares of beneficial interest | | $ | 12.09 |
| | |
|
|
STATEMENT OF OPERATIONS
Year Ended December 31, 2007
| | | |
| INVESTMENT INCOME | | | |
Affiliated dividend income | | $ | 17,213,854 |
| | |
|
|
| EXPENSES | | | |
Management fee | | | 314,074 |
Custodian’s fees and expenses | | | 44,000 |
Shareholders’ reports | | | 31,000 |
Audit fee | | | 17,000 |
Trustees’ fees | | | 6,000 |
Insurance expenses | | | 4,000 |
Legal fees and expenses | | | 4,000 |
Transfer agent’s fees and expenses (including affiliated expense of $3,000) (Note 4) | | | 3,000 |
Commitment fee on syndicated credit agreement | | | 1,500 |
Miscellaneous | | | 8,585 |
| | |
|
|
Total expenses | | | 433,159 |
| | |
|
|
| NET INVESTMENT INCOME | | | 16,780,695 |
| | |
|
|
| NET REALIZED AND UNREALIZED GAIN ON AFFILIATED INVESTMENTS | | | |
Net realized gain on investment transactions | | | 10,663,968 |
Net capital gain distributions received | | | 17,207,633 |
| | |
|
|
| | | | 27,871,601 |
Net change in unrealized appreciation (depreciation) on investments | | | 11,875,158 |
| | |
|
|
| NET GAIN ON INVESTMENTS | | | 39,746,759 |
| | |
|
|
| NET INCREASE IN NET ASSETS RESULTING FROM OPERATIONS | | $ | 56,527,454 |
| | |
|
|
STATEMENT OF CHANGES IN NET ASSETS
| | | | | | | | |
| | | Year Ended December 31,
| |
| | | 2007
| | | 2006
| |
| INCREASE (DECREASE) IN NET ASSETS | | | | | | | | |
| OPERATIONS: | | | | | | | | |
Net investment income | | $ | 16,780,695 | | | $ | 18,651,880 | |
Net realized gain on investment transactions | | | 27,871,601 | | | | 13,468,622 | |
Net change in unrealized appreciation (depreciation) on investments | | | 11,875,158 | | | | 20,212,384 | |
| | |
|
|
| |
|
|
|
NET INCREASE IN NET ASSETS RESULTING FROM OPERATIONS | | | 56,527,454 | | | | 52,332,886 | |
| | |
|
|
| |
|
|
|
| DISTRIBUTIONS: | | | (32,125,621 | ) | | | (31,649,902 | ) |
| | |
|
|
| |
|
|
|
| SERIES SHARE TRANSACTIONS: | | | | | | | | |
Series shares sold [1,460,726 and 3,731,103 shares, respectively] | | | 17,545,432 | | | | 41,820,894 | |
Series shares issued in reinvestment of distributions [2,686,089 and 2,869,438 shares, respectively] | | | 32,125,621 | | | | 31,649,902 | |
Series shares repurchased [7,029,208 and 9,218,672 shares, respectively] | | | (85,525,482 | ) | | | (103,341,968 | ) |
| | |
|
|
| |
|
|
|
NET DECREASE IN NET ASSETS RESULTING FROM SERIES SHARE TRANSACTIONS | | | (35,854,429 | ) | | | (29,871,172 | ) |
| | |
|
|
| |
|
|
|
| TOTAL DECREASE IN NET ASSETS | | | (11,452,596 | ) | | | (9,188,188 | ) |
| NET ASSETS: | | | | | | | | |
Beginning of year | | | 632,789,433 | | | | 641,977,621 | |
| | |
|
|
| |
|
|
|
End of year | | $ | 621,336,837 | | | $ | 632,789,433 | |
| | |
|
|
| |
|
|
|
SEE NOTES TO FINANCIAL STATEMENTS.
A9
SCHEDULE OF INVESTMENTS | December 31, 2007 |
| | | | | |
| LONG-TERM INVESTMENTS — 99.3% | | Value
(Note 2)
|
| COMMON STOCKS | | Shares
| |
| | | | | | |
Automobile Manufacturers — 0.6% | | | | | |
CarMax, Inc.*(a) | | 90,900 | | $ | 1,795,275 |
| | | | |
|
|
Beverages — 1.1% | | | | | |
Heineken Holding NV (Netherlands) | | 61,406 | | | 3,477,133 |
| | | | |
|
|
Broadcasting — 0.4% | | | | | |
Grupo Televisia S.A., ADR (Mexico) | | 47,000 | | | 1,117,190 |
| | | | |
|
|
Business Services — 1.9% | | | | | |
Iron Mountain, Inc.*(a) | | 135,200 | | | 5,005,104 |
Sino-Forest Corp (Canada)* | | 41,100 | | | 892,836 |
| | | | |
|
|
| | | | | | 5,897,940 |
| | | | |
|
|
Cable Television — 0.3% | | | | | |
Virgin Media, Inc. ( United Kingdom ) | | 54,317 | | | 930,993 |
| | | | |
|
|
Commercial Banks — 1.3% | | | | | |
Bank of New York Mellon Corp. (The) | | 85,200 | | | 4,154,352 |
| | | | |
|
|
Computers — 1.8% | | | | | |
Dell, Inc.*(a) | | 131,000 | | | 3,210,810 |
Hewlett-Packard Co. | | 46,200 | | | 2,332,176 |
| | | | |
|
|
| | | | | | 5,542,986 |
| | | | |
|
|
Construction — 0.2% | | | | | |
Hunter Douglas NV (Netherlands) | | 8,453 | | | 626,340 |
| | | | |
|
|
Containers & Packaging — 1.5% | | | | | |
Sealed Air Corp.(a) | | 196,400 | | | 4,544,696 |
| | | | |
|
|
Cosmetics & Toiletries — 0.4% | | | | | |
Avon Products, Inc. | | 34,700 | | | 1,371,691 |
| | | | |
|
|
Diversified Financial Services — 1.3% | | | | | |
E*Trade Financial Corp.*(a) | | 18,100 | | | 64,255 |
Merrill Lynch & Co., 144A
(cost $4,214,400; purchased 12/24/07)(f)(g) | | 87,800 | | | 4,100,400 |
| | | | |
|
|
| | | | | | 4,164,655 |
| | | | |
|
|
Diversified Metals — 0.8% | | | | | |
BHP Billiton PLC (United Kingdom) | | 33,900 | | | 1,043,264 |
Rio Tinto PLC (United Kingdom) | | 12,100 | | | 1,280,669 |
| | | | |
|
|
| | | | | | 2,323,933 |
| | | | |
|
|
Electronic Equipment & Instruments — 1.8% | | | |
Agilent Technologies, Inc.* | | 49,800 | | | 1,829,652 |
Tyco Electronics Ltd. | | 97,538 | | | 3,621,586 |
| | | | |
|
|
| | | | | | 5,451,238 |
| | | | |
|
|
Entertainment & Leisure — 1.2% | | | | | |
Harley-Davidson, Inc.(a) | | 82,800 | | | 3,867,588 |
| | | | |
|
|
Financial – Bank & Trust — 2.0% | | | | | |
HSBC Holdings PLC (United Kingdom) | | 92,466 | | | 1,549,813 |
Wachovia Corp. | | 122,907 | | | 4,674,153 |
| | | | |
|
|
| | | | | | 6,223,966 |
| | | | |
|
|
Financial Services — 9.3% | | | | | |
American Express Co. | | 236,700 | | | 12,313,134 |
Ameriprise Financial, Inc. | | 55,860 | | | 3,078,445 |
Commerce Bancorp, Inc. | | 48,500 | | | 1,849,790 |
Discover Financial Services LLC | | 13,000 | | | 196,040 |
H&R Block, Inc. | | 130,400 | | | 2,421,528 |
| | | | | |
COMMON STOCKS
(continued) | | Shares
| | Value
(Note 2)
|
| | | | | | |
Financial Services (continued) | | | | | |
Moody’s Corp.(a) | | 57,100 | | $ | 2,038,470 |
State Street Corp. | | 8,100 | | | 657,720 |
Wells Fargo & Co. | | 204,800 | | | 6,182,912 |
| | | | |
|
|
| | | | | | 28,738,039 |
| | | | |
|
|
Foods — 1.5% | | | | | |
Diageo PLC, ADR (United Kingdom) | | 48,300 | | | 4,145,589 |
Hershey Co. | | 12,900 | | | 508,260 |
| | | | |
|
|
| | | | | | 4,653,849 |
| | | | |
|
|
Healthcare Equipment & Supplies — 1.5% | | | | | |
Covidien Ltd. (Bermuda) | | 101,538 | | | 4,497,118 |
| | | | |
|
|
Healthcare Providers & Services — 2.5% | | | | | |
Cardinal Health, Inc. | | 39,900 | | | 2,304,225 |
Express Scripts, Inc.*(a) | | 30,700 | | | 2,241,100 |
UnitedHealth Group, Inc. | | 56,800 | | | 3,305,760 |
| | | | |
|
|
| | | | | | 7,851,085 |
| | | | |
|
|
Household Products — 1.2% | | | | | |
Procter & Gamble Co. | | 49,500 | | | 3,634,290 |
| | | | |
|
|
Industrial Conglomerates — 1.3% | | | | | |
Tyco International Ltd. (Bermuda) | | 101,538 | | | 4,025,982 |
| | | | |
|
|
Insurance — 15.7% | | | | | |
AMBAC Financial Group, Inc.(a) | | 25,300 | | | 651,981 |
American International Group, Inc. | | 186,800 | | | 10,890,440 |
AON Corp. | | 40,510 | | | 1,931,922 |
Berkshire Hathaway, Inc.
(Class A Stock)* | | 92 | | | 13,027,200 |
Loews Corp. | | 146,200 | | | 7,359,708 |
Markel Corp.* | | 534 | | | 262,247 |
MBIA, Inc.(a) | | 22,100 | | | 411,723 |
Millea Holdings, Inc. (Japan) | | 80,900 | | | 2,716,012 |
NIPPONKOA Insurance Co. Ltd. (Japan) | | 171,800 | | | 1,559,751 |
Principal Financial Group, Inc. | | 16,400 | | | 1,128,976 |
Progressive Corp. | | 251,000 | | | 4,809,160 |
Sun Life Financial, Inc. (Canada) | | 10,100 | | | 564,994 |
Transatlantic Holdings, Inc. | | 42,575 | | | 3,093,925 |
| | | | |
|
|
| | | | | | 48,408,039 |
| | | | |
|
|
Internet & Catalog Retail — 0.3% | | | | | |
Liberty Media Corp. — Interactive
(Class A Stock)* | | 42,825 | | | 817,101 |
| | | | |
|
|
Internet Services — 0.6% | | | | | |
Google, Inc. (Class A Stock)* | | 2,520 | | | 1,742,530 |
| | | | |
|
|
Internet Software & Services — 0.3% | | | | | |
Amazon.com, Inc.*(a) | | 11,200 | | | 1,037,568 |
| | | | |
|
|
Investment Firms — 4.8% | | | | | |
Citigroup, Inc. | | 91,500 | | | 2,693,760 |
JPMorgan Chase & Co. | | 249,416 | | | 10,887,008 |
Morgan Stanley | | 26,200 | | | 1,391,482 |
| | | | |
|
|
| | | | | | 14,972,250 |
| | | | |
|
|
Materials — 1.0% | | | | | |
Martin Marietta Materials, Inc. | | 23,800 | | | 3,155,880 |
| | | | |
|
|
SEE NOTES TO FINANCIAL STATEMENTS.
A10
| | | | |
| | | SP DAVIS VALUE PORTFOLIO (Continued) | | |
SCHEDULE OF INVESTMENTS | December 31, 2007 |
| | | | | |
COMMON STOCKS
(continued) | | Shares
| | Value
(Note 2)
|
| | | | | | |
Media — 5.0% | | | | | |
Comcast Corp.
(Special Class A Stock)*(a) | | 351,800 | | $ | 6,374,616 |
Lagardere SCA (France) | | 23,900 | | | 1,792,229 |
Liberty Media Corp. — Capital
(Class A Stock)* | | 8,625 | | | 1,004,726 |
News Corp.
(Class A Stock) | | 234,600 | | | 4,806,954 |
WPP Group PLC, ADR
(United Kingdom)(a) | | 21,300 | | | 1,369,377 |
| | | | |
|
|
| | | | | | 15,347,902 |
| | | | |
|
|
Metals & Mining — 2.1% | | | | | |
China Coal Energy Co. (Hong Kong) | | 1,140,700 | | | 3,517,178 |
Transocean, Inc.(a) | | 20,708 | | | 2,964,350 |
| | | | |
|
|
| | | | | | 6,481,528 |
| | | | |
|
|
Mining — 0.6% | | | | | |
Vulcan Materials Co. | | 23,100 | | | 1,826,979 |
| | | | |
|
|
Multi-Line Retail — 0.1% | | | | | |
Sears Holdings Corp.* | | 4,200 | | | 428,610 |
| | | | |
|
|
Oil, Gas & Consumable Fuels — 14.0% | | | | | |
Canadian Natural Resources Ltd. (Canada) | | 54,100 | | | 3,956,874 |
ConocoPhillips | | 160,540 | | | 14,175,682 |
Devon Energy Corp. | | 91,700 | | | 8,153,047 |
EOG Resources, Inc. | | 79,870 | | | 7,128,397 |
Occidental Petroleum Corp. | | 126,900 | | | 9,770,031 |
| | | | |
|
|
| | | | | | 43,184,031 |
| | | | |
|
|
Real Estate Operation & Development — 0.4% | | | |
Hang Lung Group Ltd. (Hong Kong) | | 215,000 | | | 1,161,747 |
| | | | |
|
|
Retail & Merchandising — 8.2% | | | | | |
Bed Bath & Beyond, Inc.*(a) | | 51,100 | | | 1,501,829 |
Costco Wholesale Corp. | | 206,900 | | | 14,433,344 |
CVS Caremark Corp. | | 110,610 | | | 4,396,748 |
Wal-Mart Stores, Inc. | | 104,100 | | | 4,947,873 |
| | | | |
|
|
| | | | | | 25,279,794 |
| | | | |
|
|
Semiconductors & Semiconductor Equipment — 0.7% |
Texas Instruments, Inc.(a) | | 64,300 | | | 2,147,620 |
| | | | |
|
|
Software — 3.4% | | | | | |
Dun & Bradstreet Corp. | | 30,900 | | | 2,738,667 |
Microsoft Corp. | | 219,500 | | | 7,814,200 |
| | | | |
|
|
| | | | | | 10,552,867 |
| | | | |
|
|
Specialty Retail — 0.3% | | | | | |
Lowe’s Cos., Inc. | | 46,400 | | | 1,049,568 |
| | | | |
|
|
Telecommunications Wireless — 1.3% | | | | | |
SK Telecom Co. Ltd., ADR
(South Korea) | | 58,000 | | | 1,730,720 |
Sprint Nextel Corp. | | 171,000 | | | 2,245,230 |
| | | | |
|
|
| | | | | | 3,975,950 |
| | | | |
|
|
Tobacco — 3.7% | | | | | |
Altria Group, Inc. | | 150,200 | | | 11,352,116 |
| | | | |
|
|
Transportation — 1.7% | | | | | |
Asciano Group (Australia) | | 34,500 | | | 210,287 |
China Shipping Development Co. Ltd. (China) | | 390,000 | | | 1,030,344 |
| | | | | | |
COMMON STOCKS
(continued) | | Shares
| | Value
(Note 2)
| |
| | | | | | | |
Transportation (continued) | | | | | | |
Cosco Pacific Ltd. (Hong Kong) | | 409,200 | | $ | 1,077,837 | |
Kuehne & Nagel International AG (Switzerland) | | 13,145 | | | 1,259,756 | |
Toll Holdings Ltd. (Australia) | | 45,124 | | | 450,523 | |
United Parcel Service, Inc.
(Class B Stock) | | 18,600 | | | 1,315,392 | |
| | | | |
|
|
|
| | | | | | 5,344,139 | |
| | | | |
|
|
|
Transportation/Shipping — 1.2% | | | | | | |
China Merchants Holdings International Co. Ltd. (Hong Kong) | | 598,000 | | | 3,661,403 | |
| | | | |
|
|
|
TOTAL LONG-TERM INVESTMENTS
(cost $211,913,264) | | | 306,817,961 | |
| | | | |
|
|
|
| SHORT-TERM INVESTMENT — 11.0% | | | | |
Affiliated Money Market Mutual Fund | | | | |
Dryden Core Investment Fund — Taxable Money Market Series
(cost $34,078,567; includes $31,986,826 of cash collateral for securities on loan)(b)(w)(Note 4) | | 34,078,567 | | | 34,078,567 | |
| | | | |
|
|
|
TOTAL INVESTMENTS(o) — 110.3%
(cost $245,991,831) | | | 340,896,528 | |
| | | | |
|
|
|
LIABILITIES IN EXCESS OF
OTHER ASSETS — (10.3)% | | | (31,881,925 | ) |
| | | | |
|
|
|
NET ASSETS — 100.0% | | $ | 309,014,603 | |
| | | | |
|
|
|
The following abbreviation is used in the portfolio descriptions:
| | |
| 144A | | Security was purchased pursuant to Rule 144A under the securities Act of 1933 and may not be resold subject to that rule except to qualified institutional buyers. Unless otherwise noted, 144A securities are deemed to be liquid. |
| ADR | | American Depositary Receipt |
| * | Non-income producing security. |
| (a) | All or a portion of security is on loan. The aggregate market value of such securities is $30,714,678; cash collateral of $31,986,826 (included with liabilities) was received with which the portfolio purchased highly liquid short-term investments. |
| (b) | Represents security, or a portion thereof, purchased with cash collateral received for securities on loan. |
| (f) | Private Placement restricted as to resale and does not have a readily available market. The aggregate cost of such securities is $4,214,400. The aggregate value of $4,100,400 is approximately 1.3% of net assets. |
| (g) | Indicates a security that has been deemed illiquid. |
| (o) | As of December 31, 2007, 9 securities representing $18,455,139 and 6.0% of net assets were fair valued in accordance with the policies adopted by the Board of Trustees. |
| (w) | Prudential Investments LLC, the manager of the Portfolio, also serves as manager of the Dryden Core Investment Fund – Taxable Money Market Series. |
SEE NOTES TO FINANCIAL STATEMENTS.
A11
| | | | |
| | | SP DAVIS VALUE PORTFOLIO (Continued) | | |
SCHEDULE OF INVESTMENTS | December 31, 2007 |
The industry classification of investments and liabilities in excess of other assets shown as a percentage of net assets as of December 31, 2007 were as follows:
| | | |
Insurance | | 15.7 | % |
Oil, Gas & Consumable Fuels | | 14.0 | |
Affiliated Money Market Mutual Fund (10.4% represents investments purchased with collateral from securities on loan) | | 11.0 | |
Financial Services | | 9.3 | |
Retail & Merchandising | | 8.2 | |
Media | | 5.0 | |
Investment Firms | | 4.8 | |
Tobacco | | 3.7 | |
Software | | 3.4 | |
Healthcare Providers & Services | | 2.5 | |
Metals & Mining | | 2.1 | |
Financial – Bank & Trust | | 2.0 | |
Business Services | | 1.9 | |
Computers | | 1.8 | |
Electronic Equipment & Instruments | | 1.8 | |
Transportation | | 1.7 | |
Foods | | 1.5 | |
Containers & Packaging | | 1.5 | |
Healthcare Equipment & Supplies | | 1.5 | |
Diversified Financial Services | | 1.3 | |
Commercial Banks | | 1.3 | |
Industrial Conglomerates | | 1.3 | |
Telecommunications Wireless | | 1.3 | |
Entertainment & Leisure | | 1.2 | |
Transportation/Shipping | | 1.2 | |
Household Products | | 1.2 | |
Beverages | | 1.1 | |
Materials | | 1.0 | |
Diversified Metals | | 0.8 | |
Semiconductors & Semiconductor Equipment | | 0.7 | |
Mining | | 0.6 | |
Automobile Manufacturers | | 0.6 | |
Internet Services | | 0.6 | |
Cosmetics & Toiletries | | 0.4 | |
Real Estate Operation & Development | | 0.4 | |
Broadcasting | | 0.4 | |
Specialty Retail | | 0.3 | |
Internet Software & Services | | 0.3 | |
Cable Television | | 0.3 | |
Internet & Catalog Retail | | 0.3 | |
Construction | | 0.2 | |
Multi-line Retail | | 0.1 | |
| | |
|
|
| | | 110.3 | |
Liabilities in excess of other assets | | (10.3 | ) |
| | |
|
|
| | | 100.0 | % |
| | |
|
|
SEE NOTES TO FINANCIAL STATEMENTS.
A12
| | | | |
| | | SP DAVIS VALUE PORTFOLIO (Continued) | | |
STATEMENT OF ASSETS AND LIABILITIES
December 31, 2007
| | | |
| ASSETS | | | |
Investments at value, including securities on loan of $30,714,678: | | | |
Unaffiliated investments (cost $211,913,264) | | $ | 306,817,961 |
Affiliated investments (cost $34,078,567) | | | 34,078,567 |
Receivable for investments sold | | | 422,469 |
Dividends and interest receivable | | | 359,727 |
Receivable for Series shares sold | | | 47,413 |
Tax reclaim receivable | | | 24,391 |
Prepaid expenses | | | 2,340 |
| | |
|
|
Total Assets | | | 341,752,868 |
| | |
|
|
| LIABILITIES | | | |
Collateral for securities on loan | | | 31,986,826 |
Payable for investments purchased | | | 294,806 |
Management fee payable | | | 198,287 |
Payable to custodian | | | 166,183 |
Payable for Series shares repurchased | | | 30,974 |
Accrued expenses and other liabilities | | | 58,385 |
Deferred trustees’ fees | | | 2,454 |
Transfer agent fees payable | | | 350 |
| | |
|
|
Total Liabilities | | | 32,738,265 |
| | |
|
|
| NET ASSETS | | $ | 309,014,603 |
| | |
|
|
Net assets were comprised of: | | | |
Paid-in capital | | $ | 195,365,338 |
Retained earnings | | | 113,649,265 |
| | |
|
|
Net assets, December 31, 2007 | | $ | 309,014,603 |
| | |
|
|
Net asset value and redemption price per share, $309,014,603 / 25,753,045 outstanding shares of beneficial interest | | $ | 12.00 |
| | |
|
|
STATEMENT OF OPERATIONS
Year Ended December 31, 2007
| | | | |
| INVESTMENT INCOME | | | | |
Unaffiliated dividend income (net of $42,333 foreign withholding tax) | | $ | 5,951,048 | |
Affiliated dividend income | | | 195,002 | |
Affiliated income from securities lending, net | | | 81,458 | |
| | |
|
|
|
| | | | 6,227,508 | |
| | |
|
|
|
| EXPENSES | | | | |
Management fee | | | 2,446,602 | |
Custodian’s fees and expenses | | | 87,000 | |
Shareholders’ reports | | | 29,000 | |
Audit fee | | | 17,000 | |
Trustees’ fees | | | 13,000 | |
Insurance expenses | | | 10,000 | |
Legal fees and expenses | | | 7,000 | |
Transfer agent’s fees and expenses (including affiliated expense of $2,000) (Note 4) | | | 2,000 | |
Commitment fee on syndicated credit agreement | | | 1,000 | |
Miscellaneous | | | 8,678 | |
| | |
|
|
|
Total expenses | | | 2,621,280 | |
| | |
|
|
|
| NET INVESTMENT INCOME | | | 3,606,228 | |
| | |
|
|
|
| NET REALIZED AND UNREALIZED GAIN (LOSS) ON INVESTMENTS AND FOREIGN CURRENCIES | | | | |
Net realized gain (loss) on: | | | | |
Investment transactions | | | 15,387,036 | |
Foreign currency transactions | | | (26,775 | ) |
| | |
|
|
|
| | | | 15,360,261 | |
| | |
|
|
|
Net change in unrealized appreciation (depreciation) on: | | | | |
Investments | | | (4,115,088 | ) |
Foreign currencies | | | (2,084 | ) |
| | |
|
|
|
| | | | (4,117,172 | ) |
| | |
|
|
|
| NET GAIN ON INVESTMENTS AND FOREIGN CURRENCIES | | | 11,243,089 | |
| | |
|
|
|
| NET INCREASE IN NET ASSETS RESULTING FROM OPERATIONS | | $ | 14,849,317 | |
| | |
|
|
|
STATEMENT OF CHANGES IN NET ASSETS
| | | | | | | | |
| | | Year Ended December 31,
| |
| | | 2007
| | | 2006
| |
| INCREASE (DECREASE) IN NET ASSETS | | | | | | | | |
| OPERATIONS: | | | | | | | | |
Net investment income | | $ | 3,606,228 | | | $ | 2,532,874 | |
Net realized gain on investment and foreign currency transactions | | | 15,360,261 | | | | 10,716,506 | |
Net change in unrealized appreciation (depreciation) on investments and foreign currencies | | | (4,117,172 | ) | | | 30,817,262 | |
| | |
|
|
| |
|
|
|
NET INCREASE IN NET ASSETS RESULTING FROM OPERATIONS | | | 14,849,317 | | | | 44,066,642 | |
| | |
|
|
| |
|
|
|
| DISTRIBUTIONS | | | (13,230,456 | ) | | | (7,711,471 | ) |
| | |
|
|
| |
|
|
|
| SERIES SHARE TRANSACTIONS: | | | | | | | | |
Series shares sold [1,130,984 and 2,724,387 shares, respectively] | | | 13,913,747 | | | | 29,848,117 | |
Series shares issued in reinvestment of distributions [1,113,675 and 714,025 shares, respectively] | | | 13,230,457 | | | | 7,711,471 | |
Series shares repurchased [3,844,986 and 5,281,525 shares, respectively] | | | (47,719,907 | ) | | | (57,687,525 | ) |
| | |
|
|
| |
|
|
|
DECREASE IN NET ASSETS RESULTING FROM SERIES SHARE TRANSACTIONS | | | (20,575,703 | ) | | | (20,127,937 | ) |
| | |
|
|
| |
|
|
|
| TOTAL INCREASE (DECREASE) IN NET ASSETS | | | (18,956,842 | ) | | | 16,227,234 | |
| NET ASSETS: | | | | | | | | |
Beginning of year | | | 327,971,445 | | | | 311,744,211 | |
| | |
|
|
| |
|
|
|
End of year | | $ | 309,014,603 | | | $ | 327,971,445 | |
| | |
|
|
| |
|
|
|
SEE NOTES TO FINANCIAL STATEMENTS.
A13
| | | | |
| | | SP GROWTH ASSET ALLOCATION PORTFOLIO | | |
SCHEDULE OF INVESTMENTS | December 31, 2007 |
| | | | | | |
| LONG-TERM INVESTMENTS — 99.5% | | Shares
| | Value
(Note2)
| |
Affiliated Mutual Funds | | | | | | |
Advanced Series Trust — Marsico Capital Growth Portfolio | | 9,375,059 | | $ | 220,032,635 | |
Advanced Series Trust — Western Asset Core Plus Bond Portfolio | | 1,992,600 | | | 19,926,000 | |
The Prudential Series Fund —
Jennison Portfolio (Class I) | | 9,393,649 | | | 221,032,569 | |
Money Market Portfolio | | 6,260 | | | 62,600 | |
Natural Resources Portfolio (Class I) | | 635,537 | | | 35,768,000 | |
SP Large Cap Value Portfolio | | 26,593,097 | | | 313,798,543 | |
SP International Growth Portfolio (Class I) | | 14,876,716 | | | 126,749,617 | |
SP International Value Portfolio | | 10,560,221 | | | 112,255,144 | |
SP PIMCO High Yield Portfolio | | 2,249 | | | 22,110 | |
SP PIMCO Total Return Portfolio | | 13,587,098 | | | 158,561,430 | |
SP Small Cap Growth Portfolio | | 3,150,178 | | | 23,972,858 | |
SP Small Cap Value Portfolio | | 1,192,153 | | | 14,568,108 | |
| | | | |
|
|
|
TOTAL LONG-TERM INVESTMENTS
(cost $1,042,512,845) | | | 1,246,749,614 | |
| | | | |
|
|
|
| SHORT-TERM INVESTMENT — 0.5% | | | | | | |
Affiliated Money Market Mutual Fund | | | | | | |
Dryden Core Investment Fund — Taxable Money Market Series (cost 6,471,032) (Note 4) | | 6,471,032 | | | 6,471,032 | |
| | | | |
|
|
|
TOTAL INVESTMENTS — 100.0%
(cost $1,048,983,877)(a) | | | 1,253,220,646 | |
LIABILITIES IN EXCESS OF OTHER ASSETS | | | (561,721 | ) |
| | | | |
|
|
|
NET ASSETS — 100.0% | | $ | 1,252,658,925 | |
| | | | |
|
|
|
| (a) | Prudential Investments LLC, the manager of the Portfolio, also serves as manager of the underlying portfolios in which the Portfolio invests. |
The investment allocation of portfolio holdings and liabilities in excess of other assets shown as a percentage of net assets as of December 31, 2007 were as follows:
| | | |
Investment Type
| | | |
Large/Mid-Cap Growth | | 35.2 | % |
Large/Mid-Cap Value | | 25.0 | |
Core Bonds | | 14.2 | |
International Growth | | 10.1 | |
International Value | | 9.0 | |
Sector | | 2.9 | |
Small-Cap Growth | | 1.9 | |
Small-Cap Value | | 1.2 | |
| | |
|
|
| | | 99.5 | |
Short-Term Investment | | 0.5 | |
| | |
|
|
| | | 100.0 | % |
| | |
|
|
SEE NOTES TO FINANCIAL STATEMENTS.
A14
| | | | |
| | | SP GROWTH ASSET ALLOCATION PORTFOLIO (Continued) | | |
STATEMENT OF ASSETS AND LIABILITIES
December 31, 2007
| | | |
| ASSETS | | | |
Affiliated investments, at value (cost $1,048,983,877) | | $ | 1,253,220,646 |
Cash | | | 6,615 |
Receivable for Series shares sold | | | 39,014 |
Prepaid expenses | | | 14,035 |
Dividends receivable | | | 7,666 |
| | |
|
|
Total Assets | | | 1,253,287,976 |
| | |
|
|
| LIABILITIES | | | |
Payable for Series shares repurchased | | | 524,806 |
Management fee payable | | | 53,371 |
Accrued expenses and other liabilities | | | 50,215 |
Transfer agent fee payable | | | 634 |
Payable for investments purchased | | | 25 |
| | |
|
|
Total Liabilities | | | 629,051 |
| | |
|
|
| NET ASSETS | | $ | 1,252,658,925 |
| | |
|
|
Net assets were comprised of: | | | |
Paid-in capital | | $ | 933,594,231 |
Retained earnings | | | 319,064,694 |
| | |
|
|
Net assets, December 31, 2007 | | $ | 1,252,658,925 |
| | |
|
|
Net asset value and redemption price per share, $1,252,658,925 / 108,036,663 outstanding shares of beneficial interest | | $ | 11.59 |
| | |
|
|
STATEMENT OF OPERATIONS
Year Ended December 31, 2007
| | | | |
| INVESTMENT INCOME | | | | |
Affiliated dividend income | | $ | 17,711,091 | |
| | |
|
|
|
| EXPENSES | | | | |
Management fee | | | 641,849 | |
Custodian’s fees and expenses | | | 44,000 | |
Shareholders’ reports | | | 33,000 | |
Audit fee | | | 17,000 | |
Insurance expenses | | | 8,000 | |
Trustees’ fees | | | 7,000 | |
Legal fees and expenses | | | 5,000 | |
Transfer agent’s fee and expenses (including affiliated expense of $3,800) (Note 4) | | | 5,000 | |
Commitment fee on syndicated credit agreement | | | 4,000 | |
Miscellaneous | | | 9,317 | |
| | |
|
|
|
Total expenses | | | 774,166 | |
| | |
|
|
|
| NET INVESTMENT INCOME | | | 16,936,925 | |
| | |
|
|
|
| NET REALIZED AND UNREALIZED GAIN ON AFFILIATED INVESTMENTS | | | | |
Net realized gain on investment transactions | | | 32,809,944 | |
Net capital gain distributions received | | | 66,397,750 | |
| | |
|
|
|
| | | | 99,207,694 | |
Net change in unrealized appreciation (depreciation) on investments | | | (1,774,234 | ) |
| | |
|
|
|
| NET GAIN ON INVESTMENTS | | | 97,433,460 | |
| | |
|
|
|
| NET INCREASE IN NET ASSETS RESULTING FROM OPERATIONS | | $ | 114,370,385 | |
| | |
|
|
|
STATEMENT OF CHANGES IN NET ASSETS
| | | | | | | | |
| | | Year Ended December 31,
| |
| | | 2007
| | | 2006
| |
| INCREASE (DECREASE) IN NET ASSETS | | | | | | | | |
| OPERATIONS: | | | | | | | | |
Net investment income | | $ | 16,936,925 | | | $ | 18,680,882 | |
Net realized gain on investment transactions | | | 99,207,694 | | | | 43,928,941 | |
Net change in unrealized appreciation (depreciation) on investments | | | (1,774,234 | ) | | | 87,976,514 | |
| | |
|
|
| |
|
|
|
NET INCREASE IN NET ASSETS RESULTING FROM OPERATIONS | | | 114,370,385 | | | | 150,586,337 | |
| | |
|
|
| |
|
|
|
| DISTRIBUTIONS | | | (62,515,434 | ) | | | (41,746,770 | ) |
| | |
|
|
| |
|
|
|
| SERIES SHARE TRANSACTIONS: | | | | | | | | |
Series shares sold [4,149,530 and 10,842,004 shares, respectively] | | | 48,388,069 | | | | 113,640,623 | |
Series shares issued in reinvestment of distributions [5,426,687 and 4,029,611 shares, respectively] | | | 62,515,434 | | | | 41,746,770 | |
Series shares repurchased [16,523,123 and 18,418,048 shares, respectively] | | | (193,998,790 | ) | | | (192,330,963 | ) |
| | |
|
|
| |
|
|
|
NET DECREASE IN NET ASSETS RESULTING FROM SERIES SHARE TRANSACTIONS | | | (83,095,287 | ) | | | (36,943,570 | ) |
| | |
|
|
| |
|
|
|
| TOTAL INCREASE (DECREASE) IN NET ASSETS | | | (31,240,336 | ) | | | 71,895,997 | |
| NET ASSETS: | | | | | | | | |
Beginning of year | | | 1,283,899,261 | | | | 1,212,003,264 | |
| | |
|
|
| |
|
|
|
End of year | | $ | 1,252,658,925 | | | $ | 1,283,899,261 | |
| | |
|
|
| |
|
|
|
SEE NOTES TO FINANCIAL STATEMENTS.
A15
| | | | |
| | | SP INTERNATIONAL GROWTH PORTFOLIO | | |
SCHEDULE OF INVESTMENTS | December 31, 2007 |
| | | | | |
| LONG-TERM INVESTMENTS — 94.6% | | Value
(Note 2)
|
| COMMON STOCKS | | Shares
| |
| | | | | | |
Australia — 6.1% | | | | | |
BHP Billiton Ltd. | | 122,200 | | $ | 4,271,871 |
CSL Ltd. | | 69,593 | | | 2,204,697 |
Macquarie Group Ltd. | | 74,956 | | | 5,015,100 |
QBE Insurance Group Ltd. | | 152,400 | | | 4,424,594 |
Toll Holdings Ltd. | | 257,400 | | | 2,569,911 |
Woolworths Ltd. | | 290,400 | | | 8,612,108 |
WorleyParsons Ltd. | | 121,800 | | | 5,487,016 |
| | | | |
|
|
| | | | | | 32,585,297 |
| | | | |
|
|
Austria — 0.8% | | | | | |
Erste Bank der Oesterreichischen Sparkassen AG | | 24,833 | | | 1,760,897 |
Raiffeisen International Bank Holding AG | | 15,650 | | | 2,370,484 |
| | | | |
|
|
| | | | | | 4,131,381 |
| | | | |
|
|
Belgium — 1.0% | | | | | |
InBev NV | | 62,300 | | | 5,191,894 |
| | | | |
|
|
Brazil — 5.6% | | | | | |
All America Latina Logistica SA | | 67,822 | | | 877,876 |
Bolsa de Mercadorias e Futuros — BM&F | | 26,400 | | | 370,787 |
Bovespa Holding SA | | 269,100 | | | 5,185,466 |
Companhia Vale do Rio Doce, ADR | | 217,600 | | | 7,108,992 |
Gafisa SA | | 86,200 | | | 1,607,291 |
Net Servicos de Comunicacao SA* | | 138,200 | | | 1,684,798 |
Petroleo Brasileiro SA | | 46,100 | | | 2,289,461 |
Petroleo Brasileiro SA, ADR | | 56,230 | | | 6,479,945 |
Redecard SA | | 95,600 | | | 1,546,786 |
Unibanco — Uniao de Bancos Brasileiros, GDR | | 17,278 | | | 2,412,700 |
| | | | |
|
|
| | | | | | 29,564,102 |
| | | | |
|
|
Canada — 5.1% | | | | | |
Agnico Eagle Mines Ltd. | | 72,452 | | | 3,958,053 |
Brookfield Asset Management, Inc. (Class A Stock) | | 107,700 | | | 3,868,448 |
Potash Corp. of Saskatchewan, Inc. | | 19,472 | | | 2,803,189 |
Research In Motion Ltd.* | | 59,518 | | | 6,749,341 |
Rogers Communications, Inc. (Class B Stock) | | 132,217 | | | 6,027,097 |
Shoppers Drug Mart Corp. | | 66,000 | | | 3,561,639 |
| | | | |
|
|
| | | | | | 26,967,767 |
| | | | |
|
|
Chile — 0.3% | | | | | |
Centros Comerciales Sudamericanos SA, ADR, 144A | | 30,100 | | | 1,817,062 |
| | | | |
|
|
China — 2.0% | | | | | |
Baidu.com, ADR* | | 2,105 | | | 821,771 |
China Communications Construction Co. Ltd. (Class H Stock) | | 1,447,658 | | | 3,742,598 |
China Merchants Bank Co. Ltd. (Class H Stock) | | 363,500 | | | 1,462,454 |
China Merchants Holdings International Co. Ltd. | | 122,000 | | | 746,975 |
China Oilfield Services Ltd. (Class H Stock) | | 682,000 | | | 1,523,111 |
| | | | | |
COMMON STOCKS
(continued) | | Shares
| | Value
(Note 2)
|
| | | | | | |
China (continued) | | | | | |
Country Garden Holdings Co. Ltd.* | | 755,000 | | $ | 860,348 |
Shandong Weigao Group Medical Polymer Co. Ltd. (Class H Stock) | | 548,000 | | | 1,255,033 |
| | | | |
|
|
| | | | | | 10,412,290 |
| | | | |
|
|
Egypt — 0.7% | | | | | |
Egyptian Financial Group Hermes Holding | | 316,200 | | | 3,781,503 |
| | | | |
|
|
Finland — 0.9% | | | | | |
Nokia Oyj | | 117,100 | | | 4,540,392 |
| | | | |
|
|
France — 10.9% | | | | | |
Accor SA | | 41,547 | | | 3,322,691 |
Alstom | | 7,582 | | | 1,629,537 |
Axa SA | | 89,800 | | | 3,596,096 |
Cie Generale de Geophysique-Veritas* | | 5,750 | | | 1,639,326 |
Electricite de France | | 41,844 | | | 4,984,793 |
Essilor International SA | | 56,300 | | | 3,592,987 |
Eurazeo | | 18,900 | | | 2,424,778 |
Groupe Danone | | 29,053 | | | 2,608,088 |
Iliad SA | | 20,300 | | | 2,184,423 |
JC Decaux SA | | 60,303 | | | 2,371,670 |
L’Oreal SA | | 55,500 | | | 7,950,480 |
PPR | | 20,598 | | | 3,312,689 |
Schneider Electric SA | | 47,800 | | | 6,477,044 |
Veolia Environment | | 126,880 | | | 11,584,755 |
| | | | |
|
|
| | | | | | 57,679,357 |
| | | | |
|
|
Germany — 5.2% | | | | | |
Beiersdorf AG | | 49,100 | | | 3,804,699 |
Continental AG | | 55,729 | | | 7,250,791 |
Daimler Chrysler AG | | 32,942 | | | 3,202,835 |
Deutsche Boerse AG | | 36,300 | | | 7,204,592 |
GEA Group AG* | | 33,239 | | | 1,156,613 |
MTU Aero Engines Holding AG | | 15,640 | | | 914,660 |
Q-Cells AG* | | 28,700 | | | 4,095,384 |
| | | | |
|
|
| | | | | | 27,629,574 |
| | | | |
|
|
Greece — 0.9% | | | | | |
National Bank of Greece SA | | 59,276 | | | 4,071,504 |
Public Power Corp. SA | | 15,243 | | | 802,298 |
| | | | |
|
|
| | | | | | 4,873,802 |
| | | | |
|
|
Hong Kong — 3.1% | | | | | |
China Mobile Ltd. | | 91,500 | | | 1,593,427 |
China Mobile Ltd., ADR(a) | | 10,200 | | | 886,074 |
CNOOC Ltd. | | 999,800 | | | 1,679,036 |
Esprit Holdings Ltd. | | 405,400 | | | 5,969,623 |
Li & Fung Ltd. | | 1,174,400 | | | 4,682,007 |
Shangri-La Asia Ltd. | | 544,000 | | | 1,691,893 |
| | | | |
|
|
| | | | | | 16,502,060 |
| | | | |
|
|
India — 1.3% | | | | | |
HDFC Bank Ltd., ADR(a) | | 30,900 | | | 4,030,905 |
ICICI Bank Ltd., ADR | | 47,025 | | | 2,892,037 |
| | | | |
|
|
| | | | | | 6,922,942 |
| | | | |
|
|
Indonesia — 0.4% | | | | | |
Bank Rakyat Indonesia | | 2,550,000 | | | 1,982,282 |
| | | | |
|
|
SEE NOTES TO FINANCIAL STATEMENTS.
A16
| | | | |
| | | SP INTERNATIONAL GROWTH PORTFOLIO (Continued) | | |
SCHEDULE OF INVESTMENTS | December 31, 2007 |
| | | | | |
COMMON STOCKS
(continued) | | Shares
| | Value
(Note 2)
|
| | | | | | |
Italy — 1.7% | | | | | |
Geox SpA | | 75,200 | | $ | 1,511,762 |
Saipem SpA | | 194,100 | | | 7,784,206 |
| | | | |
|
|
| | | | | | 9,295,968 |
| | | | |
|
|
Japan — 11.6% | | | | | |
Aeon Mall Co. Ltd. | | 72,800 | | | 1,910,520 |
Daikin Industries Ltd. | | 30,600 | | | 1,706,748 |
Fanuc Ltd. | | 49,900 | | | 4,837,711 |
Fujitsu Ltd. | | 117,000 | | | 782,668 |
Fukuoka Financial Group, Inc. | | 613,000 | | | 3,579,935 |
Jupiter Telecommunications Co. Ltd.* | | 2,987 | | | 2,513,034 |
K.K. DaVinci Advisors* | | 1,262 | | | 1,093,336 |
Komatsu Ltd. | | 159,500 | | | 4,277,658 |
Marubeni Corp. | | 307,000 | | | 2,151,152 |
Mitsui & Co. Ltd. | | 246,000 | | | 5,137,130 |
Mitsui Trust Holdings, Inc. | | 203,000 | | | 1,548,094 |
NGK Insulators Ltd. | | 177,000 | | | 4,745,602 |
Nintendo Co. Ltd. | | 23,800 | | | 13,974,216 |
Nippon Electric Glass Co. Ltd. | | 109,000 | | | 1,773,108 |
Nomura Holdings, Inc. | | 48,900 | | | 819,313 |
Shin-Etsu Chemical Co. Ltd. | | 46,600 | | | 2,898,110 |
Sumitomo Realty & Development Co. Ltd. | | 127,000 | | | 3,105,921 |
Suruga Bank Ltd. | | 265,000 | | | 2,882,864 |
Yamada Denki Co. Ltd. | | 16,920 | | | 1,908,664 |
| | | | |
|
|
| | | | | | 61,645,784 |
| | | | |
|
|
Malaysia — 0.8% | | | | | |
Bumiputra-Commerce Holdings Bhd | | 693,800 | | | 2,284,267 |
Kuala Lumpur Kepong Bhd | | 426,400 | | | 2,227,786 |
| | | | |
|
|
| | | | | | 4,512,053 |
| | | | |
|
|
Mexico — 1.1% | | | | | |
America Movil SAB de CV (Class L Stock), ADR | | 47,804 | | | 2,934,688 |
Grupo Televisia SA, ADR | | 130,369 | | | 3,098,871 |
| | | | |
|
|
| | | | | | 6,033,559 |
| | | | |
|
|
Netherlands — 0.5% | | | | | |
Heineken NV | | 41,238 | | | 2,666,117 |
| | | | |
|
|
Russia — 0.5% | | | | | |
PIK Group, GDR, 144A* | | 91,200 | | | 2,667,600 |
| | | | |
|
|
Singapore — 1.8% | | | | | |
Capitaland Ltd. | | 1,366,000 | | | 5,877,083 |
Wilmar International Ltd. | | 974,200 | | | 3,620,051 |
| | | | |
|
|
| | | | | | 9,497,134 |
| | | | |
|
|
South Africa — 1.6% | | | | | |
MTN Group Ltd. | | 363,595 | | | 6,812,934 |
Naspers Ltd. (Class N Stock) | | 63,900 | | | 1,514,672 |
| | | | |
|
|
| | | | | | 8,327,606 |
| | | | |
|
|
South Korea — 0.9% | | | | | |
NHN Corp.* | | 9,500 | | | 2,265,338 |
Samsung Electronics Co. Ltd. | | 4,530 | | | 2,665,895 |
| | | | |
|
|
| | | | | | 4,931,233 |
| | | | |
|
|
| | | | | |
COMMON STOCKS
(continued) | | Shares
| | Value
(Note 2)
|
| | | | | | |
Spain — 0.9% | | | | | |
Industria de Diseno Textil SA | | 80,800 | | $ | 4,963,984 |
| | | | |
|
|
Switzerland — 12.8% | | | | | |
ABB Ltd. | | 492,120 | | | 14,179,175 |
Actelion Ltd* | | 74,934 | | | 3,445,051 |
Credit Suisse Group | | 46,811 | | | 2,815,730 |
EFG International | | 46,000 | | | 1,848,695 |
Geberit AG | | 9,300 | | | 1,277,349 |
Holcim Ltd. | | 45,449 | | | 4,869,464 |
Julius Baer Holding AG | | 76,080 | | | 6,289,880 |
Kuehne & Nagel International AG | | 32,100 | | | 3,076,315 |
Lonza Group AG | | 29,346 | | | 3,561,490 |
Nestle SA | | 24,706 | | | 11,347,542 |
Roche Holding AG | | 34,344 | | | 5,933,566 |
SGS Societe Generale | | 2,006 | | | 2,390,226 |
Sonova Holding AG | | 14,781 | | | 1,669,823 |
Xstrata PLC | | 78,600 | | | 5,554,383 |
| | | | |
|
|
| | | | | | 68,258,689 |
| | | | |
|
|
Taiwan — 1.0% | | | | | |
Hon Hai Precision Industry Co. Ltd. | | 473,115 | | | 2,916,034 |
MediaTek, Inc. | | 166,400 | | | 2,132,890 |
| | | | |
|
|
| | | | | | 5,048,924 |
| | | | |
|
|
United Arab Emirates — 0.2% | | | | | |
DP World Ltd.* | | 682,900 | | | 812,651 |
| | | | |
|
|
United Kingdom — 14.1% | | | | | |
BG Group PLC | | 378,300 | | | 8,660,025 |
British Sky Broadcasting Group PLC | | 751,816 | | | 9,263,757 |
Capita Group PLC | | 263,232 | | | 3,657,459 |
Carphone Warehouse Group | | 221,200 | | | 1,516,908 |
Johnson Matthey PLC | | 23,788 | | | 890,700 |
Man Group PLC | | 501,134 | | | 5,676,114 |
Reckitt Benckiser Group PLC | | 189,693 | | | 11,003,372 |
Rio Tinto PLC | | 21,367 | | | 2,261,493 |
Rolls-Royce Group PLC* | | 691,516 | | | 7,515,880 |
Rolls-Royce Group PLC (Class B Stock)* | | 27,763,526 | | | 55,266 |
Rotork PLC | | 62,700 | | | 1,206,921 |
Tesco PLC | | 1,679,514 | | | 15,955,650 |
Tullow Oil PLC | | 225,900 | | | 2,929,649 |
Vedanta Resources PLC | | 109,700 | | | 4,467,836 |
| | | | |
|
|
| | | | | | 75,061,030 |
| | | | |
|
|
United States — 0.8% | | | | | |
Las Vegas Sands Corp.* | | 25,267 | | | 2,603,764 |
Schlumberger Ltd. | | 16,943 | | | 1,666,683 |
| | | | |
|
|
| | | | | | 4,270,447 |
| | | | |
|
|
TOTAL LONG-TERM INVESTMENTS
(cost $386,337,327) | | | 502,574,484 |
| | | | |
|
|
SEE NOTES TO FINANCIAL STATEMENTS.
A17
| | | | |
| | | SP INTERNATIONAL GROWTH PORTFOLIO (Continued) | | |
SCHEDULE OF INVESTMENTS | December 31, 2007 |
| | | | | | |
SHORT-TERM
INVESTMENT — 5.9% | | Shares
| | Value
(Note 2)
| |
| | | | | | | |
Affiliated Money Market Mutual Fund | | | | |
Dryden Core Investment Fund —
Taxable Money Market Series
(cost $31,415,333; includes $4,369,462 of cash collateral for securities on loan)(b)(w) (Note 4) | | 31,415,333 | | $ | 31,415,333 | |
| | | | |
|
|
|
TOTAL INVESTMENTS(o) — 100.5%
(cost $417,752,660) | | | 533,989,817 | |
LIABILITIES IN EXCESS OF
OTHER ASSETS(x) — (0.5)% | | | (2,446,402 | ) |
| | | | |
|
|
|
NET ASSETS — 100.0% | | $ | 531,543,415 | |
| | | | |
|
|
|
The following abbreviations are used in portfolio descriptions:
| | |
| 144A | | Security was purchased pursuant to Rule 144A under the securities Act of 1933 and may not be resold subject to that rule except to qualified institutional buyers. Unless otherwise noted, 144A securities are deemed to be liquid. |
| ADR | | American Depositary Receipt |
| GDR | | Global Depositary Receipt |
| CHF | | Swiss Franc |
| EUR | | Euro |
| * | Non-income producing security. |
| (a) | All or a portion of security is on loan. The aggregate market value of such securities is $4,195,439; cash collateral of $4,369,462 (included with liabilities) was received with which the portfolio purchased highly liquid short-term investments. |
| (b) | Represents security, or a portion thereof, purchased with cash collateral received for securities on loan. |
| (o) | As of December 31, 2007, 45 securities representing $140,350,662 and 26.4% of net assets were fair valued in accordance with the policies adopted by the Board of Trustees. |
| (w) | Prudential Investments LLC, the manager of the Portfolio, also serves as manager of the Dryden Core Investment Fund — Taxable Money Market Series. |
| (x) | Liabilities in excess of other assets includes net unrealized appreciation (depreciation) on forward foreign currency contracts as follows: |
Forward foreign currency exchange contracts outstanding at December 31, 2007:
| | | | | | | | | | | | | |
Purchase Contracts
| | Notional
Amount
(000)
| | Value at Settlement
Date Payable
| | Current
Value
| | Unrealized
Depreciation
| |
| Euros, | | | | | | | | | | | | | |
| expiring 01/03/08 | | EUR | 160 | | $ | 235,599 | | $ | 234,141 | | $ | (1,458 | ) |
| | | | | |
|
| |
|
| |
|
|
|
| | | | |
Sale Contracts
| | Notional
Amount
(000)
| | Value at Settlement
Date Receivable
| | Current
Value
| | Unrealized
Appreciation
(Depreciation)
| |
| Swiss Franc, | | | | | | | | | | | | | |
| expiring 01/03/08 | | CHF | 64 | | $ | 56,487 | | $ | 56,866 | | $ | (379 | ) |
| expiring 01/04/08 | | CHF | 97 | | | 85,695 | | | 85,384 | | | 311 | |
| | | | | |
|
| |
|
| |
|
|
|
| | | | | | $ | 142,182 | | $ | 142,250 | | $ | (68 | ) |
| | | | | |
|
| |
|
| |
|
|
|
SEE NOTES TO FINANCIAL STATEMENTS.
A18
| | | | |
| | | SP INTERNATIONAL GROWTH PORTFOLIO (Continued) | | |
SCHEDULE OF INVESTMENTS | December 31, 2007 |
The industry classification of investments and liabilities in excess of other assets shown as a percentage of net assets as of December 31, 2007 were as follows:
| | | |
Financial Services | | 6.9 | % |
Food | | 6.7 | |
Real Estate | | 6.0 | |
Affiliated Money Market Mutual Fund (0.8% represents investments purchased with collateral from securities on loan) | | 5.9 | |
Oil, Gas & Consumable Fuels | | 5.2 | |
Metals & Mining | | 5.1 | |
Oil & Gas | | 3.9 | |
Electronic Components | | 3.2 | |
Financial – Bank & Trust | | 3.2 | |
Telecommunications | | 3.2 | |
Entertainment & Leisure | | 2.6 | |
Commercial Banks | | 2.4 | |
Broadcasting | | 2.3 | |
Retail & Merchandising | | 2.3 | |
Water | | 2.2 | |
Pharmaceuticals | | 2.2 | |
Transportation | | 2.2 | |
Consumer Products & Services | | 2.1 | |
Automobile Manufacturers | | 2.0 | |
Medical Supplies & Equipment | | 1.9 | |
Chemicals | | 1.9 | |
Media | | 1.9 | |
Insurance | | 1.5 | |
Cosmetics & Toiletries | | 1.5 | |
Beverages | | 1.5 | |
Lodging | | 1.4 | |
Automotive Parts | | 1.4 | |
Software | | 1.3 | |
Electronics | | 1.2 | |
Commercial Services | | 1.2 | |
Building Materials | | 1.1 | |
Agriculture | | 1.1 | |
Engineering/Construction | | 1.0 | |
Internet Software & Services | | 1.0 | |
Diversified Operations | | 1.0 | |
Retail | | 0.9 | |
Machinery – Construction & Mining | | 0.8 | |
Energy – Other | | 0.8 | |
Banks | | 0.7 | |
Computer Hardware | | 0.7 | |
Conglomerates | | 0.5 | |
Food Products | | 0.5 | |
Advertising | | 0.5 | |
Diversified Financial Services | | 0.5 | |
Semiconductors | | 0.4 | |
Electronic Components & Equipment | | 0.3 | |
Building Products | | 0.3 | |
Computer Networking | | 0.3 | |
Diversified Machinery | | 0.3 | |
Building��& Construction | | 0.3 | |
Apparel | | 0.3 | |
Instruments – Controls | | 0.2 | |
Holding Companies – Diversified | | 0.2 | |
Business Services | | 0.2 | |
Aerospace & Defense | | 0.2 | |
Electric | | 0.1 | |
| | |
|
|
| | | 100.5 | |
Liabilities in excess of other assets | | (0.5 | ) |
| | |
|
|
| | | 100.0 | % |
| | |
|
|
SEE NOTES TO FINANCIAL STATEMENTS.
A19
| | | | |
| | | SP INTERNATIONAL GROWTH PORTFOLIO (Continued) | | |
STATEMENT OF ASSETS AND LIABILITIES
December 31, 2007
| | | |
| ASSETS | | | |
Investments at value, including securities on loan of $4,195,439 | | | |
Unaffiliated investments (cost $386,337,327) | | $ | 502,574,484 |
Affiliated investments (cost $31,415,333) | | | 31,415,333 |
Foreign currency, at value (cost $1,633,115) | | | 1,633,841 |
Receivable for investments sold | | | 1,296,180 |
Tax reclaim receivable | | | 681,986 |
Dividends and interest receivable | | | 515,999 |
Receivable for Series shares sold | | | 223,566 |
Other assets | | | 75,308 |
Prepaid expenses | | | 5,661 |
Unrealized appreciation on foreign currency forward contracts | | | 311 |
| | |
|
|
Total Assets | | | 538,422,669 |
| | |
|
|
| LIABILITIES | | | |
Collateral for securities on loan | | | 4,369,462 |
Payable for investments purchased | | | 1,530,145 |
Management fee payable | | | 378,485 |
Payable to custodian | | | 295,349 |
Accrued expenses and other liabilities | | | 174,206 |
Payable for Series shares repurchased | | | 118,412 |
Distribution fee payable | | | 6,346 |
Administration fee payable | | | 3,807 |
Unrealized depreciation on foreign currency forward contracts | | | 1,837 |
Transfer agent fees payable | | | 1,205 |
| | |
|
|
Total Liabilities | | | 6,879,254 |
| | |
|
|
| NET ASSETS | | $ | 531,543,415 |
| | |
|
|
Net assets were comprised of: | | | |
Paid-in capital | | $ | 347,731,137 |
Retained earnings | | | 183,812,278 |
| | |
|
|
Net assets, December 31, 2007 | | $ | 531,543,415 |
| | |
|
|
| Class I: | | | |
Net asset value and redemption price per share, $500,016,447 / 58,706,024 outstanding shares of beneficial interest | | $ | 8.52 |
| | |
|
|
| Class II: | | | |
Net asset value and redemption price per share, $31,526,968 / 3,772,647 outstanding shares of beneficial interest | | $ | 8.36 |
| | |
|
|
STATEMENT OF OPERATIONS
Year Ended December 31, 2007
| | | | |
| INVESTMENT INCOME | | | | |
Unaffiliated dividend income (net of $718,378 foreign withholding tax) | | $ | 9,777,853 | |
Affiliated dividend income | | | 699,400 | |
Affiliated income from securities lending, net | | | 41,067 | |
Interest | | | 19,641 | |
| | |
|
|
|
| | | | 10,537,961 | |
| | |
|
|
|
| EXPENSES | | | | |
Management fee | | | 4,300,961 | |
Distribution fee—Class II | | | 61,619 | |
Administration fee—Class II | | | 36,971 | |
Custodian’s fees and expenses | | | 313,000 | |
Shareholders’ reports | | | 87,000 | |
Audit fee | | | 22,000 | |
Trustees’ fees | | | 15,000 | |
Loan interest expense (Note 8) | | | 9,858 | |
Transfer agent’s fees and expenses (including affiliated expense of $6,500) (Note 4) | | | 7,000 | |
Legal fees and expenses | | | 6,000 | |
Insurance expenses | | | 4,000 | |
Commitment fee on syndicated credit agreement | | | 1,000 | |
Miscellaneous | | | 14,623 | |
| | |
|
|
|
Total expenses | | | 4,879,032 | |
| | |
|
|
|
| NET INVESTMENT INCOME | | | 5,658,929 | |
| | |
|
|
|
| NET REALIZED AND UNREALIZED GAIN (LOSS) ON INVESTMENTS AND FOREIGN CURRENCIES | | | | |
Net realized gain (loss) on: | | | | |
Investment transactions | | | 70,851,009 | |
Foreign currency transactions | | | (841,617 | ) |
| | |
|
|
|
| | | | 70,009,392 | |
| | |
|
|
|
Net change in unrealized appreciation (depreciation) on: | | | | |
Investments | | | 14,829,831 | |
Foreign currencies | | | 74,848 | |
| | |
|
|
|
| | | | 14,904,679 | |
| | |
|
|
|
| NET GAIN ON INVESTMENTS AND FOREIGN CURRENCIES | | | 84,914,071 | |
| | |
|
|
|
| NET INCREASE IN NET ASSETS RESULTING FROM OPERATIONS | | $ | 90,573,000 | |
| | |
|
|
|
STATEMENT OF CHANGES IN NET ASSETS
| | | | | | | | |
| | | Year Ended December 31,
| |
| | | 2007
| | | 2006
| |
| INCREASE (DECREASE) IN NET ASSETS | | | | | | | | |
| OPERATIONS: | | | | | | | | |
Net investment income | | $ | 5,658,929 | | | $ | 3,333,006 | |
Net realized gain on investment and foreign currency transactions | | | 70,009,392 | | | | 71,519,956 | |
Net change in unrealized appreciation (depreciation) on investments and foreign currencies | | | 14,904,679 | | | | 16,561,203 | |
| | |
|
|
| |
|
|
|
NET INCREASE IN NET ASSETS RESULTING FROM OPERATIONS | | | 90,573,000 | | | | 91,414,165 | |
| | |
|
|
| |
|
|
|
| DISTRIBUTIONS | | | | | | | | |
Class I | | | (69,883,162 | ) | | | (45,416,833 | ) |
Class II | | | (4,307,436 | ) | | | (2,301,316 | ) |
| | |
|
|
| |
|
|
|
TOTAL DISTRIBUTIONS | | | (74,190,598 | ) | | | (47,718,149 | ) |
| | |
|
|
| |
|
|
|
| SERIES SHARE TRANSACTIONS (Note 7): | | | | | | | | |
Series shares sold [11,040,459 and 11,881,106 shares, respectively] | | | 100,653,807 | | | | 90,213,315 | |
Series shares issued in reinvestment of distributions [8,842,171 and 6,452,228 shares, respectively] | | | 74,190,598 | | | | 47,718,149 | |
Series shares repurchased [15,266,263 and 23,645,208 shares, respectively] | | | (139,468,986 | ) | | | (178,494,583 | ) |
| | |
|
|
| |
|
|
|
INCREASE (DECREASE) IN NET ASSETS RESULTING FROM SERIES SHARE TRANSACTIONS | | | 35,375,419 | | | | (40,563,119 | ) |
| | |
|
|
| |
|
|
|
| TOTAL INCREASE IN NET ASSETS | | | 51,757,821 | | | | 3,132,897 | |
| NET ASSETS: | | | | | | | | |
Beginning of year | | | 479,785,594 | | | | 476,652,697 | |
| | |
|
|
| |
|
|
|
End of year | | $ | 531,543,415 | | | $ | 479,785,594 | |
| | |
|
|
| |
|
|
|
SEE NOTES TO FINANCIAL STATEMENTS.
A20
| | | | |
| | | SP INTERNATIONAL VALUE PORTFOLIO | | |
SCHEDULE OF INVESTMENTS | December 31, 2007 |
| | | | | |
| LONG-TERM INVESTMENTS — 98.5% | | Value
(Note 2)
|
| COMMON STOCKS | | Shares
| |
| | | | | | |
Australia — 1.7% | | | | | |
AWB Ltd. | | 310,900 | | $ | 794,976 |
Bluescope Steel Ltd. | | 104,200 | | | 874,684 |
Commonwealth Bank of Australia | | 20,100 | | | 1,036,332 |
CSR Ltd. | | 253,300 | | | 685,898 |
Pacific Brands Ltd. | | 231,100 | | | 656,307 |
Qantas Airways Ltd. | | 393,600 | | | 1,870,127 |
Santos Ltd. | | 72,300 | | | 888,439 |
Telestra Corp. Ltd. | | 269,600 | | | 1,104,853 |
Zinifex Ltd. | | 46,500 | | | 498,793 |
| | | | |
|
|
| | | | | | 8,410,409 |
| | | | |
|
|
Austria — 0.3% | | | | | |
voestalpine AG | | 18,800 | | | 1,359,212 |
| | | | |
|
|
Belgium — 0.5% | | | | | |
AGFA-Gevaert NV | | 39,400 | | | 604,275 |
Dexia NV/SA | | 24,800 | | | 624,741 |
Fortis NV/SA | | 42,900 | | | 1,129,624 |
| | | | |
|
|
| | | | | | 2,358,640 |
| | | | |
|
|
Brazil — 0.9% | | | | | |
Empresa Brasileira de Aeronautica SA, ADR | | 92,700 | | | 4,226,193 |
| | | | |
|
|
Canada — 5.6% | | | | | |
Canadian National Railway Co. | | 120,100 | | | 5,676,747 |
Canadian Natural Resources Ltd. | | 64,200 | | | 4,721,248 |
Potash Corp. of Saskatchewan | | 77,000 | | | 11,084,920 |
Rogers Communications, Inc.
(Class B Stock) | | 138,500 | | | 6,313,506 |
| | | | |
|
|
| | | | | | 27,796,421 |
| | | | |
|
|
China — 3.5% | | | | | |
China Merchants Bank Co. Ltd. | | 851,500 | | | 3,425,803 |
China Petroleum and Chemical Corp. (Class H Stock) | | 4,304,093 | | | 6,380,599 |
Country Garden Holdings Co. Ltd.* | | 3,721,400 | | | 4,240,664 |
Soho China Ltd* | | 3,118,600 | | | 3,219,628 |
| | | | |
|
|
| | | | | | 17,266,694 |
| | | | |
|
|
Denmark — 3.2% | | | | | |
Carlsberg A/S (Class B Stock) | | 37,400 | | | 4,524,622 |
Danske Bank SA | | 28,900 | | | 1,131,906 |
H. Lundbeck A/S | | 55,800 | | | 1,509,867 |
Novo Nordisk SA (Class B Stock) | | 131,900 | | | 8,663,935 |
| | | | |
|
|
| | | | | | 15,830,330 |
| | | | |
|
|
Finland — 3.8% | | | | | |
Fortum Oyj | | 205,208 | | | 9,243,766 |
Nokia Oyj | | 209,700 | | | 8,130,830 |
Rautaruukki Oyj | | 17,900 | | | 775,962 |
Tietoenator Oyj | | 35,600 | | | 799,474 |
| | | | |
|
|
| | | | | | 18,950,032 |
| | | | |
|
|
France — 11.3% | | | | | |
Air Liquide | | 53,672 | | | 7,987,591 |
Arkema* | | 130 | | | 8,542 |
AXA SA | | 188,200 | | | 7,536,585 |
BNP Paribas SA | | 31,800 | | | 3,450,730 |
Ciments Francais SA | | 3,000 | | | 516,294 |
| | | | | |
COMMON STOCKS
(continued) | | Shares
| | Value
(Note 2)
|
| | | | | | |
France (continued) | | | | | |
Compagnie Generale des Establissements Michelin
(Class B Stock) | | 8,800 | | $ | 1,009,986 |
Credit Agricole SA | | 31,300 | | | 1,055,735 |
France Telecom SA | | 178,567 | | | 6,427,650 |
Groupe Danone | | 86,700 | | | 7,783,061 |
LVMH Moet Hennessy Louis Vuitton SA | | 55,135 | | | 6,664,856 |
Natixis SA | | 30,000 | | | 576,341 |
PSA Peugeot Citroen SA | | 19,800 | | | 1,500,987 |
Renault SA | | 11,000 | | | 1,560,171 |
Sanofi-Aventis | | 34,100 | | | 3,139,930 |
Schneider Electric SA | | 6,200 | | | 840,119 |
Societe Generale | | 3,300 | | | 477,315 |
Thales SA | | 14,000 | | | 834,101 |
Thomson | | 61,800 | | | 879,153 |
Total SA | | 17,200 | | | 1,429,121 |
Valeo SA | | 23,100 | | | 952,410 |
Vivendi | | 29,500 | | | 1,353,436 |
| | | | |
|
|
| | | | | | 55,984,114 |
| | | | |
|
|
Germany — 6.5% | | | | | |
BASF AG | | 72,400 | | | 10,734,512 |
Daimler AG | | 21,900 | | | 2,129,260 |
Deutsche Bank AG | | 20,200 | | | 2,640,291 |
Deutsche Lufthansa AG | | 33,800 | | | 900,385 |
E.ON AG | | 45,400 | | | 9,663,854 |
Heidelberger Druckmaschinen AG | | 20,600 | | | 692,720 |
Muenchener Rueckversicherungs AG | | 8,100 | | | 1,574,359 |
ThyssenKrup AG | | 46,900 | | | 2,629,669 |
Volkswagen AG | | 4,400 | | | 1,004,196 |
| | | | |
|
|
| | | | | | 31,969,246 |
| | | | |
|
|
Greece — 1.3% | | | | | |
National Bank of Greece SA | | 24,735 | | | 1,698,979 |
OPAP SA | | 122,593 | | | 4,914,689 |
| | | | |
|
|
| | | | | | 6,613,668 |
| | | | |
|
|
Hong Kong — 3.5% | | | | | |
Chaoda Modern Agriculture Holdings Ltd. | | 1,023,637 | | | 915,782 |
China Mobile Ltd. | | 471,565 | | | 8,212,070 |
CITIC Pacific Ltd. | | 138,000 | | | 762,951 |
Hong Kong Electric Holdings | | 124,000 | | | 709,631 |
Hong Kong Exchanges and Clearing Ltd. | | 213,800 | | | 5,993,623 |
Orient Overseas International Ltd. | | 117,392 | | | 860,046 |
Solomon Systech International Ltd. | | 525,000 | | | 44,077 |
| | | | |
|
|
| | | | | | 17,498,180 |
| | | | |
|
|
Ireland — 0.4% | | | | | |
Allied Irish Banks PLC | | 51,100 | | | 1,170,794 |
Irish Life & Permanent PLC | | 45,500 | | | 785,641 |
| | | | |
|
|
| | | | | | 1,956,435 |
| | | | |
|
|
Israel — 2.9% | | | | | |
Amdocs Ltd.* | | 122,100 | | | 4,208,787 |
Teva Pharmaceutical Industries Ltd., ADR | | 219,000 | | | 10,179,120 |
| | | | |
|
|
| | | | | | 14,387,907 |
| | | | |
|
|
SEE NOTES TO FINANCIAL STATEMENTS.
A21
| | | | |
| | | SP INTERNATIONAL VALUE PORTFOLIO (Continued) | | |
SCHEDULE OF INVESTMENTS | December 31, 2007 |
| | | | | |
COMMON STOCKS
(continued) | | Shares
| | Value
(Note 2)
|
| | | | | | |
Italy — 1.5% | | | | | |
Banche Popolari Unite SpA | | 26,200 | | $ | 720,532 |
Banco Ambrosiano Veneto SpA | | 105,200 | | | 832,101 |
Banco Popolare Scarl* | | 37,000 | | | 820,094 |
Eni SpA | | 83,100 | | | 3,043,489 |
Finmeccanica SpA | | 28,100 | | | 902,608 |
Fondiaria SAI SpA | | 17,000 | | | 700,908 |
Indesit Co. SpA | | 27,500 | | | 426,992 |
| | | | |
|
|
| | | | | | 7,446,724 |
| | | | |
|
|
Japan — 12.4% | | | | | |
Alpine Electronics, Inc. | | 45,300 | | | 759,022 |
ALPS Electric Co. Ltd. | | 51,800 | | | 669,210 |
Asahi Kasei Corp. | | 122,000 | | | 805,136 |
Canon, Inc. | | 89,371 | | | 4,090,206 |
Cosmo Oil Co. Ltd. | | 149,000 | | | 550,762 |
Denki Kagaku Kogyo Kabushiki Kiasha | | 133,000 | | | 574,882 |
Fanuc Ltd. | | 63,600 | | | 6,165,900 |
Fuji Heavy Industries Ltd. | | 241,100 | | | 1,116,762 |
Hokkaido Electric Power Co., Inc. | | 13,100 | | | 282,384 |
Honda Motor Co. Ltd. | | 74,200 | | | 2,451,186 |
Komatsu Ltd. | | 58,100 | | | 1,558,194 |
Kurabo Industries Ltd. | | 152,000 | | | 340,980 |
Kureha Corp. | | 134,000 | | | 714,048 |
Kyushu Electric Power Co., Inc. | | 7,400 | | | 181,662 |
Marubeni Corp. | | 124,600 | | | 873,073 |
Matsushita Electric Industrial Co. Ltd. | | 45,000 | | | 922,089 |
Mitsubishi Chemical Holdings Corp. | | 126,000 | | | 961,340 |
Nifco, Inc. | | 28,200 | | | 654,408 |
Nintendo Co. Ltd. | | 13,410 | | | 7,873,708 |
Nippon Oil Corp. | | 82,700 | | | 668,578 |
Nippon Shokubai Co. Ltd. | | 88,000 | | | 843,213 |
Nippon Telegraph and Telephone Corp. | | 400 | | | 1,988,372 |
Nippon Unipac Group, Inc. | | 141 | | | 424,733 |
Nipro Corp. | | 25,000 | | | 500,307 |
Nissan Motor Co. Ltd. | | 230,200 | | | 2,512,517 |
Nomura Holdings, Inc. | | 65,400 | | | 1,095,768 |
NTT DoCoMo, Inc. | | 1,400 | | | 2,304,834 |
OJI Paper Co. Ltd. | | 23,000 | | | 112,999 |
Okasan Holdings, Inc. | | 46,900 | | | 264,146 |
Promise Co. Ltd. | | 3,800 | | | 93,563 |
Ricoh Co. Ltd. | | 59,000 | | | 1,077,124 |
Santen Pharmaceutical Co. Ltd. | | 21,200 | | | 522,793 |
Sanwa Shutter Corp. | | 136,000 | | | 667,684 |
Seiko Epson Corp. | | 4,900 | | | 104,364 |
Sumitomo Corp. | | 75,000 | | | 1,049,353 |
Sumitomo Trust & Banking Co. Ltd. (The) | | 149,000 | | | 982,021 |
Takefuji Corp. | | 15,100 | | | 362,681 |
Tanabe Seiyaku Co. Ltd. | | 112,000 | | | 1,040,395 |
Toppan Printing Co. Ltd. | | 64,000 | | | 627,639 |
Toyota Motor Corp. | | 135,100 | | | 7,195,252 |
Yamada Denki Co. Ltd. | | 40,429 | | | 4,560,602 |
Yokohama Rubber Co. Ltd. | | 85,000 | | | 502,356 |
| | | | |
|
|
| | | | | | 61,046,246 |
| | | | |
|
|
Mexico — 2.2% | | | | | |
America Movil SA de CV, ADR | | 104,800 | | | 6,433,672 |
| | | | | |
COMMON STOCKS
(continued) | | Shares
| | Value
(Note 2)
|
| | | | | | |
Mexico (continued) | | | | | |
Wal-Mart de Mexico SA de CV | | 1,237,700 | | $ | 4,314,934 |
| | | | |
|
|
| | | | | | 10,748,606 |
| | | | |
|
|
Netherlands — 1.6% | | | | | |
Aegon NV | | 48,400 | | | 855,529 |
ING Groep NV, ADR | | 64,800 | | | 2,534,322 |
Koninklijke (Royal) KPN NV | | 69,200 | | | 1,258,605 |
Oce NV | | 58,900 | | | 1,066,102 |
Royal Dutch Shell PLC
(Class A Stock) | | 50,700 | | | 2,131,124 |
| | | | |
|
|
| | | | | | 7,845,682 |
| | | | |
|
|
New Zealand — 0.1% | | | | | |
Air New Zealand Ltd. | | 317,200 | | | 457,197 |
| | | | |
|
|
Norway — 0.2% | | | | | |
Norsk Hydro ASA | | 24,400 | | | 348,709 |
StatoilHydro ASA | | 21,037 | | | 654,761 |
| | | | |
|
|
| | | | | | 1,003,470 |
| | | | |
|
|
Russia — 2.2% | | | | | |
OAO Gazprom, ADR | | 123,700 | | | 7,013,790 |
Sberbank | | 940,000 | | | 3,966,800 |
| | | | |
|
|
| | | | | | 10,980,590 |
| | | | |
|
|
Singapore — 0.6% | | | | | |
MobileOne Ltd. | | 441,000 | | | 579,827 |
Neptune Orient Lines Ltd. | | 336,000 | | | 903,227 |
Singapore Airlines Ltd. | | 122,270 | | | 1,468,856 |
| | | | |
|
|
| | | | | | 2,951,910 |
| | | | |
|
|
South Korea — 1.0% | | | | | |
Shinhan Financial Group Co. Ltd. | | 83,955 | | | 4,762,331 |
| | | | |
|
|
Spain — 2.9% | | | | | |
Banco Bilbao Vizcaya Argentaria SA | | 62,400 | | | 1,529,050 |
Banco Santander Central Hispano SA | | 197,100 | | | 4,262,042 |
Repsol YPF SA | | 61,200 | | | 2,181,464 |
Telefonica SA | | 189,200 | | | 6,146,503 |
| | | | |
|
|
| | | | | | 14,119,059 |
| | | | |
|
|
Sweden — 0.7% | | | | | |
Electrolux AB (Class B Stock) | | 59,500 | | | 998,847 |
Nordea Bank AB | | 69,700 | | | 1,164,686 |
SSAB Svenskt Stal AB, Series B | | 32,600 | | | 801,987 |
Volvo AB (Class B Stock) | | 34,600 | | | 580,842 |
| | | | |
|
|
| | | | | | 3,546,362 |
| | | | |
|
|
Switzerland — 10.1% | | | | | |
Baloise Holding | | 11,000 | | | 1,083,337 |
Ciba Specialty Chemicals AG | | 2,600 | | | 120,567 |
Credit Suisse Group | | 50,800 | | | 3,055,673 |
Georg Fischer AG* | | 1,400 | | | 861,900 |
Givaudan SA | | 3,472 | | | 3,345,804 |
Nestle SA | | 18,300 | | | 8,405,247 |
Novartis AG | | 119,615 | | | 6,561,049 |
Rieter Holdings AG | | 1,400 | | | 618,293 |
Roche Holding AG | | 54,885 | | | 9,482,406 |
Swiss Re | | 28,500 | | | 2,025,195 |
Swisscom AG | | 5,500 | | | 2,147,242 |
UBS AG | | 200,560 | | | 9,282,643 |
Verwaltungs und Privat Bank AG | | 2,900 | | | 717,860 |
SEE NOTES TO FINANCIAL STATEMENTS.
A22
| | | | |
| | | SP INTERNATIONAL VALUE PORTFOLIO (Continued) | | |
SCHEDULE OF INVESTMENTS | December 31, 2007 |
| | | | | |
COMMON STOCKS
(continued) | | Shares
| | Value
(Note 2)
|
| | | | | | |
Switzerland (continued) | | | | | |
Zurich Financial Services AG | | 7,400 | | $ | 2,173,298 |
| | | | |
|
|
| | | | | | 49,880,514 |
| | | | |
|
|
United Kingdom — 16.6% | | | | | |
Alliance & Leicester PLC | | 41,800 | | | 539,183 |
Arm Holdings PLC | | 1,083,700 | | | 2,674,950 |
AstraZeneca PLC | | 66,100 | | | 2,847,368 |
Aviva PLC | | 60,100 | | | 805,146 |
Barclays PLC | | 202,300 | | | 2,029,604 |
Beazley Group PLC | | 166,000 | | | 537,792 |
BP PLC | | 388,200 | | | 4,752,429 |
Bradford & Bingley PLC | | 101,000 | | | 538,817 |
Brit Insurance Holdings PLC | | 169,600 | | | 773,119 |
BT Group PLC | | 389,500 | | | 2,114,741 |
Carnival PLC | | 131,131 | | | 5,792,254 |
Dairy Crest Group PLC | | 40,400 | | | 468,851 |
Davis Service Group PLC | | 68,400 | | | 699,849 |
Drax Group PLC | | 16,911 | | | 203,662 |
DS Smith PLC | | 158,000 | | | 658,124 |
DSG International PLC | | 317,100 | | | 626,486 |
GKN PLC | | 203,300 | | | 1,141,225 |
GlaxoSmithKline PLC | | 47,500 | | | 1,209,342 |
HBOS PLC | | 167,200 | | | 2,446,294 |
Kingfisher | | 1,010,511 | | | 2,928,784 |
Legal & General PLC | | 364,200 | | | 946,821 |
Lloyds TSB Group PLC | | 608,966 | | | 5,721,633 |
Marks & Spencer Group PLC | | 511,000 | | | 5,696,313 |
Next PLC | | 107,767 | | | 3,483,829 |
Northern Foods PLC | | 162,900 | | | 304,813 |
Old Mutual PLC | | 230,800 | | | 770,007 |
Reckitt Benckiser PLC | | 103,923 | | | 6,028,179 |
| | | | | |
COMMON STOCKS
(continued) | | Shares
| | Value
(Note 2)
|
| | | | | | |
United Kingdom (continued) | | | | | |
Royal & Sun Alliance Insurance Group PLC | | 396,400 | | $ | 1,169,410 |
Royal Bank of Scotland Group PLC | | 170,100 | | | 1,503,392 |
Royal Dutch Shell PLC
(Class B Stock) | | 103,100 | | | 4,289,334 |
SABMiller PLC | | 243,500 | | | 6,863,524 |
Tate & Lyle PLC | | 65,200 | | | 577,554 |
Taylor Woodrow PLC | | 107,500 | | | 434,935 |
Tomkins PLC | | 125,800 | | | 442,614 |
TT Electronics PLC | | 127,500 | | | 286,162 |
Vodafone Group PLC | | 1,142,700 | | | 4,271,818 |
Vodafone Group PLC, ADR | | 142,000 | | | 5,299,440 |
| | | | |
|
|
| | | | | | 81,877,798 |
| | | | |
|
|
United States — 1.0% | | | | | |
Schlumberger Ltd. | | 50,600 | | | 4,977,522 |
| | | | |
|
|
TOTAL LONG-TERM INVESTMENTS
(cost $398,385,923) | | | 486,251,492 |
| | | | |
|
|
SHORT-TERM INVESTMENT — 0.7% | | | |
Affiliated Money Market Mutual Fund |
Dryden Core Investment Fund —Taxable Money Market Series
(cost $3,554,153)(w)(Note 4) | | 3,554,153 | | | 3,554,153 |
| | | | |
|
|
TOTAL INVESTMENTS(o) — 99.2%
(cost $401,940,076) | | | 489,805,645 |
OTHER ASSETS IN EXCESS OF
LIABILITIES(x) — 0.8% | | | 3,825,123 |
| | | | |
|
|
NET ASSETS — 100.0% | | $ | 493,630,768 |
| | | | |
|
|
The following abbreviations are used in the portfolio descriptions:
| | |
| ADR | | American Depositary Receipt |
| CHF | | Swiss Franc |
| EUR | | Euro |
| GBP | | British Pound |
| MXN | | Mexican Peso |
| * | Non-income producing security. |
| (o) | As of December 31, 2007, 66 securities representing $109,173,338 and 22.1% of the total net assets were fair valued in accordance with the policies adopted by the Board of Trustees. |
| (w) | Prudential Investments LLC, the manager of the Portfolio, also serves as manager of the Dryden Core Investment Fund — Taxable Money Market Series. |
SEE NOTES TO FINANCIAL STATEMENTS.
A23
| | | | |
| | | SP INTERNATIONAL VALUE PORTFOLIO (Continued) | | |
SCHEDULE OF INVESTMENTS | December 31, 2007 |
| (x) | Other assets in excess of liabilities includes net unrealized appreciation (depreciation) on forward foreign currency contracts as follows: |
| Forward | foreign currency exchange contracts outstanding at December 31, 2007: |
| | | | | | | | | | | | | |
Purchase Contracts
| | Notional
Amount
(000)
| | Value at Settlement
Date Payable
| | Current
Value
| | Unrealized
Depreciation
| |
British Pound | | | | | | | | | | | | | |
expiring 01/03/008 | | GBP | 8 | | $ | 15,207 | | $ | 15,189 | | $ | (18 | ) |
| | | | | |
|
| |
|
| |
|
|
|
| | | | |
Sale Contracts
| | Notional
Amount
(000)
| | Value at Settlement
Date Receivable
| | Current
Value
| | Unrealized
Appreciation
(Depreciation)
| |
Euro | | | | | | | | | | | | | |
expiring 01/03/08 | | EUR | 10 | | $ | 15,207 | | $ | 15,112 | | $ | 95 | |
expiring 06/24/08 | | EUR | 12,150 | | | 17,432,821 | | | 17,768,977 | | | (336,156 | ) |
Mexican Peso | | | | | | | | | | | | | |
expiring 06/06/08 | | MXN | 121,300 | | | 10,945,678 | | | 10,972,163 | | | (26,485 | ) |
Swiss Franc | | | | | | | | | | | | | |
expiring 06/24/08 | | CHF | 6,400 | | | 5,584,642 | | | 5,702,116 | | | (117,474 | ) |
| | | | | |
|
| |
|
| |
|
|
|
| | | | | | $ | 33,978,348 | | $ | 34,458,368 | | $ | (480,020 | ) |
| | | | | |
|
| |
|
| |
|
|
|
The industry classification of investments and other assets in excess of liabilities shown as a percentage of net assets as of December 31, 2007 were as follows:
| | | |
Financial – Bank & Trust | | 11.4 | % |
Telecommunications | | 10.7 | |
Pharmaceuticals | | 7.8 | |
Chemicals | | 7.4 | |
Oil, Gas & Consumable Fuels | | 7.3 | |
Insurance | | 4.6 | |
Automobile Manufacturers | | 3.9 | |
Beverages | | 2.3 | |
Electric | | 2.2 | |
Retail | | 2.0 | |
Electric Utilities | | 1.9 | |
Retail & Merchandising | | 1.7 | |
Food | | 1.7 | |
Leisure Equipment & Products | | 1.6 | |
Food Products | | 1.6 | |
Financial Services | | 1.6 | |
Real Estate | | 1.5 | |
Transportation | | 1.5 | |
Diversified Operations | | 1.4 | |
Diversified Financial Services | | 1.4 | |
Oil & Gas Exploration/Production | | 1.4 | |
Consumer Products & Services | | 1.3 | |
Automobiles | | 1.3 | |
Media | | 1.3 | |
Electronics | | 1.3 | |
Office Equipment | | 1.2 | |
Entertainment & Leisure | | 1.2 | |
Wireless Telecommunication Services | | 1.1 | |
Gaming | | 1.0 | |
Airlines | | 1.0 | |
Building Materials | | 0.9 | |
Aerospace | | 0.9 | |
Affiliated Money Market Mutual Fund | | 0.7 | |
Automotive Parts | | 0.7 | |
Iron/Steel | | 0.7 | |
Home Furnishings | | 0.7 | |
Semiconductor Components | | 0.5 | |
Telecom – Cellular | | 0.5 | |
| | | |
Oil & Gas | | 0.4 | % |
Distribution/Wholesale | | 0.4 | |
Aerospace & Defense | | 0.4 | |
Metals & Mining | | 0.3 | |
Machinery – Construction & Mining | | 0.3 | |
Steel Producers/Products | | 0.3 | |
Multimedia | | 0.3 | |
Foods | | 0.3 | |
Commercial Services | | 0.2 | |
Commercial Banks | | 0.2 | |
Insurance – Property Insurance | | 0.2 | |
Miscellaneous Manufacturing | | 0.2 | |
Furniture | | 0.2 | |
Electronic Components | | 0.2 | |
Farming & Agriculture | | 0.2 | |
Electrical Equipment | | 0.2 | |
Computer Services & Software | | 0.2 | |
Agriculture | | 0.2 | |
Rubber/Plastic Products | | 0.2 | |
Machinery | | 0.2 | |
Paper & Forest Products | | 0.1 | |
Auto/trucks Parts & Equipment | | 0.1 | |
Machinery & Equipment | | 0.1 | |
Diversified Machinery | | 0.1 | |
Healthcare-products | | 0.1 | |
Mining | | 0.1 | |
Construction | | 0.1 | |
Paper & Related Products | | 0.1 | |
Textiles | | 0.1 | |
| | |
|
|
| | | 99.2 | |
Other assets in excess of liabilities | | 0.8 | |
| | |
|
|
| | | 100.0 | % |
| | |
|
|
SEE NOTES TO FINANCIAL STATEMENTS.
A24
| | | | |
| | | SP INTERNATIONAL VALUE PORTFOLIO (Continued) | | |
STATEMENT OF ASSETS AND LIABILITIES
December 31, 2007
| | | |
| ASSETS | | | |
Investments at value: | | | |
Unaffiliated investments (cost $398,385,923) | | $ | 486,251,492 |
Affiliated investments (cost $3,554,153) | | | 3,554,153 |
Foreign currency, at value (cost $407,128) | | | 411,677 |
Cash | | | 22,820 |
Receivable for investments sold | | | 4,910,010 |
Tax reclaim receivable | | | 900,883 |
Dividends and interest receivable | | | 562,972 |
Other assets | | | 150,208 |
Prepaid expenses | | | 3,255 |
Receivable for Series shares sold | | | 2,086 |
Unrealized appreciation on foreign currency forward contracts | | | 95 |
| | |
|
|
Total Assets | | | 496,769,651 |
| | |
|
|
| LIABILITIES | | | |
Payable for investments purchased | | | 1,943,589 |
Unrealized depreciation on foreign currency forward contracts | | | 480,133 |
Management fee payable | | | 373,303 |
Accrued expenses and other liabilities | | | 189,828 |
Payable for Series shares repurchased | | | 151,390 |
Transfer agent fees payable | | | 640 |
| | |
|
|
Total Liabilities | | | 3,138,883 |
| | |
|
|
| NET ASSETS | | $ | 493,630,768 |
| | |
|
|
Net assets were comprised of: | | | |
Paid-in capital | | $ | 343,388,261 |
Retained earnings | | | 150,242,507 |
| | |
|
|
Net assets, December 31, 2007 | | $ | 493,630,768 |
| | |
|
|
Net asset value and redemption price per share, $493,630,768 / 46,449,421 outstanding shares of beneficial interest | | $ | 10.63 |
| | |
|
|
STATEMENT OF OPERATIONS
Year Ended December 31, 2007
| | | | |
| INVESTMENT INCOME | | | | |
Unaffiliated dividend income (net of $1,146,243 foreign withholding tax) | | $ | 14,210,338 | |
Affiliated dividend income | | | 208,458 | |
Interest | | | 16,244 | |
| | |
|
|
|
| | | | 14,435,040 | |
| | |
|
|
|
| EXPENSES | | | | |
Management fee | | | 4,666,427 | |
Custodian’s fees and expenses | | | 298,000 | |
Shareholders’ reports | | | 70,000 | |
Audit fee | | | 22,000 | |
Loan interest expense (Note 8) | | | 21,528 | |
Trustees’ fees | | | 15,000 | |
Legal fees and expenses | | | 8,000 | |
Transfer agent’s fees and expenses (including affiliated expense of $4,200) (Note 4) | | | 5,000 | |
Insurance expenses | | | 4,000 | |
Miscellaneous | | | 15,337 | |
| | |
|
|
|
Total expenses | | | 5,125,292 | |
| | |
|
|
|
| NET INVESTMENT INCOME | | | 9,309,748 | |
| | |
|
|
|
| NET REALIZED AND UNREALIZED GAIN (LOSS) ON INVESTMENTS AND FOREIGN CURRENCIES | | | | |
Net realized gain (loss) on: | | | | |
Investment transactions | | | 54,705,309 | |
Foreign currency transactions | | | (732,910 | ) |
| | |
|
|
|
| | | | 53,972,399 | |
| | |
|
|
|
Net change in unrealized appreciation (depreciation) on: | | | | |
Investments | | | 24,609,037 | |
Foreign currencies | | | (439,384 | ) |
| | |
|
|
|
| | | | 24,169,653 | |
| | |
|
|
|
| NET GAIN ON INVESTMENTS AND FOREIGN CURRENCIES | | | 78,142,052 | |
| | |
|
|
|
| NET INCREASE IN NET ASSETS RESULTING FROM OPERATIONS | | $ | 87,451,800 | |
| | |
|
|
|
STATEMENT OF CHANGES IN NET ASSETS
| | | | | | | | |
| | | Year Ended December 31,
| |
| | | 2007
| | | 2006
| |
| INCREASE (DECREASE) IN NET ASSETS | | | | | | | | |
| OPERATIONS: | | | | | | | | |
Net investment income | | $ | 9,309,748 | | | $ | 10,054,042 | |
Net realized gain on investment and foreign currency transactions | | | 53,972,399 | | | | 93,311,065 | |
Net change in unrealized appreciation (depreciation) on investments and foreign currencies | | | 24,169,653 | | | | 12,429,915 | |
| | |
|
|
| |
|
|
|
NET INCREASE IN NET ASSETS RESULTING FROM OPERATIONS | | | 87,451,800 | | | | 115,795,022 | |
| | |
|
|
| |
|
|
|
| DISTRIBUTIONS | | | (103,097,386 | ) | | | (11,818,434 | ) |
| | |
|
|
| |
|
|
|
| SERIES SHARE TRANSACTIONS: | | | | | | | | |
Series shares sold [3,727,566 and 10,491,513 shares, respectively] | | | 45,503,186 | | | | 104,888,014 | |
Series shares issued in reinvestment of distributions [9,781,536 and 1,199,841 shares, respectively] | | | 103,097,386 | | | | 11,818,434 | |
Series shares repurchased [9,807,700 and 11,838,881 shares, respectively] | | | (126,710,224 | ) | | | (122,618,454 | ) |
| | |
|
|
| |
|
|
|
INCREASE (DECREASE) IN NET ASSETS RESULTING FROM SERIES SHARE TRANSACTIONS | | | 21,890,348 | | | | (5,912,006 | ) |
| | |
|
|
| |
|
|
|
| TOTAL INCREASE IN NET ASSETS | | | 6,244,762 | | | | 98,064,582 | |
| NET ASSETS: | | | | | | | | |
Beginning of year | | | 487,386,006 | | | | 389,321,424 | |
| | |
|
|
| |
|
|
|
End of year | | $ | 493,630,768 | | | $ | 487,386,006 | |
| | |
|
|
| |
|
|
|
SEE NOTES TO FINANCIAL STATEMENTS.
A25
| | | | |
| | | SP LARGE CAP VALUE PORTFOLIO | | |
SCHEDULE OF INVESTMENTS | December 31, 2007 |
| | | | | |
| LONG-TERM INVESTMENTS — 98.0% | | Value
(Note 2)
|
| COMMON STOCKS | | Shares
| |
| | | | | | |
| | | | | | |
Aerospace & Defense — 2.5% | | | | | |
General Dynamics Corp. | | 10,400 | | $ | 925,496 |
Goodrich Corp. | | 8,900 | | | 628,429 |
Lockheed Martin Corp. | | 8,100 | | | 852,606 |
Northrop Grumman Corp. | | 109,000 | | | 8,571,760 |
United Technologies Corp. | | 127,400 | | | 9,751,196 |
| | | | |
|
|
| | | | | | 20,729,487 |
| | | | |
|
|
Auto Components — 0.5% | | | | | |
Johnson Controls, Inc. | | 124,300 | | | 4,479,772 |
| | | | |
|
|
Automotive Parts | | | | | |
Advance Auto Parts, Inc. | | 6,200 | | | 235,538 |
| | | | |
|
|
Banks — 2.3% | | | | | |
Colonial BancGroup, Inc. (The)(a) | | 53,900 | | | 729,806 |
Fannie Mae | | 245,300 | | | 9,807,094 |
Fifth Third Bancorp | | 12,000 | | | 301,560 |
KeyCorp(a) | | 141,669 | | | 3,322,138 |
Wells Fargo & Co.(a) | | 169,000 | | | 5,102,110 |
| | | | |
|
|
| | | | | | 19,262,708 |
| | | | |
|
|
Beverages — 0.3% | | | | | |
Coca-Cola Co. | | 42,900 | | | 2,632,773 |
| | | | |
|
|
Biotechnology Healthcare — 0.1% | | | | | |
Celgene Corp.* | | 15,000 | | | 693,150 |
| | | | |
|
|
Chemicals — 2.5% | | | | | |
Air Products & Chemicals, Inc. | | 14,900 | | | 1,469,587 |
Dow Chemical Co. | | 146,500 | | | 5,775,030 |
E.I. DuPont de Nemours & Co. | | 23,100 | | | 1,018,479 |
Eastman Chemical Co. | | 86,000 | | | 5,253,740 |
PPG Industries, Inc. | | 17,500 | | | 1,229,025 |
Praxair, Inc. | | 16,100 | | | 1,428,231 |
Rohm & Haas Co.(a) | | 90,300 | | | 4,792,221 |
| | | | |
|
|
| | | | | | 20,966,313 |
| | | | |
|
|
Clothing & Apparel — 0.1% | | | | | |
Limited Brands, Inc. | | 37,400 | | | 707,982 |
VF Corp. | | 4,500 | | | 308,970 |
| | | | |
|
|
| | | | | | 1,016,952 |
| | | | |
|
|
Commercial Banks — 4.2% | | | | | |
Bank of America Corp. | | 656,768 | | | 27,098,248 |
Bank of New York Mellon Corp. (The) | | 49,100 | | | 2,394,116 |
Comerica, Inc. | | 55,900 | | | 2,433,327 |
Huntington Bancshares, Inc.(a) | | 89,900 | | | 1,326,924 |
National City Corp.(a) | | 41,100 | | | 676,506 |
UnionBanCal Corp. | | 13,900 | | | 679,849 |
Zions Bancorp(a) | | 9,200 | | | 429,548 |
| | | | |
|
|
| | | | | | 35,038,518 |
| | | | |
|
|
Commercial Services — 0.2% | | | | | |
Domtar Corp. (Canada)*(a) | | 241,000 | | | 1,853,290 |
| | | | |
|
|
Computers — 0.1% | | | | | |
SanDisk Corp.* | | 9,800 | | | 325,066 |
Sun Microsystems, Inc.* | | 14,500 | | | 262,885 |
| | | | |
|
|
| | | | | | 587,951 |
| | | | |
|
|
Computers & Peripherals — 0.2% | | | | | |
Hewlett-Packard Co. | | 27,500 | | | 1,388,200 |
| | | | |
|
|
| | | | | |
COMMON STOCKS
(continued) | | Shares
| | Value
(Note 2)
|
| | | | | | |
Construction — 0.2% | | | | | |
Toll Brothers, Inc.*(a) | | 75,100 | | $ | 1,506,506 |
| | | | |
|
|
Consumer Products & Services — 2.0% | | | | | |
Procter & Gamble Co. | | 118,100 | | | 8,670,902 |
UST, Inc.(a) | | 143,289 | | | 7,852,237 |
| | | | |
|
|
| | | | | | 16,523,139 |
| | | | |
|
|
Diversified — 0.1% | | | | | |
Vornado Realty Trust(a) | | 8,800 | | | 773,960 |
| | | | |
|
|
Diversified Financial Services — 7.0% | | | | | |
BB & T Corp.(a) | | 57,300 | | | 1,757,391 |
Capital One Financial Corp.(a) | | 34,100 | | | 1,611,566 |
CIT Group, Inc. | | 132,300 | | | 3,179,169 |
Citigroup, Inc. | | 540,300 | | | 15,906,432 |
Countrywide Financial Corp.(a) | | 57,200 | | | 511,368 |
Goldman Sachs Group, Inc. | | 23,700 | | | 5,096,685 |
JPMorgan Chase & Co. | | 110,400 | | | 4,818,960 |
Lehman Brothers Holdings, Inc.(a) | | 39,400 | | | 2,578,336 |
Morgan Stanley | | 102,600 | | | 5,449,086 |
State Street Corp. | | 56,900 | | | 4,620,280 |
SunTrust Banks, Inc.(a) | | 37,400 | | | 2,337,126 |
TCF Financial Corp.(a) | | 100,600 | | | 1,803,758 |
U.S. Bancorp | | 271,600 | | | 8,620,584 |
| | | | |
|
|
| | | | | | 58,290,741 |
| | | | |
|
|
Diversified Telecommunication Services — 5.0% |
AT&T, Inc. | | 463,100 | | | 19,246,436 |
Cisco Systems, Inc.* | | 78,800 | | | 2,133,116 |
Corning, Inc. | | 71,000 | | | 1,703,290 |
Motorola, Inc.(a) | | 1,100 | | | 17,644 |
Sprint Nextel Corp. | | 145,900 | | | 1,915,667 |
Verizon Communications, Inc.(a) | | 384,700 | | | 16,807,543 |
| | | | |
|
|
| | | | | | 41,823,696 |
| | | | |
|
|
Electric — 0.3% | | | | | |
DTE Energy Co.(a) | | 52,400 | | | 2,303,504 |
| | | | |
|
|
Electric – Integrated — 0.3% | | | | | |
Sierra Pacific Resources(a) | | 127,200 | | | 2,159,856 |
| | | | |
|
|
Electric Utilities — 7.2% | | | | | |
American Electric Power Co., Inc. | | 125,600 | | | 5,847,936 |
CMS Energy Corp.(a) | | 175,000 | | | 3,041,500 |
Edison International | | 107,100 | | | 5,715,927 |
Entergy Corp. | | 20,200 | | | 2,414,304 |
Exelon Corp. | | 67,100 | | | 5,478,044 |
FirstEnergy Corp. | | 68,700 | | | 4,969,758 |
FPL Group, Inc.(a) | | 44,400 | | | 3,009,432 |
General Electric Co. | | 637,100 | | | 23,617,297 |
Ingersoll-Rand Co. Ltd. (Class A Stock)(a) | | 13,300 | | | 618,051 |
Northeast Utilities | | 73,800 | | | 2,310,678 |
Xcel Energy, Inc. | | 125,600 | | | 2,834,792 |
| | | | |
|
|
| | | | | | 59,857,719 |
| | | | |
|
|
Electronic Components | | | | | |
LSI Logic Corp.* | | 17,900 | | | 95,049 |
| | | | |
|
|
Electronic Equipment & Instruments — 0.9% |
Tyco Electronics Ltd. (Bermuda) | | 197,856 | | | 7,346,393 |
| | | | |
|
|
SEE NOTES TO FINANCIAL STATEMENTS.
A26
| | | | |
| | | SP LARGE CAP VALUE PORTFOLIO (Continued) | | |
SCHEDULE OF INVESTMENTS | December 31, 2007 |
| | | | | |
COMMON STOCKS
(continued) | | Shares
| | Value
(Note 2)
|
| | | | | | |
Entertainment & Leisure — 0.1% | | | | | |
Royal Caribbean Cruises Ltd. | | 26,800 | | $ | 1,137,392 |
| | | | |
|
|
Exchange Traded Fund — 0.1% | | | |
iShares Russell 1000 Value Index Fund | | 13,720 | | | 1,102,402 |
| | | | |
|
|
Financial – Bank & Trust — 4.9% | | | | | |
PNC Financial Services Group, Inc. | | 88,193 | | | 5,789,870 |
Regions Financial Corp. | | 95,800 | | | 2,265,670 |
Sovereign Bancorp, Inc.(a) | | 206,619 | | | 2,355,457 |
Wachovia Corp.(a) | | 518,500 | | | 19,718,555 |
Washington Mutual, Inc.(a) | | 798,800 | | | 10,871,668 |
| | | | |
|
|
| | | | | | 41,001,220 |
| | | | |
|
|
Financial Services — 1.6% | | | | | |
Freddie Mac | | 321,400 | | | 10,950,098 |
TD Ameritrade Holding Corp.*(a) | | 116,700 | | | 2,341,002 |
| | | | |
|
|
| | | | | | 13,291,100 |
| | | | |
|
|
Food & Staples Retailing — 1.1% | | | | | |
Safeway, Inc. | | 89,200 | | | 3,051,532 |
SYSCO Corp. | | 27,900 | | | 870,759 |
Wal-Mart Stores, Inc. | | 115,000 | | | 5,465,950 |
| | | | |
|
|
| | | | | | 9,388,241 |
| | | | |
|
|
Food Products — 1.2% | | | | | |
Campbell Soup Co. | | 3,500 | | | 125,055 |
General Mills, Inc. | | 61,000 | | | 3,477,000 |
Kraft Foods, Inc. (Class A Stock) | | 196,100 | | | 6,398,743 |
| | | | |
|
|
| | | | | | 10,000,798 |
| | | | |
|
|
Healthcare Equipment & Supplies — 0.4% | | | | | |
Covidien Ltd. (Bermuda) | | 69,128 | | | 3,061,679 |
| | | | |
|
|
Healthcare-Products — 0.2% | | | | | |
Boston Scientific Corp.*(a) | | 24,700 | | | 287,261 |
C.R. Bard, Inc.(a) | | 11,700 | | | 1,109,160 |
| | | | |
|
|
| | | | | | 1,396,421 |
| | | | |
|
|
Healthcare Providers & Services — 2.6% | | | | | |
Aetna, Inc. | | 129,900 | | | 7,499,127 |
UnitedHealth Group, Inc. | | 203,400 | | | 11,837,880 |
WellPoint, Inc.* | | 29,700 | | | 2,605,581 |
| | | | |
|
|
| | | | | | 21,942,588 |
| | | | |
|
|
Healthcare Supplies — 0.4% | | | | | |
Amgen, Inc.* | | 78,100 | | | 3,626,964 |
| | | | |
|
|
Hotels & Motels — 0.1% | | | | | |
Starwood Hotels & Resorts Worldwide, Inc. | | 26,400 | | | 1,162,392 |
| | | | |
|
|
Hotels, Restaurants & Leisure — 0.7% |
Carnival Corp. (Panama) | | 48,400 | | | 2,153,316 |
McDonald’s Corp. | | 36,100 | | | 2,126,651 |
Wyndham Worldwide Corp.(a) | | 45,600 | | | 1,074,336 |
| | | | |
|
|
| | | | | | 5,354,303 |
| | | | |
|
|
Household Durables — 0.7% | | | | | |
Centex Corp(a) | | 83,400 | | | 2,106,684 |
Lennar Corp. (Class A Stock)(a) | | 188,900 | | | 3,379,421 |
Lennar Corp. (Class B Stock) | | 16,700 | | | 277,220 |
| | | | |
|
|
| | | | | | 5,763,325 |
| | | | |
|
|
| | | | | |
COMMON STOCKS
(continued) | | Shares
| | Value
(Note 2)
|
| | | | | | |
Industrial Conglomerates — 1.5% | | | | | |
3M Co. | | 73,500 | | $ | 6,197,520 |
Eaton Corp. | | 15,900 | | | 1,541,505 |
Tyco International Ltd. (Bermuda) | | 118,871 | | | 4,713,235 |
| | | | |
|
|
| | | | | | 12,452,260 |
| | | | |
|
|
Insurance — 7.4% | | | | | |
AFLAC, Inc.(a) | | 16,900 | | | 1,058,447 |
Allstate Corp. (The) | | 42,000 | | | 2,193,660 |
AMBAC Financial Group, Inc.(a) | | 63,800 | | | 1,644,126 |
American International Group, Inc. | | 60,400 | | | 3,521,320 |
Assurant, Inc.(a) | | 20,800 | | | 1,391,520 |
AXIS Capital Holdings, Ltd. | | 59,400 | | | 2,314,818 |
Chubb Corp. (The) | | 108,000 | | | 5,894,640 |
CIGNA Corp. | | 13,400 | | | 719,982 |
Genworth Financial, Inc. (Class A Stock) | | 207,400 | | | 5,278,330 |
Hanover Insurance Group, Inc. (The) | | 39,600 | | | 1,813,680 |
Hartford Financial Services Group, Inc. | | 76,400 | | | 6,661,316 |
Lincoln National Corp. | | 30,500 | | | 1,775,710 |
MBIA, Inc.(a) | | 80,300 | | | 1,495,989 |
MetLife, Inc. | | 149,700 | | | 9,224,514 |
Protective Life Corp. | | 20,800 | | | 853,216 |
Provident Corp. | | 150,700 | | | 3,585,153 |
Renaissance Holdings Ltd.(a) | | 41,700 | | | 2,512,008 |
Travelers Cos., Inc. (The) | | 132,100 | | | 7,106,980 |
W.R. Berkely Corp. | | 12,000 | | | 357,720 |
XL Capital Ltd. (Class A Stock) | | 38,300 | | | 1,926,873 |
| | | | |
|
|
| | | | | | 61,330,002 |
| | | | |
|
|
Internet Services — 0.1% | | | | | |
eBay, Inc.* | | 20,700 | | | 687,033 |
| | | | |
|
|
IT Consulting & Services — 0.4% | | | | | |
Affiliated Computer Services, Inc. (Class A Stock)* | | 2,800 | | | 126,280 |
International Business Machines Corp.(a) | | 29,200 | | | 3,156,520 |
| | | | |
|
|
| | | | | | 3,282,800 |
| | | | |
|
|
IT Services — 0.8% | | | | | |
Electronic Data Systems Corp. | | 322,100 | | | 6,677,133 |
| | | | |
|
|
Machinery — 0.3% | | | | | |
Deere & Co. | | 2,800 | | | 260,736 |
Dover Corp. | | 52,800 | | | 2,433,552 |
| | | | |
|
|
| | | | | | 2,694,288 |
| | | | |
|
|
Machinery & Equipment — 0.3% | | | | | |
Caterpillar, Inc. | | 33,000 | | | 2,394,480 |
Rockwell Automation, Inc. | | 1,200 | | | 82,752 |
| | | | |
|
|
| | | | | | 2,477,232 |
| | | | |
|
|
Manufacturing — 0.1% | | | | | |
Danaher Corp. | | 12,000 | | | 1,052,880 |
| | | | |
|
|
Media — 1.9% | | | | | |
CBS Corp. (Class B Stock)(a) | | 57,800 | | | 1,575,050 |
Idearc, Inc. | | 136,700 | | | 2,400,452 |
News Corp. (Class A Stock) | | 217,800 | | | 4,462,722 |
Time Warner, Inc.(a) | | 32,800 | | | 541,528 |
Walt Disney Co. (The) | | 217,200 | | | 7,011,216 |
| | | | |
|
|
| | | | | | 15,990,968 |
| | | | |
|
|
SEE NOTES TO FINANCIAL STATEMENTS.
A27
| | | | |
| | | SP LARGE CAP VALUE PORTFOLIO (Continued) | | |
SCHEDULE OF INVESTMENTS | December 31, 2007 |
| | | | | |
COMMON STOCKS
(continued) | | Shares
| | Value
(Note 2)
|
| | | | | | |
Metals & Mining — 0.5% | | | | | |
United States Steel Corp.(a) | | 34,900 | | $ | 4,219,759 |
| | | | |
|
|
Multi-Line Retail — 0.7% | | | | | |
Abercrombie & Fitch Co. (Class A Stock)(a) | | 7,400 | | | 591,778 |
Kohl’s Corp.* | | 8,800 | | | 403,040 |
Lowe’s Cos., Inc.(a) | | 203,200 | | | 4,596,384 |
| | | | |
|
|
| | | | | | 5,591,202 |
| | | | |
|
|
Multi-Utilities — 0.1% | | | | | |
SCANA Corp. | | 20,500 | | | 864,075 |
| | | | |
|
|
Networking Products | | | | | |
Juniper Networks, Inc.*(a) | | 10,100 | | | 335,320 |
| | | | |
|
|
Office Equipment — 0.8% | | | | | |
Staples, Inc.(a) | | 293,959 | | | 6,781,634 |
| | | | |
|
|
Oil & Gas — 2.7% | | | | | |
Apache Corp. | | 88,050 | | | 9,468,897 |
Occidental Petroleum Corp. | | 150,900 | | | 11,617,791 |
Schlumberger Ltd. (Netherlands) | | 15,700 | | | 1,544,409 |
| | | | |
|
|
| | | | | | 22,631,097 |
| | | | |
|
|
Oil, Gas & Consumable Fuels — 13.6% | | | | | |
Anadarko Petroleum Corp. | | 137,200 | | | 9,012,668 |
ChevronTexaco Corp. | | 186,800 | | | 17,434,044 |
ConocoPhillips | | 324,701 | | | 28,671,099 |
Devon Energy Corp. | | 156,800 | | | 13,941,088 |
EnCana Corp.(a) | | 800 | | | 54,368 |
Exxon Mobil Corp. | | 272,800 | | | 25,558,632 |
Halliburton Co. | | 6,100 | | | 231,251 |
Hess Corp. | | 7,400 | | | 746,364 |
Marathon Oil Corp. | | 113,900 | | | 6,931,954 |
Nabors Industries Ltd. (Bermuda)* | | 10,700 | | | 293,073 |
Patterson-UTI Energy, Inc. | | 18,800 | | | 366,976 |
Royal Dutch Shell PLC (Class B Stock), ADR (United Kingdom) | | 37,300 | | | 3,095,900 |
Sunoco, Inc.(a) | | 37,300 | | | 2,702,012 |
XTO Energy, Inc. | | 80,375 | | | 4,128,060 |
| | | | |
|
|
| | | | | | 113,167,489 |
| | | | |
|
|
Paper & Forest Products — 0.1% | | | | | |
Weyerhaeuser Co.(a) | | 6,700 | | | 494,058 |
| | | | |
|
|
Pharmaceuticals — 6.5% | | | | | |
Abbott Laboratories | | 41,100 | | | 2,307,765 |
AstraZeneca PLC, ADR (United Kingdom)(a) | | 44,000 | | | 1,884,080 |
Bristol-Meyers Squibb Co. | | 39,100 | | | 1,036,932 |
Eli Lilly & Co. | | 117,900 | | | 6,294,681 |
Johnson & Johnson | | 65,600 | | | 4,375,520 |
Merck & Co., Inc. | | 101,000 | | | 5,869,110 |
Pfizer, Inc. | | 853,100 | | | 19,390,963 |
Schering-Plough Corp. | | 154,400 | | | 4,113,216 |
Sepracor, Inc.*(a) | | 12,300 | | | 322,875 |
Wyeth | | 198,400 | | | 8,767,296 |
| | | | |
|
|
| | | | | | 54,362,438 |
| | | | |
|
|
Real Estate Investment Trusts — 1.2% | | | | | |
Alexandria Real Estate Equities, Inc.(a) | | 4,800 | | | 488,016 |
Apartment Investment & Management Co. (Class A Stock)(a) | | 47,600 | | | 1,653,148 |
| | | | | |
COMMON STOCKS
(continued) | | Shares
| | Value
(Note 2)
|
| | | | | | |
Real Estate Investment Trusts (continued) | | | | | |
Duke Realty Corp.(a) | | 56,000 | | $ | 1,460,480 |
Hospitality Properties Trust(a) | | 70,400 | | | 2,268,288 |
Host Hotels & Resorts Inc.(a) | | 57,100 | | | 972,984 |
Liberty Property Trust | | 14,900 | | | 429,269 |
ProLogis(a) | | 8,800 | | | 557,744 |
Public Storage, Inc.(a) | | 19,900 | | | 1,460,859 |
Simon Property Group, Inc.(a) | | 1,100 | | | 95,546 |
UDR, Inc. | | 11,000 | | | 218,350 |
| | | | |
|
|
| | | | | | 9,604,684 |
| | | | |
|
|
Retail — 0.2% | | | | | |
Borders Group, Inc.(a) | | 99,700 | | | 1,061,805 |
Family Dollar Stores, Inc.(a) | | 33,200 | | | 638,436 |
| | | | |
|
|
| | | | | | 1,700,241 |
| | | | |
|
|
Retail & Merchandising — 0.4% | | | | | |
CVS/Caremark Corp. | | 26,000 | | | 1,033,500 |
Macy’s, Inc. | | 77,400 | | | 2,002,338 |
| | | | |
|
|
| | | | | | 3,035,838 |
| | | | |
|
|
Semiconductors — 0.2% | | | | | |
Altera Corp. | | 7,600 | | | 146,832 |
Broadcom Corp. (Class A Stock) | | 17,600 | | | 460,064 |
Xilinx, Inc. | | 51,300 | | | 1,121,931 |
| | | | |
|
|
| | | | | | 1,728,827 |
| | | | |
|
|
Software — 2.1% | | | | | |
BMC Software, Inc.* | | 87,600 | | | 3,122,064 |
CA, Inc.(a) | | 270,715 | | | 6,754,339 |
Microsoft Corp. | | 202,900 | | | 7,223,240 |
| | | | |
|
|
| | | | | | 17,099,643 |
| | | | |
|
|
Specialty Retail — 1.3% | | | | | |
AutoNation, Inc.*(a) | | 94,600 | | | 1,481,436 |
AutoZone, Inc.* | | 5,300 | | | 635,523 |
Gap, Inc. | | 98,600 | | | 2,098,208 |
Home Depot, Inc. (The) | | 150,525 | | | 4,055,144 |
NIKE, Inc. (Class B Stock)(a) | | 25,800 | | | 1,657,392 |
Ross Stores, Inc. | | 20,500 | | | 524,185 |
| | | | |
|
|
| | | | | | 10,451,888 |
| | | | |
|
|
Telecommunication Services | | | | | |
Crown Castle International Corp.* | | 5,500 | | | 228,800 |
| | | | |
|
|
Textiles, Apparel & Luxury Goods — 0.2% | | | |
Jones Apparel Group, Inc. | | 100,400 | | | 1,605,396 |
| | | | |
|
|
Tobacco — 3.8% | | | | | |
Altria Group, Inc. | | 387,800 | | | 29,309,924 |
Imperial Tobacco Group, ADR (United Kingdom) | | 18,400 | | | 1,973,952 |
| | | | |
|
|
| | | | | | 31,283,876 |
| | | | |
|
|
Transportation — 0.6% | | | | | |
Norfolk Southern Corp. | | 94,900 | | | 4,786,756 |
| | | | |
|
|
Utilities — 0.1% | | | | | |
Dynegy, Inc.* | | 13,100 | | | 93,534 |
Illinois Tool Works, Inc. | | 12,400 | | | 663,896 |
| | | | |
|
|
| | | | | | 757,430 |
| | | | |
|
|
TOTAL LONG-TERM INVESTMENTS
(cost $769,577,607) | | | 815,169,087 |
| | | | |
|
|
SEE NOTES TO FINANCIAL STATEMENTS.
A28
| | | | |
| | | SP LARGE CAP VALUE PORTFOLIO (Continued) | | |
SCHEDULE OF INVESTMENTS | December 31, 2007 |
| | | | | | |
SHORT-TERM
INVESTMENT — 15.3% | | Shares
| | Value
(Note 2)
| |
| | | | | | | |
Affiliated Money Market Mutual Fund | | | | |
Dryden Core Investment Fund — Taxable Money Market Series
(cost $126,898,413; includes $111,341,082 of cash collateral for securities on loan)(b)(w) (Note 4) | | 126,898,413 | | $ | 126,898,413 | |
| | | | |
|
|
|
TOTAL SHORT-TERM INVESTMENTS
(cost $126,898,413) | | | 126,898,413 | |
| | | | |
|
|
|
TOTAL INVESTMENTS — 113.3%
(cost $896,476,020) | | | 942,067,500 | |
| | | | |
|
|
|
LIABILITIES IN EXCESS OF OTHER ASSETS — (13.3)% | | | (110,463,834 | ) |
| | | | |
|
|
|
NET ASSETS — 100.0% | | $ | 831,603,666 | |
| | | | |
|
|
|
The following abbreviation is used in the portfolio descriptions.
| | |
| ADR | | American Depositary Receipt |
| * | Non-income producing security. |
| (a) | All or a portion of security is on loan. The aggregate market value of such securities is $107,373,558; cash collateral of $111,341,082 (included with liabilities) was received with which the portfolio purchased highly liquid short-term investments. |
| (b) | Represents security, or a portion thereof, purchased with cash collateral received for securities on loan. |
| (w) | Prudential Investments LLC, the manager of the Portfolio, also serves as manager of the Dryden Core Investment Fund-Taxable Money Market Fund. |
The industry classification of investments and liabilities in excess of other assets shown as a percentage of net assets as of December 31, 2007 were as follows:
| | | |
Affiliated Money Market Mutual Fund (13.4% represents investments purchased with collateral from securities on loan) | | 15.3 | % |
Oil, Gas & Consumable Fuels | | 13.6 | |
Insurance | | 7.4 | |
Electric Utilities | | 7.2 | |
Diversified Financial Services | | 7.0 | |
Pharmaceuticals | | 6.5 | |
Diversified Telecommunication Services | | 5.0 | |
Financial – Bank & Trust | | 4.9 | |
Commercial Banks | | 4.2 | |
Tobacco | | 3.8 | |
Oil & Gas | | 2.7 | |
Healthcare Providers & Services | | 2.6 | |
Aerospace & Defense | | 2.5 | |
Chemicals | | 2.5 | |
Banks | | 2.3 | |
Software | | 2.1 | |
Consumer Products & Services | | 2.0 | |
Media | | 1.9 | |
Financial Services | | 1.6 | |
Industrial Conglomerates | | 1.5 | |
Specialty Retail | | 1.3 | |
Food Products | | 1.2 | |
Real Estate Investment Trusts | | 1.2 | |
Food & Staples Retailing | | 1.1 | |
Electronic Equipment & Instruments | | 0.9 | |
IT Services | | 0.8 | |
Office Equipment | | 0.8 | |
Hotels, Restaurants & Leisure | | 0.7 | |
Household Durables | | 0.7 | |
Multi-Line Retail | | 0.7 | |
Transportation | | 0.6 | |
| | | |
Auto Components | | 0.5 | % |
Metals & Mining | | 0.5 | |
Healthcare Equipment & Supplies | | 0.4 | |
Healthcare Supplies | | 0.4 | |
IT Consulting & Services | | 0.4 | |
Retail & Merchandising | | 0.4 | |
Beverages | | 0.3 | |
Electric | | 0.3 | |
Electric – Integrated | | 0.3 | |
Machinery | | 0.3 | |
Machinery & Equipment | | 0.3 | |
Commercial Services | | 0.2 | |
Computers & Peripherals | | 0.2 | |
Construction | | 0.2 | |
Healthcare-Products | | 0.2 | |
Retail | | 0.2 | |
Semiconductors | | 0.2 | |
Textiles, Apparel & Luxury Goods | | 0.2 | |
Biotechnology Healthcare | | 0.1 | |
Clothing & Apparel | | 0.1 | |
Computers | | 0.1 | |
Diversified | | 0.1 | |
Entertainment & Leisure | | 0.1 | |
Exchange Traded Fund | | 0.1 | |
Hotels & Motels | | 0.1 | |
Internet Services | | 0.1 | |
Manufacturing | | 0.1 | |
Multi-Utilities | | 0.1 | |
Paper & Forest Products | | 0.1 | |
Utilities | | 0.1 | |
| | |
|
|
| | | 113.3 | |
Liabilities in excess of other assets | | (13.3 | ) |
| | |
|
|
| | | 100.0 | % |
| | |
|
|
SEE NOTES TO FINANCIAL STATEMENTS.
A29
| | | | |
| | | SP LARGE CAP VALUE PORTFOLIO (Continued) | | |
STATEMENT OF ASSETS AND LIABILITIES
December 31, 2007
| | | |
| ASSETS | | | |
Investments at value, including securities on loan of $107,373,558: | | | |
Unaffiliated investments (cost $769,577,607) | | $ | 815,169,087 |
Affiliated investments (cost $126,898,413) | | | 126,898,413 |
Cash | | | 212,255 |
Dividends and interest receivable | | | 1,711,286 |
Receivable for investments sold | | | 415,053 |
Receivable for Series shares sold | | | 9,781 |
Prepaid expenses | | | 4,276 |
| | |
|
|
Total Assets | | | 944,420,151 |
| | |
|
|
| LIABILITIES | | | |
Collateral for securities on loan | | | 111,341,082 |
Payable for investments purchased | | | 788,314 |
Management fee payable | | | 570,613 |
Accrued expenses and other liabilities | | | 111,875 |
Payable for Series shares repurchased | | | 2,012 |
Deferred trustees’ fees | | | 1,961 |
Transfer agent fees payable | | | 628 |
| | |
|
|
Total Liabilities | | | 112,816,485 |
| | |
|
|
| NET ASSETS | | $ | 831,603,666 |
| | |
|
|
Net assets were comprised of: | | | |
Paid-in capital | | $ | 708,972,029 |
Retained earnings | | | 122,631,637 |
| | |
|
|
Net assets, December 31, 2007 | | $ | 831,603,666 |
| | |
|
|
Net asset value and redemption price per share, $831,603,666 / 70,497,513 outstanding shares of beneficial interest | | $ | 11.80 |
| | |
|
|
STATEMENT OF OPERATIONS
Year Ended December 31, 2007
| | | | |
| INVESTMENT INCOME | | | | |
Unaffiliated dividend income (net of $5,480 foreign withholding tax) | | $ | 22,757,468 | |
Affiliated dividend income | | | 1,046,928 | |
Affiliated income from securities lending, net | | | 261,620 | |
| | |
|
|
|
| | | | 24,066,016 | |
| | |
|
|
|
| EXPENSES | | | | |
Management fee | | | 7,577,944 | |
Custodian’s fees and expenses | | | 147,000 | |
Shareholders’ reports | | | 48,000 | |
Trustees’ fees | | | 22,000 | |
Audit fee | | | 19,000 | |
Legal fees and expenses | | | 19,000 | |
Transfer agent’s fees and expenses (including affiliated expense of $4,000) (Note 4) | | | 5,000 | |
Commitment fee on syndicated credit agreement | | | 3,500 | |
Insurance expenses | | | 3,000 | |
Loan interest expense (Note 8) | | | 1,452 | |
Miscellaneous | | | 12,263 | |
| | |
|
|
|
Total expenses | | | 7,858,159 | |
| | |
|
|
|
| NET INVESTMENT INCOME | | | 16,207,857 | |
| | |
|
|
|
| NET REALIZED AND UNREALIZED GAIN (LOSS) ON INVESTMENTS | | | | |
Net realized gain on: | | | | |
Investment transactions | | | 63,863,683 | |
Futures transactions | | | 106,357 | |
| | |
|
|
|
| | | | 63,970,040 | |
| | |
|
|
|
Net change in unrealized appreciation (depreciation) on: | | | | |
Investments | | | (102,281,380 | ) |
Futures | | | (158,575 | ) |
| | |
|
|
|
| | | | (102,439,955 | ) |
| | |
|
|
|
| NET LOSS ON INVESTMENTS | | | (38,469,915 | ) |
| | |
|
|
|
| NET DECREASE IN NET ASSETS RESULTING FROM OPERATIONS | | $ | (22,262,058 | ) |
| | |
|
|
|
STATEMENT OF CHANGES IN NET ASSETS
| | | | | | | | |
| | | Year Ended December 31,
| |
| | | 2007
| | | 2006
| |
| INCREASE (DECREASE) IN NET ASSETS | |
| OPERATIONS: | |
Net investment income | | $ | 16,207,857 | | | $ | 14,587,125 | |
Net realized gain on investment transactions | | | 63,970,040 | | | | 55,552,273 | |
Net change in unrealized appreciation (depreciation) on investments | | | (102,439,955 | ) | | | 83,869,663 | |
| | |
|
|
| |
|
|
|
NET INCREASE (DECREASE) IN NET ASSETS RESULTING FROM OPERATIONS | | | (22,262,058 | ) | | | 154,009,061 | |
| | |
|
|
| |
|
|
|
| DISTRIBUTIONS | | | (70,135,393 | ) | | | (51,644,712 | ) |
| | |
|
|
| |
|
|
|
| SERIES SHARE TRANSACTIONS: | | | | | | | | |
Series shares sold [5,291,911 and 7,084,853 shares, respectively] | | | 71,045,079 | | | | 83,219,245 | |
Series shares issued in reinvestment of distributions [5,943,677 and 4,380,383 shares, respectively] | | | 70,135,393 | | | | 51,644,712 | |
Series shares repurchased [13,112,555 and 9,098,369 shares, respectively] | | | (176,808,069 | ) | | | (110,691,150 | ) |
| | |
|
|
| |
|
|
|
INCREASE (DECREASE) IN NET ASSETS RESULTING FROM SERIES SHARE TRANSACTIONS | | | (35,627,597 | ) | | | 24,172,807 | |
| | |
|
|
| |
|
|
|
| TOTAL INCREASE (DECREASE) IN NET ASSETS | | | (128,025,048 | ) | | | 126,537,156 | |
| NET ASSETS: | |
Beginning of year | | | 959,628,714 | | | | 833,091,558 | |
| | |
|
|
| |
|
|
|
End of year | | $ | 831,603,666 | | | $ | 959,628,714 | |
| | |
|
|
| |
|
|
|
SEE NOTES TO FINANCIAL STATEMENTS.
A30
| | | | |
| | | SP MID-CAP GROWTH PORTFOLIO | | |
SCHEDULE OF INVESTMENTS | December 31, 2007 |
| | | | | |
| LONG-TERM INVESTMENTS — 94.4% | | Value
(Note 2)
|
| COMMON STOCKS | | Shares
| |
| | | | | | |
Advertising — 2.2% | | | | | |
Focus Media Holding Ltd., ADR (China)*(a) | | 28,100 | | $ | 1,596,361 |
Lamar Advertising Co.(a) | | 27,000 | | | 1,297,890 |
| | | | |
|
|
| | | | | | 2,894,251 |
| | | | |
|
|
Aerospace — 3.6% | | | | | |
AerCap Holdings NV (Netherlands)* | | 55,500 | | | 1,158,285 |
BE Aerospace, Inc.* | | 43,300 | | | 2,290,570 |
CAE, Inc. (Canada) | | 104,000 | | | 1,390,480 |
| | | | |
|
|
| | | | | | 4,839,335 |
| | | | |
|
|
Air Freight & Logistics — 0.7% | | | | | |
C.H. Robinson Worldwide, Inc.(a) | | 17,100 | | | 925,452 |
| | | | |
|
|
Banks — 0.7% | | | | | |
Northern Trust Corp.(a) | | 13,100 | | | 1,003,198 |
| | | | |
|
|
Beverages — 0.9% | | | | | |
Hansen Natural Corp.*(a) | | 27,700 | | | 1,226,833 |
| | | | |
|
|
Biotechnology — 1.2% | | | | | |
AMAG Pharmaceuticals, Inc.* | | 9,000 | | | 541,170 |
Applera Corp. — Celera Genomics Group* | | 22,500 | | | 357,075 |
Celgene Corp.* | | 15,000 | | | 693,150 |
| | | | |
|
|
| | | | | | 1,591,395 |
| | | | |
|
|
Broadcasting — 1.0% | | | | | |
Liberty Global, Inc.
(Class A Stock)*(a) | | 34,300 | | | 1,344,217 |
| | | | |
|
|
Business Services — 1.6% | | | | | |
Mastercard, Inc.
(Class A Stock) | | 8,300 | | | 1,786,160 |
Total System Services, Inc. | | 12,500 | | | 350,000 |
| | | | |
|
|
| | | | | | 2,136,160 |
| | | | |
|
|
Capital Markets — 1.0% | | | | | |
Lazard Ltd.
(Class A Stock) (Bermuda)(a) | | 31,800 | | | 1,293,624 |
| | | | |
|
|
Chemicals — 2.5% | | | | | |
Airgas, Inc. | | 30,000 | | | 1,563,300 |
Ecolab, Inc.(a) | | 34,900 | | | 1,787,229 |
| | | | |
|
|
| | | | | | 3,350,529 |
| | | | |
|
|
Clothing & Apparel — 0.8% | | | | | |
Coach, Inc.* | | 35,000 | | | 1,070,300 |
| | | | |
|
|
Commercial Services — 2.9% | | | | | |
Iron Mountain, Inc.*(a) | | 40,600 | | | 1,503,012 |
Pharmaceutical Product Development, Inc. | | 30,400 | | | 1,227,248 |
VistaPrint Ltd. (Bermuda)*(a) | | 27,700 | | | 1,186,945 |
| | | | |
|
|
| | | | | | 3,917,205 |
| | | | |
|
|
Commercial Services & Supplies — 1.0% | | | | | |
Corrections Corp. of America* | | 46,500 | | | 1,372,215 |
| | | | |
|
|
Computer Hardware — 2.2% | | | | | |
Cognizant Technology Solutions Corp,
(Class A Stock)* | | 66,500 | | | 2,257,010 |
Sigma Designs, Inc.*(a) | | 13,000 | | | 717,600 |
| | | | |
|
|
| | | | | | 2,974,610 |
| | | | |
|
|
| | | | | |
COMMON STOCKS
(continued) | | Shares
| | Value
(Note 2)
|
| | | | | | |
Computer Services & Software — 3.4% | | | | | |
Activision, Inc.* | | 79,100 | | $ | 2,349,270 |
Equinix, Inc.*(a) | | 7,000 | | | 707,490 |
IHS, Inc.
(Class A Stock)*(a) | | 20,400 | | | 1,235,424 |
Omniture, Inc.* | | 10,500 | | | 349,545 |
| | | | |
|
|
| | | | | | 4,641,729 |
| | | | |
|
|
Computer Software — 0.6% | | | | | |
Intuit, Inc.* | | 23,700 | | | 749,157 |
| | | | |
|
|
Construction — 0.5% | | | | | |
Shaw Group, Inc.* | | 12,000 | | | 725,280 |
| | | | |
|
|
Consumer Products & Services — 1.6% | | | | | |
Bare Escentuals, Inc.*(a) | | 33,200 | | | 805,100 |
Chattem, Inc.*(a) | | 18,500 | | | 1,397,490 |
| | | | |
|
|
| | | | | | 2,202,590 |
| | | | |
|
|
Distribution/Wholesale — 0.6% | | | | | |
Fastenal Co. | | 20,400 | | | 824,568 |
| | | | |
|
|
Diversified Financial Services — 2.3% | | | | | |
GFI Group, Inc.*(a) | | 15,500 | | | 1,483,660 |
Intercontinental Exchange, Inc.*(a) | | 8,600 | | | 1,655,500 |
| | | | |
|
|
| | | | | | 3,139,160 |
| | | | |
|
|
Education — 2.1% | | | | | |
DeVry, Inc.(a) | | 31,400 | | | 1,631,544 |
Strayer Education, Inc. | | 7,000 | | | 1,194,060 |
| | | | |
|
|
| | | | | | 2,825,604 |
| | | | |
|
|
Electronic Components — 2.6% | | | | | |
AMETEK, Inc. | | 7,500 | | | 351,300 |
Dolby Laboratories, Inc.
(Class A Stock)* | | 17,700 | | | 880,044 |
Energizer Holdings, Inc.*(a) | | 8,600 | | | 964,318 |
Trimble Navigation Ltd.* | | 43,800 | | | 1,324,512 |
| | | | |
|
|
| | | | | | 3,520,174 |
| | | | |
|
|
Engineering/R&D Services — 1.4% | | | | | |
Fluor Corp. | | 12,900 | | | 1,879,788 |
| | | | |
|
|
Entertainment & Leisure — 5.5% | | | | | |
Gaylord Entertainment Co.* | | 20,000 | | | 809,400 |
International Game Technology | | 11,200 | | | 492,016 |
Melco PBL Entertainment (Macau) Ltd., ADR (Hong Kong)*(a) | | 65,000 | | | 751,400 |
Penn National Gaming, Inc.* | | 27,800 | | | 1,655,490 |
Scientific Games Corp.
(Class A Stock)*(a) | | 45,000 | | | 1,496,250 |
Vail Resorts, Inc.*(a) | | 11,200 | | | 602,672 |
WMS Industries, Inc.*(a) | | 45,500 | | | 1,667,120 |
| | | | |
|
|
| | | | | | 7,474,348 |
| | | | |
|
|
Environmental Control — 1.0% | | | | | |
Stericycle, Inc.* | | 23,600 | | | 1,401,840 |
| | | | |
|
|
Financial Services — 0.7% | | | | | |
AllianceBernstein Holding LP | | 8,200 | | | 617,050 |
Huron Consulting Group, Inc.* | | 4,500 | | | 362,835 |
| | | | |
|
|
| | | | | | 979,885 |
| | | | |
|
|
Financials — 1.7% | | | | | |
CME Group, Inc. | | 3,400 | | | 2,332,400 |
| | | | |
|
|
SEE NOTES TO FINANCIAL STATEMENTS.
A31
| | | | |
| | | SP MID-CAP GROWTH PORTFOLIO (Continued) | | |
SCHEDULE OF INVESTMENTS | December 31, 2007 |
| | | | | |
COMMON STOCKS
(continued) | | Shares
| | Value
(Note 2)
|
| | | | | | |
Food — 0.3% | | | | | |
Ralcorp Holdings, Inc.* | | 6,300 | | $ | 382,977 |
| | | | |
|
|
Healthcare Equipment & Supplies — 1.1% | | | | | |
Intuitive Surgical, Inc.* | | 4,600 | | | 1,492,700 |
| | | | |
|
|
Healthcare Products — 6.3% | | | | | |
C.R. Bard, Inc.(a) | | 17,400 | | | 1,649,520 |
Gen-Probe, Inc.* | | 19,700 | | | 1,239,721 |
Hologic, Inc.*(a) | | 41,800 | | | 2,869,152 |
Idexx Laboratories, Inc.* | | 13,400 | | | 785,642 |
Inverness Medical Innovations, Inc.*(a) | | 19,500 | | | 1,095,510 |
Myriad Genetics, Inc.*(a) | | 16,900 | | | 784,498 |
| | | | |
|
|
| | | | | | 8,424,043 |
| | | | |
|
|
Healthcare Services — 0.5% | | | | | |
Psychiatric Solutions, Inc.*(a) | | 18,500 | | | 601,250 |
| | | | |
|
|
Hotel/Resort&Entertainment Property — 0.9% | | | |
Orient-Express Hotels Ltd.
(Class A Stock) (Bermuda)(a) | | 20,900 | | | 1,202,168 |
| | | | |
|
|
Internet — 0.5% | | | | | |
F5 Networks, Inc.* | | 25,500 | | | 727,260 |
| | | | |
|
|
Internet Services — 0.9% | | | | | |
IAC/InterActive Corp.*(a) | | 32,800 | | | 882,976 |
WebMD Health Corp.
(Class A Stock)*(a) | | 7,400 | | | 303,918 |
| | | | |
|
|
| | | | | | 1,186,894 |
| | | | |
|
|
Manufacturing — 1.1% | | | | | |
Danaher Corp. | | 16,400 | | | 1,438,936 |
| | | | |
|
|
Medical Supplies & Equipment — 0.8% | | | | | |
Wright Medical Group, Inc.*(a) | | 35,500 | | | 1,035,535 |
| | | | |
|
|
Metals & Mining — 2.2% | | | | | |
Precision Castparts Corp. | | 21,500 | | | 2,982,050 |
| | | | |
|
|
Oil & Gas — 3.4% | | | | | |
Continental Resources, Inc.* | | 21,400 | | | 559,182 |
National-Oilwell Varco, Inc.*(a) | | 31,100 | | | 2,284,606 |
Smith International, Inc. | | 22,900 | | | 1,691,165 |
| | | | |
|
|
| | | | | | 4,534,953 |
| | | | |
|
|
Oil, Gas & Consumable Fuels — 7.0% | | | | | |
Concho Resources, Inc.* | | 28,000 | | | 577,080 |
Denbury Resources, Inc.* | | 96,400 | | | 2,867,900 |
Dresser-Rand Group, Inc.* | | 18,200 | | | 710,710 |
GSI Commerce, Inc.*(a) | | 30,100 | | | 586,950 |
ION Geophysical Corp.*(a) | | 38,800 | | | 612,264 |
Murphy Oil Corp. | | 10,500 | | | 890,820 |
Range Resources Corp. | | 40,200 | | | 2,064,672 |
XTO Energy, Inc. | | 22,875 | | | 1,174,860 |
| | | | |
|
|
| | | | | | 9,485,256 |
| | | | |
|
|
Pharmaceuticals — 3.6% | | | | | |
Express Scripts, Inc.* | | 19,000 | | | 1,387,000 |
Shire PLC, ADR (United Kingdom) | | 13,300 | | | 917,035 |
United Therapeutics Corp.*(a) | | 13,100 | | | 1,279,215 |
VCA Antech, Inc.* | | 29,300 | | | 1,295,939 |
| | | | |
|
|
| | | | | | 4,879,189 |
| | | | |
|
|
| | | | | | |
COMMON STOCKS
(continued) | | Shares
| | Value
(Note 2)
| |
| | | | | | | |
Retail & Merchandising — 2.4% | | | | | | |
GameStop Corp.*(a) | | 27,900 | | $ | 1,732,869 | |
Shoppers Drug Mart Corp. | | 27,000 | | | 1,438,020 | |
| | | | |
|
|
|
| | | | | | 3,170,889 | |
| | | | |
|
|
|
Retail Apparel — 0.6% | | | | | | |
Abercrombie & Fitch Co.
(Class A Stock) | | 10,200 | | | 815,694 | |
| | | | |
|
|
|
Semiconductors — 3.6% | | | | | | |
MEMC Electronic Materials, Inc.* | | 20,400 | | | 1,805,196 | |
Microchip Technology, Inc.(a) | | 20,500 | | | 644,110 | |
Microsemi Corp.*(a) | | 29,500 | | | 653,130 | |
NVIDIA Corp.*(a) | | 30,000 | | | 1,020,600 | |
Varian Semiconductor Equipment Associates, Inc.* | | 19,400 | | | 717,800 | |
| | | | |
|
|
|
| | | | | | 4,840,836 | |
| | | | |
|
|
|
Software — 4.0% | | | | | | |
Ansys, Inc.*(a) | | 30,000 | | | 1,243,800 | |
Autodesk, Inc.*(a) | | 26,400 | | | 1,313,664 | |
Cerner Corp.* | | 27,600 | | | 1,556,640 | |
Citrix Systems, Inc.*(a) | | 35,000 | | | 1,330,350 | |
| | | | |
|
|
|
| | | | | | 5,444,454 | |
| | | | |
|
|
|
Specialty Retail — 0.6% | | | | | | |
Urban Outfitters, Inc.* | | 30,100 | | | 820,526 | |
| | | | |
|
|
|
Telecommunications — 7.6% | | | | | | |
American Tower Corp.
(Class A Stock)* | | 37,100 | | | 1,580,460 | |
Arris Group, Inc.*(a) | | 112,500 | | | 1,122,750 | |
Foundry Networks, Inc.*(a) | | 64,600 | | | 1,131,792 | |
Harris Corp. | | 15,300 | | | 959,004 | |
Juniper Networks, Inc.* | | 32,100 | | | 1,065,720 | |
NII Holdings, Inc.* | | 49,000 | | | 2,367,680 | |
Polycom, Inc.*(a) | | 24,800 | | | 688,944 | |
SBA Communications Corp.
(Class A Stock)*(a) | | 41,000 | | | 1,387,440 | |
| | | | |
|
|
|
| | | | | | 10,303,790 | |
| | | | |
|
|
|
Transportation — 0.7% | | | | | | |
Expeditors International Washington, Inc.(a) | | 20,500 | | | 915,940 | |
| | | | |
|
|
|
TOTAL LONG-TERM INVESTMENTS
(cost $118,975,425) | | | 127,321,187 | |
| | | | |
|
|
|
SHORT-TERM INVESTMENT — 41.5% | | | | |
Affiliated Money Market Mutual Fund | | | | |
Dryden Core Investment Fund —Taxable Money Market Series
(cost $55,902,994; includes $47,953,954 of cash collateral for securities on loan)(b)(w)(Note 4) | | 55,902,994 | | | 55,902,994 | |
| | | | |
|
|
|
TOTAL INVESTMENTS — 135.9%
(cost $174,878,419) | | | 183,224,181 | |
LIABILITIES IN EXCESS OF OTHER ASSETS — (35.9)% | | | (48,394,045 | ) |
| | | | |
|
|
|
NET ASSETS — 100.0% | | $ | 134,830,136 | |
| | | | |
|
|
|
SEE NOTES TO FINANCIAL STATEMENTS.
A32
| | | | |
| | | SP MID-CAP GROWTH PORTFOLIO (Continued) | | |
SCHEDULE OF INVESTMENTS | December 31, 2007 |
The industry classification of investments and liabilities in excess of other assets shown as a percentage of net assets as of December 31, 2007 were as follows:
| | | |
Affiliated Money Market Mutual Fund (35.6% represents investments purchased with collateral from securities on loan) | | 41.5 | % |
Telecommunications | | 7.6 | |
Oil, Gas & Consumable Fuels | | 7.0 | |
Healthcare-products | | 6.3 | |
Entertainment & Leisure | | 5.5 | |
Software | | 4.0 | |
Pharmaceuticals | | 3.6 | |
Semiconductors | | 3.6 | |
Aerospace | | 3.6 | |
Computer Services & Software | | 3.4 | |
Oil & Gas | | 3.4 | |
Commercial Services | | 2.9 | |
Electronic Components | | 2.6 | |
Chemicals | | 2.5 | |
Retail & Merchandising | | 2.4 | |
Diversified Financial Services | | 2.3 | |
Metals & Mining | | 2.2 | |
Computer Hardware | | 2.2 | |
Advertising | | 2.2 | |
Education | | 2.1 | |
Financials | | 1.7 | |
Consumer Products & Services | | 1.6 | |
Business Services | | 1.6 | |
Engineering/R&D Services | | 1.4 | |
Biotechnology | | 1.2 | |
Healthcare Equipment & Supplies | | 1.1 | |
Manufacturing | | 1.1 | |
Environmental Control | | 1.0 | |
Commercial Services & Supplies | | 1.0 | |
Broadcasting | | 1.0 | |
Capital Markets | | 1.0 | |
Beverages | | 0.9 | |
Hotel/Resort&Entertainment Property | | 0.9 | |
Internet Services | | 0.9 | |
Clothing & Apparel | | 0.8 | |
Medical Supplies & Equipment | | 0.8 | |
Banks | | 0.7 | |
Financial Services | | 0.7 | |
Air Freight & Logistics | | 0.7 | |
Transportation | | 0.7 | |
Distribution/Wholesale | | 0.6 | |
Specialty Retail | | 0.6 | |
Retail Apparel | | 0.6 | |
Computer Software | | 0.6 | |
Internet | | 0.5 | |
Construction | | 0.5 | |
Healthcare Services | | 0.5 | |
Food | | 0.3 | |
| | |
|
|
| | | 135.9 | |
Liabilities in excess of other assets | | (35.9 | ) |
| | |
|
|
| | | 100.0 | % |
| | |
|
|
The following abbreviation is used in portfolio descriptions:
| | |
| ADR | | American Depositary Receipt |
| * | Non-income producing security. |
| (a) | All or a portion of security is on loan. The aggregate market value of such securities is $46,241,854; cash collateral of $47,953,954 (included with liabilities) was received with which the portfolio purchased highly liquid short-term investments. |
| (b) | Represents security, or a portion thereof, purchased with cash collateral received for securities on loan. |
| (w) | Prudential Investments LLC, the manager of the Portfolio, also serves as manager of the Dryden Core Investment Fund-Taxable Money Market Series. |
SEE NOTES TO FINANCIAL STATEMENTS.
A33
| | | | |
| | | SP MID-CAP GROWTH PORTFOLIO (Continued) | | |
STATEMENT OF ASSETS AND LIABILITIES
December 31, 2007
| | | |
| ASSETS | | | |
Investments at value, including securities on loan of $46,241,854: | | | |
Unaffiliated investments (cost $118,975,425) | | $ | 127,321,187 |
Affiliated investments (cost $55,902,994) | | | 55,902,994 |
Receivable for investments sold | | | 489,666 |
Dividends and interest receivable | | | 101,343 |
Receivable for Series shares sold | | | 83,387 |
Prepaid expenses | | | 764 |
| | |
|
|
Total Assets | | | 183,899,341 |
| | |
|
|
| LIABILITIES | | | |
Collateral for securities on loan | | | 47,953,954 |
Payable for investments purchased | | | 755,561 |
Accrued expenses and other liabilities | | | 122,487 |
Management fee payable | | | 91,655 |
Payable to custodian | | | 81,249 |
Payable for Series shares repurchased | | | 62,192 |
Deferred trustees’ fees | | | 1,362 |
Transfer agent fees payable | | | 745 |
| | |
|
|
Total Liabilities | | | 49,069,205 |
| | |
|
|
| NET ASSETS | | $ | 134,830,136 |
| | |
|
|
Net assets were comprised of: | | | |
Paid-in capital | | $ | 102,202,991 |
Retained earnings | | | 32,627,145 |
| | |
|
|
Net assets, December 31, 2007 | | $ | 134,830,136 |
| | |
|
|
Net asset value and redemption price per share, $134,830,136 / 17,909,044 outstanding shares of beneficial interest | | $ | 7.53 |
| | |
|
|
STATEMENT OF OPERATIONS
Year Ended December 31, 2007
| | | | |
| INVESTMENT INCOME | | | | |
Unaffiliated dividend income
(net of $139 foreign withholding tax) | | $ | 443,763 | |
Affiliated income from securities lending, net | | | 177,975 | |
Affiliated dividend income | | | 143,433 | |
| | |
|
|
|
| | | | 765,171 | |
| | |
|
|
|
| EXPENSES | | | | |
Management fee | | | 1,082,497 | |
Custodian’s fees and expenses | | | 52,000 | |
Audit fee | | | 17,000 | |
Trustees’ fees | | | 9,000 | |
Insurance expenses | | | 5,000 | |
Legal fees and expenses | | | 4,000 | |
Transfer agent’s fees and expenses
(including affiliated expense of $3,000) (Note 4) | | | 3,000 | |
Miscellaneous | | | 939 | |
| | |
|
|
|
Total expenses | | | 1,173,436 | |
| | |
|
|
|
| NET INVESTMENT LOSS | | | (408,265 | ) |
| | |
|
|
|
| NET REALIZED AND UNREALIZED GAIN (LOSS) ON INVESTMENTS | | | | |
Net realized gain on investment transactions | | | 24,789,919 | |
Net change in unrealized appreciation (depreciation) on investments | | | (4,065,241 | ) |
| | |
|
|
|
| NET GAIN ON INVESTMENTS | | | 20,724,678 | |
| | |
|
|
|
| NET INCREASE IN NET ASSETS RESULTING FROM OPERATIONS | | $ | 20,316,413 | |
| | |
|
|
|
STATEMENT OF CHANGES IN NET ASSETS
| | | | | | | | |
| | | Year Ended December 31,
| |
| | | 2007
| | | 2006
| |
| INCREASE (DECREASE) IN NET ASSETS | |
| OPERATIONS: | | | | | | | | |
Net investment income (loss) | | $ | (408,265 | ) | | $ | 288,941 | |
Net realized gain on investment transactions | | | 24,789,919 | | | | 13,297,303 | |
Net change in unrealized appreciation (depreciation) on investments | | | (4,065,241 | ) | | | (16,566,128 | ) |
| | |
|
|
| |
|
|
|
NET INCREASE (DECREASE) IN NET ASSETS RESULTING FROM OPERATIONS | | | 20,316,413 | | | | (2,979,884 | ) |
| | |
|
|
| |
|
|
|
| DISTRIBUTIONS | | | (11,224,860 | ) | | | — | |
| | |
|
|
| |
|
|
|
| SERIES SHARE TRANSACTIONS: | | | | | | | | |
Series shares sold [1,258,734 and 2,145,372 shares, respectively] | | | 9,512,072 | | | | 15,533,006 | |
Series shares issued in reinvestment of distributions [1,502,659 and 0, respectively] | | | 11,224,860 | | | | — | |
Series shares repurchased [3,690,457 and 4,524,604 shares, respectively] | | | (28,108,838 | ) | | | (32,351,343 | ) |
| | |
|
|
| |
|
|
|
NET DECREASE IN NET ASSETS RESULTING FROM SERIES SHARE TRANSACTIONS | | | (7,371,906 | ) | | | (16,818,337 | ) |
| | |
|
|
| |
|
|
|
| TOTAL INCREASE (DECREASE) IN NET ASSETS | | | 1,719,647 | | | | (19,798,221 | ) |
| NET ASSETS: | | | | | | | | |
Beginning of year | | | 133,110,489 | | | | 152,908,710 | |
| | |
|
|
| |
|
|
|
End of year | | $ | 134,830,136 | | | $ | 133,110,489 | |
| | |
|
|
| |
|
|
|
SEE NOTES TO FINANCIAL STATEMENTS.
A34
| | | | |
| | | SP PIMCO HIGH YIELD PORTFOLIO | | |
SCHEDULE OF INVESTMENTS | December 31, 2007 |
| | | | | | | | | | | | | |
LONG-TERM INVESTMENTS — 99.9% BANK NOTES — 6.3% | | Moody’s
Ratings
(Unaudited)
| | Interest
Rate
| | | Maturity
Date
| | Principal
Amount
(000)#
| | Value
(Note 2)
|
| | | | | | | | | | | | | | |
Chrysler Finco Term, 144A (cost $1,895,250; purchased
07/31/07 - 11/28/07)(f)(g) | | Ba | | 9.00% | (c) | | 08/03/14 | | $ | 1,995 | | $ | 1,914,747 |
Community Health System (cost $46,404; purchased 06/28/07)(f)(g) | | Ba | | 4.00% | (c) | | 07/02/14 | | | 46 | | | 44,601 |
Community Health System (cost $691,995; purchased
06/28/07 - 12/18/07)(f)(g) | | Ba | | 7.33% | (c) | | 07/02/14 | | | 692 | | | 665,109 |
Ford Motor Corp. (cost $990,000; purchased 12/12/06)(f)(g) | | Ba- | | 8.00% | (c) | | 11/29/13 | | | 990 | | | 914,850 |
HCA, Inc. (cost $742,500; purchased 11/14/06)(f)(g) | | Ba- | | 7.08% | (c) | | 11/14/13 | | | 743 | | | 714,471 |
Healthsouth Corp. (cost $2,529; purchased 03/07/06)(f)(g) | | B(d) | | 7.35% | (c) | | 02/02/13 | | | 3 | | | 2,410 |
Healthsouth Corp. (cost $522,198; purchased 03/07/06)(f)(g) | | B(d) | | 7.75% | (c) | | 02/02/13 | | | 522 | | | 497,655 |
MGM Studios (cost $978,797; purchased 12/18/06)(f)(g) | | Ba- | | 8.11% | (c) | | 04/08/12 | | | 987 | | | 917,419 |
Nordic Telephone (Denmark) (cost $367,238; purchased 04/19/06)(f)(g) | | Ba+ | | 6.68% | (c) | | 11/30/13 | | EUR | 365 | | | 523,126 |
Nordic Telephone (Denmark) (cost $442,735; purchased 04/19/06)(f)(g) | | Ba+ | | 6.93% | (c) | | 11/30/14 | | EUR | 440 | | | 633,230 |
Roundy’s, Inc., Term B (cost $980,100; purchased
11/09/05 - 11/12/07)(f)(g) | | Ba- | | 7.91% | (c) | | 10/27/11 | | | 980 | | | 958,967 |
Telesat Canada Inc., Term Loan (cost $187,025; purchased 10/31/07)(f)(g) | | B-(d) | | 9.00% | (c) | | 10/31/08 | | | 188 | | | 176,687 |
Telesat Canada Inc., Term Loan (cost $199,000; purchased 10/31/07)(f)(g) | | Caa+ | | 10.50% | (c) | | 10/31/08 | | | 200 | | | 188,000 |
Telesat Canada, Inc., Term Loan (cost $11,975; purchased 10/31/07)(f)(g) | | B-(d) | | 9.00% | (c) | | 10/31/08 | | | 12 | | | 11,313 |
Thompson Learning, Term B (cost $987,525; purchased 06/27/07)(f)(g) | | B+(d) | | 7.60% | (c) | | 06/27/14 | | | 998 | | | 941,529 |
Tribune Co. (cost $326,667; purchased 05/17/07)(f)(g) | | Ba | | 7.74% | (c) | | 05/30/09 | | | 327 | | | 314,650 |
Tribune Co. (cost $592,523; purchased 05/17/07)(f)(g) | | Ba | | 7.91% | (c) | | 05/30/14 | | | 597 | | | 506,107 |
Univision Communication (cost $26,846; purchased 10/12/07)(f)(g) | | Ba- | | 7.10% | (c) | | 09/15/14 | | | 27 | | | 24,441 |
Univision Communication (cost $33,557; purchased 03/16/07)(f)(g) | | Ba- | | 6.25% | (c) | | 09/15/14 | | | 34 | | | 30,551 |
Univision Communication (cost $939,597; purchased 03/16/07)(f)(g) | | Ba- | | 7.61% | (c) | | 09/15/14 | | | 940 | | | 855,425 |
VNU/Nielsen Finance LLC (cost $1,227,556; purchased 08/08/06)(f)(g) | | B+(d) | | 7.15% | (c) | | 08/08/13 | | | 1,234 | | | 1,168,098 |
VNU/Nielsen Finance LLC (cost $738,267; purchased 12/18/07)(f)(g) | | B+(d) | | 7.24% | (c) | | 08/08/13 | | | 741 | | | 701,849 |
Wind Acquisitions Finance, Term B (cost $330,416; purchased
12/07/06 - 10/18/07)(f)(g) | | B-(d) | | 12.46% | (c) | | 12/21/11 | | | 330 | | | 346,110 |
| | | | | | | | | | | | |
|
|
TOTAL BANK NOTES
(cost $13,455,388) | | | 13,051,345 |
| | | | | | | | | | | | |
|
|
CONVERTIBLE BOND | | | | | | | | | | | | | |
Oil & Gas Exploration/Production | | | | | | | | | | | | | |
Chesapeake Energy Corp., Gtd. Notes
(cost $46,962) | | Ba3 | | 2.50% | | | 05/15/37 | | | 50 | | | 55,563 |
| | | | | | | | | | | | |
|
|
CORPORATE BONDS — 77.6% | | | | | | | | | | | | | |
Advertising — 1.8% | | | | | | | | | | | | | |
R.H. Donnelley Corp. (cost $1,235,188; purchased 09/19/07 - 09/27/07), Sr. Notes, 144A(f)(g) | | B3 | | 8.875% | | | 10/15/17 | | | 1,225 | | | 1,133,125 |
R.H. Donnelley Corp., Sr. Disc. Notes | | B3 | | 6.875% | | | 01/15/13 | | | 175 | | | 156,625 |
R.H. Donnelley Corp., Sr. Notes | | B3 | | 8.875% | | | 01/15/16 | | | 2,675 | | | 2,501,125 |
| | | | | | | | | | | | |
|
|
| | | | | | | | | | | | | | 3,790,875 |
| | | | | | | | | | | | |
|
|
Aerospace & Defense — 0.4% | | | | | | | | | | | | | |
L-3 Communications Corp., Gtd. Notes | | Ba3 | | 7.625% | | | 06/15/12 | | | 580 | | | 593,775 |
TransDigm, Inc., Gtd. Notes | | B3 | | 7.75% | | | 07/15/14 | | | 175 | | | 177,625 |
| | | | | | | | | | | | |
|
|
| | | | | | | | | | | | | | 771,400 |
| | | | | | | | | | | | |
|
|
Airlines — 0.2% | | | | | | | | | | | | | |
United AirLines, Inc., Series 01-1, Pass-Through Certificates | | Ba2 | | 6.201% | | | 09/01/08 | | | 230 | | | 229,157 |
United AirLines, Inc., Series 01-1, Pass-Through Certificates | | Ba2 | | 6.602% | | | 09/01/13 | | | 136 | | | 135,539 |
| | | | | | | | | | | | |
|
|
| | | | | | | | | | | | | | 364,696 |
| | | | | | | | | | | | |
|
|
Apparel — 0.2% | | | | | | | | | | | | | |
Quiksilver, Inc., Gtd. Notes | | Ba3 | | 6.875% | | | 04/15/15 | | | 475 | | | 407,313 |
| | | | | | | | | | | | |
|
|
Automotive — 3.2% | | | | | | | | | | | | | |
Allison Transmission, Gtd. Notes, PIK, 144A
(cost $200,000; purchased 10/12/07)(f)(g) | | Caa1 | | 11.25% | | | 11/01/15 | | | 200 | | | 176,500 |
Allison Transmission, Gtd. Notes, 144A
(cost $282,188; purchased 10/11/07, 12/14/07)(f)(g) | | Caa1 | | 11.00% | | | 11/01/15 | | | 300 | | | 273,000 |
SEE NOTES TO FINANCIAL STATEMENTS.
A35
| | | | |
| | | SP PIMCO HIGH YIELD PORTFOLIO (Continued) | | |
SCHEDULE OF INVESTMENTS | December 31, 2007 |
| | | | | | | | | | | | |
CORPORATE BONDS (continued) | | Moody’s
Ratings
(Unaudited)
| | Interest
Rate
| | Maturity
Date
| | Principal
Amount
(000)#
| | Value
(Note 2)
|
| | | | | | | | | | | | | |
Automotive (continued) | | | | | | | | | | | | |
ArvinMeritor, Inc., Sr. Unsec`d. Notes | | B2 | | 8.125% | | 09/15/15 | | $ | 250 | | $ | 216,250 |
ArvinMeritor, Inc., Unsec`d. Notes | | B2 | | 8.75% | | 03/01/12 | | | 1,390 | | | 1,296,175 |
Cooper-Standard Automotive, Inc., Gtd. Notes | | B3 | | 7.00% | | 12/15/12 | | | 570 | | | 493,763 |
Ford Motor Co., Debs. | | Caa1 | | 9.215% | | 09/15/21 | | | 100 | | | 83,500 |
General Motors Corp., Sr. Unsec`d. Notes | | Caa1 | | 7.70% | | 04/15/16 | | | 1,125 | | | 953,437 |
Goodyear Tire & Rubber Co. (The), Sr. Notes | | Ba3 | | 9.00% | �� | 07/01/15 | | | 552 | | | 585,120 |
Goodyear Tire & Rubber Co. (The), Gtd. Notes | | Ba3 | | 8.625% | | 12/01/11 | | | 390 | | | 406,575 |
Tenneco, Inc., Sr. Unsec`d. Notes, 144A
(cost $350,000; purchased 11/01/07)(f)(g) | | B2 | | 8.125% | | 11/15/15 | | | 350 | | | 346,500 |
Tenneco, Inc., Sec`d. Notes | | Ba3 | | 10.25% | | 07/15/13 | | | 351 | | | 373,815 |
TRW Automotive, Inc., Gtd. Notes, 144A
(cost $1,171,225; purchased 03/14/07 - 11/02/07)(f)(g) | | Ba3 | | 7.25% | | 03/15/17 | | | 1,200 | | | 1,077,000 |
TRW Automotive, Inc., Gtd. Notes, 144A
(cost $245,938; purchased 03/21/07)(f)(g) | | Ba3 | | 7.00% | | 03/15/14 | | | 250 | | | 230,000 |
| | | | | | | | | | | |
|
|
| | | | | | | | | | | | | 6,511,635 |
| | | | | | | | | | | |
|
|
Business Services — 0.4% | | | | | | | | | | | | |
NSG Holdings LLC/NSG Holdings, Inc., Sec`d. Notes, 144A
(cost $450,000; purchased 03/06/07)(f)(g) | | Ba2 | | 7.75% | | 12/15/25 | | | 450 | | | 451,125 |
Petroplus Finance Ltd., Gtd. Notes, 144A (Bermuda)
(cost $175,000; purchased 04/25/07)(f)(g) | | B1 | | 6.75% | | 05/01/14 | | | 175 | | | 162,969 |
Petroplus Finance Ltd., Gtd. Notes, 144A (Bermuda)
(cost $175,000; purchased 04/25/07)(f)(g) | | B1 | | 7.00% | | 05/01/17 | | | 175 | | | 160,125 |
| | | | | | | | | | | |
|
|
| | | | | | | | | | | | | 774,219 |
| | | | | | | | | | | |
|
|
Cable — 1.4% | | | | | | | | | | | | |
CCO Holdings LLC/CCO Holdings Capital Corp., Sr. Unsec`d. Notes | | Caa1 | | 8.75% | | 11/15/13 | | | 2,975 | | | 2,841,125 |
| | | | | | | | | | | |
|
|
Chemicals — 2.2% | | | | | | | | | | | | |
Chemtura Corp., Gtd. Notes | | Ba2 | | 6.875% | | 06/01/16 | | | 575 | | | 540,500 |
Ineos Group Holdings PLC., Gtd. Notes, 144A (United Kingdom)
(cost $1,397,763; purchased 06/08/06 - 10/11/06)(f)(g) | | B3 | | 8.50% | | 02/15/16 | | | 1,500 | | | 1,335,000 |
Nalco Co., Sr. Sub. Notes | | B3 | | 8.875% | | 11/15/13 | | | 610 | | | 635,925 |
Rockwood Specialties Group, Inc., Gtd. Notes | | B3 | | 7.50% | | 11/15/14 | | | 2,075 | | | 2,054,250 |
| | | | | | | | | | | |
|
|
| | | | | | | | | | | | | 4,565,675 |
| | | | | | | | | | | |
|
|
Commercial Services — 0.8% | | | | | | | | | | | | |
Aramark Corp., Gtd. Notes | | B3 | | 8.50% | | 02/01/15 | | | 1,625 | | | 1,645,312 |
| | | | | | | | | | | |
|
|
Computer Services & Software — 1.0% | | | | | | | | | | | | |
First Data Corp., Gtd. Notes, 144A
(cost $2,022,437; purchased 10/16/07 - 12/20/07)(f)(g) | | B3 | | 9.875% | | 09/24/15 | | | 2,150 | | | 1,999,500 |
| | | | | | | | | | | |
|
|
Construction — 0.1% | | | | | | | | | | | | |
Terex Corp., Sr. Sub. Notes | | Ba3 | | 8.00% | | 11/15/17 | | | 225 | | | 227,813 |
| | | | | | | | | | | |
|
|
Containers & Packaging — 1.5% | | | | | | | | | | | | |
Berry Plastics Holding Corp., Sec`d. Notes | | B3 | | 8.875% | | 09/15/14 | | | 825 | | | 783,750 |
Crown Americas LLC/Crown Americas Capital Corp., Gtd. Notes | | B1 | | 7.625% | | 11/15/13 | | | 200 | | | 204,500 |
Crown Americas LLC/Crown Americas Capital Corp., Gtd. Notes | | B1 | | 7.75% | | 11/15/15 | | | 700 | | | 721,000 |
Jefferson Smurfit Corp. US, Gtd. Notes | | B3 | | 7.50% | | 06/01/13 | | | 1,050 | | | 1,005,375 |
Jefferson Smurfit Corp. US, Gtd. Notes | | B3 | | 8.25% | | 10/01/12 | | | 250 | | | 246,250 |
Smurfit-Stone Container Enterprises, Inc., Sr. Notes | | B3 | | 8.375% | | 07/01/12 | | | 100 | | | 99,250 |
| | | | | | | | | | | |
|
|
| | | | | | | | | | | | | 3,060,125 |
| | | | | | | | | | | |
|
|
Distribution/Wholesale — 0.7% | | | | | | | | | | | | |
Buhrmann US, Inc., Gtd. Notes | | B2 | | 8.25% | | 07/01/14 | | | 1,500 | | | 1,432,500 |
| | | | | | | | | | | |
|
|
Diversified — 0.2% | | | | | | | | | | | | |
Actuant Corp., Sr. Notes, 144A (cost $448,232; purchased 06/06/07)(f)(g) | | Ba2 | | 6.875% | | 06/15/17 | | | 450 | | | 445,500 |
| | | | | | | | | | | |
|
|
SEE NOTES TO FINANCIAL STATEMENTS.
A36
| | | | |
| | | SP PIMCO HIGH YIELD PORTFOLIO (Continued) | | |
SCHEDULE OF INVESTMENTS | December 31, 2007 |
| | | | | | | | | | | | | |
CORPORATE BONDS (continued) | | Moody’s
Ratings
(Unaudited)
| | Interest
Rate
| | | Maturity
Date
| | Principal
Amount
(000)#
| | Value
(Note 2)
|
| | | | | | | | | | | | | | |
Diversified Financial Services — 9.0% | | | | | | | | | | | | | |
AES Red Oak LLC, Sec’d. Notes | | B1 | | 8.54% | | | 11/30/19 | | $ | 942 | | $ | 1,008,090 |
Chukchansi Economic Development Authority, Sr. Notes, 144A
(cost $1,000,000; purchased 10/31/05)(f)(g) | | B2 | | 8.00% | | | 11/15/13 | | | 1,000 | | | 975,000 |
Citigroup Capital XXI, Gtd. Notes | | A1 | | 8.30% | (c) | | 12/21/57 | | | 375 | | | 391,572 |
Ford Motor Credit Co. LLC, Notes | | B1 | | 7.80% | | | 06/01/12 | | | 4,600 | | | 4,032,645 |
Ford Motor Credit Co. LLC, Unsec`d. Notes | | B1 | | 7.375% | | | 02/01/11 | | | 995 | | | 891,028 |
General Motors Acceptance Corp. LLC, Notes | | Ba3 | | 6.75% | | | 12/01/14 | | | 1,000 | | | 806,549 |
General Motors Acceptance Corp. LLC, Notes | | Ba3 | | 7.25% | | | 03/02/11 | | | 1,080 | | | 946,662 |
Goldman Sachs Group, Inc. (The), Sr. Sub. Notes | | A1 | | 6.75% | | | 10/01/37 | | | 1,200 | | | 1,175,733 |
JET Equipment Trust, Equipment Trust, 144A
(cost $134,128; purchased 03/04/02)(f)(g)(i) | | NR | | 10.00% | | | 06/15/12 | | | 145 | | | 138,958 |
JET Equipment Trust, Asset Backed, 144A
(cost $11,899; purchased 10/18/01)(f)(g) | | NR | | 7.63% | | | 08/15/12 | | | 11 | | | 6,339 |
KRATON Polymers Capital Corp., Gtd. Notes | | B3 | | 8.125% | | | 01/15/14 | | | 1,275 | | | 1,198,500 |
Lehman Brothers Holdings, Inc., Sub. Notes | | A2 | | 6.75% | | | 12/28/17 | | | 525 | | | 541,117 |
LVB Acquisition Merger Sub, Inc., Gtd. Notes, 144A
(cost $1,286,181; purchased 09/21/07 - 10/19/07)(f)(g) | | B3 | | 10.00% | | | 10/15/17 | | | 1,300 | | | 1,326,000 |
LVB Acquisition Merger Sub, Inc., Gtd. Notes, 144A
(cost $1,805,113; purchased 09/21/07 - 12/21/07)(f)(g) | | Caa1 | | 11.625% | | | 10/15/17 | | | 1,825 | | | 1,797,625 |
LVB Acquisition Merger Sub, Inc., Gtd. Notes, PIK, 144A
(cost $610,500; purchased 10/10/07 - 11/16/07)(f)(g) | | B3 | | 10.375% | | | 10/15/17 | | | 600 | | | 598,500 |
Morgan Stanley, Sr. Unsec`d. Notes, 144A
(cost $550,860; purchased 09/27/07 - 10/09/07)(f)(g) | | NR | | 3.35% | | | 10/01/12 | | | 550 | | | 518,716 |
SLM Corp., Notes | | Baa1 | | 3.928% | (c) | | 07/25/08 | | | 300 | | | 293,836 |
SLM Corp., Unsec`d. Notes | | Baa1 | | 3.878% | (c) | | 07/26/10 | | | 150 | | | 138,071 |
Smurfit Kappa Funding PLC, Sr. Sub. Notes (Ireland) | | B2 | | 7.75% | | | 04/01/15 | | | 100 | | | 95,000 |
TNK-BP Finance SA, Gtd. Notes, 144A (Luxembourg)
(cost $297,603; purchased 03/13/07)(f)(g) | | Baa2 | | 6.625% | | | 03/20/17 | | | 300 | | | 273,750 |
TNK-BP Finance SA, Gtd. Notes, 144A (Luxembourg)
(cost $398,504; purchased 07/13/06)(f)(g) | | Baa2 | | 7.50% | | | 07/18/16 | | | 400 | | | 387,500 |
Universal City Florida Holding Co. I/II, Sr. Notes | | B3 | | 8.375% | | | 05/01/10 | | | 950 | | | 954,750 |
Universal City Florida Holding Co. I/II, Sr. Notes | | B3 | | 9.661% | (c) | | 05/01/10 | | | 50 | | | 50,000 |
| | | | | | | | | | | | |
|
|
| | | | | | | | | | | | | | 18,545,941 |
| | | | | | | | | | | | |
|
|
Diversified Manufacturing — 0.5% | | | | | | | | | | | | | |
Bombardier, Inc., Sr. Unsec`d. Notes, 144A (Canada)
(cost $900,159; purchased 11/10/06)(f)(g) | | Ba2 | | 7.25% | | | 11/15/16 | | EUR | 700 | | | 1,023,437 |
| | | | | | | | | | | | |
|
|
Diversified Operations — 0.1% | | | | | | | | | | | | | |
Trinity Industries, Inc., Sr. Unsub. Notes | | Baa3 | | 6.50% | | | 03/15/14 | | | 150 | | | 147,375 |
| | | | | | | | | | | | |
|
|
Electric — 0.9% | | | | | | | | | | | | | |
AES Corp. (The), Sr. Notes, 144A
(cost $854,750; purchased 10/09/07 - 12/06/07)(f)(g) | | B1 | | 8.00% | | | 10/15/17 | | | 850 | | | 869,125 |
Energy Future Holdings, Gtd. Notes, 144A
(cost $1,019,281; purchased 11/07/07 - 12/21/07)(f)(g) | | B3 | | 10.875% | | | 11/01/17 | | | 1,025 | | | 1,030,125 |
| | | | | | | | | | | | |
|
|
| | | | | | | | | | | | | | 1,899,250 |
| | | | | | | | | | | | |
|
|
Electronic Components — 0.9% | | | | | | | | | | | | | |
Celestica, Inc., Sr. Sub. Notes (Canada) | | B3 | | 7.625% | | | 07/01/13 | | | 450 | | | 419,625 |
Celestica, Inc., Sr. Sub. Notes (Canada) | | B3 | | 7.875% | | | 07/01/11 | | | 950 | | | 914,375 |
Legrand France SA, Unsub. Notes (France) | | Baa3 | | 8.50% | | | 02/15/25 | | | 500 | | | 581,674 |
| | | | | | | | | | | | |
|
|
| | | | | | | | | | | | | | 1,915,674 |
| | | | | | | | | | | | |
|
|
Entertainment — 0.5% | | | | | | | | | | | | | |
Royal Caribbean Cruises Ltd., Sr. Unsub. Notes (Liberia) | | Ba1 | | 7.25% | | | 03/15/18 | | | 1,000 | | | 960,012 |
| | | | | | | | | | | | |
|
|
Environmental Services — 1.2% | | | | | | | | | | | | | |
Allied Waste North America, Inc., Gtd. Notes | | B1 | | 7.125% | | | 05/15/16 | | | 625 | | | 620,312 |
Allied Waste North America, Inc., Gtd. Notes | | B1 | | 7.25% | | | 03/15/15 | | | 940 | | | 935,300 |
SEE NOTES TO FINANCIAL STATEMENTS.
A37
| | | | |
| | | SP PIMCO HIGH YIELD PORTFOLIO (Continued) | | |
SCHEDULE OF INVESTMENTS | December 31, 2007 |
| | | | | | | | | | | | | |
CORPORATE BONDS (continued) | | Moody’s
Ratings
(Unaudited)
| | Interest
Rate
| | | Maturity
Date
| | Principal
Amount
(000)#
| | Value
(Note 2)
|
| | | | | | | | | | | | | | |
Environmental Services (continued) | | | | | | | | | | | | | |
Cie Gen Geophysique, Gtd. Notes (France) | | Ba3 | | 7.50% | | | 05/15/15 | | | $325 | | $ | 329,063 |
Cie Gen Geophysique, Gtd. Notes (France) | | Ba3 | | 7.75% | | | 05/15/17 | | | 600 | | | 606,000 |
| | | | | | | | | | | | |
|
|
| | | | | | | | | | | | | | 2,490,675 |
| | | | | | | | | | | | |
|
|
Financial – Bank & Trust — 2.4% | | | | | | | | | | | | | |
American International Group, Inc., Sr. Unsec`d. Notes | | Aa2 | | 5.85% | | | 01/16/18 | | | 500 | | | 503,274 |
Barclays Bank PLC, Jr. Sub. Notes, 144A (United Kingdom)
(cost $1,191,045; purchased 12/13/07, 12/19/07)(f)(g) | | Aa3 | | 7.434% | (c) | | 09/29/49 | | | 1,150 | | | 1,195,024 |
Barclays Bank PLC, Sub. Notes, 144A (United Kingdom)
(cost $744,953; purchased 12/07/07)(f)(g) | | Aa2 | | 6.05% | | | 12/04/17 | | | 750 | | | 755,714 |
C8 Capital SPV Ltd., Notes, 144A (British Virgin Islands)
(cost $800,000; purchased 02/06/07)(f)(g) | | BBB-(d) | | 6.64% | (c) | | 12/31/49 | | | 800 | | | 758,112 |
HSBC Holdings PLC, Sub. Notes (United Kingdom) | | Aa3 | | 6.50% | | | 09/15/37 | | | 100 | | | 96,923 |
Royal Bank of Scotland Group PLC, Jr. Sub. Notes (United Kingdom) | | Aa3 | | 7.64% | (c) | | 03/31/49 | | | 1,000 | | | 1,028,093 |
Santander Perpetual SA Unipersonal, Bank Gtd. Notes, 144A (Spain)
(cost $597,531; purchased 10/18/07 - 12/13/07)(f)(g) | | Aa2 | | 6.671% | (c) | | 10/29/49 | | | 600 | | | 601,613 |
| | | | | | | | | | | | |
|
|
| | | | | | | | | | | | | | 4,938,753 |
| | | | | | | | | | | | |
|
|
Foods — 1.2% | | | | | | | | | | | | | |
Albertson’s, Inc., LLC, Debs. | | B1 | | 7.45% | | | 08/01/29 | | | 200 | | | 192,488 |
Albertson’s, Inc., LLC, Debs. | | B1 | | 7.75% | | | 06/15/26 | | | 630 | | | 623,145 |
Albertson’s, Inc., LLC, Sr. Unsec`d. Notes | | B1 | | 6.57% | | | 02/23/28 | | | 300 | | | 240,000 |
American Stores Co., Sr. Unsec`d. Notes | | B1 | | 8.00% | | | 06/01/26 | | | 400 | | | 401,025 |
Ingles Markets, Inc., Sr. Sub. Notes | | B3 | | 8.875% | | | 12/01/11 | | | 975 | | | 989,625 |
| | | | | | | | | | | | |
|
|
| | | | | | | | | | | | | | 2,446,283 |
| | | | | | | | | | | | |
|
|
Forest & Paper Products — 2.8% | | | | | | | | | | | | | |
Abitibi-Consolidated, Inc, Unsub. Notes (Canada) | | B3 | | 8.55% | | | 08/01/10 | | | 225 | | | 196,875 |
Cascades, Inc., Sr. Notes (Canada) | | Ba3 | | 7.25% | | | 02/15/13 | | | 900 | | | 843,750 |
Georgia-Pacific Corp., Gtd. Notes, 144A
(cost $491,250; purchased 12/28/07)(f)(g) | | Ba3 | | 7.00% | | | 01/15/15 | | | 500 | | | 486,250 |
Georgia-Pacific Corp., Gtd. Notes, 144A
(cost $950,000; purchased 07/19/07)(f)(g) | | Ba3 | | 7.125% | | | 01/15/17 | | | 1,000 | | | 972,500 |
Georgia-Pacific Corp., Sr. Unsec`d. Notes | | B2 | | 7.375% | | | 12/01/25 | | | 1,475 | | | 1,298,000 |
Smurfit Capital Funding PLC, Gtd. Notes (Ireland) | | Ba2 | | 7.50% | | | 11/20/25 | | | 700 | | | 661,500 |
Verso Paper Holdings LLC/Verson Paper, Inc., Sec`d. Notes | | B2 | | 9.125% | | | 08/01/14 | | | 1,275 | | | 1,287,750 |
| | | | | | | | | | | | |
|
|
| | | | | | | | | | | | | | 5,746,625 |
| | | | | | | | | | | | |
|
|
Gaming — 2.4% | | | | | | | | | | | | | |
MGM Mirage, Gtd. Notes | | Ba2 | | 6.625% | | | 07/15/15 | | | 1,125 | | | 1,054,687 |
MGM Mirage, Gtd. Notes | | Ba2 | | 6.875% | | | 04/01/16 | | | 525 | | | 494,813 |
MGM Mirage, Gtd. Notes | | Ba2 | | 7.50% | | | 06/01/16 | | | 400 | | | 396,000 |
Mirage Resorts, Inc., Debs. | | Ba2 | | 7.25% | | | 08/01/17 | | | 500 | | | 472,500 |
Station Casinos, Inc., Sr. Sub. Notes | | Caa1 | | 6.875% | | | 03/01/16 | | | 255 | | | 186,150 |
Station Casinos, Inc., Sr. Unsec`d. Notes | | B2 | | 7.75% | | | 08/15/16 | | | 960 | | | 866,400 |
Wynn Las Vegas LLC, First Mortgage | | Ba2 | | 6.625% | | | 12/01/14 | | | 1,445 | | | 1,419,712 |
| | | | | | | | | | | | |
|
|
| | | | | | | | | | | | | | 4,890,262 |
| | | | | | | | | | | | |
|
|
Healthcare Services — 1.1% | | | | | | | | | | | | | |
Community Health Systems, Inc., Gtd. Notes | | B3 | | 8.875% | | | 07/15/15 | | | 1,890 | | | 1,925,437 |
Service Corp. International, Sr. Unsec`d. Notes | | B1 | | 7.625% | | | 10/01/18 | | | 350 | | | 351,750 |
| | | | | | | | | | | | |
|
|
| | | | | | | | | | | | | | 2,277,187 |
| | | | | | | | | | | | |
|
|
Hospitals/Hospital Management — 4.7% | | | | | | | | | | | | | |
DaVita, Inc., Gtd. Notes | | B2 | | 7.25% | | | 03/15/15 | | | 1,595 | | | 1,598,987 |
Fresenius Medical Care Capital Trust IV, Gtd. Notes | | B1 | | 7.875% | | | 06/15/11 | | | 1,425 | | | 1,474,875 |
HCA, Inc., Sec`d. Notes | | B2 | | 9.25% | | | 11/15/16 | | | 5,645 | | | 5,927,250 |
HCA, Inc., Unsub. Notes | | Caa1 | | 7.19% | | | 11/15/15 | | | 200 | | | 171,469 |
Tenet Healthcare Corp., Sr. Unsec`d. Notes | | Caa1 | | 7.375% | | | 02/01/13 | | | 500 | | | 437,500 |
| | | | | | | | | | | | |
|
|
| | | | | | | | | | | | | | 9,610,081 |
| | | | | | | | | | | | |
|
|
SEE NOTES TO FINANCIAL STATEMENTS.
A38
| | | | |
| | | SP PIMCO HIGH YIELD PORTFOLIO (Continued) | | |
SCHEDULE OF INVESTMENTS | December 31, 2007 |
| | | | | | | | | | | | |
CORPORATE BONDS (continued) | | Moody’s
Ratings
(Unaudited)
| | Interest
Rate
| | Maturity
Date
| | Principal
Amount
(000)#
| | Value
(Note 2)
|
| | | | | | | | | | | | | |
Household Products/Wares — 0.1% | | | | | | | | | | | | |
Yankee Acquisition Corp., Gtd. Notes | | B3 | | 8.50% | | 02/15/15 | | $ | 125 | | $ | 115,156 |
| | | | | | | | | | | |
|
|
Machinery & Equipment — 0.5% | | | | | | | | | | | | |
Chart Industries, Inc., Sr. Sub. Notes | | B3 | | 9.125% | | 10/15/15 | | | 1,000 | | | 1,025,000 |
| | | | | | | | | | | |
|
|
Media — 4.1% | | | | | | | | | | | | |
CSC Holdings, Inc., Debs. | | B2 | | 7.625% | | 07/15/18 | | | 550 | | | 505,313 |
CSC Holdings, Inc., Sr. Unsec’d. Notes | | B2 | | 6.75% | | 04/15/12 | | | 100 | | | 95,625 |
CSC Holdings, Inc., Series B, Sr. Unsec’d. Notes | | B2 | | 7.625% | | 04/01/11 | | | 1,675 | | | 1,670,812 |
Echostar DBS Corp., Gtd. Notes | | Ba3 | | 7.125% | | 02/01/16 | | | 1,500 | | | 1,530,000 |
Idearc, Inc., Gtd. Notes | | B2 | | 8.00% | | 11/15/16 | | | 1,175 | | | 1,078,063 |
Lighthouse International Co. SA, Gtd. Notes, 144A (Luxembourg)
(cost $998,333; purchased 04/08/04 - 06/18/07)(f)(g) | | B2 | | 8.00% | | 04/30/14 | | EUR | 745 | | | 1,091,952 |
Quebecor Media, Inc., Sr. Unsec’d. Notes, 144A (Canada)
(cost $713,188; purchased 09/26/07 - 11/28/07)(f)(g) | | B2 | | 7.75% | | 03/15/16 | | | 750 | | | 720,000 |
Unity Media GmbH, Sec’d. Notes, 144A (Germany)
(cost $450,000; purchased 07/11/05)(f)(g) | | Caa2 | | 10.375% | | 02/15/15 | | | 450 | | | 459,000 |
UPC Holding BV, Sec’d. Notes (Netherlands) | | B3 | | 7.75% | | 01/15/14 | | EUR | 675 | | | 941,242 |
UPC Holding BV, Sr. Notes (Netherlands) | | B3 | | 8.625% | | 01/15/14 | | EUR | 300 | | | 433,133 |
| | | | | | | | | | | |
|
|
| | | | | | | | | | | | | 8,525,140 |
| | | | | | | | | | | |
|
|
Metals & Mining — 1.1% | | | | | | | | | | | | |
Freeport-McMoRan Copper & Gold, Inc., Sr. Unsec’d. Notes | | Ba3 | | 8.25% | | 04/01/15 | | | 325 | | | 344,500 |
Freeport-McMoRan Copper & Gold, Inc., Sr. Unsec’d. Notes | | Ba3 | | 8.375% | | 04/01/17 | | | 1,475 | | | 1,581,937 |
Novelis, Inc., Gtd. Notes (Canada) | | B3 | | 7.25% | | 02/15/15 | | | 425 | | | 399,500 |
| | | | | | | | | | | |
|
|
| | | | | | | | | | | | | 2,325,937 |
| | | | | | | | | | | |
|
|
Oil & Gas Exploration/Production — 5.3% | | | | | | | | | | | | |
Chesapeake Energy Corp., Gtd. Notes | | NR | | 2.50% | | 05/15/37 | | | 150 | | | 166,687 |
Chesapeake Energy Corp., Gtd. Notes | | Ba3 | | 7.00% | | 08/15/14 | | | 700 | | | 703,500 |
Chesapeake Energy Corp., Gtd. Notes | | Ba3 | | 7.50% | | 06/15/14 | | | 400 | | | 407,000 |
Citic Resources Finance Ltd., Gtd. Notes, 144A
(cost $24,932; purchased 05/14/07)(f)(g) | | Ba2 | | 6.75% | | 05/15/14 | | | 25 | | | 23,438 |
El Paso Corp., Sr. Sub. Notes | | Ba3 | | 7.00% | | 06/15/17 | | | 2,075 | | | 2,077,152 |
OPTI Canada, Inc., Gtd. Notes, 144A
(cost $604,813; purchased 12/08/06, 12/20/07)(f)(g) | | B1 | | 8.25% | | 12/15/14 | | | 605 | | | 598,950 |
Roseton/Danskammer, Pass-Through Certificates | | Ba3 | | 7.27% | | 11/08/10 | | | 1,639 | | | 1,653,565 |
Roseton/Danskammer, Pass-Through Certificates | | Ba3 | | 7.67% | | 11/08/16 | | | 375 | | | 373,125 |
SemGroup LP, Sr. Notes, 144A
(cost $1,541,192; purchased 11/04/05 - 01/25/07)(f)(g) | | B1 | | 8.75% | | 11/15/15 | | | 1,550 | | | 1,472,500 |
Williams Cos., Inc., Debs. | | Baa3 | | 7.50% | | 01/15/31 | | | 850 | | | 913,750 |
Williams Cos., Inc., Sr. Unsec’d. Notes | | Baa3 | | 7.875% | | 09/01/21 | | | 2,250 | | | 2,494,687 |
| | | | | | | | | | | |
|
|
| | | | | | | | | | | | | 10,884,354 |
| | | | | | | | | | | |
|
|
Oil & Gas Services — 0.1% | | | | | | | | | | | | |
Complete Production Services, Inc., Gtd. Notes | | B2 | | 8.00% | | 12/15/16 | | | 195 | | | 188,663 |
| | | | | | | | | | | |
|
|
Oil, Gas & Consumable Fuels — 0.4% | | | | | | | | | | | | |
Dresser-Rand Group, Inc., Gtd. Notes | | B1 | | 7.375% | | 11/01/14 | | | 321 | | | 320,198 |
Plains Exploration & Production Co., Gtd. Notes | | B1 | | 7.75% | | 06/15/15 | | | 125 | | | 125,000 |
Tesoro Corp., Gtd. Notes | | Ba1 | | 6.50% | | 06/01/17 | | | 400 | | | 396,000 |
| | | | | | | | | | | |
|
|
| | | | | | | | | | | | | 841,198 |
| | | | | | | | | | | |
|
|
Pipelines & Other — 1.1% | | | | | | | | | | | | |
Dynegy Holdings, Inc., Sr. Unsec’d. Notes | | B2 | | 7.50% | | 06/01/15 | | | 1,000 | | | 935,000 |
Kinder Morgan Finance Co. ULC, Gtd. Notes (Canada) | | Ba2 | | 5.70% | | 01/05/16 | | | 725 | | | 656,271 |
Knight, Inc., Sr. Unsec’d. Notes | | Ba2 | | 5.15% | | 03/01/15 | | | 100 | | | 87,993 |
NGPL PipeCo. LLC, Sr. Notes, 144A
(cost $625,000; purchased 12/14/07)(f)(g) | | Baa3 | | 7.119% | | 12/15/17 | | | 625 | | | 640,843 |
| | | | | | | | | | | |
|
|
| | | | | | | | | | | | | 2,320,107 |
| | | | | | | | | | | |
|
|
SEE NOTES TO FINANCIAL STATEMENTS.
A39
| | | | |
| | | SP PIMCO HIGH YIELD PORTFOLIO (Continued) | | |
SCHEDULE OF INVESTMENTS | December 31, 2007 |
| | | | | | | | | | | | |
CORPORATE BONDS (continued) | | Moody’s
Ratings
(Unaudited)
| | Interest
Rate
| | Maturity
Date
| | Principal
Amount
(000)#
| | Value
(Note 2)
|
| | | | | | | | | | | | | |
Real Estate Investment Trusts — 0.4% | | | | | | | | | | | | |
Ventas Realty LP/Ventas Capital Corp., Gtd. Notes | | Ba1 | | 6.75% | | 04/01/17 | | $ | 625 | | $ | 618,750 |
Ventas, Inc., Gtd. Notes, 144A
(cost $133,660; purchased 10/10/07, 10/19/07)(f)(g) | | Ba1 | | 3.875% | | 11/15/11 | | | 125 | | | 136,094 |
| | | | | | | | | | | |
|
|
| | | | | | | | | | | | | 754,844 |
| | | | | | | | | | | |
|
|
Real Estate Management & Development — 0.5% | | | | | | | | | | | | |
Forest City Enterprises, Inc., Sr. Unsec’d. Notes | | Ba3 | | 7.625% | | 06/01/15 | | | 1,000 | | | 965,000 |
| | | | | | | | | | | |
|
|
Retail — 2.9% | | | | | | | | | | | | |
Amerigas Partners LP, Sr. Unsec’d. Notes | | B1 | | 7.25% | | 05/20/15 | | | 1,800 | | | 1,764,000 |
Bon-Ton Stores, Inc. (The), Gtd. Notes | | B3 | | 10.25% | | 03/15/14 | | | 1,425 | | | 1,075,875 |
Ferrellgas Escrow LLC/Ferrellgas Finance Escrow Corp.,
Sr. Unsec’d. Notes | | Ba3 | | 6.75% | | 05/01/14 | | | 805 | | | 789,906 |
Ferrellgas Partners LP/Ferrellgas Partners Finance, Sr. Notes | | B2 | | 8.75% | | 06/15/12 | | | 1,210 | | | 1,243,275 |
Suburban Propane Partners LP, Sr. Notes | | B1 | | 6.875% | | 12/15/13 | | | 1,200 | | | 1,164,000 |
| | | | | | | | | | | |
|
|
| | | | | | | | | | | | | 6,037,056 |
| | | | | | | | | | | |
|
|
Semiconductors — 2.0% | | | | | | | | | | | | |
Advanced Micro Devices, Inc., Sr. Unsec’d. Notes | | B(d) | | 6.00% | | 05/01/15 | | | 350 | | | 248,938 |
Freescale Semiconductor, Inc., Gtd. Notes | | B2 | | 8.875% | | 12/15/14 | | | 1,475 | | | 1,316,437 |
Freescale Semiconductor, Inc., Gtd. Notes, PIK | | B2 | | 9.125% | | 12/15/14 | | | 1,275 | | | 1,083,750 |
Sensata Technologies BV, Gtd. Notes (Netherlands) | | B3 | | 8.00% | | 05/01/14 | | | 1,525 | | | 1,433,500 |
| | | | | | | | | | | |
|
|
| | | | | | | | | | | | | 4,082,625 |
| | | | | | | | | | | |
|
|
Services Cyclical – Rental Equipment — 0.6% | | | | | | | | | | | | |
Hertz Corp., Gtd. Notes | | B1 | | 8.875% | | 01/01/14 | | | 1,325 | | | 1,343,219 |
| | | | | | | | | | | |
|
|
Technology — 0.9% | | | | | | | | | | | | |
Sanmina-SCI Corp., Sr. Sub. Notes | | B3 | | 8.125% | | 03/01/16 | | | 900 | | | 797,625 |
Sungard Data Systems, Inc., Gtd. Notes | | Caa1 | | 9.125% | | 08/15/13 | | | 1,150 | | | 1,170,125 |
| | | | | | | | | | | |
|
|
| | | | | | | | | | | | | 1,967,750 |
| | | | | | | | | | | |
|
|
Telecommunications — 9.0% | | | | | | | | | | | | |
Cincinnati Bell, Inc., Gtd. Notes | | B2 | | 8.375% | | 01/15/14 | | | 1,250 | | | 1,218,750 |
Citizens Communications Co., Sr. Unsec’d. Notes | | Ba2 | | 7.125% | | 03/15/19 | | | 1,750 | | | 1,662,500 |
Citizens Communications Co., Sr. Unsec’d. Notes | | Ba2 | | 7.875% | | 01/15/27 | | | 725 | | | 690,563 |
Hawaiian Telecom Communications, Inc., Gtd. Notes | | Caa1 | | 9.75% | | 05/01/13 | | | 1,100 | | | 1,091,750 |
Intelsat Bermuda Ltd., Gtd. Notes (Bermuda) | | B2 | | 9.25% | | 06/15/16 | | | 825 | | | 829,125 |
Intelsat Corp., Gtd. Notes | | B2 | | 9.00% | | 06/15/16 | | | 1,100 | | | 1,108,250 |
Intelsat Subsidiary Holding Co. Ltd., Gtd. Notes (Bermuda) | | B2 | | 8.25% | | 01/15/13 | | | 400 | | | 402,000 |
Nordic Telephone Co. Holdings, Sec’d. Notes, 144A (Denmark)
(cost $1,327,500; purchased 04/26/06, 11/01/06)(f)(g) | | B2 | | 8.875% | | 05/01/16 | | | 1,300 | | | 1,332,500 |
Nortel Networks Ltd., Gtd. Notes, 144A (Canada)
(cost $408,675; purchased 05/23/07 - 06/29/07)(f)(g) | | B3 | | 2.125% | | 04/15/14 | | | 400 | | | 310,000 |
Nortel Networks Ltd., Gtd. Notes, 144A (Canada)
(cost $2,768,438; purchased 06/29/06 - 06/29/07)(f)(g) | | B3 | | 10.125% | | 07/15/13 | | | 2,550 | | | 2,626,500 |
Northwestern Bell Telephone, Debs. | | Ba1 | | 7.75% | | 05/01/30 | | | 750 | | | 697,500 |
Panamsat Corp., Gtd. Notes | | B2 | | 9.00% | | 08/15/14 | | | 350 | | | 351,750 |
Qwest Communications International, Inc., Gtd. Notes | | Ba3 | | 7.50% | | 02/15/14 | | | 1,430 | | | 1,426,425 |
Qwest Communications International, Inc., Sr. Unsec’d. Notes | | B1 | | 3.50% | | 11/15/25 | | | 350 | | | 466,813 |
Qwest Corp., Notes | | Ba1 | | 8.875% | | 03/15/12 | | | 1,050 | | | 1,123,500 |
Qwest Corp., Sr. Notes | | Ba1 | | 7.625% | | 06/15/15 | | | 875 | | | 890,312 |
Rural Cellular Corp., Sr. Unsec’d. Notes | | B3 | | 9.875% | | 02/01/10 | | | 600 | | | 622,500 |
Time Warner Telecom Holdings, Inc., Gtd. Notes | | B3 | | 9.25% | | 02/15/14 | | | 715 | | | 731,087 |
West Corp., Gtd. Notes | | Caa1 | | 9.50% | | 10/15/14 | | | 425 | | | 416,500 |
Wind Acquisition Finance SA, Sec’d. Notes, 144A (Luxembourg)
(cost $600,000; 11/22/05)(f)(g) | | B2 | | 10.75% | | 12/01/15 | | | 600 | | | 654,000 |
| | | | | | | | | | | |
|
|
| | | | | | | | | | | | | 18,652,325 |
| | | | | | | | | | | |
|
|
Tobacco — 0.3% | | | | | | | | | | | | |
Reynolds American, Inc., Gtd. Notes | | Ba1 | | 7.75% | | 06/01/18 | | | 615 | | | 656,414 |
| | | | | | | | | | | |
|
|
SEE NOTES TO FINANCIAL STATEMENTS.
A40
| | | | |
| | | SP PIMCO HIGH YIELD PORTFOLIO (Continued) | | |
SCHEDULE OF INVESTMENTS | December 31, 2007 |
| | | | | | | | | | | |
CORPORATE BONDS (continued) | | Moody’s
Ratings
(Unaudited)
| | Interest
Rate
| | Maturity
Date
| | Principal
Amount
(000)#
| | Value
(Note 2)
|
| | | | | | | | | | | | |
Utilities — 6.5% | | | | | | | | | | | |
CMS Energy Corp., Sr. Unsub. Notes | | Ba1 | | 2.875% | | 12/01/24 | | $ 325 | | $ | 440,781 |
Edison Mission Energy, Sr. Unsec’d. Notes | | B1 | | 7.20% | | 05/15/19 | | 1,950 | | | 1,915,875 |
Homer City Funding LLC, Sec’d. Notes | | Ba2 | | 8.734% | | 10/01/26 | | 1,455 | | | 1,585,950 |
Nevada Power Co., General Refinance Mortgage | | Baa3 | | 6.75% | | 07/01/37 | | 100 | | | 103,369 |
NRG Energy, Inc., Gtd. Notes | | B1 | | 7.25% | | 02/01/14 | | 495 | | | 482,625 |
NRG Energy, Inc., Gtd. Notes | | B1 | | 7.375% | | 02/01/16 | | 2,800 | | | 2,730,000 |
NRG Energy, Inc., Gtd. Notes | | B1 | | 7.375% | | 01/15/17 | | 175 | | | 170,625 |
PSE&G Energy Holdings LLC, Sr. Notes | | Ba3 | | 8.50% | | 06/15/11 | | 1,000 | | | 1,042,113 |
Reliant Energy Mid-Atlantic Power Holdings LLC, Series B,
Pass-Through Certificates | | Ba2 | | 9.237% | | 07/02/17 | | 344 | | | 359,490 |
Reliant Energy, Inc., Gtd. Notes | | B2 | | 6.75% | | 12/15/14 | | 2,075 | | | 2,080,188 |
Reliant Energy, Inc., Sr. Notes | | B3 | | 7.625% | | 06/15/14 | | 125 | | | 123,750 |
Reliant Energy, Inc., Sr. Notes | | B3 | | 7.875% | | 06/15/17 | | 175 | | | 173,250 |
Sierra Pacific Power Co., General Refinance Mortgage | | Baa3 | | 6.75% | | 07/01/37 | | 200 | | | 206,739 |
Sierra Pacific Resources, Sr. Unsec’d. Notes | | Ba3 | | 6.75% | | 08/15/17 | | 200 | | | 202,318 |
South Point Energy Center LLC/Broad River Energy LLC/Rockgen Energy LLC, Gtd. Notes, 144A
(cost $872,767; purchased 04/29/03 - 06/03/05)(f)(g)(i) | | D(d) | | 8.40% | | 05/30/12 | | 968 | | | 957,832 |
Tenaska Alabama Partners LP, Sec’d. Notes, 144A
(cost $777,580; purchased 06/13/05 - 08/01/05)(f)(g) | | Ba2 | | 7.00% | | 06/30/21 | | 763 | | | 761,082 |
| | | | | | | | | | |
|
|
| | | | | | | | | | | | 13,335,987 |
| | | | | | | | | | |
|
|
TOTAL CORPORATE BONDS
(cost $162,472,133) | | | 159,750,018 |
| | | | | | | | | | |
|
|
MUNICIPAL BONDS — 1.7% | | | | | | | | | | | |
Texas — 1.7% | | | | | | | | | | | |
Comal Texas Independent School District, General Obligation Unlimited Bond | | Aaa | | 5.00% | | 02/01/36 | | 3,000 | | | 3,094,440 |
Transition Communication Mobility, State of Texas, General Obligation Unlimited Bond | | Aa1 | | 5.00% | | 04/01/37 | | 400 | | | 417,432 |
| | | | | | | | | | |
|
|
TOTAL MUNICIPAL BONDS
(cost $3,377,581) | | | 3,511,872 |
| | | | | | | | | | |
|
|
U.S. GOVERNMENT MORTGAGE-BACKED OBLIGATIONS — 13.2% | | | | | | | | | | | |
Federal National Mortgage Assoc. | | | | 5.00% | | TBA | | 6,500 | | | 6,337,500 |
Federal National Mortgage Assoc. | | | | 5.50% | | TBA | | 14,500 | | | 14,481,875 |
Federal National Mortgage Assoc. | | | | 6.00% | | TBA | | 6,200 | | | 6,294,934 |
| �� | | | | | | | | | |
|
|
TOTAL U.S. GOVERNMENT MORTGAGE-BACKED OBLIGATIONS
(cost $27,156,445) | | | 27,114,309 |
| | | | | | | | | | |
|
|
| | | | | | | | | Shares
| | |
PREFERRED STOCKS — 1.1% | | | | | | | | | | | |
Business Services — 0.1% | | | | | | | | | | | |
Federal National Mortgage Assoc., 5.38%, CVT | | | | | | | | 1 | | | 84,799 |
Washington Mutual Capital Trust 2001, 5.38%, CVT | | | | | | | | 4,600 | | | 129,950 |
| | | | | | | | | | |
|
|
| | | | | | | | | | | | 214,749 |
| | | | | | | | | | |
|
|
Financial – Bank & Trust — 0.1% | | | | | | | | | | | |
UBS Preferred Funding Trust V, 6.24%, CVT | | | | | | | | 250,000 | | | 240,715 |
| | | | | | | | | | |
|
|
Hospitals/Hospital Management — 0.2% | | | | | | | | | | | |
Fresenius Medical Care Capital Trust II, 7.88% | | | | | | | | 500,000 | | | 500,000 |
| | | | | | | | | | |
|
|
Metals & Mining — 0.4% | | | | | | | | | | | |
Freeport-McMoRan Cooper & Gold, Inc., 6.75%, CVT | | | | | | | | 1,500 | | | 226,380 |
Vale Capital Ltd., 5.50%, CVT | | | | | | | | 8,000 | | | 517,760 |
| | | | | | | | | | |
|
|
| | | | | | | | | | | | 744,140 |
| | | | | | | | | | |
|
|
SEE NOTES TO FINANCIAL STATEMENTS.
A41
| | | | |
| | | SP PIMCO HIGH YIELD PORTFOLIO (Continued) | | |
SCHEDULE OF INVESTMENTS | December 31, 2007 |
| | | | | | | | | | | | |
| PREFERRED STOCKS (continued) | | | | | | | | Shares
| | Value
(Note 2)
|
Oil & Gas Exploration/Production — 0.3% | | | | | | | | | | | | |
Chesapeake Energy Corp., 4.50%, CVT | | | | | | | | | 4,000 | | $ | 440,000 |
Chesapeake Energy Corp., 5.00%, CVT | | | | | | | | | 1,500 | | | 178,500 |
| | | | | | | | | | | |
|
|
| | | | | | | | | | | | | 618,500 |
| | | | | | | | | | | |
|
|
TOTAL PREFERRED STOCKS
(cost $2,089,982) | | | 2,318,104 |
| | | | | | | | | | | |
|
|
TOTAL LONG-TERM INVESTMENTS
(cost $208,598,491) | | | 205,801,211 |
| | | | | | | | | | | |
|
|
| | | | | | | | | | | | | |
| SHORT-TERM INVESTMENTS — 14.3% | | Moody’s
Ratings
(Unaudited)
| | Interest
Rate
| | Maturity
Date
| | Principal
Amount
(000)#
| | |
COMMERCIAL PAPER — 12.2% | | | | | | | | | | | | |
Abbey National North America LLC | | A1+ | | 4.22% | | 01/07/08 | | $ | 2,300 | | | 2,298,371 |
Bank of Scotland PLC | | A1+ | | 4.93% | | 03/20/08 | | | 5,600 | | | 5,541,300 |
Rabobank USA Finance Corp. | | A1+ | | 3.99% | | 01/02/08 | | | 5,600 | | | 5,599,381 |
Skandinaviska Enskilda Banken (cost $5,640,335;
purchased 12/20/07)(f)(h) | | A1+ | | 4.76% | | 03/20/08 | | | 5,700 | | | 5,640,251 |
UBS Finance (De) LLC | | A1+ | | 4.69% | | 01/28/08 | | | 6,000 | | | 5,977,207 |
| | | | | | | | | | | |
|
|
TOTAL COMMERCIAL PAPER
(cost $25,056,275) | | | 25,056,510 |
| | | | | | | | | | | |
|
|
| | | | | | | | |
Contracts/
Notional
Amount
(000)
| | |
OUTSTANDING OPTIONS PURCHASED* — 1.9% | | | | | | | | | | | | |
Call Options | | | | | | | | | | | | |
Interest Rate Swap Option, expiring 07/06/2009 @ 4.25% | | | | | | | | | 85,100 | | | 1,064,915 |
Swap on 3 Month LIBOR,
expiring 09/22/2008 @ 4.75% | | | | | | | | | 80,000 | | | 1,699,180 |
expiring 12/31/2008 @ 4.72% | | | | | | | | | 7,000 | | | 140,195 |
expiring 09/08/2009 @ 4.75% | | | | | | | | | 60,000 | | | 1,049,555 |
| | | | | | | | | | | |
|
|
TOTAL OUTSTANDING OPTIONS PURCHASED
(cost $2,011,395) | | | 3,953,845 |
| | | | | | | | | | | |
|
|
| | | | | | | | | Shares
| | |
AFFILIATED MONEY MARKET MUTUAL FUND — 0.2% | | | | | | | | | | | | |
Dryden Core Investment Fund – Taxable Money Market Series (cost $358,660)(w)(Note 4) | | | 358,660 | | | 358,660 |
| | | | | | | | | | | |
|
|
| | | | | | | | |
Principal
Amount
(000)#
| | |
U.S. TREASURY OBLIGATIONS(k)(n) | | | | | | | | | | | | |
U.S. Treasury Bills | | | | 2.955% | | 03/13/08 | | $ | 55 | | | 54,667 |
U.S. Treasury Bills | | | | 2.98% | | 03/13/08 | | | 25 | | | 24,848 |
| | | | | | | | | | | |
|
|
TOTAL U.S. TREASURY OBLIGATIONS
(cost $79,526) | | | 79,515 |
| | | | | | | | | | | |
|
|
TOTAL SHORT-TERM INVESTMENTS
(cost $27,505,856) | | | 29,448,530 |
| | | | | | | | | | | |
|
|
TOTAL INVESTMENTS, BEFORE OUTSTANDING OPTIONS WRITTEN — 114.2%
(cost $236,104,347; Note 6) | | | 235,249,741 |
| | | | | | | | | | | |
|
|
SEE NOTES TO FINANCIAL STATEMENTS.
A42
| | | | |
| | | SP PIMCO HIGH YIELD PORTFOLIO (Continued) | | |
SCHEDULE OF INVESTMENTS | December 31, 2007 |
| | | | | | | | | | | | |
| | | | | | | | | Contracts/
Notional
Amount
(000)
| | Value
(Note 2)
| |
OUTSTANDING OPTIONS WRITTEN* — (1.6)% | | | | | | | | | | | | |
Call Options | | | | | | | | | | | | |
Interest Rate Swap Option, expiring 07/06/2009 @ 4.90% | | | | | | | | 28,400 | | $ | (996,980 | ) |
Swap on 3 Month LIBOR,
expiring 09/22/2008 @ 5.23% | | | | | | | | 27,000 | | | (1,366,013 | ) |
expiring 12/31/2008 @ 5.22% | | | | | | | | 2,300 | | | (111,098 | ) |
expiring 09/08/2009 @ 5.15% | | | | | | | | 20,000 | | | (856,808 | ) |
| | | | | | | | | | |
|
|
|
TOTAL OUTSTANDING OPTIONS WRITTEN
(premium received $1,944,180) | | | (3,330,899 | ) |
| | | | | | | | | | |
|
|
|
TOTAL INVESTMENTS, NET OF OUTSTANDING OPTIONS WRITTEN — 112.6%
(cost $234,160,167; Note 6) | | | 231,918,842 | |
OTHER LIABILITIES IN EXCESS OF OTHER ASSETS(x) — (12.6%) | | | (25,925,796 | ) |
| | | | | | | | | | |
|
|
|
NET ASSETS — 100.0% | | $ | 205,993,046 | |
| | | | | | | | | | |
|
|
|
The following abbreviations are used in portfolio descriptions:
| | |
| 144A | | Security was purchased pursuant to Rule 144A under the securities Act of 1933 and may not be resold subject to that rule except to qualified institutional buyers. Unless otherwise noted, 144A securities are deemed to be liquid. |
| CVT | | Convertible Security |
| NR | | Not Rated by Moody’s or Standard & Poor’s |
| PIK | | Payment-in-kind |
| TBA | | To Be Announced |
| BRL | | Brazilian Real |
| EUR | | Euro |
| GBP | | British Pound |
| INR | | Indian Rupee |
| KRW | | South Korean Won |
| MXN | | Mexican Peso |
| RUB | | Russian Ruble |
| # | Principal amount is shown in U.S. dollars unless otherwise stated. |
| (c) | Indicates a variable rate security. |
| (d) | Standard & Poor’s rating. |
| (f) | Private Placement restricted as to resale and does not have a readily available market. The aggregate cost of such securities is $52,543,841. The aggregate value of $51,980,919 is approximately 25.2% of net assets. |
| (g) | Indicates a security that has been deemed illiquid. |
| (h) | Security is restricted as to resale and generally is sold only to institutional investors who agree that they are purchasing the paper for investment and not with a view to public distribution (does not include 144A securities – see footnote above). At the end of the current reporting period, the aggregate cost of such securities was $5,640,335. The aggregate market value of $5,640,251 is approximately 2.7% of net assets. These securities have been deemed to be liquid under procedures established by the Board of Trustees. |
| (i) | Represents issuer in default on interest payments. Non-income producing security. |
| (k) | Securities segregated as collateral for futures contracts. |
| (n) | Rates shown are the effective yields at purchase date. |
| (w) | Prudential Investments LLC, the manager of the Portfolio, also serves as manager of the Dryden Core Investment Fund-Taxable Money Market Series. |
| (x) | Other liabilities in excess of other assets include unrealized appreciation (depreciation) on futures contracts, forward foreign currency exchange contracts, interest rate and credit default swap agreements as follows: |
Futures contracts open at December 31, 2007:
Securities or a portion thereof with an aggregate market value of $79,515 have been segregated with the custodian to cover margin requirements for futures contracts open at December 31, 2007.
| | | | | | | | | | | | | |
Number of
Contracts
| | Type
| | Expiration
Date
| | Value at
Trade Date
| | Value at
December 31, 2007
| | Unrealized
Appreciation
|
| Long Positions: | | | | | | | | | | | | | |
| 12 | | 90 Day Euro Dollar | | Jun 08 | | $ | 2,871,450 | | $ | 2,887,650 | | $ | 16,200 |
| 40 | | 90 Day Euro Dollar | | Mar 09 | | | 9,557,500 | | | 9,663,000 | | | 105,500 |
| 20 | | 90 Day Euro Dollar | | Dec 09 | | | 4,765,250 | | | 4,809,000 | | | 43,750 |
| | | | | | | | | | | | |
|
|
| | | | | | | | | | | | | $ | 165,450 |
| | | | | | | | | | | | |
|
|
SEE NOTES TO FINANCIAL STATEMENTS.
A43
| | | | |
| | | SP PIMCO HIGH YIELD PORTFOLIO (Continued) | | |
SCHEDULE OF INVESTMENTS | December 31, 2007 |
Forward foreign currency exchange contracts outstanding at December 31, 2007:
| | | | | | | | | | | | | |
Purchase Contracts
| | Notional
Amount
(000)
| | Value at
Settlement Date
Payable
| | Current
Value
| | Unrealized
Appreciation
(Depreciation)
| |
Euros, expiring 01/17/08 | | EUR | 58 | | $ | 85,399 | | $ | 84,799 | | $ | (600 | ) |
Indian Rupee, expiring 05/12/08 | | INR | 80,337 | | | 2,000,000 | | | 2,026,348 | | | 26,348 | |
Mexican Peso, expiring 07/10/08 | | MXN | 22,375 | | | 2,000,000 | | | 2,016,965 | | | 16,965 | |
Russian Ruble, expiring 07/10/08 | | RUB | 50,660 | | | 2,000,000 | | | 2,057,131 | | | 57,131 | |
South Korean Won, expiring 08/04/08 | | KRW | 1,830,000 | | | 2,000,000 | | | 1,971,120 | | | (28,880 | ) |
| | | | | |
|
| |
|
| |
|
|
|
| | | | | | $ | 8,085,399 | | $ | 8,156,363 | | $ | 70,964 | |
| | | | | |
|
| |
|
| |
|
|
|
| | | | |
Sale Contracts
| | Notional
Amount (000)
| | Value at
Settlement Date
Receivable
| | Current
Value
| | Unrealized
Appreciation
| |
British Pound, expiring 01/31/08 | | GBP | 508 | | $ | 1,023,269 | | $ | 1,010,296 | | $ | 12,973 | |
Euros, expiring 01/17/08 | | EUR | 2,995 | | | 4,387,106 | | | 4,380,241 | | | 6,865 | |
| | | | | |
|
| |
|
| |
|
|
|
| | | | | | $ | 5,410,375 | | $ | 5,390,537 | | $ | 19,838 | |
| | | | | |
|
| |
|
| |
|
|
|
Interest rate swap agreements outstanding at December 31, 2007:
| | | | | | | | | | | | | | |
Counterparty
| | Termination
Date
| | Notional
Amount#
| | Fixed
Rate
| | | Floating Rate
| | Unrealized
Appreciation
(Depreciation)
| |
Barclays Bank PLC(1) | | 06/18/10 | | $ | 4,600,000 | | 4.00 | % | | 3 month LIBOR | | $ | 12,104 | |
Morgan Stanley Capital Services, Inc.(1) | | 06/18/09 | | | 300,000 | | 4.00 | % | | 3 month LIBOR | | | 746 | |
Morgan Stanley Capital Services, Inc.(1) | | 06/18/13 | | | 8,700,000 | | 4.00 | % | | 3 month LIBOR | | | 95,037 | |
Morgan Stanley Capital Services, Inc.(1) | | 12/19/09 | | | 4,000,000 | | 5.00 | % | | 3 month LIBOR | | | 55,859 | |
Barclays Bank PLC(1) | | 01/02/12 | | BRL | 12,800,000 | | 10.68 | % | | Brazilian interbank lending rate | | | (392,191 | ) |
Goldman Sachs(1) | | 01/02/12 | | BRL | 1,700,000 | | 10.15 | % | | Brazilian interbank lending rate | | | (58,363 | ) |
Morgan Stanley Capital Services, Inc.(1) | | 01/02/12 | | BRL | 16,500,000 | | 10.12 | % | | Brazilian interbank lending rate | | | (647,306 | ) |
Citigroup(1) | | 05/14/09 | | MXN | 13,000,000 | | 7.91 | % | | 28 day Mexican interbank rate | | | (5,100 | ) |
Morgan Stanley Capital Services, Inc.(1) | | 05/14/09 | | MXN | 15,000,000 | | 7.91 | % | | 28 day Mexican interbank rate | | | (4,464 | ) |
| | | | | | | | | | | | |
|
|
|
| | | | | | | | | | | | | $ | (943,678 | ) |
| | | | | | | | | | | | |
|
|
|
| (1) | Portfolio pays the floating rate and receives the fixed rate. |
| # | Notional Amount is shown in U.S. dollars unless otherwise stated. |
Credit default swap agreements outstanding at December 31, 2007:
| | | | | | | | | | | | | | |
Counterparty
| | Termination
Date
| | Notional
Amount#
| | Fixed
Rate
| | | Reference Entity/Obligation
| | Unrealized
Depreciation
| |
Credit Suisse International, LTD.(1) | | 03/20/08 | | $ | 1,000,000 | | 0.65 | % | | Abitibi-Consol, Co.,
8.375%, due 04/01/15 | | $ | (22,675 | ) |
Morgan Stanley Capital Services, Inc.(1) | | 09/20/12 | | | 500,000 | | 2.68 | % | | Aramark Corp.,
8.50%, due 02/01/15 | | | (26,089 | ) |
Lehman Brothers, Inc.(1) | | 09/20/12 | | | 400,000 | | 4.25 | % | | Celestica, Inc.,
7.625%, due 07/01/13 | | | (11,646 | ) |
Lehman Brothers, Inc.(1) | | 09/20/12 | | | 500,000 | | 2.52 | % | | CSC Holdings, Inc.,
7.625%, due 07/15/18 | | | (29,673 | ) |
Citigroup(1) | | 09/20/12 | | | 125,000 | | 2.57 | % | | Dynergy Holdings, Inc.,
6.875%, due 04/01/11 | | | (7,100 | ) |
Citigroup(1) | | 12/20/12 | | | 300,000 | | 2.25 | % | | Forest Oil Corp.,
7.75%, due 05/01/14 | | | (614 | ) |
SEE NOTES TO FINANCIAL STATEMENTS.
A44
| | | | |
| | | SP PIMCO HIGH YIELD PORTFOLIO (Continued) | | |
SCHEDULE OF INVESTMENTS | December 31, 2007 |
| | | | | | | | | | | | | | |
Counterparty
| | Termination
Date
| | Notional
Amount#
| | Fixed
Rate
| | | Reference Entity/Obligation
| | Unrealized
Depreciation
| |
Citigroup(1) | | 06/20/12 | | $ | 1,000,000 | | 7.28 | % | | GMAC LLC,
6.875%, due 08/28/12 | | $ | (7,848 | ) |
Bank of America(1) | | 09/20/12 | | | 600,000 | | 6.75 | % | | GMAC LLC,
6.875%, due 08/28/12 | | | (11,529 | ) |
Deutsche Bank(1) | | 09/20/12 | | | 250,000 | | 6.15 | % | | GMAC LLC,
6.875%, due 08/28/12 | | | (8,650 | ) |
Goldman Sachs(1) | | 09/20/12 | | | 1,600,000 | | 6.70 | % | | GMAC LLC,
6.875%, due 08/28/12 | | | (32,795 | ) |
Merrill Lynch & Co.(1) | | 12/20/12 | | | 1,600,000 | | 6.30 | % | | GMAC LLC,
6.875%, due 08/28/12 | | | (48,925 | ) |
Morgan Stanley Capital Services, Inc.(1) | | 04/20/11 | | | 1,500,000 | | 1.05 | % | | JSC “GAZPROM” | | | (20,678 | ) |
JPMorgan Chase Bank, N.A.(1) | | 02/20/12 | | | 1,000,000 | | 0.77 | % | | JSC “GAZPROM” | | | (28,801 | ) |
Barclays Bank PLC(1) | | 02/20/09 | | | 1,000,000 | | 0.76 | % | | OJSC Russian Agricultural Bank, 6.875%, due 11/29/10 | | | (8,067 | ) |
Barclays Bank PLC(1) | | 03/20/09 | | | 500,000 | | 0.74 | % | | OJSC Russian Agricultural Bank, 6.875%, due 11/29/10 | | | (5,348 | ) |
Credit Suisse International, LTD.(1) | | 09/20/12 | | | 150,000 | | 4.22 | % | | Sanmina-SCI Corp.,
8.125%, due 03/01/16 | | | (11,176 | ) |
Citigroup(1) | | 09/20/12 | | | 500,000 | | 2.92 | % | | Sungard Data Systems, Inc.,
9.125%, due 08/15/13 | | | (22,046 | ) |
| | | | | | | | | | | | |
|
|
|
| | | | | | | | | | | | | $ | (303,660 | ) |
| | | | | | | | | | | | |
|
|
|
| (1) | Portfolio receives the fixed rate and pays the counterparty the notional amount in the event that the underlying bond defaults. |
| # | Notional Amount is shown in U.S. dollars unless otherwise stated. |
SEE NOTES TO FINANCIAL STATEMENTS.
A45
| | | | |
| | | SP PIMCO HIGH YIELD PORTFOLIO (Continued) | | |
SCHEDULE OF INVESTMENTS | December 31, 2007 |
The industry classification of investments and other liabilities in excess of other assets shown as a percentage of net assets as December 31, 2007 were as follows:
| | | |
U.S. Government Mortgage-Backed Obligations | | 13.2 | % |
Commercial Paper | | 12.2 | |
Telecommunications | | 9.0 | |
Diversified Financial Services | | 9.0 | |
Utilities | | 6.5 | |
Bank Notes | | 6.3 | |
Oil & Gas Exploration/Production | | 5.6 | |
Hospitals/Hospital Management | | 4.9 | |
Media | | 4.1 | |
Automotive | | 3.2 | |
Retail | | 2.9 | |
Forest & Paper Products | | 2.8 | |
Financial – Bank & Trust | | 2.5 | |
Gaming | | 2.4 | |
Chemicals | | 2.2 | |
Semiconductors | | 2.0 | |
Outstanding Options Purchased | | 1.9 | |
Advertising | | 1.8 | |
Municipal Bonds | | 1.7 | |
Metals & Mining | | 1.5 | |
Containers & Packaging | | 1.5 | |
Cable | | 1.4 | |
Environmental Services | | 1.2 | |
Foods | | 1.2 | |
Pipelines & Other | | 1.1 | |
Healthcare Services | | 1.1 | |
Computer Services & Software | | 1.0 | |
Technology | | 0.9 | |
Electronic Components | | 0.9 | |
Electric | | 0.9 | |
Commercial Services | | 0.8 | |
Distribution/Wholesale | | 0.7 | |
Services Cyclical – Rental Equipment | | 0.6 | |
Machinery & Equipment | | 0.5 | |
Diversified Manufacturing | | 0.5 | |
Business Services | | 0.5 | |
Real Estate Management & Development | | 0.5 | |
Entertainment | | 0.5 | |
Oil, Gas & Consumable Fuels | | 0.4 | |
Aerospace & Defense | | 0.4 | |
Real Estate Investment Trusts | | 0.4 | |
Tobacco | | 0.3 | |
Diversified | | 0.2 | |
Apparel | | 0.2 | |
Airlines | | 0.2 | |
Affiliated Money Market Mutual Fund | | 0.2 | |
Construction | | 0.1 | |
Oil & Gas Services | | 0.1 | |
Diversified Operations | | 0.1 | |
Household Products/Wares | | 0.1 | |
| | |
|
|
| | | 114.2 | |
Written Options | | (1.6 | ) |
Other liabilities in excess of other assets | | (12.6 | ) |
| | |
|
|
| | | 100.0 | % |
| | |
|
|
SEE NOTES TO FINANCIAL STATEMENTS.
A46
| | | | |
| | | SP PIMCO HIGH YIELD PORTFOLIO (Continued) | | |
STATEMENT OF ASSETS AND LIABILITIES
December 31, 2007
| | | | |
| ASSETS | | | | |
Investments at value: | | | | |
Unaffiliated investments (cost $235,745,687) | | $ | 234,891,081 | |
Affiliated investments (cost $358,660) | | | 358,660 | |
Cash | | | 1,553,148 | |
Foreign currency, at value (cost $115,212) | | | 115,131 | |
Receivable for investments sold | | | 6,367,010 | |
Dividends and interest receivable | | | 3,284,492 | |
Unrealized appreciation on swap agreements | | | 163,746 | |
Unrealized appreciation on foreign currency forward contracts | | | 120,282 | |
Due from broker-varation margin | | | 13,550 | |
Receivable for Series shares sold | | | 3,973 | |
Prepaid expenses | | | 227 | |
| | |
|
|
|
Total Assets | | | 246,871,300 | |
| | |
|
|
|
| LIABILITIES | | | | |
Payable for investments purchased | | | 35,607,826 | |
Written options outstanding, at value (cost $1,944,180) | | | 3,330,899 | |
Unrealized depreciation on swap agreements | | | 1,411,084 | |
Premium for swaps sold | | | 162,186 | |
Payable for Series shares repurchased | | | 128,384 | |
Accrued expenses and other liabilities | | | 102,890 | |
Management fee payable | | | 104,877 | |
Unrealized depreciation on foreign currency forward contracts | | | 29,480 | |
Transfer agent fees payable | | | 628 | |
| | |
|
|
|
Total Liabilities | | | 40,878,254 | |
| | |
|
|
|
| NET ASSETS | | $ | 205,993,046 | |
| | |
|
|
|
Net assets were comprised of: | | | | |
Paid-in capital | | $ | 207,883,884 | |
Retained earnings | | | (1,890,838 | ) |
| | |
|
|
|
Net assets, December 31, 2007 | | $ | 205,993,046 | |
| | |
|
|
|
Net asset value and redemption price per share, $205,993,046 / 20,949,609 outstanding shares of beneficial interest | | $ | 9.83 | |
| | |
|
|
|
STATEMENT OF OPERATIONS
Year Ended December 31, 2007
| | | | |
| INVESTMENT INCOME | | | | |
Interest | | $ | 18,047,207 | |
Affiliated dividend income | | | 446,487 | |
Unaffiliated dividend income | | | 43,857 | |
| | |
|
|
|
| | | | 18,537,551 | |
| | |
|
|
|
| EXPENSES | | | | |
Management fee | | | 1,420,530 | |
Custodian’s fees and expenses | | | 106,000 | |
Audit fee | | | 34,000 | |
Shareholders’ reports | | | 28,000 | |
Trustees’ fees | | | 14,000 | |
Insurance expenses | | | 8,000 | |
Legal fees and expenses | | | 7,000 | |
Transfer agent’s fees and expenses (including affiliated expense of $4,000) (Note 4) | | | 4,000 | |
Commitment fee on syndicated credit agreement | | | 1,500 | |
Miscellaneous | | | 8,424 | |
| | |
|
|
|
Total expenses | | | 1,631,454 | |
| | |
|
|
|
| NET INVESTMENT INCOME | | | 16,906,097 | |
| | |
|
|
|
| NET REALIZED AND UNREALIZED GAIN (LOSS) ON INVESTMENTS AND FOREIGN CURRENCIES | | | | |
Net realized gain (loss) on: | | | | |
Investment transactions | | | 299,020 | |
Futures transactions | | | (172,128 | ) |
Options written transactions | | | 11,577 | |
Swap agreement transactions | | | 65,759 | |
Foreign currency transactions | | | (10,950 | ) |
| | |
|
|
|
| | | | 193,278 | |
| | |
|
|
|
Net change in unrealized appreciation (depreciation) on: | | | | |
Investments | | | (6,402,020 | ) |
Futures | | | 258,150 | |
Options written | | | (1,391,390 | ) |
Swap agreements | | | (997,238 | ) |
Foreign currencies | | | 65,103 | |
| | |
|
|
|
| | | | (8,467,395 | ) |
| | |
|
|
|
| NET LOSS ON INVESTMENTS AND FOREIGN CURRENCIES | | | (8,274,117 | ) |
| | |
|
|
|
| NET INCREASE IN NET ASSETS RESULTING FROM OPERATIONS | | $ | 8,631,980 | |
| | |
|
|
|
STATEMENT OF CHANGES IN NET ASSETS
| | | | | | | | |
| | | Year Ended December 31,
| |
| | | 2007
| | | 2006
| |
| INCREASE (DECREASE) IN NET ASSETS | | | | | | | | |
| OPERATIONS: | | | | | | | | |
Net investment income | | $ | 16,906,097 | | | $ | 20,150,424 | |
Net realized gain on investment and foreign currency transactions | | | 193,278 | | | | 3,203,903 | |
Net change in unrealized appreciation (depreciation) on investments and foreign currencies | | | (8,467,395 | ) | | | 3,124,086 | |
| | |
|
|
| |
|
|
|
NET INCREASE IN NET ASSETS RESULTING FROM OPERATIONS | | | 8,631,980 | | | | 26,478,413 | |
| | |
|
|
| |
|
|
|
| DISTRIBUTIONS | | | (19,316,825 | ) | | | (23,678,885 | ) |
| | |
|
|
| |
|
|
|
| SERIES SHARE TRANSACTIONS: | | | | | | | | |
Series shares sold [974,027 and 1,758,830 shares, respectively] | | | 10,047,357 | | | | 17,937,774 | |
Series shares issued in reinvestment of distributions [1,921,263 and 2,337,450 shares, respectively] | | | 19,316,825 | | | | 23,678,885 | |
Series shares repurchased [8,500,462 and 13,506,793 shares, respectively] | | | (87,117,703 | ) | | | (138,592,570 | ) |
| | |
|
|
| |
|
|
|
DECREASE IN NET ASSETS RESULTING FROM SERIES SHARE TRANSACTIONS | | | (57,753,521 | ) | | | (96,975,911 | ) |
| | |
|
|
| |
|
|
|
| TOTAL DECREASE IN NET ASSETS | | | (68,438,366 | ) | | | (94,176,383 | ) |
| NET ASSETS: | | | | | | | | |
Beginning of year | | | 274,431,412 | | | | 368,607,795 | |
| | |
|
|
| |
|
|
|
End of year | | $ | 205,993,046 | | | $ | 274,431,412 | |
| | |
|
|
| |
|
|
|
SEE NOTES TO FINANCIAL STATEMENTS.
A47
| | | | |
| | | SP PIMCO TOTAL RETURN PORTFOLIO | | |
SCHEDULE OF INVESTMENTS | December 31, 2007 |
| | | | | | | | | | | | | |
| LONG-TERM INVESTMENTS — 164.3% | | Moody’s
Ratings
(Unaudited)
| | Interest
Rate
| | | Maturity
Date
| | Principal
Amount
(000)#
| | Value
(Note 2)
|
| | | | | | | | | | | | | | |
ASSET-BACKED SECURITIES — 0.7% | | | | | | | | | | | | | |
Asset Backed Securities Corp. Home Equity Loan Trust,
Series 2004-HE6, Class A1 | | Aaa | | 5.14% | (c) | | 09/25/34 | | $ | 614 | | $ | 600,748 |
Countrywide Asset-Backed Certificates (cost $1,016,030; purchased 02/17/06), Series 2006-SD1, Class A1, 144A(g)(l) | | AAA(d) | | 5.025% | (c) | | 04/25/36 | | | 1,016 | | | 985,913 |
Master Asset Backed Securities Trust, Series 2006-AM3, Class A1 | | Aaa | | 4.925% | (c) | | 10/27/36 | | | 305 | | | 303,499 |
MBNA Credit Card Master Note Trust, Series 2004-A7, Class A7 | | Aaa | | 5.128% | (c) | | 12/15/11 | | | 2,000 | | | 1,996,145 |
Morgan Stanley ABS Capital I, Series 2006-HE4, Class A1 | | Aaa | | 4.905% | (c) | | 06/25/36 | | | 322 | | | 317,979 |
Morgan Stanley IXIS Real Estate Capital Trust, Series 2006-2, Class A1 | | Aaa | | 4.915% | (c) | | 11/25/36 | | | 1,135 | | | 1,105,982 |
Structured Asset Securities Corp., Series 2006-BC3, Class A2 | | Aaa | | 4.915% | (c) | | 10/25/36 | | | 4,609 | | | 4,524,912 |
| | | | | | | | | | | | |
|
|
TOTAL ASSET-BACKED SECURITIES
(cost $10,007,209) | | | 9,835,178 |
| | | | | | | | | | | | |
|
|
BANK NOTES — 3.3% | | | | | | | | | | | | | |
Chrysler Financial, Term (cost $28,239,225; purchased 07/31/07, 11/28/07)(g)(l) | | BA-(d) | | 9.00% | (c) | | 08/03/14 | | | 29,726 | | | 28,529,732 |
HCA, Inc., Term B (cost $6,775,433; purchased 07/24/07)(g)(l) | | BA-(d) | | 7.08% | (c) | | 11/14/13 | | | 6,982 | | | 6,718,826 |
Metro Goldwyn, Term B1 (cost $3,970,000; purchased 03/14/07)(g)(l) | | BA-(d) | | 8.08% | (c) | | 04/08/12 | | | 3,970 | | | 3,671,349 |
SLM Corp. Bridge Loan (cost $7,960,000; purchased 06/27/07)(g)(l) | | BA(d) | | 6.00% | (c) | | 06/30/08 | | | 8,000 | | | 7,971,221 |
| | | | | | | | | | | | |
|
|
TOTAL BANK NOTES
(cost $46,986,733) | | | 46,891,128 |
| | | | | | | | | | | | |
|
|
COLLATERALIZED MORTGAGE OBLIGATIONS — 4.0% | | | | | | | | | | | | | |
Asset Backed Funding Certificates, Series 2006-OPT3, Class A3A | | Aaa | | 4.925% | (c) | | 11/25/36 | | | 1,209 | | | 1,189,204 |
Banc of America Mortgage Securities, Inc., Series 2004-2, Class 5A1 | | Aaa | | 6.50% | | | 10/25/31 | | | 182 | | | 182,392 |
Bear Stearns Adjustable Rate Mortgage Trust, Series 2002-11, Class 1A1 | | Aaa | | 5.608% | (c) | | 02/25/33 | | | 458 | | | 453,550 |
Bear Stearns Adjustable Rate Mortgage Trust, Series 2005-2, Class A2 | | Aaa | | 4.125% | (c) | | 03/25/35 | | | 6,081 | | | 5,980,286 |
Bear Stearns Adjustable Rate Mortgage Trust, Series 2005-4, Class 23A2 | | Aaa | | 5.368% | (c) | | 05/25/35 | | | 3,091 | | | 3,004,612 |
Brazos Student Loan Finance Corp., Series 1998-A, Class A2 | | Aaa | | 4.02% | (c) | | 06/01/23 | | | 43 | | | 42,975 |
Countrywide Alternative Loan Trust, Series 2006-OA19, Class A1A | | Aaa | | 5.129% | (c) | | 12/25/46 | | | 6,159 | | | 5,810,710 |
Countrywide Alternative Loan Trust, Series 2007-OA7, Class A1A | | Aaa | | 5.045% | (c) | | 01/25/46 | | | 4,589 | | | 4,329,633 |
Federal National Mortgage Assoc., Series 2001-29, Class Z | | Aaa | | 6.50% | | | 07/25/31 | | | 261 | | | 269,218 |
Government Lease Trust (cost $1,346,953; purchased 02/14/03),
Series 1999-C1A, Class B2, 144A(g)(l) | | AAA(d) | | 4.00% | | | 05/18/11 | | | 1,500 | | | 1,500,896 |
Government National Mortgage Assoc., Series 2000-14, Class F | | Aaa | | 5.678% | (c) | | 02/16/30 | | | 19 | | | 19,642 |
Greenpoint Mortgage Funding Trust, Series 2006-AR6, Class A1A | | Aaa | | 4.945% | (c) | | 10/25/46 | | | 3,186 | | | 3,120,145 |
GSR Mortgage Loan Trust, Series 2005-AR6, Class 2A1 | | AAA(d) | | 4.539% | (c) | | 10/25/35 | | | 5,643 | | | 5,593,236 |
Harborview Mortgage Loan Trust, Series 2006-12, Class 2A11 | | Aaa | | 5.055% | (c) | | 12/19/36 | | | 1,452 | | | 1,434,630 |
Impac Secured Assets CMN Owner Trust, Series 2006-4, Class A2A | | Aaa | | 4.945% | (c) | | 12/25/36 | | | 287 | | | 281,909 |
Indymac ARM Trust, Series 2001-H2, Class A1 | | Aaa | | 6.452% | (c) | | 01/25/32 | | | 6 | | | 5,992 |
Master Asset Securitization Trust, Series 2003-7, Class 1A2 | | AAA(d) | | 5.50% | | | 09/25/33 | | | 2,510 | | | 2,487,961 |
Merrill Lynch Floating Trust (cost $1,683,642; purchased 10/31/06), Series 2006-1, Class A1, 144A(g)(l) | | Aaa | | 5.098% | (c) | | 06/15/22 | | | 1,684 | | | 1,633,423 |
Merrill Lynch Mortgage Investors, Inc., Series 2005-A10, Class A | | Aaa | | 5.075% | (c) | | 02/25/36 | | | 2,556 | | | 2,459,668 |
Quest Trust (cost $2,958; purchased 06/24/04), Series 2004-X2, Class A1, 144A(g)(l) | | Aaa | | 5.425% | (c) | | 06/25/34 | | | 3 | | | 2,749 |
Residential Funding Mortgage Securities I, Series 2003-S9, Class A1 | | Aaa | | 6.50% | | | 03/25/32 | | | 466 | | | 465,975 |
Washington Mutual, Inc., Series 2002-AR2, Class A | | Aaa | | 5.483% | (c) | | 02/27/34 | | | 1,002 | | | 979,929 |
Washington Mutual, Inc., Series 2002-AR17, Class 1A | | Aaa | | 5.988% | (c) | | 11/25/42 | | | 681 | | | 659,300 |
Washington Mutual, Inc., Series 2003-AR1, Class 2A | | Aaa | | 5.967% | (c) | | 02/25/33 | | | 75 | | | 74,682 |
Washington Mutual, Inc., Series 2003-R1, Class A1 | | Aaa | | 5.405% | (c) | | 12/25/27 | | | 9,888 | | | 9,451,130 |
Washington Mutual, Inc., Series 2005-AR13, Class A1A1 | | Aaa | | 5.155% | (c) | | 10/25/45 | | | 3,102 | | | 2,914,945 |
Washington Mutual, Inc., Series 2006-AR17, Class 1A1A | | Aaa | | 5.598% | (c) | | 12/25/46 | | | 2,240 | | | 2,109,985 |
Washington Mutual, Inc., Series 2007-AR17, Class 2A | | Aaa | | 5.733% | (c) | | 12/25/46 | | | 624 | | | 615,636 |
| | | | | | | | | | | | |
|
|
TOTAL COLLATERALIZED MORTGAGE OBLIGATIONS
(cost $58,757,530) | | | 57,074,413 |
| | | | | | | | | | | | |
|
|
SEE NOTES TO FINANCIAL STATEMENTS.
A48
| | | | |
| | | SP PIMCO TOTAL RETURN PORTFOLIO (Continued) | | |
SCHEDULE OF INVESTMENTS | December 31, 2007 |
| | | | | | | | | | | | | |
| CORPORATE BONDS — 19.6% | | Moody’s
Ratings
(Unaudited)
| | Interest
Rate
| | | Maturity
Date
| | Principal
Amount
(000)#
| | Value
(Note 2)
|
| | | | | | | | | | | | | | |
Aerospace — 0.2% | | | | | | | | | | | | | |
Goodrich Corp., Sr. Unsec’d. Notes | | Baa2 | | 6.29% | | | 07/01/16 | | $ | 2,200 | | $ | 2,289,410 |
| | | | | | | | | | | | |
|
|
Airlines | | | | | | | | | | | | | |
United AirLines, Inc., Pass-Through Certificates(i)(g) | | NR | | 9.21% | | | 01/21/17 | | | 82 | | | 204 |
| | | | | | | | | | | | |
|
|
Automobile Manufacturers — 0.5% | | | | | | | | | | | | | |
DaimlerChrysler NA Holding Corp., Gtd. Notes | | A3 | | 5.541% | (c) | | 03/13/09 | | | 3,500 | | | 3,475,685 |
DaimlerChrysler NA Holding Corp., Gtd. Notes, MTN | | A3 | | 5.75% | | | 09/08/11 | | | 3,400 | | | 3,450,490 |
| | | | | | | | | | | | |
|
|
| | | | | | | | | | | | | | 6,926,175 |
| | | | | | | | | | | | |
|
|
Building Materials — 0.3% | | | | | | | | | | | | | |
Lennar Corp., Gtd. Notes | | Ba1 | | 5.95% | | | 10/17/11 | | | 5,000 | | | 4,206,790 |
| | | | | | | | | | | | |
|
|
Diversified — 2.0% | | | | | | | | | | | | | |
C10 Capital SPV Ltd. (cost $2,500,000; purchased 12/11/06), Debs., 144A(g)(l) | | BBB-(d) | | 6.722% | (c) | | 12/31/49 | | | 2,500 | | | 2,300,900 |
General Electric Co., Sr. Unsec’d. Notes | | Aaa | | 5.186% | (c) | | 12/09/08 | | | 6,832 | | | 6,842,808 |
General Electric Co., Sr. Unsec’d. Notes | | Aaa | | 5.25% | | | 12/06/17 | | | 3,800 | | | 3,791,891 |
iStar Financial, Inc., Sr. Unsec’d. Notes | | Baa2 | | 5.80% | | | 03/15/11 | | | 1,000 | | | 895,842 |
Siemens Financieringsmat (cost $14,700,000; purchased 08/09/06), Gtd. Notes, 144A (Netherlands)(g)(l) | | A1 | | 4.92% | (c) | | 08/14/09 | | | 14,700 | | | 14,704,087 |
| | | | | | | | | | | | |
|
|
| | | | | | | | | | | | | | 28,535,528 |
| | | | | | | | | | | | |
|
|
Financial – Bank & Trust — 4.9% | | | | | | | | | | | | | |
Intesa Bank Overseas Ltd., Bank Gtd. Notes | | NR | | 6.079% | (c) | | 01/02/08 | | | 16,000 | | | 16,000,000 |
Norddeutsche Landesbank Girozentrale, MTN (Germany) | | Aaa | | 0.45% | | | 01/19/09 | | JPY | 2,456,000 | | | 21,893,894 |
Rabobank Nederland, Notes, MTN (Netherlands) | | Aaa | | 0.20% | | | 06/20/08 | | | 569,000 | | | 5,075,445 |
Rabobank Nederland (cost $6,700,000; purchased 01/17/06), Sr. Notes, 144A (Netherlands)(g)(l) | | Aaa | | 5.263% | (c) | | 01/15/09 | | | 6,700 | | | 6,690,828 |
Santander US Debt SA Unipersonal (cost $15,495,645; purchased 01/30/06), Gtd. Notes, 144A(g)(l) | | Aa1 | | 4.925% | (c) | | 02/06/09 | | | 15,500 | | | 15,411,898 |
Vornado Realty LP, Sr. Unsec’d. Notes | | Baa2 | | 5.60% | | | 02/15/11 | | | 1,000 | | | 995,516 |
VTB Capital SA (cost $3,700,000; purchased 10/27/06),
Sr. Notes, 144A(g)(l) | | A2 | | 5.494% | (c) | | 08/01/08 | | | 3,700 | | | 3,663,000 |
| | | | | | | | | | | | |
|
|
| | | | | | | | | | | | | | 69,730,581 |
| | | | | | | | | | | | |
|
|
Financial Services — 6.9% | | | | | | | | | | | | | |
Citi Financial, Inc., Unsec’d. Notes | | Aa3 | | 6.625% | | | 06/01/15 | | | 600 | | | 630,016 |
Citigroup Capital XXI Gtd. Notes | | A1 | | 8.30% | (c) | | 12/21/47 | | | 11,000 | | | 11,486,101 |
Citigroup, Inc., Sr. Unsec’d. Notes | | Aa3 | | 5.024% | (c) | | 01/30/09 | | | 1,900 | | | 1,884,374 |
General Electric Capital Corp. (cost $14,999,395; purchased 08/30/07), Sub. Notes, 144A(g)(l) | | Aa1 | | 6.751% | (c) | | 09/15/36 | | GBP | 7,500 | | | 15,116,898 |
General Motors Acceptance Corp., Bonds | | Ba3 | | 8.00% | | | 11/01/31 | | | 11,100 | | | 9,311,512 |
General Motors Acceptance Corp., Unsub. Notes | | Ba3 | | 6.875% | | | 08/28/12 | | | 10,800 | | | 9,050,011 |
Goldman Sachs Group, Inc. (The), Sr. Notes | | Aa3 | | 5.35% | | | 01/15/16 | | | 1,300 | | | 1,288,144 |
Goldman Sachs Group, Inc. (The), Sr. Notes | | Aa3 | | 5.75% | | | 10/01/16 | | | 6,000 | | | 6,089,892 |
Goldman Sachs Group, Inc. (The), Sr. Sub. Notes | | A1 | | 6.75% | | | 10/01/37 | | | 8,200 | | | 8,034,180 |
Morgan Stanley, Sr. Notes, MTN | | AA-(d) | | 5.334% | (c) | | 01/18/08 | | | 412 | | | 411,914 |
Morgan Stanley, Sr. Unsec’d. Notes, MTN | | Aa3 | | 5.006% | (c) | | 02/09/09 | | | 15,400 | | | 15,209,487 |
Pemex Project Funding Master Trust, Gtd. Notes | | Baa1 | | 9.125% | | | 10/13/10 | | | 430 | | | 475,150 |
Petroleum Export Ltd. (cost $1,887,088; purchased 07/14/05),
Sr. Notes, 144A (Cayman Islands)(g)(l) | | Baa1 | | 5.265% | | | 06/15/11 | | | 1,887 | | | 1,865,575 |
SLM Corp., Unsec’d. Notes | | Baa1 | | 5.038% | (c) | | 04/14/08 | | | 12,900 | | | 12,806,165 |
SLM Corp. (cost $4,780,656; purchased 06/08/07),
Sr. Notes, MTN, 144A(g)(l) | | Baa1 | | 4.959% | (c) | | 04/18/08 | | | 4,800 | | | 4,749,254 |
| | | | | | | | | | | | |
|
|
| | | | | | | | | | | | | | 98,408,673 |
| | | | | | | | | | | | |
|
|
SEE NOTES TO FINANCIAL STATEMENTS.
A49
| | | | |
| | | SP PIMCO TOTAL RETURN PORTFOLIO (Continued) | | |
SCHEDULE OF INVESTMENTS | December 31, 2007 |
| | | | | | | | | | | | | | |
| CORPORATE BONDS (continued) | | Moody’s
Ratings
(Unaudited)
| | Interest
Rate
| | | Maturity
Date
| | Principal
Amount
(000)#
| | | Value
(Note 2)
|
| | | | | | | | | | | | | | | |
Healthcare Services — 0.7% | | | | | | | | | | | | | | |
Amgen, Inc. (cost $9,085,713; purchased 05/24/07),
Sr. Unsec’d. Notes, 144A(g)(l) | | A2 | | 5.85% | | | 06/01/17 | | $ | 9,100 | | | $ | 9,237,501 |
HCA, Inc., Sec’d. Notes | | B2 | | 9.25% | | | 11/15/16 | | | 200 | | | | 210,000 |
| | | | | | | | | | | | | |
|
|
| | | | | | | | | | | | | | | 9,447,501 |
| | | | | | | | | | | | | |
|
|
Insurance — 0.5% | | | | | | | | | | | | | | |
ASIF III Jersey Ltd., Sec’d. Notes, MTN (Japan) | | Aa2 | | 0.95% | | | 07/15/09 | | JPY | 875,000 | | | | 7,800,678 |
| | | | | | | | | | | | | |
|
|
Oil, Gas & Consumable Fuels — 0.6% | | | | | | | | | | | | | | |
El Paso Corp., Sr. Unsec’d. Notes | | Ba3 | | 7.00% | | | 05/15/11 | | | 200 | | | | 203,722 |
El Paso Corp., Sr. Unsec’d. Notes, MTN | | Ba3 | | 7.80% | | | 08/01/31 | | | 1,050 | | | | 1,065,600 |
Transocean, Inc., Sr. Unsec’d. Notes | | Baa2 | | 5.341% | (c) | | 09/05/08 | | | 7,800 | | | | 7,761,109 |
| | | | | | | | | | | | | |
|
|
| | | | | | | | | | | | | | | 9,030,431 |
| | | | | | | | | | | | | |
|
|
Paper & Forest Products — 0.3% | | | | | | | | | | | | | | |
Georgia-Pacific Corp. (cost $900,000; purchased 12/13/06),
Gtd. Notes, 144A(g)(l) | | Ba3 | | 7.00% | | | 01/15/15 | | | 900 | | | | 875,250 |
Georgia-Pacific Corp. (cost $1,300,000; purchased 12/13/06),
Gtd. Notes, 144A(g)(l) | | Ba3 | | 7.125% | | | 01/15/17 | | | 1,300 | | | | 1,264,250 |
Georgia-Pacific Corp., Sr. Unsec’d. Notes | | B2 | | 7.75% | | | 11/15/29 | | | 3,000 | | | | 2,745,000 |
| | | | | | | | | | | | | |
|
|
| | | | | | | | | | | | | | | 4,884,500 |
| | | | | | | | | | | | | |
|
|
Retail & Merchandising — 0.3% | | | | | | | | | | | | | | |
CVS Caremark Corp., Sr. Unsec’d. Notes | | Baa2 | | 5.75% | | | 08/15/11 | | | 3,700 | | | | 3,790,051 |
| | | | | | | | | | | | | |
|
|
Telecom-Integrated/Services — 0.5% | | | | | | | | | | | | | | |
BellSouth Corp., Sr. Unsec’d. Notes | | A2 | | 4.969% | (c) | | 08/15/08 | | | 7,200 | | | | 7,188,502 |
| | | | | | | | | | | | | |
|
|
Telecommunications — 1.2% | | | | | | | | | | | | | | |
Embarq Corp., Sr. Unsec’d. Notes | | Baa3 | | 7.082% | | | 06/01/16 | | | 6,000 | | | | 6,182,286 |
Qwest Corp., Notes | | Ba1 | | 8.875% | | | 03/15/12 | | | 1,650 | | | | 1,765,500 |
Qwest Corp., Sr. Notes | | Ba1 | | 7.625% | | | 06/15/15 | | | 7,000 | | | | 7,122,500 |
Verizon Communications, Inc., Sr. Unsec’d. Notes | | A3 | | 5.85% | | | 09/15/35 | | | 2,500 | | | | 2,445,435 |
| | | | | | | | | | | | | |
|
|
| | | | | | | | | | | | | | | 17,515,721 |
| | | | | | | | | | | | | |
|
|
Tobacco — 0.3% | | | | | | | | | | | | | | |
Reynolds American, Inc., Gtd. Notes | | Ba1 | | 7.625% | | | 06/01/16 | | | 4,000 | | | | 4,251,984 |
| | | | | | | | | | | | | |
|
|
Utilities — 0.4% | | | | | | | | | | | | | | |
Edison Mission Energy, Sr. Unsec’d. Notes | | B1 | | 7.00% | | | 05/15/17 | | | 800 | | | | 786,000 |
Edison Mission Energy, Sr. Unsec’d. Notes | | B1 | | 7.625% | | | 05/15/27 | | | 4,700 | | | | 4,418,000 |
| | | | | | | | | | | | | |
|
|
| | | | | | | | | | | | | | | 5,204,000 |
| | | | | | | | | | | | | |
|
|
TOTAL CORPORATE BONDS
(cost $279,395,201) | | | | 279,210,729 |
| | | | | | | | | | | | | |
|
|
FOREIGN GOVERNMENT BONDS — 2.3% | | | | | | | | | | | | | | |
Federal Republic of France Bonds (France) | | Aaa | | 4.00% | | | 12/31/49 | | EUR | 1,400 | | | | 1,807,751 |
Federal Republic of Panama Bonds (Panama) | | Ba1 | | 8.875% | | | 09/30/27 | | | 750 | | | | 975,000 |
Federal Republic of Peru Notes (Peru) | | NR | | 9.125% | | | 01/15/08 | | | 400 | | | | 400,000 |
Japan Bank International Corp. Foreign Government Gtd. (Japan) | | Aaa | | 0.35% | | | 03/19/08 | | JPY | 350,000 | | | | 3,130,118 |
Republic of Brazil Bonds (Brazil) | | Ba1 | | 12.50% | | | 01/05/22 | | BRL | 18,300 | | | | 11,514,607 |
United Kingdom Treasury Stock Bonds (United Kingdom) | | Aaa | | 4.25% | | | 03/07/11 | | GBP | 5,900 | | | | 11,688,662 |
United Kingdom Treasury Stock Bonds (United Kingdom) | | Aaa | | 5.75% | | | 12/07/09 | | | 1,700 | | | | 3,470,997 |
| | | | | | | | | | | | | |
|
|
TOTAL FOREIGN GOVERNMENT BONDS
(cost $30,602,709) | | | | 32,987,135 |
| | | | | | | | | | | | | |
|
|
MUNICIPAL BONDS — 0.9% | | | | | | | | | | | | | | |
Georgia State Road & Tollway Authority | | Aaa | | 5.00% | | | 03/01/21 | | | 700 | | | | 731,507 |
Honolulu Hawaii City & County, Series A | | Aaa | | 5.00% | | | 07/01/23 | | | 3,075 | (f) | | | 3,217,219 |
Massachusetts Water resources Authority, Series J | | Aaa | | 5.00% | | | 08/01/32 | | | 2,500 | (f) | | | 2,564,300 |
Pierce County School District No. 3 | | Aaa | | 5.00% | | | 12/01/23 | | | 3,000 | (f) | | | 3,142,260 |
SEE NOTES TO FINANCIAL STATEMENTS.
A50
| | | | |
| | | SP PIMCO TOTAL RETURN PORTFOLIO (Continued) | | |
SCHEDULE OF INVESTMENTS | December 31, 2007 |
| | | | | | | | | | | | | | |
| MUNICIPAL BONDS (continued) | | Moody’s
Ratings
(Unaudited)
| | Interest
Rate
| | | Maturity Date
| | Principal
Amount
(000)#
| | | Value
(Note 2)
|
| | | | | | | | | | | | | | | |
Salt River Project Agricultural Improvement & Power District, B1B, Series 1076, 144A (cost $516,495; purchased 04/29/05)(g)(l) | | AA(d) | | 5.77% | (c) | | 01/01/32 | | $ | 500 | | | $ | 510,640 |
Salt River Project agricultural Improvement & Power District,
Series B | | Aa1 | | 4.75% | | | 01/01/32 | | | 1,000 | (f) | | | 1,010,640 |
Tobacco Settlement Financing Corp. Rhode Island, Revenue Bonds | | Baa3 | | 6.125% | | | 06/01/32 | | | 1,205 | | | | 1,224,485 |
Tobacco Settlement Financing Corp. Rhode Island, Revenue Bonds | | Baa3 | | 6.25% | | | 06/01/42 | | | 400 | | | | 401,040 |
| | | | | | | | | | | | | |
|
|
TOTAL MUNICIPAL BONDS
(cost $12,410,078) | | | | 12,802,091 |
| | | | | | | | | | | | | |
|
|
U.S. GOVERNMENT MORTGAGE-BACKED OBLIGATIONS — 97.7% | | | | | | | | | | | | |
Federal Home Loan Mortgage Corp. | | | | 4.00% | | | 09/01/18 | | | 648 | | | | 623,869 |
Federal Home Loan Mortgage Corp. | | | | 4.50% | | | 11/01/35 | | | 894 | | | | 845,016 |
Federal Home Loan Mortgage Corp. | | | | 5.00% | | | 09/01/35-01/01/37 | | | 52,355 | | | | 51,115,897 |
Federal Home Loan Mortgage Corp. | | | | 5.50% | | | 06/01/37 | | | 1,995 | | | | 1,990,837 |
Federal Home Loan Mortgage Corp. | | | | 5.50% | | | TBA | | | 8,000 | | | | 7,982,496 |
Federal National Mortgage Assoc. | | | | 4.00% | | | 07/01/18-03/01/20 | | | 70,866 | | | | 68,000,359 |
Federal National Mortgage Assoc. | | | | 4.50% | | | 08/01/33-06/01/36 | | | 56,054 | | | | 53,042,700 |
Federal National Mortgage Assoc. | | | | 4.50% | | | TBA | | | 35,000 | | | | 34,442,170 |
Federal National Mortgage Assoc. | | | | 5.00% | | | 12/01/18-03/01/36 | | | 178,046 | | | | 173,951,574 |
Federal National Mortgage Assoc. | | | | 5.184% | (c) | | 06/01/35 | | | 1,613 | | | | 1,629,308 |
Federal National Mortgage Assoc. | | | | 5.50% | | | 01/18/21-04/01/37 | | | 339,506 | | | | 339,405,247 |
Federal National Mortgage Assoc. | | | | 5.50% | | | TBA | | | 245,900 | | | | 245,592,625 |
Federal National Mortgage Assoc. | | | | 5.622% | (c) | | 05/01/36 | | | 82 | | | | 82,252 |
Federal National Mortgage Assoc. | | | | 6.00% | | | 04/01/16-09/01/36 | | | 19,901 | | | | 20,228,296 |
Federal National Mortgage Assoc. | | | | 6.00% | | | TBA | | | 62,000 | | | | 62,949,344 |
Federal National Mortgage Assoc. | | | | 6.341% | (c) | | 12/01/36 | | | 1,863 | | | | 1,888,604 |
Government National Mortgage Assoc. | | | | 4.50% | | | 09/15/33 | | | 38 | | | | 35,921 |
Government National Mortgage Assoc. | | | | 5.00% | | | 08/15/33-09/15/36 | | | 10,131 | | | | 9,984,372 |
Government National Mortgage Assoc. | | | | 5.00% | | | TBA | | | 46,834 | | | | 46,146,028 |
Government National Mortgage Assoc. | | | | 5.50% | | | 05/15/36-12/15/37 | | | 10,353 | | | | 10,429,722 |
Government National Mortgage Assoc. | | | | 5.50% | | | TBA | | | 32,775 | | | | 33,010,587 |
Government National Mortgage Assoc. | | | | 5.625% | (c) | | 08/20/24-08/20/27 | | | 157 | | | | 158,772 |
Government National Mortgage Assoc. | | | | 6.00% | | | 10/15/23-11/15/37 | | | 150,877 | | | | 154,487,118 |
Government National Mortgage Assoc. | | | | 6.375% | (c) | | 04/20/25-05/20/25 | | | 46 | | | | 46,656 |
Government National Mortgage Assoc. | | | | 6.50% | | | TBA | | | 71,000 | | | | 73,307,500 |
Government National Mortgage Assoc. | | | | 9.00% | | | 07/15/30-08/15/30 | | | 2 | | | | 2,479 |
| | | | | | | | | | | | | |
|
|
TOTAL U.S. GOVERNMENT MORTGAGE-BACKED OBLIGATIONS
(cost $1,382,578,462) | | | | 1,391,379,749 |
| | | | | | | | | | | | | |
|
|
U.S. TREASURY OBLIGATIONS — 35.8% | | | | | | | | | | | | | | |
U.S. Treasury Bonds | | | | 4.75% | | | 02/15/37 | | | 4,800 | | | | 5,023,498 |
U.S. Treasury Bonds | | | | 5.00% | | | 05/15/37 | | | 229,700 | | | | 250,355,083 |
U.S. Treasury Bonds | | | | 6.25% | | | 05/15/30 | | | 5,400 | | | | 6,739,033 |
U.S. Treasury Bonds | | | | 6.75% | | | 08/15/26 | | | 17,900 | | | | 22,912,000 |
U.S. Treasury Bonds | | | | 8.75% | | | 08/15/20 | | | 13,000 | | | | 18,509,764 |
U.S. Treasury Inflationary Bonds, TIPS | | | | 0.875% | | | 04/15/10 | | | 29,000 | | | | 31,876,087 |
U.S. Treasury Inflationary Bonds, TIPS | | | | 2.00% | | | 04/15/12 | | | 8,400 | | | | 8,963,851 |
U.S. Treasury Inflationary Bonds, TIPS | | | | 2.00% | | | 07/15/14 | | | 17,300 | | | | 19,812,534 |
U.S. Treasury Inflationary Bonds, TIPS | | | | 2.00% | | | 01/15/26 | | | 5,700 | | | | 5,975,960 |
U.S. Treasury Inflationary Bonds, TIPS | | | | 2.375% | | | 04/15/11 | | | 9,100 | | | | 9,984,638 |
U.S. Treasury Inflationary Bonds, TIPS | | | | 2.375% | | | 01/15/17 | | | 10,900 | | | | 11,916,815 |
U.S. Treasury Inflationary Bonds, TIPS | | | | 2.375% | | | 01/15/25 | | | 5,400 | | | | 6,283,864 |
U.S. Treasury Notes | | | | 3.375% | | | 11/30/12 | | | 800 | | | | 797,313 |
U.S. Treasury Notes | | | | 3.75% | | | 05/15/08 | | | 1,100 | | | | 1,101,289 |
U.S. Treasury Notes | | | | 4.25% | | | 09/30/12 | | | 6,100 | | | | 6,313,976 |
U.S. Treasury Notes | | | | 4.25% | | | 11/15/17 | | | 6,200 | | | | 6,308,016 |
U.S. Treasury Notes | | | | 4.50% | | | 02/28/11 | | | 13,050 | | | | 13,593,415 |
U.S. Treasury Notes | | | | 4.50% | | | 02/15/16 | | | 100 | | | | 104,086 |
SEE NOTES TO FINANCIAL STATEMENTS.
A51
| | | | |
| | | SP PIMCO TOTAL RETURN PORTFOLIO (Continued) | | |
SCHEDULE OF INVESTMENTS | December 31, 2007 |
| | | | | | | | | | |
| U.S. TREASURY OBLIGATIONS (continued) | | Interest
Rate
| | Maturity
Date
| | Principal
Amount
(000)#
| | Value
(Note 2)
|
| | | | | | | | | | | |
U.S. Treasury Notes | | 4.625% | | 07/31/12 | | $ | 14,600 | | $ | 15,330,000 |
U.S. Treasury Notes | | 4.75% | | 08/15/17 | | | 42,260 | | | 44,633,829 |
U.S. Treasury Notes | | 4.875% | | 08/15/16 | | | 1,600 | | | 1,703,750 |
U.S. Treasury Notes | | 5.125% | | 05/15/16 | | | 8,700 | | | 9,416,393 |
U.S. Treasury Notes | | 8.125% | | 08/15/19 | | | 6,800 | | | 9,166,189 |
U.S. Treasury Strips | | Zero | | 02/15/22 | | | 7,000 | | | 3,632,223 |
| | | | | | | | | |
|
|
TOTAL U.S. TREASURY OBLIGATIONS
(cost $505,685,264) | | | 510,453,606 |
| | | | | | | | | |
|
|
TOTAL LONG-TERM INVESTMENTS
(cost $2,326,423,186) | | | 2,340,634,029 |
| | | | | | | | | |
|
|
| | | | |
| SHORT-TERM INVESTMENTS — 3.8% | | | | | | Notional
Amount
(000)
| | |
OUTSTANDING OPTIONS PURCHASED* — 1.7% | | | | | | | | | | |
Call Options — 1.7% | | | | | | | | | | |
2 Year U.S. Treasury Note Futures,
expiring 02/22/2008, Strike Price $114.50 | | | | | | $ | 15,200 | | $ | 1,188 |
expiring 02/22/2008, Strike Price $116.00 | | | | | | | 136,200 | | | 10,641 |
expiring 02/22/2008, Strike Price $120.00 | | | | | | | 21,200 | | | 1,656 |
5 Year U.S. Treasury Note Futures,
expiring 02/22/2008, Strike Price $126.00 | | | | | | | 16,700 | | | 2,609 |
expiring 02/22/2008, Strike Price $126.50 | | | | | | | 5,500 | | | 859 |
expiring 02/22/2008, Strike Price $127.00 | | | | | | | 2,700 | | | 422 |
expiring 02/22/2008, Strike Price $134.00 | | | | | | | 92,800 | | | 14,500 |
10 Year Euro-Bund Futures,
expiring 02/22/2008, Strike Price $125.50 | | | | | | EUR | 31,800 | | | 4,649 |
10 Year U.S. Treasury Note Futures,
expiring 02/22/2008, Strike Price $134.00 | | | | | | | 50,000 | | | 7,813 |
expiring 02/22/2008, Strike Price $135.00 | | | | | | | 228,500 | | | 35,703 |
20 Year U.S. Treasury Bond Futures,
expiring 02/22/2008, Strike Price $137.00 | | | | | | | 83,700 | | | 13,078 |
expiring 02/22/2008, Strike Price $139.00 | | | | | | | 61,200 | | | 9,563 |
expiring 02/22/2008, Strike Price $140.00 | | | | | | | 45,000 | | | 7,031 |
expiring 02/22/2008, Strike Price $141.00 | | | | | | | 168,300 | | | 26,297 |
expiring 02/22/2008, Strike Price $150.00 | | | | | | | 200,000 | | | 31,250 |
Currency Option on EUR vs. USD,
expiring 05/19/2010 @ FX Rate 1.37 | | | | | | | 8,400 | | | 960,319 |
Currency Option on USD vs. JPY,
expiring 09/16/2008 @ FX Rate 118.00 | | | | | | | 18,300 | | | 36,069 |
Eurodollar Futures,
expiring 03/17/2008, Strike Price $95.00 | | | | | | | 454,000 | | | 873,950 |
expiring 03/17/2008, Strike Price $95.25 | | | | | | | 1,197,000 | | | 1,571,063 |
expiring 06/16/2008, Strike Price $95.25 | | | | | | | 589,000 | | | 1,483,544 |
FNMA,
expiring 03/05/2008, Strike Price $105.50 | | | | | | | 99,000 | | | 3,267 |
expiring 03/11/2008, Strike Price $104.50 | | | | | | | 13,200 | | | 673 |
GNMA,
expiring 02/13/2008, Strike Price $104.87 | | | | | | | 25,500 | | | 255 |
expiring 03/13/2008, Strike Price $105.00 | | | | | | | 22,000 | | | 968 |
Swap on 3 Month LIBOR,
expiring 05/02/2008 @ 5.75% | | | | | | | 7,800 | | | 925,255 |
expiring 09/19/2008 @ 4.55% | | | | | | | 350,000 | | | 6,366,161 |
expiring 09/26/2008 @ 4.75% | | | | | | | 279,100 | | | 5,917,168 |
expiring 12/19/2008 @ 4.50% | | | | | | | 243,900 | | | 4,160,012 |
expiring 12/31/2008 @ 3.75% | | | | | | | 232,700 | | | 2,005,595 |
| | | | | | | | | |
|
|
| | | | | | | | | | | 24,471,558 |
| | | | | | | | | |
|
|
SEE NOTES TO FINANCIAL STATEMENTS.
A52
| | | | |
| | | SP PIMCO TOTAL RETURN PORTFOLIO (Continued) | | |
SCHEDULE OF INVESTMENTS | December 31, 2007 |
| | | | | | | | | | | | |
| SHORT-TERM INVESTMENTS (continued) | | | | | | | | Notional
Amount
(000)
| | Value
(Note 2)
|
| | | | | | | | | | | | | |
Put Options | | | | | | | | | | | | |
5 Year Euro-Bobl Futures,
expiring 02/22/2008, Strike Price $103.25 | | | | | | | | EUR | 12,600 | | $ | 3,655 |
expiring 02/22/2008, Strike Price $103.50 | | | | | | | | | 50,000 | | | 921 |
10 Year U.S. Treasury Note Futures,
expiring 02/22/2008, Strike Price $102.00 | | | | | | | | | 117,800 | | | 18,406 |
expiring 02/22/2008, Strike Price $103.00 | | | | | | | | | 177,100 | | | 27,672 |
20 Year U.S. Treasury Bond Futures,
expiring 02/22/2008, Strike Price $95.00 | | | | | | | | | 90,000 | | | 14,062 |
expiring 02/22/2008, Strike Price $96.00 | | | | | | | | | 110,000 | | | 17,187 |
Currency Option on EUR vs. USD,
expiring 05/19/2010 @ FX Rate 1.37 | | | | | | | | | 8,400 | | | 342,180 |
Eurodollar Futures,
expiring 03/17/2008, Strike Price $91.75 | | | | | | | | | 1,650,000 | | | 10,313 |
expiring 03/17/2008, Strike Price $92.25 | | | | | | | | | 1,500,000 | | | 9,375 |
expiring 03/17/2008, Strike Price $92.50 | | | | | | | | | 1,080,000 | | | 6,750 |
expiring 06/16/2008, Strike Price $92.50 | | | | | | | | | 402,000 | | | 2,513 |
European Government,
expiring 03/05/2008, Strike Price $86.00 | | | | | | | | | 8,000 | | | 272 |
FNMA
expiring 01/07/2008, Strike Price $81.00 | | | | | | | | | 47,000 | | | — |
expiring 01/07/2008, Strike Price $86.00 | | | | | | | | | 69,000 | | | — |
expiring 02/05/2008, Strike Price $86.44 | | | | | | | | | 28,000 | | | — |
expiring 02/05/2008, Strike Price $88.50 | | | | | | | | | 14,900 | | | 45 |
expiring 02/12/2008, Strike Price $83.31 | | | | | | | | | 35,000 | | | — |
expiring 03/05/2008, Strike Price $85.00 | | | | | | | | | 20,000 | | | 520 |
expiring 03/05/2008, Strike Price $89.00 | | | | | | | | | 100,000 | | | 3,000 |
expiring 03/05/2008, Strike Price $90.00 | | | | | | | | | 48,000 | | | 274 |
expiring 03/05/2008, Strike Price $90.63 | | | | | | | | | 10,000 | | | — |
GNMA,
expiring 02/13/2008, Strike Price $90.00 | | | | | | | | | 18,000 | | | — |
expiring 03/13/2008, Strike Price $82.25 | | | | | | | | | 55,000 | | | 605 |
expiring 03/13/2008, Strike Price $86.00 | | | | | | | | | 40,300 | | | 1,652 |
Swap on 3 Month LIBOR,
expiring 03/19/2008, Strike Price $93.00 | | | | | | | | GBP | 673,500 | | | — |
expiring 05/02/2008 @ 6.25% | | | | | | | | | 4,500 | | | 5,727 |
expiring 06/18/2008, Strike Price $92.50 | | | | | | | | | 311,500 | | | — |
| | | | | | | | | | | |
|
|
| | | | | | | | | | | | | 465,129 |
| | | | | | | | | | | |
|
|
TOTAL OUTSTANDING OPTIONS PURCHASED
(cost $11,693,136) | | | 24,936,687 |
| | | | | | | | | | | |
|
|
| | | | | |
| | | Moody’s
Ratings
(Unaudited)
| | Interest
Rate
| | Maturity
Date
| | Principal
Amount
(000)#
| | |
COMMERCIAL PAPER (n) — 1.0% | | | | | | | | | | | | |
Federal Home Loan Mortgage Corp. Disc. Notes
(cost $13,898,841) | | A1+(d) | | 3.00% | | 01/02/08 | | | 13,900 | | | 13,898,842 |
| | | | | | | | | | | |
|
|
U.S. TREASURY OBLIGATIONS (k)(n) — 0.9% | | | | | | | | | | | | |
U.S. Treasury Bills | | | | 2.803% | | 02/28/08 | | | 20 | | | 19,910 |
U.S. Treasury Bills | | | | 2.85% | | 03/13/08 | | | 730 | | | 725,573 |
U.S. Treasury Bills | | | | 2.91% | | 03/13/08 | | | 1,170 | | | 1,162,904 |
U.S. Treasury Bills | | | | 2.955% | | 03/13/08 | | | 9,240 | | | 9,183,959 |
U.S. Treasury Bills | | | | 2.971% | | 02/28/08 | | | 290 | | | 288,689 |
U.S. Treasury Bills | | | | 3.005% | | 03/13/08 | | | 1,400 | | | 1,391,509 |
| | | | | | | | | | | |
|
|
TOTAL U.S. TREASURY OBLIGATIONS
(cost $12,774,529) | | | 12,772,544 |
| | | | | | | | | | | |
|
|
SEE NOTES TO FINANCIAL STATEMENTS.
A53
| | | | |
| | | SP PIMCO TOTAL RETURN PORTFOLIO (Continued) | | |
SCHEDULE OF INVESTMENTS | December 31, 2007 |
| | | | | | | | | | | | | |
| | | | | | | | | Shares
| | Value
(Note 2)
| |
AFFILIATED MONEY MARKET MUTUAL FUND — 0.2% | | | | | | | | | | | | | |
Dryden Core Investment Fund — Taxable Money Market Series
(cost $2,594,785) (Note 4)(w) | | | | | | | | | 2,594,785 | | $ | 2,594,785 | |
| | | | | | | | | | | |
|
|
|
TOTAL SHORT-TERM INVESTMENTS
(cost $40,961,291) | | | 54,202,858 | |
| | | | | | | | | | | |
|
|
|
TOTAL INVESTMENTS, BEFORE OUTSTANDING OPTIONS WRITTEN AND SECURITIES SOLD SHORT — 168.1%
(cost $2,367,384,477; Note 6) | | | 2,394,836,887 | |
| | | | | | | | | | | |
|
|
|
| | | | | |
| | | | | Interest
Rate
| | Maturity
Date
| | Principal
Amount
(000)#
| | | |
SECURITIES SOLD SHORT — (62.6)% | | | | | | | | | | | | | |
U.S. Government Mortgage Obligations — (19.5)% | | | | | | | | | | | | | |
Federal National Mortgage Assoc. | | | | 5.00% | | TBA | | $ | 146,500 | | | (142,929,063 | ) |
Federal National Mortgage Assoc. | | | | 5.50% | | TBA | | | 13,200 | | | (13,369,118 | ) |
Federal National Mortgage Assoc. | | | | 6.50% | | TBA | | | 93,000 | | | (95,586,516 | ) |
Government National Mortgage Assoc. | | | | 6.00% | | TBA | | | 25,500 | | | (26,105,625 | ) |
| | | | | | | | | | | |
|
|
|
| | | | | | | | | | | | | (277,990,322 | ) |
| | | | | | | | | | | |
|
|
|
U.S. Treasury Obligations — (43.1)% | | | | | | | | | | | | | |
U.S. Treasury Bonds | | | | 4.75% | | 02/15/37 | | | 3,600 | | | (3,767,623 | ) |
U.S. Treasury Bonds | | | | 6.875% | | 08/15/25 | | | 8,000 | | | (10,286,248 | ) |
U.S. Treasury Bonds | | | | 9.00% | | 11/15/18 | | | 950 | | | (1,343,211 | ) |
U.S. Treasury Notes | | | | 3.50% | | 12/15/09 | | | 14,000 | | | (14,118,132 | ) |
U.S. Treasury Notes | | | | 3.625% | | 05/15/13 | | | 1,800 | | | (1,812,375 | ) |
U.S. Treasury Notes | | | | 4.25% | | 11/15/14 | | | 149,100 | | | (153,817,673 | ) |
U.S. Treasury Notes | | | | 4.25% | | 11/15/17 | | | 73,200 | | | (74,475,290 | ) |
U.S. Treasury Notes | | | | 4.375% | | 08/15/12 | | | 81,700 | | | (85,261,630 | ) |
U.S. Treasury Notes | | | | 4.50% | | 05/15/17 | | | 700 | | | (725,539 | ) |
U.S. Treasury Notes | | | | 4.625% | | 02/29/12 | | | 6,700 | | | (7,030,812 | ) |
U.S. Treasury Notes | | | | 4.625% | | 11/15/16 | | | 1,200 | | | (1,256,719 | ) |
U.S. Treasury Notes | | | | 4.625% | | 02/15/17 | | | 147,800 | | | (154,520,318 | ) |
U.S. Treasury Notes | | | | 4.75% | | 05/15/14 | | | 400 | | | (425,344 | ) |
U.S. Treasury Notes | | | | 4.875% | | 04/30/11 | | | 55,400 | | | (58,351,767 | ) |
U.S. Treasury Notes | | | | 4.875% | | 07/31/11 | | | 39,400 | | | (41,579,293 | ) |
U.S. Treasury Notes | | | | 5.125% | | 06/30/11 | | | 5,300 | | | (5,630,837 | ) |
| | | | | | | | | | | |
|
|
|
| | | | | | | | | | | | | (614,402,811 | ) |
| | | | | | | | | | | |
|
|
|
TOTAL SECURITIES SOLD SHORT
(proceeds received $888,413,453) | | | (892,393,133 | ) |
| | | | | | | | | | | |
|
|
|
| | | | | |
| | | | | | | | | Notional
Amount
(000)
| | | |
OUTSTANDING OPTIONS WRITTEN* — (1.2)% | | | | | | | | | | | | | |
Call Options — (1.2)% | | | | | | | | | | | | | |
Swap on 3 Month LIBOR, expiring 09/19/2008 @ 5.05% | | | | | | | | | 116,700 | | | (4,986,254 | ) |
expiring 09/26/2008 @ 4.95% | | | | | | | | | 121,800 | | | (4,512,082 | ) |
expiring 12/19/2008 @ 5.00% | | | | | | | | | 81,300 | | | (3,234,330 | ) |
expiring 12/31/2008 @ 5.22% | | | | | | | | | 77,300 | | | (3,733,868 | ) |
| | | | | | | | | | | |
|
|
|
| | | | | | | | | | | | | (16,466,534 | ) |
| | | | | | | | | | | |
|
|
|
Put Options | | | | | | | | | | | | | |
Currency Option on USD vs JPY, expiring 09/16/2008 @ FX Rate 100.00 | | | | | | | | | 9,100 | | | (95,832 | ) |
| | | | | | | | | | | |
|
|
|
TOTAL OUTSTANDING OPTIONS WRITTEN
(premium received $7,189,460) | | | (16,562,366 | ) |
| | | | | | | | | | | |
|
|
|
TOTAL INVESTMENTS, NET OF OUTSTANDING OPTIONS WRITTEN AND SECURITIES SOLD SHORT — 104.3%
(cost $1,471,781,564) | | | 1,485,881,388 | |
LIABILITIES IN EXCESS OF OTHER ASSETS(x) — (4.3)% | | | (61,099,375 | ) |
| | | | | | | | | | | |
|
|
|
NET ASSETS — 100.0% | | $ | 1,424,782,013 | |
| | | | | | | | | | | |
|
|
|
SEE NOTES TO FINANCIAL STATEMENTS.
A54
| | | | |
| | | SP PIMCO TOTAL RETURN PORTFOLIO (Continued) | | |
SCHEDULE OF INVESTMENTS | December 31, 2007 |
The following abbreviations are used in portfolio descriptions:
144A Security was purchased pursuant to Rule 144A under the securities Act of 1933 and may not be resold subject to that rule except to qualified institutional buyers. Unless otherwise noted, 144A securities are deemed to be liquid.
| | |
| MTN | | Medium Term Note |
| TBA | | Securities Purchased on Forward Commitment Basis |
| TIPS | | Treasury Inflation Protected Securities |
| NR | | Not Rated by Moody’s or Standard & Poor’s |
| AUD | | Australian Dollar |
| BRL | | Brazilian Real |
| CAD | | Canadian Dollar |
| CHF | | Swiss Franc |
| CNY | | Chinese Yuan |
| EUR | | Euro |
| GBP | | British Pound |
| INR | | Indian Rupee |
| JPY | | Japanese Yen |
| KRW | | South Korean Won |
| MXN | | Mexican Peso |
| RUB | | Russian Ruble |
| * | Non-income producing security. |
| # | Principal amount is shown in U.S. dollars unless otherwise stated. |
| (c) | Indicates a variable rate security. |
| (d) | Standard & Poor’s rating. |
| (f) | Represents all or partial amount utilized in the Municipal Tender Option Bond transaction. The aggregated principal amount of the inverse floaters and the floating rate notes (included in liabilities) are $4,787,500 and $4,787,500, respectively. |
| (i) | Represents issuer in default on interest payments. Non-income producing security. |
| (g) | Indicates a security that has been deemed illiquid. |
| (k) | Securities segregated as collateral for futures contracts. |
| (l) | Private Placement restricted as to resale and does not have a readily available market. The aggregate cost of such securities is $127,559,233. The aggregate value of $127,404,190 is approximately 8.9% of net assets. |
| (n) | Rates shown are the effective yields at purchase date. |
| (w) | Prudential Investments LLC, the manager of the Portfolio, also serves as manager of the Dryden Core Investment Fund-Taxable Money Market Series. |
| (x) | Liabilities in excess of other assets includes net unrealized appreciation (depreciation) on futures contracts, forward foreign currency contracts, interest rate and credit default swaps as follows: |
Securities or a portion thereof with an aggregate market value of $12,772,544 have been segregated with the custodian to cover margin requirements for future contracts open at December 31, 2007.
| | | | | | | | | | | | | | |
Number of
Contracts
| | Type
| | Expiration
Date
| | Value at
Trade Date
| | Value at
December 31, 2007
| | Unrealized
Appreciation
(Depreciation)
| |
| Long Positions: | | | | | | | | | | | | | | |
| 300 | | 90 Day Euro Dollar | | Mar 08 | | $ | 71,737,500 | | $ | 71,823,750 | | $ | 86,250 | |
| 4,648 | | 90 Day Euro Dollar | | Jun 08 | | | 1,118,134,500 | | | 1,118,483,100 | | | 348,600 | |
| 742 | | 90 Day Euro Dollar | | Sep 08 | | | 178,970,400 | | | 179,026,050 | | | 55,650 | |
| 789 | | 90 Day Euro Dollar | | Dec 08 | | | 188,467,112 | | | 190,602,675 | | | 2,135,563 | |
| 441 | | 90 Day Euro Dollar | | Mar 09 | | | 105,602,963 | | | 106,534,575 | | | 931,612 | |
| 418 | | 90 Day Euro Dollar | | Jun 09 | | | 99,980,200 | | | 100,852,950 | | | 872,750 | |
| 102 | | 90 Day Euro Dollar | | Sep 09 | | | 24,346,125 | | | 24,569,250 | | | 223,125 | |
| 154 | | 90 Day Euro Dollar | | Dec 09 | | | 36,717,450 | | | 37,029,300 | | | 311,850 | |
| 1,625 | | 90 Day Euro EURIBOR | | Jun 08 | | | 567,630,708 | | | 567,646,425 | | | 15,717 | |
| 968 | | 90 Day Euro EURIBOR | | Sep 08 | | | 338,066,877 | | | 338,425,662 | | | 358,785 | |
| 75 | | 90 Day Euro EURIBOR | | Dec 08 | | | 26,267,599 | | | 26,240,186 | | | (27,413 | ) |
| 444 | | 90 Day Euro EURIBOR | | Dec 09 | | | 155,634,019 | | | 155,455,502 | | | (178,517 | ) |
| 395 | | 90 Day Sterling | | Sep 08 | | | 93,002,403 | | | 93,342,299 | | | 339,896 | |
| 42 | | 90 Day Sterling | | Dec 08 | | | 9,914,553 | | | 9,942,770 | | | 28,217 | |
| 712 | | 5 Year Euro-Bobl | | Mar 08 | | | 113,932,804 | | | 112,363,525 | | | (1,569,279 | ) |
| 3,441 | | 10 Year U.S. Treasury Notes | | Mar 08 | | | 387,711,110 | | | 390,177,141 | | | 2,466,031 | |
| | | | | | | | | | | | |
|
|
|
| | | | | | | | | | | | | | 6,398,837 | |
| | | | | | | | | | | | |
|
|
|
SEE NOTES TO FINANCIAL STATEMENTS.
A55
| | | | |
| | | SP PIMCO TOTAL RETURN PORTFOLIO (Continued) | | |
SCHEDULE OF INVESTMENTS | December 31, 2007 |
| | | | | | | | | | | | | | |
Number of
Contracts
| | Type
| | Expiration
Date
| | Value at
Trade Date
| | Value at
December 31, 2007
| | Unrealized
Appreciation
(Depreciation)
| |
| Short Positions: | | | | | | | | | | | | | | |
| 825 | | 2 Year U.S. Treasury Notes | | Mar 08 | | $ | 172,822,031 | | $ | 173,456,250 | | $ | (634,219 | ) |
| 1,272 | | 5 Year U.S. Treasury Notes | | Mar 08 | | | 139,598,070 | | | 140,277,750 | | | (679,680 | ) |
| 318 | | 10 Year Euro-Bund | | Mar 08 | | | 53,597,868 | | | 52,588,535 | | | 1,009,333 | |
| 6,372 | | 20 Year U.S. Treasury Notes | | Mar 08 | | | 743,112,266 | | | 741,541,500 | | | 1,570,766 | |
| | | | | | | | | | | | |
|
|
|
| | | | | | | | | | | | | | 1,266,200 | |
| | | | | | | | | | | | |
|
|
|
| | | | | | | | | | | | | $ | 7,665,037 | |
| | | | | | | | | | | | |
|
|
|
Forward foreign currency exchange contracts outstanding at December 31, 2007:
| | | | | | | | | | | | | |
Purchase Contracts
| | Notional
Amount
(000)
| | Value at
Settlement Date
Payable
| | Current
Value
| | Unrealized
Appreciation
(Depreciation)
| |
| Brazilian Real, | | | | | | | | | | | | | |
| Expiring 03/04/08 | | BRL | 36,108 | | $ | 18,167,351 | | $ | 20,093,085 | | $ | 1,925,734 | |
| Expiring 07/02/08 | | | 12,860 | | | 6,727,000 | | | 7,030,147 | | | 303,147 | |
| British Pound, | | | | | | | | | | | | | |
| Expiring 01/31/08 | | GBP | 1,601 | | | 3,185,157 | | | 3,184,026 | | | (1,131 | ) |
| Canadian Dollar | | | | | | | | | | | | | |
| Expiring 01/31/08 | | CAD | 790 | | | 783,897 | | | 800,768 | | | 16,871 | |
| Chinese Yuan, | | | | | | | | | | | | | |
| Expiring 02/27/08 | | CNY | 83,615 | | | 11,573,000 | | | 11,563,345 | | | (9,655 | ) |
| Expiring 07/02/08 | | | 203,280 | | | 28,000,000 | | | 28,956,806 | | | 956,806 | |
| Indian Rupee, | | | | | | | | | | | | | |
| Expiring 05/12/08 | | INR | 1,636,869 | | | 39,794,821 | | | 41,286,886 | | | 1,492,065 | |
| Mexican Peso, | | | | | | | | | | | | | |
| Expiring 03/13/08 | | MXN | 62,170 | | | 5,454,000 | | | 5,667,159 | | | 213,159 | |
| Russian Ruble, | | | | | | | | | | | | | |
| Expiring 01/11/08 | | RUB | 750,085 | | | 29,000,000 | | | 30,566,745 | | | 1,566,745 | |
| Expiring 07/10/08 | | | 570,459 | | | 22,500,000 | | | 23,164,421 | | | 664,421 | |
| Expiring 11/19/08 | | | 393,645 | | | 15,953,191 | | | 15,868,816 | | | (84,375 | ) |
| South Korean Won, | | | | | | | | | | | | | |
| Expiring 01/30/08 | | KRW | 11,522,462 | | | 12,661,321 | | | 12,339,986 | | | (321,335 | ) |
| Swiss Franc, | | | | | | | | | | | | | |
| Expiring 03/06/08 | | CHF | 7,000 | | | 6,240,249 | | | 6,206,973 | | | (33,276 | ) |
| | | | | |
|
| |
|
| |
|
|
|
| | | | | | $ | 200,039,987 | | $ | 206,729,163 | | $ | 6,689,176 | |
| | | | | |
|
| |
|
| |
|
|
|
| | | | | | | | | | | | | |
Sale Contracts
| | Notional
Amount
(000)
| | Value at
Settlement Date
Receivable
| | Current
Value
| | Unrealized
Appreciation
(Depreciation)
| |
| British Pound, | | | | | | | | | | | | | |
| Expiring 01/03/08 | | GBP | 1,601 | | $ | 3,187,495 | | $ | 3,186,958 | | $ | 537 | |
| Expiring 01/31/08 | | | 23,488 | | | 47,067,666 | | | 46,712,309 | | | 355,357 | |
| Euros, | | | | | | | | | | | | | |
| Expiring 01/17/08 | | EUR | 8,653 | | | 12,656,694 | | | 12,655,034 | | | 1,660 | |
| Mexican Peso, | | | | | | | | | | | | | |
| Expiring 03/13/08 | | MXN | 62,170 | | | 5,631,303 | | | 5,667,159 | | | (35,856 | ) |
| Russian Ruble, | | | | | | | | | | | | | |
| Expiring 01/11/08 | | RUB | 750,085 | | | 30,113,180 | | | 30,566,745 | | | (453,565 | ) |
| | | | | |
|
| |
|
| |
|
|
|
| | | | | | $ | 98,656,338 | | $ | 98,788,205 | | $ | (131,867 | ) |
| | | | | |
|
| |
|
| |
|
|
|
SEE NOTES TO FINANCIAL STATEMENTS.
A56
| | | | |
| | | SP PIMCO TOTAL RETURN PORTFOLIO (Continued) | | |
SCHEDULE OF INVESTMENTS | December 31, 2007 |
Interest rate swap agreements outstanding at December 31, 2007:
| | | | | | | | | | | | | | |
Counterparty
| | Termination
Date
| | Notional
Amount#
| | Fixed
Rate
| | | Floating Rate
| | Unrealized
Appreciation
(Depreciation)
| |
Barclays Capital(1) | | 06/18/10 | | $ | 45,800,000 | | 4.00 | % | | 3 month LIBOR | | $ | 97,555 | |
Barclays Capital(1) | | 06/18/13 | | | 170,900,000 | | 4.00 | % | | 3 month LIBOR | | | 1,030,912 | |
Barclays Capital(1) | | 06/18/10 | | | 11,900,000 | | 5.00 | % | | 3 month LIBOR | | | 44,452 | |
Barclays Capital(2) | | 06/18/38 | | | 26,000,000 | | 5.00 | % | | 3 month LIBOR | | | (299,581 | ) |
Citigroup(2) | | 06/20/17 | | | 30,000,000 | | 5.00 | % | | 3 month LIBOR | | | (584,266 | ) |
Deutsche Bank(1) | | 06/18/10 | | | 25,500,000 | | 4.00 | % | | 3 month LIBOR | | | 82,672 | |
Deutsche Bank(1) | | 06/18/15 | | | 30,700,000 | | 5.00 | % | | 3 month LIBOR | | | (45,869 | ) |
Deutsche Bank(2) | | 06/18/38 | | | 46,600,000 | | 5.00 | % | | 3 month LIBOR | | | (1,306,737 | ) |
Merrill Lynch & Co.(1) | | 12/17/10 | | | 73,700,000 | | 4.00 | % | | 3 month LIBOR | | | 111,216 | |
Morgan Stanley Capital Services, Inc.(1) | | 06/18/18 | | | 168,800,000 | | 5.00 | % | | 3 month LIBOR | | | 3,071,999 | |
Morgan Stanley Capital Services, Inc.(1) | | 06/18/10 | | | 13,700,000 | | 4.00 | % | | 3 month LIBOR | | | 60,466 | |
Morgan Stanley Capital Services, Inc.(1) | | 06/18/13 | | | 330,800,000 | | 4.00 | % | | 3 month LIBOR | | | 2,491,631 | |
Morgan Stanley Capital Services, Inc.(2) | | 06/18/38 | | | 44,800,000 | | 5.00 | % | | 3 month LIBOR | | | (1,268,344 | ) |
Citigroup(1) | | 04/15/09 | | AUD | 82,000,000 | | 7.00 | % | | 3 month Australian Bank Bill rate | | | (487,194 | ) |
Morgan Stanley Capital Services, Inc.(1) | | 12/15/09 | | AUD | 38,600,000 | | 7.00 | % | | 6 month Australian Bank Bill rate | | | (243,206 | ) |
Goldman Sachs(1) | | 01/02/12 | | BRL | 136,200,000 | | 10.15 | % | | Brazilian interbank lending rate | | | (4,813,267 | ) |
Morgan Stanley Capital Services, Inc.(1) | | 01/02/12 | | | 240,800,000 | | 10.12 | % | | Brazilian interbank lending rate | | | (7,247,624 | ) |
UBS AG(1) | | 01/02/12 | | | 52,800,000 | | 10.58 | % | | Brazilian interbank lending rate | | | (1,340,247 | ) |
Citigroup(1) | | 03/21/09 | | EUR | 4,000,000 | | 4.00 | % | | 6 month EURIBOR | | | (46,992 | ) |
Deutsche Bank(1) | | 06/18/34 | | | 9,400,000 | | 5.00 | % | | 6 month EURIBOR | | | (63,989 | ) |
UBS AG(1) | | 10/15/10 | | | 1,400,000 | | 2.15 | % | | FRC - Excluding Tobacco -Non-Revised Consumer Price Index | | | 15,910 | |
Barclays Capital(1) | | 09/15/10 | | GBP | 23,200,000 | | 5.00 | % | | 6 month LIBOR | | | (86,114 | ) |
Deutsche Bank(1) | | 09/15/10 | | | 6,900,000 | | 5.00 | % | | 6 month LIBOR | | | 123,258 | |
Goldman Sachs(1) | | 09/15/15 | | | 2,000,000 | | 5.00 | % | | 6 month LIBOR | | | (28,914 | ) |
Morgan Stanley Capital Services, Inc.(1) | | 09/18/09 | | | 49,200,000 | | 6.00 | % | | 6 month LIBOR | | | 714,219 | |
Barclays Capital(2) | | 06/20/17 | | JPY | 340,000,000 | | 2.00 | % | | 6 month LIBOR | | | (9,575 | ) |
UBS AG(2) | | 06/20/17 | | | 830,000,000 | | 2.00 | % | | 6 month LIBOR | | | (59,072 | ) |
Citigroup(1) | | 05/14/09 | | MXN | 525,000,000 | | 7.91 | % | | 28 day Mexican interbank rate | | | (206,199 | ) |
| | | | | | | | | | | | |
|
|
|
| | | | | | | | | | | | | $ | (10,292,900 | ) |
| | | | | | | | | | | | |
|
|
|
| (1) | Portfolio pays the floating rate and receives the fixed rate. |
| (2) | Portfolio pays the fixed rate and receives the floating rate. |
| # | Notional Amount is shown in U.S. dollars unless otherwise stated. |
Credit default swap agreements outstanding at December 31, 2007:
| | | | | | | | | | | | | | |
Counterparty
| | Termination
Date
| | Notional
Amount#
| | Fixed
Rate
| | | Reference Entity/Obligation
| | Unrealized
Appreciation
(Depreciation)
| |
Barclays Bank PLC(1) | | 06/20/12 | | $ | 1,300,000 | | 0.16 | % | | Aetna, Inc., 7.875%, due 03/01/11 | | $ | 13,963 | |
Morgan Stanley & Co.(1) | | 12/20/08 | | | 2,700,000 | | 0.26 | % | | Allstate Corp., 6.125%, due 02/15/12 | | | (2,344 | ) |
Morgan Stanley & Co.(1) | | 12/20/08 | | | 300,000 | | 0.26 | % | | Allstate Corp., 6.125%, due 02/15/12 | | | (277 | ) |
Goldman Sachs(2) | | 03/20/08 | | | 10,000,000 | | 0.05 | % | | American Intl. Group, 5.60%, due 10/18/16 | | | (12,991 | ) |
Merrill Lynch & Co.(1) | | 12/20/08 | | | 800,000 | | 0.27 | % | | Anadarko Petroleum Corp., 5.00%, due 10/01/12 | | | (519 | ) |
UBS AG(1) | | 12/20/08 | | | 3,200,000 | | 0.35 | % | | AutoZone, Inc., 5.875%, due 10/15/12 | | | (6,843 | ) |
Goldman Sachs(1) | | 03/20/12 | | | 2,300,000 | | 0.40 | % | | AutoZone, Inc., 5.875%, due 10/15/12 | | | (2,923 | ) |
Barclays Bank PLC(1) | | 06/20/12 | | | 1,300,000 | | 0.15 | % | | Baker Hughes, Inc., 6.00%, due 02/15/09 | | | 6,965 | |
Bank of America Securities LLC(1) | | 12/20/12 | | | 1,400,000 | | 0.47 | % | | Black & Decker Corp., 4.75%, due 11/01/14 | | | 20,232 | |
Barclays Bank PLC(1) | | 07/12/43 | | | 1,946,000 | | 3.30 | % | | Camber 6A, 8.758%, due 07/12/43 | | | 1,648,953 | |
Bear Stearns International Ltd.(1) | | 12/20/08 | | | 400,000 | | 1.09 | % | | Capital One Bank, 4.875%, due 05/15/08 | | | 4,736 | |
Bear Stearns International Ltd.(1) | | 12/20/08 | | | 100,000 | | 1.09 | % | | Capital One Bank, 4.875%, due 05/15/08 | | | 1,012 | |
UBS AG(1) | | 12/20/08 | | | 800,000 | | 0.44 | % | | Carnival Corp., 6.15%, due 04/15/08 | | | (2,367 | ) |
Bear Stearns International Ltd.(1) | | 12/20/08 | | | 800,000 | | 0.19 | % | | Caterpillar, Inc., 7.25%, due 09/15/09 | | | (648 | ) |
SEE NOTES TO FINANCIAL STATEMENTS.
A57
| | | | |
| | | SP PIMCO TOTAL RETURN PORTFOLIO (Continued) | | |
SCHEDULE OF INVESTMENTS | December 31, 2007 |
| | | | | | | | | | | | | | |
Counterparty
| | Termination
Date
| | Notional
Amount#
| | Fixed
Rate
| | | Reference Entity/Obligation
| | Unrealized
Appreciation
(Depreciation)
| |
Lehman Brothers, Inc.(1) | | 09/20/12 | | $ | 1,700,000 | | 0.60 | % | | CBS Corp., 4.625%, due 05/15/18 | | $ | 5,140 | |
Barclays Bank PLC(1) | | 06/20/12 | | | 1,300,000 | | 0.17 | % | | Cigna Corp., 6.375%, due 10/15/11 | | | 13,425 | |
Barclays Bank PLC(1) | | 06/20/15 | | | 700,000 | | 0.15 | % | | CitiFinancial, 6.625%, due 06/01/15 | | | 26,501 | |
Bank of America Securities LLC(1) | | 12/20/12 | | | 1,400,000 | | 0.33 | % | | Clorox Co., 6.125%, due 02/01/11 | | | 9,606 | |
Lehman Brothers, Inc.(1) | | 12/20/08 | | | 700,000 | | 0.24 | % | | Costco Wholesale Corp., 5.50%, due 03/15/07 | | | (1,423 | ) |
Lehman Brothers, Inc.(1) | | 12/20/08 | | | 100,000 | | 0.24 | % | | Costco Wholesale Corp., 5.50%, due 03/15/07 | | | (224 | ) |
Morgan Stanley & Co.(1) | | 09/20/11 | | | 3,800,000 | | 0.24 | % | | CVS Corp., 5.75%, due 08/15/11 | | | 9,567 | |
Barclays Bank PLC(1) | | 09/20/11 | | | 3,400,000 | | 0.58 | % | | DaimlerChrysler NA, 5.75%, due 09/08/11 | | | (20,209 | ) |
Bear Stearns International Ltd.(1) | | 12/20/08 | | | 800,000 | | 0.24 | % | | Deere & Co., 7.85%, due 05/15/10 | | | (958 | ) |
Merrill Lynch & Co.(1) | | 12/20/08 | | | 1,600,000 | | 0.35 | % | | Devon Energy Corp., 6.875%, due 09/30/11 | | | (4,222 | ) |
Bank of America Securities LLC(2) | | 06/20/12 | | | 16,900,000 | | 0.75 | % | | Dow Jones CDX HVOL-8 Index | | | (307,771 | ) |
Lehman Brothers, Inc.(1) | | 12/20/11 | | | 7,800,000 | | 0.00 | % | | Dow Jones CDX HY-7 Index | | | 276,982 | |
Merrill Lynch & Co.(1) | | 12/20/11 | | | 2,500,000 | | 0.00 | % | | Dow Jones CDX HY-7 Index | | | 97,535 | |
Bank of America Securities LLC(1) | | 06/20/12 | | | 16,200,000 | | 2.75 | % | | Dow Jones CDX HY-8 Index | | | 82,788 | |
Citigroup(2) | | 06/20/12 | | | 84,900,000 | | 0.47 | % | | Dow Jones CDX HY-8 Index | | | (1,219,195 | ) |
Citigroup(2) | | 06/20/12 | | | 28,200,000 | | 2.11 | % | | Dow Jones CDX HY-8 Index | | | (393,448 | ) |
Citigroup(2) | | 06/20/12 | | | 10,700,000 | | 2.14 | % | | Dow Jones CDX HY-8 Index | | | (132,364 | ) |
Citigroup(2) | | 06/20/12 | | | 2,700,000 | | 2.18 | % | | Dow Jones CDX HY-8 Index | | | (29,568 | ) |
Merrill Lynch & Co.(1) | | 06/20/12 | | | 28,200,000 | | 2.75 | % | | Dow Jones CDX HY-8 Index | | | 791,219 | |
Merrill Lynch & Co.(2) | | 06/20/12 | | | 15,400,000 | | 2.08 | % | | Dow Jones CDX HY-8 Index | | | (227,976 | ) |
UBS AG(1) | | 06/20/12 | | | 27,600,000 | | 2.75 | % | | Dow Jones CDX HY-8 Index | | | 180,104 | |
Morgan Stanley & Co.(1) | | 12/20/12 | | | 11,400,000 | | 0.14 | % | | Dow Jones CDX IG5 Index | | | 346,368 | |
Morgan Stanley & Co.(1) | | 12/20/12 | | | 26,700,000 | | 0.14 | % | | Dow Jones CDX IG5 Index | | | 811,229 | |
Morgan Stanley & Co.(2) | | 12/20/15 | | | 8,140,000 | | 0.46 | % | | Dow Jones CDX IG5 Index | | | (337,887 | ) |
Morgan Stanley & Co.(2) | | 12/20/15 | | | 19,000,000 | | 0.46 | % | | Dow Jones CDX IG5 Index | | | (782,324 | ) |
Barclays Bank PLC(1) | | 12/20/11 | | | 1,000,000 | | 0.75 | % | | Dow Jones CDX IG7 Index | | | 38,571 | |
Bank of America Securities LLC(1) | | 12/20/16 | | | 2,300,000 | | 0.65 | % | | Dow Jones CDX IG7 Index | | | 65,683 | |
Morgan Stanley & Co.(1) | | 12/20/16 | | | 13,500,000 | | 0.65 | % | | Dow Jones CDX IG7 Index | | | 389,139 | |
Bank of America Securities LLC(1) | | 06/20/12 | | | 142,900,000 | | 0.35 | % | | Dow Jones CDX IG8 Index | | | 2,144,815 | |
Lehman Brothers, Inc.(1) | | 06/20/12 | | | 14,900,000 | | 0.35 | % | | Dow Jones CDX IG8 Index | | | 149,995 | |
Morgan Stanley & Co.(1) | | 06/20/12 | | | 168,000,000 | | 0.17 | % | | Dow Jones CDX IG8 Index | | | 6,593 | |
Barclays Bank PLC(2) | | 06/20/17 | | | 57,400,000 | | 0.60 | % | | Dow Jones CDX IG8 Index | | | (468,548 | ) |
Barclays Bank PLC(1) | | 06/20/12 | | | 1,300,000 | | 0.09 | % | | Duke Energy, 7.375%, due 03/01/10 | | | 14,551 | |
Bank of America Securities LLC(1) | | 12/20/08 | | | 1,700,000 | | 0.13 | % | | E.I. DuPont de Nemours & Co.,
6.875%, due 10/15/09 | | | (849 | ) |
Bank of America Securities LLC(1) | | 12/20/08 | | | 200,000 | | 0.13 | % | | E.I. DuPont, 6.875%, due 10/15/09 | | | (123 | ) |
Citigroup(1) | | 12/20/08 | | | 2,200,000 | | 0.28 | % | | Eaton Corp., 5.75%, due 07/15/12 | | | (2,628 | ) |
Citigroup(1) | | 12/20/08 | | | 300,000 | | 0.28 | % | | Eaton Corp., 5.75%, due 07/15/12 | | | (201 | ) |
Barclays Bank PLC(1) | | 12/20/08 | | | 2,300,000 | | 0.16 | % | | Eli Lilly & Co., 6.00%, due 03/15/12 | | | (2,836 | ) |
Barclays Bank PLC(1) | | 12/20/08 | | | 300,000 | | 0.16 | % | | Eli Lilly & Co., 6.00%, due 03/15/12 | | | (272 | ) |
Morgan Stanley & Co.(1) | | 12/20/08 | | | 1,600,000 | | 0.21 | % | | Emerson Electric Co., 4.625%, due 10/15/12 | | | (2,027 | ) |
Morgan Stanley & Co.(1) | | 12/20/08 | | | 200,000 | | 0.21 | % | | Emerson Electric Co., 4.625%, due 10/15/12 | | | (214 | ) |
Morgan Stanley & Co.(1) | | 12/20/08 | | | 800,000 | | 0.22 | % | | Emerson Electric Co., 7.125%, due 08/15/10 | | | (1,094 | ) |
Bear Stearns International Ltd.(1) | | 10/05/46 | | | 4,300,000 | | 1.55 | % | | ESP Funding Ltd., 6.74%, due 10/05/46(3) | | | 3,078,762 | |
Citigroup(1) | | 12/20/08 | | | 1,700,000 | | 0.29 | % | | FedEx Corp., 7.25%, due 02/15/11 | | | (1,140 | ) |
Citigroup(1) | | 12/20/08 | | | 200,000 | | 0.29 | % | | FedEx Corp., 7.25%, due 02/15/11 | | | (61 | ) |
Merrill Lynch & Co.(1) | | 12/20/08 | | | 600,000 | | 0.22 | % | | Gannett Co., Inc., 6.375%, due 04/01/12 | | | 981 | |
Deutsche Bank(1) | | 09/20/16 | | | 2,400,000 | | 0.51 | % | | Goodrich Corp., 6.29%, due 07/01/16 | | | (29,159 | ) |
Lehman Brothers, Inc.(1) | | 12/20/08 | | | 900,000 | | 0.97 | % | | Goodrich Corp., 7.625%, due 12/15/12 | | | (7,930 | ) |
Lehman Brothers, Inc.(1) | | 12/20/08 | | | 100,000 | | 0.97 | % | | Goodrich Corp., 7.625%, due 12/15/12 | | | (596 | ) |
Lehman Brothers, Inc.(1) | | 06/20/12 | | | 1,300,000 | | 0.12 | % | | Hartford Financial Services Group,
4.75%, due 03/01/14 | | | 12,654 | |
Lehman Brothers, Inc.(1) | | 12/20/08 | | | 2,200,000 | | 0.12 | % | | Home Depot, Inc., 5.375%, due 04/01/06 | | | 9,527 | |
Lehman Brothers, Inc.(1) | | 12/20/08 | | | 300,000 | | 0.12 | % | | Home Depot, Inc., 5.375%, due 04/01/06 | | | 973 | |
Bear Stearns International Ltd.(1) | | 12/20/08 | | | 2,200,000 | | 0.32 | % | | H-P Co., 6.50%, due 07/01/12 | | | (5,145 | ) |
Bear Stearns International Ltd.(1) | | 12/20/08 | | | 300,000 | | 0.32 | % | | H-P Co., 6.50%, due 07/01/12 | | | (585 | ) |
Merrill Lynch & Co.(1) | | 12/20/08 | | | 1,400,000 | | 0.32 | % | | Ingersoll-Rand Corp., 6.48%, due 06/01/25 | | | (2,465 | ) |
Barclays Bank PLC(1) | | 03/20/12 | | | 1,500,000 | | 0.17 | % | | International Lease Finance Corp.,
5.40%, due 02/15/12 | | | 20,785 | |
SEE NOTES TO FINANCIAL STATEMENTS.
A58
| | | | |
| | | SP PIMCO TOTAL RETURN PORTFOLIO (Continued) | | |
SCHEDULE OF INVESTMENTS | December 31, 2007 |
| | | | | | | | | | | | | | |
Counterparty
| | Termination
Date
| | Notional
Amount#
| | Fixed
Rate
| | | Reference Entity/Obligation
| | Unrealized
Appreciation
(Depreciation)
| |
Barclays Bank PLC(1) | | 12/20/12 | | $ | 2,000,000 | | 0.48 | % | | International Paper Co., 5.85%, due 10/30/12 | | $ | 3,980 | |
Barclays Bank PLC(1) | | 12/20/12 | | | 8,500,000 | | 0.47 | % | | International Paper Co., 5.85%, due 10/30/12 | | | 20,940 | |
Bear Stearns International Ltd.(1) | | 12/20/08 | | | 800,000 | | 0.60 | % | | International Paper Co., 6.75%, due 09/01/11 | | | (2,965 | ) |
Bear Stearns International Ltd.(1) | | 08/04/46 | | | 5,000,000 | | 1.35 | % | | Ipswich Street CDO Ltd., 6.23%, due 08/04/46(3) | | | 3,713,025 | |
Barclays Bank PLC(1) | | 03/20/11 | | | 1,000,000 | | 0.37 | % | | iStar Financial, Inc., 5.80%, due 03/15/11 | | | 109,869 | |
Bear Stearns International Ltd.(1) | | 12/20/13 | | | 400,000 | | 0.56 | % | | iStar Financial, Inc., 5.95%, due 10/15/13 | | | 56,259 | |
Lehman Brothers, Inc.(1) | | 12/20/08 | | | 2,100,000 | | 0.11 | % | | Johnson & Johnson, 3.80%, due 05/15/13 | | | (1,166 | ) |
Lehman Brothers, Inc.(1) | | 12/20/08 | | | 300,000 | | 0.11 | % | | Johnson & Johnson, 3.80%, due 05/15/13 | | | (201 | ) |
Lehman Brothers, Inc.(1) | | 12/20/12 | | | 900,000 | | 0.44 | % | | Kohls Corp., 6.30%, due 03/01/11 | | | 16,238 | |
Morgan Stanley & Co.(1) | | 03/20/13 | | | 5,000,000 | | 0.56 | % | | Kroger Co., 5.50%, due 02/01/13 | | | (45,744 | ) |
Deutsche Bank(1) | | 12/20/11 | | | 5,000,000 | | 0.66 | % | | Lennar Corp., 5.95%, due 10/17/11 | | | 839,928 | |
Goldman Sachs(1) | | 06/20/17 | | | 3,600,000 | | 0.95 | % | | Liz Claiborne, Inc., 5.00%, due 07/08/13 | | | 268,155 | |
Goldman Sachs(1) | | 06/20/17 | | | 600,000 | | 0.95 | % | | Liz Claiborne, Inc., 5.00%, due 07/08/13 | | | 44,692 | |
Lehman Brothers, Inc.(1) | | 12/20/08 | | | 900,000 | | 0.53 | % | | Lockheed Martin Corp., 8.20%, due 12/01/09 | | | (4,111 | ) |
Lehman Brothers, Inc.(1) | | 12/20/08 | | | 100,000 | | 0.53 | % | | Lockheed Martin Corp., 8.20%, due 12/01/09 | | | (487 | ) |
Bear Stearns International Ltd.(1) | | 03/20/16 | | | 3,100,000 | | 0.28 | % | | Loews Corp., 5.25%, due 03/15/16 | | | 25,770 | |
Barclays Bank PLC(1) | | 06/20/12 | | | 1,300,000 | | 0.12 | % | | Loews Corp., 8.875%, due 04/15/11 | | | 6,183 | |
Goldman Sachs(1) | | 02/25/34 | | | 1,355,338 | | 2.00 | % | | Long Beach Mortgage Loan Trust 2004-1,
7.34% , due 02/25/34(3) | | | 479,481 | |
Merrill Lynch & Co.(2) | | 02/25/34 | | | 1,355,338 | | 2.25 | % | | Long Beach Mortgage Loan Trust 2004-1,
7.34% , due 02/25/34(3) | | | (474,719 | ) |
Lehman Brothers, Inc.(1) | | 12/20/08 | | | 1,200,000 | | 0.30 | % | | Masco Corp., 5.875%, due 07/15/12 | | | 13,628 | |
Lehman Brothers, Inc.(1) | | 12/20/08 | | | 100,000 | | 0.30 | % | | Masco Corp., 5.875%, due 07/15/12 | | | 1,114 | |
Lehman Brothers, Inc.(1) | | 09/20/17 | | | 5,000,000 | | 1.02 | % | | Masco Corp., 5.875%, due 07/15/12 | | | 148,089 | |
Bear Stearns International Ltd.(1) | | 07/27/48 | | | 4,773,691 | | 1.40 | % | | Mercury CDO, Ltd., 6.41%, due 07/27/48(3) | | | 3,416,597 | |
Merrill Lynch & Co.(1) | | 12/20/08 | | | 1,200,000 | | 0.85 | % | | Motorola, Inc., 7.625%, due 11/15/10 | | | (5,566 | ) |
Goldman Sachs(1) | | 03/20/12 | | | 2,300,000 | | 0.26 | % | | Newell Rubbermaid, Inc., 6.75%, due 03/15/12 | | | 2,566 | |
UBS AG(1) | | 06/20/17 | | | 800,000 | | 0.48 | % | | Newell Rubbermaid, Inc., 6.75%, due 03/15/12 | | | 2,005 | |
Bear Stearns International Ltd.(1) | | 12/20/12 | | | 1,800,000 | | 0.29 | % | | Nordstrom, Inc., 6.95%, due 03/15/28 | | | 20,341 | |
Lehman Brothers, Inc.(1) | | 12/20/08 | | | 900,000 | | 0.48 | % | | Northrop & Grumman Corp., 7.125%, due 02/15/11 | | | (3,805 | ) |
Lehman Brothers, Inc.(1) | | 12/20/08 | | | 100,000 | | 0.48 | % | | Northrop & Grumman Corp., 7.125%, due 02/15/11 | | | (481 | ) |
Merrill Lynch & Co.(1) | | 12/20/08 | | | 800,000 | | 0.28 | % | | Occidental Petroleum Corp., 6.75%, due 01/15/12 | | | (775 | ) |
Lehman Brothers, Inc.(1) | | 06/20/09 | | | 6,600,000 | | 0.40 | % | | People’s Republic of China, 6.80%, due 05/23/11 | | | (20,036 | ) |
Barclays Bank PLC(1) | | 06/20/12 | | | 1,300,000 | | 0.09 | % | | Progress Energy, Inc., 5.625%, due 01/15/16 | | | 12,643 | |
Merrill Lynch & Co.(1) | | 04/15/20 | | | 1,800,000 | | 1.95 | % | | Race Point CLO, 7.01%, due 04/15/20 | | | 255,877 | |
Merrill Lynch & Co.(1) | | 04/15/20 | | | 2,500,000 | | 4.05 | % | | Race Point CLO, 9.61%, due 04/15/20 | | | 427,503 | |
Lehman Brothers, Inc.(1) | | 12/20/08 | | | 1,200,000 | | 0.35 | % | | RadioShack Corp., 7.375%, due 05/15/11 | | | 5,120 | |
Lehman Brothers, Inc.(1) | | 12/20/08 | | | 100,000 | | 0.35 | % | | RadioShack Corp., 7.375%, due 05/15/11 | | | 324 | |
UBS AG(1) | | 12/20/08 | | | 800,000 | | 0.37 | % | | RadioShack Corp., 7.375%, due 05/15/11 | | | 3,254 | |
JPMorgan Chase Bank(1) | | 05/20/16 | | | 7,100,000 | | 0.54 | % | | Republic of Hungary, 4.75%, due 02/03/15 | | | 52,648 | |
Morgan Stanley & Co.(1) | | 05/20/16 | | | 15,900,000 | | 0.54 | % | | Republic of Hungary, 4.75%, due 02/03/15 | | | 123,425 | |
Lehman Brothers, Inc.(1) | | 09/20/10 | | | 400,000 | | 2.26 | % | | Republic of Turkey, 11.875%, due 01/15/30 | | | (15,298 | ) |
Morgan Stanley & Co.(1) | | 09/20/10 | | | 1,700,000 | | 2.70 | % | | Republic of Turkey, 11.875%, due 01/15/30 | | | (85,989 | ) |
Lehman Brothers, Inc.(1) | | 10/20/10 | | | 2,500,000 | | 2.11 | % | | Republic of Turkey, 11.875%, due 01/15/30 | | | (81,008 | ) |
Morgan Stanley & Co.(2) | | 06/20/08 | | | 1,500,000 | | 0.25 | % | | Russian Federation, 7.50%, due 03/31/30 | | | (1,858 | ) |
Citigroup(1) | | 03/20/12 | | | 2,300,000 | | 0.34 | % | | Safeway, Inc. 5.80%, 08/15/12 | | | (6,471 | ) |
Barclays Bank PLC(1) | | 12/20/12 | | | 3,000,000 | | 0.35 | % | | Safeway, Inc. 5.80%, 08/15/12 | | | (4,008 | ) |
Merrill Lynch & Co.(1) | | 12/15/19 | | | 1,600,000 | | 1.88 | % | | Saratoga CLO, Ltd., 6.84%, due 12/15/19 | | | 215,282 | |
Merrill Lynch & Co.(1) | | 12/15/19 | | | 2,500,000 | | 3.78 | % | | Saratoga CLO, Ltd., 8.81%, due 12/15/19 | | | 241,311 | |
Barclays Bank PLC(1) | | 06/20/12 | | | 1,300,000 | | 0.12 | % | | Schlumberger Limited, 1.50%, due 06/01/23 | | | 8,899 | |
Morgan Stanley & Co.(1) | | 09/20/13 | | | 1,600,000 | | 0.58 | % | | Sealed Air Corp., 5.625%, due 07/15/13 | | | 16,467 | |
Bank of America Securities LLC(1) | | 12/20/12 | | | 2,200,000 | | 0.30 | % | | Sherwin-Williams, 7.375%, due 02/01/27 | | | 13,162 | |
Barclays Bank PLC(1) | | 12/20/12 | | | 3,000,000 | | 0.44 | % | | Sherwin-Williams, 7.375%, due 02/01/27 | | | (1,440 | ) |
UBS AG(1) | | 12/20/08 | | | 800,000 | | 0.44 | % | | Simon Property Group, L.P., 5.45%, due 03/15/13 | | | 1,446 | |
Bank of America Securities LLC(1) | | 08/07/45 | | | 484,563 | | 4.20 | % | | TABS Ltd. 2005-2A, 7.63%, due 08/07/45(3) | | | 397,217 | |
Morgan Stanley & Co.(1) | | 06/20/12 | | | 5,000,000 | | 0.11 | % | | Target Corp., 5.875%, 03/01/12 | | | 67,841 | |
Morgan Stanley & Co.(1) | | 12/20/08 | | | 800,000 | | 0.53 | % | | The Kroger Co., 4.75%, due 04/15/12 | | | (3,539 | ) |
Morgan Stanley & Co.(1) | | 12/20/12 | | | 2,100,000 | | 0.33 | % | | TJX Cos., Inc., 7.45%, due 12/15/09 | | | 12,346 | |
Goldman Sachs(1) | | 03/08/40 | | | 467,220 | | 3.90 | % | | Trinity CDO Ltd., 7.90%, due 03/08/40(3) | | | 288,125 | |
SEE NOTES TO FINANCIAL STATEMENTS.
A59
| | | | |
| | | SP PIMCO TOTAL RETURN PORTFOLIO (Continued) | | |
SCHEDULE OF INVESTMENTS | December 31, 2007 |
| | | | | | | | | | | | | | |
Counterparty
| | Termination
Date
| | Notional
Amount#
| | Fixed
Rate
| | | Reference Entity/Obligation
| | Unrealized
Appreciation
(Depreciation)
| |
Bank of America Securities LLC(1) | | 08/07/45 | | $ | 467,220 | | 4.30 | % | | Trinity CDO Ltd., 7.90%, due 03/08/40(3) | | $ | 288,001 | |
Bear Stearns International Ltd.(1) | | 03/20/11 | | | 1,000,000 | | 0.33 | % | | Vornado Realty, 5.60%, due 02/15/11 | | | 32,098 | |
Goldman Sachs(1) | | 12/20/12 | | | 5,300,000 | | 0.24 | % | | Wal-Mart Stores, Inc., 5.75%, due 12/19/30 | | | (59 | ) |
Morgan Stanley & Co.(1) | | 06/20/17 | | | 4,900,000 | | 0.15 | % | | Wal-Mart Stores, Inc., 5.75%, due 12/19/30 | | | 55,480 | |
Bear Stearns International Ltd.(1) | | 12/20/08 | | | 1,500,000 | | 0.15 | % | | Wal-Mart Stores, Inc., 6.875%, due 08/10/09 | | | (1,049 | ) |
Citigroup(1) | | 12/20/08 | | | 3,600,000 | | 0.14 | % | | Wal-Mart Stores, Inc., 3.375%, due 10/01/08 | | | (2,158 | ) |
Barclays Bank PLC(1) | | 12/20/08 | | | 900,000 | | 0.67 | % | | Walt Disney Co. (The), 6.375%, due 03/01/12 | | | (4,470 | ) |
Barclays Bank PLC(1) | | 12/20/08 | | | 100,000 | | 0.67 | % | | Walt Disney Co. (The), 6.375%, due 03/01/12 | | | (259 | ) |
Barclays Bank PLC(1) | | 06/20/12 | | | 1,500,000 | | 0.09 | % | | Wells Fargo Co., 5.21%, due 10/28/15(3) | | | 29,754 | |
Lehman Brothers, Inc.(1) | | 12/20/08 | | | 1,100,000 | | 0.29 | % | | Whirlpool Corp., 8.60%, due 05/01/10 | | | (1,600 | ) |
Lehman Brothers, Inc.(1) | | 12/20/08 | | | 100,000 | | 0.29 | % | | Whirlpool Corp., 8.60%, due 05/01/10 | | | (195 | ) |
Barclays Bank PLC(1) | | 03/20/12 | | | 1,300,000 | | 0.21 | % | | XL Cap Europe PLC, 6.50%, due 01/15/12 | | | 56,002 | |
| | | | | | | | | | | | |
|
|
|
| | | | | | | | | | | | | $ | 17,290,628 | |
| | | | | | | | | | | | |
|
|
|
| (1) | Portfolio pays the fixed rate and receives from the counterparty, par in the event that the underlying bond defaults. |
| (2) | Portfolio pays counterparty par in the event that the underlying bond defaults and receives the fixed rate. |
| (3) | Variable rate, displayed rate is as of 12/31/07. |
| # | Notional Amount is shown in U.S. dollars unless otherwise stated. |
The industry classification of investments and liabilities in excess of other assets shown as a percentage of net assets as December 31, 2007 were as follows:
| | | |
U.S. Government Mortgage-Backed Obligations | | 97.7 | % |
U.S. Treasury Obligations | | 36.7 | |
Financial Services | | 6.9 | |
Financial – Bank & Trust | | 4.9 | |
Collateralized Mortgage Obligations | | 4.0 | |
Bank Notes | | 3.3 | |
Foreign Government Bonds | | 2.3 | |
Diversified | | 2.0 | |
Outstanding Options Purchased | | 1.7 | |
Telecommunications | | 1.2 | |
Commercial Paper | | 1.0 | |
Municipal Bonds | | 0.9 | |
Healthcare Services | | 0.7 | |
Asset-Backed Securities | | 0.7 | |
Oil, Gas & Consumable Fuels | | 0.6 | |
Insurance | | 0.5 | |
Telecom – Integrated/Services | | 0.5 | |
Automobile Manufacturers | | 0.5 | |
Utilities | | 0.4 | |
Paper & Forest Products | | 0.3 | |
Tobacco | | 0.3 | |
Building Materials | | 0.3 | |
Retail & Merchandising | | 0.3 | |
Affiliated Money Market Mutual Fund | | 0.2 | |
Aerospace | | 0.2 | |
| | |
|
|
| | | 168.1 | |
Written options and securities sold short | | (63.8 | ) |
Liabilities in excess of other assets | | (4.3 | ) |
| | |
|
|
| | | 100.0 | % |
| | |
|
|
SEE NOTES TO FINANCIAL STATEMENTS.
A60
| | | | |
| | | SP PIMCO TOTAL RETURN PORTFOLIO (Continued) | | |
STATEMENT OF ASSETS AND LIABILITIES
December 31, 2007
| | | |
| ASSETS | | | |
Investments at value: | | | |
Unaffiliated investments (cost $2,364,789,692) | | $ | 2,392,242,102 |
Affiliated investments (cost $2,594,785) | | | 2,594,785 |
Cash | | | 10,233,151 |
Foreign currency, at value (cost $8,812,421) | | | 8,915,956 |
Receivable for investments sold | | | 1,003,542,031 |
Unrealized appreciation on swap agreements | | | 29,916,729 |
Dividends and interest receivable | | | 14,890,631 |
Unrealized appreciation on foreign currency forward contracts | | | 7,496,502 |
Prepaid expenses | | | 10,230 |
Receivable for Series shares sold | | | 4,447 |
| | |
|
|
Total Assets | | | 3,469,846,564 |
| | |
|
|
| LIABILITIES | | | |
Payable for investments purchased | | | 1,093,724,049 |
Securities sold short, at value (proceeds received $888,413,453) | | | 892,393,133 |
Unrealized depreciation on swap agreements | | | 22,919,001 |
Written options outstanding, at value (cost $7,189,460) | | | 16,562,366 |
Interest payable on investments sold short | | | 7,573,733 |
Payable for floating rates issued | | | 4,787,500 |
Due to broker-variation margin | | | 2,485,288 |
Premium for swaps sold | | | 2,311,057 |
Unrealized depreciation on foreign currency forward contracts | | | 939,193 |
Management fee payable | | | 720,592 |
Payable for Series shares repurchased | | | 442,314 |
Accrued expenses and other liabilities | | | 202,644 |
Deferred trustees’ fees | | | 2,407 |
Transfer agent fees payable | | | 1,274 |
| | |
|
|
Total Liabilities | | | 2,045,064,551 |
| | |
|
|
| NET ASSETS | | $ | 1,424,782,013 |
| | |
|
|
Net assets were comprised of: | | | |
Paid-in capital | | $ | 1,378,893,617 |
Retained earnings | | | 45,888,396 |
| | |
|
|
Net assets, December 31, 2007 | | $ | 1,424,782,013 |
| | |
|
|
Net asset value and redemption price per share, $1,424,782,013 / 122,114,220 outstanding shares of beneficial interest | | $ | 11.67 |
| | |
|
|
STATEMENT OF OPERATIONS
Year Ended December 31, 2007
| | | | |
| INVESTMENT INCOME | | | | |
Interest | | $ | 75,609,573 | |
Affiliated dividend income | | | 2,834,564 | |
Unaffiliated dividend income | | | 22,500 | |
| | |
|
|
|
| | | | 78,466,637 | |
| | |
|
|
|
| EXPENSES | | | | |
Management fee | | | 8,856,902 | |
Custodian’s fees and expenses | | | 469,000 | |
Interest Expense (Note 2) | | | 334,045 | |
Audit fee | | | 41,000 | |
Shareholders’ reports | | | 38,000 | |
Trustees’ fees | | | 30,000 | |
Insurance expenses | | | 14,000 | |
Legal fees and expenses | | | 10,000 | |
Transfer agent’s fees and expenses (including affiliated expense of $4,000) (Note 4) | | | 5,000 | |
Commitment fee on syndicated credit agreement | | | 5,000 | |
Miscellaneous | | | 14,217 | |
| | |
|
|
|
Total expenses | | | 9,817,164 | |
| | |
|
|
|
| NET INVESTMENT INCOME | | | 68,649,473 | |
| | |
|
|
|
NET REALIZED AND UNREALIZED GAIN (LOSS) ON
INVESTMENTS AND FOREIGN CURRENCIES | | | | |
Net realized gain (loss) on: | | | | |
Investment transactions | | | (3,354,265 | ) |
Futures transactions | | | (18,491,896 | ) |
Options written transactions | | | 1,409,460 | |
Swap agreement transactions | | | 48,722,725 | |
Short sale transactions | | | (9,563,244 | ) |
Foreign currency transactions | | | 3,698,607 | |
| | |
|
|
|
| | | | 22,421,387 | |
| | |
|
|
|
Net change in unrealized appreciation (depreciation) on: | | | | |
Investments | | | 35,309,044 | |
Futures | | | 9,337,153 | |
Options written | | | (8,999,059 | ) |
Swap agreements | | | 7,795,807 | |
Short sales | | | (7,483,127 | ) |
Foreign currencies | | | 6,074,138 | |
| | |
|
|
|
| | | | 42,033,956 | |
| | |
|
|
|
| NET GAIN ON INVESTMENTS AND FOREIGN CURRENCIES | | | 64,455,343 | |
| | |
|
|
|
| NET INCREASE IN NET ASSETS RESULTING FROM OPERATIONS | | $ | 133,104,816 | |
| | |
|
|
|
STATEMENT OF CHANGES IN NET ASSETS
| | | | | | | | |
| | | Year Ended December 31,
| |
| | | 2007
| | | 2006
| |
INCREASE (DECREASE) IN NET ASSETS
OPERATIONS: | | | | | | | | |
Net investment income | | $ | 68,649,473 | | | $ | 62,853,888 | |
Net realized gain (loss) on investment and foreign currency transactions | | | 22,421,387 | | | | (7,743,396 | ) |
Net change in unrealized appreciation (depreciation) on investments and foreign currencies | | | 42,033,956 | | | | (1,183,406 | ) |
| | |
|
|
| |
|
|
|
NET INCREASE IN NET ASSETS RESULTING FROM OPERATIONS | | | 133,104,816 | | | | 53,927,086 | |
| | |
|
|
| |
|
|
|
| DISTRIBUTIONS | | | (62,651,148 | ) | | | (63,817,105 | ) |
| | |
|
|
| |
|
|
|
| SERIES SHARE TRANSACTIONS: | | | | | | | | |
Series shares sold [19,086,017 and 18,129,452 shares, respectively] | | | 215,233,306 | | | | 202,000,051 | |
Series shares issued in reinvestment of distributions [5,569,936 and 5,773,643 shares, respectively] | | | 62,651,148 | | | | 63,817,105 | |
Series shares repurchased [45,249,342 and 18,464,240 shares, respectively] | | | (513,850,170 | ) | | | (203,878,541 | ) |
| | |
|
|
| |
|
|
|
INCREASE (DECREASE) IN NET ASSETS RESULTING FROM SERIES SHARE TRANSACTIONS | | | (235,965,716 | ) | | | 61,938,615 | |
| | |
|
|
| |
|
|
|
| TOTAL INCREASE (DECREASE) IN NET ASSETS | | | (165,512,048 | ) | | | 52,048,596 | |
| NET ASSETS: | | | | | | | | |
Beginning of year | | | 1,590,294,061 | | | | 1,538,245,465 | |
| | |
|
|
| |
|
|
|
End of year | | $ | 1,424,782,013 | | | $ | 1,590,294,061 | |
| | |
|
|
| |
|
|
|
SEE NOTES TO FINANCIAL STATEMENTS.
A61
| | | | |
| | | SP PRUDENTIAL US EMERGING GROWTH PORTFOLIO | | |
SCHEDULE OF INVESTMENTS | December 31, 2007 |
| | | | | |
| LONG-TERM INVESTMENTS — 96.8% |
| COMMON STOCKS | | Shares
| | Value
(Note 2)
|
| | | | | | |
Aerospace & Defense — 1.0% | | | | | |
Spirit Aerosystems Holdings, Inc. (Class A Stock)(a) | | 62,200 | | $ | 2,145,900 |
| | | | |
|
|
Air Freight & Logistics — 1.3% | | | | | |
Expeditors International Washington, Inc. | | 59,600 | | | 2,662,928 |
| | | | |
|
|
Capital Markets — 3.6% | | | | | |
Eaton Vance Corp. | | 65,500 | | | 2,974,355 |
T. Rowe Price Group, Inc. | | 30,200 | | | 1,838,576 |
TD Ameritrade Holdings Corp.(a)(b) | | 130,900 | | | 2,625,854 |
| | | | |
|
|
| | | | | | 7,438,785 |
| | | | |
|
|
Chemicals — 5.6% | | | | | |
Ecolab, Inc. | | 73,900 | | | 3,784,419 |
Monsanto Co. | | 19,800 | | | 2,211,462 |
Nalco Holding Co. | | 92,200 | | | 2,229,396 |
Sigma-Aldrich Corp. | | 59,600 | | | 3,254,160 |
| | | | |
|
|
| | | | | | 11,479,437 |
| | | | |
|
|
Commercial Services & Supplies — 6.7% | | | |
Allied Waste Industries, Inc.(a)(b) | | 203,700 | | | 2,244,774 |
Corporate Executive Board Co.(b) | | 47,900 | | | 2,878,790 |
Iron Mountain, Inc.(a)(b) | | 115,700 | | | 4,283,214 |
Paychex, Inc. | | 64,400 | | | 2,332,568 |
Stericycle, Inc.(a) | | 35,500 | | | 2,108,700 |
| | | | |
|
|
| | | | | | 13,848,046 |
| | | | |
|
|
Communications Equipment — 2.2% | | | | | |
Comverse Technology, Inc.(a)(b) | | 136,400 | | | 2,352,900 |
Juniper Networks, Inc.(a) | | 67,600 | | | 2,244,320 |
| | | | |
|
|
| | | | | | 4,597,220 |
| | | | |
|
|
Computers & Peripherals — 0.8% | | | | | |
Brocade Communications Systems, Inc.(a) | | 229,600 | | | 1,685,264 |
| | | | |
|
|
Consumer Finance — 0.5% | | | | | |
Alliance Data Systems Corp.(a)(b) | | 13,500 | | | 1,012,365 |
| | | | |
|
|
Diversified Consumer Services — 1.0% | | | |
Weight Watchers International, Inc. | | 43,700 | | | 1,974,366 |
| | | | |
|
|
Electrical Equipment — 2.5% | | | | | |
Ametek, Inc.(b) | | 112,200 | | | 5,255,449 |
| | | | |
|
|
Electronic Equipment & Instruments — 1.6% | | | | | |
Amphenol Corp. (Class A Stock) | | 42,800 | | | 1,984,636 |
Insight Enterprises, Inc.(a) | | 77,000 | | | 1,404,480 |
| | | | |
|
|
| | | | | | 3,389,116 |
| | | | |
|
|
Energy Equipment & Services — 4.0% | | | | | |
Cameron International Corp.(a) | | 79,400 | | | 3,821,522 |
FMC Technologies, Inc.(a) | | 42,700 | | | 2,421,090 |
Pride International, Inc.(a) | | 61,300 | | | 2,078,070 |
| | | | |
|
|
| | | | | | 8,320,682 |
| | | | |
|
|
Food Products — 2.1% | | | | | |
ConAgra Foods, Inc. | | 138,900 | | | 3,304,431 |
Dean Foods Company | | 39,200 | | | 1,013,712 |
| | | | |
|
|
| | | | | | 4,318,143 |
| | | | |
|
|
Healthcare Equipment & Supplies — 5.4% | | | | | |
DENTSPLY International, Inc. | | 58,300 | | | 2,624,666 |
Hologic, Inc.(a)(b) | | 35,100 | | | 2,409,264 |
Inverness Medical Innovations.(a)(b) | | 29,400 | | | 1,651,692 |
SEE NOTES TO FINANCIAL STATEMENTS.
A62
| | | | |
| | | SP PRUDENTIAL US EMERGING GROWTH PORTFOLIO (Continued) | | |
SCHEDULE OF INVESTMENTS | December 31, 2007 |
| | | | | |
COMMON STOCKS
(continued) | | Shares
| | Value
(Note 2)
|
| | | | | | |
Healthcare Equipment & Supplies (continued) | | | | | |
ResMed, Inc.(a)(b) | | 54,500 | | $ | 2,862,885 |
Respironics, Inc.(a) | | 25,300 | | | 1,656,644 |
| | | | |
|
|
| | | | | | 11,205,151 |
| | | | |
|
|
Healthcare Providers & Services — 8.3% | | | | | |
DaVita, Inc.(a) | | 85,500 | | | 4,817,925 |
Express Scripts, Inc.(a) | | 41,200 | | | 3,007,600 |
Henry Schein, Inc.(a)(b) | | 33,700 | | | 2,069,180 |
Omnicare, Inc. | | 66,700 | | | 1,521,427 |
Patterson Cos, Inc.(a)(b) | | 44,900 | | | 1,524,355 |
Quest Diagnostics, Inc.(b) | | 78,000 | | | 4,126,200 |
| | | | |
|
|
| | | | | | 17,066,687 |
| | | | |
|
|
Healthcare Technology — 0.7% | | | | | |
Cerner Corp.(a)(b) | | 24,300 | | | 1,370,520 |
| | | | |
|
|
Hotels, Restaurants & Leisure — 2.7% | | | | | |
Tim Hortons, Inc. | | 78,900 | | | 2,913,777 |
Yum! Brands, Inc. | | 71,100 | | | 2,720,997 |
| | | | |
|
|
| | | | | | 5,634,774 |
| | | | |
|
|
Household Products — 1.1% | | | | | |
Clorox Co. (The) | | 34,800 | | | 2,267,916 |
| | | | |
|
|
Independent Power Producers & Energy Traders — 1.0% | | | | | |
The AES Corp.(a) | | 95,400 | | | 2,040,606 |
| | | | |
|
|
Insurance — 2.4% | | | | | |
Axis Capital Holdings Ltd. | | 52,100 | | | 2,030,337 |
White Mountain Insurance | | 1,900 | | | 976,695 |
WR Berkley Corp. | | 68,400 | | | 2,039,004 |
| | | | |
|
|
| | | | | | 5,046,036 |
| | | | |
|
|
Internet & Catalog Retail — 0.6% | | | | | |
GSI Commerce, Inc.(a)(b) | | 60,200 | | | 1,173,900 |
| | | | |
|
|
Internet Software & Services — 1.6% | | | | | |
Akamai Technologies, Inc.(a)(b) | | 46,700 | | | 1,615,820 |
Equinix, Inc.(a)(b) | | 7,700 | | | 778,239 |
VeriSign, Inc.(a)(b) | | 24,900 | | | 936,489 |
| | | | |
|
|
| | | | | | 3,330,548 |
| | | | |
|
|
Machinery — 6.3% | | | | | |
Danaher Corp. | | 47,400 | | | 4,158,876 |
Dover Corp. | | 44,600 | | | 2,055,614 |
IDEX Corp. | | 88,100 | | | 3,183,053 |
ITT Corp. | | 53,700 | | | 3,546,348 |
| | | | |
|
|
| | | | | | 12,943,891 |
| | | | |
|
|
Media — 1.3% | | | | | |
Regal Entertainment Group (Class A Stock)(b) | | 147,800 | | | 2,670,746 |
| | | | |
|
|
Metals & Mining — 1.6% | | | | | |
Goldcorp, Inc.(b) | | 94,800 | | | 3,216,564 |
| | | | |
|
|
Oil, Gas & Consumable Fuels — 8.9% | | | | | |
Denbury Resources, Inc.(a) | | 52,600 | | | 1,564,850 |
Frontier Oil Corp | | 33,300 | | | 1,351,314 |
Murphy Oil Corporation | | 14,700 | | | 1,247,148 |
Newfield Exploration Co.(a) | | 27,800 | | | 1,465,060 |
Noble Energy, Inc. | | 16,800 | | | 1,335,936 |
Range Resources Corp.(b) | | 37,500 | | | 1,926,000 |
Southwestern Energy Co.(a) | | 91,400 | | | 5,092,808 |
XTO Energy, Inc. | | 85,875 | | | 4,410,540 |
| | | | |
|
|
| | | | | | 18,393,656 |
| | | | |
|
|
SEE NOTES TO FINANCIAL STATEMENTS.
A63
| | | | |
| | | SP PRUDENTIAL US EMERGING GROWTH PORTFOLIO (Continued) | | |
SCHEDULE OF INVESTMENTS | December 31, 2007 |
| | | | | | |
COMMON STOCKS
(continued) | | Shares
| | Value
(Note 2)
| |
| | | | | | | |
Real Estate Investment Trusts — 0.7% | | | | | | |
Annaly Mortgage Management, Inc. | | 77,200 | | $ | 1,403,496 | |
| | | | |
|
|
|
Semiconductors & Semiconductor Equipment — 3.7% | |
Broadcom Corp. (Class A Stock)(a)(b) | | 110,750 | | | 2,895,005 | |
Integrated Device Technology, Inc.(a) | | 210,800 | | | 2,384,148 | |
KLA-Tencor Corp. | | 28,800 | | | 1,387,008 | |
PMC-Sierra, Inc.(a) | | 148,900 | | | 973,806 | |
| | | | |
|
|
|
| | | | | | 7,639,967 | |
| | | | |
|
|
|
Software — 4.9% | | | | | | |
Adobe Systems, Inc.(a) | | 44,528 | | | 1,902,681 | |
Amdocs Ltd.(a) | | 61,500 | | | 2,119,905 | |
Autodesk, Inc.(a)(b) | | 21,700 | | | 1,079,792 | |
Check Point Software Technologies Ltd.(a) | | 93,200 | | | 2,046,672 | |
Electronic Arts, Inc.(a) | | 49,400 | | | 2,885,454 | |
| | | | |
|
|
|
| | | | | | 10,034,504 | |
| | | | |
|
|
|
Specialty Retail — 2.0% | | | | | | |
Ross Stores, Inc. | | 59,000 | | | 1,508,630 | |
Urban Outfitters, Inc.(a)(b) | | 94,800 | | | 2,584,248 | |
| | | | |
|
|
|
| | | | | | 4,092,878 | |
| | | | |
|
|
|
Textiles, Apparel & Luxury Goods — 1.2% | | | | |
Phillips-Van Heusen(b) | | 65,900 | | | 2,429,074 | |
| | | | |
|
|
|
Trading Companies & Distributors — 1.6% | |
Fastenal Co. | | 83,900 | | | 3,391,238 | |
| | | | |
|
|
|
Wireless Telecommunication Services — 7.9% | |
American Tower Corp. (Class A Stock)(a) | | 88,900 | | | 3,787,140 | |
Clearwire Corp. (Class A Stock)(a)(b) | | 81,600 | | | 1,118,736 | |
Crown Castle International Corp.(a) | | 85,800 | | | 3,569,280 | |
NII Holdings, Inc.(a) | | 160,700 | | | 7,765,024 | |
| | | | |
|
|
|
| | | | | | 16,240,180 | |
| | | | |
|
|
|
TOTAL LONG-TERM INVESTMENTS
(cost $163,541,453) | | | 199,720,033 | |
| | | | |
|
|
|
| SHORT-TERM INVESTMENT — 31.3% | |
Affiliated Money Market Mutual Fund | | | | |
Dryden Core Investment Fund — Taxable Money Market Series
(cost $64,516,341 includes $55,037,230 of cash collateral received for securities on loan)(c)(d)(Note 4) | | 64,516,341 | | | 64,516,341 | |
| | | | |
|
|
|
TOTAL INVESTMENTS — 128.1%
(cost $228,057,794) | | | 264,236,374 | |
LIABILITIES IN EXCESS OF OTHER ASSETS — (28.1%) | | | (58,028,717 | ) |
| | | | |
|
|
|
NET ASSETS — 100.0% | | $ | 206,207,657 | |
| | | | |
|
|
|
| (a) | Non-income producing security. |
| (b) | All or a portion of security is on loan. The aggregate market value of such securities is $52,823,395; cash collateral of $55,037,230 (included in liabilities) was received with which the Portfolio purchased highly liquid short-term investments. |
| (c) | Represents security, or a portion thereof, purchased with cash collateral received for securities on loan. |
| (d) | Prudential Investments LLC, the manager of the Portfolio, also serves as manager of the Dryden Core Investment Fund — Taxable Money Market Series. |
SEE NOTES TO FINANCIAL STATEMENTS.
A64
| | | | |
| | | SP PRUDENTIAL US EMERGING GROWTH PORTFOLIO (Continued) | | |
SCHEDULE OF INVESTMENTS | December 31, 2007 |
The industry classification of portfolio holdings and liabilities in excess of other assets shown as a percentage of net assets as of December 31, 2007 were as follows:
| | | |
Affiliated Money Market Mutual Fund ( including 26.7% of collateral received for securities on loan) | | 31.3 | % |
Oil, Gas & Consumable Fuels | | 8.9 | |
Healthcare Providers & Services | | 8.3 | |
Wireless Telecommunication Services | | 7.9 | |
Commercial Services & Supplies | | 6.7 | |
Machinery | | 6.3 | |
Chemicals | | 5.6 | |
Healthcare Equipment & Supplies | | 5.4 | |
Software | | 4.9 | |
Energy Equipment & Services | | 4.0 | |
Semiconductors & Semiconductor Equipment | | 3.7 | |
Capital Markets | | 3.6 | |
Hotels, Restaurants & Leisure | | 2.7 | |
Electrical Equipment | | 2.5 | |
Insurance | | 2.4 | |
Communications Equipment | | 2.2 | |
Food Products | | 2.1 | |
Specialty Retail | | 2.0 | |
Electronic Equipment & Instruments | | 1.6 | |
Internet Software & Services | | 1.6 | |
Metals & Mining | | 1.6 | |
Trading Companies & Distributors | | 1.6 | |
Air Freight & Logistics | | 1.3 | |
Media | | 1.3 | |
Textiles, Apparel & Luxury Goods | | 1.2 | |
Household Products | | 1.1 | |
Aeroospace & Defense | | 1.0 | |
Diversified Consumer Services | | 1.0 | |
Independent Power Producers & Energy Traders | | 1.0 | |
Computers & Peripherals | | 0.8 | |
Healthcare Technology | | 0.7 | |
Real Estate Investment Trusts (REITs) | | 0.7 | |
Internet & Catalog Retail | | 0.6 | |
Consumer Finance | | 0.5 | |
| | |
|
|
| | | 128.1 | |
Liabilities in excess of other assets | | (28.1 | ) |
| | |
|
|
| | | 100.0 | % |
| | |
|
|
SEE NOTES TO FINANCIAL STATEMENTS.
A65
| | | | |
| | | SP PRUDENTIAL US EMERGING GROWTH PORTFOLIO (Continued) | | |
STATEMENT OF ASSETS AND LIABILITIES
December 31, 2007
| | | |
| ASSETS | | | |
Investments, at value including securities on loan of $52,823,395: | | | |
Unaffiliated investments (cost $163,541,453) | | $ | 199,720,033 |
Affiliated investments (cost $64,516,341) | | | 64,516,341 |
Receivable for investments sold | | | 320,533 |
Dividends and interest receivable | | | 135,382 |
Receivable for Series shares sold | | | 15,027 |
Prepaid expenses | | | 2,299 |
| | |
|
|
Total Assets | | | 264,709,615 |
| | |
|
|
| LIABILITIES | | | |
Collateral for securities on loan | | | 55,037,230 |
Payable for investments purchased | | | 3,133,917 |
Payable for Series shares reacquired | | | 123,046 |
Management fee payable | | | 104,723 |
Accrued expenses and other liabilities | | | 100,466 |
Deferred trustees’ fees | | | 1,888 |
Transfer agent fee payable | | | 557 |
Distribution fee payable | | | 80 |
Administration fee payable | | | 48 |
Payable to custodian | | | 3 |
| | |
|
|
Total Liabilities | | | 58,501,958 |
| | |
|
|
| NET ASSETS | | $ | 206,207,657 |
| | |
|
|
Net assets were comprised of: | | | |
Paid-in capital | | $ | 142,269,106 |
Retained earnings | | | 63,938,551 |
| | |
|
|
Net assets, December 31, 2007 | | $ | 206,207,657 |
| | |
|
|
| Class I: | | | |
Net asset value and redemption price per share, $205,828,249 / 24,482,072 outstanding shares of beneficial interest | | $ | 8.41 |
| | |
|
|
| Class II: | | | |
Net asset value and redemption price per share, $379,408/46,456 outstanding shares of beneficial interest | | $ | 8.17 |
| | |
|
|
STATEMENT OF OPERATIONS
Year ended December 31, 2007
| | | |
| INVESTMENT INCOME | | | |
Unaffiliated dividend income (net of foreign withholding taxes of $2,560) | | $ | 1,403,969 |
Affiliated dividend income | | | 307,455 |
Affiliated income from securities loaned, net | | | 132,617 |
Unaffiliated interest | | | 768 |
| | |
|
|
| | | | 1,844,809 |
| | |
|
|
| EXPENSES | | | |
Management fee | | | 1,253,478 |
Distribution fee—Class II | | | 908 |
Administration fee—Class II | | | 545 |
Custodian’s fees and expenses | | | 28,000 |
Shareholders’ reports | | | 20,000 |
Audit fee | | | 16,000 |
Trustees’ fees | | | 12,000 |
Transfer agent’s fee and expenses (including affiliated expense of $3,800) (Note 4) | | | 5,000 |
Insurance expenses | | | 5,000 |
Legal fees and expenses | | | 4,000 |
Miscellaneous | | | 5,998 |
| | |
|
|
Total expenses | | | 1,350,929 |
| | |
|
|
| NET INVESTMENT INCOME | | | 493,880 |
| | |
|
|
| NET REALIZED AND UNREALIZED GAIN (LOSS) ON INVESTMENTS: | | | |
Net realized gain on investment transactions | | | 27,633,621 |
Net change in unrealized appreciation (depreciation) on investments | | | 4,131,011 |
| | |
|
|
| NET GAIN ON INVESTMENTS | | | 31,764,632 |
| | |
|
|
| NET INCREASE IN NET ASSETS RESULTING FROM OPERATIONS | | $ | 32,258,512 |
| | |
|
|
STATEMENT OF CHANGES IN NET ASSETS
| | | | | | | | |
| | | Year Ended December 31,
| |
| | | 2007
| | | 2006
| |
| INCREASE (DECREASE) IN NET ASSETS | | | | | | | | |
| OPERATIONS: | | | | | | | | |
Net investment income | | $ | 493,880 | | | $ | 652,374 | |
Net realized gain on investments | | | 27,633,621 | | | | 19,588,725 | |
Net change in unrealized appreciation (depreciation) on investments | | | 4,131,011 | | | | (2,597,586 | ) |
| | |
|
|
| |
|
|
|
NET INCREASE IN NET ASSETS RESULTING FROM OPERATIONS | | | 32,258,512 | | | | 17,643,513 | |
| | |
|
|
| |
|
|
|
| DISTRIBUTIONS: | | | | | | | | |
Class I | | | (20,193,651 | ) | | | (15,437,758 | ) |
Class II | | | (36,860 | ) | | | (30,998 | ) |
| | |
|
|
| |
|
|
|
TOTAL DISTRIBUTIONS | | | (20,230,511 | ) | | | (15,468,756 | ) |
| | |
|
|
| |
|
|
|
| SERIES SHARE TRANSACTIONS (Note 7): | | | | | | | | |
Series shares sold [ 1,555,199 and 3,604,315 shares, respectively] | | | 13,349,237 | | | | 28,455,379 | |
Series shares issued in reinvestment of distributions [2,446,381 and 1,978,190 shares, respectively] | | | 20,230,511 | | | | 15,468,756 | |
Series shares repurchased [4,875,832 and 4,976,168 shares, respectively] | | | (42,334,740 | ) | | | (38,386,640 | ) |
| | |
|
|
| |
|
|
|
NET INCREASE (DECREASE) IN NET ASSETS RESULTING FROM CAPITAL STOCK TRANSACTIONS | | | (8,754,992 | ) | | | 5,537,495 | |
| | |
|
|
| |
|
|
|
| TOTAL INCREASE IN NET ASSETS | | | 3,273,009 | | | | 7,712,252 | |
| NET ASSETS: | | | | | | | | |
Beginning of year | | | 202,934,648 | | | | 195,222,396 | |
| | |
|
|
| |
|
|
|
End of year | | $ | 206,207,657 | | | $ | 202,934,648 | |
| | |
|
|
| |
|
|
|
SEE NOTES TO FINANCIAL STATEMENTS.
A66
| | | | |
| | | SP SMALL CAP GROWTH PORTFOLIO | | |
SCHEDULE OF INVESTMENTS | December 31, 2007 |
| | | | | |
| LONG-TERM INVESTMENTS — 96.3% | | Value
(Note 2)
|
| COMMON STOCKS | | Shares
| |
| | | | | | |
Aerospace — 0.5% | | | | | |
ARGON ST, Inc.*(a) | | 36,700 | | $ | 681,152 |
| | | | |
|
|
Automobile Manufacturers — 0.9% | | | | | |
Titan International, Inc. | | 38,010 | | | 1,188,193 |
| | | | |
|
|
Banking — 1.3% | | | | | |
Texas Capital Banshares, Inc.*(a) | | 33,500 | | | 611,375 |
Wintrust Financial Corp.(a) | | 32,800 | | | 1,086,664 |
| | | | |
|
|
| | | | | | 1,698,039 |
| | | | |
|
|
Building Materials — 2.2% | | | | | |
Drew Industries, Inc.*(a) | | 24,300 | | | 665,820 |
Interline Brands, Inc.*(a) | | 50,000 | | | 1,095,500 |
Texas Industries, Inc.(a) | | 15,290 | | | 1,071,829 |
| | | | |
|
|
| | | | | | 2,833,149 |
| | | | |
|
|
Business Services — 1.1% | | | | | |
ICON PLC* | | 22,530 | | | 1,393,706 |
| | | | |
|
|
Chemicals — 4.7% | | | | | |
Cabot Microelectronics Corp.*(a) | | 13,600 | | | 488,376 |
Quaker Chemical Corp. | | 20,710 | | | 454,999 |
Rockwood Holdings, Inc.* | | 41,800 | | | 1,388,596 |
Spartech Corp. | | 12,300 | | | 173,430 |
Terra Industries, Inc.*(a) | | 46,320 | | | 2,212,243 |
Zoltek Cos, Inc.*(a) | | 28,365 | | | 1,216,007 |
| | | | |
|
|
| | | | | | 5,933,651 |
| | | | |
|
|
Clothing & Apparel — 0.9% | | | | | |
Volcom, Inc.*(a) | | 50,760 | | | 1,118,243 |
| | | | |
|
|
Commercial Services — 3.1% | | | | | |
Geo Group, Inc. (The)* | | 46,830 | | | 1,311,240 |
Global Cash Access Holdings*(a) | | 86,125 | | | 521,918 |
Healthcare Services Group, Inc.(a) | | 62,650 | | | 1,326,927 |
Korn/Ferry International*(a) | | 40,600 | | | 764,092 |
| | | | |
|
|
| | | | | | 3,924,177 |
| | | | |
|
|
Commercial Services & Supplies — 3.1% | | | | | |
Advisory Board Co. (The)*(a) | | 18,600 | | | 1,193,934 |
Corrections Corp. of America* | | 28,709 | | | 847,203 |
H&E Equipment Services, Inc.*(a) | | 17,300 | | | 326,624 |
Rollins, Inc. | | 80,600 | | | 1,547,520 |
| | | | |
|
|
| | | | | | 3,915,281 |
| | | | |
|
|
Computer Hardware — 1.2% | | | | | |
Compellent Technologies, Inc.*(a) | | 42,745 | | | 514,222 |
MTS Systems Corp. | | 13,900 | | | 593,113 |
Netezza Corp.* | | 27,740 | | | 382,812 |
| | | | |
|
|
| | | | | | 1,490,147 |
| | | | |
|
|
Computer Services & Software — 4.0% | | | | | |
ACI Worldwide, Inc.*(a) | | 31,940 | | | 608,137 |
ANSYS, Inc.*(a) | | 38,985 | | | 1,616,318 |
Avid Technology, Inc.*(a) | | 24,110 | | | 683,277 |
FactSet Research Systems, Inc.(a) | | 13,803 | | | 768,827 |
Greenfield Online, Inc.*(a) | | 42,990 | | | 628,084 |
Hansen Medical, Inc.* | | 16,155 | | | 483,681 |
The9 Ltd., ADR (China)*(a) | | 15,880 | | | 338,562 |
| | | | |
|
|
| | | | | | 5,126,886 |
| | | | |
|
|
| | | | | |
COMMON STOCKS
(continued) | | Shares
| | Value
(Note 2)
|
| | | | | | |
Consulting — 0.8% | | | | | |
Watson Wyatt Worldwide, Inc. (Class A Stock) | | 21,300 | | $ | 988,533 |
| | | | |
|
|
Consumer Products & Services — 2.4% | | | | | |
Chattem, Inc.*(a) | | 10,600 | | | 800,724 |
Physicians Formula Holdings, Inc.* | | 48,065 | | | 571,012 |
Ritchie Bros. Auctioneers, Inc. (Canada) | | 20,200 | | | 1,670,540 |
| | | | |
|
|
| | | | | | 3,042,276 |
| | | | |
|
|
Distribution/Wholesale — 2.6% | | | | | |
Houston Wire & Cable(a) | | 43,000 | | | 608,020 |
MWI Veterinary Supply, Inc.*(a) | | 32,490 | | | 1,299,600 |
Owens & Minor, Inc.(a) | | 10,700 | | | 454,001 |
ScanSource, Inc.*(a) | | 29,200 | | | 944,620 |
| | | | |
|
|
| | | | | | 3,306,241 |
| | | | |
|
|
Diversified Manufacturing Operations — 3.8% | | | |
Actuant Corp. (Class A Stock)(a) | | 71,581 | | | 2,434,470 |
Ameron International Corp.(a) | | 16,330 | | | 1,504,809 |
CLARCOR, Inc. | | 22,600 | | | 858,122 |
| | | | |
|
|
| | | | | | 4,797,401 |
| | | | |
|
|
Education — 0.4% | | | | | |
American Public Education, Inc.* | | 6,450 | | | 269,481 |
K12, Inc.* | | 7,915 | | | 204,840 |
| | | | |
|
|
| | | | | | 474,321 |
| | | | |
|
|
Electrical Equipment — 1.5% | | | | | |
Advanced Energy Industries, Inc.* | | 53,100 | | | 694,548 |
General Cable Corp.*(a) | | 17,056 | | | 1,249,864 |
| | | | |
|
|
| | | | | | 1,944,412 |
| | | | |
|
|
Electronic Components — 2.5% | | | | | |
Eagle Test Systems, Inc.*(a) | | 40,830 | | | 521,807 |
LoJack Corp.*(a) | | 30,500 | | | 512,705 |
Universal Electronics, Inc.* | | 64,809 | | | 2,167,213 |
| | | | |
|
|
| | | | | | 3,201,725 |
| | | | |
|
|
Electronics — 2.2% | | | | | |
Coherent, Inc.* | | 55,030 | | | 1,379,602 |
Dolby Laboratories, Inc. (Class A Stock)* | | 29,060 | | | 1,444,863 |
| | | | |
|
|
| | | | | | 2,824,465 |
| | | | |
|
|
Energy Equipment & Services — 0.7% | | | | | |
W-H Energy Services, Inc.* | | 14,675 | | | 824,882 |
| | | | |
|
|
Entertainment — 0.3% | | | | | |
Giant Interactive Group, Inc. (China)*(a) | | 33,410 | | | 433,662 |
| | | | |
|
|
Entertainment & Leisure — 2.0% | | | | | |
International Speedway Corp.
(Class A Stock) | | 20,100 | | | 827,718 |
Vail Resorts, Inc.*(a) | | 14,470 | | | 778,631 |
WMS Industries, Inc.*(a) | | 24,055 | | | 881,375 |
| | | | |
|
|
| | | | | | 2,487,724 |
| | | | |
|
|
Financial – Brokerage — 0.3% | | | | | |
Greenhill & Co, Inc.(a) | | 5,985 | | | 397,883 |
| | | | |
|
|
SEE NOTES TO FINANCIAL STATEMENTS.
A67
| | | | |
| | | SP SMALL CAP GROWTH PORTFOLIO (Continued) | | |
SCHEDULE OF INVESTMENTS | December 31, 2007 |
| | | | | |
COMMON STOCKS
(continued) | | Shares
| | Value
(Note 2)
|
| | | | | | |
Financial Services — 4.3% | | | | | |
Boston Private Financial Holdings, Inc.(a) | | 39,105 | | $ | 1,058,963 |
FCSstone Group, Inc.*(a) | | 44,412 | | | 2,044,284 |
Financial Federal Corp.(a) | | 20,000 | | | 445,800 |
First Mercury Financial Corp.* | | 24,555 | | | 599,142 |
Hilb Rogal & Hobbs Co. | | 10,100 | | | 409,757 |
Investment Technology Group, Inc.* | | 19,130 | | | 910,397 |
| | | | |
|
|
| | | | | | 5,468,343 |
| | | | |
|
|
Health Services — 4.1% | | | | | |
Centene Corp.*(a) | | 69,940 | | | 1,919,153 |
Computer Programs & Systems, Inc. | | 27,500 | | | 625,350 |
Eclipsys Corp.*(a) | | 105,215 | | | 2,662,992 |
| | | | |
|
|
| | | | | | 5,207,495 |
| | | | |
|
|
Healthcare – Services — 0.5% | | | | | |
Animal Health International, Inc.*(a) | | 49,260 | | | 605,898 |
| | | | |
|
|
Healthcare Equipment & Supplies — 0.6% | | | | | |
Cutera, Inc.*(a) | | 50,535 | | | 793,400 |
| | | | |
|
|
Healthcare Providers & Services — 0.4% | | | | | |
Matria Healthcare, Inc.*(a) | | 20,020 | | | 475,875 |
| | | | |
|
|
Healthcare-Products — 1.6% | | | | | |
Haemonetics Corp.* | | 10,000 | | | 630,200 |
LCA-Vision, Inc.(a) | | 13,100 | | | 261,607 |
SurModics, Inc.*(a) | | 20,455 | | | 1,110,093 |
| | | | |
|
|
| | | | | | 2,001,900 |
| | | | |
|
|
Household Products — 0.4% | | | | | |
ACCO Brands Corp.*(a) | | 32,200 | | | 516,488 |
| | | | |
|
|
Insurance — 1.4% | | | | | |
American Equity Investment Life Holding Co.(a) | | 44,200 | | | 366,418 |
American Safety Insurance Holdings Ltd.* | | 17,860 | | | 350,949 |
Amerisafe, Inc.* | | 45,300 | | | 702,603 |
Tower Group, Inc. | | 9,300 | | | 310,620 |
| | | | |
|
|
| | | | | | 1,730,590 |
| | | | |
|
|
Internet Services — 3.6% | | | | | |
CNET Networks, Inc.*(a) | | 126,325 | | | 1,154,611 |
Internet Capital Group, Inc.*(a) | | 44,151 | | | 518,333 |
j2 Global Communications, Inc.* | | 47,100 | | | 997,107 |
Online Resources Corp.*(a) | | 46,700 | | | 556,664 |
Switch and Data, Inc.*(a) | | 28,115 | | | 450,402 |
TIBCO Software, Inc.*(a) | | 113,245 | | | 913,887 |
| | | | |
|
|
| | | | | | 4,591,004 |
| | | | |
|
|
Internet Software & Services — 0.2% | | | | | |
US Auto Parts Network, Inc.* | | 34,740 | | | 281,741 |
| | | | |
|
|
Machinery — 0.4% | | | | | |
CIRCOR International, Inc.(a) | | 11,080 | | | 513,669 |
| | | | |
|
|
Machinery & Equipment — 7.3% | | | | | |
Bucyrus International, Inc. (Class A Stock)(a) | | 35,757 | | | 3,553,888 |
IDEX Corp. | | 45,500 | | | 1,643,915 |
Middleby Corp.* | | 20,600 | | | 1,578,372 |
RBC Bearings, Inc.* | | 41,300 | | | 1,794,898 |
Regal-Beloit Corp.(a) | | 14,800 | | | 665,260 |
| | | | |
|
|
| | | | | | 9,236,333 |
| | | | |
|
|
| | | | | |
COMMON STOCKS
(continued) | | Shares
| | Value
(Note 2)
|
| | | | | | |
Media — 1.6% | | | | | |
Entravision Communications Corp. (Class A Stock)*(a) | | 94,200 | | $ | 737,586 |
Meredith Corp. | | 24,300 | | | 1,336,014 |
| | | | |
|
|
| | | | | | 2,073,600 |
| | | | |
|
|
Medical Products — 6.6% | | | | | |
American Medical Systems Holdings, Inc.*(a) | | 95,331 | | | 1,378,486 |
ICU Medical, Inc.*(a) | | 7,000 | | | 252,070 |
K-V Pharmaceutical Co. (Class A Stock)*(a) | | 46,655 | | | 1,331,534 |
Landauer, Inc. | | 11,000 | | | 570,350 |
Respironics, Inc.* | | 20,304 | | | 1,329,506 |
STERIS Corp.(a) | | 39,500 | | | 1,139,180 |
TECHNE Corp.* | | 10,500 | | | 693,525 |
Thoratec Corp.*(a) | | 62,454 | | | 1,136,038 |
Young Innovations, Inc. | | 24,000 | | | 573,840 |
| | | | |
|
|
| | | | | | 8,404,529 |
| | | | |
|
|
Medical Supplies & Equipment — 1.2% | | | | | |
Myriad Genetics, Inc.*(a) | | 10,785 | | | 500,640 |
Quality Systems, Inc.(a) | | 18,625 | | | 567,876 |
Vital Images, Inc.*(a) | | 25,320 | | | 457,532 |
| | | | |
|
|
| | | | | | 1,526,048 |
| | | | |
|
|
Metals & Mining — 1.1% | | | | | |
Northwest Pipe Co.*(a) | | 17,060 | | | 667,728 |
Trimas Corp.* | | 66,600 | | | 705,294 |
| | | | |
|
|
| | | | | | 1,373,022 |
| | | | |
|
|
Mineral Resources — 0.8% | | | | | |
AMCOL International Corp. | | 27,200 | | | 980,016 |
| | | | |
|
|
Office Equipment — 0.7% | | | | | |
School Specialty, Inc.*(a) | | 27,215 | | | 940,278 |
| | | | |
|
|
Oil & Field Services — 0.4% | | | | | |
Cal Dive International, Inc.*(a) | | 39,100 | | | 517,684 |
| | | | |
|
|
Oil & Gas Equipment & Services — 1.2% | | | | | |
CARBO Ceramics, Inc. | | 15,000 | | | 558,000 |
TETRA Technologies, Inc.* | | 63,400 | | | 987,138 |
| | | | |
|
|
| | | | | | 1,545,138 |
| | | | |
|
|
Oil & Gas Exploration/Production — 0.8% |
Core Laboratories NV (Netherlands)* | | 8,352 | | | 1,041,661 |
| | | | |
|
|
Oil, Gas & Consumable Fuels — 2.9% | | | | | |
Berry Petroleum Co. (Class A Stock) | | 32,200 | | | 1,431,290 |
Comstock Resources, Inc.*(a) | | 15,000 | | | 510,000 |
Lufkin Industries, Inc. | | 31,190 | | | 1,786,875 |
| | | | |
|
|
| | | | | | 3,728,165 |
| | | | |
|
|
Pharmaceuticals — 0.5% | | | | | |
Cubist Pharmaceuticals, Inc.*(a) | | 29,055 | | | 595,918 |
| | | | |
|
|
Publishing — 0.6% | | | | | |
Courier Corp.(a) | | 24,800 | | | 818,648 |
| | | | |
|
|
Restaurants — 0.6% | | | | | |
Bj’s Restaurants, Inc.*(a) | | 43,425 | | | 706,091 |
| | | | |
|
|
SEE NOTES TO FINANCIAL STATEMENTS.
A68
| | | | |
| | | SP SMALL CAP GROWTH PORTFOLIO (Continued) | | |
SCHEDULE OF INVESTMENTS | December 31, 2007 |
| | | | | |
COMMON STOCKS
(continued) | | Shares
| | Value
(Note 2)
|
| | | | | | |
Retail — 2.6% | | | | | |
Cash America International, Inc. | | 68,962 | | $ | 2,227,473 |
Hibbett Sports, Inc.*(a) | | 20,700 | | | 413,586 |
Red Robin Gourmet Burgers, Inc.* | | 20,710 | | | 662,513 |
| | | | |
|
|
| | | | | | 3,303,572 |
| | | | |
|
|
Road & Rail — 0.7% | | | | | |
Landstar System, Inc. | | 20,000 | | | 843,000 |
| | | | |
|
|
Semiconductors & Semiconductor Equipment — 1.9% |
OYO Geospace Corp.* | | 31,918 | | | 2,405,341 |
| | | | |
|
|
Software — 0.4% | | | | | |
Interactive Intelligence, Inc.* | | 16,985 | | | 447,555 |
| | | | |
|
|
Specialty Retail — 0.4% | | | | | |
Monro Muffler Brake, Inc.(a) | | 26,950 | | | 525,256 |
| | | | |
|
|
Telecommunications — 1.3% | | | | | |
EMS Technologies, Inc.* | | 35,439 | | | 1,071,676 |
Ixia*(a) | | 56,907 | | | 539,478 |
| | | | |
|
|
| | | | | | 1,611,154 |
| | | | |
|
|
Transportation Services — 0.8% | | | | | |
Heartland Express, Inc.(a) | | 30,166 | | | 427,754 |
HUB Group, Inc. (Class A Stock)*(a) | | 20,400 | | | 542,232 |
| | | | |
|
|
| | | | | | 969,986 |
| | | | |
|
|
| | | | | | |
COMMON STOCKS
(continued) | | Shares
| | Value
(Note 2)
| |
| | | | | | | |
Waste Management — 1.9% | | | | | | |
Waste Connections, Inc.*(a) | | 77,219 | | $ | 2,386,067 | |
| | | | |
|
|
|
TOTAL LONG-TERM INVESTMENTS (cost $101,555,956) | | | | | 122,191,614 | |
| | | | |
|
|
|
SHORT-TERM INVESTMENT — 47.4% | | | | | | |
Affiliated Money Market Mutual Fund | |
Dryden Core Investment
Fund Taxable Money Market Series; (cost $60,223,251;
includes $56,464,839 of cash collateral for securities
on loan)(b)(w)(Note 4) | | 60,223,251 | | | 60,223,251 | |
| | | | |
|
|
|
TOTAL INVESTMENTS — 143.7%
(cost $161,779,207) | | | 182,414,865 | |
LIABILITIES IN EXCESS OF
OTHER ASSETS — (43.7)% | | | (55,457,813 | ) |
| | | | |
|
|
|
NET ASSETS — 100.0% | | $ | 126,957,052 | |
| | | | |
|
|
|
The following abbreviation is used in portfolio descriptions:
| | |
| ADR | | American Depositary Receipt |
| * | Non-income producing security. |
| (a) | All or a portion of security is on loan. The aggregate market value of such securities is $53,453,878; cash collateral of $56,464,839 (included with liabilities) was received with which the portfolio purchased highly liquid short-term investments. |
| (b) | Represents security, or a portion thereof, purchased with cash collateral received for securities on loan. |
| (w) | Prudential Investments LLC, the manager of the Portfolio, also serves as manager of the Dryden Core Investment Fund-Taxable Money Market Series. |
SEE NOTES TO FINANCIAL STATEMENTS.
A69
| | | | |
| | | SP SMALL CAP GROWTH PORTFOLIO (Continued) | | |
SCHEDULE OF INVESTMENTS | December 31, 2007 |
The industry classification of investments and liabilities in excess of other assets shown as a percentage of net assets as of December 31, 2007 were as follows:
| | | |
Affiliated Money Market Mutual Fund (including 44.5% of collateral received from securities on loan) | | 47.4 | % |
Machinery & Equipment | | 7.3 | |
Medical Products | | 6.6 | |
Chemicals | | 4.7 | |
Financial Services | | 4.3 | |
Health Services | | 4.1 | |
Computer Services & Software | | 4.0 | |
Diversified Manufacturing Operations | | 3.8 | |
Internet Services | | 3.6 | |
Commercial Services | | 3.1 | |
Commercial Services & Supplies | | 3.1 | |
Oil, Gas & Consumable Fuels | | 2.9 | |
Distribution/Wholesale | | 2.6 | |
Retail | | 2.6 | |
Electronic Components | | 2.5 | |
Consumer Products & Services | | 2.4 | |
Building Materials | | 2.2 | |
Electronics | | 2.2 | |
Entertainment & Leisure | | 2.0 | |
Semiconductors & Semiconductor Equipment | | 1.9 | |
Waste Management | | 1.9 | |
Media | | 1.6 | |
Healthcare-Products | | 1.6 | |
Electrical Equipment | | 1.5 | |
Insurance | | 1.4 | |
Banking | | 1.3 | |
Telecommunications | | 1.3 | |
Oil & Gas Equipment & Services | | 1.2 | |
Medical Supplies & Equipment | | 1.2 | |
Computer Hardware | | 1.2 | |
Business Services | | 1.1 | |
Metals & Mining | | 1.1 | |
Automobile Manufacturers | | 0.9 | |
Clothing & Apparel | | 0.9 | |
Oil & Gas Exploration/Production | | 0.8 | |
Consulting | | 0.8 | |
Mineral Resources | | 0.8 | |
Transportation Services | | 0.8 | |
Office Equipment | | 0.7 | |
Road & Rail | | 0.7 | |
Energy Equipment & Services | | 0.7 | |
Publishing | | 0.6 | |
Healthcare Equipment & Supplies | | 0.6 | |
Restaurants | | 0.6 | |
Aerospace | | 0.5 | |
Healthcare – Services | | 0.5 | |
Pharmaceuticals | | 0.5 | |
Specialty Retail | | 0.4 | |
Oil & Field Services | | 0.4 | |
Household Products | | 0.4 | |
Machinery | | 0.4 | |
Healthcare Providers & Services | | 0.4 | |
Education | | 0.4 | |
Software | | 0.4 | |
Entertainment | | 0.3 | |
Financial – Brokerage | | 0.3 | |
Internet Software & Services | | 0.2 | |
| | |
|
|
| | | 143.7 | |
Liabilities in excess of other assets | | (43.7 | ) |
| | |
|
|
| | | 100.0 | % |
| | |
|
|
SEE NOTES TO FINANCIAL STATEMENTS.
A70
| | | | |
| | | SP SMALL CAP GROWTH PORTFOLIO (Continued) | | |
STATEMENT OF ASSETS AND LIABILITIES
December 31, 2007
| | | |
| ASSETS | | | |
Investments at value, including securities on loan of $53,453,878: | | | |
Unaffiliated investments (cost $101,555,956) | | $ | 122,191,614 |
Affiliated investments (cost $60,223,251) | | | 60,223,251 |
Cash | | | 497,099 |
Receivable for investments sold | | | 828,356 |
Dividends receivable | | | 79,390 |
Receivable for Series shares sold | | | 79,162 |
Prepaid expenses | | | 1,467 |
| | |
|
|
Total Assets | | | 183,900,339 |
| | |
|
|
| LIABILITIES | | | |
Collateral for securities on loan | | | 56,464,839 |
Payable for investments purchased | | | 228,396 |
Management fee payable | | | 102,711 |
Accrued expenses and other liabilities | | | 99,331 |
Payable for Series shares repurchased | | | 45,381 |
Deferred trustees’ fees | | | 1,930 |
Transfer agent fees payable | | | 699 |
| | |
|
|
Total Liabilities | | | 56,943,287 |
| | |
|
|
| NET ASSETS | | $ | 126,957,052 |
| | |
|
|
Net assets were comprised of: | | | |
Paid-in capital | | $ | 99,037,334 |
Retained earnings | | | 27,919,718 |
| | |
|
|
Net assets, December 31, 2007 | | $ | 126,957,052 |
| | |
|
|
Net asset value and redemption price per share, $126,957,052 / 16,683,374 outstanding shares of beneficial interest | | $ | 7.61 |
| | |
|
|
STATEMENT OF OPERATIONS
Year Ended December 31, 2007
| | | | |
| INVESTMENT INCOME | | | | |
Unaffiliated dividend income (net of $2,096 foreign withholding tax) | | $ | 597,053 | |
Affiliated income from securities lending, net | | | 281,278 | |
Affiliated dividend income | | | 227,101 | |
| | |
|
|
|
| | | | 1,105,432 | |
| | |
|
|
|
| EXPENSES | | | | |
Management fee | | | 1,273,298 | |
Custodian’s fees and expenses | | | 69,000 | |
Shareholders’ reports | | | 35,000 | |
Audit fee | | | 19,000 | |
Trustees’ fees | | | 11,000 | |
Legal fees and expenses | | | 8,000 | |
Transfer agent’s fees and expenses (including affiliated expense of $4,000) (Note 4) | | | 4,000 | |
Loan interest expense (Note 8) | | | 1,144 | |
Insurance expenses | | | 1,000 | |
Commitment fee on syndicated credit agreement | | | 300 | |
Miscellaneous | | | 8,905 | |
| | |
|
|
|
Total expenses | | | 1,430,647 | |
| | |
|
|
|
| NET INVESTMENT LOSS | | | (325,215 | ) |
| | |
|
|
|
| NET REALIZED AND UNREALIZED GAIN ON INVESTMENTS | | | | |
Net realized gain on investment transactions | | | 7,864,901 | |
Net change in unrealized appreciation (depreciation) on investments | | | 229,873 | |
| | |
|
|
|
| NET GAIN ON INVESTMENTS | | | 8,094,774 | |
| | |
|
|
|
| NET INCREASE IN NET ASSETS RESULTING FROM OPERATIONS | | $ | 7,769,559 | |
| | |
|
|
|
STATEMENT OF CHANGES IN NET ASSETS
| | | | | | | | |
| | | Year Ended December 31,
| |
| | | 2007
| | | 2006
| |
| INCREASE (DECREASE) IN NET ASSETS | | | | | | | | |
| OPERATIONS: | | | | | | | | |
Net investment loss | | $ | (325,215 | ) | | $ | (650,228 | ) |
Net realized gain on investment transactions | | | 7,864,901 | | | | 7,022,235 | |
Net change in unrealized appreciation (depreciation) on investments | | | 229,873 | | | | 10,012,719 | |
| | |
|
|
| |
|
|
|
NET INCREASE IN NET ASSETS RESULTING FROM OPERATIONS | | | 7,769,559 | | | | 16,384,726 | |
| | |
|
|
| |
|
|
|
| DISTRIBUTIONS | | | (4,795,892 | ) | | | — | |
| | |
|
|
| |
|
|
|
| SERIES SHARE TRANSACTIONS: | | | | | | | | |
Series shares sold [3,824,470 and 4,157,641 shares, respectively] | | | 30,796,089 | | | | 29,943,037 | |
Series shares issued in reinvestment of distributions [646,347 and 0 shares, respectively] | | | 4,795,892 | | | | — | |
Series shares repurchased [4,322,351 and 8,114,496 shares, respectively] | | | (34,625,132 | ) | | | (59,025,936 | ) |
| | |
|
|
| |
|
|
|
INCREASE (DECREASE) IN NET ASSETS RESULTING FROM SERIES SHARE TRANSACTIONS | | | 966,849 | | | | (29,082,899 | ) |
| | |
|
|
| |
|
|
|
| TOTAL INCREASE (DECREASE) IN NET ASSETS | | | 3,940,516 | | | | (12,698,173 | ) |
| NET ASSETS: | | | | | | | | |
Beginning of year | | | 123,016,536 | | | | 135,714,709 | |
| | |
|
|
| |
|
|
|
End of year | | $ | 126,957,052 | | | $ | 123,016,536 | |
| | |
|
|
| |
|
|
|
SEE NOTES TO FINANCIAL STATEMENTS.
A71
| | | | |
| | | SP SMALL CAP VALUE PORTFOLIO | | |
SCHEDULE OF INVESTMENTS | December 31, 2007 |
| | | | | |
| LONG-TERM INVESTMENTS — 96.2% | | Value
(Note 2)
|
| COMMON STOCKS | | Shares
| |
| | | | | | |
Aerospace & Defense — 2.2% | | | | | |
AAR Corp.*(a) | | 25,392 | | $ | 965,658 |
DRS Technologies, Inc. | | 38,910 | | | 2,111,646 |
Heico Corp. (Class A Stock) | | 45,800 | | | 1,951,080 |
Limco-Piedmont, Inc.* | | 48,913 | | | 607,010 |
Orbital Sciences Corp.*(a) | | 47,880 | | | 1,174,017 |
| | | | |
|
|
| | | | | | 6,809,411 |
| | | | |
|
|
Air Freight & Couriers — 0.2% | | | | | |
Pacer International, Inc. | | 51,773 | | | 755,886 |
| | | | |
|
|
Airlines — 0.9% | | | | | |
AirTran Holdings, Inc.*(a) | | 373,305 | | | 2,672,864 |
| | | | |
|
|
Auto Components — 1.3% | | | | | |
Cooper Tire & Rubber Co.(a) | | 84,200 | | | 1,396,036 |
Sauer-Danfoss, Inc. | | 48,500 | | | 1,214,925 |
Superior Industries International, Inc. | | 60,160 | | | 1,093,107 |
WABCO Holdings, Inc. | | 7,700 | | | 385,693 |
| | | | |
|
|
| | | | | | 4,089,761 |
| | | | |
|
|
Automobile Manufacturers — 0.4% | | | | | |
Wabash National Corp. | | 169,533 | | | 1,303,709 |
| | | | |
|
|
Automotive Parts — 0.7% | | | | | |
Commercial Vehicle Group, Inc.* | | 55,553 | | | 805,518 |
Tenneco Automotive, Inc.*(a) | | 47,072 | | | 1,227,167 |
| | | | |
|
|
| | | | | | 2,032,685 |
| | | | |
|
|
Banks — 0.5% | | | | | |
Bridge Capital Holdings* | | 10,703 | | | 229,044 |
East West Bancorp, Inc. | | 4,763 | | | 115,407 |
Pinnacle Financial Partners, Inc.* | | 6,175 | | | 156,969 |
Sterling Bancshares, Inc. (TX) | | 30,705 | | | 342,668 |
Trico Bancshares | | 7,421 | | | 143,225 |
UMB Financial Corp.(a) | | 4,480 | | | 171,853 |
West Coast Bancorp(a) | | 22,553 | | | 417,231 |
| | | | |
|
|
| | | | | | 1,576,397 |
| | | | |
|
|
Basic Materials – Mining — 0.3% | | | | | |
Olympic Steel, Inc. | | 29,289 | | | 928,754 |
| | | | |
|
|
Building Materials — 0.9% | | | | | |
Comfort Systems USA, Inc. | | 114,478 | | | 1,463,029 |
Universal Forest Products, Inc. | | 46,968 | | | 1,383,677 |
| | | | |
|
|
| | | | | | 2,846,706 |
| | | | |
|
|
Building Products — 2.0% | | | | | |
Gibraltar Industries, Inc. | | 100,090 | | | 1,543,388 |
Goodman Global, Inc.* | | 106,627 | | | 2,616,626 |
Patrick Industries, Inc.* | | 90,700 | | | 903,372 |
Simpson Manufacturing Co, Inc.(a) | | 39,500 | | | 1,050,305 |
| | | | |
|
|
| | | | | | 6,113,691 |
| | | | |
|
|
Business Services — 0.4% | | | | | |
LECG Corp.*(a) | | 37,908 | | | 570,895 |
Resources Connection, Inc. | | 39,721 | | | 721,333 |
| | | | |
|
|
| | | | | | 1,292,228 |
| | | | |
|
|
Chemicals — 2.2% | | | | | |
H.B. Fuller Co.(a) | | 63,989 | | | 1,436,553 |
KMG Chemicals, Inc.(a) | | 43,962 | | | 635,691 |
Minerals Technologies, Inc.(a) | | 27,655 | | | 1,851,502 |
| | | | | |
| COMMON STOCKS | | Value
(Note 2)
|
| (continued) | | Shares
| |
| | | | | | |
Chemicals (continued) | | | | | |
PolyOne Corp.*(a) | | 131,923 | | $ | 868,053 |
UAP Holding Corp. | | 52,819 | | | 2,038,813 |
| | | | |
|
|
| | | | | | 6,830,612 |
| | | | |
|
|
Clothing & Apparel — 0.3% | | | | | |
Gymboree Corp.*(a) | | 16,552 | | | 504,174 |
K-Swiss, Inc. (Class A Stock) | | 27,643 | | | 500,338 |
| | | | |
|
|
| | | | | | 1,004,512 |
| | | | |
|
|
Commercial Banks — 4.5% | | | | | |
Alabama National Bancorp | | 11,307 | | | 879,798 |
Bancorp Bank (The)* | | 59,498 | | | 800,843 |
Cardinal Financial Corp. | | 44,801 | | | 417,546 |
Cascade Financial Corp. | | 108,965 | | | 1,481,924 |
Central Pacific Financial Corp.(a) | | 79,818 | | | 1,473,440 |
City National Corp.(a) | | 13,800 | | | 821,790 |
Cullen Frost Bankers, Inc. | | 28,900 | | | 1,464,074 |
First Security Group, Inc. | | 100,590 | | | 902,292 |
FNB Corp.(a) | | 54,243 | | | 797,372 |
Midwest Banc Holdings, Inc.(a) | | 67,300 | | | 835,866 |
PAB Bankshares, Inc. | | 17,470 | | | 220,646 |
Tompkins Trustco, Inc.(a) | | 11,260 | | | 436,888 |
UCBH Holdings, Inc. | | 100,600 | | | 1,424,496 |
Umpqua Holdings Corp. | | 94,900 | | | 1,455,766 |
Westamerica Bancorporation(a) | | 7,675 | | | 341,921 |
| | | | |
|
|
| | | | | | 13,754,662 |
| | | | |
|
|
Commercial Services — 0.3% | | | | | |
NuCO2, Inc.* | | 17,319 | | | 431,243 |
On Assignment, Inc.*(a) | | 49,146 | | | 344,514 |
| | | | |
|
|
| | | | | | 775,757 |
| | | | |
|
|
Commercial Services & Supplies — 1.6% | | | | | |
Bright Horizons Family Solutions, Inc.* | | 9,819 | | | 339,148 |
TrueBlue, Inc.* | | 70,000 | | | 1,013,600 |
United Stationers, Inc.*(a) | | 21,100 | | | 975,031 |
Watson Wyatt & Co. Holdings | | 54,599 | | | 2,533,940 |
| | | | |
|
|
| | | | | | 4,861,719 |
| | | | |
|
|
Communication Equipment — 3.0% | | | | | |
Bel Fuse, Inc. (Class B Stock) | | 15,700 | | | 459,539 |
Black Box Corp. | | 60,130 | | | 2,174,902 |
Digi International, Inc.*(a) | | 67,650 | | | 959,954 |
Dycom Industries, Inc.* | | 19,200 | | | 511,680 |
Foundry Networks, Inc.*(a) | | 117,000 | | | 2,049,840 |
Plantronics, Inc. | | 118,779 | | | 3,088,254 |
| | | | |
|
|
| | | | | | 9,244,169 |
| | | | |
|
|
Computer Hardware — 0.8% | | | | | |
Electronics for Imaging, Inc.*(a) | | 74,628 | | | 1,677,638 |
MTS Systems Corp. | | 12,048 | | | 514,088 |
Palm, Inc.(a) | | 62,539 | | | 396,497 |
| | | | |
|
|
| | | | | | 2,588,223 |
| | | | |
|
|
Computer Services & Software — 1.5% | | | | | |
ACI Worldwide, Inc.*(a) | | 45,980 | | | 875,459 |
Avid Technology, Inc.*(a) | | 29,206 | | | 827,698 |
Intervoice, Inc.*(a) | | 42,111 | | | 336,467 |
MSC.Software Corp.*(a) | | 32,328 | | | 419,941 |
Parametric Technology Corp.* | | 87,130 | | | 1,555,270 |
Progress Software Corp.*(a) | | 17,834 | | | 600,649 |
| | | | |
|
|
| | | | | | 4,615,484 |
| | | | |
|
|
SEE NOTES TO FINANCIAL STATEMENTS.
A72
| | | | |
| | | SP SMALL CAP VALUE PORTFOLIO (Continued) | | |
SCHEDULE OF INVESTMENTS | December 31, 2007 |
| | | | | |
| COMMON STOCKS | | Value
(Note 2)
|
| (continued) | | Shares
| |
| | | | | | |
Computers & Peripherals — 0.2% | | | | | |
Rimage Corp.*(a) | | 25,000 | | $ | 648,750 |
| | | | |
|
|
Construction — 0.4% | | | | | |
Modtech Holdings, Inc.* | | 60,690 | | | 54,014 |
Ryland Group, Inc.(a) | | 40,241 | | | 1,108,640 |
| | | | |
|
|
| | | | | | 1,162,654 |
| | | | |
|
|
Construction Materials — 0.1% | | | | | |
Vulcan Materials Co. | | 2,219 | | | 175,501 |
| | | | |
|
|
Consumer Products & Services — 0.7% | | | | | |
Elizabeth Arden, Inc.*(a) | | 48,226 | | | 981,399 |
Fossil, Inc.*(a) | | 23,972 | | | 1,006,345 |
Jarden Corp.*(a) | | 4,756 | | | 112,289 |
| | | | |
|
|
| | | | | | 2,100,033 |
| | | | |
|
|
Containers & Packaging — 0.8% | | | | | |
AptarGroup, Inc.(a) | | 60,200 | | | 2,462,782 |
| | | | |
|
|
Distribution/Wholesale — 0.7% | | | | | |
Owens & Minor, Inc.(a) | | 20,737 | | | 879,871 |
Watsco, Inc.(a) | | 38,183 | | | 1,403,607 |
| | | | |
|
|
| | | | | | 2,283,478 |
| | | | |
|
|
Diversified Consumer Services — 0.5% | | | | | |
Steiner Leisure Ltd.* | | 34,850 | | | 1,538,976 |
| | | | |
|
|
Electric Utilities — 0.2% | | | | | |
MGE Energy, Inc. | | 16,484 | | | 584,687 |
| | | | |
|
|
Electrical Equipment — 0.9% | | | | | |
Hubbell, Inc. (Class B Stock) | | 19,000 | | | 980,400 |
Regal-Beloit Corp.(a) | | 42,100 | | | 1,892,395 |
| | | | |
|
|
| | | | | | 2,872,795 |
| | | | |
|
|
Electronic Components — 0.6% | | | | | |
Empire District Electric Co. (The)(a) | | 37,203 | | | 847,485 |
GrafTech International Ltd.*(a) | | 47,307 | | | 839,699 |
| | | | |
|
|
| | | | | | 1,687,184 |
| | | | |
|
|
Electronics — 0.3% | | | | | |
Belden CDT, Inc.(a) | | 9,447 | | | 420,392 |
Benchmark Electronics, Inc.* | | 24,959 | | | 442,523 |
| | | | |
|
|
| | | | | | 862,915 |
| | | | |
|
|
Energy Equipment & Services — 0.8% | | | | | |
National-Oilwell Varco, Inc.* | | 29,000 | | | 2,130,340 |
Superior Well Services, Inc.*(a) | | 20,600 | | | 437,132 |
| | | | |
|
|
| | | | | | 2,567,472 |
| | | | |
|
|
Engineering/Construction — 0.7% | | | | | |
EMCOR Group, Inc.* | | 43,700 | | | 1,032,631 |
Perini Corp.* | | 29,700 | | | 1,230,174 |
| | | | |
|
|
| | | | | | 2,262,805 |
| | | | |
|
|
Entertainment & Leisure — 0.3% | | | | | |
Boyd Gaming Corp. | | 22,348 | | | 761,397 |
Isle of Capri Casinos, Inc.*(a) | | 14,590 | | | 200,904 |
| | | | |
|
|
| | | | | | 962,301 |
| | | | |
|
|
Environmental Services — 0.5% | | | | | |
Waste Connections, Inc.*(a) | | 49,182 | | | 1,519,724 |
| | | | |
|
|
Equipment Services — 0.3% | | | | | |
Aaron Rents, Inc.(a) | | 46,813 | | | 900,682 |
| | | | |
|
|
| | | | | |
| COMMON STOCKS | | Value
(Note 2)
|
| (continued) | | Shares
| |
| | | | | | |
Exchange Traded Funds — 3.0% | | | | | |
iShares Nasdaq Biotechnology Index Fund(a) | | 22,900 | | $ | 1,859,022 |
iShares Russell 2000 Value Index Fund | | 104,869 | | | 7,408,995 |
| | | | |
|
|
| | | | | | 9,268,017 |
| | | | |
|
|
Financial – Bank & Trust — 4.9% | | | | | |
Bank of Hawaii Corp.(a) | | 12,036 | | | 615,521 |
Bank of The Ozarks, Inc. | | 30,817 | | | 807,405 |
Cascade Bancorp(a) | | 4,489 | | | 62,487 |
CoBiz Financial, Inc. | | 55,251 | | | 821,582 |
Columbia Banking System, Inc. | | 26,558 | | | 789,569 |
First Community Bancorp, Inc.(a) | | 12,803 | | | 527,996 |
First Financial Bankshare, Inc.(a) | | 31,973 | | | 1,203,784 |
Glacier Bancorp, Inc.(a) | | 84,966 | | | 1,592,263 |
Hancock Holding Co.(a) | | 20,980 | | | 801,436 |
IBERIABANK Corp. | | 45,427 | | | 2,123,712 |
Millennium Bankshares Corp. | | 39,247 | | | 207,224 |
NewAlliance Bancshares, Inc. | | 33,444 | | | 385,275 |
Nexity Financial Corp.* | | 18,443 | | | 122,462 |
Preferred Bank | | 12,617 | | | 328,294 |
Prosperity Bancshares, Inc. | | 48,905 | | | 1,437,318 |
Signature Bank*(a) | | 55,454 | | | 1,871,573 |
Southcoast Financial Corp.* | | 15,555 | | | 221,656 |
Sterling Bancorp | | 16,610 | | | 226,560 |
Summit State Bank | | 11,568 | | | 93,122 |
Texas Capital Banshares, Inc.* | | 22,518 | | | 410,954 |
United Community Banks, Inc.(a) | | 29,560 | | | 467,048 |
WSFS Financial Corp. | | 1,450 | | | 72,790 |
| | | | |
|
|
| | | | | | 15,190,031 |
| | | | |
|
|
Financial – Brokerage — 0.2% | | | | | |
Compass Diversified Trust | | 40,270 | | | 600,023 |
| | | | |
|
|
Financial – Securities/Asset Management — 0.1% | | | |
Gladstone Capital Corp.(a) | | 24,116 | | | 409,972 |
| | | | |
|
|
Financial Services — 1.8% | | | | | |
Berkshire Hills Bancorp, Inc. | | 18,838 | | | 489,788 |
Brookline Bancorp, Inc. | | 61,152 | | | 621,304 |
Financial Federal Corp.(a) | | 88,776 | | | 1,978,817 |
First Niagara Financial Group, Inc.(a) | | 30,635 | | | 368,845 |
Highland Distressed Opportunities, Inc. | | 52,860 | | | 453,010 |
Knight Capital Group, Inc. (Class A Stock)* | | 28,942 | | | 416,765 |
PennantPark Investment Corp. | | 56,390 | | | 565,028 |
RSC Holdings, Inc.*(a) | | 49,274 | | | 618,389 |
| | | | |
|
|
| | | | | | 5,511,946 |
| | | | |
|
|
Food & Staples Retailing — 0.3% | | | | | |
Weis Markets, Inc. | | 20,660 | | | 825,160 |
| | | | |
|
|
Food Products — 1.1% | | | | | |
Del Monte Foods Co. | | 232,600 | | | 2,200,396 |
Nash Finch Co.(a) | | 8,747 | | | 308,594 |
Smithfield Foods, Inc.* | | 33,800 | | | 977,496 |
| | | | |
|
|
| | | | | | 3,486,486 |
| | | | |
|
|
Gas Utilities — 0.7% | | | | | |
Atmos Energy Corp. | | 1,816 | | | 50,921 |
New Jersey Resources Corp.(a) | | 19,900 | | | 995,398 |
Northwest Natural Gas Co.(a) | | 24,900 | | | 1,211,634 |
| | | | |
|
|
| | | | | | 2,257,953 |
| | | | |
|
|
SEE NOTES TO FINANCIAL STATEMENTS.
A73
| | | | |
| | | SP SMALL CAP VALUE PORTFOLIO (Continued) | | |
SCHEDULE OF INVESTMENTS | December 31, 2007 |
| | | | | |
| COMMON STOCKS | | Value
(Note 2)
|
| (continued) | | Shares
| |
| | | | | | |
Healthcare Equipment & Supplies — 0.4% | | | |
National Dentex Corp.* | | 72,780 | | $ | 1,173,214 |
| | | | |
|
|
Healthcare Providers & Services — 1.4% | | | |
Cross Country, Inc.*(a) | | 78,300 | | | 1,114,992 |
LifePoint Hospitals, Inc.* | | 47,890 | | | 1,424,249 |
Rehabcare Group, Inc.* | | 73,300 | | | 1,653,648 |
| | | | |
|
|
| | | | | | 4,192,889 |
| | | | |
|
|
Healthcare Services — 0.2% | | | | | |
Pediatrix Medical Group, Inc.* | | 8,100 | | | 552,015 |
| | | | |
|
|
Healthcare-Products — 0.5% | | | | | |
American Medical Systems Holdings, Inc.*(a) | | 109,778 | | | 1,587,390 |
| | | | |
|
|
Hotels, Restaurants & Leisure — 0.7% | | | | | |
O’ Charleys, Inc. | | 122,900 | | | 1,841,042 |
Ruby Tuesday, Inc.(a) | | 37,600 | | | 366,600 |
| | | | |
|
|
| | | | | | 2,207,642 |
| | | | |
|
|
Household Durables — 1.6% | | | | | |
Furniture Brands International, Inc.(a) | | 133,000 | | | 1,337,980 |
Snap-On, Inc. | | 28,000 | | | 1,350,720 |
Tupperware Corp.(a) | | 63,700 | | | 2,104,011 |
| | | | |
|
|
| | | | | | 4,792,711 |
| | | | |
|
|
Household Products — 0.3% | | | | | |
Central Garden And Pet Co.*(a) | | 151,020 | | | 809,467 |
| | | | |
|
|
Industrial Products — 0.1% | | | | | |
EnergySolutions, Inc.* | | 13,188 | | | 355,944 |
| | | | |
|
|
Information Technology Services — 0.6% | | | |
MedQuist, Inc.* | | 23,170 | | | 250,004 |
Perot Systems Corp. (Class A Stock)*(a) | | 127,800 | | | 1,725,300 |
| | | | |
|
|
| | | | | | 1,975,304 |
| | | | |
|
|
Insurance — 5.0% | | | | | |
Allied World Assurance Holdings Ltd. | | 50,910 | | | 2,554,155 |
American Equity Investment Life Holding Co.(a) | | 114,737 | | | 951,170 |
Aspen Insurance Holdings Ltd. (Bermuda) | | 32,347 | | | 932,888 |
CNA Financial Corp.* | | 73,492 | | | 1,454,407 |
Donegal Group, Inc. | | 23,969 | | | 411,548 |
EMC Insurance Group, Inc.(a) | | 33,620 | | | 795,785 |
Max Capital Group Ltd. (Bermuda) | | 34,301 | | | 960,085 |
Meadowbrook Insurance Group, Inc.*(a) | | 170,775 | | | 1,606,993 |
Midland Co. (The) | | 19,273 | | | 1,246,770 |
National Atlantic Holdings Corp.* | | 24,438 | | | 108,260 |
Navigators Group, Inc.* | | 10,540 | | | 685,100 |
ProAssurance Corp.*(a) | | 31,445 | | | 1,726,959 |
Procentury Corp. | | 62,241 | | | 955,399 |
RLI Corp. | | 15,136 | | | 859,573 |
Security Capital Assurance Ltd.(a) | | 30,784 | | | 119,750 |
| | | | |
|
|
| | | | | | 15,368,842 |
| | | | |
|
|
Internet Services — 0.5% | | | | | |
Ariba, Inc.*(a) | | 109,562 | | | 1,221,616 |
RealNetworks, Inc.*(a) | | 71,082 | | | 432,889 |
| | | | |
|
|
| | | | | | 1,654,505 |
| | | | |
|
|
Leisure Equipment & Products — 0.2% | | | | | |
Callaway Gulf Co.(a) | | 28,165 | | | 490,916 |
| | | | |
|
|
| | | | | |
| COMMON STOCKS | | Value
(Note 2)
|
| (continued) | | Shares
| |
| | | | | | |
Life Science Tools & Services — 0.2% | | | | | |
Enzo Biochem, Inc.*(a) | | 56,500 | | $ | 719,810 |
| | | | |
|
|
Machinery — 4.9% | | | | | |
Albany International Corp. (Class A Stock)(a) | | 52,900 | | | 1,962,590 |
Astec Industries, Inc.*(a) | | 6,298 | | | 234,223 |
IDEX Corp. | | 51,400 | | | 1,857,082 |
Kaydon Corp.(a) | | 41,300 | | | 2,252,502 |
Kennametal, Inc. | | 50,620 | | | 1,916,473 |
Mueller Industries, Inc. | | 61,864 | | | 1,793,437 |
RBC Bearings, Inc.*(a) | | 75,791 | | | 3,293,877 |
Wabtec Corp.(a) | | 54,400 | | | 1,873,536 |
| | | | |
|
|
| | | | | | 15,183,720 |
| | | | |
|
|
Machinery & Equipment — 1.3% | | | | | |
Actuant Corp. (Class A Stock)(a) | | 38,839 | | | 1,320,914 |
Applied Industrial Technologies, Inc. | | 42,263 | | | 1,226,472 |
Franklin Electric Co., Inc.(a) | | 16,028 | | | 613,392 |
Tennant Co. | | 21,851 | | | 967,781 |
| | | | |
|
|
| | | | | | 4,128,559 |
| | | | |
|
|
Marine — 0.7% | | | | | |
Kirby Corp.* | | 49,000 | | | 2,277,520 |
| | | | |
|
|
Medical Supplies & Equipment — 1.2% | | | | | |
Cardiac Science Corp.* | | 107,152 | | | 866,860 |
Edwards Lifesciences Corp.*(a) | | 22,804 | | | 1,048,756 |
PSS World Medical, Inc.*(a) | | 58,549 | | | 1,145,804 |
Symmetry Medical, Inc.*(a) | | 39,950 | | | 696,328 |
| | | | |
|
|
| | | | | | 3,757,748 |
| | | | |
|
|
Metals & Mining — 0.5% | | | | | |
Commercial Metals Co. | | 26,164 | | | 770,530 |
Kaiser Aluminum Corp.(a) | | 10,432 | | | 829,135 |
| | | | |
|
|
| | | | | | 1,599,665 |
| | | | |
|
|
Multi-Line Retail — 0.3% | | | | | |
Dillard’s, Inc. (Class A Stock)(a) | | 46,500 | | | 873,270 |
| | | | |
|
|
Office Equipment — 0.4% | | | | | |
IKON Office Solutions, Inc.(a) | | 86,396 | | | 1,124,876 |
| | | | |
|
|
Oil, Gas & Consumable Fuels — 5.5% | | | | | |
Concho Resources, Inc.* | | 99,506 | | | 2,050,819 |
Denbury Resources, Inc.* | | 60,500 | | | 1,799,875 |
ION Geophysical Corp.*(a) | | 122,600 | | | 1,934,628 |
Oil States International*(a) | | 44,491 | | | 1,518,033 |
Parallel Petroleum Corp.*(a) | | 54,969 | | | 969,103 |
Rex Energy Corp.* | | 84,614 | | | 1,009,445 |
South Jersey Industries, Inc.(a) | | 34,250 | | | 1,236,082 |
Southwest Gas Corp. | | 25,076 | | | 746,513 |
W-H Energy Services, Inc.*(a) | | 34,086 | | | 1,915,974 |
Williams Partners LP | | 27,488 | | | 1,077,530 |
XTO Energy, Inc. | | 54,425 | | | 2,795,268 |
| | | | |
|
|
| | | | | | 17,053,270 |
| | | | |
|
|
Paper & Forest Products — 0.1% | | | | | |
Caraustar Industries, Inc.* | | 144,974 | | | 447,970 |
| | | | |
|
|
Pharmaceuticals — 0.8% | | | | | |
Bentley Pharmaceuticals, Inc.*(a) | | 120,500 | | | 1,818,345 |
Medarex, Inc.*(a) | | 75,291 | | | 784,532 |
| | | | |
|
|
| | | | | | 2,602,877 |
| | | | |
|
|
SEE NOTES TO FINANCIAL STATEMENTS.
A74
| | | | |
| | | SP SMALL CAP VALUE PORTFOLIO (Continued) | | |
SCHEDULE OF INVESTMENTS | December 31, 2007 |
| | | | | |
| COMMON STOCKS | | Value
(Note 2)
|
| (continued) | | Shares
| |
| | | | | | |
Real Estate Investment Trust – Apartment — 0.4% | | | |
American Campus Communities, Inc.(a) | | 49,367 | | $ | 1,325,504 |
| | | | |
|
|
Real Estate Investment Trust – Other REIT — 1.3% | | | |
Acadia Realty Trust(a) | | 32,467 | | | 831,480 |
Digital Realty Trust, Inc.(a) | | 33,477 | | | 1,284,513 |
Omega Healthcare Investors, Inc.(a) | | 77,877 | | | 1,249,926 |
U-Store-It Trust(a) | | 78,459 | | | 718,684 |
| | | | |
|
|
| | | | | | 4,084,603 |
| | | | |
|
|
Real Estate Investment Trusts — 4.7% | | | | | |
American Land Lease, Inc. | | 30,000 | | | 594,900 |
Annaly Mortgage Management, Inc. | | 92,200 | | | 1,676,196 |
Biomed Realty Trust, Inc.(a) | | 121,956 | | | 2,825,721 |
Cogdell Spencer, Inc. | | 31,514 | | | 502,018 |
Cousins Properties, Inc.(a) | | 49,600 | | | 1,096,160 |
Duke Realty Corp. | | 21,100 | | | 550,288 |
Entertainment Properties Trust(a) | | 13,834 | | | 650,198 |
LaSalle Hotel Properties(a) | | 41,000 | | | 1,307,900 |
Lexington Corp. Properties Trust(a) | | 28,033 | | | 407,600 |
Liberty Property Trust | | 18,700 | | | 538,747 |
Mid-America Apartment Communities, Inc.(a) | | 36,150 | | | 1,545,412 |
National Retail Properties(a) | | 57,130 | | | 1,335,699 |
Parkway Properties, Inc. | | 43,302 | | | 1,601,308 |
| | | | |
|
|
| | | | | | 14,632,147 |
| | | | |
|
|
Restaurants — 0.7% | | | | | |
California Pizza Kitchen, Inc.*(a) | | 33,849 | | | 527,029 |
CEC Entertainment, Inc.* | | 41,537 | | | 1,078,300 |
Einstein Noah Restaurant Group, Inc.* | | 31,914 | | | 579,239 |
| | | | |
|
|
| | | | | | 2,184,568 |
| | | | |
|
|
Retail & Merchandising — 2.9% | | | | | |
Asbury Automotive Group, Inc. | | 41,321 | | | 621,881 |
Big Lots, Inc.* | | 45,325 | | | 724,747 |
Cache, Inc.* | | 65,531 | | | 612,059 |
Casey’s General Stores, Inc.(a) | | 153,459 | | | 4,543,921 |
Charming Shoppes, Inc.*(a) | | 86,027 | | | 465,406 |
Hot Topic, Inc.*(a) | | 25,899 | | | 150,732 |
Insight Enterprises, Inc.*(a) | | 22,558 | | | 411,458 |
Pacific Sunwear of California, Inc.*(a) | | 55,920 | | | 789,031 |
School Specialty, Inc.*(a) | | 18,225 | | | 629,674 |
| | | | |
|
|
| | | | | | 8,948,909 |
| | | | |
|
|
Road & Rail — 0.1% | | | | | |
Landstar System, Inc. | | 5,715 | | | 240,887 |
| | | | |
|
|
Semiconductors & Semiconductor Equipment — 5.3% |
AMIS Holdings, Inc.* | | 56,294 | | | 564,066 |
ATMI, Inc.* | | 15,013 | | | 484,169 |
Cabot Microelectronics Corp.*(a) | | 29,300 | | | 1,052,163 |
Cirrus Logic, Inc.* | | 196,575 | | | 1,037,916 |
Emulex Corp.*(a) | | 61,450 | | | 1,002,864 |
Entegris, Inc.* | | 239,530 | | | 2,067,144 |
Exar Corp.*(a) | | 124,200 | | | 989,874 |
Fairchild Semiconductor International, Inc.* | | 124,400 | | | 1,795,092 |
Form Factor, Inc.* | | 24,267 | | | 803,238 |
Intergrated Device Technology, Inc.* | | 76,683 | | | 867,285 |
| | | | | |
| COMMON STOCKS | | Value
(Note 2)
|
| (continued) | | Shares
| |
| | | | | | |
Semiconductors & Semiconductor Equipment (continued) | | | | | |
Kulicke & Soffa Industries, Inc.*(a) | | 258,200 | | $ | 1,771,252 |
Omnivision Technologies, Inc.*(a) | | 73,600 | | | 1,151,840 |
Tessera Technologies, Inc.* | | 17,157 | | | 713,731 |
Verigy Ltd. (Singapore)* | | 80,900 | | | 2,198,053 |
| | | | |
|
|
| | | | | | 16,498,687 |
| | | | |
|
|
Software — 2.4% | | | | | |
EPIQ Systems, Inc.*(a) | | 102,650 | | | 1,787,137 |
Lawson Software, Inc.*(a) | | 236,500 | | | 2,421,760 |
McAfee, Inc.* | | 40,200 | | | 1,507,500 |
Sybase, Inc.*(a) | | 63,838 | | | 1,665,533 |
| | | | |
|
|
| | | | | | 7,381,930 |
| | | | |
|
|
Specialty Retail — 1.6% | | | | | |
Aeropostale, Inc.*(a) | | 14,409 | | | 381,839 |
Buckle, Inc. (The) | | 44,550 | | | 1,470,150 |
Cato Corp. (Class A Stock) | | 74,470 | | | 1,166,200 |
Lithia Motors, Inc. (Class A Stock)(a) | | 55,557 | | | 762,798 |
West Marine, Inc.*(a) | | 128,480 | | | 1,153,750 |
| | | | |
|
|
| | | | | | 4,934,737 |
| | | | |
|
|
Telecommunications — 1.4% | | | | | |
Anixter International, Inc.*(a) | | 12,471 | | | 776,569 |
CommScope, Inc.* | | 1,169 | | | 57,543 |
Polycom, Inc.*(a) | | 18,952 | | | 526,486 |
Premiere Global Services, Inc.*(a) | | 26,416 | | | 392,278 |
RCN Corp.* | | 60,640 | | | 945,378 |
Tekelec*(a) | | 121,425 | | | 1,517,812 |
| | | | |
|
|
| | | | | | 4,216,066 |
| | | | |
|
|
Textiles — 0.3% | | | | | |
G & K Services, Inc. (Class A Stock) | | 27,226 | | | 1,021,519 |
| | | | |
|
|
Textiles, Apparel & Luxury Goods — 0.4% | | | |
Timberland Co. (The) (Class A Stock)*(a) | | 73,300 | | | 1,325,264 |
| | | | |
|
|
Thrifts & Mortgage Finance — 0.6% | | | | | |
City Bank/Lynnwood WA(a) | | 42,680 | | | 956,886 |
Flushing Financial Corp. | | 10,102 | | | 162,137 |
PMI Group, Inc. (The) | | 41,480 | | | 550,854 |
Washington Federal, Inc. | | 14,223 | | | 300,248 |
| | | | |
|
|
| | | | | | 1,970,125 |
| | | | |
|
|
Transportation — 0.6% | | | | | |
Forward Air Corp. | | 27,116 | | | 845,206 |
Heartland Express, Inc.(a) | | 62,686 | | | 888,887 |
| | | | |
|
|
| | | | | | 1,734,093 |
| | | | |
|
|
Utilities — 2.0% | | | | | |
Allete, Inc. | | 1,212 | | | 47,971 |
Cleco Corp. | | 47,207 | | | 1,312,355 |
El Paso Electric Co.*(a) | | 113,174 | | | 2,893,859 |
Sierra Pacific Resources | | 20,110 | | | 341,468 |
Unisource Energy Corp. | | 9,853 | | | 310,862 |
Westar Energy, Inc.(a) | | 45,517 | | | 1,180,711 |
| | | | |
|
|
| | | | | | 6,087,226 |
| | | | |
|
|
TOTAL LONG-TERM INVESTMENTS
(cost $297,555,000) | | | 297,755,946 |
| | | | |
|
|
SEE NOTES TO FINANCIAL STATEMENTS.
A75
| | | | |
| | | SP SMALL CAP VALUE PORTFOLIO (Continued) | | |
SCHEDULE OF INVESTMENTS | December 31, 2007 |
| | | | | | |
SHORT-TERM
INVESTMENT — 41.2% | | Shares
| | Value
(Note 2)
| |
| | | | | | | |
Affiliated Money Market Mutual Fund | | | | | | |
Dryden Core Investment Fund —Taxable Money Market Series (cost $127,483,039; includes $114,414,638 of cash collateral for securities on loan)(b)(w)(Note 4) | | 127,483,039 | | $ | 127,483,039 | |
| | | | |
|
|
|
TOTAL INVESTMENTS — 137.4%
(cost $425,038,039; Note 6) | | | 425,238,985 | |
LIABILITIES IN EXCESS OF OTHER ASSETS — (37.4)% | | | (115,802,944 | ) |
| | | | |
|
|
|
NET ASSETS — 100.0% | | $ | 309,436,041 | |
| | | | |
|
|
|
| * | Non-income producing security. |
| (a) | All or a portion of security is on loan. The aggregate market value of such securities is $108,449,171; cash collateral of $114,414,638 (included with liabilities) was received with which the portfolio purchased highly liquid short-term investments. |
| (b) | Represents security, or a portion thereof, purchased with cash collateral received for securities on loan. |
| (w) | Prudential Investments LLC, the manager of the Portfolio, also serves as manager of the Dryden Core Investment Fund-Taxable Money Market Series. |
SEE NOTES TO FINANCIAL STATEMENTS.
A76
| | | | |
| | | SP SMALL CAP VALUE PORTFOLIO (Continued) | | |
SCHEDULE OF INVESTMENTS | December 31, 2007 |
The industry classification of investments and liabilities in excess of other assets shown as a percentage of net assets as of December 31, 2007 were as follows:
| | | |
Affiliated Money Market Mutual Fund (37.0% represents investments purchased with collateral from securities on loan) | | 41.2 | % |
Oil, Gas & Consumable Fuels | | 5.5 | |
Semiconductors & Semiconductor Equipment | | 5.3 | |
Insurance | | 5.0 | |
Financial – Bank & Trust | | 4.9 | |
Machinery | | 4.9 | |
Real Estate Investment Trusts | | 4.7 | |
Commercial Banks | | 4.5 | |
Exchange Traded Funds | | 3.0 | |
Communication Equipment | | 3.0 | |
Retail & Merchandising | | 2.9 | |
Software | | 2.4 | |
Chemicals | | 2.2 | |
Aerospace & Defense | | 2.2 | |
Building Products | | 2.0 | |
Utilities | | 2.0 | |
Financial Services | | 1.8 | |
Specialty Retail | | 1.6 | |
Commercial Services & Supplies | | 1.6 | |
Household Durables | | 1.6 | |
Computer Services & Software | | 1.5 | |
Telecommunications | | 1.4 | |
Healthcare Providers & Services | | 1.4 | |
Machinery & Equipment | | 1.3 | |
Auto Components | | 1.3 | |
Real Estate Investment Trust – Other REIT | | 1.3 | |
Medical Supplies & Equipment | | 1.2 | |
Food Products | | 1.1 | |
Electrical Equipment | | 0.9 | |
Building Materials | | 0.9 | |
Airlines | | 0.9 | |
Pharmaceuticals | | 0.8 | |
Computer Hardware | | 0.8 | |
Energy Equipment & Services | | 0.8 | |
Containers & Packaging | | 0.8 | |
Distribution/Wholesale | | 0.7 | |
Marine | | 0.7 | |
Engineering/Construction | | 0.7 | |
Gas Utilities | | 0.7 | |
Hotels, Restaurants & Leisure | | 0.7 | |
Restaurants | | 0.7 | |
Consumer Products & Services | | 0.7 | |
Automotive Parts | | 0.7 | |
Information Technology Services | | 0.6 | |
Thrifts & Mortgage Finance | | 0.6 | |
Transportation | | 0.6 | |
Electronic Components | | 0.6 | |
Metals & Mining | | 0.5 | |
Healthcare-Products | | 0.5 | |
Banks | | 0.5 | |
Diversified Consumer Services | | 0.5 | |
Environmental Services | | 0.5 | |
Internet Services | | 0.5 | |
Real Estate Investment Trust – Apartment | | 0.4 | |
Textiles, Apparel & Luxury Goods | | 0.4 | |
Automobile Manufacturers | | 0.4 | |
| | | |
Business Services | | 0.4 | % |
Healthcare Equipment & Supplies | | 0.4 | |
Construction | | 0.4 | |
Office Equipment | | 0.4 | |
Textiles | | 0.3 | |
Clothing & Apparel | | 0.3 | |
Entertainment & Leisure | | 0.3 | |
Basic Materials – Mining | | 0.3 | |
Equipment Services | | 0.3 | |
Multi-line Retail | | 0.3 | |
Electronics | | 0.3 | |
Food & Staples Retailing | | 0.3 | |
Household Products | | 0.3 | |
Commercial Services | | 0.3 | |
Air Freight & Couriers | | 0.2 | |
Life Science Tools & Services | | 0.2 | |
Computers & Peripherals | | 0.2 | |
Financial – Brokerage | | 0.2 | |
Electric Utilities | | 0.2 | |
Healthcare Services | | 0.2 | |
Leisure Equipment & Products | | 0.2 | |
Paper & Forest Products | | 0.1 | |
Financial – Securities/Asset Management | | 0.1 | |
Industrial Products | | 0.1 | |
Road & Rail | | 0.1 | |
Construction Materials | | 0.1 | |
| | |
|
|
| | | 137.4 | |
Liabilities in excess of other assets | | (37.4 | ) |
| | |
|
|
| | | 100.0 | % |
| | |
|
|
SEE NOTES TO FINANCIAL STATEMENTS.
A77
| | | | |
| | | SP SMALL CAP VALUE PORTFOLIO (Continued) | | |
STATEMENT OF ASSETS AND LIABILITIES
December 31, 2007
| | | |
| ASSETS | | | |
Investments at value, including securities on loan of $108,449,171: | | | |
Unaffiliated investments (cost $297,555,000) | | $ | 297,755,946 |
Affiliated investments (cost $127,483,039) | | | 127,483,039 |
Cash | | | 344,637 |
Dividends receivable | | | 640,261 |
Receivable for investments sold | | | 588,467 |
Receivable for Series shares sold | | | 138,238 |
Prepaid expenses | | | 2,976 |
| | |
|
|
Total Assets | | | 426,953,564 |
| | |
|
|
| LIABILITIES | | | |
Collateral for securities on loan | | | 114,414,638 |
Payable for investments purchased | | | 2,683,648 |
Management fee payable | | | 237,867 |
Accrued expenses and other liabilities | | | 89,366 |
Payable for Series shares repurchased | | | 89,163 |
Deferred trustees’ fees | | | 2,142 |
Transfer agent fees payable | | | 699 |
| | |
|
|
Total Liabilities | | | 117,517,523 |
| | |
|
|
| NET ASSETS | | $ | 309,436,041 |
| | |
|
|
Net assets were comprised of: | | | |
Paid-in capital | | $ | 280,070,251 |
Retained earnings | | | 29,365,790 |
| | |
|
|
Net assets, December 31, 2007 | | $ | 309,436,041 |
| | |
|
|
Net asset value and redemption price per share, $309,436,041 / 25,312,176 outstanding shares of beneficial interest | | $ | 12.22 |
| | |
|
|
STATEMENT OF OPERATIONS
Year Ended December 31, 2007
| | | | |
| INVESTMENT INCOME | | | | |
Unaffiliated dividend income | | $ | 5,054,444 | |
Affiliated dividend income | | | 643,896 | |
Affiliated income from securities lending, net | | | 533,297 | |
| | |
|
|
|
| | | | 6,231,637 | |
| | |
|
|
|
| EXPENSES | | | | |
Management fee | | | 3,163,339 | |
Custodian’s fees and expenses | | | 100,000 | |
Shareholders’ reports | | | 45,000 | |
Audit fee | | | 19,000 | |
Trustees’ fees | | | 13,000 | |
Insurance expenses | | | 7,000 | |
Legal fees and expenses | | | 6,000 | |
Transfer agent’s fees and expenses (including affiliated expense of $4,500) (Note 4) | | | 5,000 | |
Commitment fee on syndicated credit agreement | | | 1,000 | |
Miscellaneous | | | 15,522 | |
| | |
|
|
|
Total expenses | | | 3,374,861 | |
| | |
|
|
|
| NET INVESTMENT INCOME | | | 2,856,776 | |
| | |
|
|
|
| NET REALIZED AND UNREALIZED GAIN (LOSS) ON INVESTMENTS | | | | |
Net realized gain on investment transactions | | | 27,343,333 | |
Net change in unrealized appreciation (depreciation) on investments | | | (38,692,595 | ) |
| | |
|
|
|
| NET LOSS ON INVESTMENTS | | | (11,349,262 | ) |
| | |
|
|
|
| NET DECREASE IN NET ASSETS RESULTING FROM OPERATIONS | | $ | (8,492,486 | ) |
| | |
|
|
|
STATEMENT OF CHANGES IN NET ASSETS
| | | | | | | | |
| | | Year Ended December 31,
| |
| | | 2007
| | | 2006
| |
| INCREASE (DECREASE) IN NET ASSETS | | | | | | | | |
| OPERATIONS: | | | | | | | | |
Net investment income | | $ | 2,856,776 | | | $ | 2,529,284 | |
Net realized gain on investment transactions | | | 27,343,333 | | | | 19,857,258 | |
Net change in unrealized appreciation (depreciation) on investments | | | (38,692,595 | ) | | | 25,400,901 | |
| | |
|
|
| |
|
|
|
NET INCREASE (DECREASE) IN NET ASSETS RESULTING FROM OPERATIONS | | | (8,492,486 | ) | | | 47,787,443 | |
| | |
|
|
| |
|
|
|
| DISTRIBUTIONS | | | (22,383,872 | ) | | | (59,307,355 | ) |
| | |
|
|
| |
|
|
|
| SERIES SHARE TRANSACTIONS: | | | | | | | | |
Series shares sold [2,115,636 and 2,729,338 shares, respectively] | | | 29,174,651 | | | | 36,435,016 | |
Series shares issued in reinvestment of distributions [1,854,505 and 4,622,553 shares, respectively] | | | 22,383,872 | | | | 59,307,355 | |
Series shares repurchased [5,621,968 and 4,967,085 shares, respectively] | | | (80,228,555 | ) | | | (65,944,369 | ) |
| | |
|
|
| |
|
|
|
INCREASE (DECREASE) IN NET ASSETS RESULTING FROM SERIES SHARE TRANSACTIONS | | | (28,670,032 | ) | | | 29,798,002 | |
| | |
|
|
| |
|
|
|
| TOTAL INCREASE (DECREASE) IN NET ASSETS | | | (59,546,390 | ) | | | 18,278,090 | |
| NET ASSETS: | | | | | | | | |
Beginning of year | | | 368,982,431 | | | | 350,704,341 | |
| | |
|
|
| |
|
|
|
End of year | | $ | 309,436,041 | | | $ | 368,982,431 | |
| | |
|
|
| |
|
|
|
SEE NOTES TO FINANCIAL STATEMENTS.
A78
| | | | |
| | | SP STRATEGIC PARTNERS FOCUSED GROWTH PORTFOLIO | | |
SCHEDULE OF INVESTMENTS | December 31, 2007 |
| | | | | |
| LONG-TERM INVESTMENTS — 99.2% | | |
| COMMON STOCKS | | Shares
| | Value
(Note 2)
|
| | | | | | |
Aerospace & Defense — 6.6% | | | | | |
Honeywell International, Inc. | | 20,800 | | $ | 1,280,656 |
United Technologies Corp. | | 39,700 | | | 3,038,638 |
| | | | |
|
|
| | | | | | 4,319,294 |
| | | | |
|
|
Beverages — 2.9% | | | | | |
PepsiCo, Inc. | | 25,000 | | | 1,897,500 |
| | | | |
|
|
Biotechnology — 7.1% | | | | | |
Celgene Corp.* | | 8,900 | | | 411,269 |
Genentech, Inc.* | | 9,000 | | | 603,630 |
Gilead Sciences, Inc.* | | 80,100 | | | 3,685,401 |
| | | | |
|
|
| | | | | | 4,700,300 |
| | | | |
|
|
Capital Markets — 9.3% | | | | | |
Charles Schwab Corp. (The) | | 60,200 | | | 1,538,110 |
Franklin Resources, Inc. | | 8,300 | | | 949,769 |
Goldman Sachs Group, Inc. (The) | | 10,750 | | | 2,311,788 |
Merrill Lynch & Co., Inc. | | 24,500 | | | 1,315,160 |
| | | | |
|
|
| | | | | | 6,114,827 |
| | | | |
|
|
Chemicals — 7.0% | | | | | |
Air Products & Chemicals, Inc. | | 8,600 | | | 848,218 |
Monsanto Co. | | 33,500 | | | 3,741,615 |
| | | | |
|
|
| | | | | | 4,589,833 |
| | | | |
|
|
Communication Equipment — 9.5% | | | | | |
Cisco Systems, Inc.* | | 124,200 | | | 3,362,094 |
Research In Motion Ltd. (Canada)* | | 25,200 | | | 2,857,680 |
| | | | |
|
|
| | | | | | 6,219,774 |
| | | | |
|
|
Computers & Peripherals — 8.7% | | | | | |
Apple, Inc.* | | 22,450 | | | 4,446,896 |
Hewlett-Packard Co. | | 25,700 | | | 1,297,336 |
| | | | |
|
|
| | | | | | 5,744,232 |
| | | | |
|
|
Consumer Finance — 0.8% | | | | | |
American Express Co. | | 10,500 | | | 546,210 |
| | | | |
|
|
Diversified Financials — 1.6% | | | | | |
CME Group, Inc. | | 1,510 | | | 1,035,860 |
| | | | |
|
|
Electrical Equipment — 1.9% | | | | | |
First Solar, Inc.* | | 4,700 | | | 1,255,558 |
| | | | |
|
|
Engineering/Construction — 0.5% | | | | | |
Fluor Corp. | | 2,400 | | | 349,728 |
| | | | |
|
|
Financial – Bank & Trust — 0.9% | | | | | |
Blackstone Group LP (The) | | 28,300 | | | 626,279 |
| | | | |
|
|
Healthcare — 1.5% | | | | | |
WellPoint, Inc.* | | 11,300 | | | 991,349 |
| | | | |
|
|
Household Products — 1.8% | | | | | |
Colgate-Palmolive Co. | | 14,900 | | | 1,161,604 |
| | | | |
|
|
Internet & Catalog Retail — 3.0% | | | | | |
Amazon.com, Inc.* | | 21,000 | | | 1,945,440 |
| | | | |
|
|
Internet Software & Services — 7.0% | | | | | |
Google, Inc. (Class A Stock)* | | 6,680 | | | 4,619,086 |
| | | | |
|
|
Life Science Tools & Services — 3.1% | | | | | |
Thermo Fisher Scientific, Inc.* | | 35,100 | | | 2,024,568 |
| | | | |
|
|
Machinery — 1.5% | | | | | |
Deere & Co. | | 10,700 | | | 996,384 |
| | | | |
|
|
| | | | | |
| COMMON STOCKS | | |
| (continued) | | Shares
| | Value
(Note 2)
|
Media — 0.5% | | | | | |
Comcast Corp. (Special Class A Stock)* | | 17,900 | | $ | 324,348 |
| | | | |
|
|
Multi-Line Retail — 1.6% | | | | | |
Saks, Inc.* | | 50,100 | | | 1,040,076 |
| | | | |
|
|
Oil, Gas & Consumable Fuels — 3.6% | | | | | |
EOG Resources, Inc. | | 6,500 | | | 580,125 |
Schlumberger Ltd. (Netherlands) | | 17,800 | | | 1,750,986 |
| | | | |
|
|
| | | | | | 2,331,111 |
| | | | |
|
|
Pharmaceuticals — 10.7% | | | | | |
Abbott Laboratories | | 56,200 | | | 3,155,630 |
Alcon, Inc. (Switzerland) | | 5,300 | | | 758,112 |
Elan Corp. PLC, ADR (Ireland)* | | 55,900 | | | 1,228,682 |
Roche Holding AG, ADR (Switzerland) | | 22,500 | | | 1,921,500 |
| | | | |
|
|
| | | | | | 7,063,924 |
| | | | |
|
|
Retail & Merchandising — 0.3% | | | | | |
Kohl’s Corp.* | | 3,800 | | | 174,040 |
| | | | |
|
|
Semiconductors & Semiconductor Equipment — 1.8% | | | | | |
Broadcom Corp. (Class A Stock)* | | 19,300 | | | 504,502 |
NVIDIA Corp.* | | 19,500 | | | 663,390 |
| | | | |
|
|
| | | | | | 1,167,892 |
| | | | |
|
|
Software — 5.0% | | | | | |
Adobe Systems, Inc.* | | 33,100 | | | 1,414,363 |
Microsoft Corp. | | 53,100 | | | 1,890,360 |
| | | | |
|
|
| | | | | | 3,304,723 |
| | | | |
|
|
Telecommunications Wireless — 1.0% | | | | | |
Nokia Corp. (Class A Stock), ADR (Finland) | | 17,100 | | | 656,469 |
| | | | |
|
|
TOTAL LONG-TERM INVESTMENTS
(cost $50,986,043) | | | 65,200,409 |
| | | | |
|
|
| SHORT-TERM INVESTMENT — 0.7% |
Affiliated Money Market Mutual Fund |
Dryden Core Investment Fund — Taxable Money Market Series
(cost $420,282)(w)(Note 4) | | 420,282 | | | 420,282 |
| | | | |
|
|
TOTAL INVESTMENTS — 99.9%
(cost $51,406,325) | | | 65,620,691 |
OTHER ASSETS IN EXCESS OF LIABILITIES — 0.1% | | | 86,363 |
| | | | |
|
|
NET ASSETS — 100.0% | | $ | 65,707,054 |
| | | | |
|
|
The following abbreviation is used in portfolio descriptions:
| | |
| ADR | | ADR American Depositary Receipt |
| * | Non-income producing security. |
| (w) | Prudential Investments LLC, the manager of the Portfolio, also serves as manager of the Dryden Core Investment Fund-Taxable Money Market Series. |
SEE NOTES TO FINANCIAL STATEMENTS.
A79
| | | | |
| | | SP STRATEGIC PARTNERS FOCUSED GROWTH PORTFOLIO (Continued) | | |
SCHEDULE OF INVESTMENTS | December 31, 2007 |
The industry classification of investments and other assets in excess of liabilities shown as a percentage of net assets as of December 31, 2007 were as follows:
| | | |
Pharmaceuticals | | 10.7 | % |
Communication Equipment | | 9.5 | |
Capital Markets | | 9.3 | |
Computers & Peripherals | | 8.7 | |
Biotechnology | | 7.1 | |
Internet Software & Services | | 7.0 | |
Chemicals | | 7.0 | |
Aerospace & Defense | | 6.6 | |
Software | | 5.0 | |
Oil, Gas & Consumable Fuels | | 3.6 | |
Life Science Tools & Services | | 3.1 | |
Internet & Catalog Retail | | 3.0 | |
Beverages | | 2.9 | |
Electrical Equipment | | 1.9 | |
Semiconductors & Semiconductor Equipment | | 1.8 | |
Household Products | | 1.8 | |
Multi-Line Retail | | 1.6 | |
Diversified Financials | | 1.6 | |
Machinery | | 1.5 | |
Healthcare | | 1.5 | |
Telecommunications Wireless | | 1.0 | |
Financial – Bank & Trust | | 0.9 | |
Consumer Finance | | 0.8 | |
Affiliated Money Market Mutual Fund | | 0.7 | |
Engineering/Construction | | 0.5 | |
Media | | 0.5 | |
Retail & Merchandising | | 0.3 | |
| | |
|
|
| | | 99.9 | |
Other assets in excess of liabilities | | 0.1 | |
| | |
|
|
| | | 100.0 | % |
| | |
|
|
SEE NOTES TO FINANCIAL STATEMENTS.
A80
| | | | |
| | | SP STRATEGIC PARTNERS FOCUSED GROWTH PORTFOLIO (Continued) | | |
STATEMENT OF ASSETS AND LIABILITIES
December 31, 2007
| | | |
| ASSETS | | | |
Investments at value: | | | |
Unaffiliated investments (cost $50,986,043) | | $ | 65,200,409 |
Affiliated investments (cost $420,282) | | | 420,282 |
Cash | | | 514,535 |
Receivable for investments sold | | | 583,817 |
Dividends and interest receivable | | | 48,693 |
Receivable for Series shares sold | | | 29,658 |
Prepaid expenses | | | 385 |
| | |
|
|
Total Assets | | | 66,797,779 |
| | |
|
|
| LIABILITIES | | | |
Payable for investments purchased | | | 965,215 |
Management fee payable | | | 50,622 |
Accrued expenses and other liabilities | | | 49,984 |
Payable for Series shares repurchased | | | 17,991 |
Administration fee payable | | | 3,521 |
Deferred trustees’ fees | | | 1,952 |
Shareholder servicing fees payable | | | 879 |
Transfer agent fees payable | | | 561 |
| | |
|
|
Total Liabilities | | | 1,090,725 |
| | |
|
|
| NET ASSETS | | $ | 65,707,054 |
| | |
|
|
Net assets were comprised of: | | | |
Paid-in capital | | $ | 49,756,570 |
Retained earnings | | | 15,950,484 |
| | |
|
|
Net assets, December 31, 2007 | | $ | 65,707,054 |
| | |
|
|
| Class I: | | | |
Net asset value and redemption price per share,
$38,437,084/4,632,541 outstanding shares of
beneficial interest | | $ | 8.30 |
| | |
|
|
| Class II: | | | |
Net asset value and redemption price per share,
$27,269,970/3,390,838 outstanding shares of
beneficial interest | | $ | 8.04 |
| | |
|
|
STATEMENT OF OPERATIONS
Year Ended December 31, 2007
| | | | |
| INVESTMENT INCOME | | | | |
Unaffiliated dividend income (net of $6,119 foreign withholding tax) | | $ | 438,380 | |
Affiliated dividend income | | | 42,071 | |
| | |
|
|
|
| | | | 480,451 | |
| | |
|
|
|
| EXPENSES | | | | |
Management fee | | | 601,170 | |
Distribution fee — Class II | | | 72,796 | |
Administration fee — Class II | | | 43,678 | |
Custodian’s fees and expenses | | | 74,000 | |
Shareholders’ reports | | | 44,000 | |
Audit fee | | | 19,000 | |
Trustees’ fees | | | 10,000 | |
Legal fees and expenses | | | 6,000 | |
Transfer agent’s fees and expenses (including affiliated expense of $3,600) (Note 4) | | | 4,000 | |
Insurance expenses | | | 2,000 | |
Miscellaneous | | | 7,560 | |
| | |
|
|
|
Total expenses | | | 884,204 | |
| | |
|
|
|
| NET INVESTMENT LOSS | | | (403,753 | ) |
| | |
|
|
|
| NET REALIZED AND UNREALIZED GAIN (LOSS) ON INVESTMENTS | | | | |
Net realized gain on investment transactions | | | 4,363,534 | |
Net change in unrealized appreciation (depreciation) on investments | | | 5,320,010 | |
| | |
|
|
|
| NET GAIN ON INVESTMENTS | | | 9,683,544 | |
| | |
|
|
|
| NET INCREASE IN NET ASSETS RESULTING FROM OPERATIONS | | $ | 9,279,791 | |
| | |
|
|
|
STATEMENT OF CHANGES IN NET ASSETS
| | | | | | | | |
| | | Year Ended December 31,
| |
| | | 2007
| | | 2006
| |
| INCREASE (DECREASE) IN NET ASSETS OPERATIONS: | | | | | | | | |
Net investment loss | | $ | (403,753 | ) | | $ | (493,878 | ) |
Net realized gain on investment transactions | | | 4,363,534 | | | | 3,061,018 | |
Net change in unrealized appreciation (depreciation) on investments | | | 5,320,010 | | | | (3,803,346 | ) |
| | |
|
|
| |
|
|
|
NET INCREASE (DECREASE) IN NET ASSETS RESULTING FROM OPERATIONS | | | 9,279,791 | | | | (1,236,206 | ) |
| | |
|
|
| |
|
|
|
| DISTRIBUTIONS: | | | | | | | | |
Class I | | | (1,477,681 | ) | | | (2,547,235 | ) |
Class II | | | (1,087,456 | ) | | | (2,776,508 | ) |
| | |
|
|
| |
|
|
|
TOTAL DISTRIBUTIONS | | | (2,565,137 | ) | | | (5,323,743 | ) |
| | |
|
|
| |
|
|
|
| SERIES SHARE TRANSACTIONS (NOTE 7): | | | | | | | | |
Series shares sold [580,148 and 1,511,971 shares, respectively] | | | 4,576,719 | | | | 11,414,376 | |
Series shares issued in reinvestment of distributions [315,045 and 712,648 shares, respectively] | | | 2,565,137 | | | | 5,323,743 | |
Series shares repurchased [2,331,209 and 2,920,808 shares, respectively] | | | (18,165,307 | ) | | | (21,216,354 | ) |
| | |
|
|
| |
|
|
|
DECREASE IN NET ASSETS RESULTING FROM SERIES SHARE TRANSACTIONS | | | (11,023,451 | ) | | | (4,478,235 | ) |
| | |
|
|
| |
|
|
|
| TOTAL DECREASE IN NET ASSETS | | | (4,308,797 | ) | | | (11,038,184 | ) |
| NET ASSETS: | | | | | | | | |
Beginning of year | | | 70,015,851 | | | | 81,054,035 | |
| | |
|
|
| |
|
|
|
End of year | | $ | 65,707,054 | | | $ | 70,015,851 | |
| | |
|
|
| |
|
|
|
SEE NOTES TO FINANCIAL STATEMENTS.
A81
| | | | |
| | | SP T. ROWE PRICE LARGE CAP GROWTH PORTFOLIO | | |
SCHEDULE OF INVESTMENTS | December 31, 2007 |
| | | | | |
| LONG-TERM INVESTMENTS — 96.8% | | |
| COMMON STOCKS | | Shares
| | Value
(Note 2)
|
| | | | | | |
Advertising — 0.8% | | | | | |
Lamar Advertising Co. | | 12,500 | | $ | 600,875 |
| | | | |
|
|
Aerospace/Defense — 1.5% | | | | | |
General Dynamics Corp. | | 13,100 | | | 1,165,769 |
| | | | |
|
|
Airlines — 1.2% | | | | | |
Southwest Airlines Co. | | 72,900 | | | 889,380 |
| | | | |
|
|
Biotechnology Healthcare — 0.8% | | | | | |
Celgene Corp.* | | 14,000 | | | 646,940 |
| | | | |
|
|
Chemicals — 0.7% | | | | | |
Praxair, Inc. | | 6,100 | | | 541,131 |
| | | | |
|
|
Commercial Services & Supplies — 0.7% | | | | | |
Monster Worldwide, Inc.* | | 17,400 | | | 563,760 |
| | | | |
|
|
Communication Equipment — 1.5% | | | | | |
QUALCOMM, Inc. | | 29,800 | | | 1,172,630 |
| | | | |
|
|
Computer Services & Software — 8.1% | | | | | |
Automatic Data Processing, Inc. | | 17,000 | | | 757,010 |
Electronic Arts, Inc.* | | 22,200 | | | 1,296,702 |
Microsoft Corp. | | 106,100 | | | 3,777,160 |
Red Hat, Inc.* | | 17,500 | | | 364,700 |
| | | | |
|
|
| | | | | | 6,195,572 |
| | | | |
|
|
Computers — 3.6% | | | | | |
Apple, Inc.* | | 9,300 | | | 1,842,144 |
Dell, Inc.* | | 37,500 | | | 919,125 |
| | | | |
|
|
| | | | | | 2,761,269 |
| | | | |
|
|
Consumer Products & Services — 1.8% | | | | | |
Accenture Ltd. (Class A Stock) | | 37,700 | | | 1,358,331 |
| | | | |
|
|
Diversified Financial Services — 1.6% | | | | | |
Morgan Stanley | | 23,500 | | | 1,248,085 |
| | | | |
|
|
Drugs & Medicine — 6.4% | | | | | |
Genentech, Inc.* | | 16,700 | | | 1,120,069 |
Gilead Sciences, Inc.* | | 48,100 | | | 2,213,081 |
St. Jude Medical, Inc.* | | 19,200 | | | 780,288 |
WellPoint, Inc.* | | 9,100 | | | 798,343 |
| | | | |
|
|
| | | | | | 4,911,781 |
| | | | |
|
|
Electronic Components — 0.6% | | | | | |
Harman International Industries, Inc. | | 6,000 | | | 442,260 |
| | | | |
|
|
Engineering/Construction — 1.3% | | | | | |
Foster Wheeler Ltd.* | | 6,700 | | | 1,038,634 |
| | | | |
|
|
Entertainment & Leisure — 1.2% | | | | | |
Melco PBL Entertainment (Macau) Ltd., ADR (Hong Kong)* | | 12,500 | | | 144,500 |
Nintendo Co. Ltd. (Japan) | | 10,100 | | | 747,905 |
| | | | |
|
|
| | | | | | 892,405 |
| | | | |
|
|
Financial – Bank & Trust — 3.7% | | | | | |
State Street Corp. | | 35,000 | | | 2,842,000 |
| | | | |
|
|
Financial Services — 1.8% | | | | | |
Franklin Resources, Inc. | | 11,800 | | | 1,350,274 |
| | | | |
|
|
Hotels, Restaurants & Leisure — 5.4% | | | | | |
International Game Technology | | 31,300 | | | 1,375,009 |
Las Vegas Sands Corp.* | | 3,500 | | | 360,675 |
Marriott International, Inc. (Class A Stock) | | 29,600 | | | 1,011,728 |
| | | | | |
| COMMON STOCKS | | |
| (continued) | | Shares
| | Value
(Note 2)
|
| | | | | | |
Hotels, Restaurants & Leisure (continued) | | | | | |
MGM Mirage* | | 9,600 | | $ | 806,592 |
Yum! Brands, Inc. | | 14,900 | | | 570,223 |
| | | | |
|
|
| | | | | | 4,124,227 |
| | | | |
|
|
Industrial Conglomerates — 1.1% | | | | | |
McDermott International, Inc.* | | 14,200 | | | 838,226 |
| | | | |
|
|
Internet Services — 6.9% | | | | | |
Amazon.com, Inc.* | | 23,700 | | | 2,195,568 |
Google, Inc. (Class A Stock)* | | 4,500 | | | 3,111,660 |
| | | | |
|
|
| | | | | | 5,307,228 |
| | | | |
|
|
Manufacturing — 3.1% | | | | | |
Danaher Corp. | | 27,600 | | | 2,421,624 |
| | | | |
|
|
Medical Supplies & Equipment — 3.0% | | | | | |
Cardinal Health, Inc. | | 7,300 | | | 421,575 |
Medtronic, Inc. | | 28,200 | | | 1,417,614 |
Stryker Corp. | | 5,900 | | | 440,848 |
| | | | |
|
|
| | | | | | 2,280,037 |
| | | | |
|
|
Metals & Mining — 0.9% | | | | | |
Freeport-McMoRan Copper & Gold, Inc. | | 6,800 | | | 696,592 |
| | | | |
|
|
Multimedia — 0.8% | | | | | |
McGraw-Hill Cos., Inc. (The) | | 14,100 | | | 617,721 |
| | | | |
|
|
Oil, Gas & Consumable Fuels — 3.3% | | | | | |
Schlumberger Ltd. | | 19,800 | | | 1,947,726 |
Suncor Energy, Inc. | | 5,300 | | | 576,269 |
| | | | |
|
|
| | | | | | 2,523,995 |
| | | | |
|
|
Pharmaceuticals — 2.7% | | | | | |
Allergan, Inc. | | 17,600 | | | 1,130,624 |
Schering-Plough Corp. | | 36,200 | | | 964,368 |
| | | | |
|
|
| | | | | | 2,094,992 |
| | | | |
|
|
Retail & Merchandising — 7.2% | | | | | |
Bed Bath & Beyond, Inc.* | | 19,700 | | | 578,983 |
CVS Corp. | | 49,678 | | | 1,974,700 |
Kohl’s Corp.* | | 27,400 | | | 1,254,920 |
Target Corp. | | 15,400 | | | 770,000 |
Walgreen Co. | | 24,700 | | | 940,576 |
| | | | |
|
|
| | | | | | 5,519,179 |
| | | | |
|
|
Semiconductors — 8.7% | | | | | |
Analog Devices, Inc. | | 28,400 | | | 900,280 |
Applied Materials, Inc. | | 43,200 | | | 767,232 |
ASML Holding N.V. (Netherlands)* | | 2 | | | 63 |
Broadcom Corp. (Class A Stock)* | | 40,400 | | | 1,056,056 |
Intel Corp. | | 55,000 | | | 1,466,300 |
Marvell Technology Group Ltd. (Bermuda)* | | 99,000 | | | 1,384,020 |
Xilinx, Inc. | | 52,600 | | | 1,150,362 |
| | | | |
|
|
| | | | | | 6,724,313 |
| | | | |
|
|
Telecommunications — 11.8% | | | | | |
American Tower Corp. (Class A Stock)* | | 60,900 | | | 2,594,340 |
Cisco Systems, Inc.* | | 39,900 | | | 1,080,093 |
Corning, Inc. | | 66,000 | | | 1,583,340 |
Crown Castle International Corp.* | | 16,000 | | | 665,600 |
Juniper Networks, Inc.* | | 71,700 | | | 2,380,440 |
MetroPCS Communications, Inc.* | | 41,400 | | | 805,230 |
| | | | |
|
|
| | | | | | 9,109,043 |
| | | | |
|
|
SEE NOTES TO FINANCIAL STATEMENTS.
A82
| | | | |
| | | SP T. ROWE PRICE LARGE CAP GROWTH PORTFOLIO (Continued) | | |
SCHEDULE OF INVESTMENTS | December 31, 2007 |
| | | | | |
| COMMON STOCKS | | |
| (continued) | | Shares
| | Value
(Note 2)
|
| | | | | | |
Transportation — 1.5% | | | | | |
Expeditors International Washington, Inc. | | 26,100 | | $ | 1,166,148 |
| | | | |
|
|
Utilities — 3.1% | | | | | |
General Electric Co. | | 64,100 | | | 2,376,187 |
| | | | |
|
|
TOTAL LONG-TERM INVESTMENTS
(cost $63,379,313) | | | 74,420,608 |
| | | | |
|
|
| SHORT-TERM INVESTMENT — 2.2% | | | |
Affiliated Money Market Mutual Fund | | | | | |
Dryden Core Investment Fund — Taxable Money Market Series
(cost $1,729,214)(w)(Note 4) | | 1,729,214 | | | 1,729,214 |
| | | | |
|
|
TOTAL INVESTMENTS — 99.0%
(cost $65,108,527) | | | 76,149,822 |
OTHER ASSETS IN EXCESS OF LIABILITIES — 1.0% | | | 738,908 |
| | | | |
|
|
NET ASSETS — 100.0% | | $ | 76,888,730 |
| | | | |
|
|
The following abbreviation is used in portfolio descriptions:
| | |
| ADR | | American Depositary Receipt |
* Non-income producing security.
| (w) | Prudential Investments LLC, the manager of the Portfolio, also serves as manager of the Dryden Core Investment Fund — Taxable Money market Series. |
The industry classification of investments and other assets in excess of liabilities shown as a percentage of net assets as of December 31, 2007 was as follows:
| | | |
Telecommunications | | 11.8 | % |
Semiconductors | | 8.7 | |
Computer Services & Software | | 8.1 | |
Retail & Merchandising | | 7.2 | |
Internet Services | | 6.9 | |
Drugs & Medicine | | 6.4 | |
Hotels, Restaurants & Leisure | | 5.4 | |
Financial – Bank & Trust | | 3.7 | |
Computers | | 3.6 | |
Oil, Gas & Consumable Fuels | | 3.3 | |
Manufacturing | | 3.1 | |
Utilities | | 3.1 | |
Medical Supplies & Equipment | | 3.0 | |
Pharmaceuticals | | 2.7 | |
Affiliated Money Market Mutual Fund | | 2.2 | |
Consumer Products & Services | | 1.8 | |
Financial Services | | 1.8 | |
Diversified Financial Services | | 1.6 | |
Communication Equipment | | 1.5 | |
Transportation | | 1.5 | |
Aerospace/Defense | | 1.5 | |
Engineering/Construction | | 1.3 | |
Entertainment & Leisure | | 1.2 | |
Airlines | | 1.2 | |
Industrial Conglomerates | | 1.1 | |
Metals & Mining | | 0.9 | |
Biotechnology Healthcare | | 0.8 | |
Multimedia | | 0.8 | |
Advertising | | 0.8 | |
Commercial Services & Supplies | | 0.7 | |
Chemicals | | 0.7 | |
Electronic Components | | 0.6 | |
| | |
|
|
| | | 99.0 | % |
Other assets in excess of liabilities | | 1.0 | |
| | |
|
|
| | | 100.0 | % |
| | |
|
|
SEE NOTES TO FINANCIAL STATEMENTS.
A83
| | | | |
| | | SP T. ROWE PRICE LARGE CAP GROWTH PORTFOLIO (Continued) | | |
STATEMENT OF ASSETS AND LIABILITIES
December 31, 2007
| | | |
| ASSETS | | | |
Investments at value: | | | |
Unaffiliated investments (cost $63,379,313) | | $ | 74,420,608 |
Affiliated investments (cost $1,729,214) | | | 1,729,214 |
Cash | | | 212,764 |
Receivable for investments sold | | | 571,999 |
Receivable for Series shares sold | | | 115,274 |
Dividends receivable | | | 61,885 |
Prepaid expenses | | | 1,273 |
| | |
|
|
Total Assets | | | 77,113,017 |
| | |
|
|
| LIABILITIES | | | |
Accrued expenses and other liabilities | | | 73,250 |
Payable for investments purchased | | | 72,889 |
Management fee payable | | | 59,327 |
Payable for Series shares repurchased | | | 16,360 |
Deferred trustees’ fees | | | 2,111 |
Transfer agent fee payable | | | 350 |
| | |
|
|
Total Liabilities | | | 224,287 |
| | |
|
|
| NET ASSETS | | $ | 76,888,730 |
| | |
|
|
Net assets were comprised of: | | | |
Paid-in capital | | $ | 62,229,277 |
Retained earnings | | | 14,659,453 |
| | |
|
|
Net assets, December 31, 2007 | | $ | 76,888,730 |
| | |
|
|
Net asset value and redemption price per share,
$76,888,730 / 9,928,864 outstanding shares of beneficial interest | | $ | 7.74 |
| | |
|
|
STATEMENT OF OPERATIONS
Year Ended December 31, 2007
| | | | |
| INVESTMENT INCOME | | | | |
Unaffiliated dividend income | | $ | 677,572 | |
Affiliated dividend income | | | 60,542 | |
| | |
|
|
|
| | | | 738,114 | |
| | |
|
|
|
| EXPENSES | | | | |
Management fee | | | 711,545 | |
Custodian’s fees and expenses | | | 37,000 | |
Shareholders’ reports | | | 35,000 | |
Audit fee | | | 17,000 | |
Trustees’ fees | | | 7,000 | |
Transfer agent’s fees and expenses (including affiliated expense of $3,000) (Note 4) | | | 4,000 | |
Legal fees and expenses | | | 4,000 | |
Insurance expenses | | | 2,000 | |
Miscellaneous | | | 820 | |
| | |
|
|
|
Total expenses | | | 818,365 | |
| | |
|
|
|
| NET INVESTMENT LOSS | | | (80,251 | ) |
| | |
|
|
|
| NET REALIZED AND UNREALIZED GAIN (LOSS) ON INVESTMENTS AND FOREIGN CURRENCIES | | | | |
Net realized gain on investment transactions | | | 4,449,746 | |
Net change in unrealized appreciation (depreciation) on investments | | | 1,915,357 | |
| | |
|
|
|
| NET GAIN ON INVESTMENTS AND FOREIGN CURRENCIES | | | 6,365,103 | |
| | |
|
|
|
| NET INCREASE IN NET ASSETS RESULTING FROM OPERATIONS | | $ | 6,284,852 | |
| | |
|
|
|
STATEMENT OF CHANGES IN NET ASSETS
| | | | | | | | |
| | | Year Ended December 31,
| |
| | | 2007
| | | 2006
| |
| INCREASE (DECREASE) IN NET ASSETS | | | | | | | | |
| OPERATIONS: | | | | | | | | |
Net investment income (loss) | | $ | (80,251 | ) | | $ | 184,755 | |
Net realized gain (loss) on investment transactions | | | 4,449,746 | | | | (355,223 | ) |
Net change in unrealized appreciation (depreciation) on investments | | | 1,915,357 | | | | 4,393,070 | |
| | |
|
|
| |
|
|
|
NET INCREASE IN NET ASSETS RESULTING FROM OPERATIONS | | | 6,284,852 | | | | 4,222,602 | |
| | |
|
|
| |
|
|
|
| DISTRIBUTIONS | | | (184,838 | ) | | | (9,241,598 | ) |
| | |
|
|
| |
|
|
|
| SERIES SHARE TRANSACTIONS: | | | | | | | | |
Series shares sold [772,219 and 1,945,894 shares, respectively] | | | 5,847,235 | | | | 13,642,113 | |
Series shares issued in reinvestment of distributions [24,005 and 1,335,491 shares, respectively] | | | 184,838 | | | | 9,241,598 | |
Series shares repurchased [1,701,726 and 2,021,217 shares, respectively] | | | (12,951,468 | ) | | | (13,936,631 | ) |
| | |
|
|
| |
|
|
|
INCREASE (DECREASE) IN NET ASSETS RESULTING FROM SERIES SHARE TRANSACTIONS | | | (6,919,395 | ) | | | 8,947,080 | |
| | |
|
|
| |
|
|
|
| TOTAL INCREASE (DECREASE) IN NET ASSETS | | | (819,381 | ) | | | 3,928,084 | |
| NET ASSETS: | | | | | | | | |
Beginning of year | | | 77,708,111 | | | | 73,780,027 | |
| | |
|
|
| |
|
|
|
End of year | | $ | 76,888,730 | | | $ | 77,708,111 | |
| | |
|
|
| |
|
|
|
SEE NOTES TO FINANCIAL STATEMENTS.
A84
NOTES TO THE FINANCIAL STATEMENTS OF
THE PRUDENTIAL SERIES FUND
The Prudential Series Fund (“Series Fund”), organized as a Delaware statutory trust, is a diversified open-end management investment company registered under the Investment Company Act of 1940, as amended. On January 2, 2006, each Portfolio of the Fund changed its federal income tax status from a regulated investment company to a partnership. As a result of that conversion, the Series Fund was reorganized from a Maryland corporation to a Delaware statutory trust. Pursuant to this reorganization, the Fund has been renamed “The Prudential Series Fund.” The Series Fund is composed of thirty-two Portfolios (“Portfolio” or “Portfolios”), each with a separate series shares. The information presented in these financial statements pertains to seventeen Portfolios: SP Aggressive Growth Asset Allocation Portfolio, SP AIM Core Equity Portfolio, SP Balanced Asset Allocation Portfolio, SP Conservative Asset Allocation Portfolio, SP Davis Value Portfolio, SP Growth Asset Allocation Portfolio, SP International Growth Portfolio, SP International Value Portfolio, SP Large Cap Value Portfolio, SP Mid-Cap Growth Portfolio, SP PIMCO High Yield Portfolio, SP PIMCO Total Return Portfolio, SP Prudential U.S. Emerging Growth Portfolio, SP Small Cap Growth Portfolio, SP Small Cap Value Portfolio, SP Strategic Partners Focused Growth Portfolio, and SP T. Rowe Price Large Cap Growth Portfolio.
The Portfolios of the Series Fund have the following as investment objectives:
SP Aggressive Growth Asset Allocation Portfolio: Capital appreciation by investing primarily in large cap equity portfolios, international portfolios, and small/mid cap equity portfolios. The Portfolio will achieve this by investing in certain other Series Fund Portfolios and Advanced Series Trust Portfolios.
SP AIM Core Equity Portfolio: Growth of capital with a secondary objective of current income by investing primarily in securities of established companies that have long-term above-average growth in earnings and dividends, and growth companies that the Portfolio managers believe have the potential for above-average growth in earnings and dividends.
SP Balanced Asset Allocation Portfolio: Provide a balance between current income and growth of capital by investing in fixed income portfolios, large cap equity portfolios, small/mid cap equity portfolios, and international equity portfolios. The Portfolio will achieve this by investing in certain other Series Fund Portfolios and Advanced Series Trust Portfolios.
SP Conservative Asset Allocation Portfolio: Provide current income with low to moderate capital appreciation by investing in fixed income portfolios, large cap equity portfolios, and small/mid cap equity portfolios. The Portfolio will achieve this by investing in certain other Series Fund and Advanced Series Trust Portfolios.
SP Davis Value Portfolio: Capital growth through investments primarily in common stock of U.S. companies with market capitalization of at least $5 billion.
SP Growth Asset Allocation Portfolio: Provide long-term growth of capital with consideration also given to current income by investing in large-cap equity portfolios, fixed income portfolios, international equity portfolios and small/mid-cap equity portfolios. The Portfolio will achieve this by investing in certain other Series Fund Portfolios and Advanced Series Trust Portfolios.
SP International Growth Portfolio: Long-term growth of capital by investing primarily in equity-related securities of foreign issuers.
SP International Value Portfolio: Long-term capital appreciation by investing primarily in the stocks and other equity securities of companies in developed countries outside the United States.
SP Large Cap Value Portfolio: Long-term growth of capital by investing primarily in common stocks of companies with large market capitalization (those with market capitalizations similar to companies in the Standard & Poor’s 500 Composite Index or the Russell 1000 Index).
SP Mid-Cap Growth Portfolio: Long-term growth of capital by investing primarily in common stocks and related securities, such as preferred stocks, convertible securities and depository receipts for those securities.
SP PIMCO High Yield Portfolio: Maximum total return, consistent with preservation of capital and prudent investment management by investing primarily in a diversified portfolio of high yield/high risk securities rated
B1
below investment grade but rated at least B by Moody’s or S&P, or, if unrated, determined by Pacific Investment Management Company LLC (“PIMCO”) to be of comparable quality.
SP PIMCO Total Return Portfolio: Maximum total return, consistent with preservation of capital and prudent investment management by investing primarily in a diversified portfolio of fixed income instruments of varying maturities.
SP Prudential U.S. Emerging Growth Portfolio: Long-term capital appreciation by investing primarily in equity securities of small and medium-sized U.S. companies that the Portfolio manager believes have the potential for above-average growth.
SP Small Cap Growth Portfolio: Long-term capital growth by investing mostly in small-capitalization companies which are included in the Russell 2000 Growth Index at the time of purchase, or if not with market capitalizations under $2.5 billion.
SP Small Cap Value Portfolio: Long-term growth of capital by investing primarily in common stocks of companies with small to medium market capitalization.
SP Strategic Partners Focused Growth Portfolio: Long-term capital growth by investing primarily in equity-related securities of U.S. companies that the Portfolio manager believes to have strong capital appreciation potential.
SP T. Rowe Price Large Cap Growth Portfolio: Growth of capital by pursuing aggressive investment policies. The Portfolio invests primarily in stocks of companies considered to have large capitalizations.
The ability of issuers of debt securities (other than those issued or guaranteed by the U.S. Government) held by the Portfolios to meet their obligations may be affected by the economic or political developments in a specific industry, region or country.
Foreign security and currency transactions may involve certain considerations and risks not typically associated with those of domestic origin as a result of, among other factors, the possibility of political and economic instability or the level of governmental supervision and regulation of foreign securities markets.
| Note 2: | | Accounting Policies |
The following is a summary of significant accounting policies followed by the Series Fund and the Portfolios in preparation of their financial statements.
Securities Valuation: Securities listed on a securities exchange are valued at the last sale price on such exchange on the day of valuation or, if there was no sale on such day, at the mean between the last reported bid and asked prices, or at the last bid price on such day in the absence of an asked price. Securities traded via NASDAQ are valued at the official closing price provided by NASDAQ. Securities that are actively traded in the over-the-counter market, including listed securities for which the primary market is believed by Prudential Investments LLC (“PI” or “Manager”) in consultation with the subadviser, to be over-the-counter, are valued at market value using prices provided by an independent pricing agent or principal market maker. Options on securities and indices traded on an exchange are valued at the last sale price as of the close of trading on the applicable exchange or, if there was no sale, at the mean between the most recently quoted bid and asked prices on such exchange or at the last bid price in absence of an asked price. Futures contracts and options thereon traded on a commodities exchange or board of trade are valued at the last sale price at the close of trading on such exchange or board of trade or, if there was no sale on the applicable commodities exchange or board of trade on such day, at the mean between the most recently quoted bid and asked prices on such exchange or board of trade or at the last bid price in the absence of an asked price. Prices may be obtained from independent pricing services which use information provided by market makers or estimates of market values obtained from yield data relating to investments or securities with similar characteristics. Securities for which reliable market quotations are not readily available, or whose values have been affected by events occurring after the close of the security’s foreign market and before the Series Fund’s normal pricing time, are valued at fair value in accordance with Board of Trustees’ approved fair valuation procedures. When determining the fair valuation of securities, some of the factors influencing the valuation include, the nature of any restrictions on disposition of the securities; assessment of the general liquidity of the securities; the issuer’s financial condition and the markets in which it does business; the cost of the investment; the size of the holding and the capitalization of the issuer; the prices of any recent transactions or bids/offers for such securities or any comparable securities; any available analyst media or other reports or information deemed
B2
reliable by the investment adviser regarding the issuer or the markets or industry in which it operates. Using fair value to price securities may result in a value that is different from a security’s most recent closing price and from the price used by other mutual funds to calculate their net asset values. As of December 31, 2007, SP Aim Core Equity, SP Davis Value, SP International Growth and SP International Value Portfolios held foreign securities whose value required adjustment in accordance with such procedures.
Investments in mutual funds are valued at their net asset value as of the close of the New York Stock Exchange on the date of valuation.
Short-term debt securities that are held in the Portfolios which mature in more than 60 days are valued at current market quotations and those short-term debt securities which mature in 60 days or less are valued at amortized cost which approximates market value. The amortized cost method values a security at its cost at the time of purchase and thereafter assumes a constant amortization to maturity of any discount or premium.
The SP PIMCO High Yield Portfolio and the SP PIMCO Total Return Portfolio may hold up to 15% of their net assets in illiquid securities, including those which are restricted as to disposition under securities law (“restricted securities”). Restricted securities, sometimes referred to as private placements, are valued pursuant to the valuation procedures noted above. Certain restricted securities were deemed liquid by procedures adopted by the Board of Trustees.
Repurchase Agreements: In connection with transactions in repurchase agreements with United States financial institutions, it is the Series Fund’s policy that its custodian or designated subcustodians, as the case may be, under triparty repurchase agreements, take possession of the underlying collateral securities, the value of which exceeds the principal amount of the repurchase transaction, including accrued interest. To the extent that any repurchase transaction exceeds one business day, the value of the collateral is marked to market on a daily basis to ensure the adequacy of the collateral. If the seller defaults or the value of the collateral declines, or if bankruptcy proceedings are commenced with respect to the seller of the security, realization of the collateral by the Series Fund may by delayed or limited.
Foreign Currency Translation: The books and records of the Series Fund are maintained in U.S. dollars. Foreign currency amounts are translated into U.S. dollars on the following basis:
(i) market value of investment securities, other assets and liabilities – at the current daily rates of exchange.
(ii) purchases and sales of investment securities, income and expenses – at the rates of exchange prevailing on the respective dates of such transactions.
Although the net assets of the Series Fund are presented at the foreign exchange rates and market values at the close of the period, the Series Fund does not isolate that portion of the results of operations arising as a result of changes in the foreign exchange rates from the fluctuations arising from changes in the market prices of securities held at the end of the period. Similarly, the Series Fund does not isolate the effect of changes in foreign exchange rates from the fluctuations arising from changes in the market prices of portfolio securities sold during the period. Accordingly, these realized foreign currency gains (losses) are included in the reported net realized gains (losses) on investment transactions.
Net realized gains (losses) on foreign currency transactions represent net foreign exchange gains (losses) from the holding of foreign currencies, currency gains (losses) realized between the trade date and settlement date on securities transactions, and the difference between the amounts of dividends, interest and foreign withholding taxes recorded on the Series Fund’s books and the U.S. dollar equivalent amounts actually received or paid. Net unrealized currency gains (losses) from valuing foreign currency denominated assets and liabilities (other than investments) at period end exchange rates are reflected as a component of net unrealized appreciation (depreciation) on investments and foreign currencies.
Forward Currency Contracts: A forward currency contract is a commitment to purchase or sell a foreign currency at a future date at a negotiated forward rate. Certain Portfolios of the Series Fund may enter into forward currency contracts in order to hedge their exposure to changes in foreign currency exchange rates on their foreign portfolio holdings or on specific receivables and payables denominated in a foreign currency. The contracts are valued daily at current forward exchange rates and any unrealized gain (loss) is included in assets and liabilities in the financial statements. Gain (loss) is realized on the settlement date of the contract equal to the difference between the settlement value of the original and negotiated forward contracts. This gain (loss), if any, is included in net realized gain (loss) on foreign currency transactions. Risks may arise upon entering into these contracts from the potential inability of the counterparties to meet the terms of their contracts.
B3
Short Sales: Certain portfolios of the Series Fund may sell a security it does not own in anticipation of a decline in the market value of that security (short sale). When a Portfolio makes a short sale, it must borrow the security sold short and deliver it to the broker-dealer through which it made the short sale as collateral for its obligation to deliver the security upon conclusion of the transaction. The Portfolio may have to pay a fee to borrow the particular security and may be obligated to remit any interest or dividends received on such borrowed securities. Dividends declared on short positions open are recorded on the ex-date and interest payable is accrued daily on fixed income securities sold short, both of which are recorded as an expense. A gain, limited to the price at which the Portfolio sold the security short, or a loss, unlimited in magnitude, will be recognized upon the termination of a short sale if the market price at termination is less than or greater than, respectively, the proceeds originally received.
Loan Participations: The SP PIMCO High Yield Portfolio may invest in loan participations. When the Portfolio purchases a loan participation, the Portfolio typically enters into a contractual relationship with the lender or third party selling such participations (“Selling Participant”), but not the borrower. As a result, the Portfolio assumes the credit risk of the borrower, the Selling Participant and any other persons interpositioned between the Portfolio and the borrower. The Portfolio may not directly benefit from the collateral supporting the senior loan in which it has purchased the loan participant.
Options: The Series Fund may either purchase or write options in order to hedge against adverse market movements or fluctuations in value caused by changes in prevailing interest rates or foreign currency exchange rates or currencies with respect to securities which the Series Fund currently owns or intends to purchase. The Series Fund’s principal reason for writing options is to realize, through receipt of premiums, a greater current return than would be realized on the underlying security alone. When the Series Fund purchases an option, it pays a premium and an amount equal to that premium is recorded as an asset. When the Series Fund writes an option, it receives a premium and an amount equal to that premium is recorded as a liability. The asset or liability is adjusted daily to reflect the current market value of the option. If an option expires unexercised, the Series Fund realizes a gain (loss) to the extent of the premium received or paid. If an option is exercised, the premium received or paid is recorded as an adjustment to the proceeds from the sale or the cost basis of the purchase in determining whether the Series Fund has realized a gain (loss). The difference between the premium and the amount received or paid on effecting a closing purchase or sale transaction is also treated as a realized gain (loss). Gains (losses) on purchased options are included in net realized gains (losses) on investment transactions. Gains (losses) on written options are presented separately as net realized gain (loss) on written option transactions.
The Series Fund, as writer of an option, may have no control over whether the contract may be exercised. As a result, the Series Fund bears the market risk of an unfavorable change in the price of the security underlying the written option. The Series Fund, as purchaser of an option, bears the risk of the potential inability of the counterparties to meet the terms of their contracts.
Financial Futures Contracts: A financial futures contract is an agreement to purchase (long) or sell (short) an agreed amount of securities at a set price for delivery on a future date. Upon entering into a financial futures contract, the Series Fund is required to pledge to the broker an amount of cash and/or other assets equal to a certain percentage of the contract amount. This amount is known as the “initial margin”. Subsequent payments, known as “variation margin”, are made or received by the Series Fund each day, depending on the daily fluctuations in the value of the underlying security. Such variation margin is recorded for financial statement purposes on a daily basis as unrealized gain (loss). When the contract expires or is closed, the gain (loss) is realized and is presented in the Statement of Operations as net realized gain (loss) on financial futures contracts.
The Series Fund invests in financial futures contracts in order to hedge its existing portfolio securities, or securities the Series Fund intends to purchase, against fluctuations in value caused by changes in prevailing rates or market conditions. Under a variety of circumstances, the Series Fund may not achieve the anticipated benefits of the financial futures contracts and may realize a loss. The use of futures transactions involves the risk of imperfect correlation in movements in the price of futures contracts and the underlying hedged assets.
Swap Agreements: The Portfolios may enter into interest rate swap agreements, forward swap spread lock agreements, and credit default swap agreements. A swap agreement is an agreement to exchange the return generated by one instrument for the return generated by another instrument. Interest rate swap agreements
B4
involve the exchange by the Portfolio with another party of their respective commitments to pay or receive interest. Forward spread lock swap agreements involve commitments to pay or receive a settlement amount calculated as the difference between the swap spread and a fixed spread, multiplied by the notional amount times the duration of the swap. The swap spread is the difference between the benchmark swap rate (market rate) and the specific Treasury rate. In a credit default swap agreement, one party (the protection buyer) makes a stream of payments to another party (the protection seller) in exchange for the right to receive a specified payment in the event of a default by a third party, typically corporate issues or sovereign issues of an emerging country, on its obligation. The maximum amount of the payment may equal the notional, at par, of the underlying index or security as a result of a default (or “credit event”). In addition to bearing the risk that the credit event will occur, the Portfolios could be exposed to market risk due to unfavorable changes in interest rates or in the price of the underlying security or index, the possibility that the fund may be unable to close out its position at the same time or at the same price as if it had purchased comparable publicly traded securities, or that the counterparty may default on it’s obligation to perform. The Portfolios may enter into swap agreements as either the protection buyer or seller. The swaps are valued daily at current market value and any change in value is included in net unrealized appreciation or depreciation on investments. Payments received or paid by the Portfolio are recorded as realized gains or losses. Risk of loss may exceed amounts recognized on the statements of assets and liabilities. Swap agreements outstanding at period end, if any, are listed on the Schedule of Investments.
Forward currency contracts, written options, short sales, swaps and financial futures contracts involve elements of both market and credit risk in excess of the amounts reflected on the Statement of Assets and Liabilities.
Floating-Rate Notes Issued in Conjunction with Securities Held: The Portfolios invest in inverse floating rate securities (“inverse floaters”) that pay interest at a rate that varies inversely with short-term interest rates. Certain of these securities may be leveraged, whereby the interest rate varies inversely at a multiple of the change in short-term rates. As interest rates rise, inverse floaters provide less current income. The price of such securities is more volatile than comparable fixed rate securities.
When the Portfolios enter into agreements to create inverse floaters and floater note securities (also known as Tender Option Bond Transactions), the Portfolios transfer a fixed rate bond to a broker for cash. At the same time the Portfolios buy (receive) a residual interest in a trust (the “trust”) set up by the broker, often referred to as an inverse floating rate obligation (inverse floaters). Generally, the broker deposits a fixed rate bond (the “fixed rate bond”) into the trust with the same CUSIP number as the fixed rate bond sold to the broker by the Portfolio. The trust also issues floating rate notes (“floating rate notes”) which are sold to third parties. The floating rate notes have interest rates that reset weekly. The inverse floater held by the Portfolio gives the Portfolio the right (1) to cause the holders of the floating rate notes to tender their notes at par, and (2) to have the broker transfer the fixed rate bond held by the trust to the Portfolio thereby collapsing the trust. In accordance with FAS Statement No. 140, the Portfolio’s account for the transaction described above as funded leverage by including the fixed rate bond in its Portfolio of Investments, and accounts for the floating rate notes as a liability under the caption “payable for floating rate notes issued” in the Portfolio’s “Statement of Assets and Liabilities.”
The Portfolio’s investment policies and restrictions permit investments in inverse floating rate securities. Inverse floaters held by the Portfolio are securities exempt from registration under Rules 144A of the Securities Act of 1933.
Securities Lending: Each Portfolio of the Series Fund may lend its portfolio securities to broker-dealers. The loans are secured by collateral at least equal at all times to the market value of the securities loaned. Loans are subject to termination at the option of the borrower or the Portfolio. Upon termination of the loan, the borrower will return to the Portfolio securities identical to the loaned securities. Should the borrower of the securities fail financially, the Portfolio has the right to repurchase the securities using the collateral in the open market. The Portfolio recognizes income, net of any rebate and securities lending agent fees, for lending its securities in the form of fees or interest on the investment of any cash received as collateral. The Portfolio also continues to receive interest and dividends or amounts equivalent thereto on the securities loaned and recognizes any unrealized gain or loss in the market price of the securities loaned that may occur during the term of the loan.
Dollar Rolls: The Fund enters into mortgage dollar rolls in which the Fund sells mortgage securities for delivery in the current month, realizing a gain (loss), and simultaneously contracts to repurchase somewhat similar (same type, coupon and maturity) securities on a specified future date. During the roll period, the Fund
B5
forgoes principal and interest paid on the securities. The Fund is compensated by the interest earned on the cash proceeds of the initial sale and by the lower repurchase price at the future date. The difference between the sales proceeds and the lower repurchase price is recorded as a realized gain. The Fund maintains a segregated account, the dollar value of which is at least equal to its obligations, with respect to dollar rolls.
When-Issued/Delayed Delivery Securities: Securities purchased or sold on a when-issued or delayed-delivery basis may be settled a month or more after trade date; interest income is not accrued until settlement date. At the time a Portfolio enters into such transactions, it instructs the custodian to segregate assets with a current value at least equal to the amount of its when-issued or delayed-delivery purchase commitments.
Securities Transactions and Net Investment Income: Securities transactions are recorded on the trade date. Realized gains (losses) on sales of securities are calculated on the identified cost basis. Dividend income is recorded on the ex-dividend date; interest income, which is comprised of four elements: stated coupon, original issue discount, market discount and market premium, is recorded on the accrual basis. Expenses are recorded on the accrual basis. The Series Fund’s expenses are allocated to the respective Portfolios on the basis of relative net assets except for Portfolio specific expenses which are attributable directly to a Portfolio or class level.
For Portfolios with multiple classes of shares, net investment income (loss) (other than administration and distribution fees, which are charged to the respective class) and unrealized and realized gains (losses) are allocated daily to each class of shares based upon the relative proportion of net assets of each class at the beginning of the day.
Custody Fee Credits: The Series Fund has an arrangement with its custodian bank, whereby uninvested monies earn credits which reduce the fees charged by the custodian. Such custody fee credits are presented as a reduction of gross expenses in the accompanying Statements of Operations.
Taxes: For federal income tax purposes, each Portfolio in the Series is treated as a separate taxpaying entity. The Portfolios are treated as partnerships for tax purposes. No provision has been made in the financial statements for U.S. Federal, state, or local taxes, as any tax liability arising from operations of the Portfolios are the responsibility of their partners. The Portfolios are not subject to income tax. Partners of each Portfolio are subject to taxes on their distributive share of partnership earnings.
Withholding taxes on foreign dividends, interest and capital gains have been provided for in accordance with the Series Fund’s understanding of the applicable country’s tax rules and regulations.
Distributions: Distributions from each Portfolio are made in cash and automatically reinvested in additional shares of the same Portfolio. The SP PIMCO High Yield and SP PIMCO Total Return Portfolios make distributions, if any, quarterly. All other Portfolios’ distributions are generally made on an annual basis. Distributions are recorded on the ex-date.
Estimates: The preparation of financial statements requires management to make estimates and assumptions that affect the reported amounts and disclosures in the financial statements. Actual results could differ from these estimates.
The Series Fund has a management agreement with PI. Pursuant to this agreement PI has responsibility for all investment advisory services and supervises the subadvisers’ performance of such services. PI has entered into subadvisory agreements with Jennison Associates LLC (“Jennison”), AIM Capital Management, Inc. (“AIM”), AllianceBernstein LP (“AllianceBernstein”), Davis Selected Advisers, LP (“Davis”), Dreman Value Management LLC (“Dreman”), Hotchkis and Wiley Capital Management LLC (“Hotchkis and Wiley”), Goldman Sachs Asset Management, L.P. (“GSAM”), J.P. Morgan Investment Management, Inc. (“J.P. Morgan”), LSV Asset Management (“LSV”), Marsico (“Marsico”), Neuberger Berman Management, Inc. (“Neuberger Berman”), T. Rowe Price Associates, Inc. (“T. Rowe”), William Blair & Company LLC (“William Blair”), Eagle Asset Management (“Eagle”), Pacific Investment Management Company LLC (“PIMCO”), Thornburg Investment Management Inc. (“Thornburg”), and ClearBridge Advisors LLC (“ClearBridge”) (collectively, the “Subadvisers”), under which each provides investment advisory services for certain Portfolios of the Series Fund. PI pays for the services of the Subadvisers, compensation of officers of the Series Fund, occupancy and certain clerical and administrative expenses of the Series Fund. The Portfolios bear all other costs and expenses.
B6
The management fee paid to PI is computed daily and payable monthly, at the annual rates specified below, of the value of each of the Portfolio’s average daily net assets.
| | | | | | |
Portfolio
| | Management Fee
| | | Effective
Management Fee
| |
SP Aggressive Growth Asset Allocation Portfolio | | 0.05 | % | | 0.05 | % |
SP AIM Core Equity Portfolio | | 0.85 | | | 0.85 | |
SP Balanced Asset Allocation Portfolio | | 0.05 | | | 0.05 | |
SP Conservative Asset Allocation Portfolio | | 0.05 | | | 0.05 | |
SP Davis Value Portfolio | | 0.75 | | | 0.75 | |
SP Growth Asset Allocation Portfolio | | 0.05 | | | 0.05 | |
SP International Growth Portfolio | | 0.85 | | | 0.85 | |
SP International Value Portfolio | | 0.90 | | | 0.90 | |
SP Large Cap Value Portfolio | | 0.80 | | | 0.80 | |
SP Mid-Cap Growth Portfolio | | 0.80 | | | 0.80 | |
SP PIMCO High Yield Portfolio | | 0.60 | | | 0.60 | |
SP PIMCO Total Return Portfolio | | 0.60 | | | 0.60 | |
SP Prudential U.S. Emerging Growth Portfolio | | 0.60 | | | 0.60 | |
SP Small Cap Growth Portfolio | | 0.95 | | | 0.95 | |
SP Small Cap Value Portfolio | | 0.90 | | | 0.90 | |
SP Strategic Partners Focused Growth Portfolio | | 0.90 | | | 0.90 | |
SP T. Rowe Price Large Cap Growth Portfolio | | 0.90 | | | 0.90 | |
At December 31, 2007 the Subadvisers that provide investment advisory services to the Portfolios are as follows. Where more than one Subadviser is listed, each Subadviser provides services to a segment of the Portfolio:
| | |
Portfolio
| | Subadviser(s)
|
SP AIM Core Equity Portfolio | | AIM |
SP Davis Value Portfolio | | Davis |
SP International Growth Portfolio | | William Blair, Marsico |
SP International Value Portfolio | | LSV, Thornburg |
SP Large Cap Value Portfolio | | Hotchkis and Wiley, J.P. Morgan, Dreman |
SP Mid-Cap Growth Portfolio | | Neuberger Berman |
SP PIMCO High Yield Portfolio | | PIMCO |
SP PIMCO Total Return Portfolio | | PIMCO |
SP Prudential U.S. Emerging Growth Portfolio | | Jennison |
SP Small Cap Growth Portfolio | | Neuberger Berman, Eagle |
SP Small Cap Value Portfolio | | GSAM, ClearBridge |
SP Strategic Partners Focused Growth Portfolio | | AllianceBernstein, Jennison |
SP T. Rowe Price Large Cap Growth Portfolio | | T. Rowe |
The Series Fund has a distribution agreement with Prudential Investment Management Services LLC (“PIMS”) which acts as the distributor of the Class I and Class II shares of the Series Fund. The Series Fund compensates PIMS for distributing and servicing the Series Fund’s Class II shares pursuant to a plan of distribution (the “Class II Plan”), regardless of expenses actually incurred by PIMS. The distribution fees are accrued daily and payable monthly. No distribution or service fees are paid to PIMS as distributor of the Class I shares of the Series Fund. Pursuant to the Class II Plan, the Class II shares of each Portfolio compensate PIMS for distribution-related activities at an annual rate of 0.25% of the average daily net assets of the Class II shares.
The Series Fund has an administration agreement with PI which acts as the administrator of the Class II shares of the Series Fund. The administration fee paid to PI is accrued daily and payable monthly, at the annual rate of 0.15% of the average daily net assets of the Class II shares.
PI has agreed to waive management fees and/or reimburse expenses of each Portfolio (other than the SP Aggressive Growth Asset Allocation, SP Balanced Asset Allocation, SP Conservative Asset Allocation and SP Growth Asset Allocation Portfolios) for the amount that the aggregate annual ordinary operating expenses
B7
(excluding interest, taxes, and brokerage commissions) exceeded the percentage stated below, of the Portfolio’s average daily net assets.
| | | | | | |
Portfolio
| | Class I
Expense limit
| | | Class II
Expense limit
| |
SP AIM Core Equity Portfolio | | 1.00 | % | | N/A | |
SP International Growth Portfolio | | 1.24 | | | 1.64 | % |
SP International Value Portfolio | | 1.00 | * | | N/A | |
SP Large Cap Value Portfolio | | 0.90 | * | | N/A | |
SP Mid-Cap Growth Portfolio | | 1.00 | | | N/A | |
SP PIMCO High Yield Portfolio | | 0.82 | * | | N/A | |
SP PIMCO Total Return Portfolio | | 0.76 | * | | N/A | |
SP Prudential U.S. Emerging Growth Portfolio | | 0.90 | * | | 1.30 | |
SP Small Cap Growth Portfolio | | 1.15 | * | | N/A | |
SP Small Cap Value Portfolio | | 1.05 | | | N/A | |
SP Strategic Partners Focused Growth Portfolio | | 1.25 | | | 1.65 | |
SP T. Rowe Price Large Cap Growth Portfolio | | 1.06 | * | | N/A | |
N/A – Not applicable – Portfolio does not currently have Class II shares.
PIMS, PI and Jennison are indirect, wholly-owned subsidiaries of Prudential Financial, Inc. (“Prudential”).
*Effective July 1, 2007, the expense limitation was removed.
| Note 4: | | Other Transactions with Affiliates |
Prudential Mutual Fund Services LLC (“PMFS”), an affiliate of PI and an indirect, wholly-owned subsidiary of Prudential, serves as the Series Fund’s transfer agent. Transfer agent fees and expenses in the Statements of Operations include certain out-of-pocket expenses paid to non-affiliates, where applicable.
Prudential Investment Management, Inc. (“PIM”), an indirect, wholly-owned subsidiary of Prudential, is the Series Fund’s security lending agent. For the year ended December 31, 2007, PIM was compensated as follows for these services by the Series Fund Portfolios:
| | | |
| | | PIM
|
SP Davis Value Portfolio | | $ | 35,168 |
SP International Growth Portfolio | | | 17,625 |
SP Large Cap Value Portfolio | | | 112,875 |
SP Mid Cap Growth Portfolio | | | 76,577 |
SP Prudential U.S. Emerging Growth Portfolio . | | | 56,836 |
SP Small Cap Growth Portfolio | | | 120,997 |
SP Small Cap Value Portfolio | | | 229,471 |
For the year ended December 31, 2007, Prudential Equity Group, LLC, an indirect wholly-owned subsidiary of Prudential, Wachovia Securities, LLC and First Clearing, LLC, affiliates of PI, earned brokerage commissions from transactions executed on behalf of the Series Fund Portfolios as follows:
| | | | | | |
Portfolio
| | Prudential
Equity Group
| | First
Clearing/
Wachovia
Securities
|
SP Davis Value Portfolio | | $ | 103 | | $ | — |
SP Prudential U.S. Emerging Growth Portfolio | | | 28 | | | — |
SP Small Cap Growth Portfolio | | | — | | | 527 |
SP Small Cap Value Portfolio | | | 1,213 | | | — |
Pursuant to an exemptive order received from the Securities and Exchange Commission, certain Portfolios invest in the Taxable Money Market Series and Short-Term Bond Series, both registered under the Investment Company Act of 1940, as amended, and managed by PI, and both of which are portfolios of Dryden Core Investment Fund.
B8
| Note 5: | | Portfolio Securities |
The aggregate cost of purchases and the proceeds from the sales of securities (excluding government securities and short-term issues) for the year ended December 31, 2007 were as follows:
Cost of Purchases:
| | | |
Portfolio
| | |
SP Aggressive Growth Asset Allocation Portfolio | | $ | 36,631,703 |
SP AIM Core Equity Portfolio | | | 16,134,646 |
SP Balanced Asset Allocation Portfolio | | | 362,725,650 |
SP Conservative Asset Allocation Portfolio | | | 195,508,921 |
SP Davis Value Portfolio | | | 30,454,017 |
SP Growth Asset Allocation Portfolio | | | 267,655,561 |
SP International Growth Portfolio | | | 399,681,927 |
SP International Value Portfolio | | | 237,090,012 |
SP Large Cap Value Portfolio | | | 576,631,354 |
SP Mid-Cap Growth Portfolio | | | 208,080,442 |
SP PIMCO High Yield Portfolio | | | 115,323,107 |
SP PIMCO Total Return Portfolio | | | 318,061,232 |
SP Prudential U.S. Emerging Growth Portfolio | | | 110,161,818 |
SP Small Cap Growth Portfolio | | | 73,807,591 |
SP Small Cap Value Portfolio | | | 150,690,332 |
SP Strategic Partners Focused Growth Portfolio | | | 79,444,236 |
SP T. Rowe Price Large Cap Growth Portfolio | | | 44,486,369 |
Proceeds from Sales:
| | | |
Portfolio
| | |
SP Aggressive Growth Asset Allocation Portfolio | | $ | 36,845,000 |
SP AIM Core Equity Portfolio | | | 22,055,463 |
SP Balanced Asset Allocation Portfolio | | | 474,537,666 |
SP Conservative Asset Allocation Portfolio | | | 229,489,000 |
SP Davis Value Portfolio | | | 58,017,922 |
SP Growth Asset Allocation Portfolio | | | 329,840,000 |
SP International Growth Portfolio | | | 456,570,204 |
SP International Value Portfolio | | | 312,544,302 |
SP Large Cap Value Portfolio | | | 645,855,936 |
SP Mid-Cap Growth Portfolio | | | 233,401,954 |
SP PIMCO High Yield Portfolio | | | 189,556,634 |
SP PIMCO Total Return Portfolio | | | 257,841,503 |
SP Prudential U.S. Emerging Growth Portfolio | | | 136,823,553 |
SP Small Cap Growth Portfolio | | | 68,382,372 |
SP Small Cap Value Portfolio | | | 181,637,331 |
SP Strategic Partners Focused Growth Portfolio | | | 92,647,505 |
SP T. Rowe Price Large Cap Growth Portfolio | | | 52,389,132 |
The SP AIM Core Equity, SP PIMCO High Yield and SP PIMCO Total Return Portfolios’ written options activity for the year ended December 31, 2007 were as follows:
| | | | | | | | | | | | | | |
| | | SP PIMCO High Yield
Bond
| | | SP PIMCO Total Return
Bond
| |
| | | Number of
Contracts/
Swap Notional
Amount $(000)
| | | Premium
| | | Number of
Contracts/
Swap Notional
Amount $(000)
| | | Premium
| |
Balance at beginning of year | | 3,400 | | | $ | 11,577 | | | 175,200 | | | $ | 2,044,259 | |
Written options | | 77,700 | | | | 1,944,180 | | | 415,400 | | | | 7,919,595 | |
Expired options | | (3,400 | ) | | | (11,577 | ) | | (57,500 | ) | | | (1,328,823 | ) |
Exercised options | | — | | | | — | | | (20,600 | ) | | | (350,875 | ) |
Closed options | | — | | | | — | | | (106,300 | ) | | | (1,094,696 | ) |
| | |
|
| |
|
|
| |
|
| |
|
|
|
Balance at end of year | | 77,700 | | | | 1,944,180 | | | 406,200 | | | $ | 7,189,460 | |
| | |
|
| |
|
|
| |
|
| |
|
|
|
B9
| | | | | | | |
| | | SP AIM Core Equity
| |
| | | Number of
Contracts
| | | Premium
| |
Balance at beginning of year | | — | | | | — | |
Written options | | 75 | | | $ | 1,800 | |
Expired options | | (35 | ) | | | (840 | ) |
Closed options | | (40 | ) | | | (960 | ) |
| | |
|
| |
|
|
|
Balance at end of year | | — | | | | — | |
| | |
|
| |
|
|
|
For federal income tax purposes, each Portfolio in the Trust is treated as a separate taxpaying entity. After January 2, 2006, the Portfolios are treated as partnerships for tax purposes. No provision has been made in the financial statements for U.S. Federal, state, or local taxes, as any tax liability arising from operations of the Portfolios are the responsibility of their partners. The Portfolios are not subject to tax. Partners of each Portfolio are subject to taxes on their distributive share of partnership items. The Portfolios’ federal and state income tax returns for tax years for which the applicable statutes of limitations have not expired are subject to examination by the Internal Revenue Service and state departments of revenue.
Prior to January 2, 2006 each Portfolio qualified as a regulated investment company under the Internal Revenue Code and distributed all of its taxable income, including any net realized gains on investments, to shareholders.
With respect to the Portfolios, book cost of assets differs from tax cost of assets as a result of each Portfolio’s adoption of a mark to market method of accounting for tax purposes. Under this method, tax cost of assets will approximate its fair market value.
The Series Fund offers Class I and Class II shares. Neither Class I nor Class II shares of a Portfolio are subject to any sales charge or redemption charge and are sold at the net asset value of the Portfolio. Class I shares are sold only to certain separate accounts of Prudential to fund benefits under certain variable life insurance and variable annuity contracts (“contracts”). Class II shares are sold only to separate accounts of non-Prudential insurance companies as investment options under certain contracts. The separate accounts invest in shares of the Series Fund through subaccounts that correspond to the Portfolios. The separate accounts will redeem shares of the Series Fund to the extent necessary to provide benefits under the contracts or for such other purposes as may be consistent with the contracts. As of December 31, 2007, the SP Prudential U.S. Emerging Growth, SP Strategic Partners Focused Growth and SP International Growth Portfolios have Class II shares outstanding.
B10
Transactions in shares of beneficial interest of the SP Prudential U.S. Emerging Growth, SP Strategic Partners Focused Growth and SP International Growth Portfolios were as follows:
| | | | | | | |
|
| SP Prudential U.S. Emerging Growth Portfolio: | |
Class I
| | Shares
| | | Amount
| |
Year ended December 31, 2007: | | | | | | | |
Series shares sold | | 1,555,189 | | | $ | 13,349,158 | |
Series shares issued in reinvestment of distributions | | 2,441,796 | | | | 20,193,651 | |
Series shares repurchased | | (4,874,848 | ) | | | (42,326,327 | ) |
| | |
|
| |
|
|
|
Net increase (decrease) in shares outstanding | | (877,863 | ) | | $ | (8,783,518 | ) |
| | |
|
| |
|
|
|
Year ended December 31, 2006: | | | | | | | |
Series shares sold | | 3,604,315 | | | $ | 28,455,379 | |
Series shares issued in reinvestment of distributions | | 1,974,138 | | | | 15,437,758 | |
Series shares repurchased | | (4,964,683 | ) | | | (38,298,965 | ) |
| | |
|
| |
|
|
|
Net increase in shares outstanding | | 613,770 | | | $ | 5,594,172 | |
| | |
|
| |
|
|
|
| | |
Class II
| | | | | | |
Year ended December 31, 2007: | | | | | | | |
Series shares sold | | 10 | | | $ | 79 | |
Series shares issued in reinvestment of distributions | | 4,585 | | | | 36,860 | |
Series shares repurchased | | (984 | ) | | | (8,413 | ) |
| | |
|
| |
|
|
|
Net increase (decrease) in shares outstanding | | 3,611 | | | $ | 28,526 | |
| | |
|
| |
|
|
|
Year ended December 31, 2006: | | | | | | | |
Series shares issued in reinvestment of distributions | | 4,052 | | | $ | 30,998 | |
Series shares repurchased | | (11,485 | ) | | | (87,675 | ) |
| | |
|
| |
|
|
|
Net decrease in shares outstanding | | (7,433 | ) | | $ | (56,677 | ) |
| | |
|
| |
|
|
|
|
| SP Strategic Partners Focused Growth Portfolio: | |
Class I
| | Shares
| | | Amount
| |
Year ended December 31, 2007: | | | | | | | |
Series shares sold | | 311,072 | | | $ | 2,472,505 | |
Series shares issued in reinvestment of distributions | | 179,113 | | | | 1,477,681 | |
Series shares repurchased | | (1,023,282 | ) | | | (8,046,092 | ) |
| | |
|
| |
|
|
|
Net increase (decrease) in shares outstanding | | (533,097 | ) | | $ | (4,095,906 | ) |
| | |
|
| |
|
|
|
Year ended December 31, 2006: | | | | | | | |
Series shares sold | | 1,132,903 | | | $ | 8,574,353 | |
Series shares issued in reinvestment of distributions | | 336,936 | | | | 2,547,235 | |
Series shares repurchased | | (1,051,192 | ) | | | (7,751,637 | ) |
| | |
|
| |
|
|
|
Net increase in shares outstanding | | 418,647 | | | $ | 3,369,951 | |
| | |
|
| |
|
|
|
| | |
Class II
| | | | | | |
Year ended December 31, 2007: | | | | | | | |
Series shares sold | | 269,076 | | | $ | 2,104,214 | |
Series shares issued in reinvestment of distributions | | 135,932 | | | | 1,087,456 | |
Series shares repurchased | | (1,307,927 | ) | | | (10,119,215 | ) |
| | |
|
| |
|
|
|
Net increase (decrease) in shares outstanding | | (902,919 | ) | | $ | (6,927,545 | ) |
| | |
|
| |
|
|
|
Year ended December 31, 2006: | | | | | | | |
Series shares sold | | 379,068 | | | $ | 2,840,023 | |
Series shares issued in reinvestment of distributions | | 375,712 | | | | 2,776,508 | |
Series shares repurchased | | (1,869,616 | ) | | | (13,464,717 | ) |
| | |
|
| |
|
|
|
Net decrease in shares outstanding | | (1,114,836 | ) | | $ | (7,848,186 | ) |
| | |
|
| |
|
|
|
B11
| | | | | | | |
| SP International Growth Portfolio: | |
Class I
| | Shares
| | | Amount
| |
Year ended December 31, 2007: | | | | | | | |
Series shares sold | | 10,087,889 | | | $ | 91,575,100 | |
Series shares issued in reinvestment of distributions | | 8,319,424 | | | | 69,883,161 | |
Series shares repurchased | | (14,648,601 | ) | | | (134,103,634 | ) |
| | |
|
| |
|
|
|
Net increase (decrease) in shares outstanding | | 3,758,712 | | | $ | 27,354,627 | |
| | |
|
| |
|
|
|
Year ended December 31, 2006: | | | | | | | |
Series shares sold | | 11,447,164 | | | $ | 86,938,831 | |
Series shares issued in reinvestment of distributions | | 6,137,410 | | | | 45,416,833 | |
Series shares repurchased | | (22,713,601 | ) | | | (171,563,955 | ) |
| | |
|
| |
|
|
|
Net decrease in shares outstanding | | (5,129,027 | ) | | $ | (39,208,291 | ) |
| | |
|
| |
|
|
|
| | |
Class II
| | | | | | |
Year ended December 31, 2007: | | | | | | | |
Series shares sold | | 952,660 | | | $ | 9,078,707 | |
Series shares issued in reinvestment of distributions | | 522,747 | | | | 4,307,437 | |
Series shares repurchased | | (618,021 | ) | | | (5,365,352 | ) |
| | |
|
| |
|
|
|
Net increase (decrease) in shares outstanding | | 857,386 | | | $ | 8,020,792 | |
| | |
|
| |
|
|
|
Year ended December 31, 2006: | | | | | | | |
Series shares sold | | 433,942 | | | $ | 3,274,484 | |
Series shares issued in reinvestment of distributions | | 314,818 | | | | 2,301,316 | |
Series shares repurchased | | (931,607 | ) | | | (6,930,628 | ) |
| | |
|
| |
|
|
|
Net decrease in shares outstanding | | (182,847 | ) | | $ | (1,354,828 | ) |
| | |
|
| |
|
|
|
The Series Fund, along with other affiliated registered investment companies (the “Funds”), is a party to a Syndicated Credit Agreement (“SCA”) with two banks. The SCA provides for a commitment of $500 million. Interest on any borrowings under the SCA is incurred at market rates and a commitment fee for the unused amount is accrued daily and paid quarterly. Effective October 26, 2007, the Funds renewed the SCA with the two banks. The Funds pays a commitment fee of .06 of 1% of the unused portion of the SCA. The expiration date of the SCA will be October 24, 2008. For the period from October 27, 2006 through October 26, 2007, the Funds paid a commitment fee of .07 of 1% of the unused portion of the agreement. The purpose of the SCA is to provide an alternative source of temporary funding for capital share redemptions.
The following Portfolios utilized the line of credit during the year ended December 31, 2007. The average balance is for the number of days the Portfolios had utilized the credit facility.
| | | | | | | | |
Portfolio
| | Approximate
Average
Balance
Outstanding
| | Number of Days
Outstanding
| | Weighted
Average
Interest
Rates
| |
SP Large Cap Value | | $ | 930,000 | | 10 | | 5.62 | % |
SP International Value | | | 2,356,250 | | 60 | | 5.45 | |
SP International Growth | | | 2,687,000 | | 24 | | 5.51 | |
SP Small Cap Growth | | | 1,188,571 | | 7 | | 4.95 | |
| Note 9: | | Ownership and Affiliates |
As of December 31, 2007, all of Class I shares of each Portfolio were owned of record by The Prudential Insurance Company of America (“PICA”) on behalf of the owners of the variable insurance products issued by PICA.
B12
The Board of Trustees have approved the merger of the SP AIM Core Equity Portfolio into the Advanced Series Trust (AST) Marsico Capital Growth Portfolio, SP Large Cap Value Portfolio into AST Large Cap Value Portfolio, SP Small Cap Growth Portfolio into AST Small Cap Growth Portfolio, and SP T. Rowe Price Large Cap Growth Portfolio into AST T. Rowe Price Large Cap Growth Portfolio. The mergers are subject to the approval by the shareholders of the respective funds.
| Note 11: | | New Accounting Pronouncements |
On September 20, 2006, the FASB released Statement of Financial Accounting Standards No. 157 “Fair Value Measurements” (FAS 157). FAS 157 establishes an authoritative definition of fair value, sets out a framework for measuring fair value, and requires additional disclosures about fair-value measurements. The application of FAS 157 is required for fiscal years beginning after November 15, 2007 and interim periods within those fiscal years. At this time, management is evaluating the implications of FAS 157 and its impact, if any, in the financial statements has not yet been determined.
B13
Financial Highlights
| | | | | | | | | | | | | | | | | | | | |
| | | SP Aggressive Growth Asset Allocation Portfolio
| |
| | | Year Ended December 31,
| |
| | | 2007
| | | 2006
| | | 2005
| | | 2004
| | | 2003
| |
Per Share Operating Performance : | | | | | | | | | | | | | | | | | | | | |
Net Asset Value, beginning of period | | $ | 10.41 | | | $ | 9.50 | | | $ | 8.98 | | | $ | 7.83 | | | $ | 5.90 | |
| | |
|
|
| |
|
|
| |
|
|
| |
|
|
| |
|
|
|
Income From Investment Operations: | | | | | | | | | | | | | | | | | | | | |
Net investment income | | | .10 | | | | .10 | | | | .18 | | | | .02 | | | | .01 | |
Net realized and unrealized gain on investments | | | .85 | | | | 1.22 | | | | .71 | | | | 1.13 | | | | 1.92 | |
| | |
|
|
| |
|
|
| |
|
|
| |
|
|
| |
|
|
|
Total from investment operations | | | .95 | | | | 1.32 | | | | .89 | | | | 1.15 | | | | 1.93 | |
| | |
|
|
| |
|
|
| |
|
|
| |
|
|
| |
|
|
|
Less Dividends and Distributions: | | | | | | | | | | | | | | | | | | | | |
Dividends from net investment income | | | — | | | | — | | | | (.02 | ) | | | — | (b) | | | — | (b) |
Distributions from net realized gains | | | — | | | | — | | | | (.35 | ) | | | — | | | | — | |
Distributions | | | (.61 | ) | | | (.41 | ) | | | — | | | | — | | | | — | |
| | |
|
|
| |
|
|
| |
|
|
| |
|
|
| |
|
|
|
Total dividends and distributions | | | (.61 | ) | | | (.41 | ) | | | (.37 | ) | | | — | | | | — | |
| | |
|
|
| |
|
|
| |
|
|
| |
|
|
| |
|
|
|
Net Asset Value, end of period | | $ | 10.75 | | | $ | 10.41 | | | $ | 9.50 | | | $ | 8.98 | | | $ | 7.83 | |
| | |
|
|
| |
|
|
| |
|
|
| |
|
|
| |
|
|
|
Total Return(a) | | | 9.20 | % | | | 14.27 | % | | | 10.48 | % | | | 14.76 | % | | | 32.77 | % |
Ratios/Supplemental Data: | | | | | | | | | | | | | | | | | | | | |
Net assets, end of period (in millions) | | $ | 205.3 | | | $ | 201.6 | | | $ | 188.2 | | | $ | 136.9 | | | $ | 60.6 | |
Ratios to average net assets(c): | | | | | | | | | | | | | | | | | | | | |
Expenses | | | .11 | % | | | .05 | % | | | .05 | % | | | .05 | % | | | .05 | % |
Net investment income | | | .83 | % | | | 1.00 | % | | | 2.29 | % | | | .27 | % | | | .16 | % |
Portfolio turnover rate | | | 18 | % | | | 28 | % | | | 26 | % | | | 60 | % | | | 22 | % |
| (a) | Total return is calculated assuming a purchase of a share on the first day and a sale on the last day of each period reported and includes reinvestment of dividends and distributions. Total return does not reflect expenses associated with the separate account such as administrative fees, account charges and surrender charges which, if reflected, would reduce the total returns for all periods shown. Past performance is no guarantee of future results. Total returns may reflect adjustments to conform to generally accepted accounting principles. |
| (b) | Less than $.005 per share. |
| (c) | Does not include expenses of the underlying portfolios in which the Portfolio invests. |
| | | | | | | | | | | | | | | | | | | | |
| | | SP AIM Core Equity Portfolio
| |
| | | Year Ended December 31,
| |
| | | 2007
| | | 2006
| | | 2005
| | | 2004
| | | 2003
| |
Per Share Operating Performance: | | | | | | | | | | | | | | | | | | | | |
Net Asset Value, beginning of year | | $ | 8.28 | | | $ | 7.62 | | | $ | 7.36 | | | $ | 6.80 | | | $ | 5.52 | |
| | |
|
|
| |
|
|
| |
|
|
| |
|
|
| |
|
|
|
Income From Investment Operations: | | | | | | | | | | | | | | | | | | | | |
Net investment income | | | .14 | | | | .09 | | | | .07 | | | | .08 | | | | .04 | |
Net realized and unrealized gain on investments | | | .51 | | | | 1.08 | | | | .27 | | | | .51 | | | | 1.26 | |
| | |
|
|
| |
|
|
| |
|
|
| |
|
|
| |
|
|
|
Total from investment operations | | | .65 | | | | 1.17 | | | | .34 | | | | .59 | | | | 1.30 | |
| | |
|
|
| |
|
|
| |
|
|
| |
|
|
| |
|
|
|
Less Dividends and Distributions: | | | | | | | | | | | | | | | | | | | | |
Dividends from net investment income | | | — | | | | — | | | | (.08 | ) | | | (.03 | ) | | | (.02 | ) |
Distributions | | | (.19 | ) | | | (.51 | ) | | | — | | | | — | | | | — | |
| | |
|
|
| |
|
|
| |
|
|
| |
|
|
| |
|
|
|
Total dividends and distributions | | | (.19 | ) | | | (.51 | ) | | | (.08 | ) | | | (.03 | ) | | | (.02 | ) |
| | |
|
|
| |
|
|
| |
|
|
| |
|
|
| |
|
|
|
Net Asset Value, end of year | | $ | 8.74 | | | $ | 8.28 | | | $ | 7.62 | | | $ | 7.36 | | | $ | 6.80 | |
| | |
|
|
| |
|
|
| |
|
|
| |
|
|
| |
|
|
|
Total Return(a) | | | 7.82 | % | | | 16.05 | % | | | 4.63 | % | | | 8.79 | % | | | 23.69 | % |
Ratios/Supplemental Data: | | | | | | | | | | | | | | | | | | | | |
Net assets, end of year (in millions) | | $ | 37.6 | | | $ | 37.9 | | | $ | 34.2 | | | $ | 31.8 | | | $ | 22.8 | |
Ratios to average net assets(c): | | | | | | | | | | | | | | | | | | | | |
Expenses | | | 1.00 | %(b) | | | 1.02 | %(b) | | | 1.00 | %(b) | | | 1.00 | %(b) | | | 1.00 | %(b) |
Net investment income | | | 1.48 | %(b) | | | 1.20 | %(b) | | | .98 | %(b) | | | 1.27 | %(b) | | | .70 | %(b) |
Portfolio turnover rate | | | 49 | % | | | 38 | % | | | 69 | % | | | 68 | % | | | 37 | % |
| (a) | Total return is calculated assuming a purchase of a share on the first day and a sale on the last day of each year reported and includes reinvestment of dividends and distributions. Total return does not reflect expenses associated with the separate account such as administrative fees, account charges and surrender charges which, if reflected, would reduce the total returns for all periods shown. Performance figures may reflect voluntary fee waivers and/or expense reimbursements. In the absence of voluntary fee waivers and/or expense reimbursements, the total return would be lower. Past performance is no guarantee of future results. Total returns may reflect adjustments to conform to generally accepted accounting principles. |
| (b) | Net of expense reimbursement. If the investment advisor had not reimbursed expenses, the annual expense and net investment income (loss) ratios would have been 1.22% and 1.26%, respectively, for the year ended December 31, 2007, 1.29% and .93%, respectively, for year ended December 31, 2006, 1.28% and .70%, respectively, for the year ended December 31, 2005, 1.48% and .79%, respectively, for the year ended December 31, 2004, and 1.72% and (.02)%, respectively for the year ended December 31, 2003. |
| (c) | Does not include expenses of the underlying portfolio in which the Portfolio invests. |
SEE NOTES TO FINANCIAL STATEMENTS.
C1
Financial Highlights
| | | | | | | | | | | | | | | | | | | | |
| | | SP Balanced Asset Allocation Portfolio
| |
| | | Year Ended December 31,
| |
| | | 2007
| | | 2006
| | | 2005
| | | 2004
| | | 2003
| |
Per Share Operating Performance: | | | | | | | | | | | | | | | | | | | | |
Net Asset Value, beginning of year | | $ | 11.59 | | | $ | 10.92 | | | $ | 10.63 | | | $ | 9.66 | | | $ | 7.96 | |
| | |
|
|
| |
|
|
| |
|
|
| |
|
|
| |
|
|
|
Income From Investment Operations: | | | | | | | | | | | | | | | | | | | | |
Net investment income | | | .27 | | | | .25 | | | | .27 | | | | .09 | | | | .09 | |
Net realized and unrealized gain on investments | | | .81 | | | | .89 | | | | .49 | | | | .97 | | | | 1.71 | |
| | |
|
|
| |
|
|
| |
|
|
| |
|
|
| |
|
|
|
Total from investment operations | | | 1.08 | | | | 1.14 | | | | .76 | | | | 1.06 | | | | 1.80 | |
| | |
|
|
| |
|
|
| |
|
|
| |
|
|
| |
|
|
|
Less Dividends and Distributions: | | | | | | | | | | | | | | | | | | | | |
Dividends from net investment income | | | — | | | | — | | | | (.10 | ) | | | (.08 | ) | | | (.10 | ) |
Distributions from net realized gains | | | — | | | | — | | | | (.37 | ) | | | (.01 | ) | | | — | |
Distributions | | | (.63 | ) | | | (.47 | ) | | | — | | | | — | | | | — | |
| | |
|
|
| |
|
|
| |
|
|
| |
|
|
| |
|
|
|
Total dividends and distributions | | | (.63 | ) | | | (.47 | ) | | | (.47 | ) | | | (.09 | ) | | | (.10 | ) |
| | |
|
|
| |
|
|
| |
|
|
| |
|
|
| |
|
|
|
Net Asset Value, end of year | | $ | 12.04 | | | $ | 11.59 | | | $ | 10.92 | | | $ | 10.63 | | | $ | 9.66 | |
| | |
|
|
| |
|
|
| |
|
|
| |
|
|
| |
|
|
|
Total Return(a) | | | 9.35 | % | | | 10.69 | % | | | 7.60 | % | | | 11.09 | % | | | 22.87 | % |
Ratios/Supplemental Data: | | | | | | | | | | | | | | | | | | | | |
Net assets, end of year (in millions) | | $ | 1,391.0 | | | $ | 1,406.3 | | | $ | 1,372.0 | | | $ | 837.0 | | | $ | 449.8 | |
Ratios to average net assets(b): | | | | | | | | | | | | | | | | | | | | |
Expenses | | | .06 | % | | | .05 | % | | | .05 | % | | | .05 | % | | | .05 | % |
Net investment income | | | 2.01 | % | | | 2.23 | % | | | 3.40 | % | | | 1.37 | % | | | 1.83 | % |
Portfolio turnover rate | | | 26 | % | | | 27 | % | | | 21 | % | | | 48 | % | | | 12 | % |
| (a) | Total return is calculated assuming a purchase of a share on the first day and a sale on the last day of each year reported and includes reinvestment of dividends and distributions. Total return does not reflect expenses associated with the separate account such as administrative fees, account charges and surrender charges which, if reflected, would reduce the total returns for all periods shown. Performance figures may reflect voluntary fee waivers and/or expense reimbursements. In the absense of voluntary fee waivers and /or expense reimbursements, the total return would be lower. Past performance is no guarantee of future results. Total returns may reflect adjustments to conform to generally accepted accounting principles. |
| (b) | Does not include expenses of the underlying portfolios in which the Portfolio invests. |
| | | | | | | | | | | | | | | | | | | | |
| | | SP Conservative Asset Allocation Portfolio
| |
| | | Year Ended December 31,
| |
| | | 2007
| | | 2006
| | | 2005
| | | 2004
| | | 2003
| |
Per Share Operating Performance: | | | | | | | | | | | | | | | | | | | | |
Net Asset Value, beginning of year | | $ | 11.66 | | | $ | 11.28 | | | $ | 11.20 | | | $ | 10.48 | | | $ | 9.16 | |
| | |
|
|
| |
|
|
| |
|
|
| |
|
|
| |
|
|
|
Income From Investment Operations: | | | | | | | | | | | | | | | | | | | | |
Net investment income | | | .36 | | | | .35 | | | | .38 | | | | .14 | | | | .16 | |
Net realized and unrealized gain on investments | | | .73 | | | | .59 | | | | .25 | | | | .77 | | | | 1.33 | |
| | |
|
|
| |
|
|
| |
|
|
| |
|
|
| |
|
|
|
Total from investment operations | | | 1.09 | | | | .94 | | | | .63 | | | | .91 | | | | 1.49 | |
| | |
|
|
| |
|
|
| |
|
|
| |
|
|
| |
|
|
|
Less Dividends and Distributions: | | | | | | | | | | | | | | | | | | | | |
Dividends from net investment income | | | — | | | | — | | | | (.16 | ) | | | (.16 | ) | | | (.16 | ) |
Distributions from net realized gains | | | — | | | | — | | | | (.39 | ) | | | (.03 | ) | | | (.01 | ) |
Distributions | | | (.66 | ) | | | (.56 | ) | | | — | | | | — | | | | — | |
| | |
|
|
| |
|
|
| |
|
|
| |
|
|
| |
|
|
|
Total dividends and distributions | | | (.66 | ) | | | (.56 | ) | | | (.55 | ) | | | (.19 | ) | | | (.17 | ) |
| | |
|
|
| |
|
|
| |
|
|
| |
|
|
| |
|
|
|
Net Asset Value, end of year | | $ | 12.09 | | | $ | 11.66 | | | $ | 11.28 | | | $ | 11.20 | | | $ | 10.48 | |
| | |
|
|
| |
|
|
| |
|
|
| |
|
|
| |
|
|
|
Total Return(a) | | | 9.39 | % | | | 8.67 | % | | | 5.91 | % | | | 8.89 | % | | | 16.49 | % |
Ratios/Supplemental Data: | | | | | | | | | | | | | | | | | | | | |
Net assets, end of year (in millions) | | $ | 621.3 | | | $ | 632.8 | | | $ | 642.0 | | | $ | 459.9 | | | $ | 281.2 | |
Ratios to average net assets(b): | | | | | | | | | | | | | | | | | | | | |
Expenses | | | .07 | % | | | .05 | % | | | .05 | % | | | .05 | % | | | .05 | % |
Net investment income | | | 2.67 | % | | | 2.94 | % | | | 4.10 | % | | | 1.86 | % | | | 2.60 | % |
Portfolio turnover rate | | | 31 | % | | | 33 | % | | | 24 | % | | | 47 | % | | | 22 | % |
| (a) | Total return is calculated assuming a purchase of a share on the first day and a sale on the last day of each year reported and includes reinvestment of dividends and distributions. Total return does not reflect expenses associated with the separate account such as administrative fees, account charges and surrender charges which, if reflected, would reduce the total returns for all years shown. Performance figures may reflect voluntary fee waivers and/or expense reimbursements. In the absence of voluntary fee waivers and/or expense reimbursements, the total return would be lower. Past performance is no guarantee of future results. Total returns may reflect adjustments to conform to generally accepted accounting principles. |
| (b) | Does not include expenses of the underlying portfolios in which the Portfolio invests. |
SEE NOTES TO FINANCIAL STATEMENTS.
C2
Financial Highlights
| | | | | | | | | | | | | | | | | | | | |
| | | SP Davis Value Portfolio
| |
| | | Year Ended December 31,
| |
| | | 2007
| | | 2006
| | | 2005
| | | 2004
| | | 2003
| |
Per Share Operating Performance: | | | | | | | | | | | | | | | | | | | | |
Net Asset Value, beginning of year | | $ | 11.99 | | | $ | 10.68 | | | $ | 10.98 | | | $ | 9.80 | | | $ | 7.62 | |
| | |
|
|
| |
|
|
| |
|
|
| |
|
|
| |
|
|
|
Income From Investment Operations: | | | | | | | | | | | | | | | | | | | | |
Net investment income | | | .15 | | | | .09 | | | | .09 | | | | .10 | | | | .05 | |
Net realized and unrealized gain on investments | | | .39 | | | | 1.49 | | | | .82 | | | | 1.12 | | | | 2.18 | |
| | |
|
|
| |
|
|
| |
|
|
| |
|
|
| |
|
|
|
Total from investment operations | | | .54 | | | | 1.58 | | | | .91 | | | | 1.22 | | | | 2.23 | |
| | |
|
|
| |
|
|
| |
|
|
| |
|
|
| |
|
|
|
Less Dividends and Distributions: | | | | | | | | | | | | | | | | | | | | |
Dividends from net investment income | | | — | | | | — | | | | (.10 | ) | | | (.04 | ) | | | (.05 | ) |
Distributions from net realized gains | | | — | | | | — | | | | (1.11 | ) | | | — | | | | — | |
Distributions | | | (.53 | ) | | | (.27 | ) | | | — | | | | — | | | | — | |
| | |
|
|
| |
|
|
| |
|
|
| |
|
|
| |
|
|
|
Total dividends and distributions | | | (.53 | ) | | | (.27 | ) | | | (1.21 | ) | | | (.04 | ) | | | (.05 | ) |
| | |
|
|
| |
|
|
| |
|
|
| |
|
|
| |
|
|
|
Net Asset Value, end of year | | $ | 12.00 | | | $ | 11.99 | | | $ | 10.68 | | | $ | 10.98 | | | $ | 9.80 | |
| | |
|
|
| |
|
|
| |
|
|
| |
|
|
| |
|
|
|
Total Return(a) | | | 4.58 | % | | | 15.02 | % | | | 9.52 | % | | | 12.53 | % | | | 29.40 | % |
Ratios/Supplemental Data: | | | | | | | | | | | | | | | | | | | | |
Net assets, end of year (in millions) | | $ | 309.0 | | | $ | 328.0 | | | $ | 311.7 | | | $ | 285.5 | | | $ | 391.2 | |
Ratios to average net assets(b): | | | | | | | | | | | | | | | | | | | | |
Expenses | | | .80 | % | | | .81 | % | | | .82 | % | | | .82 | % | | | .82 | % |
Net investment income | | | 1.11 | % | | | .81 | % | | | .87 | % | | | .89 | % | | | .80 | % |
Portfolio turnover rate | | | 9 | % | | | 14 | % | | | 14 | % | | | 34 | % | | | 7 | % |
| (a) | Total return is calculated assuming a purchase of a share on the first day and a sale on the last day of each year reported and includes reinvestment of dividends and distributions. Total return does not reflect expenses associated with the separate account such as administrative fees, account charges and surrender charges which, if reflected, would reduce the total returns for all periods shown. Performance figures may reflect voluntary fee waivers and/or expense reimbursements. In the absence of voluntary fee waivers and/or expense reimbursements, the total return would be lower. Past performance is no guarantee of future results. Total returns may reflect adjustments to conform to generally accepted accounting principles. |
| (b) | Does not include expenses of the underlying portfolio in which the Portfolio invests. |
| | | | | | | | | | | | | | | | | | | | |
| | | SP Growth Asset Allocation Portfolio
| |
| | | Year Ended December 31,
| |
| | | 2007
| | | 2006
| | | 2005
| | | 2004
| | | 2003
| |
Per Share Operating Performance: | | | | | | | | | | | | | | | | | | | | |
Net Asset Value, beginning of year | | $ | 11.17 | | | $ | 10.23 | | | $ | 9.80 | | | $ | 8.71 | | | $ | 6.84 | |
| | |
|
|
| |
|
|
| |
|
|
| |
|
|
| |
|
|
|
Income From Investment Operations: | | | | | | | | | | | | | | | | | | | | |
Net investment income | | | .18 | | | | .16 | | | | .19 | | | | .06 | | | | .04 | |
Net realized and unrealized gain on investments | | | .85 | | | | 1.13 | | | | .66 | | | | 1.07 | | | | 1.88 | |
| | |
|
|
| |
|
|
| |
|
|
| |
|
|
| |
|
|
|
Total from investment operations | | | 1.03 | | | | 1.29 | | | | .85 | | | | 1.13 | | | | 1.92 | |
| | |
|
|
| |
|
|
| |
|
|
| |
|
|
| |
|
|
|
Less Dividends and Distributions: | | | | | | | | | | | | | | | | | | | | |
Dividends from net investment income | | | — | | | | — | | | | (.06 | ) | | | (.04 | ) | | | (.05 | ) |
Distributions from net realized gains | | | — | | | | — | | | | (.36 | ) | | | — | | | | — | |
Distributions | | | (.61 | ) | | | (.35 | ) | | | — | | | | — | | | | — | |
| | |
|
|
| |
|
|
| |
|
|
| |
|
|
| |
|
|
|
Total dividends and distributions | | | (.61 | ) | | | (.35 | ) | | | (.42 | ) | | | (.04 | ) | | | (.05 | ) |
| | |
|
|
| |
|
|
| |
|
|
| |
|
|
| |
|
|
|
Net Asset Value, end of year | | $ | 11.59 | | | $ | 11.17 | | | $ | 10.23 | | | $ | 9.80 | | | $ | 8.71 | |
| | |
|
|
| |
|
|
| |
|
|
| |
|
|
| |
|
|
|
Total Return(a) | | | 9.23 | % | | | 12.88 | % | | | 9.24 | % | | | 13.05 | % | | | 28.27 | % |
Ratios/Supplemental Data: | | | | | | | | | | | | | | | | | | | | |
Net assets, end of year (in millions) | | $ | 1,252.7 | | | $ | 1,283.9 | | | $ | 1,212.0 | | | $ | 662.7 | | | $ | 326.7 | |
Ratios to average net assets(b): | | | | | | | | | | | | | | | | | | | | |
Expenses | | | .06 | % | | | .05 | % | | | .05 | % | | | .05 | % | | | .05 | % |
Net investment income | | | 1.32 | % | | | 1.50 | % | | | 2.65 | % | | | .94 | % | | | 1.10 | % |
Portfolio turnover rate | | | 21 | % | | | 25 | % | | | 18 | % | | | 53 | % | | | 18 | % |
| (a) | Total return is calculated assuming a purchase of a share on the first day and a sale on the last day of each year reported and includes reinvestment of dividends and distributions and does not reflect the effect of insurance contract charges. Total return does not reflect expenses associated with the separate account such as administrative fees, account charges and surrender charges which, if reflected, would reduce the total returns for all periods shown. Performance figures may reflect voluntary fee waivers and/or expense reimbursements. In the absence of voluntary fee waivers and/or expense reimbursements, the total return would be lower. Past performance is no guarantee of future results. Total returns may reflect adjustments to conform to generally accepted accounting principles. |
| (b) | Does not include expenses of the underlying portfolios in which the Portfolio invests. |
SEE NOTES TO FINANCIAL STATEMENTS.
C3
Financial Highlights
| | | | | | | | | | | | | | | | | | | | |
| | | SP International Growth Portfolio | |
| | | Class I
| |
| | | Year Ended December 31,
| |
| | | 2007(c)
| | | 2006
| | | 2005
| | | 2004
| | | 2003
| |
Per Share Operating Performance: | | | | | | | | | | | | | | | | | | | | |
Net Asset Value, beginning of year | | $ | 8.30 | | | $ | 7.55 | | | $ | 6.85 | | | $ | 5.89 | | | $ | 4.22 | |
| | |
|
|
| |
|
|
| |
|
|
| |
|
|
| |
|
|
|
Income From Investment Operations: | | | | | | | | | | | | | | | | | | | | |
Net investment income | | | .10 | | | | .05 | | | | .04 | | | | .02 | | | | .01 | |
Net realized and unrealized gain on investments | | | 1.50 | | | | 1.45 | | | | 1.01 | | | | .95 | | | | 1.66 | |
| | |
|
|
| |
|
|
| |
|
|
| |
|
|
| |
|
|
|
Total from investment operations | | | 1.60 | | | | 1.50 | | | | 1.05 | | | | .97 | | | | 1.67 | |
| | |
|
|
| |
|
|
| |
|
|
| |
|
|
| |
|
|
|
Less Dividends and Distributions: | | | | | | | | | | | | | | | | | | | | |
Dividends from net investment income | | | — | | | | — | | | | (.04 | ) | | | (.01 | ) | | | — | |
Distributions from net realized gains | | | — | | | | — | | | | (.31 | ) | | | — | | | | — | |
Distributions | | | (1.38 | ) | | | (.75 | ) | | | — | | | | — | | | | — | |
| | |
|
|
| |
|
|
| |
|
|
| |
|
|
| |
|
|
|
Total dividends and distributions | | | (1.38 | ) | | | (.75 | ) | | | (.35 | ) | | | (.01 | ) | | | — | |
| | |
|
|
| |
|
|
| |
|
|
| |
|
|
| |
|
|
|
Net Asset Value, end of year | | $ | 8.52 | | | $ | 8.30 | | | $ | 7.55 | | | $ | 6.85 | | | $ | 5.89 | |
| | |
|
|
| |
|
|
| |
|
|
| |
|
|
| |
|
|
|
Total Return(a) | | | 19.55 | % | | | 21.05 | % | | | 16.39 | % | | | 16.54 | % | | | 39.57 | % |
Ratios/Supplemental Data: | | | | | | | | | | | | | | | | | | | | |
Net assets, end of year (in millions) | | $ | 500.0 | | | $ | 456.0 | | | $ | 453.6 | | | $ | 249.1 | | | $ | 105.6 | |
Ratios to average net assets(b): | | | | | | | | | | | | | | | | | | | | |
Expenses | | | .94 | % | | | .97 | % | | | .98 | % | | | 1.02 | % | | | 1.15 | % |
Net investment income | | | 1.14 | % | | | .69 | % | | | .64 | % | | | .50 | % | | | .56 | % |
Portfolio turnover rate | | | 81 | % | | | 111 | % | | | 99 | % | | | 137 | % | | | 121 | % |
| (a) | Total return is calculated assuming a purchase of a share on the first day and a sale on the last day of each year reported and includes reinvestment of dividends and distributions. Total return does not reflect expenses associated with the separate account such as administrative fees, account charges and surrender charges which, if reflected, would reduce the total returns for all periods shown. Performance figures may reflect voluntary fee waivers and/or expense reimbursements. In the absence of voluntary fee waivers and/or expense reimbursements, the total return would be lower. Past performance is no guarantee of future results. Total returns may reflect adjustments to conform to generally accepted accounting principles. |
| (b) | Does not include expenses of the underlying portfolio in which the Portfolio invests. |
| (c) | Calculation based on average shares outstanding during the year. |
| | | | | | | | | | | | | | | | | | | | |
| | | SP International Growth Portfolio | |
| | | Class II
| |
| | | Year Ended December 31,
| |
| | | 2007(c)
| | | 2006
| | | 2005
| | | 2004
| | | 2003
| |
Per Share Operating Performance: | | | | | | | | | | | | | | | | | | | | |
Net Asset Value, beginning of year | | $ | 8.17 | | | $ | 7.45 | | | $ | 6.77 | | | $ | 5.83 | | | $ | 4.19 | |
| | |
|
|
| |
|
|
| |
|
|
| |
|
|
| |
|
|
|
Income From Investment Operations: | | | | | | | | | | | | | | | | | | | | |
Net investment income | | | .07 | | | | .02 | | | | .03 | | | | .01 | | | | .01 | |
Net realized and unrealized gain on investments | | | 1.47 | | | | 1.42 | | | | .98 | | | | .93 | | | | 1.63 | |
| | |
|
|
| |
|
|
| |
|
|
| |
|
|
| |
|
|
|
Total from investment operations | | | 1.54 | | | | 1.44 | | | | 1.01 | | | | .94 | | | | 1.64 | |
| | |
|
|
| |
|
|
| |
|
|
| |
|
|
| |
|
|
|
Less Dividends and Distributions: | | | | | | | | | | | | | | | | | | | | |
Dividends from net investment income | | | — | | | | — | | | | (.02 | ) | | | — | | | | — | |
Distributions from net realized gains | | | — | | | | — | | | | (.31 | ) | | | — | | | | — | |
Distributions | | | (1.35 | ) | | | (.72 | ) | | | — | | | | — | | | | — | |
| | |
|
|
| |
|
|
| |
|
|
| |
|
|
| |
|
|
|
Total dividends and distributions | | | (1.35 | ) | | | (.72 | ) | | | (.33 | ) | | | — | | | | — | |
| | |
|
|
| |
|
|
| |
|
|
| |
|
|
| |
|
|
|
Net Asset Value, end of year | | $ | 8.36 | | | $ | 8.17 | | | $ | 7.45 | | | $ | 6.77 | | | $ | 5.83 | |
| | |
|
|
| |
|
|
| |
|
|
| |
|
|
| |
|
|
|
Total Return(a) | | | 19.12 | % | | | 20.42 | % | | | 15.79 | % | | | 16.12 | % | | | 39.14 | % |
Ratios/Supplemental Data: | | | | | | | | | | | | | | | | | | | | |
Net assets, end of year (in millions) | | $ | 31.5 | | | $ | 23.8 | | | $ | 23.1 | | | $ | 139.0 | | | $ | 113.6 | |
Ratios to average net assets(b): | | | | | | | | | | | | | | | | | | | | |
Expenses | | | 1.34 | % | | | 1.37 | % | | | 1.38 | % | | | 1.41 | % | | | 1.54 | % |
Net investment income | | | .70 | % | | | .28 | % | | | .56 | % | | | .21 | % | | | .04 | % |
Portfolio turnover rate | | | 81 | % | | | 111 | % | | | 99 | % | | | 137 | % | | | 121 | % |
| (a) | Total return is calculated assuming a purchase of a share on the first day and a sale on the last day of each year reported and includes reinvestment of dividends and distributions. Total return does not reflect expenses associated with the separate account such as administrative fees, account charges and surrender charges which, if reflected, would reduce the total returns for all periods shown. Performance figures may reflect voluntary fee waivers and/or expense reimbursements. In the absence of voluntary fee waivers and/or expense reimbursements, the total return would be lower. Past performance is no guarantee of future results. Total returns may reflect adjustments to conform to generally accepted accounting principles. |
| (b) | Does not include expenses of the underlying portfolio in which the Portfolio invests. |
| (c) | Calculation based on average shares outstanding during the year. |
SEE NOTES TO FINANCIAL STATEMENTS.
C4
Financial Highlights
| | | | | | | | | | | | | | | | | | | | |
| | | SP International Value Portfolio
| |
| | | Year Ended December 31,
| |
| | | 2007
| | | 2006
| | | 2005(c)
| | | 2004
| | | 2003(c)
| |
Per Share Operating Performance: | | | | | | | | | | | | | | | | | | | | |
Net Asset Value, beginning of year | | $ | 11.40 | | | $ | 9.08 | | | $ | 8.84 | | | $ | 7.67 | | | $ | 6.08 | |
| | |
|
|
| |
|
|
| |
|
|
| |
|
|
| |
|
|
|
Income From Investment Operations: | | | | | | | | | | | | | | | | | | | | |
Net investment income | | | .24 | | | | .24 | | | | .17 | | | | .04 | | | | .06 | |
Net realized and unrealized gain on investments | | | 1.79 | | | | 2.35 | | | | .94 | | | | 1.17 | | | | 1.58 | |
| | |
|
|
| |
|
|
| |
|
|
| |
|
|
| |
|
|
|
Total from investment operations | | | 2.03 | | | | 2.59 | | | | 1.11 | | | | 1.21 | | | | 1.64 | |
| | |
|
|
| |
|
|
| |
|
|
| |
|
|
| |
|
|
|
Less Dividends and Distributions: | | | | | | | | | | | | | | | | | | | | |
Dividends from net investment income | | | — | | | | — | | | | (.04 | ) | | | (.04 | ) | | | (.05 | ) |
Distributions from net realized gains | | | — | | | | — | | | | (.83 | ) | | | — | | | | — | |
Distributions | | | (2.80 | ) | | | (.27 | ) | | | — | | | | — | | | | — | |
| | |
|
|
| |
|
|
| |
|
|
| |
|
|
| |
|
|
|
Total dividends and distributions | | | (2.80 | ) | | | (.27 | ) | | | (.87 | ) | | | (.04 | ) | | | (.05 | ) |
| | |
|
|
| |
|
|
| |
|
|
| |
|
|
| |
|
|
|
Net Asset Value, end of year | | $ | 10.63 | | | $ | 11.40 | | | $ | 9.08 | | | $ | 8.84 | | | $ | 7.67 | |
| | |
|
|
| |
|
|
| |
|
|
| |
|
|
| |
|
|
|
Total Return(a) | | | 18.08 | % | | | 29.09 | % | | | 13.77 | % | | | 15.80 | % | | | 27.37 | % |
Ratios/Supplemental Data: | | | | | | | | | | | | | | | | | | | | |
Net assets, end of year (in millions) | | $ | 493.6 | | | $ | 487.4 | | | $ | 389.3 | | | $ | 240.7 | | | $ | 119.9 | |
Ratios to average net assets(d): | | | | | | | | | | | | | | | | | | | | |
Expenses | | | .99 | % | | | .99 | % | | | 1.06 | % | | | 1.10 | %(b) | | | 1.10 | %(b) |
Net investment income | | | 1.80 | % | | | 2.28 | % | | | 2.08 | % | | | .69 | %(b) | | | .89 | %(b) |
Portfolio turnover rate | | | 46 | % | | | 113 | % | | | 18 | % | | | 159 | % | | | 87 | % |
| (a) | Total return is calculated assuming a purchase of a share on the first day and a sale on the last day of each year reported and includes reinvestment of dividends and distributions. Total return does not reflect expenses associated with the separate account such as administrative fees, account charges and surrender charges which, if reflected, would reduce the total returns for all periods shown. Performance figures may reflect voluntary fee waivers and/or expense reimbursements. In the absence of voluntary fee waivers and/or expense reimbursements, the total return would be lower. Past performance is no guarantee of future results. Total returns may reflect adjustments to conform to generally accepted accounting principles. |
| (b) | Net of expense reimbursement. If the investment advisor had not reimbursed expenses, the annual expense and net investment income ratios would have been 1.23% and .55%, respectively, for the year ended December 31, 2004, and 1.30% and .69%, respectively, for the year ended December 31, 2003. |
| (c) | Calculated based upon weighted average shares outstanding during the year. |
| (d) | Does not include expenses of the underlying portfolio in which the Portfolio invests. |
| | | | | | | | | | | | | | | | | | | | |
| | | SP Large Cap Value Portfolio
| |
| | | Year Ended December 31,
| |
| | | 2007
| | | 2006
| | | 2005
| | | 2004(c)
| | | 2003
| |
Per Share Operating Performance: | | | | | | | | | | | | | | | | | | | | |
Net Asset Value, beginning of year | | $ | 13.26 | | | $ | 11.90 | | | $ | 11.56 | | | $ | 9.90 | | | $ | 7.81 | |
| | |
|
|
| |
|
|
| |
|
|
| |
|
|
| |
|
|
|
Income (Loss) From Investment Operations: | | | | | | | | | | | | | | | | | | | | |
Net investment income | | | .25 | | | | .20 | | | | .16 | | | | .16 | | | | .09 | |
Net realized and unrealized gain (loss) on investments | | | (.62 | ) | | | 1.91 | | | | .58 | | | | 1.58 | | | | 2.00 | |
| | |
|
|
| |
|
|
| |
|
|
| |
|
|
| |
|
|
|
Total from investment operations | | | (.37 | ) | | | 2.11 | | | | .74 | | | | 1.74 | | | | 2.09 | |
| | |
|
|
| |
|
|
| |
|
|
| |
|
|
| |
|
|
|
Less Dividends and Distributions: | | | | | | | | | | | | | | | | | | | | |
Dividends from net investment income | | | — | | | | — | | | | (.10 | ) | | | (.08 | ) | | | — | |
Distributions from net realized gains | | | — | | | | — | | | | (.30 | ) | | | — | | | | — | |
Distributions | | | (1.09 | ) | | | (.75 | ) | | | — | | | | — | | | | — | |
| | |
|
|
| |
|
|
| |
|
|
| |
|
|
| |
|
|
|
Total dividends and distributions | | | (1.09 | ) | | | (.75 | ) | | | (.40 | ) | | | (.08 | ) | | | — | |
| | |
|
|
| |
|
|
| |
|
|
| |
|
|
| |
|
|
|
Net Asset Value, end of year | | $ | 11.80 | | | $ | 13.26 | | | $ | 11.90 | | | $ | 11.56 | | | $ | 9.90 | |
| | |
|
|
| |
|
|
| |
|
|
| |
|
|
| |
|
|
|
Total Return(a) | | | (2.83 | )% | | | 18.47 | % | | | 6.64 | % | | | 17.75 | % | | | 26.76 | % |
Ratios/Supplemental Data: | | | | | | | | | | | | | | | | | | | | |
Net assets, end of year (in millions) | | $ | 831.6 | | | $ | 959.6 | | | $ | 833.1 | | | $ | 601.4 | | | $ | 72.9 | |
Ratios to average net assets(d): | | | | | | | | | | | | | | | | | | | | |
Expenses | | | .83 | % | | | .83 | % | | | .83 | % | | | .86 | % | | | .90 | %(b) |
Net investment income | | | 1.71 | % | | | 1.64 | % | | | 1.53 | % | | | 1.53 | % | | | 1.32 | %(b) |
Portfolio turnover rate | | | 63 | % | | | 71 | % | | | 62 | % | | | 77 | % | | | 73 | % |
| (a) | Total return is calculated assuming a purchase of a share on the first day and a sale on the last day of each year reported and includes reinvestment of dividends and distributions. Total return does not reflect expenses associated with the separate account such as administrative fees, account charges and surrender charges which, if reflected, would reduce the total returns for all periods shown. Performance figures may reflect voluntary fee waivers and/or expense reimbursements. In the absence of voluntary fee waivers and/or expense reimbursements, the total return would be lower. Past performance is no guarantee of future results. Total returns may reflect adjustments to conform to generally accepted accounting principles. |
| (b) | Net of expense reimbursement. If the investment advisor had not reimbursed expenses, the annual expense and net investment loss ratios would have been 1.11% and 1.11%, respectively, for the year ended December 31, 2003. |
| (c) | Calculated based upon weighted average share outstanding during the year. |
| (d) | Does not include expenses of the underlying portfolio in which the Portfolio invests. |
SEE NOTES TO FINANCIAL STATEMENTS.
C5
Financial Highlights
| | | | | | | | | | | | | | | | | | | | |
| | | SP Mid-Cap Growth Portfolio
| |
| | | Year Ended December 31,
| |
| | | 2007
| | | 2006
| | | 2005
| | | 2004
| | | 2003
| |
Per Share Operating Performance: | | | | | | | | | | | | | | | | | | | | |
Net Asset Value, beginning of year | | $ | 7.07 | | | $ | 7.21 | | | $ | 6.85 | | | $ | 5.73 | | | $ | 4.09 | |
| | |
|
|
| |
|
|
| |
|
|
| |
|
|
| |
|
|
|
Income (Loss) From Investment Operations: | | | | | | | | | | | | | | | | | | | | |
Net investment income (loss) | | | (.02 | ) | | | .02 | | | | (.03 | ) | | | (.03 | ) | | | (.02 | ) |
Net realized and unrealized gain (loss) on investments | | | 1.16 | | | | (.16 | ) | | | .39 | | | | 1.15 | | | | 1.66 | |
| | |
|
|
| |
|
|
| |
|
|
| |
|
|
| |
|
|
|
Total from investment operations | | | 1.14 | | | | (.14 | ) | | | .36 | | | | 1.12 | | | | 1.64 | |
| | |
|
|
| |
|
|
| |
|
|
| |
|
|
| |
|
|
|
Less Distributions: | | | | | | | | | | | | | | | | | | | | |
Distributions | | | (.68 | ) | | | — | | | | — | | | | — | | | | — | |
| | |
|
|
| |
|
|
| |
|
|
| |
|
|
| |
|
|
|
Net Asset Value, end of year | | $ | 7.53 | | | $ | 7.07 | | | $ | 7.21 | | | $ | 6.85 | | | $ | 5.73 | |
| | |
|
|
| |
|
|
| |
|
|
| |
|
|
| |
|
|
|
Total Return(a) | | | 16.21 | % | | | (1.94 | )% | | | 5.26 | % | | | 19.55 | % | | | 40.10 | % |
Ratios/Supplemental Data: | | | | | | | | | | | | | | | | | | | | |
Net assets, end of year (in millions) | | $ | 134.8 | | | $ | 133.1 | | | $ | 152.9 | | | $ | 107.5 | | | $ | 58.9 | |
Ratios to average net assets(c): | | | | | | | | | | | | | | | | | | | | |
Expenses | | | .87 | % | | | .91 | % | | | 1.00 | %(b) | | | 1.00 | %(b) | | | 1.00 | %(b) |
Net investment income (loss) | | | (.30 | )% | | | .20 | % | | | (.56 | )%(b) | | | (.68 | )%(b) | | | (.73 | )%(b) |
Portfolio turnover rate | | | 156 | % | | | 107 | % | | | 94 | % | | | 79 | % | | | 73 | % |
| (a) | Total return is calculated assuming a purchase of a share on the first day and a sale on the last day of each year reported and includes reinvestment of distributions. Total return does not reflect expenses associated with the separate account such as administrative fees, account charges and surrender charges which, if reflected, would reduce the total returns for all periods shown. Performance figures may reflect voluntary fee waivers and/or expense reimbursements. In the absence of voluntary fee waivers and/or expense reimbursements, the total return would be lower. Past performance is no guarantee of future results. Total returns may reflect adjustments to conform to generally accepted accounting principles. |
| (b) | Net of expense reimbursement. If the investment advisor had not reimbursed expenses, the annual expense and net investment loss ratios would have been 1.02% and (.58)%, respectively, for the year ended December 31, 2005, 1.07% and (.75)%, respectively, for the year ended December 31, 2004, and 1.34% and (1.07)%, respectively, for the year ended December 31, 2003. |
| (c) | Does not include expenses of the underlying portfolio in which the Portfolio invests. |
| | | | | | | | | | | | | | | | | | | | |
| | | SP PIMCO High Yield Portfolio
| |
| | | Year Ended December 31,
| |
| | | 2007
| | | 2006
| | | 2005
| | | 2004
| | | 2003
| |
Per Share Operating Performance: | | | | | | | | | | | | | | | | | | | | |
Net Asset Value, beginning of year | | $ | 10.33 | | | $ | 10.25 | | | $ | 10.67 | | | $ | 10.53 | | | $ | 9.17 | |
| | |
|
|
| |
|
|
| |
|
|
| |
|
|
| |
|
|
|
Income From Investment Operations: | | | | | | | | | | | | | | | | | | | | |
Net investment income | | | .77 | | | | .75 | | | | .68 | | | | .69 | | | | .65 | |
Net realized and unrealized gain (loss) on investments | | | (.39 | ) | | | .18 | | | | (.27 | ) | | | .25 | | | | 1.36 | |
| | |
|
|
| |
|
|
| |
|
|
| |
|
|
| |
|
|
|
Total from investment operations | | | .38 | | | | .93 | | | | .41 | | | | .94 | | | | 2.01 | |
| | |
|
|
| |
|
|
| |
|
|
| |
|
|
| |
|
|
|
Less Dividends and Distributions: | | | | | | | | | | | | | | | | | | | | |
Dividends from net investment income | | | — | | | | — | | | | (.68 | ) | | | (.70 | ) | | | (.65 | ) |
Distributions from net realized gains | | | — | | | | — | | | | (.15 | ) | | | (.10 | ) | | | — | |
Distributions | | | (.88 | ) | | | (.85 | ) | | | — | | | | — | | | | — | |
| | |
|
|
| |
|
|
| |
|
|
| |
|
|
| |
|
|
|
Total dividends and distributions | | | (.88 | ) | | | (.85 | ) | | | (.83 | ) | | | (.80 | ) | | | (.65 | ) |
| | |
|
|
| |
|
|
| |
|
|
| |
|
|
| |
|
|
|
Net Asset Value, end of year | | $ | 9.83 | | | $ | 10.33 | | | $ | 10.25 | | | $ | 10.67 | | | $ | 10.53 | |
| | |
|
|
| |
|
|
| |
|
|
| |
|
|
| |
|
|
|
Total Return(a) | | | 3.77 | % | | | 9.51 | % | | | 4.03 | % | | | 9.32 | % | | | 22.41 | % |
Ratios/Supplemental Data: | | | | | | | | | | | | | | | | | | | | |
Net assets, end of year (in millions) | | $ | 206.0 | | | $ | 274.4 | | | $ | 368.6 | | | $ | 312.5 | | | $ | 248.2 | |
Ratios to average net assets(b): | | | | | | | | | | | | | | | | | | | | |
Expenses | | | .69 | % | | | .70 | % | | | .67 | % | | | .68 | % | | | .72 | % |
Net investment income | | | 7.14 | % | | | 6.95 | % | | | 6.65 | % | | | 6.68 | % | | | 6.97 | % |
Portfolio turnover rate | | | 98 | % | | | 59 | % | | | 89 | % | | | 53 | % | | | 74 | % |
| (a) | Total return is calculated assuming a purchase of a share on the first day and a sale on the last day of each year reported and includes reinvestment of dividends and distributions. Total return does not reflect expenses associated with the separate account such as administrative fees, account charges and surrender charges which, if reflected, would reduce the total returns for all periods shown. Performance figures may reflect voluntary fee waivers and/or expense reimbursements. In the absence of voluntary fee waivers and/or expense reimbursements, the total return would be lower. Past performance is no guarantee of future results. Total returns may reflect adjustments to conform to generally accepted accounting principles. |
| (b) | Does not include expenses of the underlying portfolio in which the Portfolio invests. |
SEE NOTES TO FINANCIAL STATEMENTS.
C6
Financial Highlights
| | | | | | | | | | | | | | | | | | | | |
| | | SP PIMCO Total Return Portfolio
| |
| | | Year Ended December 31,
| |
| | | 2007
| | | 2006
| | | 2005
| | | 2004
| | | 2003
| |
Per Share Operating Performance: | | | | | | | | | | | | | | | | | | | | |
Net Asset Value, beginning of year | | $ | 11.14 | | | $ | 11.21 | | | $ | 11.68 | | | $ | 11.54 | | | $ | 11.41 | |
| | |
|
|
| |
|
|
| |
|
|
| |
|
|
| |
|
|
|
Income From Investment Operations: | | | | | | | | | | | | | | | | | | | | |
Net investment income | | | .55 | | | | .45 | | | | .37 | | | | .22 | | | | .23 | |
Net realized and unrealized gain (loss) on investments | | | .48 | | | | (.05 | ) | | | (.10 | ) | | | .36 | | | | .43 | |
| | |
|
|
| |
|
|
| |
|
|
| |
|
|
| |
|
|
|
Total from investment operations | | | 1.03 | | | | .40 | | | | .27 | | | | .58 | | | | .66 | |
| | |
|
|
| |
|
|
| |
|
|
| |
|
|
| |
|
|
|
Less Dividends and Distributions: | | | | | | | | | | | | | | | | | | | | |
Dividends from net investment income | | | — | | | | — | | | | (.54 | ) | | | (.23 | ) | | | (.28 | ) |
Distributions from net realized gains | | | — | | | | — | | | | (.20 | ) | | | (.21 | ) | | | (.25 | ) |
Distributions | | | (.50 | ) | | | (.47 | ) | | | — | | | | — | | | | — | |
| | |
|
|
| |
|
|
| |
|
|
| |
|
|
| |
|
|
|
Total dividends and distributions | | | (.50 | ) | | | (.47 | ) | | | (.74 | ) | | | (.44 | ) | | | (.53 | ) |
| | |
|
|
| |
|
|
| |
|
|
| |
|
|
| |
|
|
|
Net Asset Value, end of year | | $ | 11.67 | | | $ | 11.14 | | | $ | 11.21 | | | $ | 11.68 | | | $ | 11.54 | |
| | |
|
|
| |
|
|
| |
|
|
| |
|
|
| |
|
|
|
Total Return(a) | | | 9.44 | % | | | 3.68 | % | | | 2.39 | % | | | 5.28 | % | | | 5.85 | % |
Ratios/Supplemental Data: | | | | | | | | | | | | | | | | | | | | |
Net assets, end of year (in millions) | | $ | 1,424.8 | | | $ | 1,590.3 | | | $ | 1,538.2 | | | $ | 1,099.0 | | | $ | 839.1 | |
Ratios to average net assets(c): | | | | | | | | | | | | | | | | | | | | |
Expenses | | | .67 | %(b) | | | .66 | %(b) | | | .62 | % | | | .65 | % | | | .65 | % |
Net investment income | | | 4.65 | % | | | 4.16 | % | | | 3.62 | % | | | 2.01 | % | | | 2.19 | % |
Portfolio turnover rate | | | 656 | % | | | 539 | % | | | 590 | % | | | 590 | % | | | 656 | % |
| (a) | Total return is calculated assuming a purchase of a share on the first day and a sale on the last day of each year reported and includes reinvestment of dividends and distributions. Total return does not reflect expenses associated with the separate account such as administrative fees, account charges and surrender charges which, if reflected, would reduce the total returns for all periods shown. Past performance is no guarantee of future results. Total returns may reflect adjustments to conform to generally accepted accounting principles. |
| (b) | The expense ratio reflects the interest and fee expenses related to the liability for the floating rate notes issued in conjunction with the inverse floater securities and short sales. The total expense ratio excluding interest and fees is .64% and .64% for the years ended December 31, 2007 and 2006, respectively. |
| (c) | Does not include expenses of the underlying portfolio in which the Portfolio invests. |
| | | | | | | | | | | | | | | | | | | | |
| | | SP Prudential U.S. Emerging Growth Portfolio | |
| | | Class I
| |
| | | Year Ended December 31,
| |
| | | 2007
| | | 2006
| | | 2005
| | | 2004
| | | 2003
| |
Per Share Operating Performance: | | | | | | | | | | | | | | | | | | | | |
Net Asset Value, beginning of year | | $ | 7.99 | | | $ | 7.87 | | | $ | 8.07 | | | $ | 6.65 | | | $ | 4.68 | |
| | |
|
|
| |
|
|
| |
|
|
| |
|
|
| |
|
|
|
Income From Investment Operations: | | | | | | | | | | | | | | | | | | | | |
Net investment income (loss) | | | .02 | | | | .03 | | | | (.02 | ) | | | (.05 | ) | | | (.02 | ) |
Net realized and unrealized gain on investments | | | 1.31 | | | | .71 | | | | 1.16 | | | | 1.47 | | | | 1.99 | |
| | |
|
|
| |
|
|
| |
|
|
| |
|
|
| |
|
|
|
Total from investment operations | | | 1.33 | | | | .74 | | | | 1.14 | | | | 1.42 | | | | 1.97 | |
| | |
|
|
| |
|
|
| |
|
|
| |
|
|
| |
|
|
|
Less Dividends and Distributions: | | | | | | | | | | | | | | | | | | | | |
Dividends from net investment income | | | — | | | | — | | | | — | (b) | | | — | | | | — | |
Distributions from net realized gains | | | — | | | | — | | | | (1.34 | ) | | | — | (b) | | | — | |
Distributions | | | (.91 | ) | | | (.62 | ) | | | — | | | | — | | | | — | |
| | |
|
|
| |
|
|
| |
|
|
| |
|
|
| |
|
|
|
Total dividends and distributions | | | (.91 | ) | | | (.62 | ) | | | (1.34 | ) | | | — | (b) | | | — | |
| | |
|
|
| |
|
|
| |
|
|
| |
|
|
| |
|
|
|
Net Asset Value, end of year | | $ | 8.41 | | | $ | 7.99 | | | $ | 7.87 | | | $ | 8.07 | | | $ | 6.65 | |
| | |
|
|
| |
|
|
| |
|
|
| |
|
|
| |
|
|
|
Total Return(a) | | | 16.82 | % | | | 9.59 | % | | | 17.77 | % | | | 21.39 | % | | | 42.09 | % |
Ratios/Supplemental Data: | | | | | | | | | | | | | | | | | | | | |
Net assets, end of year (in millions) | | $ | 205.8 | | | $ | 202.6 | | | $ | 194.8 | | | $ | 128.3 | | | $ | 170.0 | |
Ratios to average net assets(c): | | | | | | | | | | | | | | | | | | | | |
Expenses | | | .65 | % | | | .67 | % | | | .80 | % | | | .78 | % | | | .80 | % |
Net investment income (loss) | | | .24 | % | | | .32 | % | | | (.28 | )% | | | (.53 | )% | | | (.56 | )% |
Portfolio turnover rate | | | 54 | % | | | 70 | % | | | 142 | % | | | 212 | % | | | 213 | % |
| (a) | Total return is calculated assuming a purchase of a share on the first day and a sale on the last day of each year reported and includes reinvestment of dividends and distributions. Total return does not reflect expenses associated with the separate account such as administrative fees, account charges and surrender charges which, if reflected, would reduce the total returns for all periods shown. Performance figures may reflect voluntary fee waivers and/or expense reimbursements. In the absence of voluntary fee waivers and/or expense reimbursements, the total return would be lower. Past performance is no guarantee of future results. Total returns may reflect adjustments to conform to generally accepted accounting principles. |
| (b) | Less than $.005 per share. |
| (c) | Does not include expenses of the underlying portfolio in which the Portfolio invests. |
SEE NOTES TO FINANCIAL STATEMENTS.
C7
Financial Highlights
| | | | | | | | | | | | | | | | | | | | |
| | | SP Prudential U.S. Emerging Growth Portfolio | |
| | | Class II
| |
| | | Year Ended December 31,
| |
| | | 2007
| | | 2006
| | | 2005
| | | 2004
| | | 2003
| |
Per Share Operating Performance: | | | | | | | | | | | | | | | | | | | | |
Net Asset Value, beginning of year | | $ | 7.79 | | | $ | 7.72 | | | $ | 7.96 | | | $ | 6.58 | | | $ | 4.65 | |
| | |
|
|
| |
|
|
| |
|
|
| |
|
|
| |
|
|
|
Income From Investment Operations: | | | | | | | | | | | | | | | | | | | | |
Net investment loss | | | (.01 | ) | | | (.01 | ) | | | (.05 | ) | | | (.07 | ) | | | (.05 | ) |
Net realized and unrealized gain on investments | | | 1.27 | | | | .70 | | | | 1.15 | | | | 1.45 | | | | 1.98 | |
| | |
|
|
| |
|
|
| |
|
|
| |
|
|
| |
|
|
|
Total from investment operations | | | 1.26 | | | | .69 | | | | 1.10 | | | | 1.38 | | | | 1.93 | |
| | |
|
|
| |
|
|
| |
|
|
| |
|
|
| |
|
|
|
Less Dividends and Distributions: | | | | | | | | | | | | | | | | | | | | |
Distributions from net realized gains | | | — | | | | — | | | | (1.34 | ) | | | — | (b) | | | — | |
Distributions | | | (.88 | ) | | | (.62 | ) | | | — | | | | — | | | | — | |
| | |
|
|
| |
|
|
| |
|
|
| |
|
|
| |
|
|
|
Total dividends and distributions | | | (.88 | ) | | | (.62 | ) | | | (1.34 | ) | | | — | (b) | | | — | |
| | |
|
|
| |
|
|
| |
|
|
| |
|
|
| |
|
|
|
Net Asset Value, end of year | | $ | 8.17 | | | $ | 7.79 | | | $ | 7.72 | | | $ | 7.96 | | | $ | 6.58 | |
| | |
|
|
| |
|
|
| |
|
|
| |
|
|
| |
|
|
|
Total Return(a) | | | 16.34 | % | | | 9.10 | % | | | 17.47 | % | | | 21.01 | % | | | 41.51 | % |
Ratios/Supplemental Data: | | | | | | | | | | | | | | | | | | | | |
Net assets, end of year (in millions) | | $ | 0.4 | | | $ | 0.3 | | | $ | 0.3 | | | $ | 0.4 | | | $ | 0.3 | |
Ratios to average net assets(c): | | | | | | | | | | | | | | | | | | | | |
Expenses | | | 1.05 | % | | | 1.07 | % | | | 1.20 | % | | | 1.18 | % | | | 1.20 | % |
Net investment loss | | | (.16 | )% | | | (.04 | )% | | | (.70 | )% | | | (.94 | )% | | | (.97 | )% |
Portfolio turnover rate | | | 54 | % | | | 70 | % | | | 142 | % | | | 212 | % | | | 213 | % |
| (a) | Total return is calculated assuming a purchase of a share on the first day and a sale on the last day of each year reported and includes reinvestment of dividends and distributions. Total return does not reflect expenses associated with the separate account such as administrative fees, account charges and surrender charges which, if reflected, would reduce the total returns for all periods shown. Performance figures may reflect voluntary fee waivers and/or expense reimbursements. In the absence of voluntary fee waivers and/or expense reimbursements, the total return would be lower. Past performance is no guarantee of future results. Total returns may reflect adjustments to conform to generally accepted accounting principles. |
| (b) | Less than $.005 per share. |
| (c) | Does not include expenses of the underlying portfolio in which the Portfolio invests. |
| | | | | | | | | | | | | | | | | | | | |
| | | SP Small Cap Growth Portfolio
| |
| | | Year Ended December 31,
| |
| | | 2007
| | | 2006
| | | 2005
| | | 2004
| | | 2003
| |
Per Share Operating Performance: | | | | | | | | | | | | | | | | | | | | |
Net Asset Value, beginning of year | | $ | 7.44 | | | $ | 6.62 | | | $ | 6.46 | | | $ | 6.52 | | | $ | 4.84 | |
| | |
|
|
| |
|
|
| |
|
|
| |
|
|
| |
|
|
|
Income (Loss) From Investment Operations: | | | | | | | | | | | | | | | | | | | | |
Net investment loss | | | (.02 | ) | | | (.04 | ) | | | (.04 | ) | | | (.03 | ) | | | (.03 | ) |
Net realized and unrealized gain (loss) on investments | | | .49 | | | | .86 | | | | .20 | | | | (.03 | ) | | | 1.71 | |
| | |
|
|
| |
|
|
| |
|
|
| |
|
|
| |
|
|
|
Total from investment operations | | | .47 | | | | .82 | | | | .16 | | | | (.06 | ) | | | 1.68 | |
| | |
|
|
| |
|
|
| |
|
|
| |
|
|
| |
|
|
|
Less Distributions: | | | | | | | | | | | | | | | | | | | | |
Distributions | | | (.30 | ) | | | — | | | | — | | | | — | | | | — | |
| | |
|
|
| |
|
|
| |
|
|
| |
|
|
| |
|
|
|
Net Asset Value, end of year | | $ | 7.61 | | | $ | 7.44 | | | $ | 6.62 | | | $ | 6.46 | | | $ | 6.52 | |
| | |
|
|
| |
|
|
| |
|
|
| |
|
|
| |
|
|
|
Total Return(a) | | | 6.37 | % | | | 12.39 | % | | | 2.48 | % | | | (.92 | )% | | | 34.71 | % |
Ratios/Supplemental Data: | | | | | | | | | | | | | | | | | | | | |
Net assets, end of year (in millions) | | $ | 127.0 | | | $ | 123.0 | | | $ | 135.7 | | | $ | 184.1 | | | $ | 35.0 | |
Ratios to average net assets(c): | | | | | | | | | | | | | | | | | | | | |
Expenses | | | 1.07 | % | | | 1.14 | % | | | 1.05 | % | | | 1.09 | % | | | 1.15 | %(b) |
Net investment loss | | | (.24 | )% | | | (.47 | )% | | | (.44 | )% | | | (.82 | )% | | | (.72 | )%(b) |
Portfolio turnover rate | | | 53 | % | | | 53 | % | | | 192 | % | | | 240 | % | | | 122 | % |
| (a) | Total return is calculated assuming a purchase of a share on the first day and a sale on the last day of each year reported and includes reinvestment of distributions. Total return does not reflect expenses associated with the separate account such as administrative fees, account charges and surrender charges which, if reflected, would reduce the total returns for all periods shown. Performance figures may reflect voluntary fee waivers and/or expense reimbursements. In the absence of voluntary fee waivers and/or expense reimbursements, the total return would be lower. Past performance is no guarantee of future results. Total returns may reflect adjustments to conform to generally accepted accounting principles. |
| (b) | Net of expense reimbursement. If the investment advisor had not reimbursed expenses, the annual expense and net investment loss ratios would have been 1.78% and (1.35)%, respectively, for the year ended December 31, 2003. |
| (c) | Does not include expenses of the underlying portfolio in which the Portfolio invests. |
SEE NOTES TO FINANCIAL STATEMENTS.
C8
Financial Highlights
| | | | | | | | | | | | | | | | | | | | |
| | | SP Small Cap Value Portfolio
| |
| | | Year Ended December 31,
| |
| | | 2007
| | | 2006
| | | 2005
| | | 2004
| | | 2003
| |
Per Share Operating Performance: | | | | | | | | | | | | | | | | | | | | |
Net Asset Value, beginning of year | | $ | 13.68 | | | $ | 14.27 | | | $ | 15.51 | | | $ | 12.88 | | | $ | 9.68 | |
| | |
|
|
| |
|
|
| |
|
|
| |
|
|
| |
|
|
|
Income (Loss) From Investment Operations: | | | | | | | | | | | | | | | | | | | | |
Net investment income | | | .13 | | | | .10 | | | | .07 | | | | .08 | | | | .02 | |
Net realized and unrealized gain (loss) on investments | | | (.64 | ) | | | 1.78 | | | | .52 | | | | 2.57 | | | | 3.18 | |
| | |
|
|
| |
|
|
| |
|
|
| |
|
|
| |
|
|
|
Total from investment operations | | | (.51 | ) | | | 1.88 | | | | .59 | | | | 2.65 | | | | 3.20 | |
| | |
|
|
| |
|
|
| |
|
|
| |
|
|
| |
|
|
|
Less Dividends and Distributions: | | | | | | | | | | | | | | | | | | | | |
Dividends from net investment income | | | — | | | | — | | | | (.08 | ) | | | (.02 | ) | | | — | (b) |
Distributions from net realized gains | | | — | | | | — | | | | (1.75 | ) | | | — | (b) | | | — | |
Distributions | | | (.95 | ) | | | (2.47 | ) | | | — | | | | — | | | | — | |
| | |
|
|
| |
|
|
| |
|
|
| |
|
|
| |
|
|
|
Total dividends and distributions | | | (.95 | ) | | | (2.47 | ) | | | (1.83 | ) | | | (.02 | ) | | | — | (b) |
| | |
|
|
| |
|
|
| |
|
|
| |
|
|
| |
|
|
|
Net Asset Value, end of year | | $ | 12.22 | | | $ | 13.68 | | | $ | 14.27 | | | $ | 15.51 | | | $ | 12.88 | |
| | |
|
|
| |
|
|
| |
|
|
| |
|
|
| |
|
|
|
Total Return(a) | | | (3.63 | )% | | | 14.60 | % | | | 4.61 | % | | | 20.69 | % | | | 33.11 | % |
Ratios/Supplemental Data: | | | | | | | | | | | | | | | | | | | | |
Net assets, end of year (in millions) | | $ | 309.4 | | | $ | 369.0 | | | $ | 350.7 | | | $ | 393.3 | | | $ | 250.6 | |
Ratios to average net assets(c): | | | | | | | | | | | | | | | | | | | | |
Expenses | | | .96 | % | | | .96 | % | | | .97 | % | | | .96 | % | | | 1.04 | % |
Net investment income | | | .81 | % | | | .71 | % | | | .49 | % | | | .69 | % | | | .37 | % |
Portfolio turnover rate | | | 45 | % | | | 55 | % | | | 119 | % | | | 127 | % | | | 90 | % |
| (a) | Total return is calculated assuming a purchase of a share on the first day and a sale on the last day of each year reported and includes reinvestment of dividends and distributions. Total return does not reflect expenses associated with the separate account such as administrative fees, account charges and surrender charges which, if reflected, would reduce the total returns for all periods shown. Performance figures may reflect voluntary fee waivers and/or expense reimbursements. In the absence of voluntary fee waivers and/or expense reimbursements, the total return would be lower. Past performance is no guarantee of future results. Total returns may reflect adjustments to conform to generally accepted accounting principles. |
| (b) | Less than $.005 per share. |
| (c) | Does not include expenses of the underlying portfolio in which the Portfolio invests. |
| | | | | | | | | | | | | | | | | | | | |
| | | SP Strategic Partners Focused Growth Portfolio | |
| | | Class I
| |
| | | Year Ended December 31,
| |
| | | 2007
| | | 2006
| | | 2005
| | | 2004
| | | 2003
| |
Per Share Operating Performance: | | | | | | | | | | | | | | | | | | | | |
Net Asset Value, beginning of year | | $ | 7.49 | | | $ | 8.07 | | | $ | 7.00 | | | $ | 6.33 | | | $ | 5.03 | |
| | |
|
|
| |
|
|
| |
|
|
| |
|
|
| |
|
|
|
Income (Loss) From Investment Operations: | | | | | | | | | | | | | | | | | | | | |
Net investment loss | | | (.04 | ) | | | (.04 | ) | | | (.03 | ) | | | — | (b) | | | (.01 | ) |
Net realized and unrealized gain (loss) on investments | | | 1.18 | | | | (.02 | ) | | | 1.10 | | | | .67 | | | | 1.31 | |
| | |
|
|
| |
|
|
| |
|
|
| |
|
|
| |
|
|
|
Total from investment operations | | | 1.14 | | | | (.06 | ) | | | 1.07 | | | | .67 | | | | 1.30 | |
| | |
|
|
| |
|
|
| |
|
|
| |
|
|
| |
|
|
|
Less Distributions: | | | | | | | | | | | | | | | | | | | | |
Distributions | | | (.33 | ) | | | (.52 | ) | | | — | | | | — | | | | — | |
| | |
|
|
| |
|
|
| |
|
|
| |
|
|
| |
|
|
|
Net Asset Value, end of year | | $ | 8.30 | | | $ | 7.49 | | | $ | 8.07 | | | $ | 7.00 | | | $ | 6.33 | |
| | |
|
|
| |
|
|
| |
|
|
| |
|
|
| |
|
|
|
Total Return(a) | | | 15.24 | % | | | (.66 | )% | | | 15.29 | % | | | 10.58 | % | | | 25.84 | % |
Ratios/Supplemental Data: | | | | | | | | | | | | | | | | | | | | |
Net assets, end of year (in millions) | | $ | 38.4 | | | $ | 38.7 | | | $ | 38.3 | | | $ | 30.1 | | | $ | 21.6 | |
Ratios to average net assets(d): | | | | | | | | | | | | | | | | | | | | |
Expenses | | | 1.15 | % | | | 1.15 | % | | | 1.07 | %(c) | | | 1.01 | %(c) | | | 1.01 | %(c) |
Net investment loss | | | (.43 | )% | | | (.47 | )% | | | (.44 | )%(c) | | | (.01 | )%(c) | | | (.28 | )%(c) |
Portfolio turnover rate | | | 120 | % | | | 142 | % | | | 110 | % | | | 84 | % | | | 93 | % |
| (a) | Total return is calculated assuming a purchase of a share on the first day and a sale on the last day of each year reported and includes reinvestment of distributions. Total return does not reflect expenses associated with the separate account such as administrative fees, account charges and surrender charges which, if reflected, would reduce the total returns for all periods shown. Performance figures may reflect voluntary fee waivers and/or expense reimbursements. In the absence of voluntary fee waivers and/or expense reimbursements, the total return would be lower. Past performance is no guarantee of future results. Total returns may reflect adjustments to conform to generally accepted accounting principles. |
| (b) | Less than $.005 per share. |
| (c) | Net of expense reimbursement. If the investment advisor had not reimbursed expenses, the annual expense and net investment loss ratios would have been 1.14% and (.51)%, respectively, for the year ended December 31, 2005, 1.28% and (.28)%, respectively, for the year ended December 31, 2004, and 1.65% and (.92)%, respectively, for the year ended December 31, 2003. |
| (d) | Does not include expenses of the underlying portfolio in which the Portfolio invests. |
SEE NOTES TO FINANCIAL STATEMENTS.
C9
Financial Highlights
| | | | | | | | | | | | | | | | | | | | |
| | | SP Strategic Partners Focused Growth Portfolio | |
| | | Class II
| |
| | | Year Ended December 31,
| |
| | | 2007
| | | 2006
| | | 2005
| | | 2004
| | | 2003
| |
Per Share Operating Performance: | | | | | | | | | | | | | | | | | | | | |
Net Asset Value, beginning of year | | $ | 7.30 | | | $ | 7.91 | | | $ | 6.88 | | | $ | 6.26 | | | $ | 4.99 | |
| | |
|
|
| |
|
|
| |
|
|
| |
|
|
| |
|
|
|
Income (Loss) From Investment Operations: | | | | | | | | | | | | | | | | | | | | |
Net investment loss | | | (.10 | ) | | | (.08 | ) | | | (.06 | ) | | | (.01 | ) | | | (.03 | ) |
Net realized and unrealized gain (loss) on investments | | | 1.17 | | | | (.01 | ) | | | 1.09 | | | | .63 | | | | 1.30 | |
| | |
|
|
| |
|
|
| |
|
|
| |
|
|
| |
|
|
|
Total from investment operations | | | 1.07 | | | | (.09 | ) | | | 1.03 | | | | .62 | | | | 1.27 | |
| | |
|
|
| |
|
|
| |
|
|
| |
|
|
| |
|
|
|
Less Distributions: | | | | | | | | | | | | | | | | | | | | |
Distributions | | | (.33 | ) | | | (.52 | ) | | | — | | | | — | | | | — | |
| | |
|
|
| |
|
|
| |
|
|
| |
|
|
| |
|
|
|
Net Asset Value, end of year | | $ | 8.04 | | | $ | 7.30 | | | $ | 7.91 | | | $ | 6.88 | | | $ | 6.26 | |
| | |
|
|
| |
|
|
| |
|
|
| |
|
|
| |
|
|
|
Total Return(a) | | | 14.68 | % | | | (1.07 | )% | | | 14.97 | % | | | 9.90 | % | | | 25.45 | % |
Ratios/Supplemental Data: | | | | | | | | | | | | | | | | | | | | |
Net assets, end of year (in millions) | | $ | 27.3 | | | $ | 31.3 | | | $ | 42.8 | | | $ | 32.1 | | | $ | 14.3 | |
Ratios to average net assets(c): | | | | | | | | | | | | | | | | | | | | |
Expenses | | | 1.55 | % | | | 1.55 | % | | | 1.47 | %(b) | | | 1.41 | %(b) | | | 1.41 | %(b) |
Net investment loss | | | (.83 | )% | | | (.88 | )% | | | (.84 | )%(b) | | | (.34 | )%(b) | | | (.68 | )%(b) |
Portfolio turnover rate | | | 120 | % | | | 142 | % | | | 110 | % | | | 84 | % | | | 93 | % |
| (a) | Total return is calculated assuming a purchase of a share on the first day and a sale on the last day of each year reported and includes reinvestment of distributions. Total return does not reflect expenses associated with the separate account such as administrative fees, account charges and surrender charges which, if reflected, would reduce the total returns for all periods shown. Performance figures may reflect voluntary fee waivers and/or expense reimbursements. In the absence of voluntary fee waivers and/or expense reimbursements, the total return would be lower. Past performance is no guarantee of future results. Total returns may reflect adjustments to conform to generally accepted accounting principles. |
| (b) | Net of expense reimbursement. If the investment advisor had not reimbursed expenses, the annual expense and net investment loss ratios would have been 1.54% and (.91)%, respectively, for the year ended December 31, 2005, 1.68% and (.61)%, respectively, for the year ended December 31, 2004, and 2.05% and (1.32)%, respectively, for the year ended December 31, 2003. |
| (c) | Does not include expenses of the underlying portfolio in which the Portfolio invests. |
| | | | | | | | | | | | | | | | | | | | |
| | | SP T. Rowe Price Large Cap Growth Portfolio
| |
| | | Year Ended December 31,
| |
| | | 2007
| | | 2006
| | | 2005
| | | 2004
| | | 2003
| |
Per Share Operating Performance: | | | | | | | | | | | | | | | | | | | | |
Net Asset Value, beginning of year | | $ | 7.17 | | | $ | 7.71 | | | $ | 6.61 | | | $ | 6.23 | | | $ | 5.03 | |
| | |
|
|
| |
|
|
| |
|
|
| |
|
|
| |
|
|
|
Income From Investment Operations: | | | | | | | | | | | | | | | | | | | | |
Net investment income (loss) | | | (.01 | ) | | | .02 | | | | (.03 | ) | | | (.01 | ) | | | — | (c) |
Net realized and unrealized gain on investments | | | .60 | | | | .39 | | | | 1.13 | | | | .39 | | | | 1.20 | |
| | |
|
|
| |
|
|
| |
|
|
| |
|
|
| |
|
|
|
Total from investment operations | | | .59 | | | | .41 | | | | 1.10 | | | | .38 | | | | 1.20 | |
| | |
|
|
| |
|
|
| |
|
|
| |
|
|
| |
|
|
|
Less Distributions: | | | | | | | | | | | | | | | | | | | | |
Distributions | | | (.02 | ) | | | (.95 | ) | | | — | | | | — | | | | — | |
| | |
|
|
| |
|
|
| |
|
|
| |
|
|
| |
|
|
|
Net Asset Value, end of year | | $ | 7.74 | | | $ | 7.17 | | | $ | 7.71 | | | $ | 6.61 | | | $ | 6.23 | |
| | |
|
|
| |
|
|
| |
|
|
| |
|
|
| |
|
|
|
Total Return(a) | | | 8.21 | % | | | 5.91 | % | | | 16.64 | % | | | 6.10 | % | | | 23.86 | % |
Ratios/Supplemental Data: | | | | | | | | | | | | | | | | | | | | |
Net assets, end of year (in millions) | | $ | 76.9 | | | $ | 77.7 | | | $ | 73.8 | | | $ | 65.7 | | | $ | 146.5 | |
Ratios to average net assets(d): | | | | | | | | | | | | | | | | | | | | |
Expenses | | | 1.04 | % | | | 1.06 | %(b) | | | 1.06 | %(b) | | | 1.08 | % | | | 1.06 | % |
Net investment income (loss) | | | (.10 | )% | | | .25 | %(b) | | | (.38 | )%(b) | | | (.14 | )% | | | (.11 | )% |
Portfolio turnover rate | | | 57 | % | | | 58 | % | | | 144 | % | | | 122 | % | | | 38 | % |
| (a) | Total return is calculated assuming a purchase of a share on the first day and a sale on the last day of each year reported and includes reinvestment of distributions. Total return does not reflect expenses associated with the separate account such as administrative fees, account charges and surrender charges which, if reflected, would reduce the total returns for all periods shown. Performance figures may reflect voluntary fee waivers and/or expense reimbursements. In the absence of voluntary fee waivers and/or expense reimbursements, the total return would be lower. Past performance is no guarantee of future results. Total returns may reflect adjustments to conform to generally accepted accounting principles. |
| (b) | Net of expense reimbursement. If the investment advisor had not reimbursed expenses, the annual expense and net investment income (loss) ratios would have been 1.19% and .13%, respectively, for the year ended December 31, 2006, and 1.16% and (.48)%, respectively, for the year ended December 31, 2005. |
| (c) | Less than $.005 per share. |
| (d) | Does not include expenses of the underlying portfolio in which the Portfolio invests. |
SEE NOTES TO FINANCIAL STATEMENTS.
C10
REPORT OF INDEPENDENT REGISTERED PUBLIC ACCOUNTING FIRM
THE BOARD OF TRUSTEES AND SHAREHOLDERS OF THE PRUDENTIAL SERIES FUND:
We have audited the accompanying statements of assets and liabilities of The Prudential Series Fund (comprised of SP Aggressive Growth Asset Allocation Portfolio, SP AIM Core Equity Portfolio, SP Balanced Asset Allocation Portfolio, SP Conservative Asset Allocation Portfolio, SP Davis Value Portfolio, SP Growth Asset Allocation Portfolio, SP International Growth Portfolio, SP International Value Portfolio, SP Large Cap Value Portfolio, SP Mid-Cap Growth Portfolio, SP PIMCO High Yield Portfolio, SP PIMCO Total Return Portfolio, SP Prudential U.S. Emerging Growth Portfolio, SP Small Cap Growth Portfolio, SP Small Cap Value Portfolio, SP Strategic Partners Focused Growth Portfolio, SP T. Rowe Price Large Cap Growth Portfolio, hereafter referred to as the “Funds”), including the portfolios of investments, as of December 31, 2007, and the related statements of operations for the year then ended, the statements of changes in net assets for each of the years in the two-year period then ended and the financial highlights for each of the years in the four-year period then ended. These financial statements and financial highlights are the responsibility of the Funds’ management. Our responsibility is to express an opinion on these financial statements and financial highlights based on our audits. The financial highlights for the year ended December 31, 2003 were audited by another independent registered public accounting firm, whose report dated February 20, 2004, expressed an unqualified opinion thereon.
We conducted our audits in accordance with the standards of the Public Company Accounting Oversight Board (United States). Those standards require that we plan and perform the audit to obtain reasonable assurance about whether the financial statements and financial highlights are free of material misstatement. An audit includes examining, on a test basis, evidence supporting the amounts and disclosures in the financial statements. Our procedures included confirmation of securities owned as of December 31, 2007, by correspondence with the custodian and brokers or by other appropriate auditing procedures where replies from brokers were not received. An audit also includes assessing the accounting principles used and significant estimates made by management, as well as evaluating the overall financial statement presentation. We believe that our audits provide a reasonable basis for our opinion.
In our opinion, the financial statements and financial highlights referred to above present fairly, in all material respects, the financial position of The Funds as of December 31, 2007, and the results of their operations for the year then ended, the changes in their net assets for each of the years in the two-year period then ended and the financial highlights for each of the years in the four-year period then ended, in conformity with U.S. generally accepted accounting principles.

New York, New York
February 25, 2008
D1
MANAGEMENT OF THE FUND
(Unaudited)
Information pertaining to the Trustees of the Fund is set forth below. Trustees who are not deemed to be “interested persons” of the Fund as defined in the Investment Company Act are referred to as “Independent Trustees.” Trustees who are deemed to be “interested persons” of the Fund are referred to as “Interested Trustees.” “Fund Complex” consists of the Fund and any other investment companies managed by PI.
| | | | | | |
Name, Address**,
and Age | | Position with Fund*
Term of Office***
Length of Time Served | | Number of Portfolios
In Fund Complex
Overseen by Trustee | | Other Directorships
Held by the Trustee**** |
| | | |
| Saul K. Fenster, Ph.D. (74) | | Trustee, Since 1983 | | 87 | | Member (since 2006), Board of The Ridgefield Foundation and The Leir Foundation; Board of Directors of IDT Corporation (2000-2006) |
|
| Principal Occupations During Past 5 Years – Currently President Emeritus of New Jersey Institute of Technology (since 2002); formerly President (1978-2002) of New Jersey Institute of Technology; Commissioner (1998-2002) of the Middle States Association Commission on Higher Education; Commissioner (1985-2002) of the New Jersey Commission on Science and Technology; formerly Director (1998-2005) of Society of Manufacturing Engineering Education Foundation; formerly Director of Prosperity New Jersey; formerly a director or trustee of Liberty Science Center, Research and Development Council of New Jersey, New Jersey State Chamber of Commerce, and National Action Council for Minorities in Engineering. |
| | | |
| Delayne Dedrick Gold (69) | | Trustee, Since 2001 | | 86 | | — |
|
| Principal Occupations During Past 5 Years – Marketing Consultant (1982-present); formerly Senior Vice President and Member of the Board of Directors, Prudential Bache Securities, Inc. |
| | | |
| W. Scott McDonald, Jr. (70) | | Independent Vice Chair since 2004 and Trustee, Since 1983 | | 87 | | — |
|
| Principal Occupations During Past 5 Years – Formerly Management Consultant (1997-2004) and of Counsel (2004-2005) at Kaludis Consulting Group, Inc. (company serving higher education); Formerly principal (1995-1997), Scott McDonald & Associates; Chief Operating Officer (1991-1995), Fairleigh Dickinson University; Executive Vice President and Chief Operating Officer (1975-1991), Drew University; interim President (1988-1990), Drew University; formerly Director of School, College and University Underwriters Ltd. |
| | | |
| Thomas T. Mooney (66) | | Independent Chair and Trustee, Since 2001 | | 86 | | — |
|
| Principal Occupations During Past 5 Years – Formerly Chief Executive Officer, Excell Partners, Inc.; formerly President of the Greater Rochester Metro Chamber of Commerce, Rochester City Manager; formerly Deputy Monroe County Executive. |
| | | |
| Thomas M. O’Brien (57) | | Trustee, Since 2003 | | 86 | | Formerly Director (December 1996-May 2000) of North Fork Bancorporation, Inc.; Formerly Director (May 2000-April 2006) of Atlantic Bank of New York; Director (since November 2006) of State Bancorp, Inc. (NASDAQ: STBC) and State Bank of Long Island. |
|
| Principal Occupations During Past 5 Years – President and COO (since November 2006) and CEO (since April 2007) of State Bancorp, Inc. and State Bank; Vice Chairman (January 1997-April 2000) of North Fork Bank; President and Chief Executive Officer (December 1984-December 1996) of North Side Savings Bank; formerly President and Chief Executive Officer (May 2000-June 2006) Atlantic Bank of New York. |
| | | |
| John A. Pileski (68) | | Trustee, Since 2003 | | 86 | | Director (since April 2001) of New York Bank Corp; Director (since May 1980) of Surf Club of Quogue, Inc. |
|
| Principal Occupations During Past 5 Years – Retired (June 2000) Tax Partner of KPMG, LLP. |
| | | |
| F. Don Schwartz (72) | | Trustee, Since 2003 | | 86 | | — |
|
| Principal Occupations During Past 5 Years – Management Consultant (since April 1985). |
E1
| | | | | | |
|
Interested Trustees
|
Name, Address**,
and Age | | Position with Fund*
Term of Office***
Length of Time Served | | Number of Portfolios
In Fund Complex
Overseen by Trustee | | Other Directorships
Held by the Trustee**** |
| | | |
| *David R. Odenath (50) | | President since 2002 and Trustee Since 1999 | | 86 | | — |
|
| Principal Occupations During Past 5 Years – President of Prudential Annuities (since August 2002); Senior Vice President (since June 1999) of Prudential; Director (since June 2005) and Executive Vice President (since March 2006) of AST Investment Services, Inc; formerly Executive Vice President (May 2003-November 2007) of Prudential Investment Management Services LLC; formerly President, Chief Executive Officer, Chief Operating Officer and Officer in Charge (June 2005-March 2006) of AST Investment Services, Inc. |
| | | |
| *Robert F. Gunia (61) | | Vice President and Trustee Since 2001 | | 149 | | Vice President and Director (since May 1989); Treasurer (since 1999) of The Asia Pacific Fund, Inc. and Vice President (since January 2007) of The Greater China Fund, Inc. |
|
| Principal Occupations During Past 5 Years – Chief Administrative Officer (since September 1999) and Executive Vice President (since December 1996) of Prudential Investments LLC; President (since April 1999) of Prudential Investment Management Services LLC; Executive Vice President (since March 1999) and Treasurer (since May 2000) of Prudential Mutual Fund Services LLC; Chief Administrative Officer, Executive Vice President and Director (since May 2003) of AST Investment Services, Inc. |
| | | | |
|
Officers
|
Name, Address**,
and Age | | Position with Fund*
Term of Office***
Length of Time Served | | Principal Occupations During Past 5 Years |
| | |
| Grace C. Torres (48) | | Treasurer and Principal Financial and Accounting Officer Since 1997 | | Assistant Treasurer (since March 1999) and Senior Vice President (since September 1999) of PI; Assistant Treasurer (since May 2003) and Vice President (since June 2005) of AST Investment Services, Inc.; Senior Vice President and Assistant Treasurer (since May 2003) of Prudential Annuities Advisory Services, Inc.; formerly Senior Vice President (May 2003-June 2005) of AST Investment Services, Inc. |
| | |
| Kathryn L. Quirk (55) | | Chief Legal Officer Since 2005 | | Vice President and Corporate Counsel (since September 2004) of Prudential; Executive Vice President, Chief Legal Officer and Secretary (since July 2005) of PI and Prudential Mutual Fund Services LLC; Vice President and Corporate Counsel (since June 2005) and Secretary (since February 2006) of AST Investment Services, Inc.; formerly Senior Vice President and Assistant Secretary (November 2004-August 2005) of PI; formerly Assistant Secretary (June 2005-February 2006) of AST Investment Services, Inc.; formerly Managing Director, General Counsel, Chief Compliance Officer, Chief Risk Officer and Corporate Secretary (1997-2002) of Zurich Scudder Investments, Inc. |
| | |
| Deborah A. Docs (50) | | Secretary Since 2005 | | Vice President and Corporate Counsel (since January 2001) of Prudential; Vice President (since December 1996) and Assistant Secretary (since March 1999) of PI; formerly Vice President and Assistant Secretary (May 2003-June 2005) of AST Investment Services, Inc. |
| | |
| Jonathan D. Shain (49) | | Assistant Secretary Since 2005 | | Vice President and Corporate Counsel (since August 1998) of Prudential; Vice President and Assistant Secretary (since May 2001) of PI; Vice President and Assistant Secretary (since February 2001) of PMFS; formerly Vice President and Assistant Secretary (May 2003-June 2005) of AST Investment Services, Inc. |
| | |
| Claudia DiGiacomo (33) | | Assistant Secretary Since 2005 | | Vice President and Corporate Counsel (since January 2005) of Prudential; Vice President and Assistant Secretary of PI (since December 2005); Associate at Sidley Austin Brown & Wood LLP (1999-2004). |
| | |
| John P. Schwartz (36) | | Assistant Secretary Since 2006 | | Vice President and Corporate Counsel (since April 2005) of Prudential; Vice President and Assistant Secretary of PI (since December 2005); Associate at Sidley Austin Brown & Wood LLP (1997-2005). |
| | |
| Timothy J. Knierim (49) | | Chief Compliance Officer Since 2007 | | Chief Compliance Officer of Prudential Investment Management, Inc. (since July 2007); formerly Chief Risk Officer of PIM and PI (2002-2007) and formerly Chief Ethics Officer of PIM and PI (2006-2007). |
E2
| | | | |
Name, Address**,
and Age | | Position with Fund*
Term of Office***
Length of Time Served | | Principal Occupations During Past 5 Years |
| | |
| Valerie M. Simpson (49) | | Deputy Chief Compliance Officer Since 2007 | | Chief Compliance Officer (since April 2007) of PI and AST Investment Services, Inc.; formerly Vice President-Financial Reporting (June 1999-March 2006) for Prudential Life and Annuities Finance. |
| | |
| M. Sadiq Peshimam (44) | | Assistant Treasurer Since 2006 | | Vice President (since 2005) and Director (2000-2005) within Prudential Mutual Fund Administration. |
| | |
| Peter Parrella (49) | | Assistant Treasurer Since 2007 | | Vice President (since 2007) and Director (2004-2007) within Prudential Mutual Fund Administration; formerly Tax Manager at SSB Citi Fund Management LLC (1997-2004). |
| | |
| Alan Fu (51) | | Assistant Treasurer Since 2006 | | Vice President – Tax, The Prudential Insurance Company of America (1999-October 2003); Vice President and Corporate Counsel – Tax, Prudential Financial, Inc. (since October 2003). |
| | |
| Andrew R. French (45) | | Assistant Secretary Since 2006 | | Director and Corporate Counsel (since May 2006) of Prudential; Vice President and Assistant Secretary (since January 2007) of PI; Vice President and Assistant Secretary (since January 2007) of PMFS; formerly Senior Legal Analyst of Prudential Mutual Fund Law Department (1997-2006). |
| | |
| Noreen M. Fierro (43) | | Anti-Money Laundering Compliance Officer Since 2006 | | Vice President, Corporate Compliance (since May 2006) of Prudential; formerly Corporate Vice President, Associate General Counsel (April 2002-May 2005) of UBS Financial Services, Inc., in their Money Laundering Prevention Group; Senior Manager (May 2005-May 2006) of Deloitte Financial Advisory Services, LLP, in their Forensic and Dispute Services, Anti-Money Laundering Group. |
* “Interested” Trustee, as defined in the Investment Company Act, by reason of employment with the Manager (as defined below), and/or the Distributor (as defined below).
** Unless otherwise noted, the address of the Trustees and Officers is c/o: Prudential Investments LLC, Gateway Center Three, 100 Mulberry Street, Newark, New Jersey 07102.
*** There is no set term of office for Trustees and Officers. The Independent Trustees have adopted a retirement policy, which calls for the retirement of Trustees on December 31 of the year in which they reach the age of 75. The table shows how long they have served as Trustee and/or Officer.
**** This column includes only directorships of companies required to register, or file reports with the SEC under the Securities Exchange Act of 1934 (i.e., “public companies”) or other investment companies registered under the Investment Company Act.
E3
The Prudential Series Fund
Approval of Advisory Agreements
At meetings of the Board held on September 12-13, 2007, the Trustees, including the Independent Trustees, unanimously approved the recommendations by Prudential Investments LLC (PI) to appoint Marsico Capital Management LLC (“Marsico”) as a subadviser with respect to the Global Portfolio and the SP International Growth Portfolio (each, a Portfolio, and collectively, the Portfolios) and to approve new subadvisory agreements between PI and Marsico (the “Subadvisory Agreements”).
The Board considered that, on June 14, 2007, Marsico and Bank of America Corporation (BAC) announced they had signed a definitive agreement by which Marsico would acquire ownership of the firm from BAC (the Transaction). The Transaction was completed on December 14, 2007, at which time Marsico began operating as an independent entity under the leadership of Thomas F. Marsico. The Board also considered that, although there were no changes in the Marsico portfolio management teams as a result of the Transaction, each Portfolio’s prior subadvisory agreement with Marsico would be automatically terminated as a result of a change in control.
Board Consideration of Subadvisory Agreement:
The Board of Trustees considered whether the approval of the Subadvisory Agreements with Marsico was in the best interests of each Portfolio and its shareholders. Before approving the Subadvisory Agreements, the Trustees reviewed performance, compliance and organization materials regarding Marsico and received presentations from PI. The Board also received materials relating to the Subadvisory Agreements and had the opportunity to ask questions and request further information in connection with its consideration. In making the determination to retain Marsico as a subadviser, the Trustees, including the Independent Trustees advised by independent legal counsel, considered the following information:
Nature, Quality and Extent of Services. The Board received and considered information regarding the nature and extent of services to be provided to each Portfolio by Marsico under the Subadvisory Agreements, namely, that Marsico would provide day-to-day portfolio management services and comply with all Portfolio policies and applicable rules and regulations. The Board also noted that the nature and extent of services provided to each Portfolio under the prior subadvisory agreement with Marsico were identical in all material respects to those to be provided by Marsico under the Subadvisory Agreements and generally similar to those provided by the other current subadvisers under their subadvisory agreements.
With respect to the quality of services, the Board considered, among other things, the background and experience of Marsico’s portfolio management team, which was not affected by the Transaction. In connection with the recent annual review of advisory agreements, the Board had reviewed the qualifications, backgrounds and responsibilities of the portfolio managers who are responsible for the day-to-day management of each Portfolio, and the Board was provided with information pertaining to Marsico’s organizational structure, senior management, investment operations, and other relevant information pertaining to Marsico. The Board noted that it received a favorable compliance report from the Trust’s Chief Compliance Officer (CCO) as to Marsico.
The Board concluded that it was satisfied with the nature, extent and quality of the investment subadvisory services provided to each Portfolio by Marsico under the prior subadvisory agreement and that there was a reasonable basis on which to conclude that the quality of investment subadvisory services to be provided by Marsico under the Subadvisory Agreements should equal the quality of similar services provided by Marsico under the prior subadvisory agreements.
Performance of Marsico. The Board noted that at its June 2007 meetings, it had reviewed the performance of each of the Portfolios subadvised by Marsico in connection with its annual consideration of the renewal of the Portfolios�� subadvisory agreements. As part of that review, the Board reviewed the performance record of each Portfolio, and at that time reached the following conclusions:
| | • | | With respect to the SP International Growth Portfolio, the Board noted that Marsico had assumed responsibility for a portion of the Portfolio’s assets in late 2006, and that in light of Marsico’s limited performance record, it was reasonable to approve Marsico’s subadvisory agreement. |
| | • | | With respect to the Global Portfolio, the Board noted that Marsico had assumed responsibility for a portion of the Portfolio’s assets in December 2005, and that in light of the limited performance history, it was reasonable to approve Marsico’s subadvisory agreement. |
Investment Subadvisory Fee Rate. The Board also considered, among other things, that the proposed fee rates payable under the Subadvisory Agreements are identical to the fee rates payable under the prior subadvisory agreement. The Board noted that it had recently reviewed the fee rates paid to Marsico in connection with the recent annual review of advisory agreements and determined that the fee rates were reasonable. The Board concluded that Marsico’s proposed subadvisory fee rates under the Subadvisory Agreements were reasonable.
Profitability. In connection with its recent annual review of advisory agreements, the Board considered the profitability of PI and subadvisers affiliated with PI. The Board concluded that the level of profitability of a subadviser not affiliated with PI, such as Marsico, may not be as significant as PI’s profitability given the arm’s length nature of the process by which the subadvisory fee rates were negotiated by PI and the unaffiliated subadvisers, as well as the fact that PI compensates the subadvisers out of its management fee.
Economies of Scale. In connection with its recent annual review of advisory agreements, the Board considered economies of scale. The Board noted that there was no proposed change in fee rates and breakpoints and that it would again review economies of scale at the next annual review of advisory agreements.
Other Benefits to the Subadviser or its Affiliates from Serving as Subadviser. The Board considered potential “fall-out” or ancillary benefits anticipated to be received by Marsico and its affiliates as a result of Marsico’s relationship with the Portfolios. The Board concluded that any potential benefits to be derived by Marsico included its ability to use soft dollar credits, brokerage commissions received by affiliates of Marsico, potential access to additional research resources, larger assets under management and benefits to the reputation, which were consistent with those generally derived by subadvisers to mutual funds.
Annuities are issued by Pruco Life Insurance Company, or in New York, Pruco Life Insurance Company of New Jersey, both located at 213 Washington Street, Newark, NJ 07102-2992, and Prudential Annuities Life Assurance Corporation, located at One Corporate Drive, Shelton, CT, 06484. Variable annuities are distributed by Prudential Annuities Distributors, Inc., also located in Shelton, CT. Prudential Annuities is a business unit of Prudential Financial.
Variable life insurance is issued by The Prudential Insurance Company of America, 751 Broad Street, Newark, NJ 07102-3777, Pruco Life Insurance Company, or in New York, Pruco Life Insurance Company of New Jersey, both located at 213 Washington Street, Newark, NJ 07102-2992. Pruco Life Insurance Company is not licensed to do business in New York. Variable life insurance is offered through Pruco Securities LLC, 751 Broad Street, Newark, NJ 07102-3777.
All are Prudential Financial companies and each is solely responsible for its financial condition and contractual obligations.
Life insurance and annuity contracts contain exclusions, limitations, reductions of benefits and terms for keeping them in force. Your licensed financial professional can provide you with costs and complete details. Contract guarantees are based on the claims-paying ability of the issuing company.
The 2007 Audited Financial Statements of Pruco Life Insurance Company, Pruco Life Insurance Company of New Jersey, and The Prudential Insurance Company of America will be available commencing April 30, 2008. You may call (888) 778-2888 to obtain a free copy of the audited financial statements of the insurance company that issued your contract.
To reduce costs, we now generally send only a single copy of prospectuses and shareholder reports to each household (“householding”) in lieu of sending a copy to each Contract Owner who resides in the household. You should be aware that by calling (877) 778-5008, you can revoke or “opt out” of householding at any time.
Pru, Prudential, Prudential Financial, Rock Solid, “The Rock”, the Rock Logo and the Rock Prudential Logo are registered service marks of The Prudential Insurance Company of America, Newark, NJ, and its affiliates.
The Prudential Insurance Company of America
751 Broad Street
Newark NJ 07102-3777
Presorted
Standard
U.S. Postage
PAID
Prudential
IFS-A114669 PSF-AR-B Ed. 02/2008

ANNUAL REPORT
DECEMBER 31, 2007
The Prudential Series Fund

| n | | Diversified Conservative Growth Portfolio |
| n | | Jennison 20/20 Focus Portfolio |
Please note that inside is a Prospectus Supplement dated November 27, 2007. This is separate from and not a part of the annual report.

IFS-A114743
| | This report is one of several that provide financial information about certain investment choices available on variable life insurance and variable annuity contracts. Based on the variable contract you own or the portfolios you invested in, you may receive additional reports that provide financial information on those investment choices. Please refer to your variable life insurance or variable annuity contract prospectus to determine which portfolios are available to you. |
This report must be preceded or accompanied by the current prospectuses for the Prudential Series Fund portfolios and the applicable variable life or annuity contract. The prospectuses contains information on the investment objectives, risks, and charges and expenses of the portfolios and the contract and should be read carefully.
The contract’s prospectus contains hypothetical performance illustrations that show the effect of various assumptions regarding the cost of insurance protection. You may also obtain a personalized illustration of historical performance that reflects the cost of your contract’s insurance protection.
A description of the Fund’s proxy voting policies and procedures is available, without charge, upon request. Owners of variable annuity contracts should call 888-778-2888 and owners of variable life insurance contracts should call 800-778-2255 to obtain descriptions of the Fund’s proxy voting policies and procedures. The description is also available on the website of the Securities and Exchange Commission (the “Commission”) at www.sec.gov. Information regarding how the Fund voted proxies relating to portfolio securities during the most recent 12-month period ended June 30, is available on the website of the Commission at www.sec.gov and on the Fund’s website.
The Fund files with the Commission a complete listing of portfolio holdings as of its first and third quarter-end on Form N-Q. Form N-Q is available on the Commission’s website at www.sec.gov or by visiting the Commission’s Public Reference Room. For more information on the Commission’s Public Reference Room, please visit the Commission’s website or call 800-SEC-0330. Form N-Q is also available on the Fund’s website at www.prudential.com or by calling the telephone numbers referenced above.
The Fund’s Statement of Additional Information contains additional information about the Fund’s Trustees and is available without charge upon request by calling (888) 778-2888.
This report may include financial information pertaining to certain portfolios that are not available through the variable life insurance policy or variable annuity contract that you have chosen. Please refer to your variable life insurance or variable annuity prospectus to determine which portfolios are available to you.
The Prudential Series Fund
Glossary of Benchmark Definitions
December 31, 2007
The Diversified Conservative Growth Custom Blended Index consists of the Russell 3000 Index (40%) Lehman Brothers Aggregate Bond Index (60%),
The Lipper Variable Insurance Products (VIP) Funds Averages are calculated by Lipper Analytical Services, Inc., and reflect the investment return of certain portfolios underlying variable life and annuity products. These returns are net of investment fees and fund expenses, but not product charges.
|
Mixed Asset Target Allocation Moderate Funds Average |
Large-Cap Core Funds Average |
Multi-Cap Core Funds Average |
The Russell 1000® Index is an unmanaged index that consists of the 1,000 largest securities in the Russell 3000® Index.
The Standard & Poor’s 500 Composite Stock Price Index (S&P 500 Index) is an unmanaged index of 500 stocks of large U.S. public companies. It gives a broad look at how stock prices in the United States have performed.
This page may include certain benchmarks not applicable to the portfolios available in this particular report. Investors cannot invest directly in a market index or average.
The Prudential Series Fund
Table of Contents
December 31, 2007
Letter to Contract Owners
| n | | FEES AND EXPENSES TABLE |
A1 Schedule of Investments and Financial Statements
B1 Notes to Financial Statements
C1 Financial Highlights
D1 Report of Independent Registered Accounting Firm
E1 Management of the Prudential Series Fund
This report may include financial information pertaining to certain portfolios that are not available through the variable life insurance policy or variable annuity contract that you have chosen. Please refer to your variable life insurance or variable annuity prospectus to determine which portfolios are available to you.
The Prudential Series Fund
Letter to Contract Owners
Annual Report
December 31, 2007
At Prudential, it is our goal to help our clients achieve and maintain financial success. We hope you find the Prudential Series Fund annual report both informative and useful.
We would also like to remind you about the benefits of diversifying your investment portfolio. In today’s volatile markets, diversification is key to protecting your investments. It helps position your investments when asset classes rotate in and out of favor, and is the best way to balance risk and return. In addition, diversification can help you meet your long-term investment goals although it does not assure against loss in declining markets.
Take the first step and contact your financial professional for help in creating a diversified investment portfolio. A comprehensive mix of assets that is evaluated periodically over time can help you maintain focus on your financial objectives.
Thank you for selecting our products. We value the opportunity to manage your investments as you plan for the future.
Sincerely,
David R. Odenath, Jr.
President,
The Prudential Series Fund | January 31, 2008 |
PRESIDENT
DAVID R. ODENATH, JR.
The Prudential Series Fund, Diversified Conservative Growth Portfolio
Subadvised by: EARNEST Partners, RS Investment Management Co. LLC, Jennison Associates LLC, Prudential Investment Management, Inc., Pacific Investment Management Company LLC
December 31, 2007
Investment Manager’s Report
Performance Summary - As of December 31, 2007
Average Annual Total Return Percentages
| | | | | | | | | |
| | | 1-Year | | | 5-Year | | | Since
Inception | |
Diversified Conservative Growth Portfolio | | 5.91 | % | | 10.05 | % | | 6.14 | % |
S&P 500 Index | | 5.49 | | | 12.82 | | | 2.76 | |
Diversified Conservative Growth Custom Blended Index | | 6.38 | | | 8.79 | | | 5.29 | |
Lipper VIP Mixed-Asset Target Allocation Moderate Funds Avg. | | 6.14 | | | 9.78 | | | 4.60 | |
Portfolio inception: 5/3/1999.
$10,000 INVESTED SINCE INCEPTION
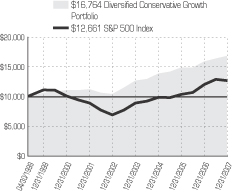
Past performance does not guarantee future returns. Portfolio performance is net of investment fees and fund expenses, but not product charges, which, if included, would significantly lower the performance quoted. The investment return and principal value of an investment will fluctuate, so that an investor’s shares, when redeemed, may be worth more or less than their original cost. Current performance may be lower or higher than the past performance data quoted.
Unless noted otherwise, Lipper Average and Index returns reflect performance beginning the closest month-end date to the Portfolio’s inception. Performance figures may reflect fee waivers and/or expense reimbursements. In the absence of such fee waivers and/or expense reimbursements, total returns would be lower.
For the year ended December 31, 2007, the Diversified Conservative Growth Portfolio had a total return that was slightly below its benchmark Custom Index and slightly below the average of its peer group.
Asset allocation differences between the Portfolio and its benchmark had a negative impact on relative performance. Specifically, overweighted allocations to high yield bonds and small cap value stocks detracted from returns, as these asset classes underperformed the aggregate Custom Index for 2007.
The Jennison managed large cap value portion was a key contributor to the Portfolio’s relative performance. Overweight positions in consumer non-cyclicals and energy, as well as a large underweight position in financials enhanced results. Underexposures to value-style holdings (stocks with lower price to price-to-book ratios (P/B) and dividend yields) benefited performance, as investors sought stocks with consistent earnings growth.
The PIMCO managed bond portion, which outperformed the LBAG, was another key contributor to the Portfolio’s relative performance. It emphasized shorter-term bonds that performed well as the slope of the yield curve—which depicts the relationship between yields on short- and long-term bonds—became steeper as the Federal Reserve cut short-term rates. The bond portion’s duration, a measure of its sensitivity to changes in interest rates, was above that of the LAG. This exposed it more fully to the impact of falling rates, which pushed bond prices higher, as bond prices move inversely to interest rates. The Portfolio benefited from a flight to quality, with a large underweight in corporate bonds proving beneficial as corporates underperformed U.S. Treasury securities. An exposure to foreign currencies, particularly those of emerging market nations, enhanced returns, as slower U.S. economic growth and lower rates weakened the U.S. dollar.
The EARNEST Partners managed small cap value portion outperformed the Russell 2000 Value Index. The manager’s style biases had a large positive impact, particularly its underexposure to value stocks, or those with lower price-to-book ratios (“P/B”), and companies with high levels of debt. A relative overexposure to stocks with price momentum added to returns. Since EARNEST’s relative value process seeks stocks with higher earnings growth and strong balance sheets, it was not surprising that this portion was exposed to these specific risk factors. An underweight position in financials and an overweight to industrials and energy further augmented returns. However, several holdings in the homebuilding industry declined again, somewhat dampening the return.
Prudential Investments LLC (PI), an indirect, wholly owned subsidiary of Prudential Financial, Inc., serves as the investment manager for the Fund.
For average and index definitions, refer to the Glossary of Benchmark Definitions page. Investors cannot invest directly in a market index or average. For a complete list of holdings, refer to the Schedule of Investments section of this report.
The Prudential Series Fund, Jennison 20/20 Focus Portfolio
Subadvised by: Jennison Associates LLC
December 31, 2007
Investment Manager’s Report
Performance Summary - As of December 31, 2007
Average Annual Total Return Percentages
| | | | | | | | | |
| | | 1-Year | | | 5-Year | | | Since
Inception | |
Jennison 20/20 Focus Portfolio: Class I | | 10.59 | % | | 18.13 | % | | 8.28 | % |
Jennison 20/20 Focus Portfolio: Class II | | 10.12 | | | 17.65 | | | 6.94 | |
S&P 500 Index | | 5.49 | | | 12.82 | | | 2.76 | |
Russell 1000® Index | | 5.77 | | | 13.43 | | | 3.29 | |
Lipper (VIP) Large Cap Core Funds Avg. | | 5.78 | | | 12.19 | | | 2.57 | |
Lipper (VIP) Multi Cap Core Funds Avg. | | 6.22 | | | 13.76 | | | 5.05 | |
Portfolio Class I inception: 5/3/1999. Portfolio Class II inception: 2/15/2000
$10,000 INVESTED SINCE INCEPTION1
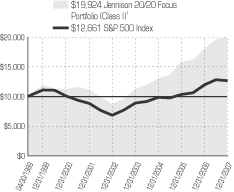
Past performance does not guarantee future returns. Portfolio performance is net of investment fees and fund expenses, but not product charges, which, if included, would significantly lower the performance quoted. The investment return and principal value of an investment will fluctuate, so that an investor’s shares, when redeemed, may be worth more or less than their original cost. Current performance may be lower or higher than the past performance data quoted.
Unless noted otherwise, Lipper Average and Index returns reflect performance beginning the closest month-end date to the Portfolio’s inception (Class I). Although Lipper classifies the Portfolio within the Multi-Cap Core Funds Average, the returns for the Large-Cap Core Funds Average are also shown, because the management of the portfolios included in the Large-Cap Core Funds Average is more consistent with the management of the Portfolio. The Russell 1000® Index is a trademark/service mark of the Frank Russell Company. Russell® is a trademark of the Frank Russell Company. Performance figures may reflect fee waivers and/or expense reimbursements. In the absence of such fee waivers and/or expense reimbursements, total returns would be lower.
For the period ended December 31, 2007, the Prudential Jennison 20/20 Focus Portfolio had a total return that was significantly above its benchmark, the Russell 1000 Index, a broad measure of large capitalization stocks.
The Portfolio is a combination of a concentrated growth sleeve and a concentrated value sleeve. Each manager holds approximately 20 stocks. The growth sleeve applies a bottom-up, stock-by-stock, selection process to identify companies with the potential for superior earnings or free cash flow growth. Valuation is also a consideration. The value sleeve uses in-depth fundamental research to identify undervalued companies with strong financials and an identifiable catalyst that can unlock the true value of the company.
In 2007, sector allocation, which is a by-product of the bottom-up stock selection process, was the primary driver of outperformance. A sizable underweight to financials and an overweight to technology enhanced performance. However the Portfolio’s overweight to consumer cyclicals was a drag on performance. The 2007 market can be broadly characterized as one where stocks associated with the crumbling housing and mortgage markets plummeted while companies with a global footprint advanced. Active managers benefited from underweights to the financial services sector and by capitalizing on broader themes that drove the market, such as the outperformance of energy and technology stocks.
From time to time certain risk characteristics of the Portfolio may benefit or detract from relative performance. These characteristics are not “drivers” of performance but are rather a by-product of the manager’s investment philosophy and process. In 2007 such exposures were generally favorable. The manager’s overexposure to stocks with share price momentum (stocks that have had a recent run-up in price) and underexposure to stocks with dividend yield contributed to outperformance. Conversely, a benchmark-neutral exposure to leverage—the debt-to-capital ratio each security has in the portfolio—and overweight in volatility, which measures the uncertainty or variability of a stock’s price, detracted from returns.
Portfolio holdings in aggregate were a negative source of relative return. Positions within the healthcare sector, particularly within the biotech and drug industries, hurt relative performance. However, stock selection within the consumer cyclical space was a bright spot for the year. Although retail sales during the holiday season generally disappointed and, overall, the consumer discretionary and services sector within the Russell 1000 Index posted a negative return for the year, there were pockets of strength in certain segments, including Internet sales and consumer electronics. One of the Portfolio’s holdings, a specialty retailer of consumer electronics that gained massive market share from rivals, benefited from increased spending this holiday season on consumer electronics.
Prudential Investments LLC (PI), an indirect, wholly owned subsidiary of Prudential Financial, Inc., serves as the investment manager for the Fund.
| 1 | The graph is based on the performance of Class I shares. Performance of Class II shares will be lower due to differences in the fee structure. Class II shares have associated 12b-1 and administrative fees at an annual rate of 0.25% and 0.15% respectively of the average daily net assets of the Class II shares. |
For average and index definitions, refer to the Glossary of Benchmark Definitions page. Investors cannot invest directly in a market index or average. For a complete list of holdings, refer to the Schedule of Investments section of this report.
The Prudential Series Fund
Presentation of Portfolio Holdings — unaudited
December 31, 2007
| | |
| Diversified Conservative Growth | | |
| Five Largest Holdings/Issues | | (% of Net Assets) |
GNMA, 5.5%, 01/22/38 | | 7.1% |
U.S. Treasury Bonds, 5.0%, 05/15/37 | | 3.0% |
GNMA, 6.5%, 01/22/38 | | 2.4% |
U.S. Treasury Notes, 4.25%, 11/15/17 | | 2.4% |
FNMA, 6.0%, 01/01/37 | | 2.4% |
| | |
| Jennison 20/20 | | |
| Five Largest Holdings | | (% of Net Assets) |
| Monsanto Co. | | 3.2% |
| Suncor Energy, Inc. | | 3.2% |
| Southwestern Energy Co. | | 3.2% |
| Apple, Inc. | | 3.2% |
| Google, Inc. (Class A Stock) | | 3.0% |
For average and index definitions, refer to the Glossary of Benchmark Definitions page. Investors cannot invest directly in an index. For a complete list of holdings, please refer to the Schedule of Investments section of this report. Holdings/Issues/Sectors/Industries are subject to change.
As a contract owner investing in Portfolios of the Fund through a variable annuity or variable life contract, you incur ongoing costs, including management fees, and other Portfolio expenses. This example is intended to help you understand your ongoing costs (in dollars) of investing in the Fund and to compare these costs with the ongoing costs of investing in other investment options. This example does not reflect fees and charges under your variable annuity or variable life contract. If contract charges were included, the costs shown below would be higher. Please consult the prospectus for your contract for more information about contract fees and charges.
The example is based on an investment of $1,000 invested at the beginning of the period and held for the entire period July 1, 2007 through December 31, 2007.
Actual Expenses
The first line of the table below provides information about actual account values and actual expenses. You may use this information, together with the amount you invested, to estimate the Portfolio expenses that you paid over the period. Simply divide your account value by $1,000 (for example, an $8,600 account value divided by $1,000 = 8.6), then multiply the result by the number in the first line under the heading entitled “Expenses Paid During Period” to estimate the Portfolio expenses you paid on your account during this period. As noted above, the table does not reflect variable contract fees and charges.
Hypothetical Example for Comparison Purposes
The second line of the table below provides information about hypothetical account values and hypothetical expenses based on the Portfolio’s actual expense ratio and an assumed rate of return of 5% per year before expenses, which is not the Portfolio’s actual return. The hypothetical account values and expenses may not be used to estimate the actual ending account balance or expenses you paid for the period. You may use this information to compare the ongoing costs of investing in the Portfolio and other investment options. To do so, compare this 5% hypothetical example with the 5% hypothetical examples that appear in the shareholder reports of the other investment options.
Please note that the expenses shown in the table are meant to highlight your ongoing Portfolio costs only and do not reflect any contract fees and charges, such as sales charges (loads), insurance charges or administrative charges. Therefore the second line of the table is useful to compare ongoing investment option costs only, and will not help you determine the relative total costs of owning different contracts. In addition, if these contract fee and charges were included, your costs would have been higher.
| | | | | | | | | | |
| The Prudential Series Fund Portfolios | | Beginning Account
Value
July 1, 2007 | | Ending Account
Value
December 31, 2007 | | Annualized
Expense Ratio
based on the
Six-Month period | | Expenses Paid
During the
Six-Month period |
| | | | | | | | | | | |
| Diversified Conservative Growth (Class I) | | Actual | | $1,000.00 | | $1,025.90 | | 1.32% | | $6.74 |
| | | Hypothetical | | $1,000.00 | | $1,018.55 | | 1.32% | | $6.72 |
| Jennison 20/20 Focus (Class I) | | Actual | | $1,000.00 | | $1,018.20 | | 0.83% | | $4.22 |
| | | Hypothetical | | $1,000.00 | | $1,021.02 | | 0.83% | | $4.23 |
| Jennison 20/20 Focus (Class II) | | Actual | | $1,000.00 | | $1,016.30 | | 1.23% | | $6.25 |
| | | Hypothetical | | $1,000.00 | | $1,019.00 | | 1.23% | | $6.26 |
Portfolio expenses (net of fee waivers or subsidies, if any) for each share class are equal to the annualized expense ratio for each share class (provided in the table), multiplied by the average account value over the period, multiplied by the 184 days in the six-month period ended December 31, 2007, and divided by the 365 days in each Portfolio’s fiscal year ending December 31, 2007 (to reflect the six-month period). Expenses presented in the table include the expenses of any underlying portfolios in which the Portfolio may invest.
| | | | |
| | | DIVERSIFIED CONSERVATIVE GROWTH PORTFOLIO | | |
SCHEDULE OF INVESTMENTS | December 31, 2007 |
| | | | | |
| LONG-TERM INVESTMENTS — 118.7% | | Value
(Note 2)
|
| COMMON STOCKS — 39.3% | | Shares
| |
| | | | | | |
Aerospace & Defense — 1.0% | | | | | |
AAR Corp.* | | 2,900 | | $ | 110,287 |
Aerovironment, Inc.* | | 2,630 | | | 63,646 |
BE Aerospace, Inc.* | | 990 | | | 52,371 |
Boeing Co. | | 2,500 | | | 218,650 |
HEICO Corp. | | 1,720 | | | 93,705 |
Moog, Inc. (Class A Stock)* | | 2,175 | | | 99,637 |
Orbital Sciences Corp.* | | 3,640 | | | 89,253 |
Teledyne Technologies, Inc.* | | 1,200 | | | 63,996 |
United Technologies Corp. | | 5,600 | | | 428,624 |
| | | | |
|
|
| | | | | | 1,220,169 |
| | | | |
|
|
Airlines — 0.1% | | | | | |
Allegiant Travel Co.* | | 3,340 | | | 107,348 |
| | | | |
|
|
Automobiles | | | | | |
Winnebago Industries, Inc. | | 900 | | | 18,918 |
| | | | |
|
|
Automotive Parts — 0.1% | | | | | |
Amerigon, Inc.* | | 2,910 | | | 61,517 |
| | | | |
|
|
Banks | | | | | |
Pacific Capital Bancorp | | 2,700 | | | 54,351 |
| | | | |
|
|
Beverages — 0.4% | | | | | |
PepsiCo, Inc. | | 6,300 | | | 478,170 |
| | | | |
|
|
Biotechnology — 1.2% | | | | | |
Amgen, Inc.* | | 6,400 | | | 297,216 |
Genentech, Inc.* | | 4,700 | | | 315,229 |
Gilead Sciences, Inc.* | | 18,700 | | | 860,387 |
| | | | |
|
|
| | | | | | 1,472,832 |
| | | | |
|
|
Building & Construction | | | | | |
Standard Pacific Corp. | | 3,300 | | | 11,055 |
| | | | |
|
|
Building Products | | | | | |
Watsco, Inc. | | 1,200 | | | 44,112 |
| | | | |
|
|
Business Services — 0.1% | | | | | |
URS Corp.* | | 2,200 | | | 119,526 |
| | | | |
|
|
Capital Goods — 0.1% | | | | | |
Joy Global, Inc. | | 2,700 | | | 177,714 |
| | | | |
|
|
Capital Markets — 1.6% | | | | | |
Bank of New York Mellon Corp. (The) | | 5,626 | | | 274,324 |
Charles Schwab Corp. (The) | | 18,200 | | | 465,010 |
Goldman Sachs Group, Inc. (The) | | 1,500 | | | 322,575 |
Jefferies Group, Inc. | | 4,000 | | | 92,200 |
Lazard Ltd. (Class A Stock) | | 5,500 | | | 223,740 |
Merrill Lynch & Co., Inc. | | 3,000 | | | 161,040 |
TD Ameritrade Holding Corp.* | | 8,300 | | | 166,498 |
UBS AG | | 6,500 | | | 299,000 |
| | | | |
|
|
| | | | | | 2,004,387 |
| | | | |
|
|
Chemicals — 0.8% | | | | | |
Monsanto Co. | | 5,100 | | | 569,619 |
Mosaic Co. (The)* | | 700 | | | 66,038 |
Potash Corp. of Saskatchewan (Canada) | | 1,900 | | | 273,524 |
Scotts Miracle-Gro Co. (The) (Class A Stock) | | 2,100 | | | 78,582 |
Valspar Corp. (The) | | 2,200 | | | 49,588 |
Zoltek Cos., Inc.* | | 1,120 | | | 48,014 |
| | | | |
|
|
| | | | | | 1,085,365 |
| | | | |
|
|
| | | | | |
COMMON STOCKS
(continued) | | Shares
| | Value
(Note 2)
|
| | | | | | |
Clothing & Apparel — 0.1% | | | | | |
Iconix Brand Group, Inc.* | | 3,320 | | $ | 65,271 |
Volcom, Inc.* | | 2,110 | | | 46,484 |
| | | | |
|
|
| | | | | | 111,755 |
| | | | |
|
|
Commercial Banks — 0.3% | | | | | |
Astoria Financial Corp. | | 3,650 | | | 84,936 |
Royal Bank of Scotland Group PLC (United Kingdom) | | 26,749 | | | 236,415 |
| | | | |
|
|
| | | | | | 321,351 |
| | | | |
|
|
Commercial Services — 0.1% | | | | | |
American Public Education, Inc.* | | 1,042 | | | 43,535 |
Cardtronics, Inc.* | | 3,670 | | | 37,103 |
HMS Holdings Corp.* | | 1,280 | | | 42,509 |
| | | | |
|
|
| | | | | | 123,147 |
| | | | |
|
|
Commercial Services & Supplies — 0.6% | | | |
Administaff, Inc. | | 1,000 | | | 28,280 |
Allied Waste Industries, Inc.* | | 6,700 | | | 73,834 |
FirstService Corp. (Canada)* | | 1,470 | | | 44,879 |
Global Payments, Inc. | | 2,800 | | | 130,256 |
Rollins, Inc. | | 2,895 | | | 55,584 |
Team, Inc.* | | 1,430 | | | 52,309 |
Waste Management, Inc. | | 9,900 | | | 323,433 |
| | | | |
|
|
| | | | | | 708,575 |
| | | | |
|
|
Communication Equipment — 1.9% | | | | | |
Ciena Corp.* | | 4,700 | | | 160,317 |
Cisco Systems, Inc.* | | 21,600 | | | 584,712 |
Juniper Networks, Inc.* | | 6,800 | | | 225,760 |
Nokia OYJ, ADR (Finland) | | 5,700 | | | 218,823 |
Nuance Communications, Inc.* | | 3,400 | | | 63,512 |
QUALCOMM, Inc. | | 13,900 | | | 546,965 |
Research In Motion Ltd.* | | 5,900 | | | 669,060 |
| | | | |
|
|
| | | | | | 2,469,149 |
| | | | |
|
|
Computer Hardware | | | | | |
Magma Design Automation, Inc.* | | 3,590 | | | 43,834 |
| | | | |
|
|
Computer Networking | | | | | |
Atheros Communications* | | 1,930 | | | 58,942 |
| | | | |
|
|
Computer Services & Software — 0.2% | | | | | |
Advent Software, Inc.* | | 750 | | | 40,575 |
FalconStor Software, Inc.* | | 3,970 | | | 44,702 |
Riverbed Technology, Inc.* | | 1,780 | | | 47,597 |
THQ, Inc.* | | 2,010 | | | 56,662 |
| | | | |
|
|
| | | | | | 189,536 |
| | | | |
|
|
Computers & Peripherals — 1.5% | | | | | |
Apple, Inc.* | | 3,800 | | | 752,704 |
Hewlett-Packard Co. | | 10,500 | | | 530,040 |
Hutchinson Technology, Inc.* | | 2,150 | | | 56,588 |
Lexmark International, Inc. (Class A Stock)* | | 7,000 | | | 244,020 |
Seagate Technology | | 14,500 | | | 369,750 |
| | | | |
|
|
| | | | | | 1,953,102 |
| | | | |
|
|
Construction | | | | | |
Granite Construction, Inc. | | 1,500 | | | 54,270 |
| | | | |
|
|
SEE NOTES TO FINANCIAL STATEMENTS.
A1
| | | | |
| | | DIVERSIFIED CONSERVATIVE GROWTH PORTFOLIO (Continued) | | |
SCHEDULE OF INVESTMENTS | December 31, 2007 |
| | | | | |
COMMON STOCKS
(continued) | | Shares
| | Value
(Note 2)
|
| | | | | | |
Consumer Finance — 0.5% | | | | | |
American Express Co. | | 7,400 | | $ | 384,948 |
SLM Corp. | | 12,500 | | | 251,750 |
| | | | |
|
|
| | | | | | 636,698 |
| | | | |
|
|
Consumer Products & Services | | | | | |
Bare Escentuals, Inc.* | | 2,510 | | | 60,868 |
| | | | |
|
|
Diversified Consumer Services — 0.5% | | | | | |
Career Education Corp.* | | 8,400 | | | 211,176 |
H&R Block, Inc. | | 23,100 | | | 428,967 |
| | | | |
|
|
| | | | | | 640,143 |
| | | | |
|
|
Diversified Financial Services — 1.5% | | | | | |
Affiliated Managers Group, Inc.* | | 710 | | | 83,397 |
Bank of America Corp. | | 5,690 | | | 234,769 |
Calamos Asset Management, Inc.
(Class A Stock) | | 1,044 | | | 31,090 |
Citigroup, Inc. | | 8,400 | | | 247,296 |
CME Group, Inc. | | 400 | | | 274,400 |
Eaton Vance Corp. | | 3,300 | | | 149,853 |
KKR Financial Holdings LLC | | 5,796 | | | 81,434 |
KKR Private Equity Investors LLP
(cost $41,122; purchased 08/03/06) | | 1,800 | | | 32,688 |
KKR Private Equity Investors LLP, ADR,
RDU, 144A (cost $279,290; purchased 5/03/06 - 05/05/06) | | 11,200 | | | 203,392 |
MarketAxess Holdings, Inc.* | | 2,210 | | | 28,354 |
NYSE Euronext | | 2,800 | | | 245,756 |
Portfolio Recovery Associates, Inc. | | 1,040 | | | 41,257 |
Raymond James Financial, Inc. | | 4,275 | | | 139,622 |
Sterling Financial Corp. (WA) | | 2,400 | | | 40,296 |
Student Loan Corp. (The) | | 400 | | | 44,000 |
| | | | |
|
|
| | | | | | 1,877,604 |
| | | | |
|
|
Diversified Telecommunication Services — 0.1% | | | |
Verizon Communications, Inc. | | 3,800 | | | 166,022 |
| | | | |
|
|
Education — 0.1% | | | | | |
DeVry, Inc. | | 1,900 | | | 98,724 |
| | | | |
|
|
Electric Utilities — 0.4% | | | | | |
Entergy Corp. | | 2,800 | | | 334,656 |
Progress Energy, Inc. | | 4,100 | | | 198,563 |
| | | | |
|
|
| | | | | | 533,219 |
| | | | |
|
|
Electrical Equipment — 0.5% | | | | | |
ABB Ltd., ADR (Switzerland) | | 8,400 | | | 241,920 |
First Solar, Inc.* | | 1,000 | | | 267,140 |
Sunpower Corp. (Class A Stock)* | | 900 | | | 117,351 |
| | | | |
|
|
| | | | | | 626,411 |
| | | | |
|
|
Electronic Equipment & Instruments — 0.5% | | | |
Checkpoint Systems, Inc.* | | 3,100 | | | 80,538 |
FLIR Systems, Inc.* | | 7,200 | | | 225,360 |
Sony Corp., ADR (Japan) | | 5,400 | | | 293,220 |
| | | | |
|
|
| | | | | | 599,118 |
| | | | |
|
|
Electronics — 0.1% | | | | | |
Benchmark Electronics, Inc.* | | 2,900 | | | 51,417 |
PNM Resources, Inc. | | 2,500 | | | 53,625 |
| | | | |
|
|
| | | | | | 105,042 |
| | | | |
|
|
| | | | | |
COMMON STOCKS
(continued) | | Shares
| | Value
(Note 2)
|
| | | | | | |
Energy | | | | | |
Headwaters, Inc.* | | 2,869 | | | 33,682 |
| | | | |
|
|
Energy Equipment & Services — 0.3% | | | | | |
Oil States International, Inc.* | | 1,500 | | $ | 51,180 |
Schlumberger Ltd. | | 3,300 | | | 324,621 |
| | | | |
|
|
| | | | | | 375,801 |
| | | | |
|
|
Entertainment & Leisure | | | | | |
Life Time Fitness, Inc.* | | 1,150 | | | 57,132 |
| | | | |
|
|
Environmental Control | | | | | |
Darling International, Inc.* | | 3,440 | | | 39,766 |
| | | | |
|
|
Exchange Traded Fund — 0.1% | | | | | |
iShares Russell 2000 Growth Index Fund | | 1,030 | | | 86,190 |
| | | | |
|
|
Financial Services — 0.2% | | | | | |
Investment Technology Group, Inc.* | | 1,550 | | | 73,765 |
Moneygram International, Inc. | | 3,000 | | | 46,110 |
optionsXpress Holdings, Inc. | | 1,360 | | | 45,995 |
PROS Holdings, Inc.* | | 3,470 | | | 68,081 |
| | | | |
|
|
| | | | | | 233,951 |
| | | | |
|
|
Food & Staples Retailing — 0.9% | | | | | |
Costco Wholesale Corp. | | 3,300 | | | 230,208 |
Kroger Co. (The) | | 15,800 | | | 422,018 |
SunOpta, Inc.* | | 3,420 | | | 45,657 |
Wal-Mart Stores, Inc. | | 5,800 | | | 275,674 |
Whole Foods Market, Inc. | | 3,500 | | | 142,800 |
| | | | |
|
|
| | | | | | 1,116,357 |
| | | | |
|
|
Food Products — 0.7% | | | | | |
Cadbury Schweppes PLC, ADR
(United Kingdom) | | 10,300 | | | 508,511 |
ConAgra Foods, Inc. | | 16,400 | | | 390,156 |
| | | | |
|
|
| | | | | | 898,667 |
| | | | |
|
|
Healthcare Equipment & Supplies — 1.1% | | | | | |
Alcon, Inc. | | 2,700 | | | 386,208 |
Baxter International, Inc. | | 5,600 | | | 325,080 |
Hologic, Inc.* | | 2,600 | | | 178,464 |
Immucor, Inc.* | | 840 | | | 28,552 |
NuVasive, Inc.* | | 1,920 | | | 75,878 |
Spectranetics Corp.* | | 6,670 | | | 102,251 |
St. Jude Medical, Inc.* | | 6,500 | | | 264,160 |
| | | | |
|
|
| | | | | | 1,360,593 |
| | | | |
|
|
Healthcare Providers & Services — 0.9% | | | | | |
Amedisys, Inc.* | | 1,400 | | | 67,928 |
AMERIGROUP Corp.* | | 2,800 | | | 102,060 |
Covance, Inc.* | | 2,200 | | | 190,564 |
Healthways, Inc.* | | 3,680 | | | 215,059 |
Omnicare, Inc. | | 11,100 | | | 253,191 |
Pediatrix Medical Group, Inc.* | | 1,270 | | | 86,551 |
Pharmaceutical Product Development, Inc. | | 4,000 | | | 161,480 |
Sunrise Senior Living, Inc.* | | 3,100 | | | 95,108 |
| | | | |
|
|
| | | | | | 1,171,941 |
| | | | |
|
|
Healthcare – Services | | | | | |
RadNet, Inc.* | | 5,020 | | | 50,953 |
| | | | |
|
|
Hotels, Restaurants & Leisure — 0.4% | | | | | |
Brinker International, Inc. | | 2,600 | | | 50,856 |
Marriott International, Inc. (Class A Stock) | | 8,400 | | | 287,112 |
SEE NOTES TO FINANCIAL STATEMENTS.
A2
| | | | |
| | | DIVERSIFIED CONSERVATIVE GROWTH PORTFOLIO (Continued) | | |
SCHEDULE OF INVESTMENTS | December 31, 2007 |
| | | | | |
COMMON STOCKS
(continued) | | Shares
| | Value
(Note 2)
|
| | | | | | |
Hotels, Restaurants & Leisure (cont’d.) | | | |
Scientific Games Corp. (Class A Stock)* | | 3,680 | | $ | 122,360 |
Sonic Corp.* | | 3,300 | | | 72,270 |
| | | | |
|
|
| | | | | | 532,598 |
| | | | |
|
|
Household Durables — 0.1% | | | | | |
Meritage Homes Corp.* | | 1,700 | | | 24,769 |
Snap-on, Inc. | | 1,700 | | | 82,008 |
| | | | |
|
|
| | | | | | 106,777 |
| | | | |
|
|
Household Products — 0.8% | | | | | |
Colgate-Palmolive Co. | | 5,400 | | | 420,984 |
Kimberly-Clark Corp. | | 5,100 | | | 353,634 |
Procter & Gamble Co. | | 3,100 | | | 227,602 |
| | | | |
|
|
| | | | | | 1,002,220 |
| | | | |
|
|
Independent Power Producers & Energy Traders — 0.3% |
NRG Energy, Inc.* | | 7,700 | | | 333,718 |
| | | | |
|
|
Industrial Conglomerates — 0.6% | | | | | |
General Electric Co. | | 20,600 | | | 763,642 |
| | | | |
|
|
Insurance — 1.3% | | | | | |
American International Group, Inc. | | 7,300 | | | 425,590 |
Amtrust Financial Services, Inc. | | 6,990 | | | 96,252 |
Axis Capital Holdings Ltd. | | 4,900 | | | 190,953 |
Delphi Financial Group, Inc. (Class A Stock) | | 1,925 | | | 67,914 |
eHealth, Inc.* | | 1,110 | | | 35,642 |
Loews Corp. | | 8,000 | | | 402,720 |
MBIA, Inc. | | 6,000 | | | 111,780 |
Philadelphia Consolidated Holding Corp.* | | 3,000 | | | 118,050 |
Protective Life Corp. | | 1,700 | | | 69,734 |
State Auto Financial Corp. | | 2,300 | | | 60,490 |
United Fire & Casualty Co. | | 1,400 | | | 40,726 |
| | | | |
|
|
| | | | | | 1,619,851 |
| | | | |
|
|
Internet — 0.2% | | | | | |
Aladdin Knowledge Systems Ltd. (Israel)* | | 2,140 | | | 55,918 |
Digital River, Inc.* | | 2,190 | | | 72,423 |
Equinix, Inc.* | | 815 | | | 82,372 |
TheStreet.com, Inc. | | 5,170 | | | 82,307 |
| | | | |
|
|
| | | | | | 293,020 |
| | | | |
|
|
Internet & Catalog Retail — 0.5% | | | | | |
Amazon.Com, Inc.* | | 4,000 | | | 370,560 |
IAC/InterActiveCorp.* | | 11,600 | | | 312,272 |
| | | | |
|
|
| | | | | | 682,832 |
| | | | |
|
|
Internet Software & Services — 1.9% | | | | | |
Akamai Technologies, Inc.* | | 6,100 | | | 211,060 |
Alibaba.com Ltd. (China)* | | 4,700 | | | 16,666 |
CyberSource Corp.* | | 7,200 | | | 127,944 |
eBay, Inc.* | | 8,400 | | | 278,796 |
Google, Inc. (Class A Stock)* | | 1,500 | | | 1,037,220 |
Infosys Technologies Ltd., ADR (India) | | 2,700 | | | 122,472 |
Internet Brands, Inc. (Class A Stock)* | | 6,407 | | | 45,041 |
j2 Global Communications, Inc.* | | 4,810 | | | 101,828 |
NaviSite, Inc.* | | 11,830 | | | 59,860 |
NutriSystem, Inc.* | | 2,450 | | | 66,101 |
Shutterly, Inc.* | | 1,680 | | | 43,042 |
TriZetto Group, Inc.* | | 4,120 | | | 71,564 |
| | | | | |
COMMON STOCKS
(continued) | | Shares
| | Value
(Note 2)
|
| | | | | | |
Internet Software & Services (cont’d.) | | | |
ValueClick, Inc.* | | 2,220 | | $ | 48,618 |
Yahoo!, Inc.* | | 8,000 | | | 186,080 |
| | | | |
|
|
| | | | | | 2,416,292 |
| | | | |
|
|
Life Science Tools & Services — 0.3% | | | | | |
Thermo Fisher Scientific, Inc.* | | 6,900 | | | 397,992 |
| | | | |
|
|
Lodging — 0.1% | | | | | |
Home Inns & Hotels Management, Inc., ADR (China)* | | 2,000 | | | 71,280 |
| | | | |
|
|
Machinery — 0.2% | | | | | |
Bucyrus International, Inc. (Class A Stock) | | 2,720 | | | 270,341 |
| | | | |
|
|
Manufacturing — 0.2% | | | | | |
Harsco Corp. | | 2,400 | | | 153,768 |
Hexel Corp.* | | 5,800 | | | 140,824 |
| | | | |
|
|
| | | | | | 294,592 |
| | | | |
|
|
Media — 1.6% | | | | | |
Comcast Corp. (Class A Stock)* | | 26,250 | | | 479,325 |
DG Fastchannel, Inc.* | | 4,330 | | | 111,021 |
Liberty Global, Inc. (Class C Stock)* | | 10,883 | | | 398,209 |
News Corp. (Class A Stock) | | 13,700 | | | 280,713 |
Walt Disney Co. (The) | | 16,100 | | | 519,708 |
XM Satellite Radio Holdings, Inc. (Class A Stock)* | | 24,600 | | | 301,104 |
| | | | |
|
|
| | | | | | 2,090,080 |
| | | | |
|
|
Medical Supplies & Equipment — 0.1% | | | | | |
Micrus Endovascular Corp.* | | 4,420 | | | 86,986 |
NovaMed, Inc.* | | 8,670 | | | 36,847 |
Volcano Corp.* | | 2,990 | | | 37,405 |
| | | | |
|
|
| | | | | | 161,238 |
| | | | |
|
|
Metals & Mining — 0.3% | | | | | |
Dynamic Materials Corp. | | 920 | | | 54,188 |
Freeport-McMoRan Copper & Gold, Inc. | | 1,273 | | | 130,406 |
Haynes International, Inc.* | | 670 | | | 46,565 |
Ladish Co., Inc.* | | 1,760 | | | 76,015 |
Schnitzer Steel Industries, Inc., (Class A Stock) | | 440 | | | 30,417 |
Timken Co. | | 3,200 | | | 105,120 |
| | | | |
|
|
| | | | | | 442,711 |
| | | | |
|
|
Multi-Line Retail — 0.1% | | | | | |
Saks, Inc.* | | 8,400 | | | 174,384 |
| | | | |
|
|
Multi-Utilities — 0.3% | | | | | |
Sempra Energy | | 6,200 | | | 383,656 |
| | | | |
|
|
Office Electronics — 0.2% | | | | | |
Xerox Corp. | | 15,900 | | | 257,421 |
| | | | |
|
|
Office Equipment | | | | | |
School Specialty, Inc.* | | 1,500 | | | 51,825 |
| | | | |
|
|
Oil & Gas Exploration/Production — 0.1% | | | | | |
Core Laboratories N.V. (Netherlands)* | | 650 | | | 81,068 |
| | | | |
|
|
Oil, Gas & Consumable Fuels — 3.7% | | | | | |
Anadarko Petroleum Corp. | | 5,400 | | | 354,726 |
Arena Resources, Inc.* | | 800 | | | 33,368 |
Cabot Oil & Gas Corp. | | 5,600 | | | 226,072 |
Devon Energy Corp. | | 3,600 | | | 320,076 |
SEE NOTES TO FINANCIAL STATEMENTS.
A3
| | | | |
| | | DIVERSIFIED CONSERVATIVE GROWTH PORTFOLIO (Continued) | | |
SCHEDULE OF INVESTMENTS | December 31, 2007 |
| | | | | |
COMMON STOCKS
(continued) | | Shares
| | Value
(Note 2)
|
| | | | | | |
Oil, Gas & Consumable Fuels (cont’d.) | | | |
Hess Corp. | | 1,900 | | $ | 191,634 |
Marathon Oil Corp. | | 11,300 | | | 687,718 |
Murphy Oil Corp. | | 3,500 | | | 296,940 |
Nexen, Inc. | | 9,200 | | | 296,884 |
Occidental Petroleum Corp. | | 10,800 | | | 831,492 |
Petroleo Brasileiro SA, ADR (Brazil) | | 3,800 | | | 437,912 |
Southwestern Energy Co.* | | 1,300 | | | 72,436 |
Suncor Energy, Inc. | | 5,400 | | | 587,142 |
Superior Energy Services, Inc.* | | 1,990 | | | 68,496 |
Swift Energy Co.* | | 1,800 | | | 79,254 |
W&T Offshore, Inc. | | 1,900 | | | 56,924 |
Williams Cos., Inc. | | 5,000 | | | 178,900 |
| | | | |
|
|
| | | | | | 4,719,974 |
| | | | |
|
|
Paper & Forest Products — 0.2% | | | | | |
Domtar Corp.* | | 24,900 | | | 191,481 |
| | | | |
|
|
Pharmaceuticals — 2.5% | | | | | |
Abbott Laboratories | | 13,000 | | | 729,950 |
Barr Pharmaceuticals, Inc.* | | 1,100 | | | 58,410 |
Elan Corp. PLC, ADR (Ireland)* | | 5,900 | | | 129,682 |
K-V Pharmaceutical Co. (Class A Stock)* | | 4,430 | | | 126,432 |
LeMaitre Vascular, Inc.* | | 10,660 | | | 66,092 |
Merck & Co., Inc. | | 5,500 | | | 319,605 |
Mylan, Inc. | | 6,200 | | | 87,172 |
Novartis AG, ADR (Switzerland) | | 5,800 | | | 314,998 |
Roche Holdings Ltd., ADR (Switzerland) | | 3,800 | | | 324,520 |
Schering-Plough Corp. | | 5,800 | | | 154,512 |
Sciele Pharma, Inc.* | | 2,610 | | | 53,375 |
Teva Pharmaceutical Industries Ltd., ADR (Israel) | | 8,400 | | | 390,432 |
Wyeth | | 11,100 | | | 490,509 |
| | | | |
|
|
| | | | | | 3,245,689 |
| | | | |
|
|
Real Estate Investment Trusts — 0.1% | | | | | |
Hovnanian Enterprises, Inc.
(Class A Stock)* | | 3,100 | | | 22,227 |
SL Green Realty Corp. | | 900 | | | 84,114 |
| | | | |
|
|
| | | | | | 106,341 |
| | | | |
|
|
Retail | | | | | |
FGX International Holdings Ltd.
(British Virgin Islands)* | | 4,550 | | | 53,918 |
| | | | |
|
|
Retail & Merchandising — 0.2% | | | | | |
Cash America International, Inc. | | 1,723 | | | 55,653 |
CVS Caremark Corp. | | 5,400 | | | 214,650 |
| | | | |
|
|
| | | | | | 270,303 |
| | | | |
|
|
Semiconductors & Semiconductor Equipment — 0.5% |
IPG Photonics Corp.* | | 3,020 | | | 60,370 |
Itron, Inc.* | | 1,460 | | | 140,116 |
Mellanox Technologies Ltd. (Israel)* | | 2,330 | | | 42,452 |
NVIDIA Corp.* | | 3,350 | | | 113,967 |
O2Micro International Ltd., ADR
(Cayman Islands)* | | 4,150 | | | 47,891 |
Silicon Motion Technology Corp., ADR (Taiwan)* | | 1,660 | | | 29,515 |
Spansion, Inc. (Class A Stock)* | | 38,600 | | | 151,698 |
| | | | |
|
|
| | | | | | 586,009 |
| | | | |
|
|
| | | | | |
COMMON STOCKS
(continued) | | Shares
| | Value
(Note 2)
|
| | | | | | |
Software — 1.5% | | | | | |
Adobe Systems, Inc.* | | 11,900 | | $ | 508,487 |
Concur Technologies, Inc.* | | 820 | | | 29,692 |
Microsoft Corp. | | 29,000 | | | 1,032,400 |
Phase Forward, Inc.* | | 2,250 | | | 48,938 |
Symantec Corp.* | | 20,000 | | | 322,800 |
VMware, Inc. (Class A Stock)* | | 400 | | | 33,996 |
| | | | |
|
|
| | | | | | 1,976,313 |
| | | | |
|
|
Specialty Retail — 0.4% | | | | | |
Aaron Rents, Inc. | | 2,400 | | | 46,176 |
Best Buy Co., Inc. | | 7,600 | | | 400,140 |
Urban Outfitters, Inc.* | | 2,400 | | | 65,424 |
| | | | |
|
|
| | | | | | 511,740 |
| | | | |
|
|
Technology | | | | | |
Sanmina-SCI Corp.* | | 15,100 | | | 27,482 |
| | | | |
|
|
Telecommunications — 0.2% | | | | | |
Arris Group, Inc.* | | 6,600 | | | 65,868 |
Cbeyond, Inc.* | | 1,810 | | | 70,572 |
Dril-Quip, Inc.* | | 1,540 | | | 85,716 |
GeoEye, Inc.* | | 1,020 | | | 34,323 |
| | | | |
|
|
| | | | | | 256,479 |
| | | | |
|
|
Textiles, Apparel & Luxury Goods — 0.6% | | | | | |
Coach, Inc.* | | 8,800 | | | 269,104 |
Jos. A. Bank Clothiers, Inc.* | | 1,640 | | | 46,658 |
Nike, Inc. (Class B Stock) | | 5,300 | | | 340,472 |
Phillips-Van Heusen Corp. | | 2,400 | | | 88,464 |
| | | | |
|
|
| | | | | | 744,698 |
| | | | |
|
|
Thrifts & Mortgage Finance — 0.4% | | | | | |
Fannie Mae | | 6,600 | | | 263,868 |
People’s United Financial, Inc. | | 13,050 | | | 232,290 |
| | | | |
|
|
| | | | | | 496,158 |
| | | | |
|
|
Tobacco — 0.2% | | | | | |
Altria Group, Inc. | | 2,800 | | | 211,624 |
| | | | |
|
|
Transportation | | | | | |
Excel Maritime Carriers Ltd. (Greece) | | 1,130 | | | 45,415 |
| | | | |
|
|
Utilities — 0.1% | | | | | |
ONEOK, Inc. | | 1,900 | | | 85,063 |
| | | | |
|
|
Wireless Telecommunication Services — 0.6% | | | |
NII Holdings, Inc.* | | 5,700 | | | 275,424 |
Sprint Nextel Corp. | | 21,626 | | | 283,949 |
Virgin Mobile USA, Inc.* | | 25,000 | | | 222,250 |
| | | | |
|
|
| | | | | | 781,623 |
| | | | |
|
|
TOTAL COMMON STOCKS
(cost $39,787,552) | | | 50,395,855 |
| | | | |
|
|
| | |
| | | Units
| | |
| WARRANT | | | | | |
Media & Entertainment | | | | | |
XM Satellite Radio, Inc.,
expiring 03/15/10, 144A
(cost $0)* | | 100 | | | — |
| | | | |
|
|
SEE NOTES TO FINANCIAL STATEMENTS.
A4
| | | | |
| | | DIVERSIFIED CONSERVATIVE GROWTH PORTFOLIO (Continued) | | |
SCHEDULE OF INVESTMENTS | December 31, 2007 |
| | | | | | | | | | |
Interest
Rate
| | Maturity
Date
| | Moody’s
Ratings
(Unaudited)
| | Principal
Amount
(000)#
| | Value
(Note 2)
|
| | | | | | | | | | | |
| CORPORATE BONDS — 25.5% | | | |
Aerospace & Defense — 0.5% | | | |
DRS Technologies, Inc., | | | |
Gtd. Notes | | | |
| 6.625% | | 02/01/16 | | B1 | | $ | 75 | | $ | 74,062 |
| 7.625% | | 02/01/18 | | B3 | | | 100 | | | 101,250 |
Esterline Technologies Corp., | | | |
Gtd. Notes | | | |
| 7.75% | | 06/15/13 | | B1 | | | 125 | | | 128,125 |
L-3 Communications Corp., | | | |
Gtd. Notes | | | |
| 5.875% | | 01/15/15 | | Ba3 | | | 50 | | | 48,250 |
| 6.375% | | 10/15/15 | | Ba3 | | | 100 | | | 98,500 |
| 7.625% | | 06/15/12 | | Ba3 | | | 100 | | | 102,375 |
Moog, Inc., | | | |
Sr. Sub. Notes | | | |
| 6.25% | | 01/15/15 | | Ba3 | | | 100 | | | 97,250 |
TransDigm, Inc., | | | |
Gtd. Notes | | | |
| 7.75% | | 07/15/14 | | B3 | | | 50 | | | 50,750 |
| | | | | | | | | |
|
|
| | | | | | | | | | | 700,562 |
| | | | | | | | | |
|
|
Airlines — 0.1% | | | |
AMR Corp., MTN, | | | |
Notes | | | |
| 10.40% | | 03/10/11 | | CCC+(d) | | | 100 | | | 99,750 |
Continental Airlines, Inc., | | | |
Pass-Through Certificates | | | |
| 6.748% | | 03/15/17 | | Ba2 | | | 28 | | | 26,419 |
| | | | | | | | | |
|
|
| | | | | | | | | 126,169 |
| | | | | | | | | |
|
|
Automobile Manufacturers — 0.1% | | | |
DaimlerChrysler NA Holding Corp., MTN, | | | |
Gtd. Notes | | | |
| 5.75% | | 09/08/11 | | A3 | | | 100 | | | 101,485 |
| | | | | | | | | |
|
|
Automotive — 0.8% | | | |
Allison Transmission (cost $414,250;
purchased 10/11/07), | | | |
Gtd. Notes, 144A(f)(g) | | | |
| 11.00% | | 11/01/15 | | Caa1 | | | 400 | | | 364,000 |
Ford Motor Credit Co., | | | |
Notes | | | |
| 7.875% | | 06/15/10 | | B1 | | | 395 | | | 364,453 |
General Motors Corp., | | | |
Sr. Unsec’d. Notes | | | | | | | | |
| 7.20% | | 01/15/11 | | Caa1 | | | 240 | | | 220,800 |
Lear Corp., | | | |
Gtd. Notes | | | |
| 8.75% | | 12/01/16 | | B3 | | | 30 | | | 27,300 |
TRW Automotive, Inc., | | | |
Gtd. Notes, 144A | | | |
| 7.25% | | 03/15/17 | | Ba3 | | | 50 | | | 44,875 |
Visteon Corp., | | | |
Sr. Notes | | | |
| 7.00% | | 03/10/14 | | Caa2 | | | 40 | | | 30,000 |
| | | | | | | | | |
|
|
| | | | | | | | | | | 1,051,428 |
| | | | | | | | | |
|
|
| | | | | | | | | | |
Interest
Rate
| | Maturity
Date
| | Moody’s
Ratings
(Unaudited)
| | Principal
Amount
(000)#
| | Value
(Note 2)
|
| | | | | | | | | | | |
| CORPORATE BONDS (continued) | | | |
Banking — 0.1% | | | |
Kazkommerts International BV (Netherlands), Bank Gtd., 144A | | | |
| 7.875% | | 04/07/14 | | Ba1 | | $ | 95 | | $ | 80,988 |
Gtd. Notes, 144A | | | |
| 7.00% | | 11/03/09 | | Ba1 | | | 40 | | | 37,400 |
| | | | | | | | | |
|
|
| | | | | | | | | | | 118,388 |
| | | | | | | | | |
|
|
Building Materials & Construction — 0.1% | | | |
Goodman Global Holdings, Inc., | | | |
Gtd. Notes | | | |
| 7.991%(c) | | 06/15/12 | | B1 | | | 45 | | | 44,775 |
Nortek, Inc., | | | |
Sr. Sub. Notes | | | |
| 8.50% | | 09/01/14 | | B3 | | | 50 | | | 40,000 |
| | | | | | | | | |
|
|
| | | | | | | | | | | 84,775 |
| | | | | | | | | |
|
|
Cable — 0.5% | | | |
Charter Communications Holdings I LLC, | | | |
Gtd. Notes, Zero coupon (until 05/15/11) | | | |
| 11.75%(v) | | 05/15/14 | | Caa3 | | | 150 | | | 94,875 |
Sec’d. Notes | | | |
| 11.00% | | 10/01/15 | | Caa2 | | | 173 | | | 140,980 |
Charter Communications Holdings II LLC, | | | |
Gtd. Notes | | | | | | | | |
| 10.25% | | 09/15/10 | | Caa1 | | | 75 | | | 73,125 |
Charter Communications Operating LLC, | | | |
Sec’d. Notes, 144A | | | |
| 8.00% | | 04/30/12 | | B2 | | | 20 | | | 19,300 |
CSC Holdings, Inc., | | | |
Sr. Notes | | | |
| 8.125% | | 07/15/09 | | B2 | | | 150 | | | 152,437 |
Sr. Unsec’d. Notes | | | | | | | | |
| 6.75% | | 04/15/12 | | B2 | | | 50 | | | 47,813 |
| 8.125% | | 08/15/09 | | B2 | | | 50 | | | 50,875 |
Mediacom Broadband LLC, | | | |
Sr. Unsec’d. Notes | | | |
8.50% | | 10/15/15 | | B3 | | | 25 | | | 22,156 |
Mediacom LLC/Mediacom Capital Corp., | | | |
Sr. Unsec’d. Notes | | | |
| 9.50% | | 01/15/13 | | B3 | | | 50 | | | 46,438 |
| | | | | | | | | |
|
|
| | | | | | | | | | | 647,999 |
| | | | | | | | | |
|
|
Capital Goods — 1.6% | | | | | | |
Actuant Corp., | | | | | | | | |
Sr. Notes, 144A | | | | | | | | |
| 6.875% | | 06/15/17 | | Ba2 | | | 50 | | | 49,500 |
ALH Finance LLC, | | | | | | | | |
Gtd. Notes | | | | | | | | |
| 8.50% | | 01/15/13 | | B3 | | | 50 | | | 48,000 |
Allied Waste North America, Inc., | | | | | | |
Sec’d. Notes | | | | | | | | |
| 5.75% | | 02/15/11 | | B1 | | | 60 | | | 58,800 |
Sr. Notes | | | | | | | | |
| 7.875% | | 04/15/13 | | B1 | | | 50 | | | 51,125 |
Ashtead Capital, Inc., | | | | | | | | |
Sec’d. Notes, 144A | | | | | | | | |
| 9.00% | | 08/15/16 | | B1 | | | 100 | | | 88,500 |
SEE NOTES TO FINANCIAL STATEMENTS.
A5
| | | | |
| | | DIVERSIFIED CONSERVATIVE GROWTH PORTFOLIO (Continued) | | |
SCHEDULE OF INVESTMENTS | December 31, 2007 |
| | | | | | | | | | |
Interest
Rate
| | Maturity
Date
| | Moody’s
Ratings
(Unaudited)
| | Principal
Amount
(000)#
| | Value
(Note 2)
|
| | | | | | | | | | | |
| CORPORATE BONDS (continued) | | | |
Capital Goods (cont’d.) | | | | | | |
Ashtead Holdings PLC, | | | | | | |
Sec’d. Notes, 144A (United Kingdom) | | | |
| 8.625% | | 08/01/15 | | B1 | | $ | 75 | | $ | 65,625 |
Baldor Electric Co., | | | | | | | | |
Gtd. Notes | | | | | | | | |
| 8.625% | | 02/15/17 | | B3 | | | 70 | | | 72,100 |
Blount, Inc., | | | | | | | | |
Sr. Sub. Notes | | | | | | | | |
| 8.875% | | 08/01/12 | | B2 | | | 125 | | | 125,312 |
Columbus Mckinnon Corp., | | | | | | |
Sr. Sub. Notes | | | | | | | | |
| 8.875% | | 11/01/13 | | B1 | | | 200 | | | 207,000 |
Hertz Corp., | | | | | | | | |
Gtd. Notes | | | | | | | | |
| 8.875% | | 01/01/14 | | B1 | | | 245 | | | 248,369 |
Invensys PLC, | | | | | | | | |
Sr. Unsec’d. Notes, 144A (United Kingdom) | | | |
| 9.875% | | 03/15/11 | | B2 | | | 7 | | | 7,393 |
Johnson Diversified Holdings, Inc., | | | | | | |
Disc. Notes | | | | | | | | |
| 10.67% | | 05/15/13 | | Caa1 | | | 75 | | | 75,750 |
Gtd. Notes | | | | | | | | |
| 9.625% | | 05/15/12 | | B3 | | | 50 | | | 51,125 |
Mobile Mini, Inc., | | | | | | | | |
Gtd. Notes | | | | | | | | |
| 6.875% | | 05/01/15 | | B1 | | | 80 | | | 72,800 |
RBS Global, Inc. / Rexnord Corp., | | | | | | |
Gtd. Notes | | | | | | | | |
| 9.50% | | 08/01/14 | | B3 | | | 110 | | | 108,900 |
Rental Service Corp., | | | | | | | | |
Gtd. Notes | | | | | | | | |
| 9.50% | | 12/01/14 | | Caa1 | | | 85 | | | 76,075 |
SPX Corp., | | | |
Sr. Notes, 144A | | | | | | | | |
| 7.625% | | 12/15/14 | | Ba2 | | | 125 | | | 127,500 |
Stena AB / Capital Corp., | | | | | | |
Sr. Notes (Sweden) | | | | | | | | |
| 7.50% | | 11/01/13 | | Ba3 | | | 125 | | | 123,281 |
Terex Corp., | | | | | | | | |
Gtd. Notes | | | | | | | | |
| 7.375% | | 01/15/14 | | Ba2 | | | 75 | | | 75,938 |
Sr. Sub. Notes | | | | | | | | |
| 8.00% | | 11/15/17 | | Ba3 | | | 50 | | | 50,625 |
United Rentals North America, Inc., | | | | | | |
Gtd. Notes | | | | | | | | |
| 6.50% | | 02/15/12 | | B1 | | | 135 | | | 122,513 |
Valmont Industries, Inc., | | | | | | |
Gtd. Notes | | | | | | | | |
| 6.875% | | 05/01/14 | | Ba3 | | | 125 | | | 123,750 |
| | | | | | | | | |
|
|
| | | | | | | | | | | 2,029,981 |
| | | | | | | | | |
|
|
Chemicals — 0.5% | | | | | | | | |
Huntsman LLC, | | | | | | | | |
Gtd. Notes | | | | | | | | |
| 11.625% | | 10/15/10 | | Ba1 | | | 150 | | | 159,000 |
Invista, Sr. | | | | | | | | |
Unsec’d. Notes, 144A | | | | | | |
| 9.25% | | 05/01/12 | | Ba3 | | | 100 | | | 103,500 |
| | | | | | | | | | |
Interest Rate
| | Maturity
Date
| | Moody’s
Ratings
(Unaudited)
| | Principal
Amount
(000)#
| | Value
(Note 2)
|
| | | | | | | | | | | |
| CORPORATE BONDS (continued) | | | |
Chemicals (cont’d.) | | | | | | | | |
Koppers, Inc., | | | | | | | | |
Gtd. Notes | | | | | | | | |
| 9.875% | | 10/15/13 | | B2 | | $ | 102 | | $ | 107,355 |
Momentive Performance Materials, Inc., | | | |
Gtd. Notes, 144A | | | | | | |
| 10.00% | | 12/01/14 | | B3 | | | 70 | | | 64,400 |
| 11.50% | | 12/01/16 | | Caa2 | | | 50 | | | 43,250 |
Mosaic Co. (The), | | | | | | |
Sr. Notes, 144A | | | | | | | | |
| 7.375% | | 12/01/14 | | Ba1 | | | 25 | | | 26,750 |
| 7.875% | | 12/01/16 | | Ba1 | | | 25 | | | 27,000 |
Nalco Co., | | | | | | | | |
Sr. Unsec’d. Notes | | | | | | | | |
| 7.75% | | 11/15/11 | | B1 | | | 145 | | | 146,812 |
| | | | | | | | | |
|
|
| | | | | | | | | 678,067 |
| | | | | | | | | |
|
|
Consumer — 0.5% | | | | | | | | |
Mac-Gray Corp., | | | | | | | | |
Sr. Unsec’d. Notes | | | | | | | | |
| 7.625% | | 08/15/15 | | B2 | | | 50 | | | 48,750 |
Realogy Corp., | | | | | | | | |
Gtd. Notes, 144A | | | | | | | | |
| 10.50% | | 04/15/14 | | Caa1 | | | 50 | | | 37,375 |
| 12.375% | | 04/15/15 | | Caa2 | | | 225 | | | 141,750 |
Gtd. Notes, PIK, 144A | | | | | | | | |
| 11.00% | | 04/15/14 | | Caa1 | | | 100 | | | 69,500 |
Service Corp. International, | | | | | | |
Sr. Notes | | | | | | |
| 6.75% | | 04/01/16 | | B1 | | | 50 | | | 48,125 |
| 7.00% | | 06/15/17 | | B1 | | | 50 | | | 47,875 |
Sr. Unsec’d. Notes | | | | | | | | |
| 6.50% | | 03/15/08 | | B1 | | | 200 | | | 200,256 |
| 7.375% | | 10/01/14 | | B1 | | | 25 | | | 25,281 |
| | | | | | | | | |
|
|
| | | | | | | | | 618,912 |
| | | | | | | | | |
|
|
Diversified Financial Services — 0.5% | | | |
Morgan Stanley, MTN, | | | |
Sr. Unsec’d. Notes | | | | | | | | |
| 5.75% | | 10/18/16 | | Aa3 | | | 500 | | | 493,383 |
Petroleum Export Ltd. (cost $111,110; purchased 07/14/05), | | | | | | |
Sr. Notes, 144A (Cayman Islands)(f)(g) | | | |
| 4.633% | | 06/15/10 | | Aaa | | | 111 | | | 109,378 |
Petroleum Export Ltd. (cost $55,555; purchased 07/14/05), | | | | | | |
Sr. Notes, 144A (Cayman Islands)(f)(g) | | | |
| 4.623% | | 06/15/10 | | Aaa | | | 56 | | | 54,681 |
| | | | | | | | | |
|
|
| | | | | | | | | | | 657,442 |
| | | | | | | | | |
|
|
Electric — 1.6% | | | |
AES Corp., (The), | | | |
Sr. Notes | | | |
| 9.375% | | 09/15/10 | | B1 | | | 275 | | | 288,750 |
Sr. Unsub. Notes | | | |
| 9.50% | | 06/01/09 | | B1 | | | 25 | | | 25,875 |
AES Eastern Energy LP, | | | |
Pass-Through Certificates | | | |
| 9.00% | | 01/02/17 | | Ba1 | | | 34 | | | 37,208 |
SEE NOTES TO FINANCIAL STATEMENTS.
A6
| | | | |
| | | DIVERSIFIED CONSERVATIVE GROWTH PORTFOLIO (Continued) | | |
SCHEDULE OF INVESTMENTS | December 31, 2007 |
| | | | | | | | | | |
Interest
Rate
| | Maturity
Date
| | Moody’s
Ratings
(Unaudited)
| | Principal
Amount
(000)#
| | Value
(Note 2)
|
| | | | | | | | | | | |
| CORPORATE BONDS (continued) | | | |
Electric (cont’d.) | | | |
CMS Energy Corp., | | | |
Sr. Notes | | | |
| 8.50% | | 04/15/11 | | Ba1 | | $ | 50 | | $ | 53,861 |
Dynegy Holdings, Inc., | | | |
Sr. Unsec’d. Notes | | | |
| 7.50% | | 06/01/15 | | B2 | | | 50 | | | 46,750 |
| 8.375% | | 05/01/16 | | B2 | | | 100 | | | 97,750 |
Edison Mission Energy, | | | |
Sr. Unsec’d. Notes | | | |
| 7.00% | | 05/15/17 | | B1 | | | 100 | | | 98,250 |
| 7.75% | | 06/15/16 | | B1 | | | 50 | | | 51,500 |
Energy Future Holdings Corp., | | | |
Gtd. Notes, 144A | | | |
| 10.875% | | 11/01/17 | | B3 | | | 75 | | | 75,375 |
Intergen NV, | | | |
Sec’d. Notes, 144A (Netherlands) | | | |
| 9.00% | | 06/30/17 | | Ba3 | | | 100 | | | 105,250 |
Midwest Generation LLC, | | | |
Pass-Through Certificates | | | |
| 8.30% | | 07/02/09 | | Baa3 | | | 93 | | | 94,225 |
| 8.56% | | 01/02/16 | | Baa3 | | | 71 | | | 75,748 |
Mirant North America LLC, | | | |
Gtd. Notes | | | |
| 7.375% | | 12/31/13 | | B1 | | | 145 | | | 145,362 |
Nevada Power Co., | | | |
General Refinance Mortgage | | | |
| 6.50% | | 04/15/12 | | Baa3 | | | 50 | | | 51,784 |
NRG Energy, Inc., | | | |
Gtd. Notes | | | |
| 7.375% | | 02/01/16 | | B1 | | | 125 | | | 121,875 |
| 7.375% | | 01/15/17 | | B1 | | | 75 | | | 73,125 |
NSG Holdings LLC, | | | |
Sec’d. Notes, 144A | | | |
| 7.75% | | 12/15/25 | | Ba2 | | | 125 | | | 125,312 |
Orion Power Holdings, Inc., | | | |
Sr. Unsec’d. Notes | | | |
| 12.00% | | 05/01/10 | | B2 | | | 40 | | | 43,600 |
Sierra Pacific Resources, | | | |
Sr. Unsec’d. Notes | | | |
| 8.625% | | 03/15/14 | | Ba3 | | | 40 | | | 42,741 |
Texas Competitive Electric Holdings Co. LLC, | | | |
Gtd. Notes, 144A | | | |
| 10.25% | | 11/01/15 | | B3 | | | 375 | | | 371,250 |
| | | | | | | | | |
|
|
| | | | | | | | | | | 2,025,591 |
| | | | | | | | | |
|
|
Energy – Other — 0.8% | | | |
Chesapeake Energy Corp., | | | |
Gtd. Notes | | | |
| 6.375% | | 06/15/15 | | Ba3 | | | 200 | | | 193,500 |
Compagnie Generale de Geophysique Veritas, | | | |
Gtd. Notes (France) | | | |
| 7.50% | | 05/15/15 | | Ba3 | | | 25 | | | 25,313 |
Forest Oil Corp., | | | |
Sr. Unsec’d. Notes | | | |
| 8.00% | | 06/15/08 | | B1 | | | 40 | | | 40,400 |
McMoran Exploration Co., | | | |
Gtd. Notes | | | | | | | | |
| 11.875% | | 11/15/14 | | Caa1 | | | 75 | | | 75,281 |
| | | | | | | | | | |
Interest
Rate
| | Maturity
Date
| | Moody’s
Ratings
(Unaudited)
| | Principal
Amount
(000)#
| | Value
(Note 2)
|
| | | | | | | | | | | |
| CORPORATE BONDS (continued) | | | |
Energy – Other (cont’d.) | | | |
Newfield Exploration Co., | | | |
Sr. Sub. Notes | | | |
| 6.625% | | 04/15/16 | | Ba3 | | $ | 125 | | $ | 122,500 |
Parker Drilling Co., | | | |
Gtd. Notes | | | |
| 9.625% | | 10/01/13 | | B2 | | | 80 | | | 85,000 |
Petrohawk Energy Corp., | | | |
Gtd. Notes | | | |
| 9.125% | | 07/15/13 | | B3 | | | 75 | | | 78,937 |
Petroplus Finance Ltd., | | | |
Gtd. Notes, 144A (Bermuda) | | | |
| 6.75% | | 05/01/14 | | B1 | | | 75 | | | 69,844 |
Pioneer Natural Resources Co., | | | |
Sr. Unsec’d. Notes | | | |
| 6.65% | | 03/15/17 | | Ba1 | | | 95 | | | 91,615 |
Plains Exploration & Production Co., | | | |
Gtd. Notes | | | | | | | | |
| 7.00% | | 03/15/17 | | B1 | | | 115 | | | 109,969 |
Swift Energy Co., | | | |
Gtd. Notes | | | |
| 7.125% | | 06/01/17 | | B1 | | | 50 | | | 47,500 |
Tesoro Corp., | | | |
Gtd. Notes | | | |
| 6.625% | | 11/01/15 | | Ba1 | | | 25 | | | 24,750 |
| | | | | | | | | |
|
|
| | | | | | | | | | | 964,609 |
| | | | | | | | | |
|
|
Financial – Bank & Trust — 1.0% | | | |
Rabobank Nederland, MTN, | | | |
Notes (Netherlands) | | | |
| 0.20% | | 06/20/08 | | Aaa | | | JPY 137,000 | | | 1,222,032 |
VTB Capital SA for Vneshtorgbank
(cost $100,000; purchased 10/27/06), | | | |
Sr. Notes, 144A (Luxembourg)(f)(g) | | | |
| 5.494%(c) | | 08/01/08 | | A2 | | | 100 | | | 99,000 |
| | | | | | | | | |
|
|
| | | | | | | | | | | 1,321,032 |
| | | | | | | | | |
|
|
Financial Services — 1.3% | | | |
Bank of America Corp., | | | |
Sr. Notes | | | | | | | | |
| 4.637%(c) | | 10/14/16 | | Aa1 | | | 400 | | | 386,712 |
CitiFinancial, Inc., | | | |
Notes | | | |
| 6.625% | | 06/01/15 | | Aa3 | | | 100 | | | 105,003 |
General Electric Capital Corp.
(cost $297,708; purchased 08/30/07), | | | |
Sub. Notes, 144A(f)(g) | | | |
| 6.50%(c) | | 09/15/67 | | Aa1 | | | GBP 300 | | | 604,676 |
SLM Corp., Unsec’d. | | | |
Notes | | | |
| 4.247%(c) | | 04/14/08 | | Baa1 | | | 600 | | | 595,635 |
| | | | | | | | | |
|
|
| | | | | | | | | | | 1,692,026 |
| | | | | | | | | |
|
|
Food — 0.4% | | | |
Ahold Finance USA, Inc., | | | |
Gtd. Notes | | | |
| 6.875% | | 05/01/29 | | Baa3 | | | 20 | | | 21,066 |
| 8.25% | | 07/15/10 | | Baa3 | | | 25 | | | 27,178 |
SEE NOTES TO FINANCIAL STATEMENTS.
A7
| | | | |
| | | DIVERSIFIED CONSERVATIVE GROWTH PORTFOLIO (Continued) | | |
SCHEDULE OF INVESTMENTS | December 31, 2007 |
| | | | | | | | | | |
Interest
Rate
| | Maturity
Date
| | Moody’s
Ratings
(Unaudited)
| | Principal
Amount
(000)#
| | Value
(Note 2)
|
| | | | | | | | | | | |
| CORPORATE BONDS (continued) | | | |
Food (cont’d.) | | | |
Albertson’s, Inc., | | | |
Debs. | | | |
| 7.45% | | 08/01/29 | | B1 | | $ | 75 | | $ | 72,183 |
Sr. Unsec’d. Notes | | | |
| 8.70% | | 05/01/30 | | B1 | | | 25 | | | 26,635 |
Aramark Corp., | | | |
Gtd. Notes | | | |
| 8.50% | | 02/01/15 | | B3 | | | 125 | | | 126,562 |
Carrols Corp., | | | |
Gtd. Notes | | | |
| 9.00% | | 01/15/13 | | B3 | | | 50 | | | 45,500 |
Dole Foods Co., Inc., | | | |
Gtd. Notes | | | |
| 7.25% | | 06/15/10 | | Caa1 | | | 35 | | | 31,850 |
National Beef Packaging Co. LLC, | | | |
Sr. Unsec’d. Notes | | | |
| 10.50% | | 08/01/11 | | Caa1 | | | 50 | | | 47,500 |
Smithfield Foods, Inc., | | | |
Sr. Unsec’d. Notes | | | |
| 8.00% | | 10/15/09 | | Ba3 | | | 70 | | | 70,700 |
Stater Brothers Holdings, | | | |
Gtd. Notes | | | |
| 7.75% | | 04/15/15 | | B2 | | | 50 | | | 48,250 |
Sr. Notes | | | |
| 8.125% | | 06/15/12 | | B2 | | | 25 | | | 24,687 |
| | | | | | | | | |
|
|
| | | | | | | | | | | 542,111 |
| | | | | | | | | |
|
|
Gaming — 0.9% | | | |
Boyd Gaming Corp., | | | |
Sr. Sub. Notes | | | |
| 6.75% | | 04/15/14 | | B1 | | | 20 | | | 19,050 |
CCM Merger, Inc., | | | |
Notes, 144A | | | |
| 8.00% | | 08/01/13 | | B3 | | | 125 | | | 117,812 |
Downstream Development Authority of the Quapaw Tribe of Oklahoma, | | | |
Sec’d. Notes, 144A | | | | | | | | |
| 12.00% | | 10/15/15 | | B3 | | | 25 | | | 23,375 |
Fontainebleau Las Vegas Holdings LLC/Fontainebleau Las Vegas Capital Corp., | | | |
Second Mortgage, 144A | | | |
| 10.25% | | 06/15/15 | | Caa1 | | | 75 | | | 65,063 |
Harrahs Operating Co., Inc., | | | |
Gtd. Notes | | | |
| 5.50% | | 07/01/10 | | Baa3 | | | 50 | | | 46,500 |
| 5.625% | | 06/01/15 | | Baa3 | | | 55 | | | 40,150 |
| 6.50% | | 06/01/16 | | Baa3 | | | 25 | | | 18,625 |
MGM Mirage, | | | |
Gtd. Notes | | | |
| 6.00% | | 10/01/09 | | Ba2 | | | 255 | | | 253,725 |
| 6.625% | | 07/15/15 | | Ba2 | | | 80 | | | 75,000 |
| 6.875% | | 04/01/16 | | Ba2 | | | 50 | | | 47,125 |
| 7.50% | | 06/01/16 | | Ba2 | | | 100 | | | 99,000 |
Mohegan Tribal Gaming Authority, | | | |
Sr. Sub. Notes | | | |
| 8.00% | | 04/01/12 | | Ba2 | | | 70 | | | 71,050 |
| | | | | | | | | | |
Interest
Rate
| | Maturity
Date
| | Moody’s
Ratings
(Unaudited)
| | Principal
Amount
(000)#
| | Value
(Note 2)
|
| | | | | | | | | | | |
| CORPORATE BONDS (continued) | | | |
Gaming (cont’d.) | | | |
Park Place Entertainment Corp., | | | |
Gtd. Notes | | | |
| 8.125% | | 05/15/11 | | Ba1 | | $ | 30 | | $ | 27,900 |
Shingle Springs Tribal Gaming Authority, | | | |
Sr. Notes, 144A | | | |
| 9.375% | | 06/15/15 | | B3 | | | 75 | | | 72,750 |
Station Casinos, Inc., | | | |
Sr. Notes | | | |
| 6.00% | | 04/01/12 | | B2 | | | 120 | | | 106,800 |
Sr. Sub. Notes | | | |
| 6.50% | | 02/01/14 | | Caa1 | | | 50 | | | 37,500 |
Tropicana Entertainment LLC, | | | | | | |
Sr. Sub. Notes | | | |
| 9.625% | | 12/15/14 | | Caa3 | | | 75 | | | 47,625 |
| | | | | | | | | |
|
|
| | | | | | | | | | | 1,169,050 |
| | | | | | | | | |
|
|
Healthcare & Pharmaceuticals — 2.8% | | | |
Accellant, Inc., | | | |
Gtd. Notes | | | | | | | | |
| 10.50% | | 12/01/13 | | Caa3 | | | 225 | | | 189,000 |
Alliance Imaging, Inc., | | | |
Sr. Sub. Notes | | | |
| 7.25% | | 12/15/12 | | B3 | | | 75 | | | 71,250 |
Sr. Unsec’d. Notes, 144A | | | |
| 7.25% | | 12/15/12 | | B3 | | | 25 | | | 23,750 |
Community Health Systems, Inc., |
Gtd. Notes | | | | | | | | |
| 8.875% | | 07/15/15 | | B3 | | | 215 | | | 219,031 |
Elan Finance PLC, (Ireland) | | | |
Gtd. Notes | | | |
| 7.75% | | 11/15/11 | | B3 | | | 100 | | | 94,000 |
| 8.869%(c) | | 11/15/11 | | B3 | | | 30 | | | 28,500 |
Fresenius Medical Care Capital Trust II, |
Gtd. Notes | | | | | | | | |
| 7.875% | | 02/01/08 | | B1 | | | 150 | | | 150,000 |
Hanger Orthopedic Group, Inc., |
Gtd. Notes | | | | | | | | |
| 10.25% | | 06/01/14 | | Caa1 | | | 75 | | | 76,875 |
HCA, Inc., |
Notes | | | | | | | | |
| 9.00% | | 12/15/14 | | Caa1 | | | 50 | | | 48,199 |
Sec’d. Notes | | | |
9.125% | | 11/15/14 | | B2 | | | 150 | | | 156,000 |
| 9.25% | | 11/15/16 | | B2 | | | 525 | | | 551,250 |
LifePoint Hospitals, Inc., |
Sr. Sub. Notes, CVT | | | | | | | | |
| 3.50% | | 05/15/14 | | B(d) | | | 1,000 | | | 888,750 |
LVB Acquisition Merger Sub, Inc., | | | |
Gtd. Notes, 144A | | | | | | |
| 10.00% | | 10/15/17 | | B3 | | | 75 | | | 76,500 |
| 11.625% | | 10/15/17 | | Caa1 | | | 125 | | | 123,125 |
Omega Healthcare Investors, Inc., |
Gtd. Notes | | | | | | | | |
| 7.00% | | 04/01/14 | | Ba3 | | | 50 | | | 49,500 |
PTS Acquisition Corp., |
Gtd. Notes, PIK, 144A | | | | | | |
| 9.50% | | 04/15/15 | | Caa1 | | | 75 | | | 69,563 |
SEE NOTES TO FINANCIAL STATEMENTS.
A8
| | | | |
| | | DIVERSIFIED CONSERVATIVE GROWTH PORTFOLIO (Continued) | | |
SCHEDULE OF INVESTMENTS | December 31, 2007 |
| | | | | | | | | | |
Interest
Rate
| | Maturity
Date
| | Moody’s
Ratings
(Unaudited)
| | Principal
Amount
(000)#
| | Value
(Note 2)
|
| | | | | | | | | | | |
| CORPORATE BONDS (continued) | | | |
Healthcare & Pharmaceuticals (cont’d.) | | | |
Res-Care, Inc., |
Sr. Notes | | | | | | | | |
| 7.75% | | 10/15/13 | | B1 | | $ | 100 | | $ | 99,000 |
Select Medical Corp., |
Gtd. Notes | | | | | | | | |
| 7.625% | | 02/01/15 | | B3 | | | 20 | | | 17,100 |
Senior Housing Properties Trust, |
Sr. Notes |
| 7.875% | | 04/15/15 | | Ba1 | | | 83 | | | 86,596 |
Sr. Unsec’d. Notes |
| 8.625% | | 01/15/12 | | Ba1 | | | 75 | | | 79,500 |
Skilled HealthCare Group, |
Gtd. Notes | | | | | | | | |
| 11.00% | | 01/15/14 | | Caa1 | | | 78 | | | 83,460 |
Sun Healthcare Group, Inc., | | | |
Gtd. Notes | | | | | | | | |
| 9.125% | | 04/15/15 | | B3 | | | 75 | | | 75,563 |
Surgical Care Affiliates, Inc., |
Sr. Sub. Notes, 144A | | | | | | |
| 10.00% | | 07/15/17 | | Caa1 | | | 50 | | | 45,500 |
Ventas Realty LP/ Ventas Capital Corp., | | | |
Gtd. Notes | | | | | | | | |
| 8.75% | | 05/01/09 | | Ba1 | | | 65 | | | 66,625 |
| 9.00% | | 05/01/12 | | Ba1 | | | 75 | | | 80,625 |
Viant Holdings, Inc., |
Gtd. Notes, 144A | | | | | | | | |
| 10.125% | | 07/15/17 | | Caa1 | | | 183 | | | 167,445 |
| | | | | | | | | |
|
|
| | | | | | | | | | | 3,616,707 |
| | | | | | | | | |
|
|
Insurance — 0.4% |
ASIF III Jersey Ltd., MTN, |
Sec’d. Notes (Japan) | | | | | | |
| 0.95% | | 07/15/09 | | Aa2 | | JPY | 60,000 | | | 534,904 |
| | | | | | | | | |
|
|
Lodging — 0.3% | | | | | | |
Felcor Lodging LP, |
Gtd. Notes | | | | | | | | |
| 8.50% | | 06/01/11 | | Ba3 | | | 50 | | | 52,125 |
Host Marriott LP, |
Gtd. Notes | | | |
| 7.00% | | 08/15/12 | | Ba1 | | | 100 | | | 100,000 |
| 7.125% | | 11/01/13 | | Ba1 | | | 85 | | | 85,638 |
Sec’d. Notes | | | | | | | | |
| 6.75% | | 06/01/16 | | Ba1 | | | 75 | | | 73,875 |
Royal Caribbean Cruises Ltd., |
Sr. Notes (Liberia) | | | | | | | | |
| 8.00% | | 05/15/10 | | Ba1 | | | 50 | | | 51,691 |
| | | | | | | | | |
|
|
| | | | | | | | | | | 363,329 |
| | | | | | | | | |
|
|
Media & Entertainment — 2.1% | | | |
AMC Entertainment, Inc., |
Gtd. Notes | | | | | | | | |
| 8.625% | | 08/15/12 | | Ba3 | | | 75 | | | 76,500 |
| 11.00% | | 02/01/16 | | B2 | | | 35 | | | 36,838 |
Sr. Sub. Notes | | | | | | | | |
| 8.00% | | 03/01/14 | | B2 | | | 35 | | | 32,900 |
| | | | | | | | | | |
Interest
Rate
| | Maturity
Date
| | Moody’s
Ratings
(Unaudited)
| | Principal
Amount
(000)#
| | Value
(Note 2)
|
| | | | | | | | | | | |
| CORPORATE BONDS (continued) | | | |
Media & Entertainment (cont’d.) | | | |
Cinemark, Inc., |
Sr. Disc. Notes, Zero coupon (until 03/15/99) | | | |
| 9.75%(v) | | 03/15/14 | | B3 | | $ | 25 | | $ | 23,281 |
Clear Channel Communications, Inc., |
Debs. |
| 6.875% | | 06/15/18 | | Baa3 | | | 25 | | | 20,054 |
Sr. Notes | | | | | | | | |
| 5.75% | | 01/15/13 | | Baa3 | | | 75 | | | 62,103 |
Dex Media West LLC/Dex Media Finance Co., |
Gtd. Notes | | | | | | | | |
| 9.875% | | 08/15/13 | | B1 | | | 159 | | | 165,360 |
Dex Media, Inc., |
Sr. Unsec’d. Notes | | | | | | | | |
| 8.00% | | 11/15/13 | | B2 | | | 70 | | | 65,800 |
DirecTV Holdings LLC, |
Gtd. Notes | | | | | | | | |
| 6.375% | | 06/15/15 | | Ba3 | | | 77 | | | 73,920 |
Echostar DBS Corp., |
Gtd. Notes |
| 6.625% | | 10/01/14 | | Ba3 | | | 50 | | | 49,750 |
| 7.125% | | 02/01/16 | | Ba3 | | | 150 | | | 153,000 |
Idearc, Inc., |
Gtd. Notes | | | | | | | | |
| 8.00% | | 11/15/16 | | B2 | | | 115 | | | 105,513 |
Intelsat Bermuda Ltd., (Bermuda) |
Gtd. Notes |
| 9.25% | | 06/15/16 | | B2 | | | 25 | | | 25,125 |
Sr. Unsec’d. Notes |
| 11.25% | | 06/15/16 | | Caa1 | | | 125 | | | 129,062 |
Intelsat Subsidiary Holding Co. Ltd., |
Gtd. Notes (Bermuda) | | | | | | | | |
| 8.25% | | 01/15/13 | | B2 | | | 140 | | | 140,700 |
Lamar Media Corp., |
Sr. Sub. Notes, 144A | | | | | | |
| 6.625% | | 08/15/15 | | Ba3 | | | 125 | | | 121,562 |
LIN Television Corp., | | | |
Gtd. Notes | | | |
6.50% | | 05/15/13 | | B1 | | | 50 | | | 47,063 |
Medianews Group, Inc., |
Sr. Sub. Notes | | | | | | | | |
| 6.875% | | 10/01/13 | | B3 | | | 75 | | | 46,875 |
Morris Publishing Group LLC, | | | |
Gtd. Notes | | | |
| 7.00% | | 08/01/13 | | B1 | | | 25 | | | 18,156 |
Quebecor Media, Inc., Sr. | | | |
Unsec’d. Notes, 144A (Canada) | | | |
| 7.75% | | 03/15/16 | | B2 | | | 175 | | | 168,000 |
R.H. Donnelley Corp., | | | |
Sr. Notes | | | |
| 8.875% | | 01/15/16 | | B3 | | | 25 | | | 23,375 |
Sr. Notes, 144A | | | |
| 8.875% | | 10/15/17 | | B3 | | | 50 | | | 46,250 |
Radio One, Inc., | | | |
Gtd. Notes | | | |
| 8.875% | | 07/01/11 | | B3 | | | 75 | | | 70,219 |
SEE NOTES TO FINANCIAL STATEMENTS.
A9
| | | | |
| | | DIVERSIFIED CONSERVATIVE GROWTH PORTFOLIO (Continued) | | |
SCHEDULE OF INVESTMENTS | December 31, 2007 |
| | | | | | | | | | |
Interest
Rate
| | Maturity
Date
| | Moody’s
Ratings
(Unaudited)
| | Principal
Amount
(000)#
| | Value
(Note 2)
|
| | | | | | | | | | | |
| CORPORATE BONDS (continued) | | | |
Media & Entertainment (cont’d.) | | | |
Time Warner, Inc., | | | |
Gtd. Notes | | | |
| 5.109%(c) | | 11/13/09 | | Baa2 | | $ | 800 | | $ | 780,318 |
Universal City Florida Holding Co., | | | |
Sr. Notes | | | |
| 8.375% | | 05/01/10 | | B3 | | | 75 | | | 75,375 |
Univision Communications, Inc., | | | |
Gtd. Notes, PIK, 144A | | | |
| 9.75% | | 03/15/15 | | B3 | | | 100 | | | 91,125 |
| | | | | | | | | |
|
|
| | | | | | | | | | | 2,648,224 |
| | | | | | | | | |
|
|
Metals — 0.9% | | | |
AK Steel Corp., | | | |
Gtd. Notes | | | |
7.75% | | 06/15/12 | | B1 | | | 50 | | | 50,250 |
Aleris International, Inc., | | | |
Gtd. Notes | | | |
10.00% | | 12/15/16 | | Caa1 | | | 50 | | | 40,500 |
Gtd. Notes, PIK | | | |
9.00% | | 12/15/14 | | B3 | | | 25 | | | 20,875 |
Arch Western Finance LLC, | | | |
Gtd. Notes | | | |
6.75% | | 07/01/13 | | B1 | | | 50 | | | 48,500 |
Century Aluminum Co., | | | |
Gtd. Notes | | | |
7.50% | | 08/15/14 | | B1 | | | 50 | | | 49,250 |
CSN Islands VII Corp., | | | |
Gtd. Notes, 144A (Cayman Islands) | | | |
| 10.75% | | 09/12/08 | | BB(d) | | | 80 | | | 82,400 |
FMG Finance Pty Ltd., | | | |
Sec’d. Notes, 144A (Australia) | | | |
| 10.00% | | 09/01/13 | | B1 | | | 40 | | | 43,800 |
Freeport-McMoRan Copper & Gold, Inc., | | | |
Sr. Unsec’d. Notes | | | |
| 8.375% | | 04/01/17 | | Ba3 | | | 200 | | | 214,500 |
| 8.394%(c) | | 04/01/15 | | Ba3 | | | 50 | | | 50,750 |
Gerdau Ameristeel Corp. / Gusap Partners, | | | |
Gtd. Notes (Canada) | | | |
| 10.375% | | 07/15/11 | | Ba1 | | | 100 | | | 105,250 |
Ispat Inland ULC, | | | |
Gtd. Notes (Canada) | | | |
| 9.75% | | 04/01/14 | | Baa2 | | | 159 | | | 172,271 |
Metals USA, Inc., | | | |
Sec’d. Notes | | | |
| 11.125% | | 12/01/15 | | B3 | | | 125 | | | 129,375 |
PNA Group, Inc., | | | |
Sr. Unsec’d. Notes | | | |
| 10.75% | | 09/01/16 | | B3 | | | 50 | | | 47,000 |
Ryerson, Inc., | | | |
Sec’d. Notes, 144A | | | |
| 12.00% | | 11/01/15 | | B2 | | | 100 | | | 98,750 |
| | | | | | | | | |
|
|
| | | | | | | | | | | 1,153,471 |
| | | | | | | | | |
|
|
Non-Captive Finance — 0.5% | | | |
General Motors Acceptance Corp., | | | |
Bonds | | | |
| 8.00% | | 11/01/31 | | Ba3 | | | 300 | | | 251,662 |
| | | | | | | | | | |
Interest
Rate
| | Maturity
Date
| | Moody’s
Ratings
(Unaudited)
| | Principal
Amount
(000)#
| | Value
(Note 2)
|
| | | | | | | | | | | |
| CORPORATE BONDS (continued) | | | |
Non-Captive Finance (cont’d.) | | | |
Notes | | | |
| 6.875% | | 09/15/11 | | Ba3 | | $ | 150 | | $ | 128,324 |
Unsub. Notes | | | |
| 6.875% | | 08/28/12 | | Ba3 | | | 260 | | | 217,871 |
Residential Capital LLC, | | | |
Gtd. Notes | | | |
| 7.875% | | 06/30/10 | | Ba3 | | | 95 | | | 60,800 |
| 8.00% | | 06/01/12 | | Ba3 | | | 75 | | | 46,125 |
| | | | | | | | | |
|
|
| | | | | | | | | | | 704,782 |
| | | | | | | | | |
|
|
Packaging — 0.8% | | | |
Ball Corp.,
Gtd. Notes | | | |
| 6.625% | | 03/15/18 | | Ba1 | | | 100 | | | 99,250 |
Berry Plastics Holding Corp., | | | |
Sec’d. Notes | | | |
| 8.875% | | 09/15/14 | | B3 | | | 125 | | | 118,750 |
BWAY Corp., | | | |
Gtd. Notes | | | | | | | | |
| 10.00% | | 10/15/10 | | B3 | | | 55 | | | 54,450 |
Crown Americas LLC / Crown Americas Capital Corp., | | | |
Gtd. Notes | | | |
| 7.625% | | 11/15/13 | | B1 | | | 100 | | | 102,250 |
| 7.75% | | 11/15/15 | | B1 | | | 75 | | | 77,250 |
Exopac Holding Corp., | | | |
Gtd. Notes | | | |
| 11.25% | | 02/01/14 | | B3 | | | 75 | | | 73,500 |
Graham Packaging Co., Inc., | | | |
Gtd. Notes | | | |
| 8.50% | | 10/15/12 | | Caa1 | | | 60 | | | 56,100 |
| 9.875% | | 10/15/14 | | Caa1 | | | 25 | | | 23,000 |
Greif, Inc., | | | |
Sr. Unsec’d. Notes | | | | | | | | |
| 6.75% | | 02/01/17 | | Ba2 | | | 175 | | | 171,062 |
Owens-Brockway Glass Container, Inc., | | | |
Gtd. Notes | | | | | | | | |
| 8.25% | | 05/15/13 | | B3 | | | 125 | | | 129,688 |
Silgan Holdings, Inc., | | | |
Sr. Sub. Notes | | | | | | | | |
| 6.75% | | 11/15/13 | | B1 | | | 90 | | | 87,300 |
| | | | | | | | | |
|
|
| | | | | | | | | | | 992,600 |
| | | | | | | | | |
|
|
Paper — 0.5% | | | |
Cascades, Inc., | | | |
Sr. Notes (Canada) | | | | | | | | |
| 7.25% | | 02/15/13 | | Ba3 | | | 85 | | | 79,687 |
Catalyst Paper Corp., | | | |
Gtd. Notes (Canada) | | | | | | |
| 8.625% | | 06/15/11 | | B2 | | | 85 | | | 70,550 |
Domtar, Inc., | | | |
Gtd. Notes | | | | | | | | |
| 7.875% | | 10/15/11 | | B+(d) | | | 25 | | | 25,531 |
Georgia-Pacific Corp., | | | |
Gtd. Notes, 144A | | | |
| 7.125% | | 01/15/17 | | Ba3 | | | 50 | | | 48,625 |
Sr. Unsec’d. Notes | | | |
| 8.125% | | 05/15/11 | | B2 | | | 30 | | | 30,450 |
SEE NOTES TO FINANCIAL STATEMENTS.
A10
| | | | |
| | | DIVERSIFIED CONSERVATIVE GROWTH PORTFOLIO (Continued) | | |
SCHEDULE OF INVESTMENTS | December 31, 2007 |
| | | | | | | | | | |
Interest
Rate
| | Maturity
Date
| | Moody’s
Ratings
(Unaudited)
| | Principal
Amount
(000)#
| | Value
(Note 2)
|
| | | | | | | | | | | |
| CORPORATE BONDS (continued) | | | |
Paper (cont’d.) | | | |
Graphic Packaging International Corp., | | | |
Gtd. Notes | | | | | | | | |
| 8.50% | | 08/15/11 | | B2 | | $ | 100 | | $ | 99,000 |
NewPage Corp., | | | |
Sec’d. Notes, 144A | | | | | | | | |
| 10.00% | | 05/01/12 | | B2 | | | 50 | | | 50,250 |
Norampac, Inc., | | | |
Gtd. Notes (Canada) | | | | | | | | |
| 6.75% | | 06/01/13 | | Ba3 | | | 30 | | | 27,375 |
Smurfit-Stone Container Enterprises, Inc., | | | |
Sr. Notes | | | | | | | | |
| 8.375% | | 07/01/12 | | B3 | | | 70 | | | 69,475 |
Sr. Unsec’d. Notes | | | |
| 8.00% | | 03/15/17 | | B3 | | | 55 | | | 53,144 |
Verso Paper Holdings LLC/Verson Paper, Inc., |
Gtd. Notes | | | |
| 11.375% | | 08/01/16 | | B3 | | | 25 | | | 25,375 |
Sec’d. Notes | | | |
| 8.661%(c) | | 08/01/14 | | B2 | | | 25 | | | 24,375 |
| | | | | | | | | |
|
|
| | | | | | | | | | | 603,837 |
| | | | | | | | | |
|
|
Pipelines & Other — 1.3% | | | |
AmeriGas Partners LP / AmeriGas Eagle Finance Co., | | | |
Sr. Unsec’d. Notes | | | | | | | | |
| 7.25% | | 05/20/15 | | B1 | | | 13 | | | 12,740 |
AmeriGas Partners LP/AmeriGas Eagle Finance Co., |
Sr. Notes | | | | | | | | |
| 7.125% | | 05/20/16 | | B1 | | | 50 | | | 48,500 |
El Paso Corp., | | | |
Sr. Notes | | | |
| 7.75% | | 01/15/32 | | Ba3 | | | 75 | | | 76,131 |
Sr. Unsec’d. Notes | | | | | | |
| 7.00% | | 05/15/11 | | Ba3 | | | 250 | | | 254,652 |
| 7.80% | | 08/01/31 | | Ba3 | | | 100 | | | 101,486 |
Inergy LP Inergy Finance Corp., | | | |
Sr. Unsec’d. Notes | | | | | | | | |
| 6.875% | | 12/15/14 | | B1 | | | 50 | | | 48,625 |
Kinder Morgan Finance Co. ULC, (Canada) | | | |
Gtd. Notes | | | |
| 5.70% | | 01/05/16 | | Ba2 | | | 25 | | | 22,630 |
| 6.40% | | 01/05/36 | | Ba2 | | | 50 | | | 41,293 |
Targa Resources, Inc., | | | |
Gtd. Notes, 144A | | | | | | | | |
| 8.50% | | 11/01/13 | | B3 | | | 125 | | | 120,625 |
Transocean, Inc., | | | |
Sr. Unsec’d. Notes (Cayman Islands) | | | |
| 5.341%(c) | | 09/05/08 | | Baa2 | | | 200 | | | 199,003 |
Williams Cos., Inc. (cost $350,000; purchased 09/08/05), |
Notes, 144A(f)(g) | | | | | | | | |
| 6.375% | | 10/01/10 | | Ba2 | | | 350 | | | 353,937 |
Williams Cos., Inc., | | | |
Sr. Unsec’d. Notes | | | |
| 7.125% | | 09/01/11 | | Baa3 | | | 225 | | | 237,656 |
| 8.125% | | 03/15/12 | | Baa3 | | | 65 | | | 70,769 |
Williams Partners LP / Williams Partners Finance Co., | | | |
Sr. Unsec’d. Notes | | | | | | | | |
| 7.25% | | 02/01/17 | | Ba3 | | | 100 | | | 103,000 |
| | | | | | | | | |
|
|
| | | | | | | | | | | 1,691,047 |
| | | | | | | | | |
|
|
| | | | | | | | | | |
Interest
Rate
| | Maturity
Date
| | Moody’s
Ratings
(Unaudited)
| | Principal
Amount
(000)#
| | Value
(Note 2)
|
| | | | | | | | | | | |
| CORPORATE BONDS (continued) | | | |
Real Estate Investment Trusts — 0.2% | | | |
iStar Financial, Inc., | | | |
Sr. Unsec’d. Notes | | | | | | | | |
| 5.80% | | 03/15/11 | | Baa2 | | $ | 100 | | $ | 89,584 |
Nationwide Health Properties, Inc., | | | |
Unsec’d. Notes | | | | | | | | |
| 6.50% | | 07/15/11 | | Baa3 | | | 100 | | | 104,431 |
| | | | | | | | | |
|
|
| | | | | | | | | | | 194,015 |
| | | | | | | | | |
|
|
Retailers — 0.4% | | | |
Couche-Tard Finance Corp., | | | |
Sr. Sub. Notes | | | | | | | | |
| 7.50% | | 12/15/13 | | Ba2 | | | 25 | | | 24,937 |
GSC Holdings Corp., | | | |
Gtd. Notes | | | |
| 8.00% | | 10/01/12 | | Ba3 | | | 75 | | | 78,094 |
Neiman Marcus Group, Inc., | | | |
Gtd. Notes, PIK | | | |
| 9.00% | | 10/15/15 | | B2 | | | 120 | | | 123,750 |
Pantry, Inc., (The), | | | |
Gtd. Notes | | | |
| 7.75% | | 02/15/14 | | B3 | | | 55 | | | 50,600 |
Rite Aid Corp., | | | |
Sec’d. Notes | | | |
| 8.125% | | 05/01/10 | | B3 | | | 175 | | | 171,500 |
Susser Holdings LLC, | | | |
Gtd. Notes | | | |
| 10.625% | | 12/15/13 | | B3 | | | 36 | | | 37,260 |
Sr. Notes, 144A | | | | | | | | |
| 10.625% | | 12/15/13 | | B3 | | | 40 | | | 41,400 |
| | | | | | | | | |
|
|
| | | | | | | | | | | 527,541 |
| | | | | | | | | |
|
|
Technology — 0.9% | | | |
Amkor Technology, Inc., | | | |
Sr. Notes | | | |
| 7.125% | | 03/15/11 | | B1 | | | 25 | | | 23,813 |
Avago Technologies Finance (Singapore), | | | |
Gtd. Notes | | | |
| 10.125% | | 12/01/13 | | B2 | | | 60 | | | 62,775 |
| 11.875% | | 12/01/15 | | Caa1 | | | 50 | | | 53,437 |
First Data Corp. | | | | | | |
Gtd. Notes, 144A | | | | | | | | |
| 9.875% | | 09/24/15 | | B3 | | | 50 | | | 46,500 |
Flextronics International Ltd., | | | |
Sr. Sub. Notes (Singapore) | | | |
| 6.25% | | 11/15/14 | | Ba2 | | | 50 | | | 47,625 |
Freescale Semiconductor, Inc., | | | |
Gtd. Notes | | | |
| 8.875% | | 12/15/14 | | B2 | | | 25 | | | 22,313 |
Gtd. Notes, PIK | | | |
| 9.125% | | 12/15/14 | | B2 | | | 300 | | | 255,000 |
Iron Mountain, Inc., | | | |
Gtd. Notes | | | |
| 8.625% | | 04/01/13 | | B3 | | | 95 | | | 96,187 |
Nortel Networks Corp., | | | |
Gtd. Notes (Canada) | | | |
| 4.25% | | 09/01/08 | | B3 | | | 9 | | | 8,831 |
SEE NOTES TO FINANCIAL STATEMENTS.
A11
| | | | |
| | | DIVERSIFIED CONSERVATIVE GROWTH PORTFOLIO (Continued) | | |
SCHEDULE OF INVESTMENTS | December 31, 2007 |
| | | | | | | | | | |
Interest
Rate
| | Maturity
Date
| | Moody’s
Ratings
(Unaudited)
| | Principal
Amount
(000)#
| | Value
(Note 2)
|
| | | | | | | | | | | |
| CORPORATE BONDS (continued) | | | |
Technology (cont’d.) | | | |
Nortel Networks Ltd., | | | |
Gtd. Notes, 144A (Canada) | | | |
| 10.125% | | 07/15/13 | | B3 | | $ | 25 | | $ | 25,750 |
NXP BV / NXP Funding LLC, | | | |
Sec’d. Notes (Netherlands) | | | |
| 7.875% | | 10/15/14 | | Ba3 | | | 40 | | | 38,000 |
Open Solutions, Inc., | | | |
Gtd. Notes, 144A | | | |
| 9.75% | | 02/01/15 | | Caa1 | | | 50 | | | 45,563 |
Seagate Technology HDD Holdings (Cayman Islands), | | | |
Gtd. Notes | | | |
| 6.375% | | 10/01/11 | | Ba1 | | | 50 | | | 49,312 |
| 6.80% | | 10/01/16 | | Ba1 | | | 75 | | | 73,125 |
Sensata Technologies BV, | | | |
Gtd. Notes (Netherlands) | | | |
| 8.00% | | 05/01/14 | | B3 | | | 75 | | | 70,500 |
Serena Software, Inc., Gtd. Notes | | | |
| 10.375% | | 03/15/16 | | Caa1 | | | 145 | | | 142,825 |
STATS ChipPAC Ltd., | | | |
Sr. Notes (Singapore) | | | |
| 7.50% | | 07/19/10 | | Ba1 | | | 75 | | | 77,438 |
| | | | | | | | | |
|
|
| | | | | | | | | | | 1,138,994 |
| | | | | | | | | |
|
|
Telecom — 2.0% | | | |
Centennial Cellular Operating Co./Centennial Communications Corp.,
Gtd. Notes | | | |
| 10.125% | | 06/15/13 | | B2 | | | 25 | | | 26,250 |
Cincinnati Bell, Inc., | | | |
Gtd. Notes | | | |
| 8.375% | | 01/15/14 | | B2 | | | 45 | | | 43,875 |
Citizens Communications Co., | | | |
Sr. Unsec’d. Notes | | | |
| 6.25% | | 01/15/13 | | Ba2 | | | 40 | | | 38,750 |
| 9.00% | | 08/15/31 | | Ba2 | | | 15 | | | 14,963 |
| 9.25% | | 05/15/11 | | Ba2 | | | 75 | | | 81,187 |
Hawaiian Telcom Communications, Inc., | | | |
Gtd. Notes | | | |
| 12.50% | | 05/01/15 | | Caa1 | | | 75 | | | 77,437 |
Level 3 Financing, Inc., | | | |
Gtd. Notes | | | |
| 12.25% | | 03/15/13 | | Caa1 | | | 125 | | | 126,250 |
Nordic Telephone Co. Holdings ApS, | | | |
Sec’d. Notes, 144A (Denmark) | | | |
| 8.875% | | 05/01/16 | | B2 | | | 90 | | | 92,250 |
PAETEC Holding Corp., | | | |
Gtd. Notes, 144A | | | |
| 9.50% | | 07/15/15 | | Caa1 | | | 25 | | | 24,375 |
Qwest Communications International, Inc., | | | |
Debs. | | | |
| 6.875% | | 09/15/33 | | Ba1 | | | 100 | | | 92,250 |
Gtd. Notes | | | |
| 7.50% | | 02/15/14 | | Ba3 | | | 25 | | | 24,938 |
Sr. Notes | | | |
| 7.625% | | 06/15/15 | | Ba1 | | | 515 | | | 524,012 |
Sr. Unsec’d. Notes | | | |
| 7.50% | | 10/01/14 | | Ba1 | | | 50 | | | 50,750 |
| | | | | | | | | | |
Interest
Rate
| | Maturity
Date
| | Moody’s
Ratings
(Unaudited)
| | Principal
Amount
(000)#
| | Value
(Note 2)
|
| | | | | | | | | | | |
| CORPORATE BONDS (continued) | | | |
Telecom (cont’d.) | | | |
Rural Cellular Corp., | | | |
Sr. Unsec’d. Notes | | | |
| 9.875% | | 02/01/10 | | B3 | | $ | 45 | | $ | 46,687 |
Sprint Capital Corp., | | | |
Gtd. Notes | | | |
| 8.375% | | 03/15/12 | | Baa3 | | | 1,000 | | | 1,083,024 |
Time Warner Telecom Holdings, Inc., | | | |
Gtd. Notes | | | |
| 9.25% | | 02/15/14 | | B3 | | | 25 | | | 25,563 |
Windstream Corp., | | | |
Gtd. Notes | | | |
| 7.00% | | 03/15/19 | | Ba3 | | | 150 | | | 142,875 |
| 8.625% | | 08/01/16 | | Ba3 | | | 100 | | | 105,000 |
| | | | | | | | | |
|
|
| | | | | | | | | | | 2,620,436 |
| | | | | | | | | |
|
|
Telecommunications — 0.2% | | | |
BellSouth Corp.,
Sr. Unsec’d. Notes | | | |
| 4.969%(c) | | 08/15/08 | | A2 | | | 200 | | | 199,681 |
| | | | | | | | | |
|
|
Tobacco — 0.9% | | | |
Altria Group, Inc., | | | |
Sr. Unsec’d. Notes | | | |
| 7.00% | | 11/04/13 | | Baa1 | | | 1,000 | | | 1,118,337 |
| | | | | | | | | |
|
|
TOTAL CORPORATE BONDS
(cost $33,196,878) | | | 32,637,532 |
| | | | | | | | | |
|
|
U.S. GOVERNMENT MORTGAGE-BACKED OBLIGATIONS — 38.1% |
Federal Home Loan Mortgage Corp. |
| 5.00% | | 06/01/37 | | | | | 95 | | | 93,152 |
| 5.00% | | TBA | | | | | 1,900 | | | 1,852,500 |
| 5.50% | | 09/01/37 | | | | | 2,000 | | | 1,995,870 |
Federal National Mortgage Assoc. |
| 4.00% | | 08/01/18-06/01/20 | | | 5,144 | | | 4,939,008 |
| 4.50% | | 03/01/35-09/01/35 | | | 4,062 | | | 3,846,101 |
| 5.00% | | 01/01/19-02/01/36 | | | 146 | | | 145,388 |
| 5.00% | | TBA | | | | | 2,000 | | | 1,951,250 |
| 5.00% | | TBA | | | | | 3,000 | | | 2,925,000 |
| 5.09%(c) | | 02/01/36 | | | | | 333 | | | 335,567 |
| 5.50% | | 06/01/36 | | | | | 887 | | | 885,606 |
| 5.50% | | TBA | | | | | 1,000 | | | 998,750 |
| 5.626%(c) | | 05/01/36 | | | | | 163 | | | 164,503 |
| 6.00% | | 11/01/32-11/01/37 | | | 3,761 | | | 3,818,716 |
| 6.00% | | TBA | | | | | 3,000 | | | 3,045,936 |
| 6.269%(c) | | 08/01/29 | | | | | 31 | | | 31,102 |
| 6.50% | | 06/01/18-01/11/37 | | | 1,493 | | | 1,536,117 |
Government National Mortgage Assoc. |
| 5.00% | | 10/15/36 | | | | | 1,000 | | | 985,506 |
| 5.50% | | 11/15/28-12/15/37 | | | 6,967 | | | 7,017,058 |
| 5.50% | | TBA | | | | | 9,000 | | | 9,064,692 |
| 5.625%(c) | | 08/20/24 | | | | | 6 | | | 6,152 |
| 6.125% | | 10/20/27-11/20/29 | | | 47 | | | 47,541 |
| 6.375%(c) | | 04/20/27 | | | | | 62 | | | 62,700 |
| 6.50% | | TBA | | | | | 3,000 | | | 3,097,500 |
| 8.00% | | 08/20/31 | | | | | 5 | | | 5,009 |
| 8.50% | | 02/20/26-04/20/31 | | | 28 | | | 31,610 |
| | | | | | | | | |
|
|
TOTAL U.S. GOVERNMENT MORTGAGE-BACKED OBLIGATIONS
(cost $48,690,367) | | | 48,882,334 |
| | | | | | | | | |
|
|
SEE NOTES TO FINANCIAL STATEMENTS.
A12
| | | | |
| | | DIVERSIFIED CONSERVATIVE GROWTH PORTFOLIO (Continued) | | |
SCHEDULE OF INVESTMENTS | December 31, 2007 |
| | | | | | | | | | |
Interest
Rate
| | Maturity
Date
| | Moody’s
Ratings
(Unaudited)
| | Principal
Amount
(000)#
| | Value
(Note 2)
|
| | | | | | | | | | | |
| U.S. TREASURY OBLIGATIONS — 8.4% |
U.S. Treasury Bonds |
| 5.00% | | 05/15/37 | | | | $ | 3,500 | | $ | 3,814,727 |
| 8.125% | | 08/15/19 | | | | | 200 | | | 269,594 |
U.S. Treasury Inflationary Index Bonds, TIPS |
| 2.00% | | 04/15/12 | | | | | 100 | | | 106,713 |
| 2.00% | | 01/15/14 | | | | | 100 | | | 116,795 |
| 2.00% | | 07/15/14 | | | | | 400 | | | 458,093 |
| 2.00% | | 01/15/16 | | | | | 100 | | | 108,032 |
| 2.375% | | 04/15/11 | | | | | 100 | | | 109,721 |
| 2.375% | | 01/15/17 | | | | | 500 | | | 546,643 |
| 2.375% | | 01/15/25 | | | | | 300 | | | 349,104 |
| 2.50% | | 07/15/16 | | | | | 100 | | | 110,328 |
U.S. Treasury Notes |
| 4.25% | | 11/15/17 | | | | | 3,000 | | | 3,052,266 |
| 4.50% | | 11/15/15 | | | | | 300 | | | 312,586 |
| 4.75% | | 08/15/17 | | | | | 1,000 | | | 1,056,172 |
| 5.125% | | 05/15/16 | | | | | 300 | | | 324,703 |
| | | | | | | | | |
|
|
TOTAL U.S. TREASURY OBLIGATIONS
(cost $10,736,789) | | | 10,735,477 |
| | | | | | | | | |
|
|
| U.S. GOVERNMENT AGENCY OBLIGATIONS — 0.2% |
Small Business Administration Participation Certificates, |
Series 2000-20A, Class 1 |
| 7.59% | | 01/01/20 | | | | | 131 | | | 139,393 |
Series 2000-P10A, Class 1 |
| 8.017% | | 02/10/10 | | | | | 65 | | | 67,073 |
| | | | | | | | | |
|
|
TOTAL U.S. GOVERNMENT AGENCY OBLIGATIONS
(cost $196,762) | | | 206,466 |
| | | | | | | | | |
|
|
| COLLATERALIZED MORTGAGE OBLIGATIONS — 3.6% |
Bear Stearns Adjustable Rate Mortgage Trust, |
Series 2005-4, Class 23A2 |
| 5.373%(c) | | 05/25/35 | | Aaa | | | 147 | | | 143,077 |
Series 2005-5, Class A1 |
| 4.55% | | 08/25/35(c) | | Aaa | | | 428 | | | 422,982 |
Countrywide Alternative Loan Trust, |
Series 2006-0A7, Class A1A |
| 5.045%(c) | | 05/25/47 | | Aaa | | | 173 | | | 163,382 |
FHLMC Structured Pass-Through Securities, |
Series T-61, Class 1A1 |
| 6.263%(c) | | 07/25/44 | | Aaa | | | 457 | | | 457,237 |
Freddie Mac, |
Series 2266, Class F |
| 4.687%(c) | | 11/15/30 | | Aaa | | | 12 | | | 11,847 |
Series 2888, Class ZG |
| 4.50% | | 11/15/19 | | Aaa | | | 115 | | | 104,659 |
Series 3010, Class WB |
| 4.50% | | 07/15/20 | | Aaa | | | 1,000 | | | 956,447 |
Government National Mortgage Assoc., |
Series 2000-15, Class Z |
| 7.50% | | 02/20/30 | | Aaa | | | 230 | | | 240,509 |
Greenpoint Mortgage Funding Trust,
Series 2006-AR6, Class A1A | | | |
| 4.945%(c) | | 10/25/46 | | Aaa | | | 145 | | | 141,825 |
Impac Secured Assets CMN Owner
Trust, Series 2006-4, Class A2A | | | | | | |
| 4.945%(c) | | 01/25/37 | | Aaa | | | 115 | | | 112,764 |
| | | | | | | | | | | |
Interest
Rate
| | Maturity
Date
| | Moody’s
Ratings
(Unaudited)
| | Principal
Amount
(000)#
| | | Value
(Note 2)
|
| | | | | | | | | | | | |
| COLLATERALIZED MORTGAGE OBLIGATIONS (continued) |
Merrill Lynch Floating Trust,
(cost $168,364; purchased 10/31/06)
Series 2006-1, Class A1,144A(f)(g) |
| 4.307%(c) | | 06/15/22 | | Aaa | | $ | 168 | | | $ | 163,342 |
Merrill Lynch Mortgage Investors, Inc., Series 2005-A10, Class A | | | | | | | |
| 5.075%(c) | | 02/25/36 | | Aaa | | | 105 | | | | 101,082 |
Structured Asset Mortgage Investments, Inc.,
Series 2005-AR8, Class A1 | | | | |
| 5.145%(c) | | 02/25/36 | | Aaa | | | 419 | | | | 398,331 |
Thornburg Mortgage Securities Trust,
Series 2006-2, Class A1C | | | | |
| 4.985%(c) | | 03/25/46 | | Aaa | | | 200 | | | | 196,512 |
Washington Mutual, Inc.,
Series 2002-AR17, Class 1A | | | | |
| 5.988%(c) | | 11/25/42 | | Aaa | | | 76 | | | | 73,255 |
Series 2003-R1, Class A1 | | | | | | | |
| 5.405%(c) | | 12/25/27 | | Aaa | | | 586 | | | | 559,823 |
Series 2005-AR6, Class 2AB1 | | | | | | | |
| 5.063%(c) | | 04/25/45 | | Aaa | | | — | (r) | | | 698 |
Series 2005-AR13, Class A1A1 | | | | | | | |
| 5.155%(c) | | 10/25/45 | | Aaa | | | 115 | | | | 107,961 |
Series 2006-AR17, Class 2A | | | | | | | |
| 5.883%(c) | | 12/25/46 | | Aaa | | | 176 | | | | 173,663 |
Series 2006-AR17, Class1A1A | | | | | | | |
| 5.673%(c) | | 12/25/46 | | Aaa | | | 155 | | | | 145,516 |
| | | | | | | | | | |
|
|
TOTAL COLLATERALIZED MORTGAGE OBLIGATIONS
(cost $4,658,509) | | | | 4,674,912 |
| | | | | | | | | | |
|
|
| FOREIGN GOVERNMENT BONDS — 1.9% |
Development Bank of Japan (Japan) | | | | |
| 1.75% | | 06/21/10 | | Aaa | | JPY | 10,000 | | | | 91,534 |
Republic of Panama (Panama) | | | | | | | |
| 9.625% | | 02/08/11 | | Ba1 | | | 150 | | | | 168,375 |
United Kingdom Treasury Stock (United Kingdom) | | | | |
| 4.25% | | 03/07/11 | | Aaa | | GBP | 300 | | | | 594,339 |
| 5.00% | | 03/07/12 | | Aaa | | GBP | 100 | | | | 203,649 |
| 5.00% | | 09/07/14 | | Aaa | | GBP | 700 | | | | 1,431,965 |
| | | | | | | | | | |
|
|
TOTAL FOREIGN GOVERNMENT BONDS (cost $2,331,452) | | | | 2,489,862 |
| | | | | | | | | | |
|
|
| ASSET-BACKED SECURITIES — 0.1% |
Asset Backed Securities Corp. Home Equity,
Series 2004-HE6, Class A1 | | | | |
| 5.14%(c) | | 09/25/34 | | Aaa | | | 21 | | | | 20,573 |
WFS Financial Owner Trust,
Series 2005-1, Class A3 | | | | | | | |
| 3.59% | | 10/19/09 | | Aaa | | | 74 | | | | 74,272 |
| | | | | | | | | | |
|
|
TOTAL ASSET-BACKED SECURITIES
(cost $94,407) | | | | 94,845 |
| | | | | | | | | | |
|
|
| MUNICIPAL BONDS — 0.8% |
Buckeye Tobacco Settlement Financing Authority | | | | |
| 5.875% | | 06/01/47 | | Baa3 | | | 500 | | | | 476,905 |
Massachusetts Water Resources Authority,
Series J(l) | | | | |
| 5.00% | | 08/01/32 | | Aaa | | | 250 | | | | 256,430 |
SEE NOTES TO FINANCIAL STATEMENTS.
A13
| | | | |
| | | DIVERSIFIED CONSERVATIVE GROWTH PORTFOLIO (Continued) | | |
SCHEDULE OF INVESTMENTS | December 31, 2007 |
| | | | | | | | | | |
Interest
Rate
| | Maturity
Date
| | Moody’s
Ratings
(Unaudited)
| | Principal
Amount
(000)#
| | Value
(Note 2)
|
| | | | | | | | | | | |
| MUNICIPAL BONDS (continued) |
Tobacco Settlement Financing Corp., Series 2001 | | | |
| 5.875% | | 05/15/39 | | Baa3 | | $ | 290 | | $ | 278,560 |
| | | | | | | | | |
|
|
TOTAL MUNICIPAL BONDS
(cost $962,621) | | | | | | 1,011,895 |
| | | | | | | | | |
|
|
| BANK NOTES — 0.8% | | | | | | |
Chrysler Financial, Term, 144A (cost $1,042,388;
purchased 11/28/07)(f)(g) |
| 9.00% | | 08/03/14 | | Ba- | | | 1,097 | | | 1,053,111 |
(cost $1,042,660) | | | | | | | | |
| | | | | | | | | |
|
|
TOTAL LONG-TERM INVESTMENTS
(cost $141,697,997) | | | 152,182,289 |
| | | | | | | | | |
|
|
| SHORT-TERM INVESTMENTS — 7.9% | | | |
| U.S. TREASURY OBLIGATIONS — 0.7% |
U.S. Treasury Bills(k)(n) | | | | | | |
| 2.955% | | 03/13/08 | | | | | 315 | | | 313,090 |
| 2.98% | | 03/13/08 | | | | | 500 | | | 496,967 |
| | | | | | | | | |
|
|
TOTAL U.S. TREASURY OBLIGATIONS
(cost $810,178) | | | 810,057 |
| | | | | | | | | |
|
|
| | | | | | | | | |
| | | | |
| | | | | | | Notional
Amount
(000)
| | |
| | | | | | | | | | |
| OUTSTANDING OPTIONS PURCHASED* — 0.6% |
Call Options — 0.6% | | | | | |
5 Year U.S. Treasury Futures,
expiring 02/22/2008,
Strike Price $126.00 | | | 1,400 | | 219 |
expiring 02/22/2008,
Strike Price $126.50 | | | 3,300 | | 516 |
expiring 02/22/2008,
Strike Price $127.00 | | | 5,300 | | 828 |
20 Year U.S. Treasury Note Futures, | | | | | |
expiring 02/22/2008,
Strike Price $136.00 | | | 1,300 | | 203 |
expiring 02/22/2008,
Strike Price $141.00 | | | 6,800 | | 1,062 |
Currency Option, on USD vs JPY,
expiring 09/16/2008
@ FX Rate 118.00 | | | 600 | | 1,183 |
Eurodollar Futures, | | | | | |
expiring 03/17/2008,
Strike Price $95.25 | | | 51,000 | | 66,937 |
expiring 06/16/2008,
Strike Price $95.25 | | | 47,000 | | 118,381 |
Interest Rate Swap Option,
expiring 12/19/2008 @ 4.50% | | | 7,000 | | 119,394 |
expiring 12/31/2008 @ 3.75% | | | 4,900 | | 42,232 |
expiring 04/20/2009 @ 4.18% | | EUR | 21,800 | | 108,322 |
Swap on 3 Month LIBOR,
expiring 09/19/2008 @ 4.55% | | | 8,400 | | 152,788 |
expiring 09/26/2008 @ 4.75% | | | 7,800 | | 165,367 |
| | | | | | | | | |
|
| | | | | | 777,432 |
| | | | | |
|
Put Options | | | | | |
10 Year U.S. Treasury Note Futures, | | | | | |
expiring 02/22/2008,
Strike Price $102.00 | | | 2,200 | | 344 |
| | | | | | | | | | |
| | | | | | | Notional
Amount
(000)
| | Value
(Note 2)
|
| | | | | | | | | | | |
Put Options (cont’d.) | | | | | | |
EURO-BOBL | | | | | | |
expiring 02/22/2008,
Strike Price $102.25 | | EUR | 4,300 | | $ | — |
Eurodollar Futures, | | | | | | |
expiring 03/17/2008,
Strike Price $92.50 | | | 25,000 | | | 156 |
expiring 06/16/2008,
Strike Price $92.50 | | | 12,000 | | | 75 |
FNMA | | | | | | |
expiring 01/07/2008,
Strike Price $81.00 | | | 2,000 | | | — |
expiring 01/07/2008,
Strike Price $85.00 | | | 2,000 | | | — |
expiring 01/07/2008,
Strike Price $88.00 | | | 5,000 | | | — |
expiring 01/07/2008,
Strike Price $91.00 | | | 1,189 | | | — |
GNMA, | | | | | | |
expiring 03/13/2008,
Strike Price $85.00 | | | 9,000 | | | 306 |
| | | | | | | | | |
|
|
| | | | | | | 881 |
| | | | | | | | | |
|
|
TOTAL OUTSTANDING OPTIONS PURCHASED
(cost $468,938) | | | 778,313 |
| | | | | | �� | | | |
|
|
| | | | | | | | | |
| | | | |
Interest
Rate
| | Maturity
Date
| |
| | Principal
Amount
(000)#
| | Value
(Note 2)
|
| | | | | | | | | | |
| REPURCHASE AGREEMENT — 1.0% |
U.S. Treasury Repurchase Agreement, dated 12/31/07, maturing 01/02/08, repurchase price $1,300,072 (collateralized by U.S. Treasury Inflation Index Note, 2.375%, par value $1,140,000, market value including interest $1,344,042)
(cost $1,300,000) | | |
| 1.00% | | | | | | | $ 1,300 | | 1,300,000 |
| | | | | | | | | |
|
| | | | |
| | | | | | | Shares
| | |
| AFFILIATED MONEY MARKET MUTUAL FUND — 4.6% |
Dryden Core Investment Fund —Taxable Money Market Series
(cost $5,872,899)(w) | | | 5,872,899 | | 5,872,899 |
| | | | | | | | | |
|
| | | | |
| | | | | | | Principal
Amount
(000)#
| | |
| COMMERCIAL PAPER — 1.0% | | |
Federal Home Loan Mortgage Corp. (cost $1,299,892) | | | | | | | |
3.00% | | 01/02/08 | | | | $ | 1,300 | | 1,299,892 |
| | | | | | | | | |
|
TOTAL SHORT-TERM INVESTMENTS
(cost $9,751,907) | | 10,061,161 |
| | | | | | | | | |
|
TOTAL INVESTMENTS, BEFORE OUTSTANDING OPTIONS WRITTEN AND SECURITIES SOLD SHORT — 126.6%
(cost $151,449,904; Note 6) | | 162,243,450 |
| | | | | | | | | |
|
SEE NOTES TO FINANCIAL STATEMENTS.
A14
| | | | |
| | | DIVERSIFIED CONSERVATIVE GROWTH PORTFOLIO (Continued) | | |
SCHEDULE OF INVESTMENTS | December 31, 2007 |
| | | | | | | | | | | |
| | | | |
Interest
Rate
| | Maturity
Date
| | Moody’s
Ratings
(Unaudited)
| | Principal
Amount
(000)#
| | Value
(Note 2)
| |
| SECURITY SOLD SHORT — (10.9)% | |
U.S. Treasury Obligations | | | | |
U.S. Treasury Notes | | | | | | | | | |
| 3.625% | | 05/15/13 | | | | $ | 1,100 | | $ | (1,107,562 | ) |
U.S. Treasury Notes | | | | | | | | | |
| 4.25% | | 11/15/14 | | | | | 4,900 | | | (5,055,041 | ) |
U.S. Treasury Notes | | | | | | | | | |
| 4.25% | | 11/15/17 | | | | | 2,000 | | | (2,034,844 | ) |
U.S. Treasury Bonds | | | | | | | | | |
| 4.75% | | 08/15/17 | | | | | 1,000 | | | (1,056,172 | ) |
U.S. Treasury Notes | | | | | | | | | |
| 4.625% | | 02/15/17 | | | | | 4,500 | | | (4,704,611 | ) |
| | | | | | | | | |
|
|
|
| |
TOTAL SECURITY SOLD SHORT
(proceeds $13,657,349) | | | (13,958,230 | ) |
| | | | | | | | | |
|
|
|
| | | | | | | | | | | |
| | | | |
| | | | | | | Notional
Amount
(000)
| | Value
(Note 2)
| |
| OUTSTANDING OPTIONS WRITTEN* — (0.4)% | |
Call Options — (0.4)% | | | | | | | |
Interest Rate Swap Option,
expiring 12/19/2008 @ 5.00% | | $ | 2,300 | | $ | (91,500 | ) |
expiring 04/20/2009 @ 4.44% | | | EUR 7,000 | | | (108,632 | ) |
Swap on 3 Month LIBOR,
expiring 09/19/2008 @ 5.05% | | | 2,800 | | | (119,636 | ) |
expiring 09/26/2008 @ 4.95% | | | 3,400 | | | (125,953 | ) |
expiring 12/31/2008 @ 5.22% | | | 1,600 | | | (77,286 | ) |
| | | | | |
|
|
|
| | | | (523,007 | ) |
| | | | | |
|
|
|
Put Options | | | | | | | |
Currency Option, on USD vs JPY,
expiring 09/16/2008 @ FX Rate 100.00 | | | 300 | | | (3,159 | ) |
| | | | | | | | | |
|
|
|
TOTAL OUTSTANDING OPTIONS WRITTEN (premium received $348,366) | | | (526,166 | ) |
| | | | | | | | | |
|
|
|
TOTAL INVESTMENTS, NET OF
OUTSTANDING OPTIONS WRITTEN AND
SECURITIES SOLD SHORT(o) — 115.3%
(cost $137,444,189) | | | 147,759,054 | |
Liabilities in excess of other assets(x) — (15.3)% | | | (19,568,369 | ) |
| | | | | |
|
|
|
NET ASSETS — 100.0% | | $ | 128,190,685 | |
| | | | | |
|
|
|
The following abbreviations are used in portfolio descriptions:
| | |
| 144A | | Security was purchased pursuant to Rule 144A under the securities Act of 1933 and may not be resold subject to that rule except to qualified institutional buyers. Unless otherwise noted, 144A securities are deemed to be liquid. |
| ADR | | American Depositary Receipt |
| CVT | | Convertible Security |
| MTN | | Medium Term Note |
| PIK | | Payment-in-kind |
| TBA | | To Be Announced |
| TIPS | | Treasury Inflation Protected Securities |
| BRL | | Brazilian Real |
| CND | | Canadian Dollar |
| CHF | | Swiss Franc |
| CNY | | Chinese Yuan |
| EUR | | Euro |
| GBP | | British Pound |
| INR | | Indian Rupee |
| JPY | | Japanese Yen |
| KRW | | South Korean Won |
| MXN | | Mexican Peso |
| RUB | | Russian Ruble |
| USD | | United States Dollar—denominated |
| # | Principal amount is shown in U.S. dollars unless otherwise stated. |
| * | Non-income producing security. |
| (c) | Indicates a variable rate security. |
| (d) | Standard & Poor’s rating. |
| (f) | Private Placement restricted as to resale and does not have a readily available market. The aggregate cost of such securities is $2,539,375. The aggregate value of $2,802,125 is approximately 2.2% of net assets. |
| (g) | Indicates a security that has been deemed illiquid. |
| (k) | Securities segregated as collateral for futures contracts. |
| (l) | Represents all or partial amount utilized in the Municipal Tender Option Bond transaction. The aggregated principal amount of the inverse floaters and the floating rate notes (included in Liabilities) are $125,000 and $125,000, respectively. |
| (n) | Rates shown are the effective yields at purchase date. |
| (o) | As of December 31, 2007, 1 security representing $203,392 and .16% of the total net assets was fair valued in accordance with the policies adopted by the Board of Trustees. |
| (v) | The rate shown reflects the coupon rate after the step date. |
| (w) | Prudential Investments LLC, the manager of the Portfolio, also serves as manager of the Dryden Core Investment Fund-Taxable Money Market Series. |
SEE NOTES TO FINANCIAL STATEMENTS.
A15
| | | | |
| | | DIVERSIFIED CONSERVATIVE GROWTH PORTFOLIO (Continued) | | |
SCHEDULE OF INVESTMENTS | December 31, 2007 |
| (x) | Liabilities in excess of other assets includes net unrealized appreciation (depreciation) on futures contracts, forward foreign currency contracts, interest rate and credit default swaps as follows: |
Futures contracts open at December 31, 2007
Securities or a portion thereof with an aggregate market value of $810,057 have been segregated with the custodian to cover margin requirements for futures contracts open at December 31, 2007.
| | | | | | | | | | | | | | |
Number of
Contracts
| | Type
| | Expiration
Date
| | Value at
Trade Date
| | Value at
December 31, 2007
| | Unrealized
Appreciation
(Depreciation)
| |
| Long Positions: | | | | | | | | | | | | | | |
| 6 | | 90 Day Euro EURIBOR | | Mar 08 | | $ | 2,098,165 | | $ | 2,093,732 | | $ | (4,433 | ) |
| 15 | | 90 Day Euro EURIBOR | | Jun 08 | | | 5,241,805 | | | 5,239,813 | | | (1,992 | ) |
| 11 | | 90 Day Euro EURIBOR | | Sep 08 | | | 3,841,669 | | | 3,845,746 | | | 4,077 | |
| 7 | | 90 Day Euro EURIBOR | | Dec 08 | | | 2,451,753 | | | 2,449,084 | | | (2,669 | ) |
| 16 | | 90 Day Euro EURIBOR | | Dec 09 | | | 5,608,433 | | | 5,602,000 | | | (6,433 | ) |
| 20 | | 90 Day Euro Dollar | | Mar 08 | | | 4,782,500 | | | 4,788,250 | | | 5,750 | |
| 13 | | 90 Day Euro Dollar | | Jun 08 | | | 3,127,313 | | | 3,128,288 | | | 975 | |
| 14 | | 90 Day Euro Dollar | | Sep 08 | | | 3,354,525 | | | 3,377,850 | | | 23,325 | |
| 24 | | 90 Day Euro Dollar | | Dec 08 | | | 5,739,350 | | | 5,797,800 | | | 58,450 | |
| 7 | | 90 Day Euro Dollar | | Mar 09 | | | 1,676,237 | | | 1,691,025 | | | 14,788 | |
| 13 | | 90 Day Euro Dollar | | Jun 09 | | | 3,109,600 | | | 3,136,575 | | | 26,975 | |
| 8 | | 90 Day Euro Dollar | | Sep 09 | | | 1,909,500 | | | 1,927,000 | | | 17,500 | |
| 8 | | 90 Day Euro Dollar | | Dec 09 | | | 1,907,400 | | | 1,923,600 | | | 16,200 | |
| 39 | | 90 Day Sterling | | Mar 08 | | | 9,146,033 | | | 9,162,701 | | | 16,668 | |
| 18 | | 90 Day Sterling | | Sep 08 | | | 4,236,130 | | | 4,253,573 | | | 17,443 | |
| 12 | | 90 Day Sterling | | Jun 09 | | | 2,803,467 | | | 2,843,180 | | | 39,713 | |
| 43 | | 5 Year Euro BOBL | | Mar 09 | | | 6,880,773 | | | 6,785,999 | | | (94,774 | ) |
| 10 | | 10 Year U.S. Treasury Notes | | Mar 08 | | | 1,124,218 | | | 1,133,906 | | | 9,688 | |
| | | | | | | | | | | | |
|
|
|
| | | | | | | | | | | | | | 141,251 | |
| | | | | | | | | | | | |
|
|
|
| Short Positions: | | | | | | | | | | | | | | |
| 29 | | 2 Year U.S. Treasury Notes | | Mar 08 | | | 6,080,031 | | | 6,097,250 | | | (17,219 | ) |
| 101 | | 5 Year U.S. Treasury Notes | | Mar 08 | | | 11,095,343 | | | 11,138,406 | | | (43,063 | ) |
| 50 | | 20 Year U.S. Treasury Bonds | | Mar 08 | | | 5,832,813 | | | 5,818,750 | | | 14,063 | |
| | | | | | | | | | | | |
|
|
|
| | | | | | | | | | | | | | (46,219 | ) |
| | | | | | | | | | | | |
|
|
|
| | | | | | | | | | | | | $ | 95,032 | |
| | | | | | | | | | | | |
|
|
|
Forward foreign currency exchange contracts outstanding at December 31, 2007:
| | | | | | | | | | | | | | |
Purchase Contracts
| | | | Notional
Amount
(000)
| | Value at Settlement
Date Payable
| | Current
Value
| | Unrealized
Appreciation
(Depreciation)
| |
Brazilian Real, Expiring 07/02/08 | | BRL | | 1,970 | | $ | 977,577 | | $ | 1,077,000 | | $ | 99,423 | |
British Pound, Expiring 01/31/08 | | GBP | | 68 | | | 135,285 | | | 135,237 | | | (48 | ) |
Canadian Dollar Expiring 01/31/08 | | CND | | 12 | | | 11,893 | | | 12,163 | | | 270 | |
China Yuan, | | | | | | | | | | | | | | |
Expiring 02/27/08 | | CNY | | 2,168 | | | 300,000 | | | 299,750 | | | (250 | ) |
Expiring 07/02/08 | | CNY | | 7,260 | | | 1,000,000 | | | 1,034,172 | | | 34,172 | |
Indian Rupee, Expiring 05/12/08 | | INR | | 55,038 | | | 1,336,659 | | | 1,388,234 | | | 51,575 | |
Mexican Peso, Expiring 03/13/08 | | MXN | | 2,177 | | | 191,000 | | | 198,465 | | | 7,465 | |
Russian Ruble, | | | | | | | | | | | | | | |
Expiring 01/11/08 | | RUB | | 25,865 | | | 1,000,000 | | | 1,054,026 | | | 54,026 | |
Expiring 07/10/08 | | RUB | | 13,945 | | | 550,000 | | | 566,241 | | | 16,241 | |
Expiring 11/19/08 | | RUB | | 25,865 | | | 1,042,733 | | | 1,042,683 | | | (50 | ) |
South Korean Won, Expiring 01/30/08 | | KRW | | 369,642 | | | 406,178 | | | 395,869 | | | (10,309 | ) |
Swiss Franc, Expiring 03/06/08 | | CHF | | 250 | | | 222,866 | | | 221,677 | | | (1,189 | ) |
| | | | | | |
|
| |
|
| |
|
|
|
| | | | | | | $ | 7,174,191 | | $ | 7,425,517 | | $ | 251,326 | |
| | | | | | |
|
| |
|
| |
|
|
|
| | | | | |
Sale Contracts
| | | | Notional
Amount
(000)
| | Value at Settlement
Date Receivable
| | Current
Value
| | Unrealized
Appreciation
(Depreciation)
| |
British Pound, | | | | | | | | | | | | | | |
Expiring 01/03/08 | | GBP | | 68 | | $ | 135,384 | | $ | 135,361 | | $ | 23 | |
Expiring 01/31/08 | | GBP | | 1,796 | | | 3,609,054 | | | 3,571,837 | | | 37,217 | |
Euro, Expiring 01/17/08 | | EUR | | 205 | | | 300,998 | | | 299,816 | | | 1,182 | |
Japanese Yen, Expiring 02/07/08 | | JPY | | 70,688 | | | 636,835 | | | 635,463 | | | 1,372 | |
Mexican Peso, Expiring 03/13/08 | | MXN | | 2,177 | | | 197,209 | | | 198,465 | | | (1,256 | ) |
Russian Ruble, Expiring 01/11/08 | | RUB | | 25,865 | | | 1,055,284 | | | 1,054,026 | | | 1,258 | |
| | | | | | |
|
| |
|
| |
|
|
|
| | | | | | | $ | 5,934,764 | | $ | 5,894,968 | | $ | 39,796 | |
| | | | | | |
|
| |
|
| |
|
|
|
SEE NOTES TO FINANCIAL STATEMENTS.
A16
| | | | |
| | | DIVERSIFIED CONSERVATIVE GROWTH PORTFOLIO (Continued) | | |
SCHEDULE OF INVESTMENTS | December 31, 2007 |
Interest rate swap agreements outstanding at December 31, 2007:
| | | | | | | | | | | | | | |
Counter Party
| | Termination
Date
| |
| | Notional
Amount#
| | Fixed
Rate
| | Floating Rate
| | Unrealized
Appreciation
(Depreciation)
| |
Barclays Capital(1) | | 06/18/10 | | $ | | 6,100,000 | | 4.00% | | 3 Month LIBOR | | $ | 7,045 | |
Barclays Capital(1) | | 06/18/13 | | | | 4,900,000 | | 4.00% | | 3 Month LIBOR | | | 29,558 | |
Barclays Capital(1) | | 06/18/10 | | | | 2,300,000 | | 5.00% | | 3 Month LIBOR | | | 8,591 | |
Deutsche Bank(1) | | 06/18/10 | | | | 500,000 | | 4.00% | | 3 Month LIBOR | | | 1,621 | |
Deutsche Bank(1) | | 06/18/15 | | | | 1,100,000 | | 5.00% | | 3 Month LIBOR | | | (1,644 | ) |
Deutsche Bank(2) | | 06/18/38 | | | | 4,000,000 | | 5.00% | | 3 Month LIBOR | | | (112,166 | ) |
Merrill Lynch & Co.(1) | | 12/17/10 | | | | 1,600,000 | | 4.00% | | 3 Month LIBOR | | | 2,414 | |
Morgan Stanley & Co.(1) | | 06/18/18 | | | | 1,000,000 | | 5.00% | | 3 Month LIBOR | | | 18,199 | |
Morgan Stanley & Co.(1) | | 06/18/10 | | | | 200,000 | | 4.00% | | 3 Month LIBOR | | | 883 | |
Citigroup(1) | | 04/15/09 | | AUD | | 2,500,000 | | 7.00% | | 3 month Australian Bank Bill rate | | | (15,184 | ) |
Morgan Stanley & Co.(1) | | 12/15/09 | | AUD | | 1,300,000 | | 7.00% | | 6 month Australian Bank Bill rate | | | (8,191 | ) |
Morgan Stanley & Co.(1) | | 01/02/12 | | BRL | | 7,900,000 | | 10.12% | | Brazilian interbank lending rate | | | (244,936 | ) |
UBS AG(1) | | 01/02/12 | | BRL | | 4,600,000 | | 10.58% | | Brazilian interbank lending rate | | | (201,267 | ) |
Deutsche Bank(1) | | 06/18/34 | | EUR | | 300,000 | | 5.00% | | 6 month Euribor | | | (2,044 | ) |
UBS AG(1) | | 10/15/10 | | EUR | | 100,000 | | 2.15% | | FRC-Excluding Tobacco-Non-Revised Consumer Price Index | | | 1,130 | |
Goldman Sachs(2) | | 12/20/17 | | GBP | | 400,000 | | 5.00% | | 6 Month LIBOR | | | (21,741 | ) |
Barclays Capital(2) | | 06/20/17 | | JPY | | 10,000,000 | | 2.00% | | 6 Month LIBOR | | | (282 | ) |
UBS AG(2) | | 06/20/17 | | JPY | | 30,000,000 | | 2.00% | | 6 Month LIBOR | | | (2,135 | ) |
Merrill Lynch & Co.(1) | | 11/04/16 | | MXN | | 11,000,000 | | 8.17% | | 28 day Mexican interbank rate | | | (24,996 | ) |
| | | | | | | | | | | | |
|
|
|
| | | | | | | | | | | | | $ | (565,145 | ) |
| | | | | | | | | | | | |
|
|
|
| (1) | Portfolio pays the floating rate and receives the fixed rate. |
| (2) | Portfolio pays the fixed rate and receives the floating rate. |
| # | Notional Amount is shown in U.S. dollars unless otherwise stated. |
Credit default swap agreements outstanding at December 31, 2007:
| | | | | | | | | | | | | |
Counter Party
| | Termination
Date
| | Notional
Amount#
| | Fixed
Rate
| | Reference Entity/Obligation
| | Unrealized
Appreciation
(Depreciation)
| |
Lehman Brothers(2) | | 03/20/08 | | $ | 300,000 | | 0.06% | | AIG Corp., 5.60%, due 10/18/16 | | $ | (385 | ) |
Morgan Stanley & Co.(1) | | 12/20/08 | | | 200,000 | | 0.26% | | Allstate Corp., 6.125%, due 02/15/12 | | | (173 | ) |
UBS AG(1) | | 12/20/08 | | | 200,000 | | 0.35% | | AutoZone, Inc., 5.875%, due 10/15/12 | | | (427 | ) |
Citigroup(1) | | 12/20/16 | | | 400,000 | | 0.17% | | Bank of America Corp., 5.62%, 10/14/16 | | | 11,779 | |
Lehman Brothers(1) | | 09/20/12 | | | 1,000,000 | | 0.60% | | CBS Corp., 4.625%, due 05/15/18 | | | 3,024 | |
Barclays Bank PLC(1) | | 06/20/15 | | | 100,000 | | 0.15% | | CitiFinancial, 6.625%, due 06/01/15 | | | 3,786 | |
Barclays Bank PLC(1) | | 09/20/11 | | | 100,000 | | 0.58% | | DaimlerChrysler NA Holdings, 5.75%, due 09/08/11 | | | (594 | ) |
Barclays Bank PLC(1) | | 12/20/11 | | | 1,200,000 | | 0.75% | | Dow Jones CDX HVOL7 Index | | | 46,324 | |
Bank of America Securities LLC(2) | | 06/20/12 | | | 200,000 | | 0.75% | | Dow Jones CDX HVOL8 Index | | | (3,895 | ) |
Lehman Brothers(1) | | 12/20/11 | | | 300,000 | | 0.00% | | Dow Jones CDX HY-7 Index | | | 10,653 | |
Merrill Lynch & Co.(1) | | 12/20/11 | | | 100,000 | | 0.00% | | Dow Jones CDX HY-7 Index | | | 3,901 | |
Bank of America Securities LLC(1) | | 06/20/12 | | | 400,000 | | 2.75% | | Dow Jones CDX HY-8 Index | | | 2,044 | |
Citigroup(2) | | 06/20/12 | | | 2,000,000 | | 2.09% | | Dow Jones CDX HY-8 Index | | | (29,283 | ) |
Morgan Stanley & Co.(1) | | 06/20/12 | | | 1,300,000 | | 2.75% | | Dow Jones CDX HY-8 Index | | | 36,243 | |
UBS AG(1) | | 06/20/12 | | | 900,000 | | 2.75% | | Dow Jones CDX HY-8 Index | | | 1,207 | |
Barclays Bank PLC(1) | | 03/20/12 | | | 100,000 | | 0.17% | | International Lease Finance Corp., 5.40%, due 02/15/12 | | | 1,385 | |
SEE NOTES TO FINANCIAL STATEMENTS.
A17
| | | | |
| | | DIVERSIFIED CONSERVATIVE GROWTH PORTFOLIO (Continued) | | |
SCHEDULE OF INVESTMENTS | December 31, 2007 |
| | | | | | | | | | | | | |
Counter Party
| | Termination
Date
| | Notional
Amount#
| | Fixed
Rate
| | Reference Entity/Obligation
| | Unrealized
Appreciation
(Depreciation)
| |
Morgan Stanley & Co.(2) | | 03/20/07 | | $ | 200,000 | | 0.46% | | Dow Jones CDX IG5 Index | | $ | (8,301 | ) |
Morgan Stanley & Co.(2) | | 03/20/07 | �� | | 700,000 | | 0.46% | | Dow Jones CDX IG5 Index | | | (28,822 | ) |
Morgan Stanley & Co.(1) | | 12/20/12 | | | 300,000 | | 0.14% | | Dow Jones CDX IG5 Index | | | 9,115 | |
Morgan Stanley & Co.(1) | | 12/20/12 | | | 1,000,000 | | 0.14% | | Dow Jones CDX IG5 Index | | | 30,384 | |
Morgan Stanley & Co.(1) | | 12/20/16 | | | 500,000 | | 0.65% | | Dow Jones CDX IG7 Index | | | 14,445 | |
Lehman Brothers(1) | | 06/20/09 | | | 600,000 | | 0.35% | | Dow Jones CDX IG8 Index | | | 6,040 | |
Morgan Stanley & Co.(1) | | 06/20/12 | | | 2,100,000 | | 0.17% | | Dow Jones CDX IG8 Index | | | 82 | |
Bank of America Securities LLC(1) | | 12/20/08 | | | 100,000 | | 0.13% | | E.I. DuPont, 6.875%, due 10/15/09 | | | (50 | ) |
Citigroup(1) | | 12/20/08 | | | 200,000 | | 0.28% | | Eaton Corp., 5.75%, due 07/15/12 | | | (239 | ) |
Barclays Bank PLC(1) | | 12/20/08 | | | 200,000 | | 0.16% | | Eli Lilly & Co., 6.00%, due 03/15/12 | | | (247 | ) |
Morgan Stanley & Co.(1) | | 12/20/08 | | | 100,000 | | 0.21% | | Emerson Electric Co., 4.63%, due 10/15/12 | | | (127 | ) |
Citigroup(1) | | 12/20/08 | | | 100,000 | | 0.29% | | FedEx Corp., 7.25%, due 02/15/11 | | | (67 | ) |
Lehman Brothers(1) | | 12/20/08 | | | 100,000 | | 0.97% | | Goodrich Corp., 7.625%, due 12/15/12 | | | (881 | ) |
Bear Stearns International Ltd.(1) | | 12/20/08 | | | 200,000 | | 0.32% | | Hewlett-Packard Co., 6.50% due 07/01/12 | | | (467 | ) |
Lehman Brothers(1) | | 12/20/08 | | | 200,000 | | 0.12% | | Home Depot, Inc., 5.375%, due 04/01/06 | | | 866 | |
Merrill Lynch & Co.(1) | | 12/20/08 | | | 100,000 | | 0.32% | | Ingersoll-Rand Corp., 6.48%, due 06/01/25 | | | (178 | ) |
Barclays Bank PLC(1) | | 12/20/12 | | | 1,000,000 | | 0.48% | | International Paper Co., 5.85%, due 10/30/12 | | | 2,263 | |
Barclays Bank PLC(1) | | 03/20/11 | | | 100,000 | | 0.37% | | iStar Financial, Inc., 5.80%, due 03/15/11 | | | 10,987 | |
Lehman Brothers(1) | | 12/20/08 | | | 200,000 | | 0.11% | | Johnson & Johnson, 3.80%, due 05/15/13 | | | (111 | ) |
Lehman Brothers(1) | | 12/20/08 | | | 100,000 | | 0.53% | | Lockheed Martin Corp., 8.20%, due 12/01/09 | | | (457 | ) |
Lehman Brothers(1) | | 12/20/08 | | | 100,000 | | 0.30% | | Masco Corp., 5.875%, due 07/15/12 | | | 1,136 | |
Deutsche Bank(1) | | 09/20/11 | | | 100,000 | | 0.62% | | Nationwide Health, 6.50%, due 07/15/11 | | | 987 | |
Lehman Brothers(1) | | 12/20/08 | | | 100,000 | | 0.48% | | Northrop & Grumman Corp., 7.125%, due 02/15/11 | | | (423 | ) |
Lehman Brothers(1) | | 06/20/09 | | | 400,000 | | 0.40% | | People’s Republic of China, 6.80%, due 05/23/11 | | | (1,214 | ) |
Lehman Brothers(1) | | 12/20/08 | | | 100,000 | | 0.35% | | RadioShack Corp., 7.375%, due 05/15/11 | | | 426 | |
Morgan Stanley & Co.(1) | | 09/20/13 | | | 100,000 | | 0.58% | | Sealed Air Corp., 5.625%, due 07/15/13 | | | 1,030 | |
Bear Stearns International Ltd.(1) | | 03/20/12 | | | 1,000,000 | | 0.55% | | Sprint Capital Corp., 8.375%, due 03/15/12 | | | 22,606 | |
Citigroup(1) | | 12/20/08 | | | 300,000 | | 0.14% | | Wal-Mart Stores, Inc., 3.38%, due 10/01/08 | | | (180 | ) |
Barclays Bank PLC(1) | | 12/20/08 | | | 100,000 | | 0.67% | | Walt Disney Co. (The), 6.375%, due 03/01/12 | | | (496 | ) |
Bear Stearns International Ltd.(1) | | 06/20/16 | | | 100,000 | | 0.63% | | Whirlpool Corp., 6.50%, due 06/15/16 | | | 1,395 | |
Lehman Brothers(1) | | 12/20/08 | | | 100,000 | | 0.29% | | Whirlpool Corp., 8.60%, due 05/01/10 | | | (146 | ) |
| | | | | | | | | | | |
|
|
|
| | | | | | | | | | | | $ | 144,945 | |
| | | | | | | | | | | |
|
|
|
| (1) | Portfolio pays the fixed rate and receives from the counterparty, par in the event that the underlying bond defaults. |
| (2) | Portfolio pays the counterparty par in the event that the underlying bond defaults and receives the fixed rate. |
| # | Notional Amount is shown in U.S. dollars unless otherwise stated. |
SEE NOTES TO FINANCIAL STATEMENTS.
A18
| | | | |
| | | DIVERSIFIED CONSERVATIVE GROWTH PORTFOLIO (Continued) | | |
SCHEDULE OF INVESTMENTS | December 31, 2007 |
The industry classification of investments and liabilities in excess of other assets shown as a percentage of net assets as of December 31, 2007 were as follows:
| | | |
U.S. Government Mortgage-Backed Obligations | | 38.1 | % |
U.S. Treasury Obligations | | 9.1 | |
Affiliated Money Market Mutual Fund | | 4.6 | |
Oil, Gas & Consumable Fuels | | 3.7 | |
Collateralized Mortgage Obligations | | 3.6 | |
Healthcare & Pharmaceuticals | | 2.8 | |
Pharmaceuticals | | 2.5 | |
Media & Entertainment | | 2.1 | |
Diversified Financial Services | | 2.0 | |
Telecom | | 2.0 | |
Communication Equipment | | 1.9 | |
Foreign Government Bonds | | 1.9 | |
Internet Software & Services | | 1.9 | |
Capital Goods | | 1.7 | |
Insurance | | 1.7 | |
Capital Markets | | 1.6 | |
Electric | | 1.6 | |
Media | | 1.6 | |
Aerospace & Defense | | 1.5 | |
Computers & Peripherals | | 1.5 | |
Financial Services | | 1.5 | |
Software | | 1.5 | |
Chemicals | | 1.3 | |
Pipelines & Other | | 1.3 | |
Biotechnology | | 1.2 | |
Healthcare Equipment & Supplies | | 1.1 | |
Tobacco | | 1.1 | |
Commercial Paper | | 1.0 | |
Financial – Bank & Trust | | 1.0 | |
Repurchase Agreements | | 1.0 | |
Food & Staples Retailing | | 0.9 | |
Gaming | | 0.9 | |
Healthcare Providers & Services | | 0.9 | |
Metals | | 0.9 | |
Technology | | 0.9 | |
Automotive | | 0.8 | |
Bank Notes | | 0.8 | |
Energy-Other | | 0.8 | |
Household Products | | 0.8 | |
Municipal Bonds | | 0.8 | |
Packaging | | 0.8 | |
Food Products | | 0.7 | |
Commercial Services & Supplies | | 0.6 | |
Industrial Conglomerates | | 0.6 | |
Outstanding Options Purchased | | 0.6 | |
Wireless Telecommunication Services | | 0.6 | |
Textiles, Apparel & Luxury Goods | | 0.6 | |
Cable | | 0.5 | |
Consumer Finance | | 0.5 | |
Consumers | | 0.5 | |
Diversified Consumer Services | | 0.5 | |
Electrical Equipment | | 0.5 | |
Electronic Equipment & Instruments | | 0.5 | |
Internet & Catalog Retail | | 0.5 | |
Non-Captive Finance | | 0.5 | |
Paper | | 0.5 | |
Semiconductors & Semiconductor Equipment | | 0.5 | |
Beverages | | 0.4 | |
Electric Utilities | | 0.4 | |
| | | |
Food | | 0.4 | % |
Hotels, Restaurants & Leisure | | 0.4 | |
Lodging | | 0.4 | |
Retailers | | 0.4 | |
Specialty Retail | | 0.4 | |
Thrifts & Mortgage Finance | | 0.4 | |
Telecommunications | | 0.4 | |
Commercial Banks | | 0.3 | |
Energy Equipment & Services | | 0.3 | |
Independent Power Producers & Energy Traders | | 0.3 | |
Life Science Tools & Services | | 0.3 | |
Metals & Mining | | 0.3 | |
Multi-utilities | | 0.3 | |
Real Estate Investment Trusts | | 0.3 | |
Airlines | | 0.2 | |
Computer Services & Software | | 0.2 | |
Internet | | 0.2 | |
Machinery | | 0.2 | |
Manufacturing | | 0.2 | |
Office Electronics | | 0.2 | |
Paper & Forest Products | | 0.2 | |
Retail & Merchandising | | 0.2 | |
U.S. Government Agency Obligations | | 0.2 | |
Asset-Backed Securities | | 0.1 | |
Automobile Manufacturers | | 0.1 | |
Automotive Parts | | 0.1 | |
Banking | | 0.1 | |
Building Materials & Construction | | 0.1 | |
Business Services | | 0.1 | |
Clothing & Apparel | | 0.1 | |
Commercial Services | | 0.1 | |
Diversified Telecommunication Services | | 0.1 | |
Education | | 0.1 | |
Electronics | | 0.1 | |
Exchange Traded Funds | | 0.1 | |
Household Durables | | 0.1 | |
Medical Supplies & Equipment | | 0.1 | |
Multi-line Retail | | 0.1 | |
Oil & Gas Exploration/Production | | 0.1 | |
Utilities | | 0.1 | |
| | |
|
|
| | | 126.6 | |
Written options and securities sold short | | (11.3 | ) |
Liabilities in excess of other assets | | (15.3 | ) |
| | |
|
|
| | | 100.0 | % |
| | |
|
|
SEE NOTES TO FINANCIAL STATEMENTS.
A19
| | | | |
| | | DIVERSIFIED CONSERVATIVE GROWTH PORTFOLIO (Continued) | | |
STATEMENT OF ASSETS AND LIABILITIES
December 31, 2007
| | | |
| ASSETS | | | |
Investments at value: | | | |
Unaffiliated investments (cost $145,577,005) | | $ | 156,370,551 |
Affiliated investments (cost $5,872,899) | | | 5,872,899 |
Foreign currency, at value (cost $478,880) | | | 485,147 |
Cash | | | 36,678 |
Receivable for investments sold | | | 23,928,790 |
Dividends and interest receivable | | | 879,362 |
Unrealized appreciation on foreign currency forward contracts | | | 304,224 |
Unrealized appreciation on swap agreements | | | 291,549 |
Premium for swaps purchased | | | 257,363 |
Tax reclaim receivable | | | 284 |
Prepaid expenses | | | 228 |
| | |
|
|
Total Assets | | | 188,427,075 |
| | |
|
|
| LIABILITIES | | | |
Payable for investments purchased | | | 44,440,111 |
Securities sold short, at value (proceeds received $13,657,349) | | | 13,958,230 |
Unrealized depreciation on swap agreements | | | 711,749 |
Written options outstanding, at value
(premium $348,366) | | | 526,166 |
Accrued expenses and other liabilities | | | 182,560 |
Interest payable on investments sold short | | | 128,888 |
Payable for floating rate notes issued | | | 125,000 |
Management fee payable | | | 81,607 |
Payable for Series shares repurchased | | | 48,818 |
Due to broker-variation margin | | | 18,213 |
Unrealized depreciation on foreign currency forward contracts | | | 13,102 |
Premium for swaps sold | | | 1,732 |
Transfer agent fees payable | | | 214 |
| | |
|
|
Total Liabilities | | | 60,236,390 |
| | |
|
|
| NET ASSETS | | $ | 128,190,685 |
| | |
|
|
Net assets were comprised of: | | | |
Paid-in capital | | $ | 106,605,546 |
Retained earnings | | | 21,585,139 |
| | |
|
|
Net assets, December 31, 2007 | | $ | 128,190,685 |
| | |
|
|
Net asset value and redemption price per share, $128,190,685 / 10,829,688 outstanding shares of beneficial interest | | $ | 11.84 |
| | |
|
|
STATEMENT OF OPERATIONS
Year Ended December 31, 2007
| | | | |
| INVESTMENT INCOME | | | | |
Interest | | $ | 4,721,398 | |
Unaffiliated dividend income (net of $18,060 foreign withholding tax) | | | 662,624 | |
Affiliated dividend income | | | 394,649 | |
| | |
|
|
|
| | | | 5,778,671 | |
| | |
|
|
|
| EXPENSES | | | | |
Management fee | | | 1,007,798 | |
Custodian’s fees and expenses | | | 237,000 | |
Interest expense and fees | | | 176,757 | |
Audit fee | | | 42,000 | |
Shareholders’ reports | | | 35,000 | |
Trustees’ fees | | | 11,000 | |
Legal fees and expenses | | | 6,000 | |
Insurance expenses | | | 3,000 | |
Transfer agent’s fees and expenses (including affiliated expense of $1,000) (Note 4) | | | 1,000 | |
Commitment fee on syndicated credit agreement | | | 500 | |
Miscellaneous | | | 8,950 | |
| | |
|
|
|
Total expenses | | | 1,529,005 | |
| | |
|
|
|
| NET INVESTMENT INCOME | | | 4,249,666 | |
| | |
|
|
|
NET REALIZED AND UNREALIZED GAIN (LOSS) ON
INVESTMENTS AND FOREIGN CURRENCIES | |
Net realized gain (loss) on: | | | | |
Investment transactions | | | 7,463,715 | |
Futures transactions | | | (813,674 | ) |
Options written transactions | | | 15,003 | |
Swap agreement transactions | | | 1,311,397 | |
Foreign currency transactions | | | (20,776 | ) |
| | |
|
|
|
| | | | 7,955,665 | |
| | |
|
|
|
Net change in unrealized appreciation (depreciation) on: | |
Investments | | | (4,037,681 | ) |
Futures | | | 65,774 | |
Options written | | | (158,102 | ) |
Swap agreements | | | (281,483 | ) |
Short sales | | | (374,848 | ) |
Foreign currencies | | | 286,406 | |
| | |
|
|
|
| | | | (4,499,934 | ) |
| | |
|
|
|
| NET GAIN ON INVESTMENTS AND FOREIGN CURRENCIES | | | 3,455,731 | |
| | |
|
|
|
| NET INCREASE IN NET ASSETS RESULTING FROM OPERATIONS | | $ | 7,705,397 | |
| | |
|
|
|
STATEMENT OF CHANGES IN NET ASSETS
| | | | | | | | |
| | | Year Ended
December 31, 2007
| | | Year Ended
December 31, 2006
| |
| INCREASE (DECREASE) IN NET ASSETS | | | | | | | | |
| OPERATIONS: | | | | | | | | |
Net investment income | | $ | 4,249,666 | | | $ | 4,413,263 | |
Net realized gain on investment and foreign currency transactions | | | 7,955,665 | | | | 4,922,147 | |
Net change in unrealized appreciation (depreciation) on investments and foreign currencies | | | (4,499,934 | ) | | | 643,745 | |
| | |
|
|
| |
|
|
|
NET INCREASE IN NET ASSETS RESULTING FROM OPERATIONS | | | 7,705,397 | | | | 9,979,155 | |
| | |
|
|
| |
|
|
|
| DISTRIBUTIONS | | | (9,328,249 | ) | | | (5,417,428 | ) |
| | |
|
|
| |
|
|
|
| SERIES SHARE TRANSACTIONS: | | | | | | | | |
Series shares sold [203,407 and 205,401 shares, respectively] | | | 2,549,068 | | | | 2,385,357 | |
Series shares issued in reinvestment of distributions [795,247 and 469,855 shares, respectively] | | | 9,328,249 | | | | 5,417,428 | |
Series shares repurchased [1,756,566 and 2,063,447 shares, respectively] | | | (21,843,596 | ) | | | (24,021,598 | ) |
| | |
|
|
| |
|
|
|
DECREASE IN NET ASSETS RESULTING FROM SERIES SHARE TRANSACTIONS | | | (9,966,279 | ) | | | (16,218,813 | ) |
| | |
|
|
| |
|
|
|
| TOTAL DECREASE IN NET ASSETS | | | (11,589,131 | ) | | | (11,657,086 | ) |
| NET ASSETS: | | | | | | | | |
Beginning of year | | | 139,779,816 | | | | 151,436,902 | |
| | |
|
|
| |
|
|
|
End of year | | $ | 128,190,685 | | | $ | 139,779,816 | |
| | |
|
|
| |
|
|
|
SEE NOTES TO FINANCIAL STATEMENTS.
A20
| | | | |
| | | JENNISON 20/20 FOCUS PORTFOLIO | | |
SCHEDULE OF INVESTMENTS | December 31, 2007 |
| | | | | |
| LONG-TERM INVESTMENTS — 95.5% | | |
| COMMON STOCKS — 95.5% | | Shares
| | Value
(Note 2)
|
| | | | | | |
Aerospace & Defense — 2.6% | | | | | |
United Technologies Corp. | | 126,700 | | $ | 9,697,618 |
| | | | |
|
|
Beverages — 2.5% | | | | | |
PepsiCo, Inc. | | 123,200 | | | 9,350,880 |
| | | | |
|
|
Biotechnology — 5.2% | | | | | |
Amgen, Inc.(a) | | 184,600 | | | 8,572,824 |
Gilead Sciences, Inc.(a) | | 246,000 | | | 11,318,460 |
| | | | |
|
|
| | | | | | 19,891,284 |
| | | | |
|
|
Capital Markets — 5.2% | | | | | |
Charles Schwab Corp. (The) | | 268,500 | | | 6,860,175 |
Goldman Sachs Group, Inc. (The)(b) | | 28,000 | | | 6,021,400 |
Merrill Lynch & Co., Inc.(b) | | 127,100 | | | 6,822,728 |
| | | | |
|
|
| | | | | | 19,704,303 |
| | | | |
|
|
Chemicals — 3.2% | | | | | |
Monsanto Co. | | 109,600 | | | 12,241,224 |
| | | | |
|
|
Commercial Services & Supplies — 2.5% | | | | | |
Waste Management, Inc. | | 293,400 | | | 9,585,378 |
| | | | |
|
|
Communications Equipment — 4.9% | | | | | |
Cisco Systems, Inc.(a) | | 332,700 | | | 9,006,189 |
Research In Motion Ltd.(a)(b) | | 84,800 | | | 9,616,320 |
| | | | |
|
|
| | | | | | 18,622,509 |
| | | | |
|
|
Computers & Peripherals — 3.2% | | | | | |
Apple, Inc.(a) | | 60,800 | | | 12,043,264 |
| | | | |
|
|
Diversified Consumer Services — 4.4% | | | | | |
Career Education Corp.(a) | | 276,200 | | | 6,943,668 |
H&R Block, Inc. | | 531,700 | | | 9,873,669 |
| | | | |
|
|
| | | | | | 16,817,337 |
| | | | |
|
|
Electrical Equipment — 1.5% | | | | | |
First Solar, Inc.(a)(b) | | 21,400 | | | 5,716,796 |
| | | | |
|
|
Energy Equipment & Services — 2.3% | | | | | |
Tenaris SA, ADR (Luxembourg) | | 198,000 | | | 8,856,540 |
| | | | |
|
|
Food & Staples Retailing — 2.3% | | | | | |
Wal-Mart Stores, Inc. | | 181,000 | | | 8,602,930 |
| | | | |
|
|
Food Products — 5.4% | | | | | |
Cadbury Schweppes PLC, ADR (United Kingdom) | | 200,700 | | | 9,908,559 |
ConAgra Foods, Inc. | | 449,400 | | | 10,691,226 |
| | | | |
|
|
| | | | | | 20,599,785 |
| | | | |
|
|
Independent Power Producers & Energy Traders — 2.7% | | | | | |
NRG Energy, Inc.(a)(b) | | 238,100 | | | 10,319,254 |
| | | | |
|
|
Insurance — 2.6% | | | | | |
American International Group, Inc. | | 169,800 | | | 9,899,340 |
| | | | |
|
|
Internet & Catalog Retail — 2.4% | | | | | |
Amazon.com, Inc.(a)(b) | | 98,100 | | | 9,087,984 |
| | | | |
|
|
Internet Software & Services — 3.0% | | | | | |
Google, Inc. (Class A Stock)(a) | | 16,700 | | | 11,547,716 |
| | | | |
|
|
Life Sciences Tools & Services — 2.4% | | | | | |
Thermo Fisher Scientific, Inc.(a) | | 161,100 | | | 9,292,248 |
| | | | |
|
|
Media — 4.6% | | | | | |
Comcast Corp. (Class A)(a)(b) | | 511,200 | | | 9,334,512 |
XM Satellite Radio Holdings, Inc. (Class A Stock)(a) | | 675,300 | | | 8,265,672 |
| | | | |
|
|
| | | | | | 17,600,184 |
| | | | |
|
|
SEE NOTES TO FINANCIAL STATEMENTS.
A21
| | | | |
| | | JENNISON 20/20 FOCUS PORTFOLIO (Continued) | | |
SCHEDULE OF INVESTMENTS | December 31, 2007 |
| | | | | | |
COMMON STOCKS
(continued) | | Shares
| | Value
(Note 2)
| |
| | | | | | | |
Multiline Retail — 1.3% | | | | | | |
Saks, Inc.(a)(b) | | 231,200 | | $ | 4,799,712 | |
| | | | |
|
|
|
Multi-Utilities — 2.6% | | | | | | |
Sempra Energy | | 157,600 | | | 9,752,288 | |
| | | | |
|
|
|
Oil, Gas & Consumable Fuels — 8.8% | | | | | | |
Southwestern Energy Co.(a) | | 216,900 | | | 12,085,668 | |
Suncor Energy, Inc. | | 111,600 | | | 12,134,268 | |
Williams Cos., Inc. | | 261,700 | | | 9,363,626 | |
| | | | |
|
|
|
| | | | | | 33,583,562 | |
| | | | |
|
|
|
Pharmaceuticals — 8.5% | | | | | | |
Abbott Laboratories | | 169,900 | | | 9,539,885 | |
Elan Corp. PLC, ADR (Ireland)(a) | | 256,300 | | | 5,633,474 | |
Roche Holding AG, ADR (Switzerland) | | 106,900 | | | 9,129,260 | |
Wyeth | | 179,100 | | | 7,914,429 | |
| | | | |
|
|
|
| | | | | | 32,217,048 | |
| | | | |
|
|
|
Software — 6.0% | | | | | | |
Adobe Systems, Inc.(a) | | 159,300 | | | 6,806,889 | |
Microsoft Corp. | | 248,200 | | | 8,835,920 | |
Symantec Corp.(a) | | 434,900 | | | 7,019,286 | |
| | | | |
|
|
|
| | | | | | 22,662,095 | |
| | | | |
|
|
|
Specialty Retail — 3.0% | | | | | | |
Best Buy Co., Inc.(b) | | 217,600 | | | 11,456,640 | |
| | | | |
|
|
|
Wireless Telecommunication Services — 2.4% | | | | | | |
Sprint Nextel Corp. | | 686,700 | | | 9,016,371 | |
| | | | |
|
|
|
TOTAL LONG TERM INVESTMENTS
(cost $311,238,913) | | | 362,964,290 | |
| | | | |
|
|
|
| SHORT-TERM INVESTMENT — 22.1% | | | | | | |
Affiliated Money Market Mutual Fund | | | | | | |
Dryden Core Investment Fund — Taxable Money Market Series
(cost $83,833,076; includes $71,418,433 of cash collateral received for securities on loan)(Note 4)(c)(d) | | 83,833,076 | | | 83,833,076 | |
| | | | |
|
|
|
TOTAL INVESTMENTS — 117.6%
(cost $395,071,989) | | | 446,797,366 | |
LIABILITIES IN EXCESS OF OTHER ASSETS — (17.6%) | | | (66,856,092 | ) |
| | | | |
|
|
|
NET ASSETS — 100.0% | | $ | 379,941,274 | |
| | | | |
|
|
|
The following abbreviation is used in the portfolio descriptions:
| | |
| |
| ADR | | American Depositary Receipt |
| (a) | Non-income producing security. |
| (b) | All or a portion of security is on loan. The aggregate market value of such securities is $68,986,597; cash collateral of $71,418,433 (included in liabilities) was received with which the Portfolio purchased highly liquid short-term investments. |
| (c) | Represents security, or a portion thereof, purchased with cash collateral received for securities on loan. |
| (d) | Prudential Investments LLC, the manager of the Portfolio, also serves as manager of the Dryden Core Investment Fund-Taxable Money Market Series. |
SEE NOTES TO FINANCIAL STATEMENTS.
A22
| | | | |
| | | JENNISON 20/20 FOCUS PORTFOLIO (Continued) | | |
SCHEDULE OF INVESTMENTS | December 31, 2007 |
The industry classification of portfolio holdings and liabilities in excess of other assets shown as a percentage of net assets as of December 31, 2007 was as follow:
| | | |
Affiliated Money Market Mutual Fund (including 18.8% of collateral received for securities on loan) | | 22.1 | % |
Oil, Gas & Consumable Fuels | | 8.8 | |
Pharmaceuticals | | 8.5 | |
Software | | 6.0 | |
Food Products | | 5.4 | |
Biotechnology | | 5.2 | |
Capital Markets | | 5.2 | |
Communications Equipment | | 4.9 | |
Media | �� | 4.6 | |
Diversified Consumer Services | | 4.4 | |
Chemicals | | 3.2 | |
Computers & Peripherals | | 3.2 | |
Internet Software & Services | | 3.0 | |
Specialty Retail | | 3.0 | |
Independent Power Producers & Energy Traders | | 2.7 | |
Aerospace & Defense | | 2.6 | |
Insurance | | 2.6 | |
Multi-Utilities | | 2.6 | |
Beverages | | 2.5 | |
Commercial Services & Supplies | | 2.5 | |
Internet & Catalog Retail | | 2.4 | |
Life Sciences Tools & Services | | 2.4 | |
Wireless Telecommunication Services | | 2.4 | |
Energy Equipment & Services | | 2.3 | |
Food & Staples Retailing | | 2.3 | |
Electrical Equipment | | 1.5 | |
Multiline Retail | | 1.3 | |
| | |
|
|
| | | 117.6 | |
Liabilities in excess of other assets | | (17.6 | ) |
| | |
|
|
| | | 100.0 | % |
| | |
|
|
SEE NOTES TO FINANCIAL STATEMENTS.
A23
| | | | |
| | | JENNISON 20/20 FOCUS PORTFOLIO (Continued) | | |
STATEMENT OF ASSETS AND LIABILITIES
December 31, 2007
| | | |
| ASSETS | | | |
Investments, at value including securities on loan of $68,986,597: | | | |
Unaffiliated investments (cost $311,238,913) | | $ | 362,964,290 |
Affiliated investments (cost $83,833,076) | | | 83,833,076 |
Cash | | | 1,657,695 |
Receivable for investments sold | | | 2,159,940 |
Receivable for Series shares sold | | | 1,052,146 |
Dividends receivable | | | 337,242 |
Prepaid expenses | | | 3,845 |
| | |
|
|
Total Assets | | | 452,008,234 |
| | |
|
|
| LIABILITIES | | | |
Collateral for securities on loan | | | 71,418,433 |
Management fee payable | | | 239,570 |
Payable for Series shares repurchased | | | 145,254 |
Accrued expenses and other liabilities | | | 118,983 |
Distribution fee payable | | | 57,972 |
Payable for investments purchased | | | 50,986 |
Administration fee payable | | | 34,783 |
Transfer agent fee payable | | | 979 |
| | |
|
|
Total Liabilities | | | 72,066,960 |
| | |
|
|
| NET ASSETS | | $ | 379,941,274 |
| | |
|
|
Net assets were comprised of: | | | |
Paid-in capital | | $ | 304,955,113 |
Retained earnings | | | 74,986,161 |
| | |
|
|
Net assets, December 31, 2007 | | $ | 379,941,274 |
| | |
|
|
| Class I: | | | |
Net asset value and redemption price per share, $86,638,733 / 5,417,331 outstanding shares of beneficial interest | | $ | 15.99 |
| | |
|
|
| Class II: | | | |
Net asset value and redemption price per share, $293,302,541 / 18,582,976 outstanding shares of beneficial interest | | $ | 15.78 |
| | |
|
|
STATEMENT OF OPERATIONS
Year Ended December 31, 2007
| | | |
| INVESTMENT INCOME | | | |
Unaffiliated dividend income (net of foreign withholding taxes of $36,368) | | $ | 3,266,522 |
Affiliated dividend income | | | 662,167 |
Affiliated income from securities loaned, net | | | 323,236 |
| | |
|
|
| | | | 4,251,925 |
| | |
|
|
| EXPENSES | | | |
Management fee | | | 2,602,684 |
Distribution fee—Class II | | | 637,702 |
Administration fee—Class II | | | 382,621 |
Shareholders’ reports | | | 78,000 |
Transfer agent’s fee and expenses (including affiliated expense of $4,200) (Note 4) | | | 57,000 |
Custodian’s fees and expenses | | | 50,000 |
Audit fee | | | 16,000 |
Trustees’ fees | | | 15,000 |
Legal fees and expenses | | | 7,000 |
Insurance expenses | | | 6,000 |
Miscellaneous | | | 8,360 |
| | |
|
|
Total expenses | | | 3,860,367 |
| | |
|
|
| NET INVESTMENT INCOME | | | 391,558 |
| | |
|
|
| NET REALIZED AND UNREALIZED GAIN (LOSS) ON INVESTMENTS | | | |
Net realized gain on investment transactions | | | 22,867,447 |
Net change in unrealized appreciation (depreciation) on investments | | | 7,758,740 |
| | |
|
|
| NET GAIN ON INVESTMENTS | | | 30,626,187 |
| | |
|
|
| NET INCREASE IN NET ASSETS RESULTING FROM OPERATIONS | | $ | 31,017,745 |
| | |
|
|
STATEMENT OF CHANGES IN NET ASSETS
| | | | | | | | |
| | | Year Ended December 31, | |
| | | 2007
| | | 2006
| |
| INCREASE (DECREASE) IN NET ASSETS | | | | | | | | |
| OPERATIONS: | | | | | | | | |
Net investment income | | $ | 391,558 | | | $ | 857,995 | |
Net realized gain on investment transactions | | | 22,867,447 | | | | 34,706,334 | |
Net change in unrealized appreciation (depreciation) on investments and foreign currencies | | | 7,758,740 | | | | (791,103 | ) |
| | |
|
|
| |
|
|
|
NET INCREASE IN NET ASSETS RESULTING FROM OPERATIONS | | | 31,017,745 | | | | 34,773,226 | |
| | |
|
|
| |
|
|
|
| DISTRIBUTIONS: | | | | | | | | |
Class I | | | (8,455,776 | ) | | | (5,908,325 | ) |
Class II | | | (27,025,596 | ) | | | (10,853,728 | ) |
| | |
|
|
| |
|
|
|
TOTAL DISTRIBUTIONS | | | (35,481,372 | ) | | | (16,762,053 | ) |
| | |
|
|
| |
|
|
|
| SERIES SHARE TRANSACTIONS (Note 7): | | | | | | | | |
Series shares sold | | | 129,279,557 | | | | 82,524,252 | |
Series shares issued in reinvestment of distributions | | | 35,481,372 | | | | 16,762,053 | |
Series shares repurchased | | | (91,831,050 | ) | | | (48,978,942 | ) |
| | |
|
|
| |
|
|
|
NET INCREASE IN NET ASSETS RESULTING FROM SERIES SHARE TRANSACTIONS | | | 72,929,879 | | | | 50,307,363 | |
| | |
|
|
| |
|
|
|
| TOTAL INCREASE IN NET ASSETS | | | 68,466,252 | | | | 68,318,536 | |
| NET ASSETS: | | | | | | | | |
Beginning of year | | | 311,475,022 | | | | 243,156,486 | |
| | |
|
|
| |
|
|
|
End of year | | $ | 379,941,274 | | | $ | 311,475,022 | |
| | |
|
|
| |
|
|
|
SEE NOTES TO FINANCIAL STATEMENTS.
A24
NOTES TO THE FINANCIAL STATEMENTS OF
THE PRUDENTIAL SERIES FUND
The Prudential Series Fund (“Series Fund”), organized as a Delaware statutory trust, is a diversified open-end management investment company registered under the Investment Company Act of 1940, as amended. On January 2, 2006, each Portfolio of the Fund changed its federal income tax status from a regulated investment company to a partnership. As a result of that conversion, the Series Fund was reorganized from a Maryland corporation to a Delaware statutory trust. Pursuant to this reorganization, the Fund has been renamed “The Prudential Series Fund.” The Series Fund is composed of thirty-two Portfolios (“Portfolio” or “Portfolios”), each with a separate series shares. The information presented in these financial statements pertains to two Portfolios: Diversified Conservative Growth Portfolio and Jennison 20/20 Focus Portfolio.
The Portfolios of the Series Fund have the following as investment objectives:
Diversified Conservative Growth Portfolio: Current income and a reasonable level of capital appreciation by investing primarily in a diversified portfolio of debt and equity securities.
Jennison 20/20 Focus Portfolio: Long-term growth of capital by investing primarily in up to 40 equity securities of U.S. companies that the Portfolio manager believes to have strong capital appreciation potential.
The ability of issuers of debt securities (other than those issued or guaranteed by the U.S. Government) held by the Portfolios to meet their obligations may be affected by the economic or political developments in a specific industry, region or country.
Foreign security and currency transactions may involve certain considerations and risks not typically associated with those of domestic origin as a result of, among other factors, the possibility of political and economic instability or the level of governmental supervision and regulation of foreign securities markets.
| Note 2: | | Accounting Policies |
The following is a summary of significant accounting policies followed by the Series Fund and the Portfolios in preparation of their financial statements.
Securities Valuation: Securities listed on a securities exchange are valued at the last sale price on such exchange on the day of valuation or, if there was no sale on such day, at the mean between the last reported bid and asked prices, or at the last bid price on such day in the absence of an asked price. Securities traded via NASDAQ are valued at the official closing price provided by NASDAQ. Securities that are actively traded in the over-the-counter market, including listed securities for which the primary market is believed by Prudential Investments LLC (“PI” or “Manager”) in consultation with the subadviser, to be over-the-counter, are valued at market value using prices provided by an independent pricing agent or principal market maker. Options on securities and indices traded on an exchange are valued at the last sale price as of the close of trading on the applicable exchange or, if there was no sale, at the mean between the most recently quoted bid and asked prices on such exchange, or at the last bid price in the absence of an asked price. Futures contracts and options thereon traded on a commodities exchange or board of trade are valued at the last sale price at the close of trading on such exchange or board of trade or, if there was no sale on the applicable commodities exchange or board of trade on such day, at the mean between the most recently quoted bid and asked prices on such exchange or board of trade or at the last bid price in the absence of an asked price. Prices may be obtained from independent pricing services which use information provided by market makers or estimates of market values obtained from yield data relating to investments or securities with similar characteristics. Securities for which reliable market quotations are not readily available, or whose values have been affected by events occurring after the close of the security’s foreign market and before the Series Fund’s normal pricing time, are valued at fair value in accordance with Board of Trustees approved fair valuation procedures. When determining the fair valuation of securities some of the factors influencing the valuation include, the nature of any restrictions on disposition of the securities; assessment of the general liquidity of the securities; the issuer’s financial condition and the markets in which it does business; the cost of the investment; the size of the holding and the capitalization of the issuer; the prices of any recent transactions or bids/offers for such securities of any comparable securities; any available analyst media or other reports or information deemed reliable by the investment adviser regarding the issuer or the markets or industry in which it operates. Using
B1
fair value to price securities may result in a value that is different from a security’s most recent closing price and from the price used by other mutual funds to calculate their net asset values. As of December 31, 2007, the Portfolios held no foreign securities whose value required adjustment in accordance with such procedures.
Investments in mutual funds are valued at their net asset value as of the close of the New York Stock Exchange on the date of valuation.
Short-term debt securities that are held in the Portfolios which mature in more than 60 days are valued at current market quotations and those short-term debt securities which mature in 60 days or less are valued at amortized cost which approximates market value. The amortized cost method values a security at its cost at the time of purchase and thereafter assumes a constant amortization to maturity of any discount or premium.
Repurchase Agreements: In connection with transactions in repurchase agreements with United States financial institutions, it is the Series Fund’s policy that its custodian or designated subcustodians, as the case may be, under triparty repurchase agreements, take possession of the underlying collateral securities, the value of which exceeds the principal amount of the repurchase transaction, including accrued interest. To the extent that any repurchase transaction exceeds one business day, the value of the collateral is marked to market on a daily basis to ensure the adequacy of the collateral. If the seller defaults or the value of the collateral declines, or if bankruptcy proceedings are commenced with respect to the seller of the security, realization of the collateral by the Series Fund may by delayed or limited.
Foreign Currency Translation: The books and records of the Series Fund are maintained in U.S. dollars. Foreign currency amounts are translated into U.S. dollars on the following basis:
(i) market value of investment securities, other assets and liabilities – at the current daily rates of exchange.
(ii) purchases and sales of investment securities, income and expenses – at the rates of exchange prevailing on the respective dates of such transactions.
Although the net assets of the Series Fund are presented at the foreign exchange rates and market values at the close of the year, the Series Fund does not isolate that portion of the results of operations arising as a result of changes in the foreign exchange rates from the fluctuations arising from changes in the market prices of securities held at the end of the period. Similarly, the Series Fund does not isolate the effect of changes in foreign exchange rates from the fluctuations arising from changes in the market prices of portfolio securities sold during the period. Accordingly, these realized foreign currency gains (losses) are included in the reported net realized gains (losses) on investment transactions.
Net realized gains (losses) on foreign currency transactions represent net foreign exchange gains (losses) from the holding of foreign currencies, currency gains (losses) realized between the trade date and settlement date on securities transactions, and the difference between the amounts of dividends, interest and foreign withholding taxes recorded on the Series Fund’s books and the U.S. dollar equivalent amounts actually received or paid. Net unrealized currency gains (losses) from valuing foreign currency denominated assets and liabilities (other than investments) at period end exchange rates are reflected as a component of net unrealized appreciation (depreciation) on investments and foreign currencies.
Forward Currency Contracts: A forward currency contract is a commitment to purchase or sell a foreign currency at a future date at a negotiated forward rate. Certain Portfolios of the Series Fund may enter into forward currency contracts in order to hedge their exposure to changes in foreign currency exchange rates on their foreign portfolio holdings or on specific receivables and payables denominated in a foreign currency. The contracts are valued daily at current forward exchange rates and any unrealized gain (loss) is included in assets and liabilities on the financial statements. Gain (loss) is realized on the settlement date of the contract equal to the difference between the settlement value of the original and negotiated forward contracts. This gain (loss), if any, is included in net realized gain (loss) on foreign currency transactions. Risks may arise upon entering into these contracts from the potential inability of the counterparties to meet the terms of their contracts.
Floating-Rate Notes Issued in Conjunction with Securities Held: The Portfolios invest in inverse floating rate securities (“inverse floaters”) that pay interest at a rate that varies inversely with short-term interest rates. Certain of these securities may be leveraged, whereby the interest rate varies inversely at a multiple of the change in short-term rates. As interest rates rise, inverse floaters provide less current income. The price of such securities is more volatile than comparable fixed rate securities.
B2
When the Portfolios enter into agreements to create inverse floaters and floater note securities (also known as Tender Option Bond Transactions), the Portfolios transfer a fixed rate bond to a broker for cash. At the same time the Portfolios buy (receive) a residual interest in a trust (the “trust”) set up by the broker, often referred to as an inverse floating rate obligation (inverse floaters). Generally, the broker deposits a fixed rate bond (the “fixed rate bond”) into the trust with the same CUSIP number as the fixed rate bond sold to the broker by the Portfolio. The trust also issues floating rate notes (“floating rate notes”) which is sold to third parties. The floating rate notes have interest rates that reset weekly. The inverse floater held by the Portfolio gives the Portfolio the right (1) to cause the holders of the floating rate notes to tender their notes at par, and (2) to have the broker transfer the fixed rate bond held by the trust to the Portfolio thereby collapsing the trust. In accordance with FAS Statement No. 140, the Portfolio’s account for the transaction described above as funded leverage by including the fixed rate bond in its Portfolio of Investments, and accounts for the floating rate notes as a liability under the caption “payable for floating rate notes issued” in the Portfolio’s “Statement of Assets and Liabilities.”
The Portfolio’s investment policies and restrictions permit investments in inverse floating rate securities. Inverse floaters held by the Portfolio are securities exempt from registration under Rules 144A of the Securities Act of 1933.
Short Sales: Certain portfolios of the Series Fund may sell a security it does not own in anticipation of a decline in the market value of that security (short sale). When a Portfolio makes a short sale, it must borrow the security sold short and deliver it to the broker-dealer through which it made the short sale as collateral for its obligation to deliver the security upon conclusion of the transaction. The Portfolio may have to pay a fee to borrow the particular security and may be obligated to remit any interest or dividends received on such borrowed securities. Dividends declared on short positions open on record date are recorded on the ex-date and interest payable is accrued daily on fixed income securities sold short, both of which are recorded as an expense. A gain, limited to the price at which the Portfolio sold the security short, or a loss, unlimited in magnitude, will be recognized upon the termination of a short sale if the market price at termination is less than or greater than, respectively, the proceeds originally received.
Options: The Series Fund may either purchase or write options in order to hedge against adverse market movements or fluctuations in value caused by changes in prevailing interest rates or foreign currency exchange rates or currencies with respect to securities which the Series Fund currently owns or intends to purchase. The Series Fund’s principal reason for writing options is to realize, through receipt of premiums, a greater current return than would be realized on the underlying security alone. When the Series Fund purchases an option, it pays a premium and an amount equal to that premium is recorded as an asset. When the Series Fund writes an option, it receives a premium and an amount equal to that premium is recorded as a liability. The asset or liability is adjusted daily to reflect the current market value of the option. If an option expires unexercised, the Series Fund realizes a gain (loss) to the extent of the premium received or paid. If an option is exercised, the premium received or paid is recorded as an adjustment to the proceeds from the sale or the cost basis of the purchase in determining whether the Series Fund has realized a gain (loss). The difference between the premium and the amount received or paid on effecting a closing purchase or sale transaction is also treated as a realized gain (loss). Gains (losses) on purchased options are included in net realized gains (losses) on investment transactions. Gains (losses) on written options are presented separately as net realized gains (losses) on written option transactions.
The Series Fund, as writer of an option, may have no control over whether the contract may be exercised. As a result, the Series Fund bears the market risk of an unfavorable change in the price of the security underlying the written option. The Series Fund, as purchaser of an option, bears the risk of the potential inability of the counterparties to meet the terms of their contracts.
Financial Futures Contracts: A financial futures contract is an agreement to purchase (long) or sell (short) an agreed amount of securities at a set price for delivery on a future date. Upon entering into a financial futures contract, the Series Fund is required to pledge to the broker an amount of cash and/or other assets equal to a certain percentage of the contract amount. This amount is known as the “initial margin”. Subsequent payments, known as “variation margin”, are made or received by the Series Fund each day, depending on the daily fluctuations in the value of the underlying security. Such variation margin is recorded for financial statement purposes on a daily basis as unrealized gain (loss). When the contract expires or is closed, the gain (loss) is realized and is presented in the Statement of Operations as net realized gain (loss) on financial futures contracts.
B3
The Series Fund invests in financial futures contracts in order to hedge its existing portfolio securities, or securities the Series Fund intends to purchase, against fluctuations in value caused by changes in prevailing rates or market conditions. Under a variety of circumstances, the Series Fund may not achieve the anticipated benefits of the financial futures contracts and may realize a loss. The use of futures transactions involves the risk of imperfect correlation in movements in the price of futures contracts and the underlying hedged assets.
Swap Agreements: The Portfolios may enter into interest rate swap agreements, forward swap spread lock agreements, and credit default swap agreements. A swap agreement is an agreement to exchange the return generated by one instrument for the return generated by another instrument. Interest rate swap agreements involve the exchange by the Portfolio with another party of their respective commitments to pay or receive interest. Forward spread lock swap agreements involve commitments to pay or receive a settlement amount calculated as the difference between the swap spread and a fixed spread, multiplied by the notional amount times the duration of the swap. The swap spread is the difference between the benchmark swap rate (market rate) and the specific Treasury rate. In a credit default swap agreement, one party (the protection buyer) makes a stream of payments to another party (the protection seller) in exchange for the right to receive a specified payment in the event of a default by a third party, typically corporate issues or sovereign issues of an emerging country, on its obligation. The maximum amount of the payment may equal the notional, at par, of the underlying index or security as a result of a default (or “credit event”). In addition to bearing the risk that the credit event will occur, the Portfolios could be exposed to market risk due to unfavorable changes in interest rates or in the price of the underlying security or index, the possibility that the fund may be unable to close out its position at the same time or at the same price as if it had purchased comparable publicly traded securities, or that the counterparty may default on it’s obligation to perform. The swaps are valued daily at current market value and any change in value is included in net unrealized appreciation or depreciation on investments. Payments received or paid by the Portfolio are recorded as realized gains or losses. Risk of loss may exceed amounts recognized on the statements of assets and liabilities. Swap agreements outstanding at period end, if any, are listed on the Schedule of Investments.
Forward currency contracts, written options, short sales, swaps and financial futures contracts involve elements of both market and credit risk in excess of the amounts reflected on the Statement of Assets and Liabilities.
Securities Lending: The Series Fund may lend its portfolio securities to broker-dealers. The loans are secured by collateral at least equal at all times to the market value of the securities loaned. Loans are subject to termination at the option of the borrower or the Series Fund. Upon termination of the loan, the borrower will return to the Portfolio securities identical to the loaned securities. Should the borrower of the securities fail financially, the Series has the right to repurchase the securities using the collateral in the open market. The Series Fund recognizes income, net of any rebate and securities lending agent fees, for lending its securities in the form of fees or interest on the investment of any cash received as collateral. The Series Fund also continues to receive interest and dividends or amounts equivalent thereto on the securities loaned and recognizes any unrealized gain or loss in the market price of the securities loaned that may occur during the term of the loan.
Dollar Rolls: The Fund enters into mortgage dollar rolls in which the Fund sells mortgage securities for delivery in the current month, realizing a gain (loss), and simultaneously contracts to repurchase somewhat similar (same type, coupon and maturity) securities on a specified future date. During the roll period, the Fund forgoes principal and interest paid on the securities. The Fund is compensated by the interest earned on the cash proceeds of the initial sale and by the lower repurchase price at the future date. The difference between the sales proceeds and the lower repurchase price is recorded as a realized gain. The Fund maintains a segregated account, the dollar value of which is a least equal to its obligations, with respect to dollar rolls.
When-Issued/Delayed Delivery Securities: Securities purchased or sold on a when-issued or delayed delivery basis may be settled a month or more after trade date; interest income is not accrued until settlement date. At the time a Portfolio enters into such transactions, it instructs the custodian to segregate assets with a current value at least equal to the amount of its when-issued or delayed-delivery purchase commitments.
Securities Transactions and Net Investment Income: Securities transactions are recorded on the trade date. Realized gains (losses) on sales of securities are calculated on the identified cost basis. Dividend income is recorded on the ex-dividend date; interest income, which is comprised of four elements: stated coupon, original issue discount, market discount and market premium, is recorded on the accrual basis. Expenses are recorded on the accrual basis. The Series Fund’s expenses are allocated to the respective Portfolios on the
B4
basis of relative net assets except for Portfolio specific expenses which are attributable directly to a Portfolio or class level.
For Portfolios with multiple classes of shares, net investment income (loss) (other than administration and distribution fees, which are charged to the respective class) and unrealized and realized gains (losses) are allocated daily to each class of shares based upon the relative proportion of net assets of each class at the beginning of the day.
Taxes: For federal income tax purposes, each Portfolio in the Series is treated as a separate taxpaying entity. The are treated as partnerships for tax purposes. No provision has been made in the financial statements for U.S. Federal, state, or local taxes, as any tax liability arising from operations of the Portfolios are the responsibility of their partners. The Portfolios are not subject to tax. Partners of each Portfolio are subject to taxes on their distributive share of partnership items.
Withholding taxes on foreign dividends, interest and capital gains have been provided for in accordance with the Series Fund’s understanding of the applicable country’s tax rules and regulations.
Distributions: Distributions from each Portfolio are made in cash and automatically reinvested in additional shares of the same Portfolio. The Portfolios make distributions, if any, at least annually. Distributions are recorded on the ex-date.
Estimates: The preparation of financial statements requires management to make estimates and assumptions that affect the reported amounts and disclosures in the financial statements. Actual results could differ from these estimates.
The Series Fund has a management agreement with PI. Pursuant to this agreement PI has responsibility for all investment advisory services and supervises the subadvisers’ performance of such services. PI has entered into subadvisory agreements with Prudential Investment Management, Inc. (“PIM”), Jennison Associates LLC (“Jennison”), RS Investment Management, L.P. (“RS”), Pacific Investment Management Company LLC (“PIMCO”) and EARNEST Partners LLC (“EARNEST”) (collectively, the “Subadvisers”), under which each provides investment advisory services for certain Portfolios of the Series Fund. PI pays for the services of the Subadvisers, compensation of officers of the Series Fund, occupancy and certain clerical and administrative expenses of the Series Fund. The Series Fund bears all other costs and expenses.
The management fee paid to PI is computed daily and payable monthly, at the annual rates specified below, of the value of each of the Portfolio’s average daily net assets.
| | | | |
Portfolio
| | Management Fee
| | Effective
Management Fee
|
Diversified Conservative Growth Portfolio | | 0.75% | | 0.75% |
Jennison 20/20 Focus Portfolio | | 0.75 | | 0.75 |
At December 31, 2007 the Subadvisers that provide investment advisory services to the Portfolios are as follows. Where more than one Subadviser is listed, each Subadviser provides services to a segment of the Portfolio:
| | |
Portfolio
| | Subadviser(s)
|
Diversified Conservative Growth Portfolio | | EARNEST, RS, Jennison, PIMCO, PIM |
Jennison 20/20 Focus Portfolio | | Jennison |
The Series Fund has a distribution agreement with Prudential Investment Management Services LLC (“PIMS”) which acts as the distributor of the Class I and Class II shares of the Series Fund. The Series Fund compensates PIMS for distributing and servicing the Series Fund’s Class II shares pursuant to a plan of distribution (the “Class II Plan”), regardless of expenses actually incurred by PIMS. The distribution fees are accrued daily and payable monthly. No distribution or service fees are paid to PIMS as distributor of the Class I shares of the Series Fund. Pursuant to the Class II Plan, the Class II shares of each Portfolio compensate PIMS for distribution-related activities at an annual rate of 0.25% of the average daily net assets of the Class II shares.
B5
The Series Fund has an administration agreement with PI which acts as the administrator of the Class II shares of the Series Fund. The administration fee paid to PI is accrued daily and payable monthly, at the annual rate of 0.15% of the average daily net assets of the Class II shares.
PIMS, PI, PIM and Jennison are indirect, wholly-owned subsidiaries of Prudential Financial, Inc. (“Prudential”).
| Note 4: | | Other Transactions with Affiliates |
Prudential Mutual Fund Services LLC (“PMFS”), an affiliate of PI and an indirect, wholly-owned subsidiary of Prudential, serves as the Series Fund’s transfer agent. Transfer agent fees and expenses in the Statements of Operations include certain out-of-pocket expenses paid to non-affiliates, where applicable.
For the year ended December 31, 2007, Prudential Equity Group, LLC, an indirect wholly-owned subsidiary of Prudential, and Wachovia Securities LLC, an affiliate of PI, earned brokerage commissions from transactions executed on behalf of the Series Fund Portfolios as follows:
| | | | | | |
Portfolio
| | Prudential
Equity Group
| | Wachovia
|
Diversified Conservative Growth Portfolio | | $ | 250 | | $ | — |
Jennison 20/20 Focus Portfolio | | | — | | | 10,700 |
PIM also serves as the Series Fund’s security lending agent. For the year ended December 31, 2007, PIM was compensated $138,530 for these services for the Jennison 20/20 Focus Portfolio. Certain Portfolios invest in the Taxable Money Market Series (the “Portfolio”), a portfolio of Dryden Core Investment Fund, pursuant to an exemptive order received from the Securities and Exchange Commission. The Portfolio is a money market mutual fund registered under the Investment Company Act of 1940, as amended, and managed by PI.
| Note 5: | | Portfolio Securities |
The aggregate cost of purchases and the proceeds from the sales of securities (excluding government securities and short-term issues) for the year ended December 31, 2007 were as follows:
Cost of Purchases:
| | | |
Portfolio
| | |
Diversified Conservative Growth Portfolio | | $ | 448,651,737 |
Jennison 20/20 Focus Portfolio | | | 420,980,496 |
Proceeds from Sales:
| | | |
Portfolio
| | |
Diversified Conservative Growth Portfolio | | $ | 449,940,648 |
Jennison 20/20 Focus Portfolio | | | 386,532,042 |
The Diversified Conservative Growth Portfolio’s written options activity for the year ended December 31, 2007 was as follows:
| | | | | | | |
| | | Diversified Conservative Growth
| |
| | | Number of
Contracts/
Swap Notional
Amount
| | | Premium
| |
Balance at beginning of year | | 5,700,000 | | | $ | 66,952 | |
Written options | | 47,600,000 | | | | 333,808 | |
Expired options | | (2,000,000 | ) | | | (3,828 | ) |
Exercised options | | — | | | | — | |
Closed options | | (33,900,000 | ) | | | (48,566 | ) |
| | |
|
| |
|
|
|
Balance at end of year | | 17,400,000 | | | $ | 348,366 | |
| | |
|
| |
|
|
|
B6
For federal income tax purposes, each Portfolio in the Trust is treated as a separate taxpaying entity. After January 2, 2006, the Portfolios are treated as partnerships for tax purposes. No provision has been made in the financial statements for U.S. Federal, state, or local taxes, as any tax liability arising from operations of the Portfolios are the responsibility of their partners. The Portfolios are not subject to tax. Partners of each Portfolio are subject to taxes on their distributive share of partnership items. The Portfolios’ federal and state income tax returns for tax years for which the applicable statutes of limitations have not expired are subject to examination by the Internal Revenue Service and state departments of revenue.
Prior to January 2, 2006 each Portfolio qualified as a regulated investment company under the Internal Revenue Code and distributed all of its taxable income, including any net realized gains on investments, to shareholders.
With respect to the Portfolios, book cost of assets differs from tax cost of assets as a result of each Portfolio’s adoption of a mark to market method of accounting for tax purposes. Under this method, tax cost of assets will approximate its fair market value.
The Series Fund offers Class I and Class II shares. Neither Class I nor Class II shares of a Portfolio are subject to any sales charge or redemption charge and are sold at the net asset value of the Portfolio. Class I shares are sold only to certain separate accounts of Prudential to fund benefits under certain variable life insurance and variable annuity contracts (“contracts”). Class II shares are sold only to separate accounts of non-Prudential insurance companies as investment options under certain contracts. The separate accounts invest in shares of the Series Fund through subaccounts that correspond to the Portfolios. The separate accounts will redeem shares of the Series Fund to the extent necessary to provide benefits under the contracts or for such other purposes as may be consistent with the contracts. As of December 31, 2007, the Jennison 20/20 Focus Portfolio has Class II shares outstanding.
Transactions in shares of beneficial interest of the Jennison 20/20 Focus were as follows:
| | | | | | | |
Class I
| | Shares
| | | Amount
| |
Year ended December 31, 2007: | | | | | | | |
Series shares sold | | 165,929 | | | $ | 2,774,313 | |
Series shares issued in reinvestment of distributions | | 528,156 | | | | 8,455,776 | |
Series shares repurchased | | (1,091,749 | ) | | | (18,624,166 | ) |
| | |
|
| |
|
|
|
Net increase (decrease) in shares outstanding | | (397,664 | ) | | $ | (7,394,077 | ) |
| | |
|
| |
|
|
|
Year ended December 31, 2006: | | | | | | | |
Series shares sold | | 598,054 | | | $ | 9,065,259 | |
Series shares issued in reinvestment of distributions | | 401,108 | | | | 5,908,325 | |
Series shares repurchased | | (773,182 | ) | | | (11,540,414 | ) |
| | |
|
| |
|
|
|
Net increase (decrease) in shares outstanding | | 225,980 | | | $ | 3,433,170 | |
| | |
|
| |
|
|
|
| | |
Class II
| | | | | | |
Year ended December 31, 2007: | | | | | | | |
Series shares sold | | 7,494,671 | | | $ | 126,505,244 | |
Series shares issued in reinvestment of distributions | | 1,709,399 | | | | 27,025,596 | |
Series shares repurchased | | (4,436,889 | ) | | | (73,206,884 | ) |
| | |
|
| |
|
|
|
Net increase (decrease) in shares outstanding | | 4,767,181 | | | $ | 80,323,956 | |
| | |
|
| |
|
|
|
Year ended December 31, 2006: | | | | | | | |
Series shares sold | | 4,940,311 | | | $ | 73,458,993 | |
Series shares issued in reinvestment of distributions | | 743,915 | | | | 10,853,728 | |
Series shares repurchased | | (2,612,426 | ) | | | (37,438,528 | ) |
| | |
|
| |
|
|
|
Net increase (decrease) in shares outstanding | | 3,071,800 | | | $ | 46,874,193 | |
| | |
|
| |
|
|
|
B7
The Series Fund, along with other affiliated registered investment companies (the “Funds”), is a party to a syndicated credit agreement (“SCA”) with two banks. The SCA provides for a commitment of $500 million. Interest on any borrowings under the SCA is incurred at contracted market rates and a commitment fee for the unused amount is accrued daily and paid quarterly. Effective October 26, 2007, the Funds renewed the SCA with the banks. The Funds pays a commitment fee of .06 of 1% of the unused portion of the SCA. The expiration date of the SCA will be October 24, 2008. For the period from October 27, 2006 through October 26, 2007, the Funds paid a commitment fee of .07 of 1% of the unused portion of the agreement. The purpose of the SCA is to provide an alternative source of temporary funding for capital share redemptions. The Portfolios did not utilize the line of credit during the year ended December 31, 2007.
| Note 9: | | Ownership and Affiliates |
As of December 31, 2007, all of Class I shares of each Portfolio were owned of record by the Prudential Insurance Company of America (“PICA”) on behalf of the owners of the variable insurance products issued by PICA.
| Note 10: | | New Accounting Pronouncements |
On September 20, 2006, the FASB released Statement of Financial Accounting Standards No. 157 “Fair Value Measurements” (FAS 157). FAS 157 establishes an authoritative definition of fair value, sets out a framework for measuring fair value, and requires additional disclosures about fair-value measurements. The application of FAS 157 is required for fiscal years beginning after November 15, 2007 and interim periods within those fiscal years. At this time, management is evaluating the implications of FAS 157 and its impact, if any, in the financial statements has not yet been determined.
B8
Financial Highlights
| | | | | | | | | | | | | | | | | | | | |
| | | Diversified Conservative Growth Portfolio
| |
| | | Year Ended
December 31,
| |
| | | 2007
| | | 2006
| | | 2005
| | | 2004
| | | 2003
| |
Per Share Operating Performance: | | | | | | | | | | | | | | | | | | | | |
Net Asset Value, beginning of year | | $ | 12.06 | | | $ | 11.67 | | | $ | 11.28 | | | $ | 10.63 | | | $ | 9.17 | |
| | |
|
|
| |
|
|
| |
|
|
| |
|
|
| |
|
|
|
Income From Investment Operations: | | | | | | | | | | | | | | | | | | | | |
Net investment income | | | .45 | | | | .39 | | | | .34 | | | | .26 | | | | .32 | |
Net realized and unrealized gain on investments | | | .26 | | | | .43 | | | | .39 | | | | .72 | | | | 1.58 | |
| | |
|
|
| |
|
|
| |
|
|
| |
|
|
| |
|
|
|
Total from investment operations | | | .71 | | | | .82 | | | | .73 | | | | .98 | | | | 1.90 | |
| | |
|
|
| |
|
|
| |
|
|
| |
|
|
| |
|
|
|
Less Dividends and Distributions: | | | | | | | | | | | | | | | | | | | | |
Dividends from net investment income | | | — | | | | — | | | | (.34 | ) | | | (.33 | ) | | | (.44 | ) |
Distributions | | | (.93 | ) | | | (.43 | ) | | | — | | | | — | | | | — | |
| | |
|
|
| |
|
|
| |
|
|
| |
|
|
| |
|
|
|
Total distributions | | | (.93 | ) | | | (.43 | ) | | | (.34 | ) | | | (.33 | ) | | | (.44 | ) |
| | |
|
|
| |
|
|
| |
|
|
| |
|
|
| |
|
|
|
Net Asset Value, end of year | | $ | 11.84 | | | $ | 12.06 | | | $ | 11.67 | | | $ | 11.28 | | | $ | 10.63 | |
| | |
|
|
| |
|
|
| |
|
|
| |
|
|
| |
|
|
|
Total Return(a) | | | 5.91 | % | | | 6.92 | % | | | 7.04 | % | | | 9.56 | % | | | 21.57 | % |
Ratios/Supplemental Data: | | | | | | | | | | | | | | | | | | | | |
Net assets, end of year (in millions) | | $ | 128.2 | | | $ | 139.8 | | | $ | 151.4 | | | $ | 167.0 | | | $ | 169.6 | |
Ratios to average net assets(c): | | | | | | | | | | | | | | | | | | | | |
Expenses | | | 1.14 | %(b) | | | .99 | %(b) | | | .95 | % | | | .97 | % | | | .98 | % |
Net investment income | | | 3.16 | % | | | 3.03 | % | | | 2.75 | % | | | 2.29 | % | | | 2.93 | % |
Portfolio turnover rate | | | 322 | % | | | 286 | % | | | 304 | % | | | 186 | % | | | 224 | % |
| (a) | Total return is calculated assuming a purchase of a share on the first day and a sale on the last day of each year reported and includes reinvestment of dividends and distributions. Total return does not reflect expenses associated with the separate account such as administrative fees, account charges and surrender charges which, if reflected, would reduce the total returns for all years shown. Performance figures may reflect voluntary fee waivers and/or expense reimbursements. In the absence of voluntary fee waivers and/or expense reimbursements, the total return would be lower. Past performance is no guarantee of future results. Total returns may reflect adjustments to conform to generally accepted accounting principles. Total returns for periods less than a full year are not annualized. |
| (b) | The expense ratio reflects the interest and fee expense related to the interest expenses on investments sold short and liability for the floating rate notes issued in conjunction with the inverse floater securities. The total expense ratio excluding interest and fees expense was 1.01% and .98% for the years ended December 31, 2007 and 2006, respectively. |
| (c) | Does not include expenses of the underlying portfolio in which the Portfolio invests. |
| | | | | | | | | | | | | | | | | | | | |
| | | Jennison 20/20 Focus Portfolio
| |
| | | Class I
| |
| | | Year Ended
December 31,
| |
| | | 2007(a)
| | | 2006
| | | 2005
| | | 2004
| | | 2003
| |
Per Share Operating Performance: | | | | | | | | | | | | | | | | | | | | |
Net Asset Value, beginning of year | | $ | 16.01 | | | $ | 15.00 | | | $ | 12.37 | | | $ | 10.68 | | | $ | 8.28 | |
| | |
|
|
| |
|
|
| |
|
|
| |
|
|
| |
|
|
|
Income From Investment Operations: | | | | | | | | | | | | | | | | | | | | |
Net investment income | | | .07 | | | | .08 | | | | .06 | | | | .04 | | | | .02 | |
Net realized and unrealized gain on investments | | | 1.63 | | | | 1.95 | | | | 2.60 | | | | 1.66 | | | | 2.40 | |
| | |
|
|
| |
|
|
| |
|
|
| |
|
|
| |
|
|
|
Total from investment operations | | | 1.70 | | | | 2.03 | | | | 2.66 | | | | 1.70 | | | | 2.42 | |
| | |
|
|
| |
|
|
| |
|
|
| |
|
|
| |
|
|
|
Less Dividends and Distributions: | | | | | | | | | | | | | | | | | | | | |
Dividends from net investment income | | | — | | | | — | | | | (.03 | ) | | | (.01 | ) | | | (0.02 | ) |
Distributions | | | (1.72 | ) | | | (1.02 | ) | | | — | | | | — | | | | — | |
| | |
|
|
| |
|
|
| |
|
|
| |
|
|
| |
|
|
|
Total dividends and distributions | | | (1.72 | ) | | | (1.02 | ) | | | (.03 | ) | | | (.01 | ) | | | (0.02 | ) |
| | |
|
|
| |
|
|
| |
|
|
| |
|
|
| |
|
|
|
Net Asset Value, end of year | | $ | 15.99 | | | $ | 16.01 | | | $ | 15.00 | | | $ | 12.37 | | | $ | 10.68 | |
| | |
|
|
| |
|
|
| |
|
|
| |
|
|
| |
|
|
|
Total Return(b) | | | 10.59 | % | | | 14.13 | % | | | 21.59 | % | | | 15.94 | % | | | 29.30 | % |
Ratios/Supplemental Data: | | | | | | | | | | | | | | | | | | | | |
Net assets, end of year (in millions) | | $ | 86.6 | | | $ | 93.1 | | | $ | 83.8 | | | $ | 68.4 | | | $ | 64.6 | |
Ratios to average net assets(c): | | | | | | | | | | | | | | | | | | | | |
Expenses | | | .82 | % | | | .82 | % | | | .87 | % | | | .88 | % | | | .95 | % |
Net investment income | | | .41 | % | | | .58 | % | | | .43 | % | | | .29 | % | | | .18 | % |
Portfolio turnover rate | | | 115 | % | | | 119 | % | | | 93 | % | | | 87 | % | | | 102 | % |
| (a) | Calculated based upon average shares outstanding. |
| (b) | Total return is calculated assuming a purchase of a share on the first day and a sale on the last day of each year reported and includes reinvestment of dividends and distributions. Total return does not reflect expenses associated with the separate account such as administrative fees, account charges and surrender charges which, if reflected, would reduce the total returns for all years shown. Performance figures may reflect voluntary fee waivers and/or expense reimbursements. In the absence of voluntary fee waivers and/or expense reimbursements, the total return would be lower. Past performance is no guarantee of future results. Total returns may reflect adjustments to conform to generally accepted accounting principles. Total returns for periods less than a full year are not annualized. |
| (c) | Does not include expenses of the underlying portfolio in which the portfolio invests. |
SEE NOTES TO FINANCIAL STATEMENTS.
C1
Financial Highlights
| | | | | | | | | | | | | | | | | | | | |
| | | Jennison 20/20 Focus Portfolio
| |
| | | Class II
| |
| | | Year Ended
December 31,
| |
| | | 2007(a)
| | | 2006
| | | 2005
| | | 2004
| | | 2003
| |
Per Share Operating Performance: | | | | | | | | | | | | | | | | | | | | |
Net Asset Value, beginning of year | | $ | 15.81 | | | $ | 14.83 | | | $ | 12.23 | | | $ | 10.60 | | | $ | 8.23 | |
| | |
|
|
| |
|
|
| |
|
|
| |
|
|
| |
|
|
|
Income From Investment Operations: | | | | | | | | | | | | | | | | | | | | |
Net investment income | | | — | (c) | | | .03 | | | | .01 | | | | 0.01 | | | | — | (c) |
Net realized and unrealized gain on investments | | | 1.60 | | | | 1.91 | | | | 2.59 | | | | 1.62 | | | | 2.37 | |
| | |
|
|
| |
|
|
| |
|
|
| |
|
|
| |
|
|
|
Total from investment operations | | | 1.60 | | | | 1.94 | | | | 2.60 | | | | 1.63 | | | | 2.37 | |
| | |
|
|
| |
|
|
| |
|
|
| |
|
|
| |
|
|
|
Less Distributions: | | | | | | | | | | | | | | | | | | | | |
Distributions | | | (1.63 | ) | | | (0.96 | ) | | | — | | | | — | | | | — | |
| | |
|
|
| |
|
|
| |
|
|
| |
|
|
| |
|
|
|
Net Asset Value, end of year | | $ | 15.78 | | | $ | 15.81 | | | $ | 14.83 | | | $ | 12.23 | | | $ | 10.60 | |
| | |
|
|
| |
|
|
| |
|
|
| |
|
|
| |
|
|
|
Total Return(b): | | | 10.12 | % | | | 13.61 | % | | | 21.26 | % | | | 15.38 | % | | | 28.80 | % |
Ratios/Supplemental Data: | | | | | | | | | | | | | | | | | | | | |
Net assets, end of year (in millions) | | $ | 293.3 | | | $ | 218.4 | | | $ | 159.3 | | | $ | 101.0 | | | $ | 39.6 | |
Ratios to average net assets(d): | | | | | | | | | | | | | | | | | | | | |
Expenses | | | 1.22 | % | | | 1.22 | % | | | 1.27 | % | | | 1.28 | % | | | 1.35 | % |
Net investment income (loss) | | | .00 | % | | | .19 | % | | | .03 | % | | | (.02 | )% | | | (.22 | )% |
Portfolio turnover rate | | | 115 | % | | | 119 | % | | | 93 | % | | | 87 | % | | | 102 | % |
| (a) | Calculated based upon average shares outstanding. |
| (b) | Total return is calculated assuming a purchase of a share on the first day and a sale on the last day of each year reported and includes reinvestment of dividends and distributions. Total return does not reflect expenses associated with the separate account such as administrative fees, account charges and surrender charges which, if reflected, would reduce the total returns for all years shown. Performance figures may reflect voluntary fee waivers and/or expense reimbursements. In the absence of voluntary fee waivers and/or expense reimbursements, the total return would be lower. Past performance is no guarantee of future results. Total returns may reflect adjustments to conform to generally accepted accounting principles. Total returns for periods less than a full year are not annualized. |
| (c) | Less than $.005 per share. |
| (d) | Does not include expenses of the underlying portfolio in which the Portfolio invests. |
SEE NOTES TO FINANCIAL STATEMENTS.
C2
REPORT OF INDEPENDENT REGISTERED PUBLIC ACCOUNTING FIRM
THE BOARD OF TRUSTEES AND SHAREHOLDERS OF THE PRUDENTIAL SERIES FUND:
We have audited the accompanying statements of assets and liabilities of The Prudential Series Fund (comprised of Diversified Conservative Growth Portfolio and Jennison 20/20 Focus Portfolio, hereafter referred to as the “Funds”), including the portfolios of investments, as of December 31, 2007, and the related statements of operations for the year then ended, the statements of changes in net assets for each of the years in the two-year period then ended and the financial highlights for each of the years in the four-year period then ended. These financial statements and financial highlights are the responsibility of the Funds’ management. Our responsibility is to express an opinion on these financial statements and financial highlights based on our audits. The financial highlights for the year ended December 31, 2003 were audited by another independent registered public accounting firm, whose report dated February 13, 2004, expressed an unqualified opinion thereon.
We conducted our audits in accordance with the standards of the Public Company Accounting Oversight Board (United States). Those standards require that we plan and perform the audit to obtain reasonable assurance about whether the financial statements and financial highlights are free of material misstatement. An audit includes examining, on a test basis, evidence supporting the amounts and disclosures in the financial statements. Our procedures included confirmation of securities owned as of December 31, 2007, by correspondence with the custodian and brokers or by other appropriate auditing procedures where replies from brokers were not received. An audit also includes assessing the accounting principles used and significant estimates made by management, as well as evaluating the overall financial statement presentation. We believe that our audits provide a reasonable basis for our opinion.
In our opinion, the financial statements and financial highlights referred to above present fairly, in all material respects, the financial position of the Funds as of December 31, 2007, and the results of their operations for the year then ended, the changes in their net assets for each of the years in the two-year period then ended and the financial highlights for each of the years in the four-year period then ended, in conformity with U.S. generally accepted accounting principles.
New York, New York
February 22, 2008
D1
MANAGEMENT OF THE FUND
(Unaudited)
Information pertaining to the Trustees of the Fund is set forth below. Trustees who are not deemed to be “interested persons” of the Fund as defined in the Investment Company Act are referred to as “Independent Trustees.” Trustees who are deemed to be “interested persons” of the Fund are referred to as “Interested Trustees.” “Fund Complex” consists of the Fund and any other investment companies managed by PI.
| | | | | | |
Name, Address**,
and Age | | Position with Fund*
Term of Office***
Length of Time Served | | Number of Portfolios
In Fund Complex
Overseen by Trustee | | Other Directorships
Held by the Trustee**** |
| | | |
| Saul K. Fenster, Ph.D. (74) | | Trustee, Since 1983 | | 87 | | Member (since 2006), Board of The Ridgefield Foundation and The Leir Foundation; Board of Directors of IDT Corporation (2000-2006) |
|
| Principal Occupations During Past 5 Years – Currently President Emeritus of New Jersey Institute of Technology (since 2002); formerly President (1978-2002) of New Jersey Institute of Technology; Commissioner (1998-2002) of the Middle States Association Commission on Higher Education; Commissioner (1985-2002) of the New Jersey Commission on Science and Technology; formerly Director (1998-2005) of Society of Manufacturing Engineering Education Foundation; formerly Director of Prosperity New Jersey; formerly a director or trustee of Liberty Science Center, Research and Development Council of New Jersey, New Jersey State Chamber of Commerce, and National Action Council for Minorities in Engineering. |
| | | |
| Delayne Dedrick Gold (69) | | Trustee, Since 2001 | | 86 | | — |
|
| Principal Occupations During Past 5 Years – Marketing Consultant (1982-present); formerly Senior Vice President and Member of the Board of Directors, Prudential Bache Securities, Inc. |
| | | |
| W. Scott McDonald, Jr. (70) | | Independent Vice Chair since 2004 and Trustee, Since 1983 | | 87 | | — |
|
| Principal Occupations During Past 5 Years – Formerly Management Consultant (1997-2004) and of Counsel (2004-2005) at Kaludis Consulting Group, Inc. (company serving higher education); Formerly principal (1995-1997), Scott McDonald & Associates; Chief Operating Officer (1991-1995), Fairleigh Dickinson University; Executive Vice President and Chief Operating Officer (1975-1991), Drew University; interim President (1988-1990), Drew University; formerly Director of School, College and University Underwriters Ltd. |
| | | |
| Thomas T. Mooney (66) | | Independent Chair and Trustee, Since 2001 | | 86 | | — |
|
| Principal Occupations During Past 5 Years – Formerly Chief Executive Officer, Excell Partners, Inc.; formerly President of the Greater Rochester Metro Chamber of Commerce, Rochester City Manager; formerly Deputy Monroe County Executive. |
| | | |
| Thomas M. O’Brien (57) | | Trustee, Since 2003 | | 86 | | Formerly Director (December 1996-May 2000) of North Fork Bancorporation, Inc.; Formerly Director (May 2000-April 2006) of Atlantic Bank of New York; Director (since November 2006) of State Bancorp, Inc. (NASDAQ: STBC) and State Bank of Long Island. |
|
| Principal Occupations During Past 5 Years – President and COO (since November 2006) and CEO (since April 2007) of State Bancorp, Inc. and State Bank; Vice Chairman (January 1997-April 2000) of North Fork Bank; President and Chief Executive Officer (December 1984-December 1996) of North Side Savings Bank; formerly President and Chief Executive Officer (May 2000-June 2006) Atlantic Bank of New York. |
| | | |
| John A. Pileski (68) | | Trustee, Since 2003 | | 86 | | Director (since April 2001) of New York Bank Corp; Director (since May 1980) of Surf Club of Quogue, Inc. |
|
| Principal Occupations During Past 5 Years – Retired (June 2000) Tax Partner of KPMG, LLP. |
| | | |
| F. Don Schwartz (72) | | Trustee, Since 2003 | | 86 | | — |
|
| Principal Occupations During Past 5 Years – Management Consultant (since April 1985). |
E1
| | | | | | |
|
Interested Trustees
|
Name, Address**,
and Age | | Position with Fund*
Term of Office***
Length of Time Served | | Number of Portfolios
In Fund Complex
Overseen by Trustee | | Other Directorships
Held by the Trustee**** |
| | | |
| *David R. Odenath (50) | | President since 2002 and Trustee Since 1999 | | 86 | | — |
|
| Principal Occupations During Past 5 Years – President of Prudential Annuities (since August 2002); Senior Vice President (since June 1999) of Prudential; Director (since June 2005) and Executive Vice President (since March 2006) of AST Investment Services, Inc; formerly Executive Vice President (May 2003-November 2007) of Prudential Investment Management Services LLC; formerly President, Chief Executive Officer, Chief Operating Officer and Officer in Charge (June 2005-March 2006) of AST Investment Services, Inc. |
| | | |
| *Robert F. Gunia (61) | | Vice President and Trustee Since 2001 | | 149 | | Vice President and Director (since May 1989); Treasurer (since 1999) of The Asia Pacific Fund, Inc. and Vice President (since January 2007) of The Greater China Fund, Inc. |
|
| Principal Occupations During Past 5 Years – Chief Administrative Officer (since September 1999) and Executive Vice President (since December 1996) of Prudential Investments LLC; President (since April 1999) of Prudential Investment Management Services LLC; Executive Vice President (since March 1999) and Treasurer (since May 2000) of Prudential Mutual Fund Services LLC; Chief Administrative Officer, Executive Vice President and Director (since May 2003) of AST Investment Services, Inc. |
| | | | |
|
Officers
|
Name, Address**,
and Age | | Position with Fund*
Term of Office***
Length of Time Served | | Principal Occupations During Past 5 Years |
| | |
| Grace C. Torres (48) | | Treasurer and Principal Financial and Accounting Officer Since 1997 | | Assistant Treasurer (since March 1999) and Senior Vice President (since September 1999) of PI; Assistant Treasurer (since May 2003) and Vice President (since June 2005) of AST Investment Services, Inc.; Senior Vice President and Assistant Treasurer (since May 2003) of Prudential Annuities Advisory Services, Inc.; formerly Senior Vice President (May 2003-June 2005) of AST Investment Services, Inc. |
| | |
| Kathryn L. Quirk (55) | | Chief Legal Officer Since 2005 | | Vice President and Corporate Counsel (since September 2004) of Prudential; Executive Vice President, Chief Legal Officer and Secretary (since July 2005) of PI and Prudential Mutual Fund Services LLC; Vice President and Corporate Counsel (since June 2005) and Secretary (since February 2006) of AST Investment Services, Inc.; formerly Senior Vice President and Assistant Secretary (November 2004-August 2005) of PI; formerly Assistant Secretary (June 2005-February 2006) of AST Investment Services, Inc.; formerly Managing Director, General Counsel, Chief Compliance Officer, Chief Risk Officer and Corporate Secretary (1997-2002) of Zurich Scudder Investments, Inc. |
| | |
| Deborah A. Docs (50) | | Secretary Since 2005 | | Vice President and Corporate Counsel (since January 2001) of Prudential; Vice President (since December 1996) and Assistant Secretary (since March 1999) of PI; formerly Vice President and Assistant Secretary (May 2003-June 2005) of AST Investment Services, Inc. |
| | |
| Jonathan D. Shain (49) | | Assistant Secretary Since 2005 | | Vice President and Corporate Counsel (since August 1998) of Prudential; Vice President and Assistant Secretary (since May 2001) of PI; Vice President and Assistant Secretary (since February 2001) of PMFS; formerly Vice President and Assistant Secretary (May 2003-June 2005) of AST Investment Services, Inc. |
| | |
| Claudia DiGiacomo (33) | | Assistant Secretary Since 2005 | | Vice President and Corporate Counsel (since January 2005) of Prudential; Vice President and Assistant Secretary of PI (since December 2005); Associate at Sidley Austin Brown & Wood LLP (1999-2004). |
| | |
| John P. Schwartz (36) | | Assistant Secretary Since 2006 | | Vice President and Corporate Counsel (since April 2005) of Prudential; Vice President and Assistant Secretary of PI (since December 2005); Associate at Sidley Austin Brown & Wood LLP (1997-2005). |
| | |
| Timothy J. Knierim (49) | | Chief Compliance Officer Since 2007 | | Chief Compliance Officer of Prudential Investment Management, Inc. (since July 2007); formerly Chief Risk Officer of PIM and PI (2002-2007) and formerly Chief Ethics Officer of PIM and PI (2006-2007). |
E2
| | | | |
Name, Address**,
and Age | | Position with Fund*
Term of Office***
Length of Time Served | | Principal Occupations During Past 5 Years |
| | |
| Valerie M. Simpson (49) | | Deputy Chief Compliance Officer Since 2007 | | Chief Compliance Officer (since April 2007) of PI and AST Investment Services, Inc.; formerly Vice President-Financial Reporting (June 1999-March 2006) for Prudential Life and Annuities Finance. |
| | |
| M. Sadiq Peshimam (44) | | Assistant Treasurer Since 2006 | | Vice President (since 2005) and Director (2000-2005) within Prudential Mutual Fund Administration. |
| | |
| Peter Parrella (49) | | Assistant Treasurer Since 2007 | | Vice President (since 2007) and Director (2004-2007) within Prudential Mutual Fund Administration; formerly Tax Manager at SSB Citi Fund Management LLC (1997-2004). |
| | |
| Alan Fu (51) | | Assistant Treasurer Since 2006 | | Vice President – Tax, The Prudential Insurance Company of America (1999-October 2003); Vice President and Corporate Counsel – Tax, Prudential Financial, Inc. (since October 2003). |
| | |
| Andrew R. French (45) | | Assistant Secretary Since 2006 | | Director and Corporate Counsel (since May 2006) of Prudential; Vice President and Assistant Secretary (since January 2007) of PI; Vice President and Assistant Secretary (since January 2007) of PMFS; formerly Senior Legal Analyst of Prudential Mutual Fund Law Department (1997-2006). |
| | |
| Noreen M. Fierro (43) | | Anti-Money Laundering Compliance Officer Since 2006 | | Vice President, Corporate Compliance (since May 2006) of Prudential; formerly Corporate Vice President, Associate General Counsel (April 2002-May 2005) of UBS Financial Services, Inc., in their Money Laundering Prevention Group; Senior Manager (May 2005-May 2006) of Deloitte Financial Advisory Services, LLP, in their Forensic and Dispute Services, Anti-Money Laundering Group. |
* “Interested” Trustee, as defined in the Investment Company Act, by reason of employment with the Manager (as defined below), and/or the Distributor (as defined below).
** Unless otherwise noted, the address of the Trustees and Officers is c/o: Prudential Investments LLC, Gateway Center Three, 100 Mulberry Street, Newark, New Jersey 07102.
*** There is no set term of office for Trustees and Officers. The Independent Trustees have adopted a retirement policy, which calls for the retirement of Trustees on December 31 of the year in which they reach the age of 75. The table shows how long they have served as Trustee and/or Officer.
**** This column includes only directorships of companies required to register, or file reports with the SEC under the Securities Exchange Act of 1934 (i.e., “public companies”) or other investment companies registered under the Investment Company Act.
E3
Annuities are issued by Pruco Life Insurance Company, or in New York, Pruco Life Insurance Company of New Jersey, both located at 213 Washington Street, Newark, NJ 07102-2992, and Prudential Annuities Life Assurance Corporation, located at One Corporate Drive, Shelton, CT, 06484. Variable annuities are distributed by Prudential Annuities Distributors, Inc., also located in Shelton, CT. Prudential Annuities is a business unit of Prudential Financial.
Variable life insurance is issued by The Prudential Insurance Company of America, 751 Broad Street, Newark, NJ 07102-3777, Pruco Life Insurance Company, or in New York, Pruco Life Insurance Company of New Jersey, both located at 213 Washington Street, Newark, NJ 07102-2992. Pruco Life Insurance Company is not licensed to do business in New York. Variable life insurance is offered through Pruco Securities LLC, 751 Broad Street, Newark, NJ 07102-3777.
All are Prudential Financial companies and each is solely responsible for its financial condition and contractual obligations.
Life insurance policies and annuity contracts contain exclusions, limitations, reductions of benefits and terms for keeping them in force. Your licensed financial professional can provide you with costs and complete details. Contract guarantees are based on the claims-paying ability of the issuing company.
The 2007 Audited Financial Statements of Pruco Life Insurance Company, Pruco Life Insurance Company of New Jersey, and The Prudential Insurance Company of America will be available commencing April 30, 2008. You may call (888) 778-2888 to obtain a free copy of the audited financial statements of the insurance company that issued your contract.
To reduce costs, we now generally send only a single copy of prospectuses and shareholder reports to each household (“householding”) in lieu of sending a copy to each Contract Owner who resides in the household. You should be aware that by calling (877) 778-5008, you can revoke or “opt out” of householding at any time.
Pru, Prudential, Prudential Financial, Rock Solid, “The Rock”, the Rock Logo and the Rock Prudential Logo are registered service marks of The Prudential Insurance Company of America, Newark, NJ, and its affiliates.
The Prudential Insurance Company of America
751 Broad Street
Newark NJ 07102-3777
Presorted
Standard
U.S. Postage
PAID
Prudential
IFS-A114743 PSF-AR-C Ed. 02/2008

Item 2 – Code of Ethics – – See Exhibit (a)
As of the end of the period covered by this report, the registrant has adopted a code of ethics (the “Section 406 Standards for Investment Companies – Ethical Standards for Principal Executive and Financial Officers”) that applies to the registrant’s Principal Executive Officer and Principal Financial Officer; the registrant's Principal Financial Officer also serves as the Principal Accounting Officer.
The registrant hereby undertakes to provide any person, without charge, upon request, a copy of the code of ethics. To request a copy of the code of ethics, contact the registrant 973-367-7521, and ask for a copy of the Section 406 Standards for Investment Companies—Ethical Standards for Principal Executive and Financial Officers.
Item 3 – Audit Committee Financial Expert –
The registrant’s Board has determined that Mr. John A. Pileski, member of the Board’s Audit Committee is an “audit committee financial expert,” and that he is “independent,” for purposes of this Item.
Item 4 – Principal Accountant Fees and Services –
(a) Audit Fees
For the fiscal years ended December 31, 2007 and December 31, 2006, KPMG LLP (“KPMG”), the Registrant’s principal accountant, billed the Registrant $653,328 and $511,900, respectively, for professional services rendered for the audit of the Registrant’s annual financial statements or services that are normally provided in connection with statutory and regulatory filings.
(b) Audit-Related Fees
None.
(c) Tax Fees
None.
(d) All Other Fees
For the fiscal year ended December 31, 2007, KPMG, the Registrant’s principal accountant, billed the Registrant $8,333 for professional services rendered in connection with work performed related to inverse floating rate securities. Not applicable for the fiscal year ended December 31, 2006.
(e) (1) Audit Committee Pre-Approval Policies and Procedures
THE PRUDENTIAL MUTUAL FUNDS
AUDIT COMMITTEE POLICY
on
Pre-Approval of Services Provided by the Independent Accountants
The Audit Committee of each Prudential Mutual Fund is charged with the responsibility to monitor the independence of the Fund’s independent accountants. As part of this responsibility, the Audit Committee must pre-approve any independent accounting firm’s engagement to render audit and/or permissible non-audit services, as required by law. In evaluating a proposed engagement of the independent accountants, the Audit Committee will assess the effect that the engagement might reasonably be expected to have on the accountant’s independence. The Committee’s evaluation will be based on:
| | • | | a review of the nature of the professional services expected to be provided, |
| | • | | a review of the safeguards put into place by the accounting firm to safeguard independence, and |
| | • | | periodic meetings with the accounting firm. |
Policy for Audit and Non-Audit Services Provided to the Funds
On an annual basis, the scope of audits for each Fund, audit fees and expenses, and audit-related and non-audit services (and fees proposed in respect thereof) proposed to be performed by the Fund’s independent accountants will be presented by the Treasurer and the independent accountants to the Audit Committee for review and, as appropriate, approval prior to the initiation of such services. Such presentation shall be accompanied by confirmation by both the Treasurer and the independent accountants that the proposed services will not adversely affect the independence of the independent accountants. Proposed services shall be described in sufficient detail to enable the Audit Committee to assess the appropriateness of such services and fees, and the compatibility of the provision of such services with the auditor’s independence. The Committee shall receive periodic reports on the progress of the audit and other services which are approved by the Committee or by the Committee Chair pursuant to authority delegated in this Policy.
The categories of services enumerated under “Audit Services”, “Audit-related Services”, and “Tax Services” are intended to provide guidance to the Treasurer and the independent accountants as to those categories of services which the Committee believes are generally consistent with the independence of the independent accountants and which the Committee (or the Committee Chair) would expect upon the presentation of specific proposals to pre-approve. The enumerated categories are not intended as an exclusive list of audit, audit-related or tax services, which the Committee (or the Committee Chair) would consider for pre-approval.
Audit Services
The following categories of audit services are considered to be consistent with the role of the Fund’s independent accountants:
| | • | | Annual Fund financial statement audits |
| | • | | Seed audits (related to new product filings, as required) |
| | • | | SEC and regulatory filings and consents |
Audit-related Services
The following categories of audit-related services are considered to be consistent with the role of the Fund’s independent accountants:
| | • | | Accounting consultations |
| | • | | Fund merger support services |
| | • | | Agreed Upon Procedure Reports |
| | • | | Other Internal Control Reports |
Individual audit-related services that fall within one of these categories and are not presented to the Audit Committee as part of the annual pre-approval process will be subject to pre-approval by the Committee Chair (or any other Committee member on whom this responsibility has been delegated) so long as the estimated fee for those services does not exceed $50,000.
Tax Services
The following categories of tax services are considered to be consistent with the role of the Fund’s independent accountants:
| | • | | Tax compliance services related to the filing or amendment of the following: |
| | • | | Federal, state and local income tax compliance; and, |
| | • | | Sales and use tax compliance |
| | • | | Timely RIC qualification reviews |
| | • | | Tax distribution analysis and planning |
| | • | | Tax authority examination services |
| | • | | Tax appeals support services |
| | • | | Accounting methods studies |
| | • | | Fund merger support services |
| | • | | Tax consulting services and related projects |
Individual tax services that fall within one of these categories and are not presented to the Audit Committee as part of the annual pre-approval process will be subject to pre-approval by the Committee Chair (or any other Committee member on whom this responsibility has been delegated) so long as the estimated fee for those services does not exceed $50,000.
Other Non-audit Services
Certain non-audit services that the independent accountants are legally permitted to render will be subject to pre-approval by the Committee or by one or more Committee members to whom the Committee has delegated this authority and who will report to the full Committee any pre-approval decisions made pursuant to this Policy. Non-audit services presented for pre-approval pursuant to this paragraph will be accompanied by a confirmation from both the Treasurer and the independent accountants that the proposed services will not adversely affect the independence of the independent accountants.
Proscribed Services
The Fund’s independent accountants will not render services in the following categories of non-audit services:
| | • | | Bookkeeping or other services related to the accounting records or financial statements of the Fund |
| | • | | Financial information systems design and implementation |
| | • | | Appraisal or valuation services, fairness opinions, or contribution-in-kind reports |
| | • | | Internal audit outsourcing services |
| | • | | Management functions or human resources |
| | • | | Broker or dealer, investment adviser, or investment banking services |
| | • | | Legal services and expert services unrelated to the audit |
| | • | | Any other service that the Public Company Accounting Oversight Board determines, by regulation, is impermissible. |
Pre-approval of Non-Audit Services Provided to Other Entities Within the Prudential Fund Complex
Certain non-audit services provided to Prudential Investments LLC or any of its affiliates that also provide ongoing services to the Prudential Mutual Funds will be subject to pre-approval by the Audit Committee. The only non-audit services provided to these entities that will require pre-approval are those related directly to the operations and financial reporting of the Funds. Individual projects that are not presented to the Audit Committee as part of the annual pre-approval process will be subject to pre-approval by the Committee Chair (or any other Committee member on whom this responsibility has been delegated) so long as the estimated fee for those services does not exceed $50,000. Services presented for pre-approval pursuant to this paragraph will be accompanied by a confirmation from both the Treasurer and the independent accountants that the proposed services will not adversely affect the independence of the independent accountants.
Although the Audit Committee will not pre-approve all services provided to Prudential Investments LLC and its affiliates, the Committee will receive an annual report from the Fund’s independent accounting firm showing the aggregate fees for all services provided to Prudential Investments and its affiliates.
(e) (2) Percentage of services referred to in 4(b)- (4)(d) that were approved by the audit committee –
One hundred percent of the services described in Item 4(d) were approved by the audit committee.
(f) Percentage of hours expended attributable to work performed by other than full time employees of principal accountant if greater than 50%.
Not applicable.
(g) Non-Audit Fees
Not applicable to Registrant for the fiscal years 2007 and 2006. The aggregate non-audit fees billed by KPMG for services rendered to the registrant’s investment adviser and any entity controlling, controlled by, or under common control with the investment adviser that provides ongoing services to the registrant for the fiscal years 2007 and 2006 was $48,867 and $317,300, respectively.
(h) Principal Accountant’s Independence
Not applicable as KPMG has not provided non-audit services to the registrant’s investment adviser and any entity controlling, controlled by, or under common control with the investment adviser that provides ongoing services to the registrant that were not pre-approved pursuant to Rule 2-01(c)(7)(ii) of Regulation S-X.
Item 5 – Audit Committee of Listed Registrants – Not applicable.
Item 6 – Schedule of Investments – The schedule is included as part of the report to shareholders filed under Item 1 of this Form.
Item 7 – Disclosure of Proxy Voting Policies and Procedures for Closed-End Management Investment Companies – Not applicable.
Item 8 – Portfolio Managers of Closed-End Management Investment Companies – Not applicable.
Item 9 – Purchases of Equity Securities by Closed-End Management Investment Company and Affiliated Purchasers – Not applicable.
Item 10 – Submission of Matters to a Vote of Security Holders – Not applicable.
Item 11 – Controls and Procedures
| | (a) | It is the conclusion of the registrant's principal executive officer and principal financial officer that the effectiveness of the registrant's current disclosure controls and procedures (such disclosure controls and procedures having been evaluated within 90 days of the date of this filing) provide reasonable assurance that the information required to be disclosed by the registrant has been recorded, processed, summarized and reported within the time period specified in the Commission's rules and forms and that the information required to be disclosed by the registrant has been accumulated and communicated to the registrant's principal executive officer and principal financial officer in order to allow timely decisions regarding required disclosure. |
| | (b) | There has been no significant change in the registrant's internal control over financial reporting that occurred during the registrant's most recent fiscal quarter of the period covered by this report that has materially affected, or is likely to materially affect, the registrant's internal control over financial reporting. |
Item 12 – Exhibits
(a) (1) Code of Ethics – Attached hereto as Exhibit EX-99.CODE-ETH
(2) Certifications pursuant to Section 302 of the Sarbanes-Oxley Act – Attached hereto as Exhibit EX-99.CERT.
(3) Any written solicitation to purchase securities under Rule 23c-1. – Not applicable.
(b) Certifications pursuant to Section 906 of the Sarbanes-Oxley Act – Attached hereto as Exhibit EX-99.906CERT.
SIGNATURES
Pursuant to the requirements of the Securities Exchange Act of 1934 and the Investment Company Act of 1940, the registrant has duly caused this report to be signed on its behalf by the undersigned, thereunto duly authorized.
| | | | | | | | |
| (Registrant) | | The Prudential Series Fund | | | | | | |
| | | | |
| By (Signature and Title)* | | /s/ Deborah A. Docs | | | | | | |
| | Deborah A. Docs | | | | | | |
| | Secretary | | | | | | |
| | | |
| Date February 19, 2008 | | | | | | |
|
| Pursuant to the requirements of the Securities Exchange Act of 1934 and the Investment Company Act of 1940, this report has been signed below by the following persons on behalf of the registrant and in the capacities and on the dates indicated. |
| | | | |
| By (Signature and Title)* | | /s/ David R. Odenath | | | | | | |
| | David R. Odenath | | | | | | |
| | President and Principal Executive Officer | | | | | | |
| | | |
| Date February 19, 2008 | | | | | | |
| | | | |
| By (Signature and Title)* | | /s/ Grace C. Torres | | | | | | |
| | Grace C. Torres | | | | | | |
| | Treasurer and Principal Financial Officer | | | | | | |
| | | |
| Date February 19, 2008 | | | | | | |
| * | Print the name and title of each signing officer under his or her signature. |