UNITED STATES
SECURITIES AND EXCHANGE COMMISSION
Washington, D.C. 20549
FORM N-CSR
CERTIFIED SHAREHOLDER REPORT OF REGISTERED
MANAGEMENT INVESTMENT COMPANIES
| Investment Company Act file number: | 811-03623 | |
| Exact name of registrant as specified in charter: | The Prudential Series Fund | |
| Address of principal executive offices: | Gateway Center 3, | |
| 100 Mulberry Street, | ||
| Newark, New Jersey 07102 | ||
| Name and address of agent for service: | Jonathan D. Shain | |
| Gateway Center 3, | ||
| 100 Mulberry Street, | ||
| Newark, New Jersey 07102 | ||
| Registrant’s telephone number, including area code: | 973-802-6469 | |
| Date of fiscal year end: | 12/31/2005 | |
| Date of reporting period: | 12/31/2005 | |
Item 1 – Reports to Stockholders – [ INSERT REPORT ]
ANNUAL REPORT
DECEMBER 31, 2005
The Prudential Series Fund

| n | Conservative Balanced Portfolio |
| n | Diversified Bond Portfolio |
| n | Equity Portfolio |
| n | Flexible Managed Portfolio |
| n | Global Portfolio |
| n | Government Income Portfolio |
| n | High Yield Bond Portfolio |
| n | Jennison Portfolio |
| n | Money Market Portfolio |
| n | Natural Resources Portfolio |
| n | Small Capitalization Stock Portfolio |
| n | Stock Index Portfolio |
| n | Value Portfolio |
The Prudential Insurance Company of America
751 Broad Street, Newark, NJ 07102-3777
Pruco Life Insurance Company
Pruco Life Insurance Company of New Jersey
213 Washington Street, Newark, NJ 07102-3777
Pruco Life Insurance Company is not licensed to do business in New York.
IFS-A114446

T | his report is one of several that provide financial information about certain investment choices available on variable life insurance and variable annuity contracts. Based on the variable contract you own or the portfolios you invested in, you may receive additional reports that provide financial information on those investment choices. Please refer to your variable life insurance or variable annuity contract prospectus to determine which portfolios are available to you. A list of the variable contracts that this report supports is located on the inside back cover. |
This report must be preceded or accompanied by the current prospectuses for the Prudential Series Fund portfolios and the applicable variable life or annuity contract. The prospectuses contain information on the investment objectives, risks, and charges and expenses and should be read carefully.
The contract’s prospectus contains hypothetical performance illustrations that show the effect of various assumptions regarding the cost of insurance protection. You may also obtain a personalized illustration of historical performance that reflects the cost of your policy’s insurance protection.
DISCOVER THE BENEFITS OF eDELIVERY
| n | Eliminate receiving printed reports. |
| n | View documents on-line as they become available. |
| n | Download and store e-reports on your PC. |
| n | Help the environment by using less paper. |
To receive your semiannual/annual reports on-line, go to www.prudential.com/edelivery and enroll. Instead of receiving printed reports, you will receive notification via e-mail when new materials are available for your review. You can cancel your enrollment or change your e-mail address at any time by visiting the internet address listed above.
A description of the Fund’s proxy voting policies and procedures is available, without charge, upon request. Owners of variable annuity contracts should call 888-778-2888 and owners of variable life insurance contracts should call 800-778-2255 to obtain descriptions of the Fund’s proxy voting policies and procedures. The description is also available on the website of the Securities and Exchange Commission (the “Commission”) at www.sec.gov. Information regarding how the Fund voted proxies relating to portfolio securities during the most recent 12-month period ended June 30, 2005 is available on the website of the Commission at www.sec.gov and on the Fund’s website at www.irrc.com/prudential.
The Fund files with the Commission a complete listing of portfolio holdings as of its first and third quarter-end on Form N-Q. Form N-Q is available on the Commission’s website at www.sec.gov or by visiting the Commission’s Public Reference Room. For more information on the Commission’s Public Reference Room, please visit the Commission’s website or call 1-800-SEC-0330. Form N-Q is also available on the Fund’s website at www.prudential.com or by calling the telephone numbers referenced above.
The Fund’s Statement of Additional Information contains additional information about the Fund’s Trustees and is available without charge upon request by calling 888-778-2888.

GLOSSARY OF BENCHMARK DEFINITIONS
Aggressive Growth Asset Allocation Custom Blended Index consists of Russell 3000 Index (80%), and MSCI EAFE Index (20%).
Balanced Asset Allocation Custom Blended Index consists of Russell 3000 Index (48%), Lehman Brothers U.S. Aggregate Bond Index(40%) and MSCI EAFE Index (12%).
Conservative Asset Allocation Custom Blended Index consists of Russell 3000 Index (32%), Lehman Brothers U.S. Aggregate Bond Index(60%) and MSCI EAFE Index (8%).
Conservative Balanced Custom Blended Index consists of a blend of the S&P 500 Index (50%), the Lehman Brothers Aggregate Bond Index (40%), and the 3-Month T-Bill (10%).
Diversified Conservative Growth Custom Blended Index consists of S&P 500 Barra Value Index (15%), S&P 500 Barra Growth Index (15%), Russell 2000 Value Index (5%), Russell 2000 Growth Index (5%), Lehman Brothers Aggregate Bond Index (40%), and Lehman Brothers High Yield Bond Index (20%).
Flexible Managed Custom Blended Index consists of a blend of the S&P 500 Index (60%), the Lehman Brothers Aggregate Bond Index (35%), and the 3-Month T-Bill (5%).
Growth Asset Allocation Custom Blended Index consists of consists of Russell 3000 Index (64%), Lehman Brothers U.S. Aggregate Bond Index(20%) and MSCI EAFE Index (16%).
Lehman Brothers U.S. Aggregate Bond Index is an unmanaged index comprised of more than 5,000 government and corporate bonds.
Lehman Brothers U.S. Corporate High Yield Index is an unmanaged index of fixed-rate, non-investment-grade debt securities with at least one year remaining to maturity. It gives a broad look at how high yield (“junk”) bonds have performed.
Lehman Brothers Government Bond Index is an unmanaged index comprised of securities issued or backed by the U.S. government, its agencies, and instrumentalities with a remaining maturity of 1 to 30 years.
Lehman Brothers Intermediate BB Corporate Bond Index is an unmanaged index comprised of various fixed income securities rated BB.
The Lipper Variable Insurance Products (VIP) Funds Averages are calculated by Lipper Analytical Services, Inc., and reflect the investment return of certain portfolios underlying variable life and annuity products. These returns are net of investment fees and fund expenses, but not product charges.
| Balanced Funds Average | International Growth Funds Average | Multi-Cap Value Funds Average | ||
| Corporate Debt Funds BBB-Rated Average | Large-Cap Core Funds Average | Natural Resources Funds Average | ||
| Flexible Portfolio Funds Average | Large-Cap Growth Funds Average | S&P 500 Index Objective Funds Average | ||
| General U.S. Government Funds Average | Large-Cap Value Funds Average | Small-Cap Core Funds Average | ||
| Global Funds Average | Mid-Cap Growth Funds Average | Small-Cap Growth Funds Average | ||
| High Current Yield Funds Average | Mid-Cap Value Funds Average | Small-Cap Value Funds Average | ||
| Income Funds Average | Money Market Funds Average | Specialty/Miscellaneous Funds Average | ||
Intermediate Investment-Grade Debt Funds Average | Multi-Cap Core Funds Average | Target Maturity Funds Average | ||
| International Value Funds Average | Multi-Cap Growth Funds Average |
Merrill Lynch U.S. High Yield Master II BB-B Rated Index is a broad high yield index including high yield bonds across the maturity spectrum, within the BB-B rated credit quality spectrum, included in the below-investment-grade universe.
Morgan Stanley Capital International Europe, Australasia, and the Far East (MSCI EAFE) Index is a weighted, unmanaged index that reflects stock performance in Europe, Australasia, and the Far East.
Morgan Stanley Capital International (MSCI) World Index is an unmanaged index comprised of approximately 1,500 companies listed on the stock exchanges of Australasia, Canada, Europe, the Far East, and the United States.
Russell 1000 Growth Index is a market cap-weighted index that measures the performance of those Russell 1000 companies with higher price-to-book ratios and higher forecasted growth values.
Russell 1000 Index is a market cap-weighted index that measures the performance of the 1,000 largest companies in the Russell 3000 Index, which represents approximately 92% of the total market.
Russell 1000 Value Index is a market cap-weighted index that measures the performance of those Russell 1000 companies with lower price-to-book ratios and lower forecasted growth values.
Russell 2000 Growth Index is a market cap-weighted index that measures the performance of those Russell 2000 companies with higher price-to-book ratios and higher forecasted growth values.
Russell 2000 Index measures the performance of the 2,000 smallest companies in the Russell 3000 Index, which represents approximately 8% of the total market capitalization of the Russell 3000 Index.
Russell 2500 Growth Index is a market cap-weighted index that measures the performance of those Russell 2500™ companies with higher price-to-book ratios and higher forecasted growth values.
Russell 2500 Index is a market cap-weighted index that measures the performance of the 2,500 smallest companies in the Russell 3000 Index, which represents approximately 17% of the total market capitalization of the Russell 3000 Index.
Russell 2500 Value Index is a market cap-weighted index that measures the performance of those Russell 2500™ companies with lower price-to-book ratios and lower forecasted growth values.
Russell Midcap Growth Index is a market cap-weighted index that measures the performance of those Russell MidCap companies with higher price-to-book ratios and higher forecasted growth values.
Russell Midcap Index is a market cap-weighted index that measures the performance of the 800 smallest companies in the Russell 1000 Index, which represents approximately 25% of the total market.
S&P 500 Index is an unmanaged, market value-weighted index of 500 stocks generally representative of the broad stock market.
S&P MidCap 400 Index is a widely accepted, unmanaged total return index of 400 domestic stocks measuring the performance of the midsize company segment of the U.S. stock market.
S&P SmallCap 600 Index is an unmanaged index representing the aggregate market value of the common equity of 600 small-company stocks.
S&P SuperComposite Information Technology Index measures the performance of the technology components of the S&P SuperComposite 1500, which is a combination of the S&P 500, S&P MidCap 400, and S&P SmallCap 600 indexes, and provides a broad representation of the entire U.S. market, representing 87% of total U.S. equity market capitalization.
This page may include certain benchmarks not applicable to the portfolios available in this particular report. Investors cannot invest directly in a market index or average.
The Prudential Series Fund
Annual Report
December 31, 2005
Table of Contents
| n | LETTER TO CONTRACT OWNERS |
| n | MANAGEMENT REVIEW |
| n | PORTFOLIO COMPOSITION |
| n | FEES AND EXPENSES TABLE |
| n | FINANCIAL REPORTS |
A1 Financial Statements
B1 Schedule of Investments
C1 Notes to Financial Statements
D1 Financial Highlights
E1 Report of Independent Registered Accounting Firm
F1 Management of the Prudential Series Fund
| n | APPROVALS OF ADVISORY AGREEMENTS |
This report may include financial information pertaining to certain portfolios that are not available through the variable life insurance policy or variable annuity contract that you have chosen. Please refer to your variable life insurance or variable annuity prospectus to determine which portfolios are available to you.
The Prudential Series Fund
Annual Report
December 31, 2005
Letter to Contract Owners
| n | DEAR CONTRACT OWNER |
We hope that you find the annual report for the Prudential Series Fund informative and useful. Your success is important to us.
As a new year unfolds, we believe it is wise to take advantage of developing investment opportunities through a diversified portfolio. A diversified asset allocation offers two advantages. It helps you manage downside risk by not being overly exposed to any particular asset class, plus it helps better position your investments as asset classes rotate in and out of favor.
Your investment professional can help you create a diversified investment plan that considers your reasons for investing, personal investment horizon, and risk tolerance. A carefully chosen and broad mix of assets—reviewed periodically over time—can help you stay focused on meeting your long-term objectives.
At Prudential we are committed to helping you grow and protect your wealth by providing financial solutions that meet your needs today and in the future. We thank you for your confidence in our products.
Sincerely,

David R. Odenath, Jr.
President,
The Prudential Series Fund | January 31, 2006 |

PRESIDENT
DAVID R. ODENATH, JR.
The Prudential Series Fund, Conservative Balanced Portfolio
Subadvised by: Prudential Investment Management, Inc.
December 31, 2005
Investment Manager’s Report
Performance Summary - As of December 31, 2005
Average Annual Total Return Percentages
| 1-Year | 5-Year | 10-Year | |||||||
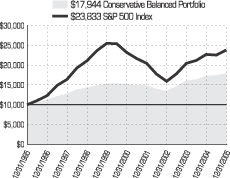
Conservative Balanced Portfolio | 3.43 | % | 3.43 | % | 6.02 | % | |||
S&P 500 Index | 4.91 | 0.54 | 9.07 | ||||||
Conservative Balanced Custom Blend Index | 3.82 | 3.15 | 7.71 | ||||||
Lipper (VIP) Balanced Funds Avg. | 4.78 | 3.33 | 7.47 |
Portfolio inception: 5/13/1983.
$10,000 INVESTED OVER 10 YEARS
Past performance does not guarantee future returns. Portfolio performance is net of investment fees and fund expenses, but not product charges, which, if included, would significantly lower the performance quoted. The investment return and principal value of an investment will fluctuate, so that an investor’s shares, when redeemed, may be worth more or less than their original cost. Current performance may be lower or higher than the past performance data quoted.
Unless noted otherwise, Lipper Average and Index returns reflect performance beginning the closest month-end date to the Portfolio’s inception.
For the year ended December 31, 2005, the Conservative Balanced Portfolio had a total return that was generally in line with its Blend Index (50% stock, 40% bond, 10% cash) and trailed the average return of its peer group.
Asset allocation decisions had a mixed impact. An overweight in stocks compared with the Portfolio’s benchmark helped its return as stocks outperformed bonds. However, a consistent underweighting in cash (very short-term securities) detracted from performance as it had a higher return for the year than the overall bond market.
The Portfolio’s stock holdings are managed as an index fund, with performance characteristics similar to those of the S&P 500 Index, while its bond holdings are more actively managed. Active management of the bond holdings added to performance in 2005 because the Portfolio was positioned to benefit when the yield curve flattened (long and short-term interest rates converged). In 2005, rates of short-term securities rose steadily while long-term rates were static.
Prudential Investments LLC (PI), a wholly owned subsidiary of Prudential Financial, Inc., serves as the overall investment manager for the Fund.
For average and index definitions, refer to the Glossary of Benchmark Definitions page. Investors cannot invest directly in a market index or average. For a complete list of holdings refer to the Schedule of Investments section of this report.
The Prudential Series Fund, Diversified Bond Portfolio
Subadvised by: Prudential Investment Management, Inc.
December 31, 2005
Investment Manager’s Report
Performance Summary - As of December 31, 2005
Average Annual Total Return Percentages
| 1-Year | 5-Year | 10-Year | |||||||
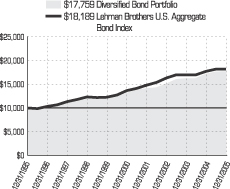
Diversified Bond Portfolio | 3.28 | % | 6.07 | % | 5.91 | % | |||
Lehman Brothers U.S Aggregate Bond Index | 2.43 | 5.87 | 6.16 | ||||||
Lipper VP Investment Grade Debt Funds Avg. | 1.99 | 5.60 | 5.62 |
Portfolio inception: 5/13/1983.
$10,000 INVESTED OVER 10 YEARS
Past performance does not guarantee future returns. Portfolio performance is net of investment fees and fund expenses, but not product charges, which, if included, would significantly lower the performance quoted. The investment return and principal value of an investment will fluctuate, so that an investor’s shares, when redeemed, may be worth more or less than their original cost. Current performance may be lower or higher than the past performance data quoted.
Unless noted otherwise, Lipper Average and Index returns reflect performance beginning the closest month-end date to the Portfolio’s inception.
For the year ended December 31, 2005, the Diversified Bond Portfolio had a total return that was above its benchmark index and the average of its peer group.
Considering the challenges facing the U.S. fixed income market in 2005, it did well to generate a modest positive return for the year. A more favorable investment environment for emerging-market bonds helped these debt securities provide a solid return in 2005. The Portfolio’s exposure to emerging-market bonds was among the key factors that benefited its performance.
A strong global economic expansion, the search for attractive yields in the global low-interest-rate environment, and rising prices for commodities and crude oil helped boost emerging-market bond prices. A considerable allocation to bonds of Brazil, the Philippines, and oil producer Russia enhanced the Portfolio’s return.
In the United States, the bond market had to contend with a trend toward higher short-term interest rates as the Federal Reserve continued its campaign to reduce excess monetary stimulus in the economy. From June 2004 through December 2005, the target for the federal funds rate on overnight loans between banks was raised 13 times in quarter-point increments, from 1.00% to 4.25%. Eight of the increases occurred in 2005. Shorter-term bonds are the most sensitive to changes in the federal funds rate. Therefore yields on shorter-term bond yields rose sharply. Longer-term bond yields largely reflect inflation expectations in the economy, and because inflationary pressures were largely contained, their yields fluctuated in a range rather than move sharply higher. Consequently, the yield curve flattened considerably in 2005. Longer-term bonds also performed better than shorter-term bonds as bond prices move in the opposite direction of their yields. Because the asset manager anticipated the flattening of the yield curve, the Portfolio benefited from its position on the longer end of the yield curve.
An emphasis on corporate bonds, particularly high yield bonds, aided the Portfolio’s relative performance, as did favorable security selection among corporate debt securities. Bonds of Sumitomo Mitsui Banking Corp. did well, reflecting the strengthening Japanese economy. Other solid performers included bonds of Qwest, Lubrizol, and FirstEnergy. Stiff competition from foreign investors and high labor costs hurt General Motors Corp. (GM) and Ford Motor Co. and led to their bonds being lowered from investment grade to speculative grade by major rating agencies. Here again, favorable security selection helped the Portfolio’s relative performance. It largely held short- and intermediate-term bonds of the financial subsidiaries of GM and Ford that performed better than their parent companies’ longer-term bonds. Meanwhile, some corporate bonds held by the Portfolio detracted from its return. Bonds of Georgia-Pacific Corp. came under pressure as purchase of the firm by Koch Industries Inc. required Georgia-Pacific to take on a large amount of debt to finance the deal. Similarly, bonds of SunGard Data Systems Inc. suffered because a group of private equity firms bought the company in a leveraged buyout that required SunGard to take on considerable debt.
Prudential Investments LLC (PI), a wholly owned subsidiary of Prudential Financial, Inc., serves as the overall investment manager for the Fund.
For average and index definitions, refer to the Glossary of Benchmark Definitions page. Investors cannot invest directly in a market index or average. For a complete list of holdings refer to the Schedule of Investments section of this report.
The Prudential Series Fund, Equity Portfolio
Subadvised by: Jennison Associates LLC, Salomon Brothers Asset Management Inc.
December 31, 2005
Investment Manager’s Report
Performance Summary - As of December 31, 2005
Average Annual Total Return Percentages
| 1-Year | 5-Year | 10-Year | Since Inception | |||||||||
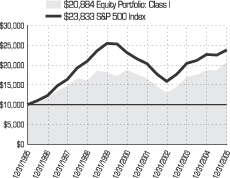
Equity Portfolio: Class I | 11.47 | % | 2.16 | % | 7.64 | % | 11.49 | % | ||||
Equity Portfolio: Class II | 11.04 | 1.75 | N/A | 1.64 | ||||||||
S&P 500 Index | 4.91 | 0.54 | 9.07 | 12.26 | ||||||||
Russell 1000® Index | 6.27 | 1.07 | 9.29 | 12.23 | ||||||||
Lipper Large-Cap Core Funds Avg. | 5.77 | -0.48 | 7.27 | 10.51 |
Portfolio (Class I) inception: 5/13/1983. Portfolio (Class II) inception: 5/4/1999.
$10,000 INVESTED OVER 10 YEARS1
Past performance does not guarantee future returns. Portfolio performance is net of investment fees and fund expenses, but not product charges, which, if included, would significantly lower the performance quoted. The investment return and principal value of an investment will fluctuate, so that an investor’s shares, when redeemed, may be worth more or less than their original cost. Current performance may be lower or higher than the past performance data quoted.
Unless noted otherwise, Lipper Average and Index returns reflect performance beginning the closest month-end date to the Portfolio’s inception (Class I).
For the year ended December 31, 2005, the Equity Portfolio had a total return that was substantially higher than its benchmarks and substantially above the average return of its peer group.
Half of the Portfolio was managed by Jennison Associates, a unit of Prudential Investment Management. Until December 5, 2005, the remaining half was split between Salomon Brothers Asset Management and GE Asset Management. After that date, the remaining half was managed entirely by Salomon Brothers. The Portfolio’s outperformance of the Russell 1000® Index was primarily due to Jennison’s stock selection and to the sector emphases of the Jennison and Salomon Brothers components. Jennison’s stock selections outperformed the sector components of the benchmark in the energy, technology, basic materials, and healthcare sectors. The overall Portfolio benefited from overweights compared with the benchmark in the energy, basic materials, and healthcare sectors and an underweight in the poor-performing consumer services sector.
Certain general characteristics of the Portfolio’s holdings, taken together, also helped its return, although not as much as the factors already mentioned. It had more exposure to stocks of companies whose earnings and/or share prices had recently been accelerating and lower exposure to companies that pay dividends. Both of these characteristics were rewarded in 2005’s markets. They more than offset the negative impact of an overweight in securities having growth characteristics in a market that generally favored value stocks.
The Portfolio also was hurt somewhat by Jennison’s holdings’ above-average sensitivity to overall market movements. This hurt the Portfolio’s performance, particularly in the declining markets of January, March, April, August, and October.
Prudential Investments LLC (PI), a wholly owned subsidiary of Prudential Financial, Inc., serves as the overall investment manager for the Fund.
| 1 | The graph is based on the performance of Class I shares. Performance of Class II shares will be lower due to differences in the fee structure. Class II shares have associated 12b-1 and administrative fees at an annual rate of 0.25% and 0.15% respectively of the average daily net assets of the Class II shares. |
For average and index definitions, refer to the Glossary of Benchmark Definitions page. Investors cannot invest directly in a market index or average. For a complete list of holdings, refer to the Schedule of Investments section of this report.
The Prudential Series Fund, Flexible Managed Portfolio
Subadvised by: Prudential Investment Management, Inc.
December 31, 2005
Investment Manager’s Report
Performance Summary - As of December 31, 2005
Average Annual Total Return Percentages
| 1-Year | 5-Year | 10-Year | |||||||
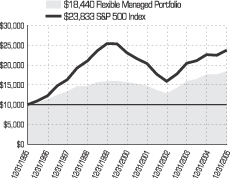
Flexible Managed Portfolio | 4.16 | % | 3.28 | % | 6.31 | % | |||
S&P 500 Index | 4.91 | 0.54 | 9.07 | ||||||
Flexible Managed Custom Blended Index | 4.03 | 2.80 | 8.12 | ||||||
Lipper (VIP) Flexible Portfolio Funds Avg. | 4.88 | 3.40 | 7.89 |
Portfolio inception: 5/13/1983.
$10,000 INVESTED OVER 10 YEARS
Past performance does not guarantee future returns. Portfolio performance is net of investment fees and fund expenses, but not product charges, which, if included, would significantly lower the performance quoted. The investment return and principal value of an investment will fluctuate, so that an investor’s shares, when redeemed, may be worth more or less than their original cost. Current performance may be lower or higher than the past performance data quoted.
Unless noted otherwise, Lipper Average and Index returns reflect performance beginning the closest month-end date to the Portfolio’s inception.
For the year ended December 31, 2005, the Flexible Managed Portfolio had a total return that was slightly above its Blend Index (60% stocks, 35% bonds, 5% cash) and below the average of its peer group.
Asset allocation added to the Portfolio’s return. Its overweight in stocks compared with its benchmark added to return as stocks outperformed bonds. The impact was augmented by the stock portfolio’s performance, which was better than its performance target. The bond holdings also beat their performance target as they were positioned to benefit from a flattening yield curve (the convergence of long-term and short-term interest rates). The yield curve flattened significantly over the course of the year.
However, the overall Portfolio was underweighted in cash (very short-term securities) compared with its benchmark. This detracted from its performance as the yield of cash instruments rose steadily through the year and their return over the reporting period was higher than that of the overall bond market.
Prudential Investments LLC (PI), a wholly owned subsidiary of Prudential Financial, Inc., serves as the overall investment manager for the Fund.
For average and index definitions, refer to the Glossary of Benchmark Definitions page. Investors cannot invest directly in a market index or average. For a complete list of holdings refer to the Schedule of Investments section of this report.
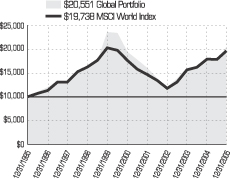
The Prudential Series Fund, Global Portfolio
Subadvised by: William Blair & Company LLC, LSV Asset Management, Marsico Capital Management, LLC, T. Rowe Price International, Inc.
December 31, 2005
Investment Manager’s Report
Performance Summary - As of December 31, 2005
Average Annual Total Return Percentages
| 1-Year | 5-Year | 10-Year | |||||||
Global Portfolio | 16.06 | % | 1.01 | % | 7.47 | % | |||
MSCI World Index | 9.49 | 2.18 | 7.04 | ||||||
Lipper (VIP) Global Growth Funds Avg. | 12.92 | 2.88 | 9.22 |
Portfolio inception: 9/19/1988.
$10,000 INVESTED OVER 10 YEARS
Past performance does not guarantee future returns. Portfolio performance is net of investment fees and fund expenses, but not product charges, which, if included, would significantly lower the performance quoted. The investment return and principal value of an investment will fluctuate, so that an investor’s shares, when redeemed, may be worth more or less than their original cost. Current performance may be lower or higher than the past performance data quoted.
Unless noted otherwise, Lipper Average and Index returns reflect performance beginning the closest month-end date to the Portfolio’s inception.
For the year ended December 31, 2005, the Global Portfolio had a total return that was substantially higher than its benchmark and also above the average of its peer group. Jennison Associates LLC managed the Portfolio until December 16, 2005, and was responsible for most of its performance.
Stock selection was strong across a substantial part of the Portfolio. It outperformed its benchmark in the consumer discretionary, financials, healthcare, and financials sectors. Selection was strongest in the United States, but the Portfolio also did quite well in Canada and Japan. The Portfolio benefited marginally from underweighting the United States, which trailed other markets significantly, and overweighting the strong Japan and Switzerland markets.
Sector weightings were less successful, detracting modestly from results. A small underweight in the utilities sector and overweight in technology hurt performance, although technology rebounded in the fourth quarter of the year. These detracting emphases were mostly offset by an overweight in the materials sector and are underweight in the consumer discretionary sector.
On December 16, 2005, the Portfolio was changed to a structure using four specialist asset managers. Marsico Capital management manages its large-cap domestic growth stocks; T. Rowe Price manages its large-cap domestic value stocks; William Blair & Company manages its international growth stocks; and LSV Asset Management manages its international value stocks. Each firm manages approximately a quarter of the Portfolio’s assets.
Prudential Investments LLC (PI), a wholly owned subsidiary of Prudential Financial, Inc., serves as the overall investment manager for the Fund.
For average and index definitions, refer to the Glossary of Benchmark Definitions page. Investors cannot invest directly in a market index or average. For a complete list of holdings refer to the Schedule of Investments section of this report.
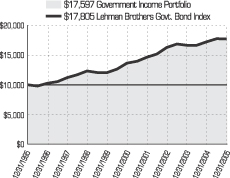
The Prudential Series Fund, Government Income Portfolio
Subadvised by: Prudential Investment Management, Inc.
December 31, 2005
Investment Manager’s Report
Performance Summary - As of December 31, 2005
Average Annual Total Return Percentages
| 1-Year | 5-Year | 10-Year | |||||||
Government Income Portfolio | 2.51 | % | 5.57 | % | 5.81 | % | |||
Lehman Brothers Govt. Bond Index | 2.65 | 5.39 | 5.94 | ||||||
Lipper (VIP) General U.S. Govt. Funds Avg. | 2.32 | 5.32 | 5.44 |
Portfolio inception: 5/1/1989.
$10,000 INVESTED OVER 10 YEARS
Past performance does not guarantee future returns. Portfolio performance is net of investment fees and fund expenses, but not product charges, which, if included, would significantly lower the performance quoted. The investment return and principal value of an investment will fluctuate, so that an investor’s shares, when redeemed, may be worth more or less than their original cost. Current performance may be lower or higher than the past performance data quoted.
Unless noted otherwise, Lipper Average and Index returns reflect performance beginning the closest month-end date to the Portfolio’s inception.
For the year ended December 31, 2005, the Government Income Portfolio had a total return that was slightly below its benchmark index but slightly above the average of its peer group.
The modest return of the U.S. government bond market in 2005 reflected a challenging investment environment dominated by a trend toward rising short-term interest rates. To prevent the U.S. economy from growing too fast and fueling higher inflation, the Federal Reserve continued its latest campaign to boost short-term rates. From June 2004 through December 2005, the target for the federal funds rate on overnight loans between banks was increased by quarter-point increments 13 times, from 1.00% to 4.25%. Eight increases occurred in 2005.
Shorter-term bond yields are the most sensitive to changes in the federal funds rate. Therefore yields on shorter-term bonds rose sharply. Longer-term bond yields largely reflect inflation expectations in the economy, and because inflationary pressures were largely contained, their yields fluctuated in a range rather than move sharply higher. Consequently, the yield curve flattened considerably in 2005. Longer-term bonds also performed better than shorter-term bonds as bond prices move in the opposite direction of their yields. Because the asset manager anticipated the flattening of the yield curve, the Portfolio benefited from its position on the longer end of the yield curve.
The Portfolio favored high-quality bonds that provided more attractive yields than U.S. Treasury securities. The Portfolio had an overweight exposure to federal agency securities that was larger than its allocation to Treasurys. The federal agency securities sector weathered negative news about accounting irregularities at the Federal National Mortgage Association (Fannie Mae). The sector largely shrugged off this development as prospects for increased regulatory oversight, improving agency balance sheets, and a reduced supply of newly issued securities helped boost investor confidence in the sector.
For the year, mortgage-backed securities underperformed Treasurys, and the Portfolio’s overweight exposure to the mortgage-backed sector detracted from its performance. This, however, was largely offset by the asset manager’s favorable security selection, which included securities backed by commercial mortgages and securities backed by pools of residential mortgages with characteristics that helped these securities perform well in the current market environment.
Prudential Investments LLC (PI), a wholly owned subsidiary of Prudential Financial, Inc., serves as the overall investment manager for the Fund.
For average and index definitions, refer to the Glossary of Benchmark Definitions page. Investors cannot invest directly in a market index or average. For a complete list of holdings refer to the Schedule of Investments section of this report.
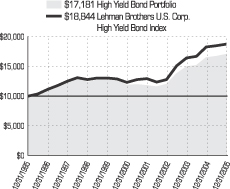
The Prudential Series Fund, High Yield Bond Portfolio
Subadvised by: Prudential Investment Management, Inc.
December 31, 2005
Investment Manager’s Report
Performance Summary - As of December 31, 2005
Average Annual Total Return Percentages
| 1-Year | 5-Year | 10-Year | |||||||
High Yield Bond Portfolio | 3.41 | % | 7.58 | % | 5.56 | % | |||
Lehman Brothers U.S. Corp. High Yield Bond Index | 2.74 | 8.85 | 6.54 | ||||||
Lipper (VIP) High Current Yield Funds Average | 2.56 | 7.12 | 5.62 |
Portfolio inception: 2/23/1987.
$10,000 INVESTED OVER 10 YEARS
Past performance does not guarantee future returns. Portfolio performance is net of investment fees and fund expenses, but not product charges, which, if included, would significantly lower the performance quoted. The investment return and principal value of an investment will fluctuate, so that an investor’s shares, when redeemed, may be worth more or less than their original cost. Current performance may be lower or higher than the past performance data quoted.
Unless noted otherwise, Lipper Average and Index returns reflect performance beginning the closest month-end date to the Portfolio’s inception.
For the year ended December 31, 2005, the High Yield Bond Portfolio had a total return that was above that of its benchmark index and the average of its peer group.
A resilient U.S. high yield bond market posted a positive return in 2005 even though the U.S. auto industry experienced a shakeup of historic proportions, the Federal Reserve (the Fed) repeatedly increased short-term interest rates, and some well-known firms sought protection by filing for bankruptcy. The high yield market was supported by its relatively attractive yields, a low default rate, and a strong U.S. economy.
To prevent the U.S. economy from growing too fast and fueling higher inflation, the Fed continued its latest campaign to increase short-term interest rates, which in the high yield market weighed most heavily on the prices of higher-quality speculative-grade bonds. The high yield market also came under pressure as stiff competition from foreign auto manufacturers and high labor costs hurt General Motors Corp. (GM) and Ford Motor Co. to the extent that their bonds were lowered from investment grade to speculative grade by major rating agencies. An underweight exposure to the auto sector compared with the Index helped the Portfolio’s performance relative to the Index, as did favorable security selection within the sector. The Portfolio held shorter-term bonds of GM and Ford financial subsidiaries that performed better than those of their respective parent companies. The Portfolio managed to avoid bonds of auto parts suppliers Collins & Aikman Corp. and Delphi Corp., both of which filed for bankruptcy in 2005. Another positive for the Portfolio was avoiding the bonds of two other bankrupt firms, Delta Air Lines and Northwest Airlines.
Among other sectors, modest underweight exposures to telecommunications and energy detracted from the Portfolio’s performance versus the Index as both sectors did well in 2005. Positive mergers and acquisitions activity aided telecom bonds, and rising prices for energy products benefited energy bonds.
Meanwhile, emerging-market bonds gained sharply in 2005. A strong global economic expansion, the search for attractive yields in the global low-interest-rate environment, and rising prices for commodities and crude oil helped boost emerging-market bond prices. Allocation to this market via bonds of Brazil, Argentina, and oil producers Russia, Venezuela, and Ecuador enhanced the Portfolio’s return.
Prudential Investments LLC (PI), a wholly owned subsidiary of Prudential Financial, Inc., serves as the overall investment manager for the Fund.
For average and index definitions, refer to the Glossary of Benchmark Definitions page. Investors cannot invest directly in a market index or average. For a complete list of holdings refer to the Schedule of Investments section of this report.
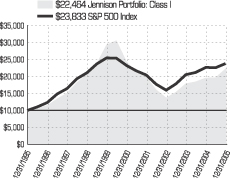
The Prudential Series Fund, Jennison Portfolio
Subadvised by: Jennison Associates LLC
December 31, 2005
Investment Manager’s Report
Performance Summary - As of December 31, 2005
Average Annual Total Return Percentages
| 1-Year | 5-Year | 10-Year | Since Inception | |||||||||
Jennison Portfolio: Class I | 14.55 | % | -1.58 | % | 8.43 | % | 10.19 | % | ||||
Jennison Portfolio: Class II | 14.02 | -1.99 | N/A | -5.79 | ||||||||
S&P 500 Index | 4.91 | 0.54 | 9.07 | 10.50 | ||||||||
Russell 1000® Growth Index | 5.26 | -3.58 | 6.73 | 8.34 | ||||||||
Lipper (VIP) Large-Cap Growth Funds Avg. | 7.33 | -3.18 | 7.24 | 8.70 |
Portfolio (Class I) inception: 4/25/1995. Portfolio (Class II) inception: 2/10/2000.
$10,000 INVESTED OVER 10 YEARS1
Past performance does not guarantee future returns. Portfolio performance is net of investment fees and fund expenses, but not product charges, which, if included, would significantly lower the performance quoted. The investment return and principal value of an investment will fluctuate, so that an investor’s shares, when redeemed, may be worth more or less than their original cost. Current performance may be lower or higher than the past performance data quoted.
Unless noted otherwise, Lipper Average and Index returns reflect performance beginning the closest month-end date to the Portfolio’s inception (Class I).
For the year ended December 31, 2005, the Jennison Portfolio had a total return that was substantially higher than its benchmarks and almost twice the average of its peer group.
The asset manager’s stock selection was very strong. Among the Portfolio’s 10 largest holdings, Google and Marvell Technology Group made particularly large contributions, and eBay was the largest detractor. The manager’s bottom-up selection process (one based upon intensive company analysis rather than forecasts of industry or sector trends) resulted in an overweight (as compared with the style-specific Russell 1000® Growth Index) in the energy sector, which was the strongest in the market by far. It also resulted in underweights in the relatively poor-performing consumer noncyclicals, consumer services, and healthcare sectors.
We look at a variety of ways in which the Portfolio differs from the style-specific benchmark. Over this reporting period, it benefited from above-benchmark exposure to stocks whose earnings growth rates and/or share prices have been rising recently. Its holdings also had an above-benchmark rate of earnings growth.
High earnings growth is characteristic of the growth investing style, but this hurt performance over 2005 because growth investing generally underperformed value investing (a relative performance trend that reversed toward the end of the year, suggesting that 2005 may be a transition year in the growth/value cycle). The Portfolio had a lower average dividend yield than the benchmark, which helped its performance—somewhat unusual in a value market. The overall Portfolio was more sensitive to the overall direction of the market than its benchmark, hurting its performance during the first half of the year when the overall market was stagnant.
Prudential Investments LLC (PI), a wholly owned subsidiary of Prudential Financial, Inc., serves as the overall investment manager for the Fund.
| 1 | The graph is based on the performance of Class I shares. Performance of Class II shares will be lower due to differences in the fee structure. Class II shares have associated 12b-1 and administrative fees at an annual rate of 0.25% and 0.15%, respectively, of the average daily net assets of the Class II shares. |
For average and index definitions, refer to the Glossary of Benchmark Definitions page. Investors cannot invest directly in a market index or average. For a complete list of holdings, refer to the Schedule of Investments section of this report.
The Prudential Series Fund, Money Market Portfolio
Subadvised by: Prudential Investment Management, Inc.
December 31, 2005
Investment Manager’s Report
Performance Summary - As of December 31, 2005
Average Annual Total Return Percentages
| 7-Day* Current Net Yield | 1-Year | 5-Year | 10-Year | |||||||||
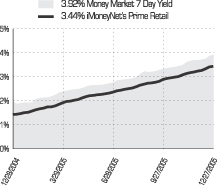
Money Market Portfolio | 3.92 | % | 2.85 | % | 2.05 | % | 3.73 | % | ||||
Lipper (VIP) Money Market Funds Avg. | N/A | 2.69 | 1.85 | 3.55 |
Portfolio inception: 5/13/1983.
SEVEN-DAY CURRENT NET YIELD *
Past performance does not guarantee future returns. Portfolio performance is net of investment fees and fund expenses, but not product charges, which, if included, would significantly lower the performance quoted. The investment return and principal value of an investment will fluctuate, so that an investor’s shares, when redeemed, may be worth more or less than their original cost. Current performance may be lower or higher than the past performance data quoted.
The yield quotation more closely reflects the current earnings of the Portfolio than the total return quotation. Unless noted otherwise, Lipper Average and Index returns reflect performance beginning the closest month-end date to the Portfolio’s inception.
For the year ended December 31, 2005, the Money Market Portfolio had a total return of 2.85% that was above the average of its peer group. On December 27, 2005, the Portfolio’s 7-day current yield was 3.92%, up from 1.95% on December 28, 2004. The yield quotation more closely reflects the current earnings of the portfolio than the total return quotation.
The investment environment for money market securities improved in 2005 as their yields rose to more attractive levels. This reflected an ongoing campaign by the Federal Reserve (the Fed) to increase short-term interest rates in order to reduce the excess monetary stimulus in the U.S. economy. From June 2004 through December 2005, the target for the federal funds rate on overnight loans between banks was raised 13 times in quarter-point increments, from 1.00% to 4.25%. Eight of the increases occurred in 2005.
The timing of Fed policymakers’ regularly scheduled meetings, which occur in roughly six-week intervals, played a key role in the asset manager’s investment strategy. The Portfolio often invested in securities that matured around the time of the next Fed meeting. This allowed it to reinvest the proceeds in higher yielding securities that became available after the Fed raised the target for the federal funds rate. If the portfolio manager believed money market yields adequately reflected fair relative value beyond the timing of the next Fed meeting, the portfolio manager purchased securities that came due after that meeting. As a result of this strategy, the Portfolio’s average maturity was positioned shorter than, or in line with, its competitive average during the first half of the year. In the second half of the year, the manager continued to invest in securities that came due around the time of Fed meetings, but late in the third quarter, it also began to invest in longer-term securities that were attractively priced because they matured after the end of the year. This positioned the Portfolio’s average maturity either in line with, or longer than, its competitive average in the second half of 2005.
In the rising-interest-rate environment, short-term adjustable-rate debt securities performed particularly well. Their interest rates reset periodically, based on formulas tied to the one- and three-month London interbank offered rates. A considerable exposure to these securities enhanced the Portfolio’s yield as their interest rates moved progressively higher.
Prudential Investments LLC (PI), a wholly owned subsidiary of Prudential Financial, Inc., serves as the overall investment manager for the Fund.
| * | Source: iMoneyNet, Inc. based on 368 funds in the iMoneyNet Prime Retail universe. Weekly 7-day current net yields of the Money Market Portfolio and the iMoneyNet Prime Retail universe as of 12/27/05. Prudential Investment Management, Inc. is the source for Money Market Portfolio information. |
For average and index definitions, refer to the Glossary of Benchmark Definitions page. Investors cannot invest directly in a market index or average. For a complete list of holdings refer to the Schedule of Investments section of this report.
The Prudential Series Fund, Natural Resources Portfolio
Subadvised by: Jennison Associates LLC
December 31, 2005
Investment Manager’s Report
Performance Summary - As of December 31, 2005
Average Annual Total Return Percentages
| 1-Year | 5-Year | 10-Year | Since Inception* | |||||||||
Natural Resources Portfolio: Class I | 55.91 | % | 23.74 | % | 18.78 | % | 15.90 | % | ||||
Natural Resources Portfolio: Class II | N/A | N/A | N/A | 50.56 | ||||||||
S&P 500 Index | 4.91 | 0.54 | 9.07 | 11.77 | ||||||||
Lipper (VIP) Natural Resources Funds Avg. | 37.38 | 16.90 | 13.04 | 16.00 |
Portfolio (Class I) inception: 5/1/1988. Portfolio (Class II) inception: 4/28/2005.
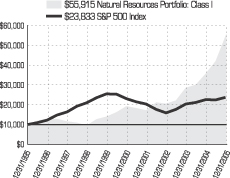
$10,000 INVESTED OVER 10 YEARS1
Past performance does not guarantee future returns. Portfolio performance is net of investment fees and fund expenses, but not product charges, which, if included, would significantly lower the performance quoted. The investment return and principal value of an investment will fluctuate, so that an investor’s shares, when redeemed, may be worth more or less than their original cost. Current performance may be lower or higher than the past performance data quoted.
| * | Returns of portfolios in existence for less than one year are not annualized. |
Unless noted otherwise, Lipper Average and Index returns reflect performance beginning the closest month-end date to the Portfolio’s inception (Class I).
For the year ended December 31, 2005, the Natural Resources Portfolio had a total return that was substantially higher than both its benchmark index and the average of its peer group. It was managed in a style designed to reproduce the performance profile of the Index.
Holdings in several industries contributed to the excellent performance. The Portfolio’s positions in the oil & gas exploration and production, drilling services, and metals & mining industries were very strong. Many of the Portfolio’s 10 largest positions fared particularly well, including OPTI Canada, Southwestern Energy, National Oilwell Varco, Suncor Energy, Global SantaFe, and Phelps Dodge.
Natural resources generally had a good year, but most of the Portfolio’s outperformance of its benchmark came from a surge in metal & mining stocks in the fourth quarter. Although a drag on return in the fourth quarter, the Portfolio’s energy holdings were strong through much of the year. Jennison continues to believe that long-term supply and demand imbalances for oil, natural gas, gold, copper, and other metals will continue.
Two chemical companies that produce the building block chemical ethylene were among the largest detractors from the Portfolio’s return. Their shares fell as investors became increasingly concerned that the ethylene cycle would not last as long as previously hoped. These positions were sold from the Portfolio. Several shipping companies that operate fleets of tankers carrying crude oil and petroleum products also hurt performance. The addition of shipping tonnage reduced utilization rates and weakened shipping prices. The shipping holdings also were sold.
Prudential Investments LLC (PI), a wholly owned subsidiary of Prudential Financial, Inc., serves as the overall investment manager for the Fund.
| 1 | The graph is based on the performance of Class I shares. Performance of Class II shares will be lower due to differences in the fee structure. Class II shares have associated 12b-1 and administrative fees at an annual rate of 0.25% and 0.15% respectively of the average daily net assets of the Class II shares. |
For average and index definitions, refer to the Glossary of Benchmark Definitions page. Investors cannot invest directly in a market index or average. For a complete list of holdings, refer to the Schedule of Investments section of this report.
The Prudential Series Fund, Small Capitalization Stock Portfolio
Subadvised by: Quantitative Management Associates LLC
December 31, 2005
Investment Manager’s Report
Performance Summary - As of December 31, 2005
Average Annual Total Return Percentages
| 1-Year | 5-Year | 10-Year | |||||||
Small Capitalization Stock Portfolio | 7.26 | % | 10.20 | % | 11.88 | % | |||
S&P SmallCap 600 Index | 7.68 | 10.76 | 12.16 | ||||||
Lipper (VIP) Small-Cap Core Funds Avg. | 5.35 | 8.21 | 10.77 |
Portfolio inception: 4/25/1995.
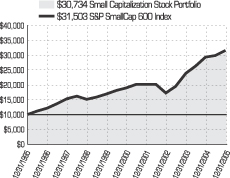
$10,000 INVESTED OVER 10 YEARS
Past performance does not guarantee future returns. Portfolio performance is net of investment fees and fund expenses, but not product charges, which, if included, would significantly lower the performance quoted. The investment return and principal value of an investment will fluctuate, so that an investor’s shares, when redeemed, may be worth more or less than their original cost. Current performance may be lower or higher than the past performance data quoted.
Unless noted otherwise, Lipper Average and Index returns reflect performance beginning the closest month-end date to the Portfolio’s inception.
For the year ended December 31, 2005, the Small Capitalization Stock Portfolio had a total return, after expenses, that was in line with the Index and above the average of its peer group. It was managed in a style designed to reproduce the performance profile of the Index.
The SmallCap 600 Index outperformed large-cap stocks (represented by the S&P 500 Index) in 2005, but equities generally had returns that were below their long-term averages. In terms of sector contributions, almost all of the Index gains came in the energy, industrials, and healthcare sectors.
The energy sector returned almost 55%, with broad-based gains. Many companies involved in exploration, production, and drilling for oil and gas are small-cap firms. Although it had a substantially lower return, the industrials sector is twice the size of the energy sector. It includes transportation stocks, which were among the market’s strongest, and capital goods firms. The contribution of the healthcare sector was the result of strong performances by healthcare equipment and services stocks, partially offset by significant declines in pharmaceuticals and biotechnology. The materials and utilities sectors are smaller components of the Index and their returns were closer to the Index average. The two consumer sectors (consumer discretionary and consumer staples), financials, and information technology neither added nor detracted much from the Index return, but that does not mean share prices were stable in those sectors. Some of their industry groups had strong performances, while others declined substantially. The telecommunication services sector had the largest sector decline, but a negligible impact because it is very small.
Prudential Investments LLC (PI), a wholly owned subsidiary of Prudential Financial, Inc., serves as the overall investment manager for the Fund.
For average and index definitions, refer to the Glossary of Benchmark Definitions page. Investors cannot invest directly in a market index or average. For a complete list of holdings refer to the Schedule of Investments section of this report.
The Prudential Series Fund, Stock Index Portfolio
Subadvised by: Quantitative Management Associates LLC
December 31, 2005
Investment Manager’s Report
Performance Summary - As of December 31, 2005
Average Annual Total Return Percentages
| 1-Year | 5-Year | 10-Year | |||||||
Stock Index Portfolio | 4.54 | % | 0.25 | % | 8.79 | % | |||
S&P 500 Index | 4.91 | 0.54 | 9.07 | ||||||
Lipper (VIP) S&P 500 Index Objective Funds Avg. | 4.52 | 0.16 | 8.74 |
Portfolio inception: 10/19/1987.
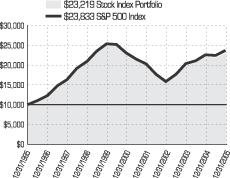
$10,000 INVESTED OVER 10 YEARS
Past performance does not guarantee future returns. Portfolio performance is net of investment fees and fund expenses, but not product charges, which, if included, would significantly lower the performance quoted. The investment return and principal value of an investment will fluctuate, so that an investor’s shares, when redeemed, may be worth more or less than their original cost. Current performance may be lower or higher than the past performance data quoted.
Unless noted otherwise, Lipper Average and Index returns reflect performance beginning the closest month-end date to the Portfolio’s inception.
For the year ended December 31, 2005, the Stock Index Portfolio had a total return, after expenses, that was generally in line with the Index and with the average of its peer group. It was managed in a style designed to reproduce the performance profile of the Index.
The Index return was considerably below its long-term average. Although it spent much of the year within a narrow range, market character changed significantly in the fourth quarter. The energy and utilities sectors were far ahead at the end of September, but then fell sharply. The materials, financials, and industrials sectors were fourth-quarter market leaders, but were in the red at the three-quarter mark.
Almost all sectors included substantial winners and losers over the full year. In the consumer discretionary sector, both GM and Ford fell dramatically, but DaimlerChrysler had a double-digit total return. Although publishing stocks generally fell substantially, McGraw-Hill’s return was in the mid-double digits. The financials sector included strong performances by life & health insurers as well as steep falls by mortgage finance companies and smaller declines by diversified and regional banks. The pharmaceutical industry, which makes up about half the healthcare sector, fell on concerns about drug pipelines, blockbuster drugs coming off patent, and legal liabilities after the withdrawal of Vioxx from the market. However, most industries in the sector had high returns, particularly HMOs.
Among industrials, human resource & employment services, railroads, and aerospace & defense stocks were strong, but some large conglomerates as well as companies sensitive to fuel costs, such as airfreight and airlines, declined. The information technology sector was very mixed. Apple Computer more than doubled in price and Hewlett-Packard surged while Gateway halved in value and Dell fell substantially. Many semiconductor-related companies had good returns. In communications equipment, firms that sell infrastructure declined substantially, but Motorola was among the market leaders on strong sales of its wireless handsets.
Prudential Investments LLC (PI), a wholly owned subsidiary of Prudential Financial, Inc., serves as the overall investment manager for the Fund.
For average and index definitions, refer to the Glossary of Benchmark Definitions page. Investors cannot invest directly in a market index or average. For a complete list of holdings refer to the Schedule of Investments section of this report.
The Prudential Series Fund, Value Portfolio
Subadvised by: Jennison Associates LLC
December 31, 2005
Investment Manager’s Report
Performance Summary - As of December 31, 2005
Average Annual Total Return Percentages
| 1-Year | 5-Year | 10-Year | Since Inception | |||||||||
Value Portfolio: Class I | 16.66 | % | 5.84 | % | 10.86 | % | 12.19 | % | ||||
Value Portfolio: Class II | 16.21 | N/A | N/A | 5.40 | ||||||||
S&P 500 Index | 4.91 | 0.54 | 9.07 | 11.52 | ||||||||
Russell 1000® Value Index | 7.05 | 5.28 | 10.94 | 12.41 | ||||||||
Lipper (VIP) Large Cap Value Funds Avg. | 4.82 | 2.95 | 8.60 | 10.10 | ||||||||
Lipper (VIP) Multi Cap Value Funds Avg. | 6.30 | 4.87 | 9.54 | 10.00 |
Portfolio (Class I) inception: 2/19/1988. Portfolio (Class II) inception: 5/14/2001.
$10,000 INVESTED OVER 10 YEARS1

Past performance does not guarantee future returns. Portfolio performance is net of investment fees and fund expenses, but not product charges, which, if included, would significantly lower the performance quoted. The investment return and principal value of an investment will fluctuate, so that an investor’s shares, when redeemed, may be worth more or less than their original cost. Current performance may be lower or higher than the past performance data quoted.
Unless noted otherwise, Lipper Average and Index returns reflect performance beginning the closest month-end date to the Portfolio’s inception (Class I). Although Lipper classifies the Portfolio within the Multi-Cap Value Funds Average, the returns for the Large-Cap Value Funds Average are also shown, because the management of the portfolios included in the Large-Cap Value Funds Average is more consistent with the management of the Portfolio.
For the year ended December 31, 2005, the Value Portfolio had a total return that was more than twice its benchmark indexes and the average of its peer group.
The Portfolio’s outperformance of the Russell 1000® Value Index (the style-specific benchmark) was due primarily to the asset manager’s strong stock selection, particularly within the energy sector. Stocks in the sector continued to benefit from the imbalance of supply and demand for energy commodities. Exploration and production companies in the Portfolio were strong performers as they became increasingly profitable due to high prices for oil and gas.
The Texas utility TXU, another strong performer, benefited as its dramatic corporate restructuring continued to lead to stronger earnings. Phelps Dodge, a copper producer, also contributed nicely to the Portfolio’s comparative performance. Of the Portfolio’s top 10 holdings, a position in the Kroger grocery chain was the largest detractor.
Sector weightings also helped the Portfolio’s performance. Overweights, compared with the style-specific benchmark in energy, consumer noncyclicals, and healthcare, had a positive impact. However, an overweight in technology detracted. Although the Portfolio did not have any major deviations from the benchmark in other significant risk characteristics, it did benefit somewhat from its underexposure to stocks with above-average dividend yield and its overexposure to momentum stocks (those whose earnings and/or share prices have been rising recently).
Prudential Investments LLC (PI), a wholly owned subsidiary of Prudential Financial, Inc., serves as the overall investment manager for the Fund.
| 1 | The graph is based on the performance of Class I shares. Performance of Class II shares will be lower due to differences in the fee structure. Class II shares have associated 12b-1 and administrative fees at an annual rate of 0.25% and 0.15% respectively of the average daily net assets of the Class II shares. |
For average and index definitions, refer to the Glossary of Benchmark Definitions page. Investors cannot invest directly in a market index or average. For a complete list of holdings, refer to the Schedule of Investments section of this report.
Prudential Series Fund Presentation of Portfolio Holdings as of December 31, 2005 (Unaudited)
| Conservative Balanced | ||
| Five Largest Equity Holdings (% of Net Assets) | ||
| General Electric Co. | 1.9% | |
| Exxon Mobil Corp. | 1.8% | |
| Citigroup, Inc. | 1.3% | |
| Microsoft Corp. | 1.2% | |
| Procter & Gamble Co. | 1.0% | |
| Five Largest Sectors (% of Net Assets) | ||
| Mortgage Backed Securities | 12.0% | |
| Drugs & Medical Supplies | 5.8% | |
| Financial Services | 5.4% | |
| U.S. Treasury Securities | 5.2% | |
| Commercial Mortgage Backed Securities | 3.8% | |
| Diversified Bond | ||
| Five Largest Issues (% of Net Assets) | ||
| Federal National Mortgage Association, 5.0%, 3/1/34 | 2.7% | |
| Federal National Mortgage Association, 6.0%, 1/1/35 | 2.6% | |
| Federal National Mortgage Association, 5.5%, 1/1/33 | 2.2% | |
| Federal National Mortgage Association, 4.5%, 5/1/19 | 1.4% | |
| Dow Jones CDX HY, 8.25%, 12/29/10 | 1.3% | |
| Five Largest Sectors (% of Net Assets) | ||
| U.S. Government Mortgage Backed Securities | 33.9% | |
| Commercial Mortgage Backed Securities | 8.7% | |
| Non-Corporate Sovereign | 6.4% | |
| Telecommunications | 5.2% | |
| Electric | 4.3% | |
| Equity | ||
| Five Largest Holdings (% of Net Assets) | ||
| General Electric Co. | 3.1% | |
| Microsoft Corp. | 2.3% | |
| UnitedHealth Group, Inc. | 2.0% | |
| Merrill Lynch & Co., Inc. | 1.8% | |
| American. International Group, Inc. | 1.8% | |
| Five Largest Industries (% of Net Assets) | ||
| Software | 6.4% | |
| Metals & Mining | 6.2% | |
| Pharmaceuticals | 5.6% | |
| Capital Markets | 4.8% | |
| Insurance | 4.3% | |
| Flexible Managed | ||
| Five Largest Equity Holdings (% of Net Assets) | ||
| General Electric Co. | 1.9% | |
| Exxon Mobil Corp. | 1.9% | |
| Intel Corp. | 1.4% | |
| Johnson & Johnson | 1.3% | |
| Citigroup Inc. | 1.3% | |
| Five Largest Sectors (% of Net Assets) | ||
| Mortgage Backed Securities | 8.3% | |
| Financial Services | 6.9% | |
| Drugs & Medical Supplies | 6.7% | |
| Oil, Gas & Consumable Fuels | 6.3% | |
| U.S. Government Obligations | 4.7% | |
| Global | ||
| Five Largest Holdings (% of Net Assets) | ||
| UBS AG | 1.7% | |
| UnitedHealth Group, Inc. | 1.7% | |
| General Electric Co. | 1.4% | |
| Genentech, Inc. | 1.3% | |
| Apple Computer, Inc. | 1.2% | |
| Five Largest Countries (% of Net Assets) | ||
| United States | 44.1% | |
| Japan | 12.6% | |
| United Kingdom | 8.0% | |
| France | 5.0% | |
| Switzerland | 4.8% | |
| Government Income | ||
| Five Largest Issues (% of Net Assets) | ||
Federal National Mortgage Association, 5.50%, 01/01/17 - 09/01/35 | 12.7% | |
Federal National Mortgage Association, 4.25%, 08/15/10 | 4.2% | |
Federal National Mortgage Association, 5.00%, 07/01/18 - 03/01/34 | 4.0% | |
Federal Home Loan Mortgage Corp., 4.375%, 01/25/10 | 3.8% | |
Federal Home Loan Mortgage Corp., 5.00%, 06/01/33 - 05/01/34 | 3.4% | |
| Five Largest Sectors (% of Net Assets) | ||
| Mortgage Backed Securities | 44.0% | |
| U.S. Government Agency Obligations | 23.0% | |
| U.S. Government Securities | 7.7% | |
| Commercial Mortgage Backed Securities | 6.5% | |
| Collateralized Mortgage Obligations | 6.5% | |
| High Yield Bond | ||
| Five Largest Issues (% of Net Assets) | ||
| General Motors Acceptance Corp. | 3.4% | |
| MGM Mirage, Inc. | 1.9% | |
| SunGard Data System, Inc | 1.3% | |
| IMC Global, Inc. | 1.2% | |
| Host Marriot LP | 1.2% | |
| Five Largest Industries (% of Net Assets) | ||
| Health Care & Pharmaceuticals | 8.2% | |
| Electric | 7.2% | |
| Chemicals | 6.9% | |
| Automotive | 6.3% | |
| Media & Entertainment | 6.0% | |
| Jennison | ||
| Five Largest Holdings (% of Net Assets) | ||
| Google, Inc. (Class “A” Stock) | 3.9% | |
| eBay, Inc. | 3.4% | |
| General Electric Co. | 3.2% | |
| Procter & Gamble Co. (The) | 3.0% | |
| Yahoo!, Inc. | 2.9% | |
| Five Largest Industries (% of Net Assets) | ||
| Semiconductors & Semiconductor Equip | 9.7% | |
| Software | 8.7% | |
| Internet Software & Services | 6.8% | |
| Biotechnology | 6.1% | |
| Health Care Providers & Services | 5.9% | |
| Natural Resources | ||
| Five Largest Holdings (% of Net Assets) | ||
| OPTI Canada, Inc. (Canada) | 3.9% | |
| Suncor Energy, Inc. | 3.8% | |
| National-Oilwell Varco, Inc. | 3.8% | |
| GlobalSantaFe Corp. | 3.6% | |
| Southwestern Energy Co. | 3.5% | |
| Five Largest Industries (% of Net Assets) | ||
| Oil Service | 22.1% | |
| Natural Gas Production | 17.2% | |
| Gold | 13.7% | |
| Integrated Oil/International | 8.2% | |
| Basic Metals | 7.3% | |
| Small Capitalization Stock | ||
| Five Largest Holdings (% of Net Assets) | ||
| iShares S&P SmallCap 600 Index | 0.7% | |
| NVR, Inc. | 0.7% | |
| Cimarex Energy Co. | 0.7% | |
| Roper Industries, Inc. | 0.6% | |
| Oshkosh Truck Corp. (Class “B” Stock) | 0.6% | |
| Five Largest Industries (% of Net Assets) | ||
| Banks & Savings & Loans | 6.2% | |
| Retail | 6.2% | |
| Drugs & Medical Supplies | 5.5% | |
| Oil & Gas | 4.9% | |
| Machinery | 3.9% | |
| Stock Index | ||
| Five Largest Holdings (% of Net Assets) | ||
| General Electric Co. | 3.2% | |
| Exxon Mobil Corp. | 3.1% | |
| Citigroup, Inc. | 2.2% | |
| Microsoft Corp. | 2.1% | |
| Procter & Gamble Co. | 1.7% | |
| Five Largest Industries (% of Net Assets) | ||
| Financial Services | 9.1% | |
| Drugs & Medical Supplies | 9.0% | |
| Banks and Savings & Loans | 6.4% | |
| Computer Services | 5.8% | |
| Retail | 5.7% | |
| Value | ||
| Five Largest Holdings (% of Net Assets) | ||
| Altria Group, Inc. | 2.7% | |
| Citigroup, Inc. | 2.7% | |
| TXU Corp. | 2.6% | |
| Kroger Co. (The) | 2.5% | |
| Suncor Energy, Inc. | 2.3% | |
| Five Largest Industries (% of Net Assets) | ||
| Oil, Gas & Consumable Fuels | 10.9% | |
| Financial Services | 10.1% | |
| Insurance | 6.8% | |
| Aerospace & Defense | 5.3% | |
| Pharmaceuticals | 4.5% | |
For a complete listing of holdings, refer to the Schedule of Investments section of this report.
Holdings reflect only long-term investments. Holdings/Issues/Industries/Sectors are subject to change.
Fees and Expenses (Unaudited)
As a contract owner investing in Portfolios of the Fund through a variable annuity or variable life contract, you incur ongoing costs, including management fees, distribution and service (12b-1) fees, and other Portfolio expenses. This example is intended to help you understand your ongoing costs (in dollars) of investing in the Fund and to compare these costs with the ongoing costs of investing in other investment options. This example does not reflect fees and charges under your variable annuity or variable life contract. If contract charges were included, the costs shown below would be higher. Please consult the prospectus for your contract for more information about contract fees and charges.
The example is based on an investment of $1,000 invested at the beginning of the period and held for the entire period July 1, 2005 through December 31, 2005.
Actual Expenses
The first line of the table below provides information about actual account values and actual expenses. You may use this information, together with the amount you invested, to estimate the Portfolio expenses that you paid over the period. Simply divide your account value by $1,000 (for example, an $8,600 account value divided by $1,000 = 8.6), then multiply the result by the number in the first line under the heading entitled “Expenses Paid During Period” to estimate the Portfolio expenses you paid on your account during this period. As noted above, the table does not reflect variable contract fees and charges.
Hypothetical Example for Comparison Purposes
The second line of the table below provides information about hypothetical account values and hypothetical expenses based on the Portfolio’s actual expense ratio and an assumed rate of return of 5% per year before expenses, which is not the Portfolio’s actual return. The hypothetical account values and expenses may not be used to estimate the actual ending account balance or expenses you paid for the period. You may use this information to compare the ongoing costs of investing in the Portfolio and other investment options. To do so, compare this 5% hypothetical example with the 5% hypothetical examples that appear in the shareholder reports of the other investment options.
Please note that the expenses shown in the table are meant to highlight your ongoing Portfolio costs only and do not reflect any contract fees and charges, such as sales charges (loads), insurance charges or administrative charges. Therefore the second line of the table is useful to compare ongoing investment option costs only, and will not help you determine the relative total costs of owning different contracts. In addition, if these contract fee and charges were included, your costs would have been higher.
| Prudential Series Fund Portfolios | Beginning Portfolio Value July 1, 2005 | Ending Portfolio Value December 31, 2005 | Annualized Expense Ratio Based on the Six-Month Period | Expenses Paid During the Six- Month Period* | ||||||||||
| Conservative Balanced (Class I) | Actual | $ | 1,000.00 | $ | 1,031.40 | 0.57 | % | $ | 2.92 | |||||
| Hypothetical | $ | 1,000.00 | $ | 1,022.33 | 0.57 | % | $ | 2.91 | ||||||
| Diversified Bond (Class I) | Actual | $ | 1,000.00 | $ | 1,003.50 | 0.46 | % | $ | 2.32 | |||||
| Hypothetical | $ | 1,000.00 | $ | 1,022.89 | 0.46 | % | $ | 2.35 | ||||||
| Equity (Class I) | Actual | $ | 1,000.00 | $ | 1,113.50 | 0.46 | % | $ | 2.45 | |||||
| Hypothetical | $ | 1,000.00 | $ | 1,022.89 | 0.46 | % | $ | 2.35 | ||||||
| Equity (Class II) | Actual | $ | 1,000.00 | $ | 1,110.90 | 0.86 | % | $ | 4.58 | |||||
| Hypothetical | $ | 1,000.00 | $ | 1,020.87 | 0.86 | % | $ | 4.38 | ||||||
| Flexible Managed (Class I) | Actual | $ | 1,000.00 | $ | 1,038.00 | 0.63 | % | $ | 3.24 | |||||
| Hypothetical | $ | 1,000.00 | $ | 1,022.03 | 0.63 | % | $ | 3.21 | ||||||
| Global (Class I) | Actual | $ | 1,000.00 | $ | 1,171.20 | 0.81 | % | $ | 4.43 | |||||
| Hypothetical | $ | 1,000.00 | $ | 1,021.12 | 0.81 | % | $ | 4.13 | ||||||
| Government Income (Class I) | Actual | $ | 1,000.00 | $ | 997.00 | 0.49 | % | $ | 2.47 | |||||
| Hypothetical | $ | 1,000.00 | $ | 1,022.74 | 0.49 | % | $ | 2.50 | ||||||
| High Yield (Class I) | Actual | $ | 1,000.00 | $ | 1,022.30 | 0.58 | % | $ | 2.96 | |||||
| Hypothetical | $ | 1,000.00 | $ | 1,022.28 | 0.58 | % | $ | 2.96 | ||||||
| Prudential Series Fund Portfolios | Beginning Portfolio Value July 1, 2005 | Ending Portfolio Value December 31, 2005 | Annualized Expense Ratio Based on the Six-Month Period | Expenses Paid During the Six- Month Period* | ||||||||||
| Jennison (Class I) | Actual | $ | 1,000.00 | $ | 1,139.00 | 0.63 | % | $ | 3.40 | |||||
| Hypothetical | $ | 1,000.00 | $ | 1,022.03 | 0.63 | % | $ | 3.21 | ||||||
| Jennison (Class II) | Actual | $ | 1,000.00 | $ | 1,135.80 | 1.03 | % | $ | 5.54 | |||||
| Hypothetical | $ | 1,000.00 | $ | 1,020.01 | 1.03 | % | $ | 5.24 | ||||||
| Money Market (Class I) | Actual | $ | 1,000.00 | $ | 1,016.50 | 0.45 | % | $ | 2.29 | |||||
| Hypothetical | $ | 1,000.00 | $ | 1,022.94 | 0.45 | % | $ | 2.29 | ||||||
| Natural Resources (Class I) | Actual | $ | 1,000.00 | $ | 1,328.90 | 0.48 | % | $ | 2.82 | |||||
| Hypothetical | $ | 1,000.00 | $ | 1,022.79 | 0.48 | % | $ | 2.45 | ||||||
| Natural Resources (Class II) | Actual | $ | 1,000.00 | $ | 1,326.30 | 0.88 | % | $ | 5.16 | |||||
| Hypothetical | $ | 1,000.00 | $ | 1,020.77 | 0.88 | % | $ | 4.48 | ||||||
| Small Capitalization (Class I) | Actual | $ | 1,000.00 | $ | 1,055.50 | 0.45 | % | $ | 2.33 | |||||
| Hypothetical | $ | 1,000.00 | $ | 1,022.94 | 0.45 | % | $ | 2.29 | ||||||
| Stock Index (Class I) | Actual | $ | 1,000.00 | $ | 1,056.10 | 0.38 | % | $ | 1.97 | |||||
| Hypothetical | $ | 1,000.00 | $ | 1,023.29 | 0.38 | % | $ | 1.94 | ||||||
| Value (Class I) | Actual | $ | 1,000.00 | $ | 1,118.80 | 0.43 | % | $ | 2.30 | |||||
| Hypothetical | $ | 1,000.00 | $ | 1,023.04 | 0.43 | % | $ | 2.19 | ||||||
| Value (Class II) | Actual | $ | 1,000.00 | $ | 1,116.80 | 0.83 | % | $ | 4.43 | |||||
| Hypothetical | $ | 1,000.00 | $ | 1,021.02 | 0.83 | % | $ | 4.23 | ||||||
| * | Portfolio expenses (net of fee waivers or subsidies, if any) for each share class are equal to the annualized expense ratio for each share class (provided in the table), multiplied by the average account value over the period, multiplied by the 184 days in the six-month period ended December 31, 2005, and divided by the 365 days in the Portfolio’s fiscal year ended December 31, 2005 (to reflect the six-month period). |
| CONSERVATIVE BALANCED PORTFOLIO |
STATEMENT OF ASSETS AND LIABILITIES
December 31, 2005
| ASSETS | ||||
Investments, at value including securities on loan of $261,257,394: | ||||
Unaffiliated investments (cost $2,407,278,671) | $ | 2,557,877,983 | ||
Affiliated investments (cost $556,186,188) | 556,179,503 | |||
Cash | 68,311 | |||
Receivable for investments sold | 91,241,360 | |||
Dividends and interest receivable | 10,440,131 | |||
Receivable for capital stock sold | 929,857 | |||
Prepaid expenses | 71,419 | |||
Total Assets | 3,216,808,564 | |||
| LIABILITIES | ||||
Collateral for securities on loan | 271,066,668 | |||
Payable for investments purchased | 192,795,325 | |||
Management fee payable | 1,294,013 | |||
Payable for capital stock repurchased | 1,223,502 | |||
Accrued expenses and other liabilities | 498,756 | |||
Due to broker—variation margin | 129,841 | |||
Outstanding options written (premiums received $32,695) | 7,363 | |||
Transfer agent fee payable | 158 | |||
Total Liabilities | 467,015,626 | |||
| NET ASSETS | $ | 2,749,792,938 | ||
Net assets were comprised of: | ||||
Common stock, at $0.01 par value | $ | 1,822,453 | ||
Paid-in capital in excess of par | 2,545,535,082 | |||
| 2,547,357,535 | ||||
Undistributed net investment income | 69,851,558 | |||
Accumulated net realized loss on investments | (18,382,356 | ) | ||
Net unrealized appreciation on investments | 150,966,201 | |||
Net assets, December 31, 2005 | $ | 2,749,792,938 | ||
Net asset value and redemption price per share, $2,749,792,938 / 182,245,305 outstanding shares of common stock (authorized 525,000,000 shares) | $ | 15.09 | ||
STATEMENT OF OPERATIONS
Year Ended December 31, 2005
| INVESTMENT INCOME | ||||
Interest | $ | 42,870,688 | ||
Unaffiliated dividend income (net of foreign withholding taxes of $14,138) | 34,090,845 | |||
Affiliated dividend income | 7,100,025 | |||
Affiliated income from securities loaned, net | 580,653 | |||
| 84,642,211 | ||||
| EXPENSES | ||||
Management fee | 15,374,476 | |||
Custodian’s fees and expenses | 482,000 | |||
Shareholders’ reports | 110,000 | |||
Insurance expenses | 85,000 | |||
Directors’ fees | 48,000 | |||
Audit fee | 20,000 | |||
Commitment fee on syndicated credit agreement | 17,000 | |||
Legal fees and expenses | 12,000 | |||
Transfer agent’s fee and expenses (including affiliated expense of $1,800) (Note 4) | 2,000 | |||
Miscellaneous | 12,050 | |||
Total expenses | 16,162,526 | |||
Less: custodian fee credit | (2,896 | ) | ||
Net expenses | 16,159,630 | |||
| NET INVESTMENT INCOME | 68,482,581 | |||
| NET REALIZED AND UNREALIZED GAIN (LOSS) ON INVESTMENTS | ||||
Net realized gain (loss) on: | ||||
Investments | (16,216,011 | ) | ||
Futures | 1,588,661 | |||
Options written | 9,120 | |||
| (14,618,230 | ) | |||
Net change in unrealized appreciation (depreciation) on: | ||||
Investments | 40,733,804 | |||
Futures | (1,167,481 | ) | ||
Options written | 25,332 | |||
| 39,591,655 | ||||
| NET GAIN ON INVESTMENTS | 24,973,425 | |||
| NET INCREASE IN NET ASSETS RESULTING FROM OPERATIONS | $ | 93,456,006 | ||
STATEMENT OF CHANGES IN NET ASSETS
| Year Ended December 31, | ||||||||
| 2005 | 2004 | |||||||
| INCREASE (DECREASE) IN NET ASSETS OPERATIONS: | ||||||||
Net investment income | $ | 68,482,581 | $ | 64,495,046 | ||||
Net realized gain (loss) on investments | (14,618,230 | ) | 34,664,562 | |||||
Net change in unrealized appreciation (depreciation) on investments | 39,591,655 | 120,028,247 | ||||||
NET INCREASE IN NET ASSETS RESULTING FROM OPERATIONS | 93,456,006 | 219,187,855 | ||||||
| DIVIDENDS AND DISTRIBUTIONS: | ||||||||
Dividends from net investment income | (65,771,642 | ) | (55,941,153 | ) | ||||
Distributions from net realized capital gains | (28,275,553 | ) | (16,740,774 | ) | ||||
TOTAL DIVIDENDS AND DISTRIBUTIONS | (94,047,195 | ) | (72,681,927 | ) | ||||
| CAPITAL STOCK TRANSACTIONS: | ||||||||
Capital stock sold [2,034,058 and 2,640,900 shares, respectively] | 30,062,884 | 37,781,509 | ||||||
Capital stock issued in reinvestment of dividends and distributions [6,595,175 and 5,151,093 shares, respectively] | 94,047,195 | 72,681,927 | ||||||
Capital stock repurchased [18,072,236 and 17,999,367 shares, respectively] | (267,289,008 | ) | (258,377,816 | ) | ||||
NET INCREASE (DECREASE) IN NET ASSETS RESULTING FROM CAPITAL STOCK TRANSACTIONS | (143,178,929 | ) | (147,914,380 | ) | ||||
| TOTAL DECREASE IN NET ASSETS | (143,770,118 | ) | (1,408,452 | ) | ||||
| NET ASSETS: | ||||||||
Beginning of year | 2,893,563,056 | 2,894,971,508 | ||||||
End of year (a) | $ | 2,749,792,938 | $ | 2,893,563,056 | ||||
(a) Includes undistributed net investment income of: | $ | 69,851,558 | $ | 65,771,642 | ||||
SEE NOTES TO FINANCIAL STATEMENTS.
A1
| DIVERSIFIED BOND PORTFOLIO |
STATEMENT OF ASSETS AND LIABILITIES
December 31, 2005
| ASSETS | ||||
Investments, at value including securities on loan of $115,342,737: | ||||
Unaffiliated investments (cost $1,207,395,338) | $ | 1,206,551,530 | ||
Affiliated investments (cost $236,170,881) | 236,165,646 | |||
Foreign currency, at value (cost $247,636) | 247,603 | |||
Receivable for investments sold | 42,884,019 | |||
Interest receivable | 11,404,710 | |||
Unrealized appreciation on forward foreign currency contracts | 720,708 | |||
Unrealized appreciation on swaps | 709,204 | |||
Prepaid expenses | 45,204 | |||
Receivable for capital stock sold | 30,140 | |||
Total Assets | 1,498,758,764 | |||
| LIABILITIES | ||||
Payable for investments purchased | 146,852,727 | |||
Collateral for securities on loan | 118,044,608 | |||
Payable for capital stock repurchased | 1,980,675 | |||
Management fee payable | 445,609 | |||
Accrued expenses and other liabilities | 386,008 | |||
Unrealized depreciation on forward foreign currency contracts | 199,873 | |||
Payable to custodian | 168,222 | |||
Outstanding options written (premiums received $68,013) | 15,319 | |||
Deferred directors’ fees | 7,911 | |||
Unrealized depreciation on swaps | 6,894 | |||
Due to broker—variation margin | 4,717 | |||
Transfer agent fee payable | 218 | |||
Total Liabilities | 268,112,781 | |||
| NET ASSETS | $ | 1,230,645,983 | ||
Net assets were comprised of: | ||||
Common stock, at $0.01 par value | $ | 1,123,114 | ||
Paid-in capital in excess of par | 1,220,942,697 | |||
| 1,222,065,811 | ||||
Distributions in excess of net investment income | (1,572,811 | ) | ||
Accumulated net realized gain on investments | 8,729,268 | |||
Net unrealized appreciation on investments and foreign currencies | 1,423,715 | |||
Net assets, December 31, 2005 | $ | 1,230,645,983 | ||
Net asset value and redemption price per share, $1,230,645,983 / 112,311,406 outstanding shares of common stock (authorized 275,000,000 shares) | $ | 10.96 | ||
STATEMENT OF OPERATIONS
Year Ended December 31, 2005
| INVESTMENT INCOME | ||||
Interest (net of foreign withholding taxes of $17,276) | $ | 61,169,113 | ||
Affiliated dividend income | 2,720,333 | |||
Affiliated income from securities loaned, net | 253,453 | |||
| 64,142,899 | ||||
| EXPENSES | ||||
Management fees | 4,870,124 | |||
Custodian’s fees and expenses | 285,000 | |||
Shareholders’ reports | 250,000 | |||
Insurance expenses | 40,000 | |||
Directors’ fees | 39,000 | |||
Audit fee | 20,000 | |||
Commitment fee on syndicated credit agreement | 15,000 | |||
Legal fees and expenses | 10,000 | |||
Transfer agent’s fee and expenses (including affiliated expense of $2,500) (Note 4) | 2,500 | |||
Miscellaneous | 7,028 | |||
Total expenses | 5,538,652 | |||
Less: custodian fee credit | (6,551 | ) | ||
Net expenses | 5,532,101 | |||
| NET INVESTMENT INCOME | 58,610,798 | |||
| NET REALIZED AND UNREALIZED GAIN (LOSS) ON INVESTMENTS, SWAPS AND FOREIGN CURRENCIES | ||||
Net realized gain (loss) on: | ||||
Investments | 4,267,073 | |||
Futures transactions | 5,388,658 | |||
Written options | 19,241 | |||
Swaps | (526,190 | ) | ||
Foreign currency transactions | (1,920 | ) | ||
| 9,146,862 | ||||
Net change in unrealized appreciation (depreciation) on: | ||||
Investments | (29,959,547 | ) | ||
Futures | (126,605 | ) | ||
Swaps | 384,851 | |||
Written options | 52,694 | |||
Foreign currencies | 1,021,566 | |||
| (28,627,041 | ) | |||
| NET LOSS ON INVESTMENTS, SWAPS AND FOREIGN CURRENCIES | (19,480,179 | ) | ||
| NET INCREASE IN NET ASSETS RESULTING FROM OPERATIONS | $ | 39,130,619 | ||
STATEMENT OF CHANGES IN NET ASSETS
| Year Ended December 31, | ||||||||
| 2005 | 2004 | |||||||
| INCREASE (DECREASE) IN NET ASSETS | ||||||||
| OPERATIONS: | ||||||||
Net investment income | $ | 58,610,798 | $ | 62,388,239 | ||||
Net realized gain on investments and foreign currencies | 9,146,862 | 23,636,787 | ||||||
Net change in unrealized appreciation (depreciation) on investments and foreign currencies | (28,627,041 | ) | (12,479,909 | ) | ||||
NET INCREASE IN NET ASSETS RESULTING FROM OPERATIONS | 39,130,619 | 73,545,117 | ||||||
| DIVIDENDS AND DISTRIBUTIONS: | ||||||||
Dividends from net investment income | (64,066,702 | ) | (59,934,775 | ) | ||||
Distributions from net realized capital gains | (8,967,165 | ) | — | |||||
TOTAL DIVIDENDS AND DISTRIBUTIONS | (73,033,867 | ) | (59,934,775 | ) | ||||
| CAPITAL STOCK TRANSACTIONS: | ||||||||
Capital stock sold [13,510,338 and 4,067,619 shares, respectively] | 149,284,047 | 45,699,435 | ||||||
Capital stock issued in reinvestment of dividends and distributions [6,639,907 and 5,347,081 shares, respectively] | 73,033,867 | 59,934,775 | ||||||
Capital stock repurchased [21,634,412 and 22,539,459 shares, respectively] | (241,438,250 | ) | (253,550,802 | ) | ||||
NET INCREASE (DECREASE) IN NET ASSETS RESULTING FROM CAPITAL STOCK TRANSACTIONS | (19,120,336 | ) | (147,916,592 | ) | ||||
| TOTAL DECREASE IN NET ASSETS | (53,023,584 | ) | (134,306,250 | ) | ||||
| NET ASSETS: | ||||||||
Beginning of year | 1,283,669,567 | 1,417,975,817 | ||||||
End of year (a) | $ | 1,230,645,983 | $ | 1,283,669,567 | ||||
(a) Includes undistributed net investment income of: | $ | — | $ | 4,711,091 | ||||
SEE NOTES TO FINANCIAL STATEMENTS.
A2
| EQUITY PORTFOLIO |
STATEMENT OF ASSETS AND LIABILITIES
December 31, 2005
| ASSETS | ||||
Investments, at value including securities on loan of $573,434,139: | ||||
Unaffiliated investments (cost $3,502,883,700) | $ | 4,205,330,097 | ||
Affiliated investments (cost $672,787,774) | 672,787,774 | |||
Receivable for investments sold | 18,053,981 | |||
Dividends and interest receivable | 5,182,711 | |||
Prepaid expenses | 125,993 | |||
Tax reclaim receivable | 47,267 | |||
Total Assets | 4,901,527,823 | |||
| LIABILITIES | ||||
Collateral for securities on loan | 596,781,337 | |||
Payable for investments purchased | 15,237,166 | |||
Management fee payable | 1,720,689 | |||
Payable for capital stock repurchased | 805,401 | |||
Accrued expenses and other liabilities | 793,169 | |||
Payable to custodian | 245,540 | |||
Deferred directors’ fees | 2,118 | |||
Transfer agent fee payable | 883 | |||
Administration fee payable | 654 | |||
Distribution fee payable | 172 | |||
Total Liabilities | 615,587,129 | |||
| NET ASSETS | $ | 4,285,940,694 | ||
Net assets were comprised of: | ||||
Common stock, at $0.01 par value | $ | 1,739,584 | ||
Paid-in capital in excess of par | 3,949,878,418 | |||
| 3,951,618,002 | ||||
Undistributed net investment income | 2,150,120 | |||
Accumulated net realized loss on investments | (370,273,744 | ) | ||
Net unrealized appreciation on investments and foreign currencies | 702,446,316 | |||
Net assets, December 31, 2005 | $ | 4,285,940,694 | ||
| Class I: | ||||
Net asset value and redemption price per share, $4,283,885,351 / 173,875,150 outstanding shares of common stock (authorized 525,000,000 shares) | $ | 24.64 | ||
| Class II: | ||||
Net asset value and redemption price per share, $2,055,343 / 83,249 outstanding shares of common stock (authorized 50,000,000 shares) | $ | 24.69 | ||
STATEMENT OF OPERATIONS
Year Ended December 31, 2005
| INVESTMENT INCOME | ||||
Unaffiliated dividend income (net of foreign withholding taxes of $708,767) | $ | 58,216,117 | ||
Affiliated dividend income | 2,133,551 | |||
Affiliated income from securities lending, net | 371,263 | |||
Interest | 40,506 | |||
| 60,761,437 | ||||
| EXPENSES | ||||
Management fee | 18,375,266 | |||
Distribution fee—Class II | 3,501 | |||
Administration fee—Class II | 2,101 | |||
Custodian fees and expenses | 457,000 | |||
Shareholders’ reports | 280,000 | |||
Directors’ fees | 73,000 | |||
Insurance expenses | 71,000 | |||
Legal fees and expenses | 50,000 | |||
Audit fee | 25,000 | |||
Commitment fee on syndicated credit agreement | 17,000 | |||
Transfer agent’s fee and expenses (including affiliated expense of $5,200) (Note 4) | 8,000 | |||
Loan interest expense (Note 8) | 1,097 | |||
Miscellaneous | 16,667 | |||
Total expenses | 19,379,632 | |||
Less: custodian fee credit | (17,915 | ) | ||
Net expenses | 19,361,717 | |||
| NET INVESTMENT INCOME | 41,399,720 | |||
| NET REALIZED AND UNREALIZED GAIN (LOSS) ON INVESTMENTS AND FOREIGN CURRENCIES | ||||
Net realized gain (loss) on: | ||||
Investments | 424,140,001 | |||
Futures transactions | (103,744 | ) | ||
Foreign currency transactions | (151,673 | ) | ||
| 423,884,584 | ||||
Net change in unrealized appreciation (depreciation) on: | ||||
Investments | (16,878,993 | ) | ||
Futures | 4,950 | |||
Foreign currencies | (1,050 | ) | ||
| (16,875,093 | ) | |||
| NET GAIN ON INVESTMENTS AND FOREIGN CURRENCIES | 407,009,491 | |||
| NET INCREASE IN NET ASSETS RESULTING FROM OPERATIONS | $ | 448,409,211 | ||
STATEMENT OF CHANGES IN NET ASSETS
| Year Ended December 31, | ||||||||
| 2005 | 2004 | |||||||
| INCREASE (DECREASE) IN NET ASSETS | ||||||||
| OPERATIONS: | ||||||||
Net investment income | $ | 41,399,720 | $ | 51,028,928 | ||||
Net realized gain on investments and foreign currencies | 423,884,584 | 137,366,918 | ||||||
Net change in unrealized appreciation (depreciation) on investments and foreign currencies | (16,875,093 | ) | 188,905,252 | |||||
NET INCREASE (DECREASE) IN NET ASSETS RESULTING FROM OPERATIONS | 448,409,211 | 377,301,098 | ||||||
| DIVIDENDS: | ||||||||
Dividends from net investment income | ||||||||
Class I | (39,989,141 | ) | (50,405,570 | ) | ||||
Class II | (9,415 | ) | (9,198 | ) | ||||
TOTAL DIVIDENDS | (39,998,556 | ) | (50,414,768 | ) | ||||
| CAPITAL STOCK TRANSACTIONS (Note 7): | ||||||||
Capital stock sold [3,037,919 and 4,902,308 shares, respectively] | 69,318,202 | 102,414,548 | ||||||
Capital stock issued in reinvestment of dividends [1,608,907 and 2,300,828 shares, respectively] | 39,998,556 | 50,414,768 | ||||||
Net asset value of shares issued in merger [1,320,590 and 0 shares, respectively] | 28,041,417 | — | ||||||
Capital stock repurchased [17,423,309 and 17,031,464 shares, respectively] | (396,681,659 | ) | (356,013,098 | ) | ||||
NET INCREASE (DECREASE) IN NET ASSETS RESULTING FROM CAPITAL STOCK TRANSACTIONS | (259,323,484 | ) | (203,183,782 | ) | ||||
| TOTAL INCREASE IN NET ASSETS | 149,087,171 | 123,702,548 | ||||||
| NET ASSETS: | ||||||||
Beginning of year | 4,136,853,523 | 4,013,150,975 | ||||||
End of year (a) | $ | 4,285,940,694 | $ | 4,136,853,523 | ||||
(a) Includes undistributed net investment income of | $ | 2,150,120 | $ | 900,629 | ||||
SEE NOTES TO FINANCIAL STATEMENTS.
A3
| FLEXIBLE MANAGED PORTFOLIO |
STATEMENT OF ASSETS AND LIABILITIES
December 31, 2005
| ASSETS | |||
Investments, at value including securities on loan of $319,608,525: | |||
Unaffiliated Investments (cost $3,138,178,593) | $ | 3,361,008,562 | |
Affiliated Investments (cost $672,020,359) | 672,014,481 | ||
Cash | 3,237,540 | ||
Dividends and interest receivable | 11,747,751 | ||
Receivable for investments sold | 8,210,565 | ||
Receivable for capital stock sold | 242,045 | ||
Prepaid expenses | 88,968 | ||
Total Assets | 4,056,549,912 | ||
| LIABILITIES | |||
Collateral for securities on loan | 333,010,724 | ||
Payable for investments purchased | 175,798,120 | ||
Management fee payable | 1,822,766 | ||
Payable for capital stock repurchased | 1,115,938 | ||
Accrued expenses and other liabilities | 792,356 | ||
Due to broker—variation margin | 74,991 | ||
Outstanding options written (premiums received $25,846) | 5,819 | ||
Transfer agent fee payable | 154 | ||
Total Liabilities | 512,620,868 | ||
| NET ASSETS | $ | 3,543,929,044 | |
Net assets were comprised of: | |||
Common stock, at par | $ | 2,093,910 | |
Paid-in capital in excess of par | 3,219,178,955 | ||
| 3,221,272,865 | |||
Undistributed net investment income | 70,753,332 | ||
Accumulated net realized gain on investments | 28,335,103 | ||
Net unrealized appreciation on investments | 223,567,744 | ||
Net assets December 31, 2005 | $ | 3,543,929,044 | |
Net asset value and redemption price per share $3,543,929,044 / 209,390,951 outstanding shares of common stock (authorized 600,000,000 shares) | $ | 16.92 | |
STATEMENT OF OPERATIONS
Year Ended December 31, 2005
| INVESTMENT INCOME | ||||
Unaffiliated dividend income (net of foreign withholding taxes of $4,063) | $ | 42,447,988 | ||
Interest | 40,268,336 | |||
Affiliated dividend income | 8,608,058 | |||
Affiliated income from securities loaned, net | 947,805 | |||
| 92,272,187 | ||||
| EXPENSES | ||||
Management fee | 21,440,131 | |||
Custodian’s fees and expenses | 541,000 | |||
Shareholders’ Reports | 279,000 | |||
Insurance expenses | 111,000 | |||
Directors’ fees | 58,000 | |||
Commitment fee on syndicated credit agreement | 36,000 | |||
Audit fee | 26,000 | |||
Legal fees and expenses | 12,000 | |||
Loan interest expense (Note 8) | 11,000 | |||
Transfer agent’s fee and expenses (including affiliated expense of $1,800) (Note 4) | 2,000 | |||
Miscellaneous | 922 | |||
Total expenses | 22,517,053 | |||
Less: custodian fee credit | (6,794 | ) | ||
Net expenses | 22,510,259 | |||
| NET INVESTMENT INCOME | 69,761,928 | |||
| NET REALIZED AND UNREALIZED GAIN (LOSS) ON INVESTMENTS | ||||
Net realized gain on: | ||||
Investment transactions | 186,606,894 | |||
Written options transactions | 7,210 | |||
Futures transactions | 1,383,923 | |||
| 187,998,027 | ||||
Net change in unrealized appreciation (depreciation) on: | ||||
Investments | (113,485,790 | ) | ||
Written options | 20,027 | |||
Futures | (2,933,593 | ) | ||
| (116,399,356 | ) | |||
| NET GAIN ON INVESTMENTS | 71,598,671 | |||
| NET INCREASE IN NET ASSETS RESULTING FROM OPERATIONS | $ | 141,360,599 | ||
STATEMENT OF CHANGES IN NET ASSETS
| Year Ended December 31, | ||||||||
| 2005 | 2004 | |||||||
| INCREASE (DECREASE) IN NET ASSETS | ||||||||
| OPERATIONS: | ||||||||
Net investment income | $ | 69,761,928 | $ | 67,692,398 | ||||
Net realized gain on investments | 187,998,027 | 277,834,444 | ||||||
Net change in unrealized appreciation (depreciation) on investments | (116,399,356 | ) | 37,872,941 | |||||
NET INCREASE IN NET ASSETS RESULTING FROM OPERATIONS | 141,360,599 | 383,399,783 | ||||||
| DIVIDENDS: | ||||||||
Dividends from net investment income | (68,680,004 | ) | (52,897,054 | ) | ||||
| CAPITAL STOCK TRANSACTIONS: | ||||||||
Capital stock sold [2,131,903 and 2,576,492 shares, respectively] | 35,053,816 | 39,870,970 | ||||||
Capital stock issued in reinvestment of dividends and distributions [4,311,362 and 3,496,170 shares, respectively] | 68,680,004 | 52,897,054 | ||||||
Capital stock repurchased [31,247,534 and 15,095,754 shares, respectively] | (515,965,873 | ) | (233,366,733 | ) | ||||
NET INCREASE (DECREASE) IN NET ASSETS RESULTING FROM CAPITAL STOCK TRANSACTIONS | (412,232,053 | ) | (140,598,709 | ) | ||||
| TOTAL INCREASE (DECREASE) IN NET ASSETS | (339,551,458 | ) | 189,904,020 | |||||
| NET ASSETS: | ||||||||
Beginning of year | 3,883,480,502 | 3,693,576,482 | ||||||
End of year (a) | $ | 3,543,929,044 | $ | 3,883,480,502 | ||||
(a) Includes undistributed net investment income of: | $ | 70,753,332 | $ | 68,680,004 | ||||
SEE NOTES TO FINANCIAL STATEMENTS.
A4
| GLOBAL PORTFOLIO |
STATEMENT OF ASSETS AND LIABILITIES
December 31, 2005
| ASSETS | ||||
Investments, at value | ||||
Unaffiliated investments (cost $733,368,638) | $ | 771,237,035 | ||
Affiliated investments (cost $41,184,673) | 41,184,673 | |||
Cash | 3,683,340 | |||
Foreign currency, at value (cost $13,801,068) | 13,871,437 | |||
Dividends and interest receivable | 778,291 | |||
Receivable for investments sold | 532,664 | |||
Receivable for capital stock sold | 240,176 | |||
Foreign tax reclaim receivable | 100,533 | |||
Prepaid expenses | 38,998 | |||
Due from broker—margin variation | 22,031 | |||
Total Assets | 831,689,178 | |||
| LIABILITIES | ||||
Payable for investments purchased | 16,526,947 | |||
Management fee payable | 517,038 | |||
Accrued expenses and other liabilities | 301,211 | |||
Payable for capital stock repurchased | 203,728 | |||
Transfer agent fee payable | 409 | |||
Total Liabilities | 17,549,333 | |||
| NET ASSETS | $ | 814,139,845 | ||
Net assets were comprised of: | ||||
Common stock, at $.01 par value | $ | 429,437 | ||
Paid-in capital in excess of par | 822,097,574 | |||
| 822,527,011 | ||||
Undistributed net investment income | 4,677,915 | |||
Accumulated net realized loss on investments | (50,846,431 | ) | ||
Net unrealized appreciation on investments futures and foreign currencies | 37,781,350 | |||
Net assets, December 31, 2005 | $ | 814,139,845 | ||
Net asset value and redemption price per share, $814,139,845 / 42,943,692 outstanding shares of common stock (authorized 125,000,000 shares) | $ | 18.96 | ||
STATEMENT OF OPERATIONS
Year Ended December 31, 2005
| INVESTMENT INCOME | ||||
Unaffiliated dividend income (net of foreign withholding taxes of $849,563) | $ | 11,239,721 | ||
Affiliated dividend income | 285,505 | |||
Affiliated income from securities loaned, net | 209,732 | |||
Interest | 6,089 | |||
| 11,741,047 | ||||
| EXPENSES | ||||
Management fee | 5,523,966 | |||
Custodian’s fees and expenses | 352,000 | |||
Shareholders’ reports | 76,000 | |||
Insurance expenses | 20,000 | |||
Directors’ fees | 20,000 | |||
Audit fee | 15,000 | |||
Legal fees and expenses | 8,000 | |||
Commitment fee on syndicated credit agreement | 6,000 | |||
Transfer agent’s fee and expenses (including affiliated expense of $4,800) (Note 4) | 4,800 | |||
Miscellaneous | 20,143 | |||
Total expenses | 6,045,909 | |||
Less: custodian fee credit | (1,383 | ) | ||
Net expenses | 6,044,526 | |||
| NET INVESTMENT INCOME | 5,696,521 | |||
| NET REALIZED AND UNREALIZED GAIN (LOSS) ON INVESTMENTS AND FOREIGN CURRENCIES | ||||
Net realized gain (loss) on: | ||||
Investment transactions | 173,555,188 | |||
Foreign currencies | (1,027,248 | ) | ||
| 172,527,940 | ||||
Net change in unrealized appreciation (depreciation) on: | ||||
Investments | (64,129,593 | ) | ||
Futures | (159,503 | ) | ||
Foreign currencies | (225,604 | ) | ||
| (64,514,700 | ) | |||
| NET GAIN ON INVESTMENTS AND FOREIGN CURRENCIES | 108,013,240 | |||
| NET INCREASE IN NET ASSETS RESULTING FROM OPERATIONS | $ | 113,709,761 | ||
STATEMENT OF CHANGES IN NET ASSETS
| Year Ended December 31, | ||||||||
| 2005 | 2004 | |||||||
| INCREASE (DECREASE) IN NET ASSETS | ||||||||
| OPERATIONS: | ||||||||
Net investment income | $ | 5,696,521 | $ | 4,416,437 | ||||
Net realized gain on investment and foreign currency transactions | 172,527,940 | 49,426,072 | ||||||
Net change in unrealized appreciation (depreciation) on investments and foreign currencies | (64,514,700 | ) | 6,753,293 | |||||
NET INCREASE IN NET ASSETS RESULTING FROM OPERATIONS | 113,709,761 | 60,595,802 | ||||||
| DIVIDENDS: | ||||||||
Dividends from net investment income | (4,467,100 | ) | (6,503,370 | ) | ||||
| CAPITAL STOCK TRANSACTIONS (Note 7): | ||||||||
Capital stock sold [5,440,330 and 4,388,836 shares, respectively] | 90,659,307 | 67,022,905 | ||||||
Capital stock issued in reinvestment of dividends and distributions [279,893 and 428,700 shares, respectively] | 4,467,100 | 6,503,370 | ||||||
Capital stock repurchased [4,829,904 and 6,721,998 shares, respectively] | (81,315,937 | ) | (102,162,355 | ) | ||||
NET INCREASE (DECREASE) IN NET ASSETS RESULTING FROM CAPITAL STOCK TRANSACTIONS | 13,810,470 | (28,636,080 | ) | |||||
| TOTAL INCREASE IN NET ASSETS | 123,053,131 | 25,456,352 | ||||||
| NET ASSETS: | ||||||||
Beginning of year | 691,086,714 | 665,630,362 | ||||||
End of year (a) | $ | 814,139,845 | $ | 691,086,714 | ||||
(a) Includes undistributed net investment income of: | $ | 4,677,915 | $ | 4,450,477 | ||||
SEE NOTES TO FINANCIAL STATEMENTS.
A5
| GOVERNMENT INCOME PORTFOLIO |
STATEMENT OF ASSETS AND LIABILITIES
December 31, 2005
| ASSETS | ||||
Investments, at value including securities on loan of $6,681,354: | ||||
Unaffiliated investments (cost $359,198,917) | $ | 357,307,863 | ||
Affiliated investments (cost $67,117,053) | 67,114,555 | |||
Receivable for investments sold | 16,653,342 | |||
Interest receivable | 2,808,136 | |||
Receivable for capital stock sold | 434,133 | |||
Unrealized appreciation on swaps | 132,959 | |||
Prepaid expenses | 15,328 | |||
Due from broker—variation margin | 6,092 | |||
Total Assets | 444,472,408 | |||
| LIABILITIES | ||||
Payable for investments purchased | 58,869,212 | |||
Collateral for securities on loan | 6,829,733 | |||
Payable for capital stock repurchased | 309,210 | |||
Management fee payable | 128,606 | |||
Accrued expenses and other liabilities | 109,549 | |||
Payable to custodian | 55,045 | |||
Outstanding option written (premium received $22,688) | 5,106 | |||
Deferred directors’ fees | 3,418 | |||
Transfer agent fee payable | 180 | |||
Total Liabilities | 66,310,059 | |||
| NET ASSETS | $ | 378,162,349 | ||
Net assets were comprised of: | ||||
Common stock, at $0.01 par value | $ | 331,576 | ||
Paid-in capital in excess of par | 382,123,227 | |||
| 382,454,803 | ||||
Undistributed net investment income | 1,093,680 | |||
Accumulated net realized loss on investments | (3,876,034 | ) | ||
Net unrealized depreciation on investments | (1,510,100 | ) | ||
Net assets, December 31, 2005 | $ | 378,162,349 | ||
Net asset value and redemption price per share, $378,162,349 / 33,157,614 outstanding shares of common stock (authorized 100,000,000 shares) | $ | 11.40 | ||
STATEMENT OF OPERATIONS
Year Ended December 31, 2005
| INVESTMENT INCOME | ||||
Interest | $ | 15,973,884 | ||
Affiliated dividend income | 2,437,713 | |||
Affiliated income from securities loaned, net | 89,911 | |||
| 18,501,508 | ||||
| EXPENSES | ||||
Management fee | 1,598,279 | |||
Custodian’s fees and expenses | 150,000 | |||
Shareholders’ reports | 63,000 | |||
Audit fee | 20,000 | |||
Directors’ fees | 16,000 | |||
Insurance expenses | 13,000 | |||
Legal fees and expenses | 10,000 | |||
Commitment fee on syndicated credit agreement | 3,000 | |||
Transfer agent’s fee and expenses (including affiliated expense of $1,200) (Note 4) | 1,200 | |||
Miscellaneous | 7,098 | |||
Total expenses | 1,881,577 | |||
Less: custodian fee credit | (4,436 | ) | ||
Net expenses | 1,877,141 | |||
| NET INVESTMENT INCOME | 16,624,367 | |||
| NET REALIZED AND UNREALIZED GAIN (LOSS) ON INVESTMENTS | ||||
Net realized gain (loss) on: | ||||
Investments | (962,945 | ) | ||
Futures transactions | 1,356,776 | |||
Interest rate swaps | (174,961 | ) | ||
Options written | 6,377 | |||
| 225,247 | ||||
Net change in unrealized appreciation (depreciation) on: | ||||
Investments | (6,904,689 | ) | ||
Futures | 96,201 | |||
Swaps | 132,959 | |||
Options written | 17,582 | |||
| (6,657,947 | ) | |||
| NET LOSS ON INVESTMENTS | (6,432,700 | ) | ||
| NET INCREASE IN NET ASSETS RESULTING FROM OPERATIONS | $ | 10,191,667 | ||
STATEMENT OF CHANGES IN NET ASSETS
| Year Ended December 31, | ||||||||
| 2005 | 2004 | |||||||
| INCREASE (DECREASE) IN NET ASSETS | ||||||||
| OPERATIONS: | ||||||||
Net investment income | $ | 16,624,367 | $ | 17,626,356 | ||||
Net realized gain (loss) on investments | 225,247 | (1,822,628 | ) | |||||
Net change in unrealized appreciation (depreciation) on investments | (6,657,947 | ) | (2,660,780 | ) | ||||
NET INCREASE IN NET ASSETS RESULTING FROM OPERATIONS | 10,191,667 | 13,142,948 | ||||||
| DIVIDENDS AND DISTRIBUTIONS: | ||||||||
Dividends from net investment income | (18,278,784 | ) | (17,811,600 | ) | ||||
Distributions from net realized capital gains | — | (5,359,384 | ) | |||||
TOTAL DIVIDENDS AND DISTRIBUTIONS | (18,278,784 | ) | (23,170,984 | ) | ||||
| CAPITAL STOCK TRANSACTIONS: | ||||||||
Capital stock sold [1,193,333 and 1,721,076 shares, respectively] | 13,825,736 | 20,315,715 | ||||||
Capital stock issued in reinvestment of dividends and distributions [1,593,500 and 1,976,013 shares, respectively] | 18,278,784 | 23,170,984 | ||||||
Capital stock repurchased [5,694,737 and 6,350,224 shares, respectively] | (66,011,678 | ) | (74,818,441 | ) | ||||
NET INCREASE (DECREASE) IN NET ASSETS RESULTING FROM CAPITAL STOCK TRANSACTIONS | (33,907,158 | ) | (31,331,742 | ) | ||||
| TOTAL DECREASE IN NET ASSETS | (41,994,275 | ) | (41,359,778 | ) | ||||
| NET ASSETS: | ||||||||
Beginning of year | 420,156,624 | 461,516,402 | ||||||
End of year (a) | $ | 378,162,349 | $ | 420,156,624 | ||||
(a) Includes undistributed net investment income of: | $ | 1,093,680 | $ | 2,209,085 | ||||
SEE NOTES TO FINANCIAL STATEMENTS.
A6
| HIGH YIELD BOND PORTFOLIO |
STATEMENT OF ASSETS AND LIABILITIES
December 31, 2005
| ASSETS | ||||
Investments, at value including securities on loan of $349,931,181: | ||||
Unaffiliated investments (cost $1,529,185,458) | $ | 1,534,299,272 | ||
Affiliated investments (cost $430,192,060) | 430,189,720 | |||
Foreign currency, at value (cost $1,053,860) | 1,031,162 | |||
Dividends and interest receivable | 31,281,130 | |||
Prepaid expenses | 46,611 | |||
Receivable for capital stock sold | 26,122 | |||
Total Assets | 1,996,874,017 | |||
| LIABILITIES | ||||
Collateral for securities on loan | 359,435,840 | |||
Management fee payable | 761,434 | |||
Payable for capital stock repurchased | 324,437 | |||
Accrued expenses and other liabilities | 295,141 | |||
Unrealized depreciation on swaps | 215,970 | |||
Payable to custodian | 88,505 | |||
Deferred directors’ fees | 3,332 | |||
Transfer agent fee payable | 218 | |||
Total Liabilities | 361,124,877 | |||
| NET ASSETS | $ | 1,635,749,140 | ||
Net assets were comprised of: | ||||
Common stock, at $0.01 par value | $ | 3,126,584 | ||
Paid-in capital in excess of par | 1,885,728,885 | |||
| 1,888,855,469 | ||||
Undistributed net investment income | 4,914,325 | |||
Accumulated net realized loss on investments | (262,893,460 | ) | ||
Net unrealized appreciation on investments, swaps and foreign currency | 4,872,806 | |||
Net assets, December 31, 2005 | $ | 1,635,749,140 | ||
Net asset value and redemption price per share, $1,635,749,140 / 312,658,447 outstanding shares of common stock (authorized 600,000,000 shares) | $ | 5.23 | ||
STATEMENT OF OPERATIONS
Year Ended December 31, 2005
| INVESTMENT INCOME | ||||
Interest | $ | 118,481,666 | ||
Affiliated dividend income | 2,544,975 | |||
Unaffiliated dividend income (net of foreign withholding taxes of $2,516) | 2,021,692 | |||
Affiliated income from securities loaned, net | 790,809 | |||
Total income | 123,839,142 | |||
| EXPENSES | ||||
Management fee | 8,815,582 | |||
Custodian’s fees and expenses | 271,000 | |||
Shareholders’ reports | 140,000 | |||
Insurance expenses | 42,000 | |||
Directors’ fees | 33,000 | |||
Audit fee | 21,000 | |||
Legal fees and expenses | 11,000 | |||
Commitment fee on syndicated credit agreement | 10,000 | |||
Transfer agent’s fee and expenses (including affiliated expense of $2,500) (Note 4) | 2,600 | |||
Miscellaneous | 10,350 | |||
Total expenses | 9,356,532 | |||
Less: custodian fee credit | (22,548 | ) | ||
Net expenses | 9,333,984 | |||
| NET INVESTMENT INCOME | 114,505,158 | |||
| NET REALIZED AND UNREALIZED GAIN (LOSS) ON INVESTMENTS, SWAPS AND FOREIGN CURRENCIES | ||||
Net realized gain (loss) on: | ||||
Investment transactions | (631,044 | ) | ||
Swaps | 26,542 | |||
Foreign currencies transactions | (107,346 | ) | ||
| (711,848 | ) | |||
Net change in unrealized appreciation (depreciation) on: | ||||
Investments | (58,787,822 | ) | ||
Swaps | (215,970 | ) | ||
Foreign currencies | (26,863 | ) | ||
| (59,030,655 | ) | |||
| NET LOSS ON INVESTMENTS, SWAPS AND FOREIGN CURRENCIES | (59,742,503 | ) | ||
| NET INCREASE IN NET ASSETS RESULTING FROM OPERATIONS | $ | 54,762,655 | ||
STATEMENT OF CHANGES IN NET ASSETS
| Year Ended December 31, | ||||||||
| 2005 | 2004 | |||||||
| INCREASE (DECREASE) IN NET ASSETS | ||||||||
| OPERATIONS: | ||||||||
Net investment income | $ | 114,505,158 | $ | 109,068,962 | ||||
Net realized gain (loss) on investments, swaps and foreign currencies | (711,848 | ) | 33,076,326 | |||||
Net change in unrealized appreciation (depreciation) on investments | (59,030,655 | ) | 2,657,216 | |||||
NET INCREASE IN NET ASSETS RESULTING FROM OPERATIONS | 54,762,655 | 144,802,504 | ||||||
| DIVIDENDS: | ||||||||
Dividends from net investment income | (110,212,418 | ) | (108,509,679 | ) | ||||
| CAPITAL STOCK TRANSACTIONS: | ||||||||
Capital stock sold [20,763,375 and 22,843,297 shares, respectively] | 110,658,866 | 123,128,055 | ||||||
Capital stock issued in reinvestment of dividends [20,967,075 and 20,556,258 shares, respectively] | 110,212,418 | 108,509,679 | ||||||
Capital stock repurchased [23,489,952 and 26,189,434 shares, respectively] | (125,355,809 | ) | (138,934,319 | ) | ||||
NET INCREASE (DECREASE) IN NET ASSETS RESULTING FROM CAPITAL STOCK TRANSACTIONS | 95,515,475 | 92,703,415 | ||||||
| TOTAL INCREASE IN NET ASSETS | 40,065,712 | 128,996,240 | ||||||
| NET ASSETS: | ||||||||
Beginning of year | 1,595,683,428 | 1,466,687,188 | ||||||
End of year (a) | $ | 1,635,749,140 | $ | 1,595,683,428 | ||||
(a) Includes undistributed net investment income of: | $ | 4,914,325 | $ | 171,280 | ||||
SEE NOTES TO FINANCIAL STATEMENTS.
A7
| JENNISON PORTFOLIO |
STATEMENT OF ASSETS AND LIABILITIES
December 31, 2005
| ASSETS | ||||
Investments, at value including securities on loan of $259,673,375: | ||||
Unaffiliated investments (cost $1,743,932,361) | $ | 2,295,674,665 | ||
Affiliated investments (cost $288,723,330) | 288,723,330 | |||
Cash | 78,607 | |||
Receivable for investments sold | 12,266,999 | |||
Dividends and interest receivable | 1,291,304 | |||
Receivable for capital stock sold | 490,564 | |||
Prepaid expenses | 42,791 | |||
Total Assets | 2,598,568,260 | |||
| LIABILITIES | ||||
Collateral for securities on loan | 272,359,041 | |||
Payable for investments purchased | 9,086,486 | |||
Management fee payable | 1,199,789 | |||
Accrued expenses | 351,371 | |||
Payable for capital stock repurchased | 322,241 | |||
Administration fee payable | 4,371 | |||
Distribution fee payable | 3,874 | |||
Transfer agent fee payable | 515 | |||
Total Liabilities | 283,327,688 | |||
| NET ASSETS | $ | 2,315,240,572 | ||
Net assets were comprised of: | ||||
Common stock, at $0.01 par value | $ | 1,115,446 | ||
Paid-in capital in excess of par | 2,783,528,737 | |||
| 2,784,644,183 | ||||
Distribution in excess of net investment income | (49,411 | ) | ||
Accumulated net realized loss on investments | (1,021,096,504 | ) | ||
Net unrealized appreciation on investments and foreign currencies | 551,742,304 | |||
Net assets, December 31, 2005 | $ | 2,315,240,572 | ||
| Class I: | ||||
Net asset value and redemption price per share, $2,296,970,767 / 110,652,861 outstanding shares of common stock (authorized 275,000,000 shares) | $ | 20.76 | ||
| Class II: | ||||
Net asset value and redemption price per share, $18,269,805 / 891,772 outstanding shares of common stock (authorized 75,000,000 shares) | $ | 20.49 | ||
STATEMENT OF OPERATIONS
Year Ended December 31, 2005
| INVESTMENT INCOME | ||||
Unaffiliated dividend income (net of foreign withholding taxes of $371,777) | $ | 14,393,429 | ||
Affiliated dividend income | 988,340 | |||
Affiliated income from securities loaned, net | 390,650 | |||
Interest | 258 | |||
| 15,772,677 | ||||
| EXPENSES | ||||
Management fee | 12,926,183 | |||
Distribution fee—Class II | 159,621 | |||
Administration fee—Class II | 95,773 | |||
Shareholders’ reports | 277,000 | |||
Custodian’s fees and expenses | 228,000 | |||
Insurance expenses | 60,000 | |||
Directors’ fees | 40,000 | |||
Audit fee | 16,000 | |||
Legal fees and expenses | 10,000 | |||
Commitment fee on syndicated credit agreement | 9,000 | |||
Transfer agent’s fee and expenses (including affiliated expense of $6,100) (Note 4) | 6,400 | |||
Miscellaneous | 8,004 | |||
Total expenses | 13,835,981 | |||
Less: custodian fee credit | (486 | ) | ||
Net expenses | 13,835,495 | |||
| NET INVESTMENT INCOME | 1,937,182 | |||
| NET REALIZED AND UNREALIZED GAIN (LOSS) ON INVESTMENTS AND FOREIGN CURRENCIES | ||||
Net realized gain (loss) on: | ||||
Investments | 134,425,982 | |||
Foreign currency transactions | (221,613 | ) | ||
| 134,204,369 | ||||
Net change in unrealized appreciation (depreciation) on: | ||||
Investments | 164,162,390 | |||
Foreign currencies | (3,661 | ) | ||
| 164,158,729 | ||||
| NET GAIN ON INVESTMENTS AND FOREIGN CURRENCIES | 298,363,098 | |||
| NET INCREASE IN NET ASSETS RESULTING FROM OPERATIONS | $ | 300,300,280 | ||
STATEMENT OF CHANGES IN NET ASSETS
| Year Ended December 31, | ||||||||
| 2005 | 2004 | |||||||
| INCREASE (DECREASE) IN NET ASSETS | ||||||||
| OPERATIONS: | ||||||||
Net investment income | $ | 1,937,182 | $ | 9,485,604 | ||||
Net realized gain on investments and foreign currencies | 134,204,369 | 43,329,941 | ||||||
Net change in unrealized appreciation (depreciation) on investments and foreign currencies | 164,158,729 | 133,571,843 | ||||||
NET INCREASE IN NET ASSETS RESULTING FROM OPERATIONS | 300,300,280 | 186,387,388 | ||||||
| DIVIDENDS: | ||||||||
Dividends from net investment income | ||||||||
Class I | (2,181,501 | ) | (8,976,218 | ) | ||||
Class II | — | (34,040 | ) | |||||
TOTAL DIVIDENDS | (2,181,501 | ) | (9,010,258 | ) | ||||
| CAPITAL STOCK TRANSACTIONS (Note 7): | ||||||||
Capital stock sold [14,492,389 and 20,281,543 shares, respectively] | 269,056,619 | 339,856,220 | ||||||
Capital stock issued in reinvestment of dividends [107,900 and 504,275 shares, respectively] | 2,181,501 | 9,010,258 | ||||||
Capital stock repurchased [20,487,671 and 14,520,484 shares, respectively] | (383,146,862 | ) | (243,917,708 | ) | ||||
NET INCREASE (DECREASE) IN NET ASSETS RESULTING FROM CAPITAL STOCK TRANSACTIONS | (111,908,742 | ) | 104,948,770 | |||||
| TOTAL INCREASE IN NET ASSETS | 186,210,037 | 282,325,900 | ||||||
| NET ASSETS: | ||||||||
Beginning of year | 2,129,030,535 | 1,846,704,635 | ||||||
End of year (a) | $ | 2,315,240,572 | $ | 2,129,030,535 | ||||
(a) Includes undistributed net investment income of: | $ | — | $ | 348,010 | ||||
SEE NOTES TO FINANCIAL STATEMENTS.
A8
| MONEY MARKET PORTFOLIO |
STATEMENT OF ASSETS AND LIABILITIES
December 31, 2005
| ASSETS | |||
Investments, at value (amortized cost $847,900,470) | $ | 847,900,470 | |
Cash | 400,000 | ||
Interest receivable | 2,952,389 | ||
Receivable for capital stock sold | 1,323,968 | ||
Prepaid expenses | 27,973 | ||
Total Assets | 852,604,800 | ||
| LIABILITIES | |||
Management fee payable | 293,817 | ||
Accrued expenses | 276,853 | ||
Dividend payable | 91,176 | ||
Transfer agent fee payable | 467 | ||
Total Liabilities | 662,313 | ||
| NET ASSETS | $ | 851,942,487 | |
Net assets were comprised of: | |||
Common stock, at $0.01 par value | $ | 851,942 | |
Paid-in capital in excess of par | 851,090,545 | ||
Net assets, December 31, 2005 | $ | 851,942,487 | |
Net asset value and redemption price per share, $851,942,487 / 85,194,248 outstanding shares of common stock (authorized 275,000,000 shares) | $ | 10.00 | |
STATEMENT OF OPERATIONS
Year Ended December 31, 2005
| INVESTMENT INCOME | ||||
Interest | $ | 29,880,875 | ||
| EXPENSES | ||||
Management fee | 3,613,954 | |||
Shareholders’ reports | 245,000 | |||
Custodian’s fees and expenses | 119,000 | |||
Directors’ fees | 20,000 | |||
Insurance expenses | 18,000 | |||
Audit fee | 13,000 | |||
Legal fees and expenses | 10,000 | |||
Transfer agent’s fee and expenses (including affiliated expense of $5,500) (Note 4) | 5,500 | |||
Miscellaneous | 4,709 | |||
Total expenses | 4,049,163 | |||
Less: custodian fee credit | (427 | ) | ||
Net expenses | 4,048,736 | |||
| NET INVESTMENT INCOME | 25,832,139 | |||
| NET REALIZED GAIN ON INVESTMENTS | 781 | |||
| NET INCREASE IN NET ASSETS RESULTING FROM OPERATIONS | $ | 25,832,920 | ||
STATEMENT OF CHANGES IN NET ASSETS
| Year Ended December 31, | ||||||||
| 2005 | 2004 | |||||||
| INCREASE (DECREASE) IN NET ASSETS | ||||||||
| OPERATIONS: | ||||||||
Net investment income | $ | 25,832,139 | $ | 9,340,610 | ||||
Net realized gain on investments | 781 | 24,915 | ||||||
NET INCREASE IN NET ASSETS RESULTING FROM OPERATIONS | 25,832,920 | 9,365,525 | ||||||
| DIVIDENDS AND DISTRIBUTIONS: | ||||||||
Dividends from net investment income | (25,832,139 | ) | (9,340,610 | ) | ||||
Distributions from net realized capital gains | (781 | ) | (24,915 | ) | ||||
TOTAL DIVIDENDS AND DISTRIBUTIONS | (25,832,920 | ) | (9,365,525 | ) | ||||
| CAPITAL STOCK TRANSACTIONS: | ||||||||
Capital stock sold [53,191,964 and 50,222,414 shares, respectively] | 531,919,640 | 502,224,143 | ||||||
Capital stock issued in reinvestment of dividends and distributions [2,574,174 and 936,553 shares, respectively] | 25,741,744 | 9,365,526 | ||||||
Capital stock repurchased [59,107,465 and 55,988,466 shares, respectively] | (591,074,644 | ) | (559,884,661 | ) | ||||
NET INCREASE (DECREASE) IN NET ASSETS RESULTING FROM CAPITAL STOCK TRANSACTIONS | (33,413,260 | ) | (48,294,992 | ) | ||||
| TOTAL DECREASE IN NET ASSETS | (33,413,260 | ) | (48,294,992 | ) | ||||
| NET ASSETS: | ||||||||
Beginning of year | 885,355,747 | 933,650,739 | ||||||
End of year | $ | 851,942,487 | $ | 885,355,747 | ||||
SEE NOTES TO FINANCIAL STATEMENTS.
A9
| NATURAL RESOURCES PORTFOLIO |
STATEMENT OF ASSETS AND LIABILITIES
December 31, 2005
| ASSETS | |||
Investments, at value including securities on loan of $159,596,535: | |||
Unaffiliated investments (cost $597,284,733) | $ | 1,008,292,602 | |
Affiliated investments (cost $184,121,312) | 184,121,312 | ||
Foreign currency, at value (cost $6,134,267) | 6,130,390 | ||
Cash | 169,259 | ||
Dividends and interest receivable | 795,002 | ||
Receivable for investments sold | 708,976 | ||
Receivable for capital stock sold | 121,517 | ||
Prepaid expenses | 27,244 | ||
Unrealized appreciation on forward foreign currency contracts | 2,762 | ||
Total Assets | 1,200,369,064 | ||
| LIABILITIES | |||
Collateral for securities on loan | 170,186,750 | ||
Payable for investments purchased | 8,161,364 | ||
Management fee payable | 388,668 | ||
Payable for capital stock repurchased | 137,787 | ||
Accrued expenses and other liabilities | 125,731 | ||
Administration fee payable | 588 | ||
Transfer agent fee payable | 122 | ||
Distribution fee payable | 980 | ||
Total Liabilities | 179,001,990 | ||
| NET ASSETS | $ | 1,021,367,074 | |
Net assets were comprised of: | |||
Common stock, at $0.01 par value | $ | 224,702 | |
Paid-in capital in excess of par | 434,520,139 | ||
| 434,744,841 | |||
Undistributed net investment income | 960,296 | ||
Accumulated net realized gain on investments | 174,656,799 | ||
Net unrealized appreciation on investments and foreign currencies | 411,005,138 | ||
Net assets, December 31, 2005 | $ | 1,021,367,074 | |
| Class I: | |||
Net asset value and redemption price per share, $1,016,313,047 / 22,358,661 outstanding shares of common stock (authorized 100,000,000 shares) | $ | 45.46 | |
| Class II: | |||
Net asset value and redemption price per share, $5,054,027 / 111,512 outstanding shares of common stock (authorized 10,000,000 shares) | $ | 45.32 | |
STATEMENT OF OPERATIONS
Year Ended December 31, 2005
| INVESTMENT INCOME | ||||
Unaffiliated dividend income (net of foreign withholding taxes of $260,581) | $ | 7,855,848 | ||
Affiliated dividend income | 450,247 | |||
Affiliated income from securities loaned, net | 797,560 | |||
| 9,103,655 | ||||
| EXPENSES | ||||
Management fee | 3,576,998 | |||
Distribution fee—Class II | 4,072 | |||
Administration fee—Class II | 2,443 | |||
Custodian’s fees and expenses | 197,000 | |||
Shareholders’ reports | 46,000 | |||
Directors’ fees | 24,000 | |||
Insurance expenses | 16,000 | |||
Audit fee | 15,000 | |||
Legal fees and expenses | 9,000 | |||
Commitment fee on syndicated credit agreement | 4,000 | |||
Transfer agent’s fee and expenses (including affiliated expense of $1,300) (Note 4) | 1,300 | |||
Miscellaneous | 12,628 | |||
Total expenses | 3,908,441 | |||
Less: custodian fee credit | (2,922 | ) | ||
Net expenses | 3,905,519 | |||
| NET INVESTMENT INCOME | 5,198,136 | |||
| NET REALIZED AND UNREALIZED GAIN (LOSS) ON INVESTMENTS AND FOREIGN CURRENCIES | ||||
Net realized gain (loss) on: | ||||
Investments | 185,452,783 | |||
Foreign currency transactions | (124,678 | ) | ||
| 185,328,105 | ||||
Net change in unrealized appreciation (depreciation) on: | ||||
Investments | 168,016,182 | |||
Foreign currencies | (2,801 | ) | ||
| 168,013,381 | ||||
| NET GAIN ON INVESTMENTS AND FOREIGN CURRENCIES | 353,341,486 | |||
| NET INCREASE IN NET ASSETS RESULTING FROM OPERATIONS | $ | 358,539,622 | ||
STATEMENT OF CHANGES IN NET ASSETS
| Year Ended December 31, | ||||||||
| 2005 | 2004 | |||||||
INCREASE (DECREASE) IN NET ASSETS OPERATIONS: | ||||||||
Net investment income | $ | 5,198,136 | $ | 2,659,732 | ||||
Net realized gain on investments and foreign currencies | 185,328,105 | 61,183,272 | ||||||
Net change in unrealized appreciation (depreciation) on investments and foreign currencies | 168,013,381 | 61,162,809 | ||||||
NET INCREASE IN NET ASSETS RESULTING FROM OPERATIONS | 358,539,622 | 125,005,813 | ||||||
| DIVIDENDS AND DISTRIBUTIONS: | ||||||||
Dividends from net investment income | ||||||||
Class I | (27,981 | ) | (18,430,595 | ) | ||||
Distributions from net realized capital gains | ||||||||
Class I | (60,008,879 | ) | (19,967,025 | ) | ||||
TOTAL DIVIDENDS AND DISTRIBUTIONS | (60,036,860 | ) | (38,397,620 | ) | ||||
| CAPITAL STOCK TRANSACTIONS (Note 7): | ||||||||
Capital stock sold [2,586,211 and 1,401,282 shares, respectively] | 96,654,278 | 39,851,530 | ||||||
Capital stock issued in reinvestment of dividends and distributions [1,857,002 and 1,462,209 shares, respectively] | 60,036,860 | 38,397,620 | ||||||
Capital stock repurchased [1,503,940 and 1,476,976 shares, respectively] | (56,381,759 | ) | (41,027,681 | ) | ||||
NET INCREASE (DECREASE) IN NET ASSETS RESULTING FROM CAPITAL STOCK TRANSACTIONS | 100,309,379 | 37,221,469 | ||||||
| TOTAL INCREASE IN NET ASSETS | 398,812,141 | 123,829,662 | ||||||
| NET ASSETS: | ||||||||
Beginning of year | 622,554,933 | 498,725,271 | ||||||
End of year (a) | $ | 1,021,367,074 | $ | 622,554,933 | ||||
(a) Includes undistributed net investment income of: | $ | 960,296 | $ | — | ||||
SEE NOTES TO FINANCIAL STATEMENTS.
A10
| SMALL CAPITALIZATION STOCK PORTFOLIO |
STATEMENT OF ASSETS AND LIABILITIES
December 31, 2005
| ASSETS | |||
Investments, at value including securities on loan of $96,200,779: | |||
Unaffiliated investments (cost $518,056,822) | $ | 730,944,078 | |
Affiliated investments (cost $109,179,634) | 109,179,634 | ||
Cash | 1,628,885 | ||
Dividends and interest receivable | 783,508 | ||
Receivable for capital stock sold | 48,896 | ||
Prepaid expenses | 23,505 | ||
Total Assets | 842,608,506 | ||
| LIABILITIES | |||
Collateral for securities on loan | 101,040,779 | ||
Payable for investments purchased | 2,529,372 | ||
Management fee payable | 255,686 | ||
Accrued expenses and other liabilities | 235,277 | ||
Payable for capital stock repurchased | 187,440 | ||
Due to broker—variation margin | 27,500 | ||
Transfer agent fee payable | 143 | ||
Total Liabilities | 104,276,197 | ||
| NET ASSETS | $ | 738,332,309 | |
Net assets were comprised of: | |||
Common stock, at $0.01 par value | $ | 345,342 | |
Paid-in capital in excess of par | 493,907,544 | ||
| 494,252,886 | |||
Undistributed net investment income | 296,825 | ||
Accumulated net realized gain on investments | 30,947,742 | ||
Net unrealized appreciation on investments | 212,834,856 | ||
Net assets, December 31, 2005 | $ | 738,332,309 | |
Net asset value and redemption price per share, $738,332,309 / 34,534,219 outstanding shares of common stock (authorized 100,000,000 shares) | $ | 21.38 | |
STATEMENT OF OPERATIONS
Year Ended December 31, 2005
| INVESTMENT INCOME | ||||
Unaffiliated dividend income (net of foreign withholding taxes of $2,994) | $ | 7,314,958 | ||
Affiliated income from securities loaned, net | 430,741 | |||
Affiliated dividend income | 31,880 | |||
Interest | 9,650 | |||
| 7,787,229 | ||||
| EXPENSES | ||||
Management fee | 2,897,737 | |||
Custodian’s fees and expenses | 197,000 | |||
Shareholders’ reports | 91,000 | |||
Directors’ fees | 25,000 | |||
Insurance expenses | 20,000 | |||
Audit fee | 16,000 | |||
Legal fees and expenses | 9,000 | |||
Commitment fee on syndicated credit agreement | 9,000 | |||
Transfer agent’s fee and expenses (including affiliated expense of $1,700) (Note 4) | 1,700 | |||
Miscellaneous | 60,043 | |||
Total expenses | 3,326,480 | |||
Less: custodian fee credit | (3,701 | ) | ||
Net expenses | 3,322,779 | |||
| NET INVESTMENT INCOME | 4,464,450 | |||
| NET REALIZED AND UNREALIZED GAIN (LOSS) ON | ||||
| INVESTMENTS | ||||
Net realized gain on: | ||||
Investments | 34,029,908 | |||
Futures transactions | 159,111 | |||
| 34,189,019 | ||||
Net change in unrealized appreciation (depreciation) on: | ||||
Investments | 11,724,730 | |||
Futures | (59,175 | ) | ||
| 11,665,555 | ||||
| NET GAIN ON INVESTMENTS | 45,854,574 | |||
| NET INCREASE IN NET ASSETS RESULTING FROM OPERATIONS | $ | 50,319,024 | ||
STATEMENT OF CHANGES IN NET ASSETS
| Year Ended December 31, | ||||||||
| 2005 | 2004 | |||||||
| INCREASE (DECREASE) IN NET ASSETS | ||||||||
| OPERATIONS: | ||||||||
Net investment income | $ | 4,464,450 | $ | 4,078,755 | ||||
Net realized gain on investments | 34,189,019 | 43,265,956 | ||||||
Net change in unrealized appreciation (depreciation) on investments | 11,665,555 | 87,541,030 | ||||||
NET INCREASE IN NET ASSETS RESULTING FROM OPERATIONS | 50,319,024 | 134,885,741 | ||||||
| DIVIDENDS AND DISTRIBUTIONS: | ||||||||
Dividends from net investment income | (4,346,380 | ) | (3,949,770 | ) | ||||
Distributions from net realized capital gains | (42,621,094 | ) | (2,458,828 | ) | ||||
TOTAL DIVIDENDS AND DISTRIBUTIONS | (46,967,474 | ) | (6,408,598 | ) | ||||
| CAPITAL STOCK TRANSACTIONS: | ||||||||
Capital stock sold [1,735,176 and 2,655,531 shares, respectively] | 35,830,020 | 49,733,501 | ||||||
Capital stock issued in reinvestment of dividends and distributions [2,375,052 and 324,158 shares, respectively] | 46,967,474 | 6,408,598 | ||||||
Capital stock repurchased [4,422,312 and 3,284,891 shares, respectively] | (91,046,543 | ) | (61,288,177 | ) | ||||
NET DECREASE IN NET ASSETS RESULTING FROM CAPITAL STOCK TRANSACTIONS | (8,249,049 | ) | (5,146,078 | ) | ||||
| TOTAL INCREASE (DECREASE) IN NET ASSETS | (4,897,499 | ) | 123,331,065 | |||||
| NET ASSETS: | ||||||||
Beginning of year | 743,229,808 | 619,898,743 | ||||||
End of year (a) | $ | 738,332,309 | $ | 743,229,808 | ||||
(a) Includes undistributed net investment income of: | $ | 296,825 | $ | 178,755 | ||||
SEE NOTES TO FINANCIAL STATEMENTS.
A11
| STOCK INDEX PORTFOLIO |
STATEMENT OF ASSETS AND LIABILITIES
December 31, 2005
| ASSETS | ||||
Investments, at value including securities on loan of $301,146,620: | ||||
Unaffiliated investments (cost $2,228,987,120) | $ | 3,153,585,869 | ||
Affiliated investments (cost $371,767,830) | 371,767,830 | |||
Cash | 1,324,185 | |||
Dividends receivable | 4,285,863 | |||
Receivable for investments sold | 1,605,721 | |||
Prepaid expenses | 79,806 | |||
Receivable for capital stock sold | 56,906 | |||
Total Assets | 3,532,706,180 | |||
| LIABILITIES | ||||
Collateral for securities on loan | 315,379,940 | |||
Payable for investments purchased | 1,492,469 | |||
Payable for capital stock repurchased | 1,222,599 | |||
Management fee payable | 966,414 | |||
Accrued expenses | 625,352 | |||
Due to broker—variation margin | 274,275 | |||
Transfer agent fee payable | 1,059 | |||
Total Liabilities | 319,962,108 | |||
| NET ASSETS | $ | 3,212,744,072 | ||
Net assets were comprised of: | ||||
Common stock, at $0.01 par value | $ | 1,022,939 | ||
Paid-in capital in excess of par | 2,298,124,425 | |||
| 2,299,147,364 | ||||
Undistributed net investment income | 1,844,408 | |||
Accumulated net realized loss on investments | (11,892,036 | ) | ||
Net unrealized appreciation on investments | 923,644,336 | |||
Net assets, December 31, 2005 | $ | 3,212,744,072 | ||
Net asset value and redemption price per share, $3,212,744,072 / 102,293,894 outstanding shares of common stock (authorized 275,000,000 shares) | $ | 31.41 | ||
STATEMENT OF OPERATIONS
Year Ended December 31, 2005
| INVESTMENT INCOME | ||||
Unaffiliated dividend income | $ | 56,333,733 | ||
Affiliated dividend income | 3,134,059 | |||
Affiliated income from securities loaned, net | 589,588 | |||
Interest | 172,369 | |||
| 60,229,749 | ||||
| EXPENSES | ||||
Management fee | 11,110,301 | |||
Custodian’s fees and expenses | 375,000 | |||
Shareholders’ reports | 350,000 | |||
Insurance expenses | 89,000 | |||
Directors’ fees | 53,000 | |||
Commitment fee on syndicated credit agreement | 24,000 | |||
Legal fees and expenses | 15,000 | |||
Audit fee | 15,000 | |||
Transfer agent’s fee and expenses (including affiliated expense of $5,300) (Note 4) | 5,500 | |||
Miscellaneous | 10,567 | |||
Total expenses | 12,047,368 | |||
Less: custodian fee credit | (528 | ) | ||
Net expenses | 12,046,840 | |||
| NET INVESTMENT INCOME | 48,182,909 | |||
| NET REALIZED AND UNREALIZED GAIN (LOSS) ON INVESTMENTS | ||||
Net realized gain (loss) on: | ||||
Investments | (12,429,838 | ) | ||
Futures transactions | 2,343,274 | |||
| (10,086,564 | ) | |||
Net change in unrealized appreciation (depreciation) on: | ||||
Investments | 105,373,659 | |||
Futures | (1,525,701 | ) | ||
| 103,847,958 | ||||
| NET GAIN ON INVESTMENTS | 93,761,394 | |||
| NET INCREASE IN NET ASSETS RESULTING FROM OPERATIONS | $ | 141,944,303 | ||
STATEMENT OF CHANGES IN NET ASSETS
| Year Ended December 31, | ||||||||
| 2005 | 2004 | |||||||
| INCREASE (DECREASE) IN NET ASSETS | ||||||||
| OPERATIONS: | ||||||||
Net investment income | $ | 48,182,909 | $ | 48,432,007 | ||||
Net realized gain (loss) on investments | (10,086,564 | ) | 82,299,696 | |||||
Net change in unrealized appreciation (depreciation) on investments | 103,847,958 | 165,798,382 | ||||||
NET INCREASE IN NET ASSETS RESULTING FROM OPERATIONS | 141,944,303 | 296,530,085 | ||||||
| DIVIDENDS AND DISTRIBUTIONS: | ||||||||
Dividends from net investment income | (47,928,302 | ) | (47,984,184 | ) | ||||
Distributions from net realized capital gains | (80,427,226 | ) | (50,558,478 | ) | ||||
TOTAL DIVIDENDS AND DISTRIBUTIONS | (128,355,528 | ) | (98,542,662 | ) | ||||
| CAPITAL STOCK TRANSACTIONS: | ||||||||
Capital stock sold [10,979,065 and 9,453,913 shares, respectively] | 339,642,147 | 278,172,758 | ||||||
Capital stock issued in reinvestment of dividends and distributions [4,228,580 and 3,317,515 shares, respectively] | 128,355,528 | 98,542,662 | ||||||
Capital stock repurchased [11,826,004 and 14,255,340 shares, respectively] | (363,515,389 | ) | (420,932,471 | ) | ||||
NET INCREASE (DECREASE) IN NET ASSETS RESULTING FROM CAPITAL STOCK TRANSACTIONS | 104,482,286 | (44,217,051 | ) | |||||
| TOTAL INCREASE IN NET ASSETS | 118,071,061 | 153,770,372 | ||||||
| NET ASSETS: | ||||||||
Beginning of year | 3,094,673,011 | 2,940,902,639 | ||||||
End of year (a) | $ | 3,212,744,072 | $ | 3,094,673,011 | ||||
(a) Includes undistributed net investment income of: | $ | 1,844,408 | $ | 1,589,801 | ||||
SEE NOTES TO FINANCIAL STATEMENTS.
A12
| VALUE PORTFOLIO |
STATEMENT OF ASSETS AND LIABILITIES
December 31, 2005
| ASSETS | |||
Investments, at value including securities on loan of $256,935,541: | |||
Unaffiliated investments (cost $1,375,439,874) | $ | 1,736,668,255 | |
Affiliated investments (cost $303,980,204) | 303,980,204 | ||
Cash | 208,135 | ||
Foreign currency, at value (cost $814) | 814 | ||
Dividends and interest receivable | 2,540,040 | ||
Receivable for capital stock sold | 509,451 | ||
Prepaid expenses | 41,074 | ||
Total Assets | 2,043,947,973 | ||
| LIABILITIES | |||
Collateral for securities on loan | 269,315,964 | ||
Payable for investments purchased | 19,641,738 | ||
Accrued expenses and other liabilities | 601,940 | ||
Management fee payable | 667,334 | ||
Payable for capital stock repurchased | 466,882 | ||
Distribution fee payable | 704 | ||
Transfer agent fee payable | 455 | ||
Administration fee payable | 422 | ||
Total Liabilities | 290,695,439 | ||
| NET ASSETS | $ | 1,753,252,534 | |
Net assets were comprised of: | |||
Common stock, at $0.01 par value | $ | 763,885 | |
Paid-in capital in excess of par | 1,328,094,369 | ||
| 1,328,858,254 | |||
Undistributed net investment income | 1,224,164 | ||
Accumulated net realized gain on investments and foreign currencies | 61,941,735 | ||
Net unrealized appreciation on investments | 361,228,381 | ||
Net assets, December 31, 2005 | $ | 1,753,252,534 | |
| Class I: | |||
Net asset value and redemption price per share, $1,750,115,391 / 76,251,973 outstanding shares of common stock (authorized 275,000,000 shares) | $ | 22.95 | |
| Class II: | |||
Net asset value and redemption price per share, $3,137,143 / 136,494 outstanding shares of common stock (authorized 50,000,000 shares) | $ | 22.98 | |
STATEMENT OF OPERATIONS
Year Ended December 31, 2005
| INVESTMENT INCOME | ||||
Unaffiliated dividend income (net of foreign withholding taxes of $560,507) | $ | 27,905,511 | ||
Affiliated dividend income | 1,005,304 | |||
Affiliated income from securities loaned, net | 346,604 | |||
Interest | 896 | |||
| 29,258,315 | ||||
| EXPENSES | ||||
Management fee | 6,558,856 | |||
Distribution fee—Class II | 7,841 | |||
Administration fee—Class II | 4,705 | |||
Shareholders’ reports | 199,000 | |||
Custodian’s fees and expenses | 196,000 | |||
Insurance expenses | 45,000 | |||
Directors’ fees | 31,000 | |||
Commitment fee on syndicated credit agreement | 15,000 | |||
Audit fee | 15,000 | |||
Legal fees and expenses | 10,000 | |||
Transfer agent’s fee and expenses (including affiliated expense of $5,300) (Note 4) | 5,500 | |||
Miscellaneous | 7,279 | |||
Total expenses | 7,095,181 | |||
Less: custodian fee credit | (1,680 | ) | ||
Net expenses | 7,093,501 | |||
| NET INVESTMENT INCOME | 22,164,814 | |||
| NET REALIZED AND UNREALIZED GAIN (LOSS) ON INVESTMENTS AND FOREIGN CURRENCIES | ||||
Net realized gain on: | ||||
Investments | 204,956,945 | |||
Foreign currency transactions | 73,841 | |||
| 205,030,786 | ||||
Net change in unrealized appreciation (depreciation) on: | ||||
Investments | 28,680,042 | |||
Foreign currencies | (1,010 | ) | ||
| 28,679,032 | ||||
| NET GAIN ON INVESTMENTS AND FOREIGN CURRENCIES | 233,709,818 | |||
| NET INCREASE IN NET ASSETS RESULTING FROM OPERATIONS | $ | 255,874,632 | ||
STATEMENT OF CHANGES IN NET ASSETS
| Year Ended December 31, | ||||||||
| 2005 | 2004 | |||||||
| INCREASE (DECREASE) IN NET ASSETS | ||||||||
| OPERATIONS: | ||||||||
Net investment income | $ | 22,164,814 | $ | 22,060,925 | ||||
Net realized gain on investments | 205,030,786 | 77,062,241 | ||||||
Net change in unrealized appreciation (depreciation) on investments | 28,679,032 | 129,044,352 | ||||||
NET INCREASE IN NET ASSETS RESULTING FROM OPERATIONS | 255,874,632 | 228,167,518 | ||||||
| DIVIDENDS: | ||||||||
Dividends from net investment income | ||||||||
Class I | (22,610,679 | ) | (20,412,598 | ) | ||||
Class II | (26,899 | ) | (26,411 | ) | ||||
TOTAL DIVIDENDS | (22,637,578 | ) | (20,439,009 | ) | ||||
| CAPITAL STOCK TRANSACTIONS (Note 7): | ||||||||
Capital stock sold [3,300,330 and 3,961,436 shares, respectively] | 69,873,234 | 72,300,449 | ||||||
Capital stock issued in reinvestment of dividends [990,895 and 1,041,743 shares, respectively] | 22,637,578 | 20,439,009 | ||||||
Capital stock repurchased [8,118,990 and 8,812,231 shares, respectively] | (171,071,091 | ) | (160,915,601 | ) | ||||
NET INCREASE (DECREASE) IN NET ASSETS RESULTING FROM CAPITAL STOCK TRANSACTIONS | (78,560,279 | ) | (68,176,143 | ) | ||||
| TOTAL INCREASE IN NET ASSETS | 154,676,775 | 139,552,366 | ||||||
| NET ASSETS: | ||||||||
Beginning of year | 1,598,575,759 | 1,459,023,393 | ||||||
End of year (a) | $ | 1,753,252,534 | $ | 1,598,575,759 | ||||
(a) Includes undistributed net investment income of: | $ | 1,224,164 | $ | 1,623,087 | ||||
SEE NOTES TO FINANCIAL STATEMENTS.
A13
| CONSERVATIVE BALANCED PORTFOLIO |
SCHEDULE OF INVESTMENTS | December 31, 2005 |
| LONG-TERM INVESTMENTS — 92.9% | Value | ||||
| COMMON STOCKS — 57.5% | Shares | ||||
Aerospace & Defense — 1.3% | |||||
Boeing Co. | 116,000 | $ | 8,147,840 | ||
General Dynamics Corp. | 28,500 | 3,250,425 | |||
Goodrich Corp. | 17,800 | 731,580 | |||
Honeywell International, Inc. | 119,812 | 4,462,997 | |||
L-3 Communications Holdings, Inc. | 17,200 | 1,278,820 | |||
Lockheed Martin Corp. | 55,100 | 3,506,013 | |||
Northrop Grumman Corp. | 50,562 | 3,039,282 | |||
Raytheon Co. | 63,700 | 2,557,555 | |||
Rockwell Collins, Inc. | 23,400 | 1,087,398 | |||
United Technologies Corp. | 142,900 | 7,989,539 | |||
| 36,051,449 | |||||
Air Freight & Couriers — 0.6% | |||||
FedEx Corp. | 43,800 | 4,528,482 | |||
Ryder System, Inc. | 9,500 | 389,690 | |||
United Parcel Service, Inc. | 159,400 | 11,978,910 | |||
| 16,897,082 | |||||
Airlines — 0.1% | |||||
Southwest Airlines Co. | 94,100 | 1,546,063 | |||
Apparel — 0.2% | |||||
Coach, Inc.(a) | 54,700 | 1,823,698 | |||
Jones Apparel Group, Inc. | 15,600 | 479,232 | |||
Liz Claiborne, Inc.(b) | 16,800 | 601,776 | |||
NIKE, Inc. (Class B) | 26,300 | 2,282,577 | |||
Reebok International Ltd. | 5,000 | 291,150 | |||
| 5,478,433 | |||||
Autos – Cars & Trucks — 0.3% | |||||
Cooper Tire & Rubber Co. | 4,000 | 61,280 | |||
Dana Corp. | 25,000 | 179,500 | |||
Ford Motor Co.(b) | 266,895 | 2,060,430 | |||
General Motors Corp.(b) | 77,791 | 1,510,701 | |||
Genuine Parts Co. | 23,100 | 1,014,552 | |||
Goodyear Tire & Rubber Co. (The)(a)(b) | 24,500 | 425,810 | |||
Johnson Controls, Inc. | 28,000 | 2,041,480 | |||
| 7,293,753 | |||||
Banks & Savings & Loans — 3.7% | |||||
AmSouth Bancorp.(b) | 44,900 | 1,176,829 | |||
Bank of America Corp. | 572,766 | 26,433,150 | |||
Bank of New York Co., Inc. (The) | 115,800 | 3,688,230 | |||
BB&T Corp.(b) | 74,200 | 3,109,722 | |||
Comerica, Inc. | 28,100 | 1,594,956 | |||
Compass Bancshares, Inc. | 16,100 | 777,469 | |||
Fifth Third Bancorp | 77,321 | 2,916,548 | |||
First Horizon National Corp. | 17,000 | 653,480 | |||
Golden West Financial Corp.(b) | 35,500 | 2,343,000 | |||
Huntington Bancshares, Inc. | 28,536 | 677,730 | |||
KeyCorp | 58,200 | 1,916,526 | |||
M&T Bank Corp. | 11,200 | 1,221,360 | |||
Marshall & Ilsley Corp. | 28,900 | 1,243,856 | |||
Mellon Financial Corp. | 56,400 | 1,931,700 | |||
MGIC Investment Corp. | 14,800 | 974,136 | |||
National City Corp. | 81,400 | 2,732,598 | |||
North Fork Bancorporation, Inc. | 65,200 | 1,783,872 | |||
Northern Trust Corp.(b) | 24,000 | 1,243,680 | |||
PNC Financial Services Group, Inc. | 40,600 | 2,510,298 | |||
| COMMON STOCKS (Continued) | Shares | Value (Note 2) | |||
Banks & Savings & Loans (cont’d.) | |||||
Regions Financial Corp. | 63,135 | $ | 2,156,692 | ||
Sovereign Bancorp, Inc. | 54,900 | 1,186,938 | |||
SunTrust Banks, Inc. | 51,000 | 3,710,760 | |||
U.S. Bancorp | 263,485 | 7,875,567 | |||
Wachovia Corp.(b) | 235,480 | 12,447,473 | |||
Wells Fargo & Co. | 242,900 | 15,261,406 | |||
Zions Bancorp. | 12,450 | 940,722 | |||
| 102,508,698 | |||||
Building Products — 0.1% | |||||
American Standard Cos., Inc. | 26,700 | 1,066,665 | |||
Masco Corp. | 62,800 | 1,895,932 | |||
| 2,962,597 | |||||
Chemicals — 0.9% | |||||
Air Products and Chemicals, Inc. | 30,800 | 1,823,052 | |||
Ashland, Inc. | 8,000 | 463,200 | |||
Dow Chemical Co. (The) | 138,031 | 6,048,518 | |||
Du Pont E. I. de Nemours & Co. | 128,920 | 5,479,100 | |||
Eastman Chemical Co. | 11,400 | 588,126 | |||
Ecolab, Inc.(b) | 25,300 | 917,631 | |||
Engelhard Corp. | 18,100 | 545,715 | |||
Hercules, Inc.(a) | 17,500 | 197,750 | |||
International Flavors & | 12,200 | 408,700 | |||
Monsanto Co. | 34,597 | 2,682,305 | |||
PPG Industries, Inc. | 24,300 | 1,406,970 | |||
Praxair, Inc. | 44,600 | 2,362,016 | |||
Rohm & Haas Co. | 21,011 | 1,017,353 | |||
Sigma-Aldrich Corp. | 10,100 | 639,229 | |||
| 24,579,665 | |||||
Commercial Services | |||||
Convergys Corp.(a) | 22,000 | 348,700 | |||
Commercial Services & Supplies — 0.4% | |||||
Allied Waste Industries, Inc.(a)(b) | 30,400 | 265,696 | |||
Avery Dennison Corp. | 15,500 | 856,685 | |||
Cendant Corp. | 146,600 | 2,528,850 | |||
Cintas Corp.(b) | 18,500 | 761,830 | |||
Equifax, Inc. | 17,200 | 653,944 | |||
Monster Worldwide, Inc.(a)(b) | 18,000 | 734,760 | |||
Pitney Bowes, Inc. | 33,400 | 1,411,150 | |||
Robert Half International, Inc. | 22,200 | 841,158 | |||
RR Donnelley & Sons Co. | 32,600 | 1,115,246 | |||
Waste Management, Inc. | 79,642 | 2,417,135 | |||
| 11,586,454 | |||||
Communications Equipment — 1.6% | |||||
ADC Telecommunications, Inc.(a) | 14,771 | 329,984 | |||
Andrew Corp.(a) | 27,700 | 297,221 | |||
Avaya, Inc.(a) | 65,970 | 703,900 | |||
CIENA Corp.(a) | 64,000 | 190,080 | |||
Cisco Systems, Inc.(a) | 892,300 | 15,276,176 | |||
Comverse Technology, Inc.(a)(b) | 28,800 | 765,792 | |||
Corning, Inc.(a) | 207,700 | 4,083,382 | |||
JDS Uniphase Corp.(a) | 173,000 | 408,280 | |||
Lucent Technologies, Inc.(a)(b) | 655,955 | 1,744,840 | |||
Motorola, Inc. | 349,525 | 7,895,770 | |||
Qualcomm, Inc. | 236,800 | 10,201,344 | |||
SEE NOTES TO FINANCIAL STATEMENTS.
B1
| CONSERVATIVE BALANCED PORTFOLIO (Continued) |
SCHEDULE OF INVESTMENTS | December 31, 2005 |
| COMMON STOCKS (Continued) | Shares | Value (Note 2) | |||
Communications Equipment (cont’d.) | |||||
Scientific-Atlanta, Inc.(b) | 21,800 | $ | 938,926 | ||
Tellabs, Inc.(a) | 66,600 | 725,940 | |||
| 43,561,635 | |||||
Computer Services — 2.7% | |||||
Adobe Systems, Inc. | 75,800 | 2,801,568 | |||
Affiliated Computer Services, Inc.(a) | 17,600 | 1,041,568 | |||
Autodesk, Inc.(b) | 32,600 | 1,400,170 | |||
Automatic Data Processing, Inc. | 82,400 | 3,781,336 | |||
BMC Software, Inc.(a) | 33,600 | 688,464 | |||
Citrix Systems, Inc.(a)(b) | 22,800 | 656,184 | |||
Computer Associates | 64,464 | 1,817,240 | |||
Computer Sciences Corp.(a) | 26,300 | 1,331,832 | |||
Compuware Corp.(a) | 59,000 | 529,230 | |||
Electronic Arts, Inc.(a) | 40,200 | 2,102,862 | |||
Electronic Data Systems Corp. | 70,700 | 1,699,628 | |||
EMC Corp.(a) | 342,250 | 4,661,445 | |||
First Data Corp. | 108,110 | 4,649,811 | |||
Fiserv, Inc.(a) | 32,400 | 1,401,948 | |||
Intuit, Inc.(a)(b) | 24,700 | 1,316,510 | |||
Mercury Interactive Corp.(a) | 13,000 | 361,270 | |||
Microsoft Corp. | 1,294,700 | 33,856,405 | |||
Novell, Inc.(a) | 41,200 | 363,796 | |||
Oracle Corp.(a) | 536,800 | 6,554,328 | |||
Parametric Technology Corp.(a) | 41,200 | 251,320 | |||
Paychex, Inc. | 47,700 | 1,818,324 | |||
Sabre Holdings Corp. | 18,926 | 456,306 | |||
Sun Microsystems, Inc.(a) | 477,000 | 1,998,630 | |||
| 75,540,175 | |||||
Computers & Peripherals — 1.9% | |||||
Apple Computer, Inc.(a) | 114,000 | 8,195,460 | |||
Dell, Inc.(a)(b) | 335,900 | 10,073,641 | |||
Gateway, Inc.(a)(b) | 24,000 | 60,240 | |||
Hewlett-Packard Co. | 403,848 | 11,562,168 | |||
International Business Machines Corp. | 229,100 | 18,832,021 | |||
Lexmark International, Inc.(a) | 16,433 | 736,691 | |||
NCR Corp.(a) | 26,400 | 896,016 | |||
Network Appliance, Inc.(a) | 50,200 | 1,355,400 | |||
QLogic Corp.(a) | 13,800 | 448,638 | |||
| 52,160,275 | |||||
Construction — 0.2% | |||||
Centex Corp. | 18,400 | 1,315,416 | |||
D.R. Horton, Inc. | 35,100 | 1,254,123 | |||
Fluor Corp. | 12,300 | 950,298 | |||
KB Home | 10,800 | 784,728 | |||
Pulte Homes, Inc.(b) | 31,000 | 1,220,160 | |||
Vulcan Materials Co.(b) | 14,300 | 968,825 | |||
| 6,493,550 | |||||
Containers — 0.1% | |||||
Ball Corp. | 19,600 | 778,512 | |||
Bemis Co. | 14,400 | 401,328 | |||
Pactiv Corp.(a) | 21,400 | 470,800 | |||
Sealed Air Corp.(a) | 10,100 | 567,317 | |||
Temple-Inland, Inc. | 15,400 | 690,690 | |||
| 2,908,647 | |||||
| COMMON STOCKS (Continued) | Shares | Value (Note 2) | |||
Diversified Consumer Services — 0.1% | |||||
Apollo Group, Inc.(a) | 20,700 | $ | 1,251,522 | ||
H&R Block, Inc. | 44,500 | 1,092,475 | |||
| 2,343,997 | |||||
Drugs & Medical Supplies — 5.8% | |||||
Abbott Laboratories | 220,600 | 8,698,258 | |||
Allergan, Inc. | 19,700 | 2,126,812 | |||
AmerisourceBergen Corp. | 28,200 | 1,167,480 | |||
Amgen, Inc.(a) | 173,160 | 13,655,398 | |||
Applera Corp. — Applied | 27,400 | 727,744 | |||
Bard (C.R.), Inc. | 15,400 | 1,015,168 | |||
Bausch & Lomb, Inc.(b) | 6,700 | 454,930 | |||
Baxter International, Inc. | 92,900 | 3,497,685 | |||
Becton, Dickinson & Co. | 35,100 | 2,108,808 | |||
Biogen Idec, Inc.(a) | 47,090 | 2,134,590 | |||
Biomet, Inc.(b) | 33,800 | 1,236,066 | |||
Boston Scientific Corp.(a) | 80,600 | 1,973,894 | |||
Bristol-Myers Squibb Co. | 276,300 | 6,349,374 | |||
Cardinal Health, Inc. | 60,950 | 4,190,313 | |||
Caremark Rx, Inc.(a) | 63,700 | 3,299,023 | |||
Chiron Corp.(a) | 7,300 | 324,558 | |||
Eli Lilly & Co.(b) | 159,400 | 9,020,446 | |||
Express Scripts, Inc.(a) | 20,200 | 1,692,760 | |||
Fisher Scientific International, Inc.(a) | 14,800 | 915,528 | |||
Forest Laboratories, Inc.(a) | 46,100 | 1,875,348 | |||
Genzyme Corp.(a)(b) | 35,800 | 2,533,924 | |||
Gilead Sciences, Inc.(a) | 62,800 | 3,305,164 | |||
Guidant Corp. | 47,100 | 3,049,725 | |||
Hospira, Inc.(a) | 20,960 | 896,669 | |||
Johnson & Johnson | 418,448 | 25,148,724 | |||
King Pharmaceuticals, Inc.(a) | 39,666 | 671,149 | |||
Laboratory Corp. of America Holdings(a)(b) | 17,900 | 963,915 | |||
Medco Health Solutions, Inc.(a) | 36,449 | 2,033,854 | |||
MedImmune, Inc.(a) | 31,000 | 1,085,620 | |||
Medtronic, Inc. | 174,400 | 10,040,208 | |||
Merck & Co., Inc.(b) | 310,800 | 9,886,548 | |||
Millipore Corp.(a) | 7,100 | 468,884 | |||
Mylan Laboratories, Inc. | 20,900 | 417,164 | |||
PerkinElmer, Inc. | 17,400 | 409,944 | |||
Pfizer, Inc. | 1,042,245 | 24,305,152 | |||
Quest Diagnostics, Inc. | 24,000 | 1,235,520 | |||
Schering-Plough Corp. | 210,200 | 4,382,670 | |||
St. Jude Medical, Inc.(a) | 51,800 | 2,600,360 | |||
| 159,899,377 | |||||
Electronics — 2.0% | |||||
Advanced Micro Devices, Inc.(a)(b) | 51,800 | 1,585,080 | |||
Agilent Technologies, Inc.(a) | 48,814 | 1,625,018 | |||
Altera Corp.(a)(b) | 52,900 | 980,237 | |||
American Power Conversion Corp. | 24,100 | 530,200 | |||
Analog Devices, Inc. | 49,700 | 1,782,739 | |||
Applied Materials, Inc.(b) | 231,800 | 4,158,492 | |||
Applied Micro Circuits Corp.(a)(b) | 49,000 | 125,930 | |||
Broadcom Corp. (Class A)(a) | 42,300 | 1,994,445 | |||
Cooper Industries Ltd. | 12,400 | 905,200 | |||
Emerson Electric Co. | 58,500 | 4,369,950 | |||
SEE NOTES TO FINANCIAL STATEMENTS.
B2
| CONSERVATIVE BALANCED PORTFOLIO (Continued) |
SCHEDULE OF INVESTMENTS | December 31, 2005 |
| COMMON STOCKS (Continued) | Shares | Value (Note 2) | |||
Electronics (cont’d.) | |||||
Freescale Semiconductor, Inc. (Class B)(a) | 56,630 | $ | 1,425,377 | ||
Intel Corp. | 861,900 | 21,513,024 | |||
Jabil Circuit, Inc.(a) | 24,800 | 919,832 | |||
KLA-Tencor Corp. | 20,300 | 1,001,399 | |||
Linear Technology Corp. | 44,100 | 1,590,687 | |||
LSI Logic Corp.(a) | 57,200 | 457,600 | |||
Maxim Integrated Products, Inc. | 46,800 | 1,696,032 | |||
Micron Technology, Inc.(a)(b) | 76,300 | 1,015,553 | |||
Molex, Inc. | 20,900 | 542,355 | |||
National Semiconductor Corp. | 47,600 | 1,236,648 | |||
Novellus Systems, Inc.(a) | 16,000 | 385,920 | |||
NVIDIA Corp.(a) | 24,000 | 877,440 | |||
PMC — Sierra, Inc.(a)(b) | 25,000 | 192,750 | |||
Rockwell Automation, Inc. | 24,900 | 1,473,084 | |||
Sanmina-SCI Corp.(a) | 71,700 | 305,442 | |||
Solectron Corp.(a)(b) | 141,600 | 518,256 | |||
Symbol Technologies, Inc. | 31,900 | 408,958 | |||
Tektronix, Inc. | 14,500 | 409,045 | |||
| 54,026,693 | |||||
Financial Services — 5.4% | |||||
American Express Co. | 173,600 | 8,933,456 | |||
Ameriprise Financial, Inc. | 35,720 | 1,464,520 | |||
Bear Stearns & Co. | 15,916 | 1,838,775 | |||
Capital One Financial Corp. | 41,000 | 3,542,400 | |||
Charles Schwab Corp. (The) | 149,950 | 2,199,767 | |||
CIT Group, Inc. | 28,800 | 1,491,264 | |||
Citigroup, Inc. | 722,658 | 35,070,592 | |||
Countrywide Financial Corp. | 82,500 | 2,820,675 | |||
E*TRADE Financial Corp.(a) | 54,000 | 1,126,440 | |||
Fannie Mae | 135,500 | 6,613,755 | |||
Federated Investors, Inc. (Class B) | 10,600 | 392,624 | |||
Franklin Resources, Inc. | 20,700 | 1,946,007 | |||
Freddie Mac(b) | 96,400 | 6,299,740 | |||
Goldman Sachs Group, Inc. | 68,000 | 8,684,280 | |||
Janus Capital Group, Inc.(b) | 30,300 | 564,489 | |||
JPMorgan Chase & Co. | 502,901 | 19,960,140 | |||
Lehman Brothers Holdings, Inc. | 40,200 | 5,152,434 | |||
MBNA Corp. | 177,625 | 4,822,519 | |||
Merrill Lynch & Co., Inc. | 136,800 | 9,265,464 | |||
Moody’s Corp.(b) | 36,800 | 2,260,256 | |||
Morgan Stanley | 157,380 | 8,929,741 | |||
SLM Corp.(b) | 58,300 | 3,211,747 | |||
State Street Corp. | 45,600 | 2,528,064 | |||
Synovus Financial Corp. | 43,550 | 1,176,286 | |||
T. Rowe Price Group, Inc. | 17,400 | 1,253,322 | |||
Washington Mutual, Inc. | 144,978 | 6,306,543 | |||
| 147,855,300 | |||||
Food & Beverage — 1.8% | |||||
Anheuser-Busch Cos., Inc. | 110,400 | 4,742,784 | |||
Archer-Daniels-Midland Co. | 92,626 | 2,284,157 | |||
Brown-Forman Corp. (Class B)(b) | 7,700 | 533,764 | |||
Campbell Soup Co. | 26,900 | 800,813 | |||
Coca-Cola Co. (The) | 297,000 | 11,972,070 | |||
Coca-Cola Enterprises, Inc. | 42,800 | 820,476 | |||
ConAgra Foods, Inc. | 71,500 | 1,450,020 | |||
| COMMON STOCKS (Continued) | Shares | Value (Note 2) | |||
Food & Beverage (cont’d.) | |||||
Constellation Brands, Inc.(a) | 23,500 | $ | 616,405 | ||
General Mills, Inc. | 51,800 | 2,554,776 | |||
H.J. Heinz Co. | 46,800 | 1,578,096 | |||
Hershey Co. (The)(b) | 26,300 | 1,453,075 | |||
Kellogg Co. | 36,500 | 1,577,530 | |||
McCormick & Co., Inc. | 18,000 | 556,560 | |||
Molson Coors Brewing Co. | 8,300 | 556,017 | |||
Pepsi Bottling Group, Inc. | 20,100 | 575,061 | |||
PepsiCo, Inc. | 234,730 | 13,867,849 | |||
Sara Lee Corp.(b) | 109,600 | 2,071,440 | |||
Tyson Foods, Inc. (Class A) | 33,000 | 564,300 | |||
Wrigley (William) Jr. Co. | 20,100 | 1,336,449 | |||
| 49,911,642 | |||||
Food & Staples Retailing — 0.9% | |||||
SUPERVALU, Inc.(b) | 18,100 | 587,888 | |||
Sysco Corp. | 85,200 | 2,645,460 | |||
Wal-Mart Stores, Inc. | 352,700 | 16,506,360 | |||
Walgreen Co. | 143,500 | 6,351,310 | |||
| 26,091,018 | |||||
Gas Pipeline | |||||
Dynegy, Inc. (Class A)(a) | 37,500 | 181,500 | |||
Healthcare Equipment & Supplies — 0.2% | |||||
Patterson Cos., Inc.(a)(b) | 10,000 | 334,000 | |||
Stryker Corp. | 40,400 | 1,794,972 | |||
Thermo Electron Corp.(a) | 23,900 | 720,107 | |||
Waters Corp.(a) | 18,000 | 680,400 | |||
Zimmer Holdings, Inc.(a) | 34,200 | 2,306,448 | |||
| 5,835,927 | |||||
Hospital/Hospital Management — 1.0% | |||||
HCA, Inc. | 61,300 | 3,095,650 | |||
Health Management | 33,400 | 733,464 | |||
Humana, Inc.(a) | 23,200 | 1,260,456 | |||
IMS Health, Inc. | 33,700 | 839,804 | |||
Manor Care, Inc. | 12,600 | 501,102 | |||
McKesson Corp. | 42,130 | 2,173,487 | |||
Tenet Healthcare Corp.(a)(b) | 71,000 | 543,860 | |||
UnitedHealth Group, Inc. | 188,400 | 11,707,176 | |||
WellPoint, Inc.(a) | 88,100 | 7,029,499 | |||
| 27,884,498 | |||||
Household Durables — 0.2% | |||||
Black & Decker Corp.(b) | 12,500 | 1,087,000 | |||
Fortune Brands, Inc. | 19,700 | 1,536,994 | |||
Leggett & Platt, Inc. | 26,200 | 601,552 | |||
Lennar Corp.(b) | 16,400 | 1,000,728 | |||
| 4,226,274 | |||||
Household Products & Personal Care — 1.4% | |||||
Alberto-Culver Co. | 11,850 | 542,138 | |||
Avon Products, Inc. | 66,100 | 1,887,155 | |||
Clorox Co.(b) | 22,100 | 1,257,269 | |||
Colgate-Palmolive Co. | 70,300 | 3,855,955 | |||
Kimberly-Clark Corp. | 67,900 | 4,050,235 | |||
Procter & Gamble Co. | 475,925 | 27,546,539 | |||
| 39,139,291 | |||||
SEE NOTES TO FINANCIAL STATEMENTS.
B3
| CONSERVATIVE BALANCED PORTFOLIO (Continued) |
SCHEDULE OF INVESTMENTS | December 31, 2005 |
| COMMON STOCKS (Continued) | Shares | Value (Note 2) | |||
Housing Related — 0.3% | |||||
Lowe’s Cos., Inc.(b) | 109,100 | $ | 7,272,606 | ||
Maytag Corp. | 13,600 | 255,952 | |||
Newell Rubbermaid, Inc. | 32,314 | 768,427 | |||
Stanley Works (The) | 10,800 | 518,832 | |||
Whirlpool Corp. | 9,100 | 762,216 | |||
| 9,578,033 | |||||
Independent Power Producers & Energy Traders — 0.1% | |||||
TXU Corp. | 70,000 | 3,513,300 | |||
Industrial Conglomerates — 2.6% | |||||
3M Co.(b) | 109,800 | 8,509,500 | |||
General Electric Co. | 1,487,500 | 52,136,875 | |||
Textron, Inc. | 18,000 | 1,385,640 | |||
Tyco International Ltd. | 286,361 | 8,264,378 | |||
| 70,296,393 | |||||
Insurance — 3.0% | |||||
ACE Ltd. (Bermuda) | 42,700 | 2,281,888 | |||
Aetna, Inc. | 41,500 | 3,913,865 | |||
AFLAC, Inc. | 68,800 | 3,193,696 | |||
Allstate Corp. (The) | 97,200 | 5,255,604 | |||
AMBAC Financial Group, Inc. | 15,200 | 1,171,312 | |||
American International Group, Inc. | 367,488 | 25,073,706 | |||
Aon Corp.(b) | 43,900 | 1,578,205 | |||
Chubb Corp. | 28,000 | 2,734,200 | |||
CIGNA Corp. | 19,700 | 2,200,490 | |||
Cincinnati Financial Corp. | 24,237 | 1,082,909 | |||
Coventry Health Care Inc.(a) | 22,850 | 1,301,536 | |||
Genworth Financial, Inc. | 45,000 | 1,556,100 | |||
Hartford Financial Services | 43,000 | 3,693,270 | |||
Jefferson-Pilot Corp. | 19,700 | 1,121,521 | |||
Lincoln National Corp. | 24,700 | 1,309,841 | |||
Loews Corp. | 18,400 | 1,745,240 | |||
Louisiana-Pacific Corp. | 14,500 | 398,315 | |||
Marsh & McLennan Cos., Inc. | 76,700 | 2,435,992 | |||
MBIA, Inc.(b) | 19,550 | 1,176,128 | |||
MetLife, Inc.(b) | 107,100 | 5,247,900 | |||
Principal Financial Group | 39,700 | 1,882,971 | |||
Progressive Corp. (The)(b) | 25,200 | 2,942,856 | |||
SAFECO Corp. | 16,800 | 949,200 | |||
St. Paul Travelers Cos., Inc. (The) | 100,835 | 4,504,300 | |||
Torchmark Corp. | 15,100 | 839,560 | |||
UnumProvident Corp.(b) | 43,110 | 980,753 | |||
XL Capital Ltd. (Class A) (Bermuda) | 20,600 | 1,388,028 | |||
| 81,959,386 | |||||
Internet Services — 0.6% | |||||
Amazon.com, Inc.(a)(b) | 35,300 | 1,664,395 | |||
eBay, Inc.(a) | 152,400 | 6,591,300 | |||
Yahoo!, Inc.(a)(b) | 176,300 | 6,907,434 | |||
| 15,163,129 | |||||
IT Services | |||||
Unisys Corp.(a) | 49,200 | 286,836 | |||
Leisure — 0.7% | |||||
Brunswick Corp. | 12,500 | 508,250 | |||
Carnival Corp. | 53,900 | 2,882,033 | |||
| COMMON STOCKS (Continued) | Shares | Value (Note 2) | |||
Leisure (cont’d.) | |||||
Eastman Kodak Co.(b) | 42,200 | $ | 987,480 | ||
Harrah’s Entertainment, Inc. | 22,800 | 1,625,412 | |||
Hilton Hotels Corp. | 47,300 | 1,140,403 | |||
International Game Technology | 39,900 | 1,228,122 | |||
Marriott International, Inc. (Class A) | 23,700 | 1,587,189 | |||
Starwood Hotels & Resorts | 26,400 | 1,685,904 | |||
Walt Disney Co. (The) | 284,500 | 6,819,465 | |||
| 18,464,258 | |||||
Machinery — 0.7% | |||||
Caterpillar, Inc.(b) | 96,400 | 5,569,028 | |||
Cummins, Inc. | 5,600 | 502,488 | |||
Deere & Co. | 33,400 | 2,274,874 | |||
Dover Corp. | 29,300 | 1,186,357 | |||
Eaton Corp. | 20,700 | 1,388,763 | |||
Illinois Tool Works, Inc. | 29,000 | 2,551,710 | |||
Ingersoll-Rand Co. Ltd. (Class A) (Bermuda) | 50,400 | 2,034,648 | |||
Navistar International Corp.(a) | 8,300 | 237,546 | |||
Paccar, Inc. | 24,975 | 1,729,019 | |||
Parker Hannifin Corp. | 17,210 | 1,135,172 | |||
Snap-on, Inc. | 4,900 | 184,044 | |||
| 18,793,649 | |||||
Media — 1.7% | |||||
CBS Corp. | 232,469 | 7,578,489 | |||
Clear Channel Communications, Inc. | 73,000 | 2,295,850 | |||
Comcast Corp. (Class A)(a)(b) | 307,760 | 7,989,450 | |||
Dow Jones & Co., Inc. | 6,800 | 241,332 | |||
E.W. Scripps Co. | 4,000 | 192,080 | |||
Gannett Co., Inc.(b) | 35,200 | 2,132,064 | |||
Interpublic Group of Cos., Inc.(a)(b) | 37,200 | 358,980 | |||
Knight-Ridder, Inc.(b) | 9,400 | 595,020 | |||
McGraw-Hill Cos., Inc. (The) | 51,600 | 2,664,108 | |||
Meredith Corp. | 7,000 | 366,380 | |||
New York Times Co. (The) | 22,100 | 584,545 | |||
News Corp. (Class A) | 334,200 | 5,196,810 | |||
Omnicom Group, Inc. | 25,600 | 2,179,328 | |||
Time Warner, Inc. | 658,800 | 11,489,472 | |||
Tribune Co. | 39,850 | 1,205,861 | |||
Univision Communications, Inc.(a)(b) | 36,900 | 1,084,491 | |||
| 46,154,260 | |||||
Metals & Mining — 0.2% | |||||
Freeport-McMoRan Copper & | 26,000 | 1,398,800 | |||
Newmont Mining Corp. | 63,800 | 3,406,920 | |||
Phelps Dodge Corp. | 13,893 | 1,998,786 | |||
| 6,804,506 | |||||
Metals – Ferrous — 0.1% | |||||
Allegheny Technologies, Inc. | 14,200 | 512,336 | |||
Nucor Corp. | 21,900 | 1,461,168 | |||
United States Steel Corp. | 14,900 | 716,243 | |||
| 2,689,747 | |||||
Metals – Non Ferrous — 0.1% | |||||
Alcoa, Inc.(b) | 116,740 | 3,452,002 | |||
SEE NOTES TO FINANCIAL STATEMENTS.
B4
| CONSERVATIVE BALANCED PORTFOLIO (Continued) |
SCHEDULE OF INVESTMENTS | December 31, 2005 |
| COMMON STOCKS (Continued) | Shares | Value (Note 2) | |||
Miscellaneous Basic Industry — 0.2% | |||||
Danaher Corp. | 35,000 | $ | 1,952,300 | ||
ITT Industries, Inc. | 13,600 | 1,398,352 | |||
Pall Corp. | 14,000 | 376,040 | |||
W.W. Grainger, Inc. | 11,300 | 803,430 | |||
| 4,530,122 | |||||
Motorcycles — 0.1% | |||||
Harley-Davidson, Inc.(b) | 39,600 | 2,039,004 | |||
Multi-Utilities — 0.1% | |||||
TECO Energy, Inc. | 32,600 | 560,068 | |||
Xcel Energy, Inc. | 55,910 | 1,032,099 | |||
| 1,592,167 | |||||
Office Electronics — 0.1% | |||||
Xerox Corp.(a) | 135,700 | 1,988,005 | |||
Oil & Gas — 3.7% | |||||
Amerada Hess Corp.(b) | 11,500 | 1,458,430 | |||
Anadarko Petroleum Corp.(b) | 33,127 | 3,138,783 | |||
B.J. Services Co. | 45,800 | 1,679,486 | |||
Chevron Corp. | 318,022 | 18,054,109 | |||
ConocoPhillips | 200,350 | 11,656,363 | |||
EOG Resources, Inc. | 33,300 | 2,443,221 | |||
Exxon Mobil Corp. | 886,240 | 49,780,101 | |||
Kerr-McGee Corp. | 16,474 | 1,496,828 | |||
Kinder Morgan, Inc. | 13,800 | 1,268,910 | |||
Murphy Oil Corp. | 23,900 | 1,290,361 | |||
Nabors Industries Ltd. (Barbados)(a) | 22,400 | 1,696,800 | |||
Sunoco, Inc. | 19,400 | 1,520,572 | |||
Valero Energy Corp. | 88,800 | 4,582,080 | |||
Williams Cos., Inc. | 78,700 | 1,823,479 | |||
| 101,889,523 | |||||
Oil & Gas Exploration & Production — 0.9% | |||||
Burlington Resources, Inc. | 52,600 | 4,534,120 | |||
Devon Energy Corp. | 65,400 | 4,090,116 | |||
Marathon Oil Corp. | 54,291 | 3,310,134 | |||
National Oilwell Varco, Inc.(a) | 23,400 | 1,467,180 | |||
Occidental Petroleum Corp. | 56,700 | 4,529,196 | |||
Transocean, Inc.(a) | 48,197 | 3,358,849 | |||
XTO Energy, Inc. | 51,333 | 2,255,572 | |||
| 23,545,167 | |||||
Oil & Gas Services — 0.8% | |||||
Apache Corp. | 45,114 | 3,091,211 | |||
Baker Hughes, Inc.(b) | 47,250 | 2,871,855 | |||
El Paso Corp.(b) | 93,236 | 1,133,750 | |||
Halliburton Co. | 71,100 | 4,405,356 | |||
Noble Corp. | 18,700 | 1,319,098 | |||
Rowan Cos., Inc. | 15,400 | 548,856 | |||
Schlumberger Ltd. | 84,500 | 8,209,175 | |||
Weatherford International Ltd.(a) | 39,100 | 1,415,420 | |||
| 22,994,721 | |||||
Paper & Forest Products — 0.2% | |||||
International Paper Co.(b) | 68,073 | 2,287,934 | |||
MeadWestvaco Corp. | 24,414 | 684,324 | |||
Weyerhaeuser Co. | 33,500 | 2,222,390 | |||
| 5,194,648 | |||||
| COMMON STOCKS (Continued) | Shares | Value (Note 2) | |||
Pharmaceuticals — 0.3% | |||||
Watson Pharmaceuticals, Inc.(a) | 15,900 | $ | 516,909 | ||
Wyeth | 193,300 | 8,905,331 | |||
| 9,422,240 | |||||
Railroads — 0.4% | |||||
Burlington Northern Santa Fe Corp. | 52,100 | 3,689,722 | |||
CSX Corp. | 30,200 | 1,533,254 | |||
Norfolk Southern Corp. | 56,400 | 2,528,412 | |||
Union Pacific Corp. | 37,800 | 3,043,278 | |||
| 10,794,666 | |||||
Real Estate Investment Trust — 0.4% | |||||
Apartment Investment & | 13,300 | 503,671 | |||
Archstone-Smith Trust | 25,300 | 1,059,817 | |||
Equity Office Properties Trust | 57,900 | 1,756,107 | |||
Equity Residential | 37,600 | 1,470,912 | |||
Plum Creek Timber Co., Inc. | 21,500 | 775,075 | |||
ProLogis | 31,100 | 1,452,992 | |||
Public Storage, Inc. | 10,000 | 677,200 | |||
Simon Property Group, Inc. | 26,400 | 2,023,032 | |||
Vornado Realty Trust | 14,000 | 1,168,580 | |||
| 10,887,386 | |||||
Restaurants — 0.4% | |||||
Darden Restaurants, Inc. | 17,650 | 686,232 | |||
McDonald’s Corp. | 176,900 | 5,965,068 | |||
Starbucks Corp.(a) | 107,800 | 3,235,078 | |||
Wendy’s International, Inc. | 11,900 | 657,594 | |||
Yum! Brands, Inc. | 40,700 | 1,908,016 | |||
| 12,451,988 | |||||
Retail — 2.1% | |||||
Albertson’s, Inc. | 52,166 | 1,113,744 | |||
AutoNation, Inc.(a)(b) | 26,000 | 564,980 | |||
AutoZone, Inc.(a)(b) | 8,000 | 734,000 | |||
Bed Bath & Beyond, Inc.(a) | 42,500 | 1,536,375 | |||
Best Buy Co., Inc. | 55,125 | 2,396,835 | |||
Big Lots, Inc.(a)(b) | 20,100 | 241,401 | |||
Circuit City Stores, Inc. | 23,200 | 524,088 | |||
Costco Wholesale Corp. | 66,100 | 3,269,967 | |||
CVS Corp. | 109,900 | 2,903,558 | |||
Dillard’s, Inc. | 7,800 | 193,596 | |||
Dollar General Corp.(b) | 44,156 | 842,055 | |||
Family Dollar Stores, Inc. | 23,000 | 570,170 | |||
Federated Department Stores, Inc. | 37,837 | 2,509,728 | |||
Gap, Inc. (The) | 77,000 | 1,358,280 | |||
Home Depot, Inc. | 304,150 | 12,311,993 | |||
J.C. Penney Co., Inc.(b) | 39,800 | 2,212,880 | |||
Kohl’s Corp.(a)(b) | 43,800 | 2,128,680 | |||
Kroger Co. (The)(a) | 104,146 | 1,966,277 | |||
Limited Brands, Inc. | 47,406 | 1,059,524 | |||
Nordstrom, Inc.(b) | 31,900 | 1,193,060 | |||
Office Depot, Inc.(a) | 42,100 | 1,321,940 | |||
OfficeMax, Inc. | 12,200 | 309,392 | |||
RadioShack Corp. | 18,600 | 391,158 | |||
Safeway, Inc. | 63,700 | 1,507,142 | |||
Sears Holding Corp.(a)(b) | 14,642 | 1,691,590 | |||
Sherwin-Williams Co. (The) | 18,300 | 831,186 | |||
SEE NOTES TO FINANCIAL STATEMENTS.
B5
| CONSERVATIVE BALANCED PORTFOLIO (Continued) |
SCHEDULE OF INVESTMENTS | December 31, 2005 |
| COMMON STOCKS (Continued) | Shares | Value (Note 2) | |||
Retail (cont’d.) | |||||
Staples, Inc. | 95,149 | $ | 2,160,834 | ||
Target Corp. | 122,700 | 6,744,819 | |||
Tiffany & Co. | 20,000 | 765,800 | |||
TJX Cos Inc. (The) | 64,400 | 1,496,012 | |||
| 56,851,064 | |||||
Semiconductors & Semiconductor Equipment — 0.3% | |||||
Teradyne, Inc.(a) | 22,100 | 321,997 | |||
Texas Instruments, Inc. | 240,700 | 7,719,249 | |||
Xilinx, Inc.(b) | 39,300 | 990,753 | |||
| 9,031,999 | |||||
Software — 0.1% | |||||
Siebel Systems, Inc. | 56,800 | 600,944 | |||
Symantec Corp.(a) | 151,778 | 2,656,115 | |||
| 3,257,059 | |||||
Telecommunications — 1.7% | |||||
Alltel Corp. | 54,800 | 3,457,880 | |||
AT&T, Inc. | 551,273 | 13,500,676 | |||
BellSouth Corp.(b) | 256,700 | 6,956,570 | |||
CenturyTel, Inc.(b) | 17,800 | 590,248 | |||
Citizens Communications Co. | 40,000 | 489,200 | |||
Qwest Communications | 217,457 | 1,228,632 | |||
Sprint Nextel Corp. | 413,677 | 9,663,495 | |||
Verizon Communications, Inc.(b) | 391,576 | 11,794,269 | |||
| 47,680,970 | |||||
Textiles | |||||
VF Corp. | 13,700 | 758,158 | |||
Tobacco — 0.9% | |||||
Altria Group, Inc. | 293,700 | 21,945,264 | |||
Reynolds American, Inc.(b) | 11,800 | 1,124,894 | |||
UST, Inc. | 23,900 | 975,837 | |||
| 24,045,995 | |||||
Toys — 0.1% | |||||
Hasbro, Inc. | 27,400 | 552,932 | |||
Mattel, Inc. | 61,851 | 978,483 | |||
| 1,531,415 | |||||
Utilities – Electric & Gas — 1.7% | |||||
AES Corp. (The)(a) | 88,100 | 1,394,623 | |||
Allegheny Energy, Inc.(a) | 14,000 | 443,100 | |||
Ameren Corp.(b) | 29,600 | 1,516,704 | |||
American Electric Power Co., Inc. | 54,860 | 2,034,757 | |||
CenterPoint Energy, Inc. | 46,200 | 593,670 | |||
Cinergy Corp. | 27,300 | 1,159,158 | |||
CMS Energy Corp.(a) | 25,000 | 362,750 | |||
Consolidated Edison, Inc. | 33,500 | 1,552,055 | |||
Constellation Energy Group, Inc. | 25,900 | 1,491,840 | |||
Dominion Resources, Inc.(b) | 48,416 | 3,737,715 | |||
DTE Energy Co. | 25,000 | 1,079,750 | |||
Duke Energy Corp. | 131,900 | 3,620,655 | |||
Edison International | 46,300 | 2,019,143 | |||
Entergy Corp. | 29,500 | 2,025,175 | |||
Exelon Corp. | 93,574 | 4,972,523 | |||
FirstEnergy Corp. | 45,101 | 2,209,498 | |||
FPL Group, Inc. | 56,400 | 2,343,984 | |||
| COMMON STOCKS (Continued) | Shares | Value (Note 2) | |||
Utilities – Electric & Gas (cont’d.) | |||||
KeySpan Corp. | 24,700 | $ | 881,543 | ||
Nicor, Inc. | 7,100 | 279,101 | |||
NiSource, Inc. | 38,200 | 796,852 | |||
Peoples Energy Corp. | 6,400 | 224,448 | |||
PG&E Corp. | 46,700 | 1,733,504 | |||
Pinnacle West Capital Corp. | 14,000 | 578,900 | |||
PPL Corp. | 54,800 | 1,611,120 | |||
Progress Energy, Inc.(b) | 34,683 | 1,523,277 | |||
Public Service Enterprise Group, Inc. | 29,400 | 1,910,118 | |||
Sempra Energy | 36,619 | 1,641,996 | |||
Southern Co. (The) | 104,200 | 3,598,026 | |||
| 47,335,985 | |||||
TOTAL COMMON STOCKS | 1,582,290,474 | ||||
Interest | Maturity Date | Moody’s Rating (Unaudited) | Principal Amount (000) | Value (Note 2) | ||||||
| LONG-TERM BONDS — 35.4% | ||||||||||
Aerospace/Defense — 0.4% | ||||||||||
BAE Systems Holdings, Inc.(k) | ||||||||||
| 4.75% | 08/15/10 | Baa2 | $ | 2,000 | $ | 1,964,186 | ||||
| 5.20% | 08/15/15 | Baa2 | 1,170 | 1,146,538 | ||||||
Boeing Capital Corp. | ||||||||||
| 6.10% | 03/01/11 | A3 | 975 | 1,027,283 | ||||||
Goodrich Corp. | ||||||||||
| 7.625% | 12/15/12 | Baa3 | 1,240 | 1,406,460 | ||||||
Lockheed Martin Corp. | ||||||||||
| 8.50% | 12/01/29 | Baa2 | 670 | 913,189 | ||||||
Northrop Grumman Corp. | ||||||||||
| 7.125% | 02/15/11 | Baa2 | 1,025 | 1,116,935 | ||||||
Raytheon Co. | ||||||||||
| 4.50% | 11/15/07 | Baa3 | 194 | 192,329 | ||||||
| 5.50% | 11/15/12 | Baa3 | 625 | 639,219 | ||||||
| 6.55% | 03/15/10 | Baa3 | 1,150 | 1,211,781 | ||||||
| 8.30% | 03/01/10 | Baa3 | 700 | 784,062 | ||||||
| 10,401,982 | ||||||||||
Airlines — 0.1% | ||||||||||
Continental Airlines, Inc. | ||||||||||
| 6.648% | 09/15/17 | Baa3 | 386 | 377,181 | ||||||
| 6.703% | 06/15/21 | Baa3 | 197 | 192,161 | ||||||
Southwest Airlines Co. | ||||||||||
| 6.50% | 03/01/12 | Baa1 | 1,290 | 1,356,916 | ||||||
| 1,926,258 | ||||||||||
Asset Backed Securities — 1.6% | ||||||||||
American Express Credit Account Master Trust I | ||||||||||
Series 2004-4, Class C(h)(k) | ||||||||||
| 4.839% | 03/15/12 | Baa2 | 1,510 | 1,516,842 | ||||||
Series 2004-C, Class C(h)(k) | ||||||||||
| 4.869% | 02/15/12 | Baa2 | 1,421 | 1,423,677 | ||||||
Bank One Issuance Trust | ||||||||||
Series 2003-C1, Class C1 | ||||||||||
| 4.54% | 09/15/10 | Baa2 | 2,445 | 2,420,908 | ||||||
CDC Mortgage Capital Trust | ||||||||||
Series 2002-HE3, Class M1(h) | ||||||||||
| 5.479% | 03/25/33 | Aa2 | 1,588 | 1,600,668 | ||||||
SEE NOTES TO FINANCIAL STATEMENTS.
B6
| CONSERVATIVE BALANCED PORTFOLIO (Continued) |
SCHEDULE OF INVESTMENTS | December 31, 2005 |
Interest | Maturity Date | Moody’s Rating (Unaudited) | Principal Amount (000) | Value (Note 2) | ||||||
| LONG-TERM BONDS (Continued) | ||||||||||
Asset Backed Securities (cont’d.) | ||||||||||
Centex Home Equity | ||||||||||
Series 2005-A, Class M2(h) | ||||||||||
| 4.879% | 01/25/35 | Aa2 | $ | 2,250 | $ | 2,250,779 | ||||
Chase Issuance Trust | ||||||||||
Series 2005-A4, Class A4 | ||||||||||
| 4.23% | 01/15/13 | Aaa | 4,000 | 3,907,056 | ||||||
Citibank Credit Card Issuance Trust | ||||||||||
Series 2003-C3, Class C3 | ||||||||||
| 4.45% | 04/07/10 | Baa2 | 1,700 | 1,678,237 | ||||||
Credit-Based Asset Servicing and Securitization | ||||||||||
Series 2005-CB6, Class A3 | ||||||||||
| 5.12% | 07/25/35 | Aaa | 1,740 | 1,733,050 | ||||||
Equity One ABS, Inc. | ||||||||||
Series 2004-3, Class M1 | ||||||||||
| 5.70% | 07/25/34 | Aa2 | 1,660 | 1,661,053 | ||||||
First Franklin Mortgage Loan Trust | ||||||||||
Series 2005-FFH1, Class M2(h) | ||||||||||
| 4.899% | 06/25/36 | Aa2 | 1,800 | 1,805,126 | ||||||
Home Equity Asset Trust | ||||||||||
Series 2005-7, Class 2A4(h) | ||||||||||
| 4.759% | 01/25/36 | Aaa | 1,400 | 1,400,670 | ||||||
Household Home Equity Loan Trust | ||||||||||
Series 2005-2, Class M2(h) | ||||||||||
| 4.86% | 01/20/35 | Aa1 | 1,415 | 1,415,151 | ||||||
Household Mortgage Loan Trust | ||||||||||
Series 2003-HC2, Class M | ||||||||||
| 4.97% | 06/20/33(h) | Aa2 | 520 | 520,959 | ||||||
Series 2004-HC1, Class M | ||||||||||
| 4.87% | 02/20/34(h) | Aa2 | 422 | 422,372 | ||||||
MBNA Master Credit Card Trust | ||||||||||
Series 1999-J, Class A | ||||||||||
| 7.00% | 02/15/12 | Aaa | 2,370 | 2,544,894 | ||||||
Series 2000-E, Class A | ||||||||||
| 7.80% | 10/15/12 | Aaa | 3,810 | 4,264,621 | ||||||
Morgan Stanley ABS Capital I | ||||||||||
Series 2004-NC3, Class M2(h) | ||||||||||
| 5.479% | 03/25/34 | A2 | 1,800 | 1,819,362 | ||||||
Morgan Stanley Dean Witter Capital I | ||||||||||
Series 2002-NC4, Class M1(h) | ||||||||||
| 5.229% | 09/25/32 | Aaa | 1,879 | 1,887,858 | ||||||
Prestige Auto Receivables Trust | ||||||||||
Series 2004-1, Class A2(k) | ||||||||||
| 3.69% | 06/15/11 | Aaa | 1,299 | 1,283,376 | ||||||
Saxon Asset Securities Trust | ||||||||||
Series 2005-2, Class M2(h) | ||||||||||
| 4.819% | 10/25/35 | Aa2 | 1,480 | 1,484,332 | ||||||
Securitized Asset Bank Receivables LLC | ||||||||||
Series 2004 Class-OP1(h) | ||||||||||
| 4.89% | 02/25/34 | Aa2 | 1,755 | 1,759,083 | ||||||
Structured Asset Securities Corp. | ||||||||||
Series 2005-RMS1, Class A3(h) | ||||||||||
| 4.679% | 02/25/35 | AAA(d) | 1,400 | 1,403,382 | ||||||
SVO VOI Mortgage Corp. | ||||||||||
Series 2005-AA, Class A(k) | ||||||||||
| 5.25% | 02/20/21 | Aaa | 1,205 | 1,204,660 | ||||||
Interest | Maturity Date | Moody’s Rating (Unaudited) | Principal Amount (000) | Value (Note 2) | ||||||
| LONG-TERM BONDS (Continued) | ||||||||||
Asset Backed Securities (cont’d.) | ||||||||||
WFS Financial Owner Trust | ||||||||||
Series 2004-4, Class D | ||||||||||
| 3.58% | 05/17/12 | Baa2 | $ | 1,246 | $ | 1,224,447 | ||||
| 42,632,563 | ||||||||||
Automotive — 0.1% | ||||||||||
Auburn Hills Trust, Inc. | ||||||||||
| 12.375% | 05/01/20 | A3 | 640 | 951,636 | ||||||
DaimlerChrysler NA Holding Corp. | ||||||||||
| 8.50% | 01/18/31 | A3 | 575 | 695,760 | ||||||
Equus Cayman Finance Ltd. | ||||||||||
| 5.50% | 09/12/08 | Baa3 | 410 | 411,079 | ||||||
General Motors Acceptance Corp. | ||||||||||
| 6.125% | 01/22/08 | Ba1 | 1,500 | 1,373,593 | ||||||
Hyundai Motor Manufacturing LLC(k) | ||||||||||
| 5.30% | 12/19/08 | Baa3 | 650 | 648,403 | ||||||
| 4,080,471 | ||||||||||
Banking — 0.8% | ||||||||||
Bank of America Corp.(b) | ||||||||||
| 4.75% | 08/01/15 | Aa2 | 2,185 | 2,119,085 | ||||||
Bank One Corp. | ||||||||||
| 7.875% | 08/01/10 | A1 | 2,500 | 2,775,325 | ||||||
Citigroup, Inc. | ||||||||||
| 5.00% | 09/15/14 | Aa2 | 513 | 504,974 | ||||||
| 5.625% | 08/27/12 | Aa2 | 1,900 | 1,958,353 | ||||||
| 6.00% | 10/31/33 | Aa2 | 745 | 779,134 | ||||||
| 6.625% | 06/15/32 | Aa2 | 1,290 | 1,457,685 | ||||||
Credit Suisse First Boston | ||||||||||
| 5.125% | 08/15/15 | Aa3 | 1,310 | 1,297,336 | ||||||
ICICI Bank Ltd. (Singapore)(k) | ||||||||||
| 5.75% | 11/16/10 | Baa3 | 1,350 | 1,356,305 | ||||||
J.P. Morgan Chase & Co. | ||||||||||
| 4.60% | 01/17/11 | Aa3 | 975 | 956,153 | ||||||
| 5.15% | 10/01/15 | A1 | 140 | 138,015 | ||||||
| 6.50% | 01/15/09 | A1 | 1,100 | 1,146,067 | ||||||
Mizuho Finance Group Ltd. | ||||||||||
| 5.79% | 04/15/14 | A2 | 1,060 | 1,095,060 | ||||||
Santander Central Hispano | ||||||||||
| 7.625% | 09/14/10 | A1 | 805 | 891,542 | ||||||
Wachovia Corp. | ||||||||||
| 7.80% | 08/18/10 | Aa3 | 2,230 | 2,503,021 | ||||||
Washington Mutual, Inc. | ||||||||||
| 5.65% | 08/15/14 | A3 | 270 | 273,423 | ||||||
Wells Fargo Bank | ||||||||||
| 5.125% | 09/15/16 | Aa2 | 290 | 287,754 | ||||||
| 6.45% | 02/01/11 | Aa1 | 2,300 | 2,451,188 | ||||||
Zions Bancorp. | ||||||||||
| 5.50% | 11/16/15 | Baa1 | 545 | 549,024 | ||||||
| 22,539,444 | ||||||||||
SEE NOTES TO FINANCIAL STATEMENTS.
B7
| CONSERVATIVE BALANCED PORTFOLIO (Continued) |
SCHEDULE OF INVESTMENTS | December 31, 2005 |
Interest | Maturity Date | Moody’s Rating (Unaudited) | Principal Amount (000) | Value (Note 2) | ||||||
| LONG-TERM BONDS (Continued) | ||||||||||
Brokerage — 0.3% | ||||||||||
Bear, Stearns & Co. | ||||||||||
| 5.30% | 10/30/15 | A1 | $ | 550 | $ | 548,777 | ||||
Goldman Sachs Group, Inc. (The) | ||||||||||
| 6.345% | 02/15/34 | A1 | 1,030 | 1,082,049 | ||||||
Lehman Brothers Holdings, Inc. | ||||||||||
| 4.80% | 03/13/14 | A1 | 120 | 117,167 | ||||||
| 6.625% | 01/18/12 | A1 | 1,800 | 1,943,402 | ||||||
Merrill Lynch & Co., Inc. | ||||||||||
| 4.25% | 02/08/10 | Aa3 | 1,470 | 1,429,904 | ||||||
| 4.79% | 08/04/10 | Aa3 | 375 | 370,782 | ||||||
| 5.00% | 01/15/15 | Aa3 | 460 | 453,091 | ||||||
| 5.45% | 07/15/14 | Aa3 | 200 | 203,268 | ||||||
Morgan Stanley Group, Inc. | ||||||||||
| 4.75% | 04/01/14 | A1 | 1,510 | 1,448,191 | ||||||
| 5.30% | 03/01/13 | Aa3 | 1,030 | 1,032,066 | ||||||
| 5.375% | 10/15/15 | Aa3 | 590 | 590,572 | ||||||
| 9,219,269 | ||||||||||
Building Materials & Construction — 0.1% | ||||||||||
American Standard, Inc.(b) | ||||||||||
| 7.625% | 02/15/10 | Baa3 | 1,000 | 1,074,877 | ||||||
Hanson PLC (United Kingdom) | ||||||||||
| 7.875% | 09/27/10 | Baa1 | 1,270 | 1,403,968 | ||||||
Ryland Group, Inc. | ||||||||||
| 5.375% | 06/01/08 | Baa3 | 575 | 574,687 | ||||||
| 3,053,532 | ||||||||||
Cable — 0.2% | ||||||||||
AT&T Broadband | ||||||||||
| 9.455% | 11/15/22 | Baa2 | 115 | 150,673 | ||||||
Comcast Corp.(b) | ||||||||||
| 5.65% | 06/15/35 | Baa2 | 635 | 584,287 | ||||||
| 6.50% | 11/15/35 | Baa2 | 640 | 652,196 | ||||||
Cox Communications, Inc.(b) | ||||||||||
| 6.75% | 03/15/11 | Baa3 | 1,195 | 1,249,621 | ||||||
Tele-Communications, Inc. | ||||||||||
| 9.875% | 06/15/22 | Baa2 | 1,440 | 1,955,116 | ||||||
| 4,591,893 | ||||||||||
Capital Goods — 0.5% | ||||||||||
Caterpillar, Inc. | ||||||||||
| 7.25% | 09/15/09 | A2 | 1,000 | 1,077,477 | ||||||
Cooper Cameron Corp. | ||||||||||
| 2.65% | 04/15/07 | Baa1 | 425 | 410,917 | ||||||
Erac USA Finance Co.(k) | ||||||||||
| 7.35% | 06/15/08 | Baa1 | 2,450 | 2,570,924 | ||||||
FedEx Corp. | ||||||||||
| 2.65% | 04/01/07 | Baa2 | 2,100 | 2,042,706 | ||||||
| 7.25% | 02/15/11 | Baa2 | 480 | 524,785 | ||||||
Honeywell International, Inc. | ||||||||||
| 6.125% | 11/01/11 | A2 | 1,120 | 1,182,203 | ||||||
Hutchison Whampoa International Ltd. (Cayman Islands)(k)(b) | ||||||||||
| 5.45% | 11/24/10 | A3 | 1,090 | 1,098,894 | ||||||
Tyco International Group SA (Luxembourg) | ||||||||||
| 6.00% | 11/15/13 | Baa3 | 1,530 | 1,562,874 | ||||||
Interest | Maturity Date | Moody’s Rating (Unaudited) | Principal Amount (000) | Value (Note 2) | ||||||
| LONG-TERM BONDS (Continued) | ||||||||||
Capital Goods (cont’d.) | ||||||||||
United Technologies Corp. | ||||||||||
| 6.35% | 03/01/11(f) | A2 | $ | 810 | $ | 863,253 | ||||
| 8.875% | 11/15/19 | A2 | 640 | 855,183 | ||||||
Waste Management, Inc. | ||||||||||
| 7.75% | 05/15/32 | Baa3 | 580 | 716,187 | ||||||
| 12,905,403 | ||||||||||
Chemicals — 0.4% | ||||||||||
Dow Chemical Co. | ||||||||||
| 5.97% | 01/15/09 | A3 | 430 | 443,815 | ||||||
| 6.125% | 02/01/11 | A3 | 690 | 722,511 | ||||||
| 7.375% | 11/01/29 | A3 | 670 | 807,230 | ||||||
Huntsman International LLC | ||||||||||
| 9.875% | 03/01/09 | B2 | 2,200 | 2,321,000 | ||||||
IMC Global, Inc. | ||||||||||
| 11.25% | 06/01/11 | Ba3 | 2,250 | 2,418,750 | ||||||
Lubrizol Corp. | ||||||||||
| 4.625% | 10/01/09 | Baa3 | 1,090 | 1,068,335 | ||||||
Lyondell Chemical Co. | ||||||||||
| 9.50% | 12/15/08 | B1 | 1,607 | 1,683,333 | ||||||
Monsanto Co., Series 1 | ||||||||||
| 5.50% | 07/30/35 | Baa1 | 635 | 606,452 | ||||||
| 10,071,426 | ||||||||||
Collateralized Mortgage Obligations — 0.4% | ||||||||||
Bank of America Mortgage Securities, Inc., | ||||||||||
Series 2005-A, Class 2A1 | ||||||||||
| 4.47% | 02/25/35(h) | Aaa | 1,661 | 1,632,274 | ||||||
Series 2005-B, Class 2A1 | ||||||||||
| 4.401% | 03/25/35(h) | Aaa | 1,666 | 1,634,498 | ||||||
Countrywide Alternative Loan Trust, Pass-Thru Certificates | ||||||||||
Series 2004-18CB, Class 3A1 | ||||||||||
| 5.25% | 09/25/19 | Aaa | 2,873 | 2,815,129 | ||||||
Master Alternative Loans Trust, Pass-Thru Certificates | ||||||||||
Series 2004-4, Class 4A1 | ||||||||||
| 5.00% | 04/25/19 | Aaa | 700 | 688,224 | ||||||
Structured Adjustable Rate Mortgage Loan | ||||||||||
Series 2004-1, Class 4A3(h) | ||||||||||
| 4.17% | 02/25/34 | Aaa | 1,938 | 1,912,133 | ||||||
Washington Mutual Alternative Loan Trust, Mortgage Pass-Through Certificates | ||||||||||
Series 2005-1, Class 3A | ||||||||||
| 5.00% | 03/25/20 | Aaa | 1,509 | 1,480,924 | ||||||
Washington Mutual, Inc., | ||||||||||
Series 2002-AR15, Class A-5(h) | ||||||||||
| 4.38% | 12/25/32 | Aaa | 907 | 894,401 | ||||||
| 11,057,583 | ||||||||||
Commercial Mortgage Backed Securities — 3.8% | ||||||||||
Banc of America Commercial Mortgage, Inc. | ||||||||||
Series 2003-2, Class A3 | ||||||||||
| 4.873% | 03/11/41 | AAA(d) | 3,350 | 3,298,610 | ||||||
Series 2004-2, Class A4 | ||||||||||
| 4.153% | 11/10/38 | Aaa | 3,680 | 3,511,035 | ||||||
SEE NOTES TO FINANCIAL STATEMENTS.
B8
| CONSERVATIVE BALANCED PORTFOLIO (Continued) |
SCHEDULE OF INVESTMENTS | December 31, 2005 |
Interest | Maturity Date | Moody’s Rating (Unaudited) | Principal Amount (000) | Value (Note 2) | ||||||
| LONG-TERM BONDS (Continued) | ||||||||||
Commercial Mortgage Backed Securities (cont’d.) | ||||||||||
Banc of America Commercial Mortgage, Inc. (cont’d.) | ||||||||||
Series 2004-3, Class A4 | ||||||||||
| 5.176% | 06/10/39 | Aaa | $ | 2,000 | $ | 2,002,442 | ||||
Series 2005-1, Class ASB | ||||||||||
| 4.86% | 11/10/42 | AAA(d) | 1,100 | 1,094,846 | ||||||
Series 2005-3, Class A4 | ||||||||||
| 4.668% | 07/10/43 | Aaa | 4,400 | 4,240,144 | ||||||
Series 2005-6, Class A4 | ||||||||||
| 5.182% | 09/10/47 | Aaa | 4,400 | 4,437,469 | ||||||
Bear Stearns Commercial Mortgage Securities | ||||||||||
Series 2004-T16, Class A6 | ||||||||||
| 4.75% | 02/13/46 | AAA(d) | 3,500 | 3,396,084 | ||||||
Series 2005-T18, Class AAB(h) | ||||||||||
| 4.823% | 02/13/42 | Aaa | 2,250 | 2,208,799 | ||||||
Series 2005-T20, Class AAB | ||||||||||
| 5.287% | 10/12/42 | Aaa | 3,000 | 3,011,602 | ||||||
Chase Commercial Mortgage Securities Corp. | ||||||||||
Series 1997-1, Class A2 | ||||||||||
| 7.37% | 06/19/29 | AAA(d) | 2,655 | 2,692,260 | ||||||
Commercial Mortgage Pass-Through Certificate | ||||||||||
Series 2004-LB2A, Class X2, IO(k) | ||||||||||
| 1.044% | 03/10/39 | Aaa | 17,980 | 608,536 | ||||||
Credit Suisse First Boston Mortgage | ||||||||||
Series 2004-C4, Class A4 | ||||||||||
| 4.283% | 10/15/39 | Aaa | 1,500 | 1,437,970 | ||||||
DLJ Commercial Mortgage Corp. | ||||||||||
Series 2000-CF1, Class A1B | ||||||||||
| 7.62% | 06/10/33 | AAA(d) | 3,200 | 3,492,652 | ||||||
GE Capital Commercial Mortgage Corporation | ||||||||||
Series 2005-C4, Class A4 | ||||||||||
| 5.333% | 11/10/45 | Aaa | 4,000 | 4,081,094 | ||||||
GE Commercial Mortgage Corp. | ||||||||||
Series 2004-C2, Class X2, IO(h)(k) | ||||||||||
| 0.639% | 03/10/40 | Aaa | 32,275 | 769,286 | ||||||
Greenwich Capital Commercial Funding Corp. | ||||||||||
Series 2003-C1, Class A-4 | ||||||||||
| 4.111% | 07/05/35 | Aaa | 5,000 | 4,695,901 | ||||||
Series 2003-C2, Class A3 | ||||||||||
| 4.533% | 01/05/36 | Aaa | 3,570 | 3,481,729 | ||||||
J.P. Morgan Chase Commercial Mortgage Securities Corp.,(h) | ||||||||||
| 5.179% | 12/15/44 | Aaa | 3,630 | 3,654,212 | ||||||
| 5.30% | 01/12/43 | Aaa | 2,800 | 2,837,591 | ||||||
J.P. Morgan Chase Commercial Mortgage Securities Corp., | ||||||||||
Series 2004-C2, Class A3(h) | ||||||||||
| 5.213% | 05/15/41 | Aaa | 6,228 | 6,271,932 | ||||||
Series 2005-LDA4, Class A4 | ||||||||||
| 4.918% | 10/15/42 | Aaa | 3,100 | 3,040,177 | ||||||
Series 2005-LDP2, Class ASB(h) | ||||||||||
| 4.659% | 07/15/42 | Aaa | 6,380 | 6,201,356 | ||||||
J.P. Morgan Commercial Mortgage Finance Corp. | ||||||||||
Series 2000-C10, Class A2 | ||||||||||
| 7.371% | 08/15/32 | Aaa | 6,500 | 6,993,729 | ||||||
| Keycorp. | ||||||||||
Series 2000-C1, Class A2 | ||||||||||
| 7.727% | 05/17/32 | Aaa | 11,180 | 12,149,414 | ||||||
Interest | Maturity Date | Moody’s Rating (Unaudited) | Principal Amount (000) | Value (Note 2) | ||||||
| LONG-TERM BONDS (Continued) | ||||||||||
Commercial Mortgage Backed Securities (cont’d.) | ||||||||||
LB-UBS Commercial Mortgage Trust | ||||||||||
Series 2003-C8, Class A-3 | ||||||||||
| 4.83% | 11/15/27 | Aaa | $ | 2,720 | $ | 2,682,179 | ||||
Series 2004-C6, Class A5 | ||||||||||
| 4.826% | 08/15/29 | AAA(d) | 5,000 | 4,910,773 | ||||||
Series 2005-C3, Class A5 | ||||||||||
| 4.739% | 07/15/30 | Aaa | 695 | 674,083 | ||||||
Merrill Lynch Mortgage Trust | ||||||||||
Series 2004-Key 2, Class A-3 | ||||||||||
| 4.615% | 08/12/39 | Aaa | 1,900 | 1,843,188 | ||||||
PNC Mortgage Acceptance Corp. | ||||||||||
Series 1999-CM1, Class A1B | ||||||||||
| 7.33% | 12/10/32 | AAA(d) | 3,860 | 4,138,314 | ||||||
Wachovia Bank Commercial Mortgage Trust | ||||||||||
Series 2002-Class 2 A4 | ||||||||||
| 4.98% | 11/15/34 | Aaa | 1,700 | 1,688,044 | ||||||
| 105,545,451 | ||||||||||
Consumer — 0.1% | ||||||||||
Cendant Corp. | ||||||||||
| 6.25% | 01/15/08 | Baa1 | 1,010 | 1,028,214 | ||||||
| 6.875% | 08/15/06 | Baa1 | 1,715 | 1,732,603 | ||||||
| 2,760,817 | ||||||||||
Electric — 0.9% | ||||||||||
Appalachian Power Co. | ||||||||||
| 4.40% | 06/01/10 | Baa2 | 790 | 766,665 | ||||||
Boston Edison Co. | ||||||||||
| 4.875% | 04/15/14 | A1 | 730 | 721,583 | ||||||
Carolina Power & Light Co. | ||||||||||
| 5.25% | 12/15/15 | A3 | 660 | 659,168 | ||||||
CenterPoint Energy Houston | ||||||||||
| 5.70% | 03/15/13 | Baa2 | 1,070 | 1,103,879 | ||||||
| 6.95% | 03/15/33 | Baa2 | 300 | 349,358 | ||||||
Consolidated Edison, Inc. | ||||||||||
| 5.375% | 12/15/15 | A1 | 820 | 831,896 | ||||||
Consumers Energy Co., First | ||||||||||
Series D | ||||||||||
| 5.375% | 04/15/13 | Baa3 | 435 | 431,838 | ||||||
Dominion Resources, Inc. | ||||||||||
| 5.125% | 12/15/09 | Baa1 | 1,255 | 1,251,332 | ||||||
Duke Capital LLC | ||||||||||
| 4.331% | 11/16/06 | Baa3 | 920 | 913,594 | ||||||
| 6.25% | 02/15/13 | Baa3 | 205 | 213,492 | ||||||
| 8.00% | 10/01/19 | Baa3 | 280 | 334,193 | ||||||
El Paso Electric Co. | ||||||||||
| 6.00% | 05/15/35 | Baa3 | 845 | 845,390 | ||||||
Empresa Nacional de Electricidad S.A. (Chile) | ||||||||||
| 8.50% | 04/01/09 | Ba1 | 1,350 | 1,472,361 | ||||||
Energy East Corp. | ||||||||||
| 6.75% | 09/15/33 | Baa2 | 805 | 886,422 | ||||||
Exelon Corp. | ||||||||||
| 4.90% | 06/15/15 | Baa2 | 195 | 186,105 | ||||||
FirstEnergy Corp. | ||||||||||
| 7.375% | 11/15/31 | Baa3 | 860 | 1,014,774 | ||||||
SEE NOTES TO FINANCIAL STATEMENTS.
B9
| CONSERVATIVE BALANCED PORTFOLIO (Continued) |
SCHEDULE OF INVESTMENTS | December 31, 2005 |
Interest | Maturity Date | Moody’s Rating (Unaudited) | Principal Amount (000) | Value (Note 2) | ||||||
| LONG-TERM BONDS (Continued) | ||||||||||
Electric (cont’d.) | ||||||||||
Florida Power & Light Co. | ||||||||||
| 5.95% | 10/01/33 | Aa3 | $ | 380 | $ | 400,460 | ||||
Indiana Michigan Power Co. | ||||||||||
| 5.05% | 11/15/14 | Baa2 | 575 | 559,123 | ||||||
Natural Rural Utilities Cooperative | ||||||||||
| 7.25% | 03/01/12 | A2 | 135 | 150,564 | ||||||
NiSource Finance Corp. | ||||||||||
| 5.45% | 09/15/20 | Baa3 | 1,760 | 1,705,303 | ||||||
Oncor Electric Delivery Co. | ||||||||||
| 6.375% | 01/15/15 | Baa2 | 465 | 493,434 | ||||||
| 7.00% | 09/01/22 | Baa2 | 545 | 605,755 | ||||||
| 7.25% | 01/15/33 | Baa2 | 240 | 281,101 | ||||||
Pacific Gas & Electric Co. | ||||||||||
| 6.05% | 03/01/34 | Baa1 | 2,330 | 2,411,454 | ||||||
Pepco Holdings, Inc. | ||||||||||
| 5.50% | 08/15/07 | Baa2 | 735 | 739,448 | ||||||
PPL Electric Utilities Corp. | ||||||||||
| 6.25% | 08/15/09 | Baa1 | 1,900 | 1,973,838 | ||||||
Progress Energy, Inc. | ||||||||||
| 6.75% | 03/01/06 | Baa2 | 1,825 | 1,830,637 | ||||||
Southern California Edison Co. | ||||||||||
| 4.65% | 04/01/15 | A3 | 610 | 590,105 | ||||||
Xcel Energy, Inc. | ||||||||||
| 3.40% | 07/01/08 | Baa1 | 785 | 756,528 | ||||||
| 7.00% | 12/01/10 | Baa1 | 250 | 269,058 | ||||||
| 24,748,858 | ||||||||||
Energy – Integrated — 0.1% | ||||||||||
Conoco, Inc. | ||||||||||
| 6.95% | 04/15/29 | A1 | 655 | 790,521 | ||||||
Marathon Oil Corp. | ||||||||||
| 6.125% | 03/15/12 | Baa1 | 390 | 413,547 | ||||||
Phillips Petroleum Co. | ||||||||||
| 8.75% | 05/25/10 | A1 | 1,900 | 2,185,574 | ||||||
| 3,389,642 | ||||||||||
Energy – Other — 0.4% | ||||||||||
BJ Services Co. | ||||||||||
| 7.00% | 02/01/06 | Baa1 | 4,000 | 4,005,607 | ||||||
Devon Energy Corp. | ||||||||||
| 2.75% | 08/01/06 | Baa2 | 2,810 | 2,771,908 | ||||||
Halliburton Co. | ||||||||||
| 5.50% | 10/15/10 | Baa1 | 200 | 204,272 | ||||||
Occidental Petroleum Corp.(b) | ||||||||||
| 6.75% | 01/15/12 | A3 | 1,555 | 1,706,766 | ||||||
Talisman Energy, Inc. | ||||||||||
| 5.125% | 05/15/15 | Baa1 | 750 | 743,305 | ||||||
Valero Energy Corp. | ||||||||||
| 7.50% | 04/15/32 | Baa3 | 185 | 224,829 | ||||||
Woodside Finance Ltd. (Australia)(k) | ||||||||||
| 5.00% | 11/15/13 | Baa1 | 1,660 | 1,659,225 | ||||||
| 11,315,912 | ||||||||||
Foods — 0.5% | ||||||||||
Albertson’s, Inc. | ||||||||||
| 7.45% | 08/01/29 | Baa3 | 220 | 203,958 | ||||||
Interest | Maturity Date | Moody’s Rating (Unaudited) | Principal Amount (000) | Value (Note 2) | ||||||
| LONG-TERM BONDS (Continued) | ||||||||||
Foods (cont’d.) | ||||||||||
Archer Daniels Midland Co. | ||||||||||
| 8.125% | 06/01/12 | A2 | $ | 195 | $ | 227,358 | ||||
Cadbury Schweppes American Finance, Inc.(k) | ||||||||||
| 3.875% | 10/01/08 | Baa2 | 1,050 | 1,019,677 | ||||||
ConAgra Foods, Inc. | ||||||||||
| 7.875% | 09/15/10 | Baa1 | 865 | 953,007 | ||||||
General Mills, Inc. | ||||||||||
| 5.125% | 02/15/07 | Baa2 | 500 | 499,571 | ||||||
HJ Heinz Co., Notes(k) | ||||||||||
| 6.428% | 12/01/20 | Baa1 | 1,620 | 1,664,177 | ||||||
Kellogg Co. | ||||||||||
| 6.60% | 04/01/11 | Baa1 | 2,285 | 2,446,299 | ||||||
Kraft Foods, Inc. | ||||||||||
| 4.625% | 11/01/06 | A3 | 1,405 | 1,400,585 | ||||||
| 5.25% | 06/01/07 | A3 | 400 | 401,624 | ||||||
| 5.625% | 11/01/11 | A3 | 965 | 990,087 | ||||||
Kroger Co. (The) | ||||||||||
| 6.75% | 04/15/12 | Baa2 | 310 | 326,010 | ||||||
| 6.80% | 04/01/11 | Baa2 | 575 | 603,035 | ||||||
PepsiAmericas, Inc. | ||||||||||
| 4.875% | 01/15/15 | Baa1 | 620 | 611,243 | ||||||
Safeway, Inc. | ||||||||||
| 7.25% | 02/01/31 | Baa2 | 175 | 188,839 | ||||||
Tricon Global Restaurants, Inc. | ||||||||||
| 8.875% | 04/15/11 | Baa3 | 235 | 269,056 | ||||||
Tyson Foods, Inc. | ||||||||||
| 7.25% | 10/01/06 | Baa3 | 525 | 533,407 | ||||||
| 8.25% | 10/01/11 | Baa3 | 110 | 124,196 | ||||||
| 12,462,129 | ||||||||||
Foreign Government Bonds — 0.3% | ||||||||||
Deutsche Telekom International | ||||||||||
| 8.25% | 06/15/30 | A3 | 345 | 438,795 | ||||||
Export-Import Bank of Korea | ||||||||||
| 4.125% | 02/10/09 | A3 | 1,120 | 1,090,999 | ||||||
Korea Development Bank (South Korea)(b) | ||||||||||
| 4.75% | 07/20/09 | A3 | 1,530 | 1,516,859 | ||||||
Mexican UT | ||||||||||
| 8.125% | 12/30/19 | Baa1 | 1,830 | 2,246,324 | ||||||
Pemex Project Funding Master Trust, | ||||||||||
| 10.00% | 09/15/27 | Baa1 | 1,025 | 1,365,813 | ||||||
Petrobras International Finance Co. (PIFCO) | ||||||||||
| 9.75% | 07/06/11 | Baa1 | 280 | 329,000 | ||||||
Province of Quebec (Canada)(b) | ||||||||||
| 4.60% | 05/26/15 | A1 | 1,585 | 1,546,446 | ||||||
| 8,534,236 | ||||||||||
Gaming — 0.1% | ||||||||||
Harrah’s Operating Co., Inc. | ||||||||||
| 5.50% | 07/01/10 | Baa3 | 970 | 969,611 | ||||||
| 5.75% | 10/01/17 | Baa3 | 1,135 | 1,104,691 | ||||||
| 7.125% | 06/01/07 | Baa3 | 365 | 374,262 | ||||||
SEE NOTES TO FINANCIAL STATEMENTS.
B10
| CONSERVATIVE BALANCED PORTFOLIO (Continued) |
SCHEDULE OF INVESTMENTS | December 31, 2005 |
Interest | Maturity Date | Moody’s Rating (Unaudited) | Principal Amount (000) | Value (Note 2) | ||||||
| LONG-TERM BONDS (Continued) | ||||||||||
Gaming (cont’d.) | ||||||||||
Mandalay Resort Group | ||||||||||
| 9.375% | 02/15/10 | Ba3 | $ | 12 | $ | 13,140 | ||||
| 2,461,704 | ||||||||||
Health Care & Pharmaceutical — 0.5% | ||||||||||
Baxter International, Inc. | ||||||||||
| 5.196% | 02/16/08 | Baa1 | 1,085 | 1,088,192 | ||||||
Bristol-Myers Squibb Co. | ||||||||||
| 5.75% | 10/01/11 | A1 | 460 | 475,078 | ||||||
Cardinal Health, Inc. | ||||||||||
| 5.85% | 12/15/17 | Baa3 | 1,475 | 1,500,315 | ||||||
Genentech, Inc. | ||||||||||
| 4.75% | 07/15/15 | A1 | 920 | 895,247 | ||||||
Laboratory Corp. of America Holdings | ||||||||||
| 5.625% | 12/15/15 | Baa3 | 925 | 937,264 | ||||||
Merck & Co., Inc. | ||||||||||
| 5.95% | 12/01/28 | Aa3 | 205 | 210,233 | ||||||
Pharmacia Corp. | ||||||||||
| 6.75% | 12/15/27 | Aaa | 230 | 270,290 | ||||||
Schering-Plough Corp. | ||||||||||
| 5.55% | 12/01/13 | Baa1 | 1,860 | 1,894,903 | ||||||
WellPoint, Inc. | ||||||||||
| 3.50% | 09/01/07 | Baa1 | 1,970 | 1,921,709 | ||||||
| 5.00% | 12/15/14 | Baa1 | 1,085 | 1,065,800 | ||||||
| 5.95% | 12/15/34 | Baa1 | 210 | 216,483 | ||||||
Wyeth | ||||||||||
| 5.50% | 03/15/13-02/01/14 | Baa1 | 2,295 | 2,326,089 | ||||||
| 6.45% | 02/01/24(f) | Baa1 | 615 | 665,129 | ||||||
| 13,466,732 | ||||||||||
Insurance — 0.3% | ||||||||||
Allstate Corp. (The) | ||||||||||
| 5.55% | 05/09/35 | A1 | 830 | 813,369 | ||||||
American International Group, Inc. | ||||||||||
| 4.25% | 05/15/13 | Aa2 | 1,355 | 1,288,780 | ||||||
| 5.05% | 10/01/15 | Aa2 | 125 | 122,679 | ||||||
AXA (France) | ||||||||||
| 8.60% | 12/15/30 | A3 | 230 | 307,359 | ||||||
Everest Reinsurance Holdings (Bermuda) | ||||||||||
| 5.40% | 10/15/14 | A3 | 780 | 769,249 | ||||||
Liberty Mutual Group(k)(b) | ||||||||||
| 7.00% | 03/15/34 | Baa3 | 910 | 938,392 | ||||||
Marsh & McLennan Cos., Inc. | ||||||||||
| 5.15% | 09/15/10 | Baa2 | 335 | 332,772 | ||||||
MetLife, Inc. | ||||||||||
| 5.70% | 06/15/35 | A2 | 1,185 | 1,189,389 | ||||||
| 6.125% | 12/01/11 | A2 | 435 | 460,952 | ||||||
| 6.375% | 06/15/34 | A2 | 85 | 93,093 | ||||||
W.R. Berkley Corp. | ||||||||||
| 5.60% | 05/15/15 | Baa2 | 705 | 702,916 | ||||||
| 6.15% | 08/15/19 | Baa2 | 575 | 578,651 | ||||||
XL Capital Ltd. (Cayman Islands) | ||||||||||
| 5.25% | 09/15/14 | A3 | 110 | 107,369 | ||||||
| 7,704,970 | ||||||||||
Interest | Maturity Date | Moody’s Rating (Unaudited) | Principal Amount (000) | Value (Note 2) | ||||||
| LONG-TERM BONDS (Continued) | ||||||||||
Lodging — 0.2% | ||||||||||
Carnival Corp. (Panama) | ||||||||||
| 3.75% | 11/15/07 | A3 | $ | 2,845 | $ | 2,781,056 | ||||
P&O Princess | ||||||||||
| 7.30% | 06/01/07 | A3 | 345 | 355,240 | ||||||
Royal Caribbean Cruises Ltd. | ||||||||||
| 8.00% | 05/15/10 | Ba1 | 2,220 | 2,411,180 | ||||||
| 5,547,476 | ||||||||||
Media & Entertainment — 0.3% | ||||||||||
British Sky Broadcasting Group PLC (United Kingdom) | ||||||||||
| 7.30% | 10/15/06 | Baa2 | 785 | 797,702 | ||||||
CBS Corp. | ||||||||||
| 7.875% | 07/30/30 | Baa3 | 470 | 536,686 | ||||||
Chancellor Media Corp. | ||||||||||
| 8.00% | 11/01/08 | Baa3 | 745 | 792,047 | ||||||
Clear Channel Communications, Inc. | ||||||||||
| 7.65% | 09/15/10 | Baa3 | 200 | 214,085 | ||||||
News America Holdings, Inc. | ||||||||||
| 7.625% | 11/30/28 | Baa2 | 1,360 | 1,542,239 | ||||||
Time Warner, Inc. | ||||||||||
| 6.75% | 04/15/11 | Baa1 | 1,970 | 2,068,676 | ||||||
| 7.25% | 10/15/17 | Baa1 | 1,040 | 1,136,927 | ||||||
| 7.70% | 05/01/32 | Baa1 | 680 | 764,768 | ||||||
Walt Disney Co. (The) | ||||||||||
| 5.375% | 06/01/07 | Baa1 | 300 | 301,894 | ||||||
| 6.75% | 03/30/06 | Baa1 | 1,365 | 1,371,508 | ||||||
| 9,526,532 | ||||||||||
Metals | ||||||||||
Alcan, Inc. (Canada) | ||||||||||
| 5.00% | 06/01/15 | Baa1 | 755 | 732,375 | ||||||
| 5.20% | 01/15/14 | Baa1 | 230 | 227,473 | ||||||
| 6.125% | 12/15/33 | Baa1 | 105 | 107,484 | ||||||
| 1,067,332 | ||||||||||
Municipals — 0.1% | ||||||||||
Illinois St. Taxable Pension, G.O. | ||||||||||
| 5.10% | 06/01/33 | Aa3 | 2,600 | 2,555,592 | ||||||
Non Captive Finance — 0.5% | ||||||||||
Berkshire Hathaway, Inc.(k) | ||||||||||
| 4.75% | 05/15/12 | Aaa | 945 | 934,170 | ||||||
Capital One Bank | ||||||||||
| 6.50% | 06/13/13(g) | Baa1 | 10 | 10,624 | ||||||
| 6.875% | 02/01/06 | A3 | 2,040 | 2,043,711 | ||||||
Capital One Financial Corp. | ||||||||||
| 5.50% | 06/01/15 | Baa1 | 275 | 273,391 | ||||||
CIT Group Co. of Canada(k) | ||||||||||
| 5.45% | 06/01/15 | A2 | 1,325 | 1,309,647 | ||||||
CIT Group, Inc. | ||||||||||
| 4.25% | 02/01/10 | A2 | 480 | 467,026 | ||||||
| 5.50% | 11/30/07 | A2 | 1,285 | 1,297,617 | ||||||
General Electric Capital Corp. | ||||||||||
| 6.125% | 02/22/11 | Aaa | 390 | 410,300 | ||||||
| 6.75% | 03/15/32 | Aaa | 2,500 | 2,934,629 | ||||||
SEE NOTES TO FINANCIAL STATEMENTS.
B11
| CONSERVATIVE BALANCED PORTFOLIO (Continued) |
SCHEDULE OF INVESTMENTS | December 31, 2005 |
Interest | Maturity Date | Moody’s Rating (Unaudited) | Principal Amount (000) | Value (Note 2) | ||||||
| LONG-TERM BONDS (Continued) | ||||||||||
Non Captive Finance (cont’d.) | ||||||||||
Household Finance Corp. | ||||||||||
| 4.75% | 05/15/09 | A1 | $ | 640 | $ | 633,018 | ||||
| 6.375% | 10/15/11 | A1 | 1,080 | 1,141,643 | ||||||
| 7.00% | 05/15/12 | A1 | 795 | 869,627 | ||||||
HSBC Finance Corp. | ||||||||||
| 6.75% | 05/15/11 | A1 | 570 | 611,707 | ||||||
International Lease Finance Corp. | ||||||||||
| 3.50% | 04/01/09 | A1 | 750 | 713,897 | ||||||
Residential Capital Corp.(k) | ||||||||||
| 6.375% | 06/30/10 | Baa3 | 610 | 619,830 | ||||||
| 14,270,837 | ||||||||||
Oil & Gas Exploration Services — 0.1% | ||||||||||
Devon Energy Corp. | ||||||||||
| 7.875% | 09/30/31 | Baa2 | 280 | 355,796 | ||||||
Oil & Gas Exploration Services (cont’d.) | ||||||||||
Encana Corp. | ||||||||||
| 6.50% | 08/15/34 | Baa2 | 255 | 284,926 | ||||||
Kerr-McGee Corp. | ||||||||||
| 5.875% | 09/15/06 | Ba3 | 1,305 | 1,309,525 | ||||||
| 1,950,247 | ||||||||||
Paper | ||||||||||
Weyerhaeuser Co.(b) | ||||||||||
| 7.375% | 03/15/32 | Baa2 | 820 | 911,601 | ||||||
Pipelines & Other — 0.3% | ||||||||||
Atmos Energy Corp. | ||||||||||
| 4.00% | 10/15/09 | Baa3 | 1,605 | 1,539,232 | ||||||
Duke Energy Field Services Corp. | ||||||||||
| 7.875% | 08/16/10 | Baa2 | 1,355 | 1,498,551 | ||||||
Enbridge, Inc. | ||||||||||
| 4.90% | 03/01/15 | A3 | 630 | 619,657 | ||||||
Enterprise Products Operating LP | ||||||||||
| 4.00% | 10/15/07 | Baa3 | 1,000 | 979,104 | ||||||
| 6.875% | 03/01/33 | Baa3 | 710 | 752,139 | ||||||
Kinder Morgan Finance Co. ULC(k) | ||||||||||
| 6.40% | 01/05/36 | Baa2 | 486 | 498,093 | ||||||
Oneok, Inc. | ||||||||||
| 5.51% | 02/16/08 | Baa2 | 1,630 | 1,636,442 | ||||||
Sempra Energy | ||||||||||
| 4.621% | 05/17/07 | Baa1 | 790 | 784,401 | ||||||
| 8,307,619 | ||||||||||
Railroads — 0.1% | ||||||||||
Burlington Northern Santa Fe Corp. | ||||||||||
| 7.95% | 08/15/30 | Baa2 | 1,020 | 1,334,688 | ||||||
Norfolk Southern Corp. | ||||||||||
| 5.64% | 05/17/29 | Baa1 | 571 | 573,632 | ||||||
| 7.80% | 05/15/27 | Baa1 | 24 | 30,409 | ||||||
Union Pacific Corp. | ||||||||||
| 6.625% | 02/01/08 | Baa2 | 1,755 | 1,812,549 | ||||||
| 3,751,278 | ||||||||||
Real Estate Investment Trust — 0.1% | ||||||||||
ERP Operating LP | ||||||||||
| 5.125% | 03/15/16 | Baa1 | 430 | 414,161 | ||||||
Interest | Maturity Date | Moody’s Rating (Unaudited) | Principal Amount (000) | Value (Note 2) | ||||||
| LONG-TERM BONDS (Continued) | ||||||||||
Real Estate Investment Trust (cont’d.) | ||||||||||
Mack-Cali Realty Corp. | ||||||||||
| 7.25% | 03/15/09 | Baa2 | $ | 1,595 | $ | 1,682,589 | ||||
Post Apartment Homes LP | ||||||||||
| 5.45% | 06/01/12 | Baa3 | 545 | 534,903 | ||||||
| 2,631,653 | ||||||||||
Retailers — 0.2% | ||||||||||
Gap, Inc. (The) | ||||||||||
| 6.90% | 09/15/07 | Baa3 | 1,550 | 1,583,791 | ||||||
May Department Stores Co. | ||||||||||
| 6.65% | 07/15/24 | Baa1 | 545 | 573,014 | ||||||
| 6.70% | 07/15/34 | Baa1 | 625 | 665,683 | ||||||
| 8.50% | 06/01/19 | Baa1 | 285 | 345,526 | ||||||
Wal-Mart Stores, Inc. | ||||||||||
| 5.25% | 09/01/35 | Aa2 | 1,605 | 1,557,935 | ||||||
| 4,725,949 | ||||||||||
Sovereign — 0.2% | ||||||||||
Republic of Italy | ||||||||||
| 5.375% | 06/15/33 | Aa2 | 1,080 | 1,100,109 | ||||||
Republic of Malaysia | ||||||||||
| 7.50% | 07/15/11 | A3 | 375 | 419,651 | ||||||
Republic of South Africa | ||||||||||
| 6.50% | 06/02/14 | Baa1 | 520 | 562,250 | ||||||
United Mexican States | ||||||||||
| 8.375% | 01/14/11 | Baa1 | 1,920 | 2,188,799 | ||||||
| 4,270,809 | ||||||||||
Technology — 0.3% | ||||||||||
Computer Associates International, Inc.(k) | ||||||||||
| 4.75% | 12/01/09 | Ba1 | 1,450 | 1,413,920 | ||||||
Equifax, Inc. | ||||||||||
| 4.95% | 11/01/07 | Baa1 | 475 | 474,702 | ||||||
First Data Corp. | ||||||||||
| 4.85% | 10/01/14 | A1 | 580 | 549,426 | ||||||
International Business Machines Corp. | ||||||||||
| 5.875% | 11/29/32 | A1 | 575 | 605,059 | ||||||
Jabil Circuit, Inc. | ||||||||||
| 5.875% | 07/15/10 | Baa3 | 1,000 | 1,015,630 | ||||||
Motorola, Inc. | ||||||||||
| 4.608% | 11/16/07 | Baa2 | 1,220 | 1,212,377 | ||||||
| 7.625% | 11/15/10 | Baa2 | 155 | 172,303 | ||||||
Seagate Technology International | ||||||||||
| 8.00% | 05/15/09 | Ba2 | 1,545 | 1,622,250 | ||||||
| 7,065,667 | ||||||||||
Telecommunications — 1.1% | ||||||||||
ALLTEL Ohio LP(k) | ||||||||||
| 8.00% | 08/15/10 | A2 | 860 | 956,900 | ||||||
AT&T Corp.(b) | ||||||||||
| 9.75% | 11/15/31 | A2 | 760 | 954,654 | ||||||
AT&T Wireless Services, Inc. | ||||||||||
| 7.35% | 03/01/06 | Baa2 | 2,245 | 2,254,299 | ||||||
| 8.125% | 05/01/12 | Baa2 | 800 | 924,342 | ||||||
| 8.75% | 03/01/31 | Baa2 | 705 | 933,997 | ||||||
BellSouth Corp. | ||||||||||
| 4.20% | 09/15/09 | A2 | 1,365 | 1,325,941 | ||||||
SEE NOTES TO FINANCIAL STATEMENTS.
B12
| CONSERVATIVE BALANCED PORTFOLIO (Continued) |
SCHEDULE OF INVESTMENTS | December 31, 2005 |
Interest | Maturity Date | Moody’s Rating (Unaudited) | Principal Amount (000) | Value (Note 2) | |||||||
| LONG-TERM BONDS (Continued) | |||||||||||
Telecommunications (cont’d.) |
| ||||||||||
British Telecommunications PLC (United Kingdom) | |||||||||||
| 7.00% | 05/23/07 | Baa1 | $ | 1,400 | $ | 1,436,429 | |||||
| 8.875% | 12/15/30(f) | Baa1 | 245 | 327,796 | |||||||
CenturyTel, Inc. |
| ||||||||||
| 7.875% | 08/15/12 | Baa2 | 165 | 181,985 | |||||||
Cingular Wireless LLC |
| ||||||||||
| 7.125% | 12/15/31 | Baa2 | 535 | 612,406 | |||||||
Citizens Communications Co., |
| ||||||||||
| 7.60% | 06/01/06 | Ba3 | 1,420 | 1,435,975 | |||||||
France Telecom SA (France) |
| ||||||||||
| 8.50% | 03/01/31 | A3 | 385 | 513,690 | |||||||
Nextel Communications, Inc.(b) |
| ||||||||||
| 5.95% | 03/15/14 | Baa2 | 1,475 | 1,482,726 | |||||||
Royal KPN N.V. (Netherlands) |
| ||||||||||
| 8.00% | 10/01/10 | Baa1 | 645 | 708,371 | |||||||
SBC Communications, Inc. |
| ||||||||||
| 4.125% | 09/15/09 | A2 | 1,335 | 1,289,107 | |||||||
| 5.30% | 11/15/10 | A2 | 1,180 | 1,183,575 | |||||||
Sprint Capital Corp. |
| ||||||||||
| 6.875% | 11/15/28 | Baa2 | 1,920 | 2,097,965 | |||||||
| 8.75% | 03/15/32 | Baa2 | 220 | 291,958 | |||||||
Telecom de Puerto Rico, Inc. (Puerto Rico) |
| ||||||||||
| 6.80% | 05/15/09 | Baa1 | 2,220 | 2,306,786 | |||||||
Telecom Italia Finance (Luxembourg) |
| ||||||||||
| 5.25% | 11/15/13 | Baa2 | 170 | 166,817 | |||||||
| 6.00% | 09/30/34 | Baa2 | 945 | (b) | 910,370 | ||||||
Telecomunicaciones de Puerto Rico, Inc. (Puerto Rico) | |||||||||||
| 6.65% | 05/15/06 | Baa1 | 4,500 | 4,525,128 | |||||||
TELUS Corp. (Cananda) | |||||||||||
| 8.00% | 06/01/11 | Baa2 | 1,500 | 1,681,590 | |||||||
US Cellular Corp. |
| ||||||||||
| 6.70% | 12/15/33 | Baa3 | 600 | 589,121 | |||||||
Verizon Global Funding Corp. |
| ||||||||||
| 5.85% | 09/15/35 | A3 | 255 | 245,736 | |||||||
| 7.75% | 12/01/30 | A3 | 450 | 534,896 | |||||||
Vodafone Group PLC (United Kingdom) |
| ||||||||||
| 7.75% | 02/15/10 | A2 | 950 | 1,040,503 | |||||||
| 30,913,063 | |||||||||||
Tobacco |
| ||||||||||
Altria Group, Inc. |
| ||||||||||
| 7.65% | 07/01/08 | Baa2 | 765 | 810,237 | |||||||
| 7.75% | 01/15/27 | Baa2 | 370 | 439,253 | |||||||
| 1,249,490 | |||||||||||
Transportation |
| ||||||||||
BNSF Funding Trust I(h) |
| ||||||||||
| 6.613% | 12/15/55 | Ba1 | 1,160 | 1,207,569 | |||||||
Mortgage Backed Securities — 12.0% |
| ||||||||||
Federal Home Loan Mortgage Corp. |
| ||||||||||
| 4.50% | 11/01/18-07/01/20 | 9,845 | 9,591,807 | ||||||||
| 5.00% | 06/01/18-05/01/34 | 18,107 | 17,832,206 | ||||||||
| 5.50% | 12/01/33-07/01/34 | 14,594 | 14,480,917 | ||||||||
| 6.00% | 03/01/32-12/01/33 | 4,436 | 4,494,305 | ||||||||
| 6.50% | 05/01/14-04/01/15 | 1,211 | 1,242,990 | ||||||||
Interest | Maturity Date | Moody’s Rating (Unaudited) | Principal Amount (000) | Value (Note 2) | ||||||
| LONG-TERM BONDS (Continued) | ||||||||||
Mortgage Backed Securities (cont’d.) | ||||||||||
Federal Home Loan Mortgage Corp. | ||||||||||
| 7.00% | 05/01/31-09/01/33 | $ | 8,919 | $ | 9,292,885 | |||||
| 5.00% | TBA | 4,000 | 3,871,248 | |||||||
| 6.00% | TBA | 7,000 | 7,067,816 | |||||||
Federal National Mortgage Association | ||||||||||
| 4.00% | 06/01/19 | 3,365 | 3,217,186 | |||||||
| 4.50% | 10/15/08-01/01/35 | 21,617 | 20,867,809 | |||||||
| 4.988% | 07/01/33 | 1,631 | 1,637,825 | |||||||
| 5.00% | 10/01/18-03/01/34 | 63,310 | 61,661,995 | |||||||
| 5.50% | 03/01/16-10/01/35 | 71,453 | 70,964,898 | |||||||
| 6.00% | 04/01/13-03/01/35 | 35,863 | 36,265,488 | |||||||
| 6.50% | 07/01/17-10/01/34 | 8,871 | 9,109,163 | |||||||
| 7.00% | 08/01/11-07/01/32 | 2,429 | 2,540,673 | |||||||
| 7.50% | 05/01/12-05/01/32 | 1,973 | 2,071,540 | |||||||
Federal National Mortgage Association | ||||||||||
| 4.50% | TBA | 4,000 | 3,891,248 | |||||||
| 5.00% | TBA | 3,500 | 3,451,561 | |||||||
| 5.50% | TBA | 14,000 | 13,875,937 | |||||||
| 6.00% | TBA | 11,500 | 11,677,341 | |||||||
| 6.50% | TBA | 1,000 | 1,025,625 | |||||||
Government National Mortgage Association | ||||||||||
| 5.50% | 08/15/33-03/15/34 | 2,768 | 2,789,458 | |||||||
| 6.00% | 04/15/33-06/20/34 | 4,150 | 4,246,882 | |||||||
| 6.50% | 10/15/23-06/15/35 | 10,481 | 10,959,998 | |||||||
| 7.00% | 09/15/31 | 324 | 340,406 | |||||||
| 8.00% | 01/15/24-04/15/25 | 261 | 278,722 | |||||||
| 328,747,929 | ||||||||||
U.S. Government Agency Obligations — 2.7% | ||||||||||
Federal Farm Credit Bank | ||||||||||
| 4.125% | 07/17/09 | 1,230 | 1,205,278 | |||||||
Federal Home Loan Bank | ||||||||||
| 3.75% | 08/18/09 | 3,935 | 3,806,813 | |||||||
| 4.25% | 04/16/07 | 15,950 | 15,847,889 | |||||||
Federal Home Loan Mortgage Corp. | ||||||||||
| 4.75% | 01/18/11 | 3,035 | 3,033,428 | |||||||
| 4.90% | 11/03/08 | 7,630 | 7,603,806 | |||||||
Federal National Mortgage Association | ||||||||||
| 4.25% | 07/27/07-05/15/09(b) | 25,466 | 25,131,603 | |||||||
| 4.50% | 10/15/08 | 5,632 | 5,600,759 | |||||||
| 4.75% | 12/15/10 | 1,610 | 1,610,018 | |||||||
| 5.25% | 08/01/12 | 8,475 | 8,556,292 | |||||||
Tennessee Valley Authority, Series B | ||||||||||
| 5.88% | 04/01/36 | 1,305 | 1,482,558 | |||||||
| 73,878,444 | ||||||||||
U.S. Treasury Securities — 5.2% | ||||||||||
United States Treasury Bonds | ||||||||||
| 5.375% | 02/15/31(b) | 2,596 | 2,916,037 | |||||||
| 6.00% | 02/15/26(b) | 7,805 | 9,203,805 | |||||||
| 6.125% | 08/15/29 | 1,230 | 1,498,246 | |||||||
| 8.125% | 05/15/21(b) | 3,160 | 4,374,748 | |||||||
| 9.00% | 11/15/18(b) | 5,372 | 7,680,284 | |||||||
| 9.125% | 05/15/18 | 462 | 660,696 | |||||||
| 9.25% | 02/15/16 | 815 | 1,129,443 | |||||||
SEE NOTES TO FINANCIAL STATEMENTS.
B13
| CONSERVATIVE BALANCED PORTFOLIO (Continued) |
SCHEDULE OF INVESTMENTS | December 31, 2005 |
Interest | Maturity Date | Moody’s Rating (Unaudited) | Principal Amount (000) | Value (Note 2) | ||||||
| LONG-TERM BONDS (Continued) | ||||||||||
U.S. Treasury Securities (cont’d.) | ||||||||||
United States Treasury Inflation Index Bonds | ||||||||||
| 2.375% | 01/15/25 | $ | 7,970 | $ | 8,377,080 | |||||
| 3.375% | 04/15/32 | 1,626 | 2,114,651 | |||||||
| 3.625% | 01/15/08 | 5,543 | 5,691,577 | |||||||
United States Treasury Inflation Index | ||||||||||
| 0.875% | 04/15/10 | 8,928 | 8,487,909 | |||||||
| 1.625% | 01/15/15 | 5,992 | 5,773,030 | |||||||
| 1.875% | 07/15/13 | 6,501 | 6,411,882 | |||||||
| 1.875% | 07/15/15 | 6,656 | 6,545,869 | |||||||
| 2.00% | 01/15/14 | 6,785 | 6,746,419 | |||||||
| 2.00% | 07/15/14 | 6,123 | 6,088,799 | |||||||
| 3.00% | 07/15/12 | 7,028 | 7,430,868 | |||||||
| 3.375% | 01/15/07 | 5,401 | 5,440,420 | |||||||
| 3.375% | 01/15/12 | 2,045 | 2,199,192 | |||||||
| 3.50% | 01/15/11 | 3,716 | 3,971,320 | |||||||
| 3.625% | 04/15/28 | 5,352 | 6,903,997 | |||||||
| 3.875% | 01/15/09-04/15/29 | 11,330 | 13,768,081 | |||||||
| 4.25% | 01/15/10(b) | 3,667 | 3,974,774 | |||||||
United States Treasury Strips(b) | ||||||||||
| Zero | 05/15/18-05/15/19 | 28,140 | 15,272,930 | |||||||
| 142,662,057 | ||||||||||
Structured Notes — 0.1% | ||||||||||
Dow Jones CDX HY, Series 5-T2(k)(b) | ||||||||||
| 7.25% | 12/29/10 | 2,000 | 1,977,500 | |||||||
TOTAL LONG-TERM BONDS | 972,088,919 | |||||||||
TOTAL LONG-TERM INVESTMENTS | 2,554,379,393 | |||||||||
| Shares | ||||
| SHORT-TERM INVESTMENTS — 20.3% | ||||
Mutual Funds — 20.2% | ||||
Dryden Core Investment Fund —Taxable Money Market Series(i)(j) (includes $271,066,668 of cash collateral received for securities on loan) | 472,618,461 | 472,618,461 | ||
Interest Rate | Maturity | Moody’s | Shares/ | Value (Note 2) | ||||||
| SHORT-TERM INVESTMENTS (Continued) | ||||||||||
Dryden Core Investment Fund — Dryden Short-Term Bond Series(j) | 8,356,772 | $ | 83,561,042 | |||||||
TOTAL MUTUAL FUNDS | 556,179,503 | |||||||||
U.S. Government Agency Obligations — 0.1% |
| |||||||||
United States Treasury Bills(c)(g) | ||||||||||
4.09% | 03/16/06 | $3,500 | 3,472,627 | |||||||
Contracts | ||||||||||
OUTSTANDING OPTIONS PURCHASED |
| |||||||||
Call Option |
| |||||||||
90 Day Euro Future, expiring 9/18/06 @ $95.25 (cost $71,880) | 62 | 25,963 | ||||||||
TOTAL SHORT-TERM INVESTMENTS | 559,678,093 | |||||||||
TOTAL INVESTMENTS, BEFORE OUTSTANDING OPTIONS WRITTEN 113.2% | 3,114,057,486 | |||||||||
OUTSTANDING OPTIONS WRITTEN(a) |
| |||||||||
Call Option |
| |||||||||
90 Day Euro Future, | 62 | (7,363 | ) | |||||||
TOTAL INVESTMENTS, NET OF OUTSTANDING OPTIONS WRITTEN —113.2% | 3,114,050,123 | |||||||||
OTHER LIABILITIES IN EXCESS OF | (364,257,185 | ) | ||||||||
TOTAL NET ASSETS — 100.0% | $ | 2,749,792,938 | ||||||||
SEE NOTES TO FINANCIAL STATEMENTS.
B14
| CONSERVATIVE BALANCED PORTFOLIO (Continued) |
SCHEDULE OF INVESTMENTS | December 31, 2005 |
The following abbreviations are used in portfolio descriptions:
| G.O. | General Obligation | |
| IO | Interest Only | |
| LP | Limited Partnership | |
| TBA | Securities purchased on a forward commitment basis |
| (a) | Non-Income producing security. |
| (b) | All or portion of security is on loan. The aggregate market value of such securities is $261,257,394; cash collateral of $271,066,668 (included in liabilities) was received with which the Portfolio purchased highly liquid short-term investments. |
| (c) | Security segregated as collateral for futures contracts. |
| (d) | Standard & Poor’s rating. |
| (f) | Increase/decrease in rate variable upon increase/decrease in Moody’s or Standard & Poor’s rating. |
| (g) | Rate quoted represents yield-to-maturity as of purchase date. |
| (h) | Indicates variable rate security. |
| (i) | Represents security, or a portion thereof, purchased with cash collateral for securities on loan. |
| (j) | Prudential Investments LLC, the manager of the Portfolio, also serves as manager of the Dryden Core Investment Fund—Taxable Money Market Series and the Dryden Core Investment Fund – Dryden Short – Term Bond Series. |
| (k) | Security was purchased pursuant to Rule 144A under the Securities Act of 1933 and may not be resold subject to that rule except to qualified institutional buyers, unless otherwise noted. 144A securities are deemed to be liquid. |
| (l) | Liabilities in excess of other assets include unrealized appreciation (depreciation) on financial futures as follows: Open futures contracts outstanding at December 31, 2005: |
| Number of Contracts | Type | Expiration Date | Value at Trade Date | Value at December 31, 2005 | Unrealized Appreciation/ (Depreciation) | |||||||||
| Long Positions: | ||||||||||||||
| 48 | Fed Funds-30 Day | Apr. 06 | $ | 19,073,117 | $ | 19,071,526 | $ | (1,591 | ) | |||||
| 58 | S&P 500 Index | Mar. 06 | 18,470,750 | 18,194,600 | (276,150 | ) | ||||||||
| 232 | U.S. Treasury 30 Yr Bonds | Mar. 06 | 25,998,243 | 26,491,500 | 493,257 | |||||||||
| 269 | Eurodollar Futures | Mar. 06 | 64,076,706 | 64,038,812 | (37,894 | ) | ||||||||
| 398 | U.S. Treasury 5 Yr Notes | Mar. 06 | 42,168,581 | 42,324,813 | 156,232 | |||||||||
| 333,854 | ||||||||||||||
| Short Positions: | ||||||||||||||
| 18 | U.S. Treasury 10 Yr Notes | Mar. 06 | 1,953,432 | 1,969,313 | (15,881 | ) | ||||||||
| 375 | U.S. Treasury 2 Yr Notes | Mar. 06 | 76,975,581 | 76,945,312 | 30,269 | |||||||||
| 14,388 | ||||||||||||||
| $ | 348,242 | |||||||||||||
SEE NOTES TO FINANCIAL STATEMENTS.
B15
| CONSERVATIVE BALANCED PORTFOLIO (Continued) |
SCHEDULE OF INVESTMENTS | December 31, 2005 |
The industry classification of portfolio holdings and liabilities in excess of other assets shown as a percentage of net assets as of December 31, 2005 was as follows:
Mutual Funds (including 9.9% of collateral received for securities on loan) | 20.2 | % | |
Mortgage Backed Securities | 12.0 | ||
Drugs & Medical Supplies | 5.8 | ||
Financial Services | 5.4 | ||
U.S. Treasury Securities | 5.2 | ||
Commercial Mortgage Backed Securities | 3.8 | ||
Banks & Savings & Loans | 3.7 | ||
Oil & Gas | 3.7 | ||
Insurance | 3.3 | ||
Telecommunications | 2.8 | ||
Computer Services | 2.7 | ||
U.S. Government Agency Obligations | 2.7 | ||
Industrial Conglomerates | 2.6 | ||
Retail | 2.1 | ||
Electronics | 2.0 | ||
Computers & Peripherals | 1.9 | ||
Food & Beverage | 1.8 | ||
Media | 1.7 | ||
Utilities — Electric & Gas | 1.7 | ||
Communications Equipment | 1.6 | ||
Asset Backed Securities | 1.6 | ||
Household Products & Personal Care | 1.4 | ||
Aerospace & Defense | 1.3 | ||
Chemicals | 1.3 | ||
Hospital/Hospital Management | 1.0 | ||
Food & Staples Retailing | 0.9 | ||
Oil & Gas Exploration & Production | 0.9 | ||
Tobacco | 0.9 | ||
Electric | 0.9 | ||
Oil & Gas Services | 0.8 | ||
Banking | 0.8 | ||
Leisure | 0.7 | ||
Machinery | 0.7 | ||
Air Freight & Couriers | 0.6 | ||
Internet Services | 0.6 | ||
Railroads | 0.5 | ||
Real Estate Investment Trust | 0.5 | ||
Capital Goods | 0.5 | ||
Foods | 0.5 | ||
Health Care & Pharmaceutical | 0.5 | ||
Non Captive Finance | 0.5 | ||
Commercial Services & Supplies | 0.4 | ||
Aerospace/Defense | 0.4 | ||
Collateralized Mortgage Obligations | 0.4 | ||
Energy — Other | 0.4 |
Restaurants | 0.4 | ||
Autos — Cars & Trucks | 0.3 | ||
Housing Related | 0.3 | ||
Pharmaceuticals | 0.3 | ||
Semiconductors & Semiconductor Equipment | 0.3 | ||
Brokerage | 0.3 | ||
Media & Entertainment | 0.3 | ||
Pipelines & Other | 0.3 | ||
Technology | 0.3 | ||
Foreign Government Bonds | 0.3 | ||
Airlines | 0.2 | ||
Apparel | 0.2 | ||
Construction | 0.2 | ||
Healthcare Equipment & Supplies | 0.2 | ||
Household Durables | 0.2 | ||
Metals & Mining | 0.2 | ||
Miscellaneous Basic Industry | 0.2 | ||
Paper & Forest Products | 0.2 | ||
Cable | 0.2 | ||
Lodging | 0.2 | ||
Retailers | 0.2 | ||
Sovereign | 0.2 | ||
Building Products | 0.1 | ||
Containers | 0.1 | ||
Diversified Consumer Services | 0.1 | ||
Independent Power Producers & Energy Traders | 0.1 | ||
Metals — Ferrous | 0.1 | ||
Metals — Non Ferrous | 0.1 | ||
Motorcycles | 0.1 | ||
Multi-Utilities | 0.1 | ||
Office Electronics | 0.1 | ||
Software | 0.1 | ||
Toys | 0.1 | ||
Automotive | 0.1 | ||
Building Materials & Construction | 0.1 | ||
Consumer | 0.1 | ||
Energy — Integrated | 0.1 | ||
Gaming | 0.1 | ||
Municipals | 0.1 | ||
Oil & Gas Exploration Services | 0.1 | ||
Structured Notes | 0.1 | ||
U.S. Government Agency Obligations | 0.1 | ||
| 113.2 | |||
Other liabilities in excess of other assets | (13.2 | ) | |
| 100.0 | % | ||
SEE NOTES TO FINANCIAL STATEMENTS.
B16
| DIVERSIFIED BOND PORTFOLIO |
SCHEDULE OF INVESTMENTS | December 31, 2005 |
| LONG-TERM INVESTMENTS — 98.0% LONG-TERM BONDS | Moody’s Rating (Unaudited) | Interest Rate | Maturity Date | Principal Amount (000) | Value (Note 2) | |||||||
Aerospace/Defense — 0.6% | ||||||||||||
BAE Systems Holdings, Inc., 144A(h) | Baa2 | 5.20% | 08/15/15 | $ | 6,850 | $ | 6,712,636 | |||||
Raytheon Co. | Baa3 | 4.50% | 11/15/07 | 335 | 332,114 | |||||||
Raytheon Co. | Baa3 | 8.30% | 03/01/10 | 725 | 812,064 | |||||||
| 7,856,814 | ||||||||||||
Airlines — 0.2% | ||||||||||||
Continental Airlines, Inc., Series 2000-1, Class A-1 | Baa3 | 6.70% | 06/15/21 | 4 | 3,626 | |||||||
Southwest Airlines Co. | Baa1 | 5.25% | 10/01/14 | 2,550 | 2,472,862 | |||||||
| 2,476,488 | ||||||||||||
Asset-Backed Securities — 3.5% | ||||||||||||
American Express Credit Account Master Trust, | ||||||||||||
Series 2004-C, Class C, 144A(g)(h) | Baa2 | 4.87% | 02/15/12 | 1,794 | 1,797,942 | |||||||
AmeriQuest Mortgage Securities, Inc., Series 2001-2, Class M3(g) | Baa2 | 6.33% | 10/25/31 | 725 | 725,962 | |||||||
Bank One Issuance Trust, Series 2003-C1, Class C1 | Baa2 | 4.54% | 09/15/10 | 2,980 | 2,950,636 | |||||||
Centex Home Equity, Series 2005-A, Class M4(g) | A1 | 5.18% | 01/25/35 | 2,400 | 2,409,157 | |||||||
Citibank Credit Card Issuance Trust, Series 2003-C4, Class C4 | Baa2 | 5.00% | 06/10/15 | 3,000 | 2,942,968 | |||||||
Countrywide Asset-Backed Certificates, Series 2004-12, Class MV3(g) | Aa3 | 5.04% | 03/25/35 | 2,670 | 2,683,485 | |||||||
CS First Boston Mortgage Securities Corp., Series 2002-HE4, Class M2 | A2 | 6.13% | 08/25/32 | 1,078 | 1,081,156 | |||||||
Equity One ABS, Inc., Series 2004-3, Class M1 | Aa2 | 5.70% | 07/25/34 | 2,100 | 2,101,332 | |||||||
First Franklin Mortgage Loan Asset-Backed Cerftificates, Series 2005-FF6, | Aa2 | 4.82% | 03/25/36 | 2,575 | 2,579,415 | |||||||
Home Equity Asset Trust, Series 2005-7, Class 2A4 | Aaa | 4.76% | 01/25/36 | 1,500 | 1,500,718 | |||||||
MBNA Master Credit Card Trust, Series 1999-J, Class A | Aaa | 7.00% | 02/15/12 | 14,300 | 15,355,273 | |||||||
Morgan Stanley ABS Capital I, Series 2003-HE1, Class M1(g) | Aa2 | 5.18% | 05/25/33 | 2,580 | 2,595,104 | |||||||
Residential Asset Mortgage Products, Inc., Series 2004-RS12, Class MII2(g) | Aa3 | 5.18% | 12/25/34 | 2,100 | 2,117,641 | |||||||
Structured Asset Securities Corp., Series 2005-RMS1, Class A3(g) | AAA(f) | 4.68% | 02/25/35 | 1,500 | 1,503,624 | |||||||
| 42,344,413 | ||||||||||||
Automotive — 2.0% | ||||||||||||
Auburn Hills Trust, Inc. | A3 | 12.375% | 05/01/20 | 640 | 951,636 | |||||||
Chrysler Corp. | A3 | 7.45% | 03/01/27 | 1,300 | 1,410,807 | |||||||
Equus Cayman Finance, Ltd., (Cayman Islands), 144A(h) | Baa3 | 5.50% | 09/12/08 | 830 | 832,184 | |||||||
Ford Motor Credit Co. | Baa3 | 6.875% | 02/01/06 | 555 | 553,793 | |||||||
Ford Motor Credit Co.(a) | Baa3 | 6.625% | 06/16/08 | 3,500 | 3,174,696 | |||||||
General Motors Acceptance Corp.(a) | Ba1 | 6.125% | 09/15/06 | 4,090 | 3,972,842 | |||||||
General Motors Acceptance Corp.(a) | Ba1 | 6.125% | 02/01/07 | 4,105 | 3,918,826 | |||||||
General Motors Acceptance Corp.(a) | Ba1 | 6.15% | 04/05/07 | 3,710 | 3,504,281 | |||||||
General Motors Acceptance Corp.(a) | Ba1 | 6.75% | 12/01/14 | 5,000 | 4,498,105 | |||||||
Hyundai Motor Manufacturing LLC, 144A(h) | Baa3 | 5.30% | 12/19/08 | 1,820 | 1,815,528 | |||||||
| 24,632,698 | ||||||||||||
Banking — 2.8% | ||||||||||||
Chuo Mitsui Trust & Banking Co. Ltd., (Japan), 144A(a)(g)(h) | Baa2 | 5.506% | 12/31/49 | 3,050 | 2,955,487 | |||||||
Citigroup, Inc. | Aa2 | 6.625% | 06/15/32 | 980 | 1,107,388 | |||||||
HSBC Finance Corp. | A1 | 5.84% | 02/15/08 | 710 | 721,763 | |||||||
Icici Bank, Ltd., (Singapore), 144A(h) | Baa3 | 5.75% | 11/16/10 | 2,500 | 2,511,675 | |||||||
Kazkommerts International BV, (Netherlands), 144A(a)(h) | Baa2 | 7.875% | 04/07/14 | 4,150 | 4,357,500 | |||||||
KBC Bank Funding Trust III, 144A(g)(h) | A2 | 9.86% | 12/31/49 | 5,000 | 5,782,355 | |||||||
Mizuho Financial Group, (Cayman Islands), MTN, 144A(h) | A2 | 5.79% | 04/15/14 | 1,880 | 1,942,181 | |||||||
Resona Bank Ltd. 144A(h) | Baa1 | 5.85% | 09/29/49 | 2,900 | 2,887,745 | |||||||
Resona Preferred Global Securities Cayman Ltd. 144A(a)(h) | Baa3 | 7.19% | 12/30/49 | 3,550 | 3,766,458 | |||||||
Russian Standard Finance Bank, SA, 144A(h) Bank, 144A(h) | Ba2 | 7.50% | 10/07/10 | 2,635 | 2,565,831 | |||||||
Sumitomo Mitsui Banking Corp., 144A(h) | A2 | 5.625% | 07/15/49 | 6,380 | 6,356,113 | |||||||
| 34,954,496 | ||||||||||||
SEE NOTES TO FINANCIAL STATEMENTS.
B17
| DIVERSIFIED BOND PORTFOLIO (Continued) |
SCHEDULE OF INVESTMENTS | December 31, 2005 |
| LONG-TERM BONDS (Continued) | Moody’s Rating (Unaudited) | Interest Rate | Maturity Date | Principal Amount (000) | Value (Note 2) | |||||||
Building Materials & Construction — 1.2% | ||||||||||||
American Standard, Inc.(a) | Baa3 | 7.625% | 02/15/10 | $ | 3,800 | $ | 4,084,533 | |||||
D.R. Horton, Inc. | Baa3 | 5.625% | 09/15/14 | 3,725 | 3,588,129 | |||||||
RPM International, Inc. | Baa3 | 4.45% | 10/15/09 | 5,150 | 4,938,195 | |||||||
Ryland Group, Inc. | Baa3 | 5.375% | 06/01/08 | 1,900 | 1,898,965 | |||||||
| 14,509,822 | ||||||||||||
Cable — 0.4% | ||||||||||||
Comcast Cable Communications, Inc. | Baa2 | 6.375% | 01/30/06 | 650 | 650,894 | |||||||
CSC Holdings, Inc. | B2 | 7.875% | 12/15/07 | 3,800 | 3,866,500 | |||||||
TCI Communications, Inc. | Baa2 | 7.875% | 02/15/26 | 750 | 865,670 | |||||||
| 5,383,064 | ||||||||||||
Capital Goods — 2.2% | ||||||||||||
Briggs & Stratton Corp. | Ba1 | 8.875% | 03/15/11 | 3,905 | 4,375,014 | |||||||
FedEx Corp. | Baa2 | 2.65% | 04/01/07 | 7,550 | 7,344,013 | |||||||
FedEx Corp. | Baa2 | 7.25% | 02/15/11 | 1,750 | 1,913,280 | |||||||
Hertz Corp., 144A(h) | B1 | 8.875% | 01/01/14 | 3,050 | 3,107,188 | |||||||
Rockwell Automation, Inc. | A3 | 5.20% | 01/15/98 | 6,500 | 5,891,724 | |||||||
Tyco International Group SA, (Luxembourg) | Baa3 | 6.00% | 11/15/13 | 200 | 204,297 | |||||||
Tyco International Group SA, (Luxembourg) | Baa3 | 6.75% | 02/15/11 | 805 | 846,368 | |||||||
Waste Management, Inc. | Baa3 | 7.125% | 10/01/07 | 1,550 | 1,601,824 | |||||||
Waste Management, Inc. | Baa3 | 7.65% | 03/15/11 | 2,100 | 2,322,506 | |||||||
| 27,606,214 | ||||||||||||
Chemicals — 2.2% | ||||||||||||
Dow Chemical Co. | A3 | 5.97% | 01/15/09 | 1,490 | 1,537,872 | |||||||
Dow Chemical Co. | A3 | 9.00% | 04/01/21 | 1,000 | 1,344,328 | |||||||
Huntsman International LLC(a) | B2 | 9.875% | 03/01/09 | 2,400 | 2,532,000 | |||||||
Huntsman International LLC | Ba3 | 11.625% | 10/15/10 | 2,100 | 2,391,375 | |||||||
ICI Wilmington, Inc. | Baa3 | 4.375% | 12/01/08 | 2,040 | 1,987,882 | |||||||
IMC Global, Inc. | Ba3 | 10.875% | 08/01/13 | 610 | 700,738 | |||||||
IMC Global, Inc.(a) | B1 | 6.875% | 07/15/07 | 2,000 | 2,030,000 | |||||||
Lubrizol Corp. | Baa3 | 5.875% | 12/01/08 | 550 | 559,651 | |||||||
Lubrizol Corp. | Baa3 | 4.625% | 10/01/09 | 5,600 | 5,488,695 | |||||||
Lubrizol Corp. | Baa3 | 6.50% | 10/01/34 | 1,775 | 1,853,160 | |||||||
Lyondell Chemical Co. | B1 | 9.50% | 12/15/08 | 1,768 | 1,851,980 | |||||||
Monsanto Co., 144A(h) | Baa1 | 5.50% | 08/15/25 | 4,560 | 4,426,702 | |||||||
| 26,704,383 | ||||||||||||
Collateralized Mortgage Obligations — 1.1% | ||||||||||||
Countrywide Alternative Loan Trust, Series 2004-18CB, Class 3A1 | Aaa | 5.25% | 09/25/19 | 3,554 | 3,481,870 | |||||||
Master Alternative Loan Trust, Series 2004-4, Class 4A1 | Aaa | 5.00% | 04/25/19 | 700 | 688,224 | |||||||
Structured Adjustable Rate Mortgage Loan Trust, Series 2004-1, | Aaa | 4.17% | 02/25/34 | 5,427 | 5,353,975 | |||||||
Washington Mutual Mortgage Pass-Through Certificates, Series 2005-1, Class 3A | Aaa | 5.00% | 03/25/20 | 2,315 | 2,271,872 | |||||||
Washington Mutual, Series 2002-AR15, Class A5 | Aaa | 4.38% | 12/25/32 | 1,959 | 1,931,905 | |||||||
| 13,727,846 | ||||||||||||
Commercial Mortgage-Backed Securities — 8.7% | ||||||||||||
Banc of America Commercial Mortgage, Inc., Series 2005-1, | AAA(f) | 4.86% | 11/10/42 | 5,950 | 5,922,123 | |||||||
Banc of America Commercial Mortgage, Inc., Series 2005-3, Class A4 | Aaa | 4.668% | 07/10/43 | 9,400 | 9,058,490 | |||||||
Banc of America Commercial Mortgage, Inc., Series 2005-6, Class A4 | Aaa | 5.182% | 09/10/47 | 4,635 | 4,674,470 | |||||||
Bear Stearns Commercial Mortgage Securities, Inc., Series. 2005-T18, | Aaa | 4.823% | 02/13/42 | 2,475 | 2,429,679 | |||||||
Bear Stearns Commercial Mortgage Securities, Inc., Series 2005-T20, | Aaa | 5.287% | 10/12/42 | 3,400 | 3,413,149 | |||||||
Chase Commercial Mortgage Securities Corp., Series 1997-1, Class A2 | AAA(f) | 7.37% | 06/19/29 | 2,063 | 2,092,271 | |||||||
GE Capital Commercial Mortgage Corp., Series 2005-C4, Class A-4 | Aaa | 5.33% | 11/10/45 | 4,500 | 4,591,230 | |||||||
SEE NOTES TO FINANCIAL STATEMENTS.
B18
| DIVERSIFIED BOND PORTFOLIO (Continued) |
SCHEDULE OF INVESTMENTS | December 31, 2005 |
| LONG-TERM BONDS (Continued) | Moody’s Rating (Unaudited) | Interest Rate | Maturity Date | Principal Amount (000) | Value (Note 2) | |||||||
Commercial Mortgage-Backed Securities (cont’d.) | ||||||||||||
GMAC Commercial Mortgage Securities, Inc., Series 2002-C3, Class A2 | Aaa | 4.93% | 07/10/39 | $ | 8,500 | $ | 8,413,610 | |||||
Greenwich Capital Commercial Funding Corp., Series 2003-C1, Class A4 | Aaa | 4.111% | 07/05/35 | 12,700 | 11,927,588 | |||||||
JP Morgan Chase Commercial Mortgage Securities Corp., Series 2005-LD4, Class A-4 | Aaa | 4.918% | 10/15/42 | 3,700 | 3,628,598 | |||||||
JP Morgan Chase Commercial Mortgage Securities Corp., Series 2005-LDP2, Class ASB(g) | Aaa | 4.66% | 07/15/42 | 9,300 | 9,039,594 | |||||||
JP Morgan Chase Commercial Mortgage Securities Corp., Series 2005-CB13, Class A4 | Aaa | 5.29% | 01/12/43 | 3,275 | 3,318,968 | |||||||
JP Morgan Chase Commercial Mortgage Securities Corp., Series 2003-ML1A, Class A2 | Aaa | 4.767% | 03/12/39 | 4,969 | 4,852,711 | |||||||
LB-UBS Commercial Mortgage Trust, Series 2004-C8, Class A6 | Aaa | 4.799% | 12/15/29 | 4,200 | 4,101,267 | |||||||
LB-UBS Commercial Mortgage Trust, Series 2003-C8, Class A3 | Aaa | 4.83% | 11/15/27 | 3,375 | 3,328,071 | |||||||
Morgan Stanley Dean Witter Capital I, Series 2000-PRIN, Class A3 | Aaa | 7.36% | 02/23/34 | 1,504 | 1,553,033 | |||||||
PNC Mortgage Acceptance Corp., Series 1999-CM1, Class A1B | AAA(f) | 7.33% | 12/10/32 | 4,800 | 5,146,090 | |||||||
PNC Mortgage Acceptance Corp., Series 2001-C1, Class A1 | Aaa | 5.91% | 03/12/34 | 5,011 | 5,097,214 | |||||||
Wachovia Bank Commercial Mortgage Trust, Series. 2003-C3, Class A2 | AAA(f) | 4.867% | 02/15/35 | 7,330 | 7,218,122 | |||||||
Wachovia Bank Commercial Mortgage Trust, Series 2002-C2, Class A4 | Aaa | 4.98% | 11/15/34 | 2,500 | 2,482,418 | |||||||
Wachovia Bank Commercial Mortgage Trust, Series 2003-C9, Class A3 | AAA(f) | 4.608% | 12/15/35 | 4,750 | 4,632,758 | |||||||
| 106,921,454 | ||||||||||||
Electric — 4.3% | ||||||||||||
CenterPoint Energy Houston Electric LLC | Baa2 | 5.70% | 03/15/13 | 2,950 | 3,043,406 | |||||||
CMS Energy Corp. | B1 | 8.90% | 07/15/08 | 2,570 | 2,746,688 | |||||||
Consumers Energy Co. | Baa3 | 5.00% | 02/15/12 | 1,000 | 978,238 | |||||||
Consumers Energy Co. | Baa3 | 5.375% | 04/15/13 | 1,000 | 992,732 | |||||||
Duke Capital LLC | Baa3 | 4.331% | 11/16/06 | 650 | 645,474 | |||||||
Edison Mission Energy | B1 | 7.73% | 06/15/09 | 1,480 | 1,528,100 | |||||||
Edison Mission Energy | B1 | 10.00% | 08/15/08 | 1,085 | 1,188,075 | |||||||
El Paso Electric Co. | Baa3 | 6.00% | 05/15/35 | 2,325 | 2,326,072 | |||||||
Empresa Nacional de Electricidad SA, (Chile) | Ba1 | 8.35% | 08/01/13 | 625 | 711,823 | |||||||
Energy East Corp. | Baa2 | 6.75% | 06/15/12 | 750 | 810,979 | |||||||
Energy East Corp. | Baa2 | 6.75% | 09/15/33 | 1,150 | 1,266,317 | |||||||
Enersis SA (Chile)(a) | Ba1 | 7.375% | 01/15/14 | 3,700 | 3,979,815 | |||||||
Exelon Corp. | Baa2 | 4.90% | 06/15/15 | 500 | 477,192 | |||||||
FirstEnergy Corp.(a) | Baa3 | 5.50% | 11/15/06 | 1,700 | 1,706,110 | |||||||
FirstEnergy Corp. | Baa3 | 6.45% | 11/15/11 | 3,030 | 3,211,791 | |||||||
FirstEnergy Corp. | Baa3 | 7.375% | 11/15/31 | 1,125 | 1,327,466 | |||||||
Korea East-West Power Co., Ltd., (South Korea), 144A(h) | A2 | 4.875% | 04/21/11 | 1,700 | 1,673,351 | |||||||
Midland Funding II, Series B | B3 | 13.25% | 07/23/06 | 2,953 | 3,058,677 | |||||||
NiSource Finance Corp. | Baa3 | 5.25% | 09/15/17 | 500 | 486,342 | |||||||
NiSource Finance Corp. | Baa3 | 5.45% | 09/15/20 | 3,000 | 2,906,766 | |||||||
Northern States Power Co. | A2 | 8.00% | 08/28/12 | 2,800 | 3,274,070 | |||||||
Oncor Electric Delivery Co. | Baa2 | 7.00% | 09/01/22 | 300 | 333,443 | |||||||
Pacific Gas & Electric Co. | Baa1 | 6.05% | 03/01/34 | 4,695 | 4,859,132 | |||||||
Southern California Edison Co. | Baa1 | 6.375% | 01/15/06 | 1,250 | 1,250,572 | |||||||
Southern California Edison Co. | Baa1 | 7.625% | 01/15/10 | 1,100 | 1,198,956 | |||||||
Teco Energy, Inc.(a) | Ba2 | 6.75% | 05/01/15 | 1,965 | 2,033,775 | |||||||
Teco Energy, Inc.(a) | Ba2 | 7.50% | 06/15/10 | 955 | 1,017,075 | |||||||
TXU Corp. | Ba1 | 4.446% | 11/16/06 | 100 | 99,232 | |||||||
Xcel Energy, Inc. | Baa1 | 3.40% | 07/01/08 | 1,330 | 1,281,761 | |||||||
Xcel Energy, Inc. | Baa1 | 7.00% | 12/01/10 | 1,850 | 1,991,029 | |||||||
| 52,404,459 | ||||||||||||
Energy – Integrated — 0.3% | ||||||||||||
Conoco Funding Co., (Canada) | A1 | 6.35% | 10/15/11 | 2,480 | 2,657,263 | |||||||
Tosco Corp. | A1 | 7.25% | 01/01/07 | 1,500 | 1,529,889 | |||||||
| 4,187,152 | ||||||||||||
SEE NOTES TO FINANCIAL STATEMENTS.
B19
| DIVERSIFIED BOND PORTFOLIO (Continued) |
SCHEDULE OF INVESTMENTS | December 31, 2005 |
| LONG-TERM BONDS (Continued) | Moody’s Rating (Unaudited) | Interest Rate | Maturity Date | Principal Amount (000) | Value (Note 2) | |||||||
Energy – Other — 1.2% | ||||||||||||
B.J. Services Co. | Baa1 | 7.00% | 02/01/06 | $ | 5,000 | $ | 5,007,009 | |||||
GS Caltex Corp., 144A(h) | Baa1 | 7.75% | 07/25/11 | 3,250 | 3,627,566 | |||||||
Halliburton Co. | Baa1 | 5.50% | 10/15/10 | 625 | 638,350 | |||||||
Occidental Petroleum Corp. | A3 | 4.25% | 03/15/10 | 3,250 | 3,170,362 | |||||||
Talisman Energy, Inc., (Canada) | Baa1 | 5.125% | 05/15/15 | 2,300 | 2,279,468 | |||||||
| 14,722,755 | ||||||||||||
Foods — 1.1% | ||||||||||||
Cadbury Schweppes US Finance LLC, 144A(h) | Baa2 | 3.875% | 10/01/08 | 2,600 | 2,524,915 | |||||||
HJ Heinz Co., 144A(h) | Baa1 | 6.428% | 12/01/08 | 3,550 | 3,646,809 | |||||||
Kraft Foods, Inc. | A3 | 5.625% | 11/01/11 | 860 | 882,357 | |||||||
Kraft Foods, Inc. | A3 | 6.25% | 06/01/12 | 1,425 | 1,503,295 | |||||||
The Kroger Co. | Baa2 | 6.75% | 04/15/12 | 1,375 | 1,446,013 | |||||||
Tricon Global Restaurants, Inc. | Baa3 | 8.875% | 04/15/11 | 1,705 | 1,952,089 | |||||||
Tyson Foods, Inc. | Baa3 | 7.25% | 10/01/06 | 1,250 | 1,270,016 | |||||||
| 13,225,494 | ||||||||||||
Gaming — 0.3% | ||||||||||||
Harrah’s Operating Co., Inc. | Baa3 | 5.75% | 10/01/17 | 3,460 | 3,367,604 | |||||||
Mandalay Resorts Group | Ba3 | 9.375% | 02/15/10 | 33 | 36,542 | |||||||
| 3,404,146 | ||||||||||||
Health Care & Pharmaceutical — 2.1% | ||||||||||||
Cardinal Health, Inc. | Baa3 | 5.85% | 12/15/17 | 3,130 | 3,183,720 | |||||||
HCA, Inc. | Ba2 | 7.125% | 06/01/06 | 7,000 | 7,057,401 | |||||||
HCA, Inc. | Ba2 | 8.36% | 04/15/24 | 2,900 | 3,161,867 | |||||||
Merck & Co., Inc. | Aa3 | 5.95% | 12/01/28 | 255 | 261,510 | |||||||
OMEGA Healthcare Investors, Inc. | B1 | 6.95% | 08/01/07 | 2,575 | 2,649,031 | |||||||
Omnicare, Inc. | Ba3 | 6.875% | 12/15/15 | 2,300 | 2,334,500 | |||||||
Wellpoint, Inc. | Baa1 | 5.00% | 12/15/14 | 1,310 | 1,286,818 | |||||||
Wyeth(b) | Baa1 | 5.50% | 03/15/13 | 1,250 | 1,267,210 | |||||||
Wyeth, 144A(h) | Baa1 | 6.00% | 02/15/36 | 1,625 | 1,673,402 | |||||||
Wyeth(b) | Baa1 | 6.45% | 02/01/24 | 2,370 | 2,563,179 | |||||||
| 25,438,638 | ||||||||||||
Insurance — 0.7% | ||||||||||||
Allstate Corp. | A1 | 5.55% | 05/09/35 | 4,865 | 4,767,520 | |||||||
American International Group, Inc. | Aa2 | 4.25% | 05/15/13 | 1,820 | 1,731,055 | |||||||
American International Group, Inc., 144A(h) | Aa2 | 5.05% | 10/01/15 | 315 | 309,150 | |||||||
Everest Reinsurance Holdings, Inc. | A3 | 5.40% | 10/15/14 | 1,900 | 1,873,812 | |||||||
Marsh & McLennan Cos., Inc. | Baa2 | 5.75% | 09/15/15 | 275 | 277,210 | |||||||
XL Capital Ltd. Class A, (Cayman Islands) | A3 | 5.25% | 09/15/14 | 140 | 136,651 | |||||||
| 9,095,398 | ||||||||||||
Lodging — 0.8% | ||||||||||||
Carnival Corp., (Panama) | A3 | 3.75% | 11/15/07 | 3,600 | 3,519,087 | |||||||
Carnival PLC, (United Kingdom) | A3 | 7.30% | 06/01/07 | 825 | 849,488 | |||||||
Royal Caribbean Cruises. Ltd., (Liberia) | Ba1 | 6.875% | 12/01/13 | 2,210 | 2,340,699 | |||||||
Starwood Hotels & Resorts Worldwide, Inc. | Ba1 | 7.375% | 05/01/07 | 3,000 | 3,060,000 | |||||||
| 9,769,274 | ||||||||||||
Media & Entertainment — 1.2% | ||||||||||||
Clear Channel Communications, Inc. | Baa3 | 8.00% | 11/01/08 | 4,720 | 5,018,068 | |||||||
Comcast Cable Communications Holdings, Inc. | Baa2 | 9.455% | 11/15/22 | 1,550 | 2,030,805 | |||||||
Comcast Corp.(a) | Baa2 | 6.50% | 11/15/35 | 2,975 | 3,031,695 | |||||||
Thomson Corp. (Canada) | A3 | 5.75% | 02/01/08 | 2,750 | 2,789,086 | |||||||
Time Warner, Inc. | Baa1 | 7.70% | 05/01/32 | 1,650 | 1,855,687 | |||||||
Viacom, Inc. | Baa3 | 7.875% | 07/30/30 | 490 | 559,524 | |||||||
| 15,284,865 | ||||||||||||
SEE NOTES TO FINANCIAL STATEMENTS.
B20
| DIVERSIFIED BOND PORTFOLIO (Continued) |
SCHEDULE OF INVESTMENTS | December 31, 2005 |
| LONG-TERM BONDS (Continued) | Moody’s Rating (Unaudited) | Interest Rate | Maturity Date | Principal Amount (000) | Value (Note 2) | ||||||
Metals — 0.7% | |||||||||||
Alcan, Inc. | Baa1 | 5.75% | 06/01/35 | $ 2,050 | $ | 1,996,024 | |||||
Asia Aluminum Holdings, Ltd., (Bermuda), 144A(h) | Ba3 | 8.00% | 12/23/11 | 1,500 | 1,464,375 | ||||||
Noranda, Inc. | Baa3 | 6.20% | 06/15/35 | 2,150 | 2,088,790 | ||||||
Oregon Steel Mills, Inc. | Ba3 | 10.00% | 07/15/09 | 3,065 | 3,279,549 | ||||||
| 8,828,738 | |||||||||||
Non-Captive Finance — 1.8% | |||||||||||
Berkshire Hathaway Finance Corp. | Aaa | 4.75% | 05/15/12 | 3,400 | 3,361,036 | ||||||
CIT Group, Inc. | A2 | 5.50% | 11/30/07 | 235 | 237,307 | ||||||
General Electric Capital Corp. | Aaa | 4.875% | 10/21/10 | 11,200 | 11,175,181 | ||||||
HSBC Finance Corp. | A1 | 5.00% | 06/30/15 | 2,850 | 2,771,383 | ||||||
HSBC Finance Corp. | A1 | 5.25% | 04/15/15 | 2,765 | 2,739,875 | ||||||
HSBC Finance Corp. | A1 | 6.75% | 05/15/11 | 550 | 590,244 | ||||||
Residential Capital Corp. | Baa3 | 6.875% | 06/30/15 | 1,550 | 1,647,007 | ||||||
| 22,522,033 | |||||||||||
Non-Corporate Foreign Agency — 1.2% | |||||||||||
Gazprom OAO, (Russia) | BB(f) | 10.50% | 10/21/09 | 1,685 | 1,950,893 | ||||||
Pemex Project Funding Master Trust, (Mexico), 144A(h) | Baa1 | 9.10% | 09/15/07 | 4,450 | 4,717,000 | ||||||
Petronas Capital, Ltd., (Malaysia), 144A(h) | A1 | 7.00% | 05/22/12 | 7,300 | 8,035,964 | ||||||
| 14,703,857 | |||||||||||
Non-Corporate Sovereign — 6.4% | |||||||||||
Australian Government, (Australia) | Aaa | 6.25% | 04/15/15 | AUD 4,005 | 3,159,187 | ||||||
Canadian Government Bond, (Canada) | Aaa | 5.00% | 06/01/14 | CAD 3,395 | 3,136,034 | ||||||
Deutsche Bundesrepublik, (Denmark) | Aaa | 3.75% | 01/04/15 | EUR 2,630 | 3,225,951 | ||||||
Federal Republic of Argentina, (Argentina) | B3 | 3.00% | 04/30/13 | $2,820 | 2,271,228 | ||||||
Federal Republic of Brazil, (Brazil)(a) | Ba3 | 9.25% | 10/22/10 | 5,325 | 5,958,675 | ||||||
Federal Republic of Brazil, (Brazil) | Ba3 | 11.25% | 07/26/07 | 565 | 612,743 | ||||||
Government of Hungary, (Hungary) | A1 | 8.00% | 02/12/15 | HUF 674,920 | 3,379,533 | ||||||
Government of Japan, (Japan) | A2 | 1.30% | 03/20/14 | JPY 395,100 | 3,345,109 | ||||||
Government of New Zealand, (New Zealand) | Aaa | 6.00% | 04/15/15 | NZD 5,275 | 3,681,391 | ||||||
Province of Quebec, (Canada) | A1 | 6.75% | 11/09/15 | NZD 4,640 | 3,202,961 | ||||||
Republic of Panama, (Panama) | Ba1 | 4.688% | 07/17/14 | $2,126 | 2,109,569 | ||||||
Republic of Panama, (Panama) | Ba1 | 9.375% | 07/23/12 | 1,295 | 1,515,150 | ||||||
Republic of Peru, (Peru) | Ba3 | 5.00% | 03/07/17 | 735 | 685,388 | ||||||
Republic of Peru, (Peru) | Ba3 | 5.00% | 03/07/17 | 1,669 | 1,597,780 | ||||||
Republic of Peru, (Peru) | Ba3 | 8.375% | 05/03/16 | 1,635 | 1,794,413 | ||||||
Republic of Philippines, (Philippines)(a) | B1 | 9.875% | 01/15/19 | 1,920 | 2,277,600 | ||||||
Republic of Poland, (Poland) | A2 | 6.25% | 10/24/15 | PLN 28,725 | 9,617,539 | ||||||
Republic of Poland, (Poland) | A2 | 8.50% | 05/12/07 | PLN 16,920 | 5,473,384 | ||||||
Republic of Uruguay, (Uruguay) | B3 | 7.25% | 02/15/11 | $ 660 | 671,550 | ||||||
Russian Government International Bond (Russia), 144A(h) | Baa2 | 8.25% | 03/31/10 | 2,650 | 2,812,313 | ||||||
United Kingdom Gilt, (Great Britain) | Aaa | 5.00% | 09/07/14 | GBP 1,630 | 2,984,440 | ||||||
United Mexican States, (Mexico)(a) | Baa1 | 8.375% | 01/14/11 | $8,000 | 9,120,000 | ||||||
United Mexican States, (Mexico) | Baa1 | 10.00% | 12/05/24 | MXP 55,400 | 5,889,881 | ||||||
| 78,521,819 | |||||||||||
Paper — 0.2% | |||||||||||
Georgia-Pacific Corp. | Ba2 | 8.875% | 05/15/31 | 1,400 | 1,403,500 | ||||||
Jefferson Smurfit Corp. | B2 | 8.25% | 10/01/12 | 49 | 47,040 | ||||||
Weyerhaeuser Co. | Baa2 | 7.375% | 03/15/32 | 460 | 511,386 | ||||||
| 1,961,926 | |||||||||||
Pipelines & Other — 1.5% | |||||||||||
Atmos Energy Corp.(e) | Baa3 | 4.00% | 10/15/09 | 5,300 | 5,082,822 | ||||||
Enterprise Products Operating LP(a) | Baa3 | 4.00% | 10/15/07 | 4,000 | 3,916,416 | ||||||
Enterprise Products Operating LP | Baa3 | 5.60% | 10/15/14 | 2,725 | 2,722,872 | ||||||
Oneok, Inc | Baa2 | 5.51% | 02/16/08 | 6,000 | 6,023,712 | ||||||
| 17,745,822 | |||||||||||
SEE NOTES TO FINANCIAL STATEMENTS.
B21
| DIVERSIFIED BOND PORTFOLIO (Continued) |
SCHEDULE OF INVESTMENTS | December 31, 2005 |
| LONG-TERM BONDS (Continued) | Moody’s Rating (Unaudited) | Interest Rate | Maturity Date | Principal Amount (000) | Value (Note 2) | |||||||
Real Estate Investment Trusts — 0.3% | ||||||||||||
Equity One, Inc. | Baa3 | 3.875% | 04/15/09 | $ | 1,450 | $ | 1,376,985 | |||||
Post Apartment Homes LP | Baa3 | 5.45% | 06/01/12 | 2,300 | 2,257,388 | |||||||
| 3,634,373 | ||||||||||||
Retailers — 1.1% | ||||||||||||
May Department Stores Co. | Baa1 | 6.65% | 07/15/24 | 900 | 946,261 | |||||||
May Department Stores Co. | Baa1 | 6.70% | 07/15/34 | 1,215 | 1,294,088 | |||||||
The Gap, Inc. | Baa3 | 6.90% | 09/15/07 | 8,875 | 9,068,484 | |||||||
Wal-Mart Stores, Inc. | Aa2 | 5.25% | 09/01/35 | 2,425 | 2,353,889 | |||||||
| 13,662,722 | ||||||||||||
Structured Notes — 2.6% | ||||||||||||
Dow Jones CDX HY, 144A(a)(h) | B3 | 8.25% | 12/29/10 | 16,500 | 16,541,249 | |||||||
Dow Jones CDX HY, 144A(a)(h) | B3 | 8.75% | 12/29/10 | 7,821 | 7,850,329 | |||||||
Preferred Term Securities X, Class A-1, 144A(g)(h)(i) | Aaa | 4.68% | 07/03/33 | 3,900 | 3,939,001 | |||||||
Trains HY, 144A(a)(h) | B1 | zero | 06/15/15 | 3,556 | 3,653,890 | |||||||
| 31,984,469 | ||||||||||||
Technology — 1.7% | ||||||||||||
Certegy, Inc. | Baa2 | 4.75% | 09/15/08 | 1,900 | 1,899,400 | |||||||
Equifax, Inc. | Baa1 | 4.95% | 11/01/07 | 1,340 | 1,339,160 | |||||||
International Business Machines Corp. | A1 | 8.375% | 11/01/19 | 575 | 746,644 | |||||||
Jabil Circuit, Inc. | Baa3 | 5.875% | 07/15/10 | 2,000 | 2,031,260 | |||||||
Motorola, Inc. | Baa2 | 4.608% | 11/16/07 | 2,870 | 2,852,068 | |||||||
Motorola, Inc. | Baa2 | 7.625% | 11/15/10 | 146 | 162,299 | |||||||
Sanmina-SCI Corp.(a) | Ba2 | 10.375% | 01/15/10 | 1,210 | 1,337,050 | |||||||
Seagate Technology International | Ba2 | 8.00% | 05/15/09 | 1,030 | 1,081,500 | |||||||
Sun Microsystems, Inc. | Ba1 | 7.50% | 08/15/06 | 5,835 | 5,915,278 | |||||||
SunGard Data Systems, Inc. | B2 | 3.75% | 01/15/09 | 720 | 655,200 | |||||||
SunGard Data Systems, Inc. | B2 | 4.875% | 01/15/14 | 2,350 | 2,044,500 | |||||||
SunGard Data Systems, Inc., 144A(a)(h) | B3 | 9.125% | 08/15/13 | 940 | 972,900 | |||||||
| 21,037,259 | ||||||||||||
Telecommunications — 5.2% | ||||||||||||
ALLTEL LP, 144A(h)(i) | A2 | 8.00% | 08/15/10 | 1,550 | 1,724,645 | |||||||
AT&T, Corp.(a) | A2 | 9.75% | 11/15/31 | 2,475 | 3,108,907 | |||||||
AT&T, Corp. | A2 | 4.125% | 09/15/09 | 4,150 | 4,007,335 | |||||||
BellSouth Corp. | A2 | 4.20% | 09/15/09 | 2,750 | 2,671,309 | |||||||
Citizens Communications Co. | Ba3 | 7.60% | 06/01/06 | 1,510 | 1,526,988 | |||||||
Citizens Communications Co. | Ba3 | 7.625% | 08/15/08 | 903 | 941,378 | |||||||
New Cingular Wireless Services, Inc. | Baa2 | 8.125% | 05/01/12 | 1,815 | 2,097,102 | |||||||
New Cingular Wireless Services, Inc. | Baa2 | 8.75% | 03/01/31 | 2,375 | 3,146,443 | |||||||
LCI International, Inc.,(i) | NR | 7.25% | 06/15/07 | 6,675 | 6,708,374 | |||||||
Sprint Capital Corp. | Baa2 | 4.78% | 08/17/06 | 6,665 | 6,659,648 | |||||||
Sprint Capital Corp. | Baa2 | 6.90% | 05/01/19 | 2,800 | 3,083,889 | |||||||
Sprint Capital Corp. | Baa2 | 8.75% | 03/15/32 | 2,215 | 2,939,482 | |||||||
Telecom Italia Capital, (Luxemburg) | Baa2 | 5.25% | 10/01/15 | 1,910 | 1,855,147 | |||||||
Telecom de Puerto Rico, (Puerto Rico)(a) | Baa1 | 6.65% | 05/15/06 | 6,800 | 6,837,970 | |||||||
Telecom de Puerto Rico, (Puerto Rico) | Baa1 | 6.80% | 05/15/09 | 4,365 | 4,535,641 | |||||||
TELUS Corp., (Canada) | Baa2 | 7.50% | 06/01/07 | 6,250 | 6,453,969 | |||||||
TELUS Corp., (Canada) | Baa2 | 8.00% | 06/01/11 | 150 | 168,159 | |||||||
Verizon Wireless Capital, Inc. | A3 | 5.375% | 12/15/06 | 5,900 | 5,919,435 | |||||||
| 64,385,821 | ||||||||||||
Tobacco — 0.6% | ||||||||||||
Altria Group, Inc. | Baa2 | 7.65% | 07/01/08 | 1,100 | 1,165,047 | |||||||
Altria Group, Inc. | Baa2 | 7.75% | 01/15/27 | 980 | 1,163,427 | |||||||
RJ Reynolds Tobacco Holdings, Inc., 144A(a)(h) | Ba2 | 6.50% | 07/15/10 | 5,600 | 5,572,000 | |||||||
| 7,900,474 | ||||||||||||
SEE NOTES TO FINANCIAL STATEMENTS.
B22
| DIVERSIFIED BOND PORTFOLIO (Continued) |
SCHEDULE OF INVESTMENTS | December 31, 2005 |
| LONG-TERM BONDS (Continued) | Moody’s Rating (Unaudited) | Interest Rate | Maturity Date | Principal Amount (000) | Value (Note 2) | |||||||
U.S. Government Agency Obligations — 0.8% | ||||||||||||
Fedederal Farm Credit Bank | Aaa | 4.15% | 05/15/13 | $ | 1,600 | $ | 1,539,285 | |||||
Federal Home Loan Mortgage Corp. | Aaa | 4.75% | 01/18/11 | 1,105 | 1,104,428 | |||||||
Federal Home Loan Mortgage Corp. | Aaa | 4.75% | 11/17/15 | 4,695 | 4,659,703 | |||||||
Federal National Mortgage Association | Aaa | 4.75% | 12/15/10 | 1,130 | 1,130,012 | |||||||
Federal National Mortgage Association | Aaa | 6.625% | 11/15/30 | 170 | 209,615 | |||||||
Tennessee Valley Authority | Aaa | 5.88% | 04/01/36 | 1,315 | 1,493,919 | |||||||
| 10,136,962 | ||||||||||||
U.S. Government Mortgage-Backed Securities — 33.9% | ||||||||||||
Federal Home Loan Mortgage Corp. | Aaa | 4.50% | 11/01/18-05/01/19 | 19,929 | 19,424,938 | |||||||
Federal Home Loan Mortgage Corp. | Aaa | 5.00% | 01/01/19-05/01/34 | 10,068 | 9,897,466 | |||||||
Federal Home Loan Mortgage Corp. | Aaa | 5.00% | TBA | 11,000 | 10,700,622 | |||||||
Federal Home Loan Mortgage Corp. | Aaa | 5.50% | 10/01/33-01/12/34 | 7,336 | 7,294,731 | |||||||
Federal Home Loan Mortgage Corp. | Aaa | 6.00% | 11/01/33-05/01/34 | 8,323 | 8,410,671 | |||||||
Federal Home Loan Mortgage Corp. | Aaa | 6.00% | TBA | 2,500 | 2,524,220 | |||||||
Federal Home Loan Mortgage Corp. | Aaa | 6.50% | 07/01/32 | 4,155 | 4,265,414 | |||||||
Federal Home Loan Mortgage Corp. | Aaa | 7.00% | 10/01/32-11/01/33 | 8,829 | 9,197,757 | |||||||
Federal National Mortgage Association | Aaa | 4.00% | 05/01/2019 | 9,290 | 8,881,178 | |||||||
Federal National Mortgage Association | Aaa | 4.50% | 01/01/19-02/01/35 | 35,524 | 34,388,606 | |||||||
Federal National Mortgage Association | Aaa | 4.50% | TBA | 11,000 | 10,700,932 | |||||||
Federal National Mortgage Association | Aaa | 5.00% | 01/01/19-03/01/34 | 55,268 | 53,892,437 | |||||||
Federal National Mortgage Association | Aaa | 5.00% | TBA | 18,500 | 17,972,655 | |||||||
Federal National Mortgage Association | Aaa | 5.50% | 12/01/16-02/01/34 | 86,503 | 86,044,612 | |||||||
Federal National Mortgage Association | Aaa | 5.50% | TBA | 27,500 | 27,225,000 | |||||||
Federal National Mortgage Association | Aaa | 6.00% | 09/01/17-02/01/35 | 26,608 | 26,929,531 | |||||||
Federal National Mortgage Association | Aaa | 6.00% | TBA | 31,500 | 31,785,453 | |||||||
Federal National Mortgage Association | Aaa | 6.50% | 11/01/09-11/01/33 | 9,763 | 10,038,782 | |||||||
Federal National Mortgage Association | Aaa | 7.00% | 05/15/32-06/01/32 | 893 | 932,081 | |||||||
Federal National Mortgage Association | Aaa | 9.00% | 10/01/16-09/01/21 | 36 | 37,653 | |||||||
Government National Mortgage Association | Aaa | 5.50% | 05/15/33-06/20/35 | 12,485 | 12,555,076 | |||||||
Government National Mortgage Association | Aaa | 6.00% | 12/15/25-11/15/34 | 14,096 | 14,427,334 | |||||||
Government National Mortgage Association | Aaa | 6.50% | 09/15/32-11/15/33 | 8,336 | 8,709,516 | |||||||
Government National Mortgage Association | Aaa | 7.50% | 10/15/25-02/15/26 | 233 | 245,835 | |||||||
| 416,482,500 | ||||||||||||
U.S. Government Treasury Securities — 3.1% | ||||||||||||
United States Treasury Bonds(a) | Aaa | 5.375% | 02/15/31 | 5,710 | 6,413,935 | |||||||
United States Treasury Notes(a) | Aaa | 4.375% | 11/15/08 | 1,165 | 1,165,182 | |||||||
United States Treasury Notes(a) | Aaa | 4.375% | 12/15/10 | 11,755 | 11,764,180 | |||||||
United States Treasury Notes | Aaa | 1.875% | 07/15/15 | 2,949 | 2,900,220 | |||||||
United States Treasury Notes(a) | Aaa | 4.50% | 11/15/15 | 14,895 | 15,017,183 | |||||||
United States Treasury Strip Principal | Aaa | Zero | 11/15/27 | 2,940 | 1,078,163 | |||||||
| 38,338,863 | ||||||||||||
TOTAL LONG-TERM BONDS | 1,206,497,511 | |||||||||||
| SHORT-TERM INVESTMENTS — 19.2% | Shares | |||||||||||
Mutual Funds — 19.2% | ||||||||||||
Dryden Core Investment Fund — Dryden Short-Term Bond Series(d) | 6,543,614 | 65,430,904 | ||||||||||
Dryden Core Investment Fund — Taxable Money Market Fund Series (includes $118,044,608 of cash collateral received for securities on loan) (Note 4)(c)(d) | 170,734,742 | 170,734,742 | ||||||||||
TOTAL MUTUAL FUNDS | 236,165,646 | |||||||||||
SEE NOTES TO FINANCIAL STATEMENTS.
B23
| DIVERSIFIED BOND PORTFOLIO (Continued) |
SCHEDULE OF INVESTMENTS | December 31, 2005 |
SHORT-TERM INVESTMENTS (Continued) OUTSTANDING OPTIONS PURCHASED | Contracts | Value (Note 2) | |||||||||||
Call Options | |||||||||||||
90 Day Euro, expiring 9/18/06 @ $95.25 | 129 | $ | 54,019 | ||||||||||
TOTAL SHORT-TERM INVESTMENT |
| 236,219,665 | |||||||||||
TOTAL INVESTMENTS, BEFORE OUTSTANDING OPTIONS WRITTEN — 117.2% |
| 1,442,717,176 | |||||||||||
| OUTSTANDING OPTIONS WRITTEN | |||||||||||||
Call Options | |||||||||||||
90 Day Euro, expiring 9/18/06 @ $95.75 | (129 | ) | (15,319 | ) | |||||||||
TOTAL INVESTMENTS, NET OF OUTSTANDING OPTIONS WRITTEN — 117.2% |
| 1,442,701,857 | |||||||||||
OTHER LIABILITIES IN EXCESS OF OTHER ASSETS(j) — (17.2%) |
| (212,055,874 | ) | ||||||||||
TOTAL NET ASSETS — 100.0% |
| $ | 1,230,645,983 | ||||||||||
The following abbreviations are used in portfolio descriptions:
| AUD | Australian Dollar | |
| CAD | Canadian Dollar | |
| EUR | Euro Dollar | |
| GBP | British Pound Sterling | |
| HUF | Hungarian Forint | |
| JPY | Japanese Yen | |
| MXP | Mexican Peso | |
| NZD | New Zealand Dollar | |
| PLN | Polish Zloty | |
| NR | Not Rated by Moody’s or Standard & Poor’s | |
| MTN | Medium Term Note | |
| TBA | Securities purchased on a forward commitment basis |
| (a) | All or portion of security is on loan. The aggregate market value of such securities is $115,342,737; cash collateral of $118,044,608 (included in liabilities) was received with which the Portfolio purchased highly liquid short term investments. |
| (b) | Increase/decrease in rate variable upon increase/decrease in Moody’s or Standard & Poor’s rating. |
| (c) | Represents security, or a portion thereof, purchased with cash collateral received for securities on loan. |
| (d) | Prudential Investments LLC, the manager of the Portfolio, also serves as manager of the Dryden Core Investment Fund – Taxable Money Market Series and the Dryden Core Investment Fund – Dryden Short-Term Bond Series. |
| (e) | Security segregated as collateral for future contracts. |
| (f) | Standard & Poor’s rating. |
| (g) | Indicates a variable rate security. The maturity date presented for these instruments is the latter of the next date on which the security can be redeemed at par or the next date on which the rate of interest is adjusted. The interest rate shown reflects the rate in effect at December 31, 2005. |
| (h) | Security was purchased pursuant to Rule 144A under the Securities Act of 1933 and may not be resold subject to that rule except to qualified institutional buyers. Unless otherwise noted 144A securities are deemed to be liquid. |
| (i) | Indicates a security that has been deemed illiquid. |
| (j) | Other liabilities in excess of other assets include net unrealized appreciation (depreciation) on financial futures, interest rate swaps, credit default swaps and foreign currency contracts as follows: |
SEE NOTES TO FINANCIAL STATEMENTS.
B24
| DIVERSIFIED BOND PORTFOLIO (Continued) |
SCHEDULE OF INVESTMENTS | December 31, 2005 |
Open futures contracts outstanding at December 31, 2005:
| Number of Contracts | Type | Expiration Date | Value at Trade Date | Value at December 31, 2005 | Unrealized Appreciation/ (Depreciation) | |||||||||
| Long Positions: | ||||||||||||||
| 592 | Eurodollar Futures | Mar 2006 | $ | 141,015,657 | $ | 140,933,000 | $ | (82,657 | ) | |||||
| 515 | U. S. Treasury 30 Yr. Bond | Mar 2006 | 57,690,876 | 58,806,563 | 1,115,687 | |||||||||
| 52 | Fed Funds | Apr 2006 | 20,659,834 | 20,660,819 | 985 | |||||||||
| 53 | U.S. Treasury 5 Yr. Notes | Mar 2006 | 5,605,642 | 5,636,219 | 30,577 | |||||||||
| 1,064,592 | ||||||||||||||
| Short Positions: | ||||||||||||||
| 1467 | U.S. Treasury 2 Yr. Notes | Mar 2006 | 301,103,153 | 301,010,063 | 93,090 | |||||||||
| 168 | U.S. Treasury 10 Yr. Notes | Mar 2006 | 18,225,174 | 18,380,250 | (155,076 | ) | ||||||||
| (61,986 | ) | |||||||||||||
| $ | 1,002,606 | |||||||||||||
Forward Foreign currency exchange contracts outstanding at December 31, 2005:
Foreign Currency Contract | Value at Settlement Date | Current Value | Unrealized Appreciation/ (Depreciation) | |||||||
Purchased: | ||||||||||
Australian Dollar | $ | 2,844,000 | $ | 2,763,902 | $ | (80,098 | ) | |||
expiring 01/19/06 | 3,097,483 | 3,097,140 | (343 | ) | ||||||
Canadian Dollar expiring 01/04/06 | 3,149,504 | 3,156,793 | 7,289 | |||||||
Euro Dollar expiring 01/24/06 | 2,921,200 | 2,899,397 | (21,803 | ) | ||||||
Norwegian Krone expiring 01/23/06 | 5,597,796 | 5,507,541 | (90,255 | ) | ||||||
New Zealand Dollar | 45,061 | 45,621 | 560 | |||||||
expiring 01/19/06 | 3,089,200 | 3,090,550 | 1,350 | |||||||
| 20,744,244 | 20,560,944 | (183,300 | ) | |||||||
Sold: | ||||||||||
Australian Dollar | 3,098,752 | 3,098,747 | 5 | |||||||
expiring 01/19/06 | 6,229,264 | 6,051,737 | 177,527 | |||||||
expiring 01/19/06 | 3,073,800 | 3,039,115 | 34,685 | |||||||
Canadian Dollars expiring 01/12/06 | 3,150,180 | 3,157,554 | (7,374 | ) | ||||||
Euro Dollar expiring 01/24/06 | 3,302,857 | 3,297,142 | 5,715 | |||||||
Hungarian Forint expiring 01/20/06 | 3,558,388 | 3,499,940 | 58,448 | |||||||
Mexican Peso expiring 01/12/06 | 3,269,563 | 3,233,709 | 35,854 | |||||||
Norwegian Krone expiring 01/23/06 | 5,593,874 | 5,507,541 | 86,333 | |||||||
New Zealand Dollar | 3,962,845 | 3,815,665 | 147,180 | |||||||
expiring 01/19/06 | 3,073,800 | 3,053,319 | 20,481 | |||||||
Polish Zloty | 10,715,994 | 10,589,602 | 126,392 | |||||||
expiring 01/20/06 | 3,342,902 | 3,324,259 | 18,643 | |||||||
expiring 01/20/06 | 1,475,400 | 1,475,154 | 246 | |||||||
| 53,847,619 | 53,143,484 | 704,135 | ||||||||
| $ | 520,835 | |||||||||
SEE NOTES TO FINANCIAL STATEMENTS.
B25
| DIVERSIFIED BOND PORTFOLIO (Continued) |
SCHEDULE OF INVESTMENTS | December 31, 2005 |
Interest rate swap agreements outstanding at December 31, 2005:
Counterparty | Termination Date | Notional Amount (000) | Fixed Rate | Floating Rate | Unrealized Appreciation | ||||||||
Morgan Stanley Capital Services, Inc.(a) | 7/14/2010 | $ | 17,000 | 5.046 | % | 3 month LIBOR | $ | 143,253 | |||||
Merrill Lynch Capital Services(b) | 12/15/2015 | 6,100 | 5.090 | % | 3 month LIBOR | 93,742 | |||||||
Merrill Lynch Capital Services(b) | 12/15/2025 | 6,100 | 5.25 | % | 3 month LIBOR | 177,567 | |||||||
| $ | 414,562 | ||||||||||||
| (a) | Portfolio pays the floating rate and receives the fixed rate. |
| (b) | Portfolio pays the fixed rate and receives the floating rate. |
Credit default swap agreements outstanding at December 31, 2005:
Counterparty | Termination Date | Notional Amount (000) | Fixed Rate | Underlying | Unrealized Appreciation/ (Depreciation) | |||||||||
Morgan Stanley Capital Services, Inc.(a) | 9/20/2015 | $ | 4,000 | 0.57 | % | Dow Chemical Co., 6.00%, due 10/1/12 | $ | 23,685 | ||||||
Morgan Stanley Capital Services, Inc.(b) | 12/20/2009 | 1,855 | 0.75 | % | RPM International, Inc., 6.25%, due 12/15/13 | (6,894 | ) | |||||||
Morgan Stanley Capital Services, Inc.(b) | 12/20/2009 | 3,295 | 0.60 | % | RPM International, Inc., 6.25%, due 12/15/13 | 5,849 | ||||||||
Morgan Stanley Capital Services, Inc.(a) | 12/20/2014 | 5,500 | 1.17 | % | Nextel Communications, Inc., 7.375%, due 8/1/15 | 219,064 | ||||||||
Morgan Stanley Capital Services, Inc.(a) | 6/20/2009 | 4,000 | 0.82 | % | Tyco International Group SA, 6.00%, due 11/15/13 | 46,044 | ||||||||
| $ | 287,748 | |||||||||||||
| (a) | The Portfolio receives the fixed rate and pays the counterparty par in the event that the underlying bond defaults. |
| (b) | The Portfolio pays the fixed rate and receives from the counterparty par in the event that the underlying bond defaults. |
SEE NOTES TO FINANCIAL STATEMENTS.
B26
| DIVERSIFIED BOND PORTFOLIO (Continued) |
SCHEDULE OF INVESTMENTS | December 31, 2005 |
The industry classification of portfolio holdings and liabilities in excess of other assets shown as a percentage of net assets as of December 31, 2005 was as follows:
U.S. Government Mortgage-Backed Securities | 33.9 | % | |
Mutual Funds (including 9.6% of collateral received for securities on loan) | 19.2 | ||
Commercial Mortgage-Backed Securities | 8.7 | ||
Non-Corporate Sovereign | 6.4 | ||
Telecommunications | 5.2 | ||
Electric | 4.3 | ||
Asset-Backed Securities | 3.5 | ||
U.S. Government Treasury Securities | 3.1 | ||
Banking | 2.8 | ||
Structured Notes | 2.6 | ||
Capital Goods | 2.2 | ||
Chemicals | 2.2 | ||
Health Care & Pharmaceutical | 2.1 | ||
Automotive | 2.0 | ||
Non-Captive Finance | 1.8 | ||
Technology | 1.7 | ||
Pipelines & Other | 1.5 | ||
Building Materials & Construction | 1.2 | ||
Energy — Other | 1.2 | ||
Media & Entertainment | 1.2 | ||
Non-Corporate Foreign Agency | 1.2 | ||
Collateralized Mortgage Obligations | 1.1 | ||
Foods | 1.1 | ||
Retailers | 1.1 | ||
Lodging | 0.8 | ||
U.S. Government Agency Obligations | 0.8 | ||
Insurance | 0.7 | ||
Metals | 0.7 | ||
Aerospace/Defense | 0.6 | ||
Tobacco | 0.6 | ||
Cable | 0.4 | ||
Energy — Integrated | 0.3 | ||
Gaming | 0.3 | ||
Real Estate Investment Trusts | 0.3 | ||
Airlines | 0.2 | ||
Paper | 0.2 | ||
| 117.2 | |||
Other liabilities in excess of other assets | (17.2 | ) | |
| 100.0 | % | ||
SEE NOTES TO FINANCIAL STATEMENTS.
B27
| EQUITY PORTFOLIO |
SCHEDULE OF INVESTMENTS | December 31, 2005 |
| LONG-TERM INVESTMENTS — 98.1% | Value | ||||
| COMMON STOCKS | Shares | ||||
Air Freight & Logistics | |||||
United Parcel Service, Inc. | 1,735 | $ | 130,385 | ||
Aerospace & Defense — 3.4% | |||||
Honeywell International, Inc. | 1,107,600 | 41,258,100 | |||
Boeing Co. | 815,857 | 57,305,796 | |||
Lockheed Martin Corp. | 300,683 | 19,132,459 | |||
Raytheon Co. | 700,265 | 28,115,640 | |||
| 145,811,995 | |||||
Beverages — 1.7% | |||||
PepsiCo, Inc. | 1,223,223 | 72,268,015 | |||
Biotechnology — 2.6% | |||||
Amgen, Inc.* | 730,067 | 57,573,084 | |||
Genetech, Inc. | 281,513 | 26,039,952 | |||
Gilead Sciences, Inc.* | 496,752 | 26,144,058 | |||
| 109,757,094 | |||||
Building & Building Products — 0.5% | |||||
American Standard Cos., Inc. | 509,047 | 20,336,428 | |||
Building Materials — 0.6% | |||||
Masco Corp. | 814,662 | 24,594,646 | |||
Business Services | |||||
Accenture Ltd. (Class “A” Stock)* | 2,802 | 80,894 | |||
Capital Markets — 4.8% | |||||
Bank of New York Co., Inc. (The) | 80,300 | 25,489,555 | |||
Goldman Sachs Group, Inc. | 379,112 | 48,416,393 | |||
Mellon Financial Corp. | 16,538 | 566,427 | |||
Merrill Lynch & Co., Inc. | 1,109,249 | 75,129,435 | |||
Schwab, (Charles) Corp. | 1,905,100 | 27,947,817 | |||
UBS AG | 267,600 | 25,462,140 | |||
| 203,011,767 | |||||
Chemicals — 1.6% | |||||
Air Products & Chemicals, Inc. | 900 | 53,271 | |||
Du Pont de Nemours & Co. | 1,093,614 | 46,478,595 | |||
Ecolab, Inc. | 555,628 | 20,152,628 | |||
| 66,684,494 | |||||
Clothing & Apparel | |||||
Cintas Corp. | 844 | 34,756 | |||
Commercial Banks — 3.4% | |||||
Bank of America Corp. | 1,376,948 | 63,546,150 | |||
Royal Bank of Scotland Group PLC (United Kingdom) | 509,900 | 15,396,220 | |||
Wachovia Corp. | 381,635 | 20,173,226 | |||
Wells Fargo & Co. | 754,857 | 47,427,665 | |||
| 146,543,261 | |||||
Commercial Services & Supplies — 0.6% | |||||
Waste Management, Inc. | 883,600 | 26,817,260 | |||
Communication Equipment — 1.1% | |||||
Cisco Systems, Inc.* | 12,989 | 222,372 | |||
Corning, Inc. | 2,475 | 48,658 | |||
Motorola, Inc. | 396,262 | 8,951,558 | |||
Nokia Corp., ADR (Finland) | 1,081,242 | 19,786,728 | |||
| COMMON STOCKS | Value | ||||
| (Continued) | Shares | ||||
Communication Equipment (cont’d.) | |||||
Nortel Networks Corp.* (Canada) | 19,265 | $ | 58,951 | ||
QUALCOMM, Inc. | 433,160 | 18,660,533 | |||
| 47,728,800 | |||||
Computer Networking — 0.5% | |||||
IBM Business Machines Corp. | 269,650 | 22,165,230 | |||
Computers & Peripherals — 0.9% | |||||
Apple Computer, Inc.* | 357,600 | 25,707,864 | |||
Dell, Inc.* | 415,441 | 12,459,075 | |||
EMC Corp.* | 8,140 | 110,867 | |||
Sun Microsystems Inc. | 5,400 | 22,626 | |||
| 38,300,432 | |||||
Conglomerates | |||||
Cooper Industries Ltd. (Class “A” Stock) (Bermuda) | 410 | 29,930 | |||
Consumer Finance — 1.4% | |||||
American Express Co. | 1,185,846 | 61,023,635 | |||
Diversified — 0.4% | |||||
Textron, Inc. | 230,585 | 17,750,433 | |||
Diversified Financial Services — 2.2% | |||||
Capital One Financial Corp. | 345,575 | 29,857,680 | |||
Citigroup, Inc. | 467,404 | 22,683,116 | |||
Freddie Mac | 1,390 | 90,837 | |||
J.P. Morgan Chase & Co. | 1,095,547 | 43,482,260 | |||
| 96,113,893 | |||||
Diversified Telecommunication Services | |||||
Verizon Communications Inc. | 17,543 | 528,395 | |||
Electric Utilities — 0.8% | |||||
Exelon Corp. | 626,600 | 33,297,524 | |||
Electronic Components — 0.1% | |||||
Dolby Laboratories, Inc. | 274,258 | 4,676,099 | |||
Energy Equipment & Services — 3.1% | |||||
BJ Services Co. | 5,010 | 183,717 | |||
Cooper Cameron Corp.* | 6,490 | 268,686 | |||
ENSCO International, Inc. | 315,026 | 13,971,403 | |||
GlobalSantaFe Corp. | 1,260,336 | 60,685,178 | |||
Halliburton Co. | 488,500 | 30,267,460 | |||
Weatherford International, Inc. Ltd.* | 697,200 | 25,238,640 | |||
| 130,615,084 | |||||
Energy Traders — 0.8% | |||||
TXU Corp. | 717,200 | 35,996,268 | |||
Financial – Bank & Trust — 0.5% | |||||
Golden West Financial Corp. | 333,657 | 22,021,362 | |||
PNC Financial Services Group, Inc. | 1,986 | 122,794 | |||
| 22,144,156 | |||||
Financial – Brokerage | |||||
Ameriprise Financial, Inc. | 177 | 7,257 | |||
Food & Staples Retailing — 2.4% | |||||
Kroger Co. (The)* | 1,645,700 | 31,070,816 | |||
Wal-Mart Stores, Inc. | 1,010,792 | 47,305,066 | |||
Whole Foods Market, Inc. | 334,000 | 25,848,260 | |||
| 104,224,142 | |||||
SEE NOTES TO FINANCIAL STATEMENTS.
B28
| EQUITY PORTFOLIO (Continued) |
SCHEDULE OF INVESTMENTS | December 31, 2005 |
| COMMON STOCKS | Value | ||||
| (Continued) | Shares | ||||
Food Products — 2.3% | |||||
Cadbury Schweppes PLC, ADR | 686,800 | $ | 26,297,572 | ||
Kellogg Co. | 611,215 | 26,416,712 | |||
McCormick & Co., Inc. | 617,523 | 19,093,811 | |||
Sara Lee Corp. | 1,397,055 | 26,404,340 | |||
| 98,212,435 | |||||
Food | |||||
General Mills, Inc. | 792 | 39,061 | |||
Health Care Equipment & Supplies — 0.9% | |||||
Alcon, Inc. | 87,400 | 11,327,040 | |||
Medtronic, Inc. | 1,486 | 85,549 | |||
St. Jude Medical, Inc.* | 561,630 | 28,193,826 | |||
| 39,606,415 | |||||
Health Care Providers & Services — 3.7% | |||||
Caremark Rx, Inc.* | 430,600 | 22,300,774 | |||
Coventry Health Care, Inc.* | 375,623 | 21,395,486 | |||
Tenet Healthcare Corp.* | 2,352 | 18,016 | |||
UnitedHealth Group, Inc. | 1,390,847 | 86,427,233 | |||
Wellpoint, Inc.* | 362,806 | 28,948,291 | |||
| 159,089,800 | |||||
Hotels & Motels — 0.5% | |||||
Station Casinos, Inc. | 286,478 | 19,423,208 | |||
Hotels, Restaurants & Leisure — 1.2% | |||||
GTECH Holdings Corp. | 831,700 | 26,398,158 | |||
McDonald’s Corp. | 816,961 | 27,547,925 | |||
Outback Steakhouse, Inc. | 560 | 23,301 | |||
| 53,969,384 | |||||
Household Durables — 0.4% | |||||
Newell Rubbermaid, Inc. | 785,708 | 18,684,136 | |||
Household Products — 2.2% | |||||
Kimberly-Clark Corp. | 345,964 | 20,636,753 | |||
Procter & Gamble Co. | 1,254,459 | 72,608,087 | |||
| 93,244,840 | |||||
Industrial Conglomerates — 3.8% | |||||
General Electric Co. | 3,771,026 | 132,174,461 | |||
Tyco International Ltd. | 1,118,208 | 32,271,483 | |||
| 164,445,944 | |||||
Insurance — 4.3% | |||||
AFLAC, Inc. | 400,970 | 18,613,027 | |||
Allstate Corp. (The) | 2,922 | 157,993 | |||
American International Group, Inc. | 1,100,528 | 75,089,025 | |||
Axis Capital Holdings Ltd. | 811,700 | 25,389,976 | |||
Berkshire Hathaway, Inc. | 218 | 19,319,160 | |||
Chubb Corp. | 198,832 | 19,415,945 | |||
Conseco, Inc. | 2,165 | 50,163 | |||
Hartford Financial Service Group, Inc. | 614 | 52,737 | |||
Loews Corp. | 256,700 | 24,347,995 | |||
| 182,436,021 | |||||
Internet & Catalog Retail — 0.9% | |||||
eBay, Inc.* | 869,571 | 37,608,946 | |||
| COMMON STOCKS | Value | ||||
| (Continued) | Shares | ||||
Internet Software & Services — 2.4% | |||||
Google, Inc. (Class “A” Stock)* | 122,400 | $ | 50,778,864 | ||
Oracle Corp.* | 10,373 | 126,654 | |||
Yahoo!, Inc.* | 1,360,125 | 53,289,698 | |||
| 104,195,216 | |||||
Leisure Equipment & Products | |||||
Mattel, Inc. | 2,812 | 44,486 | |||
Media — 2.1% | |||||
Comcast Corp. (Class “A” Stock) | 2,900 | 75,284 | |||
Comcast Corp. | 1,045 | 26,846 | |||
EchoStar Communications Corp. | 610,019 | 16,574,216 | |||
News Corp., Inc. (Class “A” Stock) | 213,426 | 3,318,774 | |||
News Corp., Inc. (Class “B” Stock) | 1,381,038 | 22,939,041 | |||
Time Warner, Inc.* | 1,437,006 | 25,061,385 | |||
Univision Communications, Inc. | 1,102 | 32,388 | |||
Viacom, Inc. (Class “B” Stock) | 709,839 | 23,140,751 | |||
| 91,168,685 | |||||
Metals & Mining — 6.2% | |||||
Barrick Gold Corp. (Canada) | 1,746,706 | 48,680,696 | |||
Companhia Vale Do Rio Doce, ADR (Brazil) | 1,203,700 | 49,520,218 | |||
Freeport-McMoRan Copper & Gold, Inc. (Class “B” Stock) | 967,600 | 52,056,880 | |||
Inco Ltd. | 575,400 | 25,070,178 | |||
Newcrest Mining Ltd., ADR (Australia) | 2,045,600 | 36,463,434 | |||
Phelps Dodge Corp. | 238,100 | 34,255,447 | |||
Placer Dome, Inc. (Canada) | 926,547 | 21,245,723 | |||
| 267,292,576 | |||||
Multi-Utilities — 1.2% | |||||
Sempra Energy | 1,184,346 | 53,106,075 | |||
Multiline Retail — 1.6% | |||||
Federated Department Stores, Inc. | 373,500 | 24,774,255 | |||
J. C. Penney Co., Inc. | 1,300 | 72,280 | |||
Kohl’s Corp.* | 530 | 25,758 | |||
Staples, Inc. | 802,841 | 18,232,519 | |||
Target Corp. | 497,713 | 27,359,284 | |||
| 70,464,096 | |||||
Office Electronics — 0.8% | |||||
Xerox Corp.* | 2,246,100 | 32,905,365 | |||
Oil & Gas — 3.7% | |||||
Burlington Resources, Inc. | 254,625 | 21,948,675 | |||
Exxon Mobil Corp. | 798,528 | 44,853,318 | |||
Suncor Energy, Inc. (Canada) | 788,491 | 49,746,213 | |||
Total SA, ADR (France) | 338,663 | 42,807,003 | |||
| 159,355,209 | |||||
Oil, Gas & Consumable Fuels — 3.4% | |||||
Apache Corp. | 546,210 | 37,426,309 | |||
Nexen, Inc. | 1,436,331 | 68,412,446 | |||
Occidental Petroleum Corp. | 509,800 | 40,722,824 | |||
| 146,561,579 | |||||
SEE NOTES TO FINANCIAL STATEMENTS.
B29
| EQUITY PORTFOLIO (Continued) |
SCHEDULE OF INVESTMENTS | December 31, 2005 |
| COMMON STOCKS | Value | ||||
| (Continued) | Shares | ||||
Pharmaceuticals — 5.6% | |||||
Abbott Laboratories | 3,655 | $ | 144,117 | ||
Eli Lilly & Co. | 1,697 | 96,033 | |||
Johnson & Johnson | 2,172 | 130,537 | |||
MedImmune, Inc.* | 1,986 | 69,550 | |||
Merck & Co., Inc. | 4,000 | 127,240 | |||
Novartis AG, ADR (Switzerland) | 836,000 | 43,873,280 | |||
Pfizer, Inc. | 2,648,875 | 61,771,765 | |||
Roche Hldgs Ltd., ADR (Switzerland) | 397,800 | 29,775,767 | |||
Sanofi-Aventis, ADR (France) | 1,178,122 | 51,719,556 | |||
Sepracor, Inc.* | 309,515 | 15,970,974 | |||
Teva Pharmaceutical Industries Ltd., ADR (Israel) | 848,412 | 36,490,200 | |||
Wyeth | 6,609 | 304,477 | |||
| 240,473,496 | |||||
Retail & Merchandising — 1.5% | |||||
Best Buy Co., Inc. | 897,089 | 39,005,430 | |||
Chico’s FAS, Inc.* | 529,900 | 23,278,507 | |||
CVS Corp. | 1,060 | 28,005 | |||
TJX Cos., Inc. | 1,310 | 30,431 | |||
| 62,342,373 | |||||
Semiconductors & Semiconductor Equipment — 4.0% | |||||
Analog Devices, Inc. | 1,080 | 38,740 | |||
Applied Materials, Inc.* | 555,528 | 9,966,172 | |||
ASML Holding NV* (Netherlands) | 788,116 | 15,825,369 | |||
Fisher Scientific International, Inc.* | 275 | 17,011 | |||
Intel Corp. | 2,197,762 | 54,856,140 | |||
KLA-Tencor Corp.* | 552 | 27,230 | |||
Marvell Technology Group Ltd.* | 581,005 | 32,588,570 | |||
Maxim Integrated Products, Inc. | 671,300 | 24,327,912 | |||
Texas Instruments, Inc. | 1,105,755 | 35,461,563 | |||
Xilinx, Inc. | 1,070 | 26,975 | |||
| 173,135,682 | |||||
Software — 6.4% | |||||
Adobe Systems, Inc. | 1,513,013 | 55,920,961 | |||
Cognos, Inc.* (Canada) | 284,375 | 9,870,656 | |||
Computer Associates International, Inc. | 1,036,100 | 29,207,659 | |||
Electronic Arts, Inc.* | 783,809 | 41,001,049 | |||
Mercury Interactive Corp.* | 922 | 25,622 | |||
Microsoft Corp. | 3,719,595 | 97,267,409 | |||
NAVTEQ Corp.* | 378,000 | 16,582,860 | |||
SAP AG, ADR (Germany) | 500,300 | 22,548,521 | |||
Symantec Corp.* | 13,210 | 231,175 | |||
| 272,655,912 | |||||
Specialty Retail — 0.5% | |||||
Bed Bath & Beyond, Inc.* | 138,469 | 5,005,654 | |||
Home Depot, Inc. | 1,445 | 58,494 | |||
Lowe's Cos., Inc. | 246,292 | 16,417,825 | |||
| 21,481,973 | |||||
Supplies — 0.5% | |||||
Paychex, Inc. | 547,510 | 20,871,081 | |||
Technology | |||||
Seagate Technology, Inc. | 350 | — | |||
| COMMON STOCKS | Value | |||||
| (Continued) | Shares | |||||
Telecommunications — 0.9% | ||||||
ADC Telecommunications, Inc. | 893,211 | $ | 19,954,334 | |||
Alltel Corp. | 281,748 | 17,778,299 | ||||
Comverse Technology, Inc.* | 25,703 | 683,443 | ||||
| 38,416,076 | ||||||
Textiles, Apparels & Luxury — 0.6% | ||||||
Coach, Inc.* | 710,500 | 23,688,070 | ||||
Tobacco — 1.5% | ||||||
Altria Group, Inc.* | 837,700 | 62,592,944 | ||||
Transportation | ||||||
Expeditors International of Washington, Inc. | 283 | 19,105 | ||||
FedEx Corp. | 250 | 25,848 | ||||
| 44,953 | ||||||
Wireless Telecommunications Services — 1.6% |
| |||||
Sprint Nextel Corp. | 2,872,508 | 67,101,787 | ||||
TOTAL LONG-TERM INVESTMENTS | 4,205,330,097 | |||||
| SHORT-TERM INVESTMENTS — 15.7% | ||||||
Mutual Fund | ||||||
Dryden Core Investment Fund — Taxable Money Market Series | 672,787,774 | 672,787,774 | ||||
TOTAL INVESTMENTS — 113.8% | 4,878,117,871 | |||||
OTHER ASSETS IN EXCESS OF | (592,177,177 | ) | ||||
NET ASSETS — 100.0% | $ | 4,285,940,694 | ||||
The following abbreviations are used in portfolio descriptions:
| ADR | American Depositary Receipt |
| * | Non-income producing security. |
| (a) | All or a portion of security on loan. The aggregate market value of such securities is $573,434,139; cash collateral of $596,781,337 (included with liabilities) was received with which the portfolio purchased highly liquid short-term investments. |
| (b) | Represents security purchased with cash collateral for securities on loan. |
| (c) | Prudential Investments LLC, the manager of the Fund also serves as manager of the Dryden Core Investment Fund-Taxable Money Market Series. |
SEE NOTES TO FINANCIAL STATEMENTS.
B30
| EQUITY PORTFOLIO (Continued) |
SCHEDULE OF INVESTMENTS | December 31, 2005 |
The industry classification of portfolio holdings and liabilities in excess of other assets shown as a percentage of net assets as of December 31, 2005 were as follows:
Mutual Fund (including 13.9% of collateral received for securities on loan) | 15.7 | % | |
Software | 6.4 | ||
Metals & Mining | 6.2 | ||
Pharmaceuticals | 5.6 | ||
Capital Markets | 4.8 | ||
Insurance | 4.3 | ||
Semiconductors & Semiconductor Equipment | 4.0 | ||
Industrial Conglomerates | 3.8 | ||
Health Care Providers & Services | 3.7 | ||
Oil & Gas | 3.7 | ||
Aerospace/Defense | 3.4 | ||
Commercial Banks | 3.4 | ||
Oil, Gas & Consumable Fuels | 3.4 | ||
Energy Equipment & Services | 3.1 | ||
Biotechnology | 2.6 | ||
Food & Staples Retailing | 2.4 | ||
Internet Software & Services | 2.4 | ||
Food Products | 2.3 | ||
Diversified Financial Services | 2.2 | ||
Household Products | 2.2 | ||
Media | 2.1 | ||
Beverages | 1.7 | ||
Chemicals | 1.6 | ||
Multiline Retail | 1.6 | ||
Wireless Telecommunications Services | 1.6 | ||
Retail & Merchandising | 1.5 | ||
Tobacco | 1.5 | ||
Consumer Finance | 1.4 | ||
Multi-Utilities | 1.2 | ||
Hotels, Restaurants & Leisure | 1.2 | ||
Communication Equipment | 1.1 | ||
Computers & Peripherals | 0.9 | ||
Health Care Equipment & Supplies | 0.9 | ||
Internet & Catalog Retail | 0.9 | ||
Telecommunications | 0.9 | ||
Electric Utilities | 0.8 | ||
Energy Traders | 0.8 | ||
Office Electronics | 0.8 | ||
Building Materials | 0.6 | ||
Commercial Services & Supplies | 0.6 | ||
Textiles, Apparels & Luxury | 0.6 | ||
Building & Building Products | 0.5 | ||
Computer Networking | 0.5 | ||
Financial — Bank & Trust | 0.5 | ||
Hotels & Motels | 0.5 | ||
Specialty Retail | 0.5 | ||
Supplies | 0.5 | ||
Diversified | 0.4 | ||
Household Durables | 0.4 | ||
Electronic Components | 0.1 | ||
| 113.8 | |||
Liabilities in excess of other assets | (13.8 | ) | |
Total | 100.0 | % | |
SEE NOTES TO FINANCIAL STATEMENTS.
B31
| FLEXIBLE MANAGED PORTFOLIO |
SCHEDULE OF INVESTMENTS | December 31, 2005 |
| LONG-TERM INVESTMENTS — 94.8% | Value (Note 2) | ||||
| COMMON STOCKS — 69.4% | Shares | ||||
Aerospace/Defense — 1.9% | |||||
Armor Holdings, Inc.(a) | 68,900 | $ | 2,938,585 | ||
General Dynamics Corp. | 129,900 | 14,815,095 | |||
Honeywell International, Inc. | 40,200 | 1,497,450 | |||
Lockheed Martin Corp. | 347,300 | 22,098,699 | |||
Northrop Grumman Corp. | 319,100 | 19,181,101 | |||
Raytheon Co. | 126,400 | 5,074,960 | |||
Rockwell Collins, Inc. | 6,100 | 283,467 | |||
United Technologies Corp. | 4,900 | 273,959 | |||
| 66,163,316 | |||||
Apparel — 0.3% | |||||
Liz Claiborne, Inc.(b) | 76,700 | 2,747,394 | |||
The Gap, Inc. | 166,400 | 2,935,296 | |||
V.F. Corp. | 62,000 | 3,431,080 | |||
| 9,113,770 | |||||
Autos – Cars & Trucks — 1.0% | |||||
AutoNation, Inc.(a)(b) | 67,100 | 1,458,083 | |||
Ford Motor Co.(b) | 563,000 | 4,346,360 | |||
General Motors Corp.(b) | 133,200 | 2,586,744 | |||
Harley-Davidson, Inc.(b) | 297,100 | 15,297,679 | |||
PACCAR, Inc. | 184,800 | 12,793,704 | |||
| 36,482,570 | |||||
Banks & Savings & Loans — 4.1% | |||||
AmSouth Bancorporation(b) | 62,600 | 1,640,746 | |||
Bank of America Corp.(b) | 966,882 | 44,621,605 | |||
Bank of New York Co., Inc. (The) | 12,000 | 382,200 | |||
BB&T Corp.(b) | 201,200 | 8,432,292 | |||
Comerica, Inc. | 163,700 | 9,291,612 | |||
First BanCorp. (Puerto Rico) | 135,000 | 1,675,350 | |||
Huntington Bancshares, Inc. | 47,400 | 1,125,750 | |||
KeyCorp. | 268,500 | 8,841,705 | |||
National City Corp.(b) | 237,900 | 7,986,303 | |||
North Fork Bancorporation, Inc. | 76,700 | 2,098,512 | |||
Popular, Inc. | 13,300 | 281,295 | |||
Sovereign Bancorp, Inc. | 70,600 | 1,526,372 | |||
SunTrust Banks, Inc. | 55,400 | 4,030,904 | |||
SVB Financial Group(a)(b) | 11,100 | 519,924 | |||
TD Banknorth, Inc.(b) | 54,200 | 1,574,510 | |||
U.S. Bancorp | 837,432 | 25,030,842 | |||
Wachovia Corp.(b) | 270,400 | 14,293,344 | |||
Wells Fargo & Co. | 188,200 | 11,824,606 | |||
Zions Bancorporation | 13,900 | 1,050,284 | |||
| 146,228,156 | |||||
Biotechnology — 0.3% | |||||
Biogen Idec, Inc.(a) | 195,400 | 8,857,482 | |||
Chemicals — 0.6% | |||||
Chemtura Corp. | 69,400 | 881,380 | |||
Eastman Chemical Co. | 105,100 | 5,422,109 | |||
Lyondell Chemical Co. | 48,200 | 1,148,124 | |||
Neurocrine Biosciences, Inc.(a) | 31,700 | 1,988,541 | |||
Rohm and Haas Co. | 18,900 | 915,138 | |||
The Dow Chemical Co. | 266,600 | 11,682,412 | |||
| 22,037,704 | |||||
| COMMON STOCKS (Continued) | Shares | Value (Note 2) | |||
Commercial Services — 0.1% | |||||
Aramark Corp., (Class “B” Stock) | 900 | $ | 25,002 | ||
Convergys Corp.(a) | 4,200 | 66,570 | |||
Corporate Executive Board Co. | 5,500 | 493,350 | |||
Moody’s Corp.(b) | 12,100 | 743,182 | |||
Robert Half International, Inc. | 66,400 | 2,515,896 | |||
| 3,844,000 | |||||
Computers — 1.7% | |||||
Dell, Inc.(a) | 173,000 | 5,188,270 | |||
Hewlett-Packard Co. | 533,365 | 15,270,240 | |||
International Business Machines Corp. | 498,600 | 40,984,920 | |||
| 61,443,430 | |||||
Computer Services — 3.5% | |||||
Black Box Corp. | 19,400 | 919,172 | |||
Cisco Systems, Inc.(a) | 1,009,000 | 17,274,080 | |||
Computer Sciences Corp.(a) | 144,500 | 7,317,480 | |||
Digital Insight Corp.(a)(b) | 83,600 | 2,676,872 | |||
EMC Corp.(a) | 813,700 | 11,082,594 | |||
Komag, Inc.(a) | 5,700 | 197,562 | |||
Lexmark International, Inc.(a) | 105,300 | 4,720,599 | |||
Microsoft Corp. | 1,706,900 | 44,635,435 | |||
MicroStrategy, Inc., (Class “A” Stock)(a) | 64,300 | 5,320,182 | |||
Network Appliance, Inc.(a) | 117,900 | 3,183,300 | |||
Oracle Corp.(a) | 2,094,100 | 25,568,961 | |||
Synaptics, Inc.(a) | 80,900 | 1,999,848 | |||
| 124,896,085 | |||||
Construction — 0.6% | |||||
Eagle Materials, Inc. | 21,400 | 2,618,504 | |||
Martin Marietta Materials, Inc. | 80,700 | 6,191,304 | |||
Masco Corp. | 222,200 | 6,708,218 | |||
Standard Pacific Corp. | 118,800 | 4,371,840 | |||
USG Corp.(a) | 30,800 | 2,002,000 | |||
| 21,891,866 | |||||
Consumer Products — 0.4% | |||||
Coach, Inc.(a) | 398,100 | 13,272,654 | |||
Containers & Packaging — 0.2% | |||||
Ball Corp. | 96,300 | 3,825,036 | |||
Egl, Inc.(a) | 44,500 | 1,671,865 | |||
| 5,496,901 | |||||
Cosmetics & Soaps — 0.8% | |||||
Procter & Gamble Co. | 514,505 | 29,779,549 | |||
Data Processing/Management | |||||
Alliance Data Systems Corp.(a)(b) | 11,500 | 409,400 | |||
Distribution/Wholesaler — 0.3% | |||||
CDW Corp.(b) | 138,200 | 7,956,174 | |||
Fastenal Co.(b) | 67,400 | 2,641,406 | |||
The Sherwin-Williams Co. | 3,800 | 172,596 | |||
| 10,770,176 | |||||
Diversified Operations — 3.7% | |||||
3M Co. | 319,200 | 24,738,000 | |||
Cendant Corp. | 80,300 | 1,385,175 | |||
SEE NOTES TO FINANCIAL STATEMENTS.
B32
| FLEXIBLE MANAGED PORTFOLIO (Continued) |
SCHEDULE OF INVESTMENTS | December 31, 2005 |
| COMMON STOCKS (Continued) | Shares | Value (Note 2) | |||
Diversified Operations (cont’d.) | |||||
Chemed Corp. | 22,500 | $ | 1,117,800 | ||
Cooper Industries Ltd. (Class “A” Stock) (Bermuda) | 56,600 | 4,131,800 | |||
Eaton Corp. | 137,200 | 9,204,748 | |||
General Electric Co. | 1,961,200 | 68,740,060 | |||
Illinois Tool Works, Inc. | 42,200 | 3,713,178 | |||
Ingersoll-Rand Co. (Class “A” Stock) | 410,800 | 16,583,996 | |||
| 129,614,757 | |||||
Drugs & Medical Supplies — 6.7% | |||||
Abbott Laboratories | 233,700 | 9,214,791 | |||
Allergan, Inc.(b) | 154,700 | 16,701,412 | |||
American Medical Systems Holdings, Inc.(a) | 33,300 | 593,739 | |||
Amgen, Inc.(a) | 356,308 | 28,098,449 | |||
Bausch & Lomb, Inc.(b) | 64,200 | 4,359,180 | |||
Baxter International, Inc. | 461,400 | 17,371,710 | |||
Becton, Dickinson & Co. | 192,400 | 11,559,392 | |||
C.R. Bard, Inc. | 69,100 | 4,555,072 | |||
Dade Behring Holdings, Inc. | 27,800 | 1,136,742 | |||
Hospira, Inc.(a) | 12,920 | 552,718 | |||
Johnson & Johnson (b) | 776,998 | 46,697,579 | |||
Laboratory Corp. of America Holdings(a)(b) | 80,300 | 4,324,155 | |||
Lilly (Eli) & Co. | 23,500 | 1,329,865 | |||
Medtronic, Inc. | 195,800 | 11,272,206 | |||
Merck & Co., Inc.(b) | 778,500 | 24,764,085 | |||
Palomar Medical Technologies, Inc.(a) | 34,500 | 1,208,880 | |||
Pfizer, Inc. | 1,967,565 | 45,883,616 | |||
Quest Diagnostics, Inc. | 126,900 | 6,532,812 | |||
Techne Corp.(a) | 3,100 | 174,065 | |||
Thoratec Corp.(a)(b) | 70,700 | 1,462,783 | |||
| 237,793,251 | |||||
Education — 0.1% | |||||
Barnes & Noble, Inc. | 12,000 | 512,040 | |||
Career Education Corp.(a) | 61,300 | 2,067,036 | |||
Strayer Education, Inc. | 23,600 | 2,211,320 | |||
| 4,790,396 | |||||
Electronics — 0.7% | |||||
Emerson Electric Co. | 90,100 | 6,730,470 | |||
Jabil Circuit, Inc.(a) | 27,400 | 1,016,266 | |||
National Instruments Corp. | 21,300 | 682,665 | |||
Rockwell Automation, Inc. | 85,800 | 5,075,928 | |||
Synopsys, Inc.(a) | 146,000 | 2,928,760 | |||
Tech Data Corp.(a) | 47,300 | 1,876,864 | |||
Thomas & Betts Corp.(a) | 36,700 | 1,539,932 | |||
Waters Corp.(a)(b) | 135,400 | 5,118,120 | |||
| 24,969,005 | |||||
Energy Equipment & Services — 0.1% | |||||
Rowan Cos., Inc. | 125,000 | 4,455,000 | |||
Financial Services — 6.9% | |||||
American Express Co. | 25,500 | 1,312,230 | |||
AmeriCredit Corp.,(a)(b) | 197,000 | 5,049,110 | |||
Ameriprise Financial, Inc. | 12,020 | 492,820 | |||
Bear, Stearns & Co., Inc. | 87,400 | 10,097,322 | |||
| COMMON STOCKS (Continued) | Shares | Value (Note 2) | |||
Financial Services (cont’d.) | |||||
Capital One Financial Corp. | 69,900 | $ | 6,039,360 | ||
CIT Group, Inc. | 203,000 | 10,511,340 | |||
Citigroup, Inc. | 957,362 | 46,460,777 | |||
Compucredit Corp.(a) | 22,000 | 846,560 | |||
Countrywide Credit Industries, Inc. | 411,900 | 14,082,861 | |||
Fannie Mae | 15,000 | 732,150 | |||
First Marblehead Corp.(b) | 24,500 | 805,070 | |||
Fiserv, Inc.(a)(b) | 321,100 | 13,893,997 | |||
Friedman, Billings, Ramsey Group, Inc. | 138,600 | 1,372,140 | |||
Goldman Sachs Group, Inc. | 205,500 | 26,244,405 | |||
J.P. Morgan Chase & Co. | 679,994 | 26,988,961 | |||
Lehman Brothers Holdings, Inc. | 183,700 | 23,544,829 | |||
Merrill Lynch & Co., Inc. | 317,900 | 21,531,367 | |||
Morgan Stanley | 268,390 | 15,228,449 | |||
PNC Financial Services Corp. | 13,700 | 847,071 | |||
R. R. Donnelley & Sons Co. | 133,200 | 4,556,772 | |||
SEI Investments Co. | 11,200 | 414,400 | |||
Washington Mutual, Inc. | 296,212 | 12,885,222 | |||
| 243,937,213 | |||||
Food & Beverage — 2.9% | |||||
Anheuser-Busch Cos, Inc.(b) | 208,100 | 8,939,976 | |||
Archer-Daniels-Midland Co. | 244,900 | 6,039,234 | |||
Chiquita Brands International, Inc. | 64,700 | 1,294,647 | |||
Coca-Cola Co. | 691,800 | 27,886,458 | |||
Coca-Cola Enterprises, Inc.(b) | 312,600 | 5,992,542 | |||
ConAgra Foods, Inc. | 16,500 | 334,620 | |||
Molson Coors Brewing Co. | 8,500 | 569,415 | |||
Pepsi Bottling Group, Inc. | 232,900 | 6,663,269 | |||
PepsiCo, Inc. | 267,820 | 15,822,806 | |||
Pilgrim’s Pride Corp. | 137,700 | 4,566,132 | |||
Sanderson Farms, Inc.(b) | 44,100 | 1,346,373 | |||
Sara Lee Corp.(b) | 25,600 | 483,840 | |||
Smithfield Foods, Inc.(a) | 81,100 | 2,481,660 | |||
SUPERVALU, Inc.(b) | 142,800 | 4,638,144 | |||
The Kroger Co.(a) | 473,000 | 8,930,240 | |||
Tyson Foods, Inc., (Class “A” Stock) | 105,043 | 1,796,235 | |||
Whole Foods Market, Inc. | 52,000 | 4,024,280 | |||
| 101,809,871 | |||||
Forest Products | |||||
Louisiana-Pacific Corp. | 48,900 | 1,343,283 | |||
Gas Pipelines — 0.1% | |||||
Sempra Energy | 41,173 | 1,846,197 | |||
Healthcare — 0.4% | |||||
Aetna, Inc. | 25,200 | 2,376,612 | |||
Boston Scientific Corp.(a) | 18,900 | 462,861 | |||
Cytyc Corp.(a) | 88,100 | 2,487,063 | |||
Dentsply International, Inc. | 14,900 | 799,981 | |||
Digene Corp.(a) | 17,000 | 495,890 | |||
Respironics, Inc.(a) | 30,100 | 1,115,807 | |||
UnitedHealth Group, Inc. | 122,000 | 7,581,080 | |||
| 15,319,294 | |||||
Healthcare Equipment & Supplies | |||||
St. Jude Medical, Inc.(a) | 6,200 | 311,240 | |||
SEE NOTES TO FINANCIAL STATEMENTS.
B33
| FLEXIBLE MANAGED PORTFOLIO (Continued) |
SCHEDULE OF INVESTMENTS | December 31, 2005 |
| COMMON STOCKS (Continued) | Shares | Value (Note 2) | |||
Healthcare Providers & Services — 0.1% | |||||
Cardinal Health, Inc. | 29,000 | $ | 1,993,750 | ||
Hospital Management — 0.6% | |||||
Caremark Rx, Inc.(a) | 308,900 | 15,997,931 | |||
Universal Health Services, Inc. | 5,300 | 247,722 | |||
WellPoint, Inc.(a) | 71,800 | 5,728,922 | |||
| 21,974,575 | |||||
Household & Personal Care Products — 0.9% | |||||
Chattem, Inc.(a) | 19,600 | 713,244 | |||
Kimberly-Clark Corp. | 314,800 | 18,777,820 | |||
Parlux Fragrances, Inc.(a)(b) | 52,300 | 1,596,719 | |||
Pulte Homes, Inc.(b) | 232,400 | 9,147,264 | |||
The Clorox Co. | 7,200 | 409,608 | |||
USANA Health Sciences, Inc.(a)(b) | 44,600 | 1,710,856 | |||
| 32,355,511 | |||||
Insurance — 4.0% | |||||
Allstate Corp. | 371,500 | 20,087,005 | |||
American Financial Group, Inc. | 44,000 | 1,685,640 | |||
American International Group, Inc. | 364,835 | 24,892,692 | |||
Assurant, Inc. | 110,100 | 4,788,249 | |||
CIGNA Corp. | 112,500 | 12,566,250 | |||
Fidelity National Financial, Inc. | 17,600 | 647,504 | |||
LandAmerica Financial Group, Inc. | 30,000 | 1,872,000 | |||
Lincoln National Corp. | 47,400 | 2,513,622 | |||
Loews Corp. | 42,000 | 3,983,700 | |||
MBIA, Inc.(b) | 143,600 | 8,638,976 | |||
MetLife, Inc. | 219,400 | 10,750,600 | |||
MGIC Investment Corp. | 166,900 | 10,985,358 | |||
PMI Group, Inc. | 24,600 | 1,010,322 | |||
Principal Financial Group, Inc. | 116,800 | 5,539,824 | |||
Radian Group, Inc. | 5,400 | 316,386 | |||
SAFECO Corp. | 35,100 | 1,983,150 | |||
The Hartford Financial Services Group, Inc.(b) | 133,000 | 11,423,370 | |||
The St. Paul Travelers Cos., Inc. | 427,200 | 19,083,024 | |||
| 142,767,672 | |||||
Internet Software & Services — 0.1% | |||||
EarthLink, Inc.(a)(b) | 74,100 | 823,251 | |||
Internet Security Systems, Inc.(a) | 35,100 | 735,345 | |||
Overstock.com, Inc.(a)(b) | 66,400 | 1,869,160 | |||
| 3,427,756 | |||||
Leisure — 0.6% | |||||
Brunswick Corp. | 52,900 | 2,150,914 | |||
Marriott International, Inc. | 35,300 | 2,364,041 | |||
Polaris Industries, Inc.(b) | 25,400 | 1,275,080 | |||
Sabre Holdings Corp., (Class “A” Stock) | 101,800 | 2,454,398 | |||
Starbucks Corp.(a) | 437,700 | 13,135,377 | |||
| 21,379,810 | |||||
Machinery — 0.2% | |||||
Deere & Co. | 58,500 | 3,984,435 | |||
Dover Corp. | 27,000 | 1,093,230 | |||
Kyphon, Inc.(a) | 36,000 | 1,469,880 | |||
Navistar International Corp.(a) | 35,200 | 1,007,424 | |||
W.W. Grainger, Inc. | 13,200 | 938,520 | |||
| 8,493,489 | |||||
| COMMON STOCKS (Continued) | Shares | Value (Note 2) | |||
Manufacturing — 0.1% | |||||
JAKKS Pacific, Inc.(a) | 21,500 | $ | 450,210 | ||
Parker Hannifin Corp. | 26,200 | 1,728,152 | |||
Wellman, Inc. | 9,400 | 63,732 | |||
| 2,242,094 | |||||
Media — 1.5% | |||||
Comcast Corp. (Special Class “A” Stock)(a)(b) | 860,882 | 22,348,497 | |||
Entercom Communications Corp.(a) | 13,900 | 412,413 | |||
Gannett Co., Inc. | 210,100 | 12,725,757 | |||
Harman International Industries, Inc. | 112,400 | 10,998,340 | |||
Meredith Corp. | 3,600 | 188,424 | |||
Time Warner, Inc. | 357,550 | 6,235,672 | |||
| 52,909,103 | |||||
Media & Entertainment — 1.0% | |||||
The DIRECTV Group, Inc.(a) | 9,700 | 136,964 | |||
Tribune Co. | 103,600 | 3,134,936 | |||
Univision Communications, Inc.(a) | 183,800 | 5,401,882 | |||
Viacom, Inc. (Class “B” Stock) | 774,038 | 25,233,639 | |||
| 33,907,421 | |||||
Metals – Non Ferrous — 0.1% | |||||
Phelps Dodge Corp. | 16,500 | 2,373,855 | |||
Metal – Steel — 0.2% | |||||
Nucor Corp. | 68,900 | 4,597,008 | |||
Reliance Steel & Aluminum Co. | 19,400 | 1,185,728 | |||
United States Steel Corp. | 43,600 | 2,095,852 | |||
| 7,878,588 | |||||
Metals & Mining — 0.4% | |||||
Freeport-McMoRan Copper & Gold, Inc. | 254,100 | 13,670,580 | |||
Quanex Corp. | 34,300 | 1,713,971 | |||
| 15,384,551 | |||||
Miscellaneous Consumer Growth — 0.1% | |||||
Energizer Holdings, Inc.(a)(b) | 74,300 | 3,699,397 | |||
Multi-Utilities | |||||
Centerpoint Energy, Inc. | 30,300 | 389,355 | |||
Dominion Resources, Inc.(b) | 4,300 | 331,960 | |||
| 721,315 | |||||
Office Equipment & Supplies — 0.3% | |||||
Herman Miller, Inc. | 74,100 | 2,088,879 | |||
Pitney Bowes, Inc. | 19,600 | 828,100 | |||
Xerox Corp.(a) | 554,900 | 8,129,285 | |||
| 11,046,264 | |||||
Oil & Gas Exploration & Production — 0.6% | |||||
Occidental Petroleum Corp. | 47,500 | 3,794,300 | |||
Valero Energy Corp. | 308,800 | 15,934,080 | |||
| 19,728,380 | |||||
Oil, Gas & Consumable Fuels — 6.3% | |||||
Anadarko Petroleum Corp.(b) | 35,600 | 3,373,100 | |||
Apache Corp. | 106,800 | 7,317,936 | |||
ChevronTexaco Corp. | 736,256 | 41,797,253 | |||
Conoco, Inc. (Class “B” Stock) | 582,334 | 33,880,192 | |||
Devon Energy Corp. | 227,324 | 14,216,843 | |||
Diamond Offshore Drilling, Inc.(b) | 30,400 | 2,114,624 | |||
Energen Corp. | 14,300 | 519,376 | |||
Exxon Mobil Corp. | 1,185,916 | 66,612,902 | |||
SEE NOTES TO FINANCIAL STATEMENTS.
B34
| FLEXIBLE MANAGED PORTFOLIO (Continued) |
SCHEDULE OF INVESTMENTS | December 31, 2005 |
| COMMON STOCKS (Continued) | Shares | Value (Note 2) | |||
Oil, Gas & Consumable Fuels (cont’d.) | |||||
Helmerich & Payne, Inc | 26,300 | $ | 1,628,233 | ||
Marathon Oil Corp. | 107,100 | 6,529,887 | |||
Nabors Industries Ltd.(a) | 52,300 | 3,961,725 | |||
ONEOK, Inc. | 74,000 | 1,970,620 | |||
Parker Drilling Company(a) | 36,400 | 394,212 | |||
Pogo Producing Co. | 19,200 | 956,352 | |||
Schlumberger Ltd. | 181,700 | 17,652,155 | |||
Tesoro Petroleum Corp. | 19,100 | 1,175,605 | |||
Tidewater, Inc.(b) | 175,400 | 7,798,284 | |||
Transocean, Inc.(a) | 126,100 | 8,787,909 | |||
Unit Corp.(a) | 65,700 | 3,615,471 | |||
| 224,302,679 | |||||
Pharmaceuticals — 0.9% | |||||
Alkermes, Inc.(a) | 35,000 | 669,200 | |||
Bristol-Myers Squibb Co. | 177,400 | 4,076,652 | |||
King Pharmaceuticals, Inc.(a) | 39,500 | 668,340 | |||
Sepracor, Inc.(a)(b) | 23,100 | 1,191,960 | |||
Wyeth | 562,300 | 25,905,161 | |||
| 32,511,313 | |||||
Real Estate Investment Trusts — 0.1% | |||||
American Home Mortgage Investment Corp.(b) | 91,600 | 2,983,412 | |||
RealNetworks, Inc.(a) | 63,000 | 488,880 | |||
Thornburg Mortgage, Inc.(b) | 12,600 | 330,120 | |||
| 3,802,412 | |||||
Restaurants — 0.6% | |||||
Brinker International, Inc. | 5,500 | 212,630 | |||
CEC Entertainment, Inc.(a) | 12,650 | 430,606 | |||
Darden Restaurants, Inc. | 143,200 | 5,567,616 | |||
Jack in the Box, Inc.(a) | 45,300 | 1,582,329 | |||
McDonald’s Corp. | 196,000 | 6,609,120 | |||
Yum! Brands, Inc. | 179,700 | 8,424,336 | |||
| 22,826,637 | |||||
Retail — 3.0% | |||||
American Eagle Outfitters, Inc. | 270,800 | 6,222,984 | |||
Bed Bath & Beyond, Inc.(a) | 219,300 | 7,927,695 | |||
BJ’s Wholesale Club, Inc.(a)(b) | 92,200 | 2,725,432 | |||
Blue Nile Inc.(a)(b) | 6,700 | 270,077 | |||
Carter’s, Inc.(a) | 7,000 | 411,950 | |||
Costco Wholesale Corp. | 11,800 | 583,746 | |||
Dollar General Corp.(b) | 271,700 | 5,181,319 | |||
Federated Department Stores, Inc. | 105,100 | 6,971,283 | |||
Home Depot, Inc. | 603,550 | 24,431,704 | |||
J.C. Penney Co., Inc. | 399,400 | 22,206,640 | |||
Jones Apparel Group, Inc. | 101,500 | 3,118,080 | |||
Lowe’s Cos., Inc. (The) | 14,400 | 959,904 | |||
MSC Industrial Direct Co. | 5,100 | 205,122 | |||
Pacific Sunwear of California, Inc.(a) | 61,900 | 1,542,548 | |||
Rent-A-Center, Inc.(a) | 9,900 | 186,714 | |||
Safeway, Inc. | 225,700 | 5,340,062 | |||
Select Comfort Corp.(a)(b) | 77,800 | 2,127,830 | |||
Too, Inc.(a) | 29,200 | 823,732 | |||
Wal-Mart Stores, Inc. | 316,500 | 14,812,200 | |||
| 106,049,022 | |||||
Road & Rail | |||||
Landstar System, Inc. | 9,300 | 388,182 | |||
Semiconductors — 2.8% | |||||
Cymer, Inc.(a) | 110,400 | 3,920,304 | |||
Emulex Corp.(a) | 175,100 | 3,465,229 | |||
Freescale Semiconductor, Inc.(a) | 60,000 | 1,510,200 | |||
Intel Corp. | 2,032,600 | 50,733,696 | |||
| COMMON STOCKS (Continued) | Shares | Value (Note 2) | |||
Semiconductors (cont’d.) | |||||
Lam Research Corp.(a) | 20,400 | $ | 727,872 | ||
LSI Logic Corp.(a) | 311,800 | 2,494,400 | |||
Micrel, Inc.(a) | 184,300 | 2,137,880 | |||
National Semiconductor Corp. | 284,100 | 7,380,918 | |||
NVIDIA Corp.(a) | 26,000 | 950,560 | |||
QLogic Corp.(a) | 10,900 | 354,359 | |||
Texas Instruments, Inc. | 824,700 | 26,448,129 | |||
| 100,123,547 | |||||
Software — 0.2% | |||||
BMC Software, Inc.(a) | 46,000 | 942,540 | |||
Cadence Design System, Inc.(a) | 35,100 | 593,892 | |||
Electronic Arts, Inc.(a) | 10,000 | 523,100 | |||
Intuit, Inc.(a)(b) | 32,400 | 1,726,920 | |||
SERENA Software, Inc.(a)(b) | 58,400 | 1,368,896 | |||
| 5,155,348 | |||||
Telecommunications — 3.2% | |||||
ALLTEL Corp. | 7,800 | 492,180 | |||
AT&T Inc. | 821,513 | 20,118,844 | |||
Avocent Corp.(a) | 61,000 | 1,658,590 | |||
BellSouth Corp. | 29,100 | 788,610 | |||
CenturyTel, Inc.(b) | 175,600 | 5,822,896 | |||
Crown Castle International Corp.(a) | 70,600 | 1,899,846 | |||
Harris Corp. | 75,700 | 3,255,857 | |||
Motorola, Inc. | 1,018,600 | 23,010,174 | |||
QUALCOMM, Inc. | 667,800 | 28,768,824 | |||
Sprint Nextel Corp. | 135,200 | 3,158,272 | |||
Verizon Communications, Inc.(b) | 802,588 | 24,173,951 | |||
| 113,148,044 | |||||
Tobacco — 1.0% | |||||
Altria Group, Inc. | 293,000 | 21,892,960 | |||
Reynolds American, Inc.(b) | 129,900 | 12,383,367 | |||
UST, Inc. | 24,900 | 1,016,667 | |||
| 35,292,994 | |||||
Trucking & Shipping — 1.3% | |||||
CNF, Inc. | 51,800 | 2,895,102 | |||
FedEx Corp. | 155,200 | 16,046,128 | |||
OMI Corp. | 6,100 | 110,715 | |||
Overseas Shipholding Group, Inc. | 2,400 | 120,936 | |||
Ryder System, Inc. | 19,800 | 812,196 | |||
Swift Transportation Co., Inc.(a) | 61,900 | 1,256,570 | |||
United Parcel Service, Inc. (Class “B” Stock) | 306,200 | 23,010,930 | |||
| 44,252,577 | |||||
Utilities – Electric — 1.8% | |||||
Alliant Energy Corp. | 89,200 | 2,501,168 | |||
American Electric Power Co., Inc. | 211,000 | 7,825,990 | |||
DTE Energy Co. | 85,800 | 3,705,702 | |||
Duke Energy Corp.(b) | 595,200 | 16,338,240 | |||
Edison International | 72,000 | 3,139,920 | |||
FirstEnergy Corp. | 47,400 | 2,322,126 | |||
NiSource, Inc. | 96,100 | 2,004,646 | |||
Pepco Holdings, Inc. | 35,000 | 782,950 | |||
Pinnacle West Capital Corp. | 98,600 | 4,077,110 | |||
PPL Corp. | 86,900 | 2,554,860 | |||
Progress Energy, Inc. | 13,000 | 570,960 | |||
TXU Corp. | 339,500 | 17,039,505 | |||
| 62,863,177 | |||||
TOTAL COMMON STOCKS | 2,459,876,029 | ||||
SEE NOTES TO FINANCIAL STATEMENTS.
B35
| FLEXIBLE MANAGED PORTFOLIO (Continued) |
SCHEDULE OF INVESTMENTS | December 31, 2005 |
Interest | Maturity Date | Moody’s Rating (Unaudited) | Principal Amount (000) | Value (Note 2) | ||||||
| LONG-TERM BONDS — 25.4% | ||||||||||
Aerospace/Defense — 0.3% | ||||||||||
BAE Systems Holdings, Inc.,(h) | ||||||||||
Notes, 144A | ||||||||||
| 4.75% | 08/15/10 | Baa2 | $ | 1,450 | $ | 1,424,035 | ||||
| 5.20% | 08/15/15 | Baa2 | 1,060 | 1,038,744 | ||||||
Boeing Capital Corp., | ||||||||||
Sr. Notes | ||||||||||
| 6.10% | 03/01/11 | A3 | 925 | 974,602 | ||||||
Goodrich Corp., | ||||||||||
Notes | ||||||||||
| 7.625% | 12/15/12 | Baa3 | 970 | 1,100,215 | ||||||
Lockheed Martin Corp., | ||||||||||
| Bonds | ||||||||||
| 8.50% | 12/01/29 | Baa2 | 120 | 163,556 | ||||||
Northrop Grumman Corp. | ||||||||||
Notes | ||||||||||
| 7.125% | 02/15/11 | Baa2 | 3,500 | 3,813,925 | ||||||
Raytheon Co., | ||||||||||
Notes | ||||||||||
| 4.50% | 11/15/07 | Baa3 | 177 | 175,475 | ||||||
| 5.50% | 11/15/12 | Baa3 | 595 | 608,537 | ||||||
| 6.55% | 03/15/10 | Baa3 | 870 | 916,739 | ||||||
| 8.30% | 03/01/10 | Baa3 | 530 | 593,647 | ||||||
| 10,809,475 | ||||||||||
Airlines | ||||||||||
Continental Airlines, Inc., | ||||||||||
Pass-thru Certs. | ||||||||||
| 6.648% | 09/15/17 | Baa3 | 423 | 413,295 | ||||||
Southwest Airlines Co., | ||||||||||
Notes | ||||||||||
| 6.50% | 03/01/12 | Baa1 | 1,005 | 1,057,131 | ||||||
| 1,470,426 | ||||||||||
Asset Backed Securities — 0.9% | ||||||||||
American Express Credit Account Master Trust,(g)(h) | ||||||||||
Ser. 2004-4, Class C, 144A | ||||||||||
| 4.839% | 03/15/12 | Baa2 | 1,170 | 1,175,301 | ||||||
Ser. 2004-C, Class C, 144A | ||||||||||
| 4.869% | 02/15/12 | Baa2 | 1,091 | 1,093,442 | ||||||
Bank One Issuance Trust, | ||||||||||
Ser. 2003-C1, Class C1 | ||||||||||
| 4.54% | 09/15/10 | Baa2 | 1,820 | 1,802,066 | ||||||
CDC Mortgage Capital Trust, | ||||||||||
Ser. 2002-HE3, Class M1 | ||||||||||
| 5.48% | 03/25/33 | Aa2 | 1,261 | 1,270,530 | ||||||
Centex Home Equity,(g) | ||||||||||
Ser. 2005-A, Class M2 | ||||||||||
| 4.88% | 01/25/35 | Aa2 | 1,790 | 1,790,619 | ||||||
Chase Issuance Trust, | ||||||||||
Ser. 2005-A4, Class A4 | ||||||||||
| 4.23% | 01/15/13 | Aaa | 3,200 | 3,125,646 | ||||||
Citibank Credit Card Issurance Trust, | ||||||||||
Ser. 2003-C3, Class C3 | ||||||||||
| 4.45% | 04/07/10 | Baa2 | 1,300 | 1,283,357 | ||||||
Credit-Based Asset Servicing And Securitization, | ||||||||||
Ser. 2005-CB6, Class A3 | ||||||||||
| 5.12% | 07/25/35 | Aaa | 1,400 | 1,394,408 | ||||||
Interest | Maturity Date | Moody’s Rating (Unaudited) | Principal Amount (000) | Value (Note 2) | ||||||
| LONG-TERM BONDS (Continued) | ||||||||||
Asset Backed Securities (cont’d.) | ||||||||||
Equity One ABS, Inc., | ||||||||||
Ser. 2004-3, Class M1 | ||||||||||
| 5.70% | 07/25/34 | Aa2 | $ | 1,280 | $ | 1,280,812 | ||||
First Franklin Mortgage Loan Trust,(g) | ||||||||||
Ser. 2005-FFH1, Class M2 | ||||||||||
| 4.90% | 06/25/36 | Aa2 | 1,450 | 1,454,129 | ||||||
Home Equity Asset Trust, | ||||||||||
Ser. 2005-7, Class 2A4 | ||||||||||
| 4.76% | 01/25/36 | Aaa | 1,100 | 1,100,527 | ||||||
Household Home Equity Loan Trust, | ||||||||||
Ser. 2005-2, Class M2 | ||||||||||
| 4.86% | 01/20/35 | Aa1 | 1,143 | 1,143,006 | ||||||
Household Mortgage Loan Trust,(g) | ||||||||||
Ser. 2003-HC2, Class M | ||||||||||
| 4.97% | 06/20/33 | Aa2 | 434 | 434,133 | ||||||
Ser. 2004-HC1, Class M | ||||||||||
| 4.87% | 02/20/34 | Aa2 | 336 | 335,978 | ||||||
MBNA Master Credit Card Trust, | ||||||||||
Ser. 1999-J, Class A | ||||||||||
| 7.00% | 02/15/12 | Aaa | 1,830 | 1,965,045 | ||||||
Ser. 2000-E, Class. A | ||||||||||
| 7.80% | 10/15/12 | Aaa | 2,940 | 3,290,812 | ||||||
Morgan Stanley ABS Capital I,(g) | ||||||||||
Ser. 2004-NC3, Class M2 | ||||||||||
| 5.48% | 03/25/34 | A2 | 1,460 | 1,475,705 | ||||||
Morgan Stanley Dean Witter Capital I, | ||||||||||
Ser. 2002-NC4, Class M1 | ||||||||||
| 5.23% | 09/25/32 | Aaa | 1,432 | 1,438,368 | ||||||
Prestige Auto Receivables Trust,(h) | ||||||||||
Ser. 2004-1, Class A2, 144A | ||||||||||
| 3.69% | 06/15/11 | Aaa | 1,022 | 1,009,200 | ||||||
Saxon Asset Securities Trust,(g) | ||||||||||
Ser. 2005-2, Class M2 | ||||||||||
| 4.82% | 10/25/35 | Aa2 | 1,170 | 1,173,425 | ||||||
Securitized Asset Backed Receivables LLC, | ||||||||||
Ser. 2004-OP1, Class M1 | ||||||||||
| 4.89% | 02/25/34 | Aa2 | 1,400 | 1,403,257 | ||||||
Structured Asset Securities Corp., | ||||||||||
Ser. 2005-RMS1, Class A3 | ||||||||||
| 4.679% | 02/25/35 | AAA(f) | 1,100 | 1,102,657 | ||||||
Svo Voi Mortgage Corp. | ||||||||||
| 5.25% | 02/20/21 | Aaa | 964 | 963,728 | ||||||
WFS Financial Owner Trust, | ||||||||||
Ser. 2004-4, Class D | ||||||||||
| 3.58% | 05/17/12 | Baa2 | 991 | 974,145 | ||||||
| 33,480,296 | ||||||||||
Automotive — 0.1% | ||||||||||
Auburn Hills Trust, | ||||||||||
Debs. | ||||||||||
| 12.375% | 05/01/20 | A3 | 510 | 758,334 | ||||||
DaimlerChrysler NA Holding Corp., | ||||||||||
Gtd. Notes | ||||||||||
| 8.50% | 01/18/31 | A3 | 500 | 605,009 | ||||||
Equus Cayman Finance Ltd.,(h) | ||||||||||
Notes, 144A (Cayman Islands) | ||||||||||
| 5.50% | 09/12/08 | Baa3 | 315 | 315,829 | ||||||
SEE NOTES TO FINANCIAL STATEMENTS.
B36
| FLEXIBLE MANAGED PORTFOLIO (Continued) |
SCHEDULE OF INVESTMENTS | December 31, 2005 |
Interest | Maturity Date | Moody’s Rating (Unaudited) | Principal Amount (000) | Value (Note 2) | ||||||
| LONG-TERM BONDS (Continued) | ||||||||||
Automotive (cont’d.) | ||||||||||
General Motors Acceptance Corp., | ||||||||||
Sr. Unsub. Notes | ||||||||||
| 6.125% | 01/22/08 | Ba1 | $ | 575 | $ | 526,544 | ||||
Hyundai Motor Manufacturing LLC,(h) | ||||||||||
Gtd. Notes, 144A | ||||||||||
| 5.30% | 12/19/08 | Baa3 | 500 | 498,772 | ||||||
| 2,704,488 | ||||||||||
Banking — 0.6% | ||||||||||
Bank of America Corp.,(b) | ||||||||||
Sr. Unsec. Notes, | ||||||||||
| 4.75% | 08/01/15 | Aa2 | 1,980 | 1,920,269 | ||||||
Bank One Corp., | ||||||||||
Sub. Notes | ||||||||||
| 7.875% | 08/01/10 | A1 | 2,250 | 2,497,793 | ||||||
Citigroup, Inc., | ||||||||||
Notes | ||||||||||
| 5.625% | 08/27/12 | Aa2 | 2,800 | 2,885,993 | ||||||
| 6.00% | 10/31/33 | Aa2 | 935 | 977,840 | ||||||
| 6.625% | 06/15/32 | Aa2 | 515 | 581,944 | ||||||
Sub. Notes | ||||||||||
| 5.00% | 09/15/14 | Aa2 | 454 | 446,897 | ||||||
Credit Suisse First Boston USA, Inc., | ||||||||||
Notes | ||||||||||
| 5.13% | 08/15/15 | Aa3 | 1,160 | 1,148,786 | ||||||
First Union National Bank | ||||||||||
Sub. Notes | ||||||||||
| 7.80% | 08/18/10 | Aa3 | 2,100 | 2,357,105 | ||||||
J.P. Morgan Chase & Co., | ||||||||||
Sr. Notes | ||||||||||
| 5.15% | 10/01/15 | A1 | 1,310 | 1,291,427 | ||||||
| 5.25% | 05/30/07 | Aa3 | 210 | 210,952 | ||||||
Sub. Notes | ||||||||||
| 4.60% | 01/17/11 | Aa3 | 720 | 706,082 | ||||||
| 6.50% | 01/15/09 | A1 | 1,100 | 1,146,067 | ||||||
Mizuho Finance Ltd.(Cayman Islands),(h) | ||||||||||
Bank Gtd. Notes, 144A | ||||||||||
| 5.79% | 04/15/14 | A2 | 815 | 841,956 | ||||||
Santander Central Hispano Issuances, | ||||||||||
Bank Gtd. Notes | ||||||||||
| 7.625% | 09/14/10 | A1 | 695 | 769,717 | ||||||
Washington Mutual Bank, | ||||||||||
| 5.65% | 08/15/14 | A3 | 290 | 293,677 | ||||||
Wells Fargo & Co., | ||||||||||
Sub. Notes | ||||||||||
| 5.125% | 09/15/16 | Aa2 | 210 | 208,373 | ||||||
Wells Fargo Bank, | ||||||||||
Sub. Notes | ||||||||||
| 6.45% | 02/01/11 | Aa1 | 2,000 | 2,131,468 | ||||||
Zions Bancorporation., | ||||||||||
Sub.Notes | ||||||||||
| 5.50% | 11/16/15 | Baa1 | 430 | 433,175 | ||||||
| 20,849,521 | ||||||||||
Interest | Maturity Date | Moody’s Rating (Unaudited) | Principal Amount (000) | Value (Note 2) | ||||||
| LONG-TERM BONDS (Continued) | ||||||||||
Brokerage — 0.2% | ||||||||||
Bear Stearns Co., Inc., | ||||||||||
Unsec. Notes | ||||||||||
| 5.30% | 10/30/15 | A1 | $ | 515 | $ | 513,855 | ||||
Lehman Brothers Holdings, Inc., | ||||||||||
Notes | ||||||||||
| 6.625% | 01/18/12 | A1 | 1,670 | 1,803,047 | ||||||
Merrill Lynch & Co., Inc., | ||||||||||
Notes | ||||||||||
| 4.25% | 02/08/10 | Aa3 | 1,170 | 1,138,087 | ||||||
| 4.79% | 08/04/10 | Aa3 | 295 | 291,682 | ||||||
| 5.00% | 01/15/15 | Aa3 | 460 | 453,091 | ||||||
| 5.45% | 07/15/14 | Aa3 | 160 | 162,614 | ||||||
Morgan Stanley, | ||||||||||
Notes | ||||||||||
| 5.30% | 03/01/13 | Aa3 | 845 | 846,695 | ||||||
| 5.375% | 10/15/15 | Aa3 | 670 | 670,649 | ||||||
Sub. Notes(b) | ||||||||||
| 4.75% | 04/01/14 | A1 | 1,170 | 1,122,108 | ||||||
The Goldman Sachs Group, Inc., | ||||||||||
Sub. Notes | ||||||||||
| 6.345% | 02/15/34 | A1 | 935 | 982,248 | ||||||
| 7,984,076 | ||||||||||
Building Materials & Construction — 0.1% | ||||||||||
American Standard, Inc.,(b) | ||||||||||
Gtd. Notes | ||||||||||
| 7.625% | 02/15/10 | Baa3 | 770 | 827,655 | ||||||
Hanson PLC, | ||||||||||
Sr. Unsub. | ||||||||||
| 7.875% | 09/27/10 | Baa1 | 1,000 | 1,105,487 | ||||||
The Ryland Group, Inc., | ||||||||||
Sr. Notes | ||||||||||
| 5.375% | 06/01/08 | Baa3 | 440 | 439,760 | ||||||
| 2,372,902 | ||||||||||
Cable — 0.2% | ||||||||||
Comcast Cable Communications Holdings, Inc., | ||||||||||
Gtd. Notes | ||||||||||
| 9.46% | 11/15/22 | Baa2 | 255 | 334,100 | ||||||
Comcast Corp., | ||||||||||
Class A(b) | ||||||||||
| 5.65% | 06/15/35 | Baa2 | 1,325 | 1,219,182 | ||||||
Sr. Unsec. Notes,(b) | ||||||||||
| 6.50% | 11/15/35 | Baa2 | 675 | 687,863 | ||||||
Continental Cablevision, Inc., | ||||||||||
Sr. Notes | ||||||||||
| 8.30% | 05/15/06 | Baa2 | 4,000 | 4,048,488 | ||||||
Cox Communications, Inc., | ||||||||||
Notes, Class A | ||||||||||
| 6.75% | 03/15/11 | Baa3 | 950 | 993,423 | ||||||
| 7,283,056 | ||||||||||
Capital Goods — 0.3% | ||||||||||
Caterpillar, Inc., | ||||||||||
Debs. | ||||||||||
| 7.25% | 09/15/09 | A2 | 700 | 754,234 | ||||||
SEE NOTES TO FINANCIAL STATEMENTS.
B37
| FLEXIBLE MANAGED PORTFOLIO (Continued) |
SCHEDULE OF INVESTMENTS | December 31, 2005 |
Interest | Maturity Date | Moody’s Rating (Unaudited) | Principal Amount (000) | Value (Note 2) | ||||||
| LONG-TERM BONDS (Continued) | ||||||||||
Capital Goods (cont’d.) | ||||||||||
Cooper Cameron Corp., | ||||||||||
Sr. Notes | ||||||||||
| 2.65% | 04/15/07 | Baa1 | $ | 330 | $ | 319,065 | ||||
ERAC Usa Finance Co.,(h) | ||||||||||
Gtd. Notes, 144A | ||||||||||
| 7.35% | 06/15/08 | Baa1 | 1,950 | 2,046,246 | ||||||
FedEx Corp., | ||||||||||
Gtd. Notes | ||||||||||
| 7.25% | 02/15/11 | Baa2 | 400 | 437,321 | ||||||
Notes | ||||||||||
| 2.65% | 04/01/07 | Baa2 | 1,600 | 1,556,347 | ||||||
Honeywell International, Inc., | ||||||||||
Bonds | ||||||||||
| 6.125% | 11/01/11 | A2 | 1,095 | 1,155,814 | ||||||
Hutchison Whampoa International Ltd.,(h) | ||||||||||
Gtd. Notes, 144A | ||||||||||
| 5.45% | 11/24/10 | A3 | 825 | 831,732 | ||||||
Tyco International Group SA, | ||||||||||
Gtd. Notes | ||||||||||
| 6.00% | 11/15/13 | Baa3 | 1,265 | 1,292,180 | ||||||
United Technologies Corp., | ||||||||||
Debs. | ||||||||||
| 8.875% | 11/15/19 | A2 | 460 | 614,663 | ||||||
Notes | ||||||||||
| 6.35% | 03/01/11 | A2 | 825 | 879,239 | ||||||
Sr. Notes | ||||||||||
| 4.875% | 05/01/15 | A2 | 1,125 | 1,113,995 | ||||||
Waste Management, Inc., | ||||||||||
Gtd. Notes | ||||||||||
7.75% | 05/15/32 | Baa3 | 540 | 666,795 | ||||||
| 11,667,631 | ||||||||||
Chemicals — 0.2% | ||||||||||
Dow Chemical, | ||||||||||
Debs. | ||||||||||
| 7.38% | 11/01/29 | A3 | 525 | 632,531 | ||||||
Huntsman International LLC, | ||||||||||
Gtd. Notes | ||||||||||
| 9.875% | 03/01/09 | B2 | 1,750 | 1,846,250 | ||||||
IMC Global, Inc., | ||||||||||
Gtd. Notes, Ser. B | ||||||||||
| 11.25% | 06/01/11 | Ba3 | 1,750 | 1,881,250 | ||||||
Lubrizol Corp., | ||||||||||
Sr. Notes | ||||||||||
| 4.625% | 10/01/09 | Baa3 | 860 | 842,907 | ||||||
Lyondell Chemical Co., | ||||||||||
Gtd. Notes | ||||||||||
| 9.50% | 12/15/08 | B1 | 1,272 | 1,332,420 | ||||||
Monsanto Co., | ||||||||||
Bonds, Series 1 | ||||||||||
| 5.50% | 07/30/35 | Baa1 | 500 | 477,521 | ||||||
The Dow Chemical Co., | ||||||||||
Notes | ||||||||||
| 5.97% | 01/15/09 | A3 | 390 | 402,530 | ||||||
| 6.125% | 02/01/11 | A3 | 685 | 717,275 | ||||||
| 8,132,684 | ||||||||||
Interest | Maturity Date | Moody’s Rating (Unaudited) | Principal Amount (000) | Value (Note 2) | ||||||
| LONG-TERM BONDS (Continued) | ||||||||||
Collateralized Mortgage Obligations — 0.3% | ||||||||||
Banc of America Mortgage Securities, | ||||||||||
Ser. 2005-A, Class 2A1(g) | ||||||||||
| 4.47% | 02/25/35 | Aaa | $ | 1,373 | $ | 1,349,346 | ||||
Ser. 2005-B, Class 2A1(g) | ||||||||||
| 4.40% | 03/25/35 | Aaa | 1,378 | 1,351,185 | ||||||
Countrywide Alternative Loan Trust, | ||||||||||
Ser. 2004-18CB, Class 3A1 | ||||||||||
| 5.25% | 09/25/19 | Aaa | 2,268 | 2,222,471 | ||||||
Master Alternative Loans Trust, | ||||||||||
Ser. 2004-4, Class 4A1 | ||||||||||
| 5.00% | 04/25/19 | Aaa | 700 | 688,224 | ||||||
Structured Adjustable Rate Mortgage Loan,(g) | ||||||||||
Ser. 2004-1, Class 4A3 | ||||||||||
| 4.17% | 02/25/34 | Aaa | 1,551 | 1,529,707 | ||||||
Washington Mutual Mortgage, Pass-Through Certificates, Ser. 2005-1, Class 3A | ||||||||||
| 5.00% | 03/25/20 | Aaa | 772 | 757,291 | ||||||
Washington Mutual, Inc.,(g) | ||||||||||
Ser. 2002-AR15, Class A5 | ||||||||||
| 4.375% | 12/25/32 | Aaa | 726 | 715,521 | ||||||
| 8,613,745 | ||||||||||
Commercial Mortgage Backed Securities — 2.6% | ||||||||||
Banc of America Commercial Mortgage, Inc., 2005-1(g) | ||||||||||
| 4.86% | 11/10/42 | AAA(f) | 900 | 895,783 | ||||||
Ser. 2003-2, Class A3 | ||||||||||
| 4.873% | 03/11/41 | AAA(f) | 2,500 | 2,461,649 | ||||||
Ser. 2004-2, Class A4 | ||||||||||
| 4.153% | 11/10/38 | Aaa | 2,800 | 2,671,440 | ||||||
Ser. 2005-3, Class A-4 | ||||||||||
| 4.67% | 07/10/43 | Aaa | 2,300 | 2,216,439 | ||||||
Ser. 2005-1, Class C(g) | ||||||||||
| 5.18% | 09/10/47 | Aaa | 1,100 | 1,109,367 | ||||||
Bear Stearns Commercial Mortgage Securities, | ||||||||||
Ser. 2005-T20, Class AAB(g) | ||||||||||
| 5.14% | 10/12/42 | Aaa | 2,400 | 2,409,282 | ||||||
Ser. 2004-T16, Class A-6(g) | ||||||||||
| 4.75% | 02/13/46 | AAA(f) | 4,500 | 4,366,394 | ||||||
Ser. 2005-T18, Class AAB(g) | ||||||||||
| 4.823% | 02/13/42 | Aaa | 1,775 | 1,742,497 | ||||||
Commercial Mortgage Pass-Through Certificate,(h) | ||||||||||
Ser. 2004-LB2A, Class X2, 144A | ||||||||||
| 1.04% | 03/10/39 | Aaa | 13,816 | 467,592 | ||||||
CS First Boston Mortgage Securities Corp., | ||||||||||
Ser. 2004-C3, Class A4 | ||||||||||
| 4.835% | 07/15/36 | Aaa | 880 | 864,901 | ||||||
Ser. 2004-C4, Class A4 | ||||||||||
| 4.283% | 10/15/39 | Aaa | 1,400 | 1,342,105 | ||||||
DLJ Commercial Mortgage Corp., | ||||||||||
Ser. 2000-CF1, Class A1B | ||||||||||
| 7.62% | 06/10/33 | AAA(f) | 2,710 | 2,957,840 | ||||||
General Electric Capital Commercial Mortgage Corp.,(g) | ||||||||||
Ser. 2004-C2, Class X2 | ||||||||||
| 0.67% | 03/10/40 | Aaa | 25,108 | 598,472 | ||||||
General Electric Capital Corp., | ||||||||||
Ser. 2005-C4, Class A4 | ||||||||||
| 5.33% | 11/10/45 | Aaa | 3,200 | 3,264,875 | ||||||
SEE NOTES TO FINANCIAL STATEMENTS.
B38
| FLEXIBLE MANAGED PORTFOLIO (Continued) |
SCHEDULE OF INVESTMENTS | December 31, 2005 |
Interest | Maturity Date | Moody’s Rating (Unaudited) | Principal Amount (000) | Value (Note 2) | ||||||
| LONG-TERM BONDS (Continued) | ||||||||||
Commercial Mortgage Backed Securities (cont’d.) | ||||||||||
Greenwich Capital Commercial Funding Corp., | ||||||||||
Ser. 2003-C1, Class A4 | ||||||||||
| 4.111% | 07/05/35 | Aaa | $ | 7,700 | $ | 7,231,687 | ||||
Ser. 2003-C2, Class A3 | ||||||||||
| 4.533% | 01/05/36 | Aaa | 2,750 | 2,682,004 | ||||||
JP Morgan Chase, | ||||||||||
Ser. 2005-CB13, Class A4 | ||||||||||
| 5.29% | 01/12/43 | Aaa | 2,340 | 2,371,415 | ||||||
Ser. 2005-LDP5, Class A4 | ||||||||||
| 5.18% | 12/15/44 | Aaa | 5,000 | 5,033,349 | ||||||
J. P. Morgan Commercial Mortgage Finance Corp., | ||||||||||
Ser. 2000-C10, Class A2 | ||||||||||
| 7.37% | 08/15/32 | Aaa | 8,250 | 8,876,656 | ||||||
Ser. 2003-CB6, Class A2 | ||||||||||
| 5.26% | 07/12/37 | Aaa | 2,100 | 2,114,495 | ||||||
J.P. Morgan Chase Commercial Mortgage Securities Corp., | ||||||||||
Ser. 2004-C2, Class A3(g) | ||||||||||
| 5.213% | 05/15/41 | Aaa | 5,100 | 5,135,975 | ||||||
Ser. 2005-LDP2, Class A5B(g) | ||||||||||
| 4.918% | 10/15/42 | Aaa | 2,500 | 2,451,756 | ||||||
Ser. 2005-LDP2, Class A5B | ||||||||||
| 4.66% | 07/15/42 | Aaa | 6,350 | 6,172,196 | ||||||
KeyCorp., | ||||||||||
Ser. 2000-C1, Class A2 | ||||||||||
| 7.727% | 05/17/32 | Aaa | 9,000 | 9,780,387 | ||||||
LB-UBS Commercial Mortgage Trust, | ||||||||||
Ser. 2003-C8, Class A3 | ||||||||||
| 4.83% | 11/15/27 | Aaa | 1,460 | 1,439,699 | ||||||
Ser. 2004-C6, Class A5(g) | ||||||||||
| 4.826% | 08/15/29 | AAA(f) | 3,910 | 3,840,224 | ||||||
Merrill Lynch Mortgage Trust, | ||||||||||
Ser. 2004-KEY2, Class A3 | ||||||||||
| 4.615% | 08/12/39 | Aaa | 2,000 | 1,940,198 | ||||||
PNC Mortgage Acceptance Corp., | ||||||||||
Ser. 1999-CM1, Class A1B | ||||||||||
| 7.33% | 12/10/32 | AAA(f) | 2,100 | 2,251,414 | ||||||
| 88,690,091 | ||||||||||
Consumer Services — 0.1% | ||||||||||
Cendant Corp., | ||||||||||
| 6.875% | 08/15/06 | Baa1 | 1,320 | 1,333,549 | ||||||
Sr. Notes | ||||||||||
| 6.25% | 01/15/08 | Baa1 | 885 | 900,960 | ||||||
| 2,234,509 | ||||||||||
Electric — 0.6% | ||||||||||
Appalachian Power Co., | ||||||||||
Sr. Notes | ||||||||||
| 4.40% | 06/01/10 | Baa2 | 620 | 601,686 | ||||||
Boston Edison Co., | ||||||||||
Debs. | ||||||||||
| 4.875% | 04/15/14 | A1 | 565 | 558,486 | ||||||
Carolina Power & Light Co., | ||||||||||
| 5.25% | 12/15/15 | A3 | 525 | 524,339 | ||||||
Interest | Maturity Date | Moody’s Rating (Unaudited) | Principal Amount (000) | Value (Note 2) | ||||||
| LONG-TERM BONDS (Continued) | ||||||||||
Electric (cont’d.) | ||||||||||
CenterPoint Energy Houston Electric LLC, | ||||||||||
Mtge. Bonds, Ser. J2 | ||||||||||
| 5.70% | 03/15/13 | Baa2 | $ | 740 | $ | 763,431 | ||||
Mtge. Bond, Ser. K2 | ||||||||||
| 6.95% | 03/15/33 | Baa2 | 590 | 687,070 | ||||||
Con Edison Co. of New York, | ||||||||||
Sr. Unsec. Notes | ||||||||||
| 5.38% | 12/15/15 | A1 | 730 | 740,590 | ||||||
Consumers Energy Co., | ||||||||||
First Mtge. Bonds, Ser. B | ||||||||||
| 5.375% | 04/15/13 | Baa3 | 325 | 322,638 | ||||||
Dominion Resources, Inc., | ||||||||||
Sr. Notes | ||||||||||
| 5.125% | 12/15/09 | Baa1 | 970 | 967,165 | ||||||
Duke Capital LLC, | ||||||||||
Sr. Notes | ||||||||||
| 4.331% | 11/16/06 | Baa3 | 700 | 695,126 | ||||||
| 6.25% | 02/15/13 | Baa3 | 235 | 244,735 | ||||||
| 8.00% | 10/01/19 | Baa3 | 215 | 256,613 | ||||||
El Paso Electric Co., | ||||||||||
Sr. Unsec. Notes | ||||||||||
| 6.00% | 05/15/35 | Baa3 | 670 | 670,309 | ||||||
Empresa Nacional de Electricidad S.A. (Chile), Bonds | ||||||||||
| 8.50% | 04/01/09 | Ba1 | 1,070 | 1,166,983 | ||||||
Energy East Corp., | ||||||||||
Notes | ||||||||||
| 6.75% | 09/15/33 | Baa2 | 630 | 693,721 | ||||||
Exelon Corp., | ||||||||||
Notes | ||||||||||
| 4.90% | 06/15/15 | Baa2 | 155 | 147,929 | ||||||
FirstEnergy Corp., | ||||||||||
Notes | ||||||||||
| 7.375% | 11/15/31 | Baa3 | 735 | 867,278 | ||||||
Florida Power & Light Co., | ||||||||||
| 5.95% | 10/01/33 | Aa3 | 295 | 310,883 | ||||||
Indiana Michigan Power Co., | ||||||||||
Sr. Notes | ||||||||||
| 5.05% | 11/15/14 | Baa2 | 460 | 447,298 | ||||||
National Rural Utilities Cooperative Finance Corp., | ||||||||||
Notes, Ser MTNC | ||||||||||
| 7.25% | 03/01/12 | A2 | 185 | 206,328 | ||||||
NiSource Finance Corp., | ||||||||||
Gtd. Notes | ||||||||||
| 5.25% | 09/15/17 | Baa3 | 650 | 632,245 | ||||||
| 5.45% | 09/15/20 | Baa3 | 1,400 | 1,356,491 | ||||||
Oncor Electric Delivery Co., | ||||||||||
Debs. | ||||||||||
| 6.375% | 01/15/15 | Baa2 | 345 | 366,096 | ||||||
Pacific Gas & Electric Co., | ||||||||||
First Mtge. | ||||||||||
| 6.05% | 03/01/34 | Baa1 | 1,930 | 1,997,470 | ||||||
Pepco Holdings, Inc., | ||||||||||
Notes | ||||||||||
| 5.50% | 08/15/07 | Baa2 | 565 | 568,419 | ||||||
SEE NOTES TO FINANCIAL STATEMENTS.
B39
| FLEXIBLE MANAGED PORTFOLIO (Continued) |
SCHEDULE OF INVESTMENTS | December 31, 2005 |
Interest | Maturity Date | Moody’s Rating (Unaudited) | Principal Amount (000) | Value (Note 2) | ||||||
| LONG-TERM BONDS (Continued) | ||||||||||
Electric (cont’d.) | ||||||||||
PPL Electric Utilities Corp., | ||||||||||
Second Mtge. | ||||||||||
| 6.25% | 08/15/09 | Baa1 | $ | 1,500 | $ | 1,558,292 | ||||
Progress Energy, Inc., | ||||||||||
Sr. Notes | ||||||||||
| 6.75% | 03/01/06 | Baa2 | 1,410 | 1,414,355 | ||||||
Southern California Edison Co., | ||||||||||
First Mtge. | ||||||||||
| 4.65% | 04/01/15 | A3 | 470 | 454,671 | ||||||
TXU Electric Delivery Co., | ||||||||||
Debs., | ||||||||||
| 7.00% | 09/01/22 | Baa2 | 475 | 527,952 | ||||||
Sec. Notes | ||||||||||
| 7.25% | 01/15/33 | Baa2 | 250 | 292,814 | ||||||
Xcel Energy, Inc., | ||||||||||
Sr. Notes | ||||||||||
| 3.40% | 07/01/08 | Baa1 | 605 | 583,057 | ||||||
| 7.00% | 12/01/10 | Baa1 | 190 | 204,484 | ||||||
| 20,828,954 | ||||||||||
Energy – Integrated — 0.1% | ||||||||||
ConocoPhillips, | ||||||||||
Sr. Notes | ||||||||||
| 6.95% | 04/15/29 | A1 | 570 | 687,935 | ||||||
Marathon Oil Corp., | ||||||||||
Notes | ||||||||||
| 6.125% | 03/15/12 | Baa1 | 310 | 328,717 | ||||||
Phillips Petroleum Co., | ||||||||||
Notes | ||||||||||
| 8.75% | 05/25/10 | A1 | 1,505 | 1,731,204 | ||||||
Union Oil Co., | ||||||||||
Gtd. Notes | ||||||||||
| 7.35% | 06/15/09 | A1 | 650 | 701,277 | ||||||
| 3,449,133 | ||||||||||
Energy – Other — 0.3% | ||||||||||
B.J. Services Co., | ||||||||||
Sr. Notes | ||||||||||
| 7.00% | 02/01/06 | Baa1 | 4,000 | 4,005,609 | ||||||
Devon Energy Corp., | ||||||||||
Gtd. Notes | ||||||||||
| 7.88% | 09/30/31 | Baa2 | 225 | 285,907 | ||||||
Sr. Notes | ||||||||||
| 2.75% | 08/01/06 | Baa2 | 2,390 | 2,357,601 | ||||||
Encana Corp., | ||||||||||
Bonds | ||||||||||
| 6.50% | 08/15/34 | Baa2 | 290 | 324,033 | ||||||
Halliburton Co., | ||||||||||
Notes | ||||||||||
| 5.50% | 10/15/10 | Baa1 | 150 | 153,204 | ||||||
Kerr-McGee Corp., | ||||||||||
Gtd. Notes | ||||||||||
| 5.875% | 09/15/06 | Ba3 | 930 | 933,225 | ||||||
Occidental Petroleum Corp.,(b) | ||||||||||
Sr. Notes | ||||||||||
| 6.75% | 01/15/12 | A3 | 735 | 806,735 | ||||||
Interest | Maturity Date | Moody’s Rating (Unaudited) | Principal Amount (000) | Value (Note 2) | ||||||
| LONG-TERM BONDS (Continued) | ||||||||||
Energy – Other (cont’d.) | ||||||||||
Talisman Energy, Inc., | ||||||||||
Notes | ||||||||||
| 5.125% | 05/15/15 | Baa1 | $ | 595 | $ | 589,688 | ||||
Valero Energy Corp., | ||||||||||
Notes | ||||||||||
| 7.50% | 04/15/32 | Baa3 | 145 | 176,217 | ||||||
Woodside Petroleum Ltd.,(h) | ||||||||||
Gtd. Notes, 144A | ||||||||||
| 5.00% | 11/15/13 | Baa1 | 1,315 | 1,314,386 | ||||||
| 10,946,605 | ||||||||||
Foods — 0.4% | ||||||||||
Alberton’s, Inc., | ||||||||||
Debs. | ||||||||||
| 7.45% | 08/01/29 | Baa3 | 175 | 162,240 | ||||||
Archer-Daniels-Midland Co., | ||||||||||
Debs. | ||||||||||
| 8.125% | 06/01/12 | A2 | 300 | 349,781 | ||||||
Cadbury Schweppes US Finance,(h) | ||||||||||
Notes, 144A | ||||||||||
| 3.875% | 10/01/08 | Baa2 | 810 | 786,608 | ||||||
Cargill, Inc.,(h) | ||||||||||
Notes, 144A | ||||||||||
| 3.625% | 03/04/09 | A2 | 1,875 | 1,807,506 | ||||||
ConAgra Foods, Inc., | ||||||||||
Notes | ||||||||||
| 7.875% | 09/15/10 | Baa1 | 650 | 716,132 | ||||||
General Mills, Inc., | ||||||||||
Notes | ||||||||||
| 5.125% | 02/15/07 | Baa2 | 350 | 349,700 | ||||||
Heinz Co.,(h) | ||||||||||
Notes, 144A | ||||||||||
| 6.43% | 12/01/08 | Baa1 | 1,290 | 1,325,178 | ||||||
Kellogg Co., | ||||||||||
Notes | ||||||||||
| 6.60% | 04/01/11 | Baa1 | 1,875 | 2,007,355 | ||||||
Kraft Foods, Inc., | ||||||||||
Notes | ||||||||||
| 4.625% | 11/01/06 | A3 | 2,700 | 2,691,516 | ||||||
| 5.25% | 06/01/07 | A3 | 300 | 301,218 | ||||||
| 5.625% | 11/01/11 | A3 | 850 | 872,097 | ||||||
PepsiAmericas, Inc., | �� | |||||||||
Notes | ||||||||||
| 4.875% | 01/15/15 | Baa1 | 570 | 561,949 | ||||||
Safeway Inc., | ||||||||||
Sr. Unsec. Notes | ||||||||||
| 7.25% | 02/01/31 | Baa2 | 135 | 145,676 | ||||||
The Kroger Co., | ||||||||||
Gtd. Notes | ||||||||||
| 6.75% | 04/15/12 | Baa2 | 45 | 47,324 | ||||||
| 6.80% | 04/01/11 | Baa2 | 670 | 702,667 | ||||||
Tricon Global Restaurants, | ||||||||||
Sr. Notes | ||||||||||
| 8.88% | 04/15/11 | Baa3 | 180 | 206,086 | ||||||
Tyson Foods, Inc., | ||||||||||
Notes | ||||||||||
| 8.25% | 10/01/11 | Baa3 | 95 | 107,261 | ||||||
Sr. Notes | ||||||||||
| 7.25% | 10/01/06 | Baa3 | 405 | 411,485 | ||||||
| 13,551,779 | ||||||||||
SEE NOTES TO FINANCIAL STATEMENTS.
B40
| FLEXIBLE MANAGED PORTFOLIO (Continued) |
SCHEDULE OF INVESTMENTS | December 31, 2005 |
Interest | Maturity Date | Moody’s Rating (Unaudited) | Principal Amount (000) | Value (Note 2) | ||||||
| LONG-TERM BONDS (Continued) | ||||||||||
Gaming | ||||||||||
Harrah’s Operating Co., Inc., | ||||||||||
Gtd. Notes | ||||||||||
| 5.50% | 07/01/10 | Baa3 | $ | 625 | $ | 624,749 | ||||
| 5.75% | 10/01/17 | Baa3 | 1,060 | 1,031,694 | ||||||
Mandalay Resorts Group, | ||||||||||
Sr. Sub. Notes | ||||||||||
| 9.375% | 02/15/10 | Ba3 | 10 | 10,950 | ||||||
| 1,667,393 | ||||||||||
Healthcare & Pharmaceutical — 0.3% | ||||||||||
Anthem, Inc., | ||||||||||
Notes | ||||||||||
| 3.50% | 09/01/07 | Baa1 | 1,560 | 1,521,760 | ||||||
Baxter International, Inc., | ||||||||||
Sr. Unsec. Notes, | ||||||||||
| 5.20% | 02/16/08 | Baa1 | 860 | 862,530 | ||||||
Bristol-Myers Squibb Co., | ||||||||||
Notes | ||||||||||
| 5.75% | 10/01/11 | A1 | 555 | 573,192 | ||||||
Cardinal Health, Inc., | ||||||||||
Unsub. Notes | ||||||||||
| 5.85% | 12/15/17 | Baa3 | 1,305 | 1,327,398 | ||||||
Genentech, Inc., | ||||||||||
Sr. Notes | ||||||||||
| 4.75% | 07/15/15 | A1 | 890 | 866,055 | ||||||
| 5.25% | 07/15/35 | A1 | 200 | 192,737 | ||||||
Laboratory Corp. of America, | ||||||||||
Sr. Unsec. Notes | ||||||||||
| 5.63% | 12/15/15 | Baa3 | 730 | 739,678 | ||||||
Merck & Co., Inc., | ||||||||||
Debs. | ||||||||||
| 5.95% | 12/01/28 | Aa3 | 165 | 169,212 | ||||||
Pharmacia Corp., | ||||||||||
Debs. | ||||||||||
| 6.75% | 12/15/27 | Aaa | 190 | 223,283 | ||||||
Schering-Plough Corp.(g) | ||||||||||
Sr. Notes | ||||||||||
| 5.55% | 12/01/13 | Baa1 | 1,580 | 1,609,649 | ||||||
Wellpoint, Inc., | ||||||||||
Notes | ||||||||||
| 5.00% | 12/15/14 | Baa1 | 860 | 844,781 | ||||||
| 5.95% | 12/15/34 | Baa1 | 785 | 809,233 | ||||||
Wyeth, | ||||||||||
Unsub. Notes | ||||||||||
| 5.50% | 03/15/13 | Baa1 | 1,350 | 1,368,587 | ||||||
| 5.50% | 02/01/14 | Baa1 | 685 | 693,873 | ||||||
| 6.45% | 02/01/24 | Baa1 | 475 | 513,717 | ||||||
| 12,315,685 | ||||||||||
Insurance — 0.2% | ||||||||||
Allstate Corp.(The), | ||||||||||
Sr. Notes | ||||||||||
| 5.55% | 05/09/35 | A1 | 710 | 695,774 | ||||||
American International Group, Inc., | ||||||||||
Notes | ||||||||||
| 4.25% | 05/15/13 | Aa2 | 1,080 | 1,027,220 | ||||||
Notes, 144A, (h) | ||||||||||
| 5.05% | 10/01/15 | Aa2 | 180 | 176,657 | ||||||
Interest | Maturity Date | Moody’s Rating (Unaudited) | Principal Amount (000) | Value (Note 2) | ||||||
| LONG-TERM BONDS (Continued) | ||||||||||
Insurance (cont’d.) | ||||||||||
AXA (France), | ||||||||||
Sub. Notes | ||||||||||
| 8.60% | 12/15/30 | A3 | $ | 155 | $ | 207,133 | ||||
Everest Reinsurance Holdings | ||||||||||
(Bermuda), Notes | ||||||||||
| 5.40% | 10/15/14 | A3 | 615 | 606,523 | ||||||
Liberty Mutual Group, Inc.,(b)(h) | ||||||||||
Gtd. Notes, 144A | ||||||||||
| 7.00% | 03/15/34 | Baa3 | 720 | 742,464 | ||||||
Marsh & McLennan Cos., Inc., | ||||||||||
Sr. Unsec. Notes, | ||||||||||
| 5.15% | 09/15/10 | Baa2 | 265 | 263,238 | ||||||
MetLife, Inc., | ||||||||||
Notes | ||||||||||
| 6.125% | 12/01/11 | A2 | 335 | 354,986 | ||||||
Sr. Notes | ||||||||||
| 5.70% | 06/15/35 | A2 | 1,020 | 1,023,778 | ||||||
| 6.375% | 06/15/34 | A2 | 70 | 76,664 | ||||||
W.R. Berkley Corp., | ||||||||||
Sr. Notes | ||||||||||
| 5.60% | 05/15/15 | Baa2 | 555 | 553,359 | ||||||
| 6.15% | 08/15/19 | Baa2 | 460 | 462,921 | ||||||
XL Capital Ltd., | ||||||||||
Sr. Notes | ||||||||||
| 5.25% | 09/15/14 | A3 | 85 | 82,967 | ||||||
| 6,273,684 | ||||||||||
Lodging — 0.1% | ||||||||||
Carnival Corp., | ||||||||||
Gtd. Notes | ||||||||||
| 3.75% | 11/15/07 | A3 | 2,205 | 2,155,441 | ||||||
P&O Princess, | ||||||||||
Notes | ||||||||||
| 7.30% | 06/01/07 | A3 | 260 | 267,717 | ||||||
Royal Caribbean Cruises Ltd., | ||||||||||
Sr. Notes | ||||||||||
| 8.00% | 05/15/10 | Ba1 | 1,770 | 1,922,427 | ||||||
| 4,345,585 | ||||||||||
Media & Entertainment — 0.2% | ||||||||||
British Sky Broadcasting Group PLC | ||||||||||
(United Kingdom), Gtd. Notes | ||||||||||
| 7.30% | 10/15/06 | Baa2 | 660 | 670,679 | ||||||
CBS Corp., | ||||||||||
Gtd. Notes | ||||||||||
| 7.88% | 07/30/30 | Baa3 | 370 | 422,498 | ||||||
Clear Channel Communications, Inc., | ||||||||||
Gtd. Notes | ||||||||||
| 8.00% | 11/01/08 | Baa3 | 575 | 611,311 | ||||||
Clear Channel Communications, Inc., | ||||||||||
Sr. Notes | ||||||||||
| 7.65% | 09/15/10 | Baa3 | 250 | 267,607 | ||||||
News America, Inc., | ||||||||||
Gtd. Notes | ||||||||||
| 7.625% | 11/30/28 | Baa2 | 1,050 | 1,190,699 | ||||||
Time Warner Cos., Inc., | ||||||||||
Debs. | ||||||||||
| 7.25% | 10/15/17 | Baa1 | 790 | 863,627 | ||||||
SEE NOTES TO FINANCIAL STATEMENTS.
B41
| FLEXIBLE MANAGED PORTFOLIO (Continued) |
SCHEDULE OF INVESTMENTS | December 31, 2005 |
Interest | Maturity Date | Moody’s Rating (Unaudited) | Principal Amount (000) | Value (Note 2) | ||||||
| LONG-TERM BONDS (Continued) | ||||||||||
Media & Entertainment (cont’d.) | ||||||||||
Time Warner, Inc., | ||||||||||
Gtd. Notes | ||||||||||
| 6.75% | 04/15/11 | Baa1 | $ | 1,570 | $ | 1,648,641 | ||||
| 7.70% | 05/01/32 | Baa1 | 680 | 764,768 | ||||||
Walt Disney Co., | ||||||||||
Sr. Notes | ||||||||||
| 5.375% | 06/01/07 | Baa1 | 225 | 226,420 | ||||||
| 6.75% | 03/30/06 | Baa1 | 1,016 | 1,020,844 | ||||||
| 7,687,094 | ||||||||||
Metals | ||||||||||
Alcan, Inc., | ||||||||||
Notes | ||||||||||
| 5.00% | 06/01/15 | Baa1 | 600 | 582,021 | ||||||
| 5.20% | 01/15/14 | Baa1 | 105 | 103,846 | ||||||
| 6.125% | 12/15/33 | Baa1 | 160 | 163,784 | ||||||
| 849,651 | ||||||||||
Municipals — 0.1% | ||||||||||
Illinois St., Taxable Pension, G.O., | ||||||||||
| 5.10% | 06/01/33 | Aa3 | 4,880 | 4,796,650 | ||||||
Non Captive Finance — 0.5% | ||||||||||
Berkshire Hathaway, | ||||||||||
Gtd. Notes | ||||||||||
| 4.75% | 05/15/12 | Aaa | 830 | 820,488 | ||||||
Capital One Bank Corp., | ||||||||||
Notes | ||||||||||
| 6.50% | 06/13/13 | Baa1 | 20 | 21,249 | ||||||
| 6.875% | 02/01/06 | A3 | 1,540 | 1,542,801 | ||||||
Capital One Financial Corp., | ||||||||||
Notes | ||||||||||
| 5.50% | 06/01/15 | Baa1 | 265 | 263,449 | ||||||
CIT Group Co. (Canada),(h) | ||||||||||
Notes, 144A | ||||||||||
| 5.45% | 06/01/15 | A2 | 1,210 | 1,195,980 | ||||||
CIT Group, Inc., | ||||||||||
Notes | ||||||||||
| 4.25% | 02/01/10 | A2 | 400 | 389,188 | ||||||
Sr. Notes | ||||||||||
| 5.50% | 11/30/07 | A2 | 990 | 999,721 | ||||||
General Electric Capital Corp., | ||||||||||
Notes, Series A, MTN | ||||||||||
| 6.125% | 02/22/11 | Aaa | 1,990 | 2,093,581 | ||||||
| 6.75% | 03/15/32 | Aaa | 2,100 | 2,465,087 | ||||||
Notes, MTN | ||||||||||
| 4.875% | 10/21/10 | Aaa | 1,070 | 1,067,629 | ||||||
Household Finance Corp., | ||||||||||
Notes | ||||||||||
| 4.75% | 05/15/09 | A1 | 640 | 633,018 | ||||||
| 6.375% | 10/15/11-11/27/12 | A1 | 945 | 999,791 | ||||||
Notes(b) | ||||||||||
| 7.00% | 05/15/12 | A1 | 585 | 639,915 | ||||||
HSBC Finance Corp., | ||||||||||
Notes | ||||||||||
| 5.00% | 06/30/15 | A1 | 840 | 816,829 | ||||||
| 6.75% | 05/15/11 | A1 | 430 | 461,464 | ||||||
Interest | Maturity Date | Moody’s Rating (Unaudited) | Principal Amount (000) | Value (Note 2) | ||||||
| LONG-TERM BONDS (Continued) | ||||||||||
Non Captive Finance (cont’d.) | ||||||||||
Icici Bank Ltd.,(h) | ||||||||||
Notes, 144A | ||||||||||
| 5.75% | 11/16/10 | Baa3 | $ | 1,070 | $ | 1,074,997 | ||||
International Lease Finance Corp., | ||||||||||
Notes | ||||||||||
| 3.50% | 04/01/09 | A1 | 580 | 552,080 | ||||||
Residential Capital Corp., | ||||||||||
Sr. Unsec. Notes | ||||||||||
| 6.375% | 06/30/10 | Baa3 | 480 | 487,735 | ||||||
| 16,525,002 | ||||||||||
Paper | ||||||||||
Weyerhaeuser Co.,(b) | ||||||||||
Notes, | ||||||||||
| 7.375% | 03/15/32 | Baa2 | 730 | 811,548 | ||||||
Pipelines & Other — 0.2% | ||||||||||
Atmos Energy Corp., | ||||||||||
Notes | ||||||||||
| 4.00% | 10/15/09 | Baa3 | 1,270 | 1,217,959 | ||||||
Duke Energy Field Services, Inc., | ||||||||||
Notes | ||||||||||
| 7.875% | 08/16/10 | Baa2 | 1,110 | 1,227,596 | ||||||
Enbridige, Inc., | ||||||||||
Notes | ||||||||||
| 4.90% | 03/01/15 | A3 | 500 | 491,792 | ||||||
Enterprise Products Operating LP, | ||||||||||
Ser. B, Sr. Notes | ||||||||||
| 4.00% | 10/15/07 | Baa3 | 780 | 763,701 | ||||||
Ser B, Gtd. Notes | ||||||||||
| 6.875% | 03/01/33 | Baa3 | 565 | 598,533 | ||||||
Kinder Morgan Finance Co. ULC(h) | ||||||||||
Gtd. Notes, 144A | ||||||||||
| 6.40% | 01/05/36 | Baa2 | 385 | 394,580 | ||||||
Oneok Inc., | ||||||||||
Sr. Notes | ||||||||||
| 5.51% | 02/16/08 | Baa2 | 1,290 | 1,295,097 | ||||||
Sempra Energy, | ||||||||||
Sr. Notes | ||||||||||
| 4.621% | 05/17/07 | Baa1 | 630 | 625,535 | ||||||
| 6,614,793 | ||||||||||
Railroads — 0.1% | ||||||||||
BNSF Funding Trust I, | ||||||||||
Gtd. Notes | ||||||||||
| 6.61% | 12/15/55 | Ba1 | 920 | 957,727 | ||||||
Burlington Northern Santa Fe Corp., | ||||||||||
Debs. | ||||||||||
| 7.95% | 08/15/30 | Baa2 | 930 | 1,216,922 | ||||||
Norfolk Southern Corp., | ||||||||||
Bonds | ||||||||||
| 7.80% | 05/15/27 | Baa1 | 18 | 22,807 | ||||||
Norfolk Southern Corp., | ||||||||||
Sr. Unsec. Notes | ||||||||||
| 5.64% | 05/17/29 | Baa1 | 477 | 479,199 | ||||||
Union Pacific Corp., | ||||||||||
Notes | ||||||||||
| 6.625% | 02/01/08 | Baa2 | 1,390 | 1,435,580 | ||||||
| 4,112,235 | ||||||||||
SEE NOTES TO FINANCIAL STATEMENTS.
B42
| FLEXIBLE MANAGED PORTFOLIO (Continued) |
SCHEDULE OF INVESTMENTS | December 31, 2005 |
Interest | Maturity Date | Moody’s Rating (Unaudited) | Principal Amount (000) | Value (Note 2) | ||||||
| LONG-TERM BONDS (Continued) | ||||||||||
Real Estate Investment Trusts — 0.1% | ||||||||||
EOP Operating LP, | ||||||||||
Sr. Notes | ||||||||||
| 5.13% | 03/15/16 | Baa1 | $ | 345 | $ | 332,292 | ||||
Mack-Cali Realty LP, | ||||||||||
Notes | ||||||||||
| 7.25% | 03/15/09 | Baa2 | 1,270 | 1,339,742 | ||||||
Post Apartment Homes LP, | ||||||||||
Sr. Notes | ||||||||||
| 5.45% | 06/01/12 | Baa3 | 435 | 426,940 | ||||||
| 2,098,974 | ||||||||||
Retailers — 0.2% | ||||||||||
Dayton Hudson Corp., | ||||||||||
Notes | ||||||||||
| 7.50% | 07/15/06 | A2 | 1,150 | 1,166,991 | ||||||
Gap, Inc., | ||||||||||
Notes | ||||||||||
| 6.90% | 09/15/07 | Baa3 | 1,230 | 1,256,815 | ||||||
May Department Stores Co., | ||||||||||
Gtd. Notes | ||||||||||
| 8.50% | 06/01/19 | Baa1 | 225 | 272,784 | ||||||
Notes | ||||||||||
| 6.65% | 07/15/24 | Baa1 | 435 | 457,359 | ||||||
| 6.70% | 07/15/34 | Baa1 | 580 | 617,754 | ||||||
Target Corp., | ||||||||||
Notes | ||||||||||
| 5.95% | 05/15/06 | A2 | 1,000 | 1,003,661 | ||||||
Wal-Mart Stores, Inc., | ||||||||||
Bonds | ||||||||||
| 5.25% | 09/01/35 | Aa2 | 1,370 | 1,329,827 | ||||||
| 6,105,191 | ||||||||||
Structured Notes | ||||||||||
Dow Jones CDX HX,(b)(h) | ||||||||||
Pass-Thru Certificates, Ser. 5-T2 | ||||||||||
| 7.25% | 12/29/10 | Ba3 | 1,600 | 1,582,000 | ||||||
Technology — 0.2% | ||||||||||
Computer Associates International, Inc.,(h) | ||||||||||
Sr. Notes 144A | ||||||||||
| 4.75% | 12/01/09 | Ba1 | 1,175 | 1,145,762 | ||||||
Equifax, Inc., | ||||||||||
Notes | ||||||||||
| 4.95% | 11/01/07 | Baa1 | 320 | 319,799 | ||||||
First Data Corp., | ||||||||||
Notes | ||||||||||
| 4.85% | 10/01/14 | A1 | 540 | 511,534 | ||||||
International Business Machines Corp., | ||||||||||
Debs. | ||||||||||
| 5.875% | 11/29/32 | A1 | 1,150 | 1,210,118 | ||||||
Jabil Circuit, Inc., | ||||||||||
Sr. Notes | ||||||||||
| 5.875% | 07/15/10 | Baa3 | 770 | 782,035 | ||||||
Motorola, Inc., | ||||||||||
Notes | ||||||||||
| 4.608% | 11/16/07 | Baa2 | 950 | 944,064 | ||||||
| 7.625% | 11/15/10 | Baa2 | 120 | 133,396 | ||||||
Interest | Maturity Date | Moody’s Rating (Unaudited) | Principal Amount (000) | Value (Note 2) | ||||
| LONG-TERM BONDS (Continued) | ||||||||
Technology (cont’d.) | ||||||||
Seagate Technology HDD Holdings,(a) | ||||||||
Gtd. Notes | ||||||||
| 8.00% | 05/15/09 | Ba2 | 1,225 | 1,286,251 | ||||
| 6,332,959 | ||||||||
Telecommunications — 0.8% | ||||||||
ALLTEL Ohio LP,(h) | ||||||||
Gtd. Notes, 144A | ||||||||
| 8.00% | 08/15/10 | A2 | 680 | 756,618 | ||||
AT&T Corp.,(b) | ||||||||
Sr. Notes | ||||||||
| 9.75% | 11/15/31 | A2 | 615 | 772,516 | ||||
AT&T Wireless Services, Inc., | ||||||||
Notes | ||||||||
| 8.125% | 05/01/12 | Baa2 | 640 | 739,474 | ||||
Sr. Notes | ||||||||
| 7.35% | 03/01/06 | Baa2 | 1,756 | 1,763,273 | ||||
| 8.75% | 03/01/31 | Baa2 | 539 | 714,077 | ||||
BellSouth Corp., | ||||||||
Bonds | ||||||||
| 6.55% | 06/15/34 | A2 | 15 | 15,977 | ||||
Notes | ||||||||
| 4.20% | 09/15/09 | A2 | 1,175 | 1,141,377 | ||||
British Telecom PLC | ||||||||
(United Kingdom), | ||||||||
Bonds | ||||||||
| 7.00% | 05/23/07 | Baa1 | 1,265 | 1,297,917 | ||||
| 8.875% | 12/15/30 | Baa1 | 210 | 280,968 | ||||
CenturyTel, Inc., | ||||||||
Sr. Notes | ||||||||
| 7.875% | 08/15/12 | Baa2 | 130 | 143,382 | ||||
Cingular Wireless LLC, | ||||||||
Sr. Notes | ||||||||
| 7.125% | 12/15/31 | Baa2 | 505 | 578,065 | ||||
Citizens Communications Co., | ||||||||
Debs. | ||||||||
| 7.60% | 06/01/06 | Ba3 | 1,100 | 1,112,375 | ||||
Deutsche Telekom International Finance | ||||||||
BV (Netherlands),(g) | ||||||||
Gtd. Notes | ||||||||
| 8.25% | 06/15/30 | A3 | 295 | 375,201 | ||||
France Telecom SA (France), | ||||||||
Notes | ||||||||
| 8.50% | 03/01/31 | A3 | 385 | 513,690 | ||||
Koninklijke (Royal) KPN NV (Netherlands), | ||||||||
Sr. Notes | ||||||||
| 8.00% | 10/01/10 | Baa1 | 530 | 582,072 | ||||
Nextel Communications, Inc.,(b) | ||||||||
Sr. Notes | ||||||||
| 5.95% | 03/15/14 | Baa2 | 1,160 | 1,166,076 | ||||
SBC Communications Inc., | ||||||||
Notes | ||||||||
| 4.125% | 09/15/09 | A2 | 1,070 | 1,033,217 | ||||
| 5.30% | 11/15/10 | A2 | 1,260 | 1,263,818 | ||||
Sprint Capital Corp., | ||||||||
Gtd. Notes | ||||||||
| 6.875% | 11/15/28 | Baa2 | 2,195 | 2,398,455 | ||||
| 8.75% | 03/15/32 | Baa2 | 230 | 305,228 | ||||
SEE NOTES TO FINANCIAL STATEMENTS.
B43
| FLEXIBLE MANAGED PORTFOLIO (Continued) |
SCHEDULE OF INVESTMENTS | December 31, 2005 |
Interest | Maturity Date | Moody’s Rating (Unaudited) | Principal Amount (000) | Value (Note 2) | ||||||
| LONG-TERM BONDS (Continued) | ||||||||||
Telecommunications (cont’d.) | ||||||||||
Telecom de Puerto Rico, | ||||||||||
Gtd. Notes | ||||||||||
| 6.65% | 05/15/06 | Baa1 | $ | 2,700 | $ | 2,715,077 | ||||
| 6.80% | 05/15/09 | Baa1 | 3,065 | 3,184,821 | ||||||
Telecom Italia Capital, | ||||||||||
Gtd. Notes | ||||||||||
| 5.25% | 11/15/13 | Baa2 | 320 | 314,008 | ||||||
| 6.00% | 09/30/34 | Baa2 | 720 | 693,616 | ||||||
Telus Corp., | ||||||||||
Notes | ||||||||||
| 8.00% | 06/01/11 | Baa2 | 1,255 | 1,406,930 | ||||||
US Cellular Corp., | ||||||||||
Sr. Notes, | ||||||||||
| 6.70% | 12/15/33 | Baa3 | 470 | 461,478 | ||||||
Verizon Global Funding Corp., | ||||||||||
Bonds | ||||||||||
| 5.85% | 09/15/35 | A3 | 315 | 303,557 | ||||||
| Notes | ||||||||||
| 7.75% | 12/01/30 | A3 | 105 | 124,809 | ||||||
Vodafone Group PLC (United Kingdom), | ||||||||||
Notes | ||||||||||
| 7.75% | 02/15/10 | A2 | 800 | 876,213 | ||||||
| 27,034,285 | ||||||||||
Tobacco | ||||||||||
Altria Group, Inc., | ||||||||||
Debs | ||||||||||
| 7.75% | 01/15/27 | Baa2 | 297 | 352,589 | ||||||
| Notes | ||||||||||
| 7.65% | 07/01/08 | Baa2 | 590 | 624,890 | ||||||
| 977,479 | ||||||||||
Foreign Government Bonds — 0.3% | ||||||||||
Korea Development Bank, | ||||||||||
Notes (Korea) | ||||||||||
| 4.75% | 07/20/09 | A3 | 1,180 | 1,169,865 | ||||||
Pemex Project Funding Master Trust,(h) | ||||||||||
Gtd. Notes, 144A (Mexico) | ||||||||||
| 9.50% | 09/15/27 | Baa1 | 980 | 1,305,850 | ||||||
Petrobras International Finance Co., | ||||||||||
Sr. Notes (Cayman Islands) | ||||||||||
| 9.75% | 07/06/11 | Baa1 | 225 | 264,375 | ||||||
Quebec Province, | ||||||||||
Debs. (Canada) | ||||||||||
| 5.75% | 02/15/09 | A1 | 500 | 514,610 | ||||||
Notes | ||||||||||
| 4.60% | 05/26/15 | A1 | 735 | 717,122 | ||||||
Republic of Italy, | ||||||||||
Notes (Italy) | ||||||||||
| 5.375% | 06/15/33 | Aa2 | 800 | 814,895 | ||||||
| 6.00% | 02/22/11 | Aa2 | 390 | 413,032 | ||||||
Republic of Malaysia, | ||||||||||
Bonds (Malaysia) | ||||||||||
| 7.50% | 07/15/11 | A3 | 300 | 335,720 | ||||||
Republic of South Africa, | ||||||||||
Notes (South Africa) | ||||||||||
| 6.50% | 06/02/14 | Baa1 | 475 | 513,594 | ||||||
Interest | Maturity Date | Moody’s Rating (Unaudited) | Principal Amount (000) | Value (Note 2) | ||||||
| LONG-TERM BONDS (Continued) | ||||||||||
Foreign Government Bonds (cont’d.) | ||||||||||
The Export-Import Bank of Korea,(b)(h) | ||||||||||
Notes, 144A (Korea) | ||||||||||
| 4.125% | 02/10/09 | A3 | $ | 860 | $ | 837,731 | ||||
United Mexican States Global Bond, | ||||||||||
Notes (Mexico) | ||||||||||
| 8.125% | 12/30/19 | Baa1 | 1,450 | 1,779,875 | ||||||
| 8.375% | 01/14/11 | Baa1 | 1,520 | 1,732,800 | ||||||
| 10,399,469 | ||||||||||
Mortgage Backed Securities — 8.3% | ||||||||||
Federal Home Loan Mortgage Corp. | ||||||||||
| 4.50% | 11/01/18-07/01/20(e) | 8,249 | 8,034,849 | |||||||
| 5.00% | TBA | 10,000 | 9,765,624 | |||||||
| 5.00% | 06/01/18-05/01/34(e) | 14,560 | 14,337,219 | |||||||
| 5.50% | 12/01/33-06/01/34(e) | 12,338 | 12,238,510 | |||||||
| 6.00% | TBA | 5,000 | 5,048,440 | |||||||
| 6.00% | 03/01/32-12/01/33(e) | 4,436 | 4,494,303 | |||||||
| 6.50% | 05/01/14-09/01/14(e) | 650 | 667,823 | |||||||
| 7.00% | 01/01/31-10/01/31(e) | 6,795 | 7,078,812 | |||||||
Federal National Mortgage Assn., | ||||||||||
| 4.00% | 06/01/19(e) | 2,524 | 2,412,890 | |||||||
| 4.50% | TBA | 3,000 | 2,918,436 | |||||||
| 4.50% | 01/01/19-01/01/35(e) | 17,855 | 17,253,467 | |||||||
| 4.988% | 07/01/33(e) | 1,226 | 1,230,867 | |||||||
| 5.00% | TBA | 10,000 | 9,829,684 | |||||||
| 5.00% | 10/01/18-07/01/35(e) | 49,740 | 48,424,835 | |||||||
| 5.50% | TBA | 27,500 | 27,248,907 | |||||||
| 5.50% | 03/01/16-10/01/35(e) | 57,362 | 56,979,770 | |||||||
| 6.00% | TBA | 13,500 | 13,664,995 | |||||||
| 6.00% | 04/01/13-02/01/35(e) | 25,864 | 26,164,149 | |||||||
| 6.50% | 07/01/17-10/01/34(e) | 6,315 | 6,482,821 | |||||||
| 7.00% | 08/01/11-07/01/32(e) | 2,185 | 2,285,238 | |||||||
| 7.50% | 06/01/12-05/01/32(e) | 1,921 | 2,007,634 | |||||||
Government National Mortgage Assn., | ||||||||||
| 5.50% | 08/15/33-02/15/34(e) | 2,290 | 2,307,052 | |||||||
| 6.00% | 02/15/33-06/20/34(e) | 3,609 | 3,695,891 | |||||||
| 6.50% | 10/15/23-07/15/35(e) | 9,312 | 9,738,740 | |||||||
| 8.00% | 01/15/24-04/15/25(e) | 326 | 348,943 | |||||||
| 294,659,899 | ||||||||||
U.S. Government Agency Obligations — 1.8% | ||||||||||
Federal Farm Credit Bank | ||||||||||
| 4.125% | 07/17/09 | 1,180 | 1,156,283 | |||||||
Federal Home Loan Bank | ||||||||||
| 3.75% | 08/18/09 | 1,895 | 1,833,268 | |||||||
| 4.25% | 04/16/07 | 9,880 | 9,816,748 | |||||||
| 4.50% | 05/13/11 | 160 | 157,544 | |||||||
Federal Home Loan Mortgage Corp. | ||||||||||
| 4.75% | 01/18/11 | 5,495 | 5,492,154 | |||||||
| 4.90% | 11/03/08 | 7,840 | 7,813,085 | |||||||
Federal National Mortgage Assn. | ||||||||||
| 4.25% | 07/27/07-05/15/09 | 22,325 | 22,020,799 | |||||||
| 4.50% | 10/15/08(b) | 7,598 | 7,555,854 | |||||||
| 4.75% | 12/15/10 | 1,170 | 1,170,013 | |||||||
| 5.25% | 08/01/12 | 6,535 | 6,597,684 | |||||||
Tennessee Valley Authority, | ||||||||||
| 5.88% | 04/01/36 | 990 | 1,124,699 | |||||||
| 64,738,131 | ||||||||||
SEE NOTES TO FINANCIAL STATEMENTS.
B44
| FLEXIBLE MANAGED PORTFOLIO (Continued) |
SCHEDULE OF INVESTMENTS | December 31, 2005 |
Interest | Maturity Date | Moody’s Rating (Unaudited) | Principal Amount (000) | Value (Note 2) | ||||||
| LONG-TERM BONDS (Continued) | ||||||||||
U.S. Government Obligations — 4.7% | ||||||||||
United States Treasury Bonds, | ||||||||||
| 5.375% | 02/15/31(b) | $ | 5,727 | $ | 6,433,030 | |||||
| 6.00% | 02/15/26 | 1,885 | 2,222,828 | |||||||
| 6.25% | 08/15/23 | 2,500 | 2,985,353 | |||||||
| 6.875% | 08/15/25 | 545 | 701,858 | |||||||
| 8.125% | 05/15/21(b) | 2,510 | 3,474,879 | |||||||
| 9.00% | 11/15/18 | 5,727 | 8,187,823 | |||||||
| 9.125% | 05/15/18 | 5,820 | 8,323,054 | |||||||
| 9.25% | 02/15/16 | 2,492 | 3,453,463 | |||||||
United States Treasury Inflation Index Bonds, | ||||||||||
| 0.875% | 04/15/10 | 8,823 | 8,388,050 | |||||||
| 1.625% | 01/15/15 | 5,992 | 5,773,030 | |||||||
| 1.875% | 07/15/13 | 6,501 | 6,411,882 | |||||||
| 1.875% | 07/15/15 | 6,436 | 6,324,324 | |||||||
| 2.00% | 07/15/14 | 6,123 | 6,088,799 | |||||||
| 2.00% | 01/15/14 | 6,677 | 6,639,333 | |||||||
| 2.375% | 01/15/25 | 7,918 | 8,321,603 | |||||||
| 3.00% | 07/15/12 | 6,917 | 7,313,847 | |||||||
| 3.375% | 01/15/12-04/15/32 | 3,643 | 4,283,718 | |||||||
| 3.375% | 01/15/07 | 5,338 | 5,377,159 | |||||||
| 3.50% | 01/15/11 | 3,659 | 3,910,223 | |||||||
| 3.625% | 01/15/08-04/15/28 | 10,894 | 12,579,458 | |||||||
| 3.875% | 01/15/09-04/15/29 | 11,269 | 13,686,411 | |||||||
| 4.25% | 01/15/10 | 3,667 | 3,974,774 | |||||||
| 8.75% | 05/15/20 | 630 | 903,828 | |||||||
| 8.875% | 02/15/19 | 2,060 | 2,929,384 | |||||||
United States Treasury Notes, | ||||||||||
| 3.625% | 04/30/07 | 5,305 | 5,249,462 | |||||||
| 4.375% | 11/15/08-12/15/10(b) | 14,875 | 14,884,738 | |||||||
| 4.50% | 11/15/15(b) | 1,705 | 1,718,986 | |||||||
| 4.75% | 05/15/14 | 130 | 133,164 | |||||||
United States Treasury Strips, I/O, | ||||||||||
| Zero | 05/15/18 | 1,248 | 708,480 | |||||||
| Zero | 05/15/19(b) | 6,005 | 3,243,727 | |||||||
| 164,626,668 | ||||||||||
TOTAL LONG-TERM BONDS | 899,623,746 | |||||||||
TOTAL LONG-TERM INVESTMENTS | 3,359,499,775 | |||||||||
Interest | Maturity Date | Moody’s Rating (Unaudited) | Principal Amount (000) | Value (Note 2) | ||||||
| SHORT-TERM INVESTMENTS — 19.0% | ||||||||||
U.S. Government Obligations | ||||||||||
United States Treasury Bill(i) | ||||||||||
| 4.12% | 03/16/06 | 1,500 | $ | 1,488,269 | ||||||
| Shares | ||||||||||
Mutual Funds — 19.0% | ||||||||||
Dryden Core Investment Fund — | ||||||||||
Dryden Short-Term Bond Series(d) | 7,348,199 | 73,476,107 | ||||||||
Dryden Core Investment Fund — Taxable Money Market Series (includes $333,010,724 of cash collateral for securities lending) (Note 4)(c)(d) | 598,538,374 | 598,538,374 | ||||||||
| 672,014,481 | ||||||||||
TOTAL SHORT-TERM INVESTMENTS | 673,502,750 | |||||||||
OUTSTANDING OPTIONS PURCHASED |
| |||||||||
Call Options | ||||||||||
90 Day Euro, | 49 | 20,519 | ||||||||
TOTAL INVESTMENTS BEFORE | 4,033,023,044 | |||||||||
OUTSTANDING OPTIONS WRITTEN |
| |||||||||
Call Options | ||||||||||
90 Day Euro, | 49 | (5,819 | ) | |||||||
TOTAL INVESTMENTS, NET OF OUTSTANDING OPTIONS WRITTEN — 113.8% | 4,033,017,225 | |||||||||
OTHER LIABILITIES IN EXCESS OF | (489,088,181 | ) | ||||||||
TOTAL NET ASSETS — 100.0% | $ | 3,543,929,044 | ||||||||
The following abbreviations are used in portfolio description:
| G.O. | General Obligation | |
| I/O | Interest Only | |
| TBA | Securities purchased on a forward commitment basis |
| (a) | Non income-producing security. |
| (b) | All or portion of security is on loan. The aggregate market value of such securities is $319,608,525; cash collateral of $333,010,724 (included in liabilities) was received with which the Portfolio purchased highly liquid short-term investments. |
| (c) | Represents security, or portion thereof, purchase with cash collateral received for securities on loan. |
| (d) | Prudential Investments LLC, the manager of the Portfolio, also serves as manager of Dryden Core Investment Fund-Taxable Money Market Series and the Dryden Core Investment Fund – Dryden Short-Term Bond Series. |
| (e) | Security segregated as collateral for TBAs. |
| (f) | Standard & Poor’s rating. |
| (g) | Indicates a variable rate security. |
| (h) | Securities were purchased pursuant to Rule 144A under the Securities Act of 1933 and may not be subject to that rule except to qualified institutional buyers. Unless otherwise noted, 144A securities are deemed to be liquid. |
SEE NOTES TO FINANCIAL STATEMENTS.
B45
| FLEXIBLE MANAGED PORTFOLIO (Continued) |
SCHEDULE OF INVESTMENTS | December 31, 2005 |
| (i) | Security segregated as collateral for futures contracts. |
| (j) | Other liabilities in excess of other assets include net unrealized appreciation (depreciation) on financial futures as follows: |
Open futures contracts outstanding at December 31, 2005:
| Number of Contracts | Type | Expiration Date | Value at Trade Date | Value at December 31, 2005 | Unrealized Appreciation (Depreciation) | |||||||||
| Long Positions: | ||||||||||||||
| 39 | Fed Fund 30 Day Futures | Apr. 06 | $ | 15,496,855 | $ | 15,495,614 | $ | (1,241 | ) | |||||
| 214 | Eurodollar Futures | Mar. 06 | 50,975,478 | 50,945,375 | (30,103 | ) | ||||||||
| 263 | U.S. Treasury Long Bond | Mar. 06 | 29,499,702 | 30,031,312 | 531,610 | |||||||||
| 214 | U.S. Treasury 5 Yr. Note | Mar. 06 | 22,673,252 | 22,757,563 | 84,311 | |||||||||
| 411 | U.S. Treasury 5 Yr. Note | Mar. 06 | 43,572,422 | 43,707,281 | 134,859 | |||||||||
| 719,436 | ||||||||||||||
| Short Positions: | ||||||||||||||
| 10 | U.S. Treasury 10Yr. Notes | Mar. 06 | 1,085,407 | 1,094,063 | (8,656 | ) | ||||||||
| 324 | U.S. Treasury 2Yr. Notes | Mar. 06 | 66,493,596 | 66,480,750 | 12,846 | |||||||||
| 4,190 | ||||||||||||||
| $ | 723,626 | |||||||||||||
The industry classification of portfolio holdings and liabilities in excess of other assets shown as a percentage of net assets as of December 31, 2005 was as follows:
Mutual Funds (including 9.4% of collateral received for securities on loan) | 19.0 | % | |
Mortgage Backed Securities | 8.3 | ||
Financial Services | 6.9 | ||
Drugs & Medical Supplies | 6.7 | ||
Oil, Gas & Consumable Fuels | 6.3 | ||
U.S. Government Obligations | 4.7 | ||
Insurance | 4.2 | ||
Banks & Savings & Loans | 4.1 | ||
Telecommunications | 4.0 | ||
Diversified Operations | 3.7 | ||
Computer Services | 3.5 | ||
Food & Beverage | 3.3 | ||
Retail | 3.2 | ||
Semiconductors | 2.8 | ||
Media & Entertainment | 2.7 | ||
Commercial Mortgage Backed Securities | 2.6 | ||
Aerospace/Defense | 2.2 | ||
U.S. Government Agency Obligations | 1.8 | ||
Utilities — Electric | 1.8 | ||
Computers | 1.7 | ||
Healthcare & Pharmaceutical | 1.6 | ||
Trucking & Shipping | 1.3 | ||
Autos — Cars & Trucks | 1.0 | ||
Tobacco | 1.0 | ||
Asset Backed Securities | 0.9 | ||
Household & Personal Care Products | 0.9 | ||
Chemicals | 0.8 | ||
Cosmetics & Soaps | 0.8 | ||
Electronics | 0.7 | ||
Banking | 0.6 | ||
Construction | 0.6 | ||
Electric | 0.6 | ||
Hospital Management | 0.6 | ||
Leisure | 0.6 | ||
Oil & Gas Exploration & Production | 0.6 | ||
Restaurants | 0.6 | ||
Non Captive Finance | 0.5 |
Consumer Products | 0.4 | ||
Metals & Mining | 0.4 | ||
Apparel | 0.3 | ||
Biotechnology | 0.3 | ||
Capital Goods | 0.3 | ||
Collateralized Mortgage Obligations | 0.3 | ||
Distribution/Wholesaler | 0.3 | ||
Energy — Other | 0.3 | ||
Foreign Government Bonds | 0.3 | ||
Office Equipment & Supplies | 0.3 | ||
Brokerage | 0.2 | ||
Cable | 0.2 | ||
Containers & Packaging | 0.2 | ||
Machinery | 0.2 | ||
Metal — Steel | 0.2 | ||
Pipelines & Other | 0.2 | ||
Real Estate Investment Trusts | 0.2 | ||
Software | 0.2 | ||
Technology | 0.2 | ||
Automotive | 0.1 | ||
Building Materials & Construction | 0.1 | ||
Commercial Services | 0.1 | ||
Consumer Services | 0.1 | ||
Education | 0.1 | ||
Energy — Integrated | 0.1 | ||
Energy Equipment & Services | 0.1 | ||
Gas Pipelines | 0.1 | ||
Healthcare Providers & Services | 0.1 | ||
Internet Software & Services | 0.1 | ||
Manufacturing | 0.1 | ||
Lodging | 0.1 | ||
Metals — Non Ferrous | 0.1 | ||
Miscellaneous Consumer Growth | 0.1 | ||
Municipals | 0.1 | ||
Railroads | 0.1 | ||
| 113.8 | |||
Other liabilities in excess of other assets | (13.8 | ) | |
| 100.0 | % | ||
SEE NOTES TO FINANCIAL STATEMENTS.
B46
| GLOBAL PORTFOLIO |
SCHEDULE OF INVESTMENTS | December 31, 2005 |
| LONG-TERM INVESTMENTS — 94.7% | Value | ||||
| COMMON STOCKS — 94.5% | Shares | ||||
Australia — 1.9% | |||||
AWB Ltd. | 271,500 | $ | 1,224,076 | ||
BHP Billiton PLC | 125,000 | 2,081,838 | |||
BlueScope Steel Ltd. | 251,400 | 1,276,060 | |||
Commonwealth Bank of Australia | 59,500 | 1,859,966 | |||
CSR Ltd. | 403,600 | 1,024,591 | |||
Macquarie Bank Ltd. | 40,200 | 1,997,582 | |||
Santos Ltd. | 180,900 | 1,622,990 | |||
Sigma Pharmaceuticals Ltd. | 161,878 | 370,464 | |||
Smorgon Steel Group Ltd. | 936,900 | 1,006,222 | |||
Suncorp-Metway Ltd. | 60,100 | 880,962 | |||
Telstra Corp. Ltd. | 198,000 | 568,987 | |||
Toll Holdings Ltd. | 137,600 | 1,497,138 | |||
| 15,410,876 | |||||
Austria — 0.6% | |||||
Boehler-Uddeholm AG | 5,800 | 981,235 | |||
Erste Bank der Oesterreichischen Sparkassen AG | 34,700 | 1,932,868 | |||
Raiffeisen International Bank-Holding AG(a) | 26,700 | 1,755,934 | |||
| 4,670,037 | |||||
Belgium — 0.3% | |||||
Fortis | 74,100 | 2,364,231 | |||
Bermuda — 0.2% | |||||
Tyco International Ltd. | 72,200 | 2,083,692 | |||
Brazil — 0.4% | |||||
Banco Itau Holding Financeira, ADR | 88,800 | 2,132,976 | |||
Petroleo Brasilerio SA, ADR | 15,500 | 997,735 | |||
| 3,130,711 | |||||
Canada — 1.1% | |||||
Canadian National Railway Co. | 58,800 | 4,711,284 | |||
Manulife Financial Corp. | 55,500 | 3,259,482 | |||
Shoppers Drug Mart Corp. | 25,700 | 972,331 | |||
| 8,943,097 | |||||
China — 0.3% | |||||
Foxconn International Holdings Ltd.(a) | 1,340,000 | 2,187,560 | |||
Colombia — 0.1% | |||||
BanColombia SA, ADR | 26,400 | 761,112 | |||
Denmark — 0.2% | |||||
Danske Bank A/S | 36,600 | 1,289,305 | |||
Finland — 0.2% | |||||
Perlos Oyj | 73,300 | 776,676 | |||
Rautaruukki Oyj | 53,600 | 1,304,036 | |||
| 2,080,712 | |||||
France — 5.0% | |||||
BNP Paribas SA | 76,200 | 6,166,042 | |||
Bouygues SA | 36,600 | 1,789,551 | |||
Ciments Francais | 5,200 | 675,956 | |||
CNP Assurances | 15,900 | 1,253,673 | |||
Compagnie Generale des Etablissements Michelin | 20,800 | 1,169,195 | |||
Credit Agricole SA | 25,200 | 793,886 | |||
Dassault Systemes SA | 21,200 | 1,196,950 | |||
| COMMON STOCKS (Continued) | Shares | Value (Note 2) | |||
France (cont’d.) | |||||
Essilor International SA CIE Generale D’Optique | 20,300 | $ | 1,639,054 | ||
Eurazeo | 10,100 | 1,054,039 | |||
Hermes International | 8,930 | 2,233,901 | |||
Iliad SA | 7,500 | 464,383 | |||
Natexis Banques Populaires | 6,900 | 1,149,360 | |||
Peugeot SA | 26,000 | 1,499,047 | |||
Rallye SA | 13,400 | 575,711 | |||
Renault SA | 13,600 | 1,109,356 | |||
Sanofi-Aventis | 55,900 | 4,897,297 | |||
Societe Generale | 5,300 | 651,935 | |||
Technip SA | 27,600 | 1,659,915 | |||
Total SA | 7,500 | 1,884,168 | |||
Total SA, ADR | 42,800 | 5,409,920 | |||
Valeo SA | 30,700 | 1,141,614 | |||
Vinci SA | 22,600 | 1,943,824 | |||
| 40,358,777 | |||||
Republic of Germany — 3.6% | |||||
BASF AG | 39,300 | 3,011,696 | |||
Bayer AG | 21,600 | 900,906 | |||
Bijou Brigitte AG | 2,350 | 637,113 | |||
Celesio AG | 25,100 | 2,153,797 | |||
Continental AG | 42,800 | 3,795,233 | |||
DaimlerChrysler AG | 24,800 | 1,264,854 | |||
Deutsche Bank AG | 21,900 | 2,125,519 | |||
Deutsche Telekom AG | 83,000 | 1,381,581 | |||
E.ON AG | 32,300 | 3,344,452 | |||
MAN AG | 29,500 | 1,574,414 | |||
Salzgitter AG | 29,200 | 1,576,379 | |||
SAP AG | 30,400 | 5,513,006 | |||
ThyssenKrupp AG | 60,200 | 1,257,211 | |||
TUI AG | 45,600 | 930,711 | |||
| 29,466,872 | |||||
Greece — 0.4% | |||||
Coca Cola Hellenic Bottling Co. SA, ADR | 48,600 | 1,422,522 | |||
Motor Oil Hellas Corinth Refineries SA | 31,000 | 728,876 | |||
National Bank of Greece SA, ADR | 133,000 | 1,138,480 | |||
| 3,289,878 | |||||
Hong Kong — 1.0% | |||||
Chaoda Modern Agriculture | 1,203,600 | 499,892 | |||
CITIC International Financial Holdings Ltd | 1,621,000 | 601,056 | |||
Citic Pacific Ltd. | 544,500 | 1,504,666 | |||
Esprit Holdings Ltd. | 269,000 | 1,908,083 | |||
Li & Fung Ltd. | 736,000 | 1,416,167 | |||
Techtronic Industries Co. | 797,000 | 1,895,984 | |||
| 7,825,848 | |||||
India — 0.4% | |||||
HDFC Bank Ltd., ADR | 23,500 | 1,196,150 | |||
Infosys Technologies Ltd., ADR | 24,000 | 1,940,640 | |||
| 3,136,790 | |||||
Ireland — 0.7% | |||||
Anglo Irish Bank Corp., PLC | 134,900 | 2,047,520 | |||
SEE NOTES TO FINANCIAL STATEMENTS.
B47
| GLOBAL PORTFOLIO (Continued) |
SCHEDULE OF INVESTMENTS | December 31, 2005 |
| COMMON STOCKS (Continued) | Shares | Value (Note 2) | |||
Ireland (cont’d.) | |||||
Irish Life & Permanent, PLC | 86,900 | $ | 1,775,716 | ||
Ryanair Holdings PLC, ADR(a) | 38,400 | 2,150,016 | |||
| 5,973,252 | |||||
Italy — 1.4% | |||||
Banche Popolari Unite Scrl | 33,200 | 727,934 | |||
Benetton Group SpA | 103,000 | 1,173,074 | |||
Eni SpA | 97,900 | 2,715,613 | |||
IFIL — Investments SpA | 362,100 | 1,546,492 | |||
Luxottica Group SpA | 115,500 | 2,930,335 | |||
Saipem SpA | 83,800 | 1,375,055 | |||
Sanpaolo IMI SpA | 53,700 | 839,827 | |||
| 11,308,330 | |||||
Japan — 12.6% | |||||
Aeon Credit Service Co. Ltd. | 9,700 | 917,876 | |||
Aeon Mall Co. Ltd | 24,200 | 1,179,449 | |||
Alpine Electronics, Inc. | 41,600 | 558,188 | |||
Alps Electric Co. Ltd. | 49,700 | 694,430 | |||
Asahi Breweries Ltd. | 131,600 | 1,604,577 | |||
Asahi Kasei Corp. | 226,100 | 1,529,975 | |||
Capcom Co. Ltd. | 93,200 | 1,088,601 | |||
Chiyoda Corp. | 56,000 | 1,283,165 | |||
Chugai Pharmaceutical Co. Ltd. | 115,300 | 2,480,821 | |||
Cosmo Oil Co. Ltd. | 303,300 | 1,516,771 | |||
Daiwa Securities Group, Inc. | 89,400 | 1,013,100 | |||
Denki Kagaku Kogyo K K | 224,900 | 993,366 | |||
Denso Corp. | 141,500 | 4,898,828 | |||
Hitachi Ltd. | 137,900 | 929,093 | |||
Hokkaido Electric Power Co., Inc. | 53,200 | 1,081,625 | |||
Hokuetsu Paper Mills Ltd. | 113,900 | 588,979 | |||
Honda Motor Co. Ltd. | 47,700 | 2,752,934 | |||
Hosiden Corp. | 51,900 | 634,920 | |||
Hoya Corp. | 84,700 | 3,044,437 | |||
JS Group Corp. | 30,800 | 615,335 | |||
Kaken Pharmaceutical Co. Ltd. | 129,500 | 1,007,079 | |||
Kansai Electric Power Co., Inc. (The) | 72,300 | 1,551,090 | |||
Kenedix, Inc. | 93 | 586,004 | |||
Keyence Corp. | 13,200 | 3,753,877 | |||
KK Davinci Advisors(a) | 78 | 586,348 | |||
Komeri Co. Ltd. | 19,400 | 832,065 | |||
Kurabo Industries Ltd. | 173,100 | 647,532 | |||
Kyowa Hakko Kogyo Co. Ltd. | 118,000 | 822,472 | |||
Kyushu Electric Power Co., Inc. | 30,700 | 666,126 | |||
Marubeni Corp. | 191,700 | 1,026,636 | |||
MISUMI Group, Inc. | 14,300 | 621,641 | |||
Mitsubishi UFJ Financial, Inc. | 440 | 5,991,811 | |||
Mori Seiki Co. Ltd. | 42,400 | 636,351 | |||
NEOMAX Co. Ltd. | 19,000 | 625,538 | |||
Nidec Corp. | 29,700 | 2,526,707 | |||
Nippon Oil Corp. | 284,200 | 2,202,467 | |||
Nippon Telegraph & Telephone Corp. | 600 | 2,722,991 | |||
Nissan Motor Co. Ltd. | 200,100 | 2,041,168 | |||
Nitto Denko Corp. | 22,400 | 1,745,239 | |||
NSK Ltd. | 219,400 | 1,500,508 | |||
NTT DoCoMo, Inc. | 1,800 | 2,741,236 | |||
Okasan Holdings, Inc. | 124,100 | 1,070,261 | |||
ORIX Corp. | 20,700 | 5,268,765 | |||
Osaka Gas Co. Ltd. | 439,300 | 1,514,758 | |||
| COMMON STOCKS (Continued) | Shares | Value (Note 2) | |||
Japan (cont’d.) | |||||
Point, Inc. | 10,000 | $ | 835,718 | ||
Rengo Co. Ltd. | 217,900 | 1,316,268 | |||
Ricoh Co. Ltd. | 95,600 | 1,673,926 | |||
Ryohin Kiekaku Co. Ltd. | 12,900 | 1,128,493 | |||
Santen Pharmaceutical Co. Ltd. | 26,700 | 740,618 | |||
Sharp Corp. | 204,000 | 3,103,939 | |||
Shimamura Co. Ltd. | 7,100 | 981,123 | |||
Sumitomo Trust & Banking Co. Ltd. (The) | 237,000 | 2,416,554 | |||
Sundrug Co. Ltd. | 7,000 | 383,532 | |||
Takefuji Corp. | 20,000 | 1,357,982 | |||
Tanabe Seiyaku Co. Ltd. | 143,600 | 1,393,213 | |||
Tohoku Electric Power Co., Inc. | 38,900 | 790,232 | |||
Toyota Motor Corp. | 78,300 | 4,090,714 | |||
Toyota Motor Corp., ADR | 59,828 | 6,259,206 | |||
UNY Co. Ltd. | 41,500 | 654,322 | |||
Yamada Denki Co. Ltd. | 18,800 | 2,350,212 | |||
Yokohama Rubber Co. Ltd. (The) | 174,300 | 1,022,796 | |||
| 102,593,988 | |||||
Mexico — 0.5% | |||||
America Movil — Ser. L, ADR | 17,395 | 508,978 | |||
America Movil SA de CV | 867,000 | 1,266,354 | |||
Wal-Mart de Mexico SA de CV | 478,400 | 2,654,653 | |||
| 4,429,985 | |||||
Netherlands — 2.0% | |||||
ABN AMRO Holding NV | 22,700 | 593,656 | |||
Aegon NV | 151,600 | 2,467,828 | |||
ING Groep NV | 69,300 | 2,403,886 | |||
Qiagen NV(a) | 66,100 | 777,076 | |||
Royal Dutch Shell PLC | 195,600 | 6,252,684 | |||
Royal Dutch Shell PLC, ADR | 32,100 | 1,973,829 | |||
Royal KPN NV | 67,900 | 680,873 | |||
Stork NV | 15,000 | 640,901 | |||
TomTom NV(a) | 26,100 | 896,090 | |||
| 16,686,823 | |||||
New Zealand — 0.1% | |||||
Fisher & Paykel Appliances Holdings Ltd. | 366,600 | 867,088 | |||
Norway — 0.6% | |||||
Norsk Hydro ASA | 16,100 | 1,653,105 | |||
Statoil ASA | 130,100 | 2,987,791 | |||
| 4,640,896 | |||||
Portugal — 0.1% | |||||
Energias de Portugal SA | 231,100 | 711,355 | |||
Singapore — 0.4% | |||||
CapitaLand Ltd. | 768,000 | 1,586,716 | |||
MobileOne Ltd. | 433,700 | 553,618 | |||
Neptune Orient Lines Ltd. | 432,800 | 875,385 | |||
| 3,015,719 | |||||
South Africa — 0.4% | |||||
Naspers Ltd.(b) | 45,500 | 805,445 | |||
Sasol Ltd. | 70,100 | 2,509,309 | |||
| 3,314,754 | |||||
SEE NOTES TO FINANCIAL STATEMENTS.
B48
| GLOBAL PORTFOLIO (Continued) |
SCHEDULE OF INVESTMENTS | December 31, 2005 |
| COMMON STOCKS (Continued) | Shares | Value (Note 2) | |||
South Korea — 0.7% | |||||
Hyundai Motor Co. GDR | 39,300 | $ | 1,891,423 | ||
Kookmin Bank, ADR | 21,700 | 1,621,207 | |||
Samsung Electronics Co. Ltd., GDR | 7,600 | 2,504,200 | |||
| 6,016,830 | |||||
Spain — 1.3% | |||||
Banco Bilbao Vizcaya Argentaria SA | 83,800 | 1,496,092 | |||
Banco Santander Central Hispano SA | 109,900 | 1,450,726 | |||
Cia Espanola de Petroleos | 23,800 | 1,089,029 | |||
Grupo Ferrovial SA | 15,600 | 1,080,422 | |||
Inditex SA | 89,200 | 2,909,373 | |||
Repsol YPF SA | 93,200 | 2,722,062 | |||
| 10,747,704 | |||||
Sweden — 0.7% | |||||
Capio AB(a) | 25,500 | 454,182 | |||
Electrolux AB, Ser. B | 68,800 | 1,788,306 | |||
Modern Times Group AB(a) | 14,100 | 588,350 | |||
Nordea Bank AB | 244,700 | 2,541,099 | |||
| 5,371,937 | |||||
Switzerland — 4.8% | |||||
Actelion Ltd.(a) | 3,700 | 306,069 | |||
Baloise Holding AG | 24,000 | 1,401,773 | |||
Credit Suisse Group | 68,700 | 3,502,835 | |||
EFG International(a) | 28,800 | 767,094 | |||
Georg Fischer AG(a) | 2,500 | 854,229 | |||
Nobel Biocare Holding AG | 4,500 | 989,688 | |||
Phonak Holding AG | 13,200 | 568,563 | |||
Rieter Holding AG | 2,200 | 652,943 | |||
Roche Holding AG | 41,800 | 6,276,124 | |||
SGS SA | 1,750 | 1,475,591 | |||
Swisscom AG | 2,900 | 915,319 | |||
Syngenta AG | 5,000 | 622,122 | |||
Synthes, Inc. | 33,900 | 3,807,800 | |||
UBS AG | 148,515 | 14,135,747 | |||
Verwalt & Privat-Bank AG | 2,578 | 431,416 | |||
Zurich Financial Services AG | 11,200 | 2,386,515 | |||
| 39,093,828 | |||||
Taiwan — 0.4% | |||||
HON HAI Precision Industry Co. Ltd., GDR | 314,000 | 3,611,000 | |||
United Kingdom — 8.0% | |||||
Alliance & Leicester PLC | 60,600 | 1,036,361 | |||
AstraZeneca PLC | 70,100 | 3,411,952 | |||
Aviva PLC | 185,200 | 2,246,374 | |||
BAE Systems PLC | 158,200 | 1,039,053 | |||
Barclays PLC | 299,200 | 3,145,247 | |||
BG Group PLC | 604,800 | 5,977,971 | |||
BP PLC | 153,600 | 1,635,814 | |||
Bradford & Bingley PLC | 178,100 | 1,257,851 | |||
BT Group PLC | 756,400 | 2,898,820 | |||
Cairn Energy PLC(a) | 29,300 | 967,878 | |||
Capita Group PLC | 260,400 | 1,867,104 | |||
Carphone Warehouse Group PLC | 116,500 | 555,211 | |||
DSG International PLC | 333,500 | 939,570 | |||
Firstgroup PLC | 127,000 | 877,832 | |||
GKN PLC | 263,300 | 1,304,654 | |||
| COMMON STOCKS (Continued) | Shares | Value (Note 2) | |||
United Kingdom (cont’d.) | |||||
GlaxoSmithKline PLC | 37,400 | $ | 945,247 | ||
Hanson PLC | 70,700 | 777,271 | |||
HBOS PLC | 410,700 | 7,016,587 | |||
House of Fraser PLC | 379,200 | 738,854 | |||
Imperial Chemical Industries PLC | 261,100 | 1,491,410 | |||
Legal & General Group PLC | 359,600 | 754,799 | |||
Lloyds TSB Group PLC | 346,200 | 2,909,669 | |||
Mitchells & Butlers PLC | 151,500 | 1,089,534 | |||
Northern Foods PLC | 211,500 | 551,283 | |||
Northumbrian Water Group PLC | 225,900 | 946,384 | |||
Old Mutual PLC | 532,900 | 1,510,508 | |||
Pilkington PLC | 544,600 | 1,396,098 | |||
Reckitt Benckiser PLC | 76,700 | 2,533,661 | |||
Scottish Power PLC | 195,100 | 1,824,353 | |||
Shanks Group PLC | 34,229 | 91,280 | |||
Standard Chartered PLC | 140,000 | 3,119,247 | |||
Tate & Lyle PLC | 99,500 | 963,792 | |||
Taylor Woodrow PLC | 198,900 | 1,302,091 | |||
Tesco PLC | 701,600 | 4,001,521 | |||
Viridain Group PLC | 46,100 | 709,469 | |||
Vodafone Group PLC | 505,800 | 1,092,130 | |||
| 64,926,880 | |||||
United States — 44.1% | |||||
Alltel Corp. | 29,800 | 1,880,380 | |||
Altria Group, Inc. | 24,400 | 1,823,168 | |||
Amerada Hess Corp. | 17,900 | 2,270,078 | |||
American Express Co. | 37,700 | 1,940,042 | |||
American International Group, Inc. | 43,100 | 2,940,713 | |||
Ameriprise Financial, Inc. | 41,200 | 1,689,200 | |||
Amylin Pharmaceuticals, Inc. | 52,180 | 2,083,026 | |||
Anheuser-Busch Cos., Inc. | 55,000 | 2,362,800 | |||
Apple Computer, Inc.(a) | 134,277 | 9,653,174 | |||
AT&T, Inc. | 79,600 | 1,949,404 | |||
Avon Products, Inc. | 68,300 | 1,949,965 | |||
Baker Hughes, Inc. | 69,500 | 4,224,210 | |||
Bank of America Corp. | 122,500 | 5,653,375 | |||
Bowater, Inc. | 35,900 | 1,102,848 | |||
Bristol-Myers Squibb Co. | 80,600 | 1,852,188 | |||
Burlington Northern Santa Fe Corp. | 81,942 | 5,803,132 | |||
Cablevision Systems Corp. | 37,800 | 887,166 | |||
Campbell Soup Co. | 58,500 | 1,741,545 | |||
Caterpillar, Inc. | 102,815 | 5,939,623 | |||
CBS Corp. (Class B)(a) | 64,600 | 2,105,960 | |||
Charles Schwab Corp. (The) | 98,200 | 1,440,594 | |||
ChevronTexaco Corp. | 81,200 | 4,609,724 | |||
Chicago Mercantile Exchange Holdings, Inc. | 21,098 | 7,753,304 | |||
Cisco Systems, Inc.(a) | 113,400 | 1,941,408 | |||
Citigroup, Inc. | 66,800 | 3,241,804 | |||
Coca-Cola Co. (The) | 71,800 | 2,894,258 | |||
Comcast Corp. (Class A)(a) | 96,300 | 2,473,947 | |||
Dow Chemical Co. (The) | 30,400 | 1,332,128 | |||
Dow Jones & Co., Inc. | 36,900 | 1,309,581 | |||
Duke Energy Corp. | 114,100 | 3,132,045 | |||
E.I. du Pont de Nemours & Co. | 56,600 | 2,405,500 | |||
Exxon Mobil Corp. | 82,200 | 4,617,174 | |||
SEE NOTES TO FINANCIAL STATEMENTS.
B49
| GLOBAL PORTFOLIO (Continued) |
SCHEDULE OF INVESTMENTS | December 31, 2005 |
| COMMON STOCKS (Continued) | Shares | Value (Note 2) | |||
United States (cont’d.) | |||||
Fannie Mae | 34,900 | $ | 1,703,469 | ||
FedEx Corp. | 79,775 | 8,247,937 | |||
Fifth Third Bancorp | 71,600 | 2,700,752 | |||
FirstEnergy Corp. | 51,200 | 2,508,288 | |||
Genentech, Inc.(a) | 118,452 | 10,956,810 | |||
General Dynamics Corp. | 42,887 | 4,891,262 | |||
General Electric Co. | 334,832 | 11,735,861 | |||
General Mills, Inc. | 32,000 | 1,578,240 | |||
General Motors Corp. | 54,200 | 1,052,564 | |||
Genworth Financial, Inc. | 35,300 | 1,220,674 | |||
Goldman Sachs Group, Inc. | 44,698 | 5,708,382 | |||
Google, Inc. (Class “A” Stock)(a) | 13,596 | 5,640,437 | |||
Halliburton Co. | 91,073 | 5,642,883 | |||
Hartford Financial Services Group, Inc. | 25,800 | 2,215,962 | |||
Hewlett-Packard Co. | 63,500 | 1,818,005 | |||
Home Depot, Inc. (The) | 169,162 | 6,847,678 | |||
Honeywell International, Inc. | 89,600 | 3,337,600 | |||
International Business Machines Corp. | 39,700 | 3,263,340 | |||
International Paper Co. | 88,800 | 2,984,568 | |||
Johnson & Johnson | 38,000 | 2,283,800 | |||
J.P. Morgan Chase & Co. | 158,600 | 6,294,834 | |||
KB Home | 40,511 | 2,943,529 | |||
Lehman Brothers Holdings, Inc. | 46,020 | 5,898,383 | |||
Lennar Corp. (Class “A” Stock) | 66,220 | 4,040,744 | |||
Liberty Media Corp. (Class “A” Stock)(a) | 364,100 | 2,865,467 | |||
Lincoln National Corp. | 18,400 | 975,752 | |||
Lockheed Martin Corp. | 27,500 | 1,749,825 | |||
Lowe’s Cos., Inc. | 115,023 | 7,667,433 | |||
Marsh & McLennan Cos., Inc. | 142,200 | 4,516,272 | |||
Medtronic, Inc. | 48,894 | 2,814,828 | |||
Mellon Financial Corp. | 76,500 | 2,620,125 | |||
Merck & Co., Inc. | 107,300 | 3,413,213 | |||
Merrill Lynch & Co., Inc. | 34,400 | 2,329,912 | |||
Microsoft Corp. | 127,500 | 3,334,125 | |||
Morgan Stanley | 47,800 | 2,712,172 | |||
Motorola, Inc. | 264,588 | 5,977,043 | |||
New York Times Co. (The) | 70,100 | 1,854,145 | |||
Newell Rubbermaid, Inc. | 88,700 | 2,109,286 | |||
NiSource, Inc. | 129,800 | 2,707,628 | |||
Nordstrom, Inc. | 106,497 | 3,982,988 | |||
Nucor Corp. | 28,000 | 1,868,160 | |||
Pfizer, Inc. | 118,400 | 2,761,088 | |||
Praxair, Inc. | 91,780 | 4,860,669 | |||
Procter & Gamble Co. (The) | 136,019 | 7,872,780 | |||
Progressive Corp. (The) | 31,612 | 3,691,649 | |||
QUALCOMM, Inc. | 127,370 | 5,487,100 | |||
Qwest Communications International, Inc.(a) | 190,000 | 1,073,500 | |||
RadioShack Corp. | 62,100 | 1,305,963 | |||
| COMMON STOCKS (Continued) | Shares | Value (Note 2) | |||
United States (cont’d.) | |||||
Raytheon Co. | 50,200 | $ | 2,015,530 | ||
Schering-Plough Corp. | 93,600 | 1,951,560 | |||
SLM Corp. | 73,259 | 4,035,838 | |||
Sprint Nextel Corp. | 118,700 | 2,772,832 | |||
St. Joe Co. (The) | 49,051 | 3,297,208 | |||
St. Paul Travelers Cos., Inc. (The) | 60,300 | 2,693,601 | |||
Starbucks Corp.(a) | 213,805 | 6,416,288 | |||
State Street Corp. | 48,100 | 2,666,664 | |||
Texas Instruments, Inc. | 44,800 | 1,436,736 | |||
Time Warner Cos., Inc. | 201,100 | 3,507,184 | |||
U.S. Bancorp | 115,600 | 3,455,284 | |||
Union Pacific Corp. | 88,485 | 7,123,927 | |||
UnitedHealth Group, Inc. | 220,218 | 13,684,346 | |||
Verizon Communications, Inc. | 71,900 | 2,165,628 | |||
Wal-Mart Stores, Inc. | 50,000 | 2,340,000 | |||
Walgreen Co. | 84,493 | 3,739,660 | |||
Walt Disney Co. | 95,000 | 2,277,150 | |||
Waste Management, Inc. | 84,800 | 2,573,680 | |||
Wyeth | 48,300 | 2,225,181 | |||
Wynn Resorts Ltd.(a) | 104,492 | 5,731,386 | |||
| 359,180,272 | |||||
TOTAL COMMON STOCKS | 769,490,139 | ||||
| PREFERRED STOCK — 0.2% | |||||
Republic of Germany | |||||
Porsche AG | 1,740 | 1,248,139 | |||
TOTAL LONG-TERM INVESTMENTS (cost $732,869,852) | 770,738,278 | ||||
| SHORT-TERM INVESTMENTS — 5.1% | |||||
Mutual Fund — 5.0% | |||||
Dryden Core Investment Fund — Taxable Money Market Series (Note 4)(d) | 41,184,673 | 41,184,673 | |||
Interest | Maturity Date | Principal Amount | ||||||||
U.S. Treasury Securities — 0.1% | ||||||||||
U.S. Treasury Bills(e) | ||||||||||
| 3.50%(c) | 01/26/06 | $ | 500,000 | 498,757 | ||||||
TOTAL SHORT-TERM INVESTMENTS | 41,683,430 | |||||||||
TOTAL INVESMENTS — 99.8% | 812,421,708 | |||||||||
OTHER ASSETS IN EXCESS OF | 1,718,137 | |||||||||
TOTAL NET ASSETS — 100.0% | $ | 814,139,845 | ||||||||
SEE NOTES TO FINANCIAL STATEMENTS.
B50
| GLOBAL PORTFOLIO (Continued) |
SCHEDULE OF INVESTMENTS | December 31, 2005 |
The following abbreviations are used in portfolio descriptions:
| ADR | American Depositary Receipt | |
| GDR | Global Depositary Receipt |
| (a) | Non-income producing security. |
| (b) | As of December 31, 2005, one security representing $805,445 and 0.001% of the total market value of the Portfolio was fair valued in accordance with the policies adopted by the Board of Directors. |
| (c) | Represents yield to maturity as of December 31, 2005. |
| (d) | Prudential Investments LLC, the manager of the Portfolio, also serves as manager of the Dryden Core Investment Fund — Taxable Money Market Series. |
| (e) | Security segregated as collateral for future contracts. |
| (f) | Other assets in excess of liabilities include net unrealized depreciation on financial futures as follows: |
| Open futures contracts outstanding at December 31, 2005: |
| Number of Contracts | Type | Expiration Date | Value at December 31, 2005 | Value at Trade Date | Unrealized (Depreciation) | |||||||||
| Long Positions: | ||||||||||||||
| 139 | 90 Day Euro | March 2006 | $ | 8,720,860 | $ | 8,880,363 | $ | (159,503 | ) | |||||
The industry classification of portfolio holdings and other assets in excess of liabilities shown as a percentage of net assets as of December 31, 2005.
Commercial Banks | 10.3 | % | |
Diversified Financial Services | 9.8 | ||
Oil, Gas & Consumable Fuels | 9.0 | ||
Retail | 6.2 | ||
Mutual Fund | 5.0 | ||
Telecommunications | 5.0 | ||
Pharmaceuticals | 4.8 | ||
Automobiles | 4.6 | ||
Insurance | 4.4 | ||
Transportation | 3.6 | ||
Metal & Minings | 3.0 | ||
Electrical Equipment | 2.5 | ||
Chemicals | 2.3 | ||
Media | 2.3 | ||
Industrial Conglomerates | 2.1 | ||
Health Care-Products | 1.9 | ||
Computers & Peripherals | 1.8 | ||
Construction | 1.8 | ||
Health Care-Services | 1.7 | ||
Software | 1.7 | ||
Biotechnology | 1.4 | ||
Electronics | 1.4 | ||
Aerospace/Defense | 1.2 | ||
Personal Products | 1.2 | ||
Food | 1.1 | ||
Beverages | 1.0 | ||
Household Products | 1.0 | ||
Hotels, Restaurants & Leasure | 0.8 | ||
Internet Software & Services | 0.8 | ||
Real Estate | 0.8 | ||
Forest Products & Paper | 0.7 | ||
Building Materials | 0.6 | ||
Commercial Services | 0.6 | ||
Semiconductors & Semiconductor Equipment | 0.6 | ||
Textiles, Apparel & Luxury Goods | 0.5 | ||
Trading Companies & Distributors | 0.5 | ||
Agriculture | 0.4 | ||
Machinery | 0.4 | ||
Airlines | 0.3 | ||
Environmental Control | 0.3 | ||
Office Equipment | 0.2 | ||
U.S. Treasury Securities | 0.1 | ||
Utility — Water | 0.1 | ||
| 99.8 | |||
Other assets in excess of liabilities | 0.2 | ||
| 100.0 | % | ||
SEE NOTES TO FINANCIAL STATEMENTS.
B51
| GOVERNMENT INCOME PORTFOLIO |
SCHEDULE OF INVESTMENTS | December 31, 2005 |
| LONG-TERM INVESTMENTS — 94.5% | Interest Rate | Maturity Date | Principal Amount (000) | Value (Note 2) | ||||||
Asset Backed Securities — 5.5% | ||||||||||
MBNA Master Credit Card Trust II, Series 1999-J, Class A | 7.00% | 02/15/12 | $ | 3,200 | $ | 3,436,145 | ||||
Small Business Administration Participation Certificates, Series 1997-20A, Class 1 | 7.15% | 01/01/17 | 5,716 | 5,977,161 | ||||||
Small Business Administration Participation Certificates, Series 1996-20J, Class 1 | 7.20% | 10/01/16 | 5,657 | 5,922,744 | ||||||
Small Business Administration Participation Certificates, Series 1997-20G, Class 1 | 6.85% | 07/01/17 | 1,727 | 1,798,390 | ||||||
Small Business Administration Participation Certificates, Series 1998-201, Class 1 | 6.00% | 09/01/18 | 3,526 | 3,624,837 | ||||||
| 20,759,277 | ||||||||||
Collateralized Mortgage Obligations — 6.5% | ||||||||||
Federal Home Loan Mortgage Corp., Series 2496, Class PM | 5.50% | 09/15/17 | 2,819 | 2,818,222 | ||||||
Federal Home Loan Mortgage Corp., Series 2501, Class MC | 5.50% | 09/15/17 | 2,000 | 2,030,958 | ||||||
Federal Home Loan Mortgage Corp., Series 2513, Class HC | 5.00% | 10/15/17 | 2,339 | 2,307,027 | ||||||
Federal Home Loan Mortgage Corp., Series 2518, Class PV | 5.50% | 06/15/19 | 1,920 | 1,901,790 | ||||||
Federal National Mortgage Association, Series 1993-29, Class PH | 6.50% | 01/25/23 | 642 | 645,328 | ||||||
Federal National Mortgage Association, Series 2002-18, Class PC | 5.50% | 04/25/17 | 5,000 | 5,093,817 | ||||||
Federal National Mortgage Association, Series 2002-57, Class ND | 5.50% | 09/25/17 | 2,600 | 2,635,009 | ||||||
Federal National Mortgage Association, Series 2002-94, Class HQ | 4.50% | 01/25/18 | 6,419 | 6,131,733 | ||||||
Structured Adjustable Rate Mortgage Loan, Series 2004-1, Class 4A-3(a) | 4.17% | 02/25/34 | 892 | 879,582 | ||||||
| 24,443,466 | ||||||||||
Commercial Mortgage Backed Securities — 6.5% | ||||||||||
Banc of America Commercial Mortgage, Inc., Series 2005-2, Class A5 | 4.86% | 07/10/43 | 1,750 | 1,710,301 | ||||||
Bear Stearns Commercial Mortgage Securities, Inc., Series 2000-WF1, Class A1 | 7.64% | 02/15/32 | 925 | 960,021 | ||||||
Bear Stearns Commercial Mortgage, Series 2004-T16, Class A5 | 4.60% | 02/13/46 | 4,200 | 4,053,503 | ||||||
Bear Stearns Commercial Mortgage, Series 2005-PWR8, Class A4 | 4.67% | 06/11/41 | 1,750 | 1,684,928 | ||||||
CS First Boston Mortgage Securities Corp., Series 2005-C3, Class A4 | 4.69% | 07/15/37 | 1,750 | 1,688,471 | ||||||
First Union National Bank Commercial Mortgage Trust, Series 2000-C2, Class A1 | 6.94% | 10/15/32 | 1,069 | 1,090,848 | ||||||
First Union National Bank Commercial Mortgage Trust, Series 2000-C1, Class A1 | 7.74% | 05/17/32 | 675 | 693,491 | ||||||
GS Mortgage Securities Corp. II, Series 2003-C1, Class A3 | 4.61% | 01/10/40 | 6,800 | 6,589,614 | ||||||
Keycorp, Series 2000-C1, Class A2 | 7.73% | 05/17/32 | 3,000 | 3,260,129 | ||||||
Morgan Stanley Capital I, Series 2005-T19, Class AAB | 4.85% | 06/12/47 | 1,375 | 1,352,576 | ||||||
Morgan Stanley Dean Witter I, Series 2001-TOP1, Class A2 | 6.32% | 02/15/33 | 1,536 | 1,557,441 | ||||||
| 24,641,323 | ||||||||||
Corporate Bonds — 1.3% | ||||||||||
International Bank for Reconstruction | 4.75% | 02/15/35 | 1,670 | 1,628,749 | ||||||
New Jersey Economic Development Authority State Pension Funding, Series B | Zero | 02/15/12 | 4,609 | 3,448,177 | ||||||
| 5,076,926 | ||||||||||
Mortgage Backed Securities — 44.0% | ||||||||||
Federal Home Loan Mortgage Corp. | 5.00% | 06/01/33-05/01/34 | 13,148 | 12,762,874 | ||||||
Federal Home Loan Mortgage Corp. | 6.00% | 09/01/34 | 838 | 846,162 | ||||||
Federal Home Loan Mortgage Corp. | 6.50% | 06/01/08-09/01/32 | 1,687 | 1,732,496 | ||||||
Federal Home Loan Mortgage Corp. | 7.00% | 12/01/08-10/01/32 | 2,297 | 2,360,956 | ||||||
Federal Home Loan Mortgage Corp. | 5.00% | TBA | 5,500 | 5,322,966 | ||||||
Federal Home Loan Mortgage Corp. | 6.00% | TBA | 3,000 | 3,029,064 | ||||||
Federal National Mortgage Association(a) | 4.09% | 08/01/33 | 5,636 | 5,446,234 | ||||||
Federal National Mortgage Association(a) | 4.27% | 04/01/34 | 2,830 | 2,786,134 | ||||||
Federal National Mortgage Association(a) | 4.45% | 06/01/34 | 2,589 | 2,559,176 | ||||||
Federal National Mortgage Association(a) | 4.89% | 10/01/34 | 3,304 | 3,267,725 | ||||||
Federal National Mortgage Association | 5.00% | 07/01/18-03/01/34 | 15,484 | 15,231,225 | ||||||
Federal National Mortgage Association | 5.50% | 01/01/17-09/01/35 | 48,300 | 47,879,669 | ||||||
Federal National Mortgage Association | 6.00% | 11/01/14-01/01/35 | 6,045 | 6,117,647 | ||||||
Federal National Mortgage Association | 6.28% | 03/01/11 | 1,605 | 1,682,777 | ||||||
Federal National Mortgage Association | 6.50% | 11/01/09-10/01/32 | 6,338 | 6,512,336 | ||||||
Federal National Mortgage Association | 7.00% | 02/01/12-11/01/33 | 2,391 | 2,492,431 | ||||||
Federal National Mortgage Association | 7.50% | 12/01/06-10/01/12 | 619 | 644,864 | ||||||
Federal National Mortgage Association | 8.00% | 10/01/23-03/01/26 | 78 | 85,747 | ||||||
Federal National Mortgage Association | 9.00% | 02/01/25-04/01/25 | 356 | 390,275 | ||||||
Federal National Mortgage Association | 5.00% | TBA | 1,000 | 968,750 | ||||||
SEE NOTES TO FINANCIAL STATEMENTS.
B52
| GOVERNMENT INCOME PORTFOLIO (Continued) |
SCHEDULE OF INVESTMENTS | December 31, 2005 |
| LONG-TERM INVESTMENTS (Continued) | Interest Rate | Maturity Date | Principal Amount (000) | Value (Note 2) | ||||||
Mortgage Backed Securities (cont’d.) | ||||||||||
Federal National Mortgage Association | 5.00% | TBA | $ | 10,000 | $ | 9,890,621 | ||||
Federal National Mortgage Association | 5.50% | TBA | 1,000 | 1,005,938 | ||||||
Federal National Mortgage Association | 5.50% | TBA | 5,000 | 4,950,000 | ||||||
Federal National Mortgage Association | 6.00% | TBA | 11,000 | 11,099,683 | ||||||
Federal National Mortgage Association | 7.00% | TBA | 3,000 | 3,129,375 | ||||||
Government National Mortgage Association | 5.00% | 09/15/33-04/15/34 | 5,401 | 5,338,497 | ||||||
Government National Mortgage Association | 6.50% | 07/15/32-08/15/32 | 1,321 | 1,380,477 | ||||||
Government National Mortgage Association | 7.00% | 08/15/23-08/15/28 | 2,996 | 3,154,259 | ||||||
Government National Mortgage Association | 7.50% | 12/15/25-02/15/26 | 646 | 680,955 | ||||||
Government National Mortgage Association | 8.50% | 09/15/24-04/15/25 | 744 | 809,206 | ||||||
Government National Mortgage Association | 5.00% | TBA | 3,000 | 2,959,686 | ||||||
| 166,518,205 | ||||||||||
U.S. Government Agency Obligations — 23.0% | ||||||||||
Federal Farm Credit Bank(b) | 3.75% | 01/15/09 | 4,250 | 4,135,446 | ||||||
Federal Farm Credit Bank | 4.125% | 07/17/09 | 3,110 | 3,047,492 | ||||||
Federal Home Loan Bank | 4.625% | 01/18/08 | 3,250 | 3,244,043 | ||||||
Federal Home Loan Bank(c) | 4.75% | 08/13/10 | 10,755 | 10,727,672 | ||||||
Federal Home Loan Bank | 7.51% | 02/20/07 | 2,000 | 2,015,940 | ||||||
Federal Home Loan Mortgage Corp. | 4.375% | 01/25/10 | 14,690 | 14,454,211 | ||||||
Federal Home Loan Mortgage Corp. | 4.75% | 01/18/11 | 10,790 | 10,784,411 | ||||||
Federal National Mortgage Association | 4.25% | 08/15/10 | 16,000 | 15,675,983 | ||||||
Federal National Mortgage Association | 4.75% | 12/15/10 | 1,930 | 1,930,021 | ||||||
Federal National Mortgage Association | 6.00% | 05/15/11 | 7,450 | 7,879,396 | ||||||
FICO Strip Principal | Zero | 05/11/18 | 4,000 | 2,207,160 | ||||||
Tennessee Valley Authority, Series B | 4.375% | 06/15/15 | 9,850 | 9,545,014 | ||||||
Tennessee Valley Authority, Series B | 5.88% | 04/01/36 | 1,090 | 1,238,305 | ||||||
| 86,885,094 | ||||||||||
U.S. Government Securities — 7.7% | ||||||||||
United States Treasury Bonds(c) | 5.375% | 02/15/31 | 265 | 297,669 | ||||||
United States Treasury Bonds | 5.50% | 08/15/28 | 7,555 | 8,494,947 | ||||||
United States Treasury Bonds(c) | 8.125% | 05/15/21-08/15/21 | 1,504 | 2,084,234 | ||||||
United States Treasury Bonds | 9.25% | 02/15/16 | 2,245 | 3,111,166 | ||||||
United States Treasury Bonds | 13.25% | 05/15/14 | 5,600 | 7,131,690 | ||||||
United States Treasury Notes | 1.875% | 07/15/15 | 911 | 896,249 | ||||||
United States Treasury Notes(c) | 4.125% | 08/15/10 | 1,417 | 1,403,051 | ||||||
United States Treasury Notes(c) | 4.375% | 12/15/10 | 1,895 | 1,896,480 | ||||||
United States Treasury Notes(c) | 4.50% | 11/15/15 | 1,855 | 1,870,217 | ||||||
United States Treasury Strip Principal | Zero | 05/15/19 | 3,295 | 1,779,863 | ||||||
| 28,965,566 | ||||||||||
TOTAL LONG-TERM INVESTMENTS | 357,289,857 | |||||||||
| SHORT-TERM INVESTMENTS — 17.7% | Shares | |||||||||
Mutual Funds — 17.7% | ||||||||||
Dryden Core Investment Fund — Dryden Short-Term Bond Series(e) | 3,121,934 | 31,216,839 | ||||||||
Dryden Core Investment Fund — Taxable Money Market Series (includes $6,829,733 of cash collateral received for securities on loan) (Note 4)(d)(e) | 35,897,716 | 35,897,716 | ||||||||
TOTAL SHORT-TERM INVESTMENTS | 67,114,555 | |||||||||
SEE NOTES TO FINANCIAL STATEMENTS.
B53
| GOVERNMENT INCOME PORTFOLIO (Continued) |
SCHEDULE OF INVESTMENTS | December 31, 2005 |
| LONG-TERM INVESTMENTS (Continued) | Contracts | Value (Note 2) | ||||||||
OUTSTANDING OPTIONS PURCHASED | ||||||||||
Call Option | ||||||||||
U.S. Treasury Notes Futures, expiring 9/18/06 @ $95.25 (cost $49,925) | 43 | $ | 18,006 | |||||||
TOTAL INVESTMENTS, BEFORE OUTSTANDING OPTIONS WRITTEN | 424,422,418 | |||||||||
OUTSTANDING OPTIONS WRITTEN | ||||||||||
Call Option | ||||||||||
U.S. Treasury Notes Futures, expiring 9/18/06 @ $95.75 | 43 | (5,106 | ) | |||||||
TOTAL INVESTMENTS, NET OF OUTSTANDING OPTIONS WRITTEN — 112.2% | 424,417,312 | |||||||||
OTHER LIABILITIES IN EXCESS OF OTHER ASSETS(f) — (12.2%) | (46,254,963 | ) | ||||||||
TOTAL NET ASSETS — 100.0% | $ | 378,162,349 | ||||||||
The following abbreviations are used in portfolio descriptions:
| TBA | Securities purchased on a forward commitment basis |
| (a) | Indicates a variable rate security. The maturity date presented for these instruments is the later of the next date on which the security can be redeemed at par or the next date on which the rate of interest is adjusted. The interest rate shown reflects the rate in effect at December 31, 2005. |
| (b) | Security segregated as collateral for futures contracts, options, swaps and TBAs. |
| (c) | All or portion of security is on loan. The aggregate market value of such securities is $6,681,354; cash collateral of $6,829,733 (included in liabilities) was received with which the Portfolio purchased highly liquid short-term investments. |
| (d) | Represents security, or a portion thereof, purchased with cash collateral received for securities on loan. |
| (e) | Prudential Investments LLC, the manager of the Portfolio, also serves as manager of the Dryden Investment Fund – Taxable Money Market Series and the Dryden Core Investment Fund – Dryden Short-Term Core Bond Series. |
| (f) | Liabilities in excess of other assets include net unrealized appreciation (depreciation) on financial futures and interest rate swaps as follows; |
Open futures contracts outstanding at December 31, 2005:
| Number of Contracts | Type | Expiration Date | Value at Trade Date | Value at December 31, 2005 | Unrealized Appreciation/ (Depreciation) | |||||||||
| Long Positions: | ||||||||||||||
| 220 | Eurodollar Futures-90 Day | Mar. 06 | $ | 52,407,059 | $ | 52,373,750 | $ | (33,309 | ) | |||||
| 20 | Fed Fund-30 Day | Apr. 06 | 7,946,090 | 7,946,469 | 379 | |||||||||
| 234 | U.S. Treasury 30 Yr Bonds | Mar. 06 | 26,232,589 | 26,719,875 | 487,286 | |||||||||
| 454,356 | ||||||||||||||
| Short Positions: | ||||||||||||||
| 359 | U.S. Treasury 2 Yr Notes | Mar. 06 | 73,653,943 | 73,662,312 | (8,369 | ) | ||||||||
| 102 | U.S. Treasury 5 Yr Notes | Mar. 06 | 10,820,459 | 10,847,063 | (26,604 | ) | ||||||||
| 209 | U.S. Treasury 10 Yr Notes | Mar. 06 | 22,679,434 | 22,865,906 | (186,472 | ) | ||||||||
| (221,445 | ) | |||||||||||||
| $ | 232,911 | |||||||||||||
Interest rate swap agreements outstanding at December 31, 2005:
Counterparty (1) | Termination Date | Notional Amount (000) | Fixed Rate | Floating Rate | Unrealized Appreciation | ||||||||
| Morgan Stanley Capital Services, Inc. | 7/14/2010 | $ | 5,750 | 5.047 | % | 3 month LIBOR | $ | 48,453 | |||||
| Morgan Stanley Capital Services, Inc. | 12/15/2015 | 1,900 | 5.047 | % | 3 month LIBOR | 29,198 | |||||||
| Morgan Stanley Capital Services, Inc. | 12/15/2025 | 1,900 | 5.250 | % | 3 month LIBOR | 55,308 | |||||||
| $ | 132,959 | ||||||||||||
| (1) | Portfolio pays the floating rate and receives the fixed rate. |
SEE NOTES TO FINANCIAL STATEMENTS.
B54
| GOVERNMENT INCOME PORTFOLIO (Continued) |
SCHEDULE OF INVESTMENTS | December 31, 2005 |
The industry classification of portfolio holdings and liabilities in excess of other assets shown as a percentage of net assets as of December 31, 2005 was as follows:
Mortgage Backed Securities | 44.0 | % | |
U.S. Government Agency Obligations | 23.0 | ||
Mutual Funds (including 1.8% of | 17.7 | ||
U.S. Government Securities | 7.7 | ||
Commercial Mortgage Backed Securities | 6.5 | ||
Collateralized Mortgage Obligations | 6.5 | ||
Asset Backed Securities | 5.5 | ||
Corporate Bonds | 1.3 | ||
Options | 0.0 | ||
| 112.2 | |||
Liabilities in excess of other assets | (12.2 | ) | |
| 100.0 | % | ||
SEE NOTES TO FINANCIAL STATEMENTS.
B55
| HIGH YIELD BOND PORTFOLIO |
SCHEDULE OF INVESTMENTS | December 31, 2005 |
LONG-TERM INVESTMENTS — 93.8% CORPORATE BONDS — 90.7% | Moody’s Rating (Unaudited) | Interest Rate | Maturity Date | Principal Amount (000) | Value (Note 2) | ||||||||
Aerospace/Defense — 2.5% |
| ||||||||||||
Alliant Techsystems, Inc., Sr. Sub. Notes | B2 | 8.50% | 05/15/11 | $ | 2,750 | $ | 2,887,500 | ||||||
Argo Tech Corp., Sr. Notes | B3 | 9.25% | 06/01/11 | 915 | 937,875 | ||||||||
BE Aerospace, Inc., Sr. Sub Notes, Ser. B | Caa2 | 8.00% | 03/01/08 | 1,150 | 1,150,000 | ||||||||
BE Aerospace, Inc., Sr. Sub Notes, Ser. B | Caa2 | 8.875% | 05/01/11 | 3,485 | 3,659,250 | ||||||||
Bombardier, Inc., Notes(b)(k) | Ba2 | 6.30% | 05/01/14 | 1,000 | 875,000 | ||||||||
Esterline Technologies Corp., Sr. Sub Notes | B1 | 7.75% | 06/15/13 | 4,500 | 4,702,500 | ||||||||
K&F Acquisition, Inc., Gtd. Notes(b) | Caa1 | 7.75% | 11/15/14 | 2,600 | 2,626,000 | ||||||||
K&F Industry, Inc.(g)(i) | B2 | 6.92% | 11/05/12 | 2,247 | 2,268,597 | ||||||||
L-3 Communications Corp., Sr. Sub. Notes | Ba3 | 7.625% | 06/15/12 | 11,050 | 11,630,124 | ||||||||
Moog, Inc., Sr. Sub. Notes | Ba3 | 6.25% | 01/15/15 | 2,000 | 1,970,000 | ||||||||
Sequa Corp., Sr. Notes | B1 | 8.875% | 04/01/08 | 3,475 | 3,622,688 | ||||||||
Sequa Corp., Sr. Notes | B1 | 9.00% | 08/01/09 | 575 | 610,938 | ||||||||
Standard Aero Holdings, Inc., Sr. Notes | Caa1 | 8.25% | 09/01/14 | 2,050 | 1,681,000 | ||||||||
TransDigm, Inc.(b) | B3 | 8.375% | 07/15/11 | 2,300 | 2,420,750 | ||||||||
| 41,042,022 | |||||||||||||
Airlines — 0.5% |
| ||||||||||||
AMR Corp., Deb. Notes | Caa2 | 10.00% | 04/15/21 | 1,695 | 1,267,013 | ||||||||
AMR Corp., MTN | CCC(h) | 10.40% | 03/15/11 | 2,000 | 1,655,000 | ||||||||
AMR Corp., MTN | NR | 10.55% | 03/12/21 | 1,425 | 1,008,188 | ||||||||
Calair Capital Corp., Gtd. Notes | Caa2 | 8.125% | 04/01/08 | 1,978 | 1,718,387 | ||||||||
Continental Airlines, Inc., Pass-thru Certs., Ser. 98-1, Class B | Ba2 | 6.748% | 03/15/17 | 1,738 | 1,522,813 | ||||||||
Continental Airlines, Inc., Pass-thru Certs., Ser. 99-2, Class B | Ba2 | 7.566% | 03/15/20 | 501 | 446,523 | ||||||||
| 7,617,924 | |||||||||||||
Automotive — 6.3% |
| ||||||||||||
ArvinMeritor, Inc., Notes(b) | Ba2 | 8.75% | 03/01/12 | 8,700 | 8,330,250 | ||||||||
Dana Corp., Notes(b) | B1 | 6.50% | 03/01/09 | 1,300 | 1,040,000 | ||||||||
Ford Motor Credit Co., Notes(b) | Baa3 | 7.875% | 06/15/10 | 19,115 | 17,201,435 | ||||||||
General Motors Acceptance Corp., Notes | Ba1 | 6.125% | 09/15/06 | 6,475 | 6,289,524 | ||||||||
General Motors Acceptance Corp., Notes(b) | Ba1 | 6.75% | 12/01/14 | 28,590 | 27,783,285 | ||||||||
General Motors Acceptance Corp., Notes(b) | Ba1 | 6.875% | 08/28/12 | 19,075 | 17,285,792 | ||||||||
Goodyear Tire & Rubber Co.(The), Sr. Notes(k) | B3 | 9.00% | 07/01/15 | 2,825 | 2,782,625 | ||||||||
Lear Corp., Gtd. Notes, Ser. B(b) | Ba2 | 8.11% | 05/15/09 | 2,765 | 2,573,402 | ||||||||
Navistar International Corp., Sr. Notes | Ba3 | 7.50% | 06/15/11 | 615 | 585,788 | ||||||||
Navistar International Corp., Sr. Notes, Ser. B | Ba3 | 9.375% | 06/01/06 | 1,300 | 1,319,500 | ||||||||
Tenneco Automotive, Inc., Gtd. Notes(b) | B3 | 8.625% | 11/15/14 | 3,025 | 2,858,625 | ||||||||
TRW Automotive, Inc., Sr. Notes(b) | Ba3 | 9.375% | 02/15/13 | 4,594 | 4,973,005 | ||||||||
TRW Automotive, Inc., Sr. Sub. Notes(b) | B1 | 11.00% | 02/15/13 | 975 | 1,094,438 | ||||||||
Visteon Corp., Sr. Notes(b) | B3 | 7.00% | 03/10/14 | 5,810 | 4,488,225 | ||||||||
Visteon Corp., Sr. Notes(b) | B3 | 8.25% | 08/01/10 | 4,625 | 3,931,250 | ||||||||
| 102,537,144 | |||||||||||||
Banking — 0.4% |
| ||||||||||||
Halyk Savings Bank of Kazakhstan, Notes (Kazahstan)(k) | Baa2 | 8.125% | 10/07/09 | 1,305 | 1,396,350 | ||||||||
Kazkommerts International BV, Gtd. Notes (Netherlands)(k) | Baa2 | 7.00% | 11/03/09 | 1,685 | 1,728,810 | ||||||||
Kazkommerts International BV, Gtd. Notes (Netherlands)(k) | Baa2 | 8.50 % | 04/16/13 | 3,360 | 3,660,384 | ||||||||
| 6,785,544 | |||||||||||||
Building Materials & Construction — 2.0% |
| ||||||||||||
Beazer Homes USA, Inc., Sr. Notes | Ba1 | 8.625% | 05/15/11 | 1,820 | 1,901,900 | ||||||||
D.R. Horton, Inc., Gtd. Notes | Baa3 | 8.00% | 02/01/09 | 3,000 | 3,197,232 | ||||||||
D.R. Horton, Inc., Gtd. Notes | Baa3 | 8.50% | 04/15/12 | 3,250 | 3,472,326 | ||||||||
D.R. Horton, Inc., Sr. Notes | Ba1 | 9.375% | 03/15/11 | 1,350 | 1,420,415 | ||||||||
Goodman Global Holdings Co., Inc., Sr. Notes(i)(k) | B3 | 7.67% | 06/15/12 | 4,060 | 4,019,400 | ||||||||
K Hovnanian Enterprises, Inc., Gtd. Notes | Ba1 | 6.25% | 01/15/15 | 3,500 | 3,293,875 | ||||||||
KB HOME, Notes | Ba1 | 6.375% | 08/15/11 | 700 | 700,526 | ||||||||
KB HOME, Sr. Sub. Notes | Ba2 | 8.625% | 12/15/08 | 2,800 | 2,974,084 | ||||||||
KB HOME, Sr. Sub. Notes | Ba2 | 9.50% | 02/15/11 | 250 | 262,980 | ||||||||
SEE NOTES TO FINANCIAL STATEMENTS.
B56
| HIGH YIELD BOND PORTFOLIO (Continued) |
SCHEDULE OF INVESTMENTS | December 31, 2005 |
| CORPORATE BONDS (Continued) | Moody’s Rating (Unaudited) | Interest Rate | Maturity Date | Principal Amount (000) | Value (Note 2) | |||||||||
Building Materials & Construction (cont’d.) |
| |||||||||||||
New Millenium Homes LLC, Sr. Notes(g) | NR | 0.00% | 12/31/07 | $ | 2,781 | $ | 2,224,800 | |||||||
Nortek, Inc., Sr. Sub. Notes | Caa1 | 8.50% | 09/01/14 | 5,225 | 5,042,124 | |||||||||
Toll Corp., Sr. Sub. Notes | Ba2 | 8.25% | 02/01/11 | 4,150 | 4,331,563 | |||||||||
| 32,841,225 | ||||||||||||||
Cable — 3.5% |
| |||||||||||||
AT&T Broadband Corp., Notes | Baa2 | 8.375% | 03/15/13 | 100 | (j) | 116 | ||||||||
Cablevision Systems Corp., Sr. Notes, Ser. B(b) | B3 | 8.00% | 04/15/12 | 875 | 818,125 | |||||||||
Callahan Nordrhein-Westfalen, Sr. Disc. Notes, Zero Coupon until 3/13/06 (Germany)(c)(g) | NR | 16.00% | (l) | 07/15/10 | 7,000 | 700 | ||||||||
Charter Communications Bank(g)(i) | B2 | 7.25% | 04/07/10 | 7,990 | 7,979,455 | |||||||||
Charter Communications Holdings II LLC, Sr. Notes(b) | Caa1 | 10.25% | 09/15/10 | 3,725 | 3,706,375 | |||||||||
Charter Communications Holdings LLC, Gtd. Notes(k) | Ca | 10.00% | 05/15/14 | 2,517 | 1,428,398 | |||||||||
Charter Communications Holdings LLC, Gtd. Notes (Zero Coupon until 5/15/06)(b) | Ca | 11.75% | (l) | 05/15/14 | 4,150 | 2,420,750 | ||||||||
Charter Communications Holdings LLC, Gtd Notes | Ca | 11.125% | 01/15/14 | 1,515 | 882,488 | |||||||||
Charter Communications Holdings LLC, Sec’d. Notes | Caa3 | 11.00% | 10/01/15 | 6,848 | 5,752,319 | |||||||||
Charter Communications Holdings LLC, Sr. Notes(b) | Ca | 10.75% | 10/01/09 | 4,650 | 3,464,250 | |||||||||
Charter Communications Operating LLC, Sr. Notes(b)(k) | B2 | 8.375% | 04/30/14 | 4,440 | 4,417,800 | |||||||||
CSC Holdings, Inc., Debs. | B2 | 7.625% | 07/15/18 | 3,800 | 3,610,000 | |||||||||
CSC Holdings, Inc., Sr. Notes | B2 | 7.875% | 12/15/07 | 3,775 | 3,841,063 | |||||||||
CSC Holdings, Inc., Sr. Notes, Ser. B | B2 | 8.125% | 07/15/09 | 3,350 | 3,383,500 | |||||||||
Kabel Deutschland GMBH, Sr. Notes (Germany)(k) | B2 | 10.625% | 07/01/14 | 3,295 | 3,467,988 | |||||||||
Rogers Cable, Inc., Sec’d. Notes(b) | Ba3 | 6.75% | 03/15/15 | 800 | 812,000 | |||||||||
UPC Distribution Holdings Bank(g)(i) | B1 | 7.92% | 11/04/11 | 5,000 | 5,054,999 | |||||||||
Videotron Ltee, Gtd. Notes | Ba3 | 6.875% | 01/15/14 | 3,000 | 3,037,500 | |||||||||
Videotron Ltee, Notes(b)(k) | Ba3 | 6.375% | 12/15/15 | 3,450 | 3,428,438 | |||||||||
| 57,506,264 | ||||||||||||||
Capital Goods — 5.5% |
| |||||||||||||
ALH Finance LLC, Sr. Sub. Notes(b) | B3 | 8.50% | 01/15/13 | 2,680 | 2,525,900 | |||||||||
Allied Waste of North America, Inc., Sr. Notes(b) | B2 | 5.75% | 02/15/11 | 5,320 | 5,040,700 | |||||||||
Allied Waste of North America, Inc., Sr. Notes(b) | B2 | 7.25% | 03/15/15 | 900 | 909,000 | |||||||||
Allied Waste of North America, Inc., Sr. Notes(b) | B2 | 7.875% | 04/15/13 | 675 | 696,938 | |||||||||
Allied Waste of North America, Inc., Sr. Notes(b) | B2 | 8.50% | 12/01/08 | 8,200 | 8,609,999 | |||||||||
Blount, Inc., Sr. Sub Notes | B3 | 8.875% | 08/01/12 | 6,825 | 7,200,375 | |||||||||
Case New Holland, Inc., Gtd. Notes | Ba3 | 9.25% | 08/01/11 | 3,360 | 3,595,200 | |||||||||
Columbus McKinnon Corp., Sr. Sub. Notes(k) | B3 | 8.875% | 11/01/13 | 2,610 | 2,714,400 | |||||||||
Hertz Corp., Sr. Notes(k) | B1 | 8.875% | 01/01/14 | 9,275 | 9,448,905 | |||||||||
Hertz Corp., Sr. Notes(b)(k) | B3 | 10.50% | 01/01/16 | 5,825 | 5,999,750 | |||||||||
Holt Group, Inc., Sr. Notes(c)(g) | NR | 9.75% | 01/15/06 | 800 | 2,000 | |||||||||
Invensys PLC, Sr. Notes (United Kingdom)(k) | B3 | 9.875% | 03/15/11 | 2,270 | 2,247,300 | |||||||||
Johnsondiversey Holdings, Inc., Disc. Note, Zero Coupon until 5/15/07(k) | Caa1 | 10.67% | (l) | 05/15/13 | 3,975 | 3,160,125 | ||||||||
Johnsondiversey, Inc., Gtd. Notes(b) | Caa1 | 9.625% | 05/15/12 | 725 | 728,625 | |||||||||
Manitowoc Co., Inc., Sr. Sub. Notes | B2 | 10.50% | 08/01/12 | 6,120 | 6,793,200 | |||||||||
Mueller Group, Inc., Sr. Sub. Notes | Caa1 | 10.00% | 05/01/12 | 1,465 | 1,556,563 | |||||||||
Rexnord Corp., Gtd. Notes | B3 | 10.125% | 12/15/12 | 3,575 | 3,843,125 | |||||||||
Stena AB, Sr. Notes (Sweden) | Ba3 | 7.50% | 11/01/13 | 5,175 | 4,968,000 | |||||||||
Stena AB, Sr. Notes (Sweden) | Ba3 | 9.625% | 12/01/12 | 3,050 | 3,313,063 | |||||||||
Terex Corp., Gtd. Notes(b) | Caa1 | 7.375% | 01/15/14 | 2,790 | 2,762,100 | |||||||||
Terex Corp., Gtd. Notes | Caa1 | 9.25% | 07/15/11 | 2,825 | 3,015,688 | |||||||||
Terex Corp., Gtd. Notes | Caa1 | 10.375% | 04/01/11 | 5,534 | 5,866,040 | |||||||||
Trism, Inc., Gtd. Notes(c)(g) | NR | 12.00% | 02/15/05 | 1,305 | 3,262 | |||||||||
United Rentals North America, Inc., Gtd. Notes(b) | B3 | 6.50% | 02/15/12 | 1,800 | 1,752,750 | |||||||||
United Rentals North America, Inc., Sr. Sub. Notes(b) | Caa1 | 7.75% | 11/15/13 | 3,150 | 3,071,250 | |||||||||
| 89,824,258 | ||||||||||||||
Chemicals — 6.9% |
| |||||||||||||
BCI Finance Corp., Sec’d. Notes(i)(k) | B3 | 9.65% | 07/15/10 | 4,125 | 4,176,563 | |||||||||
Borden United States Finance Corp., Sr. Sec’d. Notes(i)(k) | B3 | 8.90% | 07/15/10 | 1,500 | 1,507,500 | |||||||||
Borden United States Finance Corp., Sr. Sec’d. Notes(k) | B3 | 9.00% | 07/15/14 | 2,750 | 2,722,500 | |||||||||
SEE NOTES TO FINANCIAL STATEMENTS.
B57
| HIGH YIELD BOND PORTFOLIO (Continued) |
SCHEDULE OF INVESTMENTS | December 31, 2005 |
| CORPORATE BONDS (Continued) | Moody’s Rating (Unaudited) | Interest Rate | Maturity Date | Principal Amount (000) | Value (Note 2) | |||||||
Chemicals (cont’d.) | ||||||||||||
Equistar Chemicals LP, Gtd. Notes | B2 | 10.125% | 09/01/08 | $ | 5,420 | $ | 5,880,700 | |||||
Equistar Chemicals LP, Sr. Notes(b) | B2 | 10.625% | 05/01/11 | 2,185 | 2,403,500 | |||||||
Huntsman International LLC, Gtd. Notes | B2 | 9.875% | 03/01/09 | 8,850 | 9,336,749 | |||||||
Huntsman International LLC, Gtd. Notes | B3 | 10.125% | 07/01/09 | 835 | 862,138 | |||||||
Huntsman International LLC, Gtd. Notes | Ba3 | 11.625% | 10/15/10 | 5,301 | 6,036,514 | |||||||
IMC Global, Inc., Debs.(b) | B1 | 6.875% | 07/15/07 | 2,500 | 2,537,500 | |||||||
IMC Global, Inc., Gtd. Notes, Ser. B | Ba3 | 10.875% | 06/01/08 | 2,943 | 3,259,373 | |||||||
IMC Global, Inc., Gtd. Notes, Ser. B | Ba3 | 11.25% | 06/01/11 | 10,599 | 11,393,924 | |||||||
IMC Global, Inc., Sr. Notes | Ba3 | 10.875% | 08/01/13 | 2,000 | 2,297,500 | |||||||
ISP Chemco, Inc., Gtd. Notes, Ser. B | B1 | 10.25% | 07/01/11 | 5,685 | 6,054,525 | |||||||
Koppers, Inc., Gtd. Notes | B2 | 9.875% | 10/15/13 | 7,985 | 8,663,725 | |||||||
Lyondell Chemical Co., Gtd. Notes | B1 | 9.50% | 12/15/08 | 6,362 | 6,670,142 | |||||||
Lyondell Chemical Co., Gtd. Notes(b) | B1 | 10.50% | 06/01/13 | 4,500 | 5,113,125 | |||||||
Lyondell Chmeical Co., Sec’d. Notes, Ser. A | B1 | 9.625% | 05/01/07 | 6,000 | 6,262,500 | |||||||
Nalco Co., Sr. Notes | B2 | 7.75% | 11/15/11 | 2,450 | 2,517,375 | |||||||
Nalco Co., Sr. Sub. Notes(b) | Caa1 | 8.875% | 11/15/13 | 4,050 | 4,242,375 | |||||||
Nell AF SARL, Sr. Notes (Luxembourg)(b)(k) | B2 | 8.375% | 08/15/15 | 3,145 | 3,113,550 | |||||||
OM Group, Inc., Sr. Sub. Notes | Caa1 | 9.25% | 12/15/11 | 2,140 | 2,091,850 | |||||||
PQ Corp., Gtd. Notes(b)(k) | B3 | 7.50% | 02/15/13 | 1,395 | 1,297,350 | |||||||
Rhodia SA, Sr. Notes (France)(b) | B3 | 10.25% | 06/01/10 | 2,245 | 2,458,275 | |||||||
Rhodia SA, Sr. Sub. Notes (France)(b) | Caa1 | 8.875% | 06/01/11 | 4,585 | 4,699,625 | |||||||
Rockwood Specialties, Inc., Sr. Sub. Notes | B3 | 10.625% | 05/15/11 | 2,633 | 2,886,426 | |||||||
Westlake Chemical Corp., Gtd. Notes | Ba2 | 8.75% | 07/15/11 | 3,500 | 3,745,000 | |||||||
| 112,230,304 | ||||||||||||
Consumer — 1.7% | ||||||||||||
Alderwoods Group, Inc., Sr. Notes(k) | B2 | 7.75% | 09/15/12 | 950 | 983,250 | |||||||
Coinmach Corp., Sr. Notes | B3 | 9.00% | 02/01/10 | 1,967 | 2,060,433 | |||||||
Dycom Industries, Inc., Notes(b)(k) | Ba3 | 8.125% | 10/15/15 | 3,625 | 3,625,000 | |||||||
Levi Strauss & Co., Sr. Notes(b) | Caa2 | 12.25% | 12/15/12 | 4,005 | 4,465,574 | |||||||
Mac-Gray Corp., Sr. Notes | B1 | 7.625% | 08/15/15 | 2,950 | 2,972,125 | |||||||
Playtex Products, Inc., Gtd. Notes(b) | Caa1 | 9.375% | 06/01/11 | 3,965 | 4,153,338 | |||||||
Propex Fabrics, Inc., Gtd. Notes | Caa1 | 10.00% | 12/01/12 | 925 | 825,563 | |||||||
Service Corp. International, Debs. | Ba3 | 7.875% | 02/01/13 | 2,000 | 2,095,000 | |||||||
Service Corp. International, Notes | Ba3 | 6.50% | 03/15/08 | 2,000 | 2,020,000 | |||||||
Service Corp. International, Sr. Notes(k) | Ba3 | 7.00% | 06/15/17 | 2,100 | 2,084,250 | |||||||
Simmons Bedding Co., Sr. Sub Notes(b) | Caa1 | 7.875% | 01/15/14 | 2,675 | 2,474,375 | |||||||
| 27,758,908 | ||||||||||||
Electric — 7.2% | ||||||||||||
AES Corp., Sec’d. Notes(k) | Ba3 | 8.75% | 05/15/13 | 3,195 | 3,478,556 | |||||||
AES Corp., Sr. Notes(b) | B1 | 9.375% | 09/15/10 | 9,200 | 10,050,999 | |||||||
AES Corp., Sr. Notes | B1 | 9.50% | 06/01/09 | 1,325 | 1,431,000 | |||||||
AES Eastern Energy LP, Ser. 99-A | Ba1 | 9.00% | 01/02/17 | 2,977 | 3,363,892 | |||||||
Aquila, Inc., Sr. Notes(b) | B2 | 9.95% | 02/01/11 | 4,090 | 4,509,225 | |||||||
Beaver Valley II Funding Corp., Debs. | Baa3 | 9.00% | 06/01/17 | 4,000 | 4,588,280 | |||||||
CMS Energy Corp., Sr. Notes(b) | B1 | 7.50% | 01/15/09 | 3,290 | 3,388,700 | |||||||
CMS Energy Corp., Sr. Notes(b) | B1 | 8.50% | 04/15/11 | 1,310 | 1,426,263 | |||||||
CMS Energy Corp., Sr. Notes | B1 | 9.875% | 10/15/07 | 4,725 | 5,055,750 | |||||||
Dynegy Holdings, Inc., Debs. | B2 | 7.125% | 05/15/18 | 675 | 600,750 | |||||||
Dynegy Holdings, Inc., Debs. | B2 | 7.625% | 10/15/26 | 1,425 | 1,268,250 | |||||||
Dynegy Holdings, Inc., Sr. Notes(b) | B2 | 6.875% | 04/01/11 | 1,210 | 1,191,850 | |||||||
Dynegy Holdings, Inc., Sr. Sec’d. Notes(k) | B1 | 9.875% | 07/15/10 | 390 | 427,538 | |||||||
Dynegy Holdings, Inc., Sr. Sec’d. Notes(k) | B1 | 10.125% | 07/15/13 | 5,695 | 6,435,350 | |||||||
Edison Mission Energy, Sr. Notes | B1 | 7.73% | 06/15/09 | 6,140 | 6,339,550 | |||||||
Edison Mission Energy, Sr. Notes | B1 | 9.875% | 04/15/11 | 720 | 839,700 | |||||||
Empresa Nacional de Electricidad S.A., Notes (Chile) | Ba1 | 8.35% | 08/01/13 | 4,415 | 5,028,319 | |||||||
Empresa Nacional de Electricidad S.A., Notes (Chile)(b) | Ba1 | 8.625% | 08/01/15 | 4,700 | 5,503,592 | |||||||
Homer City Funding LLC, Gtd. Notes | Ba2 | 8.14% | 10/01/19 | 1,528 | 1,680,250 | |||||||
SEE NOTES TO FINANCIAL STATEMENTS.
B58
| HIGH YIELD BOND PORTFOLIO (Continued) |
SCHEDULE OF INVESTMENTS | December 31, 2005 |
| CORPORATE BONDS (Continued) | Moody’s Rating (Unaudited) | Interest Rate | Maturity Date | Principal Amount (000) | Value (Note 2) | ||||||||
Electric (cont’d.) |
| ||||||||||||
Midland Funding II, Bonds, Ser. B | B3 | 13.25% | 07/23/06 | $ | 1,170 | $ | 1,212,001 | ||||||
Midwest Generation LLC, Pass-thru Certs., Ser. A(g) | B1 | 8.30% | 07/02/09 | 3,225 | 3,362,063 | ||||||||
Midwest Generation LLC, Pass-thru Certs., Ser. B | B1 | 8.56% | 01/02/16 | 1,249 | 1,358,193 | ||||||||
Midwest Generation LLC, Sr. Sec’d. Notes | B1 | 8.75% | 05/01/34 | 4,625 | 5,093,281 | ||||||||
Mirant Corp., Sr. Notes(c)(k) | NR | 7.375% | 07/15/04 | 1,825 | 2,263,000 | ||||||||
Mirant North America LLC, Sr. Notes(b)(k) | B1 | 7.375% | 12/31/13 | 1,500 | 1,516,875 | ||||||||
Mission Energy Holdings Co., Sr. Sec’d. Notes | B2 | 13.50% | 07/15/08 | 1,925 | 2,233,000 | ||||||||
Nevada Power Co. | Ba1 | 8.25% | 06/01/11 | 1,675 | 1,855,063 | ||||||||
Nevada Power Co., Notes | Ba1 | 10.875% | 10/15/09 | 172 | 187,910 | ||||||||
NRG Energy, Inc.(k) | B1 | 8.00% | 12/15/13 | 5,927 | 6,608,604 | ||||||||
Orion Power Holdings, Inc., Sr. Notes | B2 | 12.00% | 05/01/10 | 5,055 | 5,712,150 | ||||||||
Reliant Energy Mid-Atlantic Power, Pass-thru Certs., Ser. B(g) | B1 | 9.24% | 07/02/17 | 1,791 | 1,915,876 | ||||||||
Reliant Energy Mid-Atlantic Power, Pass-thru Certs., Ser. C | B1 | 9.681% | 07/02/26 | 250 | 264,279 | ||||||||
Reliant Energy, Inc., Sec. Notes(b) | B1 | 9.50% | 07/15/13 | 6,110 | 6,125,275 | ||||||||
Sierra Pacific Power Co., Gen. Ref. Mtge. Notes, Ser. A | Ba1 | 8.00% | 06/01/08 | 1,505 | 1,572,725 | ||||||||
Sierra Pacific Resources, Inc., Sr. Notes | B1 | 8.625% | 03/15/14 | 1,530 | 1,655,443 | ||||||||
TECO Energy, Inc., Sr. Notes(b) | Ba2 | 7.50% | 06/15/10 | 3,800 | 4,047,000 | ||||||||
Texas Genco Holdings Bank(g)(i) | Ba2 | 6.501% | 12/14/11 | 1,562 | 1,563,238 | ||||||||
Texas Genco Holdings Bank(g)(i) | Ba2 | 6.50% | 12/14/11 | 646 | 647,316 | ||||||||
Utilicorp, Gtd., Notes (Canada)(b) | B2 | 7.75% | 06/15/11 | 1,990 | 2,034,775 | ||||||||
York Power Funding, Sr. Sec’d. Notes (Cayman Islands)(c)(g)(k)(l) | D(h) | 12.00% | 10/30/07 | 540 | 46,709 | ||||||||
| 117,882,590 | |||||||||||||
Energy – Other — 3.3% |
| ||||||||||||
Chesapeake Energy Corp., Gtd. Notes | Ba2 | 6.25% | 01/15/18 | 2,650 | 2,597,000 | ||||||||
Chesapeake Energy Corp., Gtd. Notes(b) | Ba2 | 7.75% | 01/15/15 | 3,054 | 3,237,240 | ||||||||
Chesapeake Energy Corp., Sr. Notes | Ba2 | 6.375% | 06/15/15 | 3,950 | 3,950,000 | ||||||||
Chesapeake Energy Corp., Sr. Notes | Ba2 | 7.00% | 08/15/14 | 2,350 | 2,432,250 | ||||||||
Compton Petroleum Corp., Sr. Notes(k) | B2 | 7.625% | 12/01/13 | 2,100 | 2,147,250 | ||||||||
Encore Acquisition Co., Sr. Sub. Notes | B2 | 6.25% | 04/15/14 | 1,500 | 1,425,000 | ||||||||
Forest Oil Corp., Sr. Notes | Ba3 | 8.00% | 06/15/08 | 440 | 458,700 | ||||||||
Hanover Equipment Trust, Sec’d. Notes | B2 | 8.50% | 09/01/08 | 2,053 | 2,127,421 | ||||||||
Hanover Equipment Trust, Sec’d. Notes(b) | B2 | 8.75% | 09/01/11 | 3,445 | 3,643,088 | ||||||||
Houston Exploration Corp., Sr. Sub. Notes | B2 | 7.00% | 06/15/13 | 1,625 | 1,560,000 | ||||||||
Kerr-McGee Corp., Sec’d. Notes | Ba3 | 6.95% | 07/01/24 | 1,375 | 1,458,438 | ||||||||
Magnum Hunter Resources, Sr. Notes | Ba3 | 9.60% | 03/15/12 | 341 | 369,985 | ||||||||
Newfield Exploration Co., Sr. Sub. Notes | Ba3 | 8.375% | 08/15/12 | 6,235 | 6,671,449 | ||||||||
Parker Drilling Co., Sr. Notes | B2 | 9.625% | 10/01/13 | 4,030 | 4,498,488 | ||||||||
Pogo Producing Co., Sr. Sub. Notes(k) | Ba3 | 6.875% | 10/01/17 | 2,475 | 2,413,125 | ||||||||
Premcor Refining Group, Inc., Gtd. Notes | Baa3 | 6.75% | 05/01/14 | 1,635 | 1,717,402 | ||||||||
Premcor Refining Group, Inc., Sr. Notes | Baa3 | 6.75% | 02/01/11 | 1,600 | 1,694,781 | ||||||||
Premcor Refining Group, Inc., Sr. Notes | Baa3 | 7.50% | 06/15/15 | 675 | 719,570 | ||||||||
Premcor Refining Group, Inc., Sr. Notes | Baa3 | 9.50% | 02/01/13 | 3,055 | 3,405,250 | ||||||||
Pride International, Inc., Sr. Notes | Ba2 | 7.375% | 07/15/14 | 2,000 | 2,145,000 | ||||||||
Vintage Petroleum, Inc., Sr. Sub Notes | B1 | 7.875% | 05/15/11 | 4,800 | 5,015,999 | ||||||||
| 53,687,436 | |||||||||||||
Foods — 1.6% |
| ||||||||||||
Agrilink Foods, Inc., Sr. Gtd. Notes | B3 | 11.875% | 11/01/08 | 465 | 474,300 | ||||||||
Ahold Finance USA, Inc., Notes | Ba2 | 8.25% | 07/15/10 | 1,120 | 1,211,000 | ||||||||
Del Monte Corp., Sr. Sub. Notes | B2 | 8.625% | 12/15/12 | 2,700 | 2,868,750 | ||||||||
Delhaize America, Inc., Gtd. Notes(b) | Ba1 | 8.125% | 04/15/11 | 3,400 | 3,706,228 | ||||||||
Dole Food Co., Inc., Sr. Notes | B2 | 8.625% | 05/01/09 | 1,833 | 1,878,825 | ||||||||
Dole Food Co., Inc., Sr. Notes | B2 | 7.25% | 06/15/10 | 1,760 | 1,707,200 | ||||||||
Dole Food Co., Inc., Sr. Notes | B2 | 8.875% | 03/15/11 | 760 | 779,000 | ||||||||
Dominos, Inc., Sr. Sub. Notes | B2 | 8.25% | 07/01/11 | 1,276 | 1,333,420 | ||||||||
National Beef Packing Co., LLC, Sr. Notes | B3 | 10.50% | 08/01/11 | 2,275 | 2,354,625 | ||||||||
Pathmark Stores, Inc., Gtd. Notes | Caa2 | 8.75% | 02/01/12 | 2,975 | 2,777,906 | ||||||||
Smithfield Foods, Inc., Sr. Notes | Ba2 | 7.00% | 08/01/11 | 2,770 | 2,825,400 | ||||||||
SEE NOTES TO FINANCIAL STATEMENTS.
B59
| HIGH YIELD BOND PORTFOLIO (Continued) |
SCHEDULE OF INVESTMENTS | December 31, 2005 |
| CORPORATE BONDS (Continued) | Moody’s Rating (Unaudited) | Interest Rate | Maturity Date | Principal Amount (000) | Value (Note 2) | |||||||
Foods (cont’d.) | ||||||||||||
Smithfield Foods, Inc., Sr. Notes(b) | Ba2 | 7.75% | 05/15/13 | $ | 900 | $ | 951,750 | |||||
Smithfield Foods, Inc., Sr. Notes | Ba2 | 8.00% | 10/15/09 | 2,040 | 2,152,200 | |||||||
Stater Brothers Holdings, Inc., Sr. Notes(b) | B1 | 8.125% | 06/15/12 | 1,265 | 1,252,350 | |||||||
| 26,272,954 | ||||||||||||
Foreign Agencies — 0.4% | ||||||||||||
Gazprom OAO, Notes(b)(k) | BB(h) | 9.625% | 03/01/13 | 3,750 | 4,523,438 | |||||||
Gazprom OAO, Sec.’d. Notes (Russia) | BB(h) | 10.50% | 10/21/09 | 1,720 | 1,991,416 | |||||||
| 6,514,854 | ||||||||||||
Gaming — 5.3% | ||||||||||||
Aztar Corp., Sr. Sub. Notes(b) | Ba3 | 7.875% | 06/15/14 | 4,725 | 4,949,438 | |||||||
Boyd Gaming Corp., Sr. Sub. Notes(b) | B1 | 6.75% | 04/15/14 | 1,200 | 1,191,000 | |||||||
Boyd Gaming Corp., Sr. Sub. Notes | B1 | 8.75% | 04/15/12 | 1,500 | 1,608,750 | |||||||
CCM Merger, Inc., Notes(b)(k) | B3 | 8.00% | 08/01/13 | 2,590 | 2,486,400 | |||||||
Circus Circus Enterprises, Inc., Sr. Notes | Ba2 | 6.45% | 02/01/06 | 1,220 | 1,220,000 | |||||||
Greektown Holdings, Sr. Notes(k) | B3 | 10.75% | 12/01/13 | 3,400 | 3,374,500 | |||||||
Isle of Capri Casinos, Inc., Sr. Sub. Notes | B2 | 9.00% | 03/15/12 | 2,530 | 2,675,475 | |||||||
Kerzner International Ltd., Sr. Sub. Notes(k) | B2 | 6.75% | 10/01/15 | 1,170 | 1,137,825 | |||||||
Mandalay Resort Group, Sr. Sub. Notes | Ba3 | 9.375% | 02/15/10 | 70 | 76,395 | |||||||
Mandalay Resort Group, Sr. Notes | Ba2 | 9.50% | 08/01/08 | 1,950 | 2,113,313 | |||||||
MGM Grand, Inc., Gtd. Notes | Ba3 | 9.75% | 06/01/07 | 9,051 | 9,537,490 | |||||||
MGM Mirage, Inc., Gtd. Notes | Ba2 | 6.00% | 10/01/09 | 10,670 | 10,603,312 | |||||||
MGM Mirage, Inc., Gtd. Notes | Ba2 | 6.625% | 07/15/15 | 7,770 | 7,750,574 | |||||||
MGM Mirage, Inc., Gtd. Notes(b) | Ba3 | 8.375% | 02/01/11 | 1,292 | 1,382,440 | |||||||
MGM Mirage, Inc., Sr. Notes(k) | Ba2 | 5.875% | 02/27/14 | 1,250 | 1,193,750 | |||||||
Mohegan Tribal Gaming Authority, Sr. Sub. Notes | Ba3 | 6.375% | 07/15/09 | 1,400 | 1,408,750 | |||||||
Mohegan Tribal Gaming Authority, Sr. Sub. Notes | Ba3 | 8.00% | 04/01/12 | 2,845 | 2,994,363 | |||||||
Park Place Entertainment Corp., Sr. Sub. Notes | Ba1 | 8.125% | 05/15/11 | 3,230 | 3,565,113 | |||||||
Park Place Entertainment, Inc., Sr. Sub Notes | Ba1 | 9.375% | 02/15/07 | 355 | 369,644 | |||||||
Penn National Gaming, Inc., Sr. Sub. Notes(k) | B3 | 6.75% | 03/01/15 | 1,400 | 1,375,500 | |||||||
Seneca Gaming Corp., Sr. Notes(k) | B1 | 7.25% | 05/01/12 | 5,375 | 5,408,594 | |||||||
Station Casinos, Inc., Sr. Notes | Ba2 | 6.00% | 04/01/12 | 3,250 | 3,241,875 | |||||||
Station Casinos, Inc., Sr. Sub. Notes | Ba3 | 6.875% | 03/01/16 | 1,850 | 1,891,625 | |||||||
Trump Entertainment Resorts, Inc., Sec’d. Notes(b) | Caa1 | 8.50% | 06/01/15 | 7,215 | 7,034,625 | |||||||
Wynn Las Vegas LLC, 1st Mortgage Bond | B2 | 6.625% | 12/01/14 | 7,700 | 7,488,250 | |||||||
| 86,079,001 | ||||||||||||
Health Care & Pharmaceutical — 8.2% | ||||||||||||
Accellent, Inc., Gtd. Notes(k) | Caa1 | 10.50% | 12/01/13 | 10,050 | 10,301,249 | |||||||
Alliance Imaging, Inc., Sr. Sub. Notes(b)(k) | B3 | 7.25% | 12/15/12 | 1,825 | 1,519,313 | |||||||
Columbia/HCA Healthcare Corp., Debs. | Ba2 | 7.50% | 12/15/23 | 600 | 614,521 | |||||||
Columbia/HCA Healthcare Corp., MTN(b) | Ba2 | 8.70% | 02/10/10 | 1,800 | 1,960,659 | |||||||
Columbia/HCA Healthcare Corp., MTN | Ba2 | 8.85% | 01/01/07 | 259 | 267,089 | |||||||
Columbia/HCA Healthcare Corp., Notes | Ba2 | 9.00% | 12/15/14 | 4,100 | 4,797,082 | |||||||
Concentra Operating Corp., Gtd. Notes | B3 | 9.125% | 06/01/12 | 2,525 | 2,600,750 | |||||||
Concentra Operating Corp., Gtd. Notes | B3 | 9.50% | 08/15/10 | 200 | 207,000 | |||||||
Coventry Health Care, Inc., Sr. Notes(g) | Ba1 | 8.125% | 02/15/12 | 2,675 | 2,842,188 | |||||||
Elan Finance PLC, Sr. Notes (Ireland)(b)(k) | B3 | 7.75% | 11/15/11 | 7,375 | 6,895,625 | |||||||
Elan Finance PLC, Sr. Notes (Ireland)(k) | B3 | 8.34% | 11/15/11 | 1,300 | 1,235,000 | |||||||
HCA, Inc., Notes | Ba2 | 5.25% | 11/06/08 | 2,000 | 1,973,648 | |||||||
HCA, Inc., Notes | Ba2 | 5.50% | 12/01/09 | 5,000 | 4,938,180 | |||||||
HCA, Inc., Notes(b) | Ba2 | 6.375% | 01/15/15 | 4,000 | 4,043,336 | |||||||
HCA, Inc., Notes | Ba2 | 7.125% | 06/01/06 | 3,830 | 3,861,406 | |||||||
HCA, Inc., Notes | Ba2 | 8.36% | 04/15/24 | 2,000 | 2,180,598 | |||||||
HCA, Inc., Notes | Ba2 | 8.75% | 09/01/10 | 2,200 | 2,433,193 | |||||||
HEALTHSOUTH Corp., Notes(b) | NR | 7.625% | 06/01/12 | 1,850 | 1,877,750 | |||||||
HEALTHSOUTH Corp., Sr. Notes(b)(c) | NR | 7.375% | 10/01/06 | 750 | 753,750 | |||||||
HEALTHSOUTH Corp., Sr. Notes(c) | NR | 8.50% | 02/01/08 | 1,580 | 1,591,850 | |||||||
SEE NOTES TO FINANCIAL STATEMENTS.
B60
| HIGH YIELD BOND PORTFOLIO (Continued) |
SCHEDULE OF INVESTMENTS | December 31, 2005 |
| CORPORATE BONDS (Continued) | Moody’s Rating (Unaudited) | Interest Rate | Maturity Date | Principal Amount (000) | Value (Note 2) | |||||||
Health Care & Pharmaceutical (cont’d.) | ||||||||||||
Iasis Healthcare LLC, Sr. Sub. Notes | B3 | 8.75% | 06/15/14 | $ | 3,400 | $ | 3,570,000 | |||||
Inverness Medical Innovations, Inc., Sr. Sub. Notes(b) | Caa3 | 8.75% | 02/15/12 | 2,655 | 2,694,825 | |||||||
Medco Health Solutions, Inc., Sr. Notes | Ba1 | 7.25% | 08/15/13 | 3,855 | 4,234,779 | |||||||
MedQuest, Inc., Sr. Sub. Notes | Caa1 | 11.875% | 08/15/12 | 4,790 | 4,622,350 | |||||||
OMEGA Healthcare Investors, Inc., Notes | B1 | 6.95% | 08/01/07 | 6,000 | 6,172,500 | |||||||
Omnicare, Inc., Notes | Ba3 | 6.875% | 12/15/15 | 4,500 | 4,567,500 | |||||||
Omnicare, Inc., Sr. Sub. Notes | Ba3 | 6.125% | 06/01/13 | 2,500 | 2,456,250 | |||||||
Res-Care, Inc., Sr. Notes(k) | B1 | 7.75% | 10/15/13 | 4,800 | 4,800,000 | |||||||
Select Medical Corp., Sr. Sub. Notes | B3 | 7.625% | 02/01/15 | 1,800 | 1,732,500 | |||||||
Senior Housing Properties Trust, Sr. Notes | Ba2 | 7.875% | 04/15/15 | 2,000 | 2,090,000 | |||||||
Senior Housing Properties Trust, Sr. Notes | Ba2 | 8.625% | 01/15/12 | 2,730 | 2,989,350 | |||||||
Skilled Healthcare Group, Inc., Notes(k) | Caa1 | 11.00% | 01/15/14 | 5,665 | 5,721,650 | |||||||
Tenet Healthcare Corp., Sr. Notes(b)(k) | B3 | 9.25% | 02/01/15 | 3,610 | 3,582,925 | |||||||
Vanguard Health Holdings Co. II, Sr. Sub. Notes | Caa1 | 9.00% | 10/01/14 | 7,675 | 8,154,688 | |||||||
Ventas Realty LP, Sr. Notes(b) | Ba2 | 7.125% | 06/01/15 | 4,500 | 4,725,000 | |||||||
Ventas Realty LP, Sr. Notes | Ba2 | 8.75% | 05/01/09 | 2,000 | 2,160,000 | |||||||
Ventas Realty LP, Sr. Notes | Ba2 | 9.00% | 05/01/12 | 4,148 | 4,728,720 | |||||||
Warner Chilcott Corp., Gtd. Notes(k) | Caa1 | 8.75% | 02/01/15 | 10,675 | 9,821,000 | |||||||
| 135,718,224 | ||||||||||||
Lodging — 3.6% | ||||||||||||
Felcor Lodging LP, Gtd. Notes(b) | B1 | 9.00% | 06/01/11 | 6,275 | 6,871,125 | |||||||
Felcor Lodging LP, Sr. Notes(i) | B1 | 8.825% | 06/01/11 | 1,875 | 1,950,000 | |||||||
Felcor Suites LP, Gtd. Notes(b) | B1 | 7.625% | 10/01/07 | 950 | 971,375 | |||||||
Gaylord Entertainment Co., Sr. Notes | B3 | 8.00% | 11/15/13 | 2,000 | 2,095,000 | |||||||
HMH Properties, Inc., Sr. Gtd. Notes, Ser. B | Ba2 | 7.875% | 08/01/08 | 632 | 639,110 | |||||||
Host Marriott LP, Sr. Gtd. Notes | Ba2 | 9.50% | 01/15/07 | 6,350 | 6,572,250 | |||||||
Host Marriott LP, Sr. Notes | Ba2 | 7.00% | 08/15/12 | 8,150 | 8,353,749 | |||||||
Host Marriott LP, Sr. Notes(b) | Ba2 | 7.125% | 11/01/13 | 3,890 | 4,045,600 | |||||||
La Quinta Properties, Inc., Sr. Notes | Ba2 | 7.00% | 08/15/12 | 1,775 | 1,921,438 | |||||||
La Quinta Properties, Inc., Sr. Notes | Ba2 | 8.875% | 03/15/11 | 3,725 | 4,046,281 | |||||||
Royal Caribbean Cruises, Ltd., Debs. | Ba1 | 7.50% | 10/15/27 | 1,050 | 1,124,813 | |||||||
Royal Caribbean Cruises, Ltd., Sr. Notes (Liberia) | Ba1 | 6.875% | 12/01/13 | 6,275 | 6,646,104 | |||||||
Royal Caribbean Cruises, Ltd., Sr. Notes (Liberia) | Ba1 | 8.75% | 02/02/11 | 1,150 | 1,299,500 | |||||||
Starwood Hotels & Resorts Worldwide, Inc., Debs. | Ba1 | 7.375% | 11/15/15 | 2,850 | 3,092,250 | |||||||
Starwood Hotels & Resorts Worldwide, Inc., Gtd. Notes | Ba1 | 7.375% | 05/01/07 | 5,900 | 6,018,000 | |||||||
Starwood Hotels & Resorts Worldwide, Inc., Gtd. Notes | Ba1 | 7.875% | 05/01/12 | 2,235 | 2,464,088 | |||||||
| 58,110,683 | ||||||||||||
Media & Entertainment — 6.0% | ||||||||||||
AMC Entertainment, Inc., Gtd. Notes(b) | B2 | 8.625% | 08/15/12 | 2,125 | 2,220,625 | |||||||
AMC Entertainment, Inc., Sr. Sub. Notes | B3 | 8.00% | 03/01/14 | 675 | 610,875 | |||||||
Cinemark USA, Inc., Sr. Sub. Notes | B3 | 9.00% | 02/01/13 | 850 | 898,875 | |||||||
Dex Media East LLC, Gtd.(b) | B1 | 12.125% | 11/15/12 | 7,298 | 8,538,659 | |||||||
Dex Media West LLC, Sr. Sub. Notes | B2 | 9.875% | 08/15/13 | 7,725 | 8,574,749 | |||||||
Dex Media, Inc., Notes | B3 | 8.00% | 11/15/13 | 2,825 | 2,881,500 | |||||||
DirecTV Holdings LLC, Sr. Sub. Notes | Ba2 | 6.375% | 06/15/15 | 2,777 | 2,714,518 | |||||||
Echostar DBS Corp., Gtd. Notes | Ba3 | 6.625% | 10/01/14 | 2,800 | 2,684,500 | |||||||
EchoStar DBS Corp., Sr. Notes | Ba3 | 9.125% | 01/15/09 | 3,371 | 3,526,909 | |||||||
Gray Television, Inc., Sr. Sub. Notes | Ba3 | 9.25% | 12/15/11 | 4,605 | 4,915,838 | |||||||
Intelsat Bermuda Ltd., Sr. Notes(k) | B2 | 8.25% | 01/15/13 | 7,610 | 7,686,099 | |||||||
Intrawest Corp., Sr. Notes | B1 | 7.50% | 10/15/13 | 5,300 | 5,366,250 | |||||||
Loews Cineplex Entertainment Corp., Gtd. Notes | B3 | 9.00% | 08/01/14 | 2,175 | 2,196,750 | |||||||
Medianews Group, Inc., Sr. Sub. Notes | B2 | 6.375% | 04/01/14 | 2,375 | 2,190,938 | |||||||
Medianews Group, Inc., Sr. Sub. Notes | B2 | 6.875% | 10/01/13 | 1,375 | 1,314,844 | |||||||
Morris Publishing Group LLC, Gtd. Notes | B1 | 7.00% | 08/01/13 | 1,050 | 990,938 | |||||||
New Skies Satellites NV(g) | B1 | 7.582% | 04/26/11 | 417 | 419,195 | |||||||
New Skies Satellites NV, Sr. Notes (Netherlands)(i) | B3 | 9.572% | 11/01/11 | 1,325 | 1,378,000 | |||||||
New Skies Satellites NV, Sr. Sub. Notes (Netherlands)(b) | Caa1 | 9.125% | 11/01/12 | 1,425 | 1,522,969 | |||||||
SEE NOTES TO FINANCIAL STATEMENTS.
B61
| HIGH YIELD BOND PORTFOLIO (Continued) |
SCHEDULE OF INVESTMENTS | December 31, 2005 |
| CORPORATE BONDS (Continued) | Moody’s Rating (Unaudited) | Interest Rate | Maturity Date | Principal Amount (000) | Value (Note 2) | ||||||||
Media & Entertainment (cont’d.) | |||||||||||||
PRIMEDIA, Inc., Sr. Notes | B2 | 8.875% | 05/15/11 | $ | 2,000 | $ | 1,845,000 | ||||||
PRIMEDIA, Inc., Sr. Notes | B2 | 9.72% | 05/15/10 | 2,145 | 2,061,881 | ||||||||
Quebecor Media, Inc., Sr. Notes (Canada) | B2 | 11.125% | 07/15/11 | 4,700 | 5,087,750 | ||||||||
Quebecor Media, Inc., Sr. Discount Notes, Zero Coupon until (7/15/06) (Canada) | B2 | 13.75% | (l) | 07/15/11 | 5,855 | 6,052,606 | |||||||
R.H. Donnelley Finance Corp., Gtd. Notes | B2 | 10.875% | 12/15/12 | 3,795 | 4,278,863 | ||||||||
Rainbow National Services LLC, Sr. Notes(k) | B2 | 8.75% | 09/01/12 | 2,000 | 2,130,000 | ||||||||
Rainbow National Services LLC, Sr. Sub. Notes(k) | B3 | 10.375% | 09/01/14 | 325 | 364,000 | ||||||||
Sinclair Broadcast Group, Inc., Gtd. Notes | B2 | 8.75% | 12/15/11 | 2,500 | 2,631,250 | ||||||||
Six Flags, Inc., Sr. Notes | Caa1 | 9.625% | 06/01/14 | 1,845 | 1,794,263 | ||||||||
Susquehanna Media Co., Sr. Sub. Notes | B1 | 7.375% | 04/15/13 | 900 | 958,500 | ||||||||
Universal City Florida Holding Company I, Sr. Notes(b) | B3 | 8.375% | 05/01/10 | 4,050 | 3,958,875 | ||||||||
Vail Resorts, Inc., Sr. Sub. Notes | B2 | 6.75% | 02/15/14 | 2,295 | 2,295,000 | ||||||||
Vertis, Inc., Gtd. Notes, Ser. B(b) | Caa1 | 10.875% | 06/15/09 | 900 | 886,500 | ||||||||
Vertis, Inc., Sec’d. Notes | B3 | 9.75% | 04/01/09 | 3,765 | 3,901,481 | ||||||||
| 98,879,000 | |||||||||||||
Metals — 3.5% | |||||||||||||
AK Steel Corp., Gtd. Notes | B1 | 7.75% | 06/15/12 | 2,932 | 2,646,130 | ||||||||
AK Steel Corp., Gtd. Notes(b) | B1 | 7.875% | 02/15/09 | 712 | 676,400 | ||||||||
Arch Western Finance LLC, Sr. Notes(b) | Ba3 | 6.75% | 07/01/13 | 3,635 | 3,703,156 | ||||||||
Century Aluminum Co., Gtd. Notes | B1 | 7.50% | 08/15/14 | 6,225 | 6,131,625 | ||||||||
Chaparral Steel Co., Gtd. Notes(b) | B1 | 10.00% | 07/15/13 | 3,800 | 4,094,500 | ||||||||
CSN Islands VII Corp., Gtd. Notes (Cayman Islands)(k) | B1 | 10.75% | 09/12/08 | 4,945 | 5,470,406 | ||||||||
Gerdau AmeriSteel Corp., Sr. Notes(b) | Ba3 | 10.375% | 07/15/11 | 3,300 | 3,638,250 | ||||||||
Ispat Inland ULC, Sec’d. Notes (Canada) | Ba1 | 9.75% | 04/01/14 | 3,489 | 3,951,293 | ||||||||
Massey Energy Co., Sr. Notes | B1 | 6.625% | 11/15/10 | 250 | 254,063 | ||||||||
Metals USA, Sec’d. Notes(k) | B3 | 11.125% | 12/01/15 | 3,800 | 3,895,000 | ||||||||
Novelis, Inc., Sr. Notes(k) | B1 | 7.50% | 02/15/15 | 6,815 | 6,354,987 | ||||||||
Oregon Steel Mills, Inc., Gtd. Notes(b) | Ba3 | 10.00% | 07/15/09 | 7,525 | 8,051,749 | ||||||||
Peabody Energy Corp., Sr. Notes(b) | Ba3 | 5.875% | 04/15/16 | 1,450 | 1,411,938 | ||||||||
Russel Metals, Inc., Sr. Notes (Canada) | Ba3 | 6.375% | 03/01/14 | 1,000 | 970,000 | ||||||||
Ryerson Tull, Inc., Sr. Notes(b) | B2 | 8.25% | 12/15/11 | 2,485 | 2,416,663 | ||||||||
United States Steel Corp., Sr. Notes | Ba2 | 10.75% | 08/01/08 | 1,900 | 2,099,500 | ||||||||
Wise Metals Group LLC, Sec’d. Notes | Caa1 | 10.25% | 05/15/12 | 1,000 | 760,000 | ||||||||
| 56,525,660 | |||||||||||||
Non Captive Finance — 0.7% | |||||||||||||
Galaxy Entertainment Finance Co., Notes(b)(k) | B1 | 9.875% | 12/15/12 | 3,000 | 3,045,000 | ||||||||
Residential Capital Corp., Sr. Notes | Baa3 | 6.375% | 06/30/10 | 4,800 | 4,877,352 | ||||||||
Stripes Acquisition LLC, Sr. Notes(k) | B2 | 10.625% | 12/15/13 | 3,775 | 3,831,625 | ||||||||
| 11,753,977 | |||||||||||||
Packaging — 2.8% | |||||||||||||
Berry Plastics Corp., Gtd. Notes | B3 | 10.75% | 07/15/12 | 4,945 | 5,315,875 | ||||||||
Crown Americas, Sr. Notes(b)(k) | B1 | 7.625% | 11/15/13 | 8,000 | 8,300,000 | ||||||||
Crown Cork & Seal PLC, Notes (United Kingdom)(b) | B2 | 7.00% | 12/15/06 | 1,850 | 1,868,500 | ||||||||
Graham Packaging Co., Inc.(b)(k) | Caa1 | 8.50% | 10/15/12 | 2,200 | 2,167,000 | ||||||||
Graham Packaging Co., Inc.(b)(k) | Caa2 | 9.875% | 10/15/14 | 3,925 | 3,826,875 | ||||||||
Greif Brothers Corp., Sr. Sub. Notes | B1 | 8.875% | 08/01/12 | 8,925 | 9,505,125 | ||||||||
Owens-Brockway, Sr. Sec’d. Notes(b) | B1 | 7.75% | 05/15/11 | 4,250 | 4,435,938 | ||||||||
Owens-Brockway, Sr. Sec’d. Notes | B1 | 8.75% | 11/15/12 | 7,755 | 8,336,625 | ||||||||
Silgan Holdings, Inc., Sr. Sub. Notes(b) | B1 | 6.75% | 11/15/13 | 2,825 | 2,810,875 | ||||||||
| 46,566,813 | |||||||||||||
Paper — 2.7% | |||||||||||||
Abitibi-Consolidated, Inc., Deb. Notes (Canada)(b) | B1 | 8.85% | 08/01/30 | 1,500 | 1,282,500 | ||||||||
Abitibi-Consolidated, Inc., Gtd. Notes (Canada)(b) | B1 | 8.375% | 04/01/15 | 3,325 | 3,183,688 | ||||||||
Abitibi-Consolidated, Inc., Notes (Canada)(b) | B1 | 5.25% | 06/20/08 | 1,200 | 1,140,000 | ||||||||
Abitibi-Consolidated, Inc., Notes (Canada)(b) | B1 | 6.00% | 06/20/13 | 2,270 | 1,923,825 | ||||||||
SEE NOTES TO FINANCIAL STATEMENTS.
B62
| HIGH YIELD BOND PORTFOLIO (Continued) |
SCHEDULE OF INVESTMENTS | December 31, 2005 |
| CORPORATE BONDS (Continued) | Moody’s Rating (Unaudited) | Interest Rate | Maturity Date | Principal Amount (000) | Value (Note 2) | ||||||||
Paper (cont’d.) | |||||||||||||
Ainsworth Lumber Co., Ltd., Gtd. Notes (Canada)(i) | B2 | 7.25% | 10/01/12 | $ | 100 | (j) | $ | 90,000 | |||||
Ainsworth Lumber Co., Ltd., Gtd. Notes (Canada) | B2 | 8.28% | 10/01/10 | 1,100 | 1,072,500 | ||||||||
Ainsworth Lumber Co., Sr. Notes (Canada) | B2 | 6.75% | 03/15/14 | 4,380 | 3,755,850 | ||||||||
Caraustar Industries, Inc., Sec. Notes(b) | Caa1 | 9.875% | 04/01/11 | 2,100 | 2,142,000 | ||||||||
Cascades, Inc., Sr. Notes (Canada) | Ba3 | 7.25% | 02/15/13 | 4,600 | 4,185,999 | ||||||||
Cellu Tissue Holdings, Inc., Sr. Sec’d Notes(b) | B2 | 9.75% | 03/15/10 | 4,000 | 3,960,000 | ||||||||
Domtar, Inc., Notes | B1 | 7.875% | 10/15/11 | 650 | 598,000 | ||||||||
Georgia-Pacific Corp., Debs. | Ba2 | 7.375% | 12/01/25 | 1,000 | 900,000 | ||||||||
Georgia-Pacific Corp., Debs.(g) | Ba2 | 7.50% | 05/15/06 | 3,650 | 3,672,813 | ||||||||
Georgia-Pacific Corp., Notes | Ba2 | 8.875% | 05/15/31 | 980 | 982,450 | ||||||||
Jefferson Smurfit Corp., Gtd. Notes(b) | B2 | 7.50% | 06/01/13 | 4,005 | 3,684,600 | ||||||||
Jefferson Smurfit Corp., Gtd. Notes | B2 | 8.25% | 10/01/12 | 620 | 595,200 | ||||||||
Millar Western Forest Products Ltd., Sr. Notes (Canada) | B2 | 7.75% | 11/15/13 | 2,670 | 1,989,150 | ||||||||
Norampac, Inc., Sr. Notes (Canada) | Ba2 | 6.75% | 06/01/13 | 2,575 | 2,484,875 | ||||||||
Norske Skog Canada LTD., Gtd. Notes (Canada) | B1 | 8.625% | 06/15/11 | 1,265 | 1,208,075 | ||||||||
Stone Container Corp., Sr. Notes(b) | B2 | 8.375% | 07/01/12 | 3,040 | 2,941,200 | ||||||||
Tembec Industries, Inc., Sr. Notes (Canada) | B3 | 7.75% | 03/15/12 | 4,415 | 2,362,025 | ||||||||
| 44,154,750 | |||||||||||||
Pipelines & Other — 3.4% | |||||||||||||
ANR Pipeline, Co., Notes(i) | B1 | 8.875% | 03/15/10 | 50 | 53,436 | ||||||||
El Paso Corp., Sr. Notes(b) | Caa1 | 7.00% | 05/15/11 | 8,505 | 8,441,213 | ||||||||
El Paso Production Holdings Corp., Gtd. Notes | B3 | 7.75% | 06/01/13 | 9,415 | 9,768,062 | ||||||||
Ferrellgas Partners LP, Sr. Notes | Ba3 | 6.75% | 05/01/14 | 1,175 | 1,110,375 | ||||||||
Holly Energy Partners LP, Gtd. Notes | Ba3 | 6.25% | 03/01/15 | 2,000 | 1,937,500 | ||||||||
Inergy LP, Sr. Notes | B1 | 6.875% | 12/15/14 | 3,000 | 2,730,000 | ||||||||
Pacific Energy Partners LP, Sr. Notes | Ba2 | 7.125% | 06/15/14 | 1,975 | 2,034,250 | ||||||||
Southern Natural Gas Co., Sr. Notes | B1 | 8.875% | 03/15/10 | 2,900 | 3,099,274 | ||||||||
Tennessee Gas Pipeline Co., Debs. | B1 | 7.00% | 10/15/28 | 5,655 | 5,686,133 | ||||||||
Tennessee Gas Pipeline Co., Debs.(b) | B1 | 7.625% | 04/01/37 | 4,615 | 4,859,124 | ||||||||
TransMontaigne, Inc., Sr. Sub. Notes | B3 | 9.125% | 06/01/10 | 1,385 | 1,360,763 | ||||||||
Williams Cos., Inc., Debs.(b) | B1 | 7.50% | 01/15/31 | 2,075 | 2,147,625 | ||||||||
Williams Cos., Inc., Notes(b) | B1 | 7.125% | 09/01/11 | 4,475 | 4,648,406 | ||||||||
Williams Cos., Inc., Sr. Notes | B1 | 7.75% | 06/15/31 | 1,925 | 2,030,875 | ||||||||
Williams Cos., Inc., Sr. Unsec’d. Notes | B1 | 8.125% | 03/15/12 | 5,045 | 5,499,050 | ||||||||
| 55,406,086 | |||||||||||||
Railroads — 0.2% | |||||||||||||
Kansas City Southern Railway, Sr. Notes | B2 | 7.50% | 06/15/09 | 2,750 | 2,839,375 | ||||||||
Retailers — 1.6% | |||||||||||||
Asbury Automotive Group, Inc., Sr. Sub. Notes(b) | B3 | 8.00% | 03/15/14 | 1,800 | 1,719,000 | ||||||||
GSC Holdings, Gtd. Notes(b)(k) | Ba3 | 7.875% | 10/01/11 | 1,200 | 1,188,000 | ||||||||
GSC Holdings, Gtd. Notes(b)(k) | Ba3 | 8.00% | 10/01/12 | 2,395 | 2,251,300 | ||||||||
JC Penney Co., Inc., Notes | Ba1 | 6.875% | 10/15/15 | 225 | 243,600 | ||||||||
JC Penney Co., Inc., Notes | Ba1 | 9.00% | 08/01/12 | 525 | 617,696 | ||||||||
JC Penney Co., Inc., Sr. Unsec’d. Notes | Ba1 | 8.00% | 03/01/10 | 2,350 | 2,573,830 | ||||||||
Neiman Marcus Group, Gtd. Notes(b)(k) | B3 | 10.375% | 10/15/15 | 5,425 | 5,513,156 | ||||||||
Pantry, Inc., Sr. Sub. Notes(b) | B3 | 7.75% | 02/15/14 | 3,025 | 3,025,000 | ||||||||
Rite Aid Corp., Sr. Sec’d. Notes(b) | B2 | 7.50% | 01/15/15 | 3,075 | 2,905,875 | ||||||||
Rite Aid Corp., Sr. Sec’d. Notes(b) | B2 | 8.125% | 05/01/10 | 4,695 | 4,777,163 | ||||||||
Sonic Automotive, Inc., Sr. Sub. Notes | B2 | 8.625% | 08/15/13 | 1,905 | 1,843,088 | ||||||||
| 26,657,708 | |||||||||||||
Structured Notes — 0.1% | |||||||||||||
Dow Jones CDX High Yield Trust, Pass Thru Certificates, Ser. 5-T2(b) | BA3 | 7.25% | 12/29/10 | 1,000 | 988,750 | ||||||||
Technology — 5.2% | |||||||||||||
Amkor Technology, Inc., Sr. Notes(b) | Caa1 | 7.125% | 03/15/11 | 800 | 704,000 | ||||||||
Ampex Corp., Sec’d. Notes(c)(g) | NR | 12.00% | 08/15/08 | 636 | 158,993 | ||||||||
SEE NOTES TO FINANCIAL STATEMENTS.
B63
| HIGH YIELD BOND PORTFOLIO (Continued) |
SCHEDULE OF INVESTMENTS | December 31, 2005 |
| CORPORATE BONDS (Continued) | Moody’s Rating (Unaudited) | Interest Rate | Maturity Date | Principal Amount (000) | Value (Note 2) | ||||||||
Technology (cont’d.) | |||||||||||||
Avago Technologies, Sr. Notes(b)(k) | B3 | 10.125% | 12/01/13 | $ | 5,400 | $ | 5,548,500 | ||||||
Avago Technologies, Sr. Sub. Notes(b)(k) | Caa2 | 11.875% | 12/01/15 | 4,750 | 4,785,625 | ||||||||
Flextronics International, Ltd., Sr. Sub. Notes (Singapore) | Ba2 | 6.25% | 11/15/14 | 2,900 | 2,860,125 | ||||||||
Flextronics International, Ltd., Sr. Sub. Notes (Singapore)(b) | Ba2 | 6.50% | 05/15/13 | 6,140 | 6,239,775 | ||||||||
Freescale Semiconductor, Inc., Sr. Notes(b) | Ba1 | 7.125% | 07/15/14 | 6,465 | 6,885,225 | ||||||||
Iron Mountain, Inc., Gtd. Notes | Caa1 | 8.625% | 04/01/13 | 3,875 | 4,039,688 | ||||||||
Nortel Networks Corp., Gtd. (Canada) | B3 | 4.25% | 09/01/08 | 2,175 | 2,039,063 | ||||||||
Nortel Networks Ltd., Notes (Canada)(b) | B3 | 6.125% | 02/15/06 | 2,960 | 2,960,000 | ||||||||
Sanmina-SCI Corp., Gtd. Notes(b) | B1 | 6.75% | 03/01/13 | 1,440 | 1,369,800 | ||||||||
Sanmina-SCI Corp., Gtd. Notes | Ba2 | 10.375% | 01/15/10 | 7,085 | 7,828,925 | ||||||||
Seagate Technology, Gtd. Notes (Cayman Islands) | Ba2 | 8.00% | 05/15/09 | 8,700 | 9,135,000 | ||||||||
STATS ChipPAC Ltd., Gtd. Notes | Ba2 | 6.75% | 11/15/11 | 1,810 | 1,746,650 | ||||||||
SunGard Data Systems, Inc., Sr. Sub. Notes(b)(k) | Caa1 | 10.25% | 08/15/15 | 18,050 | 18,049,999 | ||||||||
SunGard Data Systems, Inc., Sr. Unsec’d. Notes(k) | B3 | 8.52% | 08/15/13 | 2,000 | 2,070,000 | ||||||||
SunGard Data Systems, Inc., Sr. Unsec’d. Notes(b)(k) | B3 | 9.125% | 08/15/13 | 1,750 | 1,811,250 | ||||||||
UGS Corp., Gtd. Notes | B3 | 10.00% | 06/01/12 | 2,115 | 2,305,350 | ||||||||
Unisys Corp., Sr. Notes(b) | Ba3 | 6.875% | 03/15/10 | 500 | 462,500 | ||||||||
Unisys Corp., Sr. Notes(b) | Ba3 | 8.00% | 10/15/12 | 765 | 707,625 | ||||||||
Unisys Corp., Sr. Notes(b) | Ba3 | 8.50% | 10/15/15 | 1,800 | 1,665,000 | ||||||||
Xerox Corp., Gtd. Notes | Ba2 | 9.75% | 01/15/09 | 590 | 652,688 | ||||||||
Xerox Corp., Sr. Notes | Ba2 | 6.875% | 08/15/11 | 1,350 | 1,397,250 | ||||||||
| 85,423,031 | |||||||||||||
Telecommunications — 5.5% | |||||||||||||
Alamosa Delaware, Inc., Gtd. Notes | Caa1 | 11.00% | 07/31/10 | 2,650 | 2,987,875 | ||||||||
Alamosa Delaware, Inc., Sr. Notes | Caa1 | 8.50% | 01/31/12 | 3,650 | 3,946,563 | ||||||||
American Cellular Corp., Sr. Notes, Ser. B | B3 | 10.00% | 08/01/11 | 1,000 | 1,085,000 | ||||||||
AT&T Corp., Sr. Notes | A2 | 9.05% | 11/15/11 | 2,627 | 2,907,629 | ||||||||
AT&T Corp., Sr. Notes(b) | A2 | 9.75% | 11/15/31 | 1,500 | 1,884,186 | ||||||||
Bestel SA de CV, Sr. Disc. Notes (Mexico)(c)(g) | NR | 12.75% | 05/15/05 | 900 | 153,000 | ||||||||
Centennial Communications Corp., Sr. Notes | B3 | 8.125% | 02/01/14 | 2,875 | 2,918,125 | ||||||||
Cincinnati Bell, Inc., Gtd. Notes(b) | B1 | 7.25% | 07/15/13 | 1,325 | 1,378,000 | ||||||||
Cincinnati Bell, Inc., Sr. Sub. Notes | B3 | 8.375% | 01/15/14 | 1,105 | 1,087,044 | ||||||||
Citizens Communications Co., Notes | Ba3 | 9.25% | 05/15/11 | 2,855 | 3,147,638 | ||||||||
Citizens Communications Co., Sr. Notes(b) | Ba3 | 6.25% | 01/15/13 | 4,400 | 4,257,000 | ||||||||
Dobson Cellular Systems, Inc., Sec’d. Notes | B2 | 8.375% | 11/01/11 | 1,400 | 1,485,750 | ||||||||
Dobson Cellular Systems, Inc., Sec’d. Notes | B2 | 9.00% | 11/01/11 | 1,650 | 1,716,000 | ||||||||
Dobson Communications Co., Notes(b)(k) | Caa2 | 8.40% | 10/15/12 | 975 | 970,125 | ||||||||
Eircom Funding, Sr. Sub. Notes (Ireland) | B1 | 8.25% | 08/15/13 | 2,105 | 2,252,350 | ||||||||
Hawaiian Telcom Communications, Inc., Sr. Notes(k) | B3 | 9.95% | 05/01/13 | 3,350 | 3,232,750 | ||||||||
Hawaiian Telcom Communications, Inc., Sr. Sub. Notes(k) | Caa1 | 12.50% | 05/01/15 | 3,750 | 3,506,250 | ||||||||
MCI, Inc., Sr. Notes | Ba3 | 7.69% | 05/01/09 | 4,041 | 4,172,333 | ||||||||
MCI, Inc., Sr. Notes | Ba3 | 8.74% | 05/01/14 | 5,463 | 6,043,444 | ||||||||
Nextel Partners, Inc., Sr. Notes(b) | Ba3 | 8.125% | 07/01/11 | 5,875 | 6,278,905 | ||||||||
Qwest Communications International, Inc., Sr. Notes(b)(k) | B2 | 7.50% | 02/15/14 | 6,225 | 6,396,187 | ||||||||
Qwest Corp., Sr. Notes(k) | Ba3 | 7.625% | 06/15/15 | 3,150 | 3,370,500 | ||||||||
Qwest Services Corp., Sr. Notes | Ba3 | 7.875% | 09/01/11 | 6,110 | 6,583,524 | ||||||||
Rogers Wireless Communications, Inc., Sec’d. Notes (Canada) | Ba3 | 6.375% | 03/01/14 | 4,000 | 4,010,000 | ||||||||
Rogers Wireless Communications, Inc., Sec’d. Notes (Canada) | Ba3 | 9.625% | 05/01/11 | 1,300 | 1,495,000 | ||||||||
Rogers Wireless Communications, Inc., Sr. Sub. Notes (Canada)(b) | B2 | 8.00% | 12/15/12 | 425 | 449,969 | ||||||||
Rural Cellular Corp., Sr. Sub. Notes(b)(k) | Caa2 | 10.04% | 11/01/12 | 2,500 | 2,518,750 | ||||||||
SBA Communications Corp., Sr. Notes | Caa1 | 8.50% | 12/01/12 | 2,148 | 2,384,280 | ||||||||
Triton PCS, Inc., Gtd. Notes | Caa1 | 8.50% | 06/01/13 | 1,570 | 1,460,100 | ||||||||
U.S. Unwired, Inc., Sec’d. Notes(i) | B2 | 8.741% | 06/15/10 | 1,275 | 1,310,063 | ||||||||
Ubiquitel Operating Co., Sr. Notes | Caa1 | 9.875% | 03/01/11 | 4,300 | 4,762,250 | ||||||||
| 90,150,590 | |||||||||||||
Tobacco — 0.1% | |||||||||||||
RJ Reynolds Tobacco Holdings, Inc., Notes(k) | Ba2 | 6.50% | 07/15/10 | 2,000 | 1,990,000 | ||||||||
TOTAL CORPORATE BONDS | 1,483,745,275 | ||||||||||||
SEE NOTES TO FINANCIAL STATEMENTS.
B64
| HIGH YIELD BOND PORTFOLIO (Continued) |
SCHEDULE OF INVESTMENTS | December 31, 2005 |
| FOREIGN GOVERNMENT OBLIGATIONS — 1.6% | Moody’s Rating (Unaudited) | Interest Rate | Maturity Date | Principal Amount (000) | Value (Note 2) | |||||||
Federal Republic of Argentina(i) | B3 | 3.00% | 04/30/13 | $ | 5,245 | $ | 4,224,323 | |||||
Federal Republic of Argentina(i) | B3 | 4.005% | 08/03/12 | 3,133 | 2,751,582 | |||||||
Federal Republic of Brazil | Ba3 | 8.75% | 02/04/25 | 3,350 | 3,701,750 | |||||||
Federal Republic of Brazil(b) | Ba3 | 10.00% | 08/07/11 | 1,920 | 2,232,000 | |||||||
Federal Republic of Colombia(b) | Ba2 | 10.00% | 01/23/12 | 3,352 | 3,988,880 | |||||||
Federal Republic of Peru(b) | Ba3 | 8.375% | 05/03/16 | 3,330 | 3,654,675 | |||||||
Federal Republic of Philippines(b) | B1 | 9.375% | 01/18/17 | 5,015 | 5,742,175 | |||||||
TOTAL FOREIGN GOVERNMENT OBLIGATIONS | 26,295,385 | |||||||||||
| COMMON STOCKS — 0.7% | Shares | |||||||||||
Adelphia Business Solutions, Inc. (Class “B” Stock)(a)(f)(g) | 25,755 | 424,958 | ||||||||||
Classic Communications, Inc.(a)(g) | 6,000 | 60 | ||||||||||
IMPSAT Fiber Networks, Inc. (Argentina)(a) | 29,831 | 206,132 | ||||||||||
Kaiser Group Holdings, Inc.(a) | 34,546 | 1,347,294 | ||||||||||
Liberty Global, Inc.(a) | 45,844 | 971,893 | ||||||||||
Liberty Media, Inc.(a) | 45,844 | 1,031,490 | ||||||||||
Netia SA (Poland) | 302,168 | 530,225 | ||||||||||
NTL, Inc.(a)(b) | 12,930 | 880,274 | ||||||||||
Premium Standard Farms, Inc. | 17,260 | 258,210 | ||||||||||
Telewest Global, Inc. (United Kingdom)(a) | 189,591 | 4,516,057 | ||||||||||
Telus Corp.(a) | 42,866 | 1,725,785 | ||||||||||
Trism, Inc.(a)(g) | 82,628 | 83 | ||||||||||
York Research Corp.(a)(f)(g) | 4,155 | 4 | ||||||||||
TOTAL COMMON STOCKS | 11,892,465 | |||||||||||
| PREFERRED STOCKS — 0.8% | ||||||||||||
Adelphia Communications Corp., PIK, 13.00%(a)(g) | 5,000 | 1,250 | ||||||||||
AmeriKing, Inc., PIK, 13.00%(a)(g) | 36,672 | 37 | ||||||||||
Eagle-Picher Holdings, Inc., 11.75%(a)(g) | 170 | 17,000 | ||||||||||
McLeodUSA, Inc., 2.50%(a) | 18,063 | 1,084 | ||||||||||
New Millenium Homes LLC(a)(g) | 3,000 | 30 | ||||||||||
Paxson Communications, Inc., PIK, 14.25%(a) | 1,148 | 9,987,599 | ||||||||||
PTV, Inc., Ser. A, 10.00%(a) | 13 | 27 | ||||||||||
World Access, Inc., 13.25%(a)(g) | 1,435 | 4 | ||||||||||
Xerox Corp., 6.25%(a) | 16,920 | 2,071,008 | ||||||||||
TOTAL PREFERRED STOCKS | 12,078,039 | |||||||||||
| WARRANTS(a) — 0.0% | Expiration Date | Units | ||||||||||
Allegiance Telecommunications, Inc.(g) | 02/03/08 | 3,800 | 4 | |||||||||
GT Group Telecommunications, Inc. (Canada)(k)(g) | 02/01/10 | 3,050 | 3 | |||||||||
ICON Fitness Corp.(g) | 09/27/09 | 18,093 | 181 | |||||||||
McLeodUSA, Inc. | 04/16/07 | 40,027 | 236 | |||||||||
Price Communications Corp.(g) | 08/01/07 | 6,880 | 281,460 | |||||||||
Sterling Chemical Holdings, Inc.(g) | 08/15/08 | 560 | 1 | |||||||||
TVN Entertainment(g) | 08/21/11 | 9,347 | 5,421 | |||||||||
Verado Holdings, Inc., Ser. B | 04/15/08 | 1,175 | 790 | |||||||||
Versatel Telecommunications(g) | 05/15/05 | 2,000 | 2 | |||||||||
Viasystems Group, Inc.(g) | 01/31/10 | 45,109 | 5 | |||||||||
XM Satellite Radio, Inc.(g)(k) | 03/15/10 | 5,005 | 5 | |||||||||
TOTAL WARRANTS | 288,108 | |||||||||||
TOTAL LONG TERM INVESTMENTS | 1,534,299,272 | |||||||||||
SEE NOTES TO FINANCIAL STATEMENTS.
B65
| HIGH YIELD BOND PORTFOLIO (Continued) |
SCHEDULE OF INVESTMENTS | December 31, 2005 |
| SHORT-TERM INVESTMENTS — 26.3% | Shares | Value | ||||||||||
MUTUAL FUNDS — 26.3% | ||||||||||||
Dryden Core Investment Fund — Short-Term Bond Series(e) | 2,925,151 | $ | 29,249,174 | |||||||||
Dryden Core Investment Fund — Taxable Money Market Series (includes $359,435,840 of cash collateral for securities lending) (Note 4)(d)(e) | 400,940,546 | 400,940,546 | ||||||||||
TOTAL SHORT TERM INVESTMENTS | 430,189,720 | |||||||||||
TOTAL INVESTMENTS — 120.1% | 1,964,488,992 | |||||||||||
LIABILITIES IN EXCESS OF OTHER ASSETS(m) — (20.1%) | (328,739,852 | ) | ||||||||||
TOTAL NET ASSETS — 100.0% | $ | 1,635,749,140 | ||||||||||
The following abbreviations are used in portfolio descriptions:
| LLC | Limited Liability Company | |
| LP | Limited Partnership | |
| MTN | Medium Term Note | |
| NR | Not Rated by Moody’s or Standard & Poor’s | |
| PIK | Payment-in-kind |
| (a) | Non-income producing security. |
| (b) | All or portion of security is on loan. The aggregate market value of such securities is $349,931,181; cash collateral of $359,435,840 (included in liabilities) was received with which the Portfolio purchased highly liquid short-term investments. |
| (c) | Represents issuer in default on interest payments, non-income producing security. |
| (d) | Represents security, or a portion thereof, purchased with cash collateral received for securities on loan. |
| (e) | Prudential Investments LLC, the manager of the Portfolio, also serves as manager of the Dryden Core Investment Fund — Taxable Money Market Series and the Dryden Core Investment Fund — Dryden Short-Term Bond Series. |
| (f) | Indicates a fair valued security. |
| (g) | Indicates a security that has been deemed illiquid. |
| (h) | Standard & Poor’s rating. |
| (i) | Indicates a variable rate security. The maturity date presented for these instruments is the latter of the next date on which the security can be redeemed at par or the next date on which the rate of interest is adjusted. The interest rate shown reflects the rate in effect at December 31, 2005. |
| (j) | Amount is actual; not rounded to thousands. |
| (k) | Security was purchased pursuant to Rule 144A under the Securities Act of 1933 and may not be resold subject to that rule except to qualified institutional buyer, unless otherwise noted 144A securities are deemed to be liquid. |
| (l) | Interest rate reflected represents the rate that would be in effect from the date the bond steps up from zero to an interest paying bond. |
| (m) | Liabilities in excess of other assets include interest rate swap as follows: |
Credit default swap agreements outstanding at December 31, 2005:
Counterparty | Termination Date | Notional Amount (000) | Fixed Rate | Underlying Bond | Unrealized Depreciation | |||||||||
| Lear Corp., | ||||||||||||||
Morgan Stanley Capital Services Inc* | 09/20/10 | $ | 2,500 | 4.20 | % | 8.11%, 05/15/08 | $ | (215,970 | ) | |||||
| * | Portfolio pays the floating rate and receives the fixed rate. |
SEE NOTES TO FINANCIAL STATEMENTS.
B66
| HIGH YIELD BOND PORTFOLIO (Continued) |
SCHEDULE OF INVESTMENTS | December 31, 2005 |
The industry classification of long-term portfolio holdings, short-term investments and liabilities in excess of other assets shown as a percentage of net assets as of December 31, 2005 was as follows:
Mutual Funds (including 22.0% of collateral received for securities on loan) | 26.3 | % | |
Health Care & Pharmaceutical | 8.2 | ||
Electric | 7.2 | ||
Chemicals | 6.9 | ||
Automotive | 6.3 | ||
Media & Entertainment | 6.0 | ||
Capital Goods | 5.5 | ||
Telecommunications | 5.5 | ||
Gaming | 5.3 | ||
Technology | 5.2 | ||
Lodging | 3.6 | ||
Cable | 3.5 | ||
Metals | 3.5 | ||
Pipelines & Others | 3.4 | ||
Energy — Other | 3.3 | ||
Packaging | 2.8 | ||
Paper | 2.7 | ||
Aerospace/Defense | 2.5 | ||
Building Materials & Construction | 2.0 | ||
Consumer | 1.7 | ||
Foods | 1.6 | ||
Retailers | 1.6 | ||
Foreign Government Obligations | 1.6 | ||
Preferred Stocks | 0.8 | ||
Common Stocks | 0.7 | ||
Non Captive Finance | 0.7 | ||
Airlines | 0.5 | ||
Banking | 0.4 | ||
Foreign Agencies | 0.4 | ||
Railroads | 0.2 | ||
Structured Notes | 0.1 | ||
Tobacco | 0.1 | ||
Warrants | 0.0 | ||
Swaps | 0.0 | ||
| 120.1 | |||
Liabilities in excess of other assets | (20.1 | ) | |
| 100.0 | % | ||
SEE NOTES TO FINANCIAL STATEMENTS.
B67
| JENNISON PORTFOLIO |
SCHEDULE OF INVESTMENTS | December 31, 2005 |
| LONG-TERM INVESTMENTS — 99.2% | Value (Note 2) | ||||
| COMMON STOCKS | Shares | ||||
Beverages — 1.3% | |||||
PepsiCo, Inc. | 507,200 | $ | 29,965,376 | ||
Biotechnology — 6.1% | |||||
Amgen, Inc.(a)(b) | 652,300 | 51,440,378 | |||
Genentech, Inc.(a) | 521,100 | 48,201,750 | |||
Gilead Sciences, Inc.(a) | 769,600 | 40,504,048 | |||
| 140,146,176 | |||||
Capital Markets — 4.7% | |||||
Charles Schwab Corp. (The) | 2,649,900 | 38,874,033 | |||
Goldman Sachs Group, Inc. (The) | 214,000 | 27,329,940 | |||
Merrill Lynch & Co., Inc.(The) | 629,500 | 42,636,035 | |||
| 108,840,008 | |||||
Commercial Banks — 1.5% | |||||
Bank of America Corp.(b) | 753,100 | 34,755,565 | |||
Communications Equipment — 3.7% | |||||
Cisco Systems, Inc.(a) | 1,410,600 | 24,149,472 | |||
Nokia Corp., ADR (Finland) | 1,657,900 | 30,339,570 | |||
QUALCOMM, Inc. | 710,800 | 30,621,264 | |||
| 85,110,306 | |||||
Computers & Peripherals — 3.0% | |||||
Apple Computer, Inc.(a) | 635,500 | 45,686,095 | |||
EMC Corp.(a) | 1,720,500 | 23,433,210 | |||
| 69,119,305 | |||||
Consumer Finance — 2.6% | |||||
American Express Co. | 1,154,600 | 59,415,716 | |||
Diversified Financial Services — 1.2% | |||||
J.P.Morgan Chase & Co. | 715,400 | 28,394,226 | |||
Electronic Equipment & Instruments — 0.8% | |||||
Agilent Technologies, Inc.(a) | 574,800 | 19,135,092 | |||
Energy Equipment & Services — 2.8% | |||||
Schlumberger Ltd. | 678,400 | 65,906,560 | |||
Food & Staples Retailing — 2.0% | |||||
Whole Foods Market, Inc. | 596,000 | 46,124,440 | |||
Health Care Equipment & Supplies — 3.2% | |||||
Alcon, Inc. (Switzerland) | 311,300 | 40,344,480 | |||
St. Jude Medical, Inc.(a) | 686,300 | 34,452,260 | |||
| 74,796,740 | |||||
Health Care Providers & Services — 5.9% | |||||
Caremark Rx, Inc.(a) | 728,000 | 37,703,120 | |||
CIGNA Corp. | 188,500 | 21,055,450 | |||
UnitedHealth Group, Inc.(b) | 742,900 | 46,163,806 | |||
WellPoint, Inc.(a) | 399,900 | 31,908,021 | |||
| 136,830,397 | |||||
Hotels, Restaurants & Leisure — 1.7% | |||||
Cheesecake Factory (The)(a)(b) | 237,200 | 8,868,908 | |||
Marriott International, Inc. | 350,300 | 23,459,591 | |||
Starbucks Corp.(a) | 211,300 | 6,341,113 | |||
| 38,669,612 | |||||
Household Products — 3.0% | |||||
Procter & Gamble Co. (The) | 1,203,557 | 69,661,879 | |||
| COMMON STOCKS | Value (Note 2) | ||||
| (Continued) | Shares | ||||
Industrial Conglomerates — 3.2% | |||||
General Electric Co. | 2,138,600 | $ | 74,957,930 | ||
Insurance — 2.5% | |||||
American International Group, Inc. | 856,300 | 58,425,349 | |||
Internet & Catalog Retail — 3.9% | |||||
Amazon.com, Inc.(a)(b) | 256,100 | 12,075,115 | |||
eBay, Inc.(a) | 1,814,400 | 78,472,800 | |||
| 90,547,915 | |||||
Internet Software & Services — 6.8% | |||||
Google, Inc. (Class “A” Stock)(a)(b) | 219,700 | 91,144,741 | |||
Yahoo!, Inc.(a) | 1,709,200 | 66,966,456 | |||
| 158,111,197 | |||||
Media — 0.4% | |||||
Getty Images, Inc.(a)(b) | 93,900 | 8,382,453 | |||
Multiline Retail — 3.4% | |||||
Federated Department Stores, Inc. | 427,800 | 28,375,974 | |||
Target Corp. | 910,700 | 50,061,179 | |||
| 78,437,153 | |||||
Oil, Gas & Consumable Fuels — 2.4% | |||||
Occidental Petroleum Corp.(b) | 315,600 | 25,210,128 | |||
Suncor Energy, Inc. (Canada) | 470,900 | 29,727,917 | |||
| 54,938,045 | |||||
Pharmaceuticals — 5.5% | |||||
Novartis AG, ADR (Switzerland)(b) | 876,500 | 45,998,720 | |||
Roche Holdings Group, ADR (Switzerland) | 668,200 | 50,015,505 | |||
Sanofi-Aventis (France) | 356,500 | 31,232,316 | |||
| 127,246,541 | |||||
Semiconductors & Semiconductor Equipment — 9.7% | |||||
Applied Materials, Inc. | 1,963,400 | 35,223,396 | |||
Intel Corp. | 1,283,600 | 32,038,656 | |||
Marvell Technology Group Ltd.(a) | 1,001,400 | 56,168,526 | |||
Maxim Integrated Products, Inc. | 1,434,300 | 51,979,032 | |||
Texas Instruments, Inc. | 1,513,700 | 48,544,359 | |||
| 223,953,969 | |||||
Software — 8.7% | |||||
Adobe Systems, Inc. | 1,525,000 | 56,364,000 | |||
Electronic Arts, Inc.(a)(b) | 830,000 | 43,417,300 | |||
Microsoft Corp. | 1,709,700 | 44,708,655 | |||
NAVTEQ Corp.(a)(b) | 424,900 | 18,640,363 | |||
SAP AG, ADR (Germany) | 834,800 | 37,624,436 | |||
| 200,754,754 | |||||
Specialty Retail — 4.5% | |||||
Chico’s FAS, Inc.(a)(b) | 1,090,400 | 47,901,272 | |||
Lowe’s Companies, Inc. (The)(b) | 527,900 | 35,189,814 | |||
Williams-Sonoma, Inc.(a)(b) | 507,400 | 21,894,310 | |||
| 104,985,396 | |||||
SEE NOTES TO FINANCIAL STATEMENTS.
B68
| JENNISON PORTFOLIO (Continued) |
SCHEDULE OF INVESTMENTS | December 31, 2005 |
| COMMON STOCKS | Value (Note 2) | |||||
| (Continued) | Shares | |||||
Textiles, Apparel & Luxury Goods — 3.2% | ||||||
Coach, Inc.(a) | 1,025,600 | $ | 34,193,504 | |||
NIKE, Inc. (Class “B” Stock) | 457,800 | 39,732,462 | ||||
| 73,925,966 | ||||||
Wireless Telecommunication Services — 1.5% | ||||||
Sprint Nextel Corp. | 1,461,327 | 34,136,599 | ||||
TOTAL LONG-TERM INVESTMENTS | 2,295,674,665 | |||||
| SHORT-TERM INVESTMENT — 12.4% | ||||||
Mutual Fund | ||||||
Dryden Core Investment Fund — Taxable Money Market Series | 288,723,330 | 288,723,330 | ||||
TOTAL INVESTMENTS — 111.6% | 2,584,397,995 | |||||
LIABILITIES IN EXCESS OF | (269,157,423 | ) | ||||
NET ASSETS — 100.0% | $ | 2,315,240,572 | ||||
The industry classification of portfolio holdings and liabilities in excess of other assets shown as a percentage of net assets as of December 31, 2005 was as follows:
Mutual Fund (including 11.8% of collateral received for securities on loan) | 12.4 | % | |
Semiconductors & Semiconductor Equipment | 9.7 | ||
Software | 8.7 | ||
Internet Software & Services | 6.8 | ||
Biotechnology | 6.1 | ||
Health Care Providers & Services | 5.9 | ||
Pharmaceuticals | 5.5 | ||
Capital Markets | 4.7 | ||
Specialty Retail | 4.5 | ||
Internet & Catalog Retail | 3.9 | ||
Communications Equipment | 3.7 | ||
Multiline Retail | 3.4 | ||
Health Care Equipment & Supplies | 3.2 | ||
Industrial Conglomerates | 3.2 | ||
Textiles, Apparel & Luxury Goods | 3.2 | ||
Computer & Peripherals | 3.0 | ||
Household Products | 3.0 | ||
Energy Equipment & Services | 2.8 | ||
Consumer Finance | 2.6 | ||
Insurance | 2.5 | ||
Oil, Gas & Consumable Fuels | 2.4 | ||
Food & Staples Retailing | 2.0 | ||
Hotels, Restaurants & Leisure | 1.7 | ||
Commercial Banks | 1.5 | ||
Wireless Telecommunication Services | 1.5 | ||
Beverages | 1.3 | ||
Diversified Financial Services | 1.2 | ||
Electronic Equipment & Instruments | 0.8 | ||
Media | 0.4 | ||
| 111.6 | |||
Liabilities in excess of other assets | (11.6 | ) | |
| 100.0 | % | ||
The following abbreviation is used in portfolio descriptions:
| ADR | American Depositary Receipt |
| (a) | Non-income producing security. |
| (b) | All or portion of security is on loan. The aggregate market value of such securities is $259,673,375; cash collateral of $272,359,041 (included in liabilities) was received with which the Portfolio purchased highly liquid short-term investments. |
| (c) | Represents security, or a portion thereof, purchased with cash collateral received for securities on loan. |
| (d) | Prudential Investments LLC, the manager of the Portfolio, also serves as manager of the Dryden Core Investment Fund-Taxable Money Market Series. |
SEE NOTES TO FINANCIAL STATEMENTS.
B69
| MONEY MARKET PORTFOLIO |
SCHEDULE OF INVESTMENTS | December 31, 2005 |
| Interest Rate | Maturity Date | Principal Amount (000) | Value (Note 2) | |||||||
Certificates of Deposit — 28.5% | ||||||||||
Banco Bilbao Vizcaya NY(a) | 4.080% | 07/17/06 | $ | 10,000 | $ | 9,996,558 | ||||
Bank of New York, Inc. | 4.550% | 10/27/06 | 10,000 | 10,000,000 | ||||||
Branch Banking & Trust Co.(a) | 4.260% | 08/10/06 | 46,000 | 45,997,055 | ||||||
Citibank N.A. | 4.300% | 02/15/06 | 15,000 | 15,000,000 | ||||||
Dexia Bank NY | 4.335% | 02/01/06 | 42,000 | 42,000,180 | ||||||
Fortis Bank NV — S.A. | 4.260% | 04/17/06 | 18,000 | 17,998,915 | ||||||
Fortis Bank NV — S.A. | 4.300% | 09/28/06 | 15,000 | 15,000,000 | ||||||
Regions Bank of Alabama | 4.200% | 02/01/06 | 14,000 | 14,000,000 | ||||||
Societe Generale NA | 4.200% | 09/01/06 | 20,000 | 20,000,000 | ||||||
Suntrust Banks, Inc.(a) | 4.282% | 05/12/06 | 18,000 | 17,999,467 | ||||||
Toronto Dominion Bank NY | 3.795% | 07/03/06 | 25,000 | 25,000,000 | ||||||
Unicredito Italiano New York(a) | 4.467% | 06/30/06 | 10,000 | 9,995,752 | ||||||
| 242,987,927 | ||||||||||
Commercial Paper — 31.6% | ||||||||||
Allianz Finance Corp. 144A(d)(f) | 4.180% | 02/03/06 | 10,000 | 9,961,683 | ||||||
Amsterdam Funding Corp. 144A(d)(f) | 4.270% | 01/19/06 | 20,000 | 19,957,300 | ||||||
Bank of America Corp.(f) | 4.190% | 01/31/06 | 15,000 | 14,947,625 | ||||||
Barton Capital Corp. 144A(d)(f) | 4.300% | 01/27/06 | 13,004 | 12,963,615 | ||||||
Cafco LLC 144A(d)(f) | 4.290% | 01/31/06 | 9,000 | 8,967,825 | ||||||
Cafco LLC 144A(d)(f) | 4.290% | 02/01/06 | 30,000 | 29,890,596 | ||||||
Citigroup Funding(f) | 4.290% | 01/30/06 | 5,000 | 4,982,801 | ||||||
DNB NOR Bank ASA(f) | 4.380% | 02/16/06 | 3,300 | 3,281,531 | ||||||
Dresdner Bank(f) | 4.400% | 02/21/06 | 10,000 | 9,937,667 | ||||||
Greenwich Capital Holdings, Inc.(a)(f) | 4.320% | 05/11/06 | 28,500 | 28,500,000 | ||||||
Irish Life & Permanent PLC 144A(d)(f) | 4.310% | 02/16/06 | 4,000 | 3,977,664 | ||||||
Long Lane Master Trust 144A(d)(f) | 4.400% | 03/08/06 | 3,553 | 3,524,339 | ||||||
Norddeutche Landesbank 144A(d)(f) | 4.280% | 01/30/06 | 24,000 | 23,917,253 | ||||||
Nordea North America(f) | 4.370% | 02/14/06 | 1,950 | 1,939,585 | ||||||
Nyala Funding LLC 144A(d)(f) | 4.170% | 01/17/06 | 15,000 | 14,972,167 | ||||||
PB Finance Delaware, Inc.(f) | 4.320% | 01/30/06 | 13,600 | 13,552,672 | ||||||
Prudential PLC 144A(d)(f) | 4.390% | 03/09/06 | 10,000 | 9,918,297 | ||||||
Sheffield Receivables 144A(d)(f) | 4.280% | 01/27/06 | 20,000 | 19,938,178 | ||||||
Societe Generale NA(f) | 4.250% | 01/27/06 | 4,625 | 4,610,804 | ||||||
Tulip Funding Corp 144A(d)(f) | 4.400% | 02/03/06 | 29,774 | 29,653,912 | ||||||
| 269,395,514 | ||||||||||
Loan Participation — 1.1% | ||||||||||
Countrywide Home Loans Inc. (cost $9,000,000; purchased 12/29/2005)(b) | 4.390% | 01/31/06 | 9,000 | 9,000,000 | ||||||
Other Corporate Obligations — 37.9% | ||||||||||
American Express Credit Corp. M.T.N.(a)(d) | 4.391% | 01/05/07 | 27,000 | 27,009,357 | ||||||
American Express Credit Corp. M.T.N. 144A(a)(d) | 4.420% | 01/19/07 | 10,000 | 10,006,145 | ||||||
General Electric Capital Assurances Co. (cost $11,000,000; purchased 7/22/2005)(a)(b) | 4.450% | 07/24/06 | 11,000 | 11,000,000 | ||||||
General Electric Capital Corp.(a) | 4.440% | 01/09/07 | 11,750 | 11,750,000 | ||||||
General Electric Capital Corp. M.T.N.(a) | 4.470% | 01/17/07 | 21,000 | 21,000,000 | ||||||
HSBC USA Inc. M.T.N.(a) | 4.349% | 01/15/07 | 30,000 | 30,000,000 | ||||||
Irish Life & Permanent PLC M.T.N. 144A(a)(d) | 4.390% | 01/21/07 | 25,000 | 24,997,908 | ||||||
Merrill Lynch & Co., Inc. M.T.N.(a) | 4.560% | 01/11/07 | 34,000 | 34,008,604 | ||||||
Metropolitan Life Insurance Co. (cost $9,000,000; purchased 2/9/2005)(a)(b) | 4.320% | 02/01/06 | 9,000. | 9,000,000 | ||||||
Metropolitan Life Insurance Co. (cost $10,000,000; purchased 10/3/2005)(a)(b) | 4.361% | 10/02/06 | 10,000 | 10,000,000 | ||||||
Morgan Stanley Dean Witter Co.(a) | 4.301% | 01/03/07 | 31,000 | 31,000,000 | ||||||
Morgan Stanley Inc.(a) | 4.799% | 03/27/06 | 5,000 | 5,003,411 | ||||||
National City Bank Cleveland(a) | 4.281% | 07/07/06 | 11,000 | 10,998,705 | ||||||
Nordea Bank AB 144A(a)(d) | 4.340% | 01/11/07 | 20,000 | 20,000,000 | ||||||
Pacific Life Insurance Co. (cost $7,000,000; purchased 12/15/05)(a)(b) | 4.611% | 01/12/07 | 7,000 | 7,000,000 | ||||||
Royal Bank of Canada M.T.N.(a) | 4.390% | 01/08/07 | 5,000 | 5,000,000 | ||||||
Skandinaviska Enskilda Banken AB 144A(a)(d) | 4.360% | 01/16/07 | 36,000 | 36,000,000 | ||||||
Travelers Insurance Co. (cost $6,000,000; purchased 7/8/2005)(a)(b) | 4.410% | 07/07/06 | 6,000 | 6,000,000 | ||||||
Westpac Banking Corp. M.T.N.(a) | 4.490% | 01/11/07 | 13,000 | 12,999,899 | ||||||
| 322,774,029 | ||||||||||
SEE NOTES TO FINANCIAL STATEMENTS.
B70
| MONEY MARKET PORTFOLIO (Continued) |
SCHEDULE OF INVESTMENTS | December 31, 2005 |
| Interest Rate | Maturity Date | Principal Amount (000) | Value (Note 2) | |||||||
Repurchase Agreement — 0.4% | ||||||||||
Greenwich Capital Markets, Inc.(c) | 4.330% | 01/03/06 | $ | 3,743 | $ | 3,743,000 | ||||
TOTAL INVESTMENTS — 99.5% | 847,900,470 | |||||||||
OTHER ASSETS IN EXCESS OF LIABILITIES — 0.5% | 4,042,017 | |||||||||
TOTAL NET ASSETS — 100.0% | $ | 851,942,487 | ||||||||
The following abbreviation is used in portfolio descriptions:
| M.T.N. | Medium Term Notes |
| (a) | Indicates a variable rate security. The maturity date presented for these instruments is the later of the next date on which the security can be redeemed at par or the next date on which the rate of interest is adjusted. The interest rate shown reflects the rate in effect at December 31, 2005. |
| (b) | Indicates a restricted security and deemed illiquid. The aggregate cost and value of restricted securities is $52,000,000 and represents 6.1% of net assets. |
| (c) | Greenwich Capital Markets, Inc. Repurchase Agreement, repurchase price $3,744,801 due 1/03/06. The value of the collateral including accrued interest was $3,820,643. Collateralized by United States Treasury or federal agency obligations. |
| (d) | Securities were purchased pursuant to Rule 144A under the Securities Act of 1933 and may not be resold subject to that rule except to qualified institutional buyers unless otherwise noted. 144A securities are deemed to be liquid. |
| (e) | Federal income tax basis is the same as for financial reporting purposes. |
| (f) | Rate quoted represents yield-to-maturity as of purchase date. |
The industry classification of portfolio holdings and other assets in excess of liabilities shown as a percentage of net assets as of December 31, 2005 was as follows:
Foreign Banks | 42.1 | % | |
Asset Backed Securities | 14.3 | ||
Commercial Banks | 11.7 | ||
Insurance | 9.1 | ||
Security Broker & Dealers | 8.2 | ||
Bank Holding Companies | 4.5 | ||
Finance Services | 4.3 | ||
Short Term Business Credit | 3.8 | ||
Mortgage Bankers | 1.1 | ||
Repurchase Agreement | 0.4 | ||
| 99.5 | |||
Other assets in excess of liabilities | 0.5 | ||
| 100.0 | % | ||
SEE NOTES TO FINANCIAL STATEMENTS.
B71
| NATURAL RESOURCES PORTFOLIO |
SCHEDULE OF INVESTMENTS | December 31, 2005 |
| LONG-TERM INVESTMENTS — 98.7% | Value (Note 2) | ||||
| COMMON STOCKS — 96.6% | Shares | ||||
Aluminum — 0.5% | |||||
Aluminum Corp. of China, Ltd., ADR (China)(b) | 70,300 | $ | 5,366,702 | ||
Basic Metals — 7.3% | |||||
Cameco Corp. (Canada) | 346,100 | 21,969,736 | |||
Falconbridge Ltd. | 479,000 | 14,192,770 | |||
First Quantum Minerals, Ltd. (Canada) | 528,200 | 16,925,846 | |||
FNX Mining Co., Inc. (Canada)(a) | 390,200 | 4,561,760 | |||
FNX Mining Co., Inc.144A (Canada)(a)(h) | 56,300 | 658,194 | |||
Inco Ltd.(b) | 304,900 | 13,284,493 | |||
Northern Dynasty Minerals, Ltd.(a)(b) | 495,200 | 2,634,464 | |||
| 74,227,263 | |||||
Coal — 2.1% | |||||
CONSOL Energy, Inc. | 332,600 | 21,678,868 | |||
Copper — 5.6% | |||||
Freeport-McMoRan Copper & Gold, Inc. (Class ‘B’ Stock ) | 314,400 | 16,914,720 | |||
Peru Copper, Inc. (Canada)(a) | 656,200 | 1,823,327 | |||
Phelps Dodge Corp. | 224,600 | 32,313,202 | |||
Southern Peru Copper Corp.(b) | 94,200 | 6,309,516 | |||
| 57,360,765 | |||||
Crude Oil Production — 6.0% | |||||
Endeavour International Corp.(a)(b) | 636,800 | 2,101,440 | |||
OPTI Canada, Inc. (Canada)(a) | 1,217,274 | 39,970,191 | |||
UTS Energy Corp. (Canada)(a)(b) | 2,136,400 | 7,865,966 | |||
Western Oil Sands, Inc. (Canada)(a) | 463,300 | 11,083,808 | |||
| 61,021,405 | |||||
Diversified Resources — 5.3% | |||||
Anhui Conch Cement Co., Ltd. (Class “H” Stock) (Hong Kong) | 4,200,000 | 5,166,779 | |||
Evergreen Solar, Inc.(a)(b) | 134,600 | 1,433,490 | |||
FMC Technologies, Inc.(a) | 118,600 | 5,090,312 | |||
Halliburton Co.(b) | 292,100 | 18,098,517 | |||
Railpower Technologies Corp. (Canada)(a) | 122,200 | 679,093 | |||
Railpower Technologies Corp. 144A(Canada)(a)(h) | 232,300 | 1,290,944 | |||
SEACOR Holdings, Inc.(a) | 88,800 | 6,047,280 | |||
Technip SA, ADR (France) | 274,800 | 16,702,344 | |||
| 54,508,759 | |||||
Gold — 13.7% | |||||
Aflease Gold and Uranium Resources, Ltd., ADR (South Africa)(a)(b) | 1,133,100 | 10,386,953 | |||
AXMIN, Inc. (Canada)(a) | 1,529,600 | 736,871 | |||
AXMIN, Inc. (Canada) (cost $474,102; purchased 12/14/2005)(a)(f)(g) | 1,050,000 | 480,537 | |||
Crystallex International Corp.(a)(b) | 2,787,500 | 6,021,000 | |||
Gabriel Resources, Ltd. (Canada)(a) | 867,500 | 2,119,403 | |||
Gold Fields, Ltd., ADR (South Africa) | 821,400 | 14,481,282 | |||
Gold Reserve, Inc. (Canada)(a) | 152,800 | 442,974 | |||
| COMMON STOCKS | Value (Note 2) | ||||
| (Continued) | Shares | ||||
Gold (cont’d.) | |||||
Goldcorp, Inc. | 456,100 | $ | 10,161,908 | ||
Harmony Gold Mining Co., Ltd., ADR (South Africa)(a)(b) | 1,292,500 | 16,867,125 | |||
IAMGOLD Corp. (Canada) | 380,600 | 2,999,093 | |||
Meridian Gold, Inc.(a)(b) | 497,900 | 10,889,073 | |||
Nevsun Resources, Ltd. (Canada)(a) | 1,056,100 | 1,907,876 | |||
Newcrest Mining, Ltd. (Australia) (cost $11,489,739; purchased 11/11/02 — 11/02/05) | 940,100 | 16,684,858 | |||
Newmont Mining Corp. | 498,700 | 26,630,581 | |||
Orezone Resources, Inc. (Canada)(a) | 1,066,800 | 1,973,091 | |||
Placer Dome, Inc. | 747,200 | 17,133,296 | |||
| 139,915,921 | |||||
Integrated Oil/Domestic — 4.3% | |||||
Amerada Hess Corp.(b) | 88,700 | 11,248,934 | |||
Occidental Petroleum Corp.(b) | 224,500 | 17,933,060 | |||
Valero Energy Corp. | 281,600 | 14,530,560 | |||
| 43,712,554 | |||||
Integrated Oil/International — 7.2% | |||||
Petroleo Brasileiro SA, ADR (Brazil) | 210,600 | 15,009,462 | |||
Sasol Ltd. ADR (South Africa) | 550,500 | 19,619,820 | |||
Suncor Energy, Inc. | 608,900 | 38,439,857 | |||
| 73,069,139 | |||||
Iron & Steel — 1.9% | |||||
Companhia Vale Do Rio Doce, ADR (Brazil) | 466,300 | 19,183,582 | |||
Natural Gas Production — 17.1% | |||||
Bill Barrett Corp.(a) | 172,900 | 6,675,669 | |||
BPI Industries, Inc. | 2,800,000 | 8,432,200 | |||
Cheniere Energy, Inc.(a)(b) | 231,400 | 8,612,708 | |||
CNX Gas Corp. 144A (cost $1,436,800; purchased 8/1/05)(a)(f)(g)(h) | 89,800 | 1,436,800 | |||
Compton Petroleum Corp. (Canada)(a) | 676,200 | 9,947,112 | |||
Duvernay Oil Corp. (Canada)(a) | 181,800 | 6,917,299 | |||
EOG Resources, Inc.(b) | 133,900 | 9,824,243 | |||
Gasco Energy, Inc.(a)(b) | 944,100 | 6,164,973 | |||
Goodrich Petroleum Corp.(a)(b) | 241,100 | 6,063,665 | |||
McMoRan Exploration Co.(a)(b) | 258,800 | 5,116,476 | |||
Quicksilver Resources, Inc.(a)(b) | 229,300 | 9,632,893 | |||
Range Resources Corp.(b) | 601,950 | 15,855,363 | |||
Southwestern Energy Co.(a) | 1,000,400 | 35,954,375 | |||
Trident Resources Corp. (Canada) (cost $4,402,178; purchased 12/4/03)(a)(f)(g) | 412,657 | 17,749,452 | |||
Warren Resources, Inc.(a)(b) | 964,200 | 15,253,644 | |||
Western Gas Resoures, Inc. | 242,500 | 11,419,325 | |||
| 175,056,197 | |||||
Oil Service — 22.1% | |||||
B.J. Services Co. | 400,600 | 14,690,002 | |||
CARBO Ceramics, Inc. | 147,300 | 8,325,396 | |||
SEE NOTES TO FINANCIAL STATEMENTS.
B72
| NATURAL RESOURCES PORTFOLIO (Continued) |
SCHEDULE OF INVESTMENTS | December 31, 2005 |
| COMMON STOCKS | Value (Note 2) | ||||
| (Continued) | Shares | ||||
Oil Service (cont’d.) | |||||
Cooper Cameron Corp.(a) | 342,000 | $ | 14,158,800 | ||
GlobalSantaFe Corp. | 774,000 | 37,268,100 | |||
Grant Prideco, Inc.(a) | 270,300 | 11,925,636 | |||
Hydril Co.(a) | 114,000 | 7,136,400 | |||
National-Oilwell Varco, Inc.(a) | 611,900 | 38,366,130 | |||
Noble Corp. | 136,900 | 9,656,926 | |||
Patterson-UTI Energy, Inc.(b) | 297,000 | 9,786,150 | |||
Smith International, Inc. | 394,500 | 14,639,895 | |||
Transocean, Inc.(a) | 398,800 | 27,792,372 | |||
Universal Compression Holdings, Inc.(a) | 243,200 | 10,000,384 | |||
Weatherford International, Ltd.(a) | 599,000 | 21,683,800 | |||
| 225,429,991 | |||||
Platinum — 1.5% | |||||
Impala Platinum Holdings, Ltd., ADR (South Africa)(b) | 417,200 | 15,326,384 | |||
Silver — 2.0% | |||||
Apex Silver Mines, Ltd.(a)(b) | 448,100 | 7,124,790 | |||
Coeur d’Alene Mines Corp.(a)(b) | 1,236,900 | 4,947,600 | |||
Pan American Silver Corp. (Canada)(a) | 97,572 | 1,839,049 | |||
Western Silver Corp.(a)(b) | 635,000 | 7,150,100 | |||
| 21,061,539 | |||||
TOTAL COMMON STOCKS | 986,919,069 | ||||
| Units | |||||
| WARRANTS(a) — 0.2% | |||||
Copper | |||||
Peru Copper, Inc. (Canada) Expiring 3/18/06 | 328,100 | 273,781 | |||
Natural Gas Production — 0.1% | |||||
BPI Industries, Inc., expiring 12/31/06 (cost $131,255; purchased 12/31/04)(f)(g) | 600,000 | 1,044,662 | |||
| COMMON STOCKS | Value (Note 2) | ||||||
| (Continued) | Units | ||||||
Silver — 0.1% | |||||||
Pan American Silver Corp., | 49,786 | $ | 485,247 | ||||
TOTAL WARRANTS | 1,803,690 | ||||||
| Principal Amount (000) | |||||||
| LINKED NOTE — 0.9% | |||||||
Platinum | |||||||
USD Palladium Linked Bank Note 7/13/07 (cost $7,000,000; purchased 6/30/03)(a)(f)(g) | $ | 38,076 | 9,275,223 | ||||
| Shares | |||||||
| PREFERRED STOCK — 1.0% | |||||||
Integrated Oil/International | |||||||
Surgutneftegaz, ADR (Russia) | 115,800 | 10,294,620 | |||||
TOTAL LONG-TERM INVESTMENTS | 1,008,292,602 | ||||||
| SHORT-TERM INVESTMENTS — 18.0% | |||||||
Mutual Fund | |||||||
Dryden Core Investment Fund —Taxable Money Market Series (cost $184,121,312; includes $170,186,750 of cash collateral for securities on loan) | 184,121,312 | 184,121,312 | |||||
TOTAL INVESTMENTS(e) — 116.7% | 1,192,413,914 | ||||||
LIABILITIES IN EXCESS OF | (171,046,840 | ) | |||||
NET ASSETS — 100.0% | $ | 1,021,367,074 | |||||
SEE NOTES TO FINANCIAL STATEMENTS.
B73
| NATURAL RESOURCES PORTFOLIO (Continued) |
The following abbreviations are used in portfolio descriptions:
| ADR | American Depositary Receipt | |
| USD | United States Dollar – denominated |
| (a) | Non-income producing security. |
| (b) | All or portion of security is on loan. The aggregate market value of such securities is $159,596,535; cash collateral of $170,186,750 (included in liabilities) was received with which the Portfolio purchased highly liquid short-term investments. |
| (c) | Represents security, or portion thereof, purchased with cash collateral for securities of loan. |
| (d) | Prudential Investments LLC, the manager of the Portfolio, also serves as manager of the Dryden Core Investment Fund-Taxable Money Market Series. |
| (e) | As of December 31, 2005, 7 securities representing $55,103,732 and 5.4% of the total market value were fair valued in accordance with the policies adopted by the Board of Directors. |
| (f) | Indicates illiquid securities. |
| (g) | Indicates a security restricted to resale. The aggregate cost of such securities was $17,553,882. The aggregate value of $38,418,874 is approximately 3.8% of the net assets. |
| (h) | Security was purchased pursuant to Rule 144A under the Securities Act of 1933 and may not be resold subject to that rule except to qualified institutional buyers, unless otherwise noted. 144A securities are deemed to be liquid. |
| Forward foreign currency exchange contracts outstanding at December 31, 2005: |
Forward Foreign Currency Contracts | Value at Settlement Date | Current Value | Unrealized Appreciation | ||||||
Buy | |||||||||
Canadian Dollar expiring 1/3/06 | $ | 194,971 | $ | 195,432 | $ | 461 | |||
Canadian Dollar expiring 1/4/06 | 644,555 | 646,856 | 2,301 | ||||||
| $ | 2,762 | ||||||||
The industry classification of portfolio holdings and liabilities in excess of other assets shown as a percentage of net assets as of December 31, 2005 was as follows:
Oil Service | 22.1 | % | |
Mutual Fund (including 16.7% of collateral received for securities on loan) | 18.0 | ||
Natural Gas Production | 17.2 | ||
Gold | 13.7 | ||
Integrated Oil/ International | 8.2 | ||
Basic Metals | 7.3 | ||
Crude Oil Production | 6.0 | ||
Copper | 5.6 | ||
Diversified Resources | 5.3 | ||
Integrated Oil/ Domestic | 4.3 | ||
Platinum | 2.4 | ||
Coal | 2.1 | ||
Silver | 2.1 | ||
Iron & Steel | 1.9 | ||
Aluminum | 0.5 | ||
| 116.7 | |||
Liabilities in excess of other assets | (16.7 | ) | |
| 100.0 | % | ||
SEE NOTES TO FINANCIAL STATEMENTS.
B74
| SMALL CAPITALIZATION STOCK PORTFOLIO |
SCHEDULE OF INVESTMENTS | December 31, 2005 |
| LONG-TERM INVESTMENTS — 99.0% | |||||
| COMMON STOCKS | Shares | Value (Note 2) | |||
Advertising — 0.2% | |||||
ADVO, Inc. | 43,029 | $ | 1,212,557 | ||
Aerospace — 1.5% | |||||
AAR Corp.(a) | 45,178 | 1,082,013 | |||
Curtiss-Wright Corp. | 29,808 | 1,627,517 | |||
DRS Technologies, Inc. | 38,351 | 1,972,008 | |||
GenCorp, Inc.(a)(b) | 74,972 | 1,330,753 | |||
Kaman Corp. (Class “A” Stock) | 31,553 | 621,279 | |||
Moog, Inc. (Class “A” Stock)(a) | 47,087 | 1,336,329 | |||
Trimble Navigation, Ltd.(a) | 73,603 | 2,612,170 | |||
Triumph Group, Inc.(a) | 21,750 | 796,268 | |||
| 11,378,337 | |||||
Agricultural Products & Services — 0.2% | |||||
Delta & Pine Land Co. | 49,325 | 1,134,968 | |||
Airlines — 0.4% | |||||
Frontier Airlines, Inc.(a) | 49,458 | 456,992 | |||
Mesa Air Group, Inc.(a)(b) | 39,509 | 413,264 | |||
SkyWest, Inc. | 79,129 | 2,125,405 | |||
| 2,995,661 | |||||
Apparel — 1.0% | |||||
Finish Line, Inc. (The) (Class “A” Stock) | 60,261 | 1,049,747 | |||
Fossil, Inc.(a)(b) | 66,973 | 1,440,589 | |||
Genesco, Inc.(a)(b) | 31,282 | 1,213,429 | |||
Phillips-Van Heusen Corp. | 50,339 | 1,630,984 | |||
Russell Corp. | 45,247 | 609,025 | |||
Wolverine World Wide, Inc. | 77,741 | 1,746,063 | |||
| 7,689,837 | |||||
Autos – Cars & Trucks — 0.5% | |||||
Midas, Inc.(a) | 17,157 | 315,003 | |||
Myers Industries, Inc. | 42,749 | 623,280 | |||
Sonic Automotive, Inc. | 40,725 | 907,353 | |||
Standard Motor Products, Inc. | 17,092 | 157,759 | |||
Superior Industries International, Inc.(b) | 31,298 | 696,693 | |||
Wabash National Corp. | 42,698 | 813,397 | |||
| 3,513,485 | |||||
Banks & Savings & Loans — 6.2% | |||||
Anchor BanCorp Wisconsin, Inc. | 25,184 | 764,083 | |||
BankAtlantic Bancorp, Inc. (Class “A” Stock) | 61,479 | 860,706 | |||
BankUnited Financial Corp. (Class “A” Stock) | 36,463 | 968,822 | |||
Boston Private Financial Holdings, Inc. | 47,039 | 1,430,926 | |||
Brookline Bancorp, Inc. | 84,194 | 1,193,029 | |||
Central Pacific Financial Corp. | 41,655 | 1,496,248 | |||
Chittenden Corp. | 63,726 | 1,772,220 | |||
Community Bank System, Inc. | 40,965 | 923,761 | |||
Dime Community Bancshares | 37,838 | 552,813 | |||
Downey Financial Corp. | 28,620 | 1,957,322 | |||
East West Bancorp, Inc. | 76,964 | 2,808,416 | |||
Fidelity Bankshares, Inc. | 30,600 | 1,000,620 | |||
First Bancorp/Puerto Rico | 110,514 | 1,371,479 | |||
First Midwest Bancorp, Inc. | 62,092 | 2,176,946 | |||
First Republic Bank | 31,416 | 1,162,706 | |||
FirstFed Financial Corp.(a) | 22,668 | 1,235,859 | |||
Flagstar Bancorp, Inc. | 47,745 | 687,528 | |||
| COMMON STOCKS (Continued) | Shares | Value (Note 2) | |||
Banks & Savings & Loans (cont’d.) | |||||
Franklin Bank Corp.(a) | 31,937 | $ | 574,547 | ||
Glacier Bancorp, Inc. | 42,969 | 1,291,218 | |||
Gold Banc Corp., Inc. | 52,233 | 951,685 | |||
Nara Bancorp, Inc. | 27,125 | 482,283 | |||
PrivateBancorp, Inc. | 23,803 | 846,673 | |||
Prosperity Bancshares, Inc. | 29,425 | 845,675 | |||
Provident Bankshares Corp. | 45,025 | 1,520,494 | |||
Republic Bancorp, Inc. | 102,803 | 1,223,356 | |||
Sterling Bancshares, Inc. | 62,088 | 958,639 | |||
Sterling Financial Corp. | 47,541 | 1,187,574 | |||
Susquehanna Bancshares, Inc. | 64,011 | 1,515,780 | |||
TrustCo Bank Corp. | 102,413 | 1,271,969 | |||
UCBH Holdings, Inc. | 127,392 | 2,277,769 | |||
Umpqua Holdings Corp. | 60,925 | 1,738,190 | |||
United Bankshares, Inc. | 50,711 | 1,787,056 | |||
Whitney Holding Corp. | 86,592 | 2,386,476 | |||
Wintrust Financial Corp. | 32,430 | 1,780,407 | |||
| 45,003,275 | |||||
Chemicals — 1.2% | |||||
A. Schulman, Inc. | 42,005 | 903,948 | |||
Arch Chemicals, Inc. | 32,366 | 967,743 | |||
Cambrex Corp. | 36,477 | 684,673 | |||
Georgia Gulf Corp. | 46,629 | 1,418,454 | |||
H.B. Fuller Co. | 39,755 | 1,274,943 | |||
MacDermid, Inc. | 34,304 | 957,082 | |||
OM Group, Inc.(a) | 39,499 | 741,001 | |||
Omnova Solutions, Inc.(a) | 56,149 | 269,515 | |||
Penford Corp. | 12,243 | 149,365 | |||
PolyOne Corp.(a) | 125,718 | 808,367 | |||
Quaker Chemical Corp. | 13,250 | 254,798 | |||
WD-40 Co. | 22,811 | 599,017 | |||
Wellman, Inc. | 23,528 | 159,520 | |||
| 9,188,426 | |||||
Collectibles & Gifts — 0.3% | |||||
Lennox International, Inc. | 77,573 | 2,187,559 | |||
Lenox Group, Inc.(a) | 18,977 | 251,255 | |||
| 2,438,814 | |||||
Commercial Services — 3.2% | |||||
ABM Industries, Inc. | 52,714 | 1,030,559 | |||
Arbitron, Inc. | 42,205 | 1,602,946 | |||
Bowne & Co, Inc. | 44,570 | 661,419 | |||
CCE Spinco, Inc.(a) | 93,800 | 1,228,780 | |||
Central Parking Corp. | 24,413 | 334,946 | |||
Chemed Corp. | 35,240 | 1,750,723 | |||
Coinstar, Inc.(a) | 37,447 | 854,915 | |||
Consolidated Graphics, Inc.(a) | 16,044 | 759,523 | |||
CPI Corp. | 9,336 | 174,677 | |||
Dendrite International, Inc.(a) | 59,353 | 855,277 | |||
eFunds Corp.(a) | 62,537 | 1,465,867 | |||
Gevity HR, Inc. | 37,637 | 968,024 | |||
Hooper Holmes, Inc. | 90,119 | 229,803 | |||
iPayment Holdings, Inc.(a) | 17,725 | 735,942 | |||
John H. Harland Co. | 38,509 | 1,447,938 | |||
Labor Ready, Inc.(a) | 72,882 | 1,517,403 | |||
MAXIMUS, Inc. | 26,046 | 955,628 | |||
MIVA, Inc.(a) | 38,090 | 188,546 | |||
SEE NOTES TO FINANCIAL STATEMENTS.
B75
| SMALL CAPITALIZATION STOCK PORTFOLIO (Continued) |
SCHEDULE OF INVESTMENTS | December 31, 2005 |
| COMMON STOCKS (Continued) | Shares | Value (Note 2) | |||
Commercial Services (cont’d.) | |||||
Mobile Mini, Inc.(a) | 20,829 | $ | 987,295 | ||
NCO Group, Inc.(a) | 43,991 | 744,328 | |||
On Assignment, Inc.(a) | 35,038 | 382,265 | |||
PAREXEL International Corp.(a) | 36,364 | 736,735 | |||
Pre-Paid Legal Services, Inc. | 13,969 | 533,755 | |||
Rewards Network, Inc.(a) | 28,600 | 183,040 | |||
SOURCECORP, Inc.(a) | 21,281 | 510,318 | |||
Sovran Self Storage, Inc. | 23,408 | 1,099,474 | |||
Startek, Inc. | 15,374 | 276,732 | |||
Vertrue, Inc.(a)(b) | 13,269 | 468,794 | |||
Viad Corp. | 30,708 | 900,666 | |||
Volt Information Sciences, Inc.(a) | 11,111 | 211,331 | |||
| 23,797,649 | |||||
Computer Services — 3.7% | |||||
Actel Corp.(a) | 34,657 | 441,184 | |||
Adaptec, Inc.(a) | 155,050 | 902,391 | |||
Agilysys, Inc. | 41,615 | 758,225 | |||
Avid Technology, Inc.(a)(b) | 56,982 | 3,120,310 | |||
Black Box Corp. | 23,632 | 1,119,684 | |||
CACI International, Inc. (Class “A” Stock)(a) | 41,241 | 2,366,409 | |||
Carreker Corp.(a) | 29,337 | 146,392 | |||
Cerner Corp.(a)(b) | 42,434 | 3,857,674 | |||
Ciber, Inc.(a) | 75,176 | 496,162 | |||
FactSet Research Systems, Inc. | 46,346 | 1,907,601 | |||
FileNet Corp.(a) | 56,993 | 1,473,269 | |||
Hutchinson Technology, Inc.(a) | 35,010 | 996,035 | |||
Insight Enterprises, Inc.(a) | 65,031 | 1,275,258 | |||
Manhattan Associates, Inc.(a) | 37,814 | 774,431 | |||
Mercury Computer Systems, Inc.(a)(b) | 29,043 | 599,157 | |||
MTS Systems Corp. | 27,024 | 936,111 | |||
Phoenix Technologies, Ltd.(a) | 34,096 | 213,441 | |||
Progress Software Corp.(a) | 54,323 | 1,541,687 | |||
Radiant Systems, Inc.(a) | 31,246 | 379,951 | |||
Standard Microsystems Corp.(a) | 28,656 | 822,141 | |||
Synaptics, Inc.(a) | 33,194 | 820,556 | |||
TALX Corp. | 29,180 | 1,333,818 | |||
Teledyne Technologies, Inc.(a) | 46,009 | 1,338,862 | |||
| 27,620,749 | |||||
Computers & Peripherals — 0.2% | |||||
Komag, Inc.(a) | 40,950 | 1,419,327 | |||
Construction — 3.5% | |||||
Coachmen Industries, Inc. | 19,382 | 228,901 | |||
Drew Industries, Inc.(a) | 20,537 | 578,938 | |||
ElkCorp | 24,840 | 836,114 | |||
Florida Rock Industries, Inc. | 64,578 | 3,168,197 | |||
Insituform Technologies, Inc. (Class “A” Stock)(a) | 36,795 | 712,719 | |||
M.D.C. Holdings, Inc.(b) | 44,592 | 2,763,812 | |||
M/I Homes, Inc. | 17,100 | 694,602 | |||
Meritage Homes Corp.(a)(b) | 31,444 | 1,978,456 | |||
NCI Building Systems, Inc.(a) | 29,000 | 1,231,920 | |||
NVR, Inc.(a)(b) | 7,248 | 5,088,095 | |||
Simpson Manufacturing Co., Inc. | 50,056 | 1,819,536 | |||
Standard Pacific Corp. | 93,861 | 3,454,085 | |||
| COMMON STOCKS (Continued) | Shares | Value (Note 2) | |||
Construction (cont’d.) | |||||
The Shaw Group, Inc.(a) | 108,165 | $ | 3,146,520 | ||
| 25,701,895 | |||||
Consumer Cyclical — 0.1% | |||||
Spectrum Brands, Inc.(a) | 50,709 | 1,029,900 | |||
Containers — 0.3% | |||||
AptarGroup, Inc. | 47,831 | 2,496,778 | |||
Cosmetics & Soaps | |||||
Nature’s Sunshine Products, Inc. | 16,072 | 290,582 | |||
Distribution/Wholesalers — 1.1% | |||||
Bell Microproducts, Inc. (Class “B” Stock)(a) | 40,815 | 312,235 | |||
Brightpoint, Inc.(a) | 37,575 | 1,041,955 | |||
Castle (A.M) & Co.(a) | 13,268 | 289,773 | |||
Peet’s Coffee & Tea, Inc.(a) | 19,225 | 583,479 | |||
ScanSource, Inc.(a) | 17,385 | 950,612 | |||
SCP Pool Corp. | 71,309 | 2,654,121 | |||
United Stationers, Inc.(a) | 44,283 | 2,147,726 | |||
| 7,979,901 | |||||
Diversified Financial Services — 0.1% | |||||
Portfolio Recovery Associates, Inc.(a)(b) | 21,500 | 998,460 | |||
Diversified Manufacturing Operations — 1.5% | |||||
Acuity Brands, Inc. | 61,488 | 1,955,318 | |||
Barnes Group, Inc. | 23,774 | 784,542 | |||
Ceradyne, Inc.(a) | 36,253 | 1,587,881 | |||
CLARCOR, Inc. | 70,994 | 2,109,232 | |||
Griffon Corp.(a)(b) | 35,499 | 845,231 | |||
Lydall, Inc.(a) | 22,115 | 180,237 | |||
Mueller Industries, Inc. | 50,109 | 1,373,989 | |||
Smith (A.O.) Corp. | 27,615 | 969,287 | |||
Standex International Corp. | 15,252 | 423,396 | |||
Valmont Industries, Inc. | 22,502 | 752,917 | |||
| 10,982,030 | |||||
Drugs & Medical Supplies — 5.5% | |||||
American Medical Systems Holdings, Inc.(a) | 95,019 | 1,694,189 | |||
ArthroCare Corp.(a)(b) | 34,281 | 1,444,601 | |||
Coherent, Inc.(a) | 42,582 | 1,263,834 | |||
CONMED Corp.(a) | 40,365 | 955,036 | |||
CryoLife, Inc.(a) | 29,358 | 98,056 | |||
Cyberonics, Inc.(a) | 29,804 | 962,669 | |||
Diagnostic Products Corp. | 32,203 | 1,563,456 | |||
Enzo Biochem, Inc.(a) | 37,387 | 464,347 | |||
Haemonetics Corp.(a) | 36,220 | 1,769,709 | |||
Holologic, Inc.(a) | 60,763 | 2,304,133 | |||
ICU Medical, Inc.(a) | 18,953 | 743,147 | |||
IDEXX Laboratories, Inc.(a)(b) | 43,899 | 3,159,850 | |||
Integra LifeSciences Holdings(a) | 23,800 | 843,948 | |||
Invacare Corp. | 43,408 | 1,366,918 | |||
Medicis Pharmaceutical Corp. (Class “A” Stock) | 74,425 | 2,385,321 | |||
NBTY, Inc.(a) | 76,270 | 1,239,388 | |||
Noven Pharmaceuticals, Inc.(a) | 32,263 | 488,139 | |||
Osteotech, Inc.(a) | 23,496 | 116,775 | |||
Owens & Minor, Inc. | 54,625 | 1,503,826 | |||
SEE NOTES TO FINANCIAL STATEMENTS.
B76
| SMALL CAPITALIZATION STOCK PORTFOLIO (Continued) |
SCHEDULE OF INVESTMENTS | December 31, 2005 |
| COMMON STOCKS (Continued) | Shares | Value (Note 2) | |||
Drugs & Medical Supplies (cont’d.) | |||||
PolyMedica Corp. | 33,129 | $ | 1,108,828 | ||
Possis Medical, Inc.(a) | 23,556 | 234,382 | |||
Regeneron Pharmaceuticals, Inc.(a) | 59,905 | 955,485 | |||
ResMed, Inc.(a) | 96,703 | 3,704,691 | |||
Respironics, Inc.(a) | 98,630 | 3,656,213 | |||
SFBC International, Inc.(a)(b) | 25,179 | 403,116 | |||
SurModics, Inc.(a)(b) | 21,319 | 788,590 | |||
Sybron Dental Specialties, Inc.(a) | 55,205 | 2,197,711 | |||
Viasys Healthcare, Inc.(a)(b) | 43,268 | 1,111,988 | |||
Vital Signs, Inc. | 7,793 | 333,696 | |||
Wilson Greatbatch Technologies, Inc.(a) | 29,554 | 768,700 | |||
| 39,630,742 | |||||
Electrical Equipment — 1.0% | |||||
ALLETE, Inc. | 41,129 | 1,809,676 | |||
Anixter International, Inc. | 44,523 | 1,741,740 | |||
Baldor Electric Co. | 38,544 | 988,654 | |||
C&D Technologies, Inc. | 34,755 | 264,833 | |||
Kulicke & Soffa Industries, Inc.(a) | 71,213 | 629,523 | |||
MagneTek, Inc.(a) | 39,707 | 129,048 | |||
Radisys Corp.(a) | 28,151 | 488,138 | |||
Technitrol, Inc. | 55,366 | 946,759 | |||
Vicor Corp. | 26,339 | 416,420 | |||
| 7,414,791 | |||||
Electronic Components — 1.6% | |||||
Bel Fuse, Inc. (Class “B” Stock) | 15,990 | 508,482 | |||
Cohu, Inc. | 30,262 | 692,092 | |||
CTS Corp. | 49,215 | 544,318 | |||
Cubic Corp. | 21,167 | 422,493 | |||
Cymer, Inc.(a)(b) | 48,914 | 1,736,936 | |||
Daktronics, Inc. | 21,429 | 633,656 | |||
DSP Group, Inc.(a) | 39,021 | 977,866 | |||
FLIR Systems, Inc.(a) | 94,858 | 2,118,179 | |||
Microsemi Corp.(a) | 85,704 | 2,370,573 | |||
Planar Systems, Inc.(a) | 20,174 | 168,856 | |||
Rogers Corp.(a) | 22,292 | 873,401 | |||
Supertex, Inc.(a) | 16,115 | 713,089 | |||
| 11,759,941 | |||||
Electronics — 2.4% | |||||
Analogic Corp. | 18,916 | 905,131 | |||
Artesyn Technologies, Inc.(a) | 54,484 | 561,185 | |||
Audiovox Corp.(a) | 26,657 | 369,466 | |||
Belden, Inc. | 59,285 | 1,448,333 | |||
Benchmark Electronics, Inc.(a)(b) | 57,453 | 1,932,144 | |||
Checkpoint Systems, Inc.(a) | 52,565 | 1,295,727 | |||
Dionex Corp.(a) | 27,451 | 1,347,295 | |||
EDO Corp. | 20,183 | 546,152 | |||
Electro Scientific Industries, Inc.(a) | 39,206 | 946,825 | |||
Esterline Technologies, Corp.(a) | 34,600 | 1,286,774 | |||
Intermagnetics General Corp.(a) | 35,216 | 1,123,390 | |||
Itron, Inc.(a)(b) | 33,960 | 1,359,758 | |||
Keithley Instruments, Inc. | 19,480 | 272,330 | |||
Littelfuse, Inc.(a) | 30,568 | 832,978 | |||
Methode Electronics, Inc. (Class “A” Stock) | 51,487 | 513,325 | |||
Park Electrochemical Corp. | 27,502 | 714,502 | |||
| COMMON STOCKS (Continued) | Shares | Value (Note 2) | |||
Electronics (cont’d.) | |||||
Photronics, Inc.(a) | 56,431 | $ | 849,851 | ||
SBS Technologies, Inc.(a) | 21,395 | 215,448 | |||
Sonic Solutions(a) | 33,856 | 511,564 | |||
Ultratech Stepper, Inc.(a) | 32,965 | 541,285 | |||
X-Rite, Inc. | 25,226 | 252,260 | |||
| 17,825,723 | |||||
Energy — 1.2% | |||||
Advanced Energy Industries, Inc.(a) | 40,021 | 473,448 | |||
Headwaters, Inc.(a)(b) | 57,368 | 2,033,122 | |||
UGI Corp. | 143,498 | 2,956,059 | |||
Unisource Energy Corp. | 47,467 | 1,480,970 | |||
Veritas DGC, Inc.(a)(b) | 47,824 | 1,697,274 | |||
| 8,640,873 | |||||
Engineering — 0.8% | |||||
EMCOR Group, Inc.(a) | 21,251 | 1,435,080 | |||
Engineered Support Systems, Inc. | 57,200 | 2,381,808 | |||
URS Corp.(a) | 58,995 | 2,218,802 | |||
| 6,035,690 | |||||
Environmental Services — 0.7% | |||||
Tetra Tech, Inc.(a) | 77,938 | 1,221,288 | |||
TETRA Technologies, Inc.(a) | 47,459 | 1,448,433 | |||
Waste Connections, Inc.(a) | 63,495 | 2,188,038 | |||
| 4,857,759 | |||||
Exchange Traded Fund — 0.7% | |||||
iShares S&P SmallCap 600 Index(b) | 93,594 | 5,409,732 | |||
Financial Services — 2.0% | |||||
Financial Federal Corp. | 24,019 | 1,067,645 | |||
Hudson United Bancorp | 60,876 | 2,537,312 | |||
Investment Technology Group, Inc.(a) | 57,768 | 2,047,298 | |||
Irwin Financial Corp. | 24,210 | 518,578 | |||
MAF Bancorp, Inc. | 37,734 | 1,561,433 | |||
Piper Jaffray Cos., Inc.(a) | 27,068 | 1,093,547 | |||
South Financial Group, Inc. (The) | 102,123 | 2,812,467 | |||
SWS Group, Inc. | 21,509 | 450,398 | |||
UICI | 47,937 | 1,702,243 | |||
World Acceptance Corp.(a) | 24,942 | 710,847 | |||
| 14,501,768 | |||||
Food & Beverage — 2.0% | |||||
American Italian Pasta Co. (Class “A” Stock)(b) | 25,197 | 171,340 | |||
Corn Products International, Inc. | 100,860 | 2,409,545 | |||
Flowers Foods, Inc. | 71,496 | 1,970,430 | |||
Hain Celestial Group, Inc.(a) | 50,522 | 1,069,046 | |||
Hansen Natural Corp.(a) | 17,300 | 1,363,413 | |||
J & J Snack Foods Corp. | 9,282 | 551,444 | |||
Lance, Inc. | 40,786 | 759,843 | |||
Nash-Finch Co. | 18,121 | 461,723 | |||
Performance Food Group Co.(a)(b) | 51,378 | 1,457,594 | |||
Ralcorp Holdings, Inc.(a) | 40,601 | 1,620,386 | |||
Sanderson Farms, Inc.(b) | 19,856 | 606,204 | |||
TreeHouse Foods, Inc.(a) | 42,450 | 794,664 | |||
United Natural Foods, Inc.(a) | 56,646 | 1,495,454 | |||
| 14,731,086 | |||||
SEE NOTES TO FINANCIAL STATEMENTS.
B77
| SMALL CAPITALIZATION STOCK PORTFOLIO (Continued) |
SCHEDULE OF INVESTMENTS | December 31, 2005 |
| COMMON STOCKS (Continued) | Shares | Value (Note 2) | |||
Furniture — 0.6% | |||||
Aaron Rents, Inc. | 61,472 | $ | 1,295,830 | ||
Bassett Furniture Industries, Inc. | 16,095 | 297,758 | |||
Ethan Allen Interiors, Inc. | 45,677 | 1,668,581 | |||
Interface, Inc.(a) | 65,573 | 539,010 | |||
La-Z-Boy, Inc.(b) | 70,630 | 957,743 | |||
| 4,758,922 | |||||
Gas Utilities — 0.2% | |||||
South Jersey Industries, Inc. | 39,223 | 1,142,958 | |||
Healthcare — 2.8% | |||||
Amedisys, Inc.(a)(b) | 21,623 | 913,356 | |||
American Healthways, Inc.(a)(b) | 46,270 | 2,093,718 | |||
ArQule, Inc.(a) | 48,250 | 295,290 | |||
Biolase Technology, Inc.(b) | 31,766 | 253,810 | |||
Cooper Companies, Inc. (The) | 60,466 | 3,101,906 | |||
Datascope Corp. | 16,858 | 557,157 | |||
Immucor, Inc.(a)(b) | 62,389 | 1,457,407 | |||
LCA-Vision, Inc. | 28,245 | 1,341,920 | |||
Mentor Corp. | 52,082 | 2,399,939 | |||
Merit Medical Systems, Inc.(a) | 37,078 | 450,127 | |||
NDCHealth Corp. | 49,544 | 952,731 | |||
Pharmaceutical Product Development, Inc. | 68,831 | 4,264,079 | |||
Sierra Health Services, Inc.(a)(b) | 35,009 | 2,799,320 | |||
Theragenics Corp.(a) | 43,630 | 131,763 | |||
| 21,012,523 | |||||
Healthcare Equipment & Supplies — 0.1% | |||||
Laserscope(a)(b) | 27,425 | 615,966 | |||
Hospitals/Healthcare Management — 2.0% | |||||
AMERIGROUP Corp.(a) | 70,472 | 1,371,385 | |||
AmSurg Corp.(a) | 40,577 | 927,590 | |||
Biosite, Inc.(a)(b) | 23,866 | 1,343,417 | |||
Centene Corp.(a) | 58,392 | 1,535,126 | |||
DJ Orthopedics, Inc.(a) | 29,874 | 823,925 | |||
Healthcare Services Group, Inc. | 36,781 | 761,735 | |||
Kensey Nash Corp.(a) | 13,676 | 301,282 | |||
Odyssey Healthcare, Inc.(a)(b) | 46,757 | 871,550 | |||
Pediatrix Medical Group, Inc.(a) | 33,857 | 2,998,714 | |||
RehabCare Group, Inc.(a) | 23,002 | 464,640 | |||
Sunrise Senior Living, Inc.(a)(b) | 49,142 | 1,656,577 | |||
United Surgical Partners International, Inc.(a) | 60,532 | 1,946,104 | |||
| 15,002,045 | |||||
Household Products — 0.2% | |||||
CNS, Inc. | 19,425 | 425,602 | |||
Playtex Products, Inc.(a) | 87,400 | 1,194,758 | |||
| 1,620,360 | |||||
Housing Related — 0.4% | |||||
Champion Enterprises, Inc.(a) | 103,836 | 1,414,246 | |||
Fleetwood Enterprises, Inc.(a)(b) | 86,869 | 1,072,832 | |||
National Presto Industries, Inc. | 6,467 | 286,811 | |||
Skyline Corp. | 9,343 | 340,085 | |||
| 3,113,974 | |||||
| COMMON STOCKS (Continued) | Shares | Value (Note 2) | |||
Human Resources — 0.7% | |||||
Administaff, Inc. | 30,878 | $ | 1,298,420 | ||
CDI Corp. | 17,040 | 466,896 | |||
Cross Country Healthcare, Inc.(a) | 28,584 | 508,224 | |||
Heidrick & Struggles International, Inc.(a) | 25,415 | 814,551 | |||
Spherion Corp.(a) | 81,577 | 816,586 | |||
Watson Wyatt & Co. Holdings | 57,680 | 1,609,272 | |||
| 5,513,949 | |||||
Instrument – Controls — 0.2% | |||||
FEI Co.(a) | 34,027 | 652,298 | |||
Woodward Governor Co. | 13,540 | 1,164,575 | |||
| 1,816,873 | |||||
Insurance — 2.9% | |||||
Delphi Financial Group, Inc. | 39,266 | 1,806,629 | |||
Fremont General Corp. | 89,429 | 2,077,436 | |||
Hilb, Rogal & Hamilton Co. | 48,953 | 1,885,180 | |||
Infinity Property & Casualty Corp. | 28,300 | 1,053,043 | |||
LandAmerica Financial Group, Inc. | 23,901 | 1,491,422 | |||
Philadelphia Consolidated Holding Corp.(a) | 25,227 | 2,439,199 | |||
Presidential Life Corp. | 29,342 | 558,672 | |||
ProAssurance Corp.(a) | 42,571 | 2,070,653 | |||
RLI Corp. | 29,333 | 1,462,837 | |||
SCPIE Holdings, Inc.(a) | 13,668 | 284,294 | |||
Selective Insurance Group, Inc. | 38,590 | 2,049,129 | |||
Stewart Information Services Corp. | 24,801 | 1,207,065 | |||
United Fire & Casualty Co. | 23,255 | 940,200 | |||
Zenith National Insurance Corp. | 49,826 | 2,297,952 | |||
| 21,623,711 | |||||
Internet — 1.0% | |||||
Blue Coat Systems, Inc.(a) | 17,700 | 809,244 | |||
Digital Insight Corp.(a)(b) | 47,101 | 1,508,174 | |||
InfoSpace, Inc.(a) | 37,750 | 974,705 | |||
Internet Security Systems, Inc.(a) | 52,838 | 1,106,956 | |||
Napster, Inc.(a) | 59,979 | 211,126 | |||
Secure Computing Corp.(a) | 50,466 | 618,713 | |||
Websense, Inc.(a)(b) | 32,605 | 2,140,192 | |||
| 7,369,110 | |||||
Leisure — 1.8% | |||||
Aztar Corp.(a)(b) | 48,926 | 1,486,861 | |||
Bally Total Fitness Holding Corp.(a) | 46,537 | 292,252 | |||
JAKKS Pacific, Inc.(a) | 36,828 | 771,178 | |||
K2, Inc.(a) | 64,140 | 648,455 | |||
Marcus Corp. | 29,463 | 692,381 | |||
Multimedia Games, Inc.(a)(b) | 37,077 | 342,962 | |||
Nautilus Group, Inc. (The)(b) | 45,703 | 852,818 | |||
Pinnacle Entertainment, Inc.(a)(b) | 55,390 | 1,368,687 | |||
Polaris Industries, Inc.(b) | 56,892 | 2,855,978 | |||
Shuffle Master, Inc.(a)(b) | 47,629 | 1,197,393 | |||
Sturm Ruger & Co., Inc. | 29,416 | 206,206 | |||
Winnebago Industries, Inc. | 44,967 | 1,496,502 | |||
WMS Industries, Inc.(a)(b) | 31,171 | 782,080 | |||
| 12,993,753 | |||||
SEE NOTES TO FINANCIAL STATEMENTS.
B78
| SMALL CAPITALIZATION STOCK PORTFOLIO (Continued) |
SCHEDULE OF INVESTMENTS | December 31, 2005 |
| COMMON STOCKS (Continued) | Shares | Value (Note 2) | |||
Machinery — 3.9% | |||||
Albany International Corp. (Class “A” Stock) | 44,118 | $ | 1,595,307 | ||
Applied Industrial Technologies, Inc. | 33,988 | 1,145,056 | |||
Astec Industries, Inc.(a) | 23,910 | 780,901 | |||
ASV, Inc.(a)(b) | 24,200 | 604,516 | |||
Cognex Corp. | 64,727 | 1,947,635 | |||
Dril-Quip, Inc(a) | 10,988 | 518,634 | |||
EnPro Industries, Inc.(a) | 29,037 | 782,547 | |||
Gardner Denver, Inc.(a) | 35,528 | 1,751,530 | |||
IDEX Corp. | 71,576 | 2,942,489 | |||
JLG Industries, Inc. | 70,695 | 3,227,934 | |||
Lindsay Manufacturing Co. | 15,743 | 302,738 | |||
Manitowoc Co., Inc. | 41,372 | 2,077,702 | |||
Paxar Corp.(a) | 49,851 | 978,575 | |||
Photon Dynamics, Inc.(a) | 23,152 | 423,219 | |||
Regal-Beloit Corp. | 41,869 | 1,482,163 | |||
Robbins & Myers, Inc. | 15,796 | 321,449 | |||
Roper Industries, Inc. | 117,359 | 4,636,853 | |||
Stewart & Stevenson Services, Co. | 40,011 | 845,432 | |||
Toro Co. | 57,507 | 2,517,081 | |||
| 28,881,761 | |||||
Media — 0.1% | |||||
4Kids Entertainment, Inc.(a) | 17,315 | 271,672 | |||
Thomas Nelson, Inc. | 14,965 | 368,887 | |||
| 640,559 | |||||
Metals – Ferrous — 2.6% | |||||
Aleris International, Inc.(a) | 42,482 | 1,369,620 | |||
Carpenter Technology Corp. | 29,916 | 2,108,181 | |||
Century Aluminum Co.(a)(b) | 31,220 | 818,276 | |||
Chaparral Steel Co.(a) | 31,226 | 944,587 | |||
Cleveland-Cliffs, Inc.(b) | 30,038 | 2,660,466 | |||
Commercial Metals Co. | 79,686 | 2,991,412 | |||
Kaydon Corp.(b) | 38,493 | 1,237,165 | |||
Material Sciences Corp.(a) | 17,420 | 245,622 | |||
Maverick Tube Corp.(a)(b) | 58,999 | 2,351,700 | |||
Quanex Corp. | 34,622 | 1,730,061 | |||
Reliance Steel & Aluminum Co. | 37,926 | 2,318,037 | |||
Steel Technologies, Inc. | 15,249 | 426,820 | |||
| 19,201,947 | |||||
Metals – Non Ferrous — 0.3% | |||||
Brush Engineered Materials, Inc.(a) | 26,270 | 417,693 | |||
RTI International Metal, Inc.(a) | 31,503 | 1,195,539 | |||
Ryerson Tull, Inc.(b) | 34,500 | 839,040 | |||
Wolverine Tube, Inc.(a) | 20,538 | 103,922 | |||
| 2,556,194 | |||||
Mineral Resources — 0.6% | |||||
AMCOL International Corp. | 30,135 | 618,370 | |||
Massey Energy Corp. | 105,234 | 3,985,211 | |||
| 4,603,581 | |||||
Miscellaneous Basic Industry — 1.4% | |||||
Apogee Enterprises, Inc. | 38,121 | 618,323 | |||
Armor Holdings, Inc.(a) | 40,657 | 1,734,021 | |||
Briggs & Stratton Corp. | 70,833 | 2,747,612 | |||
Lawson Products, Inc. | 6,303 | 237,875 | |||
| COMMON STOCKS (Continued) | Shares | Value (Note 2) | |||
Miscellaneous Basic Industry (cont’d.) | |||||
Libbey, Inc. | 19,082 | $ | 195,018 | ||
Meade Instruments Corp.(a) | 23,176 | 63,270 | |||
Texas Industries, Inc. | 31,456 | 1,567,767 | |||
Tredegar Industries, Inc. | 38,003 | 489,859 | |||
Watsco, Inc. | 32,513 | 1,944,603 | |||
Watts Water Technologies (Class “A” Stock) | 34,880 | 1,056,515 | |||
| 10,654,863 | |||||
Miscellaneous Consumer Growth/Staple — 0.4% | |||||
Hughes Supply, Inc. | 91,541 | 3,281,745 | |||
Networking — 0.3% | |||||
Aeroflex, Inc.(a) | 102,121 | 1,097,801 | |||
C-COR.net Corp.(a) | 65,408 | 317,883 | |||
NETGEAR, Inc.(a) | 45,025 | 866,731 | |||
| 2,282,415 | |||||
Office Equipment & Supplies — 0.2% | |||||
Global Imaging Systems, Inc.(a) | 31,844 | 1,102,758 | |||
Standard Register Co. (The) | 17,289 | 273,339 | |||
| 1,376,097 | |||||
Oil & Gas — 4.9% | |||||
Cabot Oil & Gas Corp. (Class “A” Stock) | 67,056 | 3,024,226 | |||
Cascade Natural Gas Corp. | 15,574 | 303,849 | |||
Cimarex Energy Co.(a)(b) | 112,766 | 4,850,065 | |||
Frontier Oil Corp.(b) | 77,378 | 2,903,996 | |||
Laclede Group, Inc. (The) | 28,994 | 846,915 | |||
Lone Star Technologies, Inc.(a) | 41,889 | 2,163,986 | |||
Northwest Natural Gas Co. | 37,734 | 1,289,748 | |||
Penn Virginia Corp. | 25,455 | 1,461,117 | |||
Petroleum Development Corp.(a) | 22,733 | 757,918 | |||
Piedmont Natural Gas Co., Inc.(b) | 104,747 | 2,530,688 | |||
Remington Oil & Gas Corp.(a) | 32,221 | 1,176,067 | |||
Southern Union Co. | 133,884 | 3,163,681 | |||
Southwest Gas Corp. | 53,560 | 1,413,984 | |||
Swift Energy Co.(a)(b) | 39,302 | 1,771,341 | |||
Unit Corp.(a) | 63,114 | 3,473,163 | |||
Vintage Petroleum, Inc. | 75,443 | 4,023,374 | |||
| 35,154,118 | |||||
Oil & Gas Services — 3.8% | |||||
Atwood Oceanics, Inc.(a) | 18,194 | 1,419,678 | |||
Cal Dive International, Inc.(a)(b) | 106,354 | 3,817,044 | |||
CARBO Ceramics, Inc. | 27,003 | 1,526,210 | |||
Energen Corp. | 100,228 | 3,640,280 | |||
Hydril Co.(a)(b) | 26,879 | 1,682,625 | |||
Input/Output, Inc.(a)(b) | 95,969 | 674,662 | |||
Lufkin Industries, Inc. | 20,000 | 997,400 | |||
New Jersey Resources Corp. | 37,716 | 1,579,923 | |||
NS Group, Inc.(a) | 30,800 | 1,287,748 | |||
Oceaneering International, Inc.(a) | 36,617 | 1,822,794 | |||
Offshore Logistics, Inc.(a) | 31,844 | 929,845 | |||
SEACOR Holdings, Inc.(a) | 28,439 | 1,936,696 | |||
St. Mary Land & Exploration Co. | 77,353 | 2,847,364 | |||
Stone Energy Corp.(a) | 36,845 | 1,677,553 | |||
W-H Energy Services, Inc.(a) | 39,039 | 1,291,410 | |||
SEE NOTES TO FINANCIAL STATEMENTS.
B79
| SMALL CAPITALIZATION STOCK PORTFOLIO (Continued) |
SCHEDULE OF INVESTMENTS | December 31, 2005 |
| COMMON STOCKS (Continued) | Shares | Value (Note 2) | |||
Oil & Gas Services (cont’d.) | |||||
World Fuel Services Corp. | 37,445 | $ | 1,262,645 | ||
| 28,393,877 | |||||
Paper & Forest Products — 1.0% | |||||
Brady Corp. | 67,304 | 2,435,059 | |||
Buckeye Technologies, Inc.(a) | 45,172 | 363,635 | |||
Caraustar Industries, Inc.(a) | 39,320 | 341,691 | |||
Chesapeake Corp. | 26,863 | 456,134 | |||
Neenah Paper, Inc. | 20,227 | 566,356 | |||
Pope & Talbot, Inc. | 22,309 | 185,834 | |||
Rock-Tenn Co. (Class “A” Stock) | 42,570 | 581,081 | |||
Schwitzer-Manduit International, Inc. | 20,826 | 516,068 | |||
Universal Forest Products, Inc. | 22,102 | 1,221,136 | |||
Wausau-Mosinee Paper Corp. | 70,178 | 831,609 | |||
| 7,498,603 | |||||
Pharmaceuticals — 0.8% | |||||
Alpharma, Inc. (Class “A” Stock) | 57,067 | 1,626,980 | |||
Bradley Pharmaceuticals, Inc.(a)(b) | 19,026 | 180,747 | |||
Connetics Corp.(a) | 48,174 | 696,114 | |||
Gentiva Health Services, Inc.(a) | 31,288 | 461,185 | |||
MGI Pharma, Inc.(a)(b) | 105,939 | 1,817,913 | |||
Savient Pharmaceuticals, Inc.(a) | 83,076 | 310,704 | |||
USANA Health Sciences, Inc.(a)(b) | 13,725 | 526,491 | |||
| 5,620,134 | |||||
Real Estate Investment Trusts — 3.2% | |||||
Acadia Realty Trust | 43,074 | 863,634 | |||
Colonial Properties Trust | 61,335 | 2,574,843 | |||
Commercial Net Lease Realty | 74,108 | 1,509,580 | |||
EastGroup Properties, Inc. | 30,125 | 1,360,445 | |||
Entertainment Properties Trust | 35,466 | 1,445,240 | |||
Essex Property Trust, Inc. | 31,308 | 2,886,598 | |||
Glenborough Realty Trust, Inc. | 47,539 | 860,456 | |||
Kilroy Realty Corp. | 39,552 | 2,448,269 | |||
Lexington Corporate Properties Trust | 71,039 | 1,513,131 | |||
New Century Financial Corp. | 77,343 | 2,789,762 | |||
Parkway Properties, Inc. | 19,373 | 777,632 | |||
Shurgard Storage Centers, Inc. (Class “A” Stock) | 64,237 | 3,642,879 | |||
Town and Country Trust (The)(b) | 24,100 | 814,821 | |||
| 23,487,290 | |||||
Restaurants — 2.2% | |||||
CEC Entertainment, Inc.(a) | 46,683 | 1,589,089 | |||
IHOP Corp. | 25,761 | 1,208,449 | |||
Jack in the Box, Inc.(a) | 48,787 | 1,704,130 | |||
Landry’s Restaurants, Inc. | 22,748 | 607,599 | |||
Lone Star Steakhouse & Saloon, Inc. | 24,604 | 584,099 | |||
O’Charley’s, Inc.(a) | 30,574 | 474,203 | |||
P.F. Chang’s China Bistro, Inc.(a)(b) | 36,102 | 1,791,742 | |||
Papa John’s International, Inc.(a) | 16,294 | 966,397 | |||
RARE Hospitality International, Inc.(a) | 45,596 | 1,385,662 | |||
Red Robin Gourmet Burgers, Inc.(a) | 19,840 | 1,011,046 | |||
Ryan’s Restaurant Group, Inc.(a) | 57,358 | 691,737 | |||
Sonic Corp.(a) | 81,196 | 2,395,282 | |||
Steak n Shake Co. (The)(a) | 38,078 | 645,422 | |||
Triarc Companies., Inc. (Class “B” Stock) | 74,218 | 1,102,137 | |||
| 16,156,994 | |||||
| COMMON STOCKS (Continued) | Shares | Value (Note 2) | |||
Retail — 6.2% | |||||
Arctic Cat, Inc. | 17,433 | $ | 349,706 | ||
Brown Shoe Co., Inc. | 25,225 | 1,070,297 | |||
Building Materials Holdings Corp. | 19,730 | 1,345,783 | |||
Burlington Coat Factory Warehouse Corp. | 22,628 | 909,872 | |||
Caseys Gen. Stores, Inc. | 68,880 | 1,708,224 | |||
Cash America International, Inc. | 39,983 | 927,206 | |||
Cato Corp. (The) (Class “A” Stock) | 42,571 | 913,148 | |||
Children’s Place Retail Stores, Inc. (The)(a) | 29,265 | 1,446,276 | |||
Christopher & Banks Corp. | 49,185 | 923,694 | |||
Cost Plus, Inc.(a) | 30,160 | 517,244 | |||
Dress Barn, Inc.(a) | 30,837 | 1,190,617 | |||
Fred’s, Inc. | 54,439 | 885,723 | |||
Great Atlantic & Pacific Tea Co., Inc.(a)(b) | 24,553 | 780,294 | |||
Group 1 Automotive, Inc.(a) | 29,441 | 925,331 | |||
Guitar Center, Inc.(a)(b) | 35,602 | 1,780,456 | |||
Gymboree Corp. (The)(a) | 43,323 | 1,013,758 | |||
Hancock Fabrics, Inc.(b) | 26,104 | 106,243 | |||
Haverty Furniture Companies, Inc. | 30,624 | 394,743 | |||
Hibbett Sporting Goods, Inc.(a) | 48,844 | 1,391,077 | |||
Hot Topic, Inc.(a) | 61,314 | 873,725 | |||
J. Jill Group, Inc.(a) | 27,806 | 529,148 | |||
Jo-Ann Stores, Inc.(a) | 32,024 | 377,883 | |||
Jos. A. Bank Clothiers, Inc.(a)(b) | 16,300 | 707,583 | |||
K-Swiss, Inc. | 35,480 | 1,150,971 | |||
Linens ‘n Things, Inc.(a) | 62,094 | 1,651,700 | |||
Longs Drug Stores Corp. | 36,414 | 1,325,105 | |||
Marinemax, Inc.(a) | 21,437 | 676,766 | |||
Men’s Wearhouse, Inc. (The)(a) | 72,271 | 2,127,658 | |||
Movie Gallery, Inc.(b) | 35,294 | 197,999 | |||
Panera Bread Co. (Class “A” Stock)(a) | 42,607 | 2,798,428 | |||
Pep Boys – Manny, Moe & Jack | 74,094 | 1,103,260 | |||
Quiksilver, Inc.(a) | 160,391 | 2,219,811 | |||
Russ Berrie & Co., Inc. | 16,221 | 185,244 | |||
School Specialty, Inc.(a) | 31,374 | 1,143,269 | |||
Select Comfort Corp.(a)(b) | 48,092 | 1,315,316 | |||
Stage Stores, Inc. | 36,228 | 1,078,870 | |||
Stein Mart, Inc. | 36,425 | 661,114 | |||
Stride Rite Corp. | 49,534 | 671,681 | |||
Too, Inc.(a) | 45,520 | 1,284,119 | |||
Tractor Supply Co.(a) | 45,803 | 2,424,811 | |||
Zale Corp.(a) | 66,886 | 1,682,183 | |||
| 44,766,336 | |||||
Semiconductors — 1.4% | |||||
ATMI, Inc.(a) | 51,646 | 1,444,539 | |||
Axcelis Technologies, Inc.(a) | 137,524 | 655,989 | |||
Brooks Automation, Inc.(a) | 101,886 | 1,276,626 | |||
ESS Technology, Inc.(a) | 48,425 | 166,098 | |||
Exar Corp.(a) | 48,158 | 602,938 | |||
Kopin Corp.(a) | 94,074 | 503,296 | |||
Pericom Semiconductor Corp.(a) | 35,888 | 286,027 | |||
Power Integrations, Inc.(a) | 40,394 | 961,781 | |||
Rudolph Technologies, Inc.(a) | 19,448 | 250,490 | |||
Skyworks Solutions, Inc.(a) | 216,672 | 1,102,860 | |||
Varian Semiconductor Equipment Associates, Inc.(a) | 51,717 | 2,271,928 | |||
SEE NOTES TO FINANCIAL STATEMENTS.
B80
| SMALL CAPITALIZATION STOCK PORTFOLIO (Continued) |
SCHEDULE OF INVESTMENTS | December 31, 2005 |
| COMMON STOCKS (Continued) | Shares | Value (Note 2) | |||
Semiconductors (cont’d.) | |||||
Veeco Instruments, Inc.(a) | 36,528 | $ | 633,030 | ||
| 10,155,602 | |||||
Software — 3.3% | |||||
Altiris, Inc.(a) | 31,698 | 535,379 | |||
ANSYS, Inc.(a) | 43,761 | 1,868,157 | |||
Captaris, Inc.(a) | 38,843 | 143,331 | |||
Catapult Communications Corp.(a) | 14,000 | 207,060 | |||
EPIQ Systems, Inc.(a) | 17,466 | 323,820 | |||
Gerber Scientific, Inc.(a) | 30,476 | 291,655 | |||
Global Payments, Inc. | 90,053 | 4,197,369 | |||
Hyperion Solutions Corp.(a) | 81,381 | 2,915,067 | |||
Inter-Tel, Inc. | 28,681 | 561,287 | |||
JDA Software Group, Inc.(a) | 39,388 | 669,990 | |||
Keane, Inc.(a) | 62,150 | 684,272 | |||
ManTech International Corp. (Class “A” Stock)(a) | 24,471 | 681,762 | |||
Mapinfo Corp.(a) | 28,270 | 356,485 | |||
MICROS Systems, Inc.(a) | 52,496 | 2,536,607 | |||
MRO Software, Inc.(a) | 29,429 | 413,183 | |||
Open Solutions, Inc.(a) | 27,200 | 623,424 | |||
PC-Tel, Inc.(a) | 29,187 | 255,678 | |||
Quality Systems, Inc. | 11,250 | 863,550 | |||
SERENA Software, Inc.(b) | 39,552 | 927,099 | |||
SPSS, Inc.(a) | 22,184 | 686,151 | |||
Take-Two Interactive Software, Inc.(a)(b) | 96,947 | 1,715,962 | |||
THQ, Inc.(a)(b) | 86,160 | 2,054,916 | |||
WebEx Communications, Inc.(a) | 47,474 | 1,026,863 | |||
| 24,539,067 | |||||
Supermarkets — 0.2% | |||||
Kronos, Inc.(a)(b) | 43,575 | 1,824,050 | |||
Telecommunications — 1.1% | |||||
Applied Signal Technology, Inc. | 15,635 | 354,915 | |||
Commonwealth Telephone Enterprises, Inc. | 29,891 | 1,009,419 | |||
Comtech Telecommunications Corp.(a) | 27,631 | 843,851 | |||
Digi International, Inc.(a) | 28,118 | 294,958 | |||
Ditech Communications Corp.(a) | 44,150 | 368,653 | |||
General Communication, Inc. (Class “A’ Stock)(a) | 64,290 | 664,116 | |||
Harmonic Inc.(a) | 100,662 | 488,211 | |||
Intrado, Inc.(a) | 24,360 | 560,767 | |||
J2 Global Communications, Inc.(a)(b) | 33,886 | 1,448,288 | |||
Network Equipment Technologies, Inc.(a) | 33,612 | 147,893 | |||
Novatel Wireless, Inc.(a)(b) | 40,045 | 484,945 | |||
Symmetricom, Inc.(a) | 63,158 | 534,948 | |||
Tollgrade Communications, Inc.(a) | 17,921 | 195,877 | |||
ViaSat, Inc.(a) | 30,771 | 822,509 | |||
| 8,219,350 | |||||
Textiles — 0.5% | |||||
Angelica Corp. | 12,647 | 209,181 | |||
Ashworth, Inc.(a) | 19,112 | 161,496 | |||
G & K Services, Inc. (Class “A” Stock) | 28,908 | 1,134,639 | |||
Kellwood Co. | 38,062 | 908,921 | |||
Oxford Industries, Inc. | 19,428 | 1,062,712 | |||
| 3,476,949 | |||||
| COMMON STOCKS (Continued) | Shares | Value (Note 2) | ||||
Timber — 0.1% | ||||||
Deltic Timber Corp. | 16,822 | $ | 872,389 | |||
Tobacco — 0.1% | ||||||
Alliance One International, Inc. | 119,193 | 464,853 | ||||
Transportation — 0.9% | ||||||
EGL, Inc.(a) | 44,571 | 1,674,532 | ||||
HUB Group, Inc.(a) | 27,637 | 976,968 | ||||
Kansas City Southern Industries, Inc.(a)(b) | 101,241 | 2,473,318 | ||||
Old Dominion Freight Line, Inc.(a) | 38,775 | 1,046,150 | ||||
Pegasus Solutions, Inc.(a) | 24,147 | 216,599 | ||||
| 6,387,567 | ||||||
Trucking/Shipping — 2.2% | ||||||
Arkansas Best Corp. | 34,560 | 1,509,581 | ||||
Forward Air Corp. | 42,762 | 1,567,227 | ||||
Heartland Express, Inc. | 61,573 | 1,249,316 | ||||
Kirby Corp.(a) | 35,126 | 1,832,523 | ||||
Knight Transportation, Inc. | 78,296 | 1,623,066 | ||||
Landstar System, Inc. | 80,063 | 3,341,830 | ||||
Monaco Coach Corp. | 36,331 | 483,202 | ||||
Oshkosh Truck Corp. (Class “B” Stock) | 100,412 | 4,477,370 | ||||
| 16,084,115 | ||||||
Utilities – Electric — 1.2% | ||||||
Atmos Energy Corp. | 110,320 | 2,885,971 | ||||
Avista Corp. | 66,357 | 1,175,182 | ||||
Central Vermont Public Service Corp. | 16,785 | 302,298 | ||||
CH Energy Group, Inc. | 18,609 | 854,153 | ||||
Cleco Corp. | 68,332 | 1,424,722 | ||||
EL Paso Electric Co.(a) | 65,619 | 1,380,624 | ||||
Green Mountain Power Corp. | 7,136 | 205,303 | ||||
UIL Holdings Corp. | 17,761 | 816,828 | ||||
| 9,045,081 | ||||||
Utility – Water — 0.1% | ||||||
American States Water Co. | 22,935 | 706,398 | ||||
TOTAL LONG-TERM INVESTMENTS | 730,596,815 | |||||
| SHORT-TERM INVESTMENTS — 14.8% | ||||||
Mutual Fund | ||||||
Dryden Core Investment Fund — Taxable Money Market Series (includes $101,040,779 of cash collateral received for securities on loan) (Note 4)(c)(d) | 109,179,634 | 109,179,634 | ||||
Principal Amount (000) | ||||||
U.S. Government & Agency Obligations | ||||||
United States Treasury Bills(e)(f) 3.82% 3/16/06 | $350 | 347,263 | ||||
TOTAL SHORT-TERM INVESTMENTS | 109,526,897 | |||||
TOTAL INVESTMENTS — 113.8% | 840,123,712 | |||||
LIABILITIES IN EXCESS OF | (101,791,403 | ) | ||||
NET ASSETS — 100.0% | $ | 738,332,309 | ||||
SEE NOTES TO FINANCIAL STATEMENTS.
B81
| SMALL CAPITALIZATION STOCK PORTFOLIO (Continued) |
SCHEDULE OF INVESTMENTS | December 31, 2005 |
The following abbreviation is used in the portfolio description:
| ADR | American Depositary Receipt |
| (a) | Non-income producing security. |
| (b) | All or a portion of security is on loan. The aggregate market value of such securities is $96,200,779; cash collateral of $101,040,779 (included in liabilities) was received with which the Portfolio purchased highly liquid short-term investments. |
| (c) | Represents security, or a portion thereof, purchased with cash collateral received for securities on loan. |
| (d) | Prudential Investments LLC, the manager of the Portfolio, also serves as manager of the Dryden Core Investment Fund-Taxable Money Market Series. |
| (e) | Security segregated as collateral for futures contracts. |
| (f) | Rate quoted represents yield-to-maturity as of purchase date. |
| (g) | Liabilities in excess of other assets include net unrealized depreciation on financial futures as follows: |
| Open future contracts outstanding at December 31, 2005: |
| Number of Contracts | Type | Expiration Date | Value at Trade Date | Value at December 31, 2005 | Unrealized Depreciation | |||||||||
| Long Positions: | ||||||||||||||
| 22 | S&P MidCap 400 Index | Mar-06 | $ | 8,227,600 | $ | 8,175,200 | $ | (52,400 | ) | |||||
The industry classification of portfolio holdings and liabilities in excess of other assets shown as a percentage of net assets as of December 31, 2005 was as follows:
Mutual Fund (including 13.7% of collateral received for securities on loan) | 14.8 | % | |
Banks & Savings & Loans | 6.2 | ||
Retail | 6.2 | ||
Drugs & Medical Supplies | 5.5 | ||
Oil & Gas | 4.9 | ||
Machinery | 3.9 | ||
Oil & Gas Services | 3.8 | ||
Computer Services | 3.7 | ||
Construction | 3.5 | ||
Software | 3.3 | ||
Commercial Services | 3.2 | ||
Real Estate Investment Trusts | 3.2 | ||
Insurance | 2.9 | ||
Healthcare | 2.8 | ||
Metals — Ferrous | 2.6 | ||
Electronics | 2.4 | ||
Restaurants | 2.2 | ||
Trucking/Shipping | 2.2 | ||
Financial Services | 2.0 | ||
Food & Beverage | 2.0 | ||
Hospitals/Healthcare Management | 2.0 | ||
Leisure | 1.8 | ||
Electronic Components | 1.6 | ||
Aerospace | 1.5 | ||
Diversified Manufacturing Operations | 1.5 | ||
Miscellaneous Basic Industry | 1.4 | ||
Semiconductors | 1.4 | ||
Chemicals | 1.2 | ||
Energy | 1.2 | ||
Utilities — Electric | 1.2 | ||
Distribution/Wholesalers | 1.1 | ||
Telecommunications | 1.1 | ||
Apparel | 1.0 | ||
Electrical Equipment | 1.0 | ||
Internet | 1.0 | ||
Paper & Forest Products | 1.0 |
Transportation | 0.9 | % | |
Engineering | 0.8 | ||
Pharmaceuticals | 0.8 | ||
Environmental Services | 0.7 | ||
Exchange Traded Fund | 0.7 | ||
Human Resources | 0.7 | ||
Furniture | 0.6 | ||
Mineral Resources | 0.6 | ||
Autos Cars & Trucks | 0.5 | ||
Textiles | 0.5 | ||
Airlines | 0.4 | ||
Housing Related | 0.4 | ||
Miscellaneous Consumer Growth/Staple | 0.4 | ||
Collectibles & Gifts | 0.3 | ||
Containers | 0.3 | ||
Metals Non Ferrous | 0.3 | ||
Networking | 0.3 | ||
Advertising | 0.2 | ||
Agricultural Products & Services | 0.2 | ||
Computers & Peripherals | 0.2 | ||
Gas Utilities | 0.2 | ||
Household Products | 0.2 | ||
Instrument — Controls | 0.2 | ||
Office Equipment & Supplies | 0.2 | ||
Supermarkets | 0.2 | ||
Consumer Cyclical | 0.1 | ||
Diversified Financial Services | 0.1 | ||
Healthcare Equipment & Supplies | 0.1 | ||
Media | 0.1 | ||
Timber | 0.1 | ||
Tobacco | 0.1 | ||
Utility — Water | 0.1 | ||
| 113.8 | |||
Liabilities in excess of other assets | (13.8 | ) | |
| 100.0 | % | ||
SEE NOTES TO FINANCIAL STATEMENTS.
B82
| STOCK INDEX PORTFOLIO |
SCHEDULE OF INVESTMENTS | December 31, 2005 |
| LONG-TERM INVESTMENTS — 98.0% | Value (Note 2) | ||||
| COMMON STOCKS | Shares | ||||
Advertising — 0.1% | |||||
Omnicom Group, Inc. | 51,800 | $ | 4,409,734 | ||
Aerospace — 1.9% | |||||
Boeing Co. | 231,836 | 16,284,161 | |||
General Dynamics Corp. | 57,500 | 6,557,875 | |||
L-3 Communications Holdings, Inc. | 31,700 | 2,356,895 | |||
Lockheed Martin Corp. | 110,398 | 7,024,625 | |||
Northrop Grumman Corp. | 107,526 | 6,463,388 | |||
Raytheon Co. | 128,318 | 5,151,968 | |||
Rockwell Collins, Inc. | 49,100 | 2,281,677 | |||
United Technologies Corp. | 286,100 | 15,995,851 | |||
| 62,116,440 | |||||
Airlines — 0.1% | |||||
Southwest Airlines Co. | 190,037 | 3,122,308 | |||
Apparel — 0.2% | |||||
Jones Apparel Group, Inc. | 37,400 | 1,148,928 | |||
NIKE, Inc. (Class “B” Stock) | 54,100 | 4,695,339 | |||
Reebok International, Ltd. | 11,000 | 640,530 | |||
| 6,484,797 | |||||
Autos – Cars & Trucks — 0.7% | |||||
Cummins, Inc. | 12,400 | 1,112,652 | |||
Dana Corp. | 37,894 | 272,079 | |||
Ford Motor Co.(b) | 519,345 | 4,009,343 | |||
General Motors Corp.(b) | 160,800 | 3,122,736 | |||
Genuine Parts Co. | 49,225 | 2,161,962 | |||
Harley-Davidson, Inc.(b) | 81,500 | 4,196,435 | |||
Johnson Controls, Inc. | 54,100 | 3,944,431 | |||
Navistar International Corp.(a) | 22,900 | 655,398 | |||
PACCAR, Inc. | 51,435 | 3,560,845 | |||
| 23,035,881 | |||||
Banks and Savings & Loans — 6.4% | |||||
AmSouth Bancorporation(b) | 104,300 | 2,733,703 | |||
Bank of New York Co., Inc. | 218,700 | 6,965,595 | |||
BankAmerica Corp.(b) | 1,134,412 | 52,353,113 | |||
Capital One Financial Corp. | 80,000 | 6,912,000 | |||
Comerica, Inc. | 49,750 | 2,823,810 | |||
Compass Bancshares, Inc. | 33,800 | 1,632,202 | |||
Fifth Third Bancorp | 151,549 | 5,716,428 | |||
First Horizon National Corp. | 35,900 | 1,379,996 | |||
Golden West Financial Corp.(b) | 72,500 | 4,785,000 | |||
Huntington Bancshares, Inc. | 60,875 | 1,445,781 | |||
KeyCorp | 118,500 | 3,902,205 | |||
M&T Bank Corp. | 25,600 | 2,791,680 | |||
Mellon Financial Corp. | 116,100 | 3,976,425 | |||
National City Corp.(b) | 167,900 | 5,636,403 | |||
North Fork Bancorporation, Inc. | 140,850 | 3,853,656 | |||
Northern Trust Corp.(b) | 55,100 | 2,855,282 | |||
PNC Financial Services Group | 81,100 | 5,014,413 | |||
Regions Financial Corp. | 129,337 | 4,418,152 | |||
Sovereign Bancorp, Inc. | 105,800 | 2,287,396 | |||
State Street Corp. | 92,700 | 5,139,288 | |||
Suntrust Banks, Inc. | 99,900 | 7,268,724 | |||
Synovus Financial Corp. | 85,100 | 2,298,551 | |||
U.S. Bancorp | 527,181 | 15,757,440 | |||
Wachovia Corp.(b) | 426,585 | 22,549,283 | |||
Wells Fargo & Co. | 477,060 | 29,973,680 | |||
| COMMON STOCKS (Continued) | Shares | Value (Note 2) | |||
Banks and Savings & Loans (cont’d.) | |||||
Zions Bancorporation | 27,700 | $ | 2,093,012 | ||
| 206,563,218 | |||||
Chemicals — 1.1% | |||||
Air Products & Chemicals, Inc. | 60,300 | 3,569,157 | |||
Chemtura Corp. | 0 | 3 | |||
Dow Chemical Co. | 270,461 | 11,851,601 | |||
Du Pont (E.I.) de Nemours & Co. | 254,991 | 10,837,118 | |||
Eastman Chemical Co. | 22,400 | 1,155,616 | |||
Engelhard Corp. | 36,775 | 1,108,766 | |||
Hercules, Inc.(a) | 27,900 | 315,270 | |||
Praxair, Inc.(b) | 89,400 | 4,734,624 | |||
Rohm & Haas Co. | 43,400 | 2,101,428 | |||
Sigma-Aldrich Corp. | 19,200 | 1,215,168 | |||
| 36,888,751 | |||||
Commercial Services — 0.8% | |||||
Cendant Corp. | 300,218 | 5,178,761 | |||
Cintas Corp. | 41,200 | 1,696,616 | |||
Convergys Corp.(a) | 43,900 | 695,815 | |||
eBay, Inc.(a) | 307,600 | 13,303,700 | |||
Equifax, Inc. | 37,500 | 1,425,750 | |||
Fiserv, Inc.(a) | 54,900 | 2,375,523 | |||
Monster Worldwide, Inc.(a)(b) | 32,900 | 1,342,978 | |||
| 26,019,143 | |||||
Computers — 3.4% | |||||
Apple Computer, Inc.(a) | 230,400 | 16,563,456 | |||
Automatic Data Processing, Inc.(b) | 157,500 | 7,227,675 | |||
Citrix Systems, Inc.(a)(b) | 46,800 | 1,346,904 | |||
Comverse Technology, Inc.(a)(b) | 40,600 | 1,079,554 | |||
Dell, Inc.(a) | 677,300 | 20,312,227 | |||
Hewlett-Packard Co. | 814,716 | 23,325,319 | |||
International Business Machines Corp. | 451,200 | 37,088,640 | |||
Sun Microsystems, Inc.(a) | 842,600 | 3,530,494 | |||
| 110,474,269 | |||||
Computer Services — 5.8% | |||||
Adobe Systems, Inc. | 153,700 | 5,680,752 | |||
Affiliated Computer Services, Inc. (Class “A” Stock)(a) | 37,700 | 2,231,086 | |||
Autodesk, Inc. | 52,700 | 2,263,465 | |||
Avaya, Inc.(a) | 129,408 | 1,380,783 | |||
BMC Software, Inc.(a) | 63,300 | 1,297,017 | |||
Cisco Systems, Inc.(a) | 1,762,000 | 30,165,440 | |||
Computer Associates International, Inc. | 133,173 | 3,754,147 | |||
Computer Sciences Corp.(a) | 53,900 | 2,729,496 | |||
Compuware Corp.(a) | 108,600 | 974,142 | |||
EMC Corp.(a) | 680,974 | 9,274,866 | |||
First Data Corp. | 217,604 | 9,359,148 | |||
Gateway, Inc.(a)(b) | 22,000 | 55,220 | |||
Intuit, Inc.(a)(b) | 51,100 | 2,723,630 | |||
Lexmark International, Inc.(a) | 37,414 | 1,677,270 | |||
Mercury Interactive Corp.(a) | 14,000 | 389,060 | |||
Micron Technology, Inc.(a)(b) | 153,100 | 2,037,761 | |||
Microsoft Corp. | 2,593,600 | 67,822,639 | |||
NCR Corp.(a) | 51,800 | 1,758,092 | |||
SEE NOTES TO FINANCIAL STATEMENTS.
B83
| STOCK INDEX PORTFOLIO (Continued) |
SCHEDULE OF INVESTMENTS | December 31, 2005 |
| COMMON STOCKS (Continued) | Shares | Value (Note 2) | |||
Computer Services (cont’d.) | |||||
Network Appliance, Inc.(a) | 107,300 | $ | 2,897,100 | ||
Novell, Inc.(a) | 97,100 | 857,393 | |||
NVIDIA Corp.(a) | 44,700 | 1,634,232 | |||
Oracle Corp.(a) | 1,095,020 | 13,370,194 | |||
Parametric Technology Corp.(a) | 81,800 | 498,980 | |||
Siebel Systems, Inc. | 104,900 | 1,109,842 | |||
Symantec Corp.(a) | 311,211 | 5,446,200 | |||
Symbol Technologies, Inc. | 67,400 | 864,068 | |||
Unisys Corp.(a) | 67,000 | 390,610 | |||
Yahoo!, Inc.(a)(b) | 357,900 | 14,022,522 | |||
| 186,665,155 | |||||
Construction — 0.4% | |||||
Centex Corp. | 36,600 | 2,616,534 | |||
D.R. Horton, Inc. | 70,200 | 2,508,246 | |||
Fluor Corp. | 23,500 | 1,815,610 | |||
KB Home | 21,932 | 1,593,579 | |||
Pulte Corp. | 65,800 | 2,589,888 | |||
Vulcan Materials Co.(b) | 28,200 | 1,910,550 | |||
| 13,034,407 | |||||
Containers — 0.1% | |||||
Ball Corp. | 33,000 | 1,310,760 | |||
Bemis Co., Inc. | 25,900 | 721,833 | |||
Pactiv Corp.(a) | 43,900 | 965,800 | |||
| 2,998,393 | |||||
Cosmetics & Soaps — 2.2% | |||||
Alberto-Culver Co., | 21,100 | 965,325 | |||
Avon Products, Inc. | 125,400 | 3,580,170 | |||
Clorox Co.(b) | 43,900 | 2,497,471 | |||
Colgate-Palmolive Co. | 146,700 | 8,046,495 | |||
International Flavors & Fragrances, Inc. | 25,200 | 844,200 | |||
Procter & Gamble Co. | 941,681 | 54,504,466 | |||
| 70,438,127 | |||||
Diversified Consumer Products — 1.4% | |||||
Altria Group, Inc. | 582,000 | 43,487,040 | |||
Eastman Kodak Co.(b) | 81,000 | 1,895,400 | |||
| 45,382,440 | |||||
Diversified Manufacturing Operations — 3.4% | |||||
American Standard Cos., Inc. | 50,900 | 2,033,455 | |||
Cooper Industries Ltd. | 25,000 | 1,825,000 | |||
General Electric Co. | 2,962,700 | 103,842,634 | |||
| 107,701,089 | |||||
Diversified Office Equipment — 0.1% | |||||
Avery Dennison Corp. | 27,600 | 1,525,452 | |||
Pitney Bowes, Inc. | 65,500 | 2,767,375 | |||
| 4,292,827 | |||||
Diversified Operations — 0.3% | |||||
Corning, Inc.(a) | 411,700 | 8,094,022 | |||
Drugs & Medical Supplies — 9.0% | |||||
Abbott Laboratories | 437,900 | 17,266,397 | |||
Allergan, Inc.(b) | 37,400 | 4,037,704 | |||
| COMMON STOCKS (Continued) | Shares | Value (Note 2) | |||
Drugs & Medical Supplies (cont’d.) | |||||
AmerisourceBergen Corp. | 62,400 | $ | 2,583,360 | ||
Bard (C.R.), Inc. | 29,800 | 1,964,416 | |||
Bausch & Lomb, Inc.(b) | 16,100 | 1,093,190 | |||
Baxter International, Inc. | 180,500 | 6,795,825 | |||
Becton Dickinson & Co. | 71,000 | 4,265,680 | |||
Biogen Idec, Inc.(a) | 95,425 | 4,325,615 | |||
Biomet, Inc.(b) | 70,525 | 2,579,099 | |||
Boston Scientific Corp.(a) | 163,400 | 4,001,666 | |||
Bristol-Myers Squibb Co. | 550,260 | 12,644,975 | |||
Cardinal Health, Inc. | 122,075 | 8,392,656 | |||
Genzyme Corp.(a)(b) | 68,300 | 4,834,274 | |||
Guidant Corp. | 85,600 | 5,542,600 | |||
Hospira, Inc.(a) | 42,820 | 1,831,840 | |||
Johnson & Johnson Co. | 842,071 | 50,608,467 | |||
King Pharmaceuticals, Inc.(a) | 75,633 | 1,279,710 | |||
Laboratory Corp. of America Holdings(a)(b) | 37,600 | 2,024,760 | |||
Lilly (Eli) & Co.(b) | 319,500 | 18,080,505 | |||
Medtronic, Inc. | 341,300 | 19,648,641 | |||
Merck & Co., Inc.(b) | 622,800 | 19,811,268 | |||
Mylan Laboratories, Inc. | 53,900 | 1,075,844 | |||
Pfizer, Inc. | 2,077,608 | 48,449,819 | |||
Quest Diagnostics, Inc. | 49,500 | 2,548,260 | |||
Schering-Plough Corp. | 414,300 | 8,638,155 | |||
St. Jude Medical, Inc.(a) | 99,600 | 4,999,920 | |||
Stryker Corp. | 83,300 | 3,701,019 | |||
Watson Pharmaceuticals, Inc.(a)(b) | 31,400 | 1,020,814 | |||
Wyeth | 381,900 | 17,594,133 | |||
Zimmer Holdings, Inc.(a) | 67,286 | 4,537,768 | |||
| 286,178,380 | |||||
Education — 0.1% | |||||
Apollo Group, Inc. | 38,300 | 2,315,618 | |||
Electrical Services — 0.4% | |||||
American Power Conversion | 52,500 | 1,155,000 | |||
Rockwell Automation, Inc. | 51,800 | 3,064,488 | |||
TXU Corp. | 135,012 | 6,776,252 | |||
Xcel Energy, Inc. | 109,495 | 2,021,278 | |||
| 13,017,018 | |||||
Electronics — 4.2% | |||||
Advanced Micro Devices, Inc.(a)(b) | 101,400 | 3,102,840 | |||
Altera Corp.(a)(b) | 106,700 | 1,977,151 | |||
Analog Devices, Inc. | 96,900 | 3,475,803 | |||
Applied Materials, Inc.(b) | 433,400 | 7,775,196 | |||
Applied Micro Circuits Corp.(a)(b) | 88,000 | 226,160 | |||
Broadcom Corp.(a) | 84,900 | 4,003,035 | |||
Electronic Arts, Inc.(a) | 80,000 | 4,184,800 | |||
Electronic Data Systems Corp. | 134,300 | 3,228,572 | |||
Emerson Electric Co. | 116,800 | 8,724,960 | |||
Fisher Scientific International, Inc.(a) | 31,200 | 1,930,032 | |||
Freescale Semiconductor, Inc. | 107,446 | 2,704,416 | |||
Intel Corp. | 1,719,700 | 42,923,712 | |||
Jabil Circuit, Inc.(a) | 54,600 | 2,025,114 | |||
JDS Uniphase Corp.(a) | 307,100 | 724,756 | |||
KLA-Tencor Corp. | 47,900 | 2,362,907 | |||
SEE NOTES TO FINANCIAL STATEMENTS.
B84
| STOCK INDEX PORTFOLIO (Continued) |
SCHEDULE OF INVESTMENTS | December 31, 2005 |
| COMMON STOCKS (Continued) | Shares | Value (Note 2) | |||
Electronics (cont’d.) | |||||
Linear Technology Corp. | 88,100 | $ | 3,177,767 | ||
LSI Logic Corp.(a) | 110,800 | 886,400 | |||
Maxim Integrated Products, Inc. | 86,000 | 3,116,640 | |||
Molex, Inc. | 40,500 | 1,050,975 | |||
National Semiconductor Corp. | 101,600 | 2,639,568 | |||
Novellus Systems, Inc.(a) | 40,000 | 964,800 | |||
Perkin Elmer, Inc. | 31,000 | 730,360 | |||
Pinnacle West Capital Corp. | 26,000 | 1,075,100 | |||
PMC-Sierra, Inc.(a) | 48,800 | 376,248 | |||
PPL Corp.(b) | 110,000 | 3,234,000 | |||
QLogic Corp.(a) | 25,900 | 842,009 | |||
RadioShack Corp. | 43,660 | 918,170 | |||
Sanmina — SCI Corp.(a) | 150,600 | 641,556 | |||
Solectron Corp.(a)(b) | 282,000 | 1,032,120 | |||
Tektronix, Inc. | 18,300 | 516,243 | |||
Teradyne, Inc.(a) | 36,800 | 536,176 | |||
Texas Instruments, Inc. | 471,200 | 15,111,384 | |||
Waters Corp.(a)(b) | 34,100 | 1,288,980 | |||
Xerox Corp.(a)(b) | 270,892 | 3,968,568 | |||
Xilinx, Inc.(b) | 76,200 | 1,921,002 | |||
| 133,397,520 | |||||
Financial Services — 9.1% | |||||
Ambac Financial Group, Inc. | 30,000 | 2,311,800 | |||
American Express Co. | 348,000 | 17,908,080 | |||
Ameriprise Financial, Inc. | 69,600 | 2,853,600 | |||
Bear Stearns Cos., Inc. | 32,410 | 3,744,327 | |||
CIT Group, Inc. | 58,700 | 3,039,486 | |||
Citigroup, Inc. | 1,431,276 | 69,459,823 | |||
Countrywide Financial Corp. | 166,198 | 5,682,310 | |||
E*TRADE Financial Corp.(a) | 106,800 | 2,227,848 | |||
Fannie Mae | 273,300 | 13,339,773 | |||
Federated Investors, Inc. | 25,200 | 933,408 | |||
Franklin Resources, Inc. | 44,300 | 4,164,643 | |||
Freddie Mac | 194,300 | 12,697,505 | |||
Goldman Sachs Group, Inc. | 131,100 | 16,742,781 | |||
H&R Block, Inc. | 92,600 | 2,273,330 | |||
J.P. Morgan Chase & Co. | 993,085 | 39,415,544 | |||
Janus Capital Group, Inc.(b) | 62,600 | 1,166,238 | |||
Lehman Brothers Holdings, Inc. | 79,900 | 10,240,783 | |||
Marshall & Ilsley Corp. | 62,900 | 2,707,216 | |||
MBNA Corp. | 355,352 | 9,647,807 | |||
Merrill Lynch & Co., Inc. | 267,500 | 18,117,775 | |||
Moody’s Corp.(b) | 75,520 | 4,638,438 | |||
Morgan Stanley | 307,410 | 17,442,443 | |||
Paychex, Inc. | 94,850 | 3,615,682 | |||
Schwab (Charles) Corp. | 312,000 | 4,577,040 | |||
SLM Corp.(b) | 117,900 | 6,495,111 | |||
T. Rowe Price Group, Inc. | 36,000 | 2,593,080 | |||
Washington Mutual, Inc. | 277,525 | 12,072,379 | |||
| 290,108,250 | |||||
Food & Beverage — 3.5% | |||||
Anheuser-Busch Cos., Inc. | 222,100 | 9,541,416 | |||
Archer-Daniels-Midland Co. | 172,138 | 4,244,923 | |||
Brown-Forman Corp. | 16,200 | 1,122,984 | |||
| COMMON STOCKS (Continued) | Shares | Value (Note 2) | |||
Food & Beverage (cont’d.) | |||||
Campbell Soup Co. | 56,000 | $ | 1,667,120 | ||
Coca-Cola Co. | 588,900 | 23,738,559 | |||
Coca-Cola Enterprises, Inc. | 94,300 | 1,807,731 | |||
ConAgra Foods, Inc. | 145,300 | 2,946,684 | |||
Constellation Brands, Inc. | 43,200 | 1,133,136 | |||
General Mills, Inc. | 103,900 | 5,124,348 | |||
Heinz (H.J.) & Co. | 94,150 | 3,174,738 | |||
Hershey Foods Corp. | 49,900 | 2,756,975 | |||
Kellogg Co. | 73,200 | 3,163,704 | |||
McCormick & Co., Inc. | 36,300 | 1,122,396 | |||
Molson Coors Brewing Co. | 16,000 | 1,071,840 | |||
Monsanto Co. | 69,198 | 5,364,921 | |||
Pepsi Bottling Group, Inc.(b) | 49,700 | 1,421,917 | |||
PepsiCo, Inc. | 471,440 | 27,852,675 | |||
Sara Lee Corp.(b) | 216,300 | 4,088,070 | |||
Sysco Corp. | 180,600 | 5,607,630 | |||
Tyson Foods, Inc., (Class “A” Stock) | 51,800 | 885,780 | |||
Wrigley (William) Jr. Co. | 51,900 | 3,450,831 | |||
| 111,288,378 | |||||
Forest Products — 0.4% | |||||
International Paper Co.(b) | 123,267 | 4,143,004 | |||
Louisiana-Pacific Corp. | 31,000 | 851,570 | |||
MeadWestvaco Corp. | 48,289 | 1,353,541 | |||
Plum Creek Timber Co., Inc. | 52,200 | 1,881,810 | |||
Temple-Inland, Inc. | 26,600 | 1,193,010 | |||
Weyerhaeuser Co. | 67,700 | 4,491,218 | |||
| 13,914,153 | |||||
Gas Pipelines — 0.3% | |||||
Cinergy Corp. | 53,539 | 2,273,266 | |||
Peoples Energy Corp. | 11,400 | 399,798 | |||
Sempra Energy | 70,054 | 3,141,221 | |||
Williams Cos., Inc. | 162,000 | 3,753,540 | |||
| 9,567,825 | |||||
Hospitals/Healthcare Management — 3.9% | |||||
Aetna, Inc. | 82,624 | 7,792,269 | |||
Agilent Technologies, Inc.(a) | 103,282 | 3,438,258 | |||
Amgen, Inc.(a) | 348,264 | 27,464,099 | |||
Applera Corp. — Applied Biosystems Group | 56,800 | 1,508,608 | |||
Caremark Rx, Inc.(a) | 126,400 | 6,546,256 | |||
Chiron Corp.(a) | 20,300 | 902,538 | |||
Coventry Health Care, Inc.(a) | 39,750 | 2,264,160 | |||
Express Scripts, Inc.(a) | 37,100 | 3,108,980 | |||
Forest Laboratories, Inc.(a) | 95,800 | 3,897,144 | |||
Gilead Sciences, Inc.(a)(b) | 124,400 | 6,547,172 | |||
HCA, Inc. | 121,298 | 6,125,549 | |||
Health Management Associates, Inc. (Class “A” Stock)(b) | 66,300 | 1,455,948 | |||
Humana, Inc.(a) | 46,100 | 2,504,613 | |||
IMS Health, Inc. | 60,120 | 1,498,190 | |||
Manor Care, Inc. | 22,950 | 912,722 | |||
McKesson Corp. | 80,107 | 4,132,720 | |||
Medco Health Solutions, Inc.(a) | 75,396 | 4,207,097 | |||
MedImmune, Inc.(a) | 68,200 | 2,388,364 | |||
SEE NOTES TO FINANCIAL STATEMENTS.
B85
| STOCK INDEX PORTFOLIO (Continued) |
SCHEDULE OF INVESTMENTS | December 31, 2005 |
| COMMON STOCKS (Continued) | Shares | Value (Note 2) | |||
Hospitals/Healthcare Management (cont’d.) | |||||
Millipore Corp.(a) | 14,200 | $ | 937,768 | ||
Patterson Cos., Inc.(a)(b) | 23,900 | 798,260 | |||
Tenet Healthcare Corp.(a) | 127,100 | 973,586 | |||
UnitedHealth Group, Inc. | 373,500 | 23,209,290 | |||
WellPoint, Inc.(a) | 175,100 | 13,971,229 | |||
| 126,584,820 | |||||
Household Products & Personal Care — 0.4% | |||||
Acco Brands Corp.(a) | 1 | 17 | |||
Kimberly-Clark Corp. | 136,588 | 8,147,474 | |||
Leggett & Platt, Inc. | 54,900 | 1,260,504 | |||
Lennar Corp. (Class A)(b) | 33,800 | 2,062,476 | |||
| 11,470,471 | |||||
Housing Related — 0.3% | |||||
Masco Corp. | 124,400 | 3,755,636 | |||
Maytag Corp. | 21,800 | 410,276 | |||
Newell Rubbermaid, Inc. | 58,249 | 1,385,161 | |||
Stanley Works | 22,400 | 1,076,096 | |||
Whirlpool Corp. | 19,300 | 1,616,568 | |||
| 8,243,737 | |||||
Human Resources — 0.1% | |||||
Robert Half International, Inc. | 45,800 | 1,735,362 | |||
Insurance — 4.7% | |||||
ACE, Ltd. | 87,200 | 4,659,968 | |||
AFLAC, Inc. | 138,800 | 6,443,096 | |||
Allstate Corp. | 192,488 | 10,407,826 | |||
American International Group, Inc. | 728,187 | 49,684,199 | |||
Aon Corp.(b) | 87,125 | 3,132,144 | |||
Chubb Corp. | 58,400 | 5,702,760 | |||
CIGNA Corp. | 40,200 | 4,490,340 | |||
Cincinnati Financial Corp. | 45,628 | 2,038,659 | |||
Genworth Financial, Inc., | 90,500 | 3,129,490 | |||
Hartford Financial Services Group, Inc. | 89,100 | 7,652,799 | |||
Jefferson-Pilot Corp. | 36,018 | 2,050,505 | |||
Lincoln National Corp. | 47,700 | 2,529,531 | |||
Loews Corp. | 38,300 | 3,632,755 | |||
Marsh & McLennan Cos., Inc.(b) | 140,800 | 4,471,808 | |||
MBIA, Inc. | 38,550 | 2,319,168 | |||
MetLife, Inc. | 208,200 | 10,201,800 | |||
MGIC Investment Corp. | 32,900 | 2,165,478 | |||
Principal Financial Group, Inc. | 84,400 | 4,003,092 | |||
Progressive Corp.(b) | 54,300 | 6,341,154 | |||
SAFECO Corp. | 37,500 | 2,118,750 | |||
St. Paul Cos., Inc. | 196,598 | 8,782,033 | |||
Torchmark Corp. | 30,000 | 1,668,000 | |||
UnumProvident Corp.(b) | 80,456 | 1,830,374 | |||
XL Capital Ltd., (Bermuda) | 41,800 | 2,816,484 | |||
| 152,272,213 | |||||
Internet & Catalog Retail — 0.1% | |||||
Amazon.com, Inc.(a)(b) | 72,000 | 3,394,800 | |||
Leisure — 1.0% | |||||
Brunswick Corp. | 26,400 | 1,073,424 | |||
| COMMON STOCKS (Continued) | Shares | Value (Note 2) | |||
Leisure (cont’d.) | |||||
Carnival Corp. | 120,500 | $ | 6,443,135 | ||
Disney (Walt) Co. | 547,101 | 13,114,011 | |||
Harrah’s Entertainment, Inc. | 44,650 | 3,183,099 | |||
Hilton Hotels Corp.(b) | 67,800 | 1,634,658 | |||
Marriott International, Inc. | 49,400 | 3,308,318 | |||
Sabre Group Holdings, Inc. | 39,619 | 955,214 | |||
Starwood Hotels & Resorts Worldwide, Inc. | 53,300 | 3,403,738 | |||
| 33,115,597 | |||||
Machinery — 0.9% | |||||
Caterpillar, Inc.(b) | 192,800 | 11,138,056 | |||
Deere & Co. | 67,000 | 4,563,370 | |||
Dover Corp. | 59,700 | 2,417,253 | |||
Eaton Corp. | 41,600 | 2,790,944 | |||
Ingersoll-Rand Co. (Class “A” Stock) | 99,900 | 4,032,963 | |||
Parker-Hannifin Corp. | 32,325 | 2,132,157 | |||
Snap-on, Inc. | 12,300 | 461,988 | |||
Thermo Electron Corp.(a) | 46,400 | 1,398,032 | |||
| 28,934,763 | |||||
Media — 2.8% | |||||
Clear Channel Communications, Inc. | 144,800 | 4,553,960 | |||
Comcast Corp. (Class “A” Stock)(a)(b) | 619,730 | 16,088,191 | |||
Dow Jones & Co., Inc. | 17,400 | 617,526 | |||
E.W. Scripps Co. (The) | 9,900 | 475,398 | |||
Gannett Co., Inc.(b) | 70,400 | 4,264,128 | |||
Interpublic Group of Cos., Inc.(a)(b) | 75,200 | 725,680 | |||
Knight-Ridder, Inc.(b) | 20,900 | 1,322,970 | |||
McGraw-Hill, Inc. | 106,200 | 5,483,106 | |||
Meredith Corp. | 13,800 | 722,292 | |||
New York Times Co. | 41,900 | 1,108,255 | |||
News Corp. ( Class “A” Stock) | 658,700 | 10,242,785 | |||
R. R. Donnelley & Sons, Co. | 63,600 | 2,175,756 | |||
Time Warner, Inc. | 1,311,120 | 22,865,933 | |||
Tribune Co. | 84,700 | 2,563,022 | |||
Univision Communications, Inc. | 66,900 | 1,966,191 | |||
Viacom, Inc. (Class “B” Stock) | 455,136 | 14,837,434 | |||
| 90,012,627 | |||||
Metals – Ferrous — 0.2% | |||||
Allegheny Technologies, Inc. | 19,940 | 719,435 | |||
Nucor Corp. | 43,600 | 2,908,992 | |||
United States Steel Corp. | 31,540 | 1,516,128 | |||
| 5,144,555 | |||||
Metals – Non Ferrous — 0.2% | |||||
Alcoa, Inc.(b) | 244,176 | 7,220,284 | |||
Mineral Resources — 0.4% | |||||
Burlington Resources, Inc. | 109,034 | 9,398,731 | |||
Phelps Dodge Corp. | 27,828 | 4,003,614 | |||
| 13,402,345 | |||||
SEE NOTES TO FINANCIAL STATEMENTS.
B86
| STOCK INDEX PORTFOLIO (Continued) |
SCHEDULE OF INVESTMENTS | December 31, 2005 |
| COMMON STOCKS (Continued) | Shares | Value (Note 2) | |||
Miscellaneous – Basic Industry — 2.0% | |||||
AES Corp.(a) | 159,700 | $ | 2,528,051 | ||
BB&T Corp.(b) | 158,500 | 6,642,735 | |||
Danaher Corp. | 70,400 | 3,926,912 | |||
Ecolab, Inc.(b) | 51,800 | 1,878,786 | |||
Fortune Brands, Inc. | 36,400 | 2,839,928 | |||
Honeywell International, Inc. | 242,850 | 9,046,163 | |||
Illinois Tool Works, Inc. | 63,900 | 5,622,561 | |||
International Game Technology | 79,000 | 2,431,620 | |||
ITT Industries, Inc. | 25,000 | 2,570,500 | |||
Pall Corp. | 23,600 | 633,896 | |||
PPG Industries, Inc. | 49,700 | 2,877,630 | |||
Sealed Air Corp.(a) | 20,910 | 1,174,515 | |||
Textron, Inc. | 38,100 | 2,932,938 | |||
Tyco International, Ltd. | 571,443 | 16,491,845 | |||
W.W. Grainger, Inc. | 23,300 | 1,656,630 | |||
| 63,254,710 | |||||
Miscellaneous Consumer Growth/Staples — 0.6% | |||||
3M Co.(b) | 218,300 | 16,918,250 | |||
Black & Decker Corp. | 22,900 | 1,991,384 | |||
| 18,909,634 | |||||
Oil & Gas — 5.2% | |||||
Amerada Hess Corp.(b) | 24,700 | 3,132,454 | |||
Anadarko Petroleum Corp.(b) | 65,563 | 6,212,094 | |||
Ashland, Inc. | 18,600 | 1,076,940 | |||
ChevronTexaco Corp. | 640,392 | 36,355,108 | |||
El Paso Corp.(b) | 176,311 | 2,143,942 | |||
EOG Resources, Inc. | 65,400 | 4,798,398 | |||
Exxon Mobil Corp. | 1,756,670 | 98,672,153 | |||
Kerr-McGee Corp. | 33,089 | 3,006,467 | |||
Marathon Oil Corp. | 103,697 | 6,322,409 | |||
Murphy Oil Corp. | 43,100 | 2,326,969 | |||
NICOR, Inc. | 14,200 | 558,202 | |||
Sunoco, Inc. | 37,000 | 2,900,060 | |||
| 167,505,196 | |||||
Oil & Gas Exploration/Production — 1.4% | |||||
ConocoPhillips | 395,794 | 23,027,295 | |||
Devon Energy Corp. | 129,400 | 8,092,676 | |||
Occidental Petroleum Corp. | 112,100 | 8,954,548 | |||
XTO Energy, Inc. | 100,000 | 4,394,000 | |||
| 44,468,519 | |||||
Oil & Gas Services — 2.3% | |||||
Apache Corp. | 92,550 | 6,341,526 | |||
B.J. Services Co. | 87,400 | 3,204,958 | |||
Baker Hughes, Inc.(b) | 98,030 | 5,958,263 | |||
Halliburton Co. | 143,400 | 8,885,064 | |||
Kinder Morgan, Inc. | 29,000 | 2,666,550 | |||
Nabors Industries, Ltd. (Barbados)(a) | 43,400 | 3,287,550 | |||
National-Oilwell Varco, Inc.(a) | 43,200 | 2,708,640 | |||
Noble Corp. | 36,800 | 2,595,872 | |||
PG&E Corp. | 101,600 | 3,771,392 | |||
Rowan Cos., Inc. | 28,700 | 1,022,868 | |||
Schlumberger Ltd. | 168,200 | 16,340,630 | |||
Transocean, Inc.(a) | 93,133 | 6,490,439 | |||
Valero Energy Corp. | 169,600 | 8,751,360 | |||
| COMMON STOCKS (Continued) | Shares | Value (Note 2) | |||
Oil & Gas Services (cont’d.) | |||||
Weatherford International, Ltd.(a) | 78,500 | $ | 2,841,700 | ||
| 74,866,812 | |||||
Precious Metals — 0.3% | |||||
Freeport-McMoRan Copper & Gold, Inc. (Class “B” Stock) | 49,100 | 2,641,580 | |||
Newmont Mining Corp. | 119,503 | 6,381,460 | |||
| 9,023,040 | |||||
Railroads — 0.7% | |||||
Burlington Northern Santa Fe Corp. | 104,626 | 7,409,613 | |||
CSX Corp. | 62,912 | 3,194,042 | |||
Norfolk Southern Corp. | 112,500 | 5,043,375 | |||
Union Pacific Corp. | 71,700 | 5,772,567 | |||
| 21,419,597 | |||||
Real Estate Investment Trust — 0.6% | |||||
Apartment Investment & Management Co. (Class “A” Stock) | 24,700 | 935,389 | |||
Archstone-Smith Trust | 53,900 | 2,257,871 | |||
Equity Office Properties Trust | 103,500 | 3,139,155 | |||
Equity Residential Properties Trust | 70,000 | 2,738,400 | |||
ProLogis | 60,100 | 2,807,872 | |||
Public Storage, Inc. | 20,000 | 1,354,400 | |||
Simon Property Group, Inc. | 53,800 | 4,122,694 | |||
Vornado Realty Trust | 29,400 | 2,454,018 | |||
| 19,809,799 | |||||
Restaurants — 0.6% | |||||
Darden Restaurants, Inc. | 44,150 | 1,716,552 | |||
McDonald’s Corp. | 354,400 | 11,950,368 | |||
Wendy’s International, Inc. | 22,700 | 1,254,402 | |||
Yum! Brands, Inc. | 81,000 | 3,797,280 | |||
| 18,718,602 | |||||
Retail — 5.7% | |||||
Albertson’s, Inc. | 103,044 | 2,199,989 | |||
AutoNation, Inc.(a)(b) | 54,600 | 1,186,458 | |||
AutoZone, Inc.(a)(b) | 15,600 | 1,431,300 | |||
Bed Bath & Beyond, Inc.(a) | 80,000 | 2,892,000 | |||
Best Buy Co., Inc. | 113,225 | 4,923,023 | |||
Big Lots, Inc.(a)(b) | 35,200 | 422,752 | |||
Circuit City Stores, Inc. | 55,200 | 1,246,968 | |||
Coach, Inc.(a) | 106,400 | 3,547,376 | |||
Costco Wholesale Corp. | 132,332 | 6,546,464 | |||
CVS Corp.(b) | 222,600 | 5,881,092 | |||
Dillard’s, Inc. (Class “A” Stock) | 25,750 | 639,115 | |||
Dollar General Corp.(b) | 90,203 | 1,720,171 | |||
Family Dollar Stores, Inc. | 45,600 | 1,130,424 | |||
Federated Department Stores, Inc. | 72,260 | 4,793,066 | |||
Gap, Inc. | 173,187 | 3,055,019 | |||
Home Depot, Inc. | 607,519 | 24,592,369 | |||
J.C. Penney Co., Inc.(b) | 76,900 | 4,275,640 | |||
Kohl’s Corp.(a)(b) | 87,700 | 4,262,220 | |||
Kroger Co.(a) | 210,700 | 3,978,016 | |||
Limited Brands | 104,796 | 2,342,191 | |||
Liz Claiborne, Inc.(b) | 31,800 | 1,139,076 | |||
Lowe’s Cos., Inc.(b) | 216,900 | 14,458,554 | |||
Nordstrom, Inc.(b) | 60,800 | 2,273,920 | |||
SEE NOTES TO FINANCIAL STATEMENTS.
B87
| STOCK INDEX PORTFOLIO (Continued) |
SCHEDULE OF INVESTMENTS | December 31, 2005 |
| COMMON STOCKS (Continued) | Shares | Value (Note 2) | |||
Retail (cont’d.) | |||||
Office Depot, Inc.(a) | 82,000 | $ | 2,574,800 | ||
OfficeMax, Inc. | 21,886 | 555,029 | |||
Safeway, Inc. | 125,300 | 2,964,598 | |||
Sears Holding Corp.(a)(b) | 25,712 | 2,970,507 | |||
Sherwin-Williams Co. | 37,000 | 1,680,540 | |||
Staples, Inc. | 186,000 | 4,224,060 | |||
Starbucks Corp.(a) | 224,200 | 6,728,242 | |||
Supervalu, Inc.(b) | 39,000 | 1,266,720 | |||
Target Corp. | 239,468 | 13,163,556 | |||
Tiffany & Co. | 30,300 | 1,160,187 | |||
TJX Cos., Inc. | 126,400 | 2,936,272 | |||
Wal-Mart Stores, Inc. | 705,200 | 33,003,360 | |||
Walgreen Co. | 278,500 | 12,326,410 | |||
| 184,491,484 | |||||
Rubber — 0.1% | |||||
B.F. Goodrich Corp. | 31,800 | 1,306,980 | |||
Cooper Tire & Rubber Co. | 5,000 | 76,600 | |||
Goodyear Tire & Rubber Co.(a)(b) | 49,200 | 855,096 | |||
| 2,238,676 | |||||
Telecommunications — 4.3% | |||||
ADC Telecommunications, Inc.(a) | 27,200 | 607,648 | |||
Alltel Corp. | 103,200 | 6,511,920 | |||
Andrew Corp.(a) | 28,112 | 301,642 | |||
AT&T Inc. | 1,103,209 | 27,017,595 | |||
BellSouth Corp. | 517,100 | 14,013,410 | |||
CenturyTel, Inc.(b) | 40,400 | 1,339,664 | |||
CIENA Corp.(a) | 151,600 | 450,252 | |||
Citizens Communications Co. | 90,300 | 1,104,369 | |||
Lucent Technologies, Inc.(a)(b) | 1,225,805 | 3,260,641 | |||
Motorola, Inc. | 699,595 | 15,803,851 | |||
QUALCOMM, Inc. | 462,700 | 19,933,116 | |||
Qwest Communications International, Inc.(a)(b) | 434,547 | 2,455,191 | |||
Scientific-Atlanta, Inc.(b) | 48,700 | 2,097,509 | |||
Sprint Nextel Corp. | 813,522 | 19,003,896 | |||
Tellabs, Inc.(a) | 116,000 | 1,264,400 | |||
Verizon Communications, Inc. | 778,638 | 23,452,577 | |||
| 138,617,681 | |||||
Textiles | |||||
VF Corp. | 27,136 | 1,501,706 | |||
Tobacco — 0.1% | |||||
Reynolds American, Inc.(b) | 24,300 | 2,316,519 | |||
UST, Inc. | 47,900 | 1,955,757 | |||
| 4,272,276 | |||||
Toy Manufacturer — 0.1% | |||||
Hasbro, Inc. | 42,650 | 860,677 | |||
Mattel, Inc. | 119,781 | 1,894,935 | |||
| 2,755,612 | |||||
Trucking & Shipping — 1.0% | |||||
FedEx Corp. | 85,340 | 8,823,303 | |||
Ryder System, Inc. | 17,600 | 721,952 | |||
United Parcel Service, Inc. | 316,400 | 23,777,460 | |||
| 33,322,715 | |||||
| COMMON STOCKS (Continued) | Shares | Value (Note 2) | |||||
Utilities – Electric — 1.9% | |||||||
Allegheny Energy, Inc.(a) | 36,200 | $ | 1,145,730 | ||||
Ameren Corp.(b) | 55,300 | 2,833,572 | |||||
American Electric Power Co., Inc.(b) | 109,940 | 4,077,675 | |||||
CenterPoint Energy, Inc. | 90,610 | 1,164,339 | |||||
CMS Energy Corp.(a) | 53,000 | 769,030 | |||||
Consolidated Edison, Inc.(b) | 67,600 | 3,131,908 | |||||
Constellation Energy Group | 51,050 | 2,940,480 | |||||
Dominion Resources, Inc.(b) | 94,642 | 7,306,362 | |||||
DTE Energy Co. | 48,600 | 2,099,034 | |||||
Duke Energy Corp.(b) | 271,962 | 7,465,357 | |||||
Edison International | 91,700 | 3,999,037 | |||||
Entergy Corp. | 60,900 | 4,180,785 | |||||
FirstEnergy Corp. | 91,236 | 4,469,652 | |||||
FPL Group, Inc. | 107,000 | 4,446,920 | |||||
Public Service Enterprise Group, Inc. | 62,300 | 4,047,631 | |||||
Southern Co. | 207,100 | 7,151,163 | |||||
TECO Energy, Inc. | 52,900 | 908,822 | |||||
| 62,137,497 | |||||||
Utilities – Electric & Gas — 0.5% | |||||||
Dynegy, Inc. (Class “A” Stock)(a) | 113,300 | 548,372 | |||||
Exelon Corp. | 183,550 | 9,753,847 | |||||
KeySpan Corp. | 47,800 | 1,705,982 | |||||
NiSource, Inc. | 73,000 | 1,522,780 | |||||
Progress Energy, Inc. | 70,314 | 3,088,191 | |||||
| 16,619,172 | |||||||
Waste Management — 0.2% | |||||||
Allied Waste Industries, Inc.(a)(b) | 71,800 | 627,532 | |||||
Waste Management, Inc. | 159,030 | 4,826,561 | |||||
| 5,454,093 | |||||||
TOTAL LONG-TERM INVESTMENTS | 3,148,426,538 | ||||||
| SHORT-TERM INVESTMENTS — 11.7% | |||||||
Mutual Fund — 11.6% | |||||||
Dryden Core Investment Fund — Taxable Money Market Series (cost $371,767,830; includes $315,379,940 of cash collateral received for securities on loan) (Note 4)(c)(f) | 371,767,830 | 371,767,830 | |||||
| Principal (000) | |||||||
U.S. Government Obligation — 0.1% | |||||||
United States Treasury Bills(d)(e) | |||||||
4.06% 03/16/06 | $ | 5,200 | 5,159,331 | ||||
TOTAL SHORT-TERM INVESTMENTS | 376,927,161 | ||||||
TOTAL INVESTMENTS — 109.7% | 3,525,353,699 | ||||||
LIABILITIES IN EXCESS OF | (312,609,627 | ) | |||||
NET ASSETS — 100.0% | $ | 3,212,744,072 | |||||
SEE NOTES TO FINANCIAL STATEMENTS.
B88
| STOCK INDEX PORTFOLIO (Continued) |
SCHEDULE OF INVESTMENTS | December 31, 2005 |
| (a) | Non income-producing security. |
| (b) | All or portion of security is on loan. The aggregate market value of such securities is $301,146,620; cash collateral of $315,379,940 (included in liabilities) was received with which the Portfolio purchased highly liquid short-term investments. |
| (c) | Represents security, or portion thereof, purchase with cash collateral received for securities on loan. |
| (d) | Security segregated as collateral for futures contracts. |
| (e) | Rate quoted represents yield-to-maturity at purchase date. |
| (f) | Prudential Investments LLC, the manager of the Portfolio, also serves as manager of the Dryden Core Investment Fund – Taxable Money Market Series. |
| (g) | Liabilities in excess of other assets include net unrealized depreciation on financial futures as follows: |
Open futures contracts outstanding at December 31, 2005:
| Number of Contracts | Type | Expiration Date | Value at Trade Date | Value at December 31, 2005 | Unrealized Depreciation | |||||||||
| Long Positions: | ||||||||||||||
| 207 | S&P 500 Index | Mar. 2006 | $ | 65,890,313 | $ | 64,935,900 | $ | (954,413 | ) | |||||
The industry classification of portfolio holdings and liabilities in excess of other assets shown as a percentage of net assets as of December 31, 2005 was as follows:
Mutual Fund (including 9.8% of collateral received for securities on loan) | 11.6 | % | |
Financial Services | 9.1 | ||
Drugs & Medical Supplies | 9.0 | ||
Banks and Savings & Loans | 6.4 | ||
Computer Services | 5.8 | ||
Retail | 5.7 | ||
Oil & Gas | 5.2 | ||
Insurance | 4.7 | ||
Telecommunications | 4.3 | ||
Electronics | 4.2 | ||
Hospital/Healthcare Management | 3.9 | ||
Food & Beverage | 3.5 | ||
Computers | 3.4 | ||
Diversified Manufacturing Operations | 3.4 | ||
Media | 2.8 | ||
Oil & Gas Services | 2.3 | ||
Cosmetics & Soaps | 2.2 | ||
Miscellaneous — Basic Industry | 2.0 | ||
Aerospace | 1.9 | ||
Utilities — Electric | 1.9 | ||
Diversified Consumer Products | 1.4 | ||
Oil & Gas Exploration/Production | 1.4 | ||
Chemicals | 1.1 | ||
Leisure | 1.0 | ||
Trucking & Shipping | 1.0 | ||
Machinery | 0.9 | ||
Commercial Services | 0.8 | ||
Autos — Cars & Trucks | 0.7 | ||
Railroads | 0.7 | ||
Miscellaneous Consumer Growth/Staples | 0.6 | ||
Real Estate Investment Trust | 0.6 | ||
Restaurants | 0.6 | ||
Utilities — Electric & Gas | 0.5 | ||
Construction | 0.4 | ||
Electrical Services | 0.4 | ||
Forest Products | 0.4 | ||
Household Products & Personal Care | 0.4 | ||
Mineral Resources | 0.4 |
Diversified Operations | 0.3 | ||
Gas Pipelines | 0.3 | ||
Housing Related | 0.3 | ||
Precious Metals | 0.3 | ||
Apparel | 0.2 | ||
Metals — Ferrous | 0.2 | ||
Metals — Non Ferrous | 0.2 | ||
Waste Management | 0.2 | ||
U.S. Government Obligations | 0.1 | ||
Advertising | 0.1 | ||
Airlines | 0.1 | ||
Containers | 0.1 | ||
Diversified Office Equipment | 0.1 | ||
Education | 0.1 | ||
Human Resources | 0.1 | ||
Internet & Catalog Retail | 0.1 | ||
Rubber | 0.1 | ||
Tobacco | 0.1 | ||
Toy Manufacturer | 0.1 | ||
Textiles | 0.0 | ||
| 109.7 | |||
Liabilities in excess of other assets | (9.7 | ) | |
Total | 100.0 | % | |
SEE NOTES TO FINANCIAL STATEMENTS.
B89
| VALUE PORTFOLIO |
SCHEDULE OF INVESTMENTS | December 31, 2005 |
| LONG-TERM INVESTMENTS — 99.1% | |||||
| COMMON STOCKS | Shares | Value (Note 2) | |||
Aerospace & Defense — 5.3% | |||||
Empresa Brasileira de Aeronautica S.A. ADR (Brazil) | 560,400 | $ | 21,911,640 | ||
Honeywell International, Inc. | 987,900 | 36,799,275 | |||
Lockheed Martin Corp. | 275,800 | 17,549,154 | |||
Northrop Grumman Corp. | 266,100 | 15,995,271 | |||
| 92,255,340 | |||||
Capital Markets — 7.6% | |||||
Bank of New York Co., Inc. (The) | 694,100 | 22,107,085 | |||
Lazard Ltd., (Class A)(b) | 713,900 | 22,773,410 | |||
Lehman Brothers Holdings, Inc. | 138,300 | 17,725,911 | |||
Mellon Financial Corp. | 399,900 | 13,696,575 | |||
Merrill Lynch & Co., Inc. | 543,300 | 36,797,709 | |||
UBS AG | 217,600 | 20,704,640 | |||
| 133,805,330 | |||||
Chemicals — 2.4% | |||||
E.I. du Pont de Nemours & Co. | 586,900 | 24,943,250 | |||
Mosaic Co. (The)(a)(b) | 1,139,200 | 16,666,496 | |||
| 41,609,746 | |||||
Commercial Banks — 3.4% | |||||
Bank of America Corp.(b) | 827,684 | 38,197,617 | |||
Royal Bank of Scotland Group PLC (United Kingdom) | 708,100 | 21,380,787 | |||
| 59,578,404 | |||||
Commercial Services & Supplies — 3.0% | |||||
Cendant Corp. | 1,137,100 | 19,614,975 | |||
Waste Management, Inc. | 1,063,700 | 32,283,295 | |||
| 51,898,270 | |||||
Communications Equipment — 1.6% | |||||
Avaya, Inc.(a)(b) | 1,031,900 | 11,010,373 | |||
Nokia Corp. ADR (Finland)(b) | 975,800 | 17,857,140 | |||
| 28,867,513 | |||||
Computers & Peripherals — 2.1% | |||||
Dell, Inc.(a) | 687,700 | 20,624,123 | |||
Seagate Technology(b) | 839,300 | 16,777,607 | |||
| 37,401,730 | |||||
Consumer Finance — 1.9% | |||||
American Express Co. | 365,700 | 18,818,922 | |||
MBNA Corp. | 542,400 | 14,726,160 | |||
| 33,545,082 | |||||
Diversified Financial Services — 4.0% | |||||
Citigroup, Inc. | 959,800 | 46,579,094 | |||
JP Morgan Chase & Co. | 593,800 | 23,567,922 | |||
| 70,147,016 | |||||
Electric Utilities — 2.0% | |||||
E.ON AG, ADR (Germany) | 398,100 | 13,742,412 | |||
Exelon Corp. | 402,000 | 21,362,280 | |||
| 35,104,692 | |||||
Energy Equipment & Services — 4.1% | |||||
GlobalSantaFe Corp. | 638,300 | 30,734,145 | |||
Halliburton Co.(b) | 421,100 | 26,091,356 | |||
National Oilwell Varco, Inc.(a) | 254,800 | 15,975,960 | |||
| 72,801,461 | |||||
Food Products — 1.7% | |||||
Cadbury Schweppes PLC ADR | 768,300 | 29,418,207 | |||
| COMMON STOCKS (Continued) | Shares | Value (Note 2) | |||
Food & Staples Retailing — 2.5% | |||||
Kroger Co. (The)(a) | 2,298,800 | $ | 43,401,344 | ||
Healthcare Equipment & Supplies — 1.0% | |||||
Guidant Corp. | 270,300 | 17,501,925 | |||
Healthcare Providers & Services — 2.0% | |||||
CIGNA Corp. | 147,600 | 16,486,920 | |||
Medco Health Solutions, Inc.(a) | 323,504 | 18,051,523 | |||
| 34,538,443 | |||||
Hotels, Restaurants & Leisure — 2.6% | |||||
GTECH Holdings Corp. | 866,500 | 27,502,710 | |||
Hilton Hotels Corp. | 87,200 | 2,102,392 | |||
McDonald’s Corp. | 461,600 | 15,565,152 | |||
| 45,170,254 | |||||
Household Products — 1.5% | |||||
Kimberly-Clark Corp. | 435,600 | 25,983,540 | |||
Independent Power Producers & Energy Traders — 2.6% | |||||
TXU Corp. | 903,200 | 45,331,608 | |||
Industrial Conglomerates — 3.6% | |||||
General Electric Co. | 780,800 | 27,367,040 | |||
Tyco International, Ltd. (Bermuda) | 1,246,700 | 35,979,762 | |||
| 63,346,802 | |||||
Insurance — 6.8% | |||||
American International Group, Inc. | 557,700 | 38,051,871 | |||
Axis Capital Holdings Ltd. | 676,300 | 21,154,664 | |||
Genworth Financial, Inc. (Class A) | 414,700 | 14,340,326 | |||
Loews Corp. | 281,600 | 26,709,760 | |||
Montpelier Re Holdings Ltd. | 983,900 | 18,595,710 | |||
| 118,852,331 | |||||
Internet & Catalog Retail — 1.7% | |||||
Expedia, Inc.(a)(b) | 247,400 | 5,927,704 | |||
IAC/InterActiveCorp (a)(b) | 868,200 | 24,578,742 | |||
| 30,506,446 | |||||
IT Services — 1.4% | |||||
Accenture Ltd. (Class A) | 841,300 | 24,288,331 | |||
Media — 2.2% | |||||
News Corp. (Class A) | 853,502 | 13,271,956 | |||
Viacom, Inc. (Class B) | 750,429 | 24,463,986 | |||
| 37,735,942 | |||||
Metals & Mining — 3.7% | |||||
Inco Ltd. (Canada)(b) | 616,400 | 26,856,548 | |||
Phelps Dodge Corp. | 264,300 | 38,024,841 | |||
| 64,881,389 | |||||
Multi-Utilities — 1.3% | |||||
Sempra Energy | 518,000 | 23,227,120 | |||
Office Electronics — 2.1% | |||||
Xerox Corp.(a)(b) | 2,571,400 | 37,671,010 | |||
Oil, Gas & Consumable Fuels — 10.9% | |||||
Amerada Hess Corp.(b) | 165,500 | 20,988,710 | |||
Kerr-McGee Corp. | 323,400 | 29,384,124 | |||
Nexen, Inc. (Canada) | 746,600 | 35,560,558 | |||
Occidental Petroleum Corp.(b) | 424,700 | 33,925,036 | |||
Suncor Energy, Inc. (Canada) | 650,300 | 41,053,438 | |||
Tesoro Petroleum Corp. | 285,000 | 17,541,750 | |||
Trident Resources Corp. (Canada) | 283,737 | 12,204,267 | |||
| 190,657,883 | |||||
SEE NOTES TO FINANCIAL STATEMENTS.
B90
| VALUE PORTFOLIO (Continued) |
SCHEDULE OF INVESTMENTS | December 31, 2005 |
| COMMON STOCKS (Continued) | Shares | Value (Note 2) | ||||
Pharmaceuticals — 4.5% | ||||||
Novartis AG ADR (Switzerland)(b) | 546,800 | $ | 28,696,064 | |||
Pfizer, Inc. | 1,221,100 | 28,476,052 | ||||
Sanofi-Aventis ADR (France) | 511,600 | 22,459,240 | ||||
| 79,631,356 | ||||||
Semiconductors and Semiconductor Equipment — 0.5% |
| |||||
Spansion, Inc.(a) | 569,100 | 7,921,872 | ||||
Software — 2.4% | ||||||
Computer Associates International, Inc. | 1,041,306 | 29,354,416 | ||||
Microsoft Corp. | 504,500 | 13,192,675 | ||||
| 42,547,091 | ||||||
Thrifts & Mortgage Finance — 0.6% | ||||||
Countrywide Financial Corp. | 324,300 | 11,087,818 | ||||
Tobacco — 2.7% | ||||||
Altria Group, Inc. | 630,100 | 47,081,072 | ||||
Wireless Telecommunication Services — 3.4% | ||||||
Alltel Corp. | 379,300 | 23,933,830 | ||||
Sprint Nextel Corp. | 1,495,636 | 34,938,057 | ||||
| 58,871,887 | ||||||
TOTAL LONG-TERM INVESTMENTS | 1,736,668,255 | |||||
| SHORT-TERM INVESTMENTS — 17.3% | ||||||
Mutual Fund | ||||||
Dryden Core Investment Fund — Taxable Money Market Series | 303,980,204 | 303,980,204 | ||||
TOTAL INVESTMENTS — 116.4% | 2,040,648,459 | |||||
LIABILITIES IN EXCESS OF | (287,395,925 | ) | ||||
NET ASSETS — 100.0% | $ | 1,753,252,534 | ||||
The industry classification of portfolio holdings and liabilities in excess of other assets shown as a percentage of net assets as of December 31, 2005 was as follows:
Mutual Fund (including 15.4% of collateral received for securities on loan) | 17.3 | % | |
Oil, Gas & Consumable Fuels | 10.9 | ||
Financial Services | 10.1 | ||
Insurance | 6.8 | ||
Aerospace & Defense | 5.3 | ||
Pharmaceuticals | 4.5 | ||
Energy Equipment & Services | 4.2 | ||
Metals & Mining | 3.7 | ||
Industrial Conglomerates | 3.6 | ||
Capital Markets | 3.5 | ||
Telecommunications | 3.4 | ||
Agriculture | 2.7 | ||
Hotels, Restaurants & Leisure | 2.6 | ||
Independent Power Producers & Energy Traders | 2.6 | ||
Food & Staples Retailing | 2.5 | ||
Chemicals | 2.4 | ||
Software | 2.4 | ||
Media | 2.2 | ||
Computers & Peripherals | 2.1 | ||
Office Electronics | 2.1 | ||
Electric Utilities | 2.0 | ||
Healthcare Providers & Services | 2.0 | ||
Environmental Control | 1.8 | ||
Food Products | 1.7 | ||
Internet & Catalog Retail | 1.7 | ||
Communications Equipment | 1.6 | ||
Household Products | 1.5 | ||
IT Services | 1.4 | ||
Diversified Financial Services | 1.3 | ||
Multi-Utilities | 1.3 | ||
Commercial Banks | 1.2 | ||
Commercial Services & Supplies | 1.1 | ||
Healthcare Equipment & Supplies | 1.0 | ||
Consumer Finance | 0.8 | ||
Thrifts & Mortgage Finance | 0.6 | ||
Semiconductors | 0.5 | ||
| 116.4 | |||
Liabilities in excess of other assets | (16.4 | ) | |
| 100.0 | % | ||
The following abbreviation is used in portfolio descriptions:
| ADR | American Depositary Receipt |
| (a) | Non-income producing security. |
| (b) | All or a portion of security is on loan. The aggregate market value of such securities is $256,935,541; cash collateral of $269,315,964 (included in liabilities) was received with which the Portfolio purchased highly liquid short-term investments. |
| (c) | Represents security, or a portion thereof, purchased with cash collateral for securities on loan. |
| (d) | Prudential Investments LLC, the manager of the Fund, also serves as manager of the Dryden Core Investment Fund — Taxable Money Market Series. |
| (e) | As of December 31, 2005, 1 security representing $12,204,267 and 0.6% of the total market value was fair valued in accordance with the policies adopted by the Board of Directors. |
| (f) | Indicates illiquid securities. |
| (g) | Indicates a security restricted to resale. The aggregate cost of such securities was $11,783,583. The aggregate value of $12,204,267 is approximately 0.7% of the net assets. |
SEE NOTES TO FINANCIAL STATEMENTS.
B91
NOTES TO THE FINANCIAL STATEMENTS OF
THE PRUDENTIAL SERIES FUND, INC.
| Note 1: | General |
The Prudential Series Fund, Inc. (“Series Fund”), a Maryland corporation, organized on November 15, 1982, is a diversified open-end management investment company registered under the Investment Company Act of 1940, as amended. The Series Fund is composed of thirty-two Portfolios (“Portfolio” or “Portfolios”), each with a separate series of capital stock. The information presented in these financial statements pertains to thirteen Portfolios: Conservative Balanced Portfolio, Diversified Bond Portfolio, Equity Portfolio, Flexible Managed Portfolio, Global Portfolio, Government Income Portfolio, High Yield Bond Portfolio, Jennison Portfolio, Money Market Portfolio, Natural Resources Portfolio, Small Capitalization Stock Portfolio, Stock Index Portfolio and Value Portfolio.
The Portfolios of the Series Fund have the following as investment objectives:
Conservative Balanced Portfolio: Total investment return consistent with a conservatively managed diversified portfolio by investing in a mix of equity-related securities, debt obligations and money market instruments.
Diversified Bond Portfolio: High level of income over a longer term while providing reasonable safety of capital by investing in intermediate and long-term debt obligations that are rated investment grade and high quality money market instruments. The types of debt obligations in which the Portfolio can invest include U.S. government securities, mortgage-related securities and corporate bonds.
Equity Portfolio: Capital appreciation by investing primarily in stocks of major, established corporations as well as small companies.
Flexible Managed Portfolio: High total return consistent with an aggressively managed diversified portfolio by investing in a mix of equity and equity-related securities, debt obligations and money market instruments.
Global Portfolio: Long-term growth of capital by investing primarily in equity and equity-related securities of foreign and U.S. companies.
Government Income Portfolio: High level of income over the long-term consistent with the preservation of capital by investing primarily in intermediate and long-term U.S. government securities, including U.S. Treasuries and agencies and mortgage-related securities.
High Yield Bond Portfolio: High total return by investing primarily in medium to lower rated debt securities.
Jennison Portfolio: Long-term growth of capital by investing primarily in equity securities of established companies that the Portfolio manager believes offer above-average growth prospects.
Money Market Portfolio: Maximum current income consistent with the stability of capital and maintenance of liquidity by investing in high quality short-term money market securities issued by the U.S. government and its agencies, as well as commercial paper, asset backed securities, certificates of deposit and other obligations issued by banks, corporations and other companies, that generally mature in 13 months or less.
Natural Resources Portfolio: Long-term growth of capital by investing primarily in stocks of companies that operate within, or do business with, the natural resources sector of the economy.
Small Capitalization Stock Portfolio: Long-term growth of capital that corresponds to the price and yield performance of the Standard & Poor’s Small Capitalization Stock Index (the “S&P 600 SmallCap Index”) by investing primarily in stocks of the S&P 600 SmallCap Index.
Stock Index Portfolio: Investment results that generally correspond to the price and yield performance of the S&P 500 Index by investing primarily in stocks in the S&P 500 Index.
Value Portfolio: Capital appreciation by investing in equity and equity-related securities that are undervalued.
The ability of issuers of debt securities (other than those issued or guaranteed by the U.S. Government) held by the Portfolios to meet their obligations may be affected by the economic or political developments in a specific industry, region or country.
C1
| Note 2: | Accounting Policies |
The following is a summary of significant accounting policies followed by the Series Fund and the Portfolios in preparation of their financial statements.
Securities Valuation: Securities listed on a securities exchange are valued at the last sale price on such exchange on the day of valuation or, if there was no sale on such day, at the mean between the last reported bid and asked prices, or at the last bid price on such day in the absence of an asked price. Securities traded via NASDAQ are valued at the official closing price provided by NASDAQ. Securities that are actively traded in the over-the-counter market, including listed securities for which the primary market is believed by Prudential Investments LLC (“PI” or “Manager”) in consultation with the subadvisor, to be over-the-counter, are valued at market value using prices provided by an independent pricing agent or principal market maker. Options on securities and indices traded on an exchange are valued at the last sale price as of the close of trading on the applicable exchange or, if there was no sale, at the mean between the most recently quoted bid and asked prices on such exchange, or at the last bid price in the absence of an asked price. Futures contracts and options thereon traded on a commodities exchange or board of trade are valued at the last sale price at the close of trading on such exchange or board of trade or, if there was no sale on the applicable commodities exchange or board of trade on such day, at the mean between the most recently quoted bid and asked prices on such exchange or board of trade or at the last bid price in the absence of an asked price. Prices may be obtained from independent pricing services which use information provided by market makers or estimates of market values obtained from yield data relating to investments or securities with similar characteristics. Securities for which reliable market quotations are not readily available, or whose values have been affected by events occurring after the close of the security’s foreign market and before the Series Fund’s normal pricing time, are valued at fair value in accordance with Board of Directors’ approved fair valuation procedures. When determining the fair valuation of securities, some of the factors influencing the valuation include, the nature of any restrictions on disposition of the securities; assessment of the general liquidity of the securities; the issuer’s financial condition and the markets in which it does business; the cost of the investment; the size of the holding and the capitalization of the issuer; the prices of any recent transactions or bids/offers for such securities or any comparable securities; any available analyst media or other reports or information deemed reliable by the investment advisor regarding the issuer or the markets or industry in which it operates. Using fair value to price securities may result in a value that is different from a security’s most recent closing price and from the price used by other mutual funds to calculate their net asset values. As of December 31, 2005, Conservative Balanced, Global, High Yield Bond and Natural Resources Portfolios held foreign securities whose value required adjustment in accordance with such procedures.
Investments in mutual funds are valued at their net asset value as of the close of the New York Stock Exchange on the date of valuation.
The Money Market, Conservative Balanced and Flexible Managed Portfolios use amortized cost to value short-term securities. Short-term securities that are held in the other Portfolios which mature in more than 60 days are valued at current market quotations and those short-term securities which mature in 60 days or less are valued at amortized cost which approximates market value. The amortized cost method values a security at its cost at the time of purchase and there after assumes a constant amortization to maturity of any discount or premium.
The Diversified Bond, High Yield Bond and Natural Resources Portfolios may hold up to 15% of their net assets in illiquid securities, including those which are restricted as to disposition under securities law (“restricted securities”). Certain issues of restricted securities held by these portfolios at December 31, 2005 include registration rights, under which the portfolios may demand registration by the issuer, of which the portfolios may bear the cost of such registration. Restricted securities, sometimes referred to as private placements, are valued pursuant to the valuation procedures noted above.
Repurchase Agreements: In connection with transactions in repurchase agreements with United States financial institutions, it is the Series Fund’s policy that its custodian or designated subcustodians, as the case may be, under triparty repurchase agreements, take possession of the underlying collateral securities, the value of which exceeds the principal amount of the repurchase transaction, including accrued interest. To the extent that any repurchase transaction exceeds one business day, the value of the collateral is marked to market on a daily basis to ensure the adequacy of the collateral. If the seller defaults and the value of the collateral declines, or if bankruptcy proceedings are commenced with respect to the seller of the security, realization of the collateral by the Series Fund may by delayed or limited.
C2
Foreign Currency Translation: The books and records of the Series Fund are maintained in U.S. dollars. Foreign currency amounts are translated into U.S. dollars on the following basis:
(i) market value of investment securities, other assets and liabilities – at the current daily rates of exchange.
(ii) purchases and sales of investment securities, income and expenses – at the rates of exchange prevailing on the respective dates of such transactions.
Although the net assets of the Series Fund are presented at the foreign exchange rates and market values at the close of the period, the Series Fund does not isolate that portion of the results of operations arising as a result of changes in the foreign exchange rates from the fluctuations arising from changes in the market prices of securities held at the end of the period. Similarly, the Series Fund does not isolate the effect of changes in foreign exchange rates from the fluctuations arising from changes in the market prices of portfolio securities sold during the period. Accordingly, these realized foreign currency gains (losses) are included in the reported net realized gains (losses) on investment transactions.
Net realized gains (losses) on foreign currency transactions represent net foreign exchange gains (losses) from the holding of foreign currencies, currency gains (losses) realized between the trade date and settlement date on securities transactions, and the difference between the amounts of dividends, interest and foreign withholding taxes recorded on the Series Fund’s books and the U.S. dollar equivalent amounts actually received or paid. Net unrealized currency gains (losses) from valuing foreign currency denominated assets and liabilities (other than investments) at period end exchange rates are reflected as a component of net unrealized appreciation (depreciation) on investments and foreign currencies.
Foreign security and currency transactions may involve certain considerations and risks not typically associated with those of domestic origin as a result of, among other factors, the possibility of political and economic instability or the level of governmental supervision and regulation of foreign securities markets.
Forward Currency Contracts: A forward currency contract is a commitment to purchase or sell a foreign currency at a future date at a negotiated forward rate. Certain Portfolios of the Series Fund may enter into forward currency contracts in order to hedge their exposure to changes in foreign currency exchange rates on their foreign portfolio holdings or on specific receivables and payables denominated in a foreign currency. The contracts are valued daily at current forward exchange rates and any unrealized gain (loss) is included in net unrealized appreciation (depreciation) on investments and foreign currencies. Gain (loss) is realized on the settlement date of the contract equal to the difference between the settlement value of the original and renegotiated forward contracts. This gain (loss), if any, is included in net realized gain (loss) on foreign currency transactions. Risks may arise upon entering into these contracts from the potential inability of the counterparties to meet the terms of their contracts.
Short Sales: Certain portfolios of the Series Fund may sell a security it does not own in anticipation of a decline in the market value of that security (short sale). When a Portfolio makes a short sale, it must borrow the security sold short and deliver it to the broker-dealer through which it made the short sale as collateral for its obligation to deliver the security upon conclusion of the transaction. The Portfolio may have to pay a fee to borrow the particular security and may be obligated to remit any interest or dividends received on such borrowed securities. A gain, limited to the price at which the Portfolio sold the security short, or a loss, unlimited in magnitude, will be recognized upon the termination of a short sale if the market price at termination is less than or greater than, respectively, the proceeds originally received.
Loan Participations: The High Yield Bond Portfolio may invest in loan participations. When the Portfolio purchases a loan participation, the Portfolio typically enters into a contractual relationship with the lender or third party selling such participations (“Selling Participant”), but not the borrower. As a result, the Portfolio assumes the credit risk of the borrower, the Selling Participant and any other persons interpositioned between the Portfolio and the borrower. The Portfolio may not directly benefit from the collateral supporting the senior loan in which it has purchased the loan participant.
Options: The Series Fund may either purchase or write options in order to hedge against adverse market movements or fluctuations in value caused by changes in prevailing interest rates or foreign currency exchange rates or currencies with respect to securities which the Series Fund currently owns or intends to purchase. The Series Fund’s principal reason for writing options is to realize, through receipt of premiums, a greater current return than would be realized on the underlying security alone. When the Series Fund purchases an option, it pays a premium and an amount equal to that premium is recorded as an asset. When
C3
the Series Fund writes an option, it receives a premium and an amount equal to that premium is recorded as a liability. The asset or liability is adjusted daily to reflect the current market value of the option. If an option expires unexercised, the Series Fund realizes a gain (loss) to the extent of the premium received or paid. If an option is exercised, the premium received or paid is recorded as an adjustment to the proceeds from the sale or the cost basis of the purchase in determining whether the Series Fund has realized a gain (loss). The difference between the premium and the amount received or paid on effecting a closing purchase or sale transaction is also treated as a realized gain (loss). Gains (losses) on purchased options are included in net realized gains (losses) on investment transactions. Gains (losses) on written options are presented separately as net realized gains (losses) on written option transactions.
The Series Fund, as writer of an option, may have no control over whether the contract may be exercised. As a result, the Series Fund bears the market risk of an unfavorable change in the price of the security underlying the written option. The Series Fund, as purchaser of an option, bears the risk of the potential inability of the counterparties to meet the terms of their contracts.
Financial Futures Contracts: A financial futures contract is an agreement to purchase (long) or sell (short) an agreed amount of securities at a set price for delivery on a future date. Upon entering into a financial futures contract, the Series Fund is required to pledge to the broker an amount of cash and/or other assets equal to a certain percentage of the contract amount. This amount is known as the “initial margin”. Subsequent payments, known as “variation margin”, are made or received by the Series Fund each day, depending on the daily fluctuations in the value of the underlying security. Such variation margin is recorded for financial statement purposes on a daily basis as unrealized gain (loss). When the contract expires or is closed, the gain (loss) is realized and is presented in the Statement of Operations as net realized gain (loss) on financial futures contracts.
The Series Fund invests in financial futures contracts in order to hedge its existing portfolio securities, or securities the Series Fund intends to purchase, against fluctuations in value caused by changes in prevailing rates or market conditions. Under a variety of circumstances, the Series Fund may not achieve the anticipated benefits of the financial futures contracts and may realize a loss. The use of futures transactions involves the risk of imperfect correlation in movements in the price of futures contracts and the underlying hedged assets.
Swap Agreements: The Portfolios may enter into interest rate swap agreements, forward swap spread lock agreements, and credit default swap agreements. A swap agreement is an agreement to exchange the return generated by one instrument for the return generated by another instrument. Interest rate swap agreements involve the exchange by the Portfolio with another party of their respective commitments to pay or receive interest. Forward spread lock swap agreements involve commitments to pay or receive a settlement amount calculated as the difference between the swap spread and a fixed spread, multiplied by the notional amount times the duration of the swap. The swap spread is the difference between the benchmark swap rate (market rate) and the specific Treasury rate. In a credit default swap agreement, one party (the protection buyer) makes a stream of payments to another party (the protection seller) in exchange for the right to receive a specified payment in the event of a default by a third party, typically corporate issues or sovereign issues of an emerging country, on its obligation. The maximum amount of the payment may equal the notional, at par, of the underlying index or security as a result of a default (or “credit event”). In addition to bearing the risk that the credit event will occur, the Portfolios could be exposed to market risk due to unfavorable changes in interest rates or in the price of the underlying security or index, the possibility that the fund may be unable to close out its position at the same time or at the same price as if it had purchased comparable publicly traded securities, or that the counterparty may default on it’s obligation to perform. The swaps are valued daily at current market value and any change in value is included in net unrealized appreciation or depreciation on investments. Payments received or paid by the Portfolio are recorded as realized gains or losses. Risk of loss may exceed amounts recognized on the statements of assets and liabilities. Swap agreements outstanding at period end, if any, are listed on the Schedule of Investments.
Forward currency contracts, written options, short sales, swaps and financial futures contracts involve elements of both market and credit risk in excess of the amounts reflected on the Statement of Assets and Liabilities.
Securities Lending: The Series Fund may lend its portfolio securities to broker-dealers. The loans are secured by collateral at least equal at all times to the market value of the securities loaned. Loans are subject to termination at the option of the borrower or the Series Fund. Upon termination of the loan, the borrower will return to the lender securities identical to the loaned securities. Should the borrower of the securities fail financially, the Series has the right to repurchase the securities using the collateral in the open market. The
C4
Series Fund recognizes income, net of any rebate and securities lending agent fees, for lending its securities in the form of fees or interest on the investment of any cash received as collateral. The Series Fund also continues to receive interest and dividends or amounts equivalent thereto on the securities loaned and recognizes any unrealized gain or loss in the market price of the securities loaned that may occur during the term of the loan.
When-Issued/Delayed Delivery Securities: Securities purchased or sold on a when-issued or delayed-delivery basis may be settled a month or more after trade date; interest income is not accrued until settlement date. At the time a Portfolio enters into such transactions, it instructs the custodian to segregate assets with a current value at least equal to the amount of its when-issued or delayed-delivery purchase commitments.
Securities Transactions and Net Investment Income: Securities transactions are recorded on the trade date. Realized gains (losses) on sales of securities are calculated on the identified cost basis. Dividend income is recorded on the ex-dividend date; interest income, which is comprised of four elements: stated coupon, original issue discount, market discount and market premium, is recorded on the accrual basis. Expenses are recorded on the accrual basis. The Series Fund’s expenses are allocated to the respective Portfolios on the basis of relative net assets except for Portfolio specific expenses which are attributable directly to a Portfolio or class level.
For Portfolios with multiple classes of shares, net investment income (loss) (other than administration and distribution fees, which are charged to the respective class) and unrealized and realized gains (losses) are allocated daily to each class of shares based upon the relative proportion of net assets of each class at the beginning of the day.
Custody Fee Credits: The Series Fund has an arrangement with its custodian bank, whereby uninvested monies earn credits which reduce the fees charged by the custodian. Such custody fee credits are presented as a reduction of gross expenses in the accompanying Statements of Operations.
Taxes: For federal income tax purposes, each Portfolio in the Series Fund is treated as a separate taxpaying entity. It is each Portfolio’s policy to continue to meet the requirements of the Internal Revenue Code applicable to regulated investment companies and to distribute all of its taxable net income and capital gains, if any, to shareholders. Therefore, no federal income tax provision is required.
Withholding taxes on foreign dividends, interest and capital gains have been provided for in accordance with the Series Fund’s understanding of the applicable country’s tax rules and regulations.
Dividends and Distributions: Dividends and distributions of each Portfolio are declared in cash and automatically reinvested in additional shares of the same Portfolio. The Money Market Portfolio will declare and reinvest dividends from net investment income and net realized capital gains daily. The Diversified Bond, Government Income and High Yield Bond Portfolios will declare and distribute dividends from net investment income, if any, quarterly and distributions from net capital gains, if any, at least annually. All other Portfolios will declare and distribute dividends from net investment income and distributions from net capital gains, if any, at least annually. Dividends and distributions are recorded on the ex-dividend date.
Dividends and capital gain distributions are determined in accordance with income tax regulations which may differ from generally accepted accounting principles. Permanent book/tax differences relating to income and gains are reclassified amongst undistributed net investment income, accumulated net realized gain or loss and paid in capital in excess of par, as appropriate.
Estimates: The preparation of financial statements requires management to make estimates and assumptions that affect the reported amounts and disclosures in the financial statements. Actual results could differ from these estimates.
| Note 3: | Agreements |
The Series Fund has a management agreement with PI. Pursuant to this agreement PI has responsibility for all investment advisory services and supervises the subadvisors’ performance of such services. PI has entered into subadvisory agreements with Prudential Investment Management, Inc. (“PIM”), Jennison Associates LLC (“Jennison”), GE Asset Management (“GEAM”), LSV Asset Management (“LSV”), Marsico Capital Management, LLC (“Marsico”), Quantitative Management Associates LLC (“QMA”), Salomon Brothers Asset Management (“Salomon”), T. Rowe Price Associates, Inc. (“T. Rowe”) and William Blair & Company, L.L.C. (“William Blair”)
C5
(collectively, the “Subadvisors”), under which each provides investment advisory services for certain Portfolios of the Series Fund. PI pays for the services of the Subadvisors, compensation of officers of the Series Fund, occupancy and certain clerical and administrative expenses of the Series Fund. The Series Fund bears all other costs and expenses.
The management fee paid to PI is computed daily and payable monthly, at the annual rates specified below, of the value of each of the Portfolio’s average daily net assets.
Portfolio | Management Fee | Effective Management Fee | ||
Conservative Balanced Portfolio | 0.55% | 0.55% | ||
Diversified Bond Portfolio | 0.40 | 0.40 | ||
Equity Portfolio | 0.45 | 0.45 | ||
Flexible Managed Portfolio | 0.60 | 0.60 | ||
Global Portfolio | 0.75 | 0.75 | ||
Government Income Portfolio | 0.40 | 0.40 | ||
High Yield Bond Portfolio | 0.55 | 0.55 | ||
Jennison Portfolio | 0.60 | 0.60 | ||
Money Market Portfolio | 0.40 | 0.40 | ||
Natural Resources Portfolio | 0.45 | 0.45 | ||
Small Capitalization Stock Portfolio | 0.40 | 0.40 | ||
Stock Index Portfolio | 0.35% up to $4 billion 0.30% over $4 billion | 0.35 | ||
Value Portfolio | 0.40 | 0.40 |
At December 31, 2005 the Subadvisors that provide investment advisory services to the Portfolios as follows. Where more than one Subadvisor is listed, each Subadvisor provides services to a segment of the Portfolio:
Portfolio | Subadvisor(s) | |
Conservative Balanced Portfolio | PIM, QMA | |
Diversified Bond Portfolio | PIM | |
Equity Portfolio | Jennison, Salomon | |
Flexible Managed Portfolio | PIM, QMA | |
Global Portfolio | LSV, Marsico, T. Rowe & William Blair | |
Government Income Portfolio | PIM | |
High Yield Bond Portfolio | PIM | |
Jennison Portfolio | Jennison | |
Money Market Portfolio | PIM | |
Natural Resources Portfolio | Jennison | |
Small Capitalization Stock Portfolio | QMA | |
Stock Index Portfolio | QMA | |
Value Portfolio | Jennison |
The Series Fund has a distribution agreement with Prudential Investment Management Services LLC (“PIMS”) which acts as the distributor of the Class I and Class II shares of the Series Fund. The Series Fund compensates PIMS for distributing and servicing the Series Fund’s Class II shares pursuant to a plan of distribution (the “Class II Plan”), regardless of expenses actually incurred by PIMS. The distribution fees are accrued daily and payable monthly. No distribution or service fees are paid to PIMS as distributor of the Class I shares of the Series Fund. Pursuant to the Class II Plan, the Class II shares of each Portfolio compensate PIMS for distribution-related activities at an annual rate of 0.25% of the average daily net assets of the Class II shares.
The Series Fund has an administration agreement with PI which acts as the administrator of the Class II shares of the Series Fund. The administration fee paid to PI is accrued daily and payable monthly, at the annual rate of 0.15% of the average daily net assets of the Class II shares.
PI has agreed to reimburse each Portfolio (other than Global Portfolio) the portion of the management fee for that Portfolio equal to the amount that the aggregate annual ordinary operating expenses (excluding interest, taxes, and brokerage commissions) exceeded the percentage stated below, of the Portfolio’s average daily net assets.
C6
Portfolio | Class I Expense limit | Class II Expense Limit | ||||
Conservative Balanced Portfolio | 0.75 | % | N/A | |||
Diversified Bond Portfolio | 0.75 | N/A | ||||
Equity Portfolio | 0.75 | 1.15 | % | |||
Flexible Managed Portfolio | 0.75 | N/A | ||||
Government Income Portfolio | 0.75 | N/A | ||||
High Yield Bond Portfolio | 0.75 | N/A | ||||
Jennison Portfolio | 0.75 | 1.15 | ||||
Money Market Portfolio | 0.75 | N/A | ||||
Natural Resources Portfolio | 0.75 | 1.15 | ||||
Small Capitalization Stock Portfolio | 0.75 | N/A | ||||
Stock Index Portfolio | 0.75 | N/A | ||||
Value Portfolio | 0.75 | 1.15 |
N/A – Not applicable – There are no Class II shares outstanding for this portfolio.
PIMS, PI, PIM, QMA and Jennison are indirect, wholly-owned subsidiaries of Prudential Financial, Inc. (“Prudential”).
| Note 4: | Other Transactions with Affiliates |
Prudential Mutual Fund Services LLC (“PMFS”), an affiliate of PI and an indirect, wholly-owned subsidiary of Prudential, serves as the Series Fund’s transfer agent. Transfer agent fees and expenses in the Statements of Operations include certain out-of-pocket expenses paid to non-affiliates, where applicable.
PIM, is the Series Fund’s security lending agent. For the year ended December 31, 2005, PIM was compensated as follows for these services by the Series Fund Portfolios:
Portfolio | PIM | ||
Conservative Balanced Portfolio | $ | 234,164 | |
Diversified Bond Portfolio | 90,400 | ||
Equity Portfolio | 149,058 | ||
Flexible Managed Portfolio | 380,156 | ||
Global Portfolio | 82,505 | ||
Government Income Portfolio | 34,259 | ||
High Yield Bond Portfolio | 322,127 | ||
Jennison Portfolio | 153,134 | ||
Natural Resources Portfolio | 324,521 | ||
Small Capitalization Stock Portfolio | 174,029 | ||
Stock Index Portfolio | 241,793 | ||
Value Portfolio | 138,522 | ||
For the year ended December 31, 2005, Prudential Equity Group, LLC, and Wachovia Securities, LLC, earned brokerage commissions from transactions executed on behalf of the Series Fund Portfolios as follows:
Portfolio | Prudential Equity Group | Wachovia | ||||
Equity Portfolio | $ | 80,450 | $ | 147,245 | ||
Global Portfolio | 13,505 | 1,444 | ||||
Jennison Portfolio | 57,566 | 11,675 | ||||
Natural Resources Portfolio | 7,492 | — | ||||
Value Portfolio | 44,908 | 63,161 | ||||
C7
Certain Portfolios invest in the Taxable Money Market Series and Short-Term Bond Series (the “Portfolios”), portfolios of Dryden Core Investment Fund, pursuant to an exemptive order received from the Securities and Exchange Commission. The Portfolios are a money market mutual fund and short term bond fund, respectively, registered under the Investment Company Act of 1940, as amended, and managed by PI. During the year ended December 31, 2005, the earnings from the Portfolios from investing excess cash and collateral from securities lending were as follows. See Note 2 relating to Securities Lending:
Portfolio | Excess Cash Investment | Securities Lending Cash Collateral Investment | ||||
Conservative Balanced Portfolio | $ | 7,100,025 | $ | 580,653 | ||
Diversified Bond Portfolio | 2,720,333 | 253,453 | ||||
Equity Portfolio | 2,133,551 | 371,263 | ||||
Flexible Managed Portfolio | 8,608,058 | 947,805 | ||||
Global Portfolio | 285,505 | 209,732 | ||||
Government Income Portfolio | 2,437,713 | 89,911 | ||||
High Yield Bond Portfolio | 2,544,975 | 790,809 | ||||
Jennison Portfolio | 988,340 | 390,650 | ||||
Natural Resources Portfolio | 450,247 | 797,560 | ||||
Small Capitalization Stock Portfolio | 31,880 | 430,741 | ||||
Stock Index Portfolio | 3,134,059 | 589,588 | ||||
Value Portfolio | 1,005,304 | 346,604 | ||||
| Note 5: | Portfolio Securities |
The aggregate cost of purchases and the proceeds from the sales of securities (excluding government securities and short-term issues) for the year ended December 31, 2005 were as follows:
Cost of Purchases:
Portfolio | |||
Conservative Balanced Portfolio | $ | 376,087,212 | |
Diversified Bond Portfolio | 742,132,005 | ||
Equity Portfolio | 3,074,057,442 | ||
Flexible Managed Portfolio | 2,241,528,608 | ||
Global Portfolio | 1,120,616,284 | ||
Government Income Portfolio | 43,099,458 | ||
High Yield Bond Portfolio | 983,895,130 | ||
Jennison Portfolio | 1,215,076,897 | ||
Natural Resources Portfolio | 496,798,441 | ||
Small Capitalization Stock Portfolio | 113,106,298 | ||
Stock Index Portfolio | 241,706,336 | ||
Value Portfolio | 897,129,491 | ||
Proceeds from Sales:
Portfolio | |||
Conservative Balanced Portfolio | $ | 541,735,464 | |
Diversified Bond Portfolio | 764,086,059 | ||
Equity Portfolio | 3,353,648,771 | ||
Flexible Managed Portfolio | 2,613,202,524 | ||
Global Portfolio | 1,139,824,719 | ||
Government Income Portfolio | 27,816,346 | ||
High Yield Bond Portfolio | 837,405,770 | ||
Jennison Portfolio | 1,306,785,703 | ||
Natural Resources Portfolio | 461,431,839 | ||
Small Capitalization Stock Portfolio | 169,683,165 | ||
Stock Index Portfolio | 205,538,706 | ||
Value Portfolio | 959,564,643 | ||
C8
The Conservative Balanced, Diversified Bond, Flexible Managed and Government Income Portfolios’ written options activity for the year ended December 31, 2005 were as follows:
| Conservative Balanced Portfolio | |||||||
| Contracts | Premiums | ||||||
Balance as of December 31, 2004 | — | — | |||||
Options written | 316 | $ | 72,759 | ||||
Options terminated in closing purchase transactions | (179 | ) | (30,884 | ) | |||
Options expired | (75 | ) | (9,180 | ) | |||
Balance as of December 31, 2005 | 62 | $ | 32,695 | ||||
| Diversified Bond Portfolio | |||||||
| Contracts | Premiums | ||||||
Balance as of December 31, 2004 | — | — | |||||
Options written | 660 | $ | 152,235 | ||||
Options terminated in closing purchase transactions | (377 | ) | (65,372 | ) | |||
Options expired | (154 | ) | (18,850 | ) | |||
Balance as of December 31, 2005 | 129 | $ | 68,013 | ||||
| Flexible Managed Portfolio | |||||||
| Contracts | Premiums | ||||||
Balance as of December 31, 2004 | — | — | |||||
Options written | 251 | $ | 57,600 | ||||
Options terminated in closing purchase transactions | (143 | ) | (24,532 | ) | |||
Options expired | (59 | ) | (7,222 | ) | |||
Balance as of December 31, 2005 | 49 | $ | 25,846 | ||||
| Government Income Portfolio | |||||||
| Contracts | Premiums | ||||||
Balance as of December 31, 2004 | — | — | |||||
Options written | 220 | $ | 50,410 | ||||
Options terminated in closing purchase transactions | (125 | ) | (21,357 | ) | |||
Options expired | (52 | ) | (6,365 | ) | |||
Balance as of December 31, 2005 | 43 | $ | 22,688 | ||||
| Note 6: | Distributions and Tax Information |
In order to present undistributed net investment income and accumulated net realized capital gains (losses) on the Statement of Assets and Liabilities that more closely represent their tax character, certain adjustments have been made to undistributed net investment income and accumulated net realized gain (loss) on investments.
For the year ended December 31, 2005, the adjustments were as follows:
Portfolio | Undistributed Net Investment Income | Accumulated Net Realized Gain (Loss) | Paid-in Capital | |||||||||
Conservative Balanced Portfolio(b) | $ | 1,368,977 | $ | (1,368,977 | ) | — | ||||||
Diversified Bond Portfolio(a)(b)(f)(g) | (827,998 | ) | 827,998 | — | ||||||||
Equity Portfolio(a)(i) | (151,673 | ) | (1,218,275 | ) | $ | 1,369,948 | ||||||
Flexible Managed Portfolio(b) | 991,404 | (991,404 | ) | — | ||||||||
Global Portfolio(a)(d) | (1,001,983 | ) | 1,001,983 | — | ||||||||
Government Income Portfolio(b)(e)(f) | 539,012 | (538,982 | ) | (30 | ) | |||||||
High Yield Bond Portfolio(a)(b)(c)(f) | 450,305 | (450,305 | ) | — | ||||||||
Jennison Portfolio(a)(h) | (153,102 | ) | 221,613 | (68,511 | ) | |||||||
Natural Resources Portfolio(a)(d) | 10,633,935 | (10,633,935 | ) | — | ||||||||
Value Portfolio(a) | 73,841 | (73,841 | ) | — | ||||||||
C9
| (a) | Reclassification of net foreign currency gain (loss). |
| (b) | Reclassification of paydown losses. |
| (c) | Reclassification of income on defaulted securities. |
| (d) | Reclassification of book to tax differences due to the sale of passive foreign investment companies. |
| (e) | Reclassification of other tax adjustments. |
| (f) | Reclassification of swap income. |
| (g) | Redesignation of dividends from ordinary income to short-term capital gain. |
| (h) | Distribution in excess of net investment income. |
| (i) | Merger adjustments. |
The tax character of distributions paid during the year ended December 31, 2005 were as follows:
Portfolio | Ordinary Income | Long-Term Capital Gains | Total Distributions | ||||||
Conservative Balanced Portfolio | $ | 75,600,623 | $ | 18,446,572 | $ | 94,047,195 | |||
Diversified Bond Portfolio | 66,587,402 | 6,446,465 | 73,033,867 | ||||||
Equity Portfolio | 39,998,556 | — | 39,998,556 | ||||||
Flexible Managed Portfolio | 68,680,004 | — | 68,680,004 | ||||||
Global Portfolio | 4,467,100 | — | 4,467,100 | ||||||
Government Income Portfolio | 18,278,784 | — | 18,278,784 | ||||||
High Yield Bond Portfolio | 110,212,418 | — | 110,212,418 | ||||||
Jennison Portfolio | 2,181,501 | — | 2,181,501 | ||||||
Money Market Portfolio | 25,832,139 | 781 | 25,832,920 | ||||||
Natural Resources Portfolio | 771,086 | 59,265,774 | 60,036,860 | ||||||
Small Capitalization Stock Portfolio | 5,272,836 | 41,694,638 | 46,967,474 | ||||||
Stock Index Portfolio | 51,121,948 | 77,233,580 | 128,355,528 | ||||||
Value Portfolio | 22,637,578 | — | 22,637,578 | ||||||
The tax character of distributions paid during the year ended December 31, 2004 were as follows:
Portfolio | Ordinary Income | Long-Term Capital Gains | Total Distributions | ||||||
Conservative Balanced Portfolio | $ | 62,958,425 | $ | 9,723,502 | $ | 72,681,927 | |||
Diversified Bond Portfolio | 59,934,775 | — | 59,934,775 | ||||||
Equity Portfolio | 50,414,768 | — | 50,414,768 | ||||||
Flexible Managed Portfolio | 52,897,054 | — | 52,897,054 | ||||||
Global Portfolio | 6,503,370 | — | 6,503,370 | ||||||
Government Income Portfolio | 23,161,432 | 9,552 | 23,170,984 | ||||||
High Yield Bond Portfolio | 108,509,679 | — | 108,509,679 | ||||||
Jennison Portfolio | 9,010,258 | — | 9,010,258 | ||||||
Money Market Portfolio | 9,344,369 | 21,156 | 9,365,525 | ||||||
Natural Resources Portfolio | 21,498,787 | 16,898,833 | 38,397,620 | ||||||
Small Capitalization Stock Portfolio | 4,033,462 | 2,375,136 | 6,408,598 | ||||||
Stock Index Portfolio | 55,156,437 | 43,386,225 | 98,542,662 | ||||||
Value Portfolio | 20,439,009 | — | 20,439,009 | ||||||
C10
At December 31, 2005, the components of distributable earnings on a tax basis and approximate capital loss carryforwards were as follow:
Portfolio | Accumulated Ordinary Income | Accumulated Long-Term Capital Gains | Approximate Capital Loss Carryforward(a) | Expiration | |||||||||||||||||||||
| 2007 | 2008 | 2009 | 2010 | 2011 | |||||||||||||||||||||
Conservative Balanced Portfolio | $ | 69,851,558 | $ | 5,874,856 | — | — | — | — | — | — | |||||||||||||||
Diversified Bond Portfolio | 5,401,633 | 5,671,014 | — | — | — | — | — | — | |||||||||||||||||
Equity Portfolio | 2,152,237 | — | $ | 330,234,000 | (b) | — | — | $ | 1,082,000 | $ | 123,731,000 | $ | 205,421,000 | ||||||||||||
Flexible Managed Portfolio | 82,943,146 | 39,371,416 | — | (c) | — | — | — | — | — | ||||||||||||||||
Global Portfolio | 5,516,655 | — | 48,959,000 | (d) | — | — | — | 43,286,000 | 5,673,000 | ||||||||||||||||
Government Income Portfolio | 1,104,445 | — | 2,522,000 | (e) | — | — | — | — | — | ||||||||||||||||
High Yield Bond Portfolio | 5,213,277 | — | 261,741,000 | (f) | $ | 18,627,000 | $ | 59,264,000 | $ | 80,595,000 | 102,013,000 | — | |||||||||||||
Jennison Portfolio | — | — | 1,014,156,000 | (g) | — | — | 385,205,000 | 508,642,000 | 120,309,000 | ||||||||||||||||
Money Market Portfolio | — | 515 | — | — | — | — | — | — | |||||||||||||||||
Natural Resources Portfolio | 44,054,120 | 154,025,766 | — | — | — | — | — | — | |||||||||||||||||
Small Capitalization Stock Portfolio | 2,337,970 | 33,391,432 | — | — | — | — | — | — | |||||||||||||||||
Stock Index Portfolio | 3,535,697 | 7,284,014 | — | — | — | — | — | — | |||||||||||||||||
Value Portfolio | 6,831,994 | 58,445,493 | — | (h) | — | — | — | — | — | ||||||||||||||||
| (a) | Accordingly, no capital gain distribution is expected to be paid to shareholders until net gains have been realized in excess of such carryforwards. See also note 12. |
| (b) | Approximately $418,633,000 of its capital loss carryforward was used to offset net taxable gains realized in the fiscal year ended December 31, 2005. In addition, the Portfolio utilized capital loss carryforward from the merger with SP MFS Capital Opportunities Portfolio in the amount approximately of $1,082,000. |
| (c) | Approximately $140,450,000 of the Portfolio’s capital loss carryforward was used to offset net taxable gains realized in the fiscal year ended December 31, 2005. |
| (d) | Approximately $168,967,000 of its capital loss carryforward was used to offset net taxable gains realized in fiscal year ended December 31, 2005. |
| (e) | Approximately $735,000 of its capital loss carryforward was used to offset net taxable gains realized in the fiscal year ended December 31, 2005. Approximately $2,522,000 expiring in 2012. |
| (f) | Approximately $1,242,000 expiring in 2013. |
| (g) | Approximately $127,052,000 of its capital loss carryforward was used to offset net taxable gains realized in the fiscal year ended December 31, 2005. |
| (h) | Approximately $138,535,000 of its capital loss carryforward was used to offset net taxable gains realized in the fiscal year ended December 31, 2005. |
C11
The following Portfolios expect to elect to treat losses incurred in the period November 1, 2005 through December 31, 2005 as having been incurred in the following fiscal year.
| Approximate Post October Losses | |||||
Portfolio | Currency | Capital | |||
Conservative Balanced Portfolio | — | $ | 21,890,000 | ||
Diversified Bond Portfolio | 380,500 | 1,114,000 | |||
Global Portfolio | 52,300 | — | |||
Government Income Portfolio | — | 855,200 | |||
High Yield Portfolio | 8,200 | — | |||
Jennison Portfolio | 49,400 | — | |||
Money Market Portfolio | — | 515 | |||
Natural Resources Portfolio | 19,600 | — | |||
Stock Index Portfolio | — | 20,012,000 | |||
Value Portfolio | 29,200 | — | |||
The United States federal income tax basis and unrealized appreciation (depreciation) of the Series Fund’s investments and the total net unrealized appreciation (depreciation) as of December 31, 2005 were as follows:
Portfolio | Tax Basis | Appreciation | Depreciation | Net | Other Cost Basis Adjustment | Total Net Unrealized | |||||||||||||||
Conservative Balanced Portfolio | $ | 2,965,504,365 | $ | 415,673,022 | $ | 267,119,901 | $ | 148,553,121 | $ | 45,916 | $ | 148,599,037 | |||||||||
Diversified Bond Portfolio | 1,443,740,286 | 12,077,405 | 13,100,515 | (1,023,110 | ) | 25,191 | (997,919 | ) | |||||||||||||
Equity Portfolio | 4,215,711,056 | 763,959,201 | 101,552,386 | 662,406,815 | (81 | ) | 662,406,734 | ||||||||||||||
Flexible Managed Portfolio | 3,832,681,427 | 305,846,272 | 105,504,656 | 200,341,616 | — | 200,341,616 | |||||||||||||||
Global Portfolio | 777,386,183 | 47,318,686 | 12,283,161 | 35,035,525 | 72,455 | 35,107,980 | |||||||||||||||
Government Income Portfolio | 426,564,668 | 2,415,580 | 4,557,830 | (2,142,250 | ) | 125,615 | (2,016,635 | ) | |||||||||||||
High Yield Bond Portfolio | 1,960,813,291 | 53,510,180 | 49,834,479 | 3,675,701 | (242,168 | ) | 3,433,533 | ||||||||||||||
Jennison Portfolio | 2,039,596,694 | 557,784,270 | 12,982,969 | 544,801,301 | — | 544,801,301 | |||||||||||||||
Natural Resources Portfolio | 801,571,236 | 415,461,896 | 24,619,218 | 390,842,678 | (5,494 | ) | 390,837,184 | ||||||||||||||
Small Capitalization Stock Portfolio | 631,773,690 | 262,256,476 | 53,906,454 | 208,350,022 | — | 208,350,022 | |||||||||||||||
Stock Index Portfolio | 2,602,564,839 | 1,195,543,285 | 272,754,425 | 922,788,860 | — | 922,788,860 | |||||||||||||||
Value Portfolio | 1,681,502,486 | 379,150,035 | 20,004,062 | 359,145,973 | — | 359,145,973 | |||||||||||||||
The difference between book basis and tax basis of investments are primarily attributable to deferred losses on wash sales and mark to market on passive foreign investments companies. The other cost basis adjustments are primarily attributable to appreciation (depreciation) of foreign currency and mark to market of receivables and payables.
| Note 7: | Capital |
The Series Fund offers Class I and Class II shares. Neither Class I nor Class II shares of a Portfolio are subject to any sales charge or redemption charge and are sold at the net asset value of the Portfolio. Class I
C12
shares are sold only to certain separate accounts of Prudential to fund benefits under certain variable life insurance and variable annuity contracts (“contracts”). Class II shares are sold only to separate accounts of non-Prudential insurance companies as investment options under certain contracts. The separate accounts invest in shares of the Series Fund through subaccounts that correspond to the Portfolios. The separate accounts will redeem shares of the Series Fund to the extent necessary to provide benefits under the contracts or for such other purposes as may be consistent with the contracts. As of December 31, 2005, the Equity, Jennison, Natural Resources and Value Portfolios have class II shares outstanding.
Transaction in shares of common stock of the Equity, Jennison, Natural Resources and Value Portfolios were as follows:
| Equity Portfolio: | |||||||
Class I | Shares | Amount | |||||
Year ended December 31, 2005: | |||||||
Capital stock sold | 2,989,262 | $ | 68,173,944 | ||||
Capital stock issued in reinvestment of dividends and distributions | 1,608,530 | 39,989,141 | |||||
Capital stock issued in connection with the merger | 1,320,590 | 28,041,417 | |||||
Capital stock repurchased | (17,406,826 | ) | (396,297,859 | ) | |||
Net increase (decrease) in shares outstanding | (11,488,444 | ) | $ | (260,093,357 | ) | ||
Year ended December 31, 2004: | |||||||
Capital stock sold | 4,880,675 | $ | 101,956,955 | ||||
Capital stock issued in reinvestment of dividends and distributions | 2,300,409 | 50,405,570 | |||||
Capital stock repurchased | (17,020,123 | ) | (355,777,280 | ) | |||
Net increase (decrease) in shares outstanding | (9,839,039 | ) | $ | (203,414,755 | ) | ||
Class II | |||||||
Year ended December 31, 2005: | |||||||
Capital stock sold | 48,657 | $ | 1,144,258 | ||||
Capital stock issued in reinvestment of dividends and distributions | 377 | 9,415 | |||||
Capital stock repurchased | (16,483 | ) | (383,800 | ) | |||
Net increase (decrease) in shares outstanding | 32,551 | $ | 769,873 | ||||
Year ended December 31, 2004: | |||||||
Capital stock sold | 21,633 | $ | 457,593 | ||||
Capital stock issued in reinvestment of dividends and distributions | 419 | 9,198 | |||||
Capital stock repurchased | (11,341 | ) | (235,818 | ) | |||
Net increase (decrease) in shares outstanding | 10,711 | $ | 230,973 | ||||
| Jennison Portfolio: | |||||||
Class I | Shares | Amount | |||||
Year ended December 31, 2005: | |||||||
Capital stock sold | 14,164,344 | $ | 263,061,616 | ||||
Capital stock issued in reinvestment of dividends and distributions | 107,900 | 2,181,501 | |||||
Capital stock repurchased | (16,325,260 | ) | (304,605,918 | ) | |||
Net increase (decrease) in shares outstanding | (2,053,016 | ) | $ | (39,362,801 | ) | ||
Year ended December 31, 2004: | |||||||
Capital stock sold | 19,266,794 | $ | 323,093,604 | ||||
Capital stock issued in reinvestment of dividends and distributions | 502,353 | 8,976,218 | |||||
Capital stock repurchased | (13,717,853 | ) | (230,738,958 | ) | |||
Net increase (decrease) in shares outstanding | 6,051,294 | $ | 101,330,864 | ||||
Class II | |||||||
Year ended December 31, 2005: | |||||||
Capital stock sold | 328,045 | $ | 5,995,003 | ||||
Capital stock issued in reinvestment of dividends and distributions | — | — | |||||
Capital stock repurchased | (4,162,411 | ) | (78,540,944 | ) | |||
Net increase (decrease) in shares outstanding | (3,834,366 | ) | $ | (72,545,941 | ) | ||
Year ended December 31, 2004: | |||||||
Capital stock sold | 1,014,749 | $ | 16,762,616 | ||||
Capital stock issued in reinvestment of dividends and distributions | 1,922 | 34,040 | |||||
Capital stock repurchased | (802,631 | ) | (13,178,750 | ) | |||
Net increase (decrease) in shares outstanding | 214,040 | $ | 3,617,906 | ||||
C13
| Natural Resources Portfolio: | |||||||
Class I | Shares | Amount | |||||
Year ended December 31, 2005: | |||||||
Capital stock sold | 2,361,004 | $ | 87,612,149 | ||||
Capital stock issued in reinvestment of dividends and distributions | 1,857,002 | 60,036,860 | |||||
Capital stock repurchased | (1,390,245 | ) | (51,805,248 | ) | |||
Net increase (decrease) in shares outstanding | 2,827,761 | $ | 95,843,761 | ||||
Year ended December 31, 2004: | |||||||
Capital stock sold | 1,401,282 | $ | 39,851,530 | ||||
Capital stock issued in reinvestment of dividends and distributions | 1,462,209 | 38,397,620 | |||||
Capital stock repurchased | (1,476,976 | ) | (41,027,681 | ) | |||
Net increase (decrease) in shares outstanding | 1,386,515 | $ | 37,221,469 | ||||
Class II* | |||||||
Period ended December 31, 2005: | |||||||
Capital stock sold | 225,207 | $ | 9,042,129 | ||||
Capital stock issued in reinvestment of dividends and distributions | — | — | |||||
Capital stock repurchased | (113,695 | ) | (4,576,511 | ) | |||
Net increase (decrease) in shares outstanding | 111,512 | $ | 4,465,618 | ||||
* Commencement of offering, April 28, 2005. |
| ||||||
| Value Portfolio: | |||||||
Class I | Shares | Amount | |||||
Year ended December 31, 2005: | |||||||
Capital stock sold | 3,282,027 | $ | 69,499,816 | ||||
Capital stock issued in reinvestment of dividends and distributions | 989,733 | 22,610,679 | |||||
Capital stock repurchased | (8,085,951 | ) | (170,356,605 | ) | |||
Net increase (decrease) in shares outstanding | (3,814,191 | ) | $ | (78,246,110 | ) | ||
Year ended December 31, 2004: | |||||||
Capital stock sold | 3,957,617 | $ | 72,230,270 | ||||
Capital stock issued in reinvestment of dividends | 1,040,398 | 20,412,598 | |||||
Capital stock repurchased | (8,791,625 | ) | (160,544,530 | ) | |||
Net increase (decrease) in shares outstanding | (3,793,610 | ) | $ | (67,901,662 | ) | ||
Class II | |||||||
Year ended December 31, 2005: | |||||||
Capital stock sold | 18,303 | $ | 373,418 | ||||
Capital stock issued in reinvestment of dividends and distributions | 1,162 | 26,899 | |||||
Capital stock repurchased | (33,039 | ) | (714,486 | ) | |||
Net increase (decrease) in shares outstanding | (13,574 | ) | $ | (314,169 | ) | ||
Year ended December 31, 2004: | |||||||
Capital stock sold | 3,819 | $ | 70,179 | ||||
Capital stock issued in reinvestment of dividends | 1,345 | 26,411 | |||||
Capital stock repurchased | (20,606 | ) | (371,071 | ) | |||
Net increase (decrease) in shares outstanding | (15,442 | ) | $ | (274,481 | ) | ||
| Note 8: | Borrowings |
The Series Fund (excluding the Money Market Portfolio), along with other affiliated registered investment companies (the “Funds”), is a party to a syndicated credit agreement (“SCA”) with two banks. The SCA provides for a commitment of $500 million. Interest on any borrowings under the SCA would be incurred at market rates. For the period from October 29, 2004 through October 28, 2005, the Series Fund paid a commitment fee of .075 of 1% of the unused portion of the agreement. Effective October 29, 2005, the Funds renewed the SCA with the banks. The commitment under the renewed SCA continues to be $500 million. The
C14
Series Fund pays a commitment fee of .0725 of 1% of the unused portion of the renewed SCA. The commitment fee is accrued daily and paid quarterly and is allocated to the Funds pro-rata based on net assets. The purpose of the SCA is to serve as an alternative source of funding for capital share redemptions. The expiration date of the renewed SCA is October 27, 2006.
The following Portfolios utilized the line of credit during the year ended December 31, 2005. The average balance outstanding is for the number of days the Portfolio had an outstanding balance.
Portfolio | Approximate Average Balance Outstanding | Number of Days Outstanding | Weighted Average Interest Rates | |||||
Equity Portfolio | $ | 1,953,000 | 5 | 4.23 | % | |||
Global Portfolio | 341,000 | 9 | 3.39 | % | ||||
Jennison Portfolio | 229,000 | 24 | 3.15 | % | ||||
Small Capitalization Stock Portfolio | 1,443,000 | 65 | 2.97 | % | ||||
Flexible Managed Portfolio. | 61,003,000 | 2 | 3.05 | % | ||||
| Note 9: | Other |
The Zero Coupon Bond Portfolio 2005 was liquidated on November 15, 2005. On the liquidation date, all of the securities held by the Portfolio were sold and all outstanding shares of the Portfolio were redeemed.
| Note 10: | Reorganization |
On November 18, 2004, the Board of Directors of the Series Fund approved an Agreement and Plan of Reorganization (“the Plan”) which provided for the transfer of all the assets of the SP MFS Capital Opportunities Portfolio to the Equity Portfolio and the assumption of its liabilities.
Shareholders approved the Plan at a meeting on April 19, 2005 and the reorganization took place on April 29, 2005. The acquisition was accomplished by a tax-free exchange of the following shares:
Merged Portfolio | Shares | ||||
SP MFS Capital Opportunities Portfolio | 4,239,055 | ||||
Acquiring Portfolio | Shares Issued | Total Net Assets Acquired | |||
Equity Portfolio | 1,320,590 | $ | 28,041,417 | ||
The aggregate net assets and unrealized appreciation of the Merged and Acquiring Portfolios immediately before the merger and the amount of the capital loss carryforward of the Merged Portfolio (subject to future utilization by the Acquiring Portfolio) were as follows:
Merged Portfolio | Total Net Assets | Unrealized Appreciation | Capital Loss Carryforward* | |||
SP MFS Capital Opportunities Portfolio | $28,041,417 | $697,864 | $1,494,000 | |||
Acquiring Portfolio | ||||||
Equity Portfolio | $3,833,180,027 | |||||
| * | The future utilization of the acquired capital loss carryforward may be limited under certain conditions defined in the Internal Revenue Code of 1986, as amended. |
| Note 11: | Ownership and Affiliates |
As of December 31, 2005, all of Class I shares of each Portfolio were owned of record by the Prudential Insurance Company of America (“PICA”) on behalf of the owners of the variable insurance products issued by PICA.
C15
| Note 12: | Change in Federal Income Tax Status and Related Reorganization |
On January 2, 2006, each Portfolio of the Fund changed its federal income tax status from a regulated investment company to a partnership. As a result of that conversion, the Fund was reorganized from a Maryland corporation to a Delaware statutory trust. Pursuant to this reorganization, the Fund has been renamed “The Prudential Series Fund.” Subsequent to January 2, 2006, each Portfolio’s income, gains, losses and credits will be allocated directly to its partners and will retain the same character for federal income tax purposes. Furthermore, subsequent to January 2, 2006 each portfolio will not be able to realize any future benefit from any unused capital loss carryforward and other losses (if any) deferred from each Portfolio fiscal year ended December 31, 2005 as detailed in Note 6.
The investment objectives, policies, restrictions, net asset values per share, service providers, fiscal years, and investment portfolios of the Portfolios have not changed. In addition, the Fund obtained opinions of counsel that the change in the tax status and the related reorganization had no adverse federal income tax consequences for the Portfolios or Contract owners.
C16
Financial Highlights
| Conservative Balanced Portfolio | ||||||||||||||||||||
| Year Ended December 31, | ||||||||||||||||||||
| 2005 | 2004 | 2003 | 2002 | 2001 | ||||||||||||||||
Per Share Operating Performance: | ||||||||||||||||||||
Net Asset Value, beginning of year | $ | 15.10 | $ | 14.34 | $ | 12.43 | $ | 13.69 | $ | 14.63 | ||||||||||
Income (Loss) From Investment Operations: | ||||||||||||||||||||
Net investment income | 0.38 | 0.34 | 0.28 | 0.34 | 0.44 | |||||||||||||||
Net realized and unrealized gains (losses) on investments | 0.11 | 0.78 | 1.99 | (1.57 | ) | (0.75 | ) | |||||||||||||
Total from investment operations | 0.49 | 1.12 | 2.27 | (1.23 | ) | (0.31 | ) | |||||||||||||
Less Distributions: | ||||||||||||||||||||
Dividends from net investment income | (0.35 | ) | (0.28 | ) | (0.36 | ) | — | (0.48 | ) | |||||||||||
Distributions from net realized gains | (0.15 | ) | (0.08 | ) | — | (0.03 | ) | (0.15 | ) | |||||||||||
Total distributions | (0.50 | ) | (0.36 | ) | (0.36 | ) | (0.03 | ) | (0.63 | ) | ||||||||||
Net Asset Value, end of year | $ | 15.09 | $ | 15.10 | $ | 14.34 | $ | 12.43 | $ | 13.69 | ||||||||||
Total Investment Return(a): | 3.43 | % | 8.04 | % | 18.77 | % | (8.98 | )% | (2.02 | )% | ||||||||||
Ratios/Supplemental Data: | ||||||||||||||||||||
Net assets, end of year (in millions) | $ | 2,749.8 | $ | 2,893.6 | $ | 2,895.0 | $ | 2,660.3 | $ | 3,259.7 | ||||||||||
Ratios to average net assets: | ||||||||||||||||||||
Expenses | 0.58 | % | 0.59 | % | 0.58 | % | 0.58 | % | 0.58 | % | ||||||||||
Net investment income | 2.45 | % | 2.27 | % | 2.02 | % | 2.49 | % | 3.05 | % | ||||||||||
Portfolio turnover rate | 110 | % | 153 | % | 248 | % | 260 | % | 239 | % | ||||||||||
| (a) | Total investment return is calculated assuming a purchase of shares on the first day and a sale on the last day of each year reported and includes reinvestment of dividends and distributions and does not reflect the effect of insurance contract charges. Total return does not reflect expenses associated with the separate account such as administrative fees, account charges and surrender charges which, if reflected, would reduce the total returns for all periods shown. Performance figures may reflect voluntary fee waivers and/or expense reimbursements. In the absence of voluntary fee waivers and/or expense reimbursements, the total return would be lower. Past performance is no guarantee of future results. |
| Diversified Bond Portfolio | ||||||||||||||||||||
| Year Ended December 31, | ||||||||||||||||||||
| 2005 | 2004 | 2003 | 2002 | 2001 | ||||||||||||||||
Per Share Operating Performance: | ||||||||||||||||||||
Net Asset Value, beginning of year | $ | 11.28 | $ | 11.17 | $ | 10.82 | $ | 11.36 | $ | 11.28 | ||||||||||
Income From Investment Operations: | ||||||||||||||||||||
Net investment income | 0.55 | 0.52 | 0.45 | 0.57 | 0.67 | |||||||||||||||
Net realized and unrealized gains (losses) on investments | (0.20 | ) | 0.09 | 0.35 | 0.17 | 0.12 | ||||||||||||||
Total from investment operations | 0.35 | 0.61 | 0.80 | 0.74 | 0.79 | |||||||||||||||
Less Dividends and Distributions: | ||||||||||||||||||||
Dividends from net investment income | (0.59 | ) | (0.50 | ) | (0.45 | ) | (1.27 | ) | (0.71 | ) | ||||||||||
Distributions from net realized gains | (0.08 | ) | — | — | — | — | ||||||||||||||
Tax return of capital distributions | — | — | — | (0.01 | ) | — | ||||||||||||||
Total dividends and distributions | (0.67 | ) | (0.50 | ) | (0.45 | ) | (1.28 | ) | (0.71 | ) | ||||||||||
Net Asset Value, end of year | $ | 10.96 | $ | 11.28 | $ | 11.17 | $ | 10.82 | $ | 11.36 | ||||||||||
Total Investment Return(a) | 3.28 | % | 5.59 | % | 7.49 | % | 7.07 | % | 6.98 | % | ||||||||||
Ratios/Supplemental Data: | ||||||||||||||||||||
Net assets, end of year (in millions) | $ | 1,230.6 | $ | 1,283.7 | $ | 1,418.0 | $ | 1,370.3 | $ | 1,400.7 | ||||||||||
Ratios to average net assets: | ||||||||||||||||||||
Expenses | 0.45 | % | 0.45 | % | 0.44 | % | 0.44 | % | 0.44 | % | ||||||||||
Net investment income | 4.81 | % | 4.57 | % | 4.02 | % | 5.25 | % | 6.35 | % | ||||||||||
Portfolio turnover rate | 278 | % | 382 | % | 706 | % | 595 | % | 257 | % | ||||||||||
| (a) | Total investment return is calculated assuming a purchase of shares on the first day and a sale on the last day of each year reported and includes reinvestment of dividends and distributions and does not reflect the effect of insurance contract charges. Total return does not reflect expenses associated with the separate account such as administrative fees, account charges and surrender charges which, if reflected, would reduce the total returns for all periods shown. Performance figures may reflect voluntary fee waivers and/or expense reimbursements. In the absence of voluntary fee waivers and/or expense reimbursements, the total return would be lower. Past performance is no guarantee of future results. |
SEE NOTES TO FINANCIAL STATEMENTS.
D1
Financial Highlights
Equity Portfolio Class I | ||||||||||||||||||||
Year Ended December 31, | ||||||||||||||||||||
| 2005 | 2004 | 2003 | 2002 | 2001 | ||||||||||||||||
Per Share Operating Performance: | ||||||||||||||||||||
Net Asset Value, beginning of year | $ | 22.31 | $ | 20.55 | $ | 15.75 | $ | 20.49 | $ | 24.50 | ||||||||||
Income From Investment Operations: | ||||||||||||||||||||
Net investment income | 0.24 | 0.28 | 0.17 | 0.17 | 0.18 | |||||||||||||||
Net realized and unrealized gains (losses) on investments | 2.32 | 1.75 | 4.81 | (4.75 | ) | (2.83 | ) | |||||||||||||
Total from investment operations | 2.56 | 2.03 | 4.98 | (4.58 | ) | (2.65 | ) | |||||||||||||
Less Dividends and Distributions: | ||||||||||||||||||||
Dividends from net investment income | (0.23 | ) | (0.27 | ) | (0.18 | ) | (0.16 | ) | (0.18 | ) | ||||||||||
Distributions from net realized gains | — | — | — | — | (1.18 | ) | ||||||||||||||
Total dividends and distributions | (0.23 | ) | (0.27 | ) | (0.18 | ) | (0.16 | ) | (1.36 | ) | ||||||||||
Net Asset Value, end of year | $ | 24.64 | $ | 22.31 | $ | 20.55 | $ | 15.75 | $ | 20.49 | ||||||||||
Total Investment Return(a) | 11.47 | % | 9.93 | % | 31.65 | % | (22.34 | )% | (11.18 | )% | ||||||||||
Ratios/Supplemental Data: | ||||||||||||||||||||
Net assets, end of year (in millions) | $ | 4,283.9 | $ | 4,135.7 | $ | 4,012.3 | $ | 3,273.6 | $ | 4,615.9 | ||||||||||
Ratios to average net assets: | ||||||||||||||||||||
Expenses | 0.47 | % | 0.48 | % | 0.49 | % | 0.48 | % | 0.49 | % | ||||||||||
Net investment income | 1.01 | % | 1.29 | % | 0.96 | % | 0.88 | % | 0.84 | % | ||||||||||
Portfolio turnover rate | 77 | % | 50 | % | 54 | % | 54 | % | 153 | % | ||||||||||
| (a) | Total investment return is calculated assuming a purchase of shares on the first day and a sale on the last day of each year reported and includes reinvestment of dividends and distributions and does not reflect the effect of insurance contract charges. Total return does not reflect expenses associated with the separate account such as administrative fees, account charges and surrender charges which, if reflected, would reduce the total returns for all periods shown. Performance figures may reflect voluntary fee waivers and/or expense reimbursements. In the absence of voluntary fee waivers and/or expense reimbursements, the total return would be lower. Past performance is no guarantee of future results. |
Equity Portfolio Class II | ||||||||||||||||||||
Year Ended December 31, | ||||||||||||||||||||
| 2005 | 2004 | 2003 | 2002 | 2001 | ||||||||||||||||
Per Share Operating Performance: | ||||||||||||||||||||
Net Asset Value, beginning of year | $ | 22.34 | $ | 20.58 | $ | 15.76 | $ | 20.49 | $ | 24.51 | ||||||||||
Income From Investment Operations: | ||||||||||||||||||||
Net investment income | 0.12 | 0.20 | 0.08 | 0.09 | 0.09 | |||||||||||||||
Net realized and unrealized gains (losses) on investments | 2.35 | 1.74 | 4.83 | (4.72 | ) | (2.83 | ) | |||||||||||||
Total from investment operations | 2.47 | 1.94 | 4.91 | (4.63 | ) | (2.74 | ) | |||||||||||||
Less Dividends and Distributions: | ||||||||||||||||||||
Dividends from net investment income | (0.12 | ) | (0.18 | ) | (0.09 | ) | (0.10 | ) | (0.10 | ) | ||||||||||
Distributions from net realized gains | — | — | — | — | (1.18 | ) | ||||||||||||||
Total dividends and distributions | (0.12 | ) | (0.18 | ) | (0.09 | ) | (0.10 | ) | (1.28 | ) | ||||||||||
Net Asset Value, end of year | $ | 24.69 | $ | 22.34 | $ | 20.58 | $ | 15.76 | $ | 20.49 | ||||||||||
Total Investment Return(a) | 11.04 | % | 9.51 | % | 31.11 | % | (22.62 | )% | (11.57 | )% | ||||||||||
Ratios/Supplemental Data: | ||||||||||||||||||||
Net assets, end of year (in millions) | $ | 2.1 | $ | 1.1 | $ | 0.8 | $ | 0.4 | $ | 1.1 | ||||||||||
Ratios to average net assets: | ||||||||||||||||||||
Expenses | 0.87 | % | 0.88 | % | 0.89 | % | 0.88 | % | 0.89 | % | ||||||||||
Net investment income | 0.64 | % | 0.91 | % | 0.54 | % | 0.46 | % | 0.45 | % | ||||||||||
Portfolio turnover rate | 77 | % | 50 | % | 54 | % | 54 | % | 153 | % | ||||||||||
| (a) | Total investment return is calculated assuming a purchase of shares on the first day and a sale on the last day of each year reported and includes reinvestment of dividends and distributions and does not reflect the effect of insurance contract charges. Total return does not reflect expenses associated with the separate account such as administrative fees, account charges and surrender charges which, if reflected, would reduce the total returns for all periods shown. Performance figures may reflect voluntary fee waivers and/or expense reimbursements. In the absence of voluntary fee waivers and/or expense reimbursements, the total return would be lower. Past performance is no guarantee of future results. |
SEE NOTES TO FINANCIAL STATEMENTS.
D2
Financial Highlights
| Flexible Managed Portfolio | ||||||||||||||||||||
| Year Ended December 31, | ||||||||||||||||||||
| 2005(b) | 2004 | 2003 | 2002 | 2001 | ||||||||||||||||
Per Share Operating Performance: | ||||||||||||||||||||
Net Asset Value, beginning of year | $ | 16.58 | $ | 15.19 | $ | 12.55 | $ | 14.79 | $ | 16.53 | ||||||||||
Income (Loss) From Investment Operations: | ||||||||||||||||||||
Net investment income | .32 | .29 | .22 | .27 | .42 | |||||||||||||||
Net realized and unrealized gains (losses) on investments | .34 | 1.32 | 2.70 | (2.10 | ) | (1.35 | ) | |||||||||||||
Total from investment operations | .66 | 1.61 | 2.92 | (1.83 | ) | (.93 | ) | |||||||||||||
Less Dividends and Distributions: | ||||||||||||||||||||
Dividends from net investment income | (.32 | ) | (.22 | ) | (.28 | ) | (.41 | ) | (.58 | ) | ||||||||||
Distributions from net realized gains | — | — | — | — | (.23 | ) | ||||||||||||||
Total dividends and distributions | (.32 | ) | (.22 | ) | (.28 | ) | (.41 | ) | (.81 | ) | ||||||||||
Net Asset Value, end of year | $ | 16.92 | $ | 16.58 | $ | 15.19 | $ | 12.55 | $ | 14.79 | ||||||||||
Total Investment Return(a): | 4.16 | % | 10.74 | % | 23.76 | % | (12.74 | )% | (5.68 | )% | ||||||||||
Ratios/Supplemental Data: | ||||||||||||||||||||
Net assets, end of year (000,000) | $ | 3,543.9 | $ | 3,883.5 | $ | 3,693.6 | $ | 3,181.0 | $ | 3,896.6 | ||||||||||
Ratios to average net assets: | ||||||||||||||||||||
Expenses | .63 | % | .62 | % | .62 | % | .63 | % | .64 | % | ||||||||||
Net investment income | 1.95 | % | 1.83 | % | 1.55 | % | 1.92 | % | 2.61 | % | ||||||||||
Portfolio turnover rate | 126 | % | 150 | % | 204 | % | 238 | % | 236 | % | ||||||||||
| (a) | Total investment return is calculated assuming a purchase of shares on the first day and a sale on the last day of each year reported and includes reinvestment of dividends and distributions and does not reflect the effect of insurance contract charges. Total return does not reflect expenses associated with the separate account such as administrative fees, account charges and surrender charges which, if reflected, would reduce the total returns for all periods shown. Performance figures may reflect voluntary fee waivers and/or expense reimbursements. In the absence of voluntary fee waivers and/or expense reimbursements, the total return would be lower. Past performance is no guarantee of future results. |
| (b) | Calculated based upon weighted average shares outstanding during the year. |
| Global Portfolio | ||||||||||||||||||||
| Year Ended December 31, | ||||||||||||||||||||
| 2005 | 2004 | 2003 | 2002 | 2001 | ||||||||||||||||
Per Share Operating Performance : | ||||||||||||||||||||
Net Asset Value, beginning of year | $ | 16.43 | $ | 15.14 | $ | 11.35 | $ | 15.29 | $ | 23.61 | ||||||||||
Income (Loss) From Investment Operations: | ||||||||||||||||||||
Net investment income | .13 | .11 | .10 | .07 | .09 | |||||||||||||||
Net realized and unrealized gains (losses) on investments | 2.50 | 1.33 | 3.74 | (3.87 | ) | (3.58 | ) | |||||||||||||
Total from investment operations | 2.63 | 1.44 | 3.84 | (3.80 | ) | (3.49 | ) | |||||||||||||
Less Dividends and Distributions: | ||||||||||||||||||||
Dividends from net investment income | (.10 | ) | (.15 | ) | (.05 | ) | (.14 | ) | (.06 | ) | ||||||||||
Distributions in excess of net investment income | — | — | — | — | — | |||||||||||||||
Distributions from net realized gains | — | — | — | — | (4.77 | ) | ||||||||||||||
Total dividends and distributions | (.10 | ) | (.15 | ) | (.05 | ) | (.14 | ) | (4.83 | ) | ||||||||||
Net Asset Value, end of year | $ | 18.96 | $ | 16.43 | $ | 15.14 | $ | 11.35 | $ | 15.29 | ||||||||||
Total Investment Return(a) | 16.06 | % | 9.59 | % | 34.07 | % | (25.14 | )% | (17.64 | )% | ||||||||||
Ratios/Supplemental Data: | ||||||||||||||||||||
Net assets, end of year (in millions) | $ | 814.1 | $ | 691.1 | $ | 665.6 | $ | 514.9 | $ | 885.0 | ||||||||||
Ratios to average net assets: | ||||||||||||||||||||
Expenses | .82 | % | .84 | % | .87 | % | .82 | % | .84 | % | ||||||||||
Net investment income | .77 | % | .67 | % | .78 | % | .47 | % | .58 | % | ||||||||||
Portfolio turnover rate | 155 | % | 128 | % | 88 | % | 75 | % | 67 | % | ||||||||||
| (a) | Total investment return is calculated assuming a purchase of shares on the first day and a sale on the last day of each year reported and includes reinvestment of dividends and distributions and does not reflect the effect of insurance contract charges. Total return does not reflect expenses associated with the separate account such as administrative fees, account charges and surrender charges which, if reflected, would reduce the total returns for all periods shown. Performance figures may reflect voluntary fee waivers and/or expense reimbursements. In the absence of voluntary fee waivers and/or expense reimbursements, the total return would be lower. Past performance is no guarantee of future results. |
SEE NOTES TO FINANCIAL STATEMENTS.
D3
Financial Highlights
| Government Income Portfolio | ||||||||||||||||||||
| Year Ended December 31, | ||||||||||||||||||||
| 2005 | 2004 | 2003 | 2002 | 2001 | ||||||||||||||||
Per Share Operating Performance : | ||||||||||||||||||||
Net Asset Value, beginning of year | $ | 11.65 | $ | 11.92 | $ | 12.50 | $ | 12.26 | $ | 12.02 | ||||||||||
Income (Loss) From Investment Operations: | ||||||||||||||||||||
Net investment income | .49 | .49 | .46 | .38 | .65 | |||||||||||||||
Net realized and unrealized gains (losses) on investments | (.20 | ) | (.13 | ) | (.15 | ) | 1.00 | .31 | ||||||||||||
Total from investment operations | .29 | .36 | .31 | 1.38 | .96 | |||||||||||||||
Less Dividends and Distributions: | ||||||||||||||||||||
Dividends from net investment income | (.54 | ) | (.44 | ) | (.46 | ) | (1.06 | ) | (.72 | ) | ||||||||||
Distributions from net realized gains | — | (.19 | ) | (.43 | ) | (.08 | ) | — | ||||||||||||
Total dividends and distributions | (.54 | ) | (.63 | ) | (.89 | ) | (1.14 | ) | (.72 | ) | ||||||||||
Net Asset Value, end of year | $ | 11.40 | $ | 11.65 | $ | 11.92 | $ | 12.50 | $ | 12.26 | ||||||||||
Total Investment Return(a) | 2.51 | % | 3.12 | % | 2.46 | % | 12.05 | % | 8.06 | % | ||||||||||
Ratios/Supplemental Data: | ||||||||||||||||||||
Net assets, end of year (in millions) | $ | 378.2 | $ | 420.2 | $ | 461.5 | $ | 484.3 | $ | 311.0 | ||||||||||
Ratios to average net assets: | ||||||||||||||||||||
Expenses | .47 | % | .47 | % | .46 | % | .44 | % | .47 | % | ||||||||||
Net investment income | 4.16 | % | 4.07 | % | 3.76 | % | 4.29 | % | 5.53 | % | ||||||||||
Portfolio turnover rate | 507 | % | 617 | % | 695 | % | 508 | % | 361 | % | ||||||||||
| (a) | Total investment return is calculated assuming a purchase of shares on the first day and a sale on the last day of each year reported and includes reinvestment of dividends and distributions and does not reflect the effect of insurance contract charges. Total return does not reflect expenses associated with the separate account such as administrative fees, account charges and surrender charges which, if reflected, would reduce the total returns for all periods shown. Performance figures may reflect voluntary fee waivers and/or expense reimbursements. In the absence of voluntary fee waivers and/or expense reimbursements, the total return would be lower. Past performance is no guarantee of future results. |
| High Yield Bond Portfolio | ||||||||||||||||||||
| Year Ended December 31, | ||||||||||||||||||||
| 2005 | 2004 | 2003 | 2002(a) | 2001 | ||||||||||||||||
Per Share Operating Performance : | ||||||||||||||||||||
Net Asset Value, beginning of year | $ | 5.42 | $ | 5.29 | $ | 4.59 | $ | 5.40 | $ | 6.14 | ||||||||||
Income (Loss) From Investment Operations: | ||||||||||||||||||||
Net investment income | .38 | .39 | .41 | .29 | .58 | |||||||||||||||
Net realized and unrealized gains (losses) on investments | (.20 | ) | .13 | .71 | (.21 | ) | (.62 | ) | ||||||||||||
Total from investment operations | .18 | .52 | 1.12 | .08 | (.04 | ) | ||||||||||||||
Less Distributions: | ||||||||||||||||||||
Dividends from net investment income | (.37 | ) | (.39 | ) | (.42 | ) | (.89 | ) | (.70 | ) | ||||||||||
Net Asset Value, end of year | $ | 5.23 | $ | 5.42 | $ | 5.29 | $ | 4.59 | $ | 5.40 | ||||||||||
Total Investment Return(a): | 3.41 | % | 10.30 | % | 25.04 | % | 1.50 | % | (.44 | )% | ||||||||||
Ratios/Supplemental Data: | ||||||||||||||||||||
Net assets, end of year (000,000) | $ | 1,635.7 | $ | 1,595.7 | $ | 1,466.7 | $ | 1,128.6 | $ | 655.8 | ||||||||||
Ratios to average net assets: | ||||||||||||||||||||
Expenses | .58 | % | .59 | % | .60 | % | .58 | % | .60 | % | ||||||||||
Net investment income | 7.14 | % | 7.42 | % | 8.11 | % | 9.36 | % | 10.93 | % | ||||||||||
Portfolio turnover rate | 56 | % | 65 | % | 93 | % | 77 | % | 84 | % | ||||||||||
| (a) | Total investment return is calculated assuming a purchase of shares on the first day and a sale on the last day of each year reported and includes reinvestment of dividends and distributions and does not reflect the effect of insurance contract charges. Total return does not reflect expenses associated with the separate account such as administrative fees, account charges and surrender charges which, if reflected, would reduce the total returns for all periods shown. Performance figures may reflect voluntary fee waivers and/or expense reimbursements. In the absence of voluntary fee waivers and/or expense reimbursements, the total return would be lower. Past performance is no guarantee of future results. |
SEE NOTES TO FINANCIAL STATEMENTS.
D4
Financial Highlights
| Jennison Portfolio | ||||||||||||||||||||
| Class I | ||||||||||||||||||||
| Year Ended December 31, | ||||||||||||||||||||
| 2005(b) | 2004 | 2003 | 2002 | 2001 | ||||||||||||||||
Per Share Operating Performance : | ||||||||||||||||||||
Net Asset Value, beginning of year | $ | 18.14 | $ | 16.62 | $ | 12.79 | $ | 18.57 | $ | 22.97 | ||||||||||
Income (Loss) From Investment Operations: | ||||||||||||||||||||
Net investment income | 0.02 | 0.08 | 0.04 | 0.03 | 0.04 | |||||||||||||||
Net realized and unrealized gains (losses) on investments | 2.62 | 1.52 | 3.83 | (5.78 | ) | (4.22 | ) | |||||||||||||
Total from investment operations | 2.64 | 1.60 | 3.87 | (5.75 | ) | (4.18 | ) | |||||||||||||
Less Dividends and Distributions: | ||||||||||||||||||||
Dividends from net investment income | (0.02 | ) | (0.08 | ) | (0.04 | ) | (0.03 | ) | (0.03 | ) | ||||||||||
Distributions from net realized gains | — | — | — | — | (0.19 | ) | ||||||||||||||
Total dividends and distributions | (0.02 | ) | (0.08 | ) | (0.04 | ) | (0.03 | ) | (0.22 | ) | ||||||||||
Net Asset Value, end of year | $ | 20.76 | $ | 18.14 | $ | 16.62 | $ | 12.79 | $ | 18.57 | ||||||||||
Total Investment Return(a) | 14.55 | % | 9.63 | % | 30.25 | % | (30.95 | )% | (18.25 | )% | ||||||||||
Ratios/Supplemental Data: | ||||||||||||||||||||
Net assets, end of year (in millions) | $ | 2,297.0 | $ | 2,044.1 | $ | 1,772.4 | $ | 1,388.8 | $ | 2,186.9 | ||||||||||
Ratios to average net assets: | ||||||||||||||||||||
Expenses | 0.63 | % | 0.64 | % | 0.64 | % | 0.61 | % | 0.64 | % | ||||||||||
Net investment income | 0.10 | % | 0.50 | % | 0.28 | % | 0.21 | % | 0.18 | % | ||||||||||
Portfolio turnover rate | 57 | % | 74 | % | 69 | % | 74 | % | 86 | % | ||||||||||
| (a) | Total investment return is calculated assuming a purchase of shares on the first day and a sale on the last day of each year reported and includes reinvestment of dividends and distributions and does not reflect the effect of insurance contract charges. Total return does not reflect expenses associated with the separate account such as administrative fees, account charges and surrender charges which, if reflected, would reduce the total returns for all periods shown. Performance figures may reflect voluntary fee waivers and/or expense reimbursements. In the absence of voluntary fee waivers and/or expense reimbursements, the total return would be lower. Past performance is no guarantee of future results. |
| (b) | Calculated based upon average shares during the year. |
| Jennison Portfolio | ||||||||||||||||||||
| Class II | ||||||||||||||||||||
| Year Ended December 31, | ||||||||||||||||||||
| 2005(c) | 2004 | 2003 | 2002 | 2001 | ||||||||||||||||
Per Share Operating Performance : | ||||||||||||||||||||
Net Asset Value, beginning of year | $ | 17.97 | $ | 16.46 | $ | 12.70 | $ | 18.45 | $ | 22.88 | ||||||||||
Income (Loss) From Investment Operations: | ||||||||||||||||||||
Net investment income (loss) | (0.05 | ) | 0.02 | (0.01 | ) | (0.02 | ) | 0.01 | ||||||||||||
Net realized and unrealized gains (losses) on investments | 2.57 | 1.50 | 3.77 | (5.73 | ) | (4.25 | ) | |||||||||||||
Total from investment operations | 2.52 | 1.52 | 3.76 | (5.75 | ) | (4.24 | ) | |||||||||||||
Less Dividends and Distributions: | ||||||||||||||||||||
Dividends from net investment income | — | (0.01 | ) | — | — | — | (b) | |||||||||||||
Distributions from net realized gains | — | — | — | — | (0.19 | ) | ||||||||||||||
Total dividends and distributions | — | (0.01 | ) | — | — | (0.19 | ) | |||||||||||||
Net Asset Value, end of year | $ | 20.49 | $ | 17.97 | $ | 16.46 | $ | 12.70 | $ | 18.45 | ||||||||||
Total Investment Return(a) | 14.02 | % | 9.22 | % | 29.61 | % | (31.17 | )% | (18.60 | )% | ||||||||||
Ratios/Supplemental Data: | ||||||||||||||||||||
Net assets, end of year (in millions) | $ | 18.2 | $ | 84.9 | $ | 74.3 | $ | 48.1 | $ | 59.6 | ||||||||||
Ratios to average net assets: | ||||||||||||||||||||
Expenses | 1.03 | % | 1.04 | % | 1.04 | % | 1.01 | % | 1.04 | % | ||||||||||
Net investment income (loss) | (0.27 | )% | 0.11 | % | (0.13 | )% | (0.19 | )% | (0.19 | )% | ||||||||||
Portfolio turnover rate | 57 | % | 74 | % | 69 | % | 74 | % | 86 | % | ||||||||||
| (a) | Total investment return is calculated assuming a purchase of shares on the first day and a sale on the last day of each year reported and includes reinvestment of dividends and distributions and does not reflect the effect of insurance contract charges. Total return does not reflect expenses associated with the separate account such as administrative fees, account charges and surrender charges which, if reflected, would reduce the total returns for all periods shown. Performance figures may reflect voluntary fee waivers and/or expense reimbursements. In the absence of voluntary fee waivers and/or expense reimbursements, the total return would be lower. Past performance is no guarantee of future results. |
| (b) | Less than $0.005 per share. |
| (c) | Calculated based upon average shares during the year. |
SEE NOTES TO FINANCIAL STATEMENTS.
D5
Financial Highlights
| Money Market Portfolio | ||||||||||||||||||||
| Year Ended December 31, | ||||||||||||||||||||
| 2005 | 2004 | 2003 | 2002 | 2001 | ||||||||||||||||
Per Share Operating Performance : | ||||||||||||||||||||
Net Asset Value, beginning of year | $ | 10.00 | $ | 10.00 | $ | 10.00 | $ | 10.00 | $ | 10.00 | ||||||||||
Income From Investment Operations: | ||||||||||||||||||||
Net investment income and realized gains | .28 | .10 | .08 | .15 | .41 | |||||||||||||||
Dividends and distributions | (.28 | ) | (.10 | ) | (.08 | ) | (.15 | ) | (.41 | ) | ||||||||||
Net Asset Value, end of year | $ | 10.00 | $ | 10.00 | $ | 10.00 | $ | 10.00 | $ | 10.00 | ||||||||||
Total Investment Return(a) | 2.85 | % | 1.01 | % | .84 | % | 1.52 | % | 4.22 | % | ||||||||||
Ratios/Supplemental Data: | ||||||||||||||||||||
Net assets, end of year (in millions) | $ | 851.9 | $ | 885.4 | $ | 933.7 | $ | 1,366.6 | $ | 1,501.9 | ||||||||||
Ratios to average net assets: | ||||||||||||||||||||
Expenses | .45 | % | .45 | % | .44 | % | .43 | % | .43 | % | ||||||||||
Net investment income | 2.86 | % | 1.01 | % | .84 | % | 1.52 | % | 3.86 | % | ||||||||||
| (a) | Total investment return is calculated assuming a purchase of shares on the first day and a sale on the last day of each year reported and includes reinvestment of dividends and distributions and does not reflect the effect of insurance contract charges. Total return does not reflect expenses associated with the separate account such as administrative fees, account charges and surrender charges which, if reflected, would reduce the total returns for all periods shown. Performance figures may reflect voluntary fee waivers and/or expense reimbursements. In the absence of voluntary fee waivers and/or expense reimbursements, the total return would be lower. Past performance is no guarantee of future results. |
| Natural Resources Portfolio | ||||||||||||||||||||
| Class I | ||||||||||||||||||||
| Year Ended December 31, | ||||||||||||||||||||
| 2005 | 2004 | 2003 | 2002 | 2001 | ||||||||||||||||
Per Share Operating Performance: | ||||||||||||||||||||
Net Asset Value, beginning of year | $ | 31.88 | $ | 27.49 | $ | 22.35 | $ | 19.11 | $ | 23.59 | ||||||||||
Income (Loss) From Investment Operations: | ||||||||||||||||||||
Net investment income | 0.33 | 0.19 | 0.25 | 0.09 | 0.43 | |||||||||||||||
Net realized and unrealized gains (losses) on investments | 16.27 | 6.28 | 7.38 | 3.52 | (2.89 | ) | ||||||||||||||
Total from investment operations | 16.60 | 6.47 | 7.63 | 3.61 | (2.46 | ) | ||||||||||||||
Less Dividends and Distributions: | ||||||||||||||||||||
Dividends from net investment income | — | (b) | (1.00 | ) | (0.98 | ) | (0.12 | ) | (0.55 | ) | ||||||||||
Distributions from net realized gains | (3.02 | ) | (1.08 | ) | (1.51 | ) | (0.25 | ) | (1.47 | ) | ||||||||||
Total dividends and distributions | (3.02 | ) | (2.08 | ) | (2.49 | ) | (0.37 | ) | (2.02 | ) | ||||||||||
Net Asset Value, end of year | $ | 45.46 | $ | 31.88 | $ | 27.49 | $ | 22.35 | $ | 19.11 | ||||||||||
Total Investment Return(a) | 55.91 | % | 25.17 | % | 39.00 | % | 18.92 | % | (10.08 | )% | ||||||||||
Ratios/Supplemental Data: | ||||||||||||||||||||
Net assets, end of year (in millions) | $ | 1,016.3 | $ | 622.6 | $ | 498.7 | $ | 379.2 | $ | 336.1 | ||||||||||
Ratios to average net assets: | ||||||||||||||||||||
Expenses | 0.49 | % | 0.51 | % | 0.51 | % | 0.50 | % | 0.52 | % | ||||||||||
Net investment income | 0.66 | % | 0.49 | % | 0.80 | % | 0.47 | % | 1.94 | % | ||||||||||
Portfolio turnover rate | 59 | % | 24 | % | 24 | % | 37 | % | 23 | % | ||||||||||
| (a) | Total investment return is calculated assuming a purchase of shares on the first day and a sale on the last day of each year reported and includes reinvestment of dividends and distributions and does not reflect the effect of insurance contract charges. Total return does not reflect expenses associated with the separate account such as administrative fees, account charges and surrender charges which, if reflected, would reduce the total returns for all periods shown. Performance figures may reflect voluntary fee waivers and/or expense reimbursements. In the absence of voluntary fee waivers and/or expense reimbursements, the total return would be lower. Past performance is no guarantee of future results. |
| (b) | Amount is less than $0.01 per share. |
SEE NOTES TO FINANCIAL STATEMENTS.
D6
Financial Highlights
| Natural Resources Portfolio | ||||
| Class II | ||||
| April 28, 2005(d) through December 31, 2005 | ||||
Per Share Operating Performance: | ||||
Net Asset Value, beginning of period | $ | 30.10 | ||
Income From Investment Operations: | ||||
Net investment income | 0.05 | |||
Net realized and unrealized gains on investments | 15.17 | |||
Total from investment operations | 15.22 | |||
Net Asset Value, end of period | $ | 45.32 | ||
Total Investment Return(a) | 50.56 | % | ||
Ratios/Supplemental Data: | ||||
Net assets, end of period (in millions) | $ | 5.1 | ||
Ratios to average net assets: | ||||
Expenses | 0.89 | %(b) | ||
Net investment income | 0.33 | %(b) | ||
Portfolio turnover rate | 59 | %(c) | ||
| (a) | Total investment return is calculated assuming a purchase of shares on the first day and a sale on the last day of each period reported and includes reinvestment of dividends and distributions and does not reflect the effect of insurance contract charges. Total investment returns for periods of less than one full year are not annualized. Total return does not reflect expenses associated with the separate account such as administrative fees, account charges and surrender charges which, if reflected, would reduce the total returns for all periods shown. Performance figures may reflect voluntary fee waivers and/or expense reimbursements. In the absence of voluntary fee waivers and/or expense reimbursements, the total return would be lower. Past performance is no guarantee of future results. |
| (b) | Annualized. |
| (c) | Not annualized. |
| (d) | Commencement of offering of Class II shares. |
| Small Capitalization Stock Portfolio | ||||||||||||||||||||
| Year Ended December 31, | ||||||||||||||||||||
| 2005 | 2004 | 2003 | 2002 | 2001 | ||||||||||||||||
Per Share Operating Performance: | ||||||||||||||||||||
Net Asset Value, beginning of year | $ | 21.33 | $ | 17.64 | $ | 12.91 | $ | 15.48 | $ | 17.11 | ||||||||||
Income (Loss) From Investment Operations: | ||||||||||||||||||||
Net investment income | 0.13 | 0.12 | 0.07 | 0.06 | 0.06 | |||||||||||||||
Net realized and unrealized gains (losses) on investments | 1.30 | 3.75 | 4.82 | (2.31 | ) | 0.67 | ||||||||||||||
Total from investment operations | 1.43 | 3.87 | 4.89 | (2.25 | ) | 0.73 | ||||||||||||||
Less Dividends and Distributions: | ||||||||||||||||||||
Dividends from net investment income | (0.13 | ) | (0.11 | ) | (0.07 | ) | (0.13 | ) | (0.08 | ) | ||||||||||
Distributions from net realized gains | (1.25 | ) | (0.07 | ) | (0.09 | ) | (0.19 | ) | (2.28 | ) | ||||||||||
Total dividends and distributions | (1.38 | ) | (0.18 | ) | (0.16 | ) | (0.32 | ) | (2.36 | ) | ||||||||||
Net Asset Value, end of year | $ | 21.38 | $ | 21.33 | $ | 17.64 | $ | 12.91 | $ | 15.48 | ||||||||||
Total Investment Return(a) | 7.26 | % | 22.04 | % | 38.27 | % | (14.92 | )% | 5.53 | % | ||||||||||
Ratios/Supplemental Data: | ||||||||||||||||||||
Net assets, end of year (in millions) | $ | 738.3 | $ | 743.2 | $ | 619.9 | $ | 467.4 | $ | 611.1 | ||||||||||
Ratios to average net assets: | ||||||||||||||||||||
Expenses | 0.46 | % | 0.47 | % | 0.48 | % | 0.46 | % | 0.48 | % | ||||||||||
Net investment income | 0.62 | % | 0.62 | % | 0.47 | % | 0.40 | % | 0.52 | % | ||||||||||
Portfolio turnover rate | 16 | % | 18 | % | 15 | % | 17 | % | 23 | % | ||||||||||
| (a) | Total investment return is calculated assuming a purchase of shares on the first day and a sale on the last day of each year reported and includes reinvestment of dividends and distributions and does not reflect the effect of insurance contract charges. Total return does not reflect expenses associated with the separate account such as administrative fees, account charges and surrender charges which, if reflected, would reduce the total returns for all periods shown. Performance figures may reflect voluntary fee waivers and/or expense reimbursements. In the absence of voluntary fee waivers and/or expense reimbursements, the total return would be lower. Past performance is no guarantee of future results. |
SEE NOTES TO FINANCIAL STATEMENTS.
D7
Financial Highlights
| Stock Index Portfolio | ||||||||||||||||||||
| Year Ended December 31, | ||||||||||||||||||||
| 2005 | 2004 | 2003 | 2002 | 2001 | ||||||||||||||||
Per Share Operating Performance: | ||||||||||||||||||||
Net Asset Value, beginning of year | $ | 31.29 | $ | 29.29 | $ | 24.09 | $ | 31.64 | $ | 38.66 | ||||||||||
Income (Loss) From Investment Operations: | ||||||||||||||||||||
Net investment income | .48 | .50 | .36 | .37 | .36 | |||||||||||||||
Net realized and unrealized gains (losses) on investments | .88 | 2.50 | 6.14 | (7.34 | ) | (5.05 | ) | |||||||||||||
Total from investment operations | 1.36 | 3.00 | 6.50 | (6.97 | ) | (4.69 | ) | |||||||||||||
Less Dividends and Distributions: | ||||||||||||||||||||
Dividends from net investment income | (.47 | ) | (.49 | ) | (.37 | ) | (.36 | ) | (.35 | ) | ||||||||||
Distributions from net realized gains | (.77 | ) | (.51 | ) | (.93 | ) | (.22 | ) | (1.98 | ) | ||||||||||
Total dividends and distributions | (1.24 | ) | (1.00 | ) | (1.30 | ) | (.58 | ) | (2.33 | ) | ||||||||||
Net Asset Value, end of year | $ | 31.41 | $ | 31.29 | $ | 29.29 | $ | 24.09 | $ | 31.64 | ||||||||||
Total Investment Return(a) | 4.54 | % | 10.45 | % | 28.18 | % | (22.19 | )% | (12.05 | )% | ||||||||||
Ratios/Supplemental Data: | ||||||||||||||||||||
Net assets, end of year (in millions) | $ | 3,212.7 | $ | 3,094.7 | $ | 2,940.9 | $ | 2,352.3 | $ | 3,394.1 | ||||||||||
Ratios to average net assets: | ||||||||||||||||||||
Expenses | .38 | % | .38 | % | .37 | % | .37 | % | .39 | % | ||||||||||
Net investment income | 1.52 | % | 1.64 | % | 1.42 | % | 1.25 | % | 1.02 | % | ||||||||||
Portfolio turnover rate | 7 | % | 3 | % | 2 | % | 4 | % | 3 | % | ||||||||||
| (a) | Total investment return is calculated assuming a purchase of shares on the first day and a sale on the last day of each year reported and includes reinvestment of dividends and distributions and does not reflect the effect of insurance contract charges. Total return does not reflect expenses associated with the separate account such as administrative fees, account charges and surrender charges which, if reflected, would reduce the total returns for all periods shown. Performance figures may reflect voluntary fee waivers and/or expense reimbursements. In the absence of voluntary fee waivers and/or expense reimbursements, the total return would be lower. Past performance is no guarantee of future results. |
| Value Portfolio | ||||||||||||||||||||
| Class I | ||||||||||||||||||||
| Year Ended December 31, | ||||||||||||||||||||
| 2005 | 2004 | 2003 | 2002(b) | 2001 | ||||||||||||||||
Per Share Operating Performance : | ||||||||||||||||||||
Net Asset Value, beginning of year | $ | 19.93 | $ | 17.36 | $ | 13.75 | $ | 17.91 | $ | 20.46 | ||||||||||
Income (Loss) From Investment Operations: | ||||||||||||||||||||
Net investment income | .29 | .28 | .23 | .22 | .25 | |||||||||||||||
Net realized and unrealized gains (losses) on investments | 3.03 | 2.55 | 3.62 | (4.15 | ) | (.69 | ) | |||||||||||||
Total From Investment Operations | 3.32 | 2.83 | 3.85 | (3.93 | ) | (.44 | ) | |||||||||||||
Less Dividends and Distributions: | ||||||||||||||||||||
Dividends from net investment income | (.30 | ) | (.26 | ) | (.24 | ) | (.23 | ) | (.30 | ) | ||||||||||
Distributions from net realized gains | — | — | — | — | (1.81 | ) | ||||||||||||||
Tax return of capital distributions | — | — | — | (c) | — | — | ||||||||||||||
Total dividends and distributions | (.30 | ) | (.26 | ) | (.24 | ) | (.23 | ) | (2.11 | ) | ||||||||||
Net Asset Value, end of year | $ | 22.95 | $ | 19.93 | $ | 17.36 | $ | 13.75 | $ | 17.91 | ||||||||||
Total Investment Return(a) | 16.66 | % | 16.31 | % | 28.07 | % | (21.97 | )% | (2.08 | )% | ||||||||||
Ratios/Supplemental Data: | ||||||||||||||||||||
Net assets, end of year (in millions) | $ | 1,750.1 | $ | 1,595.6 | $ | 1,456.1 | $ | 1,247.0 | $ | 1,801.4 | ||||||||||
Ratios to average net assets: | ||||||||||||||||||||
Expenses | .43 | % | .44 | % | .44 | % | .43 | % | .44 | % | ||||||||||
Net investment income | 1.35 | % | 1.48 | % | 1.49 | % | 1.39 | % | 1.32 | % | ||||||||||
Portfolio turnover rate | 56 | % | 52 | % | 72 | % | 94 | % | 175 | % | ||||||||||
| (a) | Total investment return is calculated assuming a purchase of shares on the first day and a sale on the last day of each year reported and includes reinvestment of dividends and distributions and does not reflect the effect of insurance contract charges. Total return does not reflect expenses associated with the separate account such as administrative fees, account charges and surrender charges which, if reflected, would reduce the total returns for all periods shown. Performance figures may reflect voluntary fee waivers and/or expense reimbursements. In the absence of voluntary fee waivers and/or expense reimbursements, the total return would be lower. Past performance is no guarantee of future results. |
| (b) | Calculated based upon weighted average shares outstanding during the year. |
| (c) | Less than $0.005 per share. |
SEE NOTES TO FINANCIAL STATEMENTS.
D8
Financial Highlights
| Value Portfolio | ||||||||||||||||||||
| Class II | ||||||||||||||||||||
| Year Ended December 31, | May 14, 2001(d) 2001 | |||||||||||||||||||
| 2005 | 2004 | 2003(e) | 2002(e) | |||||||||||||||||
Per Share Operating Performance : | ||||||||||||||||||||
Net Asset Value, beginning of period | $ | 19.94 | $ | 17.37 | $ | 13.75 | $ | 17.91 | $ | 19.79 | ||||||||||
Income (Loss) From Investment Operations: | ||||||||||||||||||||
Net investment income | .21 | .20 | .16 | .16 | .12 | |||||||||||||||
Net realized and unrealized gains (losses) on investments | 3.01 | 2.55 | 3.62 | (4.15 | ) | (1.01 | ) | |||||||||||||
Total from investment operations | 3.22 | 2.75 | 3.78 | (3.99 | ) | (.89 | ) | |||||||||||||
Less Dividends and Distributions: | ||||||||||||||||||||
Dividends from net investment income | (.18 | ) | (.18 | ) | (.16 | ) | (.17 | ) | (.14 | ) | ||||||||||
Distributions from net realized gains | — | — | — | — | (.85 | ) | ||||||||||||||
Tax return of capital distributions | — | — | — | (f) | — | — | ||||||||||||||
Total dividends and distributions | (.18 | ) | (.18 | ) | (.16 | ) | (.17 | ) | (.99 | ) | ||||||||||
Net Asset Value, end of period | $ | 22.98 | $ | 19.94 | $ | 17.37 | $ | 13.75 | $ | 17.91 | ||||||||||
Total Investment Return(a) | 16.21 | % | 15.83 | % | 27.63 | % | (22.35 | )% | (4.34 | )% | ||||||||||
Ratios/Supplemental Data: | ||||||||||||||||||||
Net assets, end of period (in millions) | $ | 3.1 | $ | 3.0 | $ | 2.9 | $ | 1.5 | $ | 1.1 | ||||||||||
Ratios to average net assets: | ||||||||||||||||||||
Expenses | .83 | % | .84 | % | .84 | % | .83 | % | .84 | %(b) | ||||||||||
Net investment income | .95 | % | 1.08 | % | 1.10 | % | 1.04 | % | .94 | %(b) | ||||||||||
Portfolio turnover rate | 56 | % | 52 | % | 72 | % | 94 | % | 175 | %(c) | ||||||||||
| (a) | Total investment return is calculated assuming a purchase of shares on the first day and a sale on the last day of each period reported and includes reinvestment of dividends and distributions and does not reflect the effect of insurance contract charges. Total investment returns for periods of less than one full year are not annualized. Total return does not reflect expenses associated with the separate account such as administrative fees, account charges and surrender charges which, if reflected, would reduce the total returns for all periods shown. Performance figures may reflect voluntary fee waivers and/or expense reimbursements. In the absence of voluntary fee waivers and/or expense reimbursements, the total return would be lower. Past performance is no guarantee of future results. |
| (b) | Annualized. |
| (c) | Not annualized. |
| (d) | Commencement of offering of Class II shares. |
| (e) | Calculated based upon weighted average shares outstanding during the year. |
| (f) | Less than $0.005 per share. |
SEE NOTES TO FINANCIAL STATEMENTS.
D9
REPORT OF INDEPENDENT REGISTERED PUBLIC ACCOUNTING FIRM
The Board of Directors and Shareholders of
The Prudential Series Fund, Inc.:
We have audited the accompanying statements of assets and liabilities of The Prudential Series Fund, Inc. (comprised of the Conservative Balanced Portfolio, Diversified Bond Portfolio, Equity Portfolio, Flexible Managed Portfolio, Global Portfolio, Government Income Portfolio, High Yield Bond Portfolio, Jennison Portfolio, Money Market Portfolio, Natural Resources Portfolio, Small Capitalization Stock Portfolio, Stock Index Portfolio, and Value Portfolio, hereafter collectively referred to as the “Funds”), including the portfolios of investments, as of December 31, 2005, and the related statements of operations for the year then ended, and the statements of changes in net assets and the financial highlights for each of years in the two-year period then ended. These financial statements and financial highlights are the responsibility of the Funds’ management. Our responsibility is to express an opinion on these financial statements and financial highlights based on our audits. The financial highlights for the years presented prior to the year ended December 31, 2004, were audited by another independent registered public accounting firm, whose report dated February 13, 2004, expressed an unqualified opinion thereon.
We conducted our audits in accordance with the standards of the Public Company Accounting Oversight Board (United States). Those standards require that we plan and perform the audit to obtain reasonable assurance about whether the financial statements and financial highlights are free of material misstatement. An audit includes examining, on a test basis, evidence supporting the amounts and disclosures in the financial statements. Our procedures included confirmation of securities owned as of December 31, 2005, by correspondence with the custodian and brokers or by other appropriate auditing procedures where replies from brokers were not received. An audit also includes assessing the accounting principles used and significant estimates made by management, as well as evaluating the overall financial statement presentation. We believe that our audits provide a reasonable basis for our opinion.
In our opinion, the financial statements and financial highlights referred to above present fairly, in all material respects, the financial position of the Funds as of December 31, 2005, and the results of their operations for the year then ended, and the changes in their net assets and the financial highlights for each of the years in the two-year period then ended, in conformity with U.S. generally accepted accounting principles.

New York, New York
February 21, 2006
E1
Tax Information (Unaudited)
Although we understand that the vast majority, if not all, of the shareholders/contract holders of the Series Fund currently maintain a tax deferred status, we are nevertheless required by the Internal Revenue Code to advise you within 60 days of the Series Fund's fiscal year end (December 31, 2005) as to the federal tax status of dividends paid by the Series Fund during such fiscal year. Accordingly, we are advising you that in 2005, the Series Fund paid dividends as follows:
Ordinary Dividends | Long-Term Capital | Total Distributions | ||||||||
Conservative Balanced Portfolio | $ | 0.401 | $ | 0.098 | $ | 0.499 | ||||
Diversified Bond Portfolio | 0.616 | 0.059 | 0.675 | |||||||
Equity Portfolio (Class I) | 0.231 | — | 0.231 | |||||||
Equity Portfolio (Class II) | 0.118 | — | 0.118 | |||||||
Flexible Managed Portfolio | 0.319 | — | 0.319 | |||||||
Global Portfolio | 0.100 | — | 0.100 | |||||||
Government Income Portfolio | 0.536 | — | 0.536 | |||||||
High Yield Bond Portfolio | 0.367 | — | 0.367 | |||||||
Jennison Portfolio (Class I) | 0.020 | — | 0.020 | |||||||
Jennison Portfolio (Class II) | — | — | — | |||||||
Money Market Portfolio | 0.281 | — | (a) | 0.281 | ||||||
Natural Resources Portfolio (Class I) | 0.038 | 2.986 | 3.024 | |||||||
Natural Resources Portfolio (Class II) | — | — | — | |||||||
Small Capitalization Stock Portfolio | 0.154 | 1.225 | 1.379 | |||||||
Stock Index Portfolio | 0.504 | 0.740 | 1.244 | |||||||
Value Portfolio (Class I) | 0.299 | — | 0.299 | |||||||
Value Portfolio (Class II) | 0.184 | — | 0.184 | |||||||
| (a) | Less than $0.005 per share |
Pursuant to Section 854 of the Internal Revenue Code, the following percentages of distributions from ordinary income for the year ended December 31, 2005 have been designated as being eligible for the dividends received deduction available to corporate shareholders:
Corporate Dividend Received Deduction | |||
Conservative Balanced Portfolio | 49.11 | % | |
Equity Portfolio | 100.00 | % | |
Flexible Managed Portfolio | 79.02 | % | |
Global Portfolio | 80.45 | % | |
High Yield Bond Portfolio | 1.78 | % | |
Jennison Portfolio | 100.00 | % | |
Natural Resources Portfolio | 100.00 | % | |
Small Capitalization Stock Portfolio | 80.76 | % | |
Stock Index Portfolio | 100.00 | % | |
Value Portfolio | 100.00 | % |
E2
MANAGEMENT OF THE FUND
(Unaudited)
Information pertaining to the Trustees of the Fund is set forth below. Trustees who are not deemed to be “interested persons” of the Fund as defined in the Investment Company Act are referred to as “Independent Trustees.” Trustees who are deemed to be “interested persons” of the Fund are referred to as “Interested Trustees.” “Fund Complex” consists of the Fund and any other investment companies managed by PI.
Name, Address**, and Age | Position with Fund* Term of Office*** Length of Time Served | Number of Portfolios In Fund Complex Overseen by Trustee | Other Directorships Held by the Trustee**** | |||
| Saul K. Fenster, Ph.D. (72) | Trustee, Since 1983 | 74 | Member (since 2000), Board of Directors of IDT Corporation | |||
| Principal Occupations During Past 5 Years – Currently President Emeritus of New Jersey Institute of Technology (since 2002); formerly President (1978-2002) of New Jersey Institute of Technology; Commissioner (1998-2002) of the Middle States Association Commission on Higher Education; Commissioner (1985-2002) of the New Jersey Commission on Science and Technology; formerly Director (1998-2005) of Society of Manufacturing Engineering Education Foundation, formerly Director of Prosperity New Jersey; formerly a director or trustee of Liberty Science Center, Research and Development Council of New Jersey, New Jersey State Chamber of Commerce, and National Action Council for Minorities in Engineering. | ||||||
| Delayne Dedrick Gold (67) | Trustee, Since 2001 | 73 | — | |||
| Principal Occupations During Past 5 Years – Marketing Consultant (1982-present); formerly Senior Vice President and Member of the Board of Directors, Prudential Bache Securities, Inc. | ||||||
| Julian A. Lerner (81) | Trustee Emeritus, Since 2003 | 73 | — | |||
| W. Scott McDonald, Jr. (68) | Vice Chairman and Trustee, Since 1983 | 74 | — | |||
| Principal Occupations During Past 5 Years – Formerly Management Consultant (1997-2004) and of Counsel (2004-2005) at Kaludis Consulting Group, Inc. (company serving higher education); Formerly principal (1995-1997), Scott McDonald & Associates, Chief Operating Officer (1991-1995), Fairleigh Dickinson University, Executive Vice President and Chief Operating Officer (1975-1991), Drew University, interim President (1988-1990), Drew University and former Director of School, College and University Underwriters Ltd. | ||||||
| Thomas T. Mooney (64) | Chairman and Trustee, Since 2001 | 73 | Director (since 1988) of The High Yield Plus Fund, Inc. | |||
| Principal Occupations During Past 5 Years – Chief Executive Officer, Excell Partners, Inc., formerly President of the Greater Rochester Metro Chamber of Commerce, Rochester City Manager; formerly Deputy Monroe County Executive. | ||||||
| Thomas M. O’Brien (55) | Trustee, Since 2003 | 73 | Director (December 1996-May 2000) of North Fork Bancorporation, Inc.; Director (since May 2000) of Atlantic Bank of New York. | |||
| Principal Occupations During Past 5 Years – President and Chief Executive Officer (since May 2000) of Atlantic Bank of New York; Vice Chairman (January 1997-April 2000) of North Fork Bank; President and Chief Executive Officer (December 1984-December 1996) of North Side Savings Bank | ||||||
| John A. Pileski (66) | Trustee, Since 2003 | Director (since April 2001) of New York Community Bank. | ||||
| Principal Occupations During Past 5 Years – Retired since June 2000; Tax Partner (July 1974-June 2000) of KPMG, LLP. | ||||||
| F. Don Schwartz (70) | Trustee, Since 2003 | 73 | — | |||
| Principal Occupations During Past 5 Years – Management Consultant (since April 1985). | ||||||
Interested Trustees | ||||||
Name, Address**, and Age | Position with Fund* Term of Office*** Length of Time Served | Number of Portfolios In Fund Complex Overseen by Trustee | Other Directorships Held by the Trustee**** | |||
| *David R. Odenath (48) | President and Trustee Since 1999 | 73 | — | |||
| Principal Occupations During Past 5 Years – President of Prudential Annuities (since August 2002); Senior Vice President (since June 1999) of Prudential; Executive Vice President (since May 2003) of Prudential Investment Management Services LLC; President, Chief Executive Officer, Chief Operating Officer, Officer in Charge and Director (since June 2005) of American Skandia Investment Services, Inc; Formerly President, Chief Executive Officer, Chief Operating Officer and Officer-In-Charge (September 1999-February 2003) of Prudential Investments LLC. | ||||||
F1
Interested Trustees | ||||||
Name, Address**, and Age | Position with Fund* Term of Office*** Length of Time Served | Number of Portfolios In Fund Complex Overseen by Trustee | Other Directorships Held by the Trustee**** | |||
| *Robert F. Gunia (59) | Vice President and Trustee since 2001 | 158 | Vice President and Director (since May 1989) and Treasurer (since 1999) of The Asia Pacific Fund, Inc.; Vice President (since 2004) and Director (since August 2005) of The High Yield Plus Fund, Inc. | |||
| Principal Occupations During Past 5 Years – Chief Administrative Officer (since September 1999) and Executive Vice President (since December 1996) of Prudential Investments LLC; President (since April 1999) of Prudential Investment Management Services LLC; Executive Vice President (since March 1999) and Treasurer (since May 2000) of Prudential Mutual Fund Services LLC. | ||||||
Officers | ||||
Name, Address**, and Age | Position with Fund* Term of Office*** Length of Time Served | Principal Occupations During Past 5 Years | ||
| Grace C. Torres (46) | Treasurer and Principal Financial and Accounting Officer Since 1997 | Assistant Treasurer (since March 1999) and Senior Vice President (since September 1999) of PI; Assistant Treasurer (since May 2003) and Vice President (since June 2005) of American Skandia Investment Services, Inc.; Senior Vice President and Assistant Treasurer (since May 2003) of American Skandia Advisory Services, Inc.; formerly Senior Vice President (May 2003-June 2005) of American Skandia Investment Services, Inc. | ||
| Kathryn L. Quirk (53) | Chief Legal Officer Since 2005 | Vice President and Corporate Counsel (since September 2004) of Prudential; Executive Vice President, Chief Legal Officer and Secretary (since July 2005) of Prudential Investments LLC and Prudential Mutual Fund Services LLC; formerly Managing Director, General Counsel, Chief Compliance Officer, Chief Risk Officer and Corporate Secretary (1997-2002) of Zurich Scudder Investments, Inc. | ||
| Deborah A. Docs (48) | Secretary Since 2005 | Vice President and Corporate Counsel (since January 2001) of Prudential; Vice President (since December 1996) and Assistant Secretary (since March 1999) of PI; formerly Vice President and Assistant Secretary (May 2003-June 2005) of American Skandia Investment Services, Inc. | ||
| Jonathan D. Shain (47) | Assistant Secretary Since 2005 | Vice President and Corporate Counsel (since August 1998) of Prudential Insurance; Vice President and Assistant Secretary (since May 2003) of American Skandia Investment Services, Inc. and American Skandia Fund Services, Inc.; formerly Attorney with Fleet Bank, N.A. (January 1997-July 1998). | ||
| Claudia DiGiacomo (31) | Assistant Secretary Since 2005 | Vice President and Corporate Counsel (since January 2005) of Prudential; Vice President and Assistant Secretary of PI (since December 2005);Associate at Sidley Austin Brown & Wood LLP (1999-2004). | ||
| John P. Schwartz (34) | Assistant Secretary Since 2005 | Vice President and Corporate Counsel (since January 2005) of Prudential; Vice President and Assistant Secretary of PI (since December 2005);Associate at Sidley Austin Brown & Wood LLP (1999-2004). | ||
| Lee D. Augsburger (46) | Chief Compliance Officer Since 2004 | Senior Vice President and Chief Compliance Officer (since April 2003) of PI; Vice President (since November 2000) and Chief Compliance Officer (since October 2000) of Prudential Investment Management, Inc.; Chief Compliance Officer and Senior Vice President (since May 2003) of American Skandia Investment Services, Inc.; Chief Compliance Officer (since October 2004) of Quantitative Management Associates LLC. | ||
| Helene Gurian (51) | Acting Anti-Money Laundering Compliance Officer Since 2005 | Vice President, Prudential (since July 1997). Vice President, Compliance (July 1997-January 2001); Vice President, Compliance and Risk Officer, Retail Distribution (January 2001- May 2002); Vice President, Corporate Investigations (May 2002-date) responsible for supervision of Prudential’s fraud investigations, anti-money laundering program and high technology investigation unit. | ||
* “Interested” Trustee, as defined in the Investment Company Act, by reason of employment with the Manager (as defined below), and/or the Distributor (as defined below).
** Unless otherwise noted, the address of the Trustees and Officers is c/o: Prudential Investments LLC, Gateway Center Three, 100 Mulberry Street, Newark, New Jersey 07102.
*** There is no set term of office for Trustees and Officers. The Independent Trustees have adopted a retirement policy, which calls for the retirement of Trustees on December 31 of the year in which they reach the age of 75. The table shows how long they have served as Trustee and/or Officer.
**** This column includes only directorships of companies required to register, or file reports with the SEC under the Securities Exchange Act of 1934 (i.e., “public companies”) or other investment companies registered under the Investment Company Act.
F2
Approval of New Investment Advisory Agreements
The Board of Trustees (the “Board”) of The Prudential Series Fund (the “Trust”) oversees the management of each of the Trust’s Portfolios, and, as required by law, is responsible for the approval of the Portfolio’s investment advisory agreements. At meetings held on September 13, 2005 and December 1, 2005, the Board met and approved new investment agreements for the Trust’s Portfolios. The material factors and conclusions that formed the basis for the Trustees’ determinations to approve the agreements are discussed separately below.
Equity Portfolio and SP Small Cap Value Portfolio (formerly, SP Goldman Sachs Small Cap Value Portfolio)
At its June 2005 meeting, the Board approved Salomon Brothers Asset Management, Inc. (“Salomon Brothers”) as an additional subadviser for the SP Small Cap Value Portfolio, to join the Portfolio’s existing subadviser, Goldman Sachs Asset Management, L.P. (“GSAM”). At the same meeting, as part of its annual approval of existing investment advisory agreements, the Board re-approved an existing subadvisory agreement with Salomon Brothers pursuant to which Salomon Brothers served as a subadviser for the Equity Portfolio. Thereafter, Salomon Brothers’ corporate parent, Citigroup, Inc., announced that it had entered into an agreement for Legg Mason to acquire substantially all of Citigroup’s worldwide asset management business during the fourth quarter of 2005. As part of this transaction, Salomon Brothers would become an indirect wholly owned subsidiary of Legg Mason.
Under the Investment Company Act of 1940 (the “1940 Act”), the change in corporate ownership of Salomon Brothers is treated as a “change in control” resulting in an “assignment” of Salomon Brothers’ subadvisory agreements. Pursuant to the 1940 Act and the terms of the subadvisory agreements, the subadvisory agreements approved by the Board in June 2005 would terminate when Legg Mason completed its acquisition of Salomon Brothers. Consequently, at its September 2005 meeting, the Board approved new subadvisory agreements with Salomon Brothers, to become effective upon the completion of the Legg Mason acquisition of Salomon Brothers. The new subadvisory agreements were identical in all material respects to the agreements approved by the Board in June 2005.
The Board noted that in approving the new subadvisory agreements with Salomon Brothers, it considered PI’s representation that the information it had reviewed when considering the subadvisory agreements earlier in the year remained materially unchanged. The Board further noted that in advance of the meeting, it had received materials and information from PI and Salomon Brothers indicating that no changes in the code of ethics, compliance policies, procedures, operation or management of Salomon Brothers was contemplated by Legg Mason. The Board was also provided with a description of Legg Mason. Before approving the new agreements, the Board also received an in-person presentation from representatives of Salomon Brothers.
Set out below are the material factors considered and conclusions reached by the Board at its June 2005 meeting in approving the subadvisory agreements with Salomon Brothers:
Nature, quality and extent of services. The Board received and considered information regarding the nature and extent of services provided to the Equity Portfolio under the existing subadvisory agreement and the services that would be provided to the SP Small Cap Value Portfolio by Salomon Brothers under the new subadvisory agreement. The Board noted that the nature and extent of services under the existing and new agreements were generally similar in that Salomon Brothers was required under both agreements to provide day-to-day portfolio management services and comply with all Portfolio policies and applicable rules and regulations.
With respect to the quality of services, the Board considered, among other things, the background and experience of Salomon Brothers’ portfolio management team. The Board reviewed the qualifications, backgrounds and responsibilities of the portfolio managers who would be responsible for the day-to-day management of the Portfolio. The Board was also provided with information pertaining to Salomon Brothers’ organizational structure, senior management, investment operations, and other relevant information pertaining to Salomon Brothers. The Board noted that it received a favorable compliance report from the Portfolio’s Chief Compliance Officer (CCO) as to Salomon Brothers.
The Board concluded that it was satisfied with the nature, extent and quality of the investment subadvisory services currently provided by Salomon Brothers to the Equity Portfolio, and the services anticipated to be provided to the SP Small Cap Value Portfolio by Salomon Brothers, and that there was a reasonable basis on which to conclude that the quality of investment subadvisory services to be provided by Salomon Brothers under the new subadvisory agreement should equal the quality of similar services provided by Salomon Brothers.
Performance of Equity Portfolio. The Board received and considered information about the Portfolio’s historical performance, noting that the Portfolio had achieved performance that was in the second quartile over a one-year time period and performance that was in the first quartile over three-year and five-year time periods in relation to a group of comparable mutual funds (the Peer Group). The funds included in the Peer Group are objectively determined solely by Lipper, Inc., an independent provider of investment company data. The Board noted that the Portfolio outperformed in comparison to its benchmark index over the same one-year and three-year time periods, and that the Portfolio’s performance was above the median performance of the other mutual funds included in the Peer Group over the same time periods. The Board also reviewed the performance of each “sleeve” of the Portfolio managed by Jennison Associates LLC and Salomon Brothers. The Board determined that the Portfolio’s performance was satisfactory.
Performance of SP Small Cap Value Portfolio. The Board received and considered information about the Portfolio’s historical performance, noting that the Portfolio had achieved performance that was in the third quartile over a one-year period and performance that was in the fourth quartile over a three-year period in relation to the group of comparable mutual funds in a Peer Universe.
While expressing the view that the Portfolio’s performance had been disappointing, the Board noted that the Manager had taken steps to address the performance issues by replacing the previous subadviser and that the Portfolio’s performance since Goldman Sachs Asset Management, L.P. (GSAM) assumed responsibility for managing the Portfolio in January 2004 was only slightly below the median performance of the mutual funds included in the Peer Group. In light of this, the Board concluded that it was reasonable to allow GSAM to continue to create a performance record against which GSAM should be evaluated, to approve the continuance of the GSAM subadvisory agreement and to continue to monitor the situation.
The Board further noted that, pursuant to a recommendation from the Manager, a new subadvisory agreement with Salomon Brothers had been approved because GSAM was expected to approach its capacity limits in the near future. The Board received and considered information regarding the performance of other investment companies managed by Salomon Brothers utilizing an investment style and strategy similar to that proposed for the Portfolio, noting that Salomon Brothers had generally outperformed the various benchmarks over the same time period.
Investment Subadvisory Fee Rates. The Board considered the subadvisory fee received by Salomon Brothers under the Equity Portfolio subadvisory agreement as well as the proposed subadvisory fee rate of 0.40% payable by the Manager to Salomon Brothers under the proposed
new subadvisory agreement with respect to the SP Small Cap Value Portfolio, including among other things, the fee rate payable to Salomon Brothers by any other funds with investment objective similar to that of the Portfolios. As a result of the above considerations, the Board concluded that Salomon Brothers’ existing and proposed subadvisory fee rates under the agreements were reasonable.
Subadviser’s Profitability. Because the engagement of Salomon Brothers for the SP Small Cap Value Portfolio is new, there is no historical profitability with regard to its arrangements with the Portfolio. As a result, the Board did not consider this factor. The Board noted that the Manager pays the subadvisory fees, and therefore a change in the subadvisory fees will not change the fees paid by the Portfolio. Instead, any increase or decrease will increase or decrease, as applicable, the net fee rates retained by the Manager. The Board noted that profitability would be reviewed annually in connection with the review of advisory agreements.
Economies of Scale. The Board noted that the proposed subadvisory fee schedule for the SP Small Cap Value Portfolio does not contain breakpoints that reduce the fee rate on assets above specified levels. However, in light of the size of the Portfolio’s assets to be managed by Salomon Brothers, the Board concluded that the absence of breakpoints in the Portfolio’s fee schedule is acceptable at this time.
The Board noted that the subadvisory fee rate for the Equity Portfolio does contain a breakpoint that reduces the fee rate on assets above a specified level.
Other Benefits to the Subadviser or its affiliates from serving as Subadviser. The Board considered potential “fall-out” or ancillary benefits anticipated to be received by Salomon Brothers and its affiliates as a result of Salomon Brothers’ relationship with the Portfolios. The Board concluded that any potential benefits to be derived by Salomon Brothers included potential access to additional research resources, larger assets under management and reputational benefits, which were consistent with those generally derived by subadvisers to mutual funds.
Fund Reorganization
The Board considered and approved the reorganization of the Trust from a corporation organized under the laws of Maryland to a trust organized under the laws of Delaware. In connection with the reorganization, the Board reviewed and approved a new investment management agreement with the Trust’s Manager, Prudential Investments LLC (the “Manager” or “PI”) and new subadvisory agreements with each Portfolio’s current subadviser(s).
With respect to PI, the Board noted that at its June 2005 meeting, it had received information about PI and concluded that it was satisfied with the nature, quality and extent of services provided by PI under the investment management agreement. PI represented that there had been no material change to PI itself and the services it would provide to the Trust since June 2005. The Board determined that the reorganization would not result in any material change in the services provided by PI. Therefore, the Board determined that it was reasonable to conclude that the nature, quality and extent of services to be provided by PI under the new investment management agreement would be similar in nature to those provided under the existing investment management agreement. The Board concluded that the factors underlying the conclusions it reached in approving the investment management agreement with PI at the June 2005 meeting remained materially unchanged.
Similarly, with respect to the subadvisers, the Board noted that at its June 2005 meeting, it had received information about each subadviser and concluded that it was satisfied with the nature, quality and extent of services provided by each subadviser under the subadvisory agreements. PI similarly represented that there had been no material change to the subadvisers and the services they provided since June 2005, and the Board determined that it was reasonable to
conclude that the nature, quality and extent of services to be provided by PI under the new subadvisory agreements would be similar in nature to those provided under the existing subadvisory agreements. The Board concluded that the factors underlying the conclusions that it reached in approving the subadvisory agreements at the June 2005 meeting remained materially unchanged.
The Board further noted that it had previously reviewed and approved for inclusion in the Trust’s semi-annual shareholder report a discussion of the material factors and conclusions reached in approving the investment management and subadvisory agreements at its June 2005 meeting.
This report contains financial information about certain investment choices that may be available on the variable life insurance and variable annuity contracts listed below. You may receive additional reports and should refer to your variable life insurance or variable annuity contract prospectus to determine which portfolios are available to you.
VARIABLE LIFE INSURANCE
| n | Prudential’s Variable Appreciable Life® |
| n | Pruco Life’s Variable Appreciable Life® |
| n | Pruco Life of New Jersey’s Variable Appreciable Life® |
| n | Prudential’s Custom VALSM |
| n | Pruco Life’s Discovery® Life Plus |
| n | Pruco Life of New Jersey’s Discovery® Life Plus |
| n | Pruco Life’s Variable Life Insurance |
| n | Pruco Life of New Jersey’s Variable Life Insurance |
| n | Pruco Life’s PRUviderSM |
| n | Pruco Life of New Jersey’s PRUviderSM |
| n | Prudential’s Survivorship Preferred® |
| n | Prudential’s Variable Universal Life |
| n | Pruco Life’s Variable Universal Life® |
| n | Pruco Life’s Survivorship Variable Universal Life |
| n | Pruco Life of New Jersey’s Survivorship Variable Universal Life |
| n | Pruco Life’s Pruselect ISM |
| n | Pruco Life’s Pruselect IISM |
| n | Pruco Life’s PruLife® Custom Premier |
| n | Pruco Life of New Jersey’s PruLife® Custom Premier |
| n | Pruco Life’s PruSelectSM III |
| n | Pruco Life of New Jersey’s PruSelectSM III |
| n | Pruco Life’s Magnastar |
| n | Pruco Life’s MPremierSM VUL |
VARIABLE ANNUITIES
| n | Prudential’s Discovery® Plus |
| n | Pruco Life’s Discovery® Plus |
| n | Pruco Life of New Jersey’s Discovery® Plus |
| n | Pruco Life’s Discovery Preferred® |
| n | Prudential’s Variable Investment Plan® |
| n | Prudential’s Qualified Variable Investment Plan® |
| n | Pruco Life’s Discovery Select® |
| n | Pruco Life of New Jersey’s Discovery Select® |
| n | Pruco Life’s Discovery Choice® |
| n | Pruco Life of New Jersey’s Discovery Choice® |
| n | Pruco Life’s Strategic PartnersSM Annuity One |
| n | Pruco Life of New Jersey’s Strategic PartnersSM Annuity One |
| n | Pruco Life’s Strategic PartnersSM Select |
| n | Pruco Life of New Jersey’s Strategic PartnersSM Select |
| n | Pruco Life’s Strategic PartnersSM Advisor |
| n | Pruco Life of New Jersey’s Strategic PartnersSM Advisor |
| n | Pruco Life’s Strategic PartnersSM FlexElite |
| n | Pruco Life of New Jersey’s Strategic PartnersSM FlexElite |
| n | Pruco Life’s Strategic PartnersSM Plus |
| n | Pruco Life of New Jersey’s Strategic PartnersSM Plus |
Variable life insurance is distributed by Pruco Securities LLC, member SIPC, 751 Broad Street, Newark, NJ 07102-3777. Variable annuities are distributed through Prudential Investment Management Services LLC (PIMS), member SIPC, Gateway Center Three, 14th Floor, Newark, NJ 07102-4077. Variable life insurance and variable annuities are issued by The Prudential Insurance Company of America, Pruco Life Insurance Company, or in New York, Pruco Life Insurance Company of New Jersey. All are Prudential Financial companies. Each is solely responsible for its own financial condition and contractual obligations. Contract guarantees are based on the claims-paying ability of the issuing company.
The 2005 Audited Financial Statements of Pruco Life Insurance Company, Pruco Life Insurance Company of New Jersey, and The Prudential Insurance Company of America will be available commencing April 30, 2006. You may call (888) 778-2888 to obtain a free copy of the audited financial statements of the insurance company that issued your contract.
To reduce costs, we now generally send only a single copy of prospectuses and shareholder reports to each household (“householding”) in lieu of sending a copy to each Contract Owner who resides in the household. You should be aware that by calling (877) 778-5008, you can revoke or “opt out” of householding at any time.
Prudential Financial and the Rock logo are service marks of The Prudential Insurance Company of America, Newark, NJ, and its affiliates.
751 Broad Street
Newark NJ 07102-3777
Presorted
Standard
U.S. Postage
PAID
Prudential
IFS-A114446 PSF-AR-A Ed. 02/2006

ANNUAL REPORT
DECEMBER 31, 2005
The Prudential Series Fund

| n | SP Aggressive Growth Asset Allocation Portfolio |
| n | SP AIM Core Equity Portfolio |
| n | SP Balanced Asset Allocation Portfolio |
| n | SP Conservative Asset Allocation Portfolio |
| n | SP Davis Value Portfolio |
| n | SP Growth Asset Allocation Portfolio |
| n | SP Large Cap Value Portfolio |
| n | SP LSV International Value Portfolio |
| n | SP Mid Cap Growth Portfolio |
| n | SP PIMCO High Yield Portfolio |
| n | SP PIMCO Total Return Portfolio |
| n | SP Prudential U.S. Emerging Growth Portfolio |
| n | SP Small Cap Growth Portfolio |
| n | SP Small Cap Value Portfolio |
| n | SP Strategic Partners Focused Growth Portfolio |
| n | SP T. Rowe Price Large Cap Growth Portfolio |
| n | SP William Blair International Growth Portfolio |
Please note that inside is a Prospectus Supplement dated December 19th, 2005. This document is separate from and not a part of the annual report.
The Prudential Insurance Company of America
751 Broad Street, Newark, NJ 07102-3777
Pruco Life Insurance Company
Pruco Life Insurance Company of New Jersey
213 Washington Street, Newark, NJ 07102-2992
Pruco Life Insurance Company is not licensed to do business in New York.
IFS-A114669

This report is one of several that provide financial information about certain investment choices available on variable life insurance and variable annuity contracts. Based on the variable contract you own or the portfolios you invested in, you may receive additional reports that provide financial information on those investment choices. Please refer to your variable life insurance or variable annuity contract prospectus to determine which portfolios are available to you. A list of the variable contracts that this report supports is located on the inside back cover. |
This report must be preceded or accompanied by the current prospectuses for the Prudential Series Fund portfolios and the applicable variable life or annuity contract. The prospectuses contain information on the investment objectives, risks, and charges and expenses and should be read carefully.
The contract’s prospectus contains hypothetical performance illustrations that show the effect of various assumptions regarding the cost of insurance protection. You may also obtain a personalized illustration of historical performance that reflects the cost of your policy’s insurance protection.
DISCOVER THE BENEFITS OF eDelivery
| n | Eliminate receiving printed reports. |
| n | View documents on-line as they become available. |
| n | Download and store e-reports on your PC. |
| n | Help the environment by using less paper. |
To receive your semiannual/annual reports on-line, go to www.prudential.com/edelivery and enroll. Instead of receiving printed reports, you will receive notification via e-mail when new materials are available for your review. You can cancel your enrollment or change your e-mail address at any time by visiting the internet address listed above.
A description of the Fund’s proxy voting policies and procedures is available, without charge, upon request. Owners of variable annuity contracts should call 888-778-2888 and owners of variable life insurance contracts should call 800-778-2255 to obtain descriptions of the Fund’s proxy voting policies and procedures. The description is also available on the website of the Securities and Exchange Commission (the “Commission”) at www.sec.gov. Information regarding how the Fund voted proxies relating to portfolio securities during the most recent 12-month period ended June 30, is available on the website of the Commission at www.sec.gov and on the Fund’s website at www.irrc.com/prudential.
The Fund files with the Commission a complete listing of portfolio holdings as of its first and third quarter-ends on Form N-Q. Form N-Q is available on the Commission’s website at www.sec.gov or by visiting the Commission’s Public Reference Room. For more information on the Commission’s Public Reference Room, please visit the Commission’s website or call 800-SEC-0330. Form N-Q is also available on the Fund’s website at www.prudential.com or by calling the telephone numbers referenced above.
The Fund’s Statement of Additional Information contains additional information about the Fund’s Trustees and is available without charge upon request by calling 888-778-2888.

The Prudential Series Fund
Annual Report
December 31, 2005
Table of Contents
| n | LETTER TO CONTRACT OWNERS |
| n | MANAGEMENT REVIEW |
| n | PORTFOLIO COMPOSITION |
| n | FEES AND EXPENSES TABLE |
| n | FINANCIAL REPORTS |
A1 Financial Statements
B1 Schedule of Investments
C1 Notes to Financial Statements
D1 Financial Highlights
E1 Report of Independent Registered Accounting Firm
F1 Management of the Prudential Series Fund
| n | APPROVALS OF ADVISORY AGREEMENTS |
This report may include financial information pertaining to certain portfolios that are not available through the variable life insurance policy or variable annuity contract that you have chosen. Please refer to your variable life insurance or variable annuity prospectus to determine which portfolios are available to you.
The Prudential Series Fund, SP Aggressive Growth Asset Allocation Portfolio
Subadvised by: Prudential Investment Management, Inc.
December 31, 2005
Investment Manager’s Report
Performance Summary - As of December 31, 2005
Average Annual Total Return Percentages
| 1-Year | 5-Year | Since Inception | |||||||
SP Aggressive Growth Asset Allocation Portfolio | 10.48 | % | 1.46 | % | 0.07 | % | |||
S&P 500 Index | 4.91 | 0.54 | -1.03 | ||||||
Aggressive Growth AA Custom Blended Index | 7.64 | 2.21 | 0.55 | ||||||
Lipper (VIP) Multi Cap Core Funds Avg. | 6.66 | 1.72 | 0.66 |
Portfolio inception: 9/22/2000.
$10,000 INVESTED SINCE INCEPTION
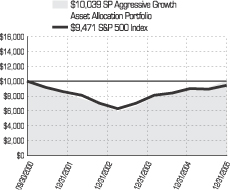
Past performance does not guarantee future returns. Portfolio performance is net of investment fees and fund expenses, but not product charges, which, if included, would significantly lower the performance quoted. The investment return and principal value of an investment will fluctuate, so that an investor’s shares, when redeemed, may be worth more or less than their original cost. Current performance may be lower or higher than the past performance data quoted.
Unless noted otherwise, Lipper Average and Index returns reflect performance beginning the closest month-end date to the Portfolio’s inception.
For the year ended December 31, 2005, the SP Aggressive Growth Asset Allocation Portfolio had a total return that was above its Custom Index benchmark and substantially above the average of its peer group.
The Portfolio is structured as a “fund of funds” that is invested in certain other Prudential Series Funds and American-Skandia Trust Portfolios. The Portfolio outperformed the Custom Index benchmark because of both the strong performance of its component portfolios and its asset allocation compared to the benchmark.
Its Prudential Series Fund Jennison Large Cap Growth component made the largest contribution to the Portfolio’s relative performance by outperforming the Russell 1000® Growth Index by a wide margin, primarily due to strong stock selection within the technology sector. The Prudential Series Fund William Blair International Growth Portfolio also added to relative performance on the strength of its stock selection and its exposure to emerging-market countries. The American Skandia Trust Marsico Capital Growth Portfolio outperformed because of its stock selection within the technology and healthcare sectors.
The Portfolio benefited from an overweight compared with its Custom benchmark in international equities. Foreign stocks had substantially higher returns than U.S. stocks in 2005 and emerging-market countries were particularly strong. The addition of the Prudential Series Fund Natural Resources Portfolio in August also strengthened the Portfolio’s performance as it had a large commitment to the energy sector, which had very high returns in August and September 2005.
Prudential Investments LLC (PI), a wholly owned subsidiary of Prudential Financial, Inc., serves as the overall investment manager for The Prudential Series Fund.
For average and index definitions, refer to the Glossary of Benchmark Definitions page. Investors cannot invest directly in a market index or average. For a complete list of holdings, refer to the Schedule of Investments section of this report.
The Prudential Series Fund, SP AIM Core Equity Portfolio
Subadvised by: A I M Capital Management, Inc.
December 31, 2005
Investment Manager’s Report
Performance Summary - As of December 31, 2005
Average Annual Total Return Percentages
| 1-Year | 5-Year | Since Inception | |||||||
SP AIM Core Equity Portfolio | 4.63 | % | -1.59 | % | -4.65 | % | |||
S&P 500 Index | 4.91 | 0.54 | -1.03 | ||||||
Russell 1000® Index | 6.27 | 1.07 | -0.81 | ||||||
Lipper (VIP) Large Cap Core Avg. | 5.77 | -0.48 | -1.74 |
Portfolio inception: 9/22/2000.
$10,000 INVESTED SINCE INCEPTION
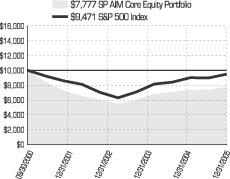
Past performance does not guarantee future returns. Portfolio performance is net of investment fees and fund expenses, but not product charges, which, if included, would significantly lower the performance quoted. The investment return and principal value of an investment will fluctuate, so that an investor’s shares, when redeemed, may be worth more or less than their original cost. Current performance may be lower or higher than the past performance data quoted.
Unless noted otherwise, Lipper Average and Index returns reflect performance beginning the closest month-end date to the Portfolio’s inception. A portion of the Portfolio’s expenses is subsidized. Absent such subsidy, the performance quoted would be lower. The subsidy may be discontinued at any time.
For the year ended December 31, 2005, the SP AIM Core Equity Portfolio had a total return that was below its benchmark indexes and below the average of its peer group.
The Portfolio’s performance was hurt by the underperformance of its stock selections in the consumer staples, consumer discretionary, and utilities sectors. This was mitigated somewhat by its good overall sector composition, particularly its overweights compared with the Russell 1000® Index in the commodity-sensitive energy and materials sectors and its underweight in the poor-performing consumer discretionary sector. These advantageous weightings helped offset unfavorable overweights in the technology and consumer staples sectors and below-benchmark exposure to the relatively strong financials sector. The Portfolio benefited from its stock selection in the commodity-sensitive sectors and, to a lesser extent, healthcare.
Prudential Investments LLC (PI), a wholly owned subsidiary of Prudential Financial, Inc., serves as the overall investment manager for The Prudential Series Fund.
For average and index definitions, refer to the Glossary of Benchmark Definitions page. Investors cannot invest directly in a market index or average. For a complete list of holdings, refer to the Schedule of Investments section of this report.
The Prudential Series Fund, SP Balanced Asset Allocation Portfolio
Subadvised by: Prudential Investment Management, Inc.
December 31, 2005
Investment Manager’s Report
Performance Summary - As of December 31, 2005
Average Annual Total Return Percentages
| 1-Year | 5-Year | Since Inception | |||||||
SP Balanced Asset Allocation Portfolio | 7.60 | % | 4.05 | % | 3.56 | % | |||
S&P 500 Index | 4.91 | 0.54 | -1.03 | ||||||
Balanced AA Custom Blended Index | 5.63 | 4.01 | 3.21 | ||||||
Lipper (VIP) Balanced Funds Avg. | 4.78 | 3.33 | 2.93 |
Portfolio inception: 9/22/2000.
$10,000 INVESTED SINCE INCEPTION
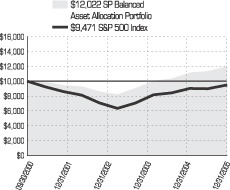
Past performance does not guarantee future returns. Portfolio performance is net of investment fees and fund expenses, but not product charges, which, if included, would significantly lower the performance quoted. The investment return and principal value of an investment will fluctuate, so that an investor’s shares, when redeemed, may be worth more or less than their original cost. Current performance may be lower or higher than the past performance data quoted.
Unless noted otherwise, Lipper Average and Index returns reflect performance beginning the closest month-end date to the Portfolio’s inception.
For the year ended December 31, 2005, the SP Balanced Asset Allocation Portfolio had a total return that was above both its Blended benchmark index and the average of its peer group.
The Portfolio is managed as a “fund of funds” that invests in shares of certain other Prudential Series Funds and American Skandia Trust Portfolios. The strong performance of these components added to the Portfolio’s return relative to its benchmark. Jennison Large Cap Growth Portfolio made the largest contribution due to its strong stock selection in the technology sector. The Prudential Series Fund William Blair International Growth Portfolio, which had strong stock selection and an exposure to the excellent performance of emerging-market stocks in 2005, and the American Skandia Trust Marsico Capital Growth, which had strong stock selection in the technology and healthcare sectors, also contributed.
The Portfolio benefited from its allocations to various asset classes. An overweight in international equities enhanced its return as non-U.S. stocks outperformed U.S. stocks by a large margin. The addition in August of an allocation to the Prudential Series Fund Natural Resources Portfolio also contributed to performance as it added exposure to the energy sector, which outpaced the broad U.S. stock market by a large margin. Within the Portfolio’s fixed income allocation, emphases on cash (short-term instruments) and high yield “junk” bonds helped its return.
Prudential Investments LLC (PI), a wholly owned subsidiary of Prudential Financial, Inc., serves as the overall investment manager for The Prudential Series Fund.
For average and index definitions, refer to the Glossary of Benchmark Definitions page. Investors cannot invest directly in a market index or average. For a complete list of holdings, refer to the Schedule of Investments section of this report.
The Prudential Series Fund, SP Conservative Asset Allocation Portfolio
Subadvised by: Prudential Investment Management, Inc.
December 31, 2005
Investment Manager’s Report
Performance Summary - As of December 31, 2005
Average Annual Total Return Percentages
| 1-Year | 5-Year | Since Inception | |||||||
SP Conservative Asset Allocation Portfolio | 5.91 | % | 4.76 | % | 4.67 | % | |||
S&P 500 Index | 4.91 | 0.54 | -1.03 | ||||||
Conservative AA Custom Blended Index | 4.58 | 4.74 | 4.38 | ||||||
Lipper (VIP) Income Funds Avg. | 4.13 | 5.08 | 4.84 |
Portfolio inception: 9/22/2000.
$10,000 INVESTED SINCE INCEPTION
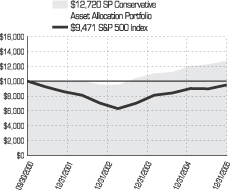
Past performance does not guarantee future returns. Portfolio performance is net of investment fees and fund expenses, but not product charges, which, if included, would significantly lower the performance quoted. The investment return and principal value of an investment will fluctuate, so that an investor’s shares, when redeemed, may be worth more or less than their original cost. Current performance may be lower or higher than the past performance data quoted.
Unless noted otherwise, Lipper Average and Index returns reflect performance beginning the closest month-end date to the Portfolio’s inception.
For the year ended December 31, 2005, the SP Conservative Asset Allocation Portfolio had a total return that was above its benchmark indexes and above the average of its peer group.
The Portfolio is structured as a “fund of funds” that invests its assets in shares of certain other Prudential Series Funds and American Skandia Trust Portfolios. The Portfolio outperformed the Custom Index benchmark because of both the strong performance of its component portfolios and its asset allocation compared to the benchmark.
Its Prudential Series Fund Jennison Large Cap Growth component made the largest contribution to the Portfolio’s relative performance by outperforming the Russell 1000® Growth Index by a wide margin, primarily due to strong stock selection within the technology sector. The Prudential Series Fund William Blair International Growth Portfolio also added to relative performance on the strength of its stock selection and its exposure to emerging market countries. The American Skandia Trust Marsico Capital Growth Portfolio outperformed because of its stock selection within the technology and healthcare sectors.
The Portfolio benefited from an overweight compared with its Custom benchmark in international equities. Foreign stocks had substantially higher returns than U.S. stocks in 2005 and emerging-market countries were particularly strong. The addition of the Prudential Series Fund Natural Resources Portfolio in August also strengthened the Portfolio’s performance, as it had a large commitment to the energy sector, which had very high returns in August and September 2005. Within the fixed income (bond) allocation, emphases on cash (short-term instruments) and high yield “junk” bonds added to return.
Prudential Investments LLC (PI), a wholly owned subsidiary of Prudential Financial, Inc., serves as the overall investment manager for The Prudential Series Fund.
For average and index definitions, refer to the Glossary of Benchmark Definitions page. Investors cannot invest directly in a market index or average. For a complete list of holdings, refer to the Schedule of Investments section of this report.
The Prudential Series Fund, SP Davis Value Portfolio
Subadvised by: Davis Advisors
December 31, 2005
Investment Manager’s Report
Performance Summary - As of December 31, 2005
Average Annual Total Return Percentages
| 1-Year | 5-Year | Since Inception | |||||||
SP Davis Value Portfolio | 9.52 | % | 3.78 | % | 3.91 | % | |||
S&P 500 Index | 4.91 | 0.54 | -1.03 | ||||||
Russell 1000® Value Index | 7.05 | 5.28 | 5.73 | ||||||
Lipper (VIP) Multi-Cap Value Funds Avg. | 6.30 | 4.87 | 5.42 | ||||||
Lipper (VIP) Large-Cap Value Funds Avg. | 4.82 | 2.95 | 3.95 |
Portfolio inception: 9/22/2000.
$10,000 INVESTED SINCE INCEPTION

Past performance does not guarantee future returns. Portfolio performance is net of investment fees and fund expenses, but not product charges, which, if included, would significantly lower the performance quoted. The investment return and principal value of an investment will fluctuate, so that an investor’s shares, when redeemed, may be worth more or less than their original cost. Current performance may be lower or higher than the past performance data quoted.
Unless noted otherwise, Lipper Average and Index returns reflect performance beginning the closest month-end date to the Portfolio’s inception. Although Lipper classifies the Portfolio within the Multi-Cap Value Funds Average, the returns for the Large-Cap Value Funds Average are also shown, because the management of the portfolios included in the Large-Cap Value Funds Average is more consistent with the management of the Portfolio.
For the year ended December 31, 2005, the SP Davis Value Portfolio had a total return that was above all of its benchmark indexes and the average of its peer group.
The Portfolio outperformed its benchmarks because of good stock selection, particularly positions in The Progressive Corporation (automobile insurance, a 3.1% position at period-end) and Altria Group (Philip Morris tobacco companies and 85% of Kraft Foods, a 4.8% position). Altria has been one of the asset manager’s long-term holdings. It fits Davis’ strategy of finding companies that have “headline risk,” negative publicity combined with solid operating fundamentals. Davis believes stocks of such firms have the potential for strong price appreciation. The Portfolio also benefited from a low exposure compared to the Russell 1000® Value Index to firms that paid dividends. In 2005, the market did not reward high dividend yields.
Prudential Investments LLC (PI), a wholly owned subsidiary of Prudential Financial, Inc., serves as the overall investment manager for The Prudential Series Fund.
For average and index definitions, refer to the Glossary of Benchmark Definitions page. Investors cannot invest directly in a market index or average. For a complete list of holdings, refer to the Schedule of Investments section of this report.
The Prudential Series Fund, SP Growth Asset Allocation Portfolio
Subadvised by: Prudential Investment Management, Inc.
December 31, 2005
Investment Manager’s Report
Performance Summary - As of December 31, 2005
Average Annual Total Return Percentages
| 1-Year | 5-Year | Since Inception | |||||||
SP Growth Asset Allocation Portfolio | 9.24 | % | 2.95 | % | 1.89 | % | |||
S&P 500 Index | 4.91 | 0.54 | -1.03 | ||||||
Growth AA Custom Blended Index | 6.64 | 3.16 | 1.93 | ||||||
Lipper (VIP) Multi-Cap Core Avg. | 6.66 | 1.72 | 0.66 |
Portfolio inception: 9/22/2000.
$10,000 INVESTED SINCE INCEPTION
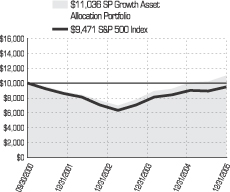
Past performance does not guarantee future returns. Portfolio performance is net of investment fees and fund expenses, but not product charges, which, if included, would significantly lower the performance quoted. The investment return and principal value of an investment will fluctuate, so that an investor’s shares, when redeemed, may be worth more or less than their original cost. Current performance may be lower or higher than the past performance data quoted.
Unless noted otherwise, Lipper Average and Index returns reflect performance beginning the closest month-end date to the Portfolio’s inception.
For the year ended December 31, 2005, the SP Growth Asset Allocation Portfolio had a total return that was above both its benchmark indexes and the average of its peer group.
The Portfolio is structured as a “fund of funds” that invests its assets in shares of certain other Prudential Series Funds and American Skandia Trust Portfolios. The Portfolio outperformed the Custom Index benchmark because of both the strong performance of its component portfolios and its asset allocation compared to the benchmark.
Its Prudential Series Fund Jennison Large Cap Growth component made the largest contribution to the Portfolio’s relative performance by outperforming the Russell 1000® Growth Index by a wide margin, primarily due to strong stock selection within the technology sector. The Prudential Series Fund William Blair International Growth Portfolio also added to relative performance on the strength of its stock selection and its exposure to emerging-market countries. The American Skandia Trust Marsico Capital Growth Portfolio outperformed because of its stock selection within the technology and healthcare sectors.
The Portfolio benefited from an overweight compared with its Custom benchmark in international equities. Foreign stocks had substantially higher returns than U.S. stocks in 2005. The addition of the Prudential Series Fund Natural Resources Portfolio in August also strengthened the Portfolio’s performance, as it had a large commitment to the energy sector, which had very high returns in August and September 2005. Within the fixed income (bond) allocation, emphases on cash (short-term instruments) and high yield “junk” bonds added to return.
Prudential Investments LLC (PI), a wholly owned subsidiary of Prudential Financial, Inc., serves as the overall investment manager for The Prudential Series Fund.
For average and index definitions, refer to the Glossary of Benchmark Definitions page. Investors cannot invest directly in a market index or average. For a complete list of holdings, refer to the Schedule of Investments section of this report.
The Prudential Series Fund, SP Large Cap Value Portfolio
Subadvised by: JP Morgan Asset Management
December 31, 2005
Investment Manager’s Report
Performance Summary - As of December 31, 2005
Average Annual Total Return Percentages
| 1-Year | 5-Year | Since Inception | |||||||
SP Large Cap Value Portfolio | 6.64 | % | 3.99 | % | 4.71 | % | |||
Russell 1000® Index | 6.27 | 1.07 | -0.81 | ||||||
Russell 1000® Value Index | 7.05 | 5.28 | 5.73 | ||||||
Lipper (VIP) Large-Cap Value Funds Avg. | 4.82 | 2.95 | 3.95 | ||||||
Lipper (VIP) Multi-Cap Value Funds Avg. | 6.30 | 4.87 | 5.42 |
Portfolio inception: 9/22/2000.
$10,000 INVESTED SINCE INCEPTION
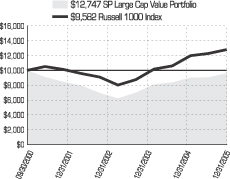
Past performance does not guarantee future returns. Portfolio performance is net of investment fees and fund expenses, but not product charges, which, if included, would significantly lower the performance quoted. The investment return and principal value of an investment will fluctuate, so that an investor’s shares, when redeemed, may be worth more or less than their original cost. Current performance may be lower or higher than the past performance data quoted.
Although Lipper classifies the Portfolio within the Multi-Cap Value Funds Average, the returns for the Large-Cap Value Funds Average are also shown because the management of the portfolios included in the Large-Cap Value Average is more consistent with the management of the Portfolio. A portion of the Portfolio’s expenses is subsidized. Absent such subsidy, the performance quoted would be lower. The subsidy may be discontinued at any time. Unless noted otherwise, Lipper Average and Index returns reflect performance beginning the closest month-end date to the Portfolio’s inception.
For the year ended December 31, 2005, the SP Large Cap Value Portfolio had a total return that was slightly below its style-specific Russell 1000® Value Index benchmark, but slightly higher than the average of its peer group.
Weak stock selection in the consumer cyclical and technology sectors adversely affected performance compared with the style-specific benchmark. The Portfolio did not hold several stocks that were in the benchmark and posted exceptionally strong returns. The Portfolio is split between two asset managers, Hotchkis and Wiley Capital Management and JP Morgan Asset Management. Both were responsible for the poor stock selection. However, certain overall Portfolio characteristics, primarily due to Hotchkis and Wiley’s holdings, had a positive impact on relative performance. The Portfolio had more extreme value characteristics than its benchmark and had greater exposure to firms whose earnings and/or share prices have recently been accelerating. It also benefited from lower exposure than the benchmark to dividend paying companies. Sector emphases also added value, particularly overweights in the consumer services and technology sectors and underweights in the financials and telecommunications sectors. However, some of this added value was diluted by the Portfolio’s sizable underweight in the energy sector, which was by far the best performing sector in 2005.
Prudential Investments LLC (PI), a wholly owned subsidiary of Prudential Financial, Inc., serves as the overall investment manager for the The Prudential Series Fund.
For average and index definitions, refer to the Glossary of Benchmark Definitions page. Investors cannot invest directly in a market index or average. For a complete list of holdings, refer to the Schedule of Investments section of this report.
The Prudential Series Fund, SP LSV International Value Portfolio
Subadvised by: LSV Asset Management
December 31, 2005
Investment Manager’s Report
Performance Summary - As of December 31, 2005
Average Annual Total Return Percentages
| 1-Year | 5-Year | Since Inception | |||||||
SP LSV International Value Portfolio | 13.77 | % | 1.61 | % | 0.51 | % | |||
MSCI EAFE Index | 13.54 | 4.55 | 3.79 | ||||||
Lipper (VIP) International Value Funds Avg. | 13.16 | 5.97 | 5.92 |
Portfolio inception: 9/22/2000.
$10,000 INVESTED SINCE INCEPTION
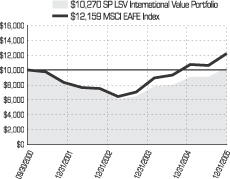
Past performance does not guarantee future returns. Portfolio performance is net of investment fees and fund expenses, but not product charges, which, if included, would significantly lower the performance quoted. The investment return and principal value of an investment will fluctuate, so that an investor’s shares, when redeemed, may be worth more or less than their original cost. Current performance may be lower or higher than the past performance data quoted.
Unless noted otherwise, Lipper Average and Index returns reflect performance beginning the closest month-end date to the Portfolio’s inception. A portion of the Portfolio’s expenses is subsidized. Absent such subsidy, the performance quoted would be lower. The subsidy may be discontinued at any time.
For the year ended December 31, 2005, the SP LSV International Value Portfolio had a total return that was in line with its benchmark index and slightly above the average of its peer group.
International value stocks generally performed quite well in 2005. The Portfolio benefited somewhat from an emphasis on the stocks of smaller companies because the market favored small caps over the reporting period. This had a particular impact on the Portfolio’s holdings in Germany and Japan. Its holdings in the commodity-sensitive sectors contributed most to its performance because that segment of the market was among the best-performing. The Portfolio’s holdings in the industrials sector also improved its performance slightly.
The Portfolio’s best stock selection was within the Nordic region where it benefited from the performance of commodity-sensitive stocks within that region. An exposure to Continental Europe also helped, driven by returns from the Portfolio’s exposure to Germany, Spain, and Austria.
Prudential Investments LLC (PI), a wholly owned subsidiary of Prudential Financial, Inc., serves as the overall investment manager for the The Prudential Series Fund.
For average and index definitions, refer to the Glossary of Benchmark Definitions page. Investors cannot invest directly in a market index or average. For a complete list of holdings, refer to the Schedule of Investments section of this report.
The Prudential Series Fund, SP Mid Cap Growth Portfolio
Subadvised by: Calamos Advisors LLC
December 31, 2005
Investment Manager’s Report
Performance Summary - As of December 31, 2005
Average Annual Total Return Percentages
| 1-Year | 5-Year | Since Inception | |||||||
SP Mid Cap Growth Portfolio | 5.26 | % | -5.64 | % | -5.76 | % | |||
Russell Midcap™ Index | 12.65 | 8.45 | 7.29 | ||||||
Russell Midcap Growth™ Index | 12.10 | 1.38 | -3.67 | ||||||
Lipper (VIP) Mid-Cap Growth Funds Avg. | 10.61 | -0.49 | -3.95 | ||||||
Lipper (VIP) Multi-Cap Growth Funds Avg. | 10.80 | -2.37 | -6.18 |
Portfolio inception: 9/22/2000.
$10,000 INVESTED SINCE INCEPTION
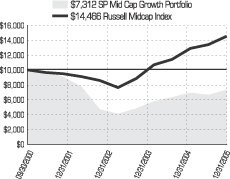
Past performance does not guarantee future returns. Portfolio performance is net of investment fees and fund expenses, but not product charges, which, if included, would significantly lower the performance quoted. The investment return and principal value of an investment will fluctuate, so that an investor’s shares, when redeemed, may be worth more or less than their original cost. Current performance may be lower or higher than the past performance data quoted.
Unless noted otherwise, Lipper Average and Index returns reflect performance beginning the closest month-end date to the Portfolio’s inception. Although Lipper classifies the Portfolio within the Multi-Cap Growth Funds Average, the returns for the Mid-Cap Growth Funds Average are also shown, because the management of the portfolios included in the Mid-Cap Growth Funds Average is more consistent with the management of the Portfolio. A portion of the Portfolio’s expenses is subsidized. Absent such subsidy, the performance quoted would be lower. The subsidy may be discontinued at any time.
For the year ended December 31, 2005, the SP Mid Cap Growth Portfolio had a total return that was about half its benchmark indexes and substantially below the average of its peer group.
Its sector exposure had a significant negative impact on the Portfolio’s performance. It was underweight compared with the style-specific Russell Midcap™ Growth benchmark in the relatively strong healthcare sector and substantially overweight in the weak technology sector. Moreover, the asset manager’s choice of industries within the technology sector (electronic equipment, computer hardware, and Internet) was unfortunate. The Portfolio also suffered because it was particularly sensitive to the overall direction of the market’s movement; less volatile securities generally performed better in 2005. Throughout the year it was positioned for a resurgence of growth stocks. This hurt it in three quarters of the year, but helped in the fourth quarter when growth stocks finally outperformed.
The Portfolio benefited from its significant exposure to companies whose earnings and/or share prices have recently been accelerating rapidly. It also benefited from a below-average dividend yield because the market was not rewarding dividend-paying stocks in 2005. A position in Apple Computer (4.8% of net assets at period-end), whose shares more than doubled over the year, made the largest positive contribution to the Portfolio’s performance.
Prudential Investments LLC (PI), a wholly owned subsidiary of Prudential Financial, Inc., serves as the overall investment manager for The Prudential Series Fund.
For average and index definitions, refer to the Glossary of Benchmark Definitions page. Investors cannot invest directly in a market index or average. For a complete list of holdings, refer to the Schedule of Investments section of this report.
The Prudential Series Fund, SP PIMCO High Yield Portfolio
Subadvised by: Prudential Investment Management, Inc.
December 31, 2005
Investment Manager’s Report
Performance Summary - As of December 31, 2005
Average Annual Total Return Percentages
| 1-Year | 5-Year | Since Inception | |||||||
SP PIMCO High Yield Portfolio | 4.03 | % | 7.71 | % | 7.68 | % | |||
M-L U.S. High Yield Master II BB-B Rated Index | 2.74 | 8.39 | 6.58 | ||||||
Lehman Intermediate BB Corp. Index | 2.81 | 7.52 | 7.13 | ||||||
Lipper (VIP) High Current Yield Funds Avg. | 2.56 | 7.12 | 5.55 |
Portfolio inception: 9/22/2000.
$10,000 INVESTED SINCE INCEPTION
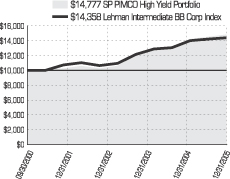
Past performance does not guarantee future returns. Portfolio performance is net of investment fees and fund expenses, but not product charges, which, if included, would significantly lower the performance quoted. The investment return and principal value of an investment will fluctuate, so that an investor’s shares, when redeemed, may be worth more or less than their original cost. Current performance may be lower or higher than the past performance data quoted.
Unless noted otherwise, Lipper Average and Index returns reflect performance beginning the closest month-end date to the Portfolio’s inception.
For the year ended December 31, 2005, the SP PIMCO High Yield Portfolio had a total return that was above its benchmark index.
A resilient U.S. high yield bond market posted a positive return in 2005 even though the U.S. auto industry experienced a shakeup of historic proportions and the Federal Reserve (the Fed) repeatedly increased short-term interest rates. The high yield market was supported by its relatively attractive yields, a low default rate, and a strong U.S. economy.
To prevent the U.S. economy from growing too fast and fueling higher inflation, the Fed continued its latest campaign to increase short-term interest rates. From June 2004 through December 2005, the target for the federal funds rate on overnight loans between banks was increased by quarter-point increments 13 times, from 1.00% to 4.25%. Eight of the increases occurred in 2005. Meanwhile, stiff competition from foreign auto makers and high labor costs pressured the profitability of General Motors Corp. and Ford Motor Co. to the extent that their bonds were lowered from investment grade to speculative grade by major rating agencies. These developments weighed most heavily on the highest-quality speculative-grade bonds, which are in the BB rating category. The asset manager’s emphasis on bonds in the single-B rating category benefited the Portfolio as it performed better than the BB rating category in 2005. However, a modest exposure to bonds in the BBB rating category detracted from the Portfolio’s return.
As for allocation to sectors, the Portfolio was helped by its overweight exposure to the telecommunications sector, with a focus on bonds of large-cap, fixed line companies. Telecom benefited from positive mergers and acquisitions activity in 2005. Exposure to the finance sector, particularly insurance company bonds, was another positive for the Portfolio, but an emphasis on bonds of low- and mid-rated electric generation companies in the utilities sector detracted from the Portfolio’s performance.
Meanwhile emerging-market bonds performed particularly well in 2005. The search for attractive yields in the global low-interest-rate environment, rising prices for commodities and crude oil, and the improving financial positions of some developing nations were among the factors that helped emerging-market bonds gain in value. The Portfolio’s allocation to these debt securities enhanced its performance in 2005.
Prudential Investments LLC (PI), a wholly owned subsidiary of Prudential Financial, Inc., serves as the overall investment manager for The Prudential Series Fund.
For average and index definitions, refer to the Glossary of Benchmark Definitions page. Investors cannot invest directly in a market index or average. For a complete list of holdings, refer to the Schedule of Investments section of this report.
The Prudential Series Fund, SP PIMCO Total Return Portfolio
Subadvised by: Prudential Investment Management, Inc.
December 31, 2005
Investment Manager’s Report
Performance Summary - As of December 31, 2005
Average Annual Total Return Percentages
| 1-Year | 5-Year | Since Inception | |||||||
SP PIMCO Total Return Portfolio | 2.39 | % | 6.28 | % | 6.96 | % | |||
Lehman Brothers U.S. Aggregate Bond Index | 2.43 | 5.87 | 6.42 | ||||||
Lipper (VIP) Intermediate Investment Grade Debt Avg. | 1.99 | 5.60 | 6.07 |
Portfolio inception: 9/22/2000.
$10,000 INVESTED SINCE INCEPTION
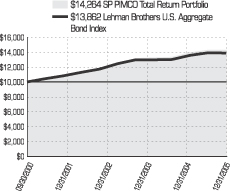
Past performance does not guarantee future returns. Portfolio performance is net of investment fees and fund expenses, but not product charges, which, if included, would significantly lower the performance quoted. The investment return and principal value of an investment will fluctuate, so that an investor’s shares, when redeemed, may be worth more or less than their original cost. Current performance may be lower or higher than the past performance data quoted.
Unless noted otherwise, Lipper Average and Index returns reflect performance beginning the closest month-end date to the Portfolio’s inception.
For the year ended December 31, 2005, the SP PIMCO Total Return Portfolio had a total return that was in line with its benchmark index.
Considering the challenges facing the U.S. fixed income market in 2005, it did well to generate a modest positive return for the year. The bond market faced repeated increases in short-term interest rates by the Federal Reserve (the Fed) and a crisis in the U.S. auto industry. To prevent the U.S. economy from growing too fast and fueling higher inflation, the Fed continued its latest campaign to increase short-term interest rates. From June 2004 through December 2005, the target for the federal funds rate on overnight loans between banks was increased by quarter-point increments 13 times, from 1.00% to 4.25%. Eight of the increases occurred in 2005. As interest rates rose in the second half of 2005, the Portfolio’s duration — a measure of its sensitivity to changes in interest rates — was above that of the Index. This hurt the Portfolio as its above-benchmark duration exposed it more fully to the impact of rising interest rates, which pushed bond prices lower as bond prices move inversely to interest rates.
In other developed nations where economic growth was generally slower than in the United States, there was less upward pressure on interest rates. Consequently, their government bond markets generally outperformed the U.S. Treasury securities market on a currency-hedged basis. The Portfolio’s allocation to non-U.S. government bond markets benefited its performance.
Stiff competition from foreign auto makers and high labor costs hurt General Motors Corp. and Ford Motor Co. to such an extent that their bonds were lowered from investment grade to speculative grade by major rating agencies. The auto industry turmoil and the trend toward higher short-term rates weighed on the investment-grade corporate bond market, which did not perform as well as comparable Treasurys in 2005. The Portfolio benefited from its underweight exposure to investment-grade corporate bonds relative to the Index. Mortgage-backed securities also underperformed comparable Treasurys. The Portfolio’s overweight exposure to the mortgage-backed market detracted from its performance, but some of this negative impact was offset by the asset manager’s favorable security selection within the mortgage-backed sector.
Meanwhile emerging-market bonds performed well in 2005. A strong global economic expansion, the search for attractive yields in the global low-interest-rate environment, and rising prices for commodities and crude oil were among the factors that helped emerging-market bonds gain in value. The Portfolio’s allocation to these debt securities enhanced its performance in 2005.
Prudential Investments LLC (PI), a wholly owned subsidiary of Prudential Financial, Inc., serves as the overall investment manager for The Prudential Series Fund.
For average and index definitions, refer to the Glossary of Benchmark Definitions page. Investors cannot invest directly in a market index or average. For a complete list of holdings, refer to the Schedule of Investments section of this report.
The Prudential Series Fund, SP Prudential U.S. Emerging Growth Portfolio
Subadvised by: Jennison Associates LLC
December 31, 2005
Investment Manager’s Report
Performance Summary - As of December 31, 2005
Average Annual Total Return Percentages
| 1-Year | 5-Year | Since Inception | |||||||
SP Prudential U.S. Emerging Growth Portfolio: Class I | 17.77 | % | 2.56 | % | -0.93 | % | |||
SP Prudential U.S. Emerging Growth Portfolio: Class II | 17.47 | N/A | 4.86 | ||||||
S&P Midcap 400 Index | 12.56 | 8.60 | 7.37 | ||||||
Russell Midcap Growth™ Index | 12.10 | 1.38 | -3.67 | ||||||
Lipper (VIP) Mid-Cap Growth Funds Avg. | 10.61 | -0.49 | -3.95 |
Portfolio (Class I) inception: 9/22/2000. Portfolio (Class II) inception: 7/9/2001.
$10,000 INVESTED SINCE INCEPTION
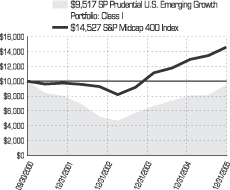
Past performance does not guarantee future returns. Portfolio performance is net of investment fees and fund expenses, but not product charges, which, if included, would significantly lower the performance quoted. The investment return and principal value of an investment will fluctuate, so that an investor’s shares, when redeemed, may be worth more or less than their original cost. Current performance may be lower or higher than the past performance data quoted.
Unless noted otherwise, Lipper Average and Index returns reflect performance beginning the closest month-end date to the Portfolio’s inception (Class I).
For the year ended December 31, 2005, the SP Prudential U.S. Emerging Growth Portfolio had a total return that was substantially higher than its benchmark indexes and even further above the average of its peer group.
The outperformance of the style-specific Russell Midcap™ Growth Index benchmark was due primarily to the asset manager’s strong stock selection. Among its 10 largest positions, Alamosa Holdings (2.2% of net assets at period-end), Varian Medical Systems (2.3%), and Monster Worldwide (3.1%) were the largest contributors to its return. Stock selection was generally strong in the energy, telecommunications, commercial services, and financial sectors. However, the Portfolio had some underperformers, including several in the healthcare industry.
The manager’s bottom-up selection process (one based on intensive company analysis rather than forecasts of industry or sector trends) resulted in a significant overweight (as compared with the style-specific benchmark) in the technology sector. This hurt its performance as technology stocks generally had a lackluster year. A slight underweight in the healthcare sector also detracted. However, an underweight in financials was a positive factor.
Over this reporting period, the Portfolio benefited from above-benchmark exposure to stocks whose earnings growth rates and/or share prices have been rising recently and from a below-average dividend yield. However, these benefits were more than offset by the negative impact of significantly higher volatility than the benchmark, a stronger growth style characteristic than the benchmark, and greater exposure to stocks with earnings variations. The Portfolio was more sensitive to the overall direction of the market than its benchmark, which detracted from its performance, particularly early in the year when the market was stagnant. The specific portfolio manager at Jennison Associates changed during the year, and the new manager has a less aggressive style.
Prudential Investments LLC (PI), a wholly owned subsidiary of Prudential Financial, Inc., serves as the overall investment manager for The Prudential Series Fund.
| 1 | The graph is based on the performance of Class I shares. Performance of Class II shares will be lower due to differences in the fee structure. Class II shares have associated 12b-1 and administrative fees at an annual rate of 0.25% and 0.15% respectively of the average daily net assets of the Class II shares. |
For average and index definitions, refer to the Glossary of Benchmark Definitions page. Investors cannot invest directly in a market index or average. For a complete list of holdings, refer to the Schedule of Investments section of this report.
The Prudential Series Fund, SP Small Cap Growth Portfolio
Subadvised by: Eagle Asset Management, Neuberger Berman Management Inc.
December 31, 2005
Investment Manager’s Report
Performance Summary - As of December 31, 2005
Average Annual Total Return Percentages
| 1-Year | 5-Year | Since Inception | |||||||
SP Small Cap Growth Portfolio | 2.48 | % | -4.61 | % | -7.52 | % | |||
Russell 2000® Index | 4.55 | 8.22 | 6.36 | ||||||
Russell 2000® Growth Index | 4.15 | 2.28 | -2.13 | ||||||
Lipper (VIP) Small-Cap Growth Funds Avg. | 7.50 | 1.06 | -2.05 |
Portfolio inception: 9/22/2000.
$10,000 INVESTED SINCE INCEPTION
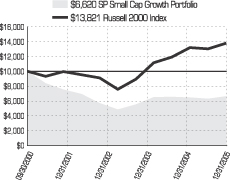
Past performance does not guarantee future returns. Portfolio performance is net of investment fees and fund expenses, but not product charges, which, if included, would significantly lower the performance quoted. The investment return and principal value of an investment will fluctuate, so that an investor’s shares, when redeemed, may be worth more or less than their original cost. Current performance may be lower or higher than the past performance data quoted.
Unless noted otherwise, Lipper Average and Index returns reflect performance beginning the closest month-end date to the Portfolio’s inception.
For the year ended December 31, 2005, the SP Small Cap Growth Portfolio had a total return that was below its benchmark indexes and below the average of its peer group. BlackRock (formerly State Street Research) managed the Portfolio through April 30, 2005; management was shared by Neuberger Berman and Eagle Asset Management for the rest of the year.
Weak stock selection, primarily by Eagle Asset Management, was the major reason the Portfolio underperformed its benchmark, although Neuberger Berman had difficulty in the healthcare and consumer services sectors. Eagle not only underperformed in those sectors but also in the consumer cyclicals and industrials sectors, although it performed better than the benchmark in technology.
The healthcare sector performed relatively well in 2005. During BlackRock’s stewardship, the Portfolio benefited from an overweight in the sector compared with the benchmark, but Neuberger Berman underweighted healthcare and overweighted the weak consumer services sector. These emphases detracted from the Portfolio’s return. However, Neuberger Berman’s overweight in strong-performing transportation stocks added value.
The Portfolio benefited from its overall risk characteristics. It was less volatile and less exposed to earnings variation than the stocks in the benchmark. Both of these qualities were rewarded in the market. However, it also had a greater exposure to earnings yield, a measure of value defined as company’s earnings per share divided by its share price. This hurt performance as investors in small-cap growth stocks generally favored companies with lower earnings yields. Generally, faster-growing small firms are more likely to have lower earnings yields, so this reflects a preference for “growthier” stocks.
Prudential Investments LLC (PI), a wholly owned subsidiary of Prudential Financial, Inc., serves as the overall investment manager for The Prudential Series Fund.
For average and index definitions, refer to the Glossary of Benchmark Definitions page. Investors cannot invest directly in a market index or average. For a complete list of holdings, refer to the Schedule of Investments section of this report.
The Prudential Series Fund, SP Small Cap Value Portfolio
Subadvised by: Salomon Brothers Asset Management Inc.
December 31, 2005
Investment Adviser’s Report
Performance Summary - As of December 31, 2005
Average Annual Total Return Percentages
| 1-Year | 5-Year | Since Inception | |||||||
SP Small Cap Value Portfolio | 4.61 | % | 8.21 | % | 9.98 | % | |||
Russell 2500™ Index | 8.11 | 9.14 | 7.91 | ||||||
Lipper (VIP) Small-Cap Core Funds Avg. | 5.35 | 8.21 | 7.40 | ||||||
Lipper (VIP) Small-Cap Value Funds Avg. | 7.56 | 13.83 | 14.03 |
Although Lipper classifies the Portfolio within the Small-Cap Core Funds Average, the returns for the Small-Cap Value Funds Average are also shown, because the management of the portfolios included in the Small-Cap Value Funds Average is more consistent with the management of the Portfolio.
Portfolio inception: 9/22/2000.
$10,000 INVESTED SINCE INCEPTION
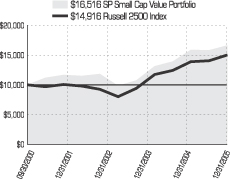
Past performance does not guarantee future returns. Portfolio performance is net of investment fees and fund expenses, but not product charges, which, if included, would significantly lower the performance quoted. The investment return and principal value of an investment will fluctuate, so that an investor’s shares, when redeemed, may be worth more or less than their original cost. Current performance may be lower or higher than the past performance data quoted.
Unless noted otherwise, Lipper Average and Index returns reflect performance beginning the closest month-end date to the Portfolio’s inception.
For the year ended December 31, 2005, the SP Small Cap Value Portfolio had a total return that was below the average of its peer group. Goldman Sachs was responsible for most of the Portfolio’s performance. Beginning December 5, 2005, however, Salomon Brothers Asset Management was given about half of its assets to invest.
Goldman Sachs follows a traditional small-cap value strategy with an emphasis on quality, i.e., strong cash flow and balance sheets. As a result, its holdings characteristically overweight energy stocks and underweight consumer services compared with their weightings in the Russell 2000® Value Index. During this reporting period, both of these sector emphases enhanced return. The energy sector was by far the strongest in the market and consumer services among the weakest. Stock selection within sectors also improved performance, particularly in the energy, basic materials, and transportation sectors. These are sectors that Goldman Sachs historically has favored. Since the Portfolio is well diversified, the benefit of stock selection consisted of many small gains. Goldman’s investment process typically results in a lower exposure to dividend-paying stocks than the benchmark, and this also enhanced performance this year as such stocks were out of favor.
These strengths were largely offset by an above-average exposure early in the year to the overall direction of the market. This is not what we would expect from Goldman Sachs, nor is it what we have seen from it historically. The small-cap stock market finished the first half of 2005 with a slightly negative return, and the Portfolio was particularly exposed to this.
Salomon Brothers was selected as second manager of the Portfolio in part because its investment style complemented that of Goldman Sachs. We expect the overall Portfolio in the future to have less of the characteristic emphases that drove its performance this year.
Prudential Investments LLC (PI), a wholly owned subsidiary of Prudential Financial, Inc., serves as the overall investment manager for The Prudential Series Fund.
For average and index definitions, refer to the Glossary of Benchmark Definitions page. Investors cannot invest directly in a market index or average. For a complete list of holdings, refer to the Schedule of Investments section of this report.
The Prudential Series Fund, SP Strategic Partners Focused Growth Portfolio
Subadvised by: Jennison Associates LLC, Alliance Capital
December 31, 2005
Investment Manager’s Report
Performance Summary - As of December 31, 2005
Average Annual Total Return Percentages
| 1-Year | 5-Year | Since Inception | |||||||
SP Strategic Partners Focused Growth Portfolio: Class I | 15.29 | % | 0.28 | % | -3.99 | % | |||
SP Strategic Partners Focused Growth Portfolio: Class II | 14.97 | N/A | -1.37 | ||||||
S&P 500 Index | 4.91 | 0.54 | -1.03 | ||||||
Russell 1000 Index® Growth Index | 5.26 | -3.58 | -7.73 | ||||||
Lipper (VIP) Large-Cap Growth Funds Avg. | 7.33 | -3.18 | -6.27 |
Portfolio (Class I) inception: 9/22/2000. Portfolio (Class II) inception: 1/12/2001.
$10,000 INVESTED SINCE INCEPTION
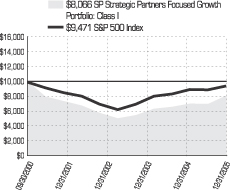
Past performance does not guarantee future returns. Portfolio performance is net of investment fees and fund expenses, but not product charges, which, if included, would significantly lower the performance quoted. The investment return and principal value of an investment will fluctuate, so that an investor’s shares, when redeemed, may be worth more or less than their original cost. Current performance may be lower or higher than the past performance data quoted.
A portion of the Portfolio’s expenses is subsidized. Absent such subsidy, the performance quoted would be lower. The subsidy may be discontinued at any time. Unless noted otherwise, Lipper Average and Index returns reflect performance beginning the closest month-end date to the Portfolio’s inception (Class I).
For the year ended December 31, 2005, the SP Strategic Partners Focused Growth Portfolio had a total return that was almost 10 percentage points above the style-appropriate Russell 1000® Growth Index and almost double the average of its peer group.
Both co-managers, Jennison Associates and Alliance Capital, had excellent stock selection. Both had positions in Apple Computer (5.0% of net assets at period-end), Google (5.5%), and Marvell Technology (4.5%), which appreciated substantially in the fourth quarter growth-stock spurt. The Portfolio also benefited from holdings in the medical services, electronic equipment, semiconductors, and biotechnology industries. However, shares of eBay (4.6%), among the Portfolio’s 10 largest holdings, lost about a quarter of their value over the year.
The Portfolio benefited marginally from its sector emphases, particularly its underweights in areas of the market influenced by consumer purchases. It was underweight specifically in food and beverage and specialty retail companies. A modest overweight in energy, the best-performing market sector, also helped. These benefits were largely offset by an overweight in the poor-performing technology sector.
Risk characteristics of the Portfolio’s holdings, taken together, had a mixed impact. It was hurt by being more sensitive than its benchmark to the overall movement of the market in the declining markets of January, March, April, and October. However, much of this impact was offset by being underrepresented in dividend-paying firms and overrepresented in companies whose earnings and/or share prices had recently been rising. These qualities were rewarded in this year’s market.
Prudential Investments LLC (PI), a wholly owned subsidiary of Prudential Financial, Inc., serves as the overall investment manager for The Prudential Series Fund.
| 1 | The graph is based on the performance of Class I shares. Performance of Class II shares will be lower due to differences in the fee structure. Class II shares have associated 12b-1 and administrative fees at an annual rate of 0.25% and 0.15% respectively of the average daily net assets of the Class II shares. |
For average and index definitions, refer to the Glossary of Benchmark Definitions page. Investors cannot invest directly in a market index or average. For a complete list of holdings, refer to the Schedule of Investments section of this report.
The Prudential Series Fund, SP T. Rowe Price Large-Cap Growth Portfolio
Subadvised by: T Rowe Price Associates Inc
December 31, 2005
Investment Manager’s Report
Performance Summary - As of December 31, 2005
Average Annual Total Return Percentages
| 1-Year | 5-Year | Since Inception | |||||||
SP T. Rowe Price Large-Cap Growth | 16.64 | % | -2.06 | % | -4.81 | % | |||
Russell 1000® Index | 6.27 | 1.07 | -0.81 | ||||||
Russell 1000® Growth Index | 5.26 | -3.58 | -7.73 | ||||||
Lipper (VIP) Large Cap Growth Funds Avg. | 7.33 | -3.18 | -6.27 |
Portfolio inception: 9/22/2000.
$10,000 INVESTED SINCE INCEPTION
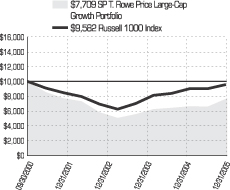
Past performance does not guarantee future returns. Portfolio performance is net of investment fees and fund expenses, but not product charges, which, if included, would significantly lower the performance quoted. The investment return and principal value of an investment will fluctuate, so that an investor’s shares, when redeemed, may be worth more or less than their original cost. Current performance may be lower or higher than the past performance data quoted.
Unless noted otherwise, Lipper Average and Index returns reflect performance beginning the closest month-end date to the Portfolio’s inception.
For the year ended December 31, 2005, the SP T. Rowe Price Large-Cap Growth Portfolio had a total return that was more than twice its benchmark indexes and the average of its peer group. The Portfolio was managed by AllianceBernstein through December 5, 2005, and by T. Rowe Price International thereafter.
The primary reason the Portfolio substantially outperformed its benchmark was excellent stock selection. Holdings in the technology sector, particularly in the Internet and computer hardware industries, and the healthcare sector were particularly strong. The sector composition of the Portfolio also helped its performance. It was overweight compared with the Russell 1000® Growth Index in the energy and financial services sectors and underweight in the consumer noncyclicals sector. Energy was by far the strongest sector in the market, and the financial sector’s average return, although not as large, was also significant. Consumer stocks, on the other hand, faced concerns because investors feared that rising interest rates and energy costs would cut into consumer spending.
Prudential Investments LLC (PI), a wholly owned subsidiary of Prudential Financial, Inc., serves as the overall investment manager for The Prudential Series Fund.
For average and index definitions, refer to the Glossary of Benchmark Definitions page. Investors cannot invest directly in a market index or average. For a complete list of holdings, refer to the Schedule of Investments section of this report.
The Prudential Series Fund, SP William Blair International Growth Portfolio
Subadvised by: William Blair & Company LLC
December 31, 2005
Investment Manager’s Report
Performance Summary - As of December 31, 2005
Average Annual Total Return Percentages
| 1-Year | 5-Year | Since Inception | |||||||
SP William Blair International Growth Portfolio: | 16.39 | % | -1.16 | % | -4.10 | % | |||
SP William Blair International Growth Portfolio: | 15.79 | -1.55 | -4.12 | ||||||
MSCI EAFE Index | 13.54 | 4.55 | 3.79 | ||||||
Lipper (VIP) International Growth Funds Avg. | 15.36 | 2.23 | 0.30 |
Portfolio (Class I) inception: 9/22/2000. Portfolio (Class II) inception: 10/4/2000.
$10,000 INVESTED SINCE INCEPTION
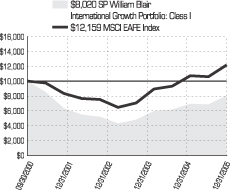
Past performance does not guarantee future returns. Portfolio performance is net of investment fees and fund expenses, but not product charges, which, if included, would significantly lower the performance quoted. The investment return and principal value of an investment will fluctuate, so that an investor’s shares, when redeemed, may be worth more or less than their original cost. Current performance may be lower or higher than the past performance data quoted.
Unless noted otherwise, Lipper Average and Index returns reflect performance beginning the closest month-end date to the Portfolio’s inception (Class I).
For the year ended December 31, 2005, the SP William Blair International Growth Portfolio had a total return that was above its benchmark index and above the average of its peer group.
The Portfolio’s outperformance of its benchmark was due to generally strong stock selection. Selection was particularly good in the energy, financials, and telecommunication services sectors. Several of the Portfolio’s 10 largest holdings added significantly to its return, including BG Group (United Kingdom, 2.8% of net assets at period-end); Mitsubishi UFJ Financial Group (Japan, 2.8%); Orix (Japan, 2.6%); and Roche Holdings (Switzerland, 3.0%). However; its exposure to SAP (Germany, 2.6%) detracted. Performance relative to the benchmark also benefited from investments in emerging markets, which are not included in the MSCI EAFE Index and which benefited from a global surge in commodity prices. Holdings in Brazil, Mexico, South Korea, and Taiwan particularly added value. Technology firms in South Korea and Taiwan had a strong year.
The Portfolio’s overall country and sector composition detracted from its performance. It was underrepresented in Japan, which benefited from a recovering housing market and expectations of meaningful economic reform. Although three of the Portfolio’s ten largest holdings were in Japan and stock selection within the country was good, the Portfolio would have benefited from a larger commitment. Being overweight in technology and underweight in materials also hurt performance, although this was partially offset by being overweight in telecommunication services and by a technology recovery in the fourth quarter.
Prudential Investments LLC (PI), a wholly owned subsidiary of Prudential Financial, Inc., serves as the overall investment manager for The Prudential Series Fund.
| 1 | The graph is based on the performance of Class I shares. Performance of Class II shares will be lower due to differences in the fee structure. Class II shares have associated 12b-1 and administrative fees at an annual rate of 0.25% and 0.15% respectively of the average daily net assets of the Class II shares. |
For average and index definitions, refer to the Glossary of Benchmark Definitions page. Investors cannot invest directly in a market index or average. For a complete list of holdings, refer to the Schedule of Investments section of this report.
Prudential Series Fund Presentation of Portfolio Holdings as of December 31, 2005 (Unaudited)
| SP Aggressive Growth Asset Allocation Portfolio | |||
| Five Largest Holdings (% of Net Assets) | |||
| SP Large Cap Value Portfolio | 31.0 | % | |
| The Pru Series Inc. - Jennison Portfolio | 22.7 | % | |
| SP William Blair International Growth Portfolio | 13.7 | % | |
| SP LSV International Value Portfolio | 12.1 | % | |
| American Skandia Trust-Marsico Capital Growth Portfolio | 10.1 | % | |
| SP Conservative Asset Allocation Portfolio | |||
| Five Largest Holdings (% of Net Assets) | |||
| SP PIMCO Total Return Portfolio | 48.3 | % | |
| SP Large Cap Value Portfolio | 11.7 | % | |
| The Pru Series Inc. - Jennison Portfolio | 9.1 | % | |
| SP William Blair International Growth Portfolio | 6.2 | % | |
| SP LSV International Value Portfolio | 5.1 | % | |
| SP Growth Asset Allocation Portfolio | |||
| Five Largest Holdings (% of Net Assets) | |||
| SP Large Cap Value Portfolio | 25.6 | % | |
| The Pru Series Inc. - Jennison Portfolio | 18.7 | % | |
| SP PIMCO Total Return Portfolio | 11.6 | % | |
| SP William Blair International Growth Portfolio | 11.1 | % | |
| SP LSV International Value Portfolio | 10.0 | % | |
| SP Mid-Cap Growth Portfolio | |||
| Five Largest Holdings (% of Net Assets) | |||
| Apple Computer, Inc. | 4.8 | % | |
| Coach, Inc. | 2.8 | % | |
| Express Scripts, Inc. | 2.8 | % | |
| JLG Industries, Inc. | 2.5 | % | |
| Advanced Mirco Devices, Inc. | 2.4 | % | |
| SP Prudential U.S. Emerging Growth Portfolio | |||
| Five Largest Issues (% of Net Assets) | |||
| Monster Worldwide, Inc. | 3.1 | % | |
| NII Holdings, Inc. | 2.4 | % | |
| Business Objects SA-SP, ADR (France) | 2.3 | % | |
| Varian Medical Systems, Inc. | 2.3 | % | |
| Alamosa Holdings, Inc. | 2.2 | % | |
| SP T. Rowe Price Large Cap Growth Portfolio | |||
| Five Largest Holdings (% of Net Assets) | |||
| General Electric Co. | 4.5 | % | |
| Microsoft Corp. | 3.9 | % | |
| UnitedHealth Group, Inc. | 3.5 | % | |
| Wal-Mart Stores, Inc. | 2.7 | % | |
| Rogers Communications, Inc. | 2.5 | % | |
| SP AIM Core Equity Portfolio | |||
| Five Largest Holdings (% of Net Assets) | |||
| Merck & Co., Inc. | 3.1 | % | |
| Microsoft Corp. | 2.8 | % | |
| Tyco International Ltd. | 2.7 | % | |
| Berkshire Hathaway, Inc. | 2.6 | % | |
| Exxon Mobil Corp. | 2.4 | % | |
| SP Davis Value Portfolio | |||
| Five Largest Holdings (% of Net Assets) | |||
| American International Group, Inc. | 5.1 | % | |
| Altria Group, Inc. | 4.8 | % | |
| American Express Co. | 4.7 | % | |
| Tyco International Ltd. | 4.3 | % | |
| Costco Wholesale, Inc. | 4.1 | % | |
| SP Large Cap Value Portfolio | |||
| Five Largest Holdings (% of Net Assets) | |||
| Exxon Mobil Corp. | 2.7 | % | |
| Lennar Corp. (Class “A” Stock) | 2.7 | % | |
| Citigroup, Inc. | 2.5 | % | |
| Electronic Data System Corp. | 2.4 | % | |
| Altria Group, Inc. | 2.4 | % | |
| SP PIMCO High Yield Portfolio | |||
| Five Largest Issues (% of Net Assets) | |||
| Republic of Brazil, Notes | 2.5 | % | |
| MCI, Inc., Sr. Notes | 1.8 | % | |
| Williams Cos., Inc., Notes | 1.4 | % | |
| PSE&G Energy Holdings LLC, Sr. Notes | 1.3 | % | |
| Ford Motor Credit Co., Bonds | 1.2 | % | |
| SP Small Cap Growth Portfolio | |||
| Five Largest Holdings (% of Net Assets) | |||
| Aleris International, Inc. | 2.1 | % | |
| Bucyrus International, Inc. | 1.9 | % | |
| FactSet Research Systems, Inc. | 1.8 | % | |
| Waste Connections, Inc. | 1.8 | % | |
| Unit Corp. | 1.6 | % | |
| SP William Blair International Growth Portfolio | |||
| Five Largest Holdings (% of Net Assets) | |||
| Roche Holding AG, ADR | 3.0 | % | |
| Mitsubishi Tokyo Financial Group, Inc. | 2.8 | % | |
| BG Group PLC | 2.8 | % | |
| SAP AG | 2.6 | % | |
| ORIX Corp. | 2.6 | % | |
| SP Balanced Asset Allocation Portfolio | |||
| Five Largest Holdings (% of Net Assets) | |||
| SP PIMCO Total Return Portfolio | 28.1 | % | |
| SP Large Cap Value Portfolio | 19.0 | % | |
| The Pru Series Inc. - Jennison Portfolio | 14.2 | % | |
| SP William Blair International Growth Portfolio | 8.7 | % | |
| SP LSV International Value Portfolio | 7.6 | % | |
| SP Small Cap Value Portfolio | |||
| Five Largest Holdings (% of Net Assets) | |||
| Wabash National Corp. | 0.8 | % | |
| Smurfit-Stone Container Corp. | 0.8 | % | |
| Accredited Home | 0.7 | % | |
| Central Pacific Financial Corp. | 0.7 | % | |
| Rli Corp. | 0.7 | % | |
| SP LSV International Value Portfolio | |||
| Five Largest Holdings (% of Net Assets) | |||
| Toyota Motor Corp. | 2.1 | % | |
| Royal Dutch Shell PLC | 2.0 | % | |
| BNP Paribas SA | 1.7 | % | |
| Credit Suisse Group | 1.7 | % | |
| UBS AG | 1.7 | % | |
| SP PIMCO Total Return Portfolio | |||
| Five Largest Issues (% of Net Assets) | |||
| UBS Finance, Inc. | 2.7 | % | |
| Societe Generale N.A. | 2.7 | % | |
| Westpac Bank | 2.5 | % | |
| CBA de Finance | 2.4 | % | |
| Danske Corp. | 2.2 | % | |
| SP Strategic Partners Focused Growth Portfolio | |||
| Five Largest Holdings (% of Net Assets) | |||
| UnitedHealth Group, Inc. | 5.9 | % | |
| Google, Inc. (Class “A” Stock) | 5.5 | % | |
| Apple Computer, Inc. | 5.0 | % | |
| Procter & Gamble Co. | 4.9 | % | |
| eBay Inc. | 4.6 | % | |
For a complete listing of holdings, refer to the Schedule of Investments section of this report.
Holdings reflect only long-term investments. Holdings/Issues/Industries/Sectors are subject to change.
Fees and Expenses (Unaudited)
As a contract owner investing in Portfolios of the Fund through a variable annuity or variable life contract, you incur ongoing costs, including management fees, [distribution and service (12b-1) fees,] and other Portfolio expenses. This example is intended to help you understand your ongoing costs (in dollars) of investing in the Fund and to compare these costs with the ongoing costs of investing in other investment options. This example does not reflect fees and charges under your variable annuity or variable life contract. If contract charges were included, the costs shown below would be higher. Please consult the prospectus for your contract for more information about contract fees and charges.
The example is based on an investment of $1,000 invested at the beginning of the period and held for the entire period July 1, 2005 through December 31, 2005.
Actual Expenses
The first line of the table below provides information about actual account values and actual expenses. You may use this information, together with the amount you invested, to estimate the Portfolio expenses that you paid over the period. Simply divide your account value by $1,000 (for example, an $8,600 account value divided by $1,000 = 8.6), then multiply the result by the number in the first line under the heading entitled “Expenses Paid During Period” to estimate the Portfolio expenses you paid on your account during this period. As noted above, the table does not reflect variable contract fees and charges.
Hypothetical Example for Comparison Purposes
The second line of the table below provides information about hypothetical account values and hypothetical expenses based on the Portfolio’s actual expense ratio and an assumed rate of return of 5% per year before expenses, which is not the Portfolio’s actual return. The hypothetical account values and expenses may not be used to estimate the actual ending account balance or expenses you paid for the period. You may use this information to compare the ongoing costs of investing in the Portfolio and other investment options. To do so, compare this 5% hypothetical example with the 5% hypothetical examples that appear in the shareholder reports of the other investment options.
Please note that the expenses shown in the table are meant to highlight your ongoing Portfolio costs only and do not reflect any contract fees and charges, such as sales charges (loads), insurance charges or administrative charges. Therefore the second line of the table is useful to compare ongoing investment option costs only, and will not help you determine the relative total costs of owning different contracts. In addition, if these contract fee and charges were included, your costs would have been higher.
| The Prudential Series Fund Portfolios | Beginning Account Value July 1, 2005 | Ending Account Value December 31, 2005 | Annualized Expense Ratio Based on the Six-Month Period | Expenses Paid During the Six- Month Period | ||||||||||
| SP Aggressive Growth Asset Allocation (Class I) | Actual | $ | 1,000.00 | $ | 1,098.30 | 0.05 | % | $ | 0.26 | |||||
| Hypothetical | $ | 1,000.00 | $ | 1,024.95 | 0.05 | % | $ | 0.26 | ||||||
| SP AIM Core Equity (Class I) | Actual | $ | 1,000.00 | $ | 1,055.40 | 1.00 | % | $ | 5.18 | |||||
| Hypothetical | $ | 1,000.00 | $ | 1,020.16 | 1.00 | % | $ | 5.09 | ||||||
| SP Balanced Asset Allocation (Class I) | Actual | $ | 1,000.00 | $ | 1,062.30 | 0.05 | % | $ | 0.26 | |||||
| Hypothetical | $ | 1,000.00 | $ | 1,024.95 | 0.05 | % | $ | 0.26 | ||||||
| SP Conservative Asset Allocation (Class I) | Actual | $ | 1,000.00 | $ | 1,042.50 | 0.05 | % | $ | 0.26 | |||||
| Hypothetical | $ | 1,000.00 | $ | 1,024.95 | 0.05 | % | $ | 0.26 | ||||||
| SP Davis Value (Class I) | Actual | $ | 1,000.00 | $ | 1,083.20 | 0.82 | % | $ | 4.31 | |||||
| Hypothetical | $ | 1,000.00 | $ | 1,021.07 | 0.82 | % | $ | 4.18 | ||||||
| SP Growth Asset Allocation (Class I) | Actual | $ | 1,000.00 | $ | 1,081.40 | 0.05 | % | $ | 0.26 | |||||
| Hypothetical | $ | 1,000.00 | $ | 1,024.95 | 0.05 | % | $ | 0.26 | ||||||
| SP Large Cap Value (Class I) | Actual | $ | 1,000.00 | $ | 1,040.20 | 0.83 | % | $ | 4.27 | |||||
| Hypothetical | $ | 1,000.00 | $ | 1,021.02 | 0.83 | % | $ | 4.23 | ||||||
| SP LSV International Value (Class I) | Actual | $ | 1,000.00 | $ | 1,135.00 | 1.03 | % | $ | 5.54 | |||||
| Hypothetical | $ | 1,000.00 | $ | 1,020.01 | 1.03 | % | $ | 5.24 | ||||||
| The Prudential Series Fund Portfolios | Beginning Account Value July 1, 2005 | Ending Account Value December 31, 2005 | Annualized Expense Ratio Based on the Six-Month Period | Expenses Paid During the Six- Month Period | ||||||||||
| SP Mid Cap Growth (Class I) | Actual | $ | 1,000.00 | $ | 1,100.80 | 1.00 | % | $ | 5.30 | |||||
| Hypothetical | $ | 1,000.00 | $ | 1,020.16 | 1.00 | % | $ | 5.09 | ||||||
| SP PIMCO High Yield (Class I) | Actual | $ | 1,000.00 | $ | 1,018.60 | 0.67 | % | $ | 3.41 | |||||
| Hypothetical | $ | 1,000.00 | $ | 1,021.83 | 0.67 | % | $ | 3.41 | ||||||
| SP PIMCO Total Return (Class I) | Actual | $ | 1,000.00 | $ | 999.10 | 0.62 | % | $ | 3.12 | |||||
| Hypothetical | $ | 1,000.00 | $ | 1,022.08 | 0.62 | % | $ | 3.16 | ||||||
| SP Prudential US Emerging Growth (Class I) | Actual | $ | 1,000.00 | $ | 1,174.60 | 0.72 | % | $ | 3.95 | |||||
| Hypothetical | $ | 1,000.00 | $ | 1,021.58 | 0.72 | % | $ | 3.67 | ||||||
| SP Prudential US Emerging Growth (Class II) | Actual | $ | 1,000.00 | $ | 1,173.30 | 1.12 | % | $ | 6.14 | |||||
| Hypothetical | $ | 1,000.00 | $ | 1,019.56 | 1.12 | % | $ | 5.70 | ||||||
| SP Small Cap Growth (Class I) | Actual | $ | 1,000.00 | $ | 1,054.10 | 1.08 | % | $ | 5.59 | |||||
| Hypothetical | $ | 1,000.00 | $ | 1,019.76 | 1.08 | % | $ | 5.50 | ||||||
| SP Small Cap Value (Class I) | Actual | $ | 1,000.00 | $ | 1,049.40 | 0.98 | % | $ | 5.06 | |||||
| Hypothetical | $ | 1,000.00 | $ | 1,020.27 | 0.98 | % | $ | 4.99 | ||||||
| SP Strategic Partners Focused Growth (Class I) | Actual | $ | 1,000.00 | $ | 1,154.70 | 1.13 | % | $ | 6.14 | |||||
| Hypothetical | $ | 1,000.00 | $ | 1,019.51 | 1.13 | % | $ | 5.75 | ||||||
| SP Strategic Partners Focused Growth (Class II) | Actual | $ | 1,000.00 | $ | 1,153.30 | 1.53 | % | $ | 8.30 | |||||
| Hypothetical | $ | 1,000.00 | $ | 1,017.49 | 1.53 | % | $ | 7.78 | ||||||
| SP T. Rowe Price Large-Cap Growth (Class I) | Actual | $ | 1,000.00 | $ | 1,173.80 | 1.02 | % | $ | 5.59 | |||||
| Hypothetical | $ | 1,000.00 | $ | 1,020.16 | 1.02 | % | $ | 5.19 | ||||||
| SP William Blair International Growth (Class I) | Actual | $ | 1,000.00 | $ | 1,174.20 | 0.99 | % | $ | 5.43 | |||||
| Hypothetical | $ | 1,000.00 | $ | 1,020.21 | 0.99 | % | $ | 5.04 | ||||||
| SP William Blair International Growth (Class II) | Actual | $ | 1,000.00 | $ | 1,171.40 | 1.39 | % | $ | 7.61 | |||||
| Hypothetical | $ | 1,000.00 | $ | 1,018.20 | 1.39 | % | $ | 7.07 | ||||||
| * | Portfolio expenses (net of fee waivers or subsidies, if any) for each share class are equal to the annualized expense ratio for each share class (provided in the table), multiplied by the average account value over the period, multiplied by the 184 days in the six-month period ended December 31, 2005, and divided by the 365 days in the Portfolio’s fiscal year ended December 31, 2005 (to reflect the six-month period). |
| SP AGGRESSIVE GROWTH ASSET ALLOCATION PORTFOLIO |
STATEMENT OF ASSETS AND LIABILITIES
December 31, 2005
| ASSETS | |||
Affiliated investments, at value (cost $163,947,773) | $ | 188,360,631 | |
Receivable for capital stock sold | 14,148 | ||
Dividends receivable | 4,700 | ||
Prepaid expenses | 895 | ||
Total Assets | 188,380,374 | ||
| LIABILITIES | |||
Payable for capital stock repurchased | 146,583 | ||
Payable to custodian | 10,182 | ||
Management fee payable | 5,088 | ||
Payable for investments purchased | 4,659 | ||
Deferred directors’ fee | 811 | ||
Total Liabilities | 167,323 | ||
| NET ASSETS | $ | 188,213,051 | |
Net assets were comprised of: | |||
Common stock, at $0.01 par value | $ | 198,126 | |
Paid-in capital in excess of par | 155,794,040 | ||
| 155,992,166 | |||
Undistributed net investment income | 3,598,037 | ||
Accumulated net realized gain on investments | 4,209,990 | ||
Net unrealized appreciation on investments | 24,412,858 | ||
Net assets, December 31, 2005 | $ | 188,213,051 | |
Net asset value and redemption price per share, $188,213,051 / 19,812,611 outstanding shares of common stock (authorized 100,000,000 shares) | $ | 9.50 | |
STATEMENT OF OPERATIONS
Year Ended December 31, 2005
| INVESTMENT INCOME | |||
Affiliated dividend income | $ | 3,677,536 | |
| EXPENSES | |||
Management fee | 78,648 | ||
| NET INVESTMENT INCOME | 3,598,888 | ||
| NET REALIZED AND UNREALIZED GAIN ON AFFILIATED INVESTMENTS | |||
Net realized gain on investments | 2,462,328 | ||
Net capital gain distributions received | 2,162,287 | ||
| 4,624,615 | |||
Net change in unrealized appreciation (depreciation) on investments | 8,995,478 | ||
| NET GAIN ON INVESTMENTS | 13,620,093 | ||
| NET INCREASE IN NET ASSETS RESULTING FROM OPERATIONS | $ | 17,218,981 | |
STATEMENT OF CHANGES IN NET ASSETS
| Year Ended December 31, 2005 | Year Ended December 31, 2004 | |||||||
| INCREASE (DECREASE) IN NET ASSETS | ||||||||
| OPERATIONS: | ||||||||
Net investment income | $ | 3,598,888 | $ | 254,403 | ||||
Net realized gain on investments | 4,624,615 | 7,391,663 | ||||||
Net change in unrealized appreciation (depreciation) on investments | 8,995,478 | 7,628,625 | ||||||
NET INCREASE IN NET ASSETS RESULTING FROM OPERATIONS | 17,218,981 | 15,274,691 | ||||||
| DIVIDENDS AND DISTRIBUTIONS: | ||||||||
Dividends from net investment income | (255,254 | ) | (47,387 | ) | ||||
Distributions from net realized capital gains | (5,750,072 | ) | — | |||||
TOTAL DIVIDENDS AND DISTRIBUTIONS | (6,005,326 | ) | (47,387 | ) | ||||
| CAPITAL STOCK TRANSACTIONS: | ||||||||
Capital stock sold [6,021,182 and 8,837,254 shares, respectively] | 53,233,551 | 71,795,086 | ||||||
Capital stock issued in reinvestment of dividends [720,063 and 5,953 shares, respectively] | 6,005,326 | 47,387 | ||||||
Capital stock repurchased [2,179,013 and 1,332,326, shares respectively] | (19,146,944 | ) | (10,751,075 | ) | ||||
NET INCREASE (DECREASE) IN NET ASSETS RESULTING FROM CAPITAL STOCK TRANSACTIONS | 40,091,933 | 61,091,398 | ||||||
| TOTAL INCREASE IN NET ASSETS | 51,305,588 | 76,318,702 | ||||||
| NET ASSETS: | ||||||||
Beginning of year | 136,907,463 | 60,588,761 | ||||||
End of year (a) | $ | 188,213,051 | $ | 136,907,463 | ||||
(a) Includes undistributed net investment income of: | $ | 3,598,037 | $ | 254,403 | ||||
SEE NOTES TO FINANCIAL STATEMENTS.
A1
| SP AIM CORE EQUITY PORTFOLIO |
STATEMENT OF ASSETS AND LIABILITIES
December 31, 2005
| ASSETS | |||
Unaffiliated investments (cost $31,994,169) | $ | 33,294,076 | |
Affiliated investments (cost $973,226) | 973,226 | ||
Dividends and interest receivable | 50,366 | ||
Foreign currency, at value (cost $1,121) | 1,106 | ||
Prepaid expenses | 1,054 | ||
Total Assets | 34,319,828 | ||
| LIABILITIES | |||
Outstanding options written (premium received $20,604) | 51,300 | ||
Management fee payable | 26,054 | ||
Payable for capital stock repurchased | 7,291 | ||
Accrued expenses and other liabilities | 2,546 | ||
Deferred directors’ fees | 2,119 | ||
Payable to custodian | 1,379 | ||
Transfer agent fee payable | 589 | ||
Total Liabilities | 91,278 | ||
| NET ASSETS | $ | 34,228,550 | |
Net assets were comprised of: | |||
Common stock, at $0.01 par value | $ | 44,919 | |
Paid-in capital in excess of par | 30,801,555 | ||
| 30,846,474 | |||
Undistributed net investment income | 317,783 | ||
Accumulated net realized gain on investments | 1,795,097 | ||
Net unrealized appreciation on investments and foreign currencies | 1,269,196 | ||
Net assets, December 31, 2005 | $ | 34,228,550 | |
Net asset value and redemption price per share, $34,228,550 / 4,491,944 outstanding shares of common stock (authorized 100,000,000 shares) | $ | 7.62 | |
STATEMENT OF OPERATIONS
Year Ended December 31, 2005
| INVESTMENT INCOME | ||||
Unaffiliated dividend income (net of foreign withholding taxes of $8,480) | $ | 574,356 | ||
Unaffiliated interest | 72,589 | |||
Affiliated dividend income | 13,594 | |||
| 660,539 | ||||
| EXPENSES | ||||
Management fee | 282,497 | |||
Custodian’s fees and expenses | 87,000 | |||
Shareholders’ reports | 15,000 | |||
Audit fee | 15,000 | |||
Directors’ fees | 9,000 | |||
Legal fees and expenses | 8,000 | |||
Transfer agent’s fee and expenses (including affiliated expense of $3,000) (Note 4) | 4,000 | |||
Insurance expenses | 1,000 | |||
Commitment fee on syndicated credit agreement | 300 | |||
Miscellaneous | 6,219 | |||
Total expenses | 428,016 | |||
Less: expense reimbursement | (94,014 | ) | ||
Less: custodian fee credit | (179 | ) | ||
Net expenses | 333,823 | |||
| NET INVESTMENT INCOME | 326,716 | |||
| NET REALIZED AND UNREALIZED GAIN ON INVESTMENTS AND FOREIGN CURRENCIES | ||||
Net realized gain (loss) on: | ||||
Investments | 2,268,419 | |||
Foreign currency transactions | (6,687 | ) | ||
| 2,261,732 | ||||
Net change in unrealized appreciation (depreciation) on: | ||||
Investments | (1,007,337 | ) | ||
Options written | (30,696 | ) | ||
Foreign currencies | (15 | ) | ||
| (1,038,048 | ) | |||
| NET GAIN ON INVESTMENTS AND FOREIGN CURRENCIES | 1,223,684 | |||
| NET INCREASE IN NET ASSETS RESULTING FROM OPERATIONS | $ | 1,550,400 | ||
STATEMENT OF CHANGES IN NET ASSETS
| Year Ended December 31, 2005 | Year Ended December 31, 2004 | |||||||
| INCREASE (DECREASE) IN NET ASSETS | ||||||||
| OPERATIONS: | ||||||||
Net investment income | $ | 326,716 | $ | 335,369 | ||||
Net realized gain on investments and foreign currencies | 2,261,732 | 1,939,651 | ||||||
Net change in unrealized appreciation (depreciation) on investments and foreign currencies | (1,038,048 | ) | 129,902 | |||||
NET INCREASE (DECREASE) IN NET ASSETS RESULTING FROM OPERATIONS | 1,550,400 | 2,404,922 | ||||||
| DIVIDENDS: | ||||||||
Dividends from net investment income | (337,615 | ) | (121,766 | ) | ||||
| CAPITAL STOCK TRANSACTIONS: | ||||||||
Capital stock sold [848,731 and 1,615,797 shares, respectively] | 6,198,927 | 11,192,718 | ||||||
Capital stock issued in reinvestment of dividends [47,087 and 18,228 shares, respectively] | 337,615 | 121,766 | ||||||
Capital stock repurchased [730,652 and 659,162 shares, respectively] | (5,361,373 | ) | (4,557,603 | ) | ||||
NET INCREASE (DECREASE) IN NET ASSETS RESULTING FROM CAPITAL STOCK TRANSACTIONS | 1,175,169 | 6,756,881 | ||||||
| TOTAL INCREASE IN NET ASSETS | 2,387,954 | 9,040,037 | ||||||
| NET ASSETS: | ||||||||
Beginning of year | 31,840,596 | 22,800,559 | ||||||
End of year (a) | $ | 34,228,550 | $ | 31,840,596 | ||||
(a) Includes undistributed net investment income of | $ | 317,783 | $ | 335,369 | ||||
SEE NOTES TO FINANCIAL STATEMENTS.
A2
| SP BALANCED ASSET ALLOCATION PORTFOLIO |
STATEMENT OF ASSETS AND LIABILITIES
December 31, 2005
| ASSETS | |||
Affiliated investments, at value (cost $1,269,921,510) | $ | 1,372,922,333 | |
Receivable for capital stock sold | 806,994 | ||
Dividends receivable | 78,317 | ||
Prepaid expenses | 5,849 | ||
Total Assets | 1,373,813,493 | ||
| LIABILITIES | |||
Payable for investments purchased | 1,728,408 | ||
Payable for capital stock repurchased | 208,630 | ||
Management fee payable | 54,728 | ||
Payable to custodian | 51,969 | ||
Deferred directors’ fees | 970 | ||
Total Liabilities | 2,044,705 | ||
| NET ASSETS | $ | 1,371,768,788 | |
Net assets were comprised of: | |||
Common stock, at $0.01 par value | $ | 1,256,226 | |
Paid-in capital in excess of par | 1,210,707,663 | ||
| 1,211,963,889 | |||
Undistributed net investment income | 35,724,076 | ||
Accumulated net realized gain on investments | 21,080,000 | ||
Net unrealized appreciation on investments | 103,000,823 | ||
Net assets, December 31, 2005 | $ | 1,371,768,788 | |
Net asset value and redemption price per share, $1,371,768,788 / 125,622,609 outstanding shares of common stock (authorized 225,000,000 shares) | $ | 10.92 | |
STATEMENT OF OPERATIONS
Year Ended December 31, 2005
| INVESTMENT INCOME | |||
Affiliated dividend income | $ | 36,249,113 | |
| EXPENSES | |||
Management fee | 525,037 | ||
| NET INVESTMENT INCOME | 35,724,076 | ||
| NET REALIZED AND UNREALIZED GAIN ON AFFILIATED INVESTMENTS | |||
Net realized gain on investments | 12,585,056 | ||
Net capital gain distributions received | 10,731,810 | ||
| 23,316,866 | |||
Net change in unrealized appreciation (depreciation) on investments | 28,223,666 | ||
| NET GAIN ON INVESTMENTS | 51,540,532 | ||
| NET INCREASE IN NET ASSETS RESULTING FROM OPERATIONS | $ | 87,264,608 | |
STATEMENT OF CHANGES IN NET ASSETS
| Year Ended December 31, 2005 | Year Ended December 31, 2004 | |||||||
| INCREASE (DECREASE) IN NET ASSETS | ||||||||
| OPERATIONS: | ||||||||
Net investment income | $ | 35,724,076 | $ | 8,722,666 | ||||
Net realized gain on investments | 23,316,866 | 33,580,255 | ||||||
Net change in unrealized appreciation (depreciation) on investments | 28,223,666 | 33,450,837 | ||||||
NET INCREASE IN NET ASSETS RESULTING FROM OPERATIONS | 87,264,608 | 75,753,758 | ||||||
| DIVIDENDS AND DISTRIBUTIONS: | ||||||||
Dividends from net investment income | (8,722,666 | ) | (4,764,898 | ) | ||||
Distributions from net realized capital gains | (30,988,808 | ) | (418,285 | ) | ||||
TOTAL DIVIDENDS AND DISTRIBUTIONS | (39,711,474 | ) | (5,183,183 | ) | ||||
| CAPITAL STOCK TRANSACTIONS: | ||||||||
Capital stock sold [53,729,204 and 36,761,733 shares, respectively] | 561,157,881 | 361,570,484 | ||||||
Capital stock issued in reinvestment of dividends and distributions [3,999,141 and 532,701 shares, respectively] | 39,711,474 | 5,183,183 | ||||||
Capital stock repurchased [10,868,002 and 5,099,733, shares respectively] | (113,645,767 | ) | (50,288,089 | ) | ||||
NET INCREASE (DECREASE) IN NET ASSETS RESULTING FROM CAPITAL STOCK TRANSACTIONS | 487,223,588 | 316,465,578 | ||||||
| TOTAL INCREASE IN NET ASSETS | 534,776,722 | 387,036,153 | ||||||
| NET ASSETS: | ||||||||
Beginning of year | 836,992,066 | 449,955,913 | ||||||
End of year (a) | $ | 1,371,768,788 | $ | 836,992,066 | ||||
(a) Includes undistributed net investment income of: | $ | 35,724,076 | $ | 8,722,666 | ||||
SEE NOTES TO FINANCIAL STATEMENTS.
A3
| SP CONSERVATIVE ASSET ALLOCATION PORTFOLIO |
STATEMENT OF ASSETS AND LIABILITIES
December 31, 2005
| ASSETS | |||
Affiliated Investments, at value (cost $611,522,573) | $ | 641,874,118 | |
Receivable for capital stock sold | 899,509 | ||
Dividends receivable | 34,054 | ||
Prepaid expenses | 3,137 | ||
Total Assets | 642,810,818 | ||
| LIABILITIES | |||
Payable for capital stock repurchased | 748,403 | ||
Payable for investments purchased | 34,004 | ||
Payable to custodian | 25,608 | ||
Management fee payable | 24,213 | ||
Deferred directors’ fees | 969 | ||
Total Liabilities | 833,197 | ||
| NET ASSETS | $ | 641,977,621 | |
Net assets were comprised of: | |||
Common stock, at $0.01 par value | $ | 568,885 | |
Paid-in capital in excess of par | 580,094,630 | ||
| 580,663,515 | |||
Undistributed net investment income | 22,042,744 | ||
Accumulated net realized gain on investments | 8,919,817 | ||
Net unrealized appreciation on investments | 30,351,545 | ||
Net assets, December 31, 2005 | $ | 641,977,621 | |
Net asset value and redemption price per share, $641,977,621 / 56,888,556 outstanding shares of common stock (authorized 140,000,000 shares) | $ | 11.28 | |
STATEMENT OF OPERATIONS
Year Ended December 31, 2005
| INVESTMENT INCOME | |||
Affiliated dividend income | $ | 22,312,768 | |
| EXPENSES | |||
Management fee | 268,995 | ||
| NET INVESTMENT INCOME | 22,043,773 | ||
| NET REALIZED AND UNREALIZED GAIN ON AFFILIATED INVESTMENTS | |||
Net realized gain on investments | 5,133,084 | ||
Net capital gain distributions received | 5,021,229 | ||
| 10,154,313 | |||
Net change in unrealized appreciation (depreciation) on investments | 1,938,451 | ||
| NET GAIN ON INVESTMENTS | 12,092,764 | ||
| NET INCREASE IN NET ASSETS RESULTING FROM OPERATIONS | $ | 34,136,537 | |
STATEMENT OF CHANGES IN NET ASSETS
| Year Ended December 31, 2005 | Year Ended December 31, 2004 | |||||||
| INCREASE (DECREASE) IN NET ASSETS | ||||||||
| OPERATIONS: | ||||||||
Net investment income | $ | 22,043,773 | $ | 6,842,945 | ||||
Net realized gain on investments | 10,154,313 | 18,584,956 | ||||||
Net change in unrealized appreciation (depreciation) on investments | 1,938,451 | 8,656,289 | ||||||
NET INCREASE IN NET ASSETS RESULTING FROM OPERATIONS | 34,136,537 | 34,084,190 | ||||||
| DIVIDENDS AND DISTRIBUTIONS: | ||||||||
Dividends from net investment income | (6,843,974 | ) | (4,871,869 | ) | ||||
Distributions from net realized capital gains | (16,727,447 | ) | (945,835 | ) | ||||
TOTAL DIVIDENDS AND DISTRIBUTIONS | (23,571,421 | ) | (5,817,704 | ) | ||||
| CAPITAL STOCK TRANSACTIONS: | ||||||||
Capital stock sold [21,064,032 and 17,606,534 shares, respectively] | 229,842,764 | 185,977,577 | ||||||
Capital stock issued in reinvestment of dividends and distributions [2,251,330 and 554,595 shares, respectively] | 23,571,421 | 5,817,704 | ||||||
Capital stock repurchased [7,482,435 and 3,928,230, shares respectively] | (81,869,848 | ) | (41,403,704 | ) | ||||
NET INCREASE (DECREASE) IN NET ASSETS RESULTING FROM CAPITAL STOCK TRANSACTIONS | 171,544,837 | 150,391,577 | ||||||
| TOTAL INCREASE IN NET ASSETS | 182,109,953 | 178,658,063 | ||||||
| NET ASSETS: | ||||||||
Beginning of year | 459,867,668 | 281,209,605 | ||||||
End of year (a) | $ | 641,977,621 | $ | 459,867,668 | ||||
(a) Includes undistributed net investment income of: | $ | 22,042,744 | $ | 6,842,945 | ||||
SEE NOTES TO FINANCIAL STATEMENTS.
A4
| SP DAVIS VALUE PORTFOLIO |
STATEMENT OF ASSETS AND LIABILITIES
December 31, 2005
| ASSETS | |||
Investments, at value including securities on loan of $23,563,227: | |||
Unaffiliated investments (cost $238,579,549) | $ | 306,784,465 | |
Affiliated investments (cost $29,022,351) | 29,022,351 | ||
Cash | 5,682 | ||
Foreign currency, at value (cost $43,786) | 43,966 | ||
Dividends and interest receivable | 478,692 | ||
Receivable for capital stock sold | 39,277 | ||
Tax reclaim receivable | 9,943 | ||
Prepaid expenses | 9,224 | ||
Total Assets | 336,393,600 | ||
| LIABILITIES | |||
Collateral for securities on loan | 24,456,765 | ||
Management fee payable | 121,448 | ||
Accrued expenses and other liabilities | 66,420 | ||
Deferred trustees’ fees | 2,690 | ||
Transfer agent fee payable | 2,066 | ||
Total Liabilities | 24,649,389 | ||
| NET ASSETS | $ | 311,744,211 | |
Net assets were comprised of: | |||
Common stock, at $0.01 par value | $ | 291,965 | |
Paid-in capital in excess of par | 235,777,013 | ||
| 236,068,978 | |||
Undistributed net investment income | 2,547,146 | ||
Accumulated net realized gain on investments | 4,922,991 | ||
Net unrealized appreciation on investments and foreign currencies | 68,205,096 | ||
Net assets, December 31, 2005 | $ | 311,744,211 | |
Net asset value and redemption price per share, $311,744,211 / 29,196,485 outstanding shares of common stock (authorized 225,000,000 shares) | $ | 10.68 | |
STATEMENT OF OPERATIONS
Year Ended December 31, 2005
| INVESTMENT INCOME | ||||
Unaffiliated dividend income (net of foreign withholding taxes of $116,034) | $ | 4,965,841 | ||
Affiliated dividend income | 14,885 | |||
Interest | 4,306 | |||
Affiliated income from securities lending, net | 4,211 | |||
| 4,989,243 | ||||
| EXPENSES | ||||
Management fee | 2,213,998 | |||
Custodian’s fees and expenses | 124,000 | |||
Shareholders’ reports | 35,000 | |||
Audit fee | 15,000 | |||
Trustees’ fees | 14,000 | |||
Legal fees and expenses | 9,500 | |||
Insurance expenses | 4,600 | |||
Transfer agent’s fee and expenses (including affiliated expenses of $4,100) (Note 4) | 4,500 | |||
Commitment fee on syndicated credit agreement | 1,000 | |||
Miscellaneous | 7,739 | |||
Total expenses | 2,429,337 | |||
Less: custodian fee credit | (78 | ) | ||
Net expenses | 2,429,259 | |||
| NET INVESTMENT INCOME | 2,559,984 | |||
| REALIZED AND UNREALIZED GAIN (LOSS) ON INVESTMENTS AND FOREIGN CURRENCIES | ||||
Net realized gain (loss) on: | ||||
Investments | 5,930,111 | |||
Foreign currency transactions | (9,986 | ) | ||
| 5,920,125 | ||||
Net change in unrealized appreciation (depreciation) on: | ||||
Investments | 18,784,605 | |||
Foreign currencies | (630 | ) | ||
| 18,783,975 | ||||
| NET GAIN ON INVESTMENTS AND FOREIGN CURRENCIES | 24,704,100 | |||
| NET INCREASE IN NET ASSETS RESULTING FROM OPERATIONS | $ | 27,264,084 | ||
STATEMENT OF CHANGES IN NET ASSETS
| Year Ended December 31, 2005 | Year Ended December 31, 2004 | |||||||
| INCREASE (DECREASE) IN NET ASSETS | ||||||||
| OPERATIONS: | ||||||||
Net investment income | $ | 2,559,984 | $ | 2,773,967 | ||||
Net realized gain on investments and foreign currencies | 5,920,125 | 35,432,951 | ||||||
Net change in unrealized appreciation (depreciation) on investments and foreign currencies | 18,783,975 | (2,603,000 | ) | |||||
NET INCREASE IN NET ASSETS RESULTING FROM OPERATIONS | 27,264,084 | 35,603,918 | ||||||
| DIVIDENDS AND DISTRIBUTIONS: | ||||||||
Dividends from net investment income | (2,694,772 | ) | (1,941,811 | ) | ||||
Distributions from net realized gains | (29,342,603 | ) | — | |||||
TOTAL DIVIDENDS AND DISTRIBUTIONS | (32,037,375 | ) | (1,941,811 | ) | ||||
| CAPITAL STOCK TRANSACTIONS: | ||||||||
Capital stock sold [3,740,896 and 13,018,059 shares, respectively] | 38,659,851 | 132,163,329 | ||||||
Capital stock issued in reinvestment of dividends [3,337,227 and 194,961 shares, respectively] | 32,037,375 | 1,941,811 | ||||||
Capital stock repurchased [3,887,912 and 27,136,196 shares, respectively] | (39,651,019 | ) | (273,492,422 | ) | ||||
NET INCREASE (DECREASE) IN NET ASSETS RESULTING FROM CAPITAL STOCK TRANSACTIONS | 31,046,207 | (139,387,282 | ) | |||||
| TOTAL INCREASE (DECREASE) IN NET ASSETS | 26,272,916 | (105,725,175 | ) | |||||
| NET ASSETS: | ||||||||
Beginning of year | 285,471,295 | 391,196,470 | ||||||
End of year (a) | $ | 311,744,211 | $ | 285,471,295 | ||||
(a) Includes undistributed net investment income of | $ | 2,547,146 | $ | 2,691,920 | ||||
SEE NOTES TO FINANCIAL STATEMENTS.
A5
| SP GROWTH ASSET ALLOCATION PORTFOLIO |
STATEMENT OF ASSETS AND LIABILITIES
December 31, 2005
| ASSETS | |||
Affiliated investments, at value (cost $1,096,763,642) | $ | 1,214,798,131 | |
Receivable for capital stock sold | 1,083,967 | ||
Dividends receivable | 46,336 | ||
Prepaid expenses | 4,662 | ||
Total Assets | 1,215,933,096 | ||
| LIABILITIES | |||
Payable for investments purchased | 2,221,410 | ||
Payable for capital stock repurchased | 1,610,281 | ||
Payable to custodian | 49,168 | ||
Management fee payable | 48,004 | ||
Deferred directors’ fees | 969 | ||
Total Liabilities | 3,929,832 | ||
| NET ASSETS | $ | 1,212,003,264 | |
Net assets were comprised of: | |||
Common stock, at $0.01 par value | $ | 1,185,300 | |
Paid-in capital in excess of par | 1,052,447,788 | ||
| 1,053,633,088 | |||
Undistributed net investment income | 23,268,793 | ||
Accumulated net realized gain on investments | 17,066,894 | ||
Net unrealized appreciation on investments | 118,034,489 | ||
Net assets, December 31, 2005 | $ | 1,212,003,264 | |
Net asset value and redemption price per share, $1,212,003,264 / 118,530,002 outstanding shares of common stock (authorized 150,000,000 shares) | $ | 10.23 | |
STATEMENT OF OPERATIONS
Year Ended December 31, 2005
| INVESTMENT INCOME | |||
Affiliated dividend income | $ | 23,707,115 | |
| EXPENSES | |||
Management fee | 438,322 | ||
| NET INVESTMENT INCOME | 23,268,793 | ||
| NET REALIZED AND UNREALIZED GAIN ON AFFILIATED INVESTMENTS | |||
Net realized gain on investments | 10,378,051 | ||
Net capital gain distributions received | 9,475,320 | ||
| 19,853,371 | |||
Net change in unrealized appreciation (depreciation) on investments | 47,018,734 | ||
| NET GAIN ON INVESTMENTS | 66,872,105 | ||
| NET INCREASE IN NET ASSETS RESULTING FROM OPERATIONS | $ | 90,140,898 | |
STATEMENT OF CHANGES IN NET ASSETS
| Year Ended December 31, 2005 | Year Ended December 31, 2004 | |||||||
| INCREASE (DECREASE) IN NET ASSETS | ||||||||
| OPERATIONS: | ||||||||
Net investment income | $ | 23,268,793 | $ | 4,573,235 | ||||
Net realized gain on investments | 19,853,371 | 31,270,135 | ||||||
Net change in unrealized appreciation (depreciation) on investments | 47,018,734 | 32,882,645 | ||||||
NET INCREASE IN NET ASSETS RESULTING FROM OPERATIONS | 90,140,898 | 68,726,015 | ||||||
| DIVIDENDS AND DISTRIBUTIONS: | ||||||||
Dividends from net investment income | (4,573,235 | ) | (1,930,590 | ) | ||||
Distributions from net realized capital gains | (26,358,243 | ) | — | |||||
TOTAL DIVIDENDS AND DISTRIBUTIONS | (30,931,478 | ) | (1,930,590 | ) | ||||
| CAPITAL STOCK TRANSACTIONS: | ||||||||
Capital stock sold [57,444,052 and 33,790,622 shares, respectively] | 555,197,559 | 302,317,165 | ||||||
Capital stock issued in reinvestment of dividends [3,391,609 and 219,136 shares, respectively] | 30,931,478 | 1,930,590 | ||||||
Capital stock repurchased [9,905,250 and 3,934,729 shares, respectively] | (96,007,437 | ) | (35,076,687 | ) | ||||
NET INCREASE (DECREASE) IN NET ASSETS RESULTING FROM CAPITAL STOCK TRANSACTIONS | 490,121,600 | 269,171,068 | ||||||
| TOTAL INCREASE IN NET ASSETS | 549,331,020 | 335,966,493 | ||||||
| NET ASSETS: | ||||||||
Beginning of year | 662,672,244 | 326,705,751 | ||||||
End of year (a) | $ | 1,212,003,264 | $ | 662,672,244 | ||||
(a) Includes undistributed net investment income of: | $ | 23,268,793 | $ | 4,573,235 | ||||
SEE NOTES TO FINANCIAL STATEMENTS.
A6
| SP LARGE CAP VALUE PORTFOLIO |
STATEMENT OF ASSETS AND LIABILITIES
December 31, 2005
| ASSETS | |||
Investments, at value including securities on loan of $135,364,333: | |||
Unaffiliated investments (cost $751,748,564) | $ | 815,910,336 | |
Affiliated investments (cost $160,390,022) | 160,390,022 | ||
Receivable for capital stock sold | 1,755,726 | ||
Receivable for investments sold | 1,746,501 | ||
Dividends and interest receivable | 1,339,992 | ||
Prepaid expenses | 7,316 | ||
Total Assets | 981,149,893 | ||
| LIABILITIES | |||
Payable to broker for collateral for securities on loan | 140,729,696 | ||
Payable for investments purchased | 6,645,896 | ||
Management fees payable | 645,638 | ||
Accrued expenses and other liabilities | 18,355 | ||
Payable to custodian | 14,971 | ||
Deferred directors’ fees | 2,152 | ||
Shareholder servicing fees payable | 1,627 | ||
Total Liabilities | 148,058,335 | ||
| NET ASSETS | $ | 833,091,558 | |
Net assets were comprised of: | |||
Common stock, at $0.01 par value | $ | 700,076 | |
Paid-in capital in excess of par | 719,726,743 | ||
| 720,426,819 | |||
Undistributed net investment income | 10,902,617 | ||
Accumulated net realized gain on investments | 37,600,350 | ||
Net unrealized appreciation on investments and foreign currencies | 64,161,772 | ||
Net assets, December 31, 2005 | $ | 833,091,558 | |
Net asset value and redemption price per share, $833,091,558 / 70,007,613 outstanding shares of common stock (authorized 100,000,000 shares) | $ | 11.90 | |
STATEMENT OF OPERATIONS
Year Ended December 31, 2005
| INVESTMENT INCOME | ||||
Unaffiliated dividend income (net of foreign withholding taxes of $21,766) | $ | 16,559,037 | ||
Interest | 185,579 | |||
Affiliated dividend income | 65,349 | |||
Affiliated income from securities lending, net | 12,127 | |||
| 16,822,092 | ||||
| EXPENSES | ||||
Management fee | 5,712,657 | |||
Custodian’s fees and expenses | 127,000 | |||
Shareholders’ reports | 15,000 | |||
Audit fee | 15,000 | |||
Directors’ fees | 15,000 | |||
Legal fees and expenses | 8,000 | |||
Insurance expenses | 8,000 | |||
Transfer agent’s fee and expenses (including affiliated expenses of $4,225) (Note 4) | 5,000 | |||
Commitment fee on syndicated credit agreement | 2,000 | |||
Miscellaneous | 11,975 | |||
Total expenses | 5,919,632 | |||
Less: custodian fee credit | (2,438 | ) | ||
Net expenses | 5,917,194 | |||
| NET INVESTMENT INCOME | 10,904,898 | |||
| NET REALIZED AND UNREALIZED GAIN (LOSS) ON INVESTMENTS | ||||
Net realized gain on investments | 39,671,466 | |||
Net change in unrealized appreciation (depreciation) on investments | (2,235,206 | ) | ||
| NET GAIN ON INVESTMENTS | 37,436,260 | |||
| NET INCREASE IN NET ASSETS RESULTING FROM OPERATIONS | $ | 48,341,158 | ||
STATEMENT OF CHANGES IN NET ASSETS
| Year Ended December 31, 2005 | Year Ended December 31, 2004 | |||||||
| INCREASE IN NET ASSETS | ||||||||
| OPERATIONS: | ||||||||
Net investment income | $ | 10,904,898 | $ | 5,479,674 | ||||
Net realized gain on investments | 39,671,466 | 17,224,937 | ||||||
Net change in unrealized appreciation (depreciation) on investments | (2,235,206 | ) | 57,876,808 | |||||
NET INCREASE IN NET ASSETS RESULTING FROM OPERATIONS | 48,341,158 | 80,581,419 | ||||||
| DIVIDENDS AND DISTRIBUTIONS: | ||||||||
Dividends from net investment income | (5,481,955 | ) | (674,049 | ) | ||||
Distributions from net realized gains | (16,382,778 | ) | — | |||||
TOTAL DIVIDENDS AND DISTRIBUTIONS | (21,864,733 | ) | (674,049 | ) | ||||
| CAPITAL STOCK TRANSACTIONS: | ||||||||
Capital stock sold [24,086,262 and 4,940,622 shares, respectively] | 276,899,408 | 498,844,480 | ||||||
Capital stock issued in reinvestment of dividends [1,996,779 and 67,744 shares, respectively] | 21,864,733 | 674,049 | ||||||
Capital stock repurchased [8,095,951 and 4,817,105 shares, respectively] | (93,554,925 | ) | (50,902,662 | ) | ||||
NET INCREASE (DECREASE) IN NET ASSETS RESULTING FROM CAPITAL STOCK TRANSACTIONS | 205,209,216 | 448,615,867 | ||||||
| TOTAL INCREASE IN NET ASSETS | 231,685,641 | 528,523,237 | ||||||
| NET ASSETS: | ||||||||
Beginning of year | 601,405,917 | 72,882,680 | ||||||
End of year (a) | $ | 833,091,558 | $ | 601,405,917 | ||||
(a) Includes undistributed net investment income of | $ | 10,902,617 | $ | 5,479,674 | ||||
SEE NOTES TO FINANCIAL STATEMENTS.
A7
| SP LSV INTERNATIONAL VALUE PORTFOLIO |
STATEMENT OF ASSETS AND LIABILITIES
December 31, 2005
| ASSETS | |||
Investments, at value: | |||
Unaffiliated investments (cost $330,531,457) | $ | 381,386,493 | |
Affiliated investments (cost $2,870,490) | 2,870,490 | ||
Foreign currency, at value (cost $4,475,699) | 4,492,404 | ||
Dividends and interest receivable | 792,996 | ||
Receivable for investments sold | 426,119 | ||
Tax reclaim receivable | 147,003 | ||
Prepaid expenses | 3,957 | ||
Receivable for capital stock sold | 1,741 | ||
Total Assets | 390,121,203 | ||
| LIABILITIES | |||
Management fees payable | 286,776 | ||
Payable for investments purchased | 248,272 | ||
Accrued expenses and other liabilities | 171,567 | ||
Payable to custodian | 87,425 | ||
Transfer agent fees payable | 5,739 | ||
Total Liabilities | 799,779 | ||
| NET ASSETS | $ | 389,321,424 | |
Net assets were comprised of: | |||
Common stock, at $0.01 par value | $ | 428,955 | |
Paid-in capital in excess of par | 326,980,964 | ||
| 327,409,919 | |||
Undistributed net investment income | 5,753,024 | ||
Accumulated net realized gain on investments | 5,286,740 | ||
Net unrealized appreciation on investments and foreign currencies | 50,871,741 | ||
Net assets, December 31, 2005 | $ | 389,321,424 | |
Net asset value and redemption price per share, $389,321,424 / 42,895,546 outstanding shares of common stock (authorized 100,000,000 shares) | $ | 9.08 | |
STATEMENT OF OPERATIONS
Year Ended December 31, 2005
| INVESTMENT INCOME | ||||
Unaffiliated dividend income (net of foreign withholding taxes of $847,374) | $ | 9,153,967 | ||
Unaffiliated Interest | 214,197 | |||
Affiliated dividend income | 33,368 | |||
| 9,401,532 | ||||
| EXPENSES | ||||
Management fee | 2,692,190 | |||
Custodian’s fees and expenses | 354,000 | |||
Shareholders’ reports | 45,000 | |||
Audit fee | 19,000 | |||
Directors’ fees | 13,000 | |||
Legal fees and expenses | 10,000 | |||
Transfer agent’s fee and expenses (including affiliated expenses of $4,100) (Note 4) | 4,300 | |||
Insurance expenses | 3,000 | |||
Commitment fee on syndicated credit agreement | 1,900 | |||
Miscellaneous | 24,819 | |||
Total expenses | 3,167,209 | |||
Less: custodian fee credit | (75 | ) | ||
Net expenses | 3,167,134 | |||
| NET INVESTMENT INCOME | 6,234,398 | |||
| NET REALIZED AND UNREALIZED GAIN ON INVESTMENTS AND FOREIGN CURRENCIES | ||||
Net realized gain (loss) on: | ||||
Investments | 5,310,157 | |||
Foreign currency transactions | (387,773 | ) | ||
| 4,922,384 | ||||
Net change in unrealized appreciation (depreciation) on: | ||||
Investments | 32,110,147 | |||
Foreign currencies | 16,705 | |||
| 32,126,852 | ||||
| NET GAIN ON INVESTMENTS AND FOREIGN CURRENCIES | 37,049,236 | |||
| NET INCREASE IN NET ASSETS RESULTING FROM OPERATIONS | $ | 43,283,634 | ||
STATEMENT OF CHANGES IN NET ASSETS
| Year Ended December 31, 2005 | Year Ended December 31, 2004 | |||||||
| INCREASE (DECREASE) IN NET ASSETS | ||||||||
| OPERATIONS: | ||||||||
Net investment income | $ | 6,234,398 | $ | 1,214,681 | ||||
Net realized gain on investments and foreign currencies | 4,922,384 | 30,161,240 | ||||||
Net change in unrealized appreciation (depreciation) on investments and foreign currencies | 32,126,852 | (408,215 | ) | |||||
NET INCREASE IN NET ASSETS RESULTING FROM OPERATIONS | 43,283,634 | 30,967,706 | ||||||
| DIVIDENDS AND DISTRIBUTIONS: | ||||||||
Dividends from net investment income | (1,104,157 | ) | (662,879 | ) | ||||
Distributions from net realized gains | (23,089,120 | ) | — | |||||
TOTAL DIVIDENDS AND DISTRIBUTIONS | (24,193,277 | ) | (662,879 | ) | ||||
| CAPITAL STOCK TRANSACTIONS: | ||||||||
Capital stock sold [15,708,031 and 15,630,900 shares, respectively] | 131,395,774 | 122,280,619 | ||||||
Capital stock issued in reinvestment of dividends [2,997,928 and 85,422 shares, respectively] | 24,193,277 | 662,879 | ||||||
Capital stock repurchased [3,031,415 and 4,118,400 shares, respectively] | (26,061,363 | ) | (32,402,675 | ) | ||||
NET INCREASE (DECREASE) IN NET ASSETS RESULTING FROM CAPITAL STOCK TRANSACTIONS | 129,527,688 | 90,540,823 | ||||||
| TOTAL INCREASE IN NET ASSETS | 148,618,045 | 120,845,650 | ||||||
| NET ASSETS: | ||||||||
Beginning of year | 240,703,379 | 119,867,729 | ||||||
End of year (a) | $ | 389,321,424 | $ | 240,703,379 | ||||
(a) Includes undistributed net investment income of | $ | 5,753,024 | $ | 1,010,556 | ||||
SEE NOTES TO FINANCIAL STATEMENTS.
A8
| SP MID-CAP GROWTH PORTFOLIO |
STATEMENT OF ASSETS AND LIABILITIES
December 31, 2005
| ASSETS | ||||
Investments, at value including securities on loan of $21,770,399: | ||||
Unaffiliated investments (cost $122,800,820) | $ | 151,777,951 | ||
Affiliated investments (cost $24,166,965) | 24,166,965 | |||
Dividends and interest receivable | 55,148 | |||
Receivable for capital stock sold | 30,045 | |||
Prepaid expenses | 4,430 | |||
Total Assets | 176,034,539 | |||
| LIABILITIES | ||||
Collateral for securities on loan | 22,801,195 | |||
Accrued expenses and other liabilities | 201,683 | |||
Advisory fees payable | 113,530 | |||
Deferred directors’ fees | 4,259 | |||
Payable to custodian | 2,137 | |||
Shareholder servicing fees payable | 1,804 | |||
Withholding tax payable | 1,221 | |||
Total Liabilities | 23,125,829 | |||
| NET ASSETS | $ | 152,908,710 | ||
Net assets were comprised of: | ||||
Common stock, at $0.01 par value | $ | 212,173 | ||
Paid-in capital in excess of par | 126,181,061 | |||
| 126,393,234 | ||||
Accumulated net investment loss | (4,259 | ) | ||
Accumulated net realized loss on investments | (2,457,396 | ) | ||
Net unrealized appreciation on investments | 28,977,131 | |||
Net assets, December 31, 2005 | $ | 152,908,710 | ||
Net asset value and redemption price per share, $152,908,710 / 21,217,340 outstanding shares of common stock (authorized 100,000,000 shares) | $ | 7.21 | ||
STATEMENT OF OPERATIONS
Year Ended December 31, 2005
| INVESTMENT INCOME | ||||
Unaffiliated dividend income (net of foreign withholding taxes of $776) | $ | 519,093 | ||
Unaffiliated interest | 52,836 | |||
Affiliated dividend income | 8,573 | |||
Affiliated income from securities lending, net | 4,472 | |||
| 584,974 | ||||
| EXPENSES | ||||
Management fee | 1,064,841 | |||
Shareholders’ reports | 118,000 | |||
Custodian’s fees and expenses | 88,000 | |||
Audit fee | 27,000 | |||
Legal fees and expenses | 20,000 | |||
Directors’ fees | 10,000 | |||
Transfer agent’s fee and expenses (including affiliated expenses of $4,300) (Note 4) | 5,000 | |||
Insurance expenses | 2,000 | |||
Commitment fee on syndicated credit agreement | 600 | |||
Miscellaneous | 16,866 | |||
Total expenses | 1,352,307 | |||
Less: expense reimbursements | (21,095 | ) | ||
Less: custodian fee credit | (117 | ) | ||
Net expenses | 1,331,095 | |||
| NET INVESTMENT LOSS | (746,121 | ) | ||
| REALIZED AND UNREALIZED GAIN ON INVESTMENTS | ||||
Net realized gain on Investments: | 2,852,382 | |||
Net change in unrealized appreciation (depreciation) on Investments: | 9,613,723 | |||
| NET GAIN ON INVESTMENTS | 12,466,105 | |||
| NET INCREASE IN NET ASSETS RESULTING FROM OPERATIONS | $ | 11,719,984 | ||
STATEMENT OF CHANGES IN NET ASSETS
| Year Ended December 31, 2005 | Year Ended December 31, 2004 | |||||||
| INCREASE (DECREASE) IN NET ASSETS | ||||||||
| OPERATIONS: | ||||||||
Net investment loss | $ | (746,121 | ) | $ | (536,149 | ) | ||
Net realized gain on investments | 2,852,382 | 5,342,999 | ||||||
Net change in unrealized appreciation (depreciation) on investments | 9,613,723 | 11,075,571 | ||||||
NET INCREASE IN NET ASSETS RESULTING FROM OPERATIONS | 11,719,984 | 15,882,421 | ||||||
| CAPITAL STOCK TRANSACTIONS: | ||||||||
Capital stock sold [4,215,893 and 7,647,553 shares, respectively] | 27,851,805 | 46,088,129 | ||||||
Net asset value of shares issued in merger 5,202,111 and 0 shares, respectively] | 31,565,347 | — | ||||||
Capital stock repurchased [3,887,856 and 2,246,630 shares, respectively] | (25,739,227 | ) | (13,367,426 | ) | ||||
NET INCREASE (DECREASE) IN NET ASSETS RESULTING FROM CAPITAL STOCK TRANSACTIONS | 33,677,925 | 32,720,703 | ||||||
| TOTAL INCREASE IN NET ASSETS | 45,397,909 | 48,603,124 | ||||||
| NET ASSETS: | ||||||||
Beginning of year | 107,510,801 | 58,907,677 | ||||||
End of year (a) | $ | 152,908,710 | $ | 107,510,801 | ||||
SEE NOTES TO FINANCIAL STATEMENTS.
A9
| SP PIMCO HIGH YIELD PORTFOLIO |
STATEMENT OF ASSETS AND LIABILITIES
December 31, 2005
| ASSETS | |||
Investments, at value: | |||
Unaffiliated investments (cost $360,357,431) | $ | 362,532,210 | |
Affiliated investments (cost $1,039,453) | 1,039,453 | ||
Cash | 1,174,906 | ||
Foreign currency, at value (cost: $1,177,668) | 1,168,770 | ||
Dividends and interest receivable | 6,871,569 | ||
Receivable for investments sold | 219,528 | ||
Unrealized appreciation on swap agreements | 95,873 | ||
Interest receivable on swap agreements | 12,353 | ||
Prepaid expenses | 7,596 | ||
Swap contracts, outstanding | 6,287 | ||
Total Assets | 373,128,545 | ||
| LIABILITIES | |||
Payable for investments purchased | 3,504,862 | ||
Payable for capital stock repurchased | 407,879 | ||
Advisory fees payable | 277,252 | ||
Written options outstanding (cost $192,765) | 127,281 | ||
Unrealized depreciation on swap agreements | 122,275 | ||
Accrued expenses and other liabilities | 55,402 | ||
Unrealized depreciation on foreign currency forward contracts | 17,601 | ||
Due to broker-variation margin | 2,813 | ||
Deferred directors’ fees | 2,287 | ||
Shareholder servicing fees payable | 2,123 | ||
Withholding tax payable | 975 | ||
Total Liabilities | 4,520,750 | ||
| NET ASSETS | $ | 368,607,795 | |
Net assets were comprised of: | |||
Common stock, at $0.01 par value | $ | 359,653 | |
Paid-in capital in excess of par | 362,253,663 | ||
| 362,613,316 | |||
Undistributed net investment income | 1,462,427 | ||
Accumulated net realized gain on investments | 2,365,166 | ||
Net unrealized appreciation on investments and foreign currencies | 2,166,886 | ||
Net assets, December 31, 2005 | $ | 368,607,795 | |
Net asset value and redemption price per share, $368,607,795 / 35,965,294 outstanding shares of common stock (authorized 100,000,000 shares) | $ | 10.25 | |
STATEMENT OF OPERATIONS
Year Ended December 31, 2005
| INVESTMENT INCOME | ||||
Unaffiliated interest | $ | 24,917,042 | ||
Affiliated dividend income | 24,194 | |||
Unaffiliated dividend income (net of foreign withholding taxes of $314) | 4,393 | |||
| 24,945,629 | ||||
| EXPENSES | ||||
Management fee | 2,043,640 | |||
Custodian’s fees and expenses | 149,985 | |||
Shareholders’ reports | 20,000 | |||
Audit fee | 20,000 | |||
Directors’ fees | 15,000 | |||
Legal fees and expenses | 9,000 | |||
Transfer agent’s fee and expenses (including affiliated expenses of $3,920) (Note 4) | 5,000 | |||
Insurance expenses | 5,000 | |||
Commitment fee on syndicated credit agreement | 2,500 | |||
Miscellaneous | 7,853 | |||
Total expenses | 2,277,978 | |||
Less: custodian fee credit | (6,985 | ) | ||
Net expenses | 2,270,993 | |||
| NET INVESTMENT INCOME | 22,674,636 | |||
| NET REALIZED AND UNREALIZED GAIN (LOSS) ON INVESTMENTS AND FOREIGN CURRENCIES | ||||
Net realized gain (loss) on: | ||||
Investments | 3,344,817 | |||
Futures transactions | (681,780 | ) | ||
Options written | 287,400 | |||
Swap agreements | 238,131 | |||
Foreign currency transactions | 445,746 | |||
| 3,634,314 | ||||
Net change in unrealized appreciation (depreciation) on: | ||||
Investments | (12,614,605 | ) | ||
Futures | 144,784 | |||
Options Written | 65,484 | |||
Swap agreements | (28,676 | ) | ||
Foreign currencies | (38,845 | ) | ||
| (12,471,858 | ) | |||
| NET LOSS ON INVESTMENTS AND FOREIGN CURRENCIES | (8,837,544 | ) | ||
| NET INCREASE IN NET ASSETS RESULTING FROM OPERATIONS | $ | 13,837,092 | ||
STATEMENT OF CHANGES IN NET ASSETS
| Year Ended December 31, 2005 | Year Ended December 31, 2004 | |||||||
| INCREASE (DECREASE) IN NET ASSETS | ||||||||
| OPERATIONS: | ||||||||
Net investment income | $ | 22,674,636 | $ | 18,225,862 | ||||
Net realized gain on investments and foreign currencies | 3,634,314 | 4,596,019 | ||||||
Net change in unrealized appreciation (depreciation) on investments and foreign currencies | (12,471,858 | ) | 1,648,899 | |||||
NET INCREASE IN NET ASSETS RESULTING FROM OPERATIONS | 13,837,092 | 24,470,780 | ||||||
| DIVIDENDS AND DISTRIBUTIONS: | ||||||||
Dividends from net investment income | (22,462,955 | ) | (18,437,315 | ) | ||||
Distributions from net realized gains | (4,530,597 | ) | (2,719,931 | ) | ||||
TOTAL DIVIDENDS AND DISTRIBUTIONS | (26,993,552 | ) | (21,157,246 | ) | ||||
| CAPITAL STOCK TRANSACTIONS: | ||||||||
Capital stock sold [9,213,269 and 12,666,692 shares, respectively] | 96,076,697 | 133,099,782 | ||||||
Capital stock issued in reinvestment of dividends [2,626,070 and 2,033,225 shares, respectively] | 26,993,552 | 21,157,246 | ||||||
Capital stock repurchased [5,161,774 and 8,990,655 shares, respectively] | (53,822,419 | ) | (93,304,039 | ) | ||||
NET INCREASE (DECREASE) IN NET ASSETS RESULTING FROM CAPITAL STOCK TRANSACTIONS | 69,247,830 | 60,952,989 | ||||||
| TOTAL INCREASE IN NET ASSETS | 56,091,370 | 64,266,523 | ||||||
| NET ASSETS: | ||||||||
Beginning of year | 312,516,425 | 248,249,902 | ||||||
End of year (a) | $ | 368,607,795 | $ | 312,516,425 | ||||
(a) Includes undistributed net investment income of | $ | 1,462,427 | $ | 566,869 | ||||
SEE NOTES TO FINANCIAL STATEMENTS.
A10
| SP PIMCO TOTAL RETURN PORTFOLIO |
STATEMENT OF ASSETS AND LIABILITIES
December 31, 2005
| ASSETS | ||||
Investments, at value: | ||||
Unaffiliated investments (cost $2,015,034,653) | $ | 2,011,434,125 | ||
Affiliated investments (cost $5,960,264) | 5,960,264 | |||
Premium for swaps purchased | 246,559,248 | |||
Receivable for investments sold | 137,108,211 | |||
Dividends and interest receivable | 8,146,072 | |||
Foreign currency, at value (cost $5,913,665) | 5,952,953 | |||
Unrealized appreciation on swaps | 1,278,749 | |||
Receivable for capital stock sold | 510,639 | |||
Interest receivable on swap agreements | 297,250 | |||
Prepaid expenses | 25,388 | |||
Total Assets | 2,417,272,899 | |||
| LIABILITIES | ||||
Payable for investments purchased | 502,102,175 | |||
Premium for swaps written | 246,688,978 | |||
Securities sold short, at value (proceeds $119,935,699) | 120,525,187 | |||
Unrealized depreciation on swaps | 3,752,733 | |||
Advisory fees payable | 1,744,546 | |||
Outstanding options written (premium received $3,719,339) | 1,574,142 | |||
Unrealized depreciation on foreign currency forward contracts | 1,068,222 | |||
Interest payable on investments sold short | 662,662 | |||
Interest payable on swap agreements | 344,372 | |||
Payable to custodian | 271,407 | |||
Due to broker-variation margin | 148,996 | |||
Accrued expenses and other liabilities | 139,309 | |||
Deferred trustees’ fees | 2,625 | |||
Transfer agent fees payable | 2,080 | |||
Total Liabilities | 879,027,434 | |||
| NET ASSETS | $ | 1,538,245,465 | ||
Net assets were comprised of: | ||||
Common stock, at $0.01 par value | $ | 1,372,688 | ||
Paid-in capital in excess of par | 1,551,548,030 | |||
| 1,552,920,718 | ||||
Undistributed net investment income | 6,657,952 | |||
Accumulated net realized loss on investments | (15,275,474 | ) | ||
Net unrealized depreciation on investments | (6,057,731 | ) | ||
Net assets, December 31, 2005 | $ | 1,538,245,465 | ||
Net asset value and redemption price per share, $1,538,245,465 / 137,268,754 outstanding shares of common stock (authorized 225,000,000 shares) | $ | 11.21 | ||
STATEMENT OF OPERATIONS
Year Ended December 31, 2005
| INVESTMENT INCOME | ||||
Interest | $ | 56,316,679 | ||
Affiliated dividend income | 265,890 | |||
Unaffiliated dividend income | 22,500 | |||
| 56,605,069 | ||||
| EXPENSES | ||||
Management fee | 8,009,402 | |||
Custodian’s fees and expenses | 239,000 | |||
Shareholders’ reports | 38,000 | |||
Directors’ fees | 27,000 | |||
Audit fee | 20,000 | |||
Insurance expenses | 17,000 | |||
Legal fees and expenses | 10,000 | |||
Transfer agent’s fee and expenses (Note 4) | 5,000 | |||
Commitment fee on syndicated credit agreement | 4,500 | |||
Miscellaneous | 7,615 | |||
Total expenses | 8,377,517 | |||
Less: custodian fee credit | (39,624 | ) | ||
Net expenses | 8,337,893 | |||
| NET INVESTMENT INCOME | 48,267,176 | |||
| NET REALIZED AND UNREALIZED GAIN (LOSS) ON INVESTMENTS AND FOREIGN CURRENCIES | ||||
Net realized gain (loss) on: | ||||
Investments | 717,222 | |||
Futures transactions | (6,403,684 | ) | ||
Options written | 2,651,703 | |||
Swap agreements | 467,132 | |||
Foreign currency transactions | 5,620,200 | |||
Short sales | (3,110,121 | ) | ||
| (57,548 | ) | |||
Net change in unrealized appreciation (depreciation) on: | ||||
Investments | (14,978,205 | ) | ||
Futures | (108,214 | ) | ||
Options written | (602,388 | ) | ||
Swap agreements | 1,153,737 | |||
Foreign currencies | (441,403 | ) | ||
Short sales | (44,716 | ) | ||
| (15,021,189 | ) | |||
| NET LOSS ON INVESTMENTS AND FOREIGN CURRENCIES | (15,078,737 | ) | ||
| NET INCREASE IN NET ASSETS RESULTING FROM OPERATIONS | $ | 33,188,439 | ||
STATEMENT OF CHANGES IN NET ASSETS
| Year Ended December 31, 2005 | Year Ended December 31, 2004 | |||||||
| INCREASE (DECREASE) IN NET ASSETS | ||||||||
| OPERATIONS: | ||||||||
Net investment income | $ | 48,267,176 | $ | 19,240,764 | ||||
Net realized gain (loss) on investments and foreign currencies | (57,548 | ) | 29,705,297 | |||||
Net change in unrealized appreciation (depreciation) on investments and foreign currencies | (15,021,189 | ) | (708,459 | ) | ||||
NET INCREASE IN NET ASSETS RESULTING FROM OPERATIONS | 33,188,439 | 48,237,602 | ||||||
| DIVIDENDS AND DISTRIBUTIONS: | ||||||||
Dividends from net investment income | (65,066,623 | ) | (18,784,427 | ) | ||||
Distributions from net realized gains | (21,522,555 | ) | (16,595,819 | ) | ||||
TOTAL DIVIDENDS AND DISTRIBUTIONS | (86,589,178 | ) | (35,380,246 | ) | ||||
| CAPITAL STOCK TRANSACTIONS: | ||||||||
Capital stock sold [45,303,572 and 33,233,895 shares, respectively] | 518,342,360 | 382,917,441 | ||||||
Capital stock issued in reinvestment of dividends [7,727,423 and 3,069,432 shares, respectively] | 86,589,178 | 35,380,246 | ||||||
Capital stock repurchased [9,845,936 and 14,954,106 shares, respectively] | (112,279,676 | ) | (171,285,273 | ) | ||||
NET INCREASE (DECREASE) IN NET ASSETS RESULTING FROM CAPITAL STOCK TRANSACTIONS | 492,651,862 | 247,012,414 | ||||||
| TOTAL INCREASE IN NET ASSETS | 439,251,123 | 259,869,770 | ||||||
| NET ASSETS: | ||||||||
Beginning of year | 1,098,994,342 | 839,124,572 | ||||||
End of year (a) | $ | 1,538,245,465 | $ | 1,098,994,342 | ||||
(a) Includes undistributed net investment income of | $ | 6,657,952 | $ | 14,907,720 | ||||
SEE NOTES TO FINANCIAL STATEMENTS.
A11
| SP PRUDENTIAL U.S. EMERGING GROWTH PORTFOLIO |
STATEMENT OF ASSETS AND LIABILITIES
December 31, 2005
| ASSETS | ||||
Investments, at value including securities on loan of $61,162,980: | ||||
Unaffiliated investments (cost $153,262,336) | $ | 187,907,491 | ||
Affiliated investments (cost $71,158,376) | 71,158,376 | |||
Cash | 21,155 | |||
Receivable for capital stock sold | 579,400 | |||
Receivable for investments sold | 390,142 | |||
Dividends and interest receivable | 55,683 | |||
Prepaid expenses | 7,779 | |||
Total Assets | 260,120,026 | |||
| LIABILITIES | ||||
Collateral for securities on loan | 63,990,138 | |||
Payable for investments purchased | 499,318 | |||
Accrued expenses and other liabilities | 185,876 | |||
Payable for capital stock repurchased | 121,476 | |||
Management fee payable | 99,881 | |||
Deferred directors’ fees | 407 | |||
Transfer agent fee payable | 401 | |||
Distribution fee payable | 83 | |||
Administration fee payable | 50 | |||
Total Liabilities | 64,897,630 | |||
| NET ASSETS | $ | 195,222,396 | ||
Net assets were comprised of: | ||||
Common stock, at $0.01 par value | $ | 247,964 | ||
Paid-in capital in excess of par | 145,238,639 | |||
| 145,486,603 | ||||
Accumulated net investment loss | (407 | ) | ||
Accumulated net realized gain on investments and foreign currencies | 15,091,045 | |||
Net unrealized appreciation on investments | 34,645,155 | |||
Net assets, December 31, 2005 | $ | 195,222,396 | ||
| Class I: | ||||
Net asset value and redemption price per share, $194,834,259 / 24,746,165 outstanding shares of common stock (authorized 100,000,000 shares) | $ | 7.87 | ||
| Class II: | ||||
Net asset value and redemption price per share, $388,137 / 50,278 outstanding shares of common stock (authorized 60,000,000 shares) | $ | 7.72 | ||
STATEMENT OF OPERATIONS
Year Ended December 31, 2005
| INVESTMENT INCOME | ||||
Unaffiliated dividend income (net of foreign withholding taxes of $3,109 ) | $ | 476,302 | ||
Affiliated dividend income | 192,858 | |||
Affiliated income from securities loaned, net | 148,103 | |||
Interest | 279 | |||
| 817,542 | ||||
| EXPENSES | ||||
Management fee | 949,735 | |||
Distribution fee—Class II | 879 | |||
Administration fee—Class II | 527 | |||
Custodian’s fees and expenses | 114,000 | |||
Shareholders’ reports | 120,000 | |||
Audit fee | 30,000 | |||
Directors’ fees | 12,000 | |||
Legal fees and expenses | 22,000 | |||
Transfer agent’s fee and expenses (including affiliated expense of $4,300) (Note 4) | 5,000 | |||
Insurance expenses | 4,000 | |||
Commitment fee on syndicated credit agreement | 1,000 | |||
Miscellaneous | 4,425 | |||
Total expenses | 1,263,566 | |||
Less: custodian fee credit | (732 | ) | ||
Net expenses | 1,262,834 | |||
| NET INVESTMENT LOSS | (445,292 | ) | ||
| NET REALIZED AND UNREALIZED GAIN (LOSS) ON INVESTMENTS AND FOREIGN CURRENCIES | ||||
Net realized gain on: | ||||
Investments | 15,793,877 | |||
Foreign currency transactions | 464 | |||
Options written | 70,446 | |||
| 15,864,787 | ||||
Net change in unrealized appreciation (depreciation) on: | ||||
Investments | 15,548,665 | |||
Options written | 85,130 | |||
Foreign currencies | (76 | ) | ||
| 15,633,719 | ||||
| NET GAIN ON INVESTMENTS AND FOREIGN CURRENCIES | 31,498,506 | |||
| NET INCREASE IN NET ASSETS RESULTING FROM OPERATIONS | $ | 31,053,214 | ||
STATEMENT OF CHANGES IN NET ASSETS
| Year Ended December 31, 2005 | Year Ended December 31, 2004 | |||||||
| INCREASE (DECREASE) IN NET ASSETS | ||||||||
| OPERATIONS: | ||||||||
Net investment loss | $ | (445,292 | ) | $ | (727,729 | ) | ||
Net realized gain on investments and foreign currencies | 15,864,787 | 23,079,809 | ||||||
Net change in unrealized appreciation (depreciation) on investments and foreign currencies | 15,633,719 | 4,402,367 | ||||||
NET INCREASE IN NET ASSETS RESULTING FROM OPERATIONS | 31,053,214 | 26,754,447 | ||||||
| DIVIDENDS AND DISTRIBUTIONS: | ||||||||
Dividends from net investment income | ||||||||
Class I | (205 | ) | — | |||||
Distributions from net realized capital gains | ||||||||
Class I | (22,102,685 | ) | (56,557 | ) | ||||
Class II | (57,580 | ) | (96 | ) | ||||
TOTAL DIVIDENDS AND DISTRIBUTIONS | (22,160,470 | ) | (56,653 | ) | ||||
| CAPITAL STOCK TRANSACTIONS (Note 7): | ||||||||
Capital stock sold [4,400,150 and 11,301,550 shares, respectively] | 32,192,747 | 79,126,894 | ||||||
Net asset value, of shares issued in connection with merger [4,037,693 and 0 shares, respectively] | 24,736,435 | — | ||||||
Capital stock issued in reinvestment of dividends and distributions [3,425,266 and 8,331 shares, respectively] | 22,160,470 | 56,653 | ||||||
Capital stock repurchased [3,011,057 and 20,993,725 shares, respectively] | (21,469,947 | ) | (147,512,432 | ) | ||||
NET INCREASE (DECREASE) IN NET ASSETS RESULTING FROM CAPITAL STOCK TRANSACTIONS | 57,619,705 | (68,328,885 | ) | |||||
| TOTAL INCREASE (DECREASE) IN NET ASSETS | 66,512,449 | (41,631,091 | ) | |||||
| NET ASSETS: | ||||||||
Beginning of year | 128,709,947 | 170,341,038 | ||||||
End of year (a) | $ | 195,222,396 | $ | 128,709,947 | ||||
(a) Includes undistributed net investment income of: | $ | — | $ | 169 | ||||
SEE NOTES TO FINANCIAL STATEMENTS.
A12
| SP SMALL CAP GROWTH PORTFOLIO |
STATEMENT OF ASSETS AND LIABILITIES
December 31, 2005
| ASSETS | ||||
Investments, at value including securities on loan of $9,623,765: | ||||
Unaffiliated investments (cost $117,526,524) | $ | 127,919,590 | ||
Affiliated investments (cost $19,630,203) | 19,630,203 | |||
Receivable for investments sold | 297,853 | |||
Dividends and interest receivable | 49,323 | |||
Receivable for capital stock sold | 4,557 | |||
Prepaid expenses | 2,460 | |||
Total Assets | 147,903,986 | |||
| LIABILITIES | ||||
Payable to broker for collateral for securities on loan | 10,275,968 | |||
Payable for investments purchased | 1,785,280 | |||
Advisory fees payable | 88,274 | |||
Accrued expenses and other liabilities | 34,547 | |||
Deferred trustees’ fees | 2,118 | |||
Shareholder servicing fees payable | 1,968 | |||
Payable to custodian | 1,122 | |||
Total Liabilities | 12,189,277 | |||
| NET ASSETS | $ | 135,714,709 | ||
Net assets were comprised of: | ||||
Common stock, at $0.01 par value | $ | 204,918 | ||
Paid-in capital in excess of par | 126,948,466 | |||
| 127,153,384 | ||||
Accumulated net investment loss | (2,118 | ) | ||
Accumulated net realized loss on investments | (1,829,623 | ) | ||
Net unrealized appreciation on investments | 10,393,066 | |||
Net assets, December 31, 2005 | $ | 135,714,709 | ||
Net asset value and redemption price per share, $135,714,709 / 20,491,763 outstanding shares of common stock (authorized 100,000,000 shares) | $ | 6.62 | ||
STATEMENT OF OPERATIONS
Year Ended December 31, 2005
| INVESTMENT INCOME | ||||
Unaffiliated dividend income (net of foreign withholding taxes of $2,272) | $ | 637,497 | ||
Unaffiliated interest | 377,283 | |||
Affiliated dividend income | 30,279 | |||
Affiliated income from securities lending, net | 11,484 | |||
| 1,056,543 | ||||
| EXPENSES | ||||
Management fee | 1,634,440 | |||
Custodian’s fees and expenses | 95,000 | |||
Shareholders’ reports | 32,000 | |||
Audit fee | 15,000 | |||
Directors’ fees | 14,000 | |||
Legal fees and expenses | 9,000 | |||
Transfer agent’s fee and expenses (including affiliated expenses of $4,300) (Note 4) | 5,000 | |||
Insurance expenses | 2,000 | |||
Commitment fee on syndicated credit agreement | 1,300 | |||
Miscellaneous | 6,085 | |||
Total expenses | 1,813,825 | |||
Less: custodian fee credit | (2,360 | ) | ||
Net expenses | 1,811,465 | |||
| NET INVESTMENT LOSS | (754,922 | ) | ||
| NET REALIZED AND UNREALIZED GAIN (LOSS) ON INVESTMENTS | ||||
Net realized gain on: | ||||
Investments | 18,176,920 | |||
| 18,176,920 | ||||
Net change in unrealized appreciation (depreciation) on: | ||||
Investments | (12,040,245 | ) | ||
| (12,040,245 | ) | |||
| NET GAIN ON INVESTMENTS | 6,136,675 | |||
| NET INCREASE IN NET ASSETS RESULTING FROM OPERATIONS | $ | 5,381,753 | ||
STATEMENT OF CHANGES IN NET ASSETS
| Year Ended December 31, 2005 | Year Ended December 31, 2004 | |||||||
| INCREASE (DECREASE) IN NET ASSETS | ||||||||
| OPERATIONS: | ||||||||
Net investment loss | $ | (754,922 | ) | $ | (949,484 | ) | ||
Net realized gain (loss) on investments | 18,176,920 | (16,711,867 | ) | |||||
Net change in unrealized appreciation (depreciation) on investments | (12,040,245 | ) | 18,224,820 | |||||
NET INCREASE IN NET ASSETS RESULTING FROM OPERATIONS | 5,381,753 | 563,469 | ||||||
| CAPITAL STOCK TRANSACTIONS: | ||||||||
Capital stock sold [10,844,232 and 26,969,916 shares, respectively] | 67,879,177 | 173,200,231 | ||||||
Capital stock repurchased [18,841,264 and 3,851,078 shares, respectively] | (121,618,637 | ) | (24,710,400 | ) | ||||
NET INCREASE (DECREASE) IN NET ASSETS RESULTING FROM CAPITAL STOCK TRANSACTIONS | (53,739,460 | ) | 148,489,831 | |||||
| TOTAL INCREASE (DECREASE) IN NET ASSETS | (48,357,707 | ) | 149,053,300 | |||||
| NET ASSETS: | ||||||||
Beginning of year | 184,072,416 | 35,019,116 | ||||||
End of year | $ | 135,714,709 | $ | 184,072,416 | ||||
SEE NOTES TO FINANCIAL STATEMENTS.
A13
| SP SMALL CAP VALUE FUND |
STATEMENT OF ASSETS AND LIABILITIES
December 31, 2005
| ASSETS | |||
Investments, at value including securities on loan of $30,938,521: | |||
Unaffiliated investments (cost $316,678,893) | $ | 330,171,533 | |
Affiliated investments (cost $48,715,973) | 48,715,973 | ||
Cash | 4,200,969 | ||
Dividends and interest receivable | 647,955 | ||
Receivable for investments sold | 464,192 | ||
Prepaid expenses | 9,597 | ||
Total Assets | 384,210,219 | ||
| LIABILITIES | |||
Collateral for securities on loan | 32,114,160 | ||
Payable for investments purchased | 989,297 | ||
Management fees payable | 268,459 | ||
Accrued expenses and other liabilities | 86,411 | ||
Payable for capital stock repurchased | 43,139 | ||
Deferred directors’ fees | 2,351 | ||
Transfer agent fees payable | 2,061 | ||
Total Liabilities | 33,505,878 | ||
| NET ASSETS | $ | 350,704,341 | |
Net assets were comprised of: | |||
Common stock, at $0.01 par value | $ | 245,792 | |
Paid-in capital in excess of par | 278,696,489 | ||
| 278,942,281 | |||
Undistributed net investment income | 1,885,918 | ||
Accumulated net realized gain on investments | 56,383,502 | ||
Net unrealized appreciation on investments | 13,492,640 | ||
Net assets, December 31, 2005 | $ | 350,704,341 | |
Net asset value and redemption price per share, $350,704,341 / 24,579,197 outstanding shares of common stock (authorized 100,000,000 shares) | $ | 14.27 | |
STATEMENT OF OPERATIONS
Year Ended December 31, 2005
| INVESTMENT INCOME | ||||
Unaffiliated dividend income (net of foreign withholding taxes of $4,391) | $ | 5,539,685 | ||
Affiliated dividend income | 28,969 | |||
Affiliated income from securities lending, net | 10,832 | |||
| 5,579,486 | ||||
| EXPENSES | ||||
Management fee | 3,442,199 | |||
Custodian’s fees and expenses | 145,000 | |||
Shareholders’ reports | 42,000 | |||
Audit fee | 17,000 | |||
Directors’ fees | 15,000 | |||
Legal fees and expenses | 13,000 | |||
Insurance expenses | 5,000 | |||
Transfer agent’s fee and expenses (including affiliated expenses of $4,500) (Note 4) | 4,700 | |||
Commitment fee on syndicated credit agreement | 1,700 | |||
Miscellaneous | 6,666 | |||
Total expenses | 3,692,265 | |||
Less: custodian fee credit | (1,189 | ) | ||
Net expenses | 3,691,076 | |||
| NET INVESTMENT INCOME | 1,888,410 | |||
| NET REALIZED AND UNREALIZED GAIN (LOSS) ON INVESTMENTS | ||||
Net realized gain on investments | 57,245,116 | |||
Net change in unrealized appreciation (depreciation) on investments | (36,955,062 | ) | ||
| NET GAIN ON INVESTMENTS | 20,290,054 | |||
| NET INCREASE IN NET ASSETS RESULTING FROM OPERATIONS | $ | 22,178,464 | ||
STATEMENT OF CHANGES IN NET ASSETS
| Year Ended December 31, 2005 | Year Ended December 31, 2004 | |||||||
| INCREASE (DECREASE) IN NET ASSETS | ||||||||
| OPERATIONS: | ||||||||
Net investment income | $ | 1,888,410 | $ | 2,138,010 | ||||
Net realized gain on investments | 57,245,116 | 46,403,552 | ||||||
Net change in unrealized appreciation (depreciation) on investments | (36,955,062 | ) | 14,582,023 | |||||
NET INCREASE IN NET ASSETS RESULTING FROM OPERATIONS | 22,178,464 | 63,123,585 | ||||||
| DIVIDENDS AND DISTRIBUTIONS: | ||||||||
Dividends from net investment income | (2,140,502 | ) | (553,326 | ) | ||||
Distributions from net realized gains | (47,092,460 | ) | (93,547 | ) | ||||
TOTAL DIVIDENDS AND DISTRIBUTIONS | (49,232,962 | ) | (646,873 | ) | ||||
| CAPITAL STOCK TRANSACTIONS: | ||||||||
Capital stock sold [7,412,645 and 11,394,458 shares, respectively] | 103,227,323 | 153,984,132 | ||||||
Capital stock issued in reinvestment of dividends [3,763,988 and 49,229 shares, respectively] | 49,232,962 | 646,873 | ||||||
Capital stock repurchased [11,952,082 and 5,544,868 shares, respectively] | (168,010,162 | ) | (74,374,100 | ) | ||||
NET INCREASE (DECREASE) IN NET ASSETS RESULTING FROM CAPITAL STOCK TRANSACTIONS | (15,549,877 | ) | 80,256,905 | |||||
| TOTAL INCREASE (DECREASE) IN NET ASSETS | (42,604,375 | ) | 142,733,617 | |||||
| NET ASSETS: | ||||||||
Beginning of year | 393,308,716 | 250,575,099 | ||||||
End of year (a) | $ | 350,704,341 | $ | 393,308,716 | ||||
(a) Includes undistributed net investment income of | $ | 1,885,918 | $ | 2,138,010 | ||||
SEE NOTES TO FINANCIAL STATEMENTS.
A14
| SP STRATEGIC PARTNERS FOCUSED GROWTH PORTFOLIO |
STATEMENT OF ASSETS AND LIABILITIES
December 31, 2005
| ASSETS | ||||
Investments, at value: | ||||
Unaffiliated investments (cost $67,414,573) | $ | 80,112,275 | ||
Affiliated investments (cost $785,524) | 785,524 | |||
Receivable for investments sold | 260,653 | |||
Dividends receivable | 41,193 | |||
Tax reclaim receivable | 2,304 | |||
Prepaid expenses | 2,122 | |||
Total Assets | 81,204,071 | |||
| LIABILITIES | ||||
Payable for capital stock repurchased | 56,813 | |||
Management fee payable | 35,865 | |||
Accrued expenses and other liabilities | 33,348 | |||
Administration fee payable | 15,397 | |||
Payable to custodian | 3,777 | |||
Deferred trustees’ fees | 2,143 | |||
Distribution fee payable | 1,624 | |||
Transfer agent fee payable | 1,069 | |||
Total Liabilities | 150,036 | |||
| NET ASSETS | $ | 81,054,035 | ||
Net assets were comprised of: | ||||
Common stock, at $0.01 par value | $ | 101,556 | ||
Paid-in capital in excess of par | 65,156,700 | |||
| 65,258,256 | ||||
Accumulated net investment loss | (2,143 | ) | ||
Accumulated net realized gain on investments | 3,100,220 | |||
Net unrealized appreciation on investments | 12,697,702 | |||
Net assets, December 31, 2005 | $ | 81,054,035 | ||
| Class I: | ||||
Net asset value and redemption price per share, $38,290,049 / 4,746,991 outstanding shares of common stock (authorized 100,000,000 shares) | $ | 8.07 | ||
| Class II: | ||||
Net asset value and redemption price per share, $42,763,986 / 5,408,593 outstanding shares of common stock (authorized 60,000,000 shares) | $ | 7.91 | ||
STATEMENT OF OPERATIONS
Year Ended December 31, 2005
| INVESTMENT INCOME | ||||
Unaffiliated dividend income (net of foreign withholding taxes of $13,788) | $ | 388,740 | ||
Affiliated dividend income | 38,099 | |||
Interest | 7,895 | |||
| 434,734 | ||||
| EXPENSES | ||||
Management fee | 620,451 | |||
Distribution fee—Class II | 92,027 | |||
Administration fee—Class II | 55,216 | |||
Custodian’s fees and expenses | 100,000 | |||
Shareholders’ reports | 25,000 | |||
Audit fee | 15,000 | |||
Trustees’ fees and expenses | 9,000 | |||
Legal fees and expenses | 8,000 | |||
Transfer agent’s fee and expenses (including affiliated expenses of $3,700) (Note 4) | 4,000 | |||
Insurance expenses | 1,000 | |||
Commitment fee on syndicated credit agreement | 300 | |||
Miscellaneous | 4,849 | |||
Total expenses | 934,843 | |||
Less: expense reimbursements | (46,572 | ) | ||
Less: custodian fee credit | (193 | ) | ||
Net expenses | 888,078 | |||
| NET INVESTMENT LOSS | (453,344 | ) | ||
| NET REALIZED AND UNREALIZED GAIN (LOSS) ON INVESTMENTS | ||||
Net realized gain on investments | 7,252,737 | |||
Net change in unrealized appreciation (depreciation) on investments | 3,483,073 | |||
| NET GAIN ON INVESTMENTS | 10,735,810 | |||
| NET INCREASE IN NET ASSETS RESULTING FROM OPERATIONS | $ | 10,282,466 | ||
STATEMENT OF CHANGES IN NET ASSETS
| Year Ended December 31, 2005 | Year Ended December 31, 2004 | |||||||
| INCREASE (DECREASE) IN NET ASSETS | ||||||||
| OPERATIONS: | ||||||||
Net investment loss | $ | (453,344 | ) | $ | (70,251 | ) | ||
Net realized gain on investments | 7,252,737 | 920,465 | ||||||
Net change in unrealized appreciation (depreciation) on investments | 3,483,073 | 4,744,770 | ||||||
NET INCREASE IN NET ASSETS RESULTING FROM OPERATIONS | 10,282,466 | 5,594,984 | ||||||
| CAPITAL STOCK TRANSACTIONS (Note 7): | ||||||||
Capital stock sold [3,646,345 and 4,453,940 shares, respectively] | 25,555,392 | 28,204,223 | ||||||
Capital stock repurchased [2,448,898 and 1,186,253 shares, respectively] | (16,934,804 | ) | (7,525,789 | ) | ||||
NET INCREASE (DECREASE) IN NET ASSETS RESULTING FROM CAPITAL STOCK TRANSACTIONS | 8,620,588 | �� | 20,678,434 | |||||
| TOTAL INCREASE IN NET ASSETS | 18,903,054 | 26,273,418 | ||||||
| NET ASSETS: | ||||||||
Beginning of year | 62,150,981 | 35,877,563 | ||||||
End of year | $ | 81,054,035 | $ | 62,150,981 | ||||
SEE NOTES TO FINANCIAL STATEMENTS.
A15
| SP T. ROWE PRICE LARGE CAP GROWTH PORTFOLIO |
STATEMENT OF ASSETS AND LIABILITIES
December 31, 2005
| ASSETS | ||||
Investments, at value | ||||
Unaffiliated investments (cost $66,832,319) | $ | 71,565,187 | ||
Affiliated investments (cost $2,632,964) | 2,632,964 | |||
Dividends receivable | 66,013 | |||
Receivable for capital stock sold | 9,851 | |||
Prepaid expenses | 2,030 | |||
Total Assets | 74,276,045 | |||
| LIABILITIES | ||||
Payable for investments purchased | 440,004 | |||
Accrued expenses and other liabilities | 41,082 | |||
Advisory fees payable | 10,030 | |||
Deferred directors’ fees | 2,314 | |||
Payable to custodian | 2,010 | |||
Withholding tax payable | 578 | |||
Total Liabilities | 496,018 | |||
| NET ASSETS | $ | 73,780,027 | ||
Net assets were comprised of: | ||||
Common stock, at $0.01 par value | $ | 95,742 | ||
Paid-in capital in excess of par | 60,105,850 | |||
| 60,201,592 | ||||
Accumulated net investment loss | (2,314 | ) | ||
Accumulated net realized gain on investments | 8,847,881 | |||
Net unrealized appreciation on investments | 4,732,868 | |||
Net assets, December 31, 2005 | $ | 73,780,027 | ||
Net asset value and redemption price per share, $73,780,027 / 9,574,198 outstanding shares of common stock (authorized 100,000,000 shares) | $ | 7.71 | ||
STATEMENT OF OPERATIONS
Year Ended December 31, 2005
| INVESTMENT INCOME | ||||
Unaffiliated dividend income (net of foreign withholding taxes of $9,282) | $ | 437,691 | ||
Affiliated dividend income | 6,999 | |||
Unaffiliated Interest | 5,790 | |||
| 450,480 | ||||
| EXPENSES | ||||
Management fee | 597,957 | |||
Custodian’s fees and expenses | 90,000 | |||
Shareholders’ reports | 37,000 | |||
Audit fee | 15,000 | |||
Directors’ fees | 11,000 | |||
Legal fees and expenses | 9,000 | |||
Transfer agent’s fee and expenses (including affiliated expenses of $3,851) (Note 4) | 4,000 | |||
Insurance expenses | 1,000 | |||
Commitment fee on syndicated credit agreement | 500 | |||
Miscellaneous | 8,154 | |||
Total expenses | 773,611 | |||
Less: management fee waivers and expense reimbursements | (70,618 | ) | ||
Less: custodian fee credit | (413 | ) | ||
Net expenses | 702,580 | |||
| NET INVESTMENT LOSS | (252,100 | ) | ||
| NET REALIZED AND UNREALIZED GAIN (LOSS) ON INVESTMENTS | ||||
Net realized gain on investments | 12,322,519 | |||
Net change in unrealized appreciation (depreciation) on investments | (1,525,052 | ) | ||
| NET GAIN ON INVESTMENTS | 10,797,467 | |||
| NET INCREASE IN NET ASSETS RESULTING FROM OPERATIONS | $ | 10,545,367 | ||
STATEMENT OF CHANGES IN NET ASSETS
| Year Ended December 31, 2005 | Year Ended December 31, 2004 | |||||||
| INCREASE (DECREASE) IN NET ASSETS | ||||||||
| OPERATIONS: | ||||||||
Net investment loss | $ | (252,100 | ) | $ | (130,997 | ) | ||
Net realized gain on investments | 12,322,519 | 10,375,124 | ||||||
Net change in unrealized appreciation (depreciation) on investments | (1,525,052 | ) | (8,138,530 | ) | ||||
NET INCREASE IN NET ASSETS RESULTING FROM OPERATIONS | 10,545,367 | 2,105,597 | ||||||
| CAPITAL STOCK TRANSACTIONS: | ||||||||
Capital stock sold [1,686,574 and 8,646,319 shares, respectively] | 11,483,234 | 54,050,476 | ||||||
Capital stock repurchased [2,056,395 and 22,224,721 shares, respectively] | (13,953,855 | ) | (136,920,541 | ) | ||||
NET INCREASE (DECREASE) IN NET ASSETS RESULTING FROM CAPITAL STOCK TRANSACTIONS | (2,470,621 | ) | (82,870,065 | ) | ||||
| TOTAL INCREASE (DECREASE) IN NET ASSETS | 8,074,746 | (80,764,468 | ) | |||||
| NET ASSETS: | ||||||||
Beginning of year | 65,705,281 | 146,469,749 | ||||||
End of year | $ | 73,780,027 | $ | 65,705,281 | ||||
SEE NOTES TO FINANCIAL STATEMENTS.
A16
| SP WILLIAM BLAIR INTERNATIONAL GROWTH PORTFOLIO |
STATEMENT OF ASSETS AND LIABILITIES
December 31, 2005
| ASSETS | |||
Investments, at value including securities on loan of $4,811,333: | |||
Unaffiliated investments (cost $368,583,806) | $ | 453,395,898 | |
Affiliated investments (cost $22,730,064) | 22,730,064 | ||
Cash | 147,815 | ||
Foreign currency, at value (cost $7,344,869) | 7,392,352 | ||
Receivable for investments sold | 461,143 | ||
Dividends and interest receivable | 262,641 | ||
Tax reclaim receivable | 131,937 | ||
Prepaid expenses | 8,633 | ||
Total Assets | 484,530,483 | ||
| LIABILITIES | |||
Collateral for securities on loan | 5,052,456 | ||
Payable for investments purchased | 2,346,605 | ||
Management fee payable | 333,830 | ||
Accrued expenses and other liabilities | 122,025 | ||
Payable for capital stock repurchased | 22,870 | ||
Total Liabilities | 7,877,786 | ||
| NET ASSETS | $ | 476,652,697 | |
Net assets were comprised of: | |||
Common stock, at $0.01 par value | $ | 631,744 | |
Paid-in capital in excess of par | 352,287,093 | ||
| 352,918,837 | |||
Undistributed net investment income | 1,463,921 | ||
Accumulated net realized gain on investments | 37,410,364 | ||
Net unrealized appreciation on investments and foreign currencies | 84,859,575 | ||
Net assets, December 31, 2005 | $ | 476,652,697 | |
| Class I: | |||
Net asset value and redemption price per share, $453,579,805 / 60,076,339 outstanding shares of common stock (authorized 100,000,000 shares) | $ | 7.55 | |
| Class II: | |||
Net asset value and redemption price per share, $23,072,892 / 3,098,108 outstanding shares of common stock (authorized 150,000,000 shares) | $ | 7.45 | |
STATEMENT OF OPERATIONS
Year Ended December 31, 2005
| INVESTMENT INCOME | ||||
Unaffiliated dividend income (net of foreign withholding taxes of $686,453) | $ | 6,440,801 | ||
Interest | 519,617 | |||
Affiliated dividend income | 253,870 | |||
Affiliated income from securities loaned, net | 647 | |||
| 7,214,935 | ||||
| EXPENSES | ||||
Management fee | 3,621,302 | |||
Custodian’s fees and expenses | 393,000 | |||
Distribution fee—Class II | 254,958 | |||
Administration fee—Class II | 152,975 | |||
Shareholders’ reports | 70,000 | |||
Audit fee | 20,000 | |||
Directors’ fees | 16,000 | |||
Legal fees and expenses | 8,000 | |||
Transfer agent’s fee and expenses (including affiliated expenses of $5,000) (Note 4) | 5,000 | |||
Insurance expenses | 5,000 | |||
Commitment fee on syndicated credit agreement | 2,500 | |||
Miscellaneous | 24,427 | |||
Total expenses | 4,573,162 | |||
Less: custodian fee credit | (1,713 | ) | ||
Net expenses | 4,571,449 | |||
| NET INVESTMENT INCOME | 2,643,486 | |||
| NET REALIZED AND UNREALIZED GAIN (LOSS) ON INVESTMENTS AND FOREIGN CURRENCIES | ||||
Net realized gain (loss) on: | ||||
Investments | 39,425,853 | |||
Foreign currency transactions | (1,709,384 | ) | ||
| 37,716,469 | ||||
Net change in unrealized appreciation (depreciation) on: | ||||
Investments | 28,083,783 | |||
Foreign currencies | 55,036 | |||
| 28,138,819 | ||||
| NET GAIN ON INVESTMENTS AND FOREIGN CURRENCIES | 65,855,288 | |||
| NET INCREASE IN NET ASSETS RESULTING FROM OPERATIONS | $ | 68,498,774 | ||
STATEMENT OF CHANGES IN NET ASSETS
| Year Ended December 31, 2005 | Year Ended December 31, 2004 | |||||||
| INCREASE (DECREASE) IN NET ASSETS | ||||||||
| OPERATIONS: | ||||||||
Net investment income | $ | 2,643,486 | $ | 1,114,391 | ||||
Net realized gain on investments and foreign currencies | 37,716,469 | 28,389,415 | ||||||
Net change in unrealized appreciation (depreciation) on investments and foreign currencies | 28,138,819 | 20,364,390 | ||||||
NET INCREASE IN NET ASSETS RESULTING FROM OPERATIONS | 68,498,774 | 49,868,196 | ||||||
| DIVIDENDS AND DISTRIBUTIONS: | ||||||||
Dividends from net investment income | ||||||||
Class I | (1,667,899 | ) | (268,170 | ) | ||||
Class II | (307,445 | ) | — | |||||
| (1,975,344 | ) | (268,170 | ) | |||||
Distributions from net realized gains | ||||||||
Class I | (12,334,591 | ) | — | |||||
Class II | (6,312,964 | ) | — | |||||
| (18,647,555 | ) | — | ||||||
TOTAL DIVIDENDS AND DISTRIBUTIONS | (20,622,899 | ) | (268,170 | ) | ||||
| CAPITAL STOCK TRANSACTIONS (Note 7): | ||||||||
Capital stock sold [28,946,819 and 41,429,271 shares, respectively] | 194,846,073 | 251,906,575 | ||||||
Capital stock issued in reinvestment of dividends and distributions [3,249,051 and 44,253 shares, respectively] | 20,622,899 | 268,170 | ||||||
Capital stock repurchased [25,901,671 and 22,043,280 shares, respectively] | (174,768,199 | ) | (132,966,714 | ) | ||||
NET INCREASE (DECREASE) IN NET ASSETS RESULTING FROM CAPITAL STOCK TRANSACTIONS | 40,700,773 | 119,208,031 | ||||||
| TOTAL INCREASE IN NET ASSETS | 88,576,648 | 168,808,057 | ||||||
| NET ASSETS: | ||||||||
Beginning of year | 388,076,049 | 219,267,992 | ||||||
End of year (a) | $ | 476,652,697 | $ | 388,076,049 | ||||
(a) Includes undistributed net investment income of | $ | 1,463,921 | $ | 889,002 | ||||
SEE NOTES TO FINANCIAL STATEMENTS.
A17
| SP AGGRESSIVE GROWTH ASSET ALLOCATION PORTFOLIO |
SCHEDULE OF INVESTMENTS | December 31, 2005 |
Value (Note 2) | ||||||
| LONG-TERM INVESTMENTS — 97.1% | Shares | |||||
Affiliated Registered Investment Companies | ||||||
American Skandia Trust-Marsico Capital Growth Portfolio | 998,592 | $ | 19,053,131 | |||
The Prudential Series Fund, Inc. — | ||||||
Jennison Portfolio (Class I) | 2,056,412 | 42,691,113 | ||||
Natural Resources Portfolio (Class I) | 43,333 | 1,969,923 | ||||
SP Large Cap Value Portfolio | 4,900,523 | 58,316,227 | ||||
SP LSV International Value Portfolio | 2,509,379 | 22,785,164 | ||||
SP Small Cap Growth Portfolio | 989,999 | 6,553,796 | ||||
SP Small Cap Value Portfolio | 396,519 | 5,642,467 | ||||
SP William Blair International Growth Portfolio (Class I) | 3,413,858 | 25,774,628 | ||||
TOTAL LONG-TERM INVESTMENTS | 182,786,449 | |||||
| SHORT-TERM INVESTMENTS — 3.0% | ||||||
Affiliated Money Market Mutual Fund | ||||||
Dryden Core Investment Fund — | 5,574,182 | 5,574,182 | ||||
TOTAL INVESTMENTS — 100.1% | 188,360,631 | |||||
LIABILITIES IN EXCESS OF | (147,580 | ) | ||||
NET ASSETS — 100.0% | $ | 188,213,051 | ||||
| (a) | Prudential Investments LLC, the Manager of the Portfolio, also serves as manager of the underlying funds in which the Portfolio invests. |
The investment allocation of portfolio holdings and liabilities in excess of other assets shown as a percentage of net assets as of December 31, 2005 were as follows:
Investment Type |
| ||
Large/Mid-Cap Growth | 32.8 | % | |
Large/Mid-Cap Value | 31.0 | ||
International Growth | 13.7 | ||
International Value | 12.1 | ||
Small-Cap Growth | 3.5 | ||
Small-Cap Value | 3.0 | ||
Sector | 1.0 | ||
| 97.1 | |||
Short-Term Investments | 3.0 | ||
Liabilities in excess of other assets | (0.1 | ) | |
| 100 | % | ||
SEE NOTES TO FINANCIAL STATEMENTS.
B1
| SP AIM CORE EQUITY PORTFOLIO |
SCHEDULE OF INVESTMENTS | December 31, 2005 |
| LONG-TERM INVESTMENTS — 97.3% | Value (Note 2) | ||||
| COMMON STOCKS | Shares | ||||
Aerospace — 1.5% | |||||
Northrop Grumman Corp. | 8,514 | $ | 511,777 | ||
Beverages — 1.7% | |||||
Heineken NV (Netherlands) | 18,666 | 591,800 | |||
Biotechnology — 1.0% | |||||
Amgen, Inc.* | 4,200 | 331,212 | |||
Building Materials — 1.0% | |||||
Masco Corp. | 11,877 | 358,567 | |||
Commercial Banks — 1.0% | |||||
Barclays PLC (United Kingdom) | 33,694 | 354,198 | |||
Commercial Services — 1.1% | |||||
Accenture Ltd. (Class “A” Stock)* | 12,727 | 367,428 | |||
Computer Services & Software — 6.4% | |||||
Cisco Systems, Inc.* | 37,700 | 645,424 | |||
Computer Associates International, Inc. | 19,717 | 555,822 | |||
Microsoft Corp. | 37,300 | 975,395 | |||
| 2,176,641 | |||||
Computers — 2.7% | |||||
International Business Machines Corp. | 5,420 | 445,524 | |||
Lexmark International, Inc. (Class “A” Stock)* | 10,700 | 479,681 | |||
| 925,205 | |||||
Consumer Products & Services — 2.5% | |||||
Avon Products, Inc. | 12,900 | 368,295 | |||
Estee Lauder Cos., Inc. (Class “A” Stock) | 14,624 | 489,612 | |||
| 857,907 | |||||
Diversified Manufacturing Operations — 4.0% | |||||
General Electric Co. | 13,327 | 467,111 | |||
Tyco International Ltd. | 31,743 | 916,103 | |||
| 1,383,214 | |||||
Electronic Components — 2.3% | |||||
Koninklijke (Royal) Philips Electronics NV* (Netherlands) | 25,494 | 792,283 | |||
Electronics — 2.7% | |||||
Analog Devices, Inc. | 12,800 | 459,136 | |||
Intel Corp. | 18,600 | 464,256 | |||
| 923,392 | |||||
Entertainment — 0.5% | |||||
Walt Disney Co. (The) | 6,900 | 165,393 | |||
Entertainment & Leisure — 0.6% | |||||
Nintendo Co. Ltd. (Japan) | 1,700 | 205,847 | |||
Finance — 0.6% | |||||
UBS AG (Switzerland) | 2,000 | 190,404 | |||
Financial – Bank & Trust — 1.1% | |||||
North Fork Bancorp., Inc. | 13,404 | 366,733 | |||
Financial Services — 3.7% | |||||
Fifth Third Bancorp | 8,300 | 313,076 | |||
Merrill Lynch & Co., Inc. | 7,075 | 479,190 | |||
Morgan Stanley | 8,423 | 477,921 | |||
| 1,270,187 | |||||
Food & Beverage — 6.5% | |||||
Campbell Soup Co. | 8,513 | 253,432 | |||
Citigroup, Inc. | 9,600 | 465,888 | |||
| COMMON STOCKS (Continued) | Value (Note 2) | ||||
| Shares | |||||
Food & Beverage (cont’d.) | |||||
Coca-Cola Co. | 10,607 | $ | 427,568 | ||
ConAgra Foods, Inc. | 7,600 | 154,128 | |||
General Mills, Inc. | 10,236 | 504,840 | |||
Kroger Co. (The)* | 22,774 | 429,973 | |||
| 2,235,829 | |||||
Food Products — 1.0% | |||||
Cadbury Schweppes PLC (United Kingdom) | 35,100 | 331,839 | |||
Food — 1.2% | |||||
Unilever NV (Netherlands) | 6,235 | 427,024 | |||
Insurance — 11.6% | |||||
ACE Ltd. | 9,568 | 511,314 | |||
American International Group, Inc. | 6,200 | 423,026 | |||
Berkshire Hathaway, Inc. (Class “A” Stock)* | 10 | 886,200 | |||
Chubb Corp. (The) | 5,200 | 507,780 | |||
Genworth Financial, Inc. (Class “A” Stock) | 10,100 | 349,258 | |||
Marsh & McLennan Cos., Inc. | 10,800 | 343,008 | |||
St. Paul Travelers Cos., Inc. (The) | 10,308 | 460,458 | |||
XL Capital Ltd. (Class “A” Stock) | 7,100 | 478,398 | |||
| 3,959,442 | |||||
Machinery — 1.0% | |||||
Dover Corp | 8,519 | 344,934 | |||
Media — 2.6% | |||||
Gannett Co., Inc. | 7,106 | 430,410 | |||
News Corp., Inc. (Class “A” Stock) | 29,900 | 464,945 | |||
| 895,355 | |||||
Metals — 0.5% | |||||
Tenaris SA, ADR (Luxembourg) | 1,495 | 171,178 | |||
Office Equipment — 2.2% | |||||
Xerox Corp.* | 50,500 | 739,825 | |||
Oil, Gas & Consumable Fuels — 12.6% | |||||
Apache Corp. | 5,300 | 363,156 | |||
BJ Services Co. | 19,700 | 722,399 | |||
Exxon Mobil Corp. | 14,799 | 831,260 | |||
Murphy Oil Corp. | 8,167 | 440,936 | |||
Nabors Industries Ltd.* | 5,000 | 378,750 | |||
Schlumberger Ltd. | 3,817 | 370,822 | |||
Smith International, Inc. | 15,575 | 577,988 | |||
Total SA (France) | 2,470 | 620,519 | |||
| 4,305,830 | |||||
Pharmaceuticals — 10.8% | |||||
Bristol-Myers Squibb Co. | 22,500 | 517,050 | |||
Forest Laboratories, Inc.* | 12,500 | 508,500 | |||
GlaxoSmithKline PLC, ADR (United Kingdom) | 12,526 | 632,312 | |||
Merck & Co., Inc. | 33,532 | 1,066,653 | |||
Teva Pharmaceutical Industries Ltd., ADR (Israel) | 11,720 | 504,077 | |||
Wyeth | 10,070 | 463,925 | |||
| 3,692,517 | |||||
Railroads — 1.3% | |||||
Union Pacific Corp. | 5,750 | 462,933 | |||
SEE NOTES TO FINANCIAL STATEMENTS.
B2
| SP AIM CORE EQUITY PORTFOLIO (Continued) |
SCHEDULE OF INVESTMENTS | December 31, 2005 |
| COMMON STOCKS (Continued) | Value (Note 2) | ||||
| Shares | |||||
Retail — 1.6% | |||||
Bed Bath & Beyond, Inc.* | 9,558 | $ | 345,522 | ||
TJX Cos., Inc. | 8,005 | 185,956 | |||
| 531,478 | |||||
Savings & Loan — 2.4% | |||||
Bank of America Corp. | 7,701 | 355,401 | |||
Bank of New York Co., Inc. (The) | 14,653 | 466,698 | |||
| 822,099 | |||||
Semi-Conductors — 1.0% | |||||
Xilinx, Inc. | 13,200 | 332,772 | |||
Telecommunications — 4.2% | |||||
AT&T, Inc. | 24,616 | 602,846 | |||
Nokia Corp. ADR* (Finland) | 27,967 | 511,796 | |||
Verizon Communications Inc. | 10,875 | 327,555 | |||
| 1,442,197 | |||||
Utilities – Electrical Utilities — 0.9% | |||||
FPL Group, Inc. | 7,600 | 315,856 | |||
Waste Management — 1.5% | |||||
Waste Management, Inc. | 16,800 | 509,880 | |||
TOTAL LONG-TERM INVESTMENTS | 33,293,176 | ||||
| SHORT-TERM INVESTMENTS — 2.8% | |||||
Mutual Fund — 2.8% | |||||
Dryden Core Investment Fund — | 973,226 | 973,226 | |||
| SHORT-TERM INVESTMENTS — (Continued) | Contracts | Value (Note 2) | ||||
OUTSTANDING OPTIONS PURCHASED* | ||||||
Put Options | ||||||
BJ Services Co., | 140 | $ | 700 | |||
Nabors Industries Ltd., | 40 | 200 | ||||
TOTAL OUTSTANDING OPTIONS PURCHASED | 900 | |||||
TOTAL SHORT-TERM INVESTMENTS | 974,126 | |||||
TOTAL INVESTMENTS, BEFORE OUTSTANDING OPTIONS WRITTEN — 100.1% | 34,267,302 | |||||
OUTSTANDING OPTIONS WRITTEN* — (0.1)% |
| |||||
Written Options | ||||||
BJ Services Co., expiring | 140 | (27,300 | ) | |||
Nabors Industries Ltd., expiring | 40 | (24,000 | ) | |||
TOTAL OUTSTANDING OPTIONS WRITTEN (premium received $20,604) | (51,300 | ) | ||||
TOTAL INVESTMENTS, NET OF OUTSTANDING OPTIONS WRITTEN(b) — 100.0% | 34,216,002 | |||||
OTHER ASSETS IN EXCESS OF | 12,548 | |||||
NET ASSETS — 100.0% | $ | 34,228,550 | ||||
The following abbreviations are used in portfolio descriptions:
| ADR | American Depositary Receipt |
| * | Non-income producing security. |
| (a) | Prudential Investments LLC, the manager of the Fund also serves as manager of the Dryden Core Investment Fund-Taxable Money Market Series. |
| (b) | As of December 31, 2005, 1 security representing $205,847 and 0.6% of the total market value was fair valued in accordance with the policies adopted by the Board of Directors. |
SEE NOTES TO FINANCIAL STATEMENTS.
B3
| SP AIM CORE EQUITY PORTFOLIO (Continued) |
SCHEDULE OF INVESTMENTS | December 31, 2005 |
The industry classification of portfolio holdings and other assets in excess of liabilities shown as a percentage of net assets as of December 31, 2005 were as follows:
Oil, Gas & Consumable Fuels | 12.6 | % | |
Insurance | 11.6 | ||
Pharmaceuticals | 10.8 | ||
Food & Beverage | 6.5 | ||
Computer Services & Software | 6.4 | ||
Telecommunications | 4.2 | ||
Diversified Manufacturing Operations | 4.0 | ||
Financial Services | 3.7 | ||
Mutual Fund | 2.8 | ||
Computers | 2.7 | ||
Electronics | 2.7 | ||
Media | 2.6 | ||
Consumer Products & Services | 2.5 | ||
Savings & Loan | 2.4 | ||
Electronic Components | 2.3 | ||
Office Equipment | 2.2 | ||
Beverages | 1.7 | ||
Retail | 1.6 | ||
Aerospace | 1.5 | ||
Waste Management | 1.5 | ||
Railroads | 1.3 | ||
Food | 1.2 | ||
Commercial Services | 1.1 | ||
Financial – Bank & Trust | 1.1 | ||
Biotechnology | 1.0 | ||
Building Materials | 1.0 | ||
Commercial Banks | 1.0 | ||
Food Products | 1.0 | ||
Machinery | 1.0 | ||
Semi-Conductors | 1.0 | ||
Utilities – Electrical Utilities | 0.9 | ||
Entertainment & Leisure | 0.6 | ||
Finance | 0.6 | ||
Entertainment | 0.5 | ||
Metals | 0.5 | ||
| 100.1 | |||
Outstanding Options Written | (0.1 | ) | |
Other assets in excess of liabilities | — | ||
Total | 100.0 | % | |
SEE NOTES TO FINANCIAL STATEMENTS.
B4
| SP BALANCED ASSET ALLOCATION PORTFOLIO |
SCHEDULE OF INVESTMENTS | December 31, 2005 |
| LONG-TERM INVESTMENTS — 93.2% | Shares | Value (Note 2) | ||||
Affiliated Registered Investment Companies | ||||||
American Skandia Trust — Marsico Capital Growth Portfolio | 4,481,334 | $ | 85,503,859 | |||
The Prudential Series Fund, Inc. — | ||||||
Jennison Portfolio (Class I) | 9,379,114 | 194,710,404 | ||||
Natural Resources Portfolio (Class I) | 308,888 | 14,042,033 | ||||
SP Large Cap Value Portfolio | 21,877,147 | 260,338,048 | ||||
SP LSV International Value Portfolio | 11,434,554 | 103,825,753 | ||||
SP PIMCO High Yield Portfolio | 6,567,864 | 67,320,607 | ||||
SP PIMCO Total Return Portfolio | 34,437,987 | 386,049,840 | ||||
SP Small Cap Growth Portfolio | 4,139,289 | 27,402,095 | ||||
SP Small Cap Value Portfolio | 1,433,791 | 20,402,840 | ||||
SP William Blair International Growth Portfolio (Class I) | 15,717,657 | 118,668,307 | ||||
TOTAL LONG-TERM INVESTMENTS | 1,278,263,786 | |||||
| SHORT-TERM INVESTMENTS — 6.9% | ||||||
Affiliated Money Market Mutual Fund | ||||||
Dryden Core Investment Fund — Taxable Money Market Series | 94,658,547 | 94,658,547 | ||||
TOTAL INVESTMENTS — 100.1% | 1,372,922,333 | |||||
LIABILITIES IN EXCESS OF | (1,153,545 | ) | ||||
NET ASSETS — 100.0% | $ | 1,371,768,788 | ||||
| (a) | Prudential Investments LLC, the Manager of the Portfolio, also serves as manager of the underlying funds in which the Portfolio invests. |
The investment allocation of portfolio holdings and liabilities in excess of other assets shown as a percentage of net assets as of December 31, 2005 were as follows:
Investment Type |
| ||
Core Bonds | 28.1 | % | |
Large/Mid-Cap Growth | 20.4 | ||
Large/Mid-Cap Value | 19.0 | ||
International Growth | 8.7 | ||
International Value | 7.6 | ||
High Yield | 4.9 | ||
Small-Cap Growth | 2.0 | ||
Small-Cap Value | 1.5 | ||
Sector | 1.0 | ||
| 93.2 | |||
Short-Term Investments | 6.9 | ||
Liabilities in excess of other assets | (0.1 | ) | |
| 100 | % | ||
SEE NOTES TO FINANCIAL STATEMENTS.
B5
| SP CONSERVATIVE ASSET ALLOCATION PORTFOLIO |
SCHEDULE OF INVESTMENTS | December 31, 2005 |
| LONG-TERM INVESTMENTS — 93.6% | Shares | Value (Note 2) | |||
Affiliated Registered Investment Companies | |||||
American Skandia Trust — Marsico Capital Growth Portfolio | 1,346,719 | $ | 25,695,397 | ||
The Prudential Series Fund, Inc. — | |||||
Jennison Portfolio (Class I) | 2,826,242 | 58,672,785 | |||
Natural Resources Portfolio (Class I) | 150,605 | 6,846,512 | |||
SP Large Cap Value Portfolio | 6,320,288 | 75,211,433 | |||
SP LSV International Value Portfolio | 3,634,339 | 32,999,801 | |||
SP PIMCO High Yield Portfolio | 3,129,079 | 32,073,059 | |||
SP PIMCO Total Return Portfolio | 27,681,937 | 310,314,516 | |||
SP Small Cap Growth Portfolio | 1,936,835 | 12,821,845 | |||
SP Small Cap Value Portfolio | 445,804 | 6,343,791 | |||
SP William Blair International Growth Portfolio (Class I) | 5,285,919 | 39,908,686 | |||
TOTAL LONG-TERM INVESTMENTS — 93.6% | 600,887,825 | ||||
| SHORT-TERM INVESTMENTS — 6.4% | |||||
Affiliated Money Market Mutual Fund | |||||
Dryden Core Investment Fund —Taxable Money Market Series | 40,986,293 | 40,986,293 | |||
TOTAL INVESTMENTS — 100.0% | 641,874,118 | ||||
ASSETS IN EXCESS OF | 103,503 | ||||
NET ASSETS — 100.0% | $ | 641,977,621 | |||
| (a) | Prudential Investments LLC, the manager of the Portfolio, also serves as manager of the underlying funds in which the Portfolio invests. |
The investment allocation of portfolio holdings and other assets in excess of liabilities shown as a percentage of net assets as of December 31, 2005 were as follows:
Investment Type |
| ||
Core Bonds | 48.4 | % | |
Large/Mid-Cap Growth | 13.1 | ||
Large/Mid-Cap Value | 11.7 | ||
International Growth | 6.2 | ||
International Value | 5.1 | ||
High Yield | 5.0 | ||
Small-Cap Growth | 2.0 | ||
Sector | 1.1 | ||
Small-Cap Value | 1.0 | ||
| 93.6 | |||
Short-Term Investments | 6.4 | ||
Other assets in excess of other liabilities | — | (a) | |
| 100 | % | ||
| (a) | Less than 0.05% |
SEE NOTES TO FINANCIAL STATEMENTS.
B6
| SP DAVIS VALUE PORTFOLIO |
SCHEDULE OF INVESTMENTS | December 31, 2005 |
| LONG-TERM INVESTMENTS — 98.4% | Value (Note 2) | ||||
| COMMON STOCKS | Shares | ||||
Auto/Equipment Rental — 0.3% | |||||
Cosco Pacific Ltd. (Hong Kong) | 462,000 | $ | 846,105 | ||
Beverages — 1.2% | |||||
Heineken Holding NV, (Class “A” Stock) (Netherlands) | 127,250 | 3,739,147 | |||
Business Services — 2.5% | |||||
Dun & Bradstreet Corp.* | 42,600 | 2,852,496 | |||
Iron Mountain, Inc.* | 120,100 | 5,070,622 | |||
| 7,923,118 | |||||
Computers — 1.5% | |||||
Dell, Inc.(a) | 93,700 | 2,810,063 | |||
Hewlett-Packard Co. | 61,200 | 1,752,156 | |||
| 4,562,219 | |||||
Construction — 1.6% | |||||
Hunter Douglas NV (Netherlands) | 10,953 | 596,232 | |||
Martin Marietta Materials, Inc. | 32,300 | 2,478,056 | |||
Vulcan Materials Co. | 29,600 | 2,005,400 | |||
| 5,079,688 | |||||
Containers & Packaging — 2.3% | |||||
Sealed Air Corp.* | 127,000 | 7,133,590 | |||
Cosmetics & Toiletries — 0.8% | |||||
Avon Products, Inc.(a) | 86,900 | 2,480,995 | |||
Diversified Consumer Services — 0.8% | |||||
Lexmark International, Inc., (Class “A” Stock)* | 53,200 | 2,384,956 | |||
Diversified Manufacturing Operations — 4.3% | |||||
Tyco International Ltd. | 463,452 | 13,375,225 | |||
Entertainment & Leisure — 1.3% | |||||
Harley-Davidson, Inc.(a) | 82,100 | 4,227,329 | |||
Financial—Bank & Trust — 3.6% | |||||
HSBC Holdings PLC (United Kingdom) | 574,549 | 9,222,755 | |||
Lloyds TSB Group PLC (United Kingdom) | 60,200 | 2,034,760 | |||
| 11,257,515 | |||||
Financial Services — 15.6% | |||||
American Express Co. | 282,800 | 14,552,888 | |||
Ameriprise Financial, Inc. | 78,860 | 3,233,260 | |||
Commerce Bancorp, Inc.(a) | 42,100 | 1,448,661 | |||
Fifth Third Bancorp | 59,400 | 2,240,568 | |||
Golden West Financial Corp. | 151,800 | 10,018,800 | |||
H&R Block, Inc. | 169,400 | 4,158,770 | |||
Moody’s Corp. | 79,200 | 4,864,464 | |||
State Street Corp | 13,000 | 720,720 | |||
Wells Fargo & Co. | 118,800 | 7,464,204 | |||
| 48,702,335 | |||||
Foods — 2.0% | |||||
Diageo PLC, ADR(a) (United Kingdom) | 65,500 | 3,818,650 | |||
Hershey Foods Corp | 41,900 | 2,314,975 | |||
| 6,133,625 | |||||
Health Care Providers & Services — 3.3% | |||||
Cardinal Health, Inc. | 60,200 | 4,138,750 | |||
HCA, Inc. | 120,100 | 6,065,050 | |||
| 10,203,800 | |||||
| COMMON STOCKS (Continued) | Shares | Value (Note 2) | |||
Insurance — 17.5% | |||||
American International Group, Inc. | 233,300 | $ | 15,918,059 | ||
AON Corp. | 67,900 | 2,441,005 | |||
Berkshire Hathaway, Inc. (Class “A” Stock)* | 125 | 11,077,500 | |||
Chubb Corp. | 9,900 | 966,735 | |||
Loews Corp.* | 63,000 | 5,975,550 | |||
Markel Corp.* | 700 | 221,935 | |||
Marsh & McLennan Cos., Inc.(a) | 74,000 | 2,350,240 | |||
Principal Financial Group, Inc. | 22,100 | 1,048,203 | |||
Progressive Corp. | 82,100 | 9,587,638 | |||
Sun Life Financial, Inc. (Canada) | 15,300 | 613,989 | |||
Transatlantic Holdings, Inc. | 67,475 | 4,534,320 | |||
| 54,735,174 | |||||
Internet Services — 0.5% | |||||
Expedia, Inc.* | 28,050 | 672,078 | |||
IAC/InterActive Corp.* | 28,050 | 794,095 | |||
| 1,466,173 | |||||
Investment Firms — 7.0% | |||||
Citigroup, Inc. | 158,400 | 7,687,152 | |||
JPMorgan Chase & Co. | 302,616 | 12,010,829 | |||
Morgan Stanley | 35,800 | 2,031,292 | |||
| 21,729,273 | |||||
Media — 4.5% | |||||
Comcast Corp. (Special Class “A” Stock)* | 309,800 | 7,958,762 | |||
Gannett Co., Inc. | 16,700 | 1,011,519 | |||
Lagarderes SCA (France) | 55,600 | 4,278,594 | |||
WPP Group PLC, ADR (United Kingdom) | 14,300 | 772,200 | |||
| 14,021,075 | |||||
Oil, Gas & Consumable Fuels — 10.4% | |||||
ConocoPhillips | 136,040 | 7,914,807 | |||
Devon Energy Corp. | 120,700 | 7,548,578 | |||
EOG Resources, Inc. | 101,700 | 7,461,729 | |||
Occidental Petroleum Corp. | 84,100 | 6,717,908 | |||
Transocean, Inc. (Cayman Islands)* | 38,000 | 2,648,220 | |||
| 32,291,242 | |||||
Pharmaceuticals — 1.2% | |||||
Caremark Rx, Inc.* | 73,300 | 3,796,207 | |||
Real Estate Investment Trust — 1.7% | |||||
CenterPoint Properties Trust | 108,700 | 5,378,476 | |||
Retail & Merchandising — 5.9% | |||||
Costco Wholesale, Inc.(a) | 256,300 | 12,679,161 | |||
Wal-Mart Stores, Inc. | 124,500 | 5,826,600 | |||
| 18,505,761 | |||||
Software — 1.2% | |||||
Microsoft Corp. | 140,900 | 3,684,535 | |||
Telecommunications Wireless — 1.3% | |||||
Nokia Corp. (Class “A” Stock), ADR* (Finland) | 49,500 | 905,850 | |||
NTL, Inc. | 10,600 | 721,648 | |||
SK Telecom Co. Ltd., ADR (South Korea) | 53,600 | 1,087,544 | |||
Telewest Global, Inc.* | 53,800 | 1,281,516 | |||
| 3,996,558 | |||||
SEE NOTES TO FINANCIAL STATEMENTS.
B7
| SP DAVIS VALUE PORTFOLIO (Continued) |
SCHEDULE OF INVESTMENTS | December 31, 2005 |
| COMMON STOCKS (Continued) | Shares | Value (Note 2) | ||||
Tobacco — 4.8% | ||||||
Altria Group, Inc. | 202,000 | $ | 15,093,440 | |||
Transportation — 0.9% | ||||||
Kuehne & Nagel International AG• (Switzerland) | 3,429 | 966,816 | ||||
United Parcel Service, Inc. (Class “B” Stock) | 25,200 | 1,893,780 | ||||
| 2,860,596 | ||||||
Transportation/Shipping — 0.4% | ||||||
China Merchants Holdings International Co. Ltd. (Hong Kong) | 542,000 | 1,176,308 | ||||
TOTAL LONG-TERM INVESTMENTS | 306,784,465 | |||||
| SHORT-TERM INVESTMENT — 9.3% | ||||||
MUTUAL FUND | ||||||
Dryden Core Investment Fund — | 29,022,351 | 29,022,351 | ||||
TOTAL INVESTMENTS(o) — 107.7% | 335,806,816 | |||||
LIABILITIES IN EXCESS OF OTHER | (24,062,605 | ) | ||||
NET ASSETS — 100.0% | $ | 311,744,211 | ||||
The industry classification of portfolio holdings and liabilities in excess of other assets shown as a percentage of net assets as of December 31, 2005 were as follows:
Insurance | 17.5 | % | |
Financial Services | 15.6 | ||
Oil, Gas & Consumable Fuels | 10.4 | ||
Mutual Fund (including 7.8% of collateral received for securities on loan) | 9.3 | ||
Investment Firms | 7.0 | ||
Retail & Merchandising | 5.9 | ||
Tobacco | 4.8 | ||
Media | 4.5 | ||
Diversified Manufacturing Operations | 4.3 | ||
Financial – Bank & Trust | 3.6 | ||
Health Care Providers & Services | 3.3 | ||
Business Services | 2.5 | ||
Containers & Packaging | 2.3 | ||
Foods | 2.0 | ||
Real Estate Investment Trust | 1.7 | ||
Construction | 1.6 | ||
Computers | 1.5 | ||
Entertainment & Leisure | 1.3 | ||
Telecommunications Wireless | 1.3 | ||
Beverages | 1.2 | ||
Pharmaceuticals | 1.2 | ||
Software | 1.2 | ||
Transportation | 0.9 | ||
Cosmetics & Toiletries | 0.8 | ||
Diversified Consumer Services | 0.8 | ||
Internet Services | 0.5 | ||
Transportation/Shipping | 0.4 | ||
Auto/Equipment Rental | 0.3 | ||
| 107.7 | |||
Liabilities in excess of other assets | (7.7 | ) | |
Total | 100.0 | % | |
The following abbreviations are used in portfolio descriptions:
| ADR | American Depositary Receipt |
| * | Non-income producing security. |
| (a) | All or a portion of security is on loan. The aggregate market value of such securities is $23,563,227; cash collateral of $24,456,765 (included with liabilities) was received with which the portfolio purchased highly liquid short-term investments. |
| (b) | Represents security, or a portion thereof, purchased with cash collateral received for securities on loan. |
| (o) | As of December 31, 2005, 1 security representing $1,176,308 and 0.38% of the total market value was fair valued in accordance with the policies adopted by the Board of Directors. |
| (w) | Prudential Investments LLC, the manager of the Fund also serves as manager of the Dryden Core Investment Fund-Taxable Money Market Series. |
SEE NOTES TO FINANCIAL STATEMENTS.
B8
| SP GROWTH ASSET ALLOCATION PORTFOLIO |
SCHEDULE OF INVESTMENTS | December 31, 2005 |
| LONG-TERM INVESTMENTS — 95.6% | Shares | Value (Note 2) | ||||
Affiliated Registered Investment Companies | ||||||
American Skandia Trust-Marsico Capital Growth Portfolio | 5,218,617 | $ | 99,571,218 | |||
The Prudential Series Funds, Inc. | ||||||
Jennison Portfolio (Class I) | 10,934,798 | 227,006,406 | ||||
Natural Resources Portfolio (Class I) | 270,898 | 12,315,041 | ||||
SP Large Cap Value Portfolio | 26,002,141 | 309,425,478 | ||||
SP LSV International Value Portfolio | 13,394,858 | 121,625,311 | ||||
SP PIMCO High Yield Portfolio | 4,609,523 | 47,247,616 | ||||
SP PIMCO Total Return Portfolio | 12,544,414 | 140,622,878 | ||||
SP Small Cap Growth Portfolio | 5,479,110 | 36,271,707 | ||||
SP Small Cap Value Portfolio | 2,130,204 | 30,312,809 | ||||
SP William Blair International Growth Portfolio (Class I) | 17,830,726 | 134,621,978 | ||||
TOTAL LONG-TERM INVESTMENTS | 1,159,020,442 | |||||
| SHORT-TERM INVESTMENTS — 4.6% | ||||||
Affiliated Money Market Mutual Fund | ||||||
Dryden Core Investment Fund — Taxable Money Market Series | 55,777,689 | 55,777,689 | ||||
TOTAL INVESTMENTS — 100.2% | 1,214,798,131 | |||||
LIABILITIES IN EXCESS OF | (2,794,867 | ) | ||||
NET ASSETS — 100.0% | $ | 1,212,003,264 | ||||
| (a) | Prudential Investments LLC, the manager of the Portfolio, also serves as manager of the underlying funds in which the Portfolio invests. |
The investment allocation of portfolio holdings and liabilities in excess of other assets shown as a percentage of net assets as of December 31, 2005 were as follows:
Investment Type |
| ||
Large/Mid-Cap Growth | 26.9 | % | |
Large/Mid-Cap Value | 25.6 | ||
Core Bonds | 11.6 | ||
International Growth | 11.1 | ||
International Value | 10.0 | ||
High Yield | 3.9 | ||
Small-Cap Growth | 3.0 | ||
Small-Cap Value | 2.5 | ||
Sector | 1.0 | ||
| 95.6 | |||
Short-Term Investments | 4.6 | ||
Liabilities in excess of other assets | (0.2 | ) | |
| 100 | % | ||
SEE NOTES TO FINANCIAL STATEMENTS.
B9
| SP LARGE CAP VALUE PORTFOLIO |
SCHEDULE OF INVESTMENTS | December 31, 2005 |
| LONG-TERM INVESTMENTS — 97.9% | Value (Note 2) | ||||
| COMMON STOCKS | Shares | ||||
Aerospace/Defense — 3.0% | |||||
Lockheed Martin Corp.(a) | 174,900 | $ | 11,128,887 | ||
Northrop Grumman Corp.(a) | 76,100 | 4,574,371 | |||
Raytheon Co. | 229,300 | 9,206,395 | |||
| 24,909,653 | |||||
Auto Components — 1.0% | |||||
Delphi Corp. | 422,900 | 123,064 | |||
Johnson Controls, Inc. | 37,500 | 2,734,125 | |||
Lear Corp.(a) | 47,400 | 1,349,004 | |||
Magna International, Inc. (Class A Shares) | 53,300 | 3,836,534 | |||
| 8,042,727 | |||||
Beverages — 0.8% | |||||
Coca-Cola Co. | 107,900 | 4,349,449 | |||
Coca-Cola Enterprises, Inc. | 111,900 | 2,145,123 | |||
| 6,494,572 | |||||
Building & Building Products — 0.1% | |||||
Masco Corp. | 20,000 | 603,800 | |||
Chemicals — 1.2% | |||||
Air Products & Chemicals, Inc. | 65,900 | 3,900,621 | |||
Dow Chemical Co. | 3,000 | 131,460 | |||
Du Pont de Nemours & Co. | 7,700 | 327,250 | |||
PPG Industries, Inc. | 9,600 | 555,840 | |||
Praxair, Inc.* | 63,300 | 3,352,368 | |||
Rohm & Haas Co. | 39,300 | 1,902,906 | |||
| 10,170,445 | |||||
Commercial Banks — 4.5% | |||||
Bank of America Corp.(a) | 356,800 | 16,466,320 | |||
KeyCorp | 193,500 | 6,371,955 | |||
Marshall & Ilsley Corp. | 13,000 | 559,520 | |||
Mellon Financial Corp. | 136,300 | 4,668,275 | |||
North Fork Bancorporation, Inc. | 168,300 | 4,604,688 | |||
UnionBanCal Corp. | 55,400 | 3,807,088 | |||
Zions Bancorporation | 15,300 | 1,156,068 | |||
| 37,633,914 | |||||
Commercial Services & Supplies — 1.9% | |||||
Cendant Corp. | 475,600 | 8,204,100 | |||
Nalco Holding Co. | 76,100 | 1,347,731 | |||
PHH Corp.* | 12,770 | 357,815 | |||
Waste Management, Inc. | 204,200 | 6,197,470 | |||
| 16,107,116 | |||||
Communication Equipment — 0.1% | |||||
QUALCOMM, Inc. | 12,900 | 555,732 | |||
Computers & Peripherals — 0.5% | |||||
Dell, Inc.(a) | 26,500 | 794,735 | |||
Hewlett-Packard Co. | 110,900 | 3,175,067 | |||
NCR Corp. | 6,700 | 227,398 | |||
| 4,197,200 | |||||
Consumer Finance — 1.1% | |||||
MBNA Corp. | 336,300 | 9,130,545 | |||
Consumer Products & Services | |||||
Kimberly-Clark Corp. | 5,200 | 310,180 | |||
| COMMON STOCKS (Continued) | Value (Note 2) | ||||
| Shares | |||||
Containers & Packaging — 0.1% | |||||
Smurfit-Stone Container Corp. | 5,800 | $ | 82,186 | ||
Temple-Inland, Inc. | 15,900 | 713,115 | |||
| 795,301 | |||||
Diversified Financial Services — 11.0% | |||||
Astoria Financial Corp. | 13,900 | 408,660 | |||
BB & T Corp.* | 6,500 | 272,415 | |||
Capital One Financial Corp. | 15,200 | 1,313,280 | |||
CIT Group, Inc. | 122,300 | 6,332,694 | |||
Citigroup, Inc. | 430,000 | 20,867,900 | |||
Compass Banshares, Inc. | 1,700 | 82,093 | |||
Countrywide Credit Industries, Inc.(a) | 132,700 | 4,537,013 | |||
E*TRADE Group Corp.* | 37,800 | 788,508 | |||
Fannie Mae | 37,400 | 1,825,494 | |||
Goldman Sachs Group, Inc.(a) | 54,200 | 6,921,882 | |||
JPMorgan Chase & Co. | 238,400 | 9,462,096 | |||
Merrill Lynch & Co., Inc. | 77,700 | 5,262,621 | |||
Morgan Stanley | 100,200 | 5,685,348 | |||
Principal Financial Group, Inc. | 122,100 | 5,791,203 | |||
State Street Corp. | 54,900 | 3,043,656 | |||
TCF Financial Corp. | 4,600 | 124,844 | |||
U.S. Bancorp | 275,000 | 8,219,750 | |||
Wachovia Corp. | 34,800 | 1,839,528 | |||
Wells Fargo & Co. | 136,000 | 8,544,880 | |||
| 91,323,865 | |||||
Diversified Telecommunication Services — 3.3% | |||||
AT&T, Inc. | 396,510 | 9,710,530 | |||
BellSouth Corp. | 6,000 | 162,600 | |||
Corning, Inc.* | 138,600 | 2,724,876 | |||
MCI, Inc. | 11,400 | 224,922 | |||
Motorola, Inc. | 85,000 | 1,920,150 | |||
Sprint Nextel Corp. | 150,700 | 3,520,352 | |||
Tellabs, Inc.* | 19,200 | 209,280 | |||
Verizon Communications Inc.(a) | 312,400 | 9,409,488 | |||
| 27,882,198 | |||||
Electric Utilities — 6.8% | |||||
American Electric Power Co., Inc. | 7,800 | 289,302 | |||
CMS Energy Corp.* | 127,000 | 1,842,770 | |||
Consolidated Edison, Inc. | 51,500 | 2,385,995 | |||
Constellation Energy Group, Inc. | 29,700 | 1,710,720 | |||
Dominion Resources, Inc.(a) | 63,900 | 4,933,080 | |||
Duke Energy Corp. | 60,900 | 1,671,705 | |||
Edison International | 67,200 | 2,930,592 | |||
Entergy Corp. | 77,200 | 5,299,780 | |||
FirstEnergy Corp. | 91,500 | 4,482,585 | |||
FPL Group, Inc.(a) | 381,100 | 15,838,516 | |||
General Electric Co. | 192,900 | 6,761,145 | |||
Ingersoll-Rand Co. Ltd. (Class “A” Stock) | 1,600 | 64,592 | |||
Northeast Utilities | 56,600 | 1,114,454 | |||
Pepco Holdings, Inc. | 6,300 | 140,931 | |||
PG&E Corp. | 30,300 | 1,124,736 | |||
Pinnacle West Capital Corp. | 21,200 | 876,620 | |||
PPL Corp. | 92,700 | 2,725,380 | |||
Wisconsin Energy Corp. | 25,000 | 976,500 | |||
Xcel Energy, Inc.* | 101,500 | 1,873,690 | |||
| 57,043,093 | |||||
SEE NOTES TO FINANCIAL STATEMENTS.
B10
| SP LARGE CAP VALUE PORTFOLIO (Continued) |
SCHEDULE OF INVESTMENTS | December 31, 2005 |
| COMMON STOCKS (Continued) | Value (Note 2) | ||||
| Shares | |||||
Energy Equipment & Services — 0.1% | |||||
Weatherford International, Inc. Ltd. | 31,000 | $ | 1,122,200 | ||
Exchange Traded Fund — 0.6% | |||||
iShares Russell 1000 Value Index Fund | 67,470 | 4,657,454 | |||
Food & Staples Retailing — 1.3% | |||||
Albertson’s, Inc.(a) | 499,700 | 10,668,595 | |||
Sysco Corp. | 10,000 | 310,500 | |||
| 10,979,095 | |||||
Food Products — 2.2% | |||||
Campbell Soup Co. | 6,200 | 184,574 | |||
Heinz Co., H.J. | 6,000 | 202,320 | |||
Kellogg Co. | 4,000 | 172,880 | |||
Kraft Foods, Inc. (Class “A” Stock)(a) | 213,600 | 6,010,704 | |||
Sara Lee Corp. | 203,500 | 3,846,150 | |||
Unilever PLC (United Kingdom) | 188,400 | 7,558,608 | |||
| 17,975,236 | |||||
Health Care Equipment & Supplies — 0.1% | |||||
Boston Scientific Corp.*(a) | 29,700 | 727,353 | |||
McKesson Corp. | 800 | 41,272 | |||
| 768,625 | |||||
Health Care Providers & Services — 1.8% | |||||
Aetna, Inc.*(a) | 14,400 | 1,358,064 | |||
HCA, Inc.(a) | 98,800 | 4,989,400 | |||
Tenet Healthcare Corp.*(a) | 670,000 | 5,132,200 | |||
WellPoint, Inc.* | 47,600 | 3,798,004 | |||
| 15,277,668 | |||||
Healthcare Supplies — 0.3% | |||||
Amgen, Inc.* | 3,100 | 244,466 | |||
Bausch & Lomb, Inc. | 14,200 | 964,180 | |||
Cardinal Health, Inc. | 300 | 20,625 | |||
The Cooper Cos., Inc. | 6,100 | 312,930 | |||
Zimmer Holdings, Inc.* | 8,900 | 600,216 | |||
| 2,142,417 | |||||
Hotels, Restaurants & Leisure — 1.7% | |||||
Carnival Corp. (Panama) | 26,000 | 1,390,220 | |||
Harrah’s Entertainment, Inc. | 102,427 | 7,302,021 | |||
Hilton Hotels Corp. | 50,600 | 1,219,966 | |||
McDonald’s Corp. | 109,500 | 3,692,340 | |||
Starwood Hotels & Resorts | 9,000 | 574,740 | |||
| 14,179,287 | |||||
Household Durables — 2.9% | |||||
Lennar Corp. (Class “A” Stock)(a) | 364,500 | 22,241,790 | |||
Lennar Corp. (Class “B” Stock) | 29,100 | 1,649,679 | |||
Mohawk Industries, Inc.* | 7,900 | 687,142 | |||
| 24,578,611 | |||||
Household Products — 0.1% | |||||
Procter & Gamble Co. | 9,700 | 561,436 | |||
Industrial Conglomerates — 2.4% | |||||
Eaton Corp. | 36,600 | 2,455,494 | |||
Tyco International Ltd. | 617,400 | 17,818,164 | |||
| 20,273,658 | |||||
Insurance — 10.8% | |||||
AFLAC, Inc. | 27,200 | 1,262,624 | |||
Allstate Corp. (The) | 20,100 | 1,086,807 | |||
| COMMON STOCKS (Continued) | Value (Note 2) | ||||
| Shares | |||||
Insurance (cont’d.) | |||||
AMBAC Financial Group, Inc. | 28,400 | $ | 2,188,504 | ||
American International Group, Inc. | 44,700 | 3,049,881 | |||
AON Corp. | 19,400 | 697,430 | |||
Assurant, Inc. | 57,800 | 2,513,722 | |||
Chubb Corp. | 4,000 | 390,600 | |||
CIGNA Corp. | 300 | 33,510 | |||
Genworth Financial, Inc. (Class “A” Stock)(a) | 389,600 | 13,472,368 | |||
Hanover Insurance Group, Inc. (The) | 115,200 | 4,811,904 | |||
Hartford Financial Services Group, Inc. | 65,000 | 5,582,850 | |||
Lincoln National Corp.(a) | 40,100 | 2,126,503 | |||
MBIA, Inc. | 33,400 | 2,009,344 | |||
MetLife, Inc.(a) | 263,200 | 12,896,800 | |||
Protective Life Corp. | 15,100 | 660,927 | |||
St. Paul Travelers Cos., Inc. (The)(a) | 424,700 | 18,971,349 | |||
Torchmark Corp. | 23,900 | 1,328,840 | |||
UnumProvident Corp.(a) | 669,900 | 15,240,225 | |||
W.R. Berkely Corp. | 35,600 | 1,695,272 | |||
XL Capital Ltd. (Class “A” Stock) | 3,000 | 202,140 | |||
| 90,221,600 | |||||
Internet Services — 0.1% | |||||
eBay Inc. | 10,500 | 454,125 | |||
IT Consulting & Services — 0.3% | |||||
Affiliated Computer Services, Inc. | 16,500 | 976,470 | |||
International Business Machines Corp.(a) | 15,800 | 1,298,760 | |||
| 2,275,230 | |||||
IT Services — 2.4% | |||||
Electronic Data System Corp. | 838,900 | 20,167,156 | |||
Leisure Equipment & Products — 0.6% | |||||
Eastman Kodak Co.(a) | 201,000 | 4,703,400 | |||
Mattel, Inc. | 5,600 | 88,592 | |||
| 4,791,992 | |||||
Machinery — 1.0% | |||||
Deere & Co. | 25,100 | 1,709,561 | |||
SPX Corp. | 145,800 | 6,673,266 | |||
| 8,382,827 | |||||
Manufacturing | |||||
Danaher Corp. | 2,000 | 111,560 | |||
Media — 2.4% | |||||
DIRECTV Group, Inc. (The)* | 25,300 | 357,236 | |||
E.W. Scripps Co., (Class “A” Stock) | 32,100 | 1,541,442 | |||
EchoStar Communications Corp. (Class “A” Stock) | 5,400 | 146,718 | |||
Gannett Co., Inc. | 80,900 | 4,900,113 | |||
News Corp., Inc. (Class “A” Stock) | 260,000 | 4,043,000 | |||
Time Warner, Inc.* | 142,200 | 2,479,968 | |||
Viacom, Inc. (Class “B” Stock) | 211,200 | 6,885,120 | |||
Walt Disney Co. (The) | 1,700 | 40,749 | |||
| 20,394,346 | |||||
Metals & Mining — 2.0% | |||||
Alcoa, Inc.(a) | 513,000 | 15,169,410 | |||
United States Steel Corp.(a) | 38,300 | 1,841,081 | |||
| 17,010,491 | |||||
SEE NOTES TO FINANCIAL STATEMENTS.
B11
| SP LARGE CAP VALUE PORTFOLIO (Continued) |
SCHEDULE OF INVESTMENTS | December 31, 2005 |
| COMMON STOCKS (Continued) | Value (Note 2) | ||||
| Shares | |||||
Multi-Utilities — 1.1% | |||||
Dynegy, Inc. (Class “A” Stock)* | 32,200 | $ | 155,848 | ||
Public Service Enterprise Group, Inc. | 117,700 | 7,646,969 | |||
SCANA Corp. | 34,500 | 1,358,610 | |||
| 9,161,427 | |||||
Multiline Retail — 1.1% | |||||
Abercrombie & Fitch Co. | 7,500 | 488,850 | |||
Dollar General Corp. | 13,900 | 265,073 | |||
Federated Department Stores, Inc. | 15,700 | 1,041,381 | |||
Home Depot (The), Inc. | 16,700 | 676,016 | |||
Kohl’s Corp.* | 12,300 | 597,780 | |||
Lowe’s Cos., Inc. | 6,500 | 433,290 | |||
Sears Holdings Corp.* | 1 | 116 | |||
Target Corp. | 11,200 | 615,664 | |||
Yum! Brands, Inc. | 113,700 | 5,330,256 | |||
| 9,448,426 | |||||
Networking Products — 0.2% | |||||
Juniper Networks, Inc.*(a) | 62,300 | 1,389,290 | |||
Oil, Gas & Consumable Fuels — 6.5% | |||||
Anadarko Petroleum Corp.(a) | 26,300 | 2,491,925 | |||
Apache Corp. | 39,700 | 2,720,244 | |||
Burlington Resources, Inc. | 20,900 | 1,801,580 | |||
ChevronTexaco Corp. | 153,400 | 8,708,518 | |||
ConocoPhillips | 111,700 | 6,498,706 | |||
EOG Resources, Inc. | 19,100 | 1,401,367 | |||
Exxon Mobil Corp. | 397,200 | 22,310,724 | |||
Halliburton Co. | 14,000 | 867,440 | |||
Occidental Petroleum Corp. | 67,200 | 5,367,936 | |||
Valero Energy Corp. | 40,700 | 2,100,120 | |||
| 54,268,560 | |||||
Oil, Gas & Consumable Fuels — 1.3% | |||||
Ashland, Inc. | 75,000 | 4,342,500 | |||
Devon Energy Corp. | 28,800 | 1,801,152 | |||
Rowan Cos., Inc. | 14,600 | 520,344 | |||
Tesoro Corp.* | 67,300 | 4,142,315 | |||
| 10,806,311 | |||||
Paper & Forest Products — 1.4% | |||||
Bowater, Inc. | 11,000 | 337,920 | |||
International Paper Co.(a) | 40,400 | 1,357,844 | |||
Plum Creek Timber Co. | 107,900 | 3,889,795 | |||
Weyerhaeuser Co. | 85,800 | 5,691,972 | |||
| 11,277,531 | |||||
Pharmaceuticals — 2.5% | |||||
Barr Pharmaceuticals, Inc. | 5,000 | 311,450 | |||
Bristol-Meyers Squibb Co. | 5,300 | 121,794 | |||
Eli Lilly & Co.(a) | 32,100 | 1,816,539 | |||
Medco Health Solutions, Inc.* | 7,700 | 429,660 | |||
Pfizer, Inc. | 442,400 | 10,316,768 | |||
Sepracor, Inc.(a) | 29,700 | 1,532,520 | |||
Wyeth | 141,400 | 6,514,298 | |||
| 21,043,029 | |||||
Real Estate Investment Trust — 2.8% | |||||
Apartment Investment & Management Co. (Class “A” Stock) | 134,000 | 5,074,580 | |||
Camden Property Trust | 12,200 | 706,624 | |||
| COMMON STOCKS (Continued) | Value (Note 2) | ||||
| Shares | |||||
Real Estate Investment Trust (cont’d.) | |||||
CarrAmerica Realty Corp. | 8,600 | $ | 297,818 | ||
Centerpoint Properties Trust | 12,000 | 593,760 | |||
Hospitality Pptys Trust | 3,800 | 152,380 | |||
Host Marriott Corp. | 147,700 | 2,798,915 | |||
Liberty Property Trust | 19,900 | 852,715 | |||
Mack-Cali Realty Corp. | 30,300 | 1,308,960 | |||
New Century Financial Corp. | 154,700 | 5,580,029 | |||
ProLogis | 107,500 | 5,022,400 | |||
Simon Property Group, Inc. | 9,300 | 712,659 | |||
| 23,100,840 | |||||
Semiconductors — 0.2% | |||||
Altera Corp. | 21,900 | 405,807 | |||
Analog Devices, Inc. | 13,000 | 466,310 | |||
Linear Technology Corp. | 3,900 | 140,673 | |||
Maxim Integrated Products, Inc. | 7,000 | 253,680 | |||
Novellus Systems, Inc.* | 1,000 | 24,120 | |||
Teradyne, Inc. | 4,400 | 64,108 | |||
Xilinx, Inc.(a) | 3,100 | 78,151 | |||
| 1,432,849 | |||||
Software — 4.8% | |||||
BMC Software, Inc.* | 486,100 | 9,960,189 | |||
Computer Associates International, Inc. | 676,400 | 19,067,716 | |||
Computer Sciences Corp.* | 5,100 | 258,264 | |||
Microsoft Corp. | 354,600 | 9,272,790 | |||
Oracle Corp.* | 141,100 | 1,722,831 | |||
| 40,281,790 | |||||
Specialty Retail — 0.6% | |||||
J. C. Penney Co., Inc. | 25,100 | 1,395,560 | |||
Nike, Inc. (Class “B” Shares) | 25,800 | 2,239,182 | |||
Nordstrom, Inc. | 13,600 | 508,640 | |||
Staples, Inc. | 47,600 | 1,080,996 | |||
| 5,224,378 | |||||
Textiles, Apparel & Luxury Goods — 0.8% | |||||
Coach, Inc.* | 400 | 13,336 | |||
Jones Apparel Group, Inc. | 211,400 | 6,494,208 | |||
| 6,507,544 | |||||
Thrifts & Mortgage Finance — 2.8% | |||||
Freddie Mac | 222,600 | 14,546,910 | |||
Washington Mutual, Inc. | 203,600 | 8,856,600 | |||
| 23,403,510 | |||||
Tobacco — 2.4% | |||||
Altria Group, Inc.* | 263,000 | 19,651,360 | |||
Transportation — 0.8% | |||||
CSX Corp. | 59,100 | 3,000,507 | |||
FedEx Corp. | 15,400 | 1,592,206 | |||
Norfolk Southern Corp.(a) | 44,100 | 1,977,003 | |||
| 6,569,716 | |||||
Wireless Telecommunication Services — 0.1% | |||||
American Tower Corp. (Class “A” Shares) | 30,200 | 818,420 | |||
TOTAL LONG-TERM INVESTMENTS | 815,910,336 | ||||
SEE NOTES TO FINANCIAL STATEMENTS.
B12
| SP LARGE CAP VALUE PORTFOLIO (Continued) |
SCHEDULE OF INVESTMENTS | December 31, 2005 |
| Value (Note 2) | ||||||
| Shares | ||||||
| SHORT-TERM INVESTMENT — 19.3% | ||||||
Mutual Fund | ||||||
Dryden Core Investment Fund — Taxable Money Market Series (cost $160,390,022; includes $140,729,696 of cash collateral received for securities on loan)(b)(w) (Note 4) | 160,390,022 | $ | 160,390,022 | |||
TOTAL INVESTMENTS — 117.2% | 976,300,358 | |||||
LIABILITIES IN EXCESS OF | (143,208,800 | ) | ||||
NET ASSETS — 100.0% | $ | 833,091,558 | ||||
| * | Non-income producing security. |
| (a) | All or a portion of security is on loan. The aggregate market value of such securities is $135,364,333; cash collateral of $140,729,696 (included with liabilities) was received with which the portfolio purchased highly liquid short-term investments. |
| (b) | Represents security, or a portion thereof, purchased with cash collateral received for securities on loan. |
| (w) | Prudential Investments LLC, the manager of the Fund also serves as manager of the Dryden Core Investment Fund-Taxable Money Market Series. |
The industry classification of long-term portfolio holdings, short-term investments and liabilities in excess of other assets shown as a percentage of net assets as of December 31, 2005 was as follows:
Money Market Mutual Fund (including 16.9% of collateral received for securities on loan) | 19.3 | % | |
Diversified Financial Services | 11.0 | ||
Insurance | 10.8 | ||
Oil, Gas & Consumable Fuels | 7.8 | ||
Electric Utilities | 6.8 | ||
Software | 4.8 | ||
Commercial Banks | 4.5 | ||
Diversified Telecommunication Services | 3.3 | ||
Aerospace/Defense | 3.0 | ||
Household Durables | 2.9 | ||
Real Estate Investment Trust | 2.8 | ||
Thrifts & Mortgage Finance | 2.8 | ||
Pharmaceuticals | 2.5 | ||
IT Services | 2.4 | ||
Industrial Conglomerates | 2.4 | ||
Media | 2.4 | ||
Tobacco | 2.4 | ||
Food Products | 2.2 | ||
Metals & Mining | 2.0 | ||
Commercial Services & Supplies | 1.9 | ||
Health Care Providers & Services | 1.8 | ||
Hotels, Restaurants & Leisure | 1.7 | ||
Paper & Forest Products | 1.4 | ||
Food & Staples Retailing | 1.3 | ||
Chemicals | 1.2 | ||
Consumer Finance | 1.1 | ||
Multi-Utilities | 1.1 | ||
Multiline Retail | 1.1 | ||
Auto Components | 1.0 | ||
Machinery | 1.0 | ||
Beverages | 0.8 | ||
Textiles, Apparel & Luxury Goods | 0.8 | ||
Transportation | 0.8 | ||
Exchange Traded Fund | 0.6 | ||
Leisure Equipment & Products | 0.6 | ||
Specialty Retail | 0.6 | ||
Computers & Peripherals | 0.5 | ||
Healthcare Supplies | 0.3 | ||
IT Consulting & Services | 0.3 | ||
Networking Products | 0.2 | ||
Semiconductors | 0.2 | ||
Building & Building Products | 0.1 | ||
Communication Equipment | 0.1 | ||
Containers & Packaging | 0.1 | ||
Energy Equipment & Services | 0.1 | ||
Health Care Equipment & Supplies | 0.1 | ||
Household Products | 0.1 | ||
Internet Services | 0.1 | ||
Wireless Telecommunication Services | 0.1 | ||
| 117.2 | |||
Liabilities in excess of other assets | (17.2 | ) | |
Total | 100.0 | % | |
SEE NOTES TO FINANCIAL STATEMENTS.
B13
| SP LSV INTERNATIONAL VALUE PORTFOLIO |
SCHEDULE OF INVESTMENTS | December 31, 2005 |
| LONG-TERM INVESTMENTS — 98.0% | Value (Note 2) | ||||
| COMMON STOCKS | Shares | ||||
Australia — 4.4% | |||||
AWB Ltd. | 93,100 | $ | 417,568 | ||
Bluescope Steel Ltd. | 500,700 | 2,541,461 | |||
Commonwealth Bank of Australia | 178,500 | 5,579,898 | |||
CSR Ltd. | 803,900 | 2,040,804 | |||
David Jones Ltd. | 80,372 | 136,722 | |||
Santos Ltd. | 360,400 | 3,233,420 | |||
Suncorp-Metway Ltd. | 55,200 | 809,137 | |||
Telestra Corp. Ltd. | 774,200 | 2,224,797 | |||
| 16,983,807 | |||||
Austria — 0.5% | |||||
Boehler-Uddeholm AG* | 11,500 | 1,945,553 | |||
Belgium — 0.9% | |||||
Dexia | 31,700 | 731,074 | |||
Fortis | 91,500 | 2,919,394 | |||
| 3,650,468 | |||||
Denmark — 0.9% | |||||
Danisco SA* | 15,200 | 1,163,757 | |||
Danske Bank SA | 72,900 | 2,568,042 | |||
| 3,731,799 | |||||
Finland — 1.5% | |||||
Rautaruukki Oyj | 149,700 | 3,642,055 | |||
Sampo Oyj (Class “A” Stock) | 134,300 | 2,340,436 | |||
| 5,982,491 | |||||
France — 9.1% | |||||
BNP Paribas SA | 82,800 | 6,700,108 | |||
Bouygues SA | 66,700 | 3,261,285 | |||
Ciments Francais SA* | 10,300 | 1,338,913 | |||
CNP Assurances | 31,500 | 2,483,692 | |||
Compagnie Generale des Establissements Michelin (Class “B” Stock) | 44,300 | 2,490,161 | |||
Credit Agricole SA | 62,600 | 1,972,114 | |||
Natexis Banques Populaires* | 15,500 | 2,581,896 | |||
Peugeot SA | 51,800 | 2,986,563 | |||
Renault SA* | 27,000 | 2,202,398 | |||
Societe Generale | 10,600 | 1,303,870 | |||
Suez SA | 143,000 | 4,452,508 | |||
Total SA | 5,400 | 1,356,601 | |||
Valeo SA | 58,100 | 2,160,514 | |||
| 35,290,623 | |||||
Germany — 6.8% | |||||
BASF AG | 79,900 | 6,121,123 | |||
Bayer AG | 43,100 | 1,800,702 | |||
Deutsche Bank AG* | 43,700 | 4,237,193 | |||
Deutsche Telekom AG | 131,300 | 2,188,670 | |||
Fresenius AG | 10,200 | 1,384,482 | |||
MAN AG* | 58,700 | 3,132,816 | |||
Salzgitter AG* | 58,200 | 3,142,650 | |||
ThyssenKrup AG | 119,900 | 2,501,140 | |||
TUI AG | 90,200 | 1,847,420 | |||
| 26,356,196 | |||||
| COMMON STOCKS (Continued) | Shares | Value (Note 2) | |||
Hong Kong — 2.3% | |||||
Chaoda Modern Agriculture Holdings Ltd.* | 3,169,000 | $ | 1,316,183 | ||
CITIC International Financial Holding Ltd. | 3,229,000 | 1,194,884 | |||
Citic Pacific Ltd. | 690,000 | 1,906,739 | |||
CNOOC Ltd. | 1,444,000 | 981,315 | |||
Orient Overseas International Ltd.* | 435,392 | 1,473,011 | |||
Solomon Systech International Ltd. | 5,326,000 | 2,205,568 | |||
| 9,077,700 | |||||
Ireland — 0.6% | |||||
Irish Life & Permanent PLC | 111,900 | 2,286,566 | |||
Italy — 3.5% | |||||
Banca Popolare Italiana SpA | 208,200 | 1,847,419 | |||
Banche Popolari Unite Scrl | 66,200 | 1,451,483 | |||
Benetton Group SpA | 176,900 | 2,014,725 | |||
ENI SpA | 194,900 | 5,406,262 | |||
IFIL – Investments SpA | 251,700 | 1,074,985 | |||
Sanpaolo IMI SpA | 106,900 | 1,671,835 | |||
| 13,466,709 | |||||
Japan — 24.4% | |||||
Alpine Electronics, Inc. | 78,300 | 1,050,629 | |||
ALPS Electric Co. Ltd. | 99,000 | 1,383,271 | |||
Asahi Breweries Ltd. | 172,700 | 2,105,703 | |||
Asahi Kasei Corp. | 33,000 | 223,305 | |||
Capcom Co. Ltd. | 20,600 | 240,613 | |||
CMK Corp. | 45,000 | 991,841 | |||
Cosmo Oil Co. Ltd. | 604,000 | 3,020,540 | |||
Denki Kagaku Kogyo Kabushiki Kaisha | 448,000 | 1,978,781 | |||
Hitachi Koko Co. Ltd. | 153,000 | 2,527,158 | |||
Hitachi Ltd. | 423,000 | 2,849,937 | |||
Hokkaido Electric Power Co., Inc. | 105,800 | 2,151,052 | |||
Hokuetsu Paper Mills Ltd. | 263,000 | 1,359,977 | |||
Honda Motor Co. Ltd. | 95,100 | 5,488,555 | |||
Hosiden Corp. | 102,900 | 1,258,830 | |||
Japan Securities Finance Co. Ltd. | 172,000 | 1,982,186 | |||
JS Group Corp. | 61,400 | 1,226,675 | |||
Kaken Pharmaceutical Co. Ltd. | 258,000 | 2,006,380 | |||
Kansai Electric Power Co., Inc. (The) | 144,100 | 3,091,454 | |||
Kurabo Industries Ltd. | 391,000 | 1,462,653 | |||
Kyowa Hakko Kogyo Co. Ltd. | 235,000 | 1,637,974 | |||
Kyushu Electric Power Co., Inc. | 61,100 | 1,325,742 | |||
Marubeni Corp. | 560,600 | 3,002,255 | |||
Mitsubishi Chemical Holdings Corp. | 322,000 | 2,028,626 | |||
Nihon Kohden Corp. | 84,000 | 1,371,580 | |||
Nippon Oil Corp. | 519,000 | 4,022,099 | |||
Nippon Telegraph and Telephone Corp. | 1,200 | 5,445,981 | |||
Nipro Corp. | 65,000 | 950,641 | |||
Nissan Motor Co. Ltd. | 398,500 | 4,064,995 | |||
NSK Ltd. | 437,000 | 2,988,706 | |||
NTT DoCoMo, Inc. | 600 | 913,745 | |||
Okasan Holdings, Inc. | 225,100 | 1,941,303 | |||
Osaka Gas Co. Ltd. | 875,000 | 3,017,104 | |||
Rengo Co. Ltd. | 285,000 | 1,721,599 | |||
Rohto Pharmaceutical Co. Ltd.* | 36,000 | 358,166 | |||
SEE NOTES TO FINANCIAL STATEMENTS.
B14
| SP LSV INTERNATIONAL VALUE PORTFOLIO (Continued) |
SCHEDULE OF INVESTMENTS | December 31, 2005 |
| COMMON STOCKS (Continued) | Shares | Value (Note 2) | |||
Japan (cont’d.) | |||||
Santen Pharmaceutical Co. Ltd. | 53,200 | $ | 1,475,689 | ||
Sanyo Electric Credit Co. Ltd. | 60,000 | 1,225,992 | |||
Sumitomo Trust & Banking Co. Ltd. (The) | 472,000 | 4,812,715 | |||
Takefuji Corp. | 39,900 | 2,709,175 | |||
Tanabe Seiyaku Co. Ltd. | 286,000 | 2,774,784 | |||
Tohoku Electric Power Co., Inc. | 77,500 | 1,574,370 | |||
Toyota Motor Corp. | 155,900 | 8,144,856 | |||
UNY Co. Ltd. | 71,000 | 1,119,442 | |||
| 95,027,079 | |||||
Netherlands — 4.4% | |||||
ABN AMRO Holding NV | 97,700 | 2,555,073 | |||
Aegon NV | 156,000 | 2,539,453 | |||
ING Groep NV | 138,100 | 4,790,427 | |||
Koninklijke (Royal) KPN NV | 135,300 | 1,356,732 | |||
Royal Dutch Shell (Class “A” Stock) | 154,600 | 4,718,515 | |||
Stork NV | 25,600 | 1,093,805 | |||
| 17,054,005 | |||||
Norway — 0.8% | |||||
Norsk Hydro ASA* | 32,100 | 3,295,942 | |||
Portugal — 0.5% | |||||
EDP Energias de Portugal SA* | 588,700 | 1,812,092 | |||
Singapore — 0.9% | |||||
MobileOne Ltd.* | 1,256,000 | 1,603,283 | |||
Neptune Orient Lines Ltd. | 862,000 | 1,743,489 | |||
| 3,346,772 | |||||
Spain — 4.1% | |||||
Banco Bilbao Vizcaya Argentaria SA | 166,900 | 2,979,687 | |||
Banco Santander Central Hispano SA | 114,300 | 1,508,808 | |||
Compania Espanola de Petroleos, SA (CEPSA) | 18,261 | 835,578 | |||
Endesa SA | 141,600 | 3,724,948 | |||
Repsol YPF SA | 156,200 | 4,562,082 | |||
Union Fenosa SA | 61,800 | 2,299,566 | |||
| 15,910,669 | |||||
Sweden — 1.9% | |||||
Electrolux AB, Series B | 92,800 | 2,412,134 | |||
Nordea Bank AB | 488,400 | 5,071,811 | |||
| 7,483,945 | |||||
Switzerland — 6.8% | |||||
Ciba Specialty Chemicals AG | 5,600 | 362,239 | |||
Credit Suisse Group* | 130,800 | 6,669,153 | |||
Georg Fischer AG* | 4,900 | 1,674,290 | |||
Rieter Holdings AG | 4,400 | 1,305,886 | |||
Swisscom AG | 4,700 | 1,483,448 | |||
Syngenta AG | 17,100 | 2,127,659 | |||
UBS AG | 69,600 | 6,626,049 | |||
Verwalt & Privat – Bank AG* | 7,900 | 1,322,027 | |||
Zurich Financial Services AG* | 22,400 | 4,773,030 | |||
| 26,343,781 | |||||
United Kingdom — 23.7% | |||||
Alliance & Leicester PLC | 120,700 | 2,064,171 | |||
Arriva PLC | 187,900 | 1,883,106 | |||
| COMMON STOCKS (Continued) | Shares | Value (Note 2) | |||
United Kingdom (cont’d.) | |||||
AstraZeneca PLC | 51,000 | $ | 2,482,305 | ||
Aviva PLC | 368,900 | 4,474,554 | |||
BAE SYSTEMS PLC | 515,700 | 3,387,101 | |||
Barclays PLC | 595,900 | 6,264,214 | |||
Boots Group PLC* | 186,300 | 1,939,189 | |||
BP PLC | 177,300 | 1,888,215 | |||
Bradford & Bingley PLC | 354,800 | 2,505,814 | |||
BT Group PLC | 1,506,500 | 5,773,495 | |||
Dairy Crest Group PLC | 103,400 | 973,105 | |||
DSG International PLC | 664,200 | 1,871,251 | |||
FirstGroup PLC | 253,000 | 1,748,753 | |||
GKN PLC* | 522,300 | 2,588,001 | |||
GlaxoSmithkKine PLC | 59,500 | 1,503,802 | |||
Hanson PLC | 140,800 | 1,547,945 | |||
HBOS PLC | 346,400 | 5,918,056 | |||
Imperial Chemical Industries PLC | 520,100 | 2,970,824 | |||
Kelda Group PLC | 192,900 | 2,568,770 | |||
Legal & General PLC | 716,300 | 1,503,511 | |||
Lloyds TSB Group PLC | 689,500 | 5,794,965 | |||
Mitchells & Butlers PLC | 301,700 | 2,169,719 | |||
Northern Foods PLC | 417,900 | 1,089,274 | |||
Northumbrian Water Group PLC | 450,000 | 1,885,226 | |||
Old Mutual PLC* | 1,061,300 | 3,008,261 | |||
Pilkington PLC | 1,084,700 | 2,780,660 | |||
Royal Dutch Shell PLC (Class “B” Stock) | 246,900 | 7,892,577 | |||
Scottish Power PLC | 388,600 | 3,633,744 | |||
Shanks Group PLC | 501,400 | 1,337,113 | |||
Tate & Lyle PLC | 212,300 | 2,056,413 | |||
Taylor Woodrow PLC | 396,200 | 2,593,708 | |||
TT Electronics PLC* | 327,500 | 828,287 | |||
Viridian Group PLC | 91,890 | 1,414,167 | |||
| 92,340,296 | |||||
TOTAL LONG-TERM INVESTMENTS | 381,386,493 | ||||
MONEY MARKET MUTUAL FUND — 0.7% | |||||
Dryden Core Investment Fund — | 2,870,490 | 2,870,490 | |||
TOTAL INVESTMENTS(o) — 98.7% | 384,256,983 | ||||
OTHER ASSETS IN EXCESS | 5,064,441 | ||||
NET ASSETS — 100.0% | $ | 389,321,424 | |||
| * | Non-income producing security. |
| (o) | As of December 31, 2005, 58 securities representing $124,435,359 and 32.0% of the total market value were fair valued in accordance with the policies adopted by the Board of Directors. |
| (w) | Prudential Investments LLC, the manager of the Fund also serves as manager of the Dryden Core Investment Fund-Taxable Money Market Series. |
SEE NOTES TO FINANCIAL STATEMENTS.
B15
| SP LSV INTERNATIONAL VALUE PORTFOLIO (Continued) |
SCHEDULE OF INVESTMENTS | December 31, 2005 |
The industry classification of long-term portfolio holdings, short-term investments and other assets in excess of liabilities shown as a percentage of net assets as of December 31, 2005 as follows:
Financial – Bank & Trust | 22.7 | % | |
Oil & Gas | 11.9 | ||
Utilities | 7.7 | ||
Insurance | 6.1 | ||
Telecommunications | 6.0 | ||
Automobile Manufacturers | 5.9 | ||
Chemicals | 4.5 | ||
Metals & Mining | 4.3 | ||
Pharmaceuticals | 3.5 | ||
Financial Services | 3.2 | ||
Electronic Components | 2.5 | ||
Building Materials | 2.3 | ||
Retail & Merchandising | 1.9 | ||
Transportation | 1.8 | ||
Automotive Parts | 1.7 | ||
Business Services | 1.6 | ||
Foods | 1.4 | ||
Machinery & Equipment | 1.4 | ||
Aerospace | 0.9 | ||
Clothing & Apparel | 0.9 | ||
Paper & Forest Products | 0.8 | ||
Construction | 0.7 | ||
Mutual Fund | 0.7 | ||
Consumer Products & Services | 0.6 | ||
Medical Supplies & Equipment | 0.6 | ||
Semiconductors | 0.6 | ||
Beverages | 0.5 | ||
Diversified Operations | 0.5 | ||
Entertainment & Leisure | 0.5 | ||
Farming & Agriculture | 0.4 | ||
Diversified | 0.3 | ||
Environmental Services | 0.3 | ||
Software | 0.1 | ||
| 98.7 | |||
Other assets in excess of liabilities | 1.3 | ||
Total | 100.0 | % | |
SEE NOTES TO FINANCIAL STATEMENTS.
B16
| SP MID-CAP GROWTH PORTFOLIO |
SCHEDULE OF INVESTMENTS | December 31, 2005 |
| LONG-TERM INVESTMENTS — 99.3% | Value (Note 2) | ||||
| COMMON STOCKS | Shares | ||||
Advertising — 1.0% | |||||
Monster Worldwide, Inc.* | 38,000 | $ | 1,551,160 | ||
Biotechnology — 1.0% | |||||
Applera Corp. – Applied Biosystems Group* | 57,000 | 1,513,920 | |||
Broadcasting — 1.9% | |||||
Radio One, Inc. (Class “D” Stock)* | 19,500 | 201,825 | |||
Univision Communications, Inc. (Class “A” Stock) * | 24,602 | 723,053 | |||
XM Satellite Radio Holdings, Inc. (Class “A” Stock)*(a) | 75,200 | 2,051,456 | |||
| 2,976,334 | |||||
Chemicals — 0.2% | |||||
Airgas, Inc. | 4,300 | 141,470 | |||
Rohm & Haas Co. | 4,000 | 193,680 | |||
| 335,150 | |||||
Clothing & Apparel — 2.8% | |||||
Coach, Inc.* | 130,000 | 4,334,200 | |||
Commercial Banks — 0.2% | |||||
North Fork Bancorporation, Inc. | 12,500 | 342,000 | |||
Commercial Services — 5.4% | |||||
Alliance Data Systems Corp.*(a) | 17,900 | 637,240 | |||
Corporate Executive Board Co. (The) | 18,100 | 1,623,570 | |||
Equifax, Inc. | 41,000 | 1,558,820 | |||
Laureate Education, Inc.* | 29,000 | 1,522,790 | |||
Pharmaceutical Product Development, Inc. | 26,000 | 1,610,700 | |||
Weight Watchers Intl., Inc.* | 26,400 | 1,304,952 | |||
| 8,258,072 | |||||
Communication Equipment — 2.3% | |||||
F5 Networks, Inc.* | 60,200 | 3,442,838 | |||
Computer Hardware — 7.8% | |||||
Affiliated Computer Services, Inc.* | 6,200 | 366,916 | |||
Apple Computer, Inc.* | 101,600 | 7,304,024 | |||
Perot Systems Corp. (Class A Stock)* | 10,700 | 151,298 | |||
Sandisk Corp.* | 23,500 | 1,476,270 | |||
Seagate Technology* | 59,000 | 1,179,410 | |||
Western Digital Corp.*(a) | 79,000 | 1,470,190 | |||
| 11,948,108 | |||||
Computer Services & Software — 5.3% | |||||
Activision, Inc.*(a) | 194,577 | 2,673,493 | |||
BEA Systems, Inc.* | 21,900 | 205,860 | |||
BMC Software, Inc.* | 71,300 | 1,460,937 | |||
Compuware Corp.* | 153,700 | 1,378,689 | |||
Fiserv, Inc.* | 10,300 | 445,681 | |||
Red Hat, Inc.*(a) | 70,000 | 1,906,800 | |||
| 8,071,460 | |||||
Construction — 0.8% | |||||
Toll Brothers, Inc.* | 34,000 | 1,177,760 | |||
Distribution/Wholesale — 0.2% | |||||
WESCO International, Inc.* | 7,500 | 320,475 | |||
| COMMON STOCKS (Continued) | Shares | Value (Note 2) | |||
Diversified Financial Services — 2.2% | |||||
Ameritrade Holding Corp.* | 136,700 | $ | 3,280,800 | ||
SLM Corp.(a) | 2,600 | 143,234 | |||
| 3,424,034 | |||||
Diversified Manufacturing Operations — 0.3% | |||||
Textron, Inc. | 5,300 | 407,994 | |||
Drugs & Healthcare — 2.9% | |||||
ARAMARK Corp. (Class “B” Stock) | 10,700 | 297,246 | |||
Express Scripts, Inc.* | 50,200 | 4,206,760 | |||
| 4,504,006 | |||||
Electronic Components — 1.7% | |||||
Amphenol Corp. (Class “A” Stock)* | 4,400 | 194,744 | |||
Garmin Ltd.(a) | 10,600 | 703,310 | |||
Harman International Industries, Inc. | 1,300 | 127,205 | |||
L-3 Communications Holdings, Inc. | 3,100 | 230,485 | |||
PerkinElmer, Inc. | 8,800 | 207,328 | |||
Trimble Navigation Ltd. | 31,400 | 1,114,386 | |||
| 2,577,458 | |||||
Entertainment & Leisure — 0.7% | |||||
Winnebago Industries | 32,100 | 1,068,288 | |||
Financial Services — 4.6% | |||||
Affiliated Managers Group, Inc.*(a) | 4,450 | 357,113 | |||
Chicago Mercantile Exchange Holdings, Inc.*(a) | 3,450 | 1,267,840 | |||
CIT Group, Inc. | 16,300 | 844,014 | |||
Nasdaq Stock Market, Inc.*(a) | 84,000 | 2,955,120 | |||
Nuveen Investments, Inc. (Class “A” Stock) | 7,900 | 336,698 | |||
Price, (T. Rowe) Group, Inc. | 18,300 | 1,318,149 | |||
| 7,078,934 | |||||
Food — 1.1% | |||||
Whole Foods Market, Inc. | 22,000 | 1,702,580 | |||
Health Care Providers & Services — 1.1% | |||||
Triad Hospitals, Inc.* | 3,600 | 141,228 | |||
UnitedHealth Group, Inc.* | 24,200 | 1,503,788 | |||
| 1,645,016 | |||||
Healthcare Services — 4.8% | |||||
Caremark Rx, Inc.* | 8,500 | 440,215 | |||
Cerner Corp.*(a) | 3,800 | 345,458 | |||
Community Health Systems, Inc.* | 37,500 | 1,437,750 | |||
Humana Inc.* | 37,500 | 2,037,375 | |||
Omnicare, Inc. | 4,500 | 257,490 | |||
WellPoint, Inc.* | 35,751 | 2,852,572 | |||
| 7,370,860 | |||||
Hotels, Restaurants & Leisure — 1.3% | |||||
International Game Technology | 7,100 | 218,538 | |||
La Quinta Corp.* | 4,300 | 47,902 | |||
Marriott International, Inc. (Class “A” Stock) | 20,500 | 1,372,885 | |||
Royal Caribbean Cruises Ltd. | 8,100 | 364,986 | |||
| 2,004,311 | |||||
Insurance — 2.1% | |||||
Assurant, Inc. | 40,200 | 1,748,298 | |||
SAFECO Corp. | 26,000 | 1,469,000 | |||
| 3,217,298 | |||||
SEE NOTES TO FINANCIAL STATEMENTS.
B17
| SP MID-CAP GROWTH PORTFOLIO (Continued) |
SCHEDULE OF INVESTMENTS | December 31, 2005 |
| COMMON STOCKS (Continued) | Shares | Value (Note 2) | |||
Internet Services — 6.1% | |||||
Amazon.Com, Inc.* | 36,000 | $ | 1,697,400 | ||
Checkfree Corp.* | 35,500 | 1,629,450 | |||
eBay Inc. | 79,000 | 3,416,750 | |||
Netease.com, Inc., ADR*(a) (China) | 17,000 | 954,720 | |||
TIBCO Software, Inc.* | 24,100 | 180,027 | |||
ValueClick, Inc.* | 78,000 | 1,412,580 | |||
| 9,290,927 | |||||
Investment Management — 0.9% | |||||
Alliance Capital Management Holding LP | 23,300 | 1,316,217 | |||
Machinery & Equipment — 3.5% | |||||
JLG Industries, Inc.* | 82,800 | 3,780,648 | |||
Rockwell Automation, Inc. | 26,200 | 1,549,992 | |||
| 5,330,640 | |||||
Medical Supplies & Equipment — 2.8% | |||||
Advanced Medical Optics*(a) | 7,800 | 326,040 | |||
Bausch & Lomb, Inc.* | 18,000 | 1,222,200 | |||
Cytyc Corp.* | 16,100 | 454,503 | |||
Fisher Scientific International, Inc.*(a) | 7,600 | 470,136 | |||
Kyphon, Inc.* | 7,600 | 310,308 | |||
Techne Corp.* | 25,900 | 1,454,285 | |||
| 4,237,472 | |||||
Metals & Mining — 1.5% | |||||
Precision Castparts Corp. | 44,000 | 2,279,640 | |||
Oil, Gas & Consumable Fuels — 8.4% | |||||
Amerada Hess Corp. | 13,000 | 1,648,660 | |||
BJ Services Co. | 92,200 | 3,380,974 | |||
ENSCO International, Inc. | 5,700 | 252,795 | |||
Nabors Industries Ltd.* | 21,600 | 1,636,200 | |||
Newfield Exploration Co.* | 28,000 | 1,401,960 | |||
Valero Energy Corp. | 59,850 | 3,088,260 | |||
Williams Cos., Inc. | 59,000 | 1,367,030 | |||
| 12,775,879 | |||||
Pharmaceuticals — 3.9% | |||||
Barr Pharmaceuticals, Inc.* | 28,000 | 1,744,120 | |||
Dade Behring Holdings, Inc. | 41,000 | 1,676,490 | |||
Genzyme Corp.* | 20,300 | 1,436,834 | |||
IVAX Corp.* | 16,750 | 524,778 | |||
MedImmune, Inc.* | 8,800 | 308,176 | |||
Valeant Pharmaceuticals International. | 11,200 | 202,496 | |||
| 5,892,894 | |||||
Real Estate — 0.8% | |||||
Potash Corp. of Saskatchewan, Inc.(a) (Canada) | 15,700 | 1,259,454 | |||
Retail & Merchandising — 5.0% | |||||
Best Buy Co., Inc. | 7,950 | 345,666 | |||
Cheesecake Factory, Inc. (The)* | 40,000 | 1,495,600 | |||
Chico’s FAS, Inc.* | 45,000 | 1,976,850 | |||
Linens ‘n Things, Inc.* | 13,400 | 356,440 | |||
Nordstrom, Inc. | 40,800 | 1,525,920 | |||
Office Depot, Inc.* | 49,000 | 1,538,600 | |||
Staples Inc.* | 19,950 | 453,064 | |||
| 7,692,140 | |||||
| COMMON STOCKS (Continued) | Shares | Value (Note 2) | ||||
Retail — 0.2% | ||||||
Bed Bath & Beyond, Inc.* | 7,100 | $ | 256,665 | |||
School — 0.1% | ||||||
Career Education Corp.* | 3,900 | 131,508 | ||||
Semiconductors — 8.2% | ||||||
Advanced Micro Devices, Inc.*(a) | 120,000 | 3,672,000 | ||||
KLA-Tencor Corp. | 8,100 | 399,573 | ||||
Marvell Technology Group Ltd.* (Bermuda) | 33,500 | 1,879,015 | ||||
MEMC Electronic Materials, Inc.* | 67,500 | 1,496,475 | ||||
National Semiconductor Corp. | 58,300 | 1,514,634 | ||||
Nvidia Corp.* | 97,100 | 3,549,976 | ||||
| 12,511,673 | ||||||
Telecommunications — 5.2% | ||||||
Amdocs Ltd.* | 7,000 | 192,500 | ||||
America Movil ADR Series L(a) (Mexico) | 40,200 | 1,176,252 | ||||
American Tower Corp. (Class “A” Shares) | 61,500 | 1,666,650 | ||||
Harris Corp. | 83,200 | 3,578,432 | ||||
Juniper Networks, Inc.*(a) | 60,550 | 1,350,265 | ||||
| 7,964,099 | ||||||
Utilities — 1.0% | ||||||
Consol Energy, Inc. | 21,200 | 1,381,816 | ||||
DPL, Inc.(a) | 7,100 | 184,671 | ||||
| 1,566,487 | ||||||
TOTAL LONG-TERM INVESTMENTS | 151,777,951 | |||||
MUTUAL FUND — 15.8% | ||||||
Dryden Core Investment Fund — | 24,166,965 | 24,166,965 | ||||
TOTAL INVESTMENTS — 115.1% | 175,944,916 | |||||
LIABILITIES IN EXCESS OF OTHER | (23,036,206 | ) | ||||
NET ASSETS — 100.0% | $ | 152,908,710 | ||||
The following abbreviations are used in portfolio descriptions:
| ADR | American Depositary Receipt |
| * | Non-income producing security. |
| (a) | All or a portion of security is on loan. The aggregate market value of such securities is $21,770,399; cash collateral of $22,801,195 (included with liabilities) was received with which the portfolio purchased highly liquid short-term investments. |
| (b) | Represents security, or a portion thereof, purchased with cash collateral received for securities on loan. |
| (w) | Prudential Investments LLC, the manager of the Fund also serves as manager of the Dryden Core Investment Fund-Taxable Money Market Series. |
SEE NOTES TO FINANCIAL STATEMENTS.
B18
| SP MID-CAP GROWTH PORTFOLIO (Continued) |
SCHEDULE OF INVESTMENTS | December 31, 2005 |
The industry classification of portfolio holdings and liabilities in excess of other assets shown as a percentage of net assets as of December 31, 2005 were as follows:
Mutual Fund (including 14.9% of collateral received for securities on loan) | 15.8 | % | |
Oil, Gas & Consumable Fuels | 8.4 | ||
Semiconductors | 8.2 | ||
Computer Hardware | 7.8 | ||
Internet Services | 6.1 | ||
Commercial Services | 5.4 | ||
Computer Services & Software | 5.3 | ||
Telecommunications | 5.2 | ||
Retail & Merchandising | 5.0 | ||
Healthcare Services | 4.8 | ||
Financial Services | 4.6 | ||
Pharmaceuticals | 3.9 | ||
Machinery & Equipment | 3.5 | ||
Drugs & Healthcare | 2.9 | ||
Clothing & Apparel | 2.8 | ||
Medical Supplies & Equipment | 2.8 | ||
Communication Equipment | 2.3 | ||
Diversified Financial Services | 2.2 | ||
Insurance | 2.1 | ||
Broadcasting | 1.9 | ||
Electronic Components | 1.7 | ||
Metals & Mining | 1.5 | ||
Hotels, Restaurants & Leisure | 1.3 | ||
Food | 1.1 | ||
Health Care Providers & Services | 1.1 | ||
Advertising | 1.0 | ||
Biotechnology | 1.0 | ||
Utilities | 1.0 | ||
Investment Management | 0.9 | ||
Construction | 0.8 | ||
Real Estate | 0.8 | ||
Entertainment & Leisure | 0.7 | ||
Diversified Manufacturing Operations | 0.3 | ||
Chemicals | 0.2 | ||
Commercial Banks | 0.2 | ||
Distribution/Wholesale | 0.2 | ||
Retail | 0.2 | ||
School | 0.1 | ||
| 115.1 | |||
Liabilities in excess of other assets | (15.1 | ) | |
Total | 100.0 | % | |
SEE NOTES TO FINANCIAL STATEMENTS.
B19
| SP PIMCO HIGH YIELD PORTFOLIO |
SCHEDULE OF INVESTMENTS | December 31, 2005 |
LONG-TERM INVESTMENTS — 91.5% CORPORATE BONDS — 87.3% | Moody’s Ratings (Unaudited) | Interest Rate | Maturity Date | Principal Amount (000) | Value (Note 2) | ||||||
Advertising — 0.1% | |||||||||||
Lamar Media Corp., Sr. Sub. Notes | Ba3 | 6.625% | 08/15/15 | $ 375 | $ | 376,406 | |||||
Aerospace & Defense — 1.7% | |||||||||||
Armor Holdings, Inc., Sr. Sub. Notes | B1 | 8.25% | 08/15/13 | 1,000 | 1,075,000 | ||||||
Delta Air Lines, Inc., Pass-Through Certs., Ser. 00-1 | Ba1 | 7.379% | 05/18/10 | 344 | 341,429 | ||||||
Delta Air Lines, Inc., Pass-Through Certs., Ser. 00-1 | Ba1 | 7.57% | 11/18/10 | 500 | 492,647 | ||||||
DRS Technologies, Inc. | Zero | 11/22/06 | 1,000 | 1,002,673 | |||||||
L-3 Communications Corp. Sr. Sub. Notes | Ba3 | 6.375% | 10/15/15 | 1,250 | 1,246,875 | ||||||
Northwest Airlines, Inc., Pass-Through Certs., Ser. 99-1A | Ba3 | 6.81% | 02/01/20 | 451 | 424,810 | ||||||
United Air Lines, Inc. Pass-Through Certs., Ser. 00-1(i) | NR | 7.783% | 01/01/14 | 846 | 842,722 | ||||||
United AirLines, Inc., Pass-Through Certs., Ser. 00-1(i) | NR | 7.73% | 07/01/10 | 550 | 546,967 | ||||||
United AirLines, Inc., Pass-Through Certs., Ser. 01-1(i) | NR | 6.201% | 09/01/08 | 95 | 93,080 | ||||||
United AirLines, Inc., Pass-Through Certs., Ser. 01-1(i) | NR | 6.602% | 09/01/13 | 334 | 330,031 | ||||||
US Airways Group, Inc., 1993 A Pass-Through Cert. (includes Certificates of Beneficial Interest)(i) | NR | 9.625% | 09/01/24 | 95 | 49,182 | ||||||
| 6,445,416 | |||||||||||
Autos – Cars & Trucks — 2.8% | |||||||||||
Arvin Capital I, Gtd. Notes | Ba3 | 9.50% | 02/01/27 | 750 | 753,750 | ||||||
ArvinMeritor, Inc., Notes | Ba2 | 8.75% | 03/01/12 | 2,190 | 2,096,925 | ||||||
Cooper-Standard Automotive, Inc., Gtd. Notes | B2 | 7.00% | 12/15/12 | 1,500 | 1,380,000 | ||||||
Dura Operating Corp., Gtd. Notes, Ser. B | B3 | 8.625% | 04/15/12 | 1,115 | 919,875 | ||||||
Tenneco Automotive, Inc., Sec’d. Notes 144A | B3 | 8.625% | 11/15/14 | 1,500 | 1,417,500 | ||||||
Tenneco Automotive, Inc., Sr. Sub. Notes | B2 | 10.25% | 07/15/13 | 1,375 | 1,502,188 | ||||||
TRW Automotive, Inc., Sr. Notes | Ba3 | 9.375% | 02/15/13 | 2,065 | 2,235,362 | ||||||
| 10,305,600 | |||||||||||
Broadcasting & Other Media — 1.0% | |||||||||||
Lighthouse International Co. SA, Sr. Notes (Luxembourg) | B3 | 8.00% | 04/30/14 | 2,320 | 2,911,433 | ||||||
Unity Media GmbH, Sr. Notes (Germany) | Caa1 | 10.375% | 02/15/15 | 600 | 624,000 | ||||||
| 3,535,433 | |||||||||||
Cable — 4.8% | |||||||||||
CanWest Media, Inc., Sr. Sub. Notes (Canada) | B2 | 8.00% | 09/15/12 | 1,200 | 1,225,500 | ||||||
CCO Holdings LLC/CCO Holdings Capital Corp., Sr. Notes | B3 | 8.75% | 11/15/13 | 1,870 | 1,781,175 | ||||||
Charter Communications Operating LLC, Sr. Notes | B2 | 8.00% | 04/30/12 | 350 | 348,250 | ||||||
Charter Communications Operating LLC, Sr. Notes | B2 | 8.375% | 04/30/14 | 1,415 | 1,407,925 | ||||||
CSC Holdings, Inc., Debs., Ser. B | B1 | 8.125% | 08/15/09 | 700 | 707,000 | ||||||
CSC Holdings, Inc., Sr. Notes | B1 | 8.125% | 07/15/09 | 2,000 | 2,020,000 | ||||||
CSC Holdings, Inc., Sr. Notes, Ser. B | B1 | 7.625% | 04/01/11 | 2,375 | 2,363,125 | ||||||
DirecTV Holdings LLC | Ba2 | 6.375% | 06/15/15 | 1,535 | 1,500,462 | ||||||
Echostar DBS Corp., Sr. Notes | Ba3 | 6.375% | 10/01/11 | 600 | 577,500 | ||||||
Echostar DBS Corp., Sr. Notes | Ba3 | 6.625% | 10/01/14 | 1,300 | 1,246,375 | ||||||
Mediacom Broadband LLC, Gtd. Notes | B2 | 11.00% | 07/15/13 | 2,350 | 2,526,250 | ||||||
Rogers Cable, Inc. (Canada) | Ba3 | 6.25% | 06/15/13 | 700 | 690,375 | ||||||
Rogers Cable, Inc., Sec’d. Notes 144A (Canada) | Ba3 | 6.75% | 03/15/15 | 1,315 | 1,334,725 | ||||||
| 17,728,662 | |||||||||||
Chemicals — 2.9% | |||||||||||
Equistar Chemicals LP, Gtd. Notes | B2 | 10.125% | 09/01/08 | 500 | 542,500 | ||||||
Equistar Chemicals LP, Notes | B2 | 8.75% | 02/15/09 | 2,025 | 2,131,312 | ||||||
ISP Chemco, Inc., Ser. B | B1 | 10.25% | 07/01/11 | 1,200 | 1,278,000 | ||||||
ISP Holdings, Inc., Sr. Sec’d. Notes, Ser.B | B2 | 10.625% | 12/15/09 | 300 | 315,000 | ||||||
Nalco Co., Sr. Notes | B2 | 7.75% | 11/15/11 | 1,200 | 1,233,000 | ||||||
Nalco Co., Sr. Sub. Notes | Caa1 | 8.875% | 11/15/13 | 850 | 890,375 | ||||||
PQ Corp., Gtd. Notes 144A | B3 | 7.50% | 02/15/13 | 1,000 | 930,000 | ||||||
Rhodia SA, Sr. Notes (Luxembourg) | NR | 8.00% | 06/01/10 | EUR 1,000 | 1,243,089 | ||||||
Rockwood Specialties Group, Inc. | B3 | 7.50% | 11/15/14 | $ 2,075 | 2,067,219 | ||||||
| 10,630,495 | |||||||||||
SEE NOTES TO FINANCIAL STATEMENTS.
B20
| SP PIMCO HIGH YIELD PORTFOLIO (Continued) |
SCHEDULE OF INVESTMENTS | December 31, 2005 |
| CORPORATE BONDS (Continued) | Moody’s Ratings (Unaudited) | Interest Rate | Maturity Date | Principal Amount (000) | Value (Note 2) | |||||||
Commercial Services — 0.7% | ||||||||||||
Alderwoods Group, Inc., Gtd. Notes | B2 | 7.75% | 09/15/12 | $ | 775 | $ | 802,125 | |||||
Cenveo Corp., Gtd. Notes | B1 | 9.625% | 03/15/12 | 760 | 820,800 | |||||||
Hertz Corp. | B1 | 8.875% | 12/21/12 | 1,000 | 1,013,615 | |||||||
| 2,636,540 | ||||||||||||
Containers — 3.0% | ||||||||||||
Crown Americas Inc., Sr. Notes | B1 | 7.625% | 11/15/13 | 350 | 363,125 | |||||||
Crown Americas, Inc. | B1 | 7.75% | 11/15/15 | 425 | 439,875 | |||||||
Greif, Inc., Gtd. Notes | B1 | 8.875% | 08/01/12 | 500 | 532,500 | |||||||
Jefferson Smurfit Corp. US, Gtd. Notes | B2 | 7.50% | 06/01/13 | 800 | 736,000 | |||||||
Jefferson Smurfit Corp. US, Gtd. Notes | B2 | 8.25% | 10/01/12 | 950 | 912,000 | |||||||
Kappa Beheer BV, Gtd. Notes (Netherlands) | B2 | 10.625% | 07/15/09 | 1,275 | 1,320,160 | |||||||
Norampac, Inc., Sr. Notes (Canada) | Ba2 | 6.75% | 06/01/13 | 1,200 | 1,158,000 | |||||||
Owens-Brockway Glass Container, Inc., Gtd. Notes | B1 | 7.75% | 05/15/11 | 300 | 313,125 | |||||||
Owens-Brockway Glass Container, Inc., Gtd. Notes | B2 | 8.25% | 05/15/13 | 500 | 516,250 | |||||||
Owens-Brockway Glass Container, Inc., Sec’d. Notes | B1 | 8.75% | 11/15/12 | 825 | 886,875 | |||||||
Owens-Brockway, Sr. Notes 144A | B2 | 6.75% | 12/01/14 | 150 | 145,500 | |||||||
Smurfit-Stone Container Enterprises, Inc., Sr. Notes | B2 | 8.375% | 07/01/12 | 2,650 | 2,563,875 | |||||||
Smurfit-Stone Container Enterprises, Inc., Sr. Notes | B2 | 9.75% | 02/01/11 | 1,000 | 1,010,000 | |||||||
Stone Container Finance, Gtd. Notes (Canada) | B2 | 7.375% | 07/15/14 | 150 | 136,500 | |||||||
| 11,033,785 | ||||||||||||
Distribution/Wholesale — 1.0% | ||||||||||||
Aviall, Inc., Sr. Notes | B1 | 7.625% | 07/01/11 | 875 | 896,875 | |||||||
Buhrmann US Inc., Sr. Sub. Notes | B2 | 8.25% | 07/01/14 | 1,500 | 1,505,625 | |||||||
Spectrum Brands, Inc., Gtd. Notes | B3 | 7.375% | 02/01/15 | 1,450 | 1,210,750 | |||||||
Spectrum Brands, Inc., Sr. Sub. Notes | B3 | 8.50% | 10/01/13 | 100 | 87,250 | |||||||
| 3,700,500 | ||||||||||||
Diversified Operations — 1.0% | ||||||||||||
Aearo Co., Inc., Sr. Sub. Notes | B3 | 8.25% | 04/15/12 | 500 | 507,500 | |||||||
Bombardier, Inc., Notes (Canada) | Ba2 | 6.30% | 05/01/14 | 700 | 612,500 | |||||||
Bombardier, Inc., Notes (Canada) | Ba2 | 6.75% | 05/01/12 | 1,000 | 925,000 | |||||||
Invensys PLC, Sr. Notes (United Kingdom) | B3 | 9.875% | 03/15/11 | 700 | 693,000 | |||||||
Trinity Industries, Inc., Sr. Notes | Ba3 | 6.50% | 03/15/14 | 975 | 960,375 | |||||||
| 3,698,375 | ||||||||||||
Entertainment — 1.1% | ||||||||||||
Choctaw Resort Development Enterprise, Sr. Notes | B1 | 7.25% | 11/15/19 | 2,075 | 2,108,719 | |||||||
Royal Caribbean Cruises Ltd., Deb. (Liberia) | Ba1 | 7.25% | 03/15/18 | 1,075 | 1,155,625 | |||||||
Royal Caribbean Cruises Ltd., Deb. (Liberia) | Ba1 | 7.50% | 10/15/27 | 725 | 776,656 | |||||||
| 4,041,000 | ||||||||||||
Financials — 10.1% | ||||||||||||
AES Ironwood LLC, Sec’d. Notes, Series A | B2 | 8.857% | 11/30/25 | 1,449 | 1,601,069 | |||||||
AES Red Oak LLC, Sec’d. Notes | B2 | 8.54% | 11/30/19 | 1,007 | 1,107,701 | |||||||
BCP Crystal US Holdings Corp., Sr. Sub. Notes | B3 | 9.625% | 06/15/14 | 2,364 | 2,629,950 | |||||||
Bluewater Finance Ltd., Gtd. Notes (Cayman Island) | B1 | 10.25% | 02/15/12 | 1,650 | 1,773,750 | |||||||
Chukchansi Economic Development Authority, Sr. Notes | B2 | 8.00% | 11/15/13 | 1,000 | 1,026,250 | |||||||
Eircom Funding, Gtd. Notes (Ireland) | B1 | 8.25% | 08/15/13 | 1,200 | 1,284,000 | |||||||
Ford Motor Credit Co., Bonds | Baa3 | 7.375% | 02/01/11 | 5,140 | 4,505,302 | |||||||
Ford Motor Credit Co., Notes | Baa3 | 5.70% | 01/15/10 | 425 | 361,277 | |||||||
Ford Motor Credit Co., Notes | Baa3 | 7.00% | 10/01/13 | 975 | 833,096 | |||||||
Ford Motor Credit Co., Notes | Baa3 | 7.375% | 10/28/09 | 185 | 164,074 | |||||||
Ford Motor Credit Co., Sr. Notes | Baa3 | 5.80% | 01/12/09 | 2,000 | 1,744,678 | |||||||
Ford Motor Credit Co., Sr. Notes | Baa3 | 7.25% | 10/25/11 | 175 | 151,175 | |||||||
General Motors Acceptance Corp., Bonds | Ba1 | 6.00% | 04/01/11 | 990 | 890,942 | |||||||
General Motors Acceptance Corp., Bonds | Ba1 | 8.00% | 11/01/31 | 2,175 | 2,083,391 | |||||||
General Motors Acceptance Corp., Notes | Ba1 | 6.875% | 09/15/11-08/28/12 | 3,125 | 2,836,299 | |||||||
General Motors Acceptance Corp., Notes | Ba1 | 7.00% | 02/01/12 | 1,600 | 1,451,082 | |||||||
SEE NOTES TO FINANCIAL STATEMENTS.
B21
| SP PIMCO HIGH YIELD PORTFOLIO (Continued) |
SCHEDULE OF INVESTMENTS | December 31, 2005 |
| CORPORATE BONDS (Continued) | Moody’s Ratings (Unaudited) | Interest Rate | Maturity Date | Principal Amount (000) | Value (Note 2) | |||||||
Financials (cont’d.) | ||||||||||||
General Motors Acceptance Corp., Notes | Ba1 | 7.25% | 03/02/11 | $ | 1,350 | $ | 1,240,836 | |||||
Ineos Group Holdings Ltd. (European Currency Unit) | Zero | 10/07/06 | 1,000 | 1,175,198 | ||||||||
JET Equipment Trust 144A(i)(g) | NR | 7.63% | 06/15/12 | 245 | 221,485 | |||||||
JET Equipment Trust 144A(i)(g) | NR | 10.00% | 08/15/12 | 70 | 62,221 | |||||||
JSG Funding PLC, Sr. Notes (Ireland) | B3 | 9.625% | 10/01/12 | 4,375 | 4,375,000 | |||||||
KRATON Polymers LLC, Sr. Sub. Notes 144A | Caa1 | 8.125% | 01/15/14 | 1,875 | 1,800,000 | |||||||
Morgan Stanley Bank AG For OAO Gazprom, Notes (Germany) | BB-(d) | 9.625% | 03/01/13 | 700 | 843,220 | |||||||
Sigmakalon Term A Eur (Bank Notes LOC) (European Currency Unit) | Zero | 06/30/12 | 1,000 | 1,160,639 | ||||||||
Universal City Development Partners, Sr. Notes | B2 | 11.75% | 04/01/10 | 825 | 925,031 | |||||||
Universal City Florida Holding Co. I/II, Sr. Notes | B3 | 8.375% | 05/01/10 | 1,000 | 977,500 | |||||||
| 37,225,166 | ||||||||||||
Food & Beverage — 1.4% | ||||||||||||
Delhaize America, Inc., Gtd. Notes | Ba1 | 9.00% | 04/15/31 | 2,730 | 3,209,437 | |||||||
Ingles Markets, Inc., Gtd. Notes | B3 | 8.875% | 12/01/11 | 975 | 1,009,125 | |||||||
Roundy’s Inc., Sr. Sub. Notes | NR | Zero | 11/01/11 | 1,000 | 995,250 | |||||||
| 5,213,812 | ||||||||||||
Forest & Paper — 2.9% | ||||||||||||
Abitibi-Consolidated, Inc., Debs. (Canada) | Ba3 | 8.85% | 08/01/30 | 860 | 735,300 | |||||||
Abitibi-Consolidated, Inc., Notes (Canada) | Ba3 | 8.55% | 08/01/10 | 1,750 | 1,771,875 | |||||||
Abitibi-Consolidated, Inc., Sr. Notes (Canada) | Ba3 | 8.375% | 04/01/15 | 1,625 | 1,555,937 | |||||||
Bowater Canada Finance, Gtd. Notes (Canada) | Ba3 | 7.95% | 11/15/11 | 725 | 703,250 | |||||||
Bowater, Inc., Notes | Ba3 | 6.50% | 06/15/13 | 500 | 447,500 | |||||||
Cascades, Inc., Sr. Notes (Canada) | Ba3 | 7.25% | 02/15/13 | 1,500 | 1,365,000 | |||||||
Georgia-Pacific Corp., Debs. | Ba3 | 7.375% | 12/01/25 | 3,500 | 3,150,000 | |||||||
Georgia-Pacific Corp., Sr. Notes | Ba2 | 8.00% | 01/15/14 | 75 | 82,125 | |||||||
Georgia-Pacific Corp./Timber Group Bonds | Ba3 | 7.25% | 06/01/28 | 775 | 686,844 | |||||||
| 10,497,831 | ||||||||||||
Gaming — 3.9% | ||||||||||||
Gaylord Entertainment Co., Sr. Notes | B3 | 8.00% | 11/15/13 | 1,000 | 1,047,500 | |||||||
Mandalay Resort Group | Ba2 | 6.50% | 07/31/09 | 760 | 768,550 | |||||||
Mandalay Resort Group, Sr. Sub. Debs. | Ba3 | 7.625% | 07/15/13 | 980 | 1,016,750 | |||||||
Mandalay Resort Group, Sr. Sub. Notes | Ba3 | 9.375% | 02/15/10 | 197 | 215,715 | |||||||
MGM Mirage, Gtd. Notes | Ba3 | 8.375% | 02/01/11 | 1,050 | 1,123,500 | |||||||
MGM Mirage, Inc., | Ba2 | 7.25% | 08/01/17 | 500 | 508,750 | |||||||
MGM Mirage, Inc., Sr. Notes | Ba2 | 6.75% | 09/01/12 | 100 | 101,375 | |||||||
MGM Mirage, Sr. Unsec’d. Notes | Ba2 | 6.625% | 07/15/15 | 3,225 | 3,216,937 | |||||||
Seneca Gaming Corp., Sr. Notes | B1 | 7.25% | 05/01/12 | 1,110 | 1,116,938 | |||||||
Station Casinos, Inc., Sr. Sub. Notes | Ba3 | 6.50% | 02/01/14 | 1,200 | 1,212,000 | |||||||
Wynn Las Vegas LLC/Wynn Las Vegas Capital Corp., 1st Mortgage 144A | B2 | 6.625% | 12/01/14 | 4,200 | 4,084,500 | |||||||
| 14,412,515 | ||||||||||||
Hospitals/Hospital Management — 7.4% | ||||||||||||
Community Health Systems, Inc., Sr. Sub. Notes 144A | B3 | 6.50% | 12/15/12 | 1,300 | 1,265,875 | |||||||
Davita, Inc., Sr. Sub. Notes | B3 | 7.25% | 03/15/15 | 2,175 | 2,202,188 | |||||||
Extendicare Health Services, Inc., Gtd. Notes | B1 | 9.50% | 07/01/10 | 1,000 | 1,061,250 | |||||||
Fresenius Medical Care Capital Trust II, Gtd. Notes | NR | 7.875% | 02/01/08 | 1,250 | 1,290,625 | |||||||
Fresenius Medical Care Capital Trust, Gtd. Notes | B1 | 7.875% | 06/15/11 | 1,925 | 2,050,125 | |||||||
HCA, Inc., Notes | Ba2 | 6.375% | 01/15/15 | 1,500 | 1,516,251 | |||||||
HCA, Inc., Notes | Ba2 | 6.75% | 07/15/13 | 2,700 | 2,783,932 | |||||||
HCA, Inc., Notes | Ba2 | 7.69% | 06/15/25 | 681 | 707,158 | |||||||
HCA, Inc., Sr. Notes | BBB-(d) | 6.95% | 05/01/12 | 500 | 518,622 | |||||||
Healthsouth Corp., Sr. Notes | NR | 8.375% | 10/01/11 | 1,775 | 1,806,063 | |||||||
Healthsouth, Corp., Notes | NR | 7.625% | 06/01/12 | 1,875 | 1,903,125 | |||||||
Healthsouth, Corp., Sr. Notes | NR | 7.00% | 06/15/08 | 2,000 | 2,005,000 | |||||||
Rotech Healthcare, Inc., Gtd. Notes | B2 | 9.50% | 04/01/12 | 2,775 | 2,913,750 | |||||||
Tenet Healthcare Corp., Sr. Unsec’d. Notes | B3 | 7.375% | 02/01/13 | 1,600 | 1,476,000 | |||||||
SEE NOTES TO FINANCIAL STATEMENTS.
B22
| SP PIMCO HIGH YIELD PORTFOLIO (Continued) |
SCHEDULE OF INVESTMENTS | December 31, 2005 |
| CORPORATE BONDS (Continued) | Moody’s Ratings (Unaudited) | Interest Rate | Maturity Date | Principal Amount (000) | Value (Note 2) | |||||||
Hospitals/Hospital Management (cont’d.) | ||||||||||||
Triad Hospitals, Inc., Sr. Sub. Notes | B3 | 7.00% | 11/15/13 | $ | 2,625 | $ | 2,631,562 | |||||
VWR International, Inc., Sr. Notes | B3 | 6.875% | 04/15/12 | 1,300 | 1,290,250 | |||||||
| 27,421,776 | ||||||||||||
Lodging — 0.9% | ||||||||||||
Host Marriott LP, Gtd. Notes | Ba3 | 6.375% | 03/15/15 | 2,500 | 2,493,750 | |||||||
ITT Corp., Debs. | Ba1 | 7.375% | 11/15/15 | 875 | 949,375 | |||||||
| 3,443,125 | ||||||||||||
Machinery & Equipment — 0.7% | ||||||||||||
Chart Industries, Inc., | B3 | 9.125% | 10/15/15 | 1,000 | 1,020,000 | |||||||
VWR International, Inc., Sr. Sub. Notes | Caa1 | 8.00% | 04/15/14 | 1,500 | 1,492,500 | |||||||
| 2,512,500 | ||||||||||||
Manufacturing — 0.9% | ||||||||||||
Dresser, Inc., Gtd. Notes | B2 | 9.375% | 04/15/11 | 2,190 | 2,304,975 | |||||||
Legrand Holding SA, Sr. Unsec’d. Notes (France) | B1 | 10.50% | 02/15/13 | 850 | 960,500 | |||||||
| 3,265,475 | ||||||||||||
Metals & Mining — 0.7% | ||||||||||||
Novelis, Inc., Sr. Notes (Canada) | B1 | 7.25% | 02/15/15 | 1,150 | 1,072,375 | |||||||
Peabody Energy Corp., Gtd. Notes | Ba3 | 6.875% | 03/15/13 | 1,500 | 1,560,000 | |||||||
| 2,632,375 | ||||||||||||
Office Equipment — 0.7% | ||||||||||||
Xerox Capital Trust I, Gtd. Notes | Ba3 | 8.00% | 02/01/27 | 1,300 | 1,339,000 | |||||||
Xerox Corp., Sr. Notes | Ba2 | 7.625% | 06/15/13 | 1,170 | 1,234,350 | |||||||
| 2,573,350 | ||||||||||||
Oil & Gas Exploration/Production — 9.6% | ||||||||||||
Chesapeake Energy Corp., Sr. Notes | Ba3 | 6.375% | 06/15/15 | 1,125 | 1,125,000 | |||||||
Chesapeake Energy Corp., Sr. Notes | Ba2 | 6.875% | 01/15/16 | 950 | 973,750 | |||||||
Chesapeake Energy Corp., Sr. Notes | Ba3 | 7.50% | 06/15/14 | 1,150 | 1,219,000 | |||||||
Dresser-Rand Group, Inc., Sr. Sub Notes | B3 | 7.375% | 11/01/14 | 396 | 407,880 | |||||||
El Paso CGP Co. | Caa1 | 7.75% | 01/15/32 | 400 | 396,500 | |||||||
El Paso CGP Co., Notes | Caa1 | 6.375% | 02/01/09 | 1,700 | 1,666,000 | |||||||
El Paso CGP Co., Notes | Caa1 | 7.75% | 06/15/10 | 650 | 663,000 | |||||||
El Paso Corp., Notes | Caa1 | 7.625% | 09/01/08 | 2,400 | 2,436,000 | |||||||
El Paso Corp., Notes | Caa1 | 7.875% | 06/15/12 | 150 | 154,500 | |||||||
El Paso Corp., Sr. Notes | Caa1 | 7.375% | 12/15/12 | 1,750 | 1,758,750 | |||||||
El Paso Corp., Sr. Notes | Caa1 | 7.80% | 08/01/31 | 675 | 673,312 | |||||||
El Paso Corp., Sr. Notes | Caa1 | 8.05% | 10/15/30 | 1,035 | 1,055,700 | |||||||
El Paso Production Holding Co., Gtd. Notes | B3 | 7.75% | 06/01/13 | 2,835 | 2,941,312 | |||||||
Encore Acquisition Co., Sr. Sub. Notes | B2 | 6.25% | 04/15/14 | 525 | 498,750 | |||||||
Exco Resources, Inc., Gtd. Notes | B2 | 7.25% | 01/15/11 | 1,300 | 1,319,500 | |||||||
Gaz Capital For Gazprom, Notes 144A (Luxembourg) | Baa2 | 8.625% | 04/28/34 | 100 | 126,500 | |||||||
Gazprom International SA, Gtd. Notes (Luxembourg) | BBB-(d) | 7.201% | 02/01/20 | 500 | 532,750 | |||||||
Hanover Compressor Co., Sr. Notes | B3 | 9.00% | 06/01/14 | 1,200 | 1,308,000 | |||||||
Hanover Equipment Trust, Sec’d. Notes, Ser. A | B2 | 8.50% | 09/01/08 | 820 | 849,725 | |||||||
Newpark Resources, Gtd. Notes | B2 | 8.625% | 12/15/07 | 1,075 | 1,075,000 | |||||||
Roseton/Danskammer, Gtd. Notes | Caa2 | 7.27% | 11/08/10 | 3,200 | 3,224,000 | |||||||
Roseton/Danskammer, Gtd. Notes | Caa2 | 7.67% | 11/08/16 | 700 | 701,750 | |||||||
Semgroup LP, Notes | B1 | 8.75% | 11/15/15 | 450 | 460,125 | |||||||
SESI LLC, Gtd. Notes | B1 | 8.875% | 05/15/11 | 1,250 | 1,309,375 | |||||||
Sonat, Inc., Notes | Caa1 | 7.625% | 07/15/11 | 300 | 305,250 | |||||||
Transmontaigne, Inc., Sr. Sub. Notes | B3 | 9.125% | 06/01/10 | 625 | 614,063 | |||||||
Vintage Petroleum, Inc., Sr. Notes | Ba3 | 8.25% | 05/01/12 | 250 | 268,125 | |||||||
Vintage Petroleum, Inc., Sr. Sub. Notes | B1 | 7.875% | 05/15/11 | 1,135 | 1,186,075 | |||||||
Williams Cos., Inc., Notes | B1 | 7.875% | 09/01/21 | 4,600 | 4,979,500 | |||||||
Williams Cos., Inc., Notes | B1 | 8.75% | 03/15/32 | 600 | 696,000 | |||||||
SEE NOTES TO FINANCIAL STATEMENTS.
B23
| SP PIMCO HIGH YIELD PORTFOLIO (Continued) |
SCHEDULE OF INVESTMENTS | December 31, 2005 |
| CORPORATE BONDS (Continued) | Moody’s Ratings (Unaudited) | Interest Rate | Maturity Date | Principal Amount (000) | Value (Note 2) | ||||||||
Oil & Gas Exploration/Production (cont’d.) | |||||||||||||
Williams Cos., Inc., Sr. Notes | B1 | 7.125% | 09/01/11 | $ | 425 | $ | 441,469 | ||||||
Williams Cos., Inc., Sr. Notes | B1 | 7.625% | 07/15/19 | 125 | 134,063 | ||||||||
| 35,500,724 | |||||||||||||
Pharmaceuticals | |||||||||||||
AmerisourceBergen Corp., Gtd. Notes | Ba2 | 7.25% | 11/15/12 | — | (r) | 1,000 | |||||||
Printing & Publishing — 1.0% | |||||||||||||
American Media Operations, Inc., Gtd. Notes | Caa1 | 10.25% | 05/01/09 | 581 | 531,615 | ||||||||
Dex Media West LLC/Dex Media Finance Co., Sr. Notes | B1 | 8.50% | 08/15/10 | 975 | 1,021,313 | ||||||||
Dex Media West LLC/Dex Media Finance Co., Sr. Sub. Notes | B2 | 9.875% | 08/15/13 | 1,922 | 2,133,420 | ||||||||
| 3,686,348 | |||||||||||||
Real Estate Investment Trust — 0.7% | |||||||||||||
Forest City Enterprises, Inc., Sr. Notes | Ba3 | 7.625% | 06/01/15 | 1,000 | 1,060,000 | ||||||||
Ventas Realty LP/Ventas Capital Corp., Gtd. Notes | Ba3 | 8.75% | 05/01/09 | 1,450 | 1,566,000 | ||||||||
| 2,626,000 | |||||||||||||
Retail — 3.5% | |||||||||||||
Amerigas Partners LP (g) | B2 | 7.25% | 05/20/15 | 1,350 | 1,377,000 | ||||||||
Amerigas Partners LP, Sr. Notes(f)(g) | B1 | 8.83% | 04/19/10 | 125 | 129,531 | ||||||||
Ferrellgas Escrow LLC/Ferrellgas Finance Escrow Corp., Sr. Notes | Ba3 | 6.75% | 05/01/14 | 1,825 | 1,724,625 | ||||||||
Ferrellgas Partners LP/Ferrellgas Partners Finance, Sr. Notes | B2 | 8.75% | 06/15/12 | 1,400 | 1,386,000 | ||||||||
JC Penney Corp., Inc., Debs. | Ba1 | 7.125% | 11/15/23 | 1,100 | 1,224,593 | ||||||||
JC Penney Corp., Inc., Debs. | Ba1 | 7.40% | 04/01/37 | 850 | 949,632 | ||||||||
JC Penney Corp., Inc., Debs. | Ba1 | 7.65% | 08/15/16 | 330 | 375,148 | ||||||||
JC Penney Corp., Inc., Debs. | Ba1 | 8.125% | 04/01/27 | 600 | 628,500 | ||||||||
Quiksilver, Inc., Sr. Notes | B1 | 6.875% | 04/15/15 | 1,875 | 1,804,687 | ||||||||
Russell Corp., Gtd. Notes | B1 | 9.25% | 05/01/10 | 1,500 | 1,520,625 | ||||||||
Suburban Propane Partners LP/Suburban Energy Finance Corp., Sr. Notes | B1 | 6.875% | 12/15/13 | 1,825 | 1,706,375 | ||||||||
| 12,826,716 | |||||||||||||
Semi-Conductors | |||||||||||||
Amkor Technology, Inc., Sr. Notes | B1 | 7.75% | 05/15/13 | — | (r) | 743 | |||||||
Technology — 0.7% | |||||||||||||
Sungard Data Systems, Inc., Sr. Unsec’d. Notes | B3 | 9.125% | 08/15/13 | 2,050 | 2,121,750 | ||||||||
UGS Corp., Gtd. Notes | B3 | 10.00% | 06/01/12 | 275 | 299,750 | ||||||||
| 2,421,500 | |||||||||||||
Telecommunications — 11.6% | |||||||||||||
American Cellular Corp., Sr. Notes | Caa1 | 10.00% | 08/01/11 | 1,225 | 1,329,125 | ||||||||
Cincinnati Bell, Inc., Gtd. Notes | B1 | 7.25% | 07/15/13 | 2,415 | 2,511,600 | ||||||||
Cincinnati Bell, Inc., Sr. Sub. Notes | B3 | 8.375% | 01/15/14 | 1,700 | 1,672,375 | ||||||||
Citizens Communications Co., Sr. Notes | Ba3 | 6.25% | 01/15/13 | 1,270 | 1,228,725 | ||||||||
Hawaiian Telcom Communications, Inc., Sr. Notes | B3 | 9.75% | 05/01/13 | 900 | 879,750 | ||||||||
Insight Midwest Lp Insight Capital, Inc., | B2 | 9.75% | 10/01/09 | 1,800 | 1,854,000 | ||||||||
Intelsat Bermuda Ltd., Sr. Notes (Bermuda) | B2 | 8.25% | 01/15/13 | 125 | 126,250 | ||||||||
Intelsat Bermuda Ltd., Sr. Notes (Bermuda) | B2 | 8.625% | 01/15/15 | 1,800 | 1,818,000 | ||||||||
Intelsat Bermuda Ltd., Sr. Notes (Bermuda) | B2 | 8.695% | 01/15/12 | 800 | 813,000 | ||||||||
MCI, Inc., Sr. Notes | B2 | 8.735% | 05/01/14 | 6,081 | 6,727,106 | ||||||||
Mobile Telesystems Finance SA, Gtd. Notes (Luxembourg) | Ba3 | 8.00% | 01/28/12 | 350 | 357,000 | ||||||||
Mobile Telesystems Finance SA, Gtd. Notes | Ba3 | 8.375% | 10/14/10 | 500 | 521,850 | ||||||||
Northwestern Bell Telephone, Debs. | Ba3 | 7.75% | 05/01/30 | 750 | 745,313 | ||||||||
Qwest Capital Funding, Inc., Gtd. Notes | Caa2 | 7.25% | 02/15/11 | 975 | 987,188 | ||||||||
Qwest Capital Funding, Inc., Gtd. Notes | Caa2 | 7.90% | 08/15/10 | 1,250 | 1,293,750 | ||||||||
Qwest Communications International, Inc., Gtd. Notes | B3 | 7.25% | 02/15/11 | 2,000 | 2,040,000 | ||||||||
Qwest Communications International, Inc., Gtd. Notes | B3 | 7.50% | 02/15/14 | 2,730 | 2,805,075 | ||||||||
Qwest Communications International, Inc., Sr. Notes | B2 | 7.50% | 02/15/14 | 3,525 | 3,621,937 | ||||||||
Qwest Corp. | Bb | 7.50% | 06/15/23 | 500 | 496,875 | ||||||||
Qwest Corp., Debs. | Ba3 | 8.875% | 03/15/12 | 2,350 | 2,649,625 | ||||||||
SEE NOTES TO FINANCIAL STATEMENTS.
B24
| SP PIMCO HIGH YIELD PORTFOLIO (Continued) |
SCHEDULE OF INVESTMENTS | December 31, 2005 |
| CORPORATE BONDS (Continued) | Moody’s Ratings (Unaudited) | Interest Rate | Maturity Date | Principal Amount (000) | Value (Note 2) | |||||||
Telecommunications (cont’d.) | ||||||||||||
Qwest Corp., Notes | Ba3 | 6.875% | 09/15/33 | $ | 1,000 | $ | 940,000 | |||||
Rogers Wireless, Inc., Sec’d. Notes (Canada) | Ba3 | 6.375% | 03/01/14 | 650 | 651,625 | |||||||
Rogers Wireless, Inc., Sec’d. Notes 144A (Canada) | Ba3 | 7.25% | 12/15/12 | 100 | 105,125 | |||||||
Rogers Wireless, Inc., Sec’d. Notes 144A (Canada) | Ba3 | 7.50% | 03/15/15 | 805 | 869,400 | |||||||
Rogers Wireless, Inc., Sec’d. Notes 144A (Canada) | B2 | 8.00% | 12/15/12 | 780 | 825,825 | |||||||
Rural Cellular Corp., Sec’d. Notes | B2 | 8.25% | 03/15/12 | 2,225 | 2,347,375 | |||||||
Suncom Wireless, Inc., Gtd. Notes | Caa1 | 8.50% | 06/01/13 | 570 | 530,100 | |||||||
Time Warner Telecom Holdings, Inc., Gtd. Notes | B2 | 9.25% | 02/15/14 | 550 | 580,250 | |||||||
Time Warner Telecom Holdings, Inc., Secd. Notes | B1 | 8.34% | 02/15/11 | 200 | 204,500 | |||||||
Time Warner Telecom, Inc., Sr. Notes | B3 | 10.125% | 02/01/11 | 600 | 628,500 | |||||||
Wind Acquistion Finance SA (Luxembourg) | B3 | 10.75% | 12/01/15 | 600 | 619,500 | |||||||
| 42,780,744 | ||||||||||||
Tobacco — 0.7% | ||||||||||||
Alliance One International, Inc., Notes | B2 | 11.00% | 05/15/12 | 650 | 572,000 | |||||||
RJ Reynolds Tobacco Holdings, Inc., Gtd. Notes | Ba2 | 7.25% | 06/01/12 | 2,040 | 2,080,800 | |||||||
| 2,652,800 | ||||||||||||
Transportation — 0.8% | ||||||||||||
Hertz Corp. | B1 | 8.875% | 01/01/14 | 1,000 | 1,018,750 | |||||||
Horizon Lines LLC, Notes | B3 | 9.00% | 11/01/12 | 1,671 | 1,758,728 | |||||||
| 2,777,478 | ||||||||||||
Utilities — 7.3% | ||||||||||||
AES Corp, Sec’d. Notes 144A | Ba3 | 8.75% | 05/15/13 | 2,445 | 2,661,994 | |||||||
CMS Energy Corp., Sr. Notes | B1 | 2.875% | 12/01/24 | 1,500 | 1,745,625 | |||||||
CMS Energy Corp., Sr. Notes | B1 | 6.30% | 02/01/12 | 700 | 692,125 | |||||||
CMS Energy Corp., Sr. Notes | NR | 8.50% | 04/15/11 | 500 | 544,375 | |||||||
Headwaters, Inc. 144A(f)(g) | NR | 5.33% | 04/30/11 | 11 | 10,844 | |||||||
Homer City Funding LLC, Gtd. Notes | Ba2 | 8.734% | 10/01/26 | 1,484 | 1,728,802 | |||||||
IPALCO Enterprises, Inc., Sec’d. Notes | Ba1 | 8.625% | 11/14/11 | 350 | 381,500 | |||||||
Midwest Generation LLC, Pass-Through Certs. | B1 | 8.56% | 01/02/16 | 2,200 | 2,392,281 | |||||||
Midwest Generation LLC, Secd. Notes | B1 | 8.75% | 05/01/34 | 2,500 | 2,753,125 | |||||||
MSW Energy Holdings II LLC/MSW Energy Finance Co. II, Inc., Gtd. Notes | Ba3 | 7.375% | 09/01/10 | 500 | 513,750 | |||||||
NRG Energy, Inc., Gtd. Notes | B1 | 8.00% | 12/15/13 | 1,124 | 1,253,682 | |||||||
PSE&G Energy Holdings LLC, Sr. Notes | Ba3 | 8.50% | 06/15/11 | 4,475 | 4,788,250 | |||||||
Reliant Energy | B1 | 9.50% | 04/30/10 | 2 | 1,868 | |||||||
Reliant Energy Mid-Atlantic Power Holdings LLC, Pass-Through Certs. | B1 | 9.237% | 07/02/17 | 394 | 421,844 | |||||||
Reliant Energy, Inc., Sec’d. Notes | B1 | 6.75% | 12/15/14 | 2,275 | 1,984,937 | |||||||
Reliant Energy, Inc., Sec’d. Notes | B1 | 9.50% | 07/15/13 | 1,575 | 1,578,937 | |||||||
Sierra Pacific Power Co., Notes | Ba2 | 7.10% | 11/02/23 | 500 | 502,500 | |||||||
South Point Energy Center LLC/Broad River Energy LlLC/Rockgen Energy LLC, Gtd. Notes | B3 | 8.40% | 05/30/12 | 1,937 | 1,782,189 | |||||||
Tenaska Alabama Partners LP, Sec’d. Notes | B1 | 7.00% | 06/30/21 | 1,321 | 1,328,520 | |||||||
| 27,067,148 | ||||||||||||
Waste Management — 1.7% | ||||||||||||
Allied Waste North America, Inc., Gtd. Notes, Ser. B | B2 | 8.875% | 04/01/08 | 585 | 617,175 | |||||||
Allied Waste North America, Inc., Gtd. Notes, Ser. B | B2 | 9.25% | 09/01/12 | 217 | 234,903 | |||||||
Allied Waste North America, Inc., Sr. Notes | B2 | 7.875% | 04/15/13 | 1,725 | 1,781,062 | |||||||
Allied Waste North America, Inc., Sr. Notes, Ser. B | B2 | 8.50% | 12/01/08 | 685 | 719,250 | |||||||
Allied Waste North America, Sr. Notes | B2 | 7.25% | 03/15/15 | 2,850 | 2,878,500 | |||||||
| 6,230,890 | ||||||||||||
TOTAL CORPORATE BONDS | 321,893,722 | |||||||||||
| FOREIGN GOVERNMENT BONDS — 4.1% | ||||||||||||
Republic of Brazil (Brazil) | B1 | 10.50% | 07/14/14 | 2,775 | 3,400,762 | |||||||
Republic of Brazil (Brazil) | B1 | 11.00% | 08/17/40 | 500 | 644,500 | |||||||
SEE NOTES TO FINANCIAL STATEMENTS.
B25
| SP PIMCO HIGH YIELD PORTFOLIO (Continued) |
SCHEDULE OF INVESTMENTS | December 31, 2005 |
| FOREIGN GOVERNMENT BONDS (Continued) | Moody’s Ratings (Unaudited) | Interest Rate | Maturity Date | Principal Amount (000) | Value (Note 2) | ||||||
Republic of Brazil, Notes | NR | 8.00% | 01/15/18 | $ 8,704 | $ | 9,391,616 | |||||
Republic of Brazil, Notes (Brazil) | B1 | 11.00% | 01/11/12 | 25 | 30,500 | ||||||
Republic of Guatemala (Guatemala) | Ba2 | 9.25% | 08/01/13 | 500 | 581,250 | ||||||
Republic of Panama (Panama) | Ba1 | 8.875% | 09/30/27 | 1,100 | 1,309,000 | ||||||
TOTAL FOREIGN GOVERNMENT BONDS | 15,357,628 | ||||||||||
| PREFERRED STOCKS — 0.1% | Shares | ||||||||||
Oil & Gas Exploration/Production | |||||||||||
Chesapeake Energy Corp. (cost $399,676) | 4,000 | 386,040 | |||||||||
TOTAL LONG-TERM INVESTMENTS | 337,645,896 | ||||||||||
| SHORT-TERM INVESTMENTS — 7.1% | Principal Amount (000) | ||||||||||
COMMERCIAL PAPER — 4.9% | |||||||||||
Barclays US Funding | 4.305% | 02/28/06 | $ 6,300 | 6,257,468 | |||||||
CBA Finance | 4.26% | 02/21/06 | 3,600 | 3,578,734 | |||||||
DNB Nor Bank ASA | 4.23% | 02/16/06 | 600 | 596,915 | |||||||
HBOS Treasury Services | 4.36% | 03/07/06 | 500 | 496,196 | |||||||
Societe Generale N.A. | 4.34% | 03/06/06 | 800 | 794,013 | |||||||
Societe Generale N.A. | 4.43% | 04/20/06 | 4,400 | 4,341,882 | |||||||
Westpac Banking Corp. | 4.315% | 03/01/06 | 900 | 893,824 | |||||||
Westpac Banking Corp. | 4.33% | 02/21/06 | 1,000 | 994,093 | |||||||
TOTAL COMMERCIAL PAPER | 17,953,125 | ||||||||||
BANK NOTES — 1.8% | |||||||||||
Brenntag | Zero | 02/28/12 | 600 | 600,800 | |||||||
General Growth Properties | Zero | 11/12/08-11/12/08 | 1,071 | 1,077,025 | |||||||
Goodyear Tire + Rubber Co. | Zero | 04/01/10 | 1,500 | 1,509,644 | |||||||
Headwaters, Inc. | Zero | 04/30/11 | 702 | 705,902 | |||||||
Invensys Second Lien | Zero | 12/30/09 | 500 | 512,500 | |||||||
Reliant Energy | Zero | 04/30/10 | 685 | 682,458 | |||||||
UPC Financing | Zero | 09/15/12 | 1,500 | 1,512,321 | |||||||
TOTAL BANK NOTES | 6,600,650 | ||||||||||
| MONEY MARKET MUTUAL FUND — 0.3% | Shares | ||||||||||
Dryden Core Investment Fund — Taxable Money | 1,039,453 | 1,039,453 | |||||||||
| U.S. TREASURY OBLIGATIONS(h) — 0.1% | Principal Amount (000) | ||||||||||
U.S. Treasury Bills | 3.83% | 03/16/06 | $ 210 | 208,357 | |||||||
U.S. Treasury Bills | 3.855% | 03/16/06 | 15 | 14,883 | |||||||
U.S. Treasury Bills | 3.871% | 03/16/06 | 10 | 9,922 | |||||||
U.S. Treasury Bills | 3.895% | 03/02/06 | 100 | 99,377 | |||||||
TOTAL U.S. TREASURY OBLIGATIONS | 332,539 | ||||||||||
TOTAL SHORT-TERM INVESTMENTS | 25,925,767 | ||||||||||
TOTAL INVESTMENTS, BEFORE OUTSTANDING OPTIONS WRITTEN — 98.6% | 363,571,663 | ||||||||||
SEE NOTES TO FINANCIAL STATEMENTS.
B26
| SP PIMCO HIGH YIELD PORTFOLIO (Continued) |
SCHEDULE OF INVESTMENTS | December 31, 2005 |
| SHORT-TERM INVESTMENTS (Continued) | Contracts | Value (Note 2) | ||||||||||
| OUTSTANDING OPTIONS WRITTEN | ||||||||||||
Put Options | ||||||||||||
United States Treasury 10 Yr. Notes, expiring 02/24/06 @$105.0 | 38 | $ | (2,000 | ) | ||||||||
United States Treasury 10 Yr. Notes, expiring 02/24/06 @$106.0 | 210 | (16,406 | ) | |||||||||
| (18,406 | ) | |||||||||||
Call Options | ||||||||||||
United States Treasury 10 Yr. Notes, expiring 02/24/06 @$110.0 | 110 | (60,156 | ) | |||||||||
United States Treasury 10 Yr. Notes, expiring 02/24/06 @$111.0 | 138 | (34,500 | ) | |||||||||
United States Treasury 10 Yr. Notes, expiring 02/24/06 @$112.0 | 130 | (14,219 | ) | |||||||||
| (108,875 | ) | |||||||||||
TOTAL OUTSTANDING OPTIONS WRITTEN | (127,281 | ) | ||||||||||
TOTAL INVESTMENTS, NET OF OUTSTANDING OPTIONS WRITTEN — 98.6% | 363,444,382 | |||||||||||
OTHER ASSETS IN EXCESS OF LIABILITIES(j) — 1.4% | 5,163,413 | |||||||||||
NET ASSETS — 100.0% | $ | 368,607,795 | ||||||||||
The following abbreviations are used in portfolio descriptions:
| 144A | Security was purchased pursuant to Rule 144A under the securities Act of 1933 and may not be resold subject to that rule except to qualified institutional buyers. Unless otherwise noted 144A securities are deemed to be liquid. | |
| NR | Not Rated by Moodys or Standard & Poor’s | |
| EUR | Euro |
| (d) | Standard & Poor’s rating. |
| (f) | Loan Participation Agreement. |
| (g) | Indicates a security that has been deemed illiquid. |
| (h) | Security segregated as collateral for futures contracts. |
| (i) | Represents issuer in default on interest payments. Non-income producing security. |
| (j) | Other assets in excess of liabilities include net unrealized appreciation (depreciation) on forward foreign currency exchange contracts, financial futures and interest rate/credit default swap agreements. |
| (r) | Less than 1,000 par. |
| (w) | Prudential Investments LLC, the manager of the Fund also serves as manager of the Dryden Core Investment Fund-Taxable Money Market Series. |
Forward foreign currency exchange contracts outstanding at December 31, 2005:
Sale Contracts
| Settlement Month | Type | Contracts to Deliver | In Exchange For | Contracts at Value | Unrealized Depreciation | |||||||||
| Jan 06 | Sell | EUR 5,404,000 | $ | 6,385,808 | $ | 6,403,409 | $ | (17,601 | ) | |||||
Open futures contracts at December 31, 2005:
| Number of Contracts | Type | Expiration Month | Value at Trade Date | Value at December 31, 2005 | Unrealized (Depreciation) | |||||||||
| Long Positions: | ||||||||||||||
| 9 | Euro Dollar | Dec 06 | $ | 2,143,013 | $ | 2,142,113 | $ | (900 | ) | |||||
| 66 | Euro Dollar | Sep 06 | 15,703,050 | 15,701,400 | (1,650 | ) | ||||||||
| $ | (2,550 | ) | ||||||||||||
Interest rate/credit default swap agreements outstanding at December 31, 2005:
| Counterparty | Termination Date | Notional Amount | Fixed Rate | Floating Rate | Unrealized Appreciation | ||||||||
| Barclays Bank, PLC(1) | 06/21/11 | $ | 21,600,000 | 5.00 | % | 3 month LIBOR | $ | 92,485 | |||||
SEE NOTES TO FINANCIAL STATEMENTS.
B27
| SP PIMCO HIGH YIELD PORTFOLIO (Continued) |
SCHEDULE OF INVESTMENTS | December 31, 2005 |
| Counterparty | Termination Date | Notional Amount | Fixed Rate | Underlying Bond | Unrealized Appreciation (Depreciation) | ||||||||
| Merrill Lynch International(2) | 06/20/06 | 1,900,000 | 3.50 | % | General Motors Acceptance Corp., 6.875%, due 08/28/12 | $ | (17,214 | ) | |||||
| JPMorgan Chase Bank, N.A,(2) | 06/20/07 | 2,000,000 | 3.40 | % | Ford Motor Credit Co., 7.00%, due 10/01/13 | (49,802 | ) | ||||||
| UBS AG(2) | 09/20/06 | 1,000,000 | 5.05 | % | General Motors Acceptance Corp., 6.875%, due 08/28/12 | (3,005 | ) | ||||||
| JPMorgan Chase Bank, N.A,(2) | 09/20/07 | 1,000,000 | 2.20 | % | Ford Motor Credit Co., 7.00%, due 10/01/13 | (49,013 | ) | ||||||
| Morgan Stanley Capital Services, Inc.(2) | 09/20/07 | 500,000 | 2.45 | % | Bombardier, Inc., 6.75%, due 5/01/12 | (3,241 | ) | ||||||
| Lehman Brothers(2) | 06/20/06 | 900,000 | 1.75 | % | ABITIBI SP, 8.55%, due 08/01/10 | 688 | |||||||
| First Boston(2) | 04/20/06 | 2,000,000 | 0.72 | % | SC GAZ Prom, 9.125%, due 4/25/07; 10.50%, due 10/21/09; 7.80%, due 9/27/10; 9.625%, due 3/1/13; 5.875%, due 6/1/15; and 8.625%, due 4/28/34 | 1,628 | |||||||
| Goldman Sachs(2) | 03/20/06 | 500,000 | 6.00 | % | General Motors Acceptance Corp., 6.875%, due 08/28/12 | 1,072 | |||||||
| $ | (118,887 | ) | |||||||||||
| (1) | Porfolio pays the floating rate and receives the fixed rate. |
| (2) | Portfolio receives the fixed rate and pays the counterparty the notional amount in the event that the underlying bond defaults. |
SEE NOTES TO FINANCIAL STATEMENTS.
B28
| SP PIMCO HIGH YIELD PORTFOLIO (Continued) |
SCHEDULE OF INVESTMENTS | December 31, 2005 |
The industry classification of long-term portfolio holdings, short-term investments and other assets in excess of liabilities shown as a percentage of net assets as of December 31, 2005 as follows:
Telecommunications | 11.6 | % | |
Financials | 10.1 | ||
Oil & Gas Exploration/Production | 9.6 | ||
Hospitals/Hospital Management | 7.4 | ||
Utilities | 7.3 | ||
Cable | 4.8 | ||
Foreign Government Bonds | 4.1 | ||
Gaming | 3.9 | ||
Retail | 3.5 | ||
Containers | 3.0 | ||
Chemicals | 2.9 | ||
Forest & Paper | 2.9 | ||
Autos – Cars & Trucks | 2.8 | ||
Aerospace & Defense | 1.7 | ||
Waste Management | 1.7 | ||
Food & Beverage | 1.4 | ||
Entertainment | 1.1 | ||
Broadcasting & Other Media | 1.0 | ||
Distribution/Wholesale | 1.0 | ||
Diversified Operations | 1.0 | ||
Printing & Publishing | 1.0 | ||
Lodging | 0.9 | ||
Manufacturing | 0.9 | ||
Transportation | 0.8 | ||
Commercial Services | 0.7 | ||
Machinery & Equipment | 0.7 | ||
Metals & Mining | 0.7 | ||
Office Equipment | 0.7 | ||
Real Estate Investment Trust | 0.7 | ||
Technology | 0.7 | ||
Tobacco | 0.7 | ||
Advertising | 0.1 | ||
Preferred Stocks | 0.1 | ||
Short-Term Investments | 7.1 | ||
| 98.6 | |||
Other assets in excess of liabilities | 1.4 | ||
Total | 100.0 | % | |
SEE NOTES TO FINANCIAL STATEMENTS.
B29
| SP PIMCO TOTAL RETURN PORTFOLIO |
SCHEDULE OF INVESTMENTS | December 31, 2005 |
| LONG-TERM INVESTMENTS — 97.3% | Moody’s Ratings (Unaudited) | Interest Rate | Maturity Date | Principal Amount (000) | Value (Note 2) | |||||||
COLLATERALIZED MORTGAGE OBLIGATIONS — 4.9% | ||||||||||||
Argent Securities Inc., Series 2005-W3, Class A2A | NR | 4.479% | 11/25/35 | $ | 6,757 | $ | 6,757,731 | |||||
Banc of America Mortgage Securities, Series 2004-2, Class 5A1 | Aaa | 6.50% | 10/25/31 | 341 | 348,581 | |||||||
Bear Stearns Adjustable Rate Mortgage Trust, Series 2002-05, Class 6 A(j) | Aaa | 5.943% | 06/25/32 | 322 | 320,699 | |||||||
Bear Stearns Adjustable Rate Mortgage Trust, Series 2002-11, Class 1A1(j) | Aaa | 5.627% | 02/25/33 | 573 | 572,978 | |||||||
Bear Stearns Alt-A Trust, Series 2005-4, Class 23A2 | Aaa | 5.426% | 05/25/35 | 5,209 | 5,198,969 | |||||||
Brazos Student Finance Corp., Series 1998-A, Class A2 | Aaa | 4.93% | 06/01/23 | 122 | 123,174 | |||||||
Commercial Mortgage Pass Through Certificates, Series 2005-F10A, Class MOA1 | Aaa | 4.30% | 03/15/20 | 12,400 | 12,398,404 | |||||||
Conseco Finance Securitizations Corp., Series 2001-4, Class A3 | Ba1 | 6.09% | 09/01/33 | 3,909 | 3,919,889 | |||||||
Federal National Mortgage Assoc., Series 2001-29, Class Z | Aaa | 6.50% | 07/25/31 | 392 | 401,505 | |||||||
First Nationwide Trust, Series 2001-4, Class 3A10 | NR | 8.50% | 09/25/31 | 4 | 4,243 | |||||||
Fremont Home Loan Trust, Series 2005-E, Class 2A1 | NR | 4.46% | 01/25/36 | 15,300 | 15,323,977 | |||||||
Government Lease Trust, Series 1999-C1A, Class B2 144A | Aaa | 4.00% | 05/18/11 | 1,500 | 1,447,386 | |||||||
Government National Mortgage Assoc., Series 2000-14, Class F | Aaa | 5.02% | 02/16/30 | 30 | 30,791 | |||||||
Government National Mortgage Assoc., Series 2005-AR6, Class 2A1 | Aaa | 4.541% | 10/25/35 | 7,362 | 7,241,424 | |||||||
Homeside Mortgage Securities Trust, Series 2001-1, Class A (Australia) | Aaa | 4.364% | 01/20/27 | 59 | 57,767 | |||||||
Indymac ARM Trust, Series 2001-H2, Class A1 | Aaa | 5.07% | 01/25/32 | 17 | 16,939 | |||||||
Master Asset Securitization Trust, Series 2003-7, Class 1A2 | NR | 5.50% | 09/25/33 | 2,900 | 2,858,527 | |||||||
Mellon Residential Funding Corp., Series 1999-TBC2, Class A3 | NR | 4.286% | 07/25/29 | 44 | 44,557 | |||||||
Quest Trust, Series 2004-X2, Class A1 | Aaa | 4.751% | 06/25/34 | 1,293 | 1,295,297 | |||||||
Residential Funding Mortgage Securities I, Series 2003-S9, Class A1 | Aaa | 6.50% | 03/25/32 | 791 | 802,182 | |||||||
Washington Mutual, Inc. Series 2003-AR1, Class 2A | Aaa | 5.38% | 02/25/33 | 235 | 233,465 | |||||||
Washington Mutual, Inc., Series 2002-AR2, Class A | Aaa | 4.12% | 02/27/34 | 1,402 | 1,395,988 | |||||||
Washington Mutual, Inc., Series 2003-R1, Class A1 | Aaa | 4.461% | 12/25/27 | 15,059 | 15,047,599 | |||||||
TOTAL COLLATERALIZED MORTGAGE OBLIGATIONS | 75,842,072 | |||||||||||
CORPORATE BONDS — 12.5% | ||||||||||||
Airlines | ||||||||||||
United Air Lines, Inc., Pass Thru Certificates Series A-4(i) | NR | 9.21% | 01/21/17 | 136 | 96,019 | |||||||
Automobile Manufacturers — 1.8% | ||||||||||||
DaimlerChrysler NA Holding Corp., Gtd. Notes(j) | A3 | 4.70% | 03/07/07 | 11,300 | 11,288,452 | |||||||
DaimlerChrysler NA Holding Corp., Gtd. Notes | A3 | 6.40% | 05/15/06 | 6,100 | 6,130,250 | |||||||
DaimlerChrysler NA Holding Corp., M.T.N.(j) | A3 | 5.30% | 08/08/06 | 1,700 | 1,707,330 | |||||||
Ford Motor Co., Notes | Ba3 | 7.45% | 07/16/31 | 8,400 | 5,712,000 | |||||||
General Motors Corp., Debs. | B1 | 8.375% | 07/15/33 | 4,850 | 3,201,000 | |||||||
| 28,039,032 | ||||||||||||
Diversified — 1.0% | ||||||||||||
General Electric Co., Unsec`d. Notes | Aaa | 4.50% | 12/09/08 | 15,232 | 15,222,846 | |||||||
Diversified Financial Services — 0.5% | ||||||||||||
Oasis CBO, Ltd., Sr. Notes | Aa1 | 4.955% | 05/30/11 | 2,939 | 2,920,070 | |||||||
Preferred Term Securities Ltd., Sr. Notes | NR | 4.886% | 12/23/31 | 4,000 | 4,025,000 | |||||||
| 6,945,070 | ||||||||||||
Electronic Components — 0.4% | ||||||||||||
PPL Capital Funding Trust I, Gtd. Notes | Ba1 | 7.29% | 05/18/06 | 4,400 | 4,426,708 | |||||||
TXU Energy Co. LLC, Sr. Notes(j) | Baa2 | 5.40% | 01/17/06 | 1,100 | 1,099,955 | |||||||
| 5,526,663 | ||||||||||||
Entertainment & Leisure — 0.5% | ||||||||||||
Harrah’s Operating Co., Inc., 144A | Baa3 | 5.625% | 06/01/15 | 8,000 | 7,859,376 | |||||||
Environmental Services — 0.2% | ||||||||||||
Waste Management, Inc., Notes | Baa3 | 7.00% | 10/15/06 | 2,775 | 2,813,140 | |||||||
Financial – Bank & Trust — 3.2% | ||||||||||||
Goldman Sachs Group, Inc., Notes | Aa3 | 4.59% | 12/22/08 | 15,300 | 15,295,410 | |||||||
SEE NOTES TO FINANCIAL STATEMENTS.
B30
| SP PIMCO TOTAL RETURN PORTFOLIO (Continued) |
SCHEDULE OF INVESTMENTS | December 31, 2005 |
| CORPORATE BONDS (Continued) | Moody’s Ratings (Unaudited) | Interest Rate | Maturity Date | Principal Amount (000) | Value (Note 2) | |||||||
HSBC Bank USA NA, Sr. Notes (j) | Aa2 | 4.57% | 09/21/07 | $ | 4,300 | $ | 4,307,288 | |||||
Resona Bank Ltd., Notes | Baa1 | 5.85% | 09/29/49 | 5,900 | 5,875,067 | |||||||
Royal Bank of Scotland Group PLC, Sr. Notes (United Kingdom) (j) | Aa2 | 4.497% | 12/21/07 | 23,000 | 22,995,078 | |||||||
| 48,472,843 | ||||||||||||
Financial Services — 3.2% | ||||||||||||
European Investment Bank, Notes (Japan) | Aaa | 3.00% | 09/20/06 | JPY | 106,000 | 917,092 | ||||||
Ford Motor Credit Co., Notes | Ba2 | 5.70% | 01/15/10 | 1,300 | 1,105,082 | |||||||
Ford Motor Credit Co., Notes | Ba2 | 6.875% | 02/01/06 | 2,000 | 1,995,700 | |||||||
General Electric Capital Corp., Sr. Unsub. Notes (Japan) | Aaa | 1.40% | 11/02/06 | JPY | 469,000 | 4,019,545 | ||||||
General Motors Acceptance Corp., Notes | Ba1 | 6.875% | 09/15/11 | 2,500 | 2,279,862 | |||||||
Morgan Stanley Warehouse Facility144A (Cost $29,800,000, purchased 6/28/04)(g) | NR | 3.855% | 08/03/06 | 29,800 | 29,800,000 | |||||||
Pemex Project Funding Master Trust, Gtd. Notes | Baa1 | 7.375% | 12/15/14 | 300 | 333,300 | |||||||
Pemex Project Funding Master Trust, Gtd. Notes | Baa1 | 8.625% | 02/01/22 | 500 | 616,250 | |||||||
Pemex Project Funding Master Trust, Gtd. Notes | Baa1 | 9.125% | 10/13/10 | 2,000 | 2,302,000 | |||||||
Pemex Project Funding Master Trust, Gtd. Notes 144A | Baa1 | 9.75% | 03/30/18 | 1,700 | 2,160,700 | |||||||
Petroleum Export Ltd., Sr. Notes | Baa1 | 5.265% | 06/15/11 | 2,500 | 2,476,275 | |||||||
Simsbury CLO Ltd., Sec’d. Notes 144A(j) | Aaa | 4.69% | 09/24/11 | 1,849 | 1,838,392 | |||||||
| 49,844,198 | ||||||||||||
Oil, Gas & Consumable Fuels — 0.2% | ||||||||||||
El Paso Corp. | Caa1 | 7.00% | 05/15/11 | 200 | 198,500 | |||||||
El Paso Corp., M.T.N. | Caa1 | 7.75% | 01/15/32 | 2,240 | 2,245,600 | |||||||
El Paso Corp., M.T.N. | Caa1 | 7.80% | 08/01/31 | 1,250 | 1,246,875 | |||||||
| 3,690,975 | ||||||||||||
Paper & Forest Products — 0.2% | ||||||||||||
Georgia-Pacific Corp., Notes | B2 | 7.75% | 11/15/29 | 3,000 | 2,737,500 | |||||||
Telecommunications — 1.3% | ||||||||||||
BellSouth Corp. | A2 | 4.258% | 04/26/21 | 6,100 | 6,092,692 | |||||||
MCI, Inc., Sr. Notes | Ba3 | 8.735% | 05/01/14 | 4,700 | 5,199,375 | |||||||
Qwest Corp., Notes 144A | Ba3 | 8.875% | 03/15/12 | 1,650 | 1,860,375 | |||||||
Qwest Corp., Sr. Notes | Ba3 | 7.625% | 06/15/15 | 7,000 | 7,490,000 | |||||||
| 20,642,442 | ||||||||||||
TOTAL CORPORATE BONDS | 191,890,104 | |||||||||||
FOREIGN GOVERNMENT BONDS — 3.3% | ||||||||||||
Federal Republic of Brazil (Brazil) | B1 | 4.25% | 04/15/06 | 280 | 279,835 | |||||||
Federal Republic of Brazil (Brazil) | B1 | 4.313% | 04/15/09 | 144 | 143,208 | |||||||
Federal Republic of Brazil (Brazil) | B1 | 11.00% | 08/17/40 | 6,300 | 8,120,700 | |||||||
Federal Republic of France (France) | Aaa | 4.00% | 12/31/49 | EUR | 1,400 | 1,805,131 | ||||||
Federal Republic of Germany (Germany) | Aaa | 5.625% | 01/04/28 | EUR | 1,500 | 2,322,362 | ||||||
Federal Republic of Italy (Italy) | Aa2 | 0.375% | 10/10/06 | JPY | 100,000 | 850,000 | ||||||
Federal Republic of Panama (Panama) | Ba1 | 8.25% | 04/22/08 | 1,500 | 1,590,000 | |||||||
Federal Republic of Panama (Panama) | Ba1 | 8.875% | 09/30/27 | 750 | 892,500 | |||||||
Federal Republic of Peru (Peru) | Ba3 | 9.125% | 01/15/08 | 400 | 430,000 | |||||||
Federal Republic of Peru (Peru) | Ba3 | 9.875% | 02/06/15 | 2,500 | 3,000,000 | |||||||
Russian Federation (Russia) | Baa3 | 5.00% | 03/31/30 | 10,750 | 12,135,675 | |||||||
United Kingdom Treasury Stock (United Kingdom) | Aaa | 4.75% | 06/07/10 | GBP | 8,800 | 15,494,301 | ||||||
United Kingdom Treasury Stock (United Kingdom) | Aaa | 5.75% | 12/07/09 | GBP | 1,700 | 3,088,622 | ||||||
TOTAL FOREIGN GOVERNMENT BONDS | 50,152,334 | |||||||||||
MUNICIPAL BONDS — 1.8% | ||||||||||||
City & County of Honolulu HI, Series 1115 | NR | 6.22% | 07/01/23 | 1,538 | 1,705,118 | |||||||
City of Chicago IL | Aaa | 5.00% | 01/01/15 | 300 | 317,199 | |||||||
Clark Cnty. Nev. Bond Bank, G.O., MBIA | Aaa | 5.00% | 06/01/32 | 3,000 | 3,095,430 | |||||||
Dallas Independent School District, Series 1073 | NR | 6.22% | 02/15/21 | 1,000 | 1,102,060 | |||||||
SEE NOTES TO FINANCIAL STATEMENTS.
B31
| SP PIMCO TOTAL RETURN PORTFOLIO (Continued) |
SCHEDULE OF INVESTMENTS | December 31, 2005 |
| MUNICIPAL BONDS (Continued) | Moody’s Ratings (Unaudited) | Interest Rate | Maturity Date | Principal Amount (000) | Value (Note 2) | |||||||
Georgia State Road & Tollway Authority | Aaa | 5.00% | 03/01/21 | $ | 700 | $ | 739,858 | |||||
Golden State Tobacco Securitization Corp., Series A1 | Baa3 | 6.25% | 06/01/33 | 2,500 | 2,722,300 | |||||||
Golden State Tobacco Securitization Corp., Series A1 | Baa3 | 6.75% | 06/01/39 | 2,000 | 2,247,560 | |||||||
Massachusetts Water Resources Authority, Series 1080 | Aaa | 6.22% | 08/01/32 | 1,250 | 1,331,975 | |||||||
New Jersey Economic Development Authority | NR | 5.00% | 09/01/14 | 2,890 | 3,148,424 | |||||||
North East Independent School District | Aaa | 5.00% | 08/01/29 | 1,000 | 1,041,030 | |||||||
Pierce County School District No. 3 | Aaa | 6.22% | 12/01/23 | 1,500 | 1,651,260 | |||||||
Salt River Project Agricultural Improvement & Power District | NR | 5.72% | 01/01/32 | 1,000 | 1,024,960 | |||||||
State of South Carolina, Series 1078 | NR | 6.22% | 04/01/17 | 1,000 | 1,130,040 | |||||||
Tobacco Settlement Financing Authority, Series 1029 | NR | 7.14% | 06/01/15 | 1,000 | 1,151,380 | |||||||
Tobacco Settlement Financing Corp. | Baa3 | 6.125% | 06/01/32 | 1,205 | 1,255,116 | |||||||
Tobacco Settlement Financing Corp. | Baa3 | 6.25% | 06/01/42 | 400 | 419,984 | |||||||
Tobacco Settlement Financing Corp. | Baa3 | 6.375% | 06/01/32 | 2,000 | 2,198,520 | |||||||
Triborough Bridge & Tunnel Authority | Aa2 | 5.00% | 11/15/32 | 1,860 | 1,924,374 | |||||||
TOTAL MUNICIPAL BONDS | 28,206,588 | |||||||||||
U.S. GOVERNMENT MORTGAGE BACKED OBLIGATIONS — 62.0% | ||||||||||||
Federal Home Loan Mortgage Corp. | 4.00% | 09/01/18 | 839 | 803,039 | ||||||||
Federal Home Loan Mortgage Corp. | 5.00% | TBA | 60,700 | 58,746,188 | ||||||||
Federal Home Loan Mortgage Corp. | 5.50% | 01/12/36 | 25,000 | 24,765,625 | ||||||||
Federal National Mortgage Assoc. | Zero | 01/12/36 | 310,200 | 307,098,000 | ||||||||
Federal National Mortgage Assoc. | 4.00% | 07/01/18-07/01/20 | 95,777 | 91,564,113 | ||||||||
Federal National Mortgage Assoc. | 4.487% | 05/01/36 | 121 | 121,652 | ||||||||
Federal National Mortgage Assoc. | 4.50% | 08/01/33-01/12/36 | 48,837 | 46,003,977 | ||||||||
Federal National Mortgage Assoc. | 5.00% | 12/01/18-01/12/36 | 48,152 | 46,662,748 | ||||||||
Federal National Mortgage Assoc. | 5.275% | 12/01/36 | 2,754 | 2,763,267 | ||||||||
Federal National Mortgage Assoc. | 5.50% | 09/01/32-09/01/35 | 374,119 | 370,862,068 | ||||||||
Federal National Mortgage Assoc. | 6.00% | 04/01/16-04/01/35 | 3,296 | 3,356,610 | ||||||||
Government National Mortgage Assoc. | 4.375% | 04/20/25-05/20/25 | 76 | 76,257 | ||||||||
Government National Mortgage Assoc. | 4.50% | 09/15/33 | 51 | 48,850 | ||||||||
Government National Mortgage Assoc. | 4.75% | 08/20/24-08/20/27 | 233 | 235,349 | ||||||||
Government National Mortgage Assoc. | 9.00% | 07/15/30-10/15/30 | 3 | 4,286 | ||||||||
TOTAL U.S. GOVERNMENT MORTGAGE BACKED OBLIGATIONS | 953,112,029 | |||||||||||
U.S. TREASURY OBLIGATIONS — 12.8% | ||||||||||||
U.S. Treasury Inflationary Bonds, TIPS | 1.625% | 01/15/15 | 1,300 | 1,306,221 | ||||||||
U.S. Treasury Notes | 3.375% | 02/15/08 | 660 | 646,413 | ||||||||
U.S. Treasury Notes | 3.50% | 02/15/10 | 51,500 | 49,814,199 | ||||||||
U.S. Treasury Notes | 3.625% | 01/15/10 | 5,200 | 5,057,405 | ||||||||
U.S. Treasury Notes | 3.75% | 05/15/08 | 7,900 | 7,787,670 | ||||||||
U.S. Treasury Notes | 3.875% | 05/15/10 | 7,500 | 7,357,912 | ||||||||
U.S. Treasury Notes | 4.00% | 04/15/10 | 13,300 | 13,106,738 | ||||||||
U.S. Treasury Notes | 4.25% | 11/15/14 | 20,300 | 20,063,688 | ||||||||
U.S. Treasury Notes | 6.50% | 11/15/26 | 22,500 | 28,117,980 | ||||||||
U.S. Treasury Notes | 6.625% | 02/15/27 | 5,500 | 6,977,696 | ||||||||
U.S. Treasury Notes | 8.125% | 08/15/19 | 22,100 | 29,981,766 | ||||||||
U.S. Treasury Notes | 8.875% | 08/15/17-02/15/19 | 14,500 | 20,454,097 | ||||||||
U.S. Treasury Strips | Zero | 02/15/15-02/15/22 | 12,950 | 6,661,237 | ||||||||
TOTAL U.S. TREASURY OBLIGATIONS | 197,333,022 | |||||||||||
| WARRANTS (e) | Expiration Date | Shares | ||||||||||
United Mexico State, Series D (Mexico) | 6/30/06 | 1,000 | 20,550 | |||||||||
United Mexico State, Series E (Mexico) | 6/01/07 | 1,000 | 26,250 | |||||||||
TOTAL RIGHTS | 46,800 | |||||||||||
TOTAL LONG-TERM INVESTMENTS | 1,496,582,949 | |||||||||||
SEE NOTES TO FINANCIAL STATEMENTS.
B32
| SP PIMCO TOTAL RETURN PORTFOLIO (Continued) |
SCHEDULE OF INVESTMENTS | December 31, 2005 |
| SHORT-TERM INVESTMENTS — 33.8% | Interest Rate | Maturity Date | Principal Amount (000) | Value (Note 2) | ||||||
COMMERCIAL PAPER — 18.2% | ||||||||||
CBA de Finance | 4.26% | 01/09/06 | $ | 36,900 | $ | 36,865,068 | ||||
Danske Corp. | 4.15% | 02/27/06 | 12,700 | 12,615,598 | ||||||
Danske Corp. | 4.27% | 01/03/06 | 33,300 | 33,292,101 | ||||||
HBOS Treasury Services | 4.165% | 02/03/06 | 20,700 | 20,626,515 | ||||||
Rabobank USA | 4.29% | 01/03/06 | 23,400 | 23,394,423 | ||||||
Skandi Ensk Bank | 4.07% | 01/19/06 | 6,500 | 6,488,332 | ||||||
Skandi Ensk Bank | 4.17% | 02/03/06 | 8,300 | 8,270,328 | ||||||
Societe Generale N.A. | 4.035% | 02/06/06 | 4,500 | 4,481,725 | ||||||
Societe Generale N.A. | 4.31% | 01/03/06 | 41,800 | 41,789,991 | ||||||
UBS Finance, Inc. | 3.975% | 01/30/06 | 300 | 299,050 | ||||||
UBS Finance, Inc. | 4.29% | 01/03/06 | 42,200 | 42,189,942 | ||||||
UBS Finance, Inc. | 4.30% | 01/03/06 | 3,800 | 3,799,092 | ||||||
Westpac Bank | 4.19% | 02/07/06 | 6,500 | 6,472,700 | ||||||
Westpac Bank | 4.31% | 02/28/06 | 39,200 | 38,935,354 | ||||||
TOTAL COMMERCIAL PAPER | 279,520,219 | |||||||||
FOREIGN TREASURY OBLIGATIONS — 12.1% | ||||||||||
Dutch Treasury Certificate | Zero | 01/31/06 | EUR 67,280 | 79,513,813 | ||||||
Dutch Treasury Certificate | Zero | 02/28/06 | EUR 7,730 | 9,119,464 | ||||||
France Discount T Bill Government | Zero | 02/09/06 | EUR 53,580 | 63,280,817 | ||||||
France Discount T Bill Government | Zero | 01/26/06 | EUR 29,630 | 35,026,170 | ||||||
TOTAL FOREIGN TREASURY OBLIGATIONS | 186,940,264 | |||||||||
REPURCHASE AGREEMENTS — 1.3% | ||||||||||
U.S. Treasury Repurchase Agreement, repurchase price $ 2,101,015, due 1/3/06. (The value of the collateral including accrued interest was $2,142,001. The collateral consists of U.S. Federal Agency Obligations.) | 3.25% | 01/03/06 | 20,000 | 20,000,000 | ||||||
U.S. GOVERNMENT AGENCY OBLIGATIONS — 1.3% | ||||||||||
Federal Home Loan Banks | 3.40% | 01/03/06 | 19,900 | 19,896,241 | ||||||
| MONEY MARKET MUTUAL FUND — 0.4% | Shares | |||||||||
Dryden Core Investment Fund — | 5,960,264 | 5,960,264 | ||||||||
| U.S. TREASURY OBLIGATIONS — 0.3% | Interest Rate | Maturity Date | Principal Amount (000) | |||||||
U.S. Treasury Bills | 3.825% | 03/16/06 | $ | 3,800 | 3,770,280 | |||||
U.S. Treasury Bills(h) | 3.895% | 03/02/06 | 500 | 496,886 | ||||||
TOTAL U.S. TREASURY OBLIGATIONS | 4,267,166 | |||||||||
| OUTSTANDING OPTIONS PURCHASED* — 0.2% | Contracts/ Notional Amount | |||||||||
Call Options — 0.2% | ||||||||||
Swap Option on 3 Month LIBOR, expiring 04/27/09 @ 5.75% | 9,800,000 | 1,271,697 | ||||||||
Swap Option on 3 Month LIBOR, expiring 05/02/08 @ 5.75% | 7,800,000 | 980,718 | ||||||||
Swap Option on 3 Month LIBOR, expiring 10/12/06 @ 4.25% | 41,500,000 | 59,345 | ||||||||
Swap Option on 3 Month LIBOR, expiring 10/18/06 @ 4.50% | 90,100,000 | 249,757 | ||||||||
Eurodollar Futures, expiring 06/19/06 @ $95.25 | 681 | 170,250 | ||||||||
Eurodollar Futures, expiring 03/13/06 @ $95.25 | 636 | 91,425 | ||||||||
Swap Option on 3 Month LIBOR, expiring 10/11/06 @4.25% | 44,100,000 | 62,666 | ||||||||
Swap Option on 3 Month LIBOR, expiring 10/25/06 @ 4.25% | 54,100,000 | 83,476 | ||||||||
SEE NOTES TO FINANCIAL STATEMENTS.
B33
| SP PIMCO TOTAL RETURN PORTFOLIO (Continued) |
SCHEDULE OF INVESTMENTS | December 31, 2005 |
| OUTSTANDING OPTIONS PURCHASED (Continued) | Contracts/ Notional Amount | Value (Note 2) | |||||||||||
Swap Option on 3 Month LIBOR, expiring 02/01/06 @ 4.70% | 57,900,000 | $ | 4,864 | ||||||||||
Swap Option on 3 Month LIBOR, expiring 08/08/06 @ 4.75% | 18,200,000 | 67,722 | |||||||||||
Swap Option on 3 Month LIBOR, expiring 05/02/06 @ 4.75% | 81,200,000 | 182,538 | |||||||||||
Swap Option on 3 Month LIBOR, expiring 08/07/06 @ 4.75% | 72,000,000 | 266,904 | |||||||||||
Swap Option on 3 Month LIBOR, expiring 06/12/06 @ 4.65% | 26,500,000 | 210,047 | |||||||||||
| 3,701,409 | |||||||||||||
Put Options | |||||||||||||
Eurodollar Futures, expiring 09/18/06 @ $92.50 | 116 | 725 | |||||||||||
Eurodollar Futures, expiring 12/18/06 @ $91.75 | 220 | 1,375 | |||||||||||
Eurodollar Futures, expiring 12/18/06 @ $92.00 | 417 | 2,606 | |||||||||||
Eurodollar Futures, expiring 06/19/06 @ $94.50 | 2,491 | 31,137 | |||||||||||
Eurodollar Futures, expiring 03/13/06 @ $92.50 | 120 | 750 | |||||||||||
Swap Option on 3 Month LIBOR, expiring 04/27/09 @ 6.25% | 13,100,000 | 392,057 | |||||||||||
Swap Option on 3 Month LIBOR, expiring 05/02/08 @ 6.25% | 4,500,000 | 97,227 | |||||||||||
| 525,877 | |||||||||||||
TOTAL OUTSTANDING OPTIONS PURCHASED | 4,227,286 | ||||||||||||
TOTAL SHORT-TERM INVESTMENTS | 520,811,440 | ||||||||||||
TOTAL INVESTMENTS, BEFORE OUTSTANDING OPTIONS WRITTEN AND SECURITIES SOLD SHORT—131.1% | 2,017,394,389 | ||||||||||||
| SECURITIES SOLD SHORT — (7.8)% | Interest Rate | Maturity Date | Principal Amount (000) | ||||||||||
SHORT SALES — (7.8)% | |||||||||||||
Federal National Mortgage Assoc. | 5.50% | TBA | $ | 13,200 | (13,278,382 | ) | |||||||
Federal National Mortgage Assoc. | 6.00% | TBA | 3,000 | (3,027,186 | ) | ||||||||
Federal National Mortgage Assoc. | 4.00% | TBA | 2,000 | (1,909,376 | ) | ||||||||
U.S. Treasury Note | 3.625% | 5/15/13 | 62,400 | (59,516,434 | ) | ||||||||
U.S. Treasury Note | 4.00% | 11/15/12 | 27,900 | (27,299,508 | ) | ||||||||
United Kingdom Gilt | 4.75% | 6/07/10 | GBP | 8,800 | (15,494,301 | ) | |||||||
TOTAL SECURITIES SOLD SHORT | (120,525,187 | ) | |||||||||||
| OUTSTANDING OPTIONS WRITTEN — (0.1)% | Contracts/ Notional Amount | ||||||||||||
PUT OPTION | |||||||||||||
Swap Option on 3 Month LIBOR, expiring 07/05/13 @ 6.00% | 35,300,000 | (36,218 | ) | ||||||||||
CALL OPTIONS — (0.1)% | |||||||||||||
Swap Option on 3 Month LIBOR, expiring 02/01/06 @ 4.70% | 9,500,000 | (9,652 | ) | ||||||||||
Swap Option on 3 Month LIBOR, expiring 05/02/06 @ 4.78% | 35,000,000 | (218,295 | ) | ||||||||||
Swap Option on 3 Month LIBOR, expiring 06/12/06 @ 4.65% | 7,100,000 | (181,082 | ) | ||||||||||
Swap Option on 3 Month LIBOR, expiring 08/07/06 @ 4.78% | 31,000,000 | (293,911 | ) | ||||||||||
Swap Option on 3 Month LIBOR, expiring 08/08/06 @ 4.78% | 7,800,000 | (74,178 | ) | ||||||||||
Swap Option on 3 Month LIBOR, expiring 10/11/06 @4.30% | 19,000,000 | (75,848 | ) | ||||||||||
Swap Option on 3 Month LIBOR, expiring 10/12/06 @ 4.30% | 17,800,000 | (71,360 | ) | ||||||||||
Swap Option on 3 Month LIBOR, expiring 10/18/06 @ 4.56% | 38,700,000 | (289,554 | ) | ||||||||||
Swap Option on 3 Month LIBOR, expiring 10/25/06 @ 4.32% | 23,300,000 | (103,988 | ) | ||||||||||
Swap Option on 3 Month LIBOR, expiring 07/15/13 @ 4.00% | 35,300,000 | (26,616 | ) | ||||||||||
Eurodollar Futures, expiring 03/10/06 @ $95.50 | 636 | (57,240 | ) | ||||||||||
Eurodollar Futures, expiring 06/19/06 @ $95.50 | 1,362 | (136,200 | ) | ||||||||||
TOTAL CALL OPTIONS | (1,537,924 | ) | |||||||||||
TOTAL OUTSTANDING OPTIONS WRITTEN | (1,574,142 | ) | |||||||||||
TOTAL INVESTMENTS, NET OF OUTSTANDING OPTIONS WRITTEN | 1,895,295,060 | ||||||||||||
OTHER LIABILITIES IN EXCESS OF OTHER ASSETS(l) — (23.2%) | (357,049,595 | ) | |||||||||||
NET ASSETS — 100.0% | $ | 1,538,245,465 | |||||||||||
SEE NOTES TO FINANCIAL STATEMENTS.
B34
| SP PIMCO TOTAL RETURN PORTFOLIO (Continued) |
SCHEDULE OF INVESTMENTS | December 31, 2005 |
The following abbreviations are used in portfolio descriptions:
| 144A | Security was purchased pursuant to Rule 144A under the Securities Act of 1933 and may not be resold subject to that rule except to qualified institutional buyers. Unless otherwise noted, 144A Securities are deemed to be liquid. | |
| NR | Not Rated by Moodys or Standard & Poor’s | |
| TBA | Securities Purchased on a Forward Commitment Basis | |
| TIPS | Treasury Inflation Protected Securities | |
| EUR | Euro | |
| GBP | British Pound | |
| JPY | Japanese Yen |
| (e) | Non-income producing security. |
| (g) | Indicates a security that has been deemed illiquid. |
| (h) | Security segregated as collateral for futures contracts. |
| (i) | Represents issuer in default on interest payments. Non-income producing security. |
| (j) | Rate shown reflects current rate on variable rate instrument. |
| (k) | Prudential Investments LLC, the manager of the Fund also serves as manager of the Dryden Core Investment Fund-Taxable Money Market Series. |
| (l) | Liabilities in excess of other assets include net unrealized appreciation (depreciation) of financial futures, foreign currency contracts, interest rate swaps and credit default swaps as follows: |
Forward foreign currency exchange contracts outstanding at December 31, 2005:
Purchase Contracts: | Value at Settlement Date | Current Value | Unrealized Appreciation (Depreciation) | |||||||
EUR 681,000, | $ | 807,224 | $ | 806,232 | $ | (992 | ) | |||
GBP 202,000, | 352,144 | 347,539 | (4,605 | ) | ||||||
| $ | (5,597 | ) | ||||||||
Sales Contracts: | ||||||||||
EUR 60,645,000, | $ | 71,177,339 | $ | 71,874,550 | $ | (697,211 | ) | |||
EUR 29,497,000, | 34,918,110 | 34,984,551 | (66,441 | ) | ||||||
EUR 53,580,000, | 63,294,324 | 63,547,894 | (253,570 | ) | ||||||
EUR 7,684,000, | 9,089,711 | 9,127,354 | (37,643 | ) | ||||||
GBP 2,056,000, | 3,529,356 | 3,537,116 | (7,760 | ) | ||||||
| $ | (1,062,625 | ) | ||||||||
| Total | $ | (1,068,222 | ) | |||||||
Securities or a portion thereof with an aggregate market value of $496,886 have been segregated with the custodian to cover margin requirements for futures contracts open at December 31, 2005.
| Number of Contracts | Type | Expiration Month | Value at Trade Date | Value at December 31, 2005 | Unrealized Appreciation (Depreciation) | |||||||||
| Long Positions: | ||||||||||||||
| 556 | Euro Dollar | Mar 06 | $ | 132,446,150 | $ | 132,362,750 | $ | (83,400 | ) | |||||
| 256 | Euro Dollar | Mar 07 | 60,905,600 | 60,960,000 | 54,400 | |||||||||
| 1,523 | Euro Dollar | Jun 06 | 362,085,950 | 362,302,663 | 216,713 | |||||||||
| 940 | Euro Dollar | Sep 06 | 223,526,225 | 223,626,000 | 99,775 | |||||||||
| 19 | Euro Dollar | Dec 06 | 4,561,663 | 4,522,238 | (39,425 | ) | ||||||||
| 3,085 | U.S. Treasury 5 Year Note | Mar 06 | 327,453,156 | 328,070,469 | 617,313 | |||||||||
| $ | 865,376 | |||||||||||||
| Short Positions: | ||||||||||||||
| 186 | German Government 10 Year Bond | Mar 06 | 26,699,777 | 26,829,697 | (129,921 | ) | ||||||||
| 628 | U.S. Treasury Note | Mar 06 | 68,081,875 | 68,707,125 | (625,250 | ) | ||||||||
| 23 | U.S. Treasury 30 Year Note | Mar 06 | 2,570,251 | 2,626,312 | (56,063 | ) | ||||||||
| (811,234 | ) | |||||||||||||
| $ | 54,142 | |||||||||||||
SEE NOTES TO FINANCIAL STATEMENTS.
B35
| SP PIMCO TOTAL RETURN PORTFOLIO (Continued) |
SCHEDULE OF INVESTMENTS | December 31, 2005 |
Interest rate swaps agreements outstanding at December 31, 2005:
| Counterparty | Termination Date | Notional Amount | Fixed Rate | Floating Rate | Unrealized Appreciation (Depreciation) | |||||||||
| Lehman Brothers, Inc.(1) | 12/15/31 | EUR | 3,000,000 | 5.50 | % | 6 month LIBOR | $ | (949,755 | ) | |||||
| Bank of America, N.A.(1) | 06/15/35 | $ | 5,300,000 | 6.00 | % | 3 month LIBOR | 216,516 | |||||||
| Barclays Capital PLC(1) | 09/15/10 | GBP | 8,000,000 | 5.00 | % | 6 month LIBOR | 272,243 | |||||||
| Barclays PLC(2) | 12/15/14 | EUR | 4,100,000 | 4.00 | % | 6 month LIBOR | (218,211 | ) | ||||||
| Morgan Stanley(2) | 12/15/14 | EUR | 35,800,000 | 4.00 | % | 6 month LIBOR | (1,915,963 | ) | ||||||
| Barclays Capital PLC(2) | 06/18/34 | GBP | 400,000 | 5.00 | % | 6 month LIBOR | (30,731 | ) | ||||||
| UBS AG(1) | 10/15/10 | EUR | 1,400,000 | 2.1455 | % | FRC – Excluding Tobacco – Non-Revised Consumer Price Index | 10,237 | |||||||
| Merrill Lynch & Co.(2) | 06/15/15 | JPY | 830,000,000 | 1.50 | % | 6 month LIBOR | 40,337 | |||||||
| Bank of America, N.A.(1) | 06/21/11 | $ | 35,100,000 | 5.00 | % | 3 month LIBOR | 175,974 | |||||||
| Bank of America, N.A.(1) | 06/21/16 | $ | 19,300,000 | 5.00 | % | 3 month LIBOR | 234,429 | |||||||
| Barclays Capital(1) | 06/15/15 | JPY | 340,000,000 | 1.50 | % | 6 month LIBOR | 18,374 | |||||||
| $ | (2,146,550 | ) | ||||||||||||
| (1) | Porfolio pays the floating rate and receives the fixed rate. |
| (2) | Portfolio pays the fixed rate and receives the floating rate. |
Credit default swap agreements outstanding at December 31, 2005:
Counterparty | Termination Date | Notional Amount | Fixed Rate | Underlying | Unrealized Appreciation (Depreciation) | ||||||||
| Morgan Stanley & Co.(1) | 12/20/08 | 2,700,000 | 0.26 | % | Allstate Corp., 6.125%, due 02/15/12 | $ | (14,299) | ||||||
| Merrill Lynch & Co.(1) | 12/20/08 | 1,400,000 | 0.32 | % | Ingersoll-Rand Corp., 6.48%, due 06/01/25 | (7,742 | ) | ||||||
| Morgan Stanley & Co.(1) | 12/20/08 | 1,600,000 | 0.21 | % | Emerson Electric Co., 4.625%, due 10/15/12 | (2,569 | ) | ||||||
| Barclays Bank PLC(1) | 12/20/08 | 2,300,000 | 0.16 | % | Eli Lilly & Co., 6.00%, due 03/15/12 | (7,201 | ) | ||||||
| Bank of America Securities LLC(1) | 12/20/08 | 1,700,000 | 0.13 | % | E.I Dupont de Nemours & Co., 6.875%, due 10/15/09 | 207 | |||||||
| Bear Sterns International Ltd.(1) | 12/20/08 | 2,200,000 | 0.32 | % | Hewlett Packard Co., 6.50%, due 07/01/12 | (11,915 | ) | ||||||
| Lehman Brothers, Inc.(1) | 12/20/08 | 2,100,000 | 0.11 | % | Johnson & Johnson, 3.80%, due 05/15/13 | (4,225 | ) | ||||||
| Lehman Brothers, Inc.(1) | 12/20/08 | 2,200,000 | 0.12 | % | Home Depot, Inc., 5.375%, due 04/01/06 | (2,578 | ) | ||||||
| Citigroup(1) | 12/20/08 | 1,700,000 | 0.29 | % | FedEx Corp. 7.25%, due 02/15/11 | (7,747 | ) | ||||||
| Lehman Brothers, Inc.(1) | 12/20/08 | 1,100,000 | 0.29 | % | Whirlpool Corp., 8.60%, due 05/01/10 | (434 | ) | ||||||
| Citigroup(1) | 12/20/08 | 2,200,000 | 0.28 | % | Eaton Corp., 5.75%, due 07/15/12 | (8,292 | ) | ||||||
| Merrill Lynch & Co.(1) | 12/20/08 | 600,000 | 0.22 | % | Gannett Co., Inc., 6.375%, due 04/01/12 | 557 | |||||||
| Citigroup(1) | 12/20/08 | 3,600,000 | 0.14 | % | Walmart Stores, Inc., 6.875%, due 08/10/09 | (7,426 | ) | ||||||
| UBS AG(1) | 12/20/08 | 3,200,000 | 0.35 | % | AutoZone, Inc., 5.875%, due 10/15/12 | 9,963 | |||||||
| Lehman Brothers, Inc.(1) | 12/20/08 | 700,000 | 0.24 | % | Costco Wholesale Corp., 5.50%, due 03/15/07 | (2,421 | ) | ||||||
SEE NOTES TO FINANCIAL STATEMENTS.
B36
| SP PIMCO TOTAL RETURN PORTFOLIO (Continued) |
SCHEDULE OF INVESTMENTS | December 31, 2005 |
Counterparty | Termination Date | Notional Amount | Fixed Rate | Underlying | Unrealized Appreciation (Depreciation) | ||||||||
| Lehman Brothers, Inc.(1) | 12/20/08 | 1,200,000 | 0.30 | % | Masco Corp., 5.875%, due 07/15/12 | $ | 2,742 | ||||||
| Lehman Brothers, Inc.(1) | 12/20/08 | 1,200,000 | 0.35 | % | RadioShack Corp., 7.375%, due 05/15/11 | 14,370 | |||||||
| Barclays Bank PLC(1) | 12/20/08 | 900,000 | 0.67 | % | Walt Disney Co. (The), 6.375%, due 03/01/12 | (13,105 | ) | ||||||
| Bear Sterns International Ltd.(1) | 12/20/08 | 400,000 | 1.09 | % | Capital One Bank, 4.875%, due 05/15/08 | (10,497 | ) | ||||||
| Lehman Brothers, Inc.(1) | 12/20/08 | 900,000 | 0.48 | % | Northrop Grumman Corp., 7.125%, due 02/15/11 | (8,786 | ) | ||||||
| Lehman Brothers, Inc.(1) | 12/20/08 | 900,000 | 0.53 | % | Lockheed Martin Corp., 8.20%, due 12/01/09 | (9,886 | ) | ||||||
| Lehman Brothers, Inc.(1) | 12/20/08 | 900,000 | 0.97 | % | Goodrich Corp., 7.625%, due 12/15/12 | (17,636 | ) | ||||||
| Bear Sterns International Ltd.(1) | 12/20/08 | 800,000 | 0.24 | % | Deere & Co., 7.85%, due 05/15/10 | (2,950 | ) | ||||||
| UBS AG(1) | 12/20/08 | 800,000 | 0.37 | % | RadioShack Corp., 7.375%, due 05/15/11 | 9,138 | |||||||
| Bear Sterns International Ltd.(1) | 12/20/08 | 800,000 | 0.19 | % | Caterpillar, Inc., 7.25%, due 09/15/09 | (2,180 | ) | ||||||
| Morgan Stanley & Co.(1) | 12/20/08 | 300,000 | 0.26 | % | Allstate Corp., 6.125%, due 02/15/12 | (1,640 | ) | ||||||
| Morgan Stanley & Co.(1) | 12/20/08 | 200,000 | 0.21 | % | Emerson Electric Co., 4.625%, due 10/15/12 | (201 | ) | ||||||
| Lehman Brothers, Inc.(1) | 12/20/08 | 300,000 | 0.12 | % | Home Depot, Inc., 5.375%, due 04/01/06 | (1,350) | |||||||
| Lehman Brothers, Inc.(1) | 12/20/08 | 100,000 | 0.29 | % | Whirlpool Corp., 8.60%, due 05/01/10 | (191 | ) | ||||||
| Citigroup(1) | 12/20/08 | 200,000 | 0.29 | % | FedEx Corp., 7.25%, due 02/15/11 | (688 | ) | ||||||
| Lehman Brothers, Inc.(1) | 12/20/08 | 100,000 | 0.48 | % | Northrop & Grumman Corp., 7.125%, due 02/15/11 | (1,156 | ) | ||||||
| Lehman Brothers, Inc.(1) | 12/20/08 | 100,000 | 0.53 | % | Lockheed Martin Corp., 8.20%, due 12/01/09 | (1,189 | ) | ||||||
| Lehman Brothers, Inc.(1) | 12/20/08 | 300,000 | 0.11 | % | Johnson & Johnson, 3.8%, due 05/15/13 | (707 | ) | ||||||
| Morgan Stanley & Co.(1) | 12/20/08 | 800,000 | 0.22 | % | Emerson Electric Co., 7.125%%, due 08/15/10 | (1,508 | ) | ||||||
| Merrill Lynch & Co.(1) | 12/20/08 | 1,600,000 | 0.35 | % | Devon Energy Corp., 6.875%, due 09/30/11 | (8,587 | ) | ||||||
| Bear Sterns International Ltd.(1) | 12/20/08 | 800,000 | 0.60 | % | International Paper Co., 6.75%, due 09/01/11 | (5,283 | ) | ||||||
| Merrill Lynch & Co.(1) | 12/20/08 | 800,000 | 0.27 | % | Anadarko Petroleum Corp., 5.00%, due 10/01/12 | (1,814 | ) | ||||||
| UBS AG(1) | 12/20/08 | 800,000 | 0.44 | % | Carnival Corp., 6.15%, due 04/15/08 | (6,958 | ) | ||||||
| Morgan Stanley & Co.(1) | 12/20/08 | 800,000 | 0.42 | % | Countrywide Home Loans, Inc., 5.625%, due 07/15/09 | (4,392 | ) | ||||||
| Merrill Lynch & Co.(1) | 12/20/08 | 800,000 | 0.28 | % | Occidental Petoleum Corp., 6.75%, due 01/15/12 | (2,666 | ) | ||||||
| UBS AG(1) | 12/20/08 | 800,000 | 0.44 | % | Simon Property Group, L.P., 5.45%, due 03/15/13 | (4,182 | ) | ||||||
SEE NOTES TO FINANCIAL STATEMENTS.
B37
| SP PIMCO TOTAL RETURN PORTFOLIO (Continued) |
SCHEDULE OF INVESTMENTS | December 31, 2005 |
Counterparty | Termination Date | Notional Amount | Fixed Rate | Underlying | Unrealized Appreciation (Depreciation) | ||||||||
| Morgan Stanley & Co.(1) | 12/20/08 | 800,000 | 0.53 | % | The Kroger Co., 4.75%, due 04/15/12 | $ | (5,305 | ) | |||||
| Bear Sterns International Ltd.(1) | 12/20/08 | 1,500,000 | 0.15 | % | Walmart Stores, Inc., 6.875%, due 08/10/09 | (3,514 | ) | ||||||
| Merrill Lynch & Co.(1) | 12/20/08 | 1,200,000 | 0.85 | % | Motorola, Inc, 7.625%, due 11/15/10 | (24,803 | ) | ||||||
| Bear Sterns International Ltd.(1) | 12/20/08 | 300,000 | 0.32 | % | Hewlett Packard Co., 6.50%, due 07/12/12 | (1,272 | ) | ||||||
| Bank of America Securities LLC(1) | 12/20/08 | 200,000 | 0.13 | % | E.I Dupont de Nemours & Co., 6.875%, due 10/15/09 | (44 | ) | ||||||
| Barclays Bank PLC(1) | 12/20/08 | 300,000 | 0.16 | % | Eli Lilly & Co., 6.00%, due 03/15/12 | (639 | ) | ||||||
| Lehman Brothers, Inc.(1) | 12/20/08 | 100,000 | 0.35 | % | RadioShack Corp., 7.375%, due 05/15/11 | 883 | |||||||
| Lehman Brothers, Inc.(1) | 12/20/08 | 100,000 | 0.30 | % | Masco Corp., 5.875%, due 07/15/12 | 163 | |||||||
| Barclays Bank PLC(1) | 12/20/08 | 100,000 | 0.67 | % | Walt Disney Co. (The), 6.375%, due 03/01/12 | (729 | ) | ||||||
| Lehman Brothers, Inc.(1) | 12/20/08 | 100,000 | 0.97 | % | Goodrich Corp., 7.625%, due 12/15/12 | (1,087 | ) | ||||||
| Bear Sterns International Ltd.(1) | 12/20/08 | 100,000 | 1.09 | % | Capital One Bank, 4.875%, due 05/15/08 | (3,153 | ) | ||||||
| Lehman Brothers, Inc.(1) | 12/20/08 | 100,000 | 0.24 | % | Costco Wholesale Corp., 5.50%, due 03/15/07 | (418 | ) | ||||||
| Citigroup(1) | 12/20/08 | 300,000 | 0.28 | % | Eaton Corp., 5.75%, due 07/15/12 | (650 | ) | ||||||
| Lehman Brothers, Inc.(1) | 6/20/09 | 6,600,000 | 0.40 | % | Peoples Republic of China, 6.80%, due 05/23/11 | (54,756 | ) | ||||||
| Bear Sterns International Ltd.(2) | 3/20/07 | 4,500,000 | 0.62 | % | Russian Federation, 2.25%, due 03/31/30 | 13,366 | |||||||
| Bank of America Securities LLC(2) | 6/20/10 | 16,000,000 | 0.40 | % | Dow Jones CDX IG4 | 174,843 | |||||||
| Barclays Bank PLC(2) | 6/20/10 | 2,900,000 | 0.40 | % | Dow Jones CDX IG4 | 13,409 | |||||||
| Bear Sterns International Ltd.(2) | 6/20/10 | 15,300,000 | 0.40 | % | Dow Jones CDX IG4 | 69,161 | |||||||
| JPMorgan Chase Bank(2) | 5/20/07 | 300,000 | 0.77 | % | Russian Federation, 2.25%, due 03/31/30 | 1,595 | |||||||
| Morgan Stanley & Co.(2) | 6/20/06 | 200,000 | 0.58 | % | Russian Federation, 5.00%, due 03/31/30 | 272 | |||||||
| Morgan Stanley & Co.(1) | 9/20/10 | 3,300,000 | 2.70 | % | Republic of Turkey, 11.875%, due 01/15/30 | (175,234 | ) | ||||||
| Lehman Brothers, Inc.(1) | 9/20/10 | 1,000,000 | 2.26 | % | Republic of Turkey, 11.875%, due 01/15/30 | (34,863 | ) | ||||||
| Lehman Brothers, Inc.(1) | 9/20/08 | 3,000,000 | 2.47 | % | Republic of the Phillipines, 8.25% 01/15/14 | (78,150 | ) | ||||||
| Lehman Brothers, Inc.(1) | 10/20/10 | 2,500,000 | 2.11 | % | Republic of Turkey, 11.875%, due 01/15/30 | (69,085 | ) | ||||||
| $ | (327,434 | ) | |||||||||||
| (1) | Portfolio pays the fixed rate and receives from the counterparty, par in the event that the underlying bond defaults. |
| (2) | Portfolio pays counterparty par in the event that the underlying bond defaults and receives the fixed rate. |
SEE NOTES TO FINANCIAL STATEMENTS.
B38
| SP PIMCO TOTAL RETURN PORTFOLIO (Continued) |
SCHEDULE OF INVESTMENTS | December 31, 2005 |
The industry classification of long-term portfolio holdings and other liabilities in excess of other assets shown as a percentage of net assets as of December 31, 2005 were as follows:
U.S. Government Mortgage Backed Obligations | 62.0 | % | |
U.S. Treasury Obligations | 12.8 | ||
Collateralized Mortgage Obligations | 4.9 | ||
Foreign Government Bonds | 3.3 | ||
Financial – Bank & Trust | 3.2 | ||
Financial Services | 3.2 | ||
Automobile Manufacturers | 1.8 | ||
Municipal Bonds | 1.8 | ||
Telecommunications | 1.3 | ||
Diversified | 1.0 | ||
Diversified Financial Services | 0.5 | ||
Entertainment & Leisure | 0.5 | ||
Electronic Components | 0.4 | ||
Oil, Gas & Consumable Fuels | 0.2 | ||
Environmental Services | 0.2 | ||
Paper & Forest Products | 0.2 | ||
Airlines | 0.0 | ||
Outstanding Options Written | (0.1 | ) | |
Short Sales | (7.8 | ) | |
Short-Term Investments | 33.8 | ||
| 123.2 | |||
Other liabilities in excess of other assets | (23.2 | ) | |
Total | 100.0 | % | |
SEE NOTES TO FINANCIAL STATEMENTS.
B39
| SP PRUDENTIAL U.S. EMERGING GROWTH PORTFOLIO |
SCHEDULE OF INVESTMENTS | December 31, 2005 |
| LONG-TERM INVESTMENTS — 96.3% | Value (Note 2) | ||||
| COMMON STOCKS | Shares | ||||
Air Freight & Logistics — 1.4% | |||||
UTI Worldwide, Inc.(Virgin Islands)(b) | 28,800 | $ | 2,673,792 | ||
Biotechnology — 2.0% | |||||
ImClone Systems, Inc.(a)(b) | 58,900 | 2,016,736 | |||
Invitrogen Corp.(a) | 27,900 | 1,859,256 | |||
| 3,875,992 | |||||
Capital Markets — 5.8% | |||||
Ameritrade Holding Corp.(a) | 99,000 | 2,376,000 | |||
Eaton Vance Corp.(b) | 85,600 | 2,342,016 | |||
Lazard, Ltd. (Class “A” Stock)(b) | 77,300 | 2,465,870 | |||
Legg Mason, Inc. | 15,550 | 1,861,180 | |||
Nuveen Investments, Inc. (Class “A” Stock) | 55,100 | 2,348,362 | |||
| 11,393,428 | |||||
Chemicals — 2.6% | |||||
Ecolab, Inc.(b) | 58,600 | 2,125,422 | |||
Monsanto Co. | 36,800 | 2,853,104 | |||
| 4,978,526 | |||||
Commercial Services & Supplies — 7.9% | |||||
Administaff, Inc. | 24,600 | 1,034,430 | |||
ARAMARK Corp.( Class “B” Stock) | 109,500 | 3,041,910 | |||
Iron Mountain, Inc.(a) | 39,600 | 1,671,912 | |||
Monster Worldwide, Inc.(a)(b) | 147,800 | 6,033,195 | |||
Paychex, Inc. | 24,600 | 937,752 | |||
Robert Half International, Inc. | 36,500 | 1,382,985 | |||
Stericycle, Inc.(a)(b) | 21,700 | 1,277,696 | |||
| 15,379,880 | |||||
Communications Equipment — 2.4% | |||||
Comverse Technology, Inc.(a)(b) | 129,800 | 3,451,382 | |||
Juniper Networks, Inc.(a) | 24,500 | 546,350 | |||
QUALCOMM, Inc. | 15,500 | 667,740 | |||
| 4,665,472 | |||||
Computers & Peripherals — 3.7% | |||||
Apple Computer, Inc.(a) | 13,200 | 948,948 | |||
Avid Technology, Inc.(a)(b) | 66,000 | 3,614,160 | |||
Rackable Systems, Inc.(a) | 44,100 | 1,255,968 | |||
UNOVA, Inc.(a) | 41,600 | 1,406,080 | |||
| 7,225,156 | |||||
Diversified Consumer Services — 1.7% | |||||
Apollo Group, Inc. (Class “A” Stock)(a) | 8,300 | 501,818 | |||
Education Management Corp.(a) | 84,800 | 2,841,648 | |||
| 3,343,466 | |||||
Electronic Equipment & Instruments — 2.7% | |||||
Amphenol Corp., Class A | 46,400 | 2,053,664 | |||
Insight Enterprises, Inc.(a) | 73,900 | 1,449,179 | |||
Tektronix, Inc. | 60,400 | 1,703,884 | |||
| 5,206,727 | |||||
Energy Equipment & Services — 5.8% | |||||
Grant Prideco, Inc.(a) | 81,100 | 3,578,132 | |||
National-Oilwell Varco, Inc.(a) | 34,300 | 2,150,610 | |||
Pride International, Inc.(a) | 63,400 | 1,949,550 | |||
Todco (Class “A” Stock) | 41,300 | 1,571,878 | |||
Weatherford International Ltd.(a) | 54,900 | 1,987,380 | |||
| 11,237,550 | |||||
| COMMON STOCKS (Continued) | Shares | Value (Note 2) | |||
Health Care Equipment & Supplies — 9.0% | |||||
Bausch & Lomb, Inc.(b) | 47,700 | $ | 3,238,830 | ||
DENSPLY International, Inc. | 17,000 | 912,730 | |||
Fisher Scientific International, Inc.(a) | 39,900 | 2,468,214 | |||
Mentor Corp. | 49,600 | 2,285,568 | |||
ResMed Inc.(a) | 67,200 | 2,574,432 | |||
Respironics, Inc.(a) | 46,700 | 1,731,169 | |||
Varian Medical Systems, Inc.(a) | 87,100 | 4,384,614 | |||
| 17,595,557 | |||||
Health Care Providers & Services — 8.1% | |||||
Caremark Rx, Inc.(a) | 30,400 | 1,574,416 | |||
Cerner Corp.(a)(b) | 29,700 | 2,700,027 | |||
DaVita, Inc.(a) | 52,400 | 2,653,536 | |||
Medco Health Solutions, Inc.(a) | 63,800 | 3,560,040 | |||
Omnicare, Inc.(b) | 50,000 | 2,861,000 | |||
Quest Diagnostics, Inc. | 46,300 | 2,383,524 | |||
| 15,732,543 | |||||
Hotels, Restaurants & Leisure — 2.4% | |||||
GTECH Holdings Corp. | 85,700 | 2,720,118 | |||
Hilton Hotels Corp. | 84,800 | 2,044,528 | |||
| 4,764,646 | |||||
Internet & Catalog Retail — 1.0% | |||||
eBay, Inc.(a) | 12,600 | 544,950 | |||
GSI Commerce, Inc.(a)(b) | 87,600 | 1,321,884 | |||
| 1,866,834 | |||||
Internet Software & Services — 3.7% | |||||
Akamai Technologies, Inc.(a)(b) | 108,900 | 2,170,377 | |||
Digital River, Inc.(a)(b) | 45,000 | 1,338,300 | |||
Equinix, Inc.(a)(b) | 59,600 | 2,429,296 | |||
VeriSign, Inc.(a) | 18,500 | 405,520 | |||
Yahoo!, Inc.(a)(b) | 24,000 | 940,320 | |||
| 7,283,813 | |||||
IT Services — 0.9% | |||||
CheckFree Corp.(a)(b) | 40,300 | 1,849,770 | |||
Machinery — 1.2% | |||||
Danaher Corp. | 42,400 | 2,365,072 | |||
Media — 3.4% | |||||
E.W. Scripps Co. (The)(Class “A” Stock)(b) | 54,700 | 2,626,694 | |||
Regal Entertainment Group Class “A” Stock)(b) | 102,500 | 1,949,550 | |||
XM Satellite Radio Holdings, Inc. (Class “A” Stock)(a)(b) | 73,900 | 2,015,992 | |||
| 6,592,236 | |||||
Metals & Mining — 2.2% | |||||
Arch Coal, Inc.(b) | 10,700 | 850,650 | |||
Goldcorp, Inc. | 94,800 | 2,112,144 | |||
Harmony Gold Mining Co., Ltd., ADR (South Africa)(a)(b) | 112,700 | 1,470,735 | |||
| 4,433,529 | |||||
Oil, Gas & Consumable Fuels — 1.2% | |||||
Southwestern Energy Co.(a) | 65,800 | 2,364,852 | |||
Pharmaceuticals — 1.4% | |||||
Kos Pharmaceuticals, Inc.(a)(b) | 27,700 | 1,432,921 | |||
Sepracor, Inc.(a)(b) | 24,900 | 1,284,840 | |||
| 2,717,761 | |||||
SEE NOTES TO FINANCIAL STATEMENTS.
B40
| SP PRUDENTIAL U.S. EMERGING GROWTH PORTFOLIO (Continued) |
SCHEDULE OF INVESTMENTS | December 31, 2005 |
| COMMON STOCKS (Continued) | Shares | Value (Note 2) | ||||
Real Estate — 0.8% | ||||||
Host Marriot Corp. (REIT) | 85,300 | $ | 1,616,435 | |||
Semiconductors & Semiconductor Equipment — 6.0% |
| |||||
Broadcom Corp. (Class “A” Stock)(a) | 39,900 | 1,881,285 | ||||
Integrated Device Technology, Inc.(a) | 214,500 | 2,827,110 | ||||
Intersil Corp. (Class “A” Stock) | 83,800 | 2,084,944 | ||||
Marvell Technology Group, Ltd.(a) | 35,400 | 1,985,586 | ||||
Maxim Integrated Products, Inc. | 51,900 | 1,880,856 | ||||
MEMC Electronic Materials, Inc.(a) | 44,400 | 984,348 | ||||
| 11,644,129 | ||||||
Software — 9.8% | ||||||
Adobe Systems, Inc. | 91,228 | 3,371,787 | ||||
Amdocs Ltd.(United Kingdom)(a) | 98,600 | 2,711,500 | ||||
BEA Systems, Inc.(a) | 227,700 | 2,140,380 | ||||
Business Objects SA-SP, ADR (France)(a)(b) | 110,900 | 4,481,469 | ||||
Citrix Systems, Inc.(a)(b) | 70,800 | 2,037,624 | ||||
Cognos, Inc.(a) | 13,300 | 461,643 | ||||
Electronic Arts, Inc.(a)(b) | 36,900 | 1,930,239 | ||||
NAVTEQ Corp.(a)(b) | 22,300 | 978,301 | ||||
TIBCO Software, Inc.(a) | 124,700 | 931,509 | ||||
| 19,044,452 | ||||||
Specialty Retail — 3.4% | ||||||
Abercrombie & Fitch Co. | 15,900 | 1,036,362 | ||||
Advance Auto Parts(a) | 45,800 | 1,990,468 | ||||
Chico’s FAS, Inc.(a)(b) | 39,600 | 1,739,628 | ||||
Williams-Sonoma, Inc.(a)(b) | 44,300 | 1,911,545 | ||||
| 6,678,003 | ||||||
Wireless Telecommunication Services — 5.8% | ||||||
Alamosa Holdings, Inc.(a)(b) | 234,200 | 4,358,462 | ||||
American Tower Corp. | 87,200 | 2,363,120 | ||||
NII Holdings, Inc.(a)(b) | 106,600 | 4,656,288 | ||||
| 11,377,870 | ||||||
TOTAL LONG-TERM INVESTMENTS | 187,907,491 | |||||
| SHORT-TERM INVESTMENTS — 36.4% | ||||||
Mutual Fund | ||||||
Dryden Core Investment Fund —Taxable Money Market Series(c)(d) | 71,158,376 | 71,158,376 | ||||
TOTAL INVESTMENTS — 132.7% | 259,065,867 | |||||
LIABILITIES IN EXCESS OF | (63,843,471 | ) | ||||
NET ASSETS — 100.0% | $ | 195,222,396 | ||||
The following abbreviations are used in the portfolio descriptions:
| ADR | American Depositary Receipt | |
| REIT | Real Estate Investment Trust |
| (a) | Non-income producing security. |
| (b) | All or a portion of security is on loan. The aggregate market value of such securities is $61,162,980; cash collateral of $63,990,138 (included in liabilities) was received with which the portfolio purchased highly liquid short-term investments. |
| (c) | Represents security, or a portion thereof, purchased with cash collateral received for securities on loan. |
| (d) | Prudential Investments LLC, the manager of the Fund, also serves as the manager of the Dryden Core Investment Fund – Taxable Money Market Series. |
The industry classification of portfolio holdings and liabilities in excess of other assets shown as a percentage of net assets as of December 31, 2005 were as follows:
Mutual Fund (including 32.8% of collateral received for securities on loan) | 36.4 | % | |
Software | 9.8 | ||
Health Care Equipment & Supplies | 9.0 | ||
Health Care Providers & Services | 8.1 | ||
Commercial Services & Supplies | 7.9 | ||
Semiconductors & Semiconductor Equipment | 6.0 | ||
Capital Markets | 5.8 | ||
Wireless Telecommunication Services | 5.8 | ||
Energy Equipment & Services | 5.8 | ||
Computer & Peripherals | 3.7 | ||
Internet Software & Services | 3.7 | ||
Media | 3.4 | ||
Specialty Retail | 3.4 | ||
Electronic Equipment & Instruments | 2.7 | ||
Chemicals | 2.6 | ||
Communication Equipment | 2.4 | ||
Hotels, Restaurants & Leisure | 2.4 | ||
Metals & Mining | 2.2 | ||
Biotechnology | 2.0 | ||
Diversified Consumer Services | 1.7 | ||
Air Freight & Logistics | 1.4 | ||
Pharmaceuticals | 1.4 | ||
Machinery | 1.2 | ||
Oil, Gas & Consumable Fuels | 1.2 | ||
Internet & Catalog Retail | 1.0 | ||
IT Services | 0.9 | ||
Real Estate | 0.8 | ||
| 132.7 | |||
Liabilities in excess of other assets | (32.7 | ) | |
| 100.0 | % | ||
SEE NOTES TO FINANCIAL STATEMENTS.
B41
| SP SMALL CAP GROWTH PORTFOLIO |
SCHEDULE OF INVESTMENTS | December 31, 2005 |
| LONG-TERM INVESTMENTS — 94.2% | Value (Note 2) | ||||
| COMMON STOCKS | Shares | ||||
Aerospace — 0.3% | |||||
ARGON ST, Inc. | 13,000 | $ | 402,740 | ||
Agricultural Products & Services — 0.9% | |||||
Delta & Pine Land Co. | 53,115 | 1,222,176 | |||
Autos – Cars & Trucks — 0.7% | |||||
Modine Manufacturing Co. | 30,500 | 993,995 | |||
Banking — 1.0% | |||||
BankAtlantic Bancorp, Inc. | 17,574 | 246,036 | |||
Wilshire Bancorp, Inc. | 12,500 | 214,875 | |||
Wintrust Financial Corp. | 16,600 | 911,340 | |||
| 1,372,251 | |||||
Biotechnology — 0.4% | |||||
Ariad Pharmaceuticals, Inc. | 88,922 | 520,194 | |||
Building Materials — 0.7% | |||||
Drew Industries, Inc. | 25,400 | 716,026 | |||
Interline Brands, Inc.* | 13,200 | 300,300 | |||
| 1,016,326 | |||||
Chemicals — 1.6% | |||||
Cabot Microelectronics Corp.* | 25,200 | 739,116 | |||
Rockwood Holdings, Inc.* | 29,200 | 576,116 | |||
Spartech Corp. | 37,300 | 818,735 | |||
| 2,133,967 | |||||
Commercial Services — 1.9% | |||||
Korn/Ferry International* | 39,100 | 730,779 | |||
Navigant Consulting, Inc.* | 44,200 | 971,516 | |||
Resources Connection, Inc.* | 35,325 | 920,569 | |||
| 2,622,864 | |||||
Commercial Services & Supplies — 2.6% | |||||
Corrections Corp. of America * | 28,345 | 1,274,675 | |||
Rollins, Inc. | 57,700 | 1,137,267 | |||
SCP Pool Corp. | 29,329 | 1,091,625 | |||
| 3,503,567 | |||||
Computer Services & Software — 5.4% | |||||
ANSYS, Inc.* | 41,015 | 1,750,930 | |||
Datastream Systems, Inc.* | 166,861 | 1,443,348 | |||
FactSet Research Systems, Inc. | 58,758 | 2,418,479 | |||
Kanbay International, Inc. | 29,900 | 475,111 | |||
RadiSys Corp.*(a) | 74,213 | 1,286,854 | |||
| 7,374,722 | |||||
Computers — 0.8% | |||||
McData Corp. (Class “A” Stock) | 291,006 | 1,105,823 | |||
Construction — 0.6% | |||||
Chicago Bridge & Iron Co. NV (Netherlands) | 30,800 | 776,468 | |||
Consulting — 0.4% | |||||
Watson Wyatt Worldwide, Inc. | 19,900 | 555,210 | |||
Consumer Products & Services — 1.2% | |||||
Elizabeth Arden, Inc.* | 34,100 | 684,046 | |||
Ritchie Bros. Auctioneers, Inc. (Canada) | 21,300 | 899,925 | |||
| 1,583,971 | |||||
| COMMON STOCKS (Continued) | Shares | Value (Note 2) | |||
Distribution/Wholesale — 1.1% | |||||
MWI Veterinary Supply, Inc. | 13,300 | $ | 343,273 | ||
ScanSource, Inc.* | 21,900 | 1,197,492 | |||
| 1,540,765 | |||||
Diversified Financial Services — 0.3% | |||||
World Acceptance Corp. | 15,000 | 427,500 | |||
Diversified Manufacturing Operations — 3.0% | |||||
Actuant Corp. (Class “A” Stock) | 34,643 | 1,933,079 | |||
Applied Films Corp. | 49,611 | 1,030,421 | |||
CLARCOR, Inc. | 36,000 | 1,069,560 | |||
| 4,033,060 | |||||
Electrical Equipment — 1.5% | |||||
Advanced Energy Industries, Inc.* | 65,331 | 772,866 | |||
General Cable Corp.* | 66,416 | 1,308,395 | |||
| 2,081,261 | |||||
Electronic Components — 2.5% | |||||
Daktronics, Inc. | 12,100 | 357,797 | |||
Gentex Corp. | 12,416 | 242,112 | |||
Littelfuse, Inc. | 10,292 | 280,457 | |||
LoJack Corp.* | 20,500 | 494,665 | |||
Methode Electronics, Inc. | 38,500 | 383,845 | |||
Universal Electronics, Inc.* | 93,799 | 1,616,157 | |||
| 3,375,033 | |||||
Electronics — 0.7% | |||||
Dolby Laboratories, Inc. (Class “A” Stock)* | 56,300 | 959,915 | |||
Entertainment — 0.5% | |||||
Vail Resorts, Inc.* | 20,200 | 667,206 | |||
Entertainment & Leisure — 0.1% | |||||
RC2 Corp. | 5,300 | 188,256 | |||
Financial Services — 4.4% | |||||
Assured Guaranty Ltd. | 38,500 | 977,515 | |||
Boston Private Financial Holdings, Inc. | 23,500 | 714,870 | |||
Financial Federal Corp.(a) | 14,500 | 644,525 | |||
Global Payments, Inc. | 40,406 | 1,883,323 | |||
Hilb Rogal & Hobbs Co. | 11,000 | 423,610 | |||
ITLA Capital Corp. | 15,600 | 762,060 | |||
Primus Guaranty Ltd. | 17,455 | 227,788 | |||
W.P. Stewart & Co., Ltd. | 12,300 | 289,911 | |||
| 5,923,602 | |||||
Food — 0.4% | |||||
Tootsie Roll Industries, Inc. | 19,100 | 552,563 | |||
Gaming — 1.3% | |||||
Nevada Gold & Casinos, Inc.* | 28,112 | 292,084 | |||
Shuffle Master, Inc.*(a) | 59,444 | 1,494,422 | |||
| 1,786,506 | |||||
Health Services — 4.7% | |||||
American Healthways, Inc.(a) | 32,705 | 1,479,901 | |||
Apria Healthcare Group, Inc.* | 24,500 | 590,695 | |||
Centene Corp.* | 57,775 | 1,518,905 | |||
Computer Programs & Systems, Inc. | 14,500 | 600,735 | |||
Eclipsys Corp.* | 40,260 | 762,122 | |||
Horizon Health Corp.* | 60,943 | 1,379,140 | |||
| 6,331,498 | |||||
SEE NOTES TO FINANCIAL STATEMENTS.
B42
| SP SMALL CAP GROWTH PORTFOLIO (Continued) |
SCHEDULE OF INVESTMENTS | December 31, 2005 |
| COMMON STOCKS (Continued) | Shares | Value (Note 2) | |||
Healthcare-Products — 0.5% | |||||
SurModics, Inc.* | 17,110 | $ | 632,899 | ||
Household Products — 0.5% | |||||
ACCO Brands Corp. | 27,200 | 666,400 | |||
Instruments – Controls — 0.4% | |||||
Photon Dynamics, Inc.* | 31,616 | 577,940 | |||
Insurance — 2.6% | |||||
American Equity Investment Life Holding Co. | 45,100 | 588,555 | |||
Amerisafe, Inc.* | 32,500 | 327,600 | |||
HCC Insurance Holdings, Inc.* | 52,050 | 1,544,844 | |||
Hooper Holmes, Inc. | 90,856 | 231,683 | |||
Philadelphia Consolidated Holding Co.* | 8,413 | 813,453 | |||
| 3,506,135 | |||||
Internet — 0.3% | |||||
Avocent Corp.* | 14,700 | 399,693 | |||
Internet Services — 1.2% | |||||
eCollege.com, Inc.*(a) | 30,435 | 548,743 | |||
Internet Capital Group, Inc.* | 52,036 | 427,736 | |||
j2 Global Communications, Inc.(a) | 16,600 | 709,484 | |||
| 1,685,963 | |||||
Leisure — 0.7% | |||||
International Speedway Corp. | 18,900 | 905,310 | |||
Machinery — 0.6% | |||||
RBC Bearings, Inc. | 1,400 | 22,750 | |||
Regal-Beloit Corp. | 21,100 | 746,940 | |||
Robbins & Myers, Inc. | 3,700 | 75,295 | |||
| 844,985 | |||||
Machinery & Equipment — 3.2% | |||||
Bucyrus International, Inc. | 49,575 | 2,612,602 | |||
IDEX Corp. | 29,300 | 1,204,523 | |||
Middleby Corp.* | 6,200 | 536,300 | |||
| 4,353,425 | |||||
Media — 2.8% | |||||
Emmis Communications Corp. | 63,200 | 1,258,312 | |||
Entravision Communications Corp. | 71,975 | 512,462 | |||
Journal Communications, Inc. | 57,600 | 803,520 | |||
Meredith Corp. | 22,600 | 1,182,884 | |||
| 3,757,178 | |||||
Medical Products — 9.1% | |||||
Ameican Medical Systems Holdings, Inc. | 76,051 | 1,355,989 | |||
Arrow International, Inc. | 17,750 | 514,572 | |||
deCODE genetics, Inc. | 102,968 | 850,516 | |||
Dendreon Corp.* | 53,214 | 288,420 | |||
DJ Orthopedics, Inc.* | 22,762 | 627,776 | |||
ICU Medical, Inc.* | 12,600 | 494,046 | |||
K-V Pharmaceutical Co. | 84,955 | 1,750,073 | |||
| COMMON STOCKS (Continued) | Shares | Value (Note 2) | |||
Medical Products (cont’d.) | |||||
Landauer, Inc. | 14,000 | $ | 645,260 | ||
Medicis Pharmaceutical Corp. | 24,073 | 771,540 | |||
Respironics, Inc.* | 48,609 | 1,801,936 | |||
STERIS Corp.* | 37,000 | 925,740 | |||
Techne Corp.* | 11,300 | 634,495 | |||
Thoratec Corp.* | 27,679 | 572,678 | |||
Young Innovations, Inc. | 34,900 | 1,189,392 | |||
| 12,422,433 | |||||
Metals & Mining — 2.1% | |||||
Aleris International, Inc. | 89,288 | 2,878,645 | |||
Mineral Resources — 0.3% | |||||
AMCOL International Corp. | 20,000 | 410,400 | |||
Oil & Gas Equipment & Services — 2.4% | |||||
CARBO Ceramics, Inc. | 21,000 | 1,186,920 | |||
FMC Technologies, Inc.* | 16,700 | 716,764 | |||
TETRA Technologies, Inc.* | 44,254 | 1,350,632 | |||
| 3,254,316 | |||||
Oil & Gas Exploration/Production — 3.5% | |||||
Core Laboratories NV (Netherlands) | 17,787 | 664,522 | |||
Hydril* | 6,000 | 375,600 | |||
Patterson-UTI Energy, Inc. | 46,726 | 1,539,622 | |||
Unit Corp.* | 38,883 | 2,139,732 | |||
| 4,719,476 | |||||
Oil & Gas — 0.2% | |||||
Berry Petroleum Co. | 6,000 | 343,200 | |||
Pharmaceuticals — 0.3% | |||||
Connectics Corp * | 26,470 | 382,491 | |||
Publishing — 1.0% | |||||
Courier Corp. | 11,800 | 405,212 | |||
Journal Register Co.* | 61,100 | 913,445 | |||
| 1,318,657 | |||||
Retail — 7.6% | |||||
A.C. Moore Arts & Crafts, Inc.* | 23,093 | 336,003 | |||
Blue Nile, Inc. *(a) | 15,702 | 632,948 | |||
Build-A-Bear Workshop, Inc.*(a) | 28,416 | 842,250 | |||
Cabela`s, Inc. (Class “A” Stock)*(a) | 45,908 | 762,073 | |||
Cash America International, Inc. | 59,967 | 1,390,635 | |||
Genesco, Inc.*(a) | 54,753 | 2,123,869 | |||
Red Robin Gourmet Burgers, Inc. | 22,725 | 1,158,066 | |||
Regis Corp. | 20,600 | 794,542 | |||
Ruby Tuesday, Inc. | 29,600 | 766,344 | |||
Steak N Shake Co. (The)* | 57,900 | 981,405 | |||
Tempur-Pedic International, Inc. | 45,449 | 522,663 | |||
| 10,310,798 | |||||
Retail & Merchandising — 1.4% | |||||
MSC Industrial Direct, Inc. | 47,500 | 1,910,450 | |||
School — 0.5% | |||||
Universal Technical Institute, Inc.* | 21,800 | 674,492 | |||
SEE NOTES TO FINANCIAL STATEMENTS.
B43
| SP SMALL CAP GROWTH PORTFOLIO (Continued) |
SCHEDULE OF INVESTMENTS | December 31, 2005 |
| COMMON STOCKS (Continued) | Shares | Value (Note 2) | |||
Semiconductors — 0.4% | |||||
ATMI, Inc.* | 17,250 | $ | 482,482 | ||
Semiconductors & Semiconductor Equipment — 1.9% | |||||
Intergrated Device Technology, Inc. | 122,207 | 1,610,688 | |||
OYO Geospace Corp.* | 32,503 | 925,036 | |||
| 2,535,724 | |||||
Software — 0.7% | |||||
Netsmart Technologies, Inc.* | 29,000 | 365,690 | |||
Per-Se Technologies, Inc.*(a) | 25,608 | 598,203 | |||
| 963,893 | |||||
Telecommunications — 2.9% | |||||
EMS Technologies, Inc.* | 54,119 | 957,906 | |||
Ixia* | 46,350 | 685,053 | |||
Plantronics, Inc. | 40,700 | 1,151,810 | |||
Tekelec* | 85,253 | 1,185,017 | |||
| 3,979,786 | |||||
Textiles — 1.2% | |||||
G & K Services, Inc. | 40,600 | 1,593,550 | |||
Transportation Services — 3.4% | |||||
Forward Air Corp. | 22,900 | 839,285 | |||
Heartland Express, Inc. | 49,100 | 996,239 | |||
Hub Group, Inc. | 18,800 | 664,580 | |||
Landstar System, Inc.* | 31,200 | 1,302,288 | |||
Offshore Logistics, Inc. | 28,600 | 835,120 | |||
| 4,637,512 | |||||
Waste Management — 3.5% | |||||
Duratek, Inc. | 58,031 | 866,403 | |||
Stericycle, Inc.* | 24,600 | 1,448,448 | |||
Waste Connections, Inc.* | 69,793 | 2,405,067 | |||
| 4,719,918 | |||||
TOTAL LONG-TERM INVESTMENTS | 127,919,590 | ||||
| SHORT-TERM INVESTMENT — 14.5% | Shares | Value (Note 2) | ||||
Mutual Fund | ||||||
Dryden Core Investment Fund —Taxable Money Market Series | 19,630,203 | $ | 19,630,203 | |||
TOTAL INVESTMENTS — 108.7% | 147,549,793 | |||||
LIABILITIES IN EXCESS OF | (11,835,084 | ) | ||||
NET ASSETS — 100.0% | $ | 135,714,709 | ||||
| * | Non-income producing security. |
| (a) | All or a portion of security is on loan. The aggregate market value of such securities is $9,623,765; cash collateral of $10,275,968 (included with liabilities) was received with which the portfolio purchased highly liquid short-term investments. |
| (b) | Represents security, or a portion thereof, purchased with cash collateral received for securities on loan. |
| (w) | Prudential Investments LLC, the manager of the Fund also serves as manager of the Dryden Core Investment Fund-Taxable Money Market Series. |
SEE NOTES TO FINANCIAL STATEMENTS.
B44
| SP SMALL CAP GROWTH PORTFOLIO (Continued) |
SCHEDULE OF INVESTMENTS | December 31, 2005 |
The industry classification of portfolio holdings and liabilities in excess of other assets shown as a percentage of net assets as of December 31, 2005 were as follows:
Mutual Fund (including 7.6% of collateral received for securities on loan) | 14.5 | % | |
Medical Products | 9.1 | ||
Retail | 7.6 | ||
Computer Services & Software | 5.4 | ||
Health Services | 4.7 | ||
Financial Services | 4.4 | ||
Oil & Gas Exploration/Production | 3.5 | ||
Waste Management | 3.5 | ||
Transportation Services | 3.4 | ||
Machinery & Equipment | 3.2 | ||
Diversified Manufacturing Operations | 3.0 | ||
Telecommunications | 2.9 | ||
Media | 2.8 | ||
Commercial Services & Supplies | 2.6 | ||
Insurance | 2.6 | ||
Electronic Components | 2.5 | ||
Oil & Gas Equipment & Services | 2.4 | ||
Metals & Mining | 2.1 | ||
Commercial Services | 1.9 | ||
Semiconductors & Semiconductor Equipment | 1.9 | ||
Chemicals | 1.6 | ||
Electrical Equipment | 1.5 | ||
Retail & Merchandising | 1.4 | ||
Gaming | 1.3 | ||
Consumer Products & Services | 1.2 | ||
Internet Services | 1.2 | ||
Textiles | 1.2 | ||
Distribution/Wholesale | 1.1 | ||
Banking | 1.0 | ||
Publishing | 1.0 | ||
Agricultural Products & Services | 0.9 | ||
Computers | 0.8 | ||
Autos—Cars & Trucks | 0.7 | ||
Building Materials | 0.7 | ||
Electronics | 0.7 | ||
Leisure | 0.7 | ||
Software | 0.7 | ||
Construction | 0.6 | ||
Machinery | 0.6 | ||
Entertainment | 0.5 | ||
Healthcare-Products | 0.5 | ||
Household Products | 0.5 | ||
School | 0.5 | ||
Biotechnology | 0.4 | ||
Consulting | 0.4 | ||
Food | 0.4 | ||
Instruments – Controls | 0.4 | ||
Semiconductors | 0.4 | ||
Aerospace | 0.3 | ||
Diversified Financial Services | 0.3 | ||
Internet | 0.3 | ||
Mineral Resources | 0.3 | ||
Pharmaceuticals | 0.3 | ||
Oil & Gas | 0.2 | ||
Entertainment & Leisure | 0.1 | ||
| 108.7 | |||
Liabilities in excess of other assets | (8.7 | ) | |
Total | 100.0 | % | |
SEE NOTES TO FINANCIAL STATEMENTS.
B45
| SP SMALL CAP VALUE PORTFOLIO |
SCHEDULE OF INVESTMENTS | December 31, 2005 |
| LONG-TERM INVESTMENTS — 94.1% | Value (Note 2) | ||||
| COMMON STOCKS | Shares | ||||
Advertising — 0.3% | |||||
ADVO, Inc. | 22,990 | $ | 647,858 | ||
Lamar Advertising Co.* | 6,586 | 303,878 | |||
| 951,736 | |||||
Aerospace — 2.4% | |||||
Alliant Techsystems, Inc.* | 4,620 | 351,905 | |||
DRS Technologies, Inc.* | 30,500 | 1,568,310 | |||
Ducommun, Inc.* | 26,564 | 567,407 | |||
Harsco Corp. | 26,500 | 1,789,015 | |||
Heico Corp. (Class “A” Stock) | 57,100 | 1,171,692 | |||
MTC Technologies, Inc.* | 53,347 | 1,460,641 | |||
Orbital Sciences Corp.* | 100,300 | 1,287,852 | |||
Rockwell Collins, Inc. | 7,579 | 352,196 | |||
| 8,549,018 | |||||
Agriculture/Heavy Equipment | |||||
Delta & Pine Land Co. | 6,311 | 145,216 | |||
Airlines — 0.8% | |||||
AirTran Holdings, Inc.* | 127,300 | 2,040,619 | |||
Frontier Airlines, Inc.* | 22,511 | 208,002 | |||
Skywest, Inc. | 26,100 | 701,046 | |||
| 2,949,667 | |||||
Auto Components — 0.6% | |||||
Lear Corp. | 71,100 | 2,023,506 | |||
Automobile Manufacturers — 0.8% | |||||
Wabash National Corp. | 142,993 | 2,724,017 | |||
Automotive Parts — 1.1% | |||||
Autoliv, Inc. | 3,460 | 157,153 | |||
Commercial Vehicle Group, Inc.* | 43,499 | 816,911 | |||
Cooper Tire & Rubber Co. | 125,900 | 1,928,788 | |||
Tenneco Automotive, Inc. | 50,854 | 997,247 | |||
| 3,900,099 | |||||
Banks — 0.9% | |||||
Amcore Financial, Inc. | 43,500 | 1,322,835 | |||
Cascade Financial Corp | 4,100 | 72,786 | |||
Pacific Capital Bancorp | 53,200 | 1,892,856 | |||
| 3,288,477 | |||||
Beverages | |||||
Pepsi Bottling Group, Inc. | 4,767 | 136,384 | |||
Building Materials — 0.9% | |||||
American Standard Cos., Inc. | 12,889 | 514,915 | |||
Comfort Systems USA, Inc.* | 61,513 | 565,920 | |||
Patrick Industries, Inc.* | 85,700 | 907,554 | |||
Texas Industries, Inc. | 2,334 | 116,327 | |||
Trex Co., Inc.*(a) | 2,905 | 81,485 | |||
Universal Forest Products, Inc. | 15,444 | 853,281 | |||
| 3,039,482 | |||||
Business Services — 0.7% | |||||
LECG Corp.* | 16,151 | 280,705 | |||
Resources Connection, Inc.* | 10,189 | 265,525 | |||
United Stationers, Inc. | 38,200 | 1,852,700 | |||
| 2,398,930 | |||||
| COMMON STOCKS (Continued) | Shares | Value (Note 2) | |||
Chemicals — 2.5% | |||||
Agrium, Inc. | 6,888 | $ | 151,467 | ||
Albemarle Corp. | 31,051 | 1,190,806 | |||
American Vanguard Corp. | 2,876 | 67,586 | |||
Chemtura Corp. | 17,917 | 227,546 | |||
Georgia Gulf Corp. | 31,400 | 955,188 | |||
Lyondell Chemical Co. | 32,700 | 778,914 | |||
Minerals Technologies, Inc. | 18,918 | 1,057,327 | |||
O.M. Group, Inc.* | 67,600 | 1,268,176 | |||
Olin Corp. | 56,700 | 1,115,856 | |||
Penford Corp. | 20,662 | 252,076 | |||
Rohm & Haas Co. | 5,083 | 246,119 | |||
Schulman, (A.), Inc. | 47,900 | 1,030,808 | |||
UAP Holding Corp. | 14,937 | 305,014 | |||
| 8,646,883 | |||||
Clothing & Apparel — 1.0% | |||||
Gymboree Corp.* | 23,954 | 560,524 | |||
K-Swiss, Inc. (Class “A” Stock) | 17,194 | 557,773 | |||
Kellwood Co. | 16,701 | 398,820 | |||
Mohawk Industries, Inc.* | 4,973 | 432,551 | |||
Timberland Co. (The) (Class “A” Stock) | 51,300 | 1,669,815 | |||
| 3,619,483 | |||||
Commercial Banks — 0.9% | |||||
Alabama National Bancorp | 18,015 | 1,166,651 | |||
Alliance Bankshares Corp.* | 12,686 | 203,103 | |||
Bancorp Bank (The)* | 46,265 | 786,505 | |||
Cardinal Financial Corp. | 46,494 | 511,434 | |||
KeyCorp | 11,022 | 362,955 | |||
| 3,030,648 | |||||
Commercial Services — 2.8% | |||||
BearingPoint, Inc. | 90,901 | 714,482 | |||
Cross Ctry Inc* | 92,500 | 1,644,650 | |||
ITT Educational Services, Inc.* | 13,939 | 823,934 | |||
Korn/Ferry International* | 15,900 | 297,171 | |||
Labor Ready, Inc.* | 82,300 | 1,713,486 | |||
PAREXEL International Corp.* | 24,978 | 506,054 | |||
Providence Service Corp. | 7,682 | 221,165 | |||
Steiner Leisure Ltd. | 57,400 | 2,041,144 | |||
Watson Wyatt & Co. Holdings | 63,100 | 1,760,490 | |||
| 9,722,576 | |||||
Computer Hardware — 1.2% | |||||
Hutchinson Technology, Inc. | 64,523 | 1,835,679 | |||
Mercury Computer Systems, Inc. | 60,500 | 1,248,115 | |||
Mobility Electronics, Inc.* | 43,273 | 418,017 | |||
MTS Systems Corp. | 4,406 | 152,624 | |||
Rimage Corp.* | 23,200 | 672,336 | |||
| 4,326,771 | |||||
Computer Services & Software — 1.7% | |||||
Dendrite International, Inc.* | 62,800 | 904,948 | |||
Epicor Software Corp.* | 41,544 | 587,017 | |||
EPIQ Systems, Inc.* | 65,300 | 1,210,662 | |||
Kanbay International, Inc. | 17,247 | 274,055 | |||
Micromuse* | 57,900 | 572,631 | |||
NDCHealth Corp. | 33,386 | 642,013 | |||
SEE NOTES TO FINANCIAL STATEMENTS.
B46
| SP SMALL CAP VALUE PORTFOLIO (Continued) |
SCHEDULE OF INVESTMENTS | December 31, 2005 |
| COMMON STOCKS (Continued) | Shares | Value (Note 2) | |||
Computer Services & Software (cont’d.) | |||||
NetIQ Corp.* | 54,000 | $ | 663,660 | ||
Take-Two Interactive Software, Inc.* | 40,888 | 723,717 | |||
Ultimate Software Group, Inc.* | 12,120 | 231,128 | |||
| 5,809,831 | |||||
Computers — 0.4% | |||||
Computer Sciences Corp.* | 1,950 | 98,748 | |||
Perot Systems Corp. (Class “A” Stock) | 88,000 | 1,244,320 | |||
| 1,343,068 | |||||
Construction — 0.5% | |||||
Beazer Homes USA, Inc.(a) | 9,119 | 664,228 | |||
Builders Firstsource, Inc.* | 10,476 | 223,872 | |||
Champion Enterprises, Inc.* | 14,207 | 193,499 | |||
Infrasource Services, Inc.* | 30,144 | 394,284 | |||
Modtech Holdings, Inc.*(a) | 26,782 | 250,144 | |||
WCI Communities, Inc.*(a) | 6,857 | 184,110 | |||
| 1,910,137 | |||||
Consumer Products & Services — 1.9% | |||||
Chattem, Inc. | 8,546 | 310,989 | |||
Clorox Co. | 5,857 | 333,205 | |||
Elizabeth Arden, Inc.* | 67,359 | 1,351,221 | |||
Fossil, Inc.(a) | 34,502 | 742,138 | |||
Helen of Troy Ltd. (Bermuda)* | 46,584 | 750,468 | |||
Leapfrog Enterprises, Inc.*(a) | 92,083 | 1,072,767 | |||
Newell Rubbermaid, Inc. | 14,897 | 354,251 | |||
Oneida Ltd.*(a) | 70,921 | 56,027 | |||
Playtex Products, Inc.* | 90,425 | 1,236,110 | |||
Reynolds, (R.J.) Tobacco Holdings, Inc. | 3,036 | 289,422 | |||
| 6,496,598 | |||||
Containers & Packaging — 0.9% | |||||
Packaging Corp. of America | 13,455 | 308,792 | |||
Smurfit-Stone Container Corp. | 189,000 | 2,678,130 | |||
| 2,986,922 | |||||
Distribution/Wholesale — 1.1% | |||||
CDW Corp. | 4,088 | 235,346 | |||
Hughes Supply, Inc. | 48,364 | 1,733,849 | |||
Ingram Micro, Inc. (Class “A” Stock)* | 9,178 | 182,918 | |||
NuCo2, Inc.* | 14,391 | 401,221 | |||
ScanSource, Inc.* | 9,538 | 521,538 | |||
Tech Data Corp.* | 22,000 | 872,960 | |||
| 3,947,832 | |||||
Diversified — 1.8% | |||||
Actuant Corp. (Class “A” Stock)(a) | 10,000 | 558,000 | |||
Carlisle Cos., Inc. | 2,802 | 193,758 | |||
Lydall, Inc.* | 71,743 | 584,705 | |||
Matthews International Corp. (Class “A” Stock)) | 3,882 | 141,344 | |||
Pentair, Inc. | 62,300 | 2,150,596 | |||
Roper Industries, Inc. | 56,300 | 2,224,413 | |||
Technology Investment Capital Corp. | 30,457 | 459,901 | |||
| 6,312,717 | |||||
Diversified Financial Services — 0.1% | |||||
CIT Group, Inc. | 7,157 | 370,589 | |||
| COMMON STOCKS (Continued) | Shares | Value (Note 2) | |||
Electric | |||||
Central Vermont Public Service Corp. | 6,804 | $ | 122,540 | ||
Electric Utilities — 0.2% | |||||
Entergy Corp. | 7,400 | 508,010 | |||
Electronic Components — 1.1% | |||||
Amphenol Corp. | 5,348 | 236,703 | |||
Bel Fuse, Inc. (Class “B” Stock) | 15,300 | 486,540 | |||
CyberOptics Corp.* | 24,796 | 334,250 | |||
EDO Corp. | 21,297 | 576,297 | |||
Freescale Semiconductor, Inc. (Class “A” Stock) * | 2,648 | 66,703 | |||
GrafTech International Ltd.* | 238,144 | 1,481,256 | |||
LoJack Corp.* | 27,734 | 669,221 | |||
| 3,850,970 | |||||
Electronics — 0.3% | |||||
Woodhead Industries, Inc. | 79,700 | 1,105,439 | |||
Engineering/Construction — 0.5% | |||||
EMCOR Group, Inc.* | 24,400 | 1,647,732 | |||
Entertainment — 0.1% | |||||
Activision, Inc.*(a) | 25,253 | 346,976 | |||
Entertainment & Leisure — 0.9% | |||||
Atari, Inc.* | 287,906 | 310,938 | |||
Harrah’s Entertainment, Inc. | 8,551 | 609,601 | |||
Isle of Capri Casinos*(a) | 11,979 | 291,808 | |||
K2, Inc.* | 135,459 | 1,369,491 | |||
Pegasus Solutions, Inc.* | 56,000 | 502,320 | |||
| 3,084,158 | |||||
Environmental Services — 0.4% | |||||
Republic Services, Inc. | 9,294 | 348,990 | |||
TRC Cos., Inc.* | 9,941 | 108,854 | |||
Waste Connections, Inc.*(a) | 30,096 | 1,037,108 | |||
| 1,494,952 | |||||
Equipment Services — 0.4% | |||||
Aaron Rents, Inc. | 60,733 | 1,280,252 | |||
Exchange Traded Funds — 3.8% | |||||
Ishares Nasdaq Biotech Index(a) | 22,800 | 1,761,072 | |||
Ishares Russell 2000 Value Index Fund(a) | 173,878 | 11,463,777 | |||
| 13,224,849 | |||||
Financial – Bank & Trust — 7.5% | |||||
Banctrust Financial Group, Inc. | 21,100 | 424,110 | |||
Central Pacific Financial Corp.* | 70,922 | 2,547,518 | |||
Citizens Banking Corp. | 51,305 | 1,423,714 | |||
City Bank/Lynnwood WA | 6,300 | 224,091 | |||
Commerce Bancshares, Inc. | 2,481 | 129,310 | |||
Cullen Frost Bankers, Inc. | 29,100 | 1,562,088 | |||
First Charter Corp. | 59,500 | 1,407,770 | |||
First Oak Brook Bancshares, Inc. | 9,532 | 266,419 | |||
First State Bancorporation | 60,400 | 1,448,996 | |||
FirstMerit Corp. | 10,389 | 269,179 | |||
IBERIABANK Corp. | 33,092 | 1,688,023 | |||
Investors Financial Services Corp. | 23,907 | 880,495 | |||
Irwin Financial Corp. | 24,514 | 525,090 | |||
M&T Bank Corp. | 4,190 | 456,919 | |||
Main Street Banks, Inc. | 30,658 | 834,817 | |||
SEE NOTES TO FINANCIAL STATEMENTS.
B47
| SP SMALL CAP VALUE PORTFOLIO (Continued) |
SCHEDULE OF INVESTMENTS | December 31, 2005 |
| COMMON STOCKS (Continued) | Shares | Value (Note 2) | |||
Financial – Bank & Trust (cont’d.) | |||||
Midwest Banc Holdings, Inc. | 64,847 | $ | 1,442,846 | ||
Millennium Bankshares Corp.* | 33,441 | 289,265 | |||
Nexity Financial Corp. | 13,236 | 177,362 | |||
Northern Trust Corp. | 5,802 | 300,660 | |||
Placer Sierra Bancshares | 18,337 | 508,118 | |||
Prosperity Bancshares, Inc. | 9,281 | 266,736 | |||
Signature Bank* | 29,731 | 834,549 | |||
Southcoast Financial Corp.* | 11,012 | 265,389 | |||
Sterling Bancorp | 44,696 | 881,852 | |||
Sun Bancorp, Inc.* | 3,292 | 65,017 | |||
Texas United Bancshares, Inc. | 13,247 | 240,566 | |||
Tompkins Trustco, Inc. | 9,100 | 407,680 | |||
UCBH Holdings, Inc. | 119,700 | 2,140,236 | |||
Umpqua Holdings Corp. | 69,800 | 1,991,394 | |||
United Community Banks, Inc. | 28,800 | 767,808 | |||
Webster Financial Corp. | 22,700 | 1,064,630 | |||
Zions Bancorporation | 7,603 | 574,483 | |||
| 26,307,130 | |||||
Financial Services — 5.2% | |||||
Accredited Home(a) | 51,967 | 2,576,524 | |||
Affiliated Managers Group, Inc.* | 16,851 | 1,352,293 | |||
American Capital Strategies Ltd. | 3,423 | 123,947 | |||
Apollo Investment Corp. | 60,980 | 1,093,371 | |||
BankUnited Financial Corp. | 38,950 | 1,034,902 | |||
Bear Stearns Cos., Inc. | 4,502 | 520,116 | |||
Berkshire Hills Bancorp, Inc. | 17,186 | 575,731 | |||
Brookline Bancorp, Inc. | 45,416 | 643,545 | |||
Capital Source, Inc.*(a) | 47,230 | 1,057,952 | |||
Eaton Vance Corp. | 5,260 | 143,914 | |||
Fidelity Bankshares, Inc. | 36,314 | 1,187,468 | |||
Financial Federal Corp.(a) | 54,743 | 2,433,326 | |||
First Niagara Financial Group, Inc. | 103,794 | 1,501,899 | |||
Knight Trading Group, Inc. | 86,190 | 852,419 | |||
PFF Bancorp, Inc. | 60,293 | 1,840,142 | |||
Portfolio Recovery Associates, Inc.* | 30,100 | 1,397,844 | |||
| 18,335,393 | |||||
Foods — 1.0% | |||||
Archer-Daniels-Midland Co. | 12,378 | 305,242 | |||
Corn Products International, Inc. | 19,115 | 456,657 | |||
Del Monte Foods Co.* | 225,100 | 2,347,793 | |||
Smithfield Foods, Inc.* | 10,130 | 309,978 | |||
| 3,419,670 | |||||
Forest Products — 0.2% | |||||
Pope & Talbot, Inc. | 96,000 | 799,680 | |||
Hand/Machine Tools — 0.3% | |||||
Snap-On, Inc. | 27,900 | 1,047,924 | |||
Healthcare Services — 1.3% | |||||
AMERIGROUP Corp.* | 52,600 | 1,023,596 | |||
Apria Healthcare Group, Inc.* | 60,486 | 1,458,317 | |||
Coventry Health Care, Inc.* | 3,750 | 213,600 | |||
Health Net, Inc.* | 5,600 | 288,680 | |||
National Dentex Corp.* | 4,900 | 110,446 | |||
Rehabcare Group, Inc.* | 71,300 | 1,440,260 | |||
| 4,534,899 | |||||
| COMMON STOCKS (Continued) | Shares | Value (Note 2) | |||
Home Furnishings — 0.3% | |||||
Furniture Brands International, Inc. | 54,000 | $ | 1,205,820 | ||
Hotels & Motels — 0.3% | |||||
Aztar Corp.* | 31,648 | 961,783 | |||
Household Durables — 0.1% | |||||
Lennar Corp. (Class “A” Stock)(a) | 7,649 | 466,742 | |||
Industrial Products — 0.1% | |||||
Cooper Industries Ltd. (Class “A” Stock) (Bermuda) | 5,220 | 381,060 | |||
Insurance — 4.7% | |||||
Ambac Financial Group, Inc. | 8,686 | 669,343 | |||
Aspen Insurance Holdings, Ltd. (Bermuda)* | 15,488 | 366,601 | |||
Assurant, Inc. | 3,370 | 146,561 | |||
CNA Financial Corp.* | 70,792 | 1,031,440 | |||
Donegal Group, Inc. | 14,876 | 345,718 | |||
EMC Insurance Group, Inc. | 58,300 | 1,162,502 | |||
Everest Reinsurance Group Ltd. (Bermuda) | 4,169 | 418,359 | |||
Midland Co. (The) | 24,591 | 886,260 | |||
National Atlantic Holdings Corp.* | 13,283 | 145,449 | |||
Navigators Group, Inc.* | 14,379 | 627,068 | |||
NYMAGIC, Inc. | 10,310 | 255,585 | |||
PartnerRe Ltd. (Bermuda) | 4,018 | 263,862 | |||
PMI Group, Inc. (The) | 59,045 | 2,424,978 | |||
ProAssurance Corp.* | 23,955 | 1,165,171 | |||
Procentury Corp. | 43,519 | 467,829 | |||
PXRE Group Ltd. (Bermuda) (a) | 22,616 | 293,103 | |||
RenaissanceRe Holdings Ltd. | 5,373 | 237,003 | |||
Republic Companies Group, Inc. | 31,617 | 489,431 | |||
Rli Corp. | 50,143 | 2,500,632 | |||
StanCorp Financial Group, Inc. | 16,187 | 808,541 | |||
Torchmark Corp. | 6,617 | 367,905 | |||
Triad Guaranty, Inc.* | 29,400 | 1,293,306 | |||
Willis Group Holdings Ltd. | 5,667 | 209,339 | |||
| 16,575,986 | |||||
Insurance – Life Insurance — 0.2% | |||||
American Equity Investment Life Holding Co. | 43,266 | 564,621 | |||
Internet Services — 0.9% | |||||
Autobytel, Inc.* | 74,926 | 370,134 | |||
Avocent Corp.* | 2,513 | 68,329 | |||
Lionbridge Technologies, Inc.* | 194,891 | 1,368,135 | |||
McAfee, Inc.* | 37,600 | 1,020,088 | |||
NetBank, Inc. | 53,183 | 381,854 | |||
| 3,208,540 | |||||
Machinery & Equipment — 3.4% | |||||
Albany International Corp. | 57,000 | 2,061,120 | |||
Applied Industrial Technologies, Inc. | 8,176 | 275,449 | |||
Baldor Electric Co. | 20,093 | 515,386 | |||
Franklin Electric Co., Inc. | 14,228 | 562,575 | |||
IDEX Corp. | 54,900 | 2,256,939 | |||
Kennametal, Inc. | 30,600 | 1,561,824 | |||
Lindsay Manufacturing Co. | 17,800 | 342,294 | |||
Sauer-Danfoss, Inc. | 67,100 | 1,262,151 | |||
SEE NOTES TO FINANCIAL STATEMENTS.
B48
| SP SMALL CAP VALUE PORTFOLIO (Continued) |
SCHEDULE OF INVESTMENTS | December 31, 2005 |
| COMMON STOCKS (Continued) | Shares | Value (Note 2) | |||
Machinery & Equipment (cont’d.) | |||||
Stanley Works (The) | 4,882 | $ | 234,531 | ||
Tennant Co. | 5,696 | 296,192 | |||
Terex Corp.* | 12,428 | 738,223 | |||
Wabtec Corp. | 59,800 | 1,608,620 | |||
Zebra Technologies Corp. | 8,450 | 362,083 | |||
| 12,077,387 | |||||
Medical Supplies & Equipment — 0.8% | |||||
Biosite, Inc.(a) | 3,734 | 210,187 | |||
Cardiac Science Corp. | 39,783 | 360,036 | |||
Encore Medical Corp. | 111,447 | 551,663 | |||
PSS World Medical, Inc.* | 53,270 | 790,527 | |||
Symmetry Medical, Inc. | 30,389 | 589,243 | |||
Thermogenesis Corp.* | 25,350 | 122,440 | |||
| 2,624,096 | |||||
Metals & Mining — 3.1% | |||||
Allegheny Technologies, Inc. | 4,760 | 171,741 | |||
Carpenter Technology Corp. | 2,237 | 157,641 | |||
Commercial Metals Co. | 38,308 | 1,438,082 | |||
Earle M. Jorgensen Co.* | 69,711 | 643,433 | |||
Gibraltar Industries, Inc. | 72,700 | 1,667,738 | |||
Kaydon Corp. | 57,500 | 1,848,050 | |||
Mueller Industries, Inc. | 72,101 | 1,977,009 | |||
Oregon Steel Mills, Inc.* | 30,138 | 886,660 | |||
Schnitzer Steel Industries, Inc. | 4,794 | 146,649 | |||
Timken Co. | 64,600 | 2,068,492 | |||
| 11,005,495 | |||||
Miscellaneous Manufacturers — 0.5% | |||||
AptarGroup, Inc. | 31,000 | 1,618,200 | |||
Multi-line Retail — 0.2% | |||||
J.C. Penney Co., Inc. | 13,965 | 776,454 | |||
Networking/Telecom Equipment — 0.2% | |||||
Aeroflex, Inc.* | 78,441 | 843,241 | |||
Office Equipment — 0.7% | |||||
IKON Office Solutions, Inc. | 115,300 | 1,200,273 | |||
John H. Harland Co. | 29,900 | 1,124,240 | |||
| 2,324,513 | |||||
Oil Field Equipment & Services | |||||
Grant Prideco, Inc.* | 3,100 | 136,772 | |||
Oil, Gas & Consumable Fuels — 6.6% | |||||
AGL Resources, Inc. | 14,394 | 501,055 | |||
BJ Services Co. | 12,986 | 476,197 | |||
Denbury Resources, Inc. | 77,300 | 1,760,894 | |||
EOG Resources, Inc. | 9,731 | 713,963 | |||
Hydril Co.* | 6,831 | 427,621 | |||
National-Oilwell Varco, Inc.* | 35,900 | 2,250,930 | |||
New Jersey Resources Corp. | 19,000 | 795,910 | |||
Newfield Exploration Co.* | 28,800 | 1,442,016 | |||
Northwest Natural Gas Co. | 54,386 | 1,858,914 | |||
Oil States International* | 30,708 | 972,829 | |||
Parallel Petroleum Corp.* | 35,305 | 600,538 | |||
Petroleum Development Corp.* | 5,596 | 186,571 | |||
Range Resources Corp. | 119,702 | 3,152,949 | |||
| COMMON STOCKS (Continued) | Shares | Value (Note 2) | |||
Oil, Gas & Consumable Fuels (cont’d.) | |||||
South Jersey Industries, Inc. | 16,009 | $ | 466,502 | ||
Southwest Gas Corp. | 18,739 | 494,710 | |||
Superior Well Services, Inc. | 25,986 | 617,427 | |||
Todco (Class “A” Stock)* | 35,200 | 1,339,712 | |||
W-H Energy Services, Inc.* | 17,575 | 581,381 | |||
Western Gas Resource, Inc. | 8,361 | 393,720 | |||
Whiting Petroleum Corp.* | 45,134 | 1,805,360 | |||
Williams Cos., Inc. | 22,232 | 515,115 | |||
XTO Energy, Inc. | 43,400 | 1,906,996 | |||
| 23,261,310 | |||||
Paper & Forest Products — 0.3% | |||||
Caraustar Industries, Inc.* | 135,059 | 1,173,663 | |||
Petroleum Exploration & Production — 0.3% | |||||
Delta Petroleum Corp.*(a) | 30,191 | 657,258 | |||
Ultra Petroleum Corp. | 5,000 | 279,000 | |||
| 936,258 | |||||
Pharmaceuticals — 1.4% | |||||
Bentley Pharmaceuticals, Inc. | 120,500 | 1,977,405 | |||
Charles River Laboratories International, Inc.*(a) | 8,619 | 365,187 | |||
Medarex, Inc.*(a) | 60,375 | 836,194 | |||
MedImmune, Inc.* | 11,538 | 404,061 | |||
Prestige Brands Holdings, Inc.* | 54,444 | 680,550 | |||
Salix Pharmaceuticals Ltd.* | 26,300 | 462,354 | |||
| 4,725,751 | |||||
Printing & Publishing — 0.2% | |||||
Dow Jones & Co., Inc. | 8,112 | 287,895 | |||
Journal Register Co.* | 36,344 | 543,343 | |||
| 831,238 | |||||
Real Estate — 0.1% | |||||
Plum Creek Timber Co. | 10,373 | 373,947 | |||
Real Estate Investment Trust — 5.6% | |||||
American Land Lease, Inc. | 28,600 | 676,962 | |||
Cogdell Spencer, Inc. | 15,515 | 262,048 | |||
Commercial Net Lease Realty, Inc. | 51,163 | 1,042,190 | |||
Cousins Properties, Inc. | 46,700 | 1,321,610 | |||
Crane Co. | 61,700 | 2,176,159 | |||
Developers Diversified Realty Corp. | 7,179 | 337,557 | |||
Duke Realty Corp. | 20,200 | 674,680 | |||
Entertainment Properties Trust | 16,779 | 683,744 | |||
Equity One, Inc. | 44,100 | 1,019,592 | |||
Equity Residential Properties Trust | 3,712 | 145,213 | |||
Healthcare Realty Trust, Inc. | 1,767 | 58,788 | |||
Host Marriot Corp. | 62,900 | 1,191,955 | |||
iStar Financial, Inc. | 11,275 | 401,954 | |||
LaSalle Hotel Properties | 61,283 | 2,250,312 | |||
Lexington Corp. Properties Trust | 39,418 | 839,603 | |||
Liberty Property Trust | 21,480 | 920,418 | |||
MFA Mortgage Investments, Inc. | 115,610 | 658,977 | |||
Pan Pacific Retail Properties, Inc. | 24,700 | 1,652,183 | |||
Parkway Properties, Inc. | 25,008 | 1,003,821 | |||
Post Properties, Inc. | 8,568 | 342,292 | |||
Prentiss Properties Trust | 20,745 | 843,907 | |||
Rait Investment | 39,453 | 1,022,622 | |||
| 19,526,587 | |||||
SEE NOTES TO FINANCIAL STATEMENTS.
B49
| SP SMALL CAP VALUE PORTFOLIO (Continued) |
SCHEDULE OF INVESTMENTS | December 31, 2005 |
| COMMON STOCKS (Continued) | Shares | Value (Note 2) | |||
Real Estate Investment Trust – Apartment — 0.3% | |||||
American Campus Communities, Inc.* | 6,573 | $ | 163,011 | ||
Apartment Investment & Management Co. (Class “A” Stock) | 9,085 | 344,049 | |||
Town & Country Trust*(a) | 13,388 | 452,648 | |||
| 959,708 | |||||
Real Estate Investment Trust – Hotels | |||||
Hersha Hospitality Trust | 17,098 | 154,053 | |||
Real Estate Investment Trust – Office Industrial — 0.6% | |||||
Biomed Realty Trust, Inc. | 29,785 | 726,754 | |||
Brandywine Realty Trust | 41,004 | 1,144,421 | |||
Columbia Equity Trust, Inc. | 4,454 | 71,932 | |||
Corporate Office Properties Trust | 6,531 | 232,112 | |||
| 2,175,219 | |||||
Real Estate Investment Trust – Other Reit — 0.8% | |||||
Agree Realty Corp. | 19,136 | 553,030 | |||
Centacore Properties Trust | 26,787 | 719,767 | |||
Digital Realty Trust, Inc. | 15,887 | 359,523 | |||
Omega Healthcare Investors, Inc. | 59,928 | 754,493 | |||
Spirit Finance Corp.* | 31,857 | 361,577 | |||
| 2,748,390 | |||||
Restaurants — 0.4% | |||||
BUCA, Inc.* | 28,916 | 157,592 | |||
CEC Entertainment, Inc.* | 32,612 | 1,110,112 | |||
Ruby Tuesday, Inc. | 5,767 | 149,308 | |||
| 1,417,012 | |||||
Retail — 0.1% | |||||
Charming Shoppes, Inc.* | 19,938 | 263,182 | |||
Retail & Merchandising — 4.4% | |||||
Big Lots, Inc.* | 44,121 | 529,893 | |||
California Pizza Kitchen, Inc.* | 12,908 | 412,669 | |||
Cato Corp. (Class “A” Stock) | 100,500 | 2,155,725 | |||
Deb Shops, Inc. | 28,000 | 832,440 | |||
Dillard’s, Inc. (Class “A” Stock) | 46,700 | 1,159,094 | |||
Dress Barn, Inc.* | 15,354 | 592,818 | |||
Federated Department Stores, Inc. | 4,356 | 288,934 | |||
Fox & Hound Restaurant Group* | 11,303 | 173,953 | |||
Insight Enterprises, Inc.* | 92,000 | 1,804,120 | |||
Linens ‘n Things, Inc.* | 43,200 | 1,149,120 | |||
O’ Charleys, Inc.* | 104,900 | 1,626,999 | |||
Ross Stores, Inc.(a) | 10,367 | 299,606 | |||
School Specialty, Inc. | 14,214 | 517,958 | |||
Select Comfort Corp.* | 78,272 | 2,140,739 | |||
Sharper Image Corp.* | 5,268 | 51,310 | |||
The Buckle, Inc. | 28,100 | 905,944 | |||
Tuesday Morning Corp.* | 21,555 | 450,931 | |||
Zale Corp.* | 12,501 | 314,400 | |||
| 15,406,653 | |||||
Self Storage — 0.1% | |||||
U-Store-It Trust | 23,850 | 502,042 | |||
Semiconductors | |||||
Diodes, Inc. | 1,653 | 51,326 | |||
| COMMON STOCKS (Continued) | Shares | Value (Note 2) | |||
Semi-Conductor & Semi-Conductor Instruments — 0.3% | |||||
Cabot Microelectronics Corp.*(a) | 32,550 | $ | 954,691 | ||
Semiconductors — 2.8% | |||||
ATI Technologies, Inc.* | 96,700 | 1,642,933 | |||
Entegris, Inc.* | 30,901 | 291,088 | |||
Exar Corp.* | 83,200 | 1,041,664 | |||
Fairchild Semiconductor International, Inc.* | 6,220 | 105,180 | |||
Formfactor, Inc.* | 8,374 | 204,577 | |||
Intergrated Device Technology, Inc. | 108,288 | 1,427,236 | |||
Tektronix, Inc. | 67,400 | 1,901,354 | |||
Tessera Technologies, Inc.*(a) | 48,611 | 1,256,594 | |||
Varian Semiconductor Equipment Associates, Inc.* | 42,100 | 1,849,453 | |||
| 9,720,079 | |||||
Shopping Centers — 0.1% | |||||
Acadia Realty Trust | 24,851 | 498,263 | |||
Technology – Computer Software — 0.1% | |||||
Viisage Technology, Inc.* | 24,322 | 428,310 | |||
Telecommunications — 2.2% | |||||
ADC Telecommunications, Inc. | 8,450 | 188,773 | |||
Alaska Communications Systems Group, Inc. | 18,540 | 188,366 | |||
Andrew Corp. | 26,534 | 284,710 | |||
Anixter International, Inc. | 43,324 | 1,694,835 | |||
Black Box Corp. | 35,000 | 1,658,300 | |||
Ditech Communications Corp. | 41,956 | 350,333 | |||
Dobson Communications Corp.* | 67,888 | 509,160 | |||
Leap Wireless International, Inc.* | 7,848 | 297,282 | |||
RCN Corp.(a) | 15,029 | 352,430 | |||
UbiquiTel, Inc.* | 23,452 | 231,940 | |||
West Corp.* | 46,244 | 1,949,185 | |||
| 7,705,314 | |||||
Transportation — 1.4% | |||||
Arkansas Best Corp.(a) | 44,500 | 1,943,760 | |||
Forward Air Corp. | 3,988 | 146,160 | |||
Heartland Express, Inc. | 17,816 | 361,487 | |||
Kirby Corp.* | 27,700 | 1,445,109 | |||
Norfolk Southern Corp. | 6,900 | 309,327 | |||
SCS Transportation, Inc.* | 27,393 | 582,101 | |||
Teekay Shipping Corp.(a) | 5,641 | 225,076 | |||
| 5,013,020 | |||||
Utilities — 2.0% | |||||
Avista Corp. | 16,226 | 287,363 | |||
CH Energy Group, Inc. | 59 | 2,708 | |||
Cleco Corp. | 26,179 | 545,832 | |||
CMS Energy Corp.* | 3,905 | 56,662 | |||
Edison International | 11,076 | 483,024 | |||
El Paso Electric Co. | 78,611 | 1,653,975 | |||
FirstEnergy Corp. | 3,526 | 172,739 | |||
MGE Energy, Inc. | 15,065 | 510,854 | |||
Northeast Utilities | 6,134 | 120,779 | |||
PG&E Corp. | 15,569 | 577,921 | |||
PNM Resources, Inc. | 2,994 | 73,323 | |||
PPL Corp. | 23,918 | 703,189 | |||
Public Service Enterprise Group, Inc. | 1,407 | 91,413 | |||
SEE NOTES TO FINANCIAL STATEMENTS.
B50
| SP SMALL CAP VALUE PORTFOLIO (Continued) |
SCHEDULE OF INVESTMENTS | December 31, 2005 |
| COMMON STOCKS (Continued) | Shares | Value (Note 2) | ||||
Utilities (cont’d.) | ||||||
Sierra Pacific Resources | 24,895 | $ | 324,631 | |||
Unisource Energy Corp. | 8,092 | 252,470 | ||||
Westar Energy, Inc. | 34,950 | 751,425 | ||||
Wisconsin Energy Corp. | 5,769 | 225,337 | ||||
| 6,833,645 | ||||||
TOTAL LONG-TERM INVESTMENTS | 330,171,533 | |||||
| SHORT-TERM INVESTMENT — 13.9% | ||||||
Money Market Mutual Fund | ||||||
Dryden Core Investment Fund — | 48,715,973 | 48,715,973 | ||||
TOTAL INVESTMENTS — 108.0% | 378,887,506 | |||||
LIABILITIES IN EXCESS OF OTHER | (28,183,165 | ) | ||||
NET ASSETS — 100.0% | $ | 350,704,341 | ||||
| * | Non-income producing security. |
| (a) | All or a portion of security is on loan. The aggregate market value of such securities is $30,938,521; cash collateral of $32,114,160 (included with liabilities) was received with which the portfolio purchased highly liquid short-term investments. |
| (b) | Represents security, or a portion thereof, purchased with cash collateral received for securities on loan. |
| (w) | Prudential Investments LLC, the manager of the Fund also serves as manager of the Dryden Core Investment Fund-Taxable Money Market Series. |
SEE NOTES TO FINANCIAL STATEMENTS.
B51
| SP SMALL CAP VALUE PORTFOLIO (Continued) |
SCHEDULE OF INVESTMENTS | December 31, 2005 |
The industry classification of long-term portfolio holdings, short-term investments and other assets in excess of liabilities shown as a percentage of net assets as of December 31, 2005 as follows:
Mutual Fund (including 9.2% of collateral received for securities on loan) | 13.9 | % | |
Oil, Gas & Consumable Fuels | 6.6 | ||
Real Estate Investment Trust | 5.6 | ||
Financial Services | 5.2 | ||
Insurance | 4.7 | ||
Retail & Merchandising | 4.4 | ||
Exchange Traded Funds | 3.8 | ||
Machinery & Equipment | 3.4 | ||
Metals & Mining | 3.1 | ||
Commercial Services | 2.8 | ||
Semiconductors | 2.8 | ||
Chemicals | 2.5 | ||
Aerospace | 2.4 | ||
Telecommunications | 2.2 | ||
Utilities | 2.0 | ||
Consumer Products & Services | 1.9 | ||
Diversified | 1.8 | ||
Computer Services & Software | 1.7 | ||
Pharmaceuticals | 1.4 | ||
Transportation | 1.4 | ||
Healthcare Services | 1.3 | ||
Computer Hardware | 1.2 | ||
Automotive Parts | 1.1 | ||
Distribution/Wholesale | 1.1 | ||
Electronic Components | 1.1 | ||
Clothing & Apparel | 1.0 | ||
Foods | 1.0 | ||
Banks | 0.9 | ||
Building Materials | 0.9 | ||
Commercial Banks | 0.9 | ||
Containers & Packaging | 0.9 | ||
Entertainment & Leisure | 0.9 | ||
Internet Services | 0.9 | ||
Airlines | 0.8 | ||
Automobile Manufacturers | 0.8 | ||
Medical Supplies & Equipment | 0.8 | ||
Real Estate Investment Trust – Other Reit | 0.8 | ||
Business Services | 0.7 | ||
Office Equipment | 0.7 | ||
Auto Components | 0.6 | ||
Real Estate Investment Trust – Office Industrial | 0.6 | ||
Construction | 0.5 | ||
Engineering/Construction | 0.5 | ||
Miscellaneous Manufacturers | 0.5 | ||
Computers | 0.4 | ||
Environmental Services | 0.4 | ||
Equipment Services | 0.4 | ||
Restaurants | 0.4 | ||
Advertising | 0.3 | ||
Electronics | 0.3 | ||
Hand/Machine Tools | 0.3 | ||
Home Furnishings | 0.3 | ||
Hotels & Motels | 0.3 | ||
Paper & Forest Products | 0.3 | ||
Petroleum Exploration & Production | 0.3 | ||
Real Estate Investment Trust – Apartment | 0.3 | ||
Semi-Conductor & Semi-Conductor Instruments | 0.3 |
Electric Utilities | 0.2 | % | |
Forest Products | 0.2 | ||
Insurance – Life Insurance | 0.2 | ||
Multiline Retail | 0.2 | ||
Networking/Telecom Equipment | 0.2 | ||
Printing & Publishing | 0.2 | ||
Diversified Financial Services | 0.1 | ||
Entertainment | 0.1 | ||
Household Durables | 0.1 | ||
Industrial Products | 0.1 | ||
Real Estate | 0.1 | ||
Retail | 0.1 | ||
Self Storage | 0.1 | ||
Shopping Centers | 0.1 | ||
Technology – Computer Software | 0.1 | ||
| 108.0 | |||
Liabilities in excess of other assets | (8.0 | ) | |
Total | 100.0 | % | |
SEE NOTES TO FINANCIAL STATEMENTS.
B52
| SP STRATEGIC PARTNERS FOCUSED GROWTH PORTFOLIO |
SCHEDULE OF INVESTMENTS | December 31, 2005 |
| LONG-TERM INVESTMENTS — 98.8% | Value (Note 2) | ||||
| COMMON STOCKS | Shares | ||||
Apparel — 2.7% | |||||
Nike, Inc. (Class “B” Stock) | 25,300 | $ | 2,195,787 | ||
Biotechnology — 5.2% | |||||
Amgen, Inc.* | 29,100 | 2,294,826 | |||
Genentech, Inc.* | 20,900 | 1,933,250 | |||
| 4,228,076 | |||||
Capital Markets — 6.9% | |||||
Charles Schwab Corp. (The) | 120,300 | 1,764,801 | |||
Franklin Resources, Inc. | 17,500 | 1,645,175 | |||
Merrill Lynch & Co., Inc. | 32,500 | 2,201,225 | |||
| 5,611,201 | |||||
Communication Equipment — 4.1% | |||||
Juniper Networks, Inc.* | 57,500 | 1,282,250 | |||
Qualcomm, Inc. | 46,500 | 2,003,220 | |||
| 3,285,470 | |||||
Computers & Peripherals — 5.0% | |||||
Apple Computer, Inc.* | 56,300 | 4,047,407 | |||
Consumer Finance — 2.8% | |||||
American Express Co. | 43,700 | 2,248,802 | |||
Consumer Products & Services — 4.9% | |||||
Procter & Gamble Co. | 68,200 | 3,947,416 | |||
Diversified Financial Services — 1.0% | |||||
Goldman Sachs Group, Inc. | 6,200 | 791,802 | |||
Food & Staples Retailing — 2.4% | |||||
Whole Foods Market, Inc. | 25,200 | 1,950,228 | |||
Health Care Equipment & Supplies — 0.8% | |||||
St. Jude Medical, Inc.* | 13,200 | 662,640 | |||
Health Care Providers & Services — 8.4% | |||||
Caremark Rx, Inc.* | 39,000 | 2,019,810 | |||
UnitedHealth Group, Inc. | 77,100 | 4,790,994 | |||
| 6,810,804 | |||||
Industrial Conglomerates — 2.2% | |||||
General Electric Co. | 51,800 | 1,815,590 | |||
Insurance — 3.3% | |||||
ACE Ltd. | 22,900 | 1,223,776 | |||
American International Group, Inc. | 21,200 | 1,446,476 | |||
| 2,670,252 | |||||
Internet & Catalog Retail — 4.6% | |||||
eBay, Inc. | 85,650 | 3,704,362 | |||
Internet Software & Services — 8.9% | |||||
Google, Inc. (Class “A” Stock)* | 10,720 | 4,447,299 | |||
Yahoo!, Inc.* | 71,500 | 2,801,370 | |||
| 7,248,669 | |||||
Medical Supplies & Equipment — 0.9% | |||||
Zimmer Holdings, Inc.* | 11,150 | 751,956 | |||
Multiline Retail — 2.5% | |||||
Target Corp. | 36,900 | 2,028,393 | |||
Oil & Gas Drilling — 2.7% | |||||
Nabors Industries Ltd.* | 28,500 | 2,158,875 | |||
| COMMON STOCKS (Continued) | Shares | Value (Note 2) | |||
Oil, Gas & Consumable Fuels — 6.2% | |||||
Halliburton Co. | 12,100 | $ | 749,716 | ||
Occidental Petroleum Corp. | 26,700 | 2,132,796 | |||
Schlumberger Ltd. | 22,200 | 2,156,730 | |||
| 5,039,242 | |||||
Pharmaceuticals — 7.9% | |||||
Alcon, Inc. (Switzerland) | 9,600 | 1,244,160 | |||
Gilead Sciences, Inc.* | 36,900 | 1,942,047 | |||
Roche Holdings, Ltd., ADR (Switzerland) | 26,000 | 1,946,129 | |||
Teva Pharmaceutical Industries Ltd., ADR (Israel) | 29,700 | 1,277,397 | |||
| 6,409,733 | |||||
Semi-Conductors — 4.4% | |||||
Marvell Technology Group Ltd.* (Bermuda) | 64,300 | 3,606,587 | |||
Software — 6.9% | |||||
Adobe Systems, Inc. | 71,100 | 2,627,856 | |||
Electronic Arts, Inc.* | 15,900 | 831,729 | |||
Microsoft Corp. | 82,700 | 2,162,605 | |||
| 5,622,190 | |||||
Specialty Retail — 2.3% | |||||
Lowe’s Cos., Inc. | 27,450 | 1,829,817 | |||
Telecommunications — 1.8% | |||||
Corning, Inc.* | 73,600 | 1,446,976 | |||
TOTAL LONG-TERM INVESTMENTS | 80,112,275 | ||||
| SHORT-TERM INVESTMENT — 1.0% | |||||
Mutual Fund | |||||
Dryden Core Investment Fund — | 785,524 | 785,524 | |||
TOTAL INVESTMENTS — 99.8% | 80,897,799 | ||||
OTHER ASSETS IN EXCESS OF | 156,236 | ||||
NET ASSETS — 100.0% | $ | 81,054,035 | |||
The following abbreviations are used in portfolio descriptions:
| ADR | American Depositary Receipt |
| * | Non-income producing security. |
| (w) | Prudential Investments LLC, the manager of the Fund also serves as manager of the Dryden Core Investment Fund-Taxable Money Market Series. |
SEE NOTES TO FINANCIAL STATEMENTS.
B53
| SP STRATEGIC PARTNERS FOCUSED GROWTH PORTFOLIO (Continued) |
SCHEDULE OF INVESTMENTS | December 31, 2005 |
The industry classification of portfolio holdings and other assets in excess of liabilities shown as a percentage of net assets as of December 31, 2005 was as follows:
Internet Software & Services | 8.9 | % | |
Health Care Providers & Services | 8.4 | ||
Pharmaceuticals | 7.9 | ||
Capital Markets | 6.9 | ||
Software | 6.9 | ||
Oil, Gas & Consumable Fuels | 6.2 | ||
Biotechnology | 5.2 | ||
Computers & Peripherals | 5.0 | ||
Consumer Products & Services | 4.9 | ||
Internet & Catalog Retail | 4.6 | ||
Semi-Conductors | 4.4 | ||
Communication Equipment | 4.1 | ||
Insurance | 3.3 | ||
Consumer Finance | 2.8 | ||
Apparel | 2.7 | ||
Oil & Gas Drilling | 2.7 | ||
Multiline Retail | 2.5 | ||
Food & Staples Retailing | 2.4 | ||
Specialty Retail | 2.3 | ||
Industrial Conglomerates | 2.2 | ||
Telecommunications | 1.8 | ||
Diversified Financial Services | 1.0 | ||
Mutual Fund | 1.0 | ||
Medical Supplies & Equipment | 0.9 | ||
Health Care Equipment & Supplies | 0.8 | ||
| 99.8 | |||
Other assets in excess of liabilities | 0.2 | ||
| 100.0 | % | ||
SEE NOTES TO FINANCIAL STATEMENTS.
B54
| SP T. ROWE PRICE LARGE CAP GROWTH PORTFOLIO |
SCHEDULE OF INVESTMENTS | December 31, 2005 |
| LONG-TERM INVESTMENTS — 97.0% | Value (Note 2) | ||||
| COMMON STOCKS | Shares | ||||
Advertising — 1.3% | |||||
Lamar Advertising Co.* | 20,700 | $ | 955,098 | ||
Aerospace/Defense — 0.9% | |||||
General Dynamics Corp. | 5,700 | 650,085 | |||
Airlines — 1.3% | |||||
Southwest Airlines Co. | 60,400 | 992,372 | |||
Cable Television — 2.5% | |||||
Rogers Communications, Inc. | 43,700 | 1,846,762 | |||
Computer Services & Software — 10.7% | |||||
Automatic Data Processing, Inc. | 22,000 | 1,009,580 | |||
Electronic Arts, Inc.* | 7,000 | 366,170 | |||
EMC Corp.* | 85,000 | 1,157,700 | |||
Microsoft Corp. | 109,400 | 2,860,810 | |||
NAVTEQ Corp.* | 15,900 | 697,533 | |||
Oracle Corp.* | 89,200 | 1,089,132 | |||
Red Hat, Inc.* | 24,900 | 678,276 | |||
| 7,859,201 | |||||
Computers — 2.5% | |||||
Dell, Inc. | 60,600 | 1,817,394 | |||
Consumer Products & Services — 1.8% | |||||
Accenture Ltd. (Class “A” Stock)* | 47,300 | 1,365,551 | |||
Drugs & Medicine — 9.4% | |||||
Amgen, Inc. | 18,600 | 1,466,796 | |||
Caremark Rx, Inc.* | 15,100 | 782,029 | |||
Genentech, Inc.* | 10,800 | 999,000 | |||
Gilead Sciences, Inc.* | 20,600 | 1,084,178 | |||
Humana, Inc. | 11,300 | 613,929 | |||
St. Jude Medical, Inc.* | 16,000 | 803,200 | |||
WellPoint, Inc.* | 14,900 | 1,188,871 | |||
| 6,938,003 | |||||
Education — 1.1% | |||||
Apollo Group, Inc. | 13,600 | 822,256 | |||
Electronic Components — 2.1% | |||||
Garmin Ltd. | 11,400 | 756,390 | |||
Harman International Industries, Inc. | 7,800 | 763,230 | |||
| 1,519,620 | |||||
Farming & Agriculture — 1.4% | |||||
Monsanto Co. | 13,000 | 1,007,890 | |||
Financial – Bank & Trust — 2.4% | |||||
State Street Corp. | 32,100 | 1,779,624 | |||
Financial Services — 7.8% | |||||
Ameritrade Holding Corp.* | 57,200 | 1,372,800 | |||
Citigroup, Inc. | 25,900 | 1,256,927 | |||
Franklin Resources, Inc. | 9,100 | 855,491 | |||
Legg Mason, Inc. | 5,800 | 694,202 | |||
SLM Corp. | 28,300 | 1,559,047 | |||
| 5,738,467 | |||||
Food & Staples Retailing — 4.3% | |||||
Sysco Corp. | 39,100 | 1,214,055 | |||
Wal-Mart Stores, Inc. | 42,200 | 1,974,960 | |||
| 3,189,015 | |||||
| COMMON STOCKS (Continued) | Shares | Value (Note 2) | |||
Health Care Providers & Services — 3.5% | |||||
UnitedHealth Group, Inc. | 41,700 | $ | 2,591,238 | ||
Hotels, Restaurants & Leisure — 4.6% | |||||
Carnival Corp. (Panama) | 23,400 | 1,251,198 | |||
International Game Technology | 40,000 | 1,231,200 | |||
Wynn Resorts Ltd.* | 16,100 | 883,085 | |||
| 3,365,483 | |||||
Internet Services — 3.8% | |||||
Google, Inc. (Class “A” Stock)* | 3,300 | 1,369,038 | |||
Yahoo!, Inc.* | 37,100 | 1,453,578 | |||
| 2,822,616 | |||||
Manufacturing — 2.4% | |||||
Danaher Corp. | 32,000 | 1,784,960 | |||
Media — 0.9% | |||||
E.W. Scripps Co., (Class “A” Stock) | 14,400 | 691,488 | |||
Medical Supplies & Equipment — 3.7% | |||||
Cardinal Health, Inc. | 8,700 | 598,125 | |||
Medtronic, Inc. | 27,100 | 1,560,147 | |||
Sepracor, Inc.* | 10,700 | 552,120 | |||
| 2,710,392 | |||||
Oil, Gas & Consumable Fuels — 1.8% | |||||
Schlumberger Ltd. | 6,300 | 612,045 | |||
Transocean, Inc. (Cayman Islands)* | 10,300 | 717,807 | |||
| 1,329,852 | |||||
Retail & Merchandising — 5.4% | |||||
Kohl’s Corp.* | 29,300 | 1,423,980 | |||
PETsMART, Inc. | 25,200 | 646,632 | |||
Starbucks Corp.* | 10,300 | 309,103 | |||
Target Corp. | 9,800 | 538,706 | |||
Walgreen Co. | 23,800 | 1,053,388 | |||
| 3,971,809 | |||||
Semiconductors — 9.9% | |||||
Analog Devices, Inc. | 50,800 | 1,822,196 | |||
Intel Corp. | 73,400 | 1,832,064 | |||
Marvell Technology Group Ltd. (Bermuda)* | 14,700 | 824,523 | |||
Maxim Integrated Products, Inc. | 33,800 | 1,224,912 | |||
Xilinx, Inc. | 63,900 | 1,610,919 | |||
| 7,314,614 | |||||
Telecommunications — 7.0% | |||||
American Tower Corp. | 38,400 | 1,040,640 | |||
Corning, Inc.* | 50,100 | 984,966 | |||
Juniper Networks, Inc.* | 66,500 | 1,482,950 | |||
Nextel Partners, Inc. | 59,900 | 1,673,606 | |||
| 5,182,162 | |||||
Utilities — 4.5% | |||||
General Electric Co. | 94,700 | 3,319,235 | |||
TOTAL LONG-TERM INVESTMENTS | 71,565,187 | ||||
SEE NOTES TO FINANCIAL STATEMENTS.
B55
| SP T. ROWE PRICE LARGE CAP GROWTH PORTFOLIO (Continued) |
SCHEDULE OF INVESTMENTS | December 31, 2005 |
| COMMON STOCKS (Continued) | Shares | Value (Note 2) | ||||
| SHORT-TERM INVESTMENT — 3.6% | ||||||
Affiliated Money Market Mutual Fund | ||||||
Dryden Core Investment Fund — | 2,632,964 | $ | 2,632,964 | |||
TOTAL INVESTMENTS — 100.6% | 74,198,151 | |||||
LIABILITIES IN EXCESS OF OTHER | (418,124 | ) | ||||
NET ASSETS — 100.0% | $ | 73,780,027 | ||||
The industry classification of long-term portfolio holdings, short-term investments and liabilities in excess of other assets shown as a percentage of net assets as of December 31, 2005 were as follows:
Computer Services & Software | 10.7 | % | |
Semiconductors | 9.9 | ||
Drugs & Medicine | 9.4 | ||
Financial Services | 7.8 | ||
Telecommunications | 7.0 | ||
Retail & Merchandising | 5.4 | ||
Hotels, Restaurants & Leisure | 4.6 | ||
Utilities | 4.5 | ||
Food & Staples Retailing | 4.3 | ||
Internet Services | 3.8 | ||
Medical Supplies & Equipment | 3.7 | ||
Affiliated Money Market Mutual Fund | 3.6 | ||
Health Care Providers & Services | 3.5 | ||
Cable Television | 2.5 | ||
Computers | 2.5 | ||
Financial – Bank & Trust | 2.4 | ||
Manufacturing | 2.4 | ||
Electronic Components | 2.1 | ||
Consumer Products & Services | 1.8 | ||
Oil, Gas & Consumable Fuels | 1.8 | ||
Farming & Agriculture | 1.4 | ||
Advertising | 1.3 | ||
Airlines | 1.3 | ||
Education | 1.1 | ||
Aerospace/Defense | 0.9 | ||
Media | 0.9 | ||
| 100.6 | |||
Liabilities in excess of other assets | (0.6 | ) | |
Total | 100.0 | % | |
| * | Non-income producing security. |
| (w) | Prudential Investments LLC, the manager of the Fund also serves as manager of the Dryden Core Investment Fund-Taxable Money Market Series. |
SEE NOTES TO FINANCIAL STATEMENTS.
B56
| SP WILLIAM BLAIR INTERNATIONAL GROWTH PORTFOLIO |
SCHEDULE OF INVESTMENTS | December 31, 2005 |
| LONG-TERM INVESTMENTS — 95.1% | Value (Note 2) | ||||
| COMMON STOCKS — 92.3% | Shares | ||||
Australia — 2.9% | |||||
BHP Billiton Ltd. | 283,500 | $ | 4,721,608 | ||
Macquarie Bank Ltd. | 94,400 | 4,690,840 | |||
Sigma Pharmaceuticals Ltd. | 417,334 | 955,086 | |||
Toll Holdings Ltd. | 305,300 | 3,321,776 | |||
| 13,689,310 | |||||
Austria — 1.8% | |||||
Erste Bank der Oesterreichischen Sparkassen AG | 83,400 | 4,645,566 | |||
Raiffeisen International Bank Holding AG* | 61,100 | 4,018,261 | |||
| 8,663,827 | |||||
Brazil — 1.0% | |||||
Companhia de Concessoes Rodviarias (CCR) | 25,800 | 816,490 | |||
Natura Cosmeticos SA | 35,500 | 1,563,439 | |||
Petroleo Brasileiro SA | 142,700 | 2,270,824 | |||
| 4,650,753 | |||||
Canada — 5.3% | |||||
Canadian National Railway Co. | 133,150 | 10,668,494 | |||
Manulife Financial Corp. | 125,700 | 7,382,287 | |||
Research in Motion Ltd.* | 74,150 | 4,895,705 | |||
Shoppers Drug Mart Corp. | 58,900 | 2,228,416 | |||
| 25,174,902 | |||||
Colombia — 0.4% | |||||
Bancolombia SA, ADR | 62,000 | 1,787,460 | |||
France — 8.5% | |||||
BNP Paribas SA | 81,500 | 6,594,913 | |||
Dassault Systemes SA | 49,900 | 2,817,350 | |||
Essilor International SA | 45,200 | 3,649,520 | |||
Eurazeo | 20,900 | 2,181,130 | |||
Hermes International Designs | 19,300 | 4,828,027 | |||
Iliad SA | 16,500 | 1,021,642 | |||
Sanofi-Aventis | 128,200 | 11,231,368 | |||
Technip SA | 61,600 | 3,704,737 | |||
Vinci SA | 53,200 | 4,575,728 | |||
| 40,604,415 | |||||
Germany — 7.3% | |||||
Bijou Brigitte AG | 4,800 | 1,298,495 | |||
Continental AG | 96,900 | 8,601,657 | |||
E.ON AG | 73,800 | 7,635,387 | |||
Gehe AG | 57,640 | 4,958,294 | |||
SAP AG | 69,100 | 12,529,575 | |||
| 35,023,408 | |||||
Greece — 1.7% | |||||
Coca-Cola Hellenic Bottling Co. SA | 106,800 | 3,145,825 | |||
EFG Eurobank Ergasias | 70,870 | 2,241,877 | |||
National Bank of Greece SA* | 60,540 | 2,580,227 | |||
| 7,967,929 | |||||
Hong Kong — 3.1% | |||||
Esprit Holdings Ltd. | 609,300 | 4,321,915 | |||
Foxconn International Holding Ltd.* | 1,715,000 | 2,799,750 | |||
Li & Fung Ltd. | 1,736,000 | 3,340,308 | |||
Techtronic Industries Co. Ltd. | 1,873,300 | 4,456,394 | |||
| 14,918,367 | |||||
| COMMON STOCKS (Continued) | Value (Note 2) | ||||
| Shares | |||||
India — 1.5% | |||||
HDFC Bank Ltd., ADR | 54,100 | $ | 2,753,690 | ||
Infosys Technologies Ltd., ADR | 54,800 | 4,431,128 | |||
| 7,184,818 | |||||
Ireland — 2.0% | |||||
Anglo Irish Bank Corp. PLC | 301,300 | 4,573,675 | |||
Ryanair Holdings PLC, ADR*(a) | 86,800 | 4,859,932 | |||
| 9,433,607 | |||||
Italy — 2.0% | |||||
Luxottica Group SpA | 262,800 | 6,667,461 | |||
Saipem SpA | 174,400 | 2,861,690 | |||
| 9,529,151 | |||||
Japan — 21.9% | |||||
Aeon Credit Service Co. Ltd. | 22,500 | 2,129,093 | |||
Aeon Mall Co. Ltd. | 56,800 | 2,768,293 | |||
ASKUL Corp.* | 19,800 | 614,474 | |||
Chiyoda Corp. | 128,000 | 2,932,949 | |||
Chugai Pharmaceutical Co. Ltd. | 326,000 | 7,014,289 | |||
Denso Corp. | 320,800 | 11,106,315 | |||
Hoya Corp. | 189,800 | 6,822,126 | |||
Kenedix, Inc. | 212 | 1,335,836 | |||
Keyence Corp. | 30,800 | 8,759,046 | |||
KK DaVinci Advisors* | 166 | 1,247,868 | |||
Komeri Co. Ltd. | 46,100 | 1,977,227 | |||
Misumi Corp. | 33,300 | 1,447,599 | |||
Mitsubishi Tokyo Financial Group, Inc. | 992 | 13,508,807 | |||
NEOMAX Co. Ltd. | 40,000 | 1,316,923 | |||
Nidec Corp. | 65,900 | 5,606,397 | |||
Nitto Denko Corp., ADR | 52,400 | 4,082,612 | |||
ORIX Corp. | 47,900 | 12,191,972 | |||
Point, Inc. | 20,900 | 1,746,652 | |||
Ryohin Keikaku Co. Ltd. | 26,900 | 2,353,215 | |||
Sharp Corp. | 450,800 | 6,859,098 | |||
Shimamura Co. Ltd. | 16,700 | 2,307,713 | |||
Sundrug Co. Ltd. | 16,000 | 876,645 | |||
Yamada Denki Co. Ltd. | 44,200 | 5,525,499 | |||
| 104,530,648 | |||||
Korea — 2.8% | |||||
Hyundai Motor Co. | 45,000 | 4,280,945 | |||
Kookmin Bank* | 49,900 | 3,760,798 | |||
Samsung Electronics Co. Ltd. | 8,100 | 5,211,207 | |||
| 13,252,950 | |||||
Mexico — 1.8% | |||||
America Movil SA de CV, Series L | 1,889,700 | 2,760,126 | |||
Wal-Mart de Mexico SA de CV, Series L | 1,085,000 | 6,020,691 | |||
| 8,780,817 | |||||
Netherlands — 0.8% | |||||
Qaigen NV* | 152,100 | 1,789,899 | |||
TomTom NV* | 54,400 | 1,867,712 | |||
| 3,657,611 | |||||
Singapore — 0.8% | |||||
CapitaLand Ltd. | 1,791,000 | 3,700,272 | |||
SEE NOTES TO FINANCIAL STATEMENTS.
B57
| SP WILLIAM BLAIR INTERNATIONAL GROWTH PORTFOLIO (Continued) |
SCHEDULE OF INVESTMENTS | December 31, 2005 |
| COMMON STOCKS (Continued) | Value (Note 2) | ||||
| Shares | |||||
South Africa — 1.6% | |||||
Naspers Ltd. | 107,000 | $ | 1,894,124 | ||
Sasol Ltd.* | 158,100 | 5,659,368 | |||
| 7,553,492 | |||||
Spain — 1.9% | |||||
Grupo Ferrovial SA | 35,400 | 2,451,727 | |||
Industria de Diseno Textil SA | 209,719 | 6,840,255 | |||
| 9,291,982 | |||||
Sweden — 0.5% | |||||
Capio AB* | 63,200 | 1,125,659 | |||
Modern Times Group AB (Class “B” Stock) | 29,300 | 1,222,601 | |||
| 2,348,260 | |||||
Switzerland — 9.1% | |||||
Actelion Ltd.* | 6,100 | 504,600 | |||
EFG International* | 56,600 | 1,507,553 | |||
Nobel Biocare Holding AG* | 10,550 | 2,320,270 | |||
Phonak Holindg AG-Reg | 31,000 | 1,335,261 | |||
Roche Holding AG, ADR | 94,550 | 14,196,351 | |||
SGS Societe Generale* | 3,680 | 3,102,957 | |||
Synthes, Inc. | 77,900 | 8,750,078 | |||
UBS AG | 121,320 | 11,549,889 | |||
| 43,266,959 | |||||
Taiwan — 2.6% | |||||
Hon Hai Precision Industry Co. Ltd. | 1,384,441 | 7,607,130 | |||
MediaTek, Inc.* | 429,100 | 5,019,763 | |||
| 12,626,893 | |||||
United Kingdom — 11.0% | |||||
BG Group PLC | 1,361,275 | 13,455,129 | |||
Cairn Energy PLC* | 61,100 | 2,018,340 | |||
Capital Group PLC | 610,900 | 4,380,238 | |||
Carphone Warehouse Group | 274,100 | 1,306,294 | |||
HBOS PLC | 556,100 | 9,500,668 | |||
Reckitt Benckiser PLC | 176,200 | 5,820,484 | |||
Standard Chartered PLC | 330,000 | 7,352,511 | |||
Tesco PLC | 1,533,300 | 8,745,057 | |||
| 52,578,721 | |||||
TOTAL COMMON STOCKS | 440,216,552 | ||||
| PREFERRED STOCKS — 2.8% | Shares | Value (Note 2) | |||
Brazil — 1.1% | |||||
Banco Itau Holding Financeira SA, 13.50% | 207,790 | $ | 5,003,026 | ||
Germany — 0.3% | |||||
Porsche AG , 3.39% | 1,960 | 1,408,433 | |||
Norway — 1.4% | |||||
Statoil ASA | 294,700 | 6,767,887 | |||
TOTAL PREFERRED STOCKS | 13,179,347 | ||||
TOTAL LONG-TERM INVESTMENTS | 453,395,898 | ||||
| SHORT-TERM INVESTMENT — 4.8% | |||||
Money Market Mutual Fund | |||||
Dryden Core Investment Fund — | 22,730,064 | 22,730,064 | |||
TOTAL INVESTMENTS(o) — 99.9% (cost $391,313,870) | 476,125,962 | ||||
OTHER ASSETS IN EXCESS OF | 526,735 | ||||
NET ASSETS — 100.0% | $ | 476,652,697 | |||
SEE NOTES TO FINANCIAL STATEMENTS.
B58
| SP WILLIAM BLAIR INTERNATIONAL GROWTH PORTFOLIO (Continued) |
SCHEDULE OF INVESTMENTS | December 31, 2005 |
The following abbreviations are used in portfolio descriptions:
| ADR | American Depositary Receipt |
| * | Non-income producing security. |
| (a) | All or a portion of security is on loan. The aggregate market value of such securities is $4,811,333; cash collateral of $5,052,456 (included with liabilities) was received with which the portfolio purchased highly liquid short-term investments. |
| (b) | Represents security, or a portion thereof, purchased with cash collateral received for securities on loan. |
| (o) | As of December 31, 2005, 39 securities representing $170,271,932 and 35.37% of the total market value were fair valued in accordance with the policies adopted by the Board of Directors. |
| (w) | Prudential Investments LLC, the manager of the Fund also serves as manager of the Dryden Core Investment Fund-Taxable Money Market Series. |
The country classification of portfolio holdings and assets in excess of other liabilities shown as a percentage of net assets as of December 31, 2005 were as follows:
Japan | 21.9 | % | |
United Kingdom | 11.0 | ||
Switzerland | 9.1 | ||
France | 8.5 | ||
Germany | 7.3 | ||
Canada | 5.3 | ||
Mutual Fund (Including 1.1% of collateral received for securities on loan) | 4.8 | ||
Hong Kong | 3.1 | ||
Australia | 2.9 | ||
Korea | 2.8 | ||
Preferred Stocks | 2.8 | ||
Taiwan | 2.6 | ||
Ireland | 2.0 | ||
Italy | 2.0 | ||
Spain | 1.9 | ||
Austria | 1.8 | ||
Mexico | 1.8 | ||
Greece | 1.7 | ||
South Africa | 1.6 | ||
India | 1.5 | ||
Brazil | 1.0 | ||
Netherlands | 0.8 | ||
Singapore | 0.8 | ||
Sweden | 0.5 | ||
Colombia | 0.4 | ||
| 99.9 | |||
Other assets in excess of liabilities | 0.1 | ||
Total | 100.0 | % | |
SEE NOTES TO FINANCIAL STATEMENTS.
B59
NOTES TO THE FINANCIAL STATEMENTS OF
THE PRUDENTIAL SERIES FUND, INC.
| Note 1: | General |
The Prudential Series Fund, Inc. (“Series Fund”), a Maryland corporation, organized on November 15, 1982, is a diversified open-end management investment company registered under the Investment Company Act of 1940, as amended. The Series Fund is composed of 32 Portfolios (“Portfolio” or “Portfolios”), each with a separate series of capital stock. The information presented in these financial statements pertains to seventeen Portfolios: SP Aggressive Growth Asset Allocation Portfolio, SP AIM Core Equity Portfolio, SP Balanced Asset Allocation Portfolio, SP Conservative Asset Allocation Portfolio, SP Davis Value Portfolio, SP Growth Asset Allocation Portfolio, SP Large Cap Value Portfolio, SP LSV International Value Portfolio, SP Mid-Cap Growth Portfolio, SP PIMCO High Yield Portfolio, SP PIMCO Total Return Portfolio, SP Prudential U.S. Emerging Growth Portfolio, SP Small Cap Growth Portfolio (formerly SP State Street Research Small Cap Growth Portfolio), SP Small Cap Value Portfolio, SP Strategic Partners Focused Growth Portfolio, SP T. Rowe Price Large Cap Growth Portfolio (formerly SP Alliance Berstein Large Cap Growth Portfolio) and SP William Blair International Growth Portfolio.
The Portfolios of the Series Fund have the following as investment objectives:
SP Aggressive Growth Asset Allocation Portfolio: Capital appreciation by investing primarily in large cap equity portfolios, international portfolios, and small/mid cap equity portfolios. The Portfolio will achieve this by investing in certain other Series Fund and American Skandia Trust Portfolios.
SP AIM Core Equity Portfolio: Growth of capital with a secondary objective of current income by investing primarily in securities of established companies that have long-term above-average growth in earnings and dividends, and growth companies that the Portfolio managers believe have the potential for above-average growth in earnings and dividends.
SP Balanced Asset Allocation Portfolio: Provide a balance between current income and growth of capital by investing in fixed income portfolios, large cap equity portfolios, small/mid cap equity portfolios, and international equity Portfolios. The Portfolio will achieve this by investing in certain other Series Fund and American Skandia Trust Portfolios.
SP Conservative Asset Allocation Portfolio: Provide current income with low to moderate capital appreciation by investing in fixed income portfolios, large cap equity portfolios, and small/mid cap equity portfolios. The Portfolio will achieve this by investing in certain other Series Fund and American Skandia Trust Portfolios.
SP Davis Value Portfolio: Capital growth through investments primarily in common stock of U.S. companies with market capitalization of at least $5 billion.
SP Growth Asset Allocation Portfolio: Provide long-term growth of capital with consideration also given to current income by investing in large-cap equity portfolios, fixed income portfolios, international equity portfolios and small/mid-cap equity portfolios. The Portfolio will achieve this by investing in certain other Series Fund Portfolios and American Skandia Trust Portfolios.
SP Large Cap Value Portfolio: Long-term growth of capital by investing primarily in common stocks of companies with large market capitalization (those with market capitalizations similar to companies in the Standard & Poor’s 500 Composite Index or the Russell 100 Index).
SP LSV International Value Portfolio: Long-term capital appreciation by investing primarily in the stocks and other equity securities of companies in developed countries outside the United States.
SP Mid-Cap Growth Portfolio: Long-term growth of capital by investing primarily in common stocks and related securities, such as preferred stocks, convertible securities and depository receipts for those securities.
SP PIMCO High Yield Portfolio: Maximum total return, consistent with preservation of capital and prudent investment management by investing primarily in a diversified portfolio of high yield/high risk securities rated below investment grade but rated at least B by Moody’s or S&P, or, if unrated, determined by Pacific Investment Management Company LLC (“PIMCO”) to be of comparable quality.
SP PIMCO Total Return Portfolio: Maximum total return, consistent with preservation of capital and prudent investment management by investing primarily in a diversified portfolio of fixed income instruments of varying maturities.
C1
SP Prudential U.S. Emerging Growth Portfolio: Long-term capital appreciation by investing primarily in equity securities of small and medium-sized U.S. companies that the Portfolio manager believes have the potential for above-average growth.
SP Small Cap Growth Portfolio: Long-term capital growth by investing mostly in small-capitalization companies which are included in the Russell 2000 Growth Index at the time of purchase, or if not with market capitalizations under $2.5 billion.
SP Small Cap Value Portfolio: Long-term growth of capital by investing primarily in common stocks of companies with small to medium market capitalization.
SP Strategic Partners Focused Growth Portfolio: Long-term capital growth by investing primarily in equity-related securities of U.S. companies that the adviser believes to have strong capital appreciation potential.
SP T. Rowe Price Large Cap Growth Portfolio: Growth of capital by pursuing aggressive investment policies. The Portfolio invests primarily in stocks of companies considered to have large capitalizations.
SP William Blair International Growth Portfolio: Long-term growth of capital by investing primarily in equity-related securities of foreign issuers.
The ability of issuers of debt securities (other than those issued or guaranteed by the U.S. Government) held by the Portfolios to meet their obligations may be affected by the economic or political developments in a specific industry, region or country.
| Note 2: | Accounting Policies |
The following is a summary of significant accounting policies followed by the Series Fund and the Portfolios in preparation of their financial statements.
Securities Valuation: Securities listed on a securities exchange are valued at the last sale price on such exchange on the day of valuation or, if there was no sale on such day, at the mean between the last reported bid and asked prices, or at the last bid price on such day in the absence of an asked price. Securities traded via NASDAQ are valued at the official closing price provided by NASDAQ. Securities that are actively traded in the over-the-counter market, including listed securities for which the primary market is believed by Prudential Investments LLC (“PI” or “Manager”) in consultation with the subadvisor, to be over-the-counter, are valued at market value using prices provided by an independent pricing agent or principal market maker. Options on securities and indices traded on an exchange are valued at the last sale price as of the close of trading on the applicable exchange or, if there was no sale, at the mean between the most recently quoted bid and asked prices on such exchange or at the last bid price in absence of an asked price. Futures contracts and options thereon traded on a commodities exchange or board of trade are valued at the last sale price at the close of trading on such exchange or board of trade or, if there was no sale on the applicable commodities exchange or board of trade on such day, at the mean between the most recently quoted bid and asked prices on such exchange or board of trade or at the last bid price in the absence of an asked price. Prices may be obtained from independent pricing services which use information provided by market makers or estimates of market values obtained from yield data relating to investments or securities with similar characteristics. Securities for which reliable market quotations are not readily available, or whose values have been affected by events occurring after the close of the security’s foreign market and before the Series Fund’s normal pricing time, are valued at fair value in accordance with Board of Directors’ approved fair valuation procedures. When determining the fair valuation of securities, some of the factors influencing the valuation include, the nature of any restrictions on disposition of the securities; assessment of the general liquidity of the securities; the issuer’s financial condition and the markets in which it does business; the cost of the investment; the size of the holding and the capitalization of the issuer; the prices of any recent transactions or bids/offers for such securities or any comparable securities; any available analyst media or other reports or information deemed reliable by the investment adviser regarding the issuer or the markets or industry in which it operates. Using fair value to price securities may result in a value that is different from a security’s most recent closing price and from the price used by other mutual funds to calculate their net asset values. As of December 31, 2005, the SP AIM Core Equity Portfolio, SP Davis Value Portfolio, SP LSV International Value Portfolio and SP William Blair International Growth Portfolio held foreign securities whose value required adjustment in accordance with such procedures.
C2
Investments in mutual funds are valued at their net asset value as of the close of the New York Stock Exchange on the date of valuation.
Short-term securities that are held in the other Portfolios which mature in more than 60 days are valued at current market quotations and those short-term securities which mature in 60 days or less are valued at amortized cost which approximates market value. The amortized cost method values a security at its cost at the time of purchase and there after assumes a constant amortization to maturity of any discount or premium.
The SP PIMCO High Yield Portfolio and the SP PIMCO Total Return Portfolio may hold up to 15% of their net assets in illiquid securities, including those which are restricted as to disposition under securities law (“restricted securities”). Certain issues of restricted securities held by the SP PIMCO High Yield Portfolio and the SP PIMCO Total Return Portfolio at December 31, 2005 include registration rights, under which the Portfolios may demand registration by the issuer, of which the Portfolio may bear the cost of such registration. Restricted securities, sometimes referred to as private placements, are valued pursuant to the valuation procedures noted above. Certain restricted securities were deemed liquid by procedures adopted by the Board of Directors.
Repurchase Agreements: In connection with transactions in repurchase agreements with United States financial institutions, it is the Series Fund’s policy that its custodian or designated subcustodians, as the case may be, under triparty repurchase agreements, take possession of the underlying collateral securities, the value of which exceeds the principal amount of the repurchase transaction, including accrued interest. To the extent that any repurchase transaction exceeds one business day, the value of the collateral is marked to market on a daily basis to ensure the adequacy of the collateral. If the seller defaults or the value of the collateral declines, or if bankruptcy proceedings are commenced with respect to the seller of the security, realization of the collateral by the Series Fund may by delayed or limited.
Foreign Currency Translation: The books and records of the Series Fund are maintained in U.S. dollars. Foreign currency amounts are translated into U.S. dollars on the following basis:
(i) market value of investment securities, other assets and liabilities – at the current daily rates of exchange.
(ii) purchases and sales of investment securities, income and expenses – at the rates of exchange prevailing on the respective dates of such transactions.
Although the net assets of the Series Fund are presented at the foreign exchange rates and market values at the close of the period, the Series Fund does not isolate that portion of the results of operations arising as a result of changes in the foreign exchange rates from the fluctuations arising from changes in the market prices of securities held at the end of the period. Similarly, the Series Fund does not isolate the effect of changes in foreign exchange rates from the fluctuations arising from changes in the market prices of portfolio securities sold during the period. Accordingly, these realized foreign currency gains (losses) are included in the reported net realized gains (losses) on investment transactions.
Net realized gains (losses) on foreign currency transactions represent net foreign exchange gains (losses) from the holding of foreign currencies, currency gains (losses) realized between the trade date and settlement date on securities transactions, and the difference between the amounts of dividends, interest and foreign withholding taxes recorded on the Series Fund’s books and the U.S. dollar equivalent amounts actually received or paid. Net unrealized currency gains (losses) from valuing foreign currency denominated assets and liabilities (other than investments) at period end exchange rates are reflected as a component of net unrealized appreciation (depreciation) on investments and foreign currencies.
Foreign security and currency transactions may involve certain considerations and risks not typically associated with those of domestic origin as a result of, among other factors, the possibility of political and economic instability or the level of governmental supervision and regulation of foreign securities markets.
Forward Currency Contracts: A forward currency contract is a commitment to purchase or sell a foreign currency at a future date at a negotiated forward rate. Certain Portfolios of the Series Fund may enter into forward currency contracts in order to hedge their exposure to changes in foreign currency exchange rates on their foreign portfolio holdings or on specific receivables and payables denominated in a foreign currency. The contracts are valued daily at current forward exchange rates and any unrealized gain (loss) is included in assets and liabilities in the financial statements. Gain (loss) is realized on the settlement date of the contract equal to the difference between the settlement value of the original and negotiated forward contracts. This
C3
gain (loss), if any, is included in net realized gain (loss) on foreign currency transactions. Risks may arise upon entering into these contracts from the potential inability of the counterparties to meet the terms of their contracts.
Short Sales: Certain portfolios of the Series Fund may sell a security it does not own in anticipation of a decline in the market value of that security (short sale). When a Portfolio makes a short sale, it must borrow the security sold short and deliver it to the broker-dealer through which it made the short sale as collateral for its obligation to deliver the security upon conclusion of the transaction. The Portfolio may have to pay a fee to borrow the particular security and may be obligated to remit any interest or dividends received on such borrowed securities. Dividends declared on short positions open on record date are recorded on the ex-date as an expense. A gain, limited to the price at which the Portfolio sold the security short, or a loss, unlimited in magnitude, will be recognized upon the termination of a short sale if the market price at termination is less than or greater than, respectively, the proceeds originally received. The portfolio maintains a segregated account of securities or other liquid assets, the dollar value of which is at least equal to its obligation with respect to short sales.
Loan Participations: The SP PIMCO High Yield Portfolio may invest in loan participations. When the Portfolio purchases a loan participation, the Portfolio typically enters into a contractual relationship with the lender or third party selling such participations (“Selling Participant”), but not the borrower. As a result, the Portfolio assumes the credit risk of the borrower, the Selling Participant and any other persons interpositioned between the Portfolio and the borrower. The Portfolio may not directly benefit from the collateral supporting the senior loan in which it has purchased the loan participant.
Options: The Series Fund may either purchase or write options in order to hedge against adverse market movements or fluctuations in value caused by changes in prevailing interest rates or foreign currency exchange rates or currencies with respect to securities which the Series Fund currently owns or intends to purchase. The Series Fund’s principal reason for writing options is to realize, through receipt of premiums, a greater current return than would be realized on the underlying security alone. When the Series Fund purchases an option, it pays a premium and an amount equal to that premium is recorded as an asset. When the Series Fund writes an option, it receives a premium and an amount equal to that premium is recorded as a liability. The asset or liability is adjusted daily to reflect the current market value of the option. If an option expires unexercised, the Series Fund realizes a gain (loss) to the extent of the premium received or paid. If an option is exercised, the premium received or paid is recorded as an adjustment to the proceeds from the sale or the cost basis of the purchase in determining whether the Series Fund has realized a gain (loss). The difference between the premium and the amount received or paid on effecting a closing purchase or sale transaction is also treated as a realized gain (loss). Gains (losses) on purchased options is included in net realized gains (losses) on investment transactions. Gains (losses) on written options is presented separately as net realized gain (loss) on written option transactions.
The Series Fund, as writer of an option, may have no control over whether the contract may be exercised. As a result, the Series Fund bears the market risk of an unfavorable change in the price of the security underlying the written option. The Series Fund, as purchaser of an option, bears the risk of the potential inability of the counterparties to meet the terms of their contracts.
Financial Futures Contracts: A financial futures contract is an agreement to purchase (long) or sell (short) an agreed amount of securities at a set price for delivery on a future date. Upon entering into a financial futures contract, the Series Fund is required to pledge to the broker an amount of cash and/or other assets equal to a certain percentage of the contract amount. This amount is known as the “initial margin”. Subsequent payments, known as “variation margin”, are made or received by the Series Fund each day, depending on the daily fluctuations in the value of the underlying security. Such variation margin is recorded for financial statement purposes on a daily basis as unrealized gain (loss). When the contract expires or is closed, the gain (loss) is realized and is presented in the Statement of Operations as net realized gain (loss) on financial futures contracts.
The Series Fund invests in financial futures contracts in order to hedge its existing portfolio securities, or securities the Series Fund intends to purchase, against fluctuations in value caused by changes in prevailing rates or market conditions. Under a variety of circumstances, the Series Fund may not achieve the anticipated benefits of the financial futures contracts and may realize a loss. The use of futures transactions involves the risk of imperfect correlation in movements in the price of futures contracts and the underlying hedged assets.
C4
Swap Agreements: The Portfolios may enter into interest rate swap agreements, forward swap spread lock agreements, and credit default swap agreements. A swap agreement is an agreement to exchange the return generated by one instrument for the return generated by another instrument. Interest rate swap agreements involve the exchange by the Portfolio with another party of their respective commitments to pay or receive interest. Forward spread lock swap agreements involve commitments to pay or receive a settlement amount calculated as the difference between the swap spread and a fixed spread, multiplied by the notional amount times the duration of the swap. The swap spread is the difference between the benchmark swap rate (market rate) and the specific Treasury rate. In a credit default swap agreement, one party (the protection buyer) makes a stream of payments to another party (the protection seller) in exchange for the right to receive a specified payment in the event of a default by a third party, typically corporate issues or sovereign issues of an emerging country, on its obligation. The maximum amount of the payment may equal the notional, at par, of the underlying index or security as a result of a default (or “credit event”). In addition to bearing the risk that the credit event will occur, the Portfolios could be exposed to market risk due to unfavorable changes in interest rates or in the price of the underlying security or index, the possibility that the fund may be unable to close out its position at the same time or at the same price as if it had purchased comparable publicly traded securities, or that the counterparty may default on it’s obligation to perform. The Portfolios may enter into swap agreements as either the protection buyer or seller. The swaps are valued daily at current market value and any change in value is included in net unrealized appreciation or depreciation on investments. Payments received or paid by the Portfolio are recorded as realized gains or losses. Risk of loss may exceed amounts recognized on the statements of assets and liabilities. Swap agreements outstanding at period end, if any, are listed on the Schedule of Investments.
Forward currency contracts, written options, short sales, swaps and financial futures contracts involve elements of both market and credit risk in excess of the amounts reflected on the Statement of Assets and Liabilities.
Securities Lending: The Series Fund may lend its portfolio securities to broker-dealers. The loans are secured by collateral at least equal at all times to the market value of the securities loaned. Loans are subject to termination at the option of the borrower or the Series Fund. Upon termination of the loan, the borrower will return to the lender securities identical to the loaned securities. Should the borrower of the securities fail financially, the Series has the right to repurchase the securities using the collateral in the open market. The Series Fund recognizes income, net of any rebate and securities lending agent fees, for lending its securities in the form of fees or interest on the investment of any cash received as collateral. The Series Fund also continues to receive interest and dividends or amounts equivalent thereto on the securities loaned and recognizes any unrealized gain or loss in the market price of the securities loaned that may occur during the term of the loan.
When-Issued/Delayed Delivery Securities: Securities purchased or sold on a when-issued or delayed-delivery basis may be settled a month or more after trade date; interest income is not accrued until settlement date. At the time a Portfolio enters into such transactions, it instructs the custodian to segregate assets with a current value at least equal to the amount of its when-issued or delayed-delivery purchase commitments.
Securities Transactions and Net Investment Income: Securities transactions are recorded on the trade date. Realized gains (losses) on sales of securities are calculated on the identified cost basis. Dividend income is recorded on the ex-dividend date; interest income, which is comprised of four elements: stated coupon, original issue discount, market discount and market premium, is recorded on the accrual basis. Expenses are recorded on the accrual basis. The Series Fund’s expenses are allocated to the respective Portfolios on the basis of relative net assets except for Portfolio specific expenses which are attributable directly to a Portfolio or class level. The only expense charged to SP Aggressive Growth Asset Allocation Portfolio, SP Balanced Asset Allocation Portfolio, SP Conservative Asset Allocation Portfolio, and SP Growth Allocation Portfolio is a management fee. All other expenses attributable to these Portfolios are borne by PI, the Portfolios’ investment advisor (see Note 3).
For Portfolios with multiple classes of shares, net investment income (loss) (other than administration and distribution fees, which are charged to the respective class) and unrealized and realized gains (losses) are allocated daily to each class of shares based upon the relative proportion of net assets of each class at the beginning of the day.
Custody Fee Credits: The Series Fund has an arrangement with its custodian bank, whereby uninvested monies earn credits which reduce the fees charged by the custodian. Such custody fee credits are presented as a reduction of gross expenses in the accompanying Statements of Operations.
C5
Taxes: For federal income tax purposes, each Portfolio in the Series Fund is treated as a separate taxpaying entity. It is each Portfolio’s policy to continue to meet the requirements of the Internal Revenue Code applicable to regulated investment companies and to distribute all of its taxable net income and capital gains, if any, to shareholders. Therefore, no federal income tax provision is required.
Withholding taxes on foreign dividends, interest and capital gains have been provided for in accordance with the Series Fund’s understanding of the applicable country’s tax rules and regulations.
Dividends and Distributions: Dividends and distributions of each Portfolio are declared in cash and automatically reinvested in additional shares of the same Portfolio. The SP PIMCO High Yield and SP PIMCO Total Return Portfolios will declare and distribute dividends from net investment income, if any, quarterly and distributions from net capital gains, if any, at least annually. All other Portfolios will declare and distribute dividends from net investment income and distributions from net capital gains, if any, at least annually. Dividends and distributions are recorded on the ex-dividend date.
Dividends and capital gain distributions are determined in accordance with income tax regulations which may differ from generally accepted accounting principles. Permanent book/tax differences relating to income and gains are reclassified amongst undistributed net investment income, accumulated net realized gain or loss and paid in capital in excess of par, as appropriate.
Estimates: The preparation of financial statements requires management to make estimates and assumptions that affect the reported amounts and disclosures in the financial statements. Actual results could differ from these estimates.
| Note 3: | Agreements |
The Series Fund has a management agreement with PI. Pursuant to this agreement PI has responsibility for all investment advisory services and supervises the subadvisers’ performance of such services. PI has entered into subadvisory agreements with Jennison Associates LLC (“Jennison”), AIM Capital Management, Inc. (“AIM”), Alliance Capital Management, LP (“Alliance”), Davis Selected Advisers, LP (“Davis”), Calamos Investments (“Calamos”), Hotchkis and Wiley Capital Management LLC (“Hotchkis and Wiley”), Goldman Sachs Asset Management, L.P. (“GSAM”), J.P. Morgan Investment Management, Inc. (“J.P. Morgan”), LSV Asset Management (“LSV”), Neuberger Berman Management, Inc. (“Neuberger Berman”), T. Rowe Price Associates, Inc. (“T. Rowe”), William Blair & Company LLC (“William Blair”), Eagle Asset Management (“Eagle”), Pacific Investment Management Company LLC (“PIMCO”) and Salomon Brothers Asset Management Inc. (“Salomon”) (collectively, the “Subadvisers”), under which each provides investment advisory services for certain Portfolios of the Series Fund. PI pays for the services of the Subadvisers, compensation of officers of the Series Fund, occupancy and certain clerical and administrative expenses of the Series Fund. The Series Fund bears all other costs and expenses.
The management fee paid to PI is computed daily and payable monthly, at the annual rates specified below, of the value of each of the Portfolio’s average daily net assets.
Portfolio | Management Fee | Effective Management Fee | ||||
SP Aggressive Growth Asset Allocation Portfolio | 0.05 | % | 0.05 | % | ||
SP AIM Core Equity Portfolio | 0.85 | 0.85 | ||||
SP Balanced Asset Allocation Portfolio | 0.05 | 0.05 | ||||
SP Conservative Asset Allocation Portfolio | 0.05 | 0.05 | ||||
SP Davis Value Portfolio | 0.75 | 0.75 | ||||
SP Growth Asset Allocation Portfolio | 0.05 | 0.05 | ||||
SP Large Cap Value Portfolio | 0.80 | 0.80 | ||||
SP LSV International Value Portfolio | 0.90 | 0.90 | ||||
SP Mid-Cap Growth Portfolio | 0.80 | 0.80 | ||||
SP PIMCO High Yield Portfolio | 0.60 | 0.60 | ||||
SP PIMCO Total Return Portfolio | 0.60 | 0.60 | ||||
SP Prudential U.S. Emerging Growth Portfolio | 0.60 | 0.60 | ||||
SP Small Cap Growth Portfolio | 0.95 | 0.95 | ||||
SP Small Cap Value Portfolio | 0.90 | 0.90 | ||||
SP Strategic Partners Focused Growth Portfolio | 0.90 | 0.90 | ||||
SP T. Rowe Price Large Cap Growth Portfolio | 0.90 | 0.82 | ||||
SP William Blair International Growth Portfolio | 0.85 | 0.85 |
C6
At December 31, 2005 the Subadvisers that provide investment advisory services to the Portfolios as follows. Where more than one Subadviser is listed, each Subadviser provides services to a segment of the Portfolio:
Portfolio | Subadviser(s) | |
SP AIM Core Equity Portfolio | AIM | |
SP Davis Value Portfolio | Davis | |
SP Large Cap Value Portfolio | Hotchkis and Wiley, J.P. Morgan | |
SP LSV International Value Portfolio | LSV | |
SP Mid-Cap Growth Portfolio | Calamos | |
SP PIMCO High Yield Portfolio | PIMCO | |
SP PIMCO Total Return Portfolio | PIMCO | |
SP Prudential U.S. Emerging Growth Portfolio | Jennison | |
SP Small Cap Growth Portfolio | Neuberger Berman, Eagle | |
SP Small Cap Value Portfolio | GSAM, Salomon | |
SP Strategic Partners Focused Growth Portfolio | Alliance, Jennison | |
SP T. Rowe Price Large Cap Growth Portfolio | T. Rowe | |
SP William Blair International Growth Portfolio | William Blair |
The Series Fund has a distribution agreement with Prudential Investment Management Services LLC (“PIMS”) which acts as the distributor of the Class I and Class II shares of the Series Fund. The Series Fund compensates PIMS for distributing and servicing the Series Fund’s Class II shares pursuant to a plan of distribution (the “Class II Plan”), regardless of expenses actually incurred by PIMS. The distribution fees are accrued daily and payable monthly. No distribution or service fees are paid to PIMS as distributor of the Class I shares of the Series Fund. Pursuant to the Class II Plan, the Class II shares of each Portfolio compensate PIMS for distribution-related activities at an annual rate of 0.25% of the average daily net assets of the Class II shares.
The Series Fund has an administration agreement with PI which acts as the administrator of the Class II shares of the Series Fund. The administration fee paid to PI is accrued daily and payable monthly, at the annual rate of 0.15% of the average daily net assets of the Class II shares.
PI has agreed to reimburse each Portfolio (other than the SP Aggressive Growth Asset Allocation, SP Balanced Asset Allocation, SP Conservative Asset Allocation and SP Growth Asset Allocation Portfolios) the amount that the aggregate annual ordinary operating expenses (excluding interest, taxes, and brokerage commissions) exceeded the percentage stated below, of the Portfolio’s average daily net assets.
Portfolio | Class I Expense limit | Class II Expense limit | ||||
SP AIM Core Equity Portfolio | 1.00 | % | N/A | |||
SP Davis Value Portfolio | 0.83 | N/A | ||||
SP Large Cap Value Portfolio | 0.90 | N/A | ||||
SP LSV International Value Portfolio | 1.10 | ** | N/A | |||
SP Mid-Cap Growth Portfolio | 1.00 | N/A | ||||
SP PIMCO High Yield Portfolio | 0.82 | N/A | ||||
SP PIMCO Total Return Portfolio | 0.76 | N/A | ||||
SP Prudential U.S. Emerging Growth Portfolio | 0.90 | 1.30 | % | |||
SP Small Cap Growth Portfolio | 1.15 | N/A | ||||
SP Small Cap Value Portfolio | 1.05 | N/A | ||||
SP Strategic Partners Focused Growth Portfolio | 1.25 | *** | 1.65 | *** | ||
SP T. Rowe Price Large Cap Growth Portfolio | 1.02 | * | N/A | |||
SP William Blair International Growth Portfolio | 1.24 | 1.64 |
N/A – Not applicable – Portfolio does not currently have Class II shares.
PIMS, PI and Jennison are indirect, wholly-owned subsidiaries of Prudential Financial, Inc. (“Prudential”).
| * | Effective July 1, 2005, the SP T. Rowe Price Large Cap Growth Portfolio, PI voluntarily agreed to waive a portion of its management fee, and if necessary, reimburse the portfolio an amount equal to the amount of ordinary operating expenses (excluding interest, taxes and brokerage commissions) that exceed 1.02% (expense limitation). For the period between January 1, 2005 and June 30, 2005, this portfolio had an expense limitation of 1.10%. |
C7
| ** | Effective July 1, 2005, the SP LSV International Value Portfolio, PI voluntarily agreed to waive a portion of its management fee, and if necessary, reimburse the portfolio an amount equal to the amount of ordinary operating expenses (excluding interest, taxes and brokerage commissions) that exceed 1.10% (expense limitation). |
| *** | Effective July 1, 2005, the expense limitation for SP Strategic Partners Focused Growth Portfolio is 1.25% for Class I and 1.65% for Class II. For the period between January 1, 2005 and June 30, 2005, this portfolio had expense limitations of 1.01% for Class I and 1.41% for Class II. |
| Note 4: | Other Transactions with Affiliates |
Prudential Mutual Fund Services LLC (“PMFS”), an affiliate of PI and an indirect, wholly-owned subsidiary of Prudential, serves as the Series Fund’s transfer agent. Transfer agent fees and expenses in the Statements of Operations include certain out-of-pocket expenses paid to non-affiliates, where applicable.
Prudential Investment Management, Inc. (“PIM”), an indirect, wholly-owned subsidiary of Prudential, is the Series Fund’s security lending agent. For the year ended December 31, 2005, PIM was compensated as follows for these services by the Series Fund Portfolios:
| PIM | |||
SP Davis Portfolio | $ | 1,878 | |
SP Mid Cap Growth Portfolio | 2,069 | ||
SP Prudential U.S. Emerging Growth Portfolio . | 61,164 | ||
For the year ended December 31, 2005, Prudential Equity Group, LLC, an indirect wholly-owned subsidiary of Prudential, Wachovia Securities, LLC and First Clearing, LLC, affiliates of PI, earned brokerage commissions from transactions executed on behalf of the Series Fund Portfolios as follows:
Portfolio | Prudential Equity Group | Wachovia | First Clearing | ||||||
SP Large Cap Value Portfolio | $ | 445 | $ | — | $ | — | |||
SP Prudential U.S. Emerging Growth | 3,200 | 1,500 | — | ||||||
SP Small Cap Growth Portfolio | — | 1,271 | — | ||||||
SP Strategic Partners Focused Growth Portfolio | 794 | 639 | — | ||||||
Certain Portfolios invest in the Taxable Money Market Series and Short-Term Bond Series (the “Portfolios”), portfolios of Dryden Core Investment Fund, pursuant to an exemptive order received from the Securities and Exchange Commission. The Portfolios are a money market mutual fund and short term bond fund, respectively, registered under the Investment Company Act of 1940, as amended, and managed by PI.
| Note 5: | Portfolio Securities |
The aggregate cost of purchases and the proceeds from the sales of securities (excluding government securities and short-term issues) for the year ended December 31, 2005 were as follows:
Cost of Purchases:
Portfolio | |||
SP Aggressive Growth Asset Allocation Portfolio | $ | 74,801,443 | |
SP AIM Core Equity Portfolio | 24,272,784 | ||
SP Balanced Asset Allocation Portfolio | 611,044,431 | ||
SP Conservative Asset Allocation Portfolio | 255,122,923 | ||
SP Davis Value Portfolio | 54,514,378 | ||
SP Growth Asset Allocation Portfolio | 593,465,852 | ||
SP Large Cap Value Portfolio | 619,506,482 | ||
SP LSV International Value Portfolio | 162,127,592 | ||
SP Mid-Cap Growth Portfolio | 159,207,346 | ||
SP PIMCO High Yield Portfolio | 329,167,615 | ||
C8
Portfolio | |||
SP PIMCO Total Return Portfolio | $ | 676,240,075 | |
SP Prudential U.S. Emerging Growth Portfolio | 253,173,356 | ||
SP Small Cap Growth Portfolio | 303,872,268 | ||
SP Small Cap Value Portfolio | 434,481,962 | ||
SP Strategic Partners Focused Growth Portfolio | 83,066,124 | ||
SP T. Rowe Price Large Cap Growth Portfolio | 95,819,429 | ||
SP William Blair International Growth Portfolio | 413,203,120 | ||
Proceeds from Sales:
Portfolio | |||
SP Aggressive Growth Asset Allocation Portfolio | $ | 40,386,611 | |
SP AIM Core Equity Portfolio | 20,997,117 | ||
SP Balanced Asset Allocation Portfolio | 221,348,819 | ||
SP Conservative Asset Allocation Portfolio | 126,215,606 | ||
SP Davis Value Portfolio | 40,081,481 | ||
SP Growth Asset Allocation Portfolio | 154,542,581 | ||
SP Large Cap Value Portfolio | 433,204,483 | ||
SP LSV International Value Portfolio | 50,994,103 | ||
SP Mid-Cap Growth Portfolio | 123,968,898 | ||
SP PIMCO High Yield Portfolio | 278,167,825 | ||
SP PIMCO Total Return Portfolio | 353,359,663 | ||
SP Prudential U.S. Emerging Growth Portfolio | 219,008,436 | ||
SP Small Cap Growth Portfolio | 363,204,623 | ||
SP Small Cap Value Portfolio | 501,723,513 | ||
SP Strategic Partners Focused Growth Portfolio | 74,735,793 | ||
SP T. Rowe Price Large Cap Growth Portfolio | 100,657,312 | ||
SP William Blair International Growth Portfolio | 394,506,992 | ||
The SP AIM Core Equity, SP PIMCO High Yield, SP PIMCO Total Return and the SP Prudential U.S. Emerging Growth Portfolios’ written options activity for the year ended December 31, 2005 were as follows:
| SP AIM Core Equity Portfolio | Contracts | Premiums | |||
Balance as of December 31, 2004 | — | — | |||
Options written | 180 | $ | 20,604 | ||
Balance as of December 31, 2005 | 180 | $ | 20,604 | ||
| SP PIMCO High Yield Portfolio | Contracts | Premiums | |||||
Balance as of December 31, 2004 | — | — | |||||
Options written | 1,469 | $ | 414,144 | ||||
Options terminated in closing purchase transactions | (185 | ) | (68,765 | ) | |||
Options expired | (606 | ) | (152,614 | ) | |||
Balance as of December 31, 2005 | 678 | $ | 192,765 | ||||
| SP PIMCO Total Return Portfolio | Contracts/ Notional (000) | Premiums | |||||
Balance as of December 31, 2004 | 213,336 | $ | 4,600,694 | ||||
Options written | 70,531,443 | 342,736 | |||||
Swap Options written | 189,200,000 | 1,509,812 | |||||
Options expired | (142,781 | ) | (2,733,903 | ) | |||
Balance as of December 31, 2005 | 259,801,998 | $ | 3,719,339 | ||||
C9
| SP Prudential U.S. Emerging Growth Portfolio | Contracts | Premiums | |||||
Balance as of December 31, 2004 | 233 | $ | 38,320 | ||||
Options written | 810 | 81,558 | |||||
Options terminated in closing purchase transactions | (772 | ) | (75,213 | ) | |||
Options assigned | (113 | ) | (24,040 | ) | |||
Options expired | (158 | ) | (20,625 | ) | |||
Balance as of December 31, 2005 | — | $ | — | ||||
| Note 6: | Distributions and Tax Information |
In order to present undistributed net investment income and accumulated net realized capital gains (losses) on the statement of assets and liabilities that more closely represent their tax character, certain adjustments have been made to undistributed net investment income and accumulated net realized gain (loss) on investments.
For the year ended December 31, 2005, the adjustments were as follows:
Portfolio | Undistributed Income | Accumulated Net Realized Gain (Loss) | Paid-in Capital | |||||||||
SP AIM Core Equity Portfolio(b) | $ | (6,687 | ) | $ | 6,687 | $ | — | |||||
SP Davis Value Portfolio(b) | (9,986 | ) | 9,986 | — | ||||||||
SP LSV International Value Portfolio(b) | (387,773 | ) | 387,773 | — | ||||||||
SP Mid-Cap Growth Portfolio(a) | 744,133 | — | (744,133 | ) | ||||||||
SP PIMCO High Yield Portfolio(b)(d) | 683,877 | (683,877 | ) | — | ||||||||
SP PIMCO Total Return Portfolio(b)(c)(d) | 8,549,679 | (8,549,679 | ) | — | ||||||||
SP Prudential U.S. Emerging Growth Portfolio(b)(f) | 444,920 | (444,920 | ) | — | ||||||||
SP Small Cap Growth Portfolio(a) | 755,049 | — | (755,049 | ) | ||||||||
SP Strategic Partners Focused Growth Portfolio(f) | 453,472 | (453,472 | ) | — | ||||||||
SP T. Rowe Price Large Cap Growth Portfolio(f) | 252,239 | (252,239 | ) | — | ||||||||
SP William Blair International Growth Portfolio(b)(e) | (93,223 | ) | 93,223 | — | ||||||||
| (a) | Reclassification of tax operating loss. |
| (b) | Reclassification of net foreign currency gain (loss). |
| (c) | Reclassification of paydown losses. |
| (d) | Reclassification of swap income. |
| (e) | Reclassification of income due to sale of passive foreign investment companies. |
| (f) | Reclassification of tax operating loss against capital gains. |
The tax character of distributions paid during the year ended December 31, 2005, were as follows:
Portfolio | Ordinary Income | Long-Term Capital Gains | Total Distributions | ||||||
SP Aggressive Growth Asset Allocation Portfolio | $ | 2,784,998 | $ | 3,220,328 | $ | 6,005,326 | |||
SP AIM Core Equity Portfolio | 337,615 | — | 337,615 | ||||||
SP Balanced Asset Allocation Portfolio | 17,685,987 | 22,025,487 | 39,711,474 | ||||||
SP Conservative Asset Allocation Portfolio | 10,571,529 | 12,999,892 | 23,571,421 | ||||||
SP Davis Value Portfolio | 2,694,772 | 29,342,603 | 32,037,375 | ||||||
SP Growth Asset Allocation Portfolio | 16,999,403 | 13,932,075 | 30,931,478 | ||||||
SP Large Cap Value Portfolio | 17,688,553 | 4,176,180 | 21,864,733 | ||||||
SP LSV International Value Portfolio | 12,360,238 | 11,833,039 | 24,193,277 | ||||||
SP PIMCO High Yield Portfolio | 23,631,498 | 3,362,054 | 26,993,552 | ||||||
SP PIMCO Total Return Portfolio | 77,092,879 | 9,496,299 | 86,589,178 | ||||||
SP Prudential U.S. Emerging Growth Portfolio | 17,879,412 | 4,281,058 | 22,160,470 | ||||||
SP Small Cap Value Portfolio | 31,804,658 | 17,428,304 | 49,232,962 | ||||||
SP William Blair International Growth Portfolio | 8,183,431 | 12,439,468 | 20,622,899 | ||||||
C10
The tax character of distributions paid during the year ended December 31, 2004, were as follows:
Portfolio | Ordinary Income | Long-Term Capital Gains | Total Distributions | ||||||
SP Aggressive Growth Asset Allocation Portfolio | $ | 47,387 | — | $ | 47,387 | ||||
SP AIM Core Equity Portfolio | 121,766 | — | 121,766 | ||||||
SP Balanced Asset Allocation Portfolio | 4,764,898 | $ | 418,285 | 5,183,183 | |||||
SP Conservative Asset Allocation Portfolio | 5,505,641 | 312,063 | 5,817,704 | ||||||
SP Davis Value Portfolio | 1,941,811 | — | 1,941,811 | ||||||
SP Growth Asset Allocation Portfolio | 1,930,590 | — | 1,930,590 | ||||||
SP Large Cap Value Portfolio | 674,049 | — | 674,049 | ||||||
SP LSV International Value Portfolio | 662,879 | — | 662,879 | ||||||
SP PIMCO High Yield Portfolio | 20,411,909 | 745,337 | 21,157,246 | ||||||
SP PIMCO Total Return Portfolio | 24,423,511 | 10,956,735 | 35,380,246 | ||||||
SP Prudential U.S. Emerging Growth Portfolio | — | 56,653 | 56,653 | ||||||
SP Small Cap Value Portfolio | 553,326 | 93,547 | 646,873 | ||||||
SP William Blair International Growth Portfolio | 268,170 | — | 268,170 | ||||||
At December 31, 2005, the components of distributable earnings on a tax basis and approximate capital loss carryforwards were as follows:
| Accumulated Ordinary Income | Accumulated Long-Term Capital Gains | Approximate Capital Loss Carryforward(a) | Expiration | ||||||||||||||||
Portfolio | 2010 | 2012 | 2013 | ||||||||||||||||
SP Aggressive Growth Asset Allocation Portfolio | $ | 3,836,671 | $ | 4,277,298 | — | — | — | — | |||||||||||
SP AIM Core Equity Portfolio | 747,368 | 1,519,694 | — | (b) | — | — | — | ||||||||||||
SP Balanced Asset Allocation Portfolio | 36,258,211 | 22,012,317 | — | — | — | — | |||||||||||||
SP Conservative Asset Allocation Portfolio | 22,739,224 | 8,910,678 | — | — | — | — | |||||||||||||
SP Davis Value Portfolio | 2,834,310 | 4,877,161 | — | — | — | — | |||||||||||||
SP Growth Asset Allocation Portfolio | 23,498,863 | 18,247,907 | — | — | — | — | |||||||||||||
SP Large Cap Value Portfolio | 27,179,982 | 24,464,730 | — | — | — | — | |||||||||||||
SP LSV International Value Portfolio | 10,792,550 | 1,025,884 | — | — | — | — | |||||||||||||
SP Mid-Cap Growth Portfolio | — | — | $ | 1,695,000 | (c) | $ | 1,695,000 | — | — | ||||||||||
SP PIMCO High Yield Portfolio | 1,496,293 | 2,779,073 | — | — | — | — | |||||||||||||
SP PIMCO Total Return Portfolio | 8,452,812 | — | 6,544,000 | — | — | $ | 6,544,000 | ||||||||||||
SP Prudential U.S. Emerging Growth Portfolio. | 11,894,764 | 3,573,992 | — | — | — | — | |||||||||||||
SP Small Cap Growth Portfolio | — | — | 1,576,000 | (d) | — | $ | 1,576,000 | — | |||||||||||
SP Small Cap Value Portfolio | 20,773,353 | 38,534,003 | — | — | — | — | |||||||||||||
SP Strategic Partners Focused Growth Portfolio | 928,277 | 2,292,381 | — | (e) | — | — | — | ||||||||||||
SP T. Rowe Price Large Cap Growth Portfolio | 5,195,499 | 4,046,099 | — | (f) | — | — | — | ||||||||||||
SP William Blair International Growth Portfolio | 21,973,233 | 25,744,916 | — | — | — | — | |||||||||||||
| (a) | Accordingly, no capital gain distribution is expected to be paid to shareholders until net gains have been realized in excess of such carryforwards. |
C11
| (b) | Approximately $316,000 of its capital loss carryforward was used to offset net taxable gains realized in the fiscal year ended December 31, 2005. |
| (c) | Approximately $3,614,000 of its capital loss carryforward was used to offset net taxable gains realized in the fiscal year ended December 31, 2005. |
| (d) | Approximately $16,105,000 of its capital loss carryforward was used to offset net taxable gains realized in the fiscal year ended December 31, 2005. |
| (e) | Approximately $3,533,000 of its capital loss carryforward was used to offset net taxable gains realized in the fiscal year ended December 31, 2005. |
| (f) | Approximately $1,099,000 of its capital loss carryforward was used to offset net taxable gains realized in the fiscal year ended December 31, 2005. |
The difference between book and tax basis is primarily cost basis adjustments and post-October losses (the Portfolios have elected to treat losses incurred in the period November 1, 2005 through December 31, 2005 as having been incurred in the following fiscal year) which are presented below:
Portfolio | Approximate Post October Losses | |||||
| Currency | Capital | |||||
SP Aggressive Growth Asset Allocation Portfolio | — | $ | 9,400 | |||
SP AIM Core Equity Portfolio | $ | 8,000 | — | |||
SP Balanced Asset Allocation Portfolio | — | 30,000 | ||||
SP Davis Value Portfolio | 7,000 | |||||
SP Growth Asset Allocation Portfolio | — | 43,000 | ||||
SP LSV International Value Portfolio | 189,000 | — | ||||
SP Mid-Cap Growth Portfolio | — | 665,000 | ||||
SP PIMCO High Yield Portfolio | — | 84,000 | ||||
SP PIMCO Total Return Portfolio | 2,404,000 | 6,650,000 | ||||
SP William Blair International Growth Portfolio | — | 633,000 | ||||
The United States federal income tax basis and unrealized appreciation (depreciation) of the Series Fund’s investments and the total net unrealized appreciation (depreciation) as of December 31, 2005 were as follows:
Portfolio | Tax Basis | Appreciation | Depreciation | Net Unrealized Appreciation (Depreciation) | Other Cost Basis Adjustment | Total Net Unrealized Appreciation (Depreciation) | |||||||||||||||
SP Aggressive Growth Asset Allocation Portfolio | $ | 164,243,477 | $ | 24,117,154 | — | $ | 24,117,154 | — | $ | 24,117,154 | |||||||||||
SP AIM Core Equity Portfolio | 33,111,628 | 2,345,742 | $ | 1,190,068 | 1,155,674 | $ | (9,949 | ) | 1,145,725 | ||||||||||||
SP Balanced Asset Allocation Portfolio | 1,271,356,886 | 110,704,294 | 9,138,847 | 101,565,447 | — | 101,565,447 | |||||||||||||||
SP Conservative Asset Allocation Portfolio | 612,208,945 | 36,826,293 | 7,161,120 | 29,665,173 | — | 29,665,173 | |||||||||||||||
SP Davis Value Portfolio | 267,833,854 | 73,232,186 | 5,259,224 | 67,972,962 | (9,379 | ) | 67,963,583 | ||||||||||||||
SP Growth Asset Allocation Portfolio | 1,098,131,620 | 121,808,336 | 5,141,825 | 116,666,511 | — | 116,666,511 | |||||||||||||||
SP Large Cap Value Portfolio | 915,278,178 | 87,061,206 | 26,039,026 | 61,022,180 | (2,152 | ) | 61,020,028 | ||||||||||||||
SP LSV International Value Portfolio | 333,991,728 | 55,761,621 | 5,496,366 | 50,265,255 | (188,889 | ) | 50,076,366 | ||||||||||||||
SP Mid-Cap Growth Portfolio | 147,064,899 | 30,832,603 | 1,952,586 | 28,880,017 | (669,111 | ) | 28,210,906 | ||||||||||||||
SP PIMCO High Yield Portfolio | 361,676,219 | 8,022,497 | 6,127,053 | 1,895,444 | (168,438 | ) | 1,727,006 | ||||||||||||||
SP PIMCO Total Return Portfolio | 2,023,106,708 | 13,766,052 | 19,478,371 | (5,712,319 | ) | (8,414,107 | ) | (14,126,426 | ) | ||||||||||||
SP Prudential U.S. Emerging Growth Portfolio. | 224,798,423 | 37,162,920 | 2,895,476 | 34,267,444 | — | 34,267,444 | |||||||||||||||
C12
Portfolio | Tax Basis | Appreciation | Depreciation | Net Unrealized Appreciation (Depreciation) | Other Cost Basis Adjustment | Total Net Unrealized Appreciation (Depreciation) | |||||||||||||
SP Small Cap Growth Portfolio | $ | 137,410,651 | $ | 15,404,814 | $ | 5,265,672 | $ | 10,139,142 | $ | (2,118 | ) | $ | 10,137,024 | ||||||
SP Small Cap Value Portfolio | 366,430,451 | 25,934,342 | 13,477,287 | 12,457,055 | (2,351 | ) | 12,454,704 | ||||||||||||
SP Strategic Partners Focused Growth Portfolio | 68,320,535 | 13,221,347 | 644,083 | 12,577,264 | (2,143 | ) | 12,575,121 | ||||||||||||
SP T. Rowe Price Large Cap Growth Portfolio | 69,859,000 | 6,307,865 | 1,968,714 | 4,339,151 | (2,314 | ) | 4,336,837 | ||||||||||||
SP William Blair International Growth Portfolio | 399,524,468 | 87,467,012 | 10,865,518 | 76,601,494 | (633,267 | ) | 75,968,227 | ||||||||||||
The differences between book basis and tax basis of investments are primarily attributable to deferred losses on wash sales and mark to market on passive foreign investments companies. The other cost basis adjustments are primarily attributable to appreciation (depreciation) of foreign currency and mark to market of receivables and payables.
| Note 7: | Capital |
The Series Fund offers Class I and Class II shares. Neither Class I nor Class II shares of a Portfolio are subject to any sales charge or redemption charge and are sold at the net asset value of the Portfolio. Class I shares are sold only to certain separate accounts of Prudential to fund benefits under certain variable life insurance and variable annuity contracts (“contracts”). Class II shares are sold only to separate accounts of non-Prudential insurance companies as investment options under certain contracts. The separate accounts invest in shares of the Series Fund through subaccounts that correspond to the Portfolios. The separate accounts will redeem shares of the Series Fund to the extent necessary to provide benefits under the contracts or for such other purposes as may be consistent with the contracts. As of December 31, 2005, the SP Prudential U.S. Emerging Growth, SP Strategic Partners Focused Growth and SP William Blair International Growth Portfolios have Class II shares outstanding.
Transactions in shares of common stock of the SP Prudential U.S. Emerging Growth, SP Strategic Partners Focused Growth and SP William Blair International Growth Portfolios were as follows:
SP Prudential U.S. Emerging Growth Portfolio:
Class I | Shares | Amount | |||||
Year ended December 31, 2005: | |||||||
Capital stock sold | 4,400,150 | $ | 32,192,743 | ||||
Capital stock issued in connection with the merger | 4,037,693 | 24,736,435 | |||||
Capital stock issued in reinvestment of dividends and distributions | 3,416,212 | 22,102,890 | |||||
Capital stock repurchased | (3,006,411 | ) | (21,435,346 | ) | |||
Net increase (decrease) in shares outstanding | 8,847,644 | $ | 57,596,722 | ||||
Year ended December 31, 2004: | |||||||
Capital stock sold | 11,300,085 | $ | 79,116,525 | ||||
Capital stock issued in reinvestment of dividends and distributions | 8,317 | 56,557 | |||||
Capital stock repurchased | (20,985,809 | ) | (147,456,481 | ) | |||
Net increase (decrease) in shares outstanding | (9,677,407 | ) | $ | (68,283,399 | ) | ||
Class II | |||||||
Year ended December 31, 2005: | |||||||
Capital stock sold | — | (a) | $ | 4 | |||
Capital stock issued in reinvestment of dividends and distributions | 9,054 | 57,580 | |||||
Capital stock repurchased | (4,646 | ) | (34,601 | ) | |||
Net increase (decrease) in shares outstanding | 4,408 | $ | 22,983 | ||||
C13
Class II | Shares | Amount | |||||
Year ended December 31, 2004: | |||||||
Capital stock sold | 1,465 | $ | 10,369 | ||||
Capital stock issued in reinvestment of dividends and distributions | 14 | 96 | |||||
Capital stock repurchased | (7,916 | ) | (55,951 | ) | |||
Net increase (decrease) in shares outstanding | (6,437 | ) | $ | (45,486 | ) | ||
(a) Less than 0.5 Shares. | |||||||
SP Strategic Partners Focused Growth Portfolio:
Class I | Shares | Amount | |||||
Year ended December 31, 2005: | |||||||
Capital stock sold | 1,314,274 | $ | 9,555,363 | ||||
Capital stock repurchased | (867,937 | ) | (6,268,773 | ) | |||
Net increase (decrease) in shares outstanding | 446,337 | $ | 3,286,590 | ||||
Year ended December 31, 2004: | |||||||
Capital stock sold | 1,654,780 | $ | 10,560,311 | ||||
Capital stock repurchased | (769,923 | ) | (4,935,347 | ) | |||
Net increase (decrease) in shares outstanding | 884,857 | $ | 5,624,964 | ||||
Class II | |||||||
Year ended December 31, 2005: | |||||||
Capital stock sold | 2,332,071 | $ | 16,000,029 | ||||
Capital stock repurchased | (1,580,961 | ) | (10,666,031 | ) | |||
Net increase (decrease) in shares outstanding | 751,110 | $ | 5,333,998 | ||||
Year ended December 31, 2004: | |||||||
Capital stock sold | 2,799,160 | $ | 17,643,912 | ||||
Capital stock repurchased | (416,330 | ) | (2,590,442 | ) | |||
Net increase (decrease) in shares outstanding | 2,382,830 | $ | 15,053,470 | ||||
SP William Blair International Growth Portfolio:
Class I | Shares | Amount | |||||
Year ended December 31, 2005: | |||||||
Capital stock sold | 26,170,510 | $ | 176,617,874 | ||||
Capital stock issued in reinvestment of dividends and distributions | 2,198,193 | 14,002,490 | |||||
Capital stock repurchased | (4,631,938 | ) | (31,184,958 | ) | |||
Net increase (decrease) in shares outstanding | 23,736,765 | $ | 159,435,406 | ||||
Year ended December 31, 2004: | |||||||
Capital stock sold | 24,201,018 | $ | 148,084,849 | ||||
Capital stock issued in reinvestment of dividends and distributions | 44,253 | 268,170 | |||||
Capital stock repurchased | (5,845,906 | ) | (35,656,506 | ) | |||
Net increase (decrease) in shares outstanding | 18,399,365 | $ | 112,696,513 | ||||
Class II | |||||||
Year ended December 31, 2005: | |||||||
Capital stock sold | 2,776,309 | $ | 18,228,199 | ||||
Capital stock issued in reinvestment of dividends and distributions | 1,050,858 | 6,620,409 | |||||
Capital stock repurchased | (21,269,733 | ) | (143,583,241 | ) | |||
Net increase (decrease) in shares outstanding | (17,442,566 | ) | $ | (118,734,633 | ) | ||
Year ended December 31, 2004: | |||||||
Capital stock sold | 17,228,253 | $ | 103,821,726 | ||||
Capital stock repurchased | (16,197,374 | ) | (97,310,208 | ) | |||
Net increase (decrease) in shares outstanding | 1,030,879 | $ | 6,511,518 | ||||
C14
| Note 8: | Borrowings |
The Series Fund (excluding the Money Market Portfolio), along with other affiliated registered investment companies (the “Funds”), is a party to a syndicated credit agreement (“SCA”) with two banks. The SCA provides for a commitment of $500 million. Interest on any borrowings under the SCA would be incurred at market rates. For the period from October 29, 2004 through October 28, 2005, the Series Fund paid a commitment fee of .075 of 1% of the unused portion of the agreement. Effective October 29, 2005, the Funds renewed the SCA with the banks. The commitment under the renewed SCA continues to be $500 million. The Series Fund pays a commitment fee of .0725 of 1% of the unused portion of the renewed SCA. The commitment fee is accrued daily and paid quarterly and is allocated to the Funds pro-rate based on net assets. The purpose of the SCA is to serve as an alternative source of funding for capital share redemptions. The expiration date of the renewed SCA is October 27, 2006.
The following Portfolios utilized the line of credit during the year ended December 31, 2005. The average balance is for the number of days the Portfolios had an outstanding balance.
Portfolio | Average Balance Outstanding | Number of Outstanding | Weighted Interest Rates | |||||
SP Large Cap Value Portfolio . | $ | 1,583,333 | 3 | 4.25 | % | |||
SP Strategic Partners Focused Growth Portfolio | $ | 424,292 | 24 | 3.46 | % | |||
| Note 9: | Reorganizations |
On November 18, 2004, the Board of Directors of the Series Fund approved an Agreement and Plan of Reorganization (the “Plan”) which provided for the transfer of all the assets of the SP MFS Capital Opportunities Portfolio, SP AIM Aggressive Growth Portfolio and SP Technology Portfolio to the Equity Portfolio, SP Mid Cap Growth Portfolio and SP Prudential U.S. Emerging Growth Portfolio, respectively, and the assumption of its liabilities.
Shareholders approved the Plan at a meeting on April 19, 2005 and the reorganization took place on April 29, 2005. The acquisition was accomplished by a tax-free exchange of the following shares:
Merged Portfolio | Shares | |
SP AIM Aggressive Growth Portfolio | 5,202,111 | |
SP Technology Portfolio . | 5,782,958 |
Acquiring Portfolio | Shares Issued | Total Net Assets Acquired | |||
SP Mid Cap Growth Portfolio . | 5,202,111 | $ | 31,565,347 | ||
SP Prudential U.S. Emerging Growth Portfolio | 4,037,693 | 24,736,435 | |||
The aggregate net assets and unrealized appreciation of the Merged and Acquiring Portfolios immediately before the merger and the amount of the capital loss carryforward of the merged Portfolios (subject to future utilization by the acquiring Portfolio) were as follows:
Merged Portfolio | Total Net Assets | Unrealized Appreciation/ (Depreciation) | Capital Loss Carryforward* | |||||||
SP AIM Aggressive Growth Portfolio | $ | 31,565,347 | $ | (1,566,136 | ) | — | ||||
SP Technology Portfolio | 24,736,435 | (526,194 | ) | $ | 3,799,000 | |||||
Acquiring Portfolio | |||
SP Mid Cap Growth Portfolio | $ | 99,493,371 | |
SP Prudential U.S. Emerging Growth Portfolio | 122,565,841 | ||
| * | The future utilization of the acquired capital loss carryforwards may be limited under certain conditions defined in the Internal Revenue Code of 1986, as amended. |
C15
| Note 10: | Ownership and Affiliates |
As of December 31, 2005, all of Class I shares of each Portfolio were owned of record by The Prudential Insurance Company of America (“PICA”) on behalf of the owners of the variable insurance products issued by PICA.
| Note 11: | Change in Federal Income Tax Status and Related Reorganization |
On January 2, 2006, each Portfolio of the Fund changed its federal income tax status from a regulated investment company to a partnership. As a result of that conversion, the Fund was reorganized from a Maryland corporation to a Delaware statutory trust. Pursuant to this reorganization, the Fund has been renamed “The Prudential Series Fund.” Subsequent to January 2, 2006, each Portfolio’s income, gains, losses and credits will be allocated directly to its partners and will retain the same character for federal income tax purposes. Furthermore, subsequent to January 2, 2006 each portfolio will not be able to realize any future benefit from any unused capital loss carryforward and other losses (if any) deferred from each Portfolio fiscal year ended December 31, 2005 as detailed in Note 6.
The investment objectives, policies, restrictions, net asset values per share, service providers, fiscal years, and investment portfolios of the Portfolios have not changed. In addition, the Fund obtained opinions of counsel that the change in the tax status and the related reorganization had no adverse federal income tax consequences for the Portfolios or Contract owners.
C16
Financial Highlights
| SP Aggressive Growth Asset Allocation Portfolio | ||||||||||||||||||||
| Year Ended December 31, | ||||||||||||||||||||
| 2005 | 2004 | 2003 | 2002 | 2001 | ||||||||||||||||
Per Share Operating Performance: | ||||||||||||||||||||
Net Asset Value, beginning of year | $ | 8.98 | $ | 7.83 | $ | 5.90 | $ | 7.58 | $ | 9.33 | ||||||||||
Income (Loss) From Investment Operations: | ||||||||||||||||||||
Net investment income | .18 | .02 | .01 | — | (b) | .02 | ||||||||||||||
Net realized and unrealized gains (losses) on investments | .71 | 1.13 | 1.92 | (1.68 | ) | (1.69 | ) | |||||||||||||
Total from investment operations | .89 | 1.15 | 1.93 | (1.68 | ) | (1.67 | ) | |||||||||||||
Less Dividends and Distributions: | ||||||||||||||||||||
Dividends from net investment income | (.02 | ) | — | (b) | — | (b) | — | (.02 | ) | |||||||||||
Distributions from net realized gains | (.35 | ) | — | — | — | (.06 | ) | |||||||||||||
Total dividends and distributions | (.37 | ) | — | — | — | (.08 | ) | |||||||||||||
Net Asset Value, end of year | $ | 9.50 | $ | 8.98 | $ | 7.83 | $ | 5.90 | $ | 7.58 | ||||||||||
Total Investment Return(a) | 10.48 | % | 14.76 | % | 32.77 | % | (22.16 | )% | (17.92 | )% | ||||||||||
Ratios/Supplemental Data: | ||||||||||||||||||||
Net assets, end of year (in millions) | $ | 188.2 | $ | 136.9 | $ | 60.6 | $ | 15.1 | $ | 7.5 | ||||||||||
Ratios to average net assets: | ||||||||||||||||||||
Expenses | .05 | % | .05 | % | .05 | % | .05 | % | .05 | % | ||||||||||
Net investment income | 2.29 | % | .27 | % | .16 | % | .06 | % | .39 | % | ||||||||||
Portfolio turnover rate | 26 | % | 60 | % | 22 | % | 26 | % | 62 | % | ||||||||||
| (a) | Total investment return is calculated assuming a purchase of shares on the first day and a sale on the last day of each year reported and includes reinvestment of dividends and distributions and does not reflect the effect of insurance contract charges. Total return does not reflect expenses associated with the separate account such as administrative fees, account charges and surrender charges which, if reflected, would reduce the total returns for all periods shown. Performance figures may reflect voluntary fee waivers and/or expense reimbursements. In the absence of voluntary fee waivers and/or expense reimbursements, the total return would be lower. Past performance is no guarantee of future results. |
| (b) | Less than $0.005 per share. |
| SP AIM Core Equity Portfolio | ||||||||||||||||||||
| Year Ended December 31, | ||||||||||||||||||||
| 2005 | 2004 | 2003 | 2002 | 2001 | ||||||||||||||||
Per Share Operating Performance: | ||||||||||||||||||||
Net Asset Value, beginning of year | $ | 7.36 | $ | 6.80 | $ | 5.52 | $ | 6.51 | $ | 8.41 | ||||||||||
Income From Investment Operations: | ||||||||||||||||||||
Net investment income (loss) | 0.07 | 0.08 | 0.04 | 0.02 | — | (c) | ||||||||||||||
Net realized and unrealized gains (losses) on investments | 0.27 | 0.51 | 1.26 | (1.01 | ) | (1.90 | ) | |||||||||||||
Total from investment operations | 0.34 | 0.59 | 1.30 | (0.99 | ) | (1.90 | ) | |||||||||||||
Less Dividends: | ||||||||||||||||||||
Dividends from net investment income | (0.08 | ) | (0.03 | ) | (0.02 | ) | — | — | ||||||||||||
Net Asset Value, end of year | $ | 7.62 | $ | 7.36 | $ | 6.80 | $ | 5.52 | $ | 6.51 | ||||||||||
Total Investment Return(a) | 4.63 | % | 8.79 | % | 23.69 | % | (15.21 | )% | (22.68 | )% | ||||||||||
Ratios/Supplemental Data: | ||||||||||||||||||||
Net assets, end of year (in millions) | $ | 34.2 | $ | 31.8 | $ | 22.8 | $ | 13.9 | $ | 10.2 | ||||||||||
Ratios to average net assets(b): | ||||||||||||||||||||
Expenses | 1.00 | % | 1.00 | % | 1.00 | % | 1.00 | % | 1.00 | % | ||||||||||
Net investment income (loss) | 0.98 | % | 1.27 | % | 0.70 | % | 0.45 | % | (0.02 | )% | ||||||||||
Portfolio turnover rate | 69 | % | 68 | % | 37 | % | 116 | % | 65 | % | ||||||||||
| (a) | Total investment return is calculated assuming a purchase of shares on the first day and a sale on the last day of each year reported and includes reinvestment of dividends and distributions. Total return does not reflect expenses associated with the separate account such as administrative fees, account charges and surrender charges which, if reflected, would reduce the total returns for all years shown. Performance figures may reflect voluntary fee waivers and/or expense reimbursements. In the absence of voluntary fee waivers and/or expense reimbursements, the total return would be lower. Past performance is no guarantee of future results. |
| (b) | Net of expense reimbursement. If the investment advisor had not reimbursed expenses, the annual expense and net investment income (loss) ratios would have been 1.28% and 0.70%, respectively, for the year ended December 31, 2005, 1.48% and 0.79%, respectively, for the year ended December 31, 2004, and 1.72% and (0.02)%, respectively for the year ended December 31, 2003, 1.79% and (0.34)%, respectively, for the year ended December 31, 2002, 2.55% and (1.57)%, respectively for the year ended December 31, 2001. |
| (c) | Less than $0.005 per share. |
SEE NOTES TO FINANCIAL STATEMENTS.
D1
Financial Highlights
| SP Balanced Asset Allocation Portfolio | ||||||||||||||||||||
| Year Ended December 31, | ||||||||||||||||||||
| 2005 | 2004 | 2003 | 2002 | 2001 | ||||||||||||||||
Per Share Operating Performance: | ||||||||||||||||||||
Net Asset Value, beginning of year | $ | 10.63 | $ | 9.66 | $ | 7.96 | $ | 9.02 | $ | 9.80 | ||||||||||
Income (Loss) From Investment Operations: | ||||||||||||||||||||
Net investment income | .27 | .09 | .09 | .11 | .14 | |||||||||||||||
Net realized and unrealized gain (loss) on investments | .49 | .97 | 1.71 | (1.16 | ) | (.73 | ) | |||||||||||||
Total from investment operations | .76 | 1.06 | 1.80 | (1.05 | ) | (.59 | ) | |||||||||||||
Less Dividends and Distributions: | ||||||||||||||||||||
Dividends from net investment income | (.10 | ) | (.08 | ) | (.10 | ) | — | (.14 | ) | |||||||||||
Distributions from net realized gains | (.37 | ) | (.01 | ) | — | (.01 | ) | (.05 | ) | |||||||||||
Total dividends and distributions | (.47 | ) | (.09 | ) | (.10 | ) | (.01 | ) | (.19 | ) | ||||||||||
Net Asset Value, end of year | $ | 10.92 | $ | 10.63 | $ | 9.66 | $ | 7.96 | $ | 9.02 | ||||||||||
Total Investment Return(a) | 7.60 | % | 11.09 | % | 22.87 | % | (11.67 | )% | (5.99 | )% | ||||||||||
Ratios/Supplemental Data: | ||||||||||||||||||||
Net assets, end of year (in millions) | $ | 1,372.0 | $ | 837.0 | $ | 449.8 | $ | 147.3 | $ | 66.1 | ||||||||||
Ratios to average net assets: | ||||||||||||||||||||
Expenses | .05 | % | .05 | % | .05 | % | .05 | % | .05 | % | ||||||||||
Net investment income | 3.40 | % | 1.37 | % | 1.83 | % | 1.96 | % | 3.26 | % | ||||||||||
Portfolio turnover rate | 21 | % | 48 | % | 12 | % | 22 | % | 35 | % | ||||||||||
| (a) | Total investment return is calculated assuming a purchase of shares on the first day and a sale on the last day of each year reported and includes reinvestment of dividends and distributions and does not reflect the effect of insurance contract charges. Total return does not reflect expenses associated with the separate account such as administrative fees, account charges and surrender charges which, if reflected, would reduce the total returns for all periods shown. Performance figures may reflect voluntary fee waivers and/or expense reimbursements. In the absence of voluntary fee waivers and/or expense reimbursements, the total return would be lower. Past performance is no guarantee of future results. |
| SP Conservative Asset Allocation Portfolio | ||||||||||||||||||||
| Year Ended December 31, | ||||||||||||||||||||
| 2005 | 2004 | 2003 | 2002 | 2001 | ||||||||||||||||
Per Share Operating Performance: | ||||||||||||||||||||
Net Asset Value, Beginning of Year | $ | 11.20 | $ | 10.48 | $ | 9.16 | $ | 9.77 | $ | 10.00 | ||||||||||
Income (loss) from investment operations: | ||||||||||||||||||||
Net investment income | .38 | .14 | .16 | .16 | .21 | |||||||||||||||
Net realized and unrealized gain (loss) on investments | .25 | .77 | 1.33 | (.73 | ) | (.24 | ) | |||||||||||||
Total from investment operations | .63 | .91 | 1.49 | (.57 | ) | (.03 | ) | |||||||||||||
Less Distributions: | ||||||||||||||||||||
Dividends from net investment income | (.16 | ) | (.16 | ) | (.16 | ) | (.03 | ) | (.16 | ) | ||||||||||
Distributions from net realized gains | (.39 | ) | (.03 | ) | (.01 | ) | (.01 | ) | (.04 | ) | ||||||||||
Total distributions | (.55 | ) | (.19 | ) | (.17 | ) | (.04 | ) | (.20 | ) | ||||||||||
Net asset value, end of year | $ | 11.28 | $ | 11.20 | $ | 10.48 | $ | 9.16 | $ | 9.77 | ||||||||||
Total Investment Return(a): | 5.91 | % | 8.89 | % | 16.49 | % | (5.88 | )% | (.23 | )% | ||||||||||
Ratios/Supplemental Data: | ||||||||||||||||||||
Net assets, end of year (000,000) | $ | 642.0 | $ | 459.9 | $ | 281.2 | $ | 117.5 | $ | 47.9 | ||||||||||
Ratios to average net assets: | ||||||||||||||||||||
Expenses | .05 | % | .05 | % | .05 | % | .05 | % | .05 | % | ||||||||||
Net investment income | 4.10 | % | 1.86 | % | 2.60 | % | 2.79 | % | 4.76 | % | ||||||||||
Portfolio turnover rate | 24 | % | 47 | % | 22 | % | 25 | % | 29 | % | ||||||||||
| (a) | Total investment return is calculated assuming a purchase of shares on the first day and a sale on the last day of each year reported and includes reinvestment of dividends and distributions and does not reflect the effect of insurance contract charges. Total investment returns for periods of less than one full year are not annualized. Total return does not reflect expenses associated with the separate account such as administrative fees, account charges and surrender charges which, if reflected, would reduce the total returns for all periods shown. Performance figures may reflect voluntary fee waivers and/or expense reimbursements. In the absence of voluntary fee waivers and/or expense reimbursements, the total return would be lower. Past performance is no guarantee of future results. |
| (b) | Less than $0.005 per share. |
| (c) | Annualized. |
| (d) | Not annualized. |
SEE NOTES TO FINANCIAL STATEMENTS.
D2
Financial Highlights
| SP Davis Value Portfolio | ||||||||||||||||||||
| Year Ended December 31, | ||||||||||||||||||||
| 2005 | 2004 | 2003 | 2002 | 2001 | ||||||||||||||||
Per Share Operating Performance: | ||||||||||||||||||||
Net Asset Value, beginning of year | $ | 10.98 | $ | 9.80 | $ | 7.62 | $ | 9.04 | $ | 10.15 | ||||||||||
Income (loss) From Investment Operations: | ||||||||||||||||||||
Net investment income | 0.09 | 0.10 | 0.05 | 0.05 | 0.05 | |||||||||||||||
Net realized and unrealized gains (losses) on investments | 0.82 | 1.12 | 2.18 | (1.47 | ) | (1.11 | ) | |||||||||||||
Total from investment operations | 0.91 | 1.22 | 2.23 | (1.42 | ) | (1.06 | ) | |||||||||||||
Less Dividends and Distributions: | ||||||||||||||||||||
Dividends from net investment income | (0.10 | ) | (0.04 | ) | (0.05 | ) | — | (c) | (0.05 | ) | ||||||||||
Distributions from net realized gains | (1.11 | ) | — | — | — | — | ||||||||||||||
Total dividends and distributions | (1.21 | ) | (0.04 | ) | (0.05 | ) | — | (0.05 | ) | |||||||||||
Net Asset Value, end of year | $ | 10.68 | $ | 10.98 | $ | 9.80 | $ | 7.62 | $ | 9.04 | ||||||||||
Total Investment Return(a) | 9.52 | % | 12.53 | % | 29.40 | % | (15.70 | )% | (10.46 | )% | ||||||||||
Ratios/Supplemental Data: | ||||||||||||||||||||
Net assets, end of year (in millions) | $ | 311.7 | $ | 285.5 | $ | 391.2 | $ | 165.0 | $ | 94.4 | ||||||||||
Ratios to average net assets: | ||||||||||||||||||||
Expenses | 0.82 | % | 0.82 | % | 0.82 | % | 0.83 | %(b) | 0.83 | %(b) | ||||||||||
Net investment income | 0.87 | % | 0.89 | % | 0.80 | % | 0.82 | %(b) | 0.64 | %(b) | ||||||||||
Portfolio turnover rate | 14 | % | 34 | % | 7 | % | 22 | % | 17 | % | ||||||||||
| (a) | Total investment return is calculated assuming a purchase of shares on the first day and a sale on the last day of each period reported and includes reinvestment of dividends and distributions. Total return does not reflect expenses associated with the separate account such as administrative fees, account charges and surrender charges which, if reflected, would reduce the total returns for all periods shown. Performance figures may reflect voluntary fee waivers and/or expense reimbursements. In the absence of voluntary fee waivers and/or expense reimbursements, the total return would be lower. Past performance is no guarantee of future results. |
| (b) | Net of expense reimbursement. If the investment advisor had not reimbursed expenses, the annual expense and net investment income (loss) ratios would have been 0.87% and 0.78%, respectively, for the year ended December 31, 2002 and 1.03% and 0.43%, respectively, for the year ended December 31, 2001. |
| (c) | Less than $0.005 per share. |
| SP Growth Asset Allocation Portfolio | ||||||||||||||||||||
| Year Ended December 31, | ||||||||||||||||||||
| 2005 | 2004 | 2003 | 2002 | 2001 | ||||||||||||||||
Per Share Operating Performance: | ||||||||||||||||||||
Net Asset Value, beginning of year | $ | 9.80 | $ | 8.71 | $ | 6.84 | $ | 8.27 | $ | 9.52 | ||||||||||
Income (Loss) From Investment Operations: | ||||||||||||||||||||
Net investment income | 0.19 | 0.06 | 0.04 | 0.06 | 0.09 | |||||||||||||||
Net realized and unrealized gains (losses) on investments | 0.66 | 1.07 | 1.88 | (1.49 | ) | (1.21 | ) | |||||||||||||
Total from investment operations | 0.85 | 1.13 | 1.92 | (1.43 | ) | (1.12 | ) | |||||||||||||
Less Dividends and Distributions: | ||||||||||||||||||||
Dividends from net investment income | (0.06 | ) | (0.04 | ) | (0.05 | ) | — | (0.08 | ) | |||||||||||
Distributions from net realized gains | (0.36 | ) | — | — | — | (b) | (0.05 | ) | ||||||||||||
Total dividends and distributions | (0.42 | ) | (0.04 | ) | (0.05 | ) | — | (0.13 | ) | |||||||||||
Net Asset Value, end of year | $ | 10.23 | $ | 9.80 | $ | 8.71 | $ | 6.84 | $ | 8.27 | ||||||||||
Total Investment Return(a) | 9.24 | % | 13.05 | % | 28.27 | % | (17.26 | )% | (11.77 | )% | ||||||||||
Ratios/Supplemental Data: | ||||||||||||||||||||
Net assets, end of year (in millions) | $ | 1,212.0 | $ | 662.7 | $ | 326.7 | $ | 96.4 | $ | 46.8 | ||||||||||
Ratios to average net assets: | ||||||||||||||||||||
Expenses | 0.05 | % | 0.05 | % | 0.05 | % | 0.05 | % | 0.05 | % | ||||||||||
Net investment income | 2.65 | % | 0.94 | % | 1.10 | % | 1.12 | % | 1.71 | % | ||||||||||
Portfolio turnover rate | 18 | % | 53 | % | 18 | % | 24 | % | 43 | % | ||||||||||
| (a) | Total investment return is calculated assuming a purchase of shares on the first day and a sale on the last day of each year reported and includes reinvestment of dividends and distributions and does not reflect the effect of insurance contract charges. Total return does not reflect expenses associated with the separate account such as administrative fees, account charges and surrender charges which, if reflected, would reduce the total returns for all periods shown. Performance figures may reflect voluntary fee waivers and/or expense reimbursements. In the absence of voluntary fee waivers and/or expense reimbursements, the total return would be lower. Past performance is no guarantee of future results. |
| (b) | Less than $0.005 per share. |
SEE NOTES TO FINANCIAL STATEMENTS.
D3
Financial Highlights
| SP Large Cap Value Portfolio | ||||||||||||||||||||
| Year Ended December 31, | ||||||||||||||||||||
| 2005 | 2004(d) | 2003 | 2002 | 2001 | ||||||||||||||||
Per Share Operating Performance: | ||||||||||||||||||||
Net Asset Value, beginning of year | $ | 11.56 | $ | 9.90 | $ | 7.81 | $ | 9.44 | $ | 10.44 | ||||||||||
Income From Investment Operations: | ||||||||||||||||||||
Net investment income | 0.16 | 0.16 | 0.09 | 0.08 | 0.09 | |||||||||||||||
Net realized and unrealized gains (losses) on investments | 0.58 | 1.58 | 2.00 | (1.62 | ) | (0.99 | ) | |||||||||||||
Total from investment operations | 0.74 | 1.74 | 2.09 | (1.54 | ) | (0.90 | ) | |||||||||||||
Less Distributions: | ||||||||||||||||||||
Dividends from net investment income | (0.10 | ) | (0.08 | ) | — | (0.09 | ) | (0.10 | ) | |||||||||||
Dividends from net realized gains | (0.30 | ) | — | — | — | — | ||||||||||||||
Tax Return of Capital | — | — | — | — | (c) | — | ||||||||||||||
Total distributions | (0.40 | ) | (0.08 | ) | — | (0.09 | ) | (0.10 | ) | |||||||||||
Net Asset Value, end of year | $ | 11.90 | $ | 11.56 | $ | 9.90 | $ | 7.81 | $ | 9.44 | ||||||||||
Total Investment Return(a) | 6.64 | % | 17.75 | % | 26.76 | % | (16.37 | )% | (8.65 | )% | ||||||||||
Ratios/Supplemental Data: | ||||||||||||||||||||
Net assets, end of year (in millions) | $ | 833.1 | $ | 601.4 | $ | 72.9 | $ | 38.3 | $ | 23.7 | ||||||||||
Ratios to average net assets: | ||||||||||||||||||||
Expenses | 0.83 | % | 0.86 | % | 0.90 | %(b) | 0.90 | %(b) | 0.90 | %(b) | ||||||||||
Net investment income | 1.53 | % | 1.53 | % | 1.32 | %(b) | 1.22 | %(b) | 1.18 | %(b) | ||||||||||
Portfolio turnover rate | 62 | % | 77 | % | 73 | % | 96 | % | 61 | % | ||||||||||
| (a) | Total investment return is calculated assuming a purchase of shares on the first day and a sale on the last day of each period reported and includes reinvestment of dividends and distributions. Total return does not reflect expenses associated with the separate account such as administrative fees, account charges and surrender charges which, if reflected, would reduce the total returns for all periods shown. Performance figures may reflect voluntary fee waivers and/or expense reimbursements. In the absence of voluntary fee waivers and/or expense reimbursements, the total return would be lower. Past performance is no guarantee of future results. |
| (b) | Net of expense reimbursement. If the investment advisor had not reimbursed expenses, the annual expense and net investment income (loss) ratios would have been 1.11% and 1.11%, respectively, for the year ended December 31, 2003 and 1.31% and 0.81%, respectively, for the year ended December 31, 2002, and 1.98% and 0.10%, respectively, for the year ended December 31, 2001. |
| (c) | Less than $0.005 per share. |
| (d) | Calculated based upon weighted average shares outstanding during the year. |
| SP LSV International Value Portfolio | ||||||||||||||||||||
| Year Ended December 31, | ||||||||||||||||||||
| 2005(c) | 2004 | 2003(c) | 2002 | 2001 | ||||||||||||||||
Per Share Operating Performance: | ||||||||||||||||||||
Net Asset Value, beginning of year | $ | 8.84 | $ | 7.67 | $ | 6.08 | $ | 7.35 | $ | 9.44 | ||||||||||
Income From Investment Operations: | ||||||||||||||||||||
Net investment income | 0.17 | 0.04 | 0.06 | 0.04 | 0.05 | |||||||||||||||
Net realized and unrealized gains (losses) on investments | 0.94 | 1.17 | 1.58 | (1.31 | ) | (2.09 | ) | |||||||||||||
Total from investment operations | 1.11 | 1.21 | 1.64 | (1.27 | ) | (2.04 | ) | |||||||||||||
Less Dividends and Distributions: | ||||||||||||||||||||
Dividends from net investment income | (0.04 | ) | (0.04 | ) | (0.05 | ) | — | (0.05 | ) | |||||||||||
Dividends from net realized gains | (0.83 | ) | — | — | — | — | ||||||||||||||
Total dividends and distributions | (0.87 | ) | (0.04 | ) | (0.05 | ) | — | (0.05 | ) | |||||||||||
Net Asset Value, end of year | $ | 9.08 | $ | 8.84 | $ | 7.67 | $ | 6.08 | $ | 7.35 | ||||||||||
Total Investment Return(a) | 13.77 | % | 15.80 | % | 27.37 | % | (17.17 | )% | (22.07 | )% | ||||||||||
Ratios/Supplemental Data: | ||||||||||||||||||||
Net assets, end of year (in millions) | $ | 389.3 | $ | 240.7 | $ | 119.9 | $ | 46.4 | $ | 24.7 | ||||||||||
Ratios to average net assets: | ||||||||||||||||||||
Expenses | 1.06 | % | 1.10 | %(b) | 1.10 | %(b) | 1.10 | %(b) | 1.10 | %(b) | ||||||||||
Net investment income | 2.08 | % | 0.69 | %(b) | 0.89 | %(b) | 0.55 | %(b) | 0.61 | %(b) | ||||||||||
Portfolio turnover rate | 18 | % | 159 | % | 87 | % | 141 | % | 155 | % | ||||||||||
| (a) | Total investment return is calculated assuming a purchase of shares on the first day and a sale on the last day of each period reported and includes reinvestment of dividends and distributions. Total return does not reflect expenses associated with the separate account such as administrative fees, account charges and surrender charges which, if reflected, would reduce the total returns for all periods shown. Performance figures may reflect voluntary fee waivers and/or expense reimbursements. In the absence of voluntary fee waivers and/or expense reimbursements, the total return would be lower. Past performance is no guarantee of future results. |
| (b) | Net of expense reimbursement. If the investment advisor had not reimbursed expenses, the annual expense and net investment loss ratios would have been 1.23% and 0.55%, respectively, for the year ended December 31, 2004, 1.30% and 0.69%, respectively, for the year ended December 31, 2003, 1.77% and (0.12)%, respectively, for the year ended December 31, 2002, and 3.27% and (1.56)%, respectively, for the year ended December 31, 2001. |
| (c) | Calculated based upon weighted average shares outstanding during the period. |
SEE NOTES TO FINANCIAL STATEMENTS.
D4
Financial Highlights
| SP Mid-Cap Growth Portfolio | ||||||||||||||||||||
| Year Ended December 31, | ||||||||||||||||||||
| 2005 | 2004 | 2003 | 2002 | 2001 | ||||||||||||||||
Per Share Operating Performance: | ||||||||||||||||||||
Net Asset Value, beginning of year | $ | 6.85 | $ | 5.73 | $ | 4.09 | $ | 7.62 | $ | 9.69 | ||||||||||
Income From Investment Operations: | ||||||||||||||||||||
Net investment (loss) | (0.03 | ) | (0.03 | ) | (0.02 | ) | (0.02 | ) | (0.01 | ) | ||||||||||
Net realized and unrealized gains (losses) on investments | 0.39 | 1.15 | 1.66 | (3.51 | ) | (2.01 | ) | |||||||||||||
Total from investment operations | 0.36 | 1.12 | 1.64 | (3.53 | ) | (2.02 | ) | |||||||||||||
Less Distributions: | ||||||||||||||||||||
Dividends from net investment income | — | — | — | — | (0.01 | ) | ||||||||||||||
Dividends from net realized gains | — | — | — | — | (0.04 | ) | ||||||||||||||
Total distributions | — | — | — | — | (0.05 | ) | ||||||||||||||
Net Asset Value, end of year | $ | 7.21 | $ | 6.85 | $ | 5.73 | $ | 4.09 | $ | 7.62 | ||||||||||
Total Investment Return(a) | 5.26 | % | 19.55 | % | 40.10 | % | (46.33 | )% | (20.93 | )% | ||||||||||
Ratios/Supplemental Data: | ||||||||||||||||||||
Net assets, end of year (in millions) | $ | 152.9 | $ | 107.5 | $ | 58.9 | $ | 18.3 | $ | 15.9 | ||||||||||
Ratios to average net assets(b): | ||||||||||||||||||||
Expenses | 1.00 | % | 1.00 | % | 1.00 | % | 1.00 | % | 1.00 | % | ||||||||||
Net investment (loss) | (0.56 | )% | (0.68 | )% | (0.73 | )% | (0.59 | )% | (0.20 | )% | ||||||||||
Portfolio turnover rate | 94 | % | 79 | % | 73 | % | 255 | % | 93 | % | ||||||||||
| (a) | Total investment return is calculated assuming a purchase of shares on the first day and a sale on the last day of each period reported and includes reinvestment of dividends and distributions. Total return does not reflect expenses associated with the separate account such as administrative fees, account charges and surrender charges which, if reflected, would reduce the total returns for all periods shown. Performance figures may reflect voluntary fee waivers and/or expense reimbursements. In the absence of voluntary fee waivers and/or expense reimbursements, the total return would be lower. Past performance is no guarantee of future results. |
| (b) | Net of expense reimbursement. If the investment advisor had not reimbursed expenses, the annual expense and net investment loss ratios would have been 1.02% and (0.58)%, respectively, for the year ended December 31, 2005, 1.07% and (0.75)%, respectively, for the year ended December 31, 2004, 1.34% and (1.07)%, respectively, for the year ended December 31, 2003, 1.68% and (1.27)%, respectively, for the year ended December 31, 2002 and 2.11% and (1.31)%, respectively, for the year ended December 31, 2001. |
| SP PIMCO High Yield Portfolio | ||||||||||||||||||||
| Year Ended December 31, | ||||||||||||||||||||
| 2005 | 2004 | 2003 | 2002 | 2001 | ||||||||||||||||
Per Share Operating Performance: | ||||||||||||||||||||
Net Asset Value, beginning of year | $ | 10.67 | $ | 10.53 | $ | 9.17 | $ | 9.81 | $ | 10.02 | ||||||||||
Income From Investment Operations: | ||||||||||||||||||||
Net investment income | 0.68 | 0.69 | 0.65 | 0.64 | 0.59 | |||||||||||||||
Net realized and unrealized gains (losses) on investments | (0.27 | ) | 0.25 | 1.36 | (0.64 | ) | (0.21 | ) | ||||||||||||
Total from investment operations | 0.41 | 0.94 | 2.01 | — | 0.38 | |||||||||||||||
Less Distributions: | ||||||||||||||||||||
Dividends from net investment income | (0.68 | ) | (0.70 | ) | (0.65 | ) | (0.64 | ) | (0.59 | ) | ||||||||||
Dividends from net realized gains | (0.15 | ) | (0.10 | ) | — | — | — | |||||||||||||
Total distributions | (0.83 | ) | (0.80 | ) | (0.65 | ) | (0.64 | ) | (0.59 | ) | ||||||||||
Net Asset Value, end of year | $ | 10.25 | $ | 10.67 | $ | 10.53 | $ | 9.17 | $ | 9.81 | ||||||||||
Total Investment Return(a) | 4.03 | % | 9.32 | % | 22.41 | % | 0.15 | % | 3.97 | % | ||||||||||
Ratios/Supplemental Data: | ||||||||||||||||||||
Net assets, end of year (in millions) | $ | 368.6 | $ | 312.5 | $ | 248.2 | $ | 112.2 | $ | 52.0 | ||||||||||
Ratios to average net assets: | ||||||||||||||||||||
Expenses | 0.67 | % | 0.68 | % | 0.72 | % | 0.82 | % | 0.82 | %(b) | ||||||||||
Net investment income | 6.65 | % | 6.68 | % | 6.97 | % | 7.79 | % | 7.44 | %(b) | ||||||||||
Portfolio turnover rate | 89 | % | 53 | % | 74 | % | 108 | % | 105 | % | ||||||||||
| (a) | Total investment return is calculated assuming a purchase of shares on the first day and a sale on the last day of each period reported and includes reinvestment of dividends and distributions. Total return does not reflect expenses associated with the separate account such as administrative fees, account charges and surrender charges which, if reflected, would reduce the total returns for all periods shown. Performance figures may reflect voluntary fee waivers and/or expense reimbursements. In the absence of voluntary fee waivers and/or expense reimbursements, the total return would be lower. Past performance is no guarantee of future results. |
| (b) | Net of expense reimbursement. If the investment advisor had not reimbursed expenses, the annual expense and net investment income ratios would have been 1.08% and 7.18%, respectively, for the year ended December 31, 2001. |
SEE NOTES TO FINANCIAL STATEMENTS.
D5
Financial Highlights
| SP PIMCO Total Return Portfolio | ||||||||||||||||||||
| Year Ended December 31, | ||||||||||||||||||||
| 2005 | 2004 | 2003 | 2002 | 2001 | ||||||||||||||||
Per Share Operating Performance: | ||||||||||||||||||||
Net Asset Value, beginning of year | $ | 11.68 | $ | 11.54 | $ | 11.41 | $ | 10.70 | $ | 10.40 | ||||||||||
Income From Investment Operations: | ||||||||||||||||||||
Net investment income | 0.37 | 0.22 | 0.23 | 0.28 | 0.32 | |||||||||||||||
Net realized and unrealized gains (losses) on investments | (0.10 | ) | 0.36 | 0.43 | 0.71 | 0.57 | ||||||||||||||
Total from investment operations | 0.27 | 0.58 | 0.66 | 0.99 | 0.89 | |||||||||||||||
Less Distributions: | ||||||||||||||||||||
Dividends from net investment income | (0.54 | ) | (0.23 | ) | (0.28 | ) | (0.28 | ) | (0.34 | ) | ||||||||||
Dividends from net realized gains | (0.20 | ) | (0.21 | ) | (0.25 | ) | — | (c) | (0.25 | ) | ||||||||||
Total distributions | (0.74 | ) | (0.44 | ) | (0.53 | ) | (0.28 | ) | (0.59 | ) | ||||||||||
Net Asset Value, end of year | $ | 11.21 | $ | 11.68 | $ | 11.54 | $ | 11.41 | $ | 10.70 | ||||||||||
Total Investment Return(a) | 2.39 | % | 5.28 | % | 5.85 | % | 9.39 | % | 8.66 | % | ||||||||||
Ratios/Supplemental Data: | ||||||||||||||||||||
Net assets, end of year (in millions) | $ | 1,538.2 | $ | 1,099.0 | $ | 839.1 | $ | 471.7 | $ | 147.0 | ||||||||||
Ratios to average net assets: | ||||||||||||||||||||
Expenses | 0.62 | % | 0.65 | % | 0.65 | % | 0.67 | % | 0.76 | %(b) | ||||||||||
Net investment income | 3.62 | % | 2.01 | % | 2.19 | % | 3.02 | % | 3.69 | %(b) | ||||||||||
Portfolio turnover rate | 590 | % | 590 | % | 656 | % | 574 | % | 718 | % | ||||||||||
| (a) | Total investment return is calculated assuming a purchase of shares on the first day and a sale on the last day of each period reported and includes reinvestment of dividends and distributions. Total return does not reflect expenses associated with the separate account such as administrative fees, account charges and surrender charges which, if reflected, would reduce the total returns for all periods shown. Performance figures may reflect voluntary fee waivers and/or expense reimbursements. In the absence of voluntary fee waivers and/or expense reimbursements, the total return would be lower. Past performance is no guarantee of future results. |
| (b) | Net of expense reimbursement. If the investment advisor had not reimbursed expenses, the annual expense ratios would have been 0.82% and 3.63%, respectively, for the year ended December 31, 2001. |
| (c) | Less than $0.005 per share. |
| SP Prudential U.S. Emerging Growth Portfolio | ||||||||||||||||||||
| Class I | ||||||||||||||||||||
| Year Ended December 31, | ||||||||||||||||||||
| 2005 | 2004 | 2003 | 2002 | 2001 | ||||||||||||||||
Per Share Operating Performance: | ||||||||||||||||||||
Net Asset Value, beginning of year | $ | 8.07 | $ | 6.65 | $ | 4.68 | $ | 6.89 | $ | 8.38 | ||||||||||
Income (Loss) From Investment Operations: | ||||||||||||||||||||
Net investment loss | (.02 | ) | (.05 | ) | (.02 | ) | (.02 | ) | (.01 | ) | ||||||||||
Net realized and unrealized gains (losses) on investments | 1.16 | 1.47 | 1.99 | (2.19 | ) | (1.48 | ) | |||||||||||||
Total from investment operations | 1.14 | 1.42 | 1.97 | (2.21 | ) | (1.49 | ) | |||||||||||||
Less Dividends and Distributions: | ||||||||||||||||||||
Dividends from net investment income | — | (c) | — | — | — | — | ||||||||||||||
Distributions from net realized gains | (1.34 | ) | — | (c) | — | — | — | |||||||||||||
Total dividends and distributions | (1.34 | ) | — | (c) | — | — | — | |||||||||||||
Net Asset Value, end of year | $ | 7.87 | $ | 8.07 | $ | 6.65 | $ | 4.68 | $ | 6.89 | ||||||||||
Total Investment Return(a) | 17.77 | % | 21.39 | % | 42.09 | % | (32.08 | )% | (17.78 | )% | ||||||||||
Ratios/Supplemental Data: | ||||||||||||||||||||
Net assets, end of year (in millions) | $ | 194.8 | $ | 128.3 | $ | 170.0 | $ | 51.0 | $ | 31.2 | ||||||||||
Ratios to average net assets: | ||||||||||||||||||||
Expenses | .80 | % | .78 | % | .80 | % | .90 | %(b) | .90 | %(b) | ||||||||||
Net investment loss | (.28 | )% | (.53 | )% | (.56 | )% | (.48 | )%(b) | (.37 | )%(b) | ||||||||||
Portfolio turnover rate | 142 | % | 212 | % | 213 | % | 299 | % | 258 | % | ||||||||||
| (a) | Total investment return is calculated assuming a purchase of shares on the first day and a sale on the last day of each period reported and includes reinvestment of dividends and distributions. Total return does not reflect expenses associated with the separate account such as administrative fees, account charges and surrender charges which, if reflected, would reduce the total returns for all periods shown. Performance figures may reflect voluntary fee waivers and/or expense reimbursements. In the absence of voluntary fee waivers and/or expense reimbursements, the total return would be lower. Past performance is no guarantee of future results. |
| (b) | Net of expense reimbursement. If the investment advisor had not reimbursed expenses, the annual expense and net investment loss ratios would have been .98% and (.56)%, respectively, for the year ended December 31, 2002, 1.41% and (.88)%, respectively, for the year ended December 31, 2001. |
| (c) | Less than $0.005 per share. |
SEE NOTES TO FINANCIAL STATEMENTS.
D6
Financial Highlights
| SP Prudential U.S. Emerging Growth Portfolio | ||||||||||||||||||||
| Class II | ||||||||||||||||||||
| Year Ended December 31, | July 9, 2001(a) through December 31, 2001 | |||||||||||||||||||
| 2005 | 2004 | 2003 | 2002 | |||||||||||||||||
Per Share Operating Performance: | ||||||||||||||||||||
Net Asset Value, beginning of period | $ | 7.96 | $ | 6.58 | $ | 4.65 | $ | 6.88 | $ | 7.56 | ||||||||||
Income (Loss) From Investment Operations: | ||||||||||||||||||||
Net investment loss | (.05 | ) | (.07 | ) | (.05 | ) | (.05 | ) | (.01 | ) | ||||||||||
Net realized and unrealized gains (losses) on investments | 1.15 | 1.45 | 1.98 | (2.18 | ) | (.67 | ) | |||||||||||||
Total from investment operations | 1.10 | 1.38 | 1.93 | (2.23 | ) | (.68 | ) | |||||||||||||
Less Dividends and Distributions: | ||||||||||||||||||||
Dividends from net investment income | — | — | — | — | — | |||||||||||||||
Distributions from net realized gains | (1.34 | ) | — | (f) | — | — | — | |||||||||||||
Total dividends and distributions | (1.34 | ) | — | (f) | — | — | — | |||||||||||||
Net Asset Value, end of period | $ | 7.72 | $ | 7.96 | $ | 6.58 | $ | 4.65 | $ | 6.88 | ||||||||||
Total Investment Return(b): | 17.47 | % | 21.01 | % | 41.51 | % | (32.41 | )% | (8.99 | )% | ||||||||||
Ratios/Supplemental Data: | ||||||||||||||||||||
Net assets, end of period (in millions) | $ | 0.3 | $ | 0.4 | $ | 0.3 | $ | 0.2 | $ | 0.2 | ||||||||||
Ratios to average net assets: | ||||||||||||||||||||
Expenses | 1.20 | % | 1.18 | % | 1.20 | % | 1.30 | %(c) | 1.30 | %(c)(d) | ||||||||||
Net investment loss | (.70 | )% | (.94 | )% | (.97 | )% | (.89 | )%(c) | (.87 | )%(c)(d) | ||||||||||
Portfolio turnover rate | 142 | % | 212 | % | 213 | % | 299 | % | 258 | %(e) | ||||||||||
| (a) | Commencement of offering of Class II shares. |
| (b) | Total investment return is calculated assuming a purchase of shares on the first day and a sale on the last day of each year reported and includes reinvestment of dividends and distributions. Total return does not reflect expenses associated with the separate account such as administrative fees, account charges and surrender charges which, if reflected, would reduce the total returns for all periods shown. Performance figures may reflect voluntary fee waivers and/or expense reimbursements. In the absence of voluntary fee waivers and/or expense reimbursements, the total return would be lower. Past performance is no guarantee of future results. |
| (c) | Net of expense reimbursement. If the investment advisor had not reimbursed expenses, the annual expense and net investment loss ratios would have been 1.38% and (.95)%, respectively, for the year ended December 31, 2002, 1.81% and (1.38)%, respectively, for the period ended December 31, 2001. |
| (d) | Annualized. |
| (e) | Not annualized. |
| (f) | Less than $0.005 per share. |
| SP Small Cap Growth Portfolio | ||||||||||||||||||||
| Year Ended December 31, | ||||||||||||||||||||
| 2005 | 2004 | 2003 | 2002 | 2001 | ||||||||||||||||
Per Share Operating Performance: | ||||||||||||||||||||
Net Asset Value, beginning of year | $ | 6.46 | $ | 6.52 | $ | 4.84 | $ | 6.94 | $ | 8.38 | ||||||||||
Income From Investment Operations: | ||||||||||||||||||||
Net investment loss | (0.04 | ) | (0.03 | ) | (0.03 | ) | (0.03 | ) | (0.02 | ) | ||||||||||
Net realized and unrealized gains (losses) on investments | 0.20 | (0.03 | ) | 1.71 | (2.07 | ) | (1.42 | ) | ||||||||||||
Total from investment operations | 0.16 | (0.06 | ) | 1.68 | (2.10 | ) | (1.44 | ) | ||||||||||||
Net Asset Value, end of year | $ | 6.62 | $ | 6.46 | $ | 6.52 | $ | 4.84 | $ | 6.94 | ||||||||||
Total Investment Return(a) | 2.48 | % | (.92 | )% | 34.71 | % | (30.26 | )% | (17.18 | )% | ||||||||||
Ratios/Supplemental Data: | ||||||||||||||||||||
Net assets, end of year (in millions) | $ | 135.7 | $ | 184.1 | $ | 35.0 | $ | 12.5 | $ | 8.4 | ||||||||||
Ratios to average net assets(b): | ||||||||||||||||||||
Expenses | 1.05 | % | 1.09 | % | 1.15 | %(b) | 1.15 | %(b) | 1.15 | %(b) | ||||||||||
Net investment loss | (0.44 | )% | (.82 | )% | (0.72 | )%(b) | (0.73 | )%(b) | (0.28 | )%(b) | ||||||||||
Portfolio turnover rate | 192 | % | 240 | % | 122 | % | 109 | % | 83 | % | ||||||||||
| (a) | Total investment return is calculated assuming a purchase of shares on the first day and a sale on the last day of each year reported and includes reinvestment of dividends and distributions. Total return does not reflect expenses associated with the separate account such as administrative fees, account charges and surrender charges which, if reflected, would reduce the total returns for all periods shown. Performance figures may reflect voluntary fee waivers and/or expense reimbursements. In the absence of voluntary fee waivers and/or expense reimbursements, the total return would be lower. Past performance is no guarantee of future results. |
| (b) | Net of expense reimbursement. If the investment advisor had not reimbursed expenses, the annual expense and net investment loss ratios would have been 1.78% and (1.35)%, respectively for the year ended December 31, 2003, 2.30% and (1.89)%, respectively, for the year ended December 31, 2002, and 2.84% and (1.97)%, respectively, for the year ended December 31, 2001. |
SEE NOTES TO FINANCIAL STATEMENTS.
D7
Financial Highlights
| SP Small Cap Value Portfolio | ||||||||||||||||||||
| Year Ended December 31, | ||||||||||||||||||||
| 2005 | 2004 | 2003 | 2002 | 2001 | ||||||||||||||||
Per Share Operating Performance: | ||||||||||||||||||||
Net Asset Value, beginning of year | $ | 15.51 | $ | 12.88 | $ | 9.68 | $ | 11.36 | $ | 11.13 | ||||||||||
Income From Investment Operations: | ||||||||||||||||||||
Net investment income | 0.07 | 0.08 | 0.02 | 0.05 | 0.08 | |||||||||||||||
Net realized and unrealized gains (losses) on investments | 0.52 | 2.57 | 3.18 | (1.68 | ) | 0.26 | ||||||||||||||
Total from investment operations | 0.59 | 2.65 | 3.20 | (1.63 | ) | 0.34 | ||||||||||||||
Less Dividends and Distributions: | ||||||||||||||||||||
Dividends from net investment income | (0.08 | ) | (0.02 | ) | — | (c) | (0.05 | ) | (0.11 | ) | ||||||||||
Dividends from net realized gains | (1.75 | ) | — | (c) | — | — | — | |||||||||||||
Total dividends and distributions | (1.83 | ) | (0.02 | ) | 0.00 | (0.05 | ) | (0.11 | ) | |||||||||||
Net Asset Value, end of year | $ | 14.27 | $ | 15.51 | $ | 12.88 | $ | 9.68 | $ | 11.36 | ||||||||||
Total Investment Return(a) | 4.61 | % | 20.69 | % | 33.11 | % | (14.38 | )% | 3.11 | % | ||||||||||
Ratios/Supplemental Data: | ||||||||||||||||||||
Net assets, end of year (in millions) | $ | 350.7 | $ | 393.3 | $ | 250.6 | $ | 99.2 | $ | 47.4 | ||||||||||
Ratios to average net assets: | ||||||||||||||||||||
Expenses | 0.97 | % | 0.96 | % | 1.04 | % | 1.05 | %(b) | 1.05 | %(b) | ||||||||||
Net investment income | 0.49 | % | 0.69 | % | 0.37 | % | 0.69 | %(b) | 1.08 | %(b) | ||||||||||
Portfolio turnover rate | 119 | % | 127 | % | 90 | % | 116 | % | 89 | % | ||||||||||
| (a) | Total investment return is calculated assuming a purchase of shares on the first day and a sale on the last day of each period reported and includes reinvestment of dividends and distributions. Total return does not reflect expenses associated with the separate account such as administrative fees, account charges and surrender charges which, if reflected, would reduce the total returns for all periods shown. Performance figures may reflect voluntary fee waivers and/or expense reimbursements. In the absence of voluntary fee waivers and/or expense reimbursements, the total return would be lower. Past performance is no guarantee of future results. |
| (b) | Net of expense reimbursement. If the investment advisor had not reimbursed expenses, the annual expense and net investment income ratios would have been 1.10% and 0.64%, respectively, for the year ended December 31, 2002, and 1.56% and 0.57%, respectively, for the year ended December 31, 2001. |
| (c) | Less than $0.005 per share. |
| SP Strategic Partners Focused Growth Portfolio | ||||||||||||||||||||
| Class I | ||||||||||||||||||||
| Year Ended December 31, | ||||||||||||||||||||
| 2005 | 2004 | 2003 | 2002 | 2001(c) | ||||||||||||||||
Per Share Operating Performance: | ||||||||||||||||||||
Net Asset Value, beginning of year | $ | 7.00 | $ | 6.33 | $ | 5.03 | $ | 6.73 | $ | 7.94 | ||||||||||
Income From Investment Operations: | ||||||||||||||||||||
Net investment loss | (0.03 | ) | — | (b) | (0.01 | ) | (0.01 | ) | (0.01 | ) | ||||||||||
Net realized and unrealized gains (losses) on investments | 1.10 | 0.67 | 1.31 | (1.69 | ) | (1.20 | ) | |||||||||||||
Total from investment operations | 1.07 | 0.67 | 1.30 | (1.70 | ) | (1.21 | ) | |||||||||||||
Net Asset Value, end of year | $ | 8.07 | $ | 7.00 | $ | 6.33 | $ | 5.03 | $ | 6.73 | ||||||||||
Total Investment Return(a) | 15.29 | % | 10.58 | % | 25.84 | % | (25.26 | )% | (15.32 | )% | ||||||||||
Ratios/Supplemental Data: | ||||||||||||||||||||
Net assets, end of year (in millions) | $ | 38.3 | $ | 30.1 | $ | 21.6 | $ | 10.8 | $ | 7.7 | ||||||||||
Expenses | 1.07 | %(d) | 1.01 | %(d) | 1.01 | %(d) | 1.01 | %(d) | 1.01 | %(d) | ||||||||||
Net investment loss | (0.44 | )%(d) | (0.01 | )%(d) | (0.28 | )%(d) | (0.30 | )%(d) | (0.16 | )%(d) | ||||||||||
Portfolio turnover rate | 110 | % | 84 | % | 93 | % | 62 | % | 116 | % | ||||||||||
| (a) | Total investment return is calculated assuming a purchase of shares on the first day and a sale on the last day of each period reported and includes reinvestment of dividends and distributions. Total return does not reflect expenses associated with the separate account such as administrative fees, account charges and surrender charges which, if reflected, would reduce the total returns for all periods shown. Performance figures may reflect voluntary fee waivers and/or expense reimbursements. In the absence of voluntary fee waivers and/or expense reimbursements, the total return would be lower. Past performance is no guarantee of future results. |
| (b) | Less than $0.005 per share |
| (c) | Calculated based upon weighted average shares outstanding during the year. |
| (d) | Net of expense reimbursement. If the investment advisor had not reimbursed expenses, the annual expense and net investment loss ratios would have been 1.14 and (0.51)%, respectively, for the year ended December 31, 2005, 1.28% and (0.28)%, respectively, for the year ended December 31, 2004, 1.65% and (0.92)%, respectively, for the year ended December 31, 2003, 1.98% and (1.28)%, respectively for the year ended December 31, 2002 and 2.61% and (1.76)%, respectively, for the year ended December 31, 2001. |
SEE NOTES TO FINANCIAL STATEMENTS.
D8
Financial Highlights
| SP Strategic Partners Focused Growth Portfolio | ||||||||||||||||||||
| Class II | ||||||||||||||||||||
| Year Ended December 31, | January 12, 2001(a) through December 31, 2001(f) | |||||||||||||||||||
| 2005 | 2004 | 2003 | 2002 | |||||||||||||||||
Per Share Operating Performance: | ||||||||||||||||||||
Net Asset Value, beginning of period | $ | 6.88 | $ | 6.26 | $ | 4.99 | $ | 6.70 | $ | 8.43 | ||||||||||
Income From Investment Operations: | ||||||||||||||||||||
Net investment loss | (0.06 | ) | (0.01 | ) | (0.03 | ) | (0.02 | ) | (0.03 | ) | ||||||||||
Net realized and unrealized gains (losses) on investments | 1.09 | 0.63 | 1.30 | (1.69 | ) | (1.70 | ) | |||||||||||||
Total from investment operations | 1.03 | 0.62 | 1.27 | (1.71 | ) | (1.73 | ) | |||||||||||||
Net Asset Value, end of period | $ | 7.91 | $ | 6.88 | $ | 6.26 | $ | 4.99 | $ | 6.70 | ||||||||||
Total Investment Return(b) | 14.97 | % | 9.90 | % | 25.45 | % | (25.52 | )% | (20.80 | )% | ||||||||||
Ratios/Supplemental Data: | ||||||||||||||||||||
Net assets, end of period (in millions) | $ | 42.8 | $ | 32.1 | $ | 14.3 | $ | 6.6 | $ | 2.0 | ||||||||||
Expenses | 1.47 | %(d) | 1.41 | %(d) | 1.41 | %(d) | 1.41 | %(d) | 1.41 | %(c)(d) | ||||||||||
Net investment loss | (0.84 | )%(d) | (0.34 | )%(d) | (0.68 | )%(d) | (0.68 | )%(d) | (0.58 | )%(c)(d) | ||||||||||
Portfolio turnover rate | 110 | % | 84 | % | 93 | % | 62 | % | 116 | %(e) | ||||||||||
| (a) | Commencement of offering of Class II shares. |
| (b) | Total investment return is calculated assuming a purchase of shares on the first day and a sale on the last day of each period reported and includes reinvestment of dividends and distributions and does not reflect the effect of insurance contract charges. Total investment returns for periods of less than one full year are not annualized. Total return does not reflect expenses associated with the separate account such as administrative fees, account charges and surrender charges which, if reflected, would reduce the total returns for all periods shown. Performance figures may reflect voluntary fee waivers and/or expense reimbursements. In the absence of voluntary fee waivers and/or expense reimbursements, the total return would be lower. Past performance is no guarantee of future results. |
| (c) | Annualized. |
| (d) | Net of expense reimbursement. If the investment advisor had not reimbursed expenses, the annual expense and net investment loss ratios would have been 1.54% and (0.91)%, respectively, for the year ended December 31, 2005, 1.68% and (0.61)%, respectively, for the year ended December 31, 2004, 2.05% and (1.32)%, respectively, for the year ended December 31, 2003, 2.34% and (1.61)%, respectively, for the year ended December 31, 2002 and 3.01% and (2.18)%, respectively, for the period ended December 31, 2001. |
| (e) | Not annualized. |
| (f) | Calculated based upon weighted average shares outstanding during the period. |
| SP T. Rowe Price Large Cap Growth Portfolio | ||||||||||||||||||||
| Year Ended December 31, | ||||||||||||||||||||
| 2005 | 2004 | 2003 | 2002 | 2001 | ||||||||||||||||
Per Share Operating Performance: | ||||||||||||||||||||
Net Asset Value, beginning of year | $ | 6.61 | $ | 6.23 | $ | 5.03 | $ | 7.31 | $ | 8.55 | ||||||||||
Income From Investment Operations: | ||||||||||||||||||||
Net investment income (loss) | (0.03 | ) | (0.01 | ) | 0.00 | (c) | (0.01 | ) | (0.01 | ) | ||||||||||
Net realized and unrealized gains (losses) on investments | 1.13 | 0.39 | 1.20 | (2.27 | ) | (1.23 | ) | |||||||||||||
Total from investment operations | 1.10 | 0.38 | 1.20 | (2.28 | ) | (1.24 | ) | |||||||||||||
Less Distributions: | ||||||||||||||||||||
Dividends from net investment income | — | — | — | — | — | |||||||||||||||
Dividends from net realized gains | — | — | — | — | — | |||||||||||||||
Tax return of capital distributions | — | — | — | — | — | (c) | ||||||||||||||
Total distributions | — | — | — | — | — | (c) | ||||||||||||||
Net Asset Value, end of year | $ | 7.71 | $ | 6.61 | $ | 6.23 | $ | 5.03 | $ | 7.31 | ||||||||||
Total Investment Return(a) | 16.64 | % | 6.10 | % | 23.86 | % | (31.19 | )% | (14.47 | )% | ||||||||||
Ratios/Supplemental Data: | ||||||||||||||||||||
Net assets, end of year (in millions) | $ | 73.8 | $ | 65.7 | $ | 146.5 | $ | 57.7 | $ | 35.9 | ||||||||||
Ratios to average net assets: | ||||||||||||||||||||
Expenses | 1.06 | %(b) | 1.08 | % | 1.06 | % | 1.10 | %(b) | 1.10 | %(b) | ||||||||||
Net investment income (loss) | (0.38 | )%(b) | (0.14 | )% | (0.11 | )% | (0.27 | )%(b) | (0.08 | )%(b) | ||||||||||
Portfolio turnover rate | 144 | % | 122 | % | 38 | % | 34 | % | 47 | % | ||||||||||
| (a) | Total investment return is calculated assuming a purchase of shares on the first day and a sale on the last day of each period reported and includes reinvestment of dividends and distributions. Total return does not reflect expenses associated with the separate account such as administrative fees, account charges and surrender charges which, if reflected, would reduce the total returns for all periods shown. Performance figures may reflect voluntary fee waivers and/or expense reimbursements. In the absence of voluntary fee waivers and/or expense reimbursements, the total return would be lower. Past performance is no guarantee of future results. |
| (b) | Net of expense reimbursement. If the investment advisor had not reimbursed expenses, the expense and net investment loss ratios would have been 1.16% and (0.48)%, respectively, for the year ended December 31, 2005, 1.19% and (0.35)%, respectively, for the year ended December 31, 2002, 1.57% and (0.55)%, respectively and for the year ended December 31, 2001. |
| (c) | Less than $0.005 per share. |
SEE NOTES TO FINANCIAL STATEMENTS.
D9
Financial Highlights
| SP William Blair International Growth Portfolio | ||||||||||||||||||||
| Class I | ||||||||||||||||||||
| Year Ended December 31, | ||||||||||||||||||||
| 2005 | 2004 | 2003 | 2002 | 2001(c) | ||||||||||||||||
Per Share Operating Performance: | ||||||||||||||||||||
Net Asset Value, beginning of year | $ | 6.85 | $ | 5.89 | $ | 4.22 | $ | 5.45 | $ | 8.50 | ||||||||||
Income From Investment Operations: | ||||||||||||||||||||
Net investment income (loss) | 0.04 | 0.02 | 0.01 | 0.01 | 0.02 | |||||||||||||||
Net realized and unrealized gains (losses) on investments | 1.01 | 0.95 | 1.66 | (1.24 | ) | (3.05 | ) | |||||||||||||
Total from investment operations | 1.05 | 0.97 | 1.67 | (1.23 | ) | (3.03 | ) | |||||||||||||
Less Distributions: | ||||||||||||||||||||
Dividends from net investment income | (0.04 | ) | (0.01 | ) | — | — | — | |||||||||||||
Dividends from net realized gains | (0.31 | ) | — | — | — | (0.02 | ) | |||||||||||||
Total distributions | (0.35 | ) | (0.01 | ) | — | — | (0.02 | ) | ||||||||||||
Net Asset Value, end of year | $ | 7.55 | $ | 6.85 | $ | 5.89 | $ | 4.22 | $ | 5.45 | ||||||||||
Total Investment Return(a) | 16.39 | % | 16.54 | % | 39.57 | % | (22.57 | )% | (35.64 | )% | ||||||||||
Ratios/Supplemental Data: | ||||||||||||||||||||
Net assets, end of year (in millions) | $ | 453.6 | $ | 249.1 | $ | 105.6 | $ | 34.9 | $ | 19.9 | ||||||||||
Expenses | 0.98 | % | 1.02 | % | 1.15 | % | 1.24 | %(b) | 1.24 | %(b) | ||||||||||
Net investment income (loss) | 0.64 | % | 0.50 | % | 0.56 | % | 0.26 | %(b)(d) | 0.31 | %(b)(d) | ||||||||||
Portfolio turnover rate | 99 | % | 137 | % | 121 | % | 108 | % | 86 | % | ||||||||||
| (a) | Total investment return is calculated assuming a purchase of shares on the first day and a sale on the last day of each period reported and includes reinvestment of dividends and distributions. Total return does not reflect expenses associated with the separate account such as administrative fees, account charges and surrender charges which, if reflected, would reduce the total returns for all periods shown. Performance figures may reflect voluntary fee waivers and/or expense reimbursements. In the absence of voluntary fee waivers and/or expense reimbursements, the total return would be lower. Past performance is no guarantee of future results. |
| (b) | Net of expense reimbursement. If the investment advisor had not reimbursed expenses, the annual expense and net investment income ratios would have been 1.40% and 0.10%, respectively, for the year ended December 31, 2002 and 1.86% and (0.30)%, respectively, for the year ended December 31, 2001. |
| (c) | Calculated based upon weighted average shares outstanding during the year. |
| (d) | Includes custody fee credits of 0.02% and 0.12% for the year ended December 31, 2002 and the year ended December 31, 2001, respectively. If the Portfolio had not earned custodian fee credits, the annual net investment income would have been 0.24% and 0.19%, respectively for the year ended December 31, 2002 and the year ended December 31, 2001. |
SEE NOTES TO FINANCIAL STATEMENTS.
D10
Financial Highlights
| SP William Blair International Growth Portfolio | ||||||||||||||||||||
| Class II | ||||||||||||||||||||
| Year Ended December 31, | ||||||||||||||||||||
| 2005 | 2004 | 2003 | 2002 | 2001(d) | ||||||||||||||||
Per Share Operating Performance: | ||||||||||||||||||||
Net Asset Value, beginning of year | $ | 6.77 | $ | 5.83 | $ | 4.19 | $ | 5.43 | $ | 8.48 | ||||||||||
Income From Investment Operations: | ||||||||||||||||||||
Net investment income (loss) | 0.03 | 0.01 | 0.01 | — | (c) | — | (c) | |||||||||||||
Net realized and unrealized gains (losses) on investments | 0.98 | 0.93 | 1.63 | (1.24 | ) | (3.04 | ) | |||||||||||||
Total from investment operations | 1.01 | 0.94 | 1.64 | (1.24 | ) | (3.04 | ) | |||||||||||||
Less Distributions: | ||||||||||||||||||||
Dividends from net investment income | (0.02 | ) | — | — | — | — | ||||||||||||||
Dividends from net realized gains | (0.31 | ) | — | — | — | (0.01 | ) | |||||||||||||
Total distributions | (0.33 | ) | — | — | — | (0.01 | ) | |||||||||||||
Net Asset Value, end of year | $ | 7.45 | $ | 6.77 | $ | 5.83 | $ | 4.19 | $ | 5.43 | ||||||||||
Total Investment Return(a) | 15.79 | % | 16.12 | % | 39.14 | % | (22.84 | )% | (35.92 | )% | ||||||||||
Ratios/Supplemental Data: | ||||||||||||||||||||
Net assets, end of year (in millions) | $ | 23.1 | $ | 139.0 | $ | 113.6 | $ | 23.6 | $ | 14.9 | ||||||||||
Expenses | 1.38 | % | 1.41 | % | 1.54 | % | 1.64 | %(b) | 1.64 | %(b) | ||||||||||
Net investment income (loss) | 0.56 | % | 0.21 | % | 0.04 | % | (0.11 | )%(b)(e) | (0.03 | )%(b)(e) | ||||||||||
Portfolio turnover rate | 99 | % | 137 | % | 121 | % | 108 | % | 86 | % | ||||||||||
| (a) | Total investment return is calculated assuming a purchase of shares on the first day and a sale on the last day of each period reported and includes reinvestment of dividends and distributions. Total return does not reflect expenses associated with the separate account such as administrative fees, account charges and surrender charges which, if reflected, would reduce the total returns for all periods shown. Performance figures may reflect voluntary fee waivers and/or expense reimbursements. In the absence of voluntary fee waivers and/or expense reimbursements, the total return would be lower. Past performance is no guarantee of future results. |
| (b) | Net of expense reimbursement. If the investment advisor had not reimbursed expenses, the annual expense and net investment loss ratios would have been 1.80% and (0.26)%, respectively, for the year ended December 31, 2002 and 2.26% and (0.66)%, respectively, for the year ended December 31, 2001. |
| (c) | Less than $0.005 per share. |
| (d) | Calculated based upon weighted average shares outstanding during the year. |
| (e) | Includes custody fee credits of 0.02% and 0.13% for the year ended December 31, 2002 and the year ended December 31, 2001, respectively. If the Portfolio had not earned custodian fee credits, the annual net investment loss would have been (0.13)% and (0.16)%, respectively for the year ended December 31, 2002 and the year ended December 31, 2001. |
SEE NOTES TO FINANCIAL STATEMENTS.
D11
REPORT OF INDEPENDENT REGISTERED PUBLIC ACCOUNTING FIRM
THE BOARD OF DIRECTORS AND SHAREHOLDERS OF THE PRUDENTIAL SERIES FUND
We have audited the accompanying statements of assets and liabilities of The Prudential Series Fund, Inc. (comprised of the SP Aggressive Growth Asset Allocation Portfolio, SP AIM Core Equity Portfolio, SP Balanced Asset Allocation Portfolio, SP Conservative Asset Allocation Portfolio, SP Davis Value Portfolio, SP Growth Asset Allocation Portfolio, SP Large Cap Value Portfolio, SP LSV International Value Portfolio, SP Mid-Cap Growth Portfolio, SP PIMCO High Yield Portfolio, SP PIMCO Total Return Portfolio, SP Prudential U.S. Emerging Growth Portfolio, SP Small Cap Growth Portfolio, SP Small Cap Value Portfolio, SP Strategic Partners Focused Growth Portfolio, SP T. Rowe Price Large Cap Growth Portfolio, and SP William Blair International Growth Portfolio, hereafter referred to as the “Funds”), including the portfolios of investments, as of December 31, 2005, and the related statements of operations for the year then ended, and the statements of changes in net assets and the financial highlights for each of the years in the two-year period then ended. These financial statements and financial highlights are the responsibility of the Funds’ management. Our responsibility is to express an opinion on these financial statements and financial highlights based on our audits. The financial highlights for the years presented prior to the year ended December 31, 2004 were audited by another independent registered public accounting firm, whose report dated February 20, 2004, expressed an unqualified opinion thereon.
We conducted our audits in accordance with the standards of the Public Company Accounting Oversight Board (United States). Those standards require that we plan and perform the audit to obtain reasonable assurance about whether the financial statements and financial highlights are free of material misstatement. An audit includes examining, on a test basis, evidence supporting the amounts and disclosures in the financial statements. Our procedures included confirmation of securities owned as of December 31, 2005, by correspondence with the custodian and brokers or by other appropriate auditing procedures where replies from brokers were not received. An audit also includes assessing the accounting principles used and significant estimates made by management, as well as evaluating the overall financial statement presentation. We believe that our audits provide a reasonable basis for our opinion.
In our opinion, the financial statements and financial highlights referred to above present fairly, in all material respects, the financial position of the Funds as of December 31, 2005, and the results of their operations for the year then ended, and the changes in their net assets and the financial highlights for each of the years in the two-year period then ended, in conformity with U.S. generally accepted accounting principles.
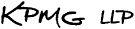
New York, New York
February 24, 2006
E1
Tax Information (Unaudited)
Although we understand that the vast majority, if not all, of the shareholders/contract holders of the Series Fund currently maintain a tax deferred status, we are nevertheless required by the Internal Revenue Code to advise you within 60 days of the Series Fund's fiscal year end (December 31, 2005) as to the federal tax status of dividends paid by the Series Fund during such fiscal year. Accordingly, we are advising you that in 2005, the Series Fund paid dividends as follows:
Ordinary Dividends | Long-Term Capital Gains | Total Distributions | |||||||
SP Aggressive Growth Asset Allocation Portfolio | $ | 0.172 | $ | 0.198 | $ | 0.370 | |||
SP AIM Core Equity Portfolio | 0.076 | — | 0.076 | ||||||
SP Balanced Asset Allocation Portfolio | 0.210 | 0.261 | 0.471 | ||||||
SP Conservative Asset Allocation Portfolio | 0.246 | 0.303 | 0.549 | ||||||
SP Davis Value Portfolio | 0.102 | 1.107 | 1.209 | ||||||
SP Growth Asset Allocation Portfolio | 0.233 | 0.191 | 0.424 | ||||||
SP Large Cap Value Portfolio | 0.320 | 0.075 | 0.395 | ||||||
SP LSV International Value Portfolio | 0.444 | 0.425 | 0.869 | ||||||
SP PIMCO High Yield Portfolio | 0.717 | 0.111 | 0.828 | ||||||
SP PIMCO Total Return Portfolio | 0.655 | 0.089 | 0.744 | ||||||
SP Prudential U.S. Emerging Growth Portfolio (Class I) | 1.084 | 0.260 | 1.344 | ||||||
SP Prudential U.S. Emerging Growth Portfolio (Class II) | 1.084 | 0.260 | 1.344 | ||||||
SP Small Cap Value Portfolio | 1.185 | 0.649 | 1.834 | ||||||
SP William Blair International Growth Portfolio (Class I) | 0.146 | 0.208 | 0.354 | ||||||
SP William Blair International Growth Portfolio (Class II) | 0.120 | 0.209 | 0.329 | ||||||
Pursuant to Section 854 of the Internal Revenue Code, the following percentages of distributions from ordinary income for the year ended December 31, 2005 have been designated as being eligible for the dividends received deduction available to corporate shareholders:
Corporate Dividend Received Deduction | |||
SP Aggressive Growth Asset Allocation Portfolio | 23.05 | % | |
SP AIM Core Equity Portfolio | 100 | % | |
SP Balanced Asset Allocation Portfolio | 10.42 | % | |
SP Conservative Asset Allocation Portfolio | 6.89 | % | |
SP Davis Value Portfolio | 100 | % | |
SP Growth Asset Allocation Portfolio | 34.70 | % | |
SP Large Cap Value Portfolio | 47.72 | % | |
SP Prudential U.S. Emerging Growth Portfolio | 1.44 | % | |
SP Small Cap Value Portfolio | 13.66 | % | |
SP William Blair International Growth Portfolio | 11.86 | % |
Pursuant to Section 853 of the Internal Revenue Code, the following foreign taxes paid and foreign source income have been designated as being paid in connection with dividends distributed from investment company taxable income for the year ended December 31, 2005:
| Foreign Taxes | Foreign Source Income | |||||
SP LSV International Value Portfolio | $ | 847,374 | $ | 9,471,679 | ||
SP William Blair International Growth Portfolio | 686,453 | 6,718,171 | ||||
E2
Approval of New Investment Advisory Agreements
The Board of Trustees (the “Board”) of The Prudential Series Fund (the “Trust”) oversees the management of each of the Trust’s Portfolios, and, as required by law, is responsible for the approval of the Portfolio’s investment advisory agreements. At meetings held on September 13, 2005 and December 1, 2005, the Board met and approved new investment agreements for the Trust’s Portfolios. The material factors and conclusions that formed the basis for the Trustees’ determinations to approve the agreements are discussed separately below.
Equity Portfolio and SP Small Cap Value Portfolio (formerly, SP Goldman Sachs Small Cap Value Portfolio)
At its June 2005 meeting, the Board approved Salomon Brothers Asset Management, Inc. (“Salomon Brothers”) as an additional subadviser for the SP Small Cap Value Portfolio, to join the Portfolio’s existing subadviser, Goldman Sachs Asset Management, L.P. (“GSAM”). At the same meeting, as part of its annual approval of existing investment advisory agreements, the Board re-approved an existing subadvisory agreement with Salomon Brothers pursuant to which Salomon Brothers served as a subadviser for the Equity Portfolio. Thereafter, Salomon Brothers’ corporate parent, Citigroup, Inc., announced that it had entered into an agreement for Legg Mason to acquire substantially all of Citigroup’s worldwide asset management business during the fourth quarter of 2005. As part of this transaction, Salomon Brothers would become an indirect wholly owned subsidiary of Legg Mason.
Under the Investment Company Act of 1940 (the “1940 Act”), the change in corporate ownership of Salomon Brothers is treated as a “change in control” resulting in an “assignment” of Salomon Brothers’ subadvisory agreements. Pursuant to the 1940 Act and the terms of the subadvisory agreements, the subadvisory agreements approved by the Board in June 2005 would terminate when Legg Mason completed its acquisition of Salomon Brothers. Consequently, at its September 2005 meeting, the Board approved new subadvisory agreements with Salomon Brothers, to become effective upon the completion of the Legg Mason acquisition of Salomon Brothers. The new subadvisory agreements were identical in all material respects to the agreements approved by the Board in June 2005.
The Board noted that in approving the new subadvisory agreements with Salomon Brothers, it considered PI’s representation that the information it had reviewed when considering the subadvisory agreements earlier in the year remained materially unchanged. The Board further noted that in advance of the meeting, it had received materials and information from PI and Salomon Brothers indicating that no changes in the code of ethics, compliance policies, procedures, operation or management of Salomon Brothers was contemplated by Legg Mason. The Board was also provided with a description of Legg Mason. Before approving the new agreements, the Board also received an in-person presentation from representatives of Salomon Brothers.
Set out below are the material factors considered and conclusions reached by the Board at its June 2005 meeting in approving the subadvisory agreements with Salomon Brothers:
Nature, quality and extent of services. The Board received and considered information regarding the nature and extent of services provided to the Equity Portfolio under the existing subadvisory agreement and the services that would be provided to the SP Small Cap Value Portfolio by Salomon Brothers under the new subadvisory agreement. The Board noted that the nature and extent of services under the existing and new agreements were generally similar in that Salomon Brothers was required under both agreements to provide day-to-day portfolio management services and comply with all Portfolio policies and applicable rules and regulations.
With respect to the quality of services, the Board considered, among other things, the background and experience of Salomon Brothers’ portfolio management team. The Board reviewed the qualifications, backgrounds and responsibilities of the portfolio managers who would be responsible for the day-to-day management of the Portfolio. The Board was also provided with information pertaining to Salomon Brothers’ organizational structure, senior management, investment operations, and other relevant information pertaining to Salomon Brothers. The Board noted that it received a favorable compliance report from the Portfolio’s Chief Compliance Officer (CCO) as to Salomon Brothers.
The Board concluded that it was satisfied with the nature, extent and quality of the investment subadvisory services currently provided by Salomon Brothers to the Equity Portfolio, and the services anticipated to be provided to the SP Small Cap Value Portfolio by Salomon Brothers, and that there was a reasonable basis on which to conclude that the quality of investment subadvisory services to be provided by Salomon Brothers under the new subadvisory agreement should equal the quality of similar services provided by Salomon Brothers.
Performance of Equity Portfolio. The Board received and considered information about the Portfolio’s historical performance, noting that the Portfolio had achieved performance that was in the second quartile over a one-year time period and performance that was in the first quartile over three-year and five-year time periods in relation to a group of comparable mutual funds (the Peer Group). The funds included in the Peer Group are objectively determined solely by Lipper, Inc., an independent provider of investment company data. The Board noted that the Portfolio outperformed in comparison to its benchmark index over the same one-year and three-year time periods, and that the Portfolio’s performance was above the median performance of the other mutual funds included in the Peer Group over the same time periods. The Board also reviewed the performance of each “sleeve” of the Portfolio managed by Jennison Associates LLC and Salomon Brothers. The Board determined that the Portfolio’s performance was satisfactory.
Performance of SP Small Cap Value Portfolio. The Board received and considered information about the Portfolio’s historical performance, noting that the Portfolio had achieved performance that was in the third quartile over a one-year period and performance that was in the fourth quartile over a three-year period in relation to the group of comparable mutual funds in a Peer Universe.
While expressing the view that the Portfolio’s performance had been disappointing, the Board noted that the Manager had taken steps to address the performance issues by replacing the previous subadviser and that the Portfolio’s performance since Goldman Sachs Asset Management, L.P. (GSAM) assumed responsibility for managing the Portfolio in January 2004 was only slightly below the median performance of the mutual funds included in the Peer Group. In light of this, the Board concluded that it was reasonable to allow GSAM to continue to create a performance record against which GSAM should be evaluated, to approve the continuance of the GSAM subadvisory agreement and to continue to monitor the situation.
The Board further noted that, pursuant to a recommendation from the Manager, a new subadvisory agreement with Salomon Brothers had been approved because GSAM was expected to approach its capacity limits in the near future. The Board received and considered information regarding the performance of other investment companies managed by Salomon Brothers utilizing an investment style and strategy similar to that proposed for the Portfolio, noting that Salomon Brothers had generally outperformed the various benchmarks over the same time period.
Investment Subadvisory Fee Rates. The Board considered the subadvisory fee received by Salomon Brothers under the Equity Portfolio subadvisory agreement as well as the proposed subadvisory fee rate of 0.40% payable by the Manager to Salomon Brothers under the proposed new subadvisory agreement with respect to the SP Small Cap Value Portfolio, including among other things, the fee rate payable to Salomon Brothers by any other funds with investment objective similar to that of the Portfolios. As a result of the above considerations, the Board concluded that Salomon Brothers’ existing and proposed subadvisory fee rates under the agreements were reasonable.
Subadviser’s Profitability. Because the engagement of Salomon Brothers for the SP Small Cap Value Portfolio is new, there is no historical profitability with regard to its arrangements with the Portfolio. As a result, the Board did not consider this factor. The Board noted that the Manager pays the subadvisory fees, and therefore a change in the subadvisory fees will not change the fees paid by
the Portfolio. Instead, any increase or decrease will increase or decrease, as applicable, the net fee rates retained by the Manager. The Board noted that profitability would be reviewed annually in connection with the review of advisory agreements.
Economies of Scale. The Board noted that the proposed subadvisory fee schedule for the SP Small Cap Value Portfolio does not contain breakpoints that reduce the fee rate on assets above specified levels. However, in light of the size of the Portfolio’s assets to be managed by Salomon Brothers, the Board concluded that the absence of breakpoints in the Portfolio’s fee schedule is acceptable at this time.
The Board noted that the subadvisory fee rate for the Equity Portfolio does contain a breakpoint that reduces the fee rate on assets above a specified level.
Other Benefits to the Subadviser or its affiliates from serving as Subadviser. The Board considered potential “fall-out” or ancillary benefits anticipated to be received by Salomon Brothers and its affiliates as a result of Salomon Brothers’ relationship with the Portfolios. The Board concluded that any potential benefits to be derived by Salomon Brothers included potential access to additional research resources, larger assets under management and reputational benefits, which were consistent with those generally derived by subadvisers to mutual funds.
SP Large Cap Value Portfolio
Pursuant to recommendations from PI, the Board approved a new investment subadvisory agreements with Dreman Value Management LLC (Dreman) with respect to the SP Large Cap Value Portfolio. PI recommended that the Board approve Dreman as an additional subadviser, to join the Portfolio’s existing subadvisers. PI recommended the addition of Dreman to join the Portfolio’s existing subadvisers, Hotchkis and Wiley Capital Management LLC and J.P. Morgan Investment Management Inc., because the existing subadvisers had or were expected to shortly reach their capacity limits.
Nature, quality and extent of services. The Board received and considered information regarding the nature and extent of services provided to the Portfolio by the existing subadvisers under the current subadvisory agreements and those that would be provided to the Portfolio by Dreman under the new subadvisory agreement, noting that the nature and extent of services under the existing and new agreements were generally similar in that the existing subadvisers and Dreman were each required to provide day-to-day portfolio management services and comply with all Portfolio policies and applicable rules and regulations.
With respect to the quality of services, the Board considered, among other things, the background and experience of Dreman’s portfolio management team. The Board met in person with representatives of Dreman and reviewed the qualifications, backgrounds and responsibilities of the portfolio managers who would be responsible for the day-to-day management of the Portfolios. The Board was also provided with information pertaining to Dreman’s organizational structure, senior management, investment operations, and other relevant information pertaining to Dreman. The Board noted that it received a favorable compliance report from the Trust’s Chief Compliance Officer (CCO) as to Dreman.
The Board concluded that it was satisfied with the nature, extent and quality of the investment subadvisory services anticipated to be provided to the Portfolio by Dreman and that there was a reasonable basis on which to conclude that the quality of investment subadvisory services to be services provided by the existing subadvisers under the existing subadvisory agreements.
Performance of the Portfolio. The Board received and considered information about the Portfolio’s historical performance, noting that the Portfolio had achieved performance that was in the first quartile over a one-year period and performance that was in the second quartile over a three-year
period in relation to the Peer Group. The Board also reviewed the separate performance records of the two “sleeves” of the Fund managed by J.P. Morgan Investment Management Inc. and Hotchkis and Wiley Capital Management LLC.
The Board received and considered information regarding the performance of other investment companies managed by Dreman utilizing an investment style and strategy similar to that proposed for the Portfolio, noting that Dreman had generally outperformed the various benchmarks over the same time period.
Investment Subadvisory Fee Rate. The Board considered the proposed subadvisory fee rate payable by PI to Dreman under the proposed new subadvisory agreement, which called for a fee rate of 0.30% of average daily net assets to $250 million; 0.25% of average daily net assets from $250 million to $500 million; and 0.20% of average daily net assets over $500 million. The Board also considered, among other things, the fee rates payable to Dreman by other funds for which Dreman serves as subadviser. As a result of the above considerations, the Board concluded that Dreman’s proposed subadvisory fee rate under the new subadvisory agreement was reasonable.
Subadviser’s Profitability. Because the engagement of Dreman is new, there is no historical profitability with regard to its arrangements with the Portfolio. As a result, the Board did not consider this factor. The Board noted that the Manager pays the subadvisory fees, and therefore a change in the subadvisory fees will not change the fees paid by the Portfolio. Instead, any increase or decrease will increase or decrease, as applicable, the net fee rates retained by PI. The Board noted that profitability would be reviewed annually in connection with the review of advisory agreements.
Economies of Scale. The Board noted that the overall advisory fee paid by the Fund did not include breakpoints that reduce the fee rate on assets above specified levels. The Board noted that it reviews economies of scale and breakpoints in connection with its annual review of advisory agreements generally.
Other Benefits to the Subadviser or its affiliates from serving as Subadviser. The Board considered potential “fall-out” or ancillary benefits anticipated to be received by Dreman and its affiliates as a result of Dreman’s relationship with the Portfolio. The Board concluded that any potential benefits to be derived by Dreman included potential access to additional research resources, larger assets under management and reputational benefits, which were consistent with those generally derived by subadvisers to mutual funds.
Fund Reorganization
The Board considered and approved the reorganization of the Trust from a corporation organized under the laws of Maryland to a trust organized under the laws of Delaware. In connection with the reorganization, the Board reviewed and approved a new investment management agreement with the Trust’s Manager, Prudential Investments LLC (the “Manager” or “PI”) and new subadvisory agreements with each Portfolio’s current subadviser(s).
With respect to PI, the Board noted that at its June 2005 meeting, it had received information about PI and concluded that it was satisfied with the nature, quality and extent of services provided by PI under the investment management agreement. PI represented that there had been no material change to PI itself and the services it would provide to the Trust since June 2005. The Board determined that the reorganization would not result in any material change in the services provided by PI. Therefore, the Board determined that it was reasonable to conclude that the nature, quality and extent of services to be provided by PI under the new investment management agreement would be similar in nature to those provided under the existing investment management agreement. The Board concluded that the factors underlying the conclusions it reached in approving the investment management agreement with PI at the June 2005 meeting remained materially unchanged.
Similarly, with respect to the subadvisers, the Board noted that at its June 2005 meeting, it had received information about each subadviser and concluded that it was satisfied with the nature, quality and extent of services provided by each subadviser under the subadvisory agreements. PI similarly represented that there had been no material change to the subadvisers and the services they provided since June 2005, and the Board determined that it was reasonable to conclude that the nature, quality and extent of services to be provided by PI under the new subadvisory agreements would be similar in nature to those provided under the existing subadvisory agreements. The Board concluded that the factors underlying the conclusions that it reached in approving the subadvisory agreements at the June 2005 meeting remained materially unchanged.
The Board further noted that it had previously reviewed and approved for inclusion in the Trust’s semi-annual shareholder report a discussion of the material factors and conclusions reached in approving the investment management and subadvisory agreements at its June 2005 meeting.
This report contains financial information about certain investment choices that may be available on the variable life insurance and variable annuity contracts listed below. You may receive additional reports and should refer to your variable life insurance or variable annuity contract prospectus to determine which portfolios are available to you.
VARIABLE LIFE INSURANCE
| n | Prudential’s Survivorship Preferred® |
| n | Prudential’s Variable Universal Life |
| n | Pruco Life’s Variable Universal Life® |
| n | Pruco Life’s Survivorship Variable Universal Life |
| n | Pruco Life of New Jersey’s Survivorship Variable Universal Life |
| n | Pruco Life’s PruLife® Custom Premier |
| n | Pruco Life of New Jersey’s PruLife® Custom Premier |
| n | Pruco Life’s PruSelectSM III |
| n | Pruco Life of New Jersey’s PruSelectSM III |
| n | Pruco Life’s Magnastar |
| n | Pruco Life’s MPremierSM VUL |
VARIABLE ANNUITIES
| n | Pruco Life’s Discovery Select® |
| n | Pruco Life of New Jersey’s Discovery Select® |
| n | Pruco Life’s Discovery Choice® |
| n | Pruco Life of New Jersey’s Discovery Choice® |
| n | Pruco Life’s Strategic PartnersSM Annuity One |
| n | Pruco Life of New Jersey’s Strategic PartnersSM Annuity One |
| n | Pruco Life’s Strategic PartnersSM Select |
| n | Pruco Life of New Jersey’s Strategic PartnersSM Select |
| n | Pruco Life’s Strategic PartnersSM Advisor |
| n | Pruco Life of New Jersey’s Strategic PartnersSM Advisor |
| n | Pruco Life’s Strategic PartnersSM FlexElite |
| n | Pruco Life of New Jersey’s Strategic PartnersSM FlexElite |
| n | Pruco Life’s Strategic PartnersSM Plus |
| n | Pruco Life of New Jersey’s Strategic PartnersSM Plus |
Variable life insurance is distributed by Pruco Securities LLC, member SIPC, 751 Broad Street, Newark, NJ 07102-3777. Variable annuities are distributed through Prudential Investment Management Services LLC (PIMS), member SIPC, Gateway Center Three, 14th Floor, Newark, NJ 07102-4077. Variable life insurance and variable annuities are issued by The Prudential Insurance Company of America, Pruco Life Insurance Company, or in New York, Pruco Life Insurance Company of New Jersey. All are Prudential Financial companies. Each is solely responsible for its own financial condition and contractual obligations. Contract guarantees are based on the claims-paying ability of the issuing Company.
The 2005 Audited Financial Statements of Pruco Life Insurance Company, Pruco Life Insurance Company of New Jersey, and The Prudential Insurance Company of America will be available commencing April 30, 2006. Owners of variable annuities may call (888) 778-2888 and owners of variable life insurance may call (800) 778-2255 to obtain a free copy of the audited financial statements of the insurance company that issued your contract.
To reduce costs, we now generally send only a single copy of prospectuses and shareholder reports to each household (“householding”) in lieu of sending a copy to each Contract Owner who resides in the household. You should be aware that by calling (877) 778-5008, you can revoke or “opt out” of householding at any time.
Prudential Financial and the Rock logo are service marks of The Prudential Insurance Company of America, Newark, NJ, and its affiliates.
751 Broad Street
Newark NJ 07102-3777
Presorted
Standard
U.S. Postage
PAID
IFS-A114669 PSF-AR-B Ed. 02/2006

ANNUAL REPORT
DECEMBER 31, 2005
The Prudential Series Fund

| n | Diversified Conservative Growth Portfolio |
| n | Jennison 20/20 Focus Portfolio |
The Prudential Insurance Company of America
751 Broad Street, Newark, NJ 07102-3777
Pruco Life Insurance Company
Pruco Life Insurance Company of New Jersey
213 Washington Street, Newark, NJ 07102-2992
Pruco Life Insurance Company is not licensed to do business in New York.
IFS-A114743

T | This report is one of several that provide financial information about certain investment choices available on variable life insurance and variable annuity contracts. Based on the variable contract you own or the portfolios you invested in, you may receive additional reports that provide financial information on those investment choices. Please refer to your variable life insurance or variable annuity contract prospectus to determine which portfolios are available to you. A list of the variable contracts that this report supports is located on the inside back cover. |
This report must be preceded or accompanied by the current prospectuses for the Prudential Series Fund portfolios and the applicable variable life or annuity contract. The prospectuses contains information on the investment objectives, risks, and charges and expenses and should be read carefully.
The contract’s prospectus contains hypothetical performance illustrations that show the effect of various assumptions regarding the cost of insurance protection. You may also obtain a personalized illustration of historical performance that reflects the cost of your policy’s insurance protection.
DISCOVER THE BENEFITS OF eDELIVERY
| n | Eliminate receiving printed reports. |
| n | View documents on-line as they become available. |
| n | Download and store e-reports on your PC. |
| n | Help the environment by using less paper. |
To receive your semiannual/annual reports on-line, go to www.prudential.com/edelivery and enroll. Instead of receiving printed reports, you will receive notification via e-mail when new materials are available for your review. You can cancel your enrollment or change your e-mail address at any time by visiting the internet address listed above.
A description of the Fund’s proxy voting policies and procedures is available, without charge, upon request. Owners of variable annuity contracts should call 888-778-2888 and owners of variable life insurance contracts should call 800-778-2255 to obtain descriptions of the Fund’s proxy voting policies and procedures. The description is also available on the website of the Securities and Exchange Commission (the “Commission”) at www.sec.gov. Information regarding how the Fund voted proxies relating to portfolio securities during the most recent 12-month period ended June 30, 2005 is available on the website of the Commission at www.sec.gov and on the Fund’s website at www.irrc.com/prudential.
The Fund files with the Commission a complete listing of portfolio holdings as of its first and third quarter-end on Form N-Q. Form N-Q is available on the Commission’s website at www.sec.gov or by visiting the Commission’s Public Reference Room. For more information on the Commission’s Public Reference Room, please visit the Commission’s website or call 800-SEC-0330. Form N-Q is also available on the Fund’s website at www.prudential.com or by calling the telephone numbers referenced above.
The Funds Statement of Additional Information contains additional information about the Fund’s Trustees and is available without charge upon request by calling (888) 778-2888.

The Prudential Series Fund
Annual Report
December 31, 2005
Table of Contents
| n | LETTER TO CONTRACT OWNERS |
| n | MANAGEMENT REVIEW |
| n | PORTFOLIO COMPOSITION |
| n | FEES AND EXPENSES TABLE |
| n | FINANCIAL REPORTS |
A1 Financial Statements
B1 Schedule of Investments
C1 Notes to Financial Statements
D1 Financial Highlights
E1 Report of Independent Registered Accounting Firm
F1 Management of The Prudential Series Fund
| n | APPROVALS OF ADVISORY AGREEMENTS |
This report may include financial information pertaining to certain portfolios that are not available through the variable life insurance policy or variable annuity contract that you have chosen. Please refer to your variable life insurance or variable annuity prospectus to determine which portfolios are available to you.
The Prudential Series Fund, Diversified Conservative Growth Portfolio
Subadvised by: Earnst Partners, RS Investments, Jennison Associates LLC, Prudential Investment Management, Inc.
December 31, 2005
Investment Manager’s Report
Performance Summary - As of December 31, 2005
Average Annual Total Return Percentages
| 1-Year | 5-Year | Since Inception | |||||||
Diversified Conservative Growth Portfolio | 7.04 | % | 6.10 | % | 6.06 | % | |||
S&P 500 Index | 4.91 | 0.54 | 0.54 | ||||||
Diversified Conservative Growth Custom Blended Index | 3.56 | 5.42 | 4.83 | ||||||
Lipper (VIP) Income Funds Avg. | 4.13 | 5.08 | 4.40 |
Portfolio inception: 5/3/1999.
$10,000 INVESTED SINCE INCEPTION
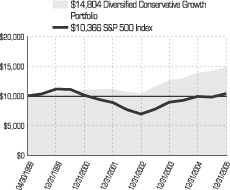
Past performance does not guarantee future returns. Portfolio performance is net of investment fees and fund expenses, but not product charges, which, if included, would significantly lower the performance quoted. The investment return and principal value of an investment will fluctuate, so that an investor’s shares, when redeemed, may be worth more or less than their original cost. Current performance may be lower or higher than the past performance data quoted.
Unless noted otherwise, Lipper Average and Index returns reflect performance beginning the closest month-end date to the Portfolio’s inception.
For the year ended December 31, 2005, the Diversified Conservative Growth Portfolio had a total return that was substantially above its Custom Index benchmark and above the average return of its peer group.
The Portfolio’s strong performance came about because all of its component portfolios outperformed their respective targets, in some cases by substantial margins. The largest contributions to relative performance came from the large-cap growth and large-cap value holdings, both managed by Jennison Associates. Among large caps, the growth holdings had strong stock selection, particularly within the technology sector, as well as overweights compared with its Russell 1000® Growth Index target in the computer software and services and Internet industries. The value holdings overweighted the energy sector, which far outperformed the rest of the stock market in 2005, and even outperformed the Russell 1000® Value Index in the sector.
The Portfolio’s allocations to small company stocks was smaller, and outperformance in these segments was more modest. RS Investments stock selections beat the comparable sectors of the Russell 2000® Growth Index in technology and healthcare. Earnest Partners benefited from overweights versus the Russell 2000® Value Index in the better-performing energy, consumer cyclicals, and industrials sectors.
Among the Portfolio’s bond holdings, PIMCO’s core portfolio benefited from an underweight versus its target in corporate bonds and from allocations to non-U.S. developed and emerging-market debt, neither of which is in its performance target. These foreign markets were particularly strong. The negative impacts of an above-target average duration in the second half of the year and an overweight in the weak mortgage sector didn’t offset PIMCO’s strengths. Prudential Investment Management’s high yield (“junk”) bond segment outperformed its target primarily due to an allocation to emerging-market debt and an underweight in the declining auto sector. Security selection in the auto sector also helped.
Prudential Investments LLC (PI), a wholly owned subsidiary of Prudential Financial, Inc., serves as the overall investment manager for The Prudential Series Fund.
For average and index definitions, refer to the Glossary of Benchmark Definitions page. Investors cannot invest directly in a market index or average. For a complete list of holdings, refer to the Schedule of Investments section of this report.
The Prudential Series Fund, Jennison 20/20 Focus Portfolio
Subadvised by: Jennison Associates LLC
December 31, 2005
Investment Manager’s Report
Performance Summary - As of December 31, 2005
Average Annual Total Return Percentages
| 1-Year | 5-Year | Since Inception | |||||||
Jennison 20/20 Focus Portfolio: Class I | 21.59 | % | 7.01 | % | 7.09 | % | |||
Jennison 20/20 Focus Portfolio: Class II | 21.26 | 6.61 | 5.32 | ||||||
S&P 500 Index | 4.91 | 0.54 | 0.54 | ||||||
Russell 1000® Index | 6.27 | 1.07 | 1.22 | ||||||
Lipper (VIP) Large Cap Core Funds Avg. | 5.77 | -0.48 | 0.33 | ||||||
Lipper (VIP) Multi Cap Core Funds Avg. | 6.66 | 1.72 | 3.03 |
Portfolio inception: 5/3/1999.
$10,000 INVESTED SINCE INCEPTION
Past performance does not guarantee future returns. Portfolio performance is net of investment fees and fund expenses, but not product charges, which, if included, would significantly lower the performance quoted. The investment return and principal value of an investment will fluctuate, so that an investor’s shares, when redeemed, may be worth more or less than their original cost. Current performance may be lower or higher than the past performance data quoted.
Unless noted otherwise, Lipper Average and Index returns reflect performance beginning the closest month-end date to the Portfolio’s inception (Class I). Although Lipper classifies the Portfolio within the Multi-Cap Core Funds Average, the returns for the Large-Cap Core Funds Average are also shown, because the management of the portfolios included in the Large-Cap Core Funds Average is more consistent with the management of the Portfolio.
For the year ended December 31, 2005, the Jennison 20/20 Focus Portfolio had a total return that was more than three times that of its benchmark indexes and the average of its peer group.
The Portfolio consists half of growth stocks, half of value stocks, all selected by a bottom-up (security by security) process. In 2005, this resulted in overweights in the energy, consumer noncyclical, and technology sectors and an underweight in consumer services. All strengthened performance except the emphasis on technology, which detracted.
Stock selection was very strong. Among the value holdings, Nexen, TXU, and Phelps Dodge had particularly outstanding returns. Nexen is an energy exploration and production company that benefited from the high prices for energy commodities. TXU is a Texas utility whose earnings are growing rapidly, in part as a result of a corporate restructuring. It is positioned to increase its margins as power prices rise because its production costs are less tied to the price of oil and natural gas than the costs of other utilities in its area. The Portfolio’s growth holdings included several technology firms that had strong performance.
Overall, the Portfolio’s overweight in companies whose earnings and/or share prices have been accelerating recently and underweight in dividend-paying firms helped performance. The Portfolio’s growth holdings are significantly more sensitive than the benchmark to the overall direction of the market. This detracted from its performance during the first half of the year, when the stock market was flat.
Prudential Investments LLC (PI), a wholly owned subsidiary of Prudential Financial, Inc., serves as the overall investment manager for The Prudential Series Fund.
| 1 | The graph is based on the performance of Class I shares. Performance of Class II shares will be lower due to differences in the fee structure. Class II shares have associated 12b-1 and administrative fees at an annual rate of 0.25% and 0.15% respectively of the average daily net assets of the Class II shares. |
For average and index definitions, refer to the Glossary of Benchmark Definitions page. Investors cannot invest directly in a market index or average. For a complete list of holdings, refer to the Schedule of Investments section of this report.
Presentation of Portfolio Holdings for the Prudential Series Fund as of December 31, 2005 (Unaudited)
| Diversified Conservative Growth | |||
Five Largest Holdings (% of Net Assets) | |||
General Electric Co. | 0.8 | % | |
American International Group, Inc. | 0.7 | % | |
Google, Inc. | 0.6 | % | |
Merrill Lynch & Co., Inc. | 0.6 | % | |
General Electric Capital Corp. | 0.6 | % | |
| Jennison 20/20 | |||
| Five Largest Holdings (% of Net Assets) | |||
| Phelps Dodge Corp. | 3.5 | % | |
| TXU Corp. | 3.3 | % | |
| Nexen, Inc. | 3.3 | % | |
| Suncor Energy, Inc. | 3.2 | % | |
| Adobe Systems, Inc. | 3.1 | % | |
For a complete listing of holdings, refer to the Schedule of Investments section of this report.
Holdings reflect only long-term investments. Holdings/Issues/Industries/Sectors are subject to change.
Fees and Expenses (unaudited)
As a contract owner investing in Portfolios of the Fund through a variable annuity or variable life contract, you incur ongoing costs, including management fees, distribution and service (12b-1) fees, and other Portfolio expenses. This example is intended to help you understand your ongoing costs (in dollars) of investing in the Fund and to compare these costs with the ongoing costs of investing in other investment options. This example does not reflect fees and charges under your variable annuity or variable life contract. If contract charges were included, the costs shown below would be higher. Please consult the prospectus for your contract for more information about contract fees and charges.
The example is based on an investment of $1,000 invested at the beginning of the period and held for the entire period July 1, 2005 through December 31, 2005.
Actual Expenses
The first line of the table below provides information about actual account values and actual expenses. You may use this information, together with the amount you invested, to estimate the Portfolio expenses that you paid over the period. Simply divide your account value by $1,000 (for example, an $8,600 account value divided by $1,000 = 8.6), then multiply the result by the number in the first line under the heading entitled “Expenses Paid During Period” to estimate the Portfolio expenses you paid on your account during this period. As noted above, the table does not reflect variable contract fees and charges.
Hypothetical Example for Comparison Purposes
The second line of the table below provides information about hypothetical account values and hypothetical expenses based on the Portfolio’s actual expense ratio and an assumed rate of return of 5% per year before expenses, which is not the Portfolio’s actual return. The hypothetical account values and expenses may not be used to estimate the actual ending account balance or expenses you paid for the period. You may use this information to compare the ongoing costs of investing in the Portfolio and other investment options. To do so, compare this 5% hypothetical example with the 5% hypothetical examples that appear in the shareholder reports of the other investment options.
Please note that the expenses shown in the table are meant to highlight your ongoing Portfolio costs only and do not reflect any contract fees and charges, such as sales charges (loads), insurance charges or administrative charges. Therefore the second line of the table is useful to compare ongoing investment option costs only, and will not help you determine the relative total costs of owning different contracts. In addition, if these contract fee and charges were included, your costs would have been higher.
| Prudential Series Fund Portfolios | Beginning Portfolio Value July 1, 2005 | Ending Portfolio December 31, 2005 | Annualized Expense Ratio Based on the Six-Month Period | Expenses Paid During the Six- Month Period* | ||||||||||
| Diversified Conservative Growth (Class I) | Actual | $ | 1,000.00 | $ | 1,048.40 | 0.93 | % | $ | 4.80 | |||||
| Hypothetical | $ | 1,000.00 | $ | 1,020.52 | 0.93 | % | $ | 4.74 | ||||||
| Jennison 20/20 Focus (Class I) | Actual | $ | 1,000.00 | $ | 1,162.80 | 0.89 | % | $ | 4.85 | |||||
| Hypothetical | $ | 1,000.00 | $ | 1,020.72 | 0.89 | % | $ | 4.53 | ||||||
| Jennison 20/20 Focus (Class II) | Actual | $ | 1,000.00 | $ | 1,161.30 | 1.29 | % | $ | 7.03 | |||||
| Hypothetical | $ | 1,000.00 | $ | 1,018.70 | 1.29 | % | $ | 6.56 | ||||||
| * | Portfolio expenses (net of fee waivers or subsidies, if any) for each share class are equal to the annualized expense ratio for each share class (provided in the table), multiplied by the average account value over the period, multiplied by the 184 days in the six-month period ended December 31, 2005, and divided by the 365 days in the Portfolio’s fiscal year ended December 31, 2005 (to reflect the six-month period). |
| DIVERSIFIED CONSERVATIVE GROWTH PORTFOLIO |
STATEMENT OF ASSETS AND LIABILITIES
December 31, 2005
| ASSETS | ||||
Investments at value: | ||||
Unaffiliated investments (cost $151,035,810) | $ | 165,215,199 | ||
Affiliated investments (cost $6,891,672) | 6,891,672 | |||
Cash | 64,442 | |||
Foreign currency, at value (cost $113,906) | 122,580 | |||
Receivable for investments sold | 5,305,235 | |||
Dividends and interest receivable | 1,327,674 | |||
Unrealized appreciation on swap agreements | 43,045 | |||
Unrealized appreciation on foreign currency forward contracts | 24,103 | |||
Interest receivable on swap agreements | 8,762 | |||
Prepaid expenses | 4,841 | |||
Tax reclaim receivable | 697 | |||
Total Assets | 179,008,250 | |||
| LIABILITIES | ||||
Payable for investments purchased | 21,837,627 | |||
Investments sold short, at value (proceeds received $5,114,862) | 5,151,000 | |||
Unrealized depreciation on swap agreements | 150,418 | |||
Management fees payable | 124,690 | |||
Accrued expenses and other liabilities | 122,724 | |||
Options written, at value (premium received $67,913) | 54,199 | |||
Premium for swap contracts written | 43,487 | |||
Payable for capital stock repurchased | 36,009 | |||
Interest payable on investments sold short | 30,762 | |||
Unrealized depreciation on foreign currency forward contracts | 9,934 | |||
Interest payable on swap agreements | 6,057 | |||
Deferred trustees’ fees | 3,550 | |||
Due to broker-variation margin | 891 | |||
Total Liabilities | 27,571,348 | |||
| NET ASSETS | $ | 151,436,902 | ||
Net assets were comprised of: | ||||
Common stock, at $0.01 par value | $ | 129,758 | ||
Paid-in capital in excess of par | 132,660,880 | |||
| 132,790,638 | ||||
Undistributed net investment income | 4,737,256 | |||
Accumulated net realized loss on investments | (135,163 | ) | ||
Net unrealized appreciation on investments and foreign currencies | 14,044,171 | |||
Net assets, December 31, 2005 | $ | 151,436,902 | ||
Net asset value and redemption price per share, $151,436,902 / 12,975,791 outstanding shares of common stock (authorized 100,000,000 shares) | $ | 11.67 | ||
STATEMENT OF OPERATIONS
Year Ended December 31, 2005
| INVESTMENT INCOME | ||||
Unaffiliated interest | $ | 4,919,032 | ||
Unaffiliated dividend income (net of $13,008 foreign withholding taxes) | 768,556 | |||
Affiliated dividend income | 129,562 | |||
| 5,817,150 | ||||
| EXPENSES | ||||
Management fee | 1,178,872 | |||
Custodian’s fees and expenses | 239,000 | |||
Shareholders’ reports | 25,000 | |||
Audit fee | 15,000 | |||
Directors’ fees | 12,000 | |||
Legal fees and expenses | 7,000 | |||
Insurance expense | 3,000 | |||
Commitment fee on syndicated credit agreement | 2,000 | |||
Transfer agent’s fee and expenses (including affiliated expense of $370) (Note 4) | 400 | |||
Miscellaneous | 19,171 | |||
Total expenses | 1,501,443 | |||
Less: custodian fee credit | (2,906 | ) | ||
Net expenses | 1,498,537 | |||
| NET INVESTMENT INCOME | 4,318,613 | |||
| NET REALIZED AND UNREALIZED GAIN (LOSS) ON INVESTMENTS AND FOREIGN CURRENCIES | ||||
Net realized gain (loss) on: | ||||
Investments | 8,937,945 | |||
Options written | 112,297 | |||
Futures transactions | (722,435 | ) | ||
Foreign currency transactions | 371,541 | |||
Swap agreements | (106,911 | ) | ||
| 8,592,437 | ||||
Net change in unrealized appreciation (depreciation) on: | ||||
Investments | (3,067,391 | ) | ||
Options written | (38,095 | ) | ||
Futures | 21,947 | |||
Foreign currencies | (10,855 | ) | ||
Short Sales | 21,416 | |||
Swap agreements | 243,100 | |||
| (2,829,878 | ) | |||
| NET GAIN ON INVESTMENTS AND FOREIGN CURRENCIES | 5,762,559 | |||
| NET INCREASE IN NET ASSETS RESULTING FROM OPERATIONS | $ | 10,081,172 | ||
STATEMENT OF CHANGES IN NET ASSETS
| Year Ended December 31, | ||||||||
| 2005 | 2004 | |||||||
| INCREASE (DECREASE) IN NET ASSETS | ||||||||
| OPERATIONS: | ||||||||
Net investment income | $ | 4,318,613 | $ | 3,828,184 | ||||
Net realized gain on investments and foreign currencies | 8,592,437 | 10,794,792 | ||||||
Net change in unrealized appreciation (depreciation) on investments and foreign currencies | (2,829,878 | ) | 442,699 | |||||
NET INCREASE IN NET ASSETS RESULTING FROM OPERATIONS | 10,081,172 | 15,065,675 | ||||||
| DIVIDENDS: | ||||||||
Dividends from net investment income | (4,898,162 | ) | (5,196,232 | ) | ||||
| CAPITAL STOCK TRANSACTIONS: | ||||||||
Capital stock sold [125,832 and 327,219 shares, respectively] | 1,403,725 | 3,465,420 | ||||||
Capital stock issued in reinvestment of dividends [456,918 and 495,351 shares, respectively] | 4,898,162 | 5,196,232 | ||||||
Capital stock repurchased [2,406,901 and 1,979,656 shares, respectively] | (27,016,843 | ) | (21,115,512 | ) | ||||
NET INCREASE (DECREASE) IN NET ASSETS RESULTING FROM CAPITAL STOCK TRANSACTIONS | (20,714,956 | ) | (12,453,860 | ) | ||||
| TOTAL DECREASE IN NET ASSETS | (15,531,946 | ) | (2,584,417 | ) | ||||
| NET ASSETS: | ||||||||
Beginning of year | 166,968,848 | 169,553,265 | ||||||
End of year (a) | $ | 151,436,902 | $ | 166,968,848 | ||||
(a) Includes undistributed net investment income of | $ | 4,737,256 | $ | 4,757,403 | ||||
SEE NOTES TO FINANCIAL STATEMENTS.
A1
| JENNISON 20/20 FOCUS PORTFOLIO |
STATEMENTS OF ASSETS AND LIABILITIES
December 31, 2005
| ASSETS | |||
Investments, at value: | |||
Unaffiliated investments (cost: $196,615,311) | $ | 241,373,051 | |
Affiliated investments (cost: $221,009) | 221,009 | ||
Cash | 62,255 | ||
Receivable for investments sold | 1,664,918 | ||
Receivable for capital stock sold | 311,975 | ||
Dividends and interest receivable | 226,445 | ||
Prepaid expenses | 9,754 | ||
Total Assets | 243,869,407 | ||
| LIABILITIES | |||
Payable for capital stock repurchased | 391,761 | ||
Management fee payable | 156,785 | ||
Accrued expenses and other liabilities | 108,961 | ||
Administration fee payable | 20,578 | ||
Distribution fee payable | 34,297 | ||
Payable for investments purchased | 454 | ||
Transfer agent fee payable | 85 | ||
Total Liabilities | 712,921 | ||
| NET ASSETS | $ | 243,156,486 | |
Net assets were comprised of: | |||
Common stock, at $0.01 par value | $ | 163,330 | |
Paid-in capital in excess of par | 181,554,541 | ||
| 181,717,871 | |||
Undistributed net investment income | 358,681 | ||
Accumulated net realized gain on investments and foreign currency transactions | 16,322,194 | ||
Net unrealized appreciation on investments | 44,757,740 | ||
Net assets, December 31, 2005 | $ | 243,156,486 | |
| Class I: | |||
Net asset value and redemption price per share, $83,825,022 / 5,589,015 outstanding shares of common stock (authorized 100,000,000 shares) | $ | 15.00 | |
| Class II: | |||
Net asset value and redemption price per share, $159,331,464 / 10,743,995 outstanding shares of common stock (authorized 50,000,000 shares) | $ | 14.83 | |
STATEMENT OF OPERATIONS
Year Ended December 31, 2005
| INVESTMENT INCOME | ||||
Unaffiliated dividend income (net of foreign withholding taxes of $60,830) | $ | 2,453,833 | ||
Affiliated dividend income | 211,684 | |||
| 2,665,517 | ||||
| EXPENSES | ||||
Management fee | 1,529,486 | |||
Distribution fee—Class II | 327,576 | |||
Administration fee—Class II | 196,545 | |||
Custodian’s fees and expenses | 148,000 | |||
Shareholders’ reports | 57,000 | |||
Audit fee | 15,000 | |||
Directors’ fees | 11,000 | |||
Legal fees and expenses | 9,000 | |||
Insurance expenses | 4,000 | |||
Commitment fee on syndicated credit agreement | 1,000 | |||
Transfer agent’s fee and expenses (Note 4) | 1,000 | |||
Miscellaneous | 7,500 | |||
Total expenses | 2,307,107 | |||
Less: custodian fee credit | (273 | ) | ||
Net expenses | 2,306,834 | |||
| NET INVESTMENT INCOME | 358,683 | |||
| NET REALIZED AND UNREALIZED GAIN ON INVESTMENTS AND FOREIGN CURRENCIES | ||||
Net realized gain on: | ||||
Investments | 25,481,250 | |||
Foreign currency transactions | 227 | |||
| 25,481,477 | ||||
Net change in unrealized appreciation (depreciation) on: | ||||
Investments | 15,674,336 | |||
Foreign currencies | (168 | ) | ||
| 15,674,168 | ||||
| NET GAIN ON INVESTMENTS AND FOREIGN CURRENCIES | 41,155,645 | |||
| NET INCREASE IN NET ASSETS RESULTING FROM OPERATIONS | $ | 41,514,328 | ||
STATEMENT OF CHANGES IN NET ASSETS
| Year Ended December 31, | ||||||||
| 2005 | 2004 | |||||||
| INCREASE (DECREASE) IN NET ASSETS | ||||||||
| OPERATIONS: | ||||||||
Net investment income | $ | 358,683 | $ | 177,039 | ||||
Net realized gain on investments and foreign currency transactions | 25,481,477 | 7,084,372 | ||||||
Net change in unrealized appreciation on investments and foreign currencies | 15,674,168 | 13,589,381 | ||||||
NET INCREASE IN NET ASSETS RESULTING FROM OPERATIONS | 41,514,328 | 20,850,792 | ||||||
| DIVIDENDS: | ||||||||
Dividends from net investment income | ||||||||
Class I | (177,361 | ) | (61,682 | ) | ||||
TOTAL DIVIDENDS | (177,361 | ) | (61,682 | ) | ||||
| CAPITAL STOCK TRANSACTIONS (Note 7): | ||||||||
Capital stock sold | 59,933,620 | 65,018,127 | ||||||
Capital stock issued in reinvestment of dividends | 177,361 | 61,682 | ||||||
Capital stock repurchased | (27,736,071 | ) | (20,614,630 | ) | ||||
NET INCREASE (DECREASE) IN NET ASSETS RESULTING FROM CAPITAL STOCK TRANSACTIONS | 32,374,910 | 44,465,179 | ||||||
| TOTAL INCREASE IN NET ASSETS | 73,711,877 | 65,254,289 | ||||||
| NET ASSETS: | ||||||||
Beginning of year | 169,444,609 | 104,190,320 | ||||||
End of year (a) | $ | 243,156,486 | $ | 169,444,609 | ||||
(a) Includes undistributed net investment income of: | $ | 358,681 | $ | 177,132 | ||||
SEE NOTES TO FINANCIAL STATEMENTS.
A2
| DIVERSIFIED CONSERVATIVE GROWTH PORTFOLIO |
SCHEDULE OF INVESTMENTS | December 31, 2005 |
| LONG-TERM INVESTMENTS — 103.7% | Value (Note 2) | ||||
| COMMON STOCKS — 40.0% | Shares | ||||
Aerospace & Defense — 0.9% | |||||
DRS Technologies, Inc.(a) | 1,950 | $ | 100,269 | ||
Empresa Brasileira de | 7,300 | 285,430 | |||
Honeywell International, Inc. | 13,000 | 484,250 | |||
Lockheed Martin Corp. | 3,500 | 222,705 | |||
Moog, Inc. (Class “A” Stock) | 3,475 | 98,620 | |||
Northrop Grumman Corp. | 3,500 | 210,385 | |||
| 1,401,659 | |||||
Automobiles | |||||
Winnebago Industries, Inc. | 1,900 | 63,232 | |||
Automotive Parts | |||||
CSK Auto Corp.(a) | 3,400 | 51,272 | |||
Banks — 0.3% | |||||
Pacific Capital Bancorp | 3,100 | 110,298 | |||
Royal Bank of Scotland Group PLC (United Kingdom) | 9,900 | 298,926 | |||
| 409,224 | |||||
Beverages — 0.2% | |||||
PepsiCo, Inc. | 5,200 | 307,216 | |||
Biotechnology — 1.0% | |||||
Amgen, Inc.(a) | 6,800 | 536,248 | |||
Genentech, Inc.(a) | 5,400 | 499,500 | |||
Gilead Sciences, Inc.(a) | 8,100 | 426,303 | |||
Illumina, Inc.(a) | 3,500 | 49,350 | |||
Serologicals Corp. | 2,500 | 49,350 | |||
| 1,560,751 | |||||
Building & Construction — 0.1% | |||||
Standard Pacific Corp. | 4,200 | 154,560 | |||
Building Products — 0.1% | |||||
Watsco, Inc. | 2,800 | 167,468 | |||
Business Services — 0.2% | |||||
Kelly Services, Inc., | 1,100 | 28,842 | |||
TNS, Inc.(a) | 4,170 | 79,981 | |||
URS Corp.(a) | 3,700 | 139,157 | |||
| 247,980 | |||||
Capital Goods | |||||
Joy Global, Inc. | 300 | 12,000 | |||
Capital Markets — 1.9% | |||||
Goldman Sachs Group, Inc. | 2,200 | 280,962 | |||
Jefferies Group, Inc. | 3,600 | 161,928 | |||
JPMorgan Chase & Co. | 15,300 | 607,257 | |||
Lehman Brothers Holdings, Inc. | 1,800 | 230,706 | |||
Mellon Financial Corp. | 5,200 | 178,100 | |||
Merrill Lynch & Co., Inc. | 13,700 | 927,901 | |||
Schwab, (Charles) Corp. | 28,400 | 416,628 | |||
| 2,803,482 | |||||
Chemicals — 0.5% | |||||
E.I. du Pont de Nemours & Co. | 7,800 | 331,500 | |||
Mosaic Co. (The)(a) | 14,900 | 217,987 | |||
Scotts Co. (The) (Class “A” Stock) | 2,400 | 108,576 | |||
Valspar Corp. (The) | 2,600 | 64,142 | |||
| 722,205 | |||||
| COMMON STOCKS (Continued) | Shares | Value (Note 2) | |||
Commercial Banks — 0.9% | |||||
Accredited Home Lenders Holding Co. | 2,500 | $ | 123,950 | ||
Astoria Financial Corp. | 2,450 | 72,030 | |||
Bank of America Corp. | 18,684 | 862,267 | |||
Bank of New York Co., Inc. (The) | 9,100 | 289,835 | |||
BankUnited Financial Corp. | 2,500 | 66,425 | |||
| 1,414,507 | |||||
Commercial Services & Supplies — 1.2% | |||||
Administaff, Inc. | 3,300 | 138,765 | |||
Allied Waste Industries, Inc.(a) | 6,300 | 55,062 | |||
Barrett Business Services, Inc. | 3,100 | 77,469 | |||
Cendant Corp. | 10,200 | 175,950 | |||
Direct Focus, Inc. | 1,400 | 26,124 | |||
FirstService Corp. (Canada) | 5,060 | 129,789 | |||
Global Payments, Inc. | 3,600 | 167,796 | |||
Laureate Education, Inc. | 1,450 | 76,139 | |||
McGrath Rentcorp | 3,717 | 103,333 | |||
PrivateBancorp, Inc. | 3,090 | 109,911 | |||
Providence Service Corp. | 2,040 | 58,732 | |||
Rollins, Inc. | 5,730 | 112,938 | |||
Steiner Leisure Ltd. | 2,820 | 100,279 | |||
Universal Technical Institute, Inc.(a) | 1,870 | 57,858 | |||
Waste Management, Inc. | 14,700 | 446,145 | |||
| 1,836,290 | |||||
Communication Equipment — 0.2% | |||||
Cisco Systems, Inc.(a) | 14,600 | 249,952 | |||
Computers & Peripherals — 0.9% | |||||
Apple Computer, Inc.(a) | 6,600 | 474,474 | |||
Dell, Inc. | 8,900 | 266,911 | |||
EMC Corp.(a) | 16,700 | 227,454 | |||
M-Systems Flash Disk Pioneers• (Israel) | 2,490 | 82,469 | |||
Optimal Group, Inc. | 6,900 | 139,794 | |||
Seagate Technology(a) | 11,800 | 235,882 | |||
| 1,426,984 | |||||
Consumer Finance — 0.7% | |||||
American Express Co. | 16,900 | 869,674 | |||
MBNA Corp. | 7,200 | 195,480 | |||
| 1,065,154 | |||||
Consumer Products & Services — 0.1% | |||||
Central Garden & Pet Co. | 2,490 | 114,391 | |||
Jarden Corp.(a) | 3,255 | 98,138 | |||
| 212,529 | |||||
Distribution/Wholesale | |||||
Building Material Holding Corp. | 750 | 51,158 | |||
Diversified Financial Services — 1.4% | |||||
AmeriCredit Corp. | 7,100 | 181,973 | |||
Boston Private Financial Holdings, Inc. | 1,950 | 59,319 | |||
Citigroup, Inc. | 12,500 | 606,625 | |||
Countrywide Financial Corp. | 4,200 | 143,598 | |||
Eaton Vance Corp. | 4,900 | 134,064 | |||
Lazard Ltd. (Class “A” Stock) (Bermuda) | 9,200 | 293,480 | |||
Oriental Financial Group (Puerto Rico) | 1,700 | 21,012 | |||
SEE NOTES TO FINANCIAL STATEMENTS.
B1
| DIVERSIFIED CONSERVATIVE GROWTH PORTFOLIO (Continued) |
SCHEDULE OF INVESTMENTS | December 31, 2005 |
| COMMON STOCKS (Continued) | Shares | Value (Note 2) | |||
Diversified Financial Services (cont’d.) | |||||
Portfolio Recovery Associates, Inc.(a) | 1,630 | $ | 75,697 | ||
Raymond James Financial, Inc. | 3,850 | 145,030 | |||
Sterling Financial Corp. (WA)(a) | 2,800 | 69,944 | |||
Student Loan Corp. | 700 | 146,461 | |||
UBS AG, ADR (Switzerland) | 2,800 | 266,420 | |||
| 2,143,623 | |||||
Electric — 0.4% | |||||
TXU Corp. | 11,700 | 587,223 | |||
Electric Utilities — 0.2% | |||||
Exelon Corp. | 5,100 | 271,014 | |||
Electronic Equipment & Instruments — 0.4% | |||||
Agilent Technologies, Inc.(a) | 5,900 | 196,411 | |||
Axsys Technologies, Inc. | 3,530 | 63,363 | |||
Checkpoint Systems, Inc. | 4,700 | 115,855 | |||
FLIR Systems, Inc.(a) | 6,100 | 136,213 | |||
Intermagnetics General Corp. | 2,080 | 66,352 | |||
Itron, Inc.(a) | 1,840 | 73,674 | |||
| 651,868 | |||||
Electronics — 0.1% | |||||
PNM Resources, Inc. | 3,400 | 83,266 | |||
Energy — 0.1% | |||||
Headwaters, Inc.(a) | 2,900 | 102,776 | |||
Energy Equipment & Services — 0.9% | |||||
GlobalSantaFe Corp. | 8,400 | 404,460 | |||
Grey Wolf, Inc.(a) | 10,210 | 78,923 | |||
Maverick Tube Corp.(a) | 2,270 | 90,482 | |||
Oil States International, Inc.(a) | 2,380 | 75,399 | |||
Patterson-UTI Energy, Inc. | 2,340 | 77,103 | |||
Schlumberger Ltd. (Netherlands) | 7,100 | 689,765 | |||
| 1,416,132 | |||||
Energy-Other — 0.2% | |||||
Halliburton Co. | 5,300 | 328,388 | |||
Food & Staples Retailing — 0.7% | |||||
Kroger Co. (The)(a) | 30,000 | 566,400 | |||
Whole Foods Market, Inc. | 6,200 | 479,818 | |||
| 1,046,218 | |||||
Food Products — 0.3% | |||||
Cadbury Schweppes PLC | 10,100 | 386,729 | |||
Gaming — 0.1% | |||||
Century Casinos, Inc. | 8,450 | 72,670 | |||
Mikohn Gaming Corp. | 8,190 | 80,835 | |||
| 153,505 | |||||
Gas Utilities — 0.1% | |||||
Oneok, Inc. | 3,000 | 79,890 | |||
Health Care & Pharmaceutical — 0.3% | |||||
Medco Health Solutions, Inc., | 4,216 | 235,253 | |||
Pharmaceutical Product | 3,800 | 235,410 | |||
| 470,663 | |||||
| COMMON STOCKS (Continued) | Shares | Value (Note 2) | |||
Health Care Equipment & Supplies — 1.2% | |||||
Adeza Biomedical Corp.(a) | 2,390 | $ | 50,310 | ||
Alcon, Inc. (Switzerland) | 3,200 | 414,720 | |||
Angiodynamics, Inc.(a) | 900 | 22,977 | |||
Encore Medical Corp. | 12,600 | 62,370 | |||
Guidant Corp. | 3,600 | 233,100 | |||
Immucor, Inc.(a) | 2,850 | 66,576 | |||
LCA-Vision, Inc. | 1,010 | 47,985 | |||
Lifeline Systems, Inc.(a) | 2,570 | 93,959 | |||
NuVasive Inc.(a) | 3,090 | 55,929 | |||
Orthovita, Inc. | 14,530 | 56,376 | |||
PolyMedica Corp. | 2,981 | 99,774 | |||
SonoSight, Inc. | 1,870 | 65,469 | |||
Spectranetics Corp. (The) | 6,190 | 69,637 | |||
St. Jude Medical, Inc.(a) | 7,200 | 361,440 | |||
Syneron Medical Ltd. (Israel) | 1,420 | 45,085 | |||
The Cooper Cos., Inc. | 2,700 | 138,510 | |||
| 1,884,217 | |||||
Health Care Providers & Services — 1.3% | |||||
Amedisys, Inc.(a) | 1,400 | 59,136 | |||
American Healthways, Inc.(a) | 3,300 | 149,325 | |||
AMERIGROUP Corp.(a) | 3,600 | 70,056 | |||
AMN Healthcare Services, Inc. | 4,330 | 85,647 | |||
CIGNA Corp. | 3,900 | 435,630 | |||
Covance, Inc. | 3,200 | 155,360 | |||
Five Star Quality Care, Inc. | 11,990 | 94,361 | |||
Matria Healthcare, Inc. | 2,110 | 81,784 | |||
Neurometrix, Inc.(a) | 1,000 | 27,280 | |||
Sunrise Senior Living, Inc. | 3,300 | 111,243 | |||
UnitedHealth Group, Inc. | 7,800 | 484,692 | |||
WellPoint, Inc.(a) | 4,000 | 319,160 | |||
| 2,073,674 | |||||
Hotels, Restaurants & Leisure — 0.8% | |||||
Brinker International, Inc. | 2,300 | 88,918 | |||
CEC Entertainment, Inc.(a) | 2,100 | 71,484 | |||
Cheesecake Factory, Inc. (The)(a) | 2,500 | 93,475 | |||
Cosi, Inc. | 4,170 | 34,611 | |||
GTECH Holdings Corp. | 11,400 | 361,836 | |||
Hilton Hotels Corp. | 1,100 | 26,521 | |||
McDonald’s Corp. | 5,900 | 198,948 | |||
Scientific Games Corp. | 5,240 | 142,947 | |||
Sonic Corp.(a) | 2,900 | 85,550 | |||
Starbucks Corp.(a) | 2,400 | 72,024 | |||
| 1,176,314 | |||||
Household Durables — 0.3% | |||||
Harman International Industries, Inc. | 2,600 | 254,410 | |||
Meritage Homes Corp.(a) | 2,500 | 157,300 | |||
Snap-On, Inc. | 2,900 | 108,924 | |||
| 520,634 | |||||
Household Products — 0.7% | |||||
Kimberly-Clark Corp. | 5,500 | 328,075 | |||
Procter & Gamble Co. | 12,588 | 728,564 | |||
| 1,056,639 | |||||
SEE NOTES TO FINANCIAL STATEMENTS.
B2
| DIVERSIFIED CONSERVATIVE GROWTH PORTFOLIO (Continued) |
SCHEDULE OF INVESTMENTS | December 31, 2005 |
| COMMON STOCKS (Continued) | Shares | Value (Note 2) | |||
Industrial Conglomerates — 1.4% | |||||
General Electric Co. | 32,600 | $ | 1,142,630 | ||
Phelps Dodge Corp. | 3,400 | 489,158 | |||
Tyco International Ltd. | 16,400 | 473,304 | |||
| 2,105,092 | |||||
Insurance — 2.0% | |||||
American International Group, Inc. | 16,400 | 1,118,972 | |||
Amerisafe, Inc.(a) | 8,690 | 87,595 | |||
Axis Capital Holdings Ltd. (Bermuda) | 8,700 | 272,136 | |||
Commerce Group, Inc. | 1,900 | 108,832 | |||
Delphi Financial Group, Inc. (Class | 1,950 | 89,719 | |||
Genworth Financial, Inc., (Class “A” Stock) | 5,200 | 179,816 | |||
Loews Corp.(a) | 3,700 | 350,945 | |||
Montpelier Re Holdings Ltd (Bermuda) | 12,900 | 243,810 | |||
Navigators Group, Inc.(a) | 1,500 | 65,415 | |||
Philadelphia Consolidated Holding Corp.(a) | 2,500 | 241,725 | |||
Protective Life Corp. | 1,400 | 61,278 | |||
Tower Group, Inc. | 2,210 | 48,576 | |||
United Fire & Casualty Co. | 2,600 | 105,118 | |||
| 2,973,937 | |||||
Internet — 0.1% | |||||
Ctrip.com International Ltd., ADR• (China) | 700 | 40,425 | |||
Equinix, Inc. | 3,160 | 128,801 | |||
Health Grades, Inc.(a) | 7,210 | 45,207 | |||
| 214,433 | |||||
Internet Software & Services — 2.5% | |||||
Amazon.Com, Inc.(a) | 2,700 | 127,305 | |||
Cybersource Corp.(a) | 12,450 | 82,170 | |||
Digitas, Inc. | 7,500 | 93,900 | |||
eBay, Inc.(a) | 18,200 | 787,150 | |||
Expedia, Inc.(a) | 3,200 | 76,672 | |||
Google, Inc. (Class “A” Stock)(a) | 2,300 | 954,178 | |||
Iac Interactive Corp.(a) | 10,800 | 305,748 | |||
j2 Global Communications, Inc.(a) | 2,820 | 120,527 | |||
Keynote Systems, Inc. | 6,466 | 83,088 | |||
Online Resources Corp.(a) | 8,360 | 92,378 | |||
Openwave Systems, Inc.(a) | 3,560 | 62,193 | |||
RADVision Ltd.(a) (Israel) | 4,750 | 78,768 | |||
Rightnow Technologies, Inc.(a) | 2,490 | 45,965 | |||
ValueClick, Inc. | 3,300 | 59,763 | |||
WebSideStory, Inc. | 3,850 | 69,801 | |||
Yahoo!, Inc.(a) | 17,800 | 697,404 | |||
| 3,737,010 | |||||
IT Consulting & Services — 0.2% | |||||
Accenture Ltd. (Class “A” Stock)(a) (Bermuda) | 11,600 | 334,892 | |||
Lodging — 0.2% | |||||
Marriott International, Inc. | 3,500 | 234,395 | |||
Machinery & Equipment — 0.1% | |||||
Bucyrus International, Inc. | 2,000 | 105,400 | |||
| COMMON STOCKS (Continued) | Shares | Value (Note 2) | |||
Manufacturing — 0.1% | |||||
Harsco Corp. | 1,900 | $ | 128,269 | ||
Hexel Corp.(a) | 4,840 | 87,362 | |||
| 215,631 | |||||
Media — 0.5% | |||||
Getty Images, Inc.(a) | 1,000 | 89,270 | |||
Liberty Global, Inc. (Class “A” Stock)(a) | 972 | 21,870 | |||
Liberty Global, Inc. - Series C | 972 | 20,606 | |||
Marchex, Inc., (Class “B” Stock) | 1,510 | 33,960 | |||
News Corp., Inc. (Class “A” Stock) | 11,134 | 173,134 | |||
Scholastic Corp.(a) | 2,900 | 82,679 | |||
Viacom, Inc. (Class “B” Stock) | 9,840 | 320,784 | |||
| 742,303 | |||||
Metals & Mining — 0.2% | |||||
Inco Ltd.(a) (Canada) | 7,600 | 331,132 | |||
Multi-Utilities — 0.2% | |||||
Sempra Energy(a) | 7,200 | 322,848 | |||
Office Electronics — 0.3% | |||||
Xerox Corp.(a) | 32,400 | 474,660 | |||
Oil, Gas & Consumable Fuels — 2.7% | |||||
Amerada Hess Corp. | 2,200 | 279,004 | |||
Cabot Oil & Gas Corp. | 5,000 | 225,500 | |||
Eni SpA, ADR (Italy) | 4,900 | 169,148 | |||
Houston Exploration Co. | 2,400 | 126,720 | |||
Hydril Co.(a) | 940 | 58,844 | |||
Kerr-McGee Corp. | 4,200 | 381,612 | |||
National-Oilwell Varco, Inc.(a) | 2,200 | 137,940 | |||
Nexen, Inc. (Canada) | 9,600 | 457,248 | |||
Occidental Petroleum Corp. | 9,100 | 726,908 | |||
Oceaneering International, Inc.(a) | 2,700 | 134,406 | |||
Suncor Energy, Inc. (Canada) | 13,300 | 839,629 | |||
Superior Energy Services, Inc. | 4,000 | 84,200 | |||
Swift Energy Co.(a) | 2,900 | 130,703 | |||
Tesoro Corp.(a) | 3,700 | 227,735 | |||
Unit Corp.(a) | 1,460 | 80,344 | |||
| 4,059,941 | |||||
Pharmaceuticals — 2.1% | |||||
Atherogenics, Inc. | 2,790 | 55,828 | |||
Barr Pharmaceuticals, Inc. | 1,400 | 87,206 | |||
Caremark Rx, Inc.(a) | 7,700 | 398,783 | |||
First Horizon Pharmaceutical Corp.(a) | 4,130 | 71,242 | |||
I-Flow Corp.(a) | 5,000 | 73,100 | |||
Martrixx Ini. Inc.(a) | 1,800 | 37,710 | |||
Novartis AG, ADR (Switzerland) | 16,000 | 839,680 | |||
Pfizer, Inc. | 15,600 | 363,792 | |||
Roche Holdings Ltd. (Switzerland) | 7,000 | 523,958 | |||
Salix Pharmaceuticals Ltd.(a) | 3,970 | 69,793 | |||
Sanofi-Aventis, ADR (France) | 7,300 | 320,470 | |||
Sanofi-Aventis | 3,900 | 341,672 | |||
Viropharma, Inc.(a) | 3,050 | 56,577 | |||
| 3,239,811 | |||||
Real Estate Investment Trust — 0.4% | |||||
Entertainment Properties Trust | 1,700 | 69,275 | |||
Hovnanian Enterprises, Inc. | 5,200 | 258,128 | |||
SEE NOTES TO FINANCIAL STATEMENTS.
B3
| DIVERSIFIED CONSERVATIVE GROWTH PORTFOLIO (Continued) |
SCHEDULE OF INVESTMENTS | December 31, 2005 |
| COMMON STOCKS (Continued) | Shares | Value (Note 2) | |||
Real Estate Investment Trust (cont’d.) | |||||
KKR Financial Corp.(a) | 4,630 | $ | 111,074 | ||
SL Green Realty Corp. | 1,600 | 122,224 | |||
| 560,701 | |||||
Semiconductors & Semiconductor Equipment — 1.8% | |||||
Advanced Analogic Technologies, Inc. | 4,540 | 62,879 | |||
Applied Materials, Inc.(a) | 20,300 | 364,182 | |||
Intel Corp. | 13,300 | 331,968 | |||
Marvell Technology Group Ltd.(a) (Bermuda) | 10,300 | 577,727 | |||
Maxim Integrated Products, Inc. | 13,200 | 478,368 | |||
Microsemi Corp.(a) | 2,750 | 76,065 | |||
O2Micro International Ltd.(a) | 5,870 | 59,757 | |||
Spansion, Inc., (Class “A” Stock)(a) | 7,500 | 104,400 | |||
SRS Labs, Inc. | 9,690 | 63,760 | |||
Texas Instruments, Inc. | 15,700 | 503,499 | |||
Ultratech, Inc.(a) | 3,800 | 62,396 | |||
Volterra Semiconductor Corp. | 4,090 | 61,350 | |||
| 2,746,351 | |||||
Software — 2.3% | |||||
Adobe Systems, Inc. | 15,900 | 587,664 | |||
Bottomline Technologies, Inc. | 5,100 | 56,202 | |||
Computer Associates International, Inc. | 15,227 | 429,249 | |||
Concur Technologies, Inc. | 3,860 | 49,756 | |||
Electronic Arts, Inc.(a) | 8,800 | 460,328 | |||
Epicor Software Corp.(a) | 6,310 | 89,160 | |||
Merge Technologies, Inc.(a) | 2,130 | 53,335 | |||
Microsoft Corp. | 24,400 | 638,060 | |||
NAVTEQ Corp.(a) | 4,500 | 197,415 | |||
Pdf Solutions, Inc.(a) | 4,400 | 71,500 | |||
Retalix Ltd. | 2,700 | 66,042 | |||
SafeNet, Inc.(a) | 2,840 | 91,505 | |||
SAP AG, ADR (Germany) | 8,600 | 387,602 | |||
Synplicity, Inc. | 11,500 | 95,450 | |||
Ultimate Software Group, Inc.(a) | 4,030 | 76,852 | |||
Witness Systems, Inc. | 3,500 | 68,845 | |||
| 3,418,965 | |||||
Technology | |||||
Sanmina - SCI Corp., Gtd. Notes(a) | 9,100 | 38,766 | |||
Telecommunications — 1.0% | |||||
Alltel Corp. | 5,100 | 321,810 | |||
American Tower Corp. (Class “A” Shares) | 4,000 | 108,400 | |||
Avaya, Inc.(a) | 13,400 | 142,978 | |||
McLeodUSA, Inc. | 1,043 | 63 | |||
Nokia Corp. (Class “A” Stock), | 30,000 | 549,000 | |||
NTL, Inc. | 250 | 17,020 | |||
QUALCOMM, Inc. | 7,400 | 318,792 | |||
| 1,458,063 | |||||
Textiles & Apparel — 1.7% | |||||
Chico’s FAS, Inc.(a) | 11,800 | 518,374 | |||
Federated Department Stores, Inc. | 4,400 | 291,852 | |||
Jos. A. Bank Clothiers, Inc.(a) | 1,792 | 77,791 | |||
Lowe’s Cos., Inc. | 5,500 | 366,630 | |||
NIKE, Inc. (Class “B” Stock) | 4,500 | 390,555 | |||
| COMMON STOCKS (Continued) | Shares | Value (Note 2) | |||
Textiles & Apparel (cont’d.) | |||||
Stein Mart, Inc. | 5,400 | $ | 98,010 | ||
Target Corp. | 9,600 | 527,712 | |||
Williams-Sonoma, Inc.(a) | 5,200 | 224,380 | |||
| 2,495,304 | |||||
Textiles, Apparel & Luxury Goods — 0.4% | |||||
Cache, Inc.(a) | 4,440 | 76,901 | |||
Coach, Inc.(a) | 10,500 | 350,070 | |||
Phillips-Van Heusen Corp. | 4,800 | 155,520 | |||
| 582,491 | |||||
Tobacco — 0.4% | |||||
Altria Group Inc.(a) | 7,900 | 590,288 | |||
Transportation — 0.2% | |||||
American Commerical Lines, Inc.(a) | 2,940 | 89,053 | |||
Old Dominion Freight Line(a) | 3,125 | 84,312 | |||
Vitran Corp., Inc. (Canada) | 4,630 | 91,211 | |||
| 264,576 | |||||
Wireless Telecommunication Services — 0.5% | |||||
Sprint Nextel Corp. | 34,509 | 806,130 | |||
TOTAL COMMON STOCKS | 60,643,516 | ||||
| Units | |||||
| RIGHTS(a) | |||||
U.S. Treasury Obligations | |||||
United Mexican States, expiring 06/30/06 | 1,300,000 | 34,125 | |||
United Mexican States, expiring 06/01/07 | 1,300,000 | 26,715 | |||
TOTAL RIGHTS | 60,840 | ||||
| WARRANTS(a) | |||||
Telecommunications | |||||
McLeodUSA, Inc. | 2 | 14 | |||
XM Satellite Radio, Inc., 144A | — | — | |||
TOTAL WARRANTS | 14 | ||||
Interest | Maturity Date | Principal Amount (000) | |||||||
| U.S. GOVERNMENT MORTGAGE BACKED OBLIGATIONS — 24.0% | |||||||||
Federal Home Loan Mortgage Corp. | |||||||||
| 4.565% | 11/15/30 | $ | 20 | 20,266 | |||||
| 5.50% | 01/12/36 | 2,000 | 1,981,250 | ||||||
Federal National Mortgage Assoc. | |||||||||
| 6.50% | 06/01/18 -10/01/32 | 427 | 442,657 | ||||||
| 6.272% | 08/01/29 | 48 | 48,658 | ||||||
| 6.875% | 08/01/09 | 940 | 985,784 | ||||||
| 6.00% | 11/01/32 | 11 | 10,964 | ||||||
| 5.00% | 01/01/19 | 158 | 156,674 | ||||||
| 4.00% | 09/01/18-09/01/20 | 6,131 | 5,860,014 | ||||||
| 4.50% | 03/01/35-01/12/36 | 4,589 | 4,322,709 | ||||||
| 5.50% | 02/01/35-01/12/36 | 22,145 | 21,931,439 | ||||||
| 4.487% | 05/01/36 | 242 | 243,304 | ||||||
SEE NOTES TO FINANCIAL STATEMENTS.
B4
| DIVERSIFIED CONSERVATIVE GROWTH PORTFOLIO (Continued) |
SCHEDULE OF INVESTMENTS | December 31, 2005 |
Interest | Maturity Date | Moody’s Ratings (Unaudited) | Principal Amount (000) | Value (Note 2) | ||||||
| U.S. GOVERNMENT MORTGAGE BACKED OBLIGATIONS (Continued) | ||||||||||
Government National Mortgage Assoc. | ||||||||||
| 8.50% | 02/20/26-04/20/31 | $ | 52 | $ | 57,326 | |||||
| 4.75% | 08/20/24 | 10 | 9,590 | |||||||
| 4.375% | 04/20/27 | 115 | 115,870 | |||||||
| 8.00% | 08/20/31 | 6 | 6,045 | |||||||
| 4.125% | 10/20/27-11/20/29 | 94 | 94,844 | |||||||
TOTAL U.S. GOVERNMENT | 36,287,394 | |||||||||
| CORPORATE BONDS — 21.5% | ||||||||||
Aerospace & Defense — 0.5% | ||||||||||
Alliant Techsystems, Inc., Sr. Sub. Notes | ||||||||||
| 8.50% | 05/15/11 | B2 | 75 | 78,750 | ||||||
Argo-Tech Corp., Sr. Notes | ||||||||||
| 9.25% | 06/01/11 | B3 | 20 | 20,500 | ||||||
BE Aerospace, Inc., Sr. Sub. Notes | ||||||||||
| 8.875% | 05/01/11 | Caa2 | 115 | 120,750 | ||||||
Esterline Technologies, Sr. Sub. Notes | ||||||||||
| 7.75% | 06/15/13 | B1 | 125 | 130,625 | ||||||
L-3 Communications Corp., Sr. Sub. Notes | ||||||||||
| 7.625% | 06/15/12 | Ba3 | 175 | 184,187 | ||||||
Moog, Inc., Sr. Sub. Notes 144A | ||||||||||
| 6.25% | 01/15/15 | Ba3 | 100 | 98,500 | ||||||
Sequa Corp., Sr. Notes | ||||||||||
| 8.875% | 04/01/08 | B1 | 100 | 104,250 | ||||||
Standard Aero Holdings, Inc., Notes | ||||||||||
| 8.25% | 09/01/14 | Caa1 | 45 | 36,900 | ||||||
| 774,462 | ||||||||||
Airlines — 0.1% | ||||||||||
AMR Corp., Debs. Notes | ||||||||||
| 10.00% | 04/15/21 | Caa2 | 50 | 37,375 | ||||||
AMR Corp., Notes | ||||||||||
| 10.40% | 03/10/11 | CCC | 100 | 82,750 | ||||||
Continental Airlines, Inc., Pass-Through Certs., Series 98-1B | ||||||||||
| 6.748% | 03/15/17 | Ba2 | 39 | 33,840 | ||||||
| 153,965 | ||||||||||
Automobiles — 2.1% | ||||||||||
DaimlerChrysler NA Holding Corp. Gtd. Notes | ||||||||||
| 6.40% | 05/15/06 | A3 | 300 | 301,488 | ||||||
| 4.70% | 03/07/07 | A3 | 600 | 599,387 | ||||||
Ford Motor Co., Notes | ||||||||||
| 7.45% | 07/16/31 | Ba1 | 300 | 204,000 | ||||||
Ford Motor Credit Co., Notes | ||||||||||
| 7.875% | 06/15/10 | Baa3 | 355 | 319,462 | ||||||
General Motors Acceptance Corp., Notes | ||||||||||
| 6.75% | 01/15/06-12/01/14 | Ba1 | 605 | 589,144 | ||||||
| 6.125% | 09/15/06 | Ba1 | 100 | 97,136 | ||||||
| 6.875% | 09/15/11-08/28/12 | Ba1 | 1,150 | 1,046,879 | ||||||
| 3,157,496 | ||||||||||
Automotive — 0.5% | ||||||||||
Dana Corp., Notes | ||||||||||
| 6.50% | 03/01/09 | Ba2 | 25 | 20,000 | ||||||
Interest | Maturity Date | Moody’s Ratings (Unaudited) | Principal Amount (000) | Value (Note 2) | ||||||
Automotive (cont’d.) | ||||||||||
Goodyear Tire & Rubber Co. (The), Notes | ||||||||||
| 9.00% | 07/01/15 | B3 | $ | 50 | $ | 49,250 | ||||
Hertz Corp., Sr. Notes | ||||||||||
| 8.875% | 01/01/14 | B1 | 175 | 178,281 | ||||||
Hertz Corp., Sr. Sub. Notes | ||||||||||
| 10.50% | 01/01/16 | B3 | 100 | 103,000 | ||||||
Lear Corp., Gtd. Notes | ||||||||||
| 8.11% | 05/15/09 | Ba2 | 50 | 46,535 | ||||||
Navistar International Corp., Gtd. Notes | ||||||||||
| 9.375% | 06/01/06 | Ba3 | 40 | 40,600 | ||||||
Rexnord Corp., Gtd. Notes | ||||||||||
| 10.125% | 12/15/12 | B3 | $ | 100 | 107,500 | |||||
TRW Automotive, Inc., Sr. Notes | ||||||||||
| 9.375% | 02/15/13 | Ba3 | 113 | 122,323 | ||||||
Visteon Corp., Sr. Notes | ||||||||||
| 8.25% | 08/01/10 | B3 | 85 | 72,250 | ||||||
| 7.00% | 03/10/14 | B3 | 95 | 73,388 | ||||||
| 813,127 | ||||||||||
Automotive Parts — 0.1% | ||||||||||
Arvinmeritor Inc., Notes | ||||||||||
| 8.75% | 03/01/12 | Ba2 | 160 | 153,200 | ||||||
Tenneco Automotive Inc., Gtd. Notes | ||||||||||
| 8.625% | 11/15/14 | B3 | 50 | 47,250 | ||||||
| 200,450 | ||||||||||
Banks — 0.1% | ||||||||||
Kazkommerts International BV, Bank Gtd. Notes | ||||||||||
| 7.875% | 04/07/14 | Baa2 | 95 | 99,750 | ||||||
| 7.00% | 11/03/09 | Baa2 | 40 | 41,040 | ||||||
| 140,790 | ||||||||||
Building Materials & Construction — 0.4% | ||||||||||
D.R. Horton, Inc., Sr. Notes | ||||||||||
| 7.875% | 08/15/11 | Ba1 | 200 | 217,842 | ||||||
Goodman Global Holding Co., Inc., Sr. Notes | ||||||||||
| 6.41% | 06/15/12 | B3 | 85 | 84,150 | ||||||
K Hovnanian Enterprises, Inc., Gtd. Notes | ||||||||||
| 6.25% | 01/15/15 | Ba1 | 50 | 47,055 | ||||||
KB Home, Sr. Sub. Notes | ||||||||||
| 8.625% | 12/15/08 | Ba2 | 80 | 84,974 | ||||||
Nortek, Inc., Sr. Sub. Notes | ||||||||||
| 8.50% | 09/01/14 | Caa1 | 100 | 96,500 | ||||||
| 530,521 | ||||||||||
Cable — 0.3% | ||||||||||
Cablevision Systems Corp. Holdings, Inc., Sr. Notes | ||||||||||
| 8.125% | 07/15/09 | B1 | 75 | 75,750 | ||||||
Cablevision Systems Corp., Sr. Notes 144A | ||||||||||
| 8.00% | 04/15/12 | B3 | 25 | 23,375 | ||||||
Callahan Nordrhein-Westfalen, Sr. Disc. Notes (Germany)(i) | ||||||||||
| 16.00% | 07/15/10 | NR | 250 | 25 | ||||||
Charter Communications Corp., Sr. Notes | ||||||||||
| Zero | 05/15/14 | B2 | 150 | 83,250 | ||||||
Charter Communications Holdings II, Sr. Notes | ||||||||||
| 10.25% | 09/15/10 | Caa1 | 100 | 99,500 | ||||||
Charter Communications Operating LLC, Sr. Notes | ||||||||||
| 8.375% | 04/30/14 | B2 | 50 | 49,750 | ||||||
SEE NOTES TO FINANCIAL STATEMENTS.
B5
| DIVERSIFIED CONSERVATIVE GROWTH PORTFOLIO (Continued) |
SCHEDULE OF INVESTMENTS | December 31, 2005 |
Interest | Maturity Date | Moody’s Ratings (Unaudited) | Principal Amount (000) | Value (Note 2) | ||||||
Cable (cont’d.) | ||||||||||
CSC Holdings, Inc., Debs. Notes | ||||||||||
| 7.625% | 07/15/18 | B2 | $ | 25 | $ | 23,750 | ||||
CSC Holdings, Inc., Sr. Notes | ||||||||||
| 7.25% | 07/15/08 | B1 | 50 | 49,875 | ||||||
| 7.875% | 12/15/07 | B1 | 24 | 24,420 | ||||||
| 7.00% | 04/15/12 | B1 | 50 | 47,250 | ||||||
| 476,945 | ||||||||||
Capital Goods — 0.7% | ||||||||||
Allied Waste North America, Inc., Sec’d. Notes | ||||||||||
| 8.50% | 12/01/08 | B2 | 145 | 152,250 | ||||||
| 5.75% | 02/15/11 | B2 | 60 | 56,850 | ||||||
Allied Waste North America, Inc., Sr. Notes | ||||||||||
| 7.875% | 04/15/13 | B2 | 50 | 51,625 | ||||||
Case New Holland, Inc., Sr. Notes | ||||||||||
| 9.25% | 08/01/11 | Ba3 | 70 | 74,900 | ||||||
Columbus Mckinnon Corp. NY, Sr. Sub. Notes | ||||||||||
| 8.875% | 11/01/13 | B3 | 50 | 52,000 | ||||||
Johnson Diversified Holdings, Inc., Disc. Notes, Zero Coupon (until 05/15/07) | ||||||||||
| 10.67%(v) | 05/15/13 | Caa1 | 70 | 55,650 | ||||||
Manitowoc Co., Sr. Sub. Notes | ||||||||||
| 10.50% | 08/01/12 | B2 | 97 | 107,670 | ||||||
Mueller Group, Inc., Sr. Sub. Notes | ||||||||||
| 10.00% | 05/01/12 | Caa1 | 30 | 31,875 | ||||||
Playtex Products, Inc., Gtd. Notes | ||||||||||
| 9.375% | 06/01/11 | Caa2 | 50 | 52,375 | ||||||
Stena AB, Sr. Notes (Sweden)(l) | ||||||||||
| 7.50% | 11/01/13 | Ba3 | 125 | 120,000 | ||||||
Terex Corp., Gtd. Notes | ||||||||||
| 9.25% | 07/15/11 | Caa1 | 45 | 48,037 | ||||||
| 7.375% | 01/15/14 | Caa1 | 75 | 74,250 | ||||||
United Rentals North America, Inc., Gtd. Notes | ||||||||||
| 6.50% | 02/15/12 | B3 | 100 | 97,375 | ||||||
| 974,857 | ||||||||||
Chemicals — 1.2% | ||||||||||
BCI US Finance Corp/Borden 2 Nova Scotia Finance ULC, Sec’d. Notes | ||||||||||
| 9.65% | 07/15/10 | B3 | 60 | 60,750 | ||||||
Equistar Chemical Funding, Sr. Notes | ||||||||||
| 10.625% | 05/01/11 | B2 | 55 | 60,500 | ||||||
Equistar Chemicals LP, Gtd. Notes | ||||||||||
| 10.125% | 09/01/08 | B2 | 95 | 103,075 | ||||||
Huntsman International LLC, Gtd. Notes | ||||||||||
| 10.125% | 07/01/09 | B3 | 11 | 11,358 | ||||||
Huntsman LLC, Gtd. Notes | ||||||||||
| 11.625% | 10/15/10 | Ba3 | 150 | 170,812 | ||||||
IMC Global, Inc., Debs. Notes | ||||||||||
| 6.875% | 07/15/07 | B1 | 100 | 101,500 | ||||||
IMC Global, Inc., Gtd. Notes | ||||||||||
| 10.875% | 06/01/08 | Ba3 | 125 | 138,437 | ||||||
IMC Global, Inc., Sr. Notes | ||||||||||
| 10.875% | 08/01/13 | Ba3 | 50 | 57,437 | ||||||
ISP Chemco, Inc., Gtd. Notes | ||||||||||
| 10.25% | 07/01/11 | B1 | 75 | 79,875 | ||||||
Johnsondiversey, Inc., Gtd. Notes | ||||||||||
| 9.625% | 05/15/12 | B3 | 30 | 30,150 | ||||||
Interest | Maturity Date | Moody’s Ratings (Unaudited) | Principal Amount (000) | Value (Note 2) | ||||||
Chemicals (cont’d.) | ||||||||||
Koppers, Inc., Gtd. Notes | ||||||||||
| 9.875% | 10/15/13 | B2 | $ | 150 | $ | 162,750 | ||||
Lyondell Chemical Co., Gtd. Notes | ||||||||||
| 10.50% | 06/01/13 | B1 | 150 | 170,437 | ||||||
Lyondell Chemical Co., Sec’d. Notes | ||||||||||
| 11.125% | 07/15/12 | B1 | 50 | 55,938 | ||||||
| 9.625% | 05/01/07 | B1 | 100 | 104,375 | ||||||
Nalco Co., Sr. Notes | ||||||||||
| 7.75% | 11/15/11 | B2 | 130 | 133,575 | ||||||
Nalco Co., Sr. Sub. Notes | ||||||||||
| 8.875% | 11/15/13 | Caa1 | 15 | 15,713 | ||||||
Nova Chemicals Corp., Sr. Notes | ||||||||||
| 7.561% | 11/15/13 | Ba2 | 150 | 153,187 | ||||||
OM Group, Inc., Gtd. Notes | ||||||||||
| 9.25% | 12/15/11 | Caa1 | 35 | 34,213 | ||||||
PQ Corp., Gtd. Notes 144A | ||||||||||
| 7.50% | 02/15/13 | B3 | 25 | 23,250 | ||||||
Rhodia SA, Sr. Sub. Notes (France)(l) | ||||||||||
| 8.875% | 06/01/11 | Caa1 | 100 | 102,500 | ||||||
Rockwood Specialties, Inc., Sr. Sub. Notes | ||||||||||
| 10.625% | 05/15/11 | B3 | 36 | 39,465 | ||||||
| 1,809,297 | ||||||||||
Commercial Services — 0.3% | ||||||||||
Iron Mountain, Inc., Gtd. Notes | ||||||||||
| 8.625% | 04/01/13 | Caa1 | 95 | 99,038 | ||||||
Mac-Gray Corp., Sr. Notes | ||||||||||
| 7.625% | 08/15/15 | B1 | 50 | 50,375 | ||||||
Quebecor Media, Sr. Disc. Notes, | ||||||||||
| 13.75%(v) | 07/15/11 | B2 | 150 | 155,062 | ||||||
Service Corp. International US, Sr. Notes | ||||||||||
| 7.00% | 06/15/17 | Ba3 | 125 | 124,063 | ||||||
| 428,538 | ||||||||||
Computer Hardware | ||||||||||
Unisys Corp., Sr. Notes | ||||||||||
| 8.00% | 10/15/12 | Ba3 | 35 | 32,375 | ||||||
Computer Services & Software — 0.2% | ||||||||||
Sungard Data Systems, Inc., Sr. Sub. Notes 144A | ||||||||||
| 10.25% | 08/15/15 | Caa1 | 230 | 230,000 | ||||||
Sungard Data Systems, Inc., Sr. Unsec’d. Notes | ||||||||||
| 9.125% | 08/15/13 | B3 | 125 | 129,375 | ||||||
| 359,375 | ||||||||||
Computers & Peripherals — 0.1% | ||||||||||
Seagate Technology HDD Holdings, Gtd. Notes (Cayman Island)(l) | ||||||||||
| 8.00% | 05/15/09 | Ba2 | 150 | 157,500 | ||||||
Construction | ||||||||||
Dycom Industries, Inc., Notes | ||||||||||
| 8.125% | 10/15/15 | Ba3 | 50 | 50,000 | ||||||
Consumer Cyclical – Services | ||||||||||
Nell AF SARL, Sr. Notes 144A (Luxembourg)(l) | ||||||||||
| 8.375% | 08/15/15 | B2 | 55 | 54,450 | ||||||
NoteCo Ltd. (United Kingdom) | ||||||||||
| 6.673% | 06/30/25 | NR | GBP | 3 | 6,246 | |||||
| 60,696 | ||||||||||
Consumer Products & Services — 0.1% | ||||||||||
Simmons Bedding, Co., Sr. Sub. Notes | ||||||||||
| 7.875% | 01/15/14 | Caa1 | 75 | 69,375 | ||||||
SEE NOTES TO FINANCIAL STATEMENTS.
B6
| DIVERSIFIED CONSERVATIVE GROWTH PORTFOLIO (Continued) |
SCHEDULE OF INVESTMENTS | December 31, 2005 |
Interest | Maturity Date | Moody’s Ratings (Unaudited) | Principal Amount (000) | Value (Note 2) | ||||||
Consumer Services — 0.1% | ||||||||||
Levi Strauss & Co., Gtd. Notes | ||||||||||
| 12.25% | 12/15/12 | Caa2 | $ | 75 | $ | 83,625 | ||||
Propex Fabrics, Inc., Gtd. Notes | ||||||||||
| 10.00% | 12/01/12 | Caa1 | 15 | 13,388 | ||||||
| 97,013 | ||||||||||
Containers & Packaging — 0.4% | ||||||||||
Berry Plastics Corp., Gtd. Notes | ||||||||||
| 10.75% | 07/15/12 | B3 | 100 | 107,500 | ||||||
Crown Americas LLC, Sr. Notes | ||||||||||
| 7.625% | 11/15/13 | B1 | 100 | 103,750 | ||||||
Greif, Inc., Gtd. Notes | ||||||||||
| 8.875% | 08/01/12 | B1 | 175 | 186,375 | ||||||
Jefferson Smurfit Corp., Gtd. Notes | ||||||||||
| 8.25% | 10/01/12 | B2 | 35 | 33,600 | ||||||
| 7.50% | 06/01/13 | B2 | 50 | 46,000 | ||||||
Norampac, Inc., Sr. Notes (Canada)(l) | ||||||||||
| 6.75% | 06/01/13 | Ba2 | 30 | 28,950 | ||||||
Silgan Holdings, Inc., Sr. Sub. Notes | ||||||||||
| 6.75% | 11/15/13 | B1 | 50 | 49,750 | ||||||
Smurfit-Stone Container Enterprises, Inc., Sr. Notes | ||||||||||
| 8.375% | 07/01/12 | B2 | 25 | 24,188 | ||||||
| 9.75% | 02/01/11 | B2 | 25 | 25,250 | ||||||
| 605,363 | ||||||||||
Diversified Financial Services — 0.2% | ||||||||||
Borden U.S. Finance Corp. / Nova Scotia Finance ULC, Sed’d. Notes | ||||||||||
| 9.00% | 07/15/14 | B3 | 50 | 49,500 | ||||||
CCM Merger, Inc., Notes | ||||||||||
| 8.00% | 08/01/13 | B3 | 25 | 24,000 | ||||||
Galaxy Entertainment Finance Co., Ltd. Gtd. Notes | ||||||||||
| 9.875% | 12/15/12 | B1 | 100 | 101,500 | ||||||
K&F Acquisition, Inc., Gtd. Notes, PIK | ||||||||||
| 7.75% | 11/15/14 | Caa1 | 50 | 50,500 | ||||||
Residential Capital Corp., Sr. UnSec’d. Notes | ||||||||||
| 6.375% | 06/30/10 | Baa3 | 50 | 50,806 | ||||||
Stripes Acquisition, LLC, Sr. Notes | ||||||||||
| 10.625% | 12/15/13 | B2 | 50 | 50,750 | ||||||
| 327,056 | ||||||||||
Electric — 1.0% | ||||||||||
AES Corp., Sr. Notes | ||||||||||
| 9.375% | 09/15/10 | B1 | 275 | 300,437 | ||||||
| 9.50% | 06/01/09 | B1 | 25 | 27,000 | ||||||
AES Eastern Energy LP, Pass-Through Certificates, Series 99-A | ||||||||||
| 9.00% | 01/02/17 | Ba1 | 37 | 41,918 | ||||||
Aquila Inc., Sr. Notes | ||||||||||
| 9.95% | 02/01/11 | B2 | 55 | 60,637 | ||||||
CMS Energy Corp., Sr. Notes | ||||||||||
| 7.50% | 01/15/09 | B1 | 125 | 128,750 | ||||||
Sr. Notes | ||||||||||
| 8.50% | 04/15/11 | B1 | 50 | 54,437 | ||||||
Edison Mission Energy, Sr. Notes | ||||||||||
| 7.73% | 06/15/09 | B1 | 50 | 51,625 | ||||||
Empresa Nacional de Electricidad SA, Notes (Chile)(l) | ||||||||||
| 8.625% | 08/01/15 | Ba1 | 55 | 64,404 | ||||||
Empresa Nacional de Electricidad SA, Unsub. Notes (Chile)(l) | ||||||||||
| 8.35% | 08/01/13 | Ba1 | 110 | 125,281 | ||||||
| Interest Rate | Maturity Date | Moody’s Ratings (Unaudited) | Principal Amount (000) | Value (Note 2) | |||||||
| Electric (cont’d.) | |||||||||||
| Homer City Funding LLC, Gtd. Notes | |||||||||||
| 8.137% | 10/01/19 | Ba2 | $ | 47 | $ | 51,700 | |||||
| Inergy LP Inergy Finance Corp., Sr. Notes | |||||||||||
| 6.875% | 12/15/14 | B1 | 50 | 45,500 | |||||||
| Midland Funding II, Bonds | |||||||||||
| 13.25% | 07/23/06 | B3 | 129 | 133,817 | |||||||
| Midwest Generation LLC, Pass-Through Certificates, Series A | |||||||||||
| 8.30% | 07/02/09 | B1 | 35 | 36,487 | |||||||
| 8.56% | 01/02/16 | B1 | 80 | 87,460 | |||||||
| Midwest Generation LLC, Sec’d. Notes | |||||||||||
| 8.75% | 05/01/34 | B1 | 75 | 82,594 | |||||||
| Nevada Power Co., Notes | |||||||||||
| 10.875% | 10/15/09 | Ba1 | 3 | 3,278 | |||||||
| Nevada Power, Ref. Mtge. Bonds | |||||||||||
| 6.50% | 04/15/12 | Ba1 | 50 | 51,250 | |||||||
| Sierra Pacific Resources, Sr. Notes | |||||||||||
| 8.625% | 03/15/14 | B1 | 40 | 43,280 | |||||||
| Texas Genco LLC, Sr. Notes | |||||||||||
| 6.875% | 12/15/14 | B1 | 100 | 108,250 | |||||||
| Utilicorp Canada Finance Corp., Gtd. Notes (Canada)(l) | |||||||||||
| 7.75% | 06/15/11 | B2 | 40 | 40,900 | |||||||
| 1,539,005 | |||||||||||
| Electric Utilities — 0.2% | |||||||||||
| PPL Capital Fund Trust I, Sub. Notes | |||||||||||
| 7.29% | 05/18/06 | Ba1 | 275 | 276,669 | |||||||
| TXU Energy Co. LLC, Sr. Notes | |||||||||||
| 4.92% | (c) | 01/17/06 | Baa2 | 50 | 49,998 | ||||||
| 326,667 | |||||||||||
| Energy — Other — 0.5% | |||||||||||
| Chesapeake Energy Corp., Sr. Notes | |||||||||||
| 6.375% | 06/15/15 | Ba2 | 200 | 200,000 | |||||||
| Encore Acquisition Corp., Sr. Notes | |||||||||||
| 6.25% | 04/15/14 | B2 | 25 | 23,750 | |||||||
| Houston Exploration Co., Sr. Sub. Notes | |||||||||||
| 7.00% | 06/15/13 | B2 | 25 | 24,000 | |||||||
| Magnum Hunter Resources, Inc., Gtd. Notes | |||||||||||
| 9.60% | 03/15/12 | Ba3 | 10 | 10,850 | |||||||
| Newfield Exploration Co., Sr. Sub. Notes | |||||||||||
| 8.375% | 08/15/12 | Ba3 | 50 | 53,500 | |||||||
| Parker Drilling Co., Sr. Notes | |||||||||||
| 9.625% | 10/01/13 | B2 | 175 | 195,344 | |||||||
| Premcor Refining Group, Inc., Gtd. Notes | |||||||||||
| 9.50% | 02/01/13 | Baa3 | 100 | 111,465 | |||||||
| 6.75% | 05/01/14 | Baa3 | 20 | 21,008 | |||||||
| Pride International, Inc., Sr. Notes | |||||||||||
| 7.375% | 07/15/14 | Ba2 | 25 | 26,812 | |||||||
| Vintage Petroleum, Inc., Sr. Notes | |||||||||||
| 8.25% | 05/01/12 | Ba3 | 50 | 53,625 | |||||||
| Vintage Petroleum, Inc., Sr. Sub. Notes | |||||||||||
| 7.875% | 05/15/11 | B1 | 50 | 52,250 | |||||||
| 772,604 | |||||||||||
| Finance | |||||||||||
| Compton Petroleum Corp., Gtd. Notes | |||||||||||
| 7.625% | 12/01/13 | B2 | 25 | 25,563 | |||||||
| Financial Services | |||||||||||
| European Investment Bank, Notes (Japan) | |||||||||||
| 3.00% | 09/20/06 | Aaa | JPY 2,000 | 17,304 | |||||||
SEE NOTES TO FINANCIAL STATEMENTS.
B7
| DIVERSIFIED CONSERVATIVE GROWTH PORTFOLIO (Continued) |
SCHEDULE OF INVESTMENTS | December 31, 2005 |
Interest | Maturity Date | Moody’s Ratings (Unaudited) | Principal Amount (000) | Value (Note 2) | |||||
Foods — 0.4% | |||||||||
Agrilink Foods, Inc., Gtd. Notes 144A | |||||||||
| 11.875% | 11/01/08 | B3 | $ 25 | $ | 25,500 | ||||
Ahold Finance USA, Inc., Sr. Notes | |||||||||
| 8.25% | 07/15/10 | Ba2 | 25 | 27,031 | |||||
Carrols Corp., Sr. Sub. Notes | |||||||||
| 9.00% | 01/15/13 | B3 | 50 | 48,625 | |||||
Del Monte Corp., Sr. Sub Notes | |||||||||
| 8.625% | 12/15/12 | B2 | 100 | 106,250 | |||||
Delhaize America, Inc., Gtd. Notes | |||||||||
| 8.125% | 04/15/11 | Ba1 | 80 | 87,205 | |||||
Dole Foods Co. Inc., Gtd. Notes | |||||||||
| 7.25% | 06/15/10 | B2 | 35 | 33,950 | |||||
Dole Foods Co., Inc., Sr. Notes | |||||||||
| 8.625% | 05/01/09 | B2 | 38 | 38,950 | |||||
| 8.875% | 03/15/11 | B2 | 18 | 18,450 | |||||
Dominos, Inc., Sr. Sub. Notes | |||||||||
| 8.25% | 07/01/11 | B2 | 18 | 18,810 | |||||
National Beef Packaging Co., LLC Sr. Notes | |||||||||
| 10.50% | 08/01/11 | B3 | 25 | 25,875 | |||||
Pathmark Stores, Inc., Gtd. Notes | |||||||||
| 8.75% | 02/01/12 | Caa2 | 50 | 46,688 | |||||
Smithfield Foods, Inc., Sr. Notes | |||||||||
| 7.00% | 08/01/11 | Ba2 | 50 | 51,000 | |||||
| 8.00% | 10/15/09 | Ba2 | 70 | 73,850 | |||||
Stater Brothers Holdings, Inc., Sr. Notes | |||||||||
| 8.125% | 06/15/12 | B1 | 25 | 24,750 | |||||
| 626,934 | |||||||||
Furniture | |||||||||
ALH Finance LLC, Sr. Sub. Notes | |||||||||
| 8.50% | 01/15/13 | B3 | 30 | 28,275 | |||||
Gaming — 1.0% | |||||||||
Aztar Corp., Sr. Sub. Notes | |||||||||
| 7.875% | 06/15/14 | Ba3 | 70 | 73,325 | |||||
Boyd Gaming Corp., Sr. Sub. Notes | |||||||||
| 8.75% | 04/15/12 | B1 | 90 | 96,525 | |||||
Caesars Entertainment, Inc., Sr. Sub. Notes | |||||||||
| 8.875% | 09/15/08 | Ba1 | 40 | 43,250 | |||||
Gaylord Entertainment Co., Sr. Notes | |||||||||
| 8.00% | 11/15/13 | B3 | 25 | 26,187 | |||||
Kerzner International Ltd., Sr. Sub. Notes (Bahamas)(l) | |||||||||
| 6.75% | 10/01/15 | B2 | 100 | 97,250 | |||||
MGM Mirage, Inc., Gtd. Notes | |||||||||
| 9.75% | 06/01/07 | Ba3 | 105 | 110,644 | |||||
| 6.625% | 07/15/15 | Ba2 | 275 | 274,312 | |||||
| 6.00% | 10/01/09 | Ba2 | 205 | 203,719 | |||||
Mohegan Tribal Gaming Authority, Sr. Sub. Notes | |||||||||
| 8.00% | 04/01/12 | Ba3 | 70 | 73,675 | |||||
| 6.375% | 07/15/09 | Ba3 | 50 | 50,312 | |||||
Park Place Entertainment Corp., Sr. Sub. Notes | |||||||||
| 9.375% | 02/15/07 | Ba1 | 45 | 46,856 | |||||
Park Place Entertainment Corp., Sr. Sub. Notes | |||||||||
| 8.125% | 05/15/11 | Ba1 | 25 | 27,594 | |||||
Penn National Gaming, Inc., Sr. Sub. Notes | |||||||||
| 6.75% | 03/01/15 | B3 | 25 | 24,563 | |||||
Station Casinos, Inc., Sr. Notes | |||||||||
| 6.00% | 04/01/12 | Ba2 | 75 | 74,812 | |||||
Interest | Maturity Date | Moody’s Ratings (Unaudited) | Principal Amount (000) | Value (Note 2) | ||||||
Gaming (cont’d.) | ||||||||||
Station Casinos, Inc., Sr. Sub. Notes | ||||||||||
| 6.875% | 03/01/16 | Ba3 | $ | 25 | $ | 25,563 | ||||
Trump Entertainment Resorts, Inc., Sec’d. Notes | ||||||||||
| 8.50% | 06/01/15 | Caa1 | 90 | 87,750 | ||||||
Wynn Las Vegas LLC, First Mortgage | ||||||||||
| 6.625% | 12/01/14 | B2 | 110 | 106,975 | ||||||
| 1,443,312 | ||||||||||
Health Care & Pharmaceutical — 1.6% | ||||||||||
Accellant, Inc., Gtd. Notes | ||||||||||
| 10.50% | 12/01/13 | Caa1 | 225 | 230,625 | ||||||
Alliance Imaging, Inc., Sr. Sub. Notes | ||||||||||
| 7.25% | 12/15/12 | B3 | 25 | 20,813 | ||||||
Concentra Operating Corp., Gtd. Notes | ||||||||||
| 9.50% | 08/15/10 | B3 | 50 | 51,750 | ||||||
| 9.125% | 06/01/12 | B3 | 50 | 51,500 | ||||||
Coventry Health Care, Inc., Sr. Notes | ||||||||||
| 8.125% | 02/15/12 | Ba1 | 50 | 53,125 | ||||||
Elan Finance PLC, Sr. Notes | ||||||||||
| 7.75% | 11/15/11 | B3 | 100 | 93,500 | ||||||
Gtd Co. | ||||||||||
| 8.34% | 11/15/11 | B3 | 50 | 47,500 | ||||||
HCA, Inc. Debs. Notes | ||||||||||
| 8.36% | 04/15/24 | Ba2 | 100 | 109,030 | ||||||
HCA, Inc., Notes | ||||||||||
| 9.00% | 12/15/14 | Ba2 | 50 | 58,501 | ||||||
| 5.50% | 12/01/09 | Ba2 | 50 | 49,382 | ||||||
HEALTHSOUTH Corp., Sr. Notes | ||||||||||
| 8.50% | 02/01/08 | NR | 70 | 70,525 | ||||||
| 7.625% | 06/01/12 | NR | 25 | 25,375 | ||||||
Iasis Healthcare LLC, Sr. Sub. Notes | ||||||||||
| 8.75% | 06/15/14 | B3 | 115 | 120,750 | ||||||
Inverness Medical Innovations, Inc., Sr. Sub. Notes | ||||||||||
| 8.75% | 02/15/12 | Caa3 | 60 | 60,900 | ||||||
Medco Health Solutions, Inc., Sr. Notes | ||||||||||
| 7.25% | 08/15/13 | Ba1 | 55 | 60,418 | ||||||
MedQuest, Inc., Gtd. Notes | ||||||||||
| 11.875% | 08/15/12 | Caa1 | 75 | 72,375 | ||||||
Omega Healthcare Investors, Inc., Notes | ||||||||||
| 6.95% | 08/01/07 | B1 | 100 | 102,875 | ||||||
Omnicare, Inc., Sr. Sub Notes | ||||||||||
| 6.875% | 12/15/15 | Ba3 | 150 | 152,250 | ||||||
Res-Care, Inc., Gtd. Notes | ||||||||||
| 7.75% | 10/15/13 | B1 | 100 | 100,000 | ||||||
Select Medical Corp., Gtd. Notes | ||||||||||
| 7.625% | 02/01/15 | B3 | 35 | 33,688 | ||||||
Senior Housing Properties Trust, Sr. Notes | ||||||||||
| 8.625% | 01/15/12 | Ba2 | 50 | 54,750 | ||||||
Skilled Health Care Group., Sr. Sub Notes | ||||||||||
| 11.00% | 01/15/14 | Caa1 | 125 | 126,250 | ||||||
Tenet Healthcare Corp., Sr. Notes 144A | ||||||||||
| 9.25% | 02/01/15 | B3 | 50 | 49,625 | ||||||
Vanguard Health Holdings Co. LLC, Sr. Sub. Notes | ||||||||||
| 9.00% | 10/01/14 | Caa1 | 125 | 132,812 | ||||||
Ventas Realty LP, Sr. Notes | ||||||||||
| 9.00% | 05/01/12 | Ba3 | 85 | 96,900 | ||||||
| 6.625% | 10/15/14 | Ba3 | 75 | 76,687 | ||||||
| 7.125% | 06/01/15 | Ba3 | 75 | 78,750 | ||||||
Warner Chilcott Corp., Gtd. Notes 144A | ||||||||||
| 8.75% | 02/01/15 | Caa1 | 175 | 161,000 | ||||||
| 2,341,656 | ||||||||||
SEE NOTES TO FINANCIAL STATEMENTS.
B8
| DIVERSIFIED CONSERVATIVE GROWTH PORTFOLIO (Continued) |
SCHEDULE OF INVESTMENTS | December 31, 2005 |
Interest | Maturity Date | Moody’s Ratings (Unaudited) | Principal Amount (000) | Value (Note 2) | ||||||
Healthcare Services — 0.2% | ||||||||||
HCA, Inc., Debs. Notes | ||||||||||
| 7.50% | 11/06/33 | Ba2 | $ | 75 | $ | 77,439 | ||||
| 7.125% | 06/01/06 | Ba2 | 100 | 100,820 | ||||||
| 6.75% | 07/15/13 | Ba2 | 50 | 51,554 | ||||||
| 229,813 | ||||||||||
Household Durables — 0.1% | ||||||||||
Standard-Pacific Corp., Sr. Notes | ||||||||||
| 6.50% | 08/15/10 | Ba2 | 125 | 119,219 | ||||||
Industrial Conglomerates — 0.4% | ||||||||||
General Electric Capital Corp., | ||||||||||
| 1.40% | 11/02/06 | Aaa | JPY 74,000 | 634,214 | ||||||
Leisure Equipment & Products | ||||||||||
K2, Inc., Sr. Notes | ||||||||||
| 7.375% | 07/01/14 | Ba3 | 30 | 29,850 | ||||||
Lodging — 0.5% | ||||||||||
Felcor Suites LP, Gtd. Notes | ||||||||||
| 7.625% | 10/01/07 | B1 | 75 | 76,687 | ||||||
HMH Properties, Inc., Gtd. Notes, Series B | ||||||||||
| 7.875% | 08/01/08 | Ba3 | 12 | 12,135 | ||||||
Host Marriott LP, Sr. Notes | ||||||||||
| 7.00% | 08/15/12 | Ba3 | 100 | 102,500 | ||||||
| 7.125% | 11/01/13 | Ba3 | 85 | 88,400 | ||||||
ITT Corp., Debs. Notes | ||||||||||
| 7.375% | 11/15/15 | Ba1 | 85 | 92,225 | ||||||
La Quinta Properties, Inc., Sr. Notes | ||||||||||
| 8.875% | 03/15/11 | Ba3 | 125 | 135,781 | ||||||
Royal Caribbean Cruises Ltd., Deb. Notes (Liberia)(l) | ||||||||||
| 7.25% | 03/15/18 | Ba1 | 45 | 48,375 | ||||||
Royal Caribbean Cruises Ltd., Sr. Notes | ||||||||||
| 8.00% | 05/15/10 | Ba1 | 50 | 54,306 | ||||||
| 6.875% | 12/01/13 | Ba1 | 10 | 10,591 | ||||||
Starwood Hotels & Resorts Worldwide, Inc., Gtd. Notes | ||||||||||
| 7.875% | 05/01/12 | Ba1 | 55 | 60,638 | ||||||
| 7.375% | 05/01/07 | Ba1 | 120 | 122,400 | ||||||
| 804,038 | ||||||||||
Machinery — 0.1% | ||||||||||
Terex Corp., Gtd. Notes | ||||||||||
| 10.375% | 04/01/11 | Caa1 | 155 | 164,300 | ||||||
Manufacturing — 0.2% | ||||||||||
Blount, Inc., Sr. Sub. Notes | ||||||||||
| 8.875% | 08/01/12 | B3 | 200 | 211,000 | ||||||
Invensys PLC, Sr. Notes 144A (United Kingdom)(l) | ||||||||||
| 9.875% | 03/15/11 | B3 | 40 | 39,600 | ||||||
| 250,600 | ||||||||||
Media & Entertainment — 1.6% | ||||||||||
AMC Entertainment, Inc., Gtd. Notes | ||||||||||
| 8.625% | 08/15/12 | B2 | 75 | 78,375 | ||||||
AMC Entertainment, Inc., Sr. Sub. Notes | ||||||||||
| 8.00% | 03/01/14 | B3 | 35 | 31,675 | ||||||
CCH I LLC, Sec`d. Notes 144A | ||||||||||
| 11.00% | 10/01/15 | Caa3 | 188 | 157,999 | ||||||
Dex Media East LLC, Gtd. Notes | ||||||||||
| 12.125% | 11/15/12 | B2 | 151 | 176,670 | ||||||
Interest | Maturity Date | Moody’s Ratings (Unaudited) | Principal Amount (000) | Value (Note 2) | ||||||
Media & Entertainment (cont’d.) | ||||||||||
Dex Media West LLC, Sr. Sub. Notes | ||||||||||
| 9.875% | 08/15/13 | B2 | $ | 159 | $ | 176,490 | ||||
Dex Media, Inc., Notes | ||||||||||
| 8.00% | 11/15/13 | B3 | 70 | 71,400 | ||||||
DirecTV Holdings LLC, Gtd. Notes | ||||||||||
| 6.375% | 06/15/15 | Ba2 | 102 | 99,705 | ||||||
Echostar DBS Corp., Gtd. Notes | ||||||||||
| 6.625% | 10/01/14 | Ba3 | 75 | 71,906 | ||||||
Gray Television, Inc., Gtd. Notes | ||||||||||
| 9.25% | 12/15/11 | Ba3 | 125 | 133,437 | ||||||
Greektown Holdings LLC., Sr, Notes | ||||||||||
| 10.75% | 12/01/13 | B3 | 50 | 49,625 | ||||||
Harrah’s Operating Co., Inc., Bonds | ||||||||||
| 5.625% | 06/01/15 | Baa3 | 500 | 491,211 | ||||||
Intrawest Corp., Sr. Notes (Canada)(l) | ||||||||||
| 7.50% | 10/15/13 | B1 | 75 | 75,937 | ||||||
LCE Acquisition, Gtd., Notes | ||||||||||
| 9.00% | 08/01/14 | B3 | 25 | 25,250 | ||||||
Medianews Group, Inc., Sr. Sub. Notes | ||||||||||
| 6.875% | 10/01/13 | B2 | 75 | 71,719 | ||||||
Morris Publishing Group LLC, Co., Gtd. Notes | ||||||||||
| 7.00% | 08/01/13 | Ba3 | 25 | 23,594 | ||||||
Primedia, Inc., Sr. Notes | ||||||||||
| 9.715% | 05/15/10 | B2 | 75 | 72,094 | ||||||
R.H. Donnelley Finance Corp., Sr. Sub. Notes | ||||||||||
| 10.875% | 12/15/12 | B2 | 150 | 169,125 | ||||||
Six Flags Inc., Sr. Notes | ||||||||||
| 9.625% | 06/01/14 | Caa1 | 35 | 34,038 | ||||||
Sun Media Corp., Gtd. Notes (Canada)(l) | ||||||||||
| 7.625% | 02/15/13 | Ba3 | 175 | 179,375 | ||||||
Universal City Florida, Holding Co., Sr. Notes | ||||||||||
| 8.375% | 05/01/10 | B3 | 75 | 73,312 | ||||||
Vail Resorts, Inc., Sr. Sub Notes | ||||||||||
| 6.75% | 02/15/14 | B2 | 60 | 60,000 | ||||||
Vertis, Inc., Sec’d. Notes | ||||||||||
| 9.75% | 04/01/09 | B3 | 105 | 108,806 | ||||||
| 2,431,743 | ||||||||||
Media – Cable — 0.1% | ||||||||||
Kabel Deutschland GmbH, Sr. Notes (Germany)(l) | ||||||||||
| 10.625% | 07/01/14 | B2 | 75 | 78,938 | ||||||
Metals — 0.6% | ||||||||||
AK Steel Corp., Gtd. Notes | ||||||||||
| 7.75% | 06/15/12 | B1 | 50 | 45,125 | ||||||
Arch Western Finance LLC, Sr. Notes | ||||||||||
| 6.75% | 07/01/13 | Ba3 | 125 | 127,344 | ||||||
Century Aluminum Co., Sr. Notes 144A | ||||||||||
| 7.50% | 08/15/14 | B1 | 75 | 73,875 | ||||||
Chaparral Steel Co. Gtd. Notes | ||||||||||
| 10.00% | 07/15/13 | B1 | 90 | 96,975 | ||||||
CSN Islands VII Corp., Gtd. Notes 144A | ||||||||||
| 10.75% | 09/12/08 | BB-(d) | 80 | 88,500 | ||||||
Foundation PA Coal Co., Sr. Notes | ||||||||||
| 7.25% | 08/01/14 | B1 | 75 | 77,531 | ||||||
Ispat Inland ULC, Sec’d. Notes (Canada)(l) | ||||||||||
| 9.75% | 04/01/14 | Ba1 | 64 | 72,480 | ||||||
SEE NOTES TO FINANCIAL STATEMENTS.
B9
| DIVERSIFIED CONSERVATIVE GROWTH PORTFOLIO (Continued) |
SCHEDULE OF INVESTMENTS | December 31, 2005 |
Interest | Maturity Date | Moody’s Ratings (Unaudited) | Principal Amount (000) | Value (Note 2) | ||||||
Metals (cont’d.) | ||||||||||
Metals USA, Inc., Sec’d. Notes | ||||||||||
| 11.125% | 12/01/15 | B3 | $ | 75 | $ | 76,875 | ||||
Oregon Steel Mills, Inc., Gtd. Notes | ||||||||||
| 10.00% | 07/15/09 | Ba3 | 145 | 155,150 | ||||||
Ryerson Tull, Inc., Sr. Notes | ||||||||||
| 8.25% | 12/15/11 | B2 | 45 | 43,762 | ||||||
United States Steel LLC, Sr. Notes | ||||||||||
| 10.75% | 08/01/08 | Ba2 | 50 | 55,250 | ||||||
| 9.75% | 05/15/10 | Ba2 | 50 | 54,375 | ||||||
| 967,242 | ||||||||||
Metals & Mining — 0.1% | ||||||||||
Novelis, Inc., Sr. Notes (Canada)(l) | ||||||||||
| 7.50% | 02/15/15 | B1 | 120 | 111,900 | ||||||
Oil & Gas Exploration/Production — 0.4% | ||||||||||
Pemex Project Funding Master Trust, Gtd. Notes | ||||||||||
| 8.625% | 02/01/22 | Baa1 | 250 | 308,125 | ||||||
| 9.50% | 03/30/18 | Baa1 | 250 | 317,750 | ||||||
| 625,875 | ||||||||||
Oil, Gas & Consumable Fuels — 0.1% | ||||||||||
Forest Oil Corp., Sr. Notes | ||||||||||
| 8.00% | 06/15/08 | Ba3 | 40 | 41,700 | ||||||
Pioneer Natural Resources Co., Sr. Notes | ||||||||||
| 5.875% | 07/15/16 | Baa3 | 100 | 99,032 | ||||||
Pogo Producing Co., Sr. Sub. Notes | ||||||||||
| 6.875% | 10/01/17 | Ba3 | 25 | 24,375 | ||||||
| 165,107 | ||||||||||
Packaging — 0.3% | ||||||||||
Graham Packaging Co., Gtd. Notes | ||||||||||
| 8.50% | 10/15/12 | Caa1 | 25 | 24,625 | ||||||
Graham Packaging Co., Sub. Notes 144A | ||||||||||
| 9.875% | 10/15/14 | Caa2 | 100 | 97,500 | ||||||
Owens Brockway Glass Container, Inc., Sec`d. Notes | ||||||||||
| 8.75% | 11/15/12 | B1 | 240 | 258,000 | ||||||
| 380,125 | ||||||||||
Paper — 0.4% | ||||||||||
Abitibi-Consolidated, Inc., Notes (Canada)(l) | ||||||||||
| 5.25% | 06/20/08 | Ba3 | 50 | 47,500 | ||||||
Ainsworth Lumber Co. Ltd., Sr. Notes | ||||||||||
| 6.75% | 03/15/14 | B2 | 25 | 21,438 | ||||||
| 7.25% | 10/01/12 | B2 | 10 | 9,000 | ||||||
Caraustar Industries, Inc., Sr. Sub. Notes | ||||||||||
| 9.875% | 04/01/11 | Caa1 | 25 | 25,500 | ||||||
Cascades, Inc., Sr. Notes (Canada)(l) | ||||||||||
| 7.25% | 02/15/13 | Ba3 | 95 | 86,450 | ||||||
Cellu Tissue Holdings, Inc., Sec’d. Notes | ||||||||||
| 9.75% | 03/15/10 | B2 | 125 | 123,750 | ||||||
Georgia-Pacific Corp., Notes | ||||||||||
| 7.50% | 05/15/06 | Ba2 | 75 | 75,469 | ||||||
| 8.875% | 05/15/31 | Ba2 | 25 | 25,062 | ||||||
| 8.125% | 05/15/11 | Ba2 | 30 | 30,037 | ||||||
Millar Western Forest Products Ltd, Sr. Notes (Canada)(l) | ||||||||||
| 7.75% | 11/15/13 | B2 | 65 | 48,425 | ||||||
Tembec Industries, Inc., Gtd. Notes (Canada)(l) | ||||||||||
| 7.75% | 03/15/12 | B3 | 95 | 50,825 | ||||||
| 543,456 | ||||||||||
Interest | Maturity Date | Moody’s Ratings (Unaudited) | Principal Amount (000) | Value (Note 2) | ||||||
Paper & Forest Products — 0.1% | ||||||||||
Abitibi-Consolidated Inc (Canada)(l) | ||||||||||
| 8.375% | 04/01/15 | Ba3 | $ | 125 | $ | 119,688 | ||||
Pipelines & Other — 1.3% | ||||||||||
Dynegy Holdings, Inc., Sec’d. Notes | ||||||||||
| 9.875% | 07/15/10 | B1 | 50 | 54,812 | ||||||
| 10.125% | 07/15/13 | B1 | 130 | 146,900 | ||||||
El Paso Corp., Sr. Notes | ||||||||||
| 7.00% | 05/15/11 | Caa1 | 465 | 461,512 | ||||||
| 7.80% | 08/01/31 | Caa1 | 100 | 99,750 | ||||||
El Paso Production Holding Co., Gtd. Notes | ||||||||||
| 7.75% | 06/01/13 | B3 | 150 | 155,625 | ||||||
Pacific Energy Partners LP, Sr. Notes | ||||||||||
| 7.125% | 06/15/14 | Ba2 | 25 | 25,750 | ||||||
Targa Resources, Inc., Gtd. Notes | ||||||||||
| 8.50% | 11/01/13 | B2 | 125 | 128,125 | ||||||
Tennessee Gas Pipeline Co., Debs. Notes | ||||||||||
| 7.00% | 03/15/27-10/15/28 | B1 | 140 | 140,854 | ||||||
| 7.625% | 04/01/37 | B1 | 145 | 152,670 | ||||||
Transmontaigne, Inc., Sr. Sub. Notes | ||||||||||
| 9.125% | 06/01/10 | B3 | 35 | 34,388 | ||||||
Williams Cos., Inc., Notes | ||||||||||
| 7.125% | 09/01/11 | B1 | 225 | 233,719 | ||||||
| 8.125% | 03/15/12 | B1 | 40 | 43,600 | ||||||
| 6.375% | 10/01/10 | B1 | 350 | 349,562 | ||||||
| 2,027,267 | ||||||||||
Real Estate Investment Trust — 0.2% | ||||||||||
Felcor Lodging LP, Gtd. Notes | ||||||||||
| 9.00% | 06/01/11 | B1 | 50 | 54,750 | ||||||
Felcor Lodging LP, Sr. Notes | ||||||||||
| 8.83% | 06/01/11 | B1 | 50 | 52,000 | ||||||
Host Marriott LP, Gtd. Notes | ||||||||||
| 9.50% | 01/15/07 | Ba3 | 150 | 155,250 | ||||||
Senior Housing Properties Trust, Sr. Notes | ||||||||||
| 7.875% | 04/15/15 | Ba2 | 50 | 52,250 | ||||||
| 314,250 | ||||||||||
Retail & Merchandising — 0.4% | ||||||||||
Asbury Automotive Group Inc., Sr. Sub. Notes | ||||||||||
| 8.00% | 03/15/14 | B3 | 25 | 23,875 | ||||||
GSC Holdings Corp., Gtd. Notes 144A | ||||||||||
| 8.00% | 10/01/12 | Ba3 | 50 | 47,000 | ||||||
JC Penney CO Inc., Debs. Notes | ||||||||||
| 7.40% | 04/01/37 | Ba1 | 135 | 150,824 | ||||||
Neiman Marcus Group, Inc., Gtd. Notes | ||||||||||
| 10.375% | 10/15/15 | B3 | 75 | 76,219 | ||||||
Pantry, Inc., (The) Sr. Sub. Notes | ||||||||||
| 7.75% | 02/15/14 | B3 | 85 | 85,000 | ||||||
Rite Aid Corp., Gtd. Notes | ||||||||||
| 7.50% | 01/15/15 | B2 | 100 | 94,500 | ||||||
Rite Aid Corp., Sec’d. Notes | ||||||||||
| 8.125% | 05/01/10 | B2 | 25 | 25,437 | ||||||
Sonic Automotive Inc., Sr. Sub. Notes | ||||||||||
| 8.625% | 08/15/13 | B2 | 40 | 38,700 | ||||||
| 541,555 | ||||||||||
SEE NOTES TO FINANCIAL STATEMENTS.
B10
| DIVERSIFIED CONSERVATIVE GROWTH PORTFOLIO (Continued) |
SCHEDULE OF INVESTMENTS | December 31, 2005 |
Interest | Maturity Date | Moody’s Ratings (Unaudited) | Principal Amount (000) | Value (Note 2) | ||||||
Semiconductors & Semiconductor Equipment — 0.1% | ||||||||||
Avago Technologies Financial, Sr. Notes | ||||||||||
| 10.125% | 12/01/13 | B | $ | 95 | $ | 97,613 | ||||
Avago Technologies Financial, Sr. Sub. Notes (Singapore)(l) | ||||||||||
| 11.875% | 12/01/15 | Caa2 | 100 | 100,750 | ||||||
| 198,363 | ||||||||||
Technology — 0.4% | ||||||||||
Amkor Technology, Inc., Sr. Notes | ||||||||||
| 7.125% | 03/15/11 | Caa1 | 25 | 22,000 | ||||||
Flextronics International, Ltd. Sr. Sub. Notes | ||||||||||
| 6.50% | 05/15/13 | Ba2 | 15 | 15,244 | ||||||
| 6.25% | 11/15/14 | Ba2 | 150 | 147,937 | ||||||
Freescale Semiconductor, Inc., Sr. Notes | ||||||||||
Sr. Notes | ||||||||||
| 6.875% | 07/15/11 | Ba2 | 100 | 105,000 | ||||||
| 7.125% | 07/15/14 | Ba2 | 50 | 53,250 | ||||||
Sanmina — SCI Corp., Gtd. Notes Gtd. | ||||||||||
| 10.375% | 01/15/10 | Ba2 | 125 | 138,125 | ||||||
| 6.75% | 03/01/13 | B1 | 15 | 14,269 | ||||||
UGS Corp., Sr. Sub. Notes | ||||||||||
| 10.00% | 06/01/12 | B3 | 50 | 54,500 | ||||||
| 550,325 | ||||||||||
Telecommunications — 1.4% | ||||||||||
Alamosa Delaware, Inc., Sr. Notes | ||||||||||
| 11.00% | 07/31/10 | Caa1 | 50 | 56,375 | ||||||
| 8.50% | 01/31/12 | Caa1 | 25 | 27,031 | ||||||
AT&T Corp., Sr. Notes | ||||||||||
| 9.05% | 11/15/11 | Ba1 | 85 | 94,080 | ||||||
Centennial Communications Corp., Sr. Notes | ||||||||||
| 8.125% | 02/01/14 | B3 | 25 | 25,375 | ||||||
Cincinnati Bell, Inc., Sr. Sub. Notes | ||||||||||
| 8.375% | 01/15/14 | B3 | 45 | 44,269 | ||||||
Citizens Communications Co., Sr. Notes | ||||||||||
| 9.25% | 05/15/11 | Ba3 | 105 | 115,762 | ||||||
| 6.25% | 01/15/13 | Ba3 | 40 | 38,700 | ||||||
Dobson Cellular Systems, Sec’d. Notes | ||||||||||
| 8.375% | 11/01/11 | B1 | 50 | 53,062 | ||||||
| 9.00% | 11/01/11 | B1 | 25 | 26,000 | ||||||
Dobson Communications Corp., Sr. Notes | ||||||||||
| 8.10% | 10/15/12 | Caa2 | 10 | 9,950 | ||||||
Eircom Funding, Gtd. Notes (Ireland)(l) | ||||||||||
| 8.25% | 08/15/13 | B1 | 40 | 42,800 | ||||||
Hawaiian Telcom Communications, Inc., Sr. Notes | ||||||||||
| 9.75% | 05/01/13 | B3 | 25 | 24,438 | ||||||
Hawaiian Telcom Communications, Inc., Sr. Sub. Notes | ||||||||||
| 12.50% | 05/01/15 | Caa1 | 65 | 60,775 | ||||||
Intelsat Bermuda Ltd., Sr. Notes 144A (Bermuda)(l) | ||||||||||
| 8.25% | 01/15/13 | B2 | 140 | 141,400 | ||||||
MCI Inc., Sr. Notes | ||||||||||
| 8.735% | 05/01/14 | B2 | 55 | 60,844 | ||||||
MCI, Inc., Sr. Notes | ||||||||||
| 7.688% | 05/01/09 | B2 | 225 | 232,312 | ||||||
New Skies Satellites, Sr. Notes | ||||||||||
| 9.573% | 11/01/11 | B3 | 25 | 26,000 | ||||||
| 9.125% | 11/01/12 | Caa1 | 25 | 26,719 | ||||||
Interest | Maturity Date | Moody’s Ratings (Unaudited) | Principal Amount (000) | Value (Note 2) | |||||
Telecommunications (cont’d.) | |||||||||
Nortel Networks Corp., Gtd. Notes (Canada)(l) | |||||||||
| 4.25% | 09/01/08 | B3 | $ 25 | $ | 23,438 | ||||
Nortel Networks Ltd., Notes (Canada)(l) | |||||||||
| 6.125% | 02/15/06 | B3 (d) | 80 | 80,000 | |||||
Qwest Communications International. Inc., | |||||||||
| 7.50% | 02/15/14 | B2 | 50 | 51,375 | |||||
Qwest Corp., Sr. Notes | |||||||||
Sr. Notes | |||||||||
| 7.625% | 06/15/15 | Ba3 | 500 | 535,000 | |||||
| 7.875% | 09/01/11 | Ba3 | 150 | 161,625 | |||||
Rogers Wireless, Inc., Sec’d. Notes (Canada)(l) | |||||||||
| 9.625% | 05/01/11 | Ba3 | 95 | 109,250 | |||||
UbiquiTel Operating Co., Sr. Notes | |||||||||
| 9.875% | 03/01/11 | Caa1 | 75 | 83,062 | |||||
US Unwired, Inc., Sec’d. Notes | |||||||||
| 8.12% | 06/15/10 | B2 | 25 | 25,688 | |||||
| 2,175,330 | |||||||||
Tobacco | |||||||||
RJ Reynolds Tobacco Holdings, Inc., Notes | |||||||||
| 6.50% | 07/15/10 | Ba2 | 25 | 24,875 | |||||
Utilities — 0.4% | |||||||||
Mirant North America LLC, Sr. Notes | |||||||||
| 7.375% | 12/31/13 | B1 | 150 | 151,688 | |||||
NRG Energy, Inc., Gtd. Notes | |||||||||
| 8.00% | 12/15/13 | Ba3 | 126 | 140,490 | |||||
Orion Power Holdings, Inc., Sr. Notes | |||||||||
| 12.00% | 05/01/10 | B2 | 40 | 45,200 | |||||
Reliant Energy, Inc., Sec’d. Notes | |||||||||
| 9.50% | 07/15/13 | B1 | 140 | 140,350 | |||||
TECO Energy, Inc., Notes | |||||||||
| 7.50% | 06/15/10 | Ba2 | 175 | 186,375 | |||||
| 664,103 | |||||||||
TOTAL CORPORATE BONDS | 32,492,697 | ||||||||
FOREIGN GOVERNMENT BONDS — 6.9% | |||||||||
Bank of England/London (United Kingdom) | |||||||||
Zero | 01/12/06 | EUR 100 | 118,325 | ||||||
Federal Republic of Brazil(l) | |||||||||
| 12.00% | 04/15/10 | B1 | 300 | 364,800 | |||||
| 11.00% | 08/17/40 | Ba3 | 200 | 257,800 | |||||
Federal Republic of Italy (Italy) | |||||||||
| 0.375% | 10/10/06 | Aa2 | JPY 3,000 | 25,500 | |||||
French Treasury Note (France) | |||||||||
| 5.00% | 01/12/06 | NR | EUR 5,880 | 6,964,898 | |||||
Petroleum Export Ltd Cayman Spv(l) | |||||||||
| 4.623% | 06/15/10 | Aaa | 100 | 99,015 | |||||
| 4.633% | 06/15/10 | Aaae | 200 | 198,030 | |||||
Republic of Panama (Panama)(l) | |||||||||
| 9.625% | 02/08/11 | Ba1 | 150 | 175,125 | |||||
Russian Government International Bond (Russia)(l) | |||||||||
| 5.00% | 03/31/30 | NR | 450 | 508,005 | |||||
United Kingdom Treasury Stock | |||||||||
| 5.00% | 03/07/12-09/07/14 | Aaa | GBP 800 | 1,461,710 | |||||
United Mexican States (Mexico)(l) | |||||||||
| 8.125% | 12/30/19 | Baa1 | 170 | 208,675 | |||||
TOTAL FOREIGN GOVERNMENT BONDS | 10,381,883 | ||||||||
SEE NOTES TO FINANCIAL STATEMENTS.
B11
| DIVERSIFIED CONSERVATIVE GROWTH PORTFOLIO (Continued) |
SCHEDULE OF INVESTMENTS | December 31, 2005 |
Interest | Maturity Date | Moody’s Ratings (Unaudited) | Principal Amount (000) | Value (Note 2) | |||||
U.S. TREASURY OBLIGATIONS — 6.8% | |||||||||
U.S. Treasury Bonds | |||||||||
| 9.00% | 11/15/18 | $ 425 | $ | 607,617 | |||||
| 7.875% | 02/15/21 | 1,000 | 1,353,359 | ||||||
| 8.875% | 02/15/19 | 200 | 284,406 | ||||||
| 3.125% | 01/31/07 | 100 | 98,602 | ||||||
| 3.375% | 02/15/08 | 200 | 195,883 | ||||||
| 4.00% | 04/15/10 | 600 | 591,281 | ||||||
| 3.875% | 05/15/10 | 200 | 196,211 | ||||||
U.S. Treasury Notes | |||||||||
| 3.50% | 02/15/10 | 1,400 | 1,354,173 | ||||||
| 3.75% | 03/31/07-08/15/14 | 700 | 694,039 | ||||||
| 4.25% | 11/15/14 | 4,800 | 4,744,615 | ||||||
| 3.625% | 01/15/10 | 200 | 194,516 | ||||||
TOTAL U.S. TREASURY OBLIGATIONS | 10,314,702 | ||||||||
COLLATERALIZED MORTGAGE OBLIGATIONS — 2.7% | |||||||||
Bear Stearns Adjustable Rate Mortgage Trust, Series 2005-4, Class 23A2 | |||||||||
| 5.426% | 05/25/35 | Aaa | 247 | 246,353 | |||||
Commercial Mortgage Pass Through Certificates, Series 2005-F10A Class Moa1 | |||||||||
| 4.30% | 03/15/20 | Aaa | 600 | 599,923 | |||||
Federal National Mortgage Assoc., Series 2005-73, Class A1A | |||||||||
| 4.419% | 07/25/35 | NR | 193 | 193,505 | |||||
FHLMC Structured Pass Through Securities, Series T-61, Class 1A1 | |||||||||
| 4.563% | 07/25/44 | NR | 1,220 | 1,238,000 | |||||
Government National Mortgage Association | |||||||||
| 7.50% | 02/20/30 | Aaa | 395 | 402,528 | |||||
Structured Asset Mortgage Investments, Inc., Series 2005-Ar8, Class A1 | |||||||||
| 1.00% | 05/25/35 | NR | GBP 600 | 600,376 | |||||
Washington Mutual, Inc., Series 2003-R1, | |||||||||
| 4.461% | 12/25/27 | Aaa | 892 | 891,321 | |||||
TOTAL COLLATERALIZED MORTGAGE OBLIGATIONS | 4,172,006 | ||||||||
MUNICIPAL BONDS — 1.5% | |||||||||
City of San Antonio TX | |||||||||
| 5.00% | 05/15/25 | Aaa | 500 | 522,715 | |||||
Golden State Tobacco Securitization Corp., CA | |||||||||
| 6.25% | 06/01/33 | Baa3 | 300 | 326,676 | |||||
Massachusetts Water Resources Authority | |||||||||
| 6.22% | 08/01/32 | Aaa | 125 | 133,197 | |||||
Michigan State Building Authority | |||||||||
| 5.25% | 10/15/11 | Aaa | 400 | 434,924 | |||||
New Jersey Transportation Trust Fund Authority | |||||||||
| 6.14% | 06/15/12 | NR | 300 | 340,314 | |||||
Tobacco Settlement Financing Corp., LA | |||||||||
| 5.875% | 05/15/39 | Baa3 | 290 | 302,563 | |||||
| 6.375% | 06/01/32 | Baa3 | 250 | 274,815 | |||||
TOTAL MUNICIPAL BONDS | 2,335,204 | ||||||||
Interest | Maturity Date | Moody’s Ratings (Unaudited) | Principal Amount (000) | Value (Note 2) | ||||||
U.S. GOVERNMENT AGENCY OBLIGATIONS — 0.3% | ||||||||||
Small Business Administration Participation Certificates, Series 2000-20A, Class 1 | ||||||||||
| 7.59% | 01/01/20 | $ | 232 | $ | 249,323 | |||||
Small Business Administration Participation Certificates, Series 2000-P10A, Class 1 | ||||||||||
| 8.017% | 02/10/10 | 120 | 128,117 | |||||||
TOTAL U.S. GOVERNMENT AGENCY OBLIGATIONS | 377,440 | |||||||||
ASSET-BACKED SECURITIES | ||||||||
Ocwen Mortgage Loan Asset Backed Certificates | ||||||||
| 4.999% | 10/25/29 | NR | 3 | 3,090 | ||||
TOTAL LONG-TERM INVESTMENTS | 157,068,786 | ||||
| Notional/ Contract Amount | Value (Note 2) | ||||
| SHORT-TERM INVESTMENTS — 9.9% | |||||
OUTSTANDING OPTIONS PURCHASED(a) | |||||
Call Options | |||||
Eurodollar Futures, Strike Price $95.25, expiring 03/13/06 | 24 | $ | 3,450 | ||
Eurodollar Futures, Strike Price $95.25, expiring 06/19/06 | 25 | 6,250 | |||
Swap 3 Month LIBOR, Strike Price 4.25%, expiring 10/25/06 | 2,100,000 | 3,240 | |||
Swap 3 Month LIBOR, Strike Price 4.70%, expiring 02/01/06 | 2,300,000 | 193 | |||
Swap 3 Month LIBOR, Strike Price 4.75%, expiring 08/08/06 | 700,000 | 2,605 | |||
Swap 3 Month LIBOR, Strike Price 4.75%, expiring 05/02/06 | 3,000,000 | 6,744 | |||
Swap 3 Month LIBOR, Strike Price 4.75%, expiring 08/07/06 | 2,600,000 | 9,638 | |||
Swap 6 Month LIBOR, Strike Price 4.65%, expiring 06/12/06 | 1,000,000 | 7,926 | |||
Swap option on 3 Month LIBOR, | 1,600,000 | 2,288 | |||
Swap Option on 3 Month LIBOR, expiring 10/18/06 @ 4.50% | 3,500,000 | 9,702 | |||
Swap Option on 3 Month LIBOR, expiring 10/19/06 @ 4.25% | 1,400,000 | 2,088 | |||
| 54,124 | |||||
Put Option | |||||
Eurodollar Futures, Strike Price $94.50, expiring 06/19/06 | 182 | 910 | |||
TOTAL OUTSTANDING OPTIONS PURCHASED | 55,034 | ||||
SEE NOTES TO FINANCIAL STATEMENTS.
B12
| DIVERSIFIED CONSERVATIVE GROWTH PORTFOLIO (Continued) |
SCHEDULE OF INVESTMENTS | December 31, 2005 |
| Interest Rate | Maturity Date | Principal Amount (000) | Value (Note 2) | |||||||
| U.S. TREASURY OBLIGATIONS — 0.2% | ||||||||||
| U.S. Treasury Bills | ||||||||||
| 3.83% | (n) | 03/16/06 | $ 105 | $ | 104,179 | |||||
| 3.842% | (n) | 03/16/06 | 20 | 19,843 | ||||||
| 3.841% | (n) | 03/16/06 | 250 | (k) | 248,045 | |||||
| TOTAL U.S. TREASURY OBLIGATIONS (cost $372,036) | | 372,067 | ||||||||
| COMMERCIAL PAPER — 0.6% | ||||||||||
| General Electric Capital Corp. (cost $898,376) | | |||||||||
| 4.06% | 01/17/06 | 900 | 897,821 | |||||||
| U.S. GOVERNMENT AGENCY OBLIGATIONS — 4.5% | ||||||||||
| Federal Home Loan Bank Disc. Notes | ||||||||||
| 4.31% | 03/22/06 | 1,500 | 1,486,155 | |||||||
| Federal Home Loan Mortgage Corp. Disc. Notes | ||||||||||
| 4.354% | 05/16/06 | 1,100 | 1,082,079 | |||||||
| 3.965% | 03/28/06 | 600 | 594,036 | |||||||
| Federal National Mortgage Assoc. Disc. Notes | ||||||||||
| 4.315% | 03/15/06 | 500 | 495,799 | |||||||
| 4.39% | 05/10/06 | 1,100 | 1,082,888 | |||||||
| 4.24% | 03/15/06 | 500 | 495,799 | |||||||
| 4.32% | 03/22/06 | 1,000 | 990,770 | |||||||
| 4.415% | (n) | 03/29/06 | 600 | 593,965 | ||||||
| TOTAL U.S. GOVERNMENT AGENCY OBLIGATIONS (cost $6,820,589) | | 6,821,491 | ||||||||
| Shares | ||||||||||
| MONEY MARKET MUTUAL FUND — 4.6% | ||||||||||
| Dryden Core Investment Fund — Taxable Money Market Series(w) | | |||||||||
| (cost $6,891,672; Note 4) | 6,891,672 | 6,891,672 | ||||||||
| TOTAL SHORT-TERM INVESTMENTS | ||||||||||
| (cost $15,053,471) | 15,038,084 | |||||||||
| TOTAL INVESTMENTS, BEFORE OUTSTANDING OPTIONS WRITTEN AND INVESTMENTS SOLD SHORT — 113.6% | | |||||||||
| (cost $157,927,482; Note 6) | 172,106,871 | |||||||||
| INVESTMENTS SOLD SHORT — (3.4)% | ||||||||||
| Federal National Mortgage Assoc. | ||||||||||
| 4.00% | 01/18/21 | 600 | (572,813 | ) | ||||||
| U.S. Treasury Notes | ||||||||||
| 3.625% | 05/15/13 | 4,800 | (4,578,187 | ) | ||||||
| TOTAL INVESTMENTS SOLD SHORT (Proceeds received $(5,114,862)) | | (5,151,000 | ) | |||||||
| Notional/ Contract Amount | Value (Note 2) | |||||
| OUTSTANDING OPTIONS WRITTEN(a) | ||||||
Call Options | ||||||
Eurodollar Futures, Strike Price $95.50, expiring 03/10/06 | 24 | $ | (2,160 | ) | ||
Eurodollar Futures, Strike Price $95.50, expiring 06/19/06 | 50 | (2,000 | ) | |||
Swap 3 Month LIBOR & Fixed, Strike Price 4.32%, expiring 10/25/06 | 900,000 | (4,017 | ) | |||
Swap 3 Month LIBOR & Fixed, Strike Price 4.70%, expiring 02/01/06 | 400,000 | (407 | ) | |||
Swap 3 Month LIBOR & Fixed, Strike Price 4.78%, expiring 05/02/06 | 1,300,000 | (8,108 | ) | |||
Swap 3 Month LIBOR & Fixed, Strike Price 4.78%, expiring 08/07/06 | 1,100,000 | (10,429 | ) | |||
Swap 3 Month LIBOR & Fixed, Strike Price 4.78%, expiring 08/08/06 | 300,000 | (2,853 | ) | |||
Swap 6 Month LIBOR & Fixed, Strike Price 4.65%, expiring 06/12/06 | 300,000 | (7,651 | ) | |||
Swap Option 3 Month LIBOR & Fixed, Strike Price 4.30%, expiring 10/12/06 | 700,000 | (2,806 | ) | |||
Swap Option 3 Month LIBOR & Fixed, Strike Price 4.31%, expiring 10/19/06 | 600,000 | (2,545 | ) | |||
Swap Option 3 Month LIBOR & Fixed, Strike Price 4.56%, expiring 10/18/06 | 1,500,000 | (11,223 | ) | |||
TOTAL OUTSTANDING OPTIONS WRITTEN | (54,199 | ) | ||||
TOTAL INVESTMENTS, NET OF | $ | 166,901,672 | ||||
OTHER LIABILITIES IN EXCESS OF | (15,464,770 | ) | ||||
NET ASSETS — 100.0% | $ | 151,436,902 | ||||
SEE NOTES TO FINANCIAL STATEMENTS.
B13
| DIVERSIFIED CONSERVATIVE GROWTH PORTFOLIO (Continued) |
SCHEDULE OF INVESTMENTS | December 31, 2005 |
The following abbreviations are used in portfolio descriptions and footnotes to the schedule of investments:
| 144A | Security was purchased pursuant to Rule 144A under the securities Act of 1933 and may not be resold subject to that rule except to qualified institutional buyers. Unless otherwise noted 144A securities are deemed to be liquid. | |
| ADR | American Depositary Receipt | |
| NR | Not Rated by Moodys or Standard & Poor’s | |
| PIK | Payment-in-kind | |
| EUR | Euro | |
| GBP | British Pound | |
| JPY | Japanese Yen |
| (a) | Non-income producing security. |
| (c) | Indicates a variable rate security. |
| (d) | Standard & Poor’s rating. |
| (i) | Represents issuer in default on interest payments. Non-income producing security. |
| (k) | Securities or a portion thereof with an aggregate market value of $248,045 have been segregated with the custodian to cover margin requirements for futures contracts open at December 31, 2005: |
| Number of Contracts | Type | Expiration Month | Value at Trade Date | Value at December 31, 2005 | Unrealized Appreciation (Depreciation) | |||||||||
| Long Positions: | ||||||||||||||
| 19 | Euro Dollar | Sep 06 | $ | 4,518,150 | $ | 4,520,100 | $ | 1,950 | ||||||
| 33 | Euro Dollar | Dec 06 | 7,856,338 | 7,854,413 | (1,925 | ) | ||||||||
| 32 | Euro Dollar | Jun 06 | 7,608,500 | 7,612,400 | 3,900 | |||||||||
| 7 | Euro Dollar | Mar 07 | 1,665,388 | 1,666,875 | 1,487 | |||||||||
| 15 | Euro Dollar | Mar 06 | 3,572,813 | 3,570,938 | (1,875 | ) | ||||||||
| 110 | U.S. Treasury 5 Year Note | Mar 06 | 11,679,531 | 11,697,813 | 18,282 | |||||||||
| Short Positions: | ||||||||||||||
| 8 | Euro 10 Year Bond | Mar 06 | 1,159,553 | 1,153,965 | (5,588 | ) | ||||||||
| 45 | U.S. Treasury Bond | Mar 06 | 4,955,930 | 4,923,281 | (32,649 | ) | ||||||||
| $ | (16,418 | ) | ||||||||||||
| (l) | US$ Denominated Foreign Bonds. |
| (n) | Rates shown are the effective yield at purchase date. |
| (w) | Prudential Investments LLC, the manager of the Fund also serves as manager of the Dryden Core Investment Fund-Taxable Money Market Series. |
| (v) | The rate shown reflects the coupon rate after the step date. |
| (x) | Other liabilities in excess of other assets includes unrealized appreciation (depreciation) on forward foreign currency exchange contracts and swap contracts as follows: |
Forward foreign currency exchange contracts outstanding at December 31, 2005:
Purchase Contracts
| Settlement Month | Type | Contracts to Receive | In Exchange For | Contracts at Value | Unrealized Appreciation (Depreciation) | |||||||||||
| Jan 06 | Buy | EUR | 341,000 | $ | 400,222 | $ | 404,142 | $ | 3,920 | |||||||
| Jan 06 | Buy | GBP | 135,000 | 238,601 | 232,256 | (6,345 | ) | |||||||||
| $ | 638,823 | $ | 636,398 | $ | (2,425 | ) | ||||||||||
Sale Contracts
| Settlement Month | Type | Contracts to Deliver | In Exchange For | Contracts at Value | Unrealized Appreciation (Depreciation) | |||||||||||
| Jan 06 | Sell | EUR | 5,886,000 | $ | 6,986,867 | $ | 6,968,500 | $ | 18,367 | |||||||
| Feb 06 | Sell | EUR | 340,000 | 405,681 | 403,865 | 1,816 | ||||||||||
| Jan 06 | Sell | GBP | 951,000 | 1,632,499 | 1,636,088 | (3,589 | ) | |||||||||
| $ | 9,025,047 | $ | 9,008,453 | $ | 16,594 | |||||||||||
SEE NOTES TO FINANCIAL STATEMENTS.
B14
| DIVERSIFIED CONSERVATIVE GROWTH PORTFOLIO (Continued) |
SCHEDULE OF INVESTMENTS | December 31, 2005 |
Interest rate swap agreements outstanding at December 31, 2005:
| Counter Party | Termination Date | Notional Amount | Fixed Rate | Floating Rate | Unrealized Appreciation (Depreciation) | |||||||||||
| Barclays Capital PLC(2) | 9/15/2010 | GBP | 200,000 | 5.00 | % | 6 Month LIBOR | $ | 6,553 | ||||||||
| Merrill Lynch & Co.(2) | 12/15/2014 | EUR | 1,900,000 | 4.00 | % | 6 Month LIBOR | (101,057 | ) | ||||||||
| Barclays Capital PLC(1) | 6/18/2034 | GBP | 300,000 | 5.00 | % | 6 Month LIBOR | (21,502 | ) | ||||||||
| UBS AG(1) | 10/15/2010 | EUR | 100,000 | 2.1455 | % | FRC-Excluding Tobacco- Non-Revised Consumer Price Index | 731 | |||||||||
| Merrill Lynch & Co.(2) | 6/15/2015 | JPY | 30,000,000 | 1.50 | % | 6 Month LIBOR | 1,453 | |||||||||
| Bank of America Securities LLC(1) | 6/21/2011 | $ | 1,600,000 | 5.00 | % | 3 Month LIBOR | 8,022 | |||||||||
| UBS AG(1) | 6/21/2016 | $ | 300,000 | 5.00 | % | 3 Month LIBOR | 3,673 | |||||||||
| Bank of America Securities LLC(1) | 6/21/2016 | $ | 700,000 | 5.00 | % | 3 Month LIBOR | 8,503 | |||||||||
| Lehman Brothers(1) | 6/21/2016 | $ | 900,000 | 5.00 | % | 3 Month LIBOR | 10,932 | |||||||||
| Barclays Capital(1) | 6/15/2015 | JPY | 10,000,000 | 1.50 | % | 6 Month LIBOR | 537 | |||||||||
| $ | (82,155 | ) | ||||||||||||||
| (1) | Portfolio pays the floating rate and receives the fixed rate. |
| (2) | Portfolio pays the fixed rate and receives the floating rate. |
Credit default swap agreements outstanding at December 31, 2005:
Counter Party | Termination Date | Notional Amount | Fixed Rate | Underlying Bond | Unrealized Appreciation (Depreciation) | ||||||||||
| Morgan Stanley & Co.(3) | 12/20/2008 | 200,000 | 0.26 | % | Allstate Corp., 6.125%, due 2/15/12 | $ | (1,059 | ) | |||||||
| Merrill Lynch & Co.(3) | 12/20/2008 | 100,000 | 0.32 | % | Ingersoll-Rand Corp., 6.48%, due 6/1/25 | (557 | ) | ||||||||
| Morgan Stanley & Co.(3) | 12/20/2008 | 100,000 | 0.21 | % | Emerson Electric Co., 4.625%, due 10/15/12 | (161 | ) | ||||||||
| Barclays Bank PLC(3) | 12/20/2008 | 200,000 | 0.16 | % | Eli Lilly & Co., 6.00%, due 3/15/12 | (626 | ) | ||||||||
| Bank of America Securities LLC(3) | 12/20/2008 | 100,000 | 0.13 | % | E.I. DuPont, 6.875%, due 10/15/09 | 12 | |||||||||
| Bear Sterns International Ltd.(3) | 12/20/2008 | 200,000 | 0.32 | % | Hewlett Packard Co., 6.50% due 7/1/12 | (1,083 | ) | ||||||||
| Lehman Brothers(3) | 12/20/2008 | 200,000 | 0.11 | % | Johnson & Johnson, 3.80%, due 5/15/13 | (402 | ) | ||||||||
| Lehman Brothers(3) | 12/20/2008 | 200,000 | 0.12 | % | Home Depot, Inc. 5.375% due 4/1/06 | (234 | ) | ||||||||
| Citigroup(3) | 12/20/2008 | 100,000 | 0.29 | % | FedEx Corp., 7.25%, due 2/15/11 | (456 | ) | ||||||||
| Lehman Brothers(3) | 12/20/2008 | 100,000 | 0.29 | % | Whirlpool Corp., 8.60%, due 5/1/10 | (39 | ) | ||||||||
| Citigroup(3) | 12/20/2008 | 200,000 | 0.28 | % | Eaton Corp., 5.75%, due 7/15/12 | (754 | ) | ||||||||
| Citigroup(3) | 12/20/2008 | 300,000 | 0.14 | % | Walmart Stores, Inc., 6.875%, due 8/10/09 | (619 | ) | ||||||||
| UBS AG(3) | 12/20/2008 | 200,000 | 0.35 | % | AutoZone, Inc., 5.875%, due 10/15/12 | 623 | |||||||||
| Lehman Brothers(3) | 12/20/2008 | 100,000 | 0.30 | % | Masco Corp., 5.875%, due 7/15/12 | 228 | |||||||||
| Lehman Brothers(3) | 12/20/2008 | 100,000 | 0.35 | % | RadioShack Corp., 7.375%, due 5/15/11 | 1,197 | |||||||||
| Barclays Bank PLC(3) | 12/20/2008 | 100,000 | 0.67 | % | Walt Disney Co. (The), 6.375%, due 3/1/12 | (1,456 | ) | ||||||||
| Lehman Brothers(3) | 12/20/2008 | 100,000 | 0.48 | % | Northrop & Grumman Corp., 7.125%, due 2/15/11 | (976 | ) | ||||||||
| Lehman Brothers(3) | 12/20/2008 | 100,000 | 0.53 | % | Lockheed Martin Corp., 8.20%, due 12/1/09 | (1,098 | ) | ||||||||
| Lehman Brothers(3) | 12/20/2008 | 100,000 | 0.97 | % | Goodrich Corp., 7.625%, due 12/15/12 | (1,960 | ) | ||||||||
| Lehman Brothers(3) | 6/20/2009 | 400,000 | 0.40 | % | People’s Republic of China, 6.80%, due 5/23/11 | (3,319 | ) | ||||||||
| Merrill Lynch Int’l(4) | 3/20/2007 | 200,000 | 0.61 | % | Russian Federation, 5.00%, due 3/31/30 | 581 | |||||||||
| Bank of America Securities LLC(4) | 6/20/2010 | 1,000,000 | 0.40 | % | Dow Jones CDX IG4 Index | (4,079 | ) | ||||||||
| Bear Stearns International Ltd.(4) | 6/20/2010 | 900,000 | 0.40 | % | Dow Jones CDX IG4 Index | (3,671 | ) | ||||||||
| Morgan Stanley & Co.(3) | 9/20/2010 | 100,000 | 2.70 | % | Republic of Turkey, 11.875%, due 1/15/30 | (5,310 | ) | ||||||||
| $ | (25,218 | ) | |||||||||||||
| (3) | Portfolio pays the fixed rate and receives from the counterparty, par in the event that the underlying bond defaults. |
| (4) | Portfolio pays the counterparty notional in the event that the underlying bond defaults and receives the fixed rate. |
SEE NOTES TO FINANCIAL STATEMENTS.
B15
| DIVERSIFIED CONSERVATIVE GROWTH PORTFOLIO (Continued) |
SCHEDULE OF INVESTMENTS | December 31, 2005 |
The industry classification of long-term portfolio holdings, short-term investments and liabilities in excess of other assets shown as a percentage of net assets as of December 31, 2005 were as follows:
U.S. Government Mortgage Backed Obligations | 24.0 | % | |
Foreign Government Bonds | 6.9 | ||
U.S. Treasury Obligations | 6.8 | ||
Oil, Gas & Consumable Fuels | 2.8 | ||
Collateralized Mortgage Obligations | 2.6 | ||
Internet Software & Services | 2.5 | ||
Telecommunications | 2.4 | ||
Software | 2.3 | ||
Automobiles | 2.1 | ||
Pharmaceuticals | 2.1 | ||
Insurance | 2.0 | ||
Capital Markets | 1.9 | ||
Health Care & Pharmaceutical | 1.9 | ||
Semiconductors & Semiconductor Equipment | 1.9 | ||
Industrial Conglomerates | 1.8 | ||
Chemicals | 1.7 | ||
Textiles & Apparel | 1.7 | ||
Diversified Financial Services | 1.6 | ||
Media & Entertainment | 1.6 | ||
Municipal Bonds | 1.5 | ||
Aerospace & Defense | 1.4 | ||
Electric | 1.4 | ||
Pipelines & Other | 1.3 | ||
Health Care Equipment & Supplies | 1.2 | ||
Commercial Services & Supplies | 1.1 | ||
Gaming | 1.1 | ||
Biotechnology | 1.0 | ||
Computers & Peripherals | 1.0 | ||
Health Care Providers & Services | 1.0 | ||
Commercial Banks | 0.9 | ||
Energy Equipment & Services | 0.9 | ||
Hotels, Restaurants & Leisure | 0.8 | ||
Capital Goods | 0.7 | ||
Consumer Finance | 0.7 | ||
Energy-Other | 0.7 | ||
Food & Staples Retailing | 0.7 | ||
Household Products | 0.7 | ||
Lodging | 0.7 | ||
Metals | 0.6 | ||
Real Estate Investment Trust | 0.6 | ||
Automotive | 0.5 | ||
Media | 0.5 | ||
Wireless Telecommunication Services | 0.5 | ||
Banks | 0.4 | ||
Building Materials & Construction | 0.4 |
Commercial Services | 0.4 | % | |
Containers & Packaging | 0.4 | ||
Electric Utilities | 0.4 | ||
Electronic Equipment & Instruments | 0.4 | ||
Foods | 0.4 | ||
Household Durables | 0.4 | ||
Oil & Gas Exploration/Production | 0.4 | ||
Paper | 0.4 | ||
Retail & Merchandising | 0.4 | ||
Technology | 0.4 | ||
Textiles, Apparel & Luxury Goods | 0.4 | ||
Tobacco | 0.4 | ||
Utilities | 0.4 | ||
Cable | 0.3 | ||
Food Products | 0.3 | ||
Healthcare Providers & Services | 0.3 | ||
Manufacturing | 0.3 | ||
Metals & Mining | 0.3 | ||
Office Electronics | 0.3 | ||
Packaging | 0.3 | ||
U.S. Government Agency Obligations | 0.3 | ||
Beverages | 0.2 | ||
Business Services | 0.2 | ||
Communication Equipment | 0.2 | ||
Computer Services & Software | 0.2 | ||
Consumer Products & Services | 0.2 | ||
Healthcare Services | 0.2 | ||
IT Consulting & Services | 0.2 | ||
Multi-Utilities | 0.2 | ||
Transportation | 0.2 | ||
Airlines | 0.1 | ||
Automotive Parts | 0.1 | ||
Building & Construction | 0.1 | ||
Building Products | 0.1 | ||
Collateralized Mortgage Obligation | 0.1 | ||
Consumer Services | 0.1 | ||
Electronics | 0.1 | ||
Energy | 0.1 | ||
Gas Utilities | 0.1 | ||
Internet | 0.1 | ||
Machinery | 0.1 | ||
Machinery & Equipment | 0.1 | ||
Media—Cable | 0.1 | ||
Paper & Forest Products | 0.1 | ||
Investments Sold Short | (3.4 | ) | |
Short-Term Investments | 9.9 | ||
| 110.2 | |||
Other liabilities in excess of other assets | (10.2 | ) | |
Total | 100.0 | % | |
SEE NOTES TO FINANCIAL STATEMENTS.
B16
| JENNISON 20/20 FOCUS PORTFOLIO |
SCHEDULE OF INVESTMENTS | December 31, 2005 |
| LONG-TERM INVESTMENTS — 99.3% | Value (Note 2) | ||||
| COMMON STOCKS | Shares | ||||
Aerospace & Defense — 2.7% | |||||
Honeywell International, Inc. | 173,000 | $ | 6,444,250 | ||
Biotechnology — 4.8% | |||||
Amgen, Inc.(a) | 81,000 | 6,387,660 | |||
Gilead Sciences, Inc.(a) | 102,700 | 5,405,101 | |||
| 11,792,761 | |||||
Capital Markets — 4.6% | |||||
Charles Schwab Corp., (The) | 335,300 | 4,918,851 | |||
Merrill Lynch & Co., Inc. | 93,700 | 6,346,301 | |||
| 11,265,152 | |||||
Chemicals — 2.3% | |||||
E.I. du Pont de Nemours & Co. | 129,600 | 5,508,000 | |||
Commercial Services & Supplies — 2.6% | |||||
Waste Management, Inc. | 207,400 | 6,294,590 | |||
Computers & Peripherals — 2.6% | |||||
Apple Computer, Inc.(a) | 88,600 | 6,369,454 | |||
Consumer Finance — 2.6% | |||||
American Express Co. | 121,600 | 6,257,536 | |||
Energy Equipment & Services — 5.2% | |||||
Halliburton Co. | 107,900 | 6,685,484 | |||
Schlumberger, Ltd. | 61,700 | 5,994,155 | |||
| 12,679,639 | |||||
Food Products — 2.3% | |||||
Cadbury Schweppes, ADR | 144,200 | 5,521,418 | |||
Food & Staples Retailing — 4.2% | |||||
Kroger Co.(The)(a) | 258,500 | 4,880,480 | |||
Whole Foods Market, Inc. | 69,900 | 5,409,561 | |||
| 10,290,041 | |||||
Health Care Providers & Services — 5.1% | |||||
Caremark Rx, Inc.(a) | 108,700 | 5,629,573 | |||
UnitedHealth Group, Inc. | 108,000 | 6,711,120 | |||
| 12,340,693 | |||||
Hotels, Restaurants & Leisure — 1.9% | |||||
GTECH Holdings Corp. | 142,000 | 4,507,080 | |||
Household Products — 2.6% | |||||
Procter & Gamble Co.(The) | 107,300 | 6,210,524 | |||
Independent Power Producers & Energy Traders — 3.3% | |||||
TXU Corp. | 161,800 | 8,120,742 | |||
Industrial Conglomerates — 2.4% | |||||
Tyco International, Ltd. | 203,900 | 5,884,554 | |||
Insurance — 2.3% | |||||
American International Group, Inc. | 80,500 | 5,492,515 | |||
Internet & Catalog Retail — 2.5% | |||||
eBay, Inc.(a) | 138,300 | 5,981,475 | |||
Internet Software & Services — 4.1% | |||||
Google, Inc. (Class “A” Stock)(a) | 14,400 | 5,973,984 | |||
Yahoo!, Inc.(a) | 104,700 | 4,102,146 | |||
| 10,076,130 | |||||
| COMMON STOCKS (Continued) | Shares | Value (Note 2) | |||
Metals & Mining — 3.5% | |||||
Phelps Dodge Corp. | 59,100 | $ | 8,502,717 | ||
Multi-Utilities — 2.4% | |||||
Sempra Energy | 132,800 | 5,954,752 | |||
Office Electronics — 2.4% | |||||
Xerox Corp.(a) | 405,500 | 5,940,575 | |||
Oil, Gas & Consumable Fuels — 9.0% | |||||
Nexen, Inc. | 166,800 | 7,944,684 | |||
Occidental Petroleum Corp. | 74,400 | 5,943,072 | |||
Suncor Energy, Inc. | 125,000 | 7,891,250 | |||
| 21,779,006 | |||||
Pharmaceuticals — 6.7% | |||||
Novartis AG, ADR (Switzerland) | 105,400 | 5,531,392 | |||
Roche Holding AG, ADR (Switzerland) | 76,300 | 5,711,139 | |||
Sanofi-Aventis, ADR (France) | 115,900 | 5,088,010 | |||
| 16,330,541 | |||||
Semiconductors & Semiconductor | |||||
Marvell Technology Group Ltd.(a) | 108,700 | 6,096,983 | |||
Software — 7.4% | |||||
Adobe Systems, Inc. | 202,500 | 7,484,400 | |||
Computer Associates International, Inc. | 168,600 | 4,752,834 | |||
Microsoft Corp. | 222,000 | 5,805,300 | |||
| 18,042,534 | |||||
Textiles, Apparel & Luxury Goods — 2.7% | |||||
NIKE, Inc. (Class “B” Stock) | 74,700 | 6,483,213 | |||
Tobacco — 2.3% | |||||
Altria Group, Inc. | 75,600 | 5,648,832 | |||
Wireless Telecommunication Services — 2.3% | |||||
Sprint Nextel Corp. | 237,900 | 5,557,344 | |||
TOTAL LONG-TERM INVESTMENTS | 241,373,051 | ||||
| SHORT-TERM INVESTMENTS — 0.1% | |||||
Mutual Fund — 0.1% | |||||
Dryden Core Investment Fund —Taxable Money Market Series(b) | 221,009 | 221,009 | |||
TOTAL INVESTMENTS — 99.4% | 241,594,060 | ||||
OTHER ASSETS IN EXCESS OF LIABILITIES — 0.6% | 1,562,426 | ||||
NETS ASSETS — 100.0% | $ | 243,156,486 | |||
The following abbreviation is used in the portfolio descriptions:
| ADR | — American Depositary Receipt |
| (a) | Non-income producing security. |
| (b) | Prudential Investments LLC, the manager of the Fund, also serves as the manager of the Dryden Core Investment Fund — Taxable Money Market Series. |
SEE NOTES TO FINANCIAL STATEMENTS.
B17
| JENNISON 20/20 FOCUS PORTFOLIO (Continued) |
SCHEDULE OF INVESTMENTS | December 31, 2005 |
The industry classification of portfolio holdings and other assets in excess of liabilities shown as a percentage of net assets as of December 31, 2005 were as follows:
Oil, Gas & Consumable Fuels | 8.9 | % | |
Software | 7.5 | ||
Pharmaceuticals | 6.7 | ||
Energy Equipment & Services | 5.2 | ||
Health Care Providers & Services | 5.1 | ||
Biotechnology | 4.8 | ||
Capital Markets | 4.6 | ||
Food & Staples Retailing | 4.2 | ||
Internet Software & Services | 4.1 | ||
Metals & Mining | 3.5 | ||
Independent Power Producers & Energy Traders | 3.3 | ||
Aerospace & Defense | 2.7 | ||
Textiles, Apparel & Luxury Goods | 2.7 | ||
Commercial Services and Supplies | 2.6 | ||
Computer & Peripherals | 2.6 | ||
Consumer Finance | 2.6 | ||
Household Products | 2.6 | ||
Internet & Catalog Retail | 2.5 | ||
Semiconductors & Semiconductor Equipment | 2.5 | ||
Industrial Conglomerates | 2.4 | ||
Multi Utilities | 2.4 | ||
Office Electronics | 2.4 | ||
Chemicals | 2.3 | ||
Food Products | 2.3 | ||
Insurance | 2.3 | ||
Tobacco | 2.3 | ||
Wireless Telecommunication Services | 2.3 | ||
Hotels, Restaurants & Leisure | 1.9 | ||
Mutual Fund | 0.1 | ||
| 99.4 | |||
Other assets in excess of liabilities | 0.6 | ||
| 100.0 | % | ||
SEE NOTES TO FINANCIAL STATEMENTS.
B18
NOTES TO THE FINANCIAL STATEMENTS OF
THE PRUDENTIAL SERIES FUND, INC.
| Note 1: | General |
The Prudential Series Fund, Inc. (“Series Fund”), a Maryland corporation, organized on November 15, 1982, is a diversified open-end management investment company registered under the Investment Company Act of 1940, as amended. The Series Fund is composed of thirty-three Portfolios (“Portfolio” or “Portfolios”), each with a separate series of capital stock. The information presented in these financial statements pertains to two Portfolios: Diversified Conservative Growth Portfolio and Jennison 20/20 Focus Portfolio.
The Portfolios of the Series Fund have the following as investment objectives:
Diversified Conservative Growth Portfolio: Current income and a reasonable level of capital appreciation by investing primarily in a diversified portfolio of debt and equity securities.
Jennison 20/20 Focus Portfolio: Long-term growth of capital by investing primarily in up to 40 equity securities of U.S. companies that the Portfolio manager believes to have strong capital appreciation potential.
The ability of issuers of debt securities (other than those issued or guaranteed by the U.S. Government) held by the Portfolios to meet their obligations may be affected by the economic or political developments in a specific industry, region or country.
| Note 2: | Accounting Policies |
The following is a summary of significant accounting policies followed by the Series Fund and the Portfolios in preparation of their financial statements.
Securities Valuation: Securities listed on a securities exchange are valued at the last sale price on such exchange on the day of valuation or, if there was no sale on such day, at the mean between the last reported bid and asked prices, or at the last bid price on such day in the absence of an asked price. Securities traded via NASDAQ are valued at the official closing price provided by NASDAQ. Securities that are actively traded in the over-the-counter market, including listed securities for which the primary market is believed by Prudential Investments LLC (“PI” or “Manager”) in consultation with the subadvisor, to be over-the-counter, are valued at market value using prices provided by an independent pricing agent or principal market maker. Options on securities and indices traded on an exchange are valued at the last sale price as of the close of trading on the applicable exchange or, if there was no sale, at the mean between the most recently quoted bid and asked prices on such exchange, or at the last bid price in the absence of an asked price. Futures contracts and options thereon traded on a commodities exchange or board of trade are valued at the last sale price at the close of trading on such exchange or board of trade or, if there was no sale on the applicable commodities exchange or board of trade on such day, at the mean between the most recently quoted bid and asked prices on such exchange or board of trade or at the last bid price in the absence of an asked price. Prices may be obtained from independent pricing services which use information provided by market makers or estimates of market values obtained from yield data relating to investments or securities with similar characteristics. Securities for which reliable market quotations are not readily available, or whose values have been affected by events occurring after the close of the security’s foreign market and before the Series Fund’s normal pricing time, are valued at fair value in accordance with Board of Directors’ approved fair valuation procedures. When determining the fair valuation of securities some of the factors influencing the valuation include, the nature of any restrictions on disposition of the securities; assessment of the general liquidity of the securities; the issuer’s financial condition and the markets in which it does business; the cost of the investment; the size of the holding and the capitalization of the issuer; the prices of any recent transactions or bids/offers for such securities of any comparable securities; any available analyst media or other reports or information deemed reliable by the investment adviser regarding the issuer or the markets or industry in which it operates. Using fair value to price securities may result in a value that is different from a security’s most recent closing price and from the price used by other mutual funds to calculate their net asset values. As of December 31, 2005, the Diversified Conservative Growth Portfolio held foreign securities whose value required adjustment in accordance with such procedures.
Investments in mutual funds are valued at their net asset value as of the close of the New York Stock Exchange on the date of valuation.
C1
Short-term securities that are held in the Portfolios which mature in more than 60 days are valued at current market quotations and those short-term securities which mature in 60 days or less are valued at amortized cost which approximates market value. The amortized cost method values a security at its cost at the time of purchase and there after assumes a constant amortization to maturity of any discount or premium.
Repurchase Agreements: In connection with transactions in repurchase agreements with United States financial institutions, it is the Series Fund’s policy that its custodian or designated subcustodians, as the case may be, under triparty repurchase agreements, take possession of the underlying collateral securities, the value of which exceeds the principal amount of the repurchase transaction, including accrued interest. To the extent that any repurchase transaction exceeds one business day, the value of the collateral is marked to market on a daily basis to ensure the adequacy of the collateral. If the seller defaults or the value of the collateral declines, or if bankruptcy proceedings are commenced with respect to the seller of the security, realization of the collateral by the Series Fund may by delayed or limited.
Foreign Currency Translation: The books and records of the Series Fund are maintained in U.S. dollars. Foreign currency amounts are translated into U.S. dollars on the following basis:
(i) market value of investment securities, other assets and liabilities – at the current daily rates of exchange.
(ii) purchases and sales of investment securities, income and expenses – at the rates of exchange prevailing on the respective dates of such transactions.
Although the net assets of the Series Fund are presented at the foreign exchange rates and market values at the close of the year, the Series Fund does not isolate that portion of the results of operations arising as a result of changes in the foreign exchange rates from the fluctuations arising from changes in the market prices of securities held at the end of the period. Similarly, the Series Fund does not isolate the effect of changes in foreign exchange rates from the fluctuations arising from changes in the market prices of portfolio securities sold during the period. Accordingly, these realized foreign currency gains (losses) are included in the reported net realized gains (losses) on investment transactions.
Net realized gains (losses) on foreign currency transactions represent net foreign exchange gains (losses) from the holding of foreign currencies, currency gains (losses) realized between the trade date and settlement date on securities transactions, and the difference between the amounts of dividends, interest and foreign withholding taxes recorded on the Series Fund’s books and the U.S. dollar equivalent amounts actually received or paid. Net unrealized currency gains (losses) from valuing foreign currency denominated assets and liabilities (other than investments) at period end exchange rates are reflected as a component of net unrealized appreciation (depreciation) on investments and foreign currencies.
Foreign security and currency transactions may involve certain considerations and risks not typically associated with those of domestic origin as a result of, among other factors, the possibility of political and economic instability or the level of governmental supervision and regulation of foreign securities markets.
Forward Currency Contracts: A forward currency contract is a commitment to purchase or sell a foreign currency at a future date at a negotiated forward rate. Certain Portfolios of the Series Fund may enter into forward currency contracts in order to hedge their exposure to changes in foreign currency exchange rates on their foreign portfolio holdings or on specific receivables and payables denominated in a foreign currency. The contracts are valued daily at current forward exchange rates and any unrealized gain (loss) is included in assets and liabilities on the financial statements. Gain (loss) is realized on the settlement date of the contract equal to the difference between the settlement value of the original and negotiated forward contracts. This gain (loss), if any, is included in net realized gain (loss) on foreign currency transactions. Risks may arise upon entering into these contracts from the potential inability of the counterparties to meet the terms of their contracts.
Short Sales: Certain portfolios of the Series Fund may sell a security it does not own in anticipation of a decline in the market value of that security (short sale). When a Portfolio makes a short sale, it must borrow the security sold short and deliver it to the broker-dealer through which it made the short sale as collateral for its obligation to deliver the security upon conclusion of the transaction. The Portfolio may have to pay a fee to borrow the particular security and may be obligated to remit any interest or dividends received on such borrowed securities. Dividends declared on short positions open on record date are recorded on the ex-date as an expense. A gain, limited to the price at which the Portfolio sold the security short, or a loss, unlimited in magnitude, will be recognized upon the termination of a short sale if the market price at termination is less
C2
than or greater than, respectively, the proceeds originally received. The Portfolio maintains a segregated account of securities or other liquid assets, the dollar value of which is at least equal to its obligation with respect to short sales.
Options: The Series Fund may either purchase or write options in order to hedge against adverse market movements or fluctuations in value caused by changes in prevailing interest rates or foreign currency exchange rates or currencies with respect to securities which the Series Fund currently owns or intends to purchase. The Series Fund’s principal reason for writing options is to realize, through receipt of premiums, a greater current return than would be realized on the underlying security alone. When the Series Fund purchases an option, it pays a premium and an amount equal to that premium is recorded as an asset. When the Series Fund writes an option, it receives a premium and an amount equal to that premium is recorded as a liability. The asset or liability is adjusted daily to reflect the current market value of the option. If an option expires unexercised, the Series Fund realizes a gain (loss) to the extent of the premium received or paid. If an option is exercised, the premium received or paid is recorded as an adjustment to the proceeds from the sale or the cost basis of the purchase in determining whether the Series Fund has realized a gain (loss). The difference between the premium and the amount received or paid on effecting a closing purchase or sale transaction is also treated as a realized gain (loss). Gains (losses) on purchased options are included in net realized gains (losses) on investment transactions. Gains (losses) on written options are presented separately as net realized gains (losses) on written option transactions.
The Series Fund, as writer of an option, may have no control over whether the contract may be exercised. As a result, the Series Fund bears the market risk of an unfavorable change in the price of the security underlying the written option. The Series Fund, as purchaser of an option, bears the risk of the potential inability of the counterparties to meet the terms of their contracts.
Financial Futures Contracts: A financial futures contract is an agreement to purchase (long) or sell (short) an agreed amount of securities at a set price for delivery on a future date. Upon entering into a financial futures contract, the Series Fund is required to pledge to the broker an amount of cash and/or other assets equal to a certain percentage of the contract amount. This amount is known as the “initial margin”. Subsequent payments, known as “variation margin”, are made or received by the Series Fund each day, depending on the daily fluctuations in the value of the underlying security. Such variation margin is recorded for financial statement purposes on a daily basis as unrealized gain (loss). When the contract expires or is closed, the gain (loss) is realized and is presented in the Statement of Operations as net realized gain (loss) on financial futures contracts.
The Series Fund invests in financial futures contracts in order to hedge its existing portfolio securities, or securities the Series Fund intends to purchase, against fluctuations in value caused by changes in prevailing rates or market conditions. Under a variety of circumstances, the Series Fund may not achieve the anticipated benefits of the financial futures contracts and may realize a loss. The use of futures transactions involves the risk of imperfect correlation in movements in the price of futures contracts and the underlying hedged assets.
Swap Agreements: The Portfolios may enter into interest rate swap agreements, forward swap spread lock agreements, and credit default swap agreements. A swap agreement is an agreement to exchange the return generated by one instrument for the return generated by another instrument. Interest rate swap agreements involve the exchange by the Portfolio with another party of their respective commitments to pay or receive interest. Forward spread lock swap agreements involve commitments to pay or receive a settlement amount calculated as the difference between the swap spread and a fixed spread, multiplied by the notional amount times the duration of the swap. The swap spread is the difference between the benchmark swap rate (market rate) and the specific Treasury rate. In a credit default swap agreement, one party (the protection buyer) makes a stream of payments to another party (the protection seller) in exchange for the right to receive a specified payment in the event of a default by a third party, typically corporate issues or sovereign issues of an emerging country, on its obligation. The maximum amount of the payment may equal the notional, at par, of the underlying index or security as a result of a default (or “credit event”). In addition to bearing the risk that the credit event will occur, the Portfolios could be exposed to market risk due to unfavorable changes in interest rates or in the price of the underlying security or index, the possibility that the fund may be unable to close out its position at the same time or at the same price as if it had purchased comparable publicly traded securities, or that the counterparty may default on it’s obligation to perform. The swaps are valued daily at current market value and any change in value is included in net unrealized appreciation or depreciation on investments. Payments received or paid by the Portfolio are recorded as realized gains or losses. Risk of loss
C3
may exceed amounts recognized on the statements of assets and liabilities. Swap agreements outstanding at period end, if any, are listed on the Schedule of Investments.
Forward currency contracts, written options, short sales, swaps and financial futures contracts involve elements of both market and credit risk in excess of the amounts reflected on the Statement of Assets and Liabilities.
Securities Lending: The Series Fund may lend its portfolio securities to broker-dealers. The loans are secured by collateral at least equal at all times to the market value of the securities loaned. Loans are subject to termination at the option of the borrower or the Series Fund. Upon termination of the loan, the borrower will return to the lender securities identical to the loaned securities. Should the borrower of the securities fail financially, the Series has the right to repurchase the securities using the collateral in the open market. The Series Fund recognizes income, net of any rebate and securities lending agent fees, for lending its securities in the form of fees or interest on the investment of any cash received as collateral. The Series Fund also continues to receive interest and dividends or amounts equivalent thereto on the securities loaned and recognizes any unrealized gain or loss in the market price of the securities loaned that may occur during the term of the loan.
When-Issued/Delayed Delivery Securities: Securities purchased or sold on a when-issued or delayed delivery basis may be settled a month or more after trade date; interest income is not accrued until settlement date. At the time a Portfolio enters into such transactions, it instructs the custodian to segregate assets with a current value at least equal to the amount of its when-issued or delayed-delivery purchase commitments.
Securities Transactions and Net Investment Income: Securities transactions are recorded on the trade date. Realized gains (losses) on sales of securities are calculated on the identified cost basis. Dividend income is recorded on the ex-dividend date; interest income, which is comprised of four elements: stated coupon, original issue discount, market discount and market premium, is recorded on the accrual basis. Expenses are recorded on the accrual basis. The Series Fund’s expenses are allocated to the respective Portfolios on the basis of relative net assets except for Portfolio specific expenses which are attributable directly to a Portfolio or class level.
For Portfolios with multiple classes of shares, net investment income (loss) (other than administration and distribution fees, which are charged to the respective class) and unrealized and realized gains (losses) are allocated daily to each class of shares based upon the relative proportion of net assets of each class at the beginning of the day.
Custody Fee Credits: The Series Fund has an arrangement with its custodian bank, whereby uninvested monies earn credits which reduce the fees charged by the custodian. Such custody fee credits are presented as a reduction of gross expenses in the accompanying Statements of Operations.
Taxes: For federal income tax purposes, each Portfolio in the Series Fund is treated as a separate taxpaying entity. It is each Portfolio’s policy to continue to meet the requirements of the Internal Revenue Code applicable to regulated investment companies and to distribute all of its taxable net income and capital gains, if any, to shareholders. Therefore, no federal income tax provision is required.
Withholding taxes on foreign dividends, interest and capital gains have been provided for in accordance with the Series Fund’s understanding of the applicable country’s tax rules and regulations.
Dividends and Distributions: Dividends and distributions of each Portfolio are declared in cash and automatically reinvested in additional shares of the same Portfolio. The Portfolios will declare and distribute dividends from net investment income and distributions from net capital gains, if any, at least annually. Dividends and distributions are recorded on the ex-dividend date.
Dividends and capital gain distributions are determined in accordance with income tax regulations which may differ from generally accepted accounting principles. Permanent book/tax differences relating to income and gains are reclassified amongst undistributed net investment income, accumulated net realized gain or loss and paid in capital in excess of par, as appropriate.
Estimates: The preparation of financial statements requires management to make estimates and assumptions that affect the reported amounts and disclosures in the financial statements. Actual results could differ from these estimates.
C4
| Note 3: | Agreements |
The Series Fund has a management agreement with PI. Pursuant to this agreement PI has responsibility for all investment advisory services and supervises the subadvisers’ performance of such services. PI has entered into subadvisory agreements with Prudential Investment Management, Inc. (“PIM”), Jennison Associates LLC (“Jennison”), RS Investment Management, L.P. (“RS”), Pacific Investment Management Company LLC (“PIMCO”) and EARNEST Partners LLC (“EARNEST”) (collectively, the “Subadvisers”), under which each provides investment advisory services for certain Portfolios of the Series Fund. PI pays for the services of the Subadvisers, compensation of officers of the Series Fund, occupancy and certain clerical and administrative expenses of the Series Fund. The Series Fund bears all other costs and expenses.
The management fee paid to PI is computed daily and payable monthly, at the annual rates specified below, of the value of each of the Portfolio’s average daily net assets.
Portfolio | Management Fee | Effective Management Fee | ||||
Diversified Conservative Growth Portfolio . . . . . . . | 0.75 | % | 0.75 | % | ||
Jennison 20/20 Focus Portfolio . . . . . . . . . . . . . . . | 0.75 | 0.75 |
At December 31, 2005 the Subadvisers that provide investment advisory services to the Portfolios as follows. Where more than one Subadviser is listed, each Subadviser provides services to a segment of the Portfolio:
Portfolio | Subadviser(s) | |
Diversified Conservative Growth Portfolio . . . . . . . . . . . . | EARNEST, RS, Jennison, PIMCO, PIM | |
Jennison 20/20 Focus Portfolio . . . . . . . . . . . . . . . . . | Jennison |
The Series Fund has a distribution agreement with Prudential Investment Management Services LLC (“PIMS”) which acts as the distributor of the Class I and Class II shares of the Series Fund. The Series Fund compensates PIMS for distributing and servicing the Series Fund’s Class II shares pursuant to a plan of distribution (the “Class II Plan”), regardless of expenses actually incurred by PIMS. The distribution fees are accrued daily and payable monthly. No distribution or service fees are paid to PIMS as distributor of the Class I shares of the Series Fund. Pursuant to the Class II Plan, the Class II shares of each Portfolio compensate PIMS for distribution-related activities at an annual rate of 0.25% of the average daily net assets of the Class II shares.
The Series Fund has an administration agreement with PI which acts as the administrator of the Class II shares of the Series Fund. The administration fee paid to PI is accrued daily and payable monthly, at the annual rate of 0.15% of the average daily net assets of the Class II shares.
PIMS, PI, PIM and Jennison are indirect, wholly-owned subsidiaries of Prudential Financial, Inc. (“Prudential”).
| Note 4: | Other Transactions with Affiliates |
Prudential Mutual Fund Services LLC (“PMFS”), an affiliate of PI and an indirect, wholly-owned subsidiary of Prudential, serves as the Series Fund’s transfer agent. Transfer agent fees and expenses in the Statements of Operations include certain out-of-pocket expenses paid to non-affiliates, where applicable.
For the year ended December 31, 2005, Prudential Equity Group, LLC, an indirect wholly-owned subsidiary of Prudential, Wachovia Securities, LLC, an affiliate of PI, and First Clearing, LLC earned brokerage commissions from transactions executed on behalf of the Series Fund Portfolios as follows:
Portfolio | Prudential Equity Group | Wachovia | ||||
Diversified Conservative Growth Portfolio . . | $ | 408 | — | |||
Jennison 20/20 Focus Portfolio . . . . . . . . . . . . . | 3,745 | $ | 2,096 | |||
Certain Portfolios invest in the Taxable Money Market Series (the “Portfolio”), a portfolio of Dryden Core Investment Fund, pursuant to an exemptive order received from the Securities and Exchange Commission. The Portfolio is a money market mutual fund registered under the Investment Company Act of 1940, as
C5
amended, and managed by PI. During the year ended December 31, 2005, the following Portfolios earned income from the Portfolio by investing their excess cash:
Portfolio | Excess Cash Investment | ||
Diversified Conservative Growth Portfolio | $ | 129,562 | |
Jennison 20/20 Focus Portfolio | 211,684 | ||
| Note 5: | Portfolio Securities |
The aggregate cost of purchases and the proceeds from the sales of securities (excluding government securities and short-term issues) for the year ended December 31, 2005 were as follows:
Cost of Purchases:
Portfolio | ||
Diversified Conservative Growth Portfolio | 381,794,533 | |
Jennison 20/20 Focus Portfolio | 220,692,304 |
Proceeds from Sales:
Portfolio | ||
Diversified Conservative Growth Portfolio | 365,675,031 | |
Jennison 20/20 Focus Portfolio | 183,555,520 |
The Diversified Conservative Growth Portfolio’s written options activity for the year ended December 31, 2005 was as follows:
| Diversified Conservative Growth | |||||||
| Number of Contracts/ Swap Notional Amount | Premium | ||||||
Balance at beginning of period | 4,576 | $ | 99,789 | ||||
Written options | 133 | 38,171 | |||||
Written swap options | 7,100,000 | 51,428 | |||||
Expired options | (4,413 | ) | (107,656 | ) | |||
Expired swap options | — | — | |||||
Exercised options | (17 | ) | (7,811 | ) | |||
Closed options | (205 | ) | (6,008 | ) | |||
Balance at end of period | 7,100,074 | $ | 67,913 | ||||
| Note 6: | Distributions and Tax Information |
In order to present undistributed net investment income and accumulated net realized capital gains (losses) on the statement of assets and liabilities that more closely represent their tax character, certain adjustments have been made to undistributed net investment income and accumulated net realized gain (loss) on investments.
For the year ended December 31, 2005, the adjustments were as follows:
Portfolio | Undistributed Net Investment Income | Accumulated Net Realized Gain (Loss) | Paid-in Capital | ||||||
Diversified Conservative Growth Portfolio (a)(b) | $ | 559,402 | $ | (559,402 | ) | — | |||
Jennison 20/20 Focus Portfolio (a) | 227 | (227 | ) | — | |||||
(a) Reclassification of net foreign currency gain (loss) | |||||||||
(b) Reclassification of swap income. | |||||||||
The tax character of distributions paid during the year ended December 31, 2005 were as follows:
Portfolio | Ordinary Income | Long-Term Capital Gains | Total Distributions | ||||||
Diversified Conservative Growth Portfolio | $ | 4,898,162 | $ | — | $ | 4,898,162 | |||
Jennison 20/20 Focus Portfolio | 177,361 | — | 177,361 | ||||||
C6
The tax character of distributions paid during the year ended December 31, 2004 were as follows:
Portfolio | Ordinary Income | Long-Term Capital Gains | Total Distributions | ||||||
Diversified Conservative Growth Portfolio | $ | 5,196,232 | $ | — | $ | 5,196,232 | |||
Jennison 20/20 Focus Portfolio | 61,682 | — | 61,682 | ||||||
At December 31, 2005, the components of distributable earnings on a tax basis and approximate capital loss carryforwards were as follows:
Portfolio | Ordinary Income | Long-Term Capital Gains | Approximate Capital Loss Carryforward(a) | Expiration | |||||||||||||||
| 2009 | 2010 | 2011 | 2012 | ||||||||||||||||
Diversified Conservative Growth | $ | 4,801,296 | 616,132 | $ | — | (b) | $ | — | $ | — | — | — | |||||||
Jennison 20/20 Focus | 3,588,931 | 13,173,122 | — | (c) | — | — | — | — | |||||||||||
| (a) | Accordingly, no capital gain distribution is expected to be paid to shareholders until net gains have been realized in excess of such carryforwards. |
| (b) | Approximately $7,282,000 of its capital loss carryforward was used to offset net taxable gains realized in the fiscal year ended December 31, 2005. |
| (c) | Approximately $9,102,000 of its capital loss carryforward was used to offset net taxable gains realized in the fiscal year ended December 31, 2005. |
The United States federal income tax basis and unrealized appreciation (depreciation) of the Series Fund’s investments and the total net unrealized appreciation (depreciation) as of December 31, 2005 were as follows:
Portfolio | Tax Basis | Appreciation | Depreciation | Net Appreciation (Depreciation) | Other Cost Basis Adjusted | Total Net Unrealized Appreciation (Depreciation) | |||||||||||||
Diversified Conservative Growth Portfolio | $ | 158,730,696 | $ | 16,488,319 | $ | 3,112,144 | $ | 13,376,175 | $ | (12,123 | ) | $ | 13,364,052 | ||||||
Jennison 20/20 Focus Portfolio | 196,917,500 | 46,399,704 | 1,723,144 | 44,676,560 | — | 44,676,560 | |||||||||||||
The difference between book basis and tax basis of investments are primarily attributable to deferred losses on wash sales and mark to market on passive foreign investment companies. The other cost basis adjustments are primarily attributable to appreciation (depreciation) of foreign currency and mark to market of receivables and payables.
| Note 7: | Capital |
The Series Fund offers Class I and Class II shares. Neither Class I nor Class II shares of a Portfolio are subject to any sales charge or redemption charge and are sold at the net asset value of the Portfolio. Class I shares are sold only to certain separate accounts of Prudential to fund benefits under certain variable life insurance and variable annuity contracts (“contracts”). Class II shares are sold only to separate accounts of non-Prudential insurance companies as investment options under certain contracts. The separate accounts invest in shares of the Series Fund through subaccounts that correspond to the Portfolios. The separate accounts will redeem shares of the Series Fund to the extent necessary to provide benefits under the contracts or for such other purposes as may be consistent with the contracts. As of December 31, 2005, the Jennison 20/20 Focus Portfolio has Class II shares outstanding.
C7
Transactions in shares of common stock of the Jennison 20/20 Focus were as follows:
| Jennison 20/20 Focus Portfolio: | |||||||
Class I | Shares | Amount | |||||
Year ended December 31, 2005: | |||||||
Capital stock sold | 637,038 | $ | 8,523,762 | ||||
Capital stock issued in reinvestment of dividends and distributions | 14,562 | 177,361 | |||||
Capital stock repurchased | (594,774 | ) | (7,742,410 | ) | |||
Net increase (decrease) in shares outstanding | 56,826 | $ | 958,713 | ||||
Year ended December 31, 2004: | |||||||
Capital stock sold | 228,915 | $ | 2,558,089 | ||||
Capital stock issued in reinvestment of dividends and distributions | 5,765 | 61,682 | |||||
Capital stock repurchased | (753,278 | ) | (8,343,927 | ) | |||
Net increase (decrease) in shares outstanding | (518,598 | ) | $ | (5,724,156 | ) | ||
Class II | |||||||
Year ended December 31, 2005: | |||||||
Capital stock sold | 3,979,596 | $ | 51,409,858 | ||||
Capital stock repurchased | (1,493,869 | ) | (19,993,661 | ) | |||
Net increase (decrease) in shares outstanding | 2,485,727 | $ | 31,416,197 | ||||
Year ended December 31, 2004: | |||||||
Capital stock sold | 5,673,614 | $ | 62,460,038 | ||||
Capital stock repurchased | (1,147,786 | ) | (12,270,703 | ) | |||
Net increase (decrease) in shares outstanding | (4,525,828 | ) | $ | 50,189,335 | |||
| Note 8: | Borrowings |
The Series Fund, along with other affiliated registered investment companies (the “Funds”), is a party to a syndicated credit agreement (“SCA”) with two banks. The SCA provides for a commitment of $500 million. Interest on any borrowings under the SCA would be incurred at market rates. For the period from October 29, 2004 through October 28, 2005, the Series Fund paid a commitment fee of .075 of 1% of the unused portion of the agreement. Effective October 29, 2005, the Funds renewed the SCA with the banks. The commitment under the renewed SCA continues to be $500 million. The Series Fund pays a commitment fee of .0725 of 1% of the unused portion of the renewed SCA. The commitment fee is accrued daily and paid quarterly and is allocated to the Funds pro-rata based on net assets. The purpose of the SCA is to serve as an alternative source of funding for capital share redemptions. The expiration date of the renewed SCA is October 27, 2006.
The following Portfolio utilized the line of credit during the twelve months ended December 31, 2005. The average balance is for the number of days the Portfolio had an outstanding balance.
Portfolio | Average Balance Outstanding | Number of Days Outstanding | Weighted Average Interest Rate | |||||
Jennison 20/20 Focus Portfolio | $ | 368,300 | 6 | 3.39 | % | |||
| Note 9: | Ownership and Affiliates |
As of December 31, 2005, all of Class I shares of each Portfolio were owned of record by the Prudential Insurance Company of America (“PICA”) on behalf of the owners of the variable insurance products issued by PICA.
C8
| Note 10: | Change in Federal Income Tax Status and Related Reorganization |
On January 2, 2006, each Portfolio of the Fund changed its federal income tax status from a regulated investment company to a partnership. As a result of that conversion, the Fund was reorganized from a Maryland corporation to a Delaware statutory trust. Pursuant to this reorganization, the Fund has been renamed “The Prudential Series Fund.” Subsequent to January 2, 2006, each Portfolio’s income, gains, losses and credits will be allocated directly to its partners and will retain the same character for federal income tax purposes. Furthermore, subsequent to January 2, 2006 each portfolio will not be able to realize any future benefit from any unused capital loss carryforward and other losses (if any) deferred from each Portfolio fiscal year ended December 31, 2005 as detailed in Note 6.
The investment objectives, policies, restrictions, net asset values per share, service providers, fiscal years, and investment portfolios of the Portfolios have not changed. In addition, the Fund obtained opinions of counsel that the change in the tax status and the related reorganization had no adverse federal income tax consequences for the Portfolios or Contract owners.
C9
Financial Highlights
| Diversified Conservative Growth Portfolio | ||||||||||||||||||||
| Year Ended December 31, | ||||||||||||||||||||
| 2005 | 2004 | 2003 | 2002 | 2001 | ||||||||||||||||
Per Share Operating Performance: | ||||||||||||||||||||
Net Asset Value, beginning of year | $ | 11.28 | $ | 10.63 | $ | 9.17 | $ | 9.89 | $ | 10.16 | ||||||||||
Income From Investment Operations: | ||||||||||||||||||||
Net investment income | 0.34 | 0.26 | 0.32 | 0.38 | 0.42 | |||||||||||||||
Net realized and unrealized gains (losses) on investments | 0.39 | 0.72 | 1.58 | (1.08 | ) | (0.28 | ) | |||||||||||||
Total from investment operations | 0.73 | 0.98 | 1.90 | (0.70 | ) | 0.14 | ||||||||||||||
Less Dividends: | ||||||||||||||||||||
Dividends from net investment income | (0.34 | ) | (0.33 | ) | (0.44 | ) | (0.02 | ) | (0.41 | ) | ||||||||||
Total dividends | (0.34 | ) | (0.33 | ) | (0.44 | ) | (0.02 | ) | (0.41 | ) | ||||||||||
Net Asset Value, end of year | $ | 11.67 | $ | 11.28 | $ | 10.63 | $ | 9.17 | $ | 9.89 | ||||||||||
Total Investment Return(a) | 7.04 | % | 9.56 | % | 21.57 | % | (7.10 | )% | 1.51 | % | ||||||||||
Ratios/Supplemental Data: | ||||||||||||||||||||
Net assets, end of year (in millions) | $ | 151.4 | $ | 167.0 | $ | 169.6 | $ | 157.1 | $ | 204.1 | ||||||||||
Ratios to average net assets: | ||||||||||||||||||||
Expenses | 0.95 | % | 0.97 | % | 0.98 | % | 0.92 | % | 0.94 | % | ||||||||||
Net investment income | 2.75 | % | 2.29 | % | 2.93 | % | 3.63 | % | 4.17 | % | ||||||||||
Portfolio turnover | 304 | % | 186 | % | 224 | % | 271 | % | 315 | % | ||||||||||
| (a) | Total investment return is calculated assuming a purchase of shares on the first day and a sale on the last day of each period reported and includes reinvestment of dividends and distributions. Total return does not reflect expenses associated with the separate account such as administrative fees, account charges and surrender charges which, if reflected, would reduce the total returns for all periods shown. Performance figures may reflect voluntary fee waivers and/or expense reimbursements. In the absence of voluntary fee waivers and/or expense reimbursements, the total return would be lower. Past performance is no guarantee of future results. |
| Jennison 20/20 Focus Portfolio | ||||||||||||||||||||
| Class I | ||||||||||||||||||||
| Year Ended December 31, | ||||||||||||||||||||
| 2005 | 2004 | 2003 | 2002 | 2001 | ||||||||||||||||
Per Share Operating Performance : | ||||||||||||||||||||
Net Asset Value, beginning of year | $ | 12.37 | $ | 10.68 | $ | 8.28 | $ | 10.65 | $ | 10.99 | ||||||||||
Income (Loss) From Investment Operations: | ||||||||||||||||||||
Net investment income | 0.06 | 0.04 | 0.02 | 0.02 | 0.05 | |||||||||||||||
Net realized and unrealized gain (losses) on investments | 2.60 | 1.66 | 2.40 | (2.39 | ) | (0.15 | ) | |||||||||||||
Total from investment operations | 2.66 | 1.70 | 2.42 | (2.37 | ) | (0.10 | ) | |||||||||||||
Less Dividends and Distributions: | ||||||||||||||||||||
Dividends from net investment income | (0.03 | ) | (0.01 | ) | (0.02 | ) | — | (a) | (0.05 | ) | ||||||||||
Distributions from net realized gains | — | — | — | — | (0.19 | ) | ||||||||||||||
Total dividends and distributions | (0.03 | ) | (0.01 | ) | (0.02 | ) | — | (0.24 | ) | |||||||||||
Net Asset Value, end of year | $ | 15.00 | $ | 12.37 | $ | 10.68 | $ | 8.28 | $ | 10.65 | ||||||||||
Total Investment Return(b) | 21.59 | % | 15.94 | % | 29.30 | % | (22.24 | )% | (1.01 | )% | ||||||||||
Ratios/Supplemental Data: | ||||||||||||||||||||
Net assets, end of year (in millions) | $ | 83.8 | $ | 68.4 | $ | 64.6 | $ | 57.2 | $ | 87.8 | ||||||||||
Ratios to average net assets: | ||||||||||||||||||||
Expenses | 0.87 | % | 0.88 | % | 0.95 | % | 0.97 | % | 0.93 | % | ||||||||||
Net investment income | 0.43 | % | 0.29 | % | 0.18 | % | 0.19 | % | 0.46 | % | ||||||||||
Portfolio turnover rate | 93 | % | 87 | % | 102 | % | 75 | % | 131 | % | ||||||||||
| (a) | Less than $0.005 per share. |
| (b) | Total investment return is calculated assuming a purchase of shares on the first day and a sale on the last day of each period reported and includes reinvestment of dividends and distributions. Total return does not reflect expenses associated with the separate account such as administrative fees, account charges and surrender charges which, if reflected, would reduce the total returns for all periods shown. Performance figures may reflect voluntary fee waivers and/or expense reimbursements. In the absence of voluntary fee waivers and/or expense reimbursements, the total return would be lower. Past performance is no guarantee of future results. |
SEE NOTES TO FINANCIAL STATEMENTS.
D1
Financial Highlights
| Jennison 20/20 Focus Portfolio | ||||||||||||||||||||
| Class II | ||||||||||||||||||||
| Year Ended December 31, | ||||||||||||||||||||
| 2005 | 2004 | 2003 | 2002 | 2001 | ||||||||||||||||
Per Share Operating Performance : | ||||||||||||||||||||
Net Asset Value, beginning of year | $ | 12.23 | $ | 10.60 | $ | 8.23 | $ | 10.63 | $ | 10.99 | ||||||||||
Income (Loss) From Investment Operations: | ||||||||||||||||||||
Net investment income | 0.01 | 0.01 | — | (a) | — | (a) | 0.02 | |||||||||||||
Net realized and unrealized gains (losses) on investments | 2.59 | 1.62 | 2.37 | (2.40 | ) | (.15 | ) | |||||||||||||
Total from investment operations | 2.60 | 1.63 | 2.37 | (2.40 | ) | (.13 | ) | |||||||||||||
Less Dividends and Distributions: | ||||||||||||||||||||
Dividends from net investment income | — | — | — | — | (0.04 | ) | ||||||||||||||
Distributions from net realized gains | — | — | — | — | (0.19 | ) | ||||||||||||||
Total dividends and distributions | — | — | — | — | (0.23 | ) | ||||||||||||||
Net Asset Value, end of year | $ | 14.83 | $ | 12.23 | $ | 10.60 | $ | 8.23 | $ | 10.63 | ||||||||||
Total Investment Return(b): | 21.26 | % | 15.38 | % | 28.80 | % | (22.58 | )% | (1.30 | )% | ||||||||||
Ratios/Supplemental Data: | ||||||||||||||||||||
Net assets, end of year (in millions) | $ | 159.3 | $ | 101.0 | $ | 39.6 | $ | 7.5 | $ | 2.0 | ||||||||||
Ratios to average net assets: | ||||||||||||||||||||
Expenses | 1.27 | % | 1.28 | % | 1.35 | % | 1.37 | % | 1.33 | % | ||||||||||
Net investment income (losses) | 0.03 | % | (0.02 | )% | (0.22 | )% | (0.21 | )% | 0.06 | % | ||||||||||
Portfolio turnover rate | 93 | % | 87 | % | 102 | % | 75 | % | 131 | % | ||||||||||
| (a) | Less than $0.005 per share. |
| (b) | Total investment return is calculated assuming a purchase of shares on the first day and a sale on the last day of each period reported and includes reinvestment of dividends and distributions. Total return does not reflect expenses associated with the separate account such as administrative fees, account charges and surrender charges which, if reflected, would reduce the total returns for all periods shown. Performance figures may reflect voluntary fee waivers and/or expense reimbursements. In the absence of voluntary fee waivers and/or expense reimbursements, the total return would be lower. Past performance is no guarantee of future results. |
SEE NOTES TO FINANCIAL STATEMENTS.
D2
REPORT OF INDEPENDENT REGISTERED PUBLIC ACCOUNTING FIRM
THE BOARD OF DIRECTORS AND SHAREHOLDERS OF THE PRUDENTIAL SERIES FUND
We have audited the accompanying statements of assets and liabilities of The Prudential Series Fund, Inc. (comprised of the Diversified Conservative Growth Portfolio and Jennison 20/20 Focus Portfolio, hereafter referred to as the “Funds”), including the portfolios of investments, as of December 31, 2005, and the related statements of operations for the year then ended, and the statements of changes in net assets and the financial highlights for each of the years in the two-year period then ended. These financial statements and financial highlights are the responsibility of the Funds’ management. Our responsibility is to express an opinion on these financial statements and financial highlights based on our audits. The financial highlights for the years presented prior to the year ended December 31, 2004 were audited by another independent registered public accounting firm, whose report dated February 13, 2004, expressed an unqualified opinion thereon.
We conducted our audits in accordance with the standards of the Public Company Accounting Oversight Board (United States). Those standards require that we plan and perform the audit to obtain reasonable assurance about whether the financial statements and financial highlights are free of material misstatement. An audit includes examining, on a test basis, evidence supporting the amounts and disclosures in the financial statements. Our procedures included confirmation of securities owned as of December 31, 2005, by correspondence with the custodian and brokers or by other appropriate auditing procedures where replies from brokers were not received. An audit also includes assessing the accounting principles used and significant estimates made by management, as well as evaluating the overall financial statement presentation. We believe that our audits provide a reasonable basis for our opinion.
In our opinion, the financial statements and financial highlights referred to above present fairly, in all material respects, the financial position of the Funds as of December 31, 2005, and the results of their operations for the year then ended, and the changes in their net assets and the financial highlights for each of the years in the two-year period then ended, in conformity with U.S. generally accepted accounting principles.

New York, New York
February 24, 2006
E1
Tax Information (Unaudited)
Although we understand that the vast majority, if not all, of the shareholders/contract holders of the Series Fund currently maintain a tax deferred status, we are nevertheless required by the Internal Revenue Code to advise you within 60 days of the Series Fund's fiscal year end (December 31, 2005) as to the federal tax status of dividends paid by the Series Fund during such fiscal year. Accordingly, we are advising you that in 2005, the Series Fund paid dividends as follows:
Ordinary Dividends | Long-Term Capital | Total Distributions | |||||||
Diversified Conservative Growth Portfolio | $ | 0.343 | $ | — | $ | 0.343 | |||
Jennison 20/20 Focus Portfolio (Class I) | 0.032 | — | 0.032 | ||||||
Jennison 20/20 Focus Portfolio (Class II) | — | — | — | ||||||
Pursuant to Section 854 of the Internal Revenue Code, the following percentages of distributions from ordinary income for the year ended December 31, 2005 have been designated as being eligible for the dividends received deduction available to corporate shareholders:
Corporate Dividend Received Deduction | |||
Diversified Conservative Growth Portfolio | 19.18 | % | |
Jennison 20/20 Focus Portfolio | 100 |
E2
Approval of New Investment Advisory Agreements
The Board of Trustees (the “Board”) of The Prudential Series Fund (the “Trust”) oversees the management of each of the Trust’s Portfolios, and, as required by law, is responsible for the approval of the Portfolio’s investment advisory agreements. At a meeting held on December 1, 2005, the Board met and approved new investment advisory agreements for the Trust’s Portfolios. The material factors and conclusions that formed the basis for the Trustees’ determinations to approve the agreements are discussed separately below.
Fund Reorganization
The Board considered and approved the reorganization of the Trust from a corporation organized under the laws of Maryland to a trust organized under the laws of Delaware. In connection with the reorganization, the Board reviewed and approved a new investment management agreement with the Trust’s Manager, Prudential Investments LLC (the “Manager” or “PI”) and new subadvisory agreements with each Portfolio’s current subadviser(s).
With respect to PI, the Board noted that at its June 2005 meeting, it had received information about PI and concluded that it was satisfied with the nature, quality and extent of services provided by PI under the investment management agreement. PI represented that there had been no material change to PI itself and the services it would provide to the Trust since June 2005. The Board determined that the reorganization would not result in any material change in the services provided by PI. Therefore, the Board determined that it was reasonable to conclude that the nature, quality and extent of services to be provided by PI under the new investment management agreement would be similar in nature to those provided under the existing investment management agreement. The Board concluded that the factors underlying the conclusions it reached in approving the investment management agreement with PI at the June 2005 meeting remained materially unchanged.
Similarly, with respect to the subadvisers, the Board noted that at its June 2005 meeting, it had received information about each subadviser and concluded that it was satisfied with the nature, quality and extent of services provided by each subadviser under the subadvisory agreements. PI similarly represented that there had been no material change to the subadvisers and the services they provided since June 2005, and the Board determined that it was reasonable to conclude that the nature, quality and extent of services to be provided by PI under the new subadvisory agreements would be similar in nature to those provided under the existing subadvisory agreements. The Board concluded that the factors underlying the conclusions that it reached in approving the subadvisory agreements at the June 2005 meeting remained materially unchanged.
The Board further noted that it had previously reviewed and approved for inclusion in the Trust’s semi-annual shareholder report a discussion of the material factors and conclusions reached in approving the investment management and subadvisory agreements at its June 2005 meeting.
This report contains financial information about certain investment choices that may be available on the variable life insurance and variable annuity contracts listed below. You may receive additional reports and should refer to your variable life insurance or variable annuity contract prospectus to determine which portfolios are available to you.
VARIABLE LIFE INSURANCE
| n | Pruco Life’s Magnastar |
VARIABLE ANNUITIES
| n | Pruco Life’s Discovery Select® |
| n | Pruco Life of New Jersey’s Discovery Select® |
| n | Pruco Life’s Discovery Choice® |
| n | Pruco Life of New Jersey’s Discovery Choice® |
Variable life insurance is distributed by Pruco Securities LLC, member SIPC, 751 Broad Street, Newark, NJ 07102-3777. Variable annuities are distributed through Prudential Investment Management Services LLC (PIMS), member SIPC, Gateway Center Three, 14th Floor, Newark, NJ 07102-4077. Variable life insurance and variable annuities are issued by The Prudential Insurance Company of America, Pruco Life Insurance Company, or in New York, Pruco Life Insurance Company of New Jersey. All are Prudential Financial companies. Each is solely responsible for its own financial condition and contractual obligations. Contract guarantees are based on the claims-paying ability of the issuing company.
The 2005 Audited Financial Statements of Pruco Life Insurance Company, Pruco Life Insurance Company of New Jersey, and The Prudential Insurance Company of America will be available commencing April 30, 2006. You may call (888) 778-2888 to obtain a free copy of the audited financial statements of the insurance company that issued your contract.
To reduce costs, we now generally send only a single copy of prospectuses and shareholder reports to each household (“householding”) in lieu of sending a copy to each Contract Owner who resides in the household. You should be aware that by calling (877) 778-5008, you can revoke or “opt out” of householding at any time.
Prudential Financial and the Rock logo are service marks of The Prudential Insurance Company of America, Newark, NJ, and its affiliates.
751 Broad Street
Newark NJ 07102-3777
Presorted
Standard
U.S. Postage
PAID
Prudential
IFS-A114743 PSF-AR-C Ed. 02/2006

Item 2 – Code of Ethics – – See Exhibit (a)
As of the end of the period covered by this report, the registrant has adopted a code of ethics (the “Section 406 Standards for Investment Companies – Ethical Standards for Principal Executive and Financial Officers”) that applies to the registrant’s Principal Executive Officer and Principal Financial Officer; the registrant’s Principal Financial Officer also serves as the Principal Accounting Officer.
The registrant hereby undertakes to provide any person, without charge, upon request, a copy of the code of ethics. To request a copy of the code of ethics, contact the registrant 973-802-6469, and ask for a copy of the Section 406 Standards for Investment Companies—Ethical Standards for Principal Executive and Financial Officers.
Item 3 – Audit Committee Financial Expert –
The registrant’s Board has determined that Mr. John A. Pileski, member of the Board’s Audit Committee is an “audit committee financial expert,” and that he is “independent,” for purposes of this Item.
Item 4 – Principal Accountant Fees and Services –
(a) Audit Fees
For the fiscal years ended December 31, 2005 and December 31, 2004, KPMG LLP (“KPMG”), the Registrant’s principal accountant, billed the Registrant $511,900 and $575,500, respectively, for professional services rendered for the audit of the Registrant’s annual financial statements or services that are normally provided in connection with statutory and regulatory filings.
(b) Audit-Related Fees
None.
(c) Tax Fees
None.
(d) All Other Fees
None.
(e) (1) Audit Committee Pre-Approval Policies and Procedures
THE PRUDENTIAL MUTUAL FUNDS
AUDIT COMMITTEE POLICY
on
Pre-Approval of Services Provided by the Independent Accountants
The Audit Committee of each Prudential Mutual Fund is charged with the responsibility to monitor the independence of the Fund’s independent accountants. As part of this responsibility, the Audit Committee must pre-approve any independent accounting firm’s engagement to render audit and/or permissible non-audit services, as required by law. In evaluating a proposed engagement of the independent accountants, the Audit Committee will assess the effect that the engagement might reasonably be expected to have on the accountant’s independence. The Committee’s evaluation will be based on:
| • | a review of the nature of the professional services expected to be provided, |
| • | a review of the safeguards put into place by the accounting firm to safeguard independence, and |
| • | periodic meetings with the accounting firm. |
Policy for Audit and Non-Audit Services Provided to the Funds
On an annual basis, the scope of audits for each Fund, audit fees and expenses, and audit-related and non-audit services (and fees proposed in respect thereof) proposed to be performed by the Fund’s independent accountants will be presented by the Treasurer and the independent accountants to the Audit Committee for review and, as appropriate, approval prior to the initiation of such services. Such presentation shall be accompanied by confirmation by both the Treasurer and the independent accountants that the proposed services will not adversely affect the independence of the independent accountants. Proposed services shall be described in sufficient detail to enable the Audit Committee to assess the appropriateness of such services and fees, and the compatibility of the provision of such services with the auditor’s independence. The Committee shall receive periodic reports on the progress of the audit and other services which are approved by the Committee or by the Committee Chair pursuant to authority delegated in this Policy.
The categories of services enumerated under “Audit Services”, “Audit-related Services”, and “Tax Services” are intended to provide guidance to the Treasurer and the independent accountants as to those categories of services which the Committee believes are generally consistent with the independence of the independent accountants and which the Committee (or the Committee Chair) would expect upon the presentation of specific proposals to pre-approve. The enumerated categories are not intended as an exclusive list of audit, audit-related or tax services which the Committee (or the Committee Chair) would consider for pre-approval.
Audit Services
The following categories of audit services are considered to be consistent with the role of the Fund’s independent accountants:
| • | Annual Fund financial statement audits |
| • | Seed audits (related to new product filings, as required) |
| • | SEC and regulatory filings and consents |
Audit-related Services
The following categories of audit-related services are considered to be consistent with the role of the Fund’s independent accountants:
| • | Accounting consultations |
| • | Fund merger support services |
| • | Agreed Upon Procedure Reports |
| • | Attestation Reports |
| • | Other Internal Control Reports |
Individual audit-related services that fall within one of these categories and are not presented to the Audit Committee as part of the annual pre-approval process will be subject to pre-approval by the Committee Chair (or any other Committee member on whom this responsibility has been delegated) so long as the estimated fee for those services does not exceed $50,000.
Tax Services
The following categories of tax services are considered to be consistent with the role of the Fund’s independent accountants:
| • | Tax compliance services related to the filing or amendment of the following: |
| • | Federal, state and local income tax compliance; and, |
| • | Sales and use tax compliance |
| • | Timely RIC qualification reviews |
| • | Tax distribution analysis and planning |
| • | Tax authority examination services |
| • | Tax appeals support services |
| • | Accounting methods studies |
| • | Fund merger support services |
| • | Tax consulting services and related projects |
Individual tax services that fall within one of these categories and are not presented to the Audit Committee as part of the annual pre-approval process will be subject to pre-approval by the Committee Chair (or any other Committee member on whom this responsibility has been delegated) so long as the estimated fee for those services does not exceed $50,000.
Other Non-audit Services
Certain non-audit services that the independent accountants are legally permitted to render will be subject to pre-approval by the Committee or by one or more Committee members to whom the Committee has delegated this authority and who will report to the full Committee any pre-approval decisions made pursuant to this Policy. Non-audit services presented for pre-approval pursuant to this paragraph will be accompanied by a confirmation from both the Treasurer and the independent accountants that the proposed services will not adversely affect the independence of the independent accountants.
Proscribed Services
The Fund’s independent accountants will not render services in the following categories of non-audit services:
| • | Bookkeeping or other services related to the accounting records or financial statements of the Fund |
| • | Financial information systems design and implementation |
| • | Appraisal or valuation services, fairness opinions, or contribution-in-kind reports |
| • | Actuarial services |
| • | Internal audit outsourcing services |
| • | Management functions or human resources |
| • | Broker or dealer, investment adviser, or investment banking services |
| • | Legal services and expert services unrelated to the audit |
| • | Any other service that the Public Company Accounting Oversight Board determines, by regulation, is impermissible. |
Pre-approval of Non-Audit Services Provided to Other Entities Within the Prudential Fund Complex
Certain non-audit services provided to Prudential Investments LLC or any of its affiliates that also provide ongoing services to the Prudential Mutual Funds will be subject to pre-approval by the Audit Committee. The only non-audit services provided to these entities that will require pre-approval are those related directly to the operations and financial reporting of the Funds. Individual projects that are not presented to the Audit Committee as part of the annual pre-approval process, will be subject to pre-approval by the Committee Chair (or any other Committee member on whom this responsibility has been delegated) so long as the estimated fee for those services does not exceed $50,000. Services presented for pre-approval pursuant to this paragraph will be accompanied by a confirmation from both the Treasurer and the independent accountants that the proposed services will not adversely affect the independence of the independent accountants.
Although the Audit Committee will not pre-approve all services provided to Prudential Investments LLC and its affiliates, the Committee will receive an annual report from the Fund’s independent accounting firm showing the aggregate fees for all services provided to Prudential Investments and its affiliates.
(e) (2) Percentage of services referred to in 4(b)- (4)(d) that were approved by the audit committee –
Not applicable.
(f) Percentage of hours expended attributable to work performed by other than full time employees of principal accountant if greater than 50%.
Not applicable.
(g) Non-Audit Fees
Not applicable to Registrant for the fiscal years 2005 and 2004. The aggregate non-audit fees billed by KPMG for services rendered to the registrant’s investment adviser and any entity controlling, controlled by, or under common control with the investment adviser that provides ongoing services to the registrant for the fiscal years 2005 and 2004 was $51,000 and $33,500, respectively.
(h) Principal Accountants Independence
Not applicable as KPMG has not provided non-audit services to the registrant’s investment adviser and any entity controlling, controlled by, or under common control with the investment adviser that provides ongoing services to the registrant that were not pre-approved pursuant to Rule 2-01(c)(7)(ii) of Regulation S-X.
Item 5 – Audit Committee of Listed Registrants – Not applicable.
Item 6 – Schedule of Investments – The schedule is included as part of the report to shareholders filed under Item 1 of this Form.
Item 7 – Disclosure of Proxy Voting Policies and Procedures for Closed-End Management Investment Companies – Not applicable.
Item 8 – Portfolio Managers of Closed-End Management Investment Companies – Not applicable.
Item 9 – Purchases of Equity Securities by Closed-End Management Investment Company and Affiliated Purchasers – Not applicable.
Item 10 – Submission of Matters to a Vote of Security Holders – Not applicable.
Item 11 – Controls and Procedures
| (a) | It is the conclusion of the registrant’s principal executive officer and principal financial officer that the effectiveness of the registrant’s current disclosure controls and procedures (such disclosure controls and procedures having been evaluated within 90 days of the date of this filing) provide reasonable assurance that the information required to be disclosed by the registrant has been recorded, processed, summarized and reported within the time period specified in the Commission’s rules and forms and that the information required to be disclosed by the registrant has been accumulated and communicated to the registrant’s principal executive officer and principal financial officer in order to allow timely decisions regarding required disclosure. |
| (b) | There has been no significant change in the registrant’s internal control over financial reporting that occurred during the registrant’s most recent fiscal quarter of the period covered by this report that has materially affected, or is likely to materially affect, the registrant’s internal control over financial reporting. |
Item 12 – Exhibits
| (a) | (1) Code of Ethics – Attached hereto as Exhibit EX-99.CODE-ETH |
(2) Certifications pursuant to Section 302 of the Sarbanes-Oxley Act – Attached hereto as Exhibit EX-99.CERT.
(3) Any written solicitation to purchase securities under Rule 23c-1. – Not applicable.
| (b) | Certifications pursuant to Section 906 of the Sarbanes-Oxley Act – Attached hereto as Exhibit EX-99.906CERT. |
SIGNATURES
Pursuant to the requirements of the Securities Exchange Act of 1934 and the Investment Company Act of 1940, the registrant has duly caused this report to be signed on its behalf by the undersigned, thereunto duly authorized.
| (Registrant) The Prudential Series Fund | ||||
| By (Signature and Title)* | /s/ Jonathan D. Shain | |||
| Jonathan D. Shain | ||||
| Assistant Secretary | ||||
| Date February 27, 2006 | ||||
Pursuant to the requirements of the Securities Exchange Act of 1934 and the Investment Company Act of 1940, this report has been signed below by the following persons on behalf of the registrant and in the capacities and on the dates indicated.
| By (Signature and Title)* | /s/ David R. Odenath | |||
| David R. Odenath | ||||
| President and Principal Executive Officer | ||||
| Date February 27, 2006 | ||||
| By (Signature and Title)* | /s/ Grace C. Torres | |||
| Grace C. Torres | ||||
| Treasurer and Principal Financial Officer | ||||
| Date February 27, 2006 | ||||
| * | Print the name and title of each signing officer under his or her signature. |