| | |
| UNITED STATES
SECURITIES AND EXCHANGE COMMISSION |
| | |
| CERTIFIED SHAREHOLDER REPORT OF REGISTERED
MANAGEMENT INVESTMENT COMPANIES
|
| | |
| Investment Company Act file number: | (811-03630) |
| | |
| Exact name of registrant as specified in charter: | Putnam California Tax Exempt Income Fund |
| | |
| Address of principal executive offices: | One Post Office Square, Boston, Massachusetts 02109 |
| | |
| Name and address of agent for service: | Robert T. Burns, Vice President
One Post Office Square
Boston, Massachusetts 02109 |
| | |
| Copy to: | John W. Gerstmayr, Esq.
Ropes & Gray LLP
800 Boylston Street
Boston, Massachusetts 02199-3600 |
| | |
| Registrant’s telephone number, including area code: | (617) 292-1000 |
| | |
| Date of fiscal year end: | September 30, 2014 |
| | |
| Date of reporting period: | October 1, 2013 — March 31, 2014 |
| | |
|
Item 1. Report to Stockholders: | |
| | |
| The following is a copy of the report transmitted to stockholders pursuant to Rule 30e-1 under the Investment Company Act of 1940: | |
Putnam
California Tax Exempt
Income Fund
Semiannual report
3 | 31 | 14
| | | |
| Message from the Trustees | 1 | | |
| | |
| About the fund | 2 | | |
| | |
| Performance snapshot | 4 | | |
| | |
| Interview with your fund’s portfolio manager | 5 | | |
| | |
| Your fund’s performance | 11 | | |
| | |
| Your fund’s expenses | 13 | | |
| | |
| Terms and definitions | 15 | | |
| | |
| Other information for shareholders | 16 | | |
| | |
| Trustee approval of management contract | 17 | | |
| | |
| Financial statements | 24 | | |
| | |
| Shareholder meeting results | 51 | | |
| | |
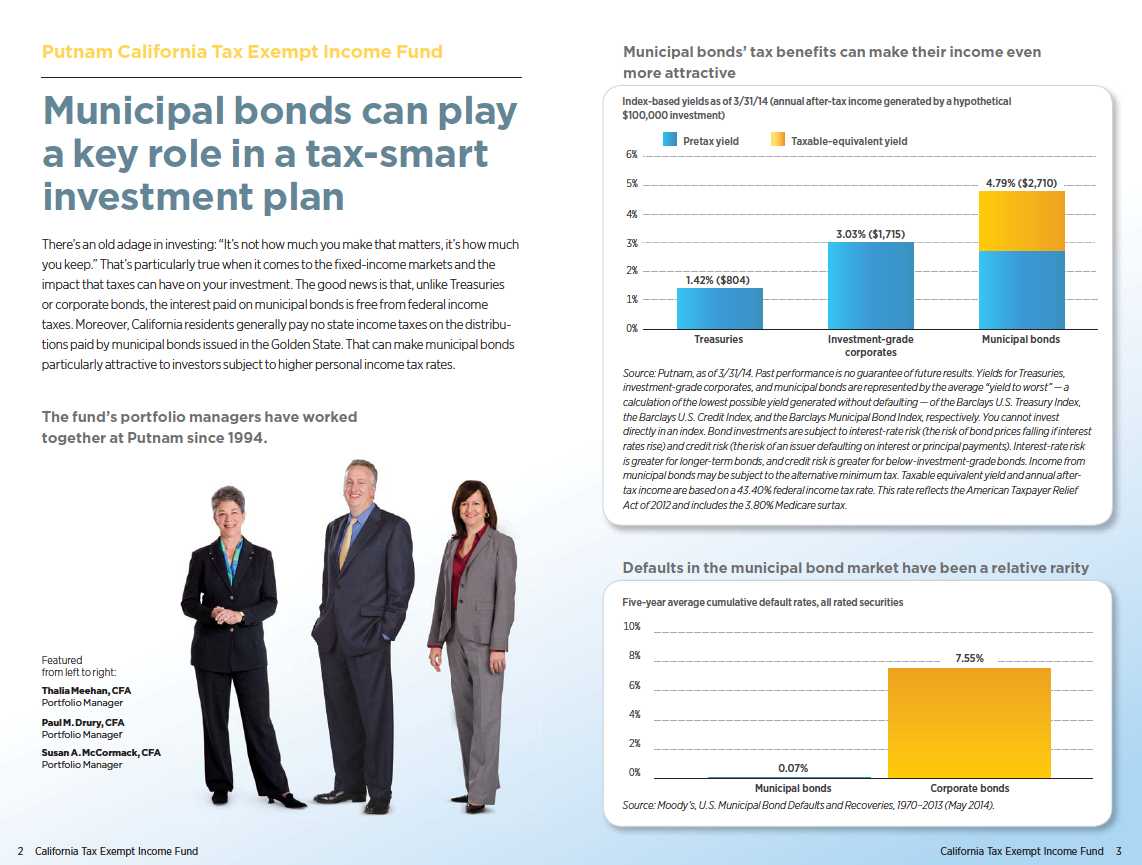
Consider these risks before investing: Single-state investments are at risk of common economic forces and other factors affecting a state’s tax-exempt investments. This may result in greater losses and volatility. Capital gains, if any, are taxed at the federal and, in most cases, state levels. For some investors, investment income may be subject to the federal alternative minimum tax. Bond investments are subject to interest-rate risk (the risk of bond prices falling if interest rates rise) and credit risk (the risk of an issuer defaulting on interest or principal payments). Interest-rate risk is greater for longer-term bonds, and credit risk is greater for below-investment-grade bonds. Unlike bonds, funds that invest in bonds have fees and expenses. Tax-exempt bonds may be issued under the Internal Revenue Code only by limited types of issuers for limited types of projects. As a result, the fund’s investments may be focused in certain market segments and be more vulnerable to fluctuations in the values of the securities it holds than a more broadly invested fund. Interest the fund receives might be taxable. Bond prices may fall or fail to rise over time for several reasons, including general financial market conditions and factors related to a specific issuer or industry. You can lose money by investing in the fund.
Message from the Trustees
Dear Fellow Shareholder:
While U.S. stocks and bonds have generally delivered modest returns so far in 2014, volatility has become more pronounced, driven in the early months of the year by unusually cold weather conditions, shifting expectations for U.S. Federal Reserve action, and rising geopolitical fears. Still, evidence exists that global economic growth is slowly strengthening, and we believe the United States, Europe, and Japan are poised to contribute to an extended recovery.
In our view, portfolio diversification becomes extraordinarily important in this kind of environment. Putnam’s active research and investment strategies can serve investors who are pursuing income and capital appreciation goals.
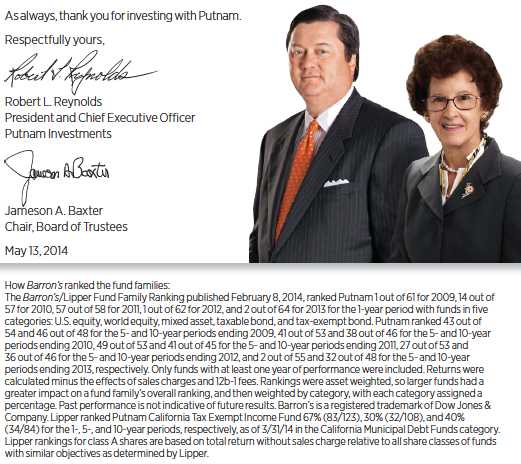
We are pleased to report that Putnam continues to garner recognition in the mutual fund industry. For 2013, Barron’s ranked Putnam second among 64 mutual fund families based on total returns across asset classes. Over the longer term of five years ended in December 2013, Putnam also ranked second out of 55 fund families.
We believe Putnam’s sound investment strategies can provide benefits to your portfolio. An experienced advisor can help you assess your individual needs, time horizon, and risk tolerance — and can help guide you toward your investment goals.
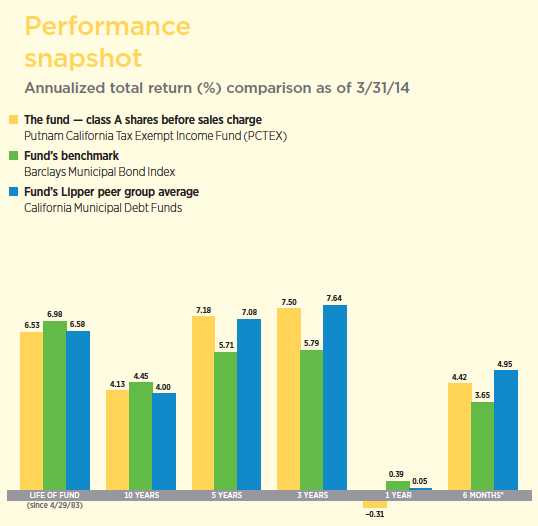
Current performance may be lower or higher than the quoted past performance, which cannot guarantee future results. Share price, principal value, and return will fluctuate, and you may have a gain or a loss when you sell your shares. Performance of class A shares assumes reinvestment of distributions and does not account for taxes. Fund returns in the bar chart do not reflect a sales charge of 4.00%; had they, returns would have been lower. See pages 5 and 11–13 for additional performance information. For a portion of the periods, the fund had expense limitations, without which returns would have been lower. To obtain the most recent month-end performance, visit putnam.com.
* Returns for the six-month period are not annualized, but cumulative.
| |
| 4 | California Tax Exempt Income Fund |
Interview with your fund’s portfolio manager

What was the investment environment like for municipal bonds during the six months ended March 31, 2014?
Municipal bonds closed out the reporting period in positive territory despite considerable month-to-month volatility stemming from headline and interest-rate fears. In October 2013, municipal bonds had positive returns after lawmakers agreed to extend the U.S. borrowing authority, avoiding a possible debt default. The asset class lost ground in November and December, however, as questions about the Federal Reserve’s monetary policy and isolated credit situations — most notably Detroit’s bankruptcy and Puerto Rico’s credit challenges — distracted investors from the improving underlying fundamentals of this asset class.
The municipal markets reversed course once again in January, posting a gain of almost 2% for the month, as measured by the Barclays Municipal Bond Index. This strong monthly return was sparked by a rally in interest rates, as investors moved to a risk-off mode around fears surrounding weaker-than-anticipated economic data and developing stress in emerging markets. In February, with the U.S. debt ceiling debate settled through March 2015, the environment for the credit markets improved. During the final weeks of the period, municipal bonds continued to post positive returns as broader economic
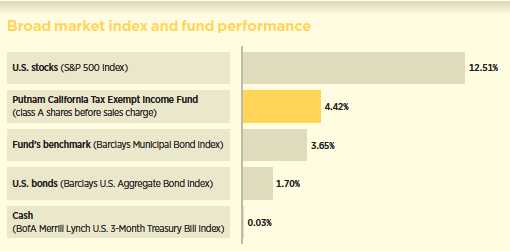
This comparison shows your fund’s performance in the context of broad market indexes for the six months ended 3/31/14. See pages 4 and 11–13 for additional fund performance information. Index descriptions can be found on page 15.
| |
| California Tax Exempt Income Fund | 5 |
data started to pick up and market technicals [supply/demand factors] helped to support prices.
What contributed to the improving technicals in the municipal market during the period?
Municipal bond issuance, which has been trending down in recent years, continued at a modest pace, and this was beneficial for municipal bond prices. The modest level of new supply has not kept pace with the solid demand from traditional tax-sensitive retail investors as well as from crossover taxable buyers drawn to the competitive yields and attractive relative value offered by this asset class. Meanwhile, inflows to tax-free mutual funds, an important measure of demand, turned slightly positive in the first quarter of 2014 — primarily in tax-free high-yield bond funds. All told, with interest rates still low and fundamental credit quality improving, there has been greater investor appetite for the yields offered by municipal bonds further out on the maturity spectrum as well as for those in the lower-rated, higher-yielding sectors.
What accounts for the decline in long-term municipal bond issuance?
Long-term municipal bond issuance, which peaked in 2007 at $429.3 billion [Source: SIFMA] before the global financial crisis began, has been trending down in recent years, as many issuers became more conservative in their debt issuance. The first quarter of 2014 reflected a similar trend with issuance approximately 27% lower than in the first quarter of 2013. We think several factors

Allocations are shown as a percentage of the fund’s net assets as of 3/31/14. Cash and net other assets, if any, represent the market value weights of cash, derivatives, short-term securities, and other unclassified assets in the portfolio. Summary information may differ from the information in the portfolio schedule notes included in the financial statements due to the inclusion of derivative securities, any interest accruals, and the use of different classifications of securities for presentation purposes. Holdings and allocations may vary over time.
| |
| 6 | California Tax Exempt Income Fund |
have contributed to the recent decline in new issuance, but chief among them are reduced refinancing volume, as well as issuers accessing the taxable market or making direct loans.

How did the fund perform in this environment?
Against this multi-dimensional backdrop, Putnam California Tax Exempt Income Fund delivered positive performance for the six-month period ended March 31, 2014, surpassing its benchmark, the Barclays Municipal Bond Index, but lagging the average return of its Lipper peer group.
Are your key investment themes, with their defensive orientation, still in place?
Our cautious and defensive strategies remain in place, since we expect continued pressure on interest rates over the longer term as the Fed unwinds its economic stimulus program and investors adjust their expectations about the central bank’s monetary policy.
Ten-year U.S. Treasury yields were especially volatile in January 2014, initially falling from a high of 3.03% to a low of 2.58% before trading in a fairly narrow range for the remainder of the first quarter. The release of some weaker-than-expected economic data, coupled with the Fed’s announcement that
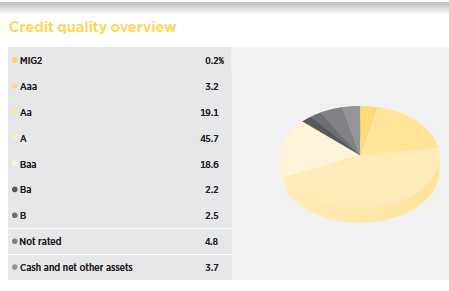
Credit qualities are shown as a percentage of the fund’s net assets as of 3/31/14. A bond rated Baa or higher (MIG3/VMIG3 or higher, for short-term debt) is considered investment grade. The chart reflects Moody’s ratings; percentages may include bonds or derivatives not rated by Moody’s but rated by Standard & Poor’s (S&P) or, if unrated by S&P, by Fitch ratings, and then included in the closest equivalent Moody’s rating. Ratings may vary over time.
Credit quality includes bonds and represents only the fixed-income portion of the portfolio. Cash and net other assets, if any, represent the market value weights of cash, derivatives, short-term securities, and other unclassified assets in the portfolio. The fund itself has not been rated by an independent rating agency.
| |
| California Tax Exempt Income Fund | 7 |
it would taper bond purchases by an additional $10 billion per month in February fueled concern over the pace of economic growth in the United States. Higher-risk assets sold off as investors moved into safe-haven U.S. Treasuries. Comments by Fed Chair Janet Yellen following the central bank’s March meeting seemed to come as somewhat of a surprise to the market, as she implied that interest-rate hikes could begin as early as the first quarter of 2015 if the pace of tapering bond purchases continues on its current path. However, those fears generally had eased by the end of the period.
Amid this volatility, we kept the fund’s duration positioning, or interest-rate sensitivity, below that of its Lipper peer group. This included maintaining a slightly higher cash position in the portfolio to help shelter it from price pressures in an interest-rate environment trending higher. We believe carrying slightly higher-than-average cash balances affords the fund greater flexibility to purchase attractively valued bonds even in a rising-rate environment. We continued to emphasize essential service revenue bonds, which are typically issued by state and local government entities to finance specific revenue-generating projects. While we believe that conditions are improving at the state and local levels — and we were vigilant for investment opportunities — we continued to underweight local G.O. [general obligation] bonds. These securities rely on the taxing power of the issuer and the health of the local economy to make payments on these bonds.
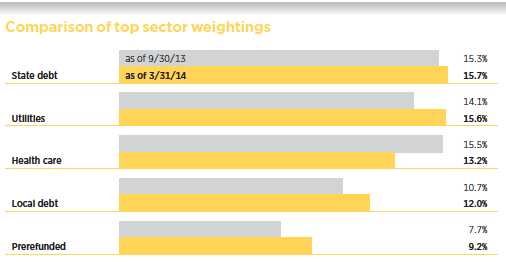
This chart shows how the fund’s top weightings have changed over the past six months. Allocations are shown as a percentage of the fund’s net assets. Current period summary information may differ from the information in the portfolio schedule notes included in the financial statements due to the inclusion of derivative securities, any interest accruals, and the use of different classifications of securities for presentation purposes. Holdings and allocations may vary over time.
| |
| 8 | California Tax Exempt Income Fund |
What did this cautious undertone mean for the fund’s positioning at the security level?
We have maintained an overweight exposure relative to the benchmark to municipal bonds rated A and Baa. In terms of sectors, relative to the fund’s Lipper peer universe, we favored transportation, higher education, utility, and health-care bonds. Overall, this credit positioning helped the fund’s performance. The fund’s underweight exposure to Puerto Rico bonds dampened results, as did its shorter-duration interest-rate positioning, which detracted from returns relative to its Lipper peer group as interest rates moved lower during the final months of the period.
Puerto Rico recently completed one of the largest tax-free bond sales ever. Are you encouraged by developments there?
While Puerto Rico still faces significant credit issues, the Commonwealth brought its long-awaited offering to market in March for $3.5 billion to help address the government’s liquidity needs and some of the underlying economic issues that have put stress on the economy. Pressures remain on Puerto Rico’s leadership to reduce the government’s budget and reinvigorate the local economy, but it was encouraging to see the Commonwealth demonstrate market access and attract less traditional crossover buyers for this record high-yield municipal bond issue. Despite the success of the new deal, Puerto Rico continues to face a number of credit stressors and has a long road to economic recovery, in our view.
What is your near-term outlook for the municipal bond market?
Despite the strong start for municipal bonds in 2014, we still remain cautious and believe that there could be some volatility surrounding supply/demand factors and interest rates in the coming months. Tax-exempt municipal fund outflows for 2013 topped $60 billion [Source: JPMorgan] — the most in 20 years — and put downward pressure on prices. Although we have seen fund flows improve and some direct retail buyers come into the market to help support prices, municipals may remain vulnerable to potentially higher interest rates.
The credit outlook of municipal bonds appears solid, especially since we still expect U.S. growth to continue to improve. With regard to tax policy, we think comprehensive tax reform is unlikely at least until after the 2014 mid-term elections. Over the longer term, we believe federal deficits and pressures around entitlement programs will likely contribute to the ongoing debate for broader tax reform, which could affect the value of municipal bonds.
We will continue to position the portfolios for modest upticks in the overall interest-rate environment, avoiding the more interest-rate-sensitive sectors of the municipal bond market to make the most of less-than-favorable market conditions. Our efforts remain focused on the pursuit of steady income, the minimizing of volatility, and a competitive total return for the fund.
Thank you, Thalia, for bringing us up to date.
The views expressed in this report are exclusively those of Putnam Management and are subject to change. They are not meant as investment advice.
Please note that the holdings discussed in this report may not have been held by the fund for the entire period. Portfolio composition is subject to review in accordance with the fund’s investment strategy and may vary in the future. Current and future portfolio holdings are subject to risk.
Portfolio Manager Thalia Meehan holds a B.A. from Williams College. Thalia joined Putnam in 1989 and has been in the investment industry since 1983. In addition to Thalia, your fund’s portfolio managers are Paul M. Drury, CFA, and Susan A. McCormack, CFA.
| |
| California Tax Exempt Income Fund | 9 |
IN THE NEWS
A worldwide economic recovery is under way — with the United States at the helm — but it may not be smooth sailing. The International Monetary Fund (IMF) raised its global growth forecast for 2014 to 3.6% from 3.0% in 2013. Even with most acute threats diminished, the IMF’s “World Economic Outlook” characterized the global recovery as somewhat fragile. Among the key downside risks cited by the IMF is the danger of low inflation. Other challenges include high unemployment, elevated sovereign debt levels, geopolitical risks, financial sector reforms, and emerging-market concerns. The United States, according to the IMF, is pulling other economies along, thanks to an accommodative central bank, a recovering real estate sector, and expanding household wealth. The IMF predicted that growth in the eurozone this year would hit 1.2%, as a reduction in the pace of fiscal tightening adds to GDP. Japan should see growth from private investment and exports, but the economy may decelerate due to tightening fiscal policy, including a recent consumption tax rate hike. Meanwhile, emerging-market economies continue to struggle, but should improve as advanced economies purchase more imports. Lastly, China’s growth should continue at a rate of about 7.5% in 2014–2015 as its leaders seek to place the country on a steadier growth path and to slow credit growth without causing the economy to stall.
| |
| 10 | California Tax Exempt Income Fund |
Your fund’s performance
This section shows your fund’s performance, price, and distribution information for periods ended March 31, 2014, the end of the first half of its current fiscal year. In accordance with regulatory requirements for mutual funds, we also include expense information taken from the fund’s current prospectus. Performance should always be considered in light of a fund’s investment strategy. Data represent past performance. Past performance does not guarantee future results. More recent returns may be less or more than those shown. Investment return and principal value will fluctuate, and you may have a gain or a loss when you sell your shares. Performance information does not reflect any deduction for taxes a shareholder may owe on fund distributions or on the redemption of fund shares. For the most recent month-end performance, please visit the Individual Investors section at putnam.com or call Putnam at 1-800-225-1581. Class Y shares are not available to all investors. See the Terms and Definitions section in this report for definitions of the share classes offered by your fund.
Fund performance Total return for periods ended 3/31/14
| | | | | | | | | |
| | Class A | Class B | Class C | Class M | Class Y |
| (inception dates) | (4/29/83) | (1/4/93) | (7/26/99) | (2/14/95) | (1/2/08) |
|
| | Before | After | | | | | Before | After | Net |
| | sales | sales | Before | After | Before | After | sales | sales | asset |
| | charge | charge | CDSC | CDSC | CDSC | CDSC | charge | charge | value |
|
| Annual average | | | | | | | | | |
| (life of fund) | 6.53% | 6.39% | 6.29% | 6.29% | 5.68% | 5.68% | 6.14% | 6.02% | 6.58% |
|
| 10 years | 49.90 | 43.90 | 42.28 | 42.28 | 38.42 | 38.42 | 45.51 | 40.78 | 52.27 |
| Annual average | 4.13 | 3.71 | 3.59 | 3.59 | 3.30 | 3.30 | 3.82 | 3.48 | 4.29 |
|
| 5 years | 41.45 | 35.80 | 37.07 | 35.07 | 36.03 | 36.03 | 39.56 | 35.02 | 43.10 |
| Annual average | 7.18 | 6.31 | 6.51 | 6.20 | 6.35 | 6.35 | 6.89 | 6.19 | 7.43 |
|
| 3 years | 24.22 | 19.25 | 21.91 | 18.91 | 21.37 | 21.37 | 23.24 | 19.24 | 25.14 |
| Annual average | 7.50 | 6.04 | 6.83 | 5.94 | 6.67 | 6.67 | 7.21 | 6.04 | 7.76 |
|
| 1 year | –0.31 | –4.30 | –1.06 | –5.84 | –1.21 | –2.17 | –0.59 | –3.82 | –0.09 |
|
| 6 months | 4.42 | 0.24 | 4.09 | –0.91 | 3.99 | 2.99 | 4.28 | 0.89 | 4.52 |
|
Current performance may be lower or higher than the quoted past performance, which cannot guarantee future results. After-sales-charge returns for class A and M shares reflect the deduction of the maximum 4.00% and 3.25% sales charge, respectively, levied at the time of purchase. Class B share returns after contingent deferred sales charge (CDSC) reflect the applicable CDSC, which is 5% in the first year, declining over time to 1% in the sixth year, and is eliminated thereafter. Class C share returns after CDSC reflect a 1% CDSC for the first year that is eliminated thereafter. Class Y shares have no initial sales charge or CDSC. Performance for class B, C, M, and Y shares before their inception is derived from the historical performance of class A shares, adjusted for the applicable sales charge (or CDSC) and the higher operating expenses for such shares, except for class Y shares, for which 12b-1 fees are not applicable.
For a portion of the periods, the fund had expense limitations, without which returns would have been lower.
Class B share performance reflects conversion to class A shares after eight years.
| |
| California Tax Exempt Income Fund | 11 |
Fund price and distribution information For the six-month period ended 3/31/14
| | | | | | | |
| Distributions | Class A | Class B | Class C | Class M | Class Y |
|
| Number | 6 | 6 | 6 | 6 | 6 |
|
| Income 1 | $0.160956 | $0.136156 | $0.130066 | $0.149908 | $0.169450 |
|
| Capital gains 2 | — | — | — | — | — |
|
| Total | $0.160956 | $0.136156 | $0.130066 | $0.149908 | $0.169450 |
|
| | Before | After | Net | Net | Before | After | Net |
| | sales | sales | asset | asset | sales | sales | asset |
| Share value | charge | charge | value | value | charge | charge | value |
|
| 9/30/13 | $7.81 | $8.14 | $7.80 | $7.85 | $7.79 | $8.05 | $7.83 |
|
| 3/31/14 | 7.99 | 8.32 | 7.98 | 8.03 | 7.97 | 8.24 | 8.01 |
|
| | Before | After | Net | Net | Before | After | Net |
| | sales | sales | asset | asset | sales | sales | asset |
| Current rate (end of period) | charge | charge | value | value�� | charge | charge | value |
|
| Current dividend rate 3 | 3.86% | 3.71% | 3.23% | 3.06% | 3.59% | 3.47% | 4.07% |
|
| Taxable equivalent 4 | 7.87 | 7.56 | 6.58 | 6.24 | 7.32 | 7.07 | 8.29 |
|
| Current 30-day SEC yield 5 | N/A | 2.79 | 2.28 | 2.13 | N/A | 2.54 | 3.12 |
|
| Taxable equivalent 4 | N/A | 5.69 | 4.65 | 4.34 | N/A | 5.18 | 6.36 |
|
The classification of distributions, if any, is an estimate. Before-sales-charge share value and current dividend rate for class A and M shares, if applicable, do not take into account any sales charge levied at the time of purchase. After-sales-charge share value, current dividend rate, and current 30-day SEC yield, if applicable, are calculated assuming that the maximum sales charge (4.00% for class A shares and 3.25% for class M shares) was levied at the time of purchase. Final distribution information will appear on your year-end tax forms.
1 For some investors, investment income may be subject to the federal alternative minimum tax.
2 Capital gains, if any, are taxable for federal and, in most cases, state purposes.
3 Most recent distribution, including any return of capital and excluding capital gains, annualized and divided by share price before or after sales charge at period-end.
4 Assumes maximum 50.93% federal and state combined tax rate for 2014. Results for investors subject to lower tax rates would not be as advantageous.
5 Based only on investment income and calculated using the maximum offering price for each share class, in accordance with SEC guidelines.
| |
| 12 | California Tax Exempt Income Fund |
Comparative index returns For periods ended 3/31/14
| | |
| | | Lipper California |
| | Barclays Municipal | Municipal Debt Funds |
| | Bond Index | category average* |
|
| Annual average (life of fund) | 6.98% | 6.58% |
|
| 10 years | 54.57 | 48.19 |
| Annual average | 4.45 | 4.00 |
|
| 5 years | 32.00 | 41.15 |
| Annual average | 5.71 | 7.08 |
|
| 3 years | 18.41 | 24.76 |
| Annual average | 5.79 | 7.64 |
|
| 1 year | 0.39 | 0.05 |
|
| 6 months | 3.65 | 4.95 |
|
Index and Lipper results should be compared with fund performance before sales charge, before CDSC, or at net asset value.
* Over the 6-month, 1-year, 3-year, 5-year, 10-year, and life-of-fund periods ended 3/31/14, there were 126, 123, 113, 108, 84, and 3 funds, respectively, in this Lipper category.
Your fund’s expenses
As a mutual fund investor, you pay ongoing expenses, such as management fees, distribution fees (12b-1 fees), and other expenses. Using the following information, you can estimate how these expenses affect your investment and compare them with the expenses of other funds. You may also pay one-time transaction expenses, including sales charges (loads) and redemption fees, which are not shown in this section and would have resulted in higher total expenses. For more information, see your fund’s prospectus or talk to your financial representative.
Expense ratios
| | | | | |
| | Class A | Class B | Class C | Class M | Class Y |
|
| Total annual operating expenses for the fiscal | | | | | |
| year ended 9/30/13 | 0.74% | 1.37% | 1.52% | 1.02% | 0.52% |
|
| Annualized expense ratio for the six-month | | | | | |
| period ended 3/31/14 | 0.74% | 1.37% | 1.52% | 1.02% | 0.52% |
|
Fiscal-year expense information in this table is taken from the most recent prospectus, is subject to change, and may differ from that shown for the annualized expense ratio and in the financial highlights of this report.
Expenses are shown as a percentage of average net assets.
| |
| California Tax Exempt Income Fund | 13 |
Expenses per $1,000
The following table shows the expenses you would have paid on a $1,000 investment in the fund from October 1, 2013, to March 31, 2014. It also shows how much a $1,000 investment would be worth at the close of the period, assuming actual returns and expenses.
| | | | | |
| | Class A | Class B | Class C | Class M | Class Y |
|
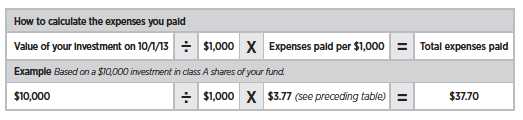
| Expenses paid per $1,000*† | $3.77 | $6.97 | $7.73 | $5.19 | $2.65 |
|
| Ending value (after expenses) | $1,044.20 | $1,040.90 | $1,039.90 | $1,042.80 | $1,045.20 |
|
* Expenses for each share class are calculated using the fund’s annualized expense ratio for each class, which represents the ongoing expenses as a percentage of average net assets for the six months ended 3/31/14. The expense ratio may differ for each share class.
† Expenses are calculated by multiplying the expense ratio by the average account value for the period; then multiplying the result by the number of days in the period; and then dividing that result by the number of days in the year.
Estimate the expenses you paid
To estimate the ongoing expenses you paid for the six months ended March 31, 2014, use the following calculation method. To find the value of your investment on October 1, 2013, call Putnam at 1-800-225-1581.
Compare expenses using the SEC’s method
The Securities and Exchange Commission (SEC) has established guidelines to help investors assess fund expenses. Per these guidelines, the following table shows your fund’s expenses based on a $1,000 investment, assuming a hypothetical 5% annualized return. You can use this information to compare the ongoing expenses (but not transaction expenses or total costs) of investing in the fund with those of other funds. All mutual fund shareholder reports will provide this information to help you make this comparison. Please note that you cannot use this information to estimate your actual ending account balance and expenses paid during the period.
| | | | | |
| | Class A | Class B | Class C | Class M | Class Y |
|
| Expenses paid per $1,000*† | $3.73 | $6.89 | $7.64 | $5.14 | $2.62 |
|
| Ending value (after expenses) | $1,021.24 | $1,018.10 | $1,017.35 | $1,019.85 | $1,022.34 |
|
* Expenses for each share class are calculated using the fund’s annualized expense ratio for each class, which represents the ongoing expenses as a percentage of average net assets for the six months ended 3/31/14. The expense ratio may differ for each share class.
† Expenses are calculated by multiplying the expense ratio by the average account value for the six-month period; then multiplying the result by the number of days in the six-month period; and then dividing that result by the number of days in the year.
| |
| 14 | California Tax Exempt Income Fund |
Terms and definitions
Important terms
Total return shows how the value of the fund’s shares changed over time, assuming you held the shares through the entire period and reinvested all distributions in the fund.
Before sales charge, or net asset value, is the price, or value, of one share of a mutual fund, without a sales charge. Before-sales-charge figures fluctuate with market conditions, and are calculated by dividing the net assets of each class of shares by the number of outstanding shares in the class.
After sales charge is the price of a mutual fund share plus the maximum sales charge levied at the time of purchase. After-sales-charge performance figures shown here assume the 4.00% maximum sales charge for class A shares and 3.25% for class M shares.
Contingent deferred sales charge (CDSC) is generally a charge applied at the time of the redemption of class B or C shares and assumes redemption at the end of the period. Your fund’s class B CDSC declines over time from a 5% maximum during the first year to 1% during the sixth year. After the sixth year, the CDSC no longer applies. The CDSC for class C shares is 1% for one year after purchase.
Share classes
Class A shares are generally subject to an initial sales charge and no CDSC (except on certain redemptions of shares bought without an initial sales charge).
Class B shares are not subject to an initial sales charge. They may be subject to a CDSC.
Class C shares are not subject to an initial sales charge and are subject to a CDSC only if the shares are redeemed during the first year.
Class M shares have a lower initial sales charge and a higher 12b-1 fee than class A shares and no CDSC.
Class Y shares are not subject to an initial sales charge or CDSC, and carry no 12b-1 fee. They are generally only available to corporate and institutional clients and clients in other approved programs.
Fixed-income terms
Current rate is the annual rate of return earned from dividends or interest of an investment. Current rate is expressed as a percentage of the price of a security, fund share, or principal investment.
Yield curve is a graph that plots the yields of bonds with equal credit quality against their differing maturity dates, ranging from shortest to longest. It is used as a benchmark for other debt, such as mortgage or bank lending rates.
Comparative indexes
Barclays Municipal Bond Index is an unmanaged index of long-term fixed-rate investment-grade tax-exempt bonds.
Barclays U.S. Aggregate Bond Index is an unmanaged index of U.S. investment-grade fixed-income securities.
BofA Merrill Lynch U.S. 3-Month Treasury Bill Index is an unmanaged index that seeks to measure the performance of U.S. Treasury bills available in the marketplace.
S&P 500 Index is an unmanaged index of common stock performance.
Indexes assume reinvestment of all distributions and do not account for fees. Securities and performance of a fund and an index will differ. You cannot invest directly in an index.
Lipper is a third-party industry-ranking entity that ranks mutual funds. Its rankings do not reflect sales charges. Lipper rankings
| |
| California Tax Exempt Income Fund | 15 |
are based on total return at net asset value relative to other funds that have similar current investment styles or objectives as determined by Lipper. Lipper may change a fund’s category assignment at its discretion. Lipper category averages reflect performance trends for funds within a category.
Other information for shareholders
Important notice regarding delivery of shareholder documents
In accordance with Securities and Exchange Commission (SEC) regulations, Putnam sends a single copy of annual and semiannual shareholder reports, prospectuses, and proxy statements to Putnam shareholders who share the same address, unless a shareholder requests otherwise. If you prefer to receive your own copy of these documents, please call Putnam at 1-800-225-1581, and Putnam will begin sending individual copies within 30 days.
Proxy voting
Putnam is committed to managing our mutual funds in the best interests of our shareholders. The Putnam funds’ proxy voting guidelines and procedures, as well as information regarding how your fund voted proxies relating to portfolio securities during the 12-month period ended June 30, 2013, are available in the Individual Investors section of putnam.com, and on the SEC’s website, www.sec.gov. If you have questions about finding forms on the SEC’s website, you may call the SEC at 1-800-SEC-0330. You may also obtain the Putnam funds’ proxy voting guidelines and procedures at no charge by calling Putnam’s Shareholder Services at 1-800-225-1581.
Fund portfolio holdings
The fund will file a complete schedule of its portfolio holdings with the SEC for the first and third quarters of each fiscal year on Form N-Q. Shareholders may obtain the fund’s Forms N-Q on the SEC’s website at www.sec.gov. In addition, the fund’s Forms N-Q may be reviewed and copied at the SEC’s Public Reference Room in Washington, D.C. You may call the SEC at 1-800-SEC-0330 for information about the SEC’s website or the operation of the Public Reference Room.
Trustee and employee fund ownership
Putnam employees and members of the Board of Trustees place their faith, confidence, and, most importantly, investment dollars in Putnam mutual funds. As of March 31, 2014, Putnam employees had approximately $461,000,000 and the Trustees had approximately $109,000,000 invested in Putnam mutual funds. These amounts include investments by the Trustees’ and employees’ immediate family members as well as investments through retirement and deferred compensation plans.
| |
| 16 | California Tax Exempt Income Fund |
Trustee approval of management contract
Putnam Investment Management (“Putnam Management”) serves as investment manager to your fund under a management contract. In addition, Putnam Management’s affiliate, Putnam Investments Limited (“PIL”), provides services to your fund under a sub-management contract between Putnam Management and PIL. Putnam Management is majority owned (directly and indirectly) by Power Corporation of Canada, a diversified international management and holding company with interests in companies in the financial services, communications and other business sectors. Until his death on October 8, 2013, The Honourable Paul G. Desmarais, both directly and through holding companies, controlled a majority of the voting shares of Power Corporation of Canada. Upon his death, Mr. Desmarais’ voting control of shares of Power Corporation of Canada was transferred to The Desmarais Family Residuary Trust (the “Transfer”). As a technical matter, the Transfer may have constituted an “assignment” within the meaning of the Investment Company Act of 1940, as amended (the “1940 Act”), causing your fund’s existing management and sub-management contracts to terminate automatically. On October 18, 2013, the Trustees, including all of the Trustees who are not “interested persons” (as this term is defined in the 1940 Act) of the Putnam funds (the “Independent Trustees”), approved interim management contracts between the Putnam funds and Putnam Management and the continuance of your fund’s sub-management contract to address this possibility and to avoid disruption of investment advisory and other services provided to the Putnam funds. At a subsequent meeting on November 22, 2013, the Trustees, including all of the Independent Trustees, approved new definitive management contracts between the Putnam funds and Putnam Management and determined to recommend their approval to the shareholders of the Putnam funds at a shareholder meeting called for February 27, 2014. The Trustees also approved new sub-management contracts, to be effective at the same time as the new definitive management contracts. The fund’s shareholders approved your fund’s new management contract at a special meeting on February 27, 2014.
In considering whether to approve your fund’s interim management contract and the continuance of your fund’s sub-management contract in October, and in considering whether to approve your fund’s new definitive management contract and its new sub-management contract in November, the Trustees took into account that they had recently approved the continuation (through June 30, 2014) of the fund’s previous management and sub-management contracts at their meeting in June 2013. The Trustees considered that the terms of the interim management contract and new definitive management contract were identical to those of the previous management contract, except for the effective dates and initial terms and for certain non-substantive changes. They also considered that the terms of the sub-management contract were identical to those of the previous sub-management contract, except for the effective dates and initial terms. In light of the substantial similarity between the proposed contracts and the previous versions of these contracts approved by the Trustees at their June 2013 meeting, the Trustees relied to a considerable extent on their review of these contracts in connection with their June meeting. In addition, the Trustees considered a number other factors relating to the Transfer, including, but not limited to, the following:
| |
| California Tax Exempt Income Fund | 17 |
• Information about the operations of The Desmarais Family Residuary Trust, including that Paul Desmarais, Jr. and André Desmarais, Mr. Desmarais’ sons, were expected to exercise, jointly, voting control over the Power Corporation of Canada shares controlled by The Desmarais Family Residuary Trust.
• That Paul Desmarais, Jr. and André Desmarais had been playing active managerial roles at Power Corporation of Canada, with responsibility for the oversight of Power Corporation of Canada’s subsidiaries, including Putnam Investments, since Power Corporation of Canada had acquired Putnam Investments in 2007, including serving as Directors of Putnam Investments, and that the Transfer would not affect their responsibilities as officers of Power Corporation of Canada.
• The intention expressed by representatives of Power Corporation of Canada and its subsidiaries, Power Financial Corporation and Great-West Lifeco, that there would be no change to the operations or management of Putnam Investments, to Putnam Management’s management of the funds or to investment, advisory and other services provided to the funds by Putnam Management and its affiliates as a result of the Transfer.
• Putnam Management’s assurances that, following the Transfer, Putnam Management would continue to provide the same level of services to each fund and that the Transfer will not have an adverse impact on the ability of Putnam Management and its affiliates to continue to provide high quality investment advisory and other services to the funds.
• Putnam Management’s assurances that there are no current plans to make any changes to the operations of the funds, existing management fees, expense limitations, distribution arrangements, or the quality of any services provided to the funds or their shareholders, as a result of the Transfer.
• The benefits that the funds have received and may potentially receive as a result of Putnam Management being a member of the Power Corporation of Canada group of companies, which promotes the stability of the Putnam organization.
• Putnam Investments’ commitment to bear a reasonable share of the expenses incurred by the Putnam Funds in connection with the Transfer.
General conclusions in connection with the Trustees’ June 2013 approval of the fund’s management and sub-management contracts
As noted above, in connection with their deliberations in October and November 2013, in addition to the factors described above, the Trustees considered their recent approval of your fund’s management and sub-management contracts in June 2013. The Board oversees the management of each fund and, as required by law, determines annually whether to approve the continuance of your fund’s management and sub-management contracts. The Board, with the assistance of its Contract Committee, requests and evaluates all information it deems reasonably necessary under the circumstances in connection with its annual contract review. The Contract Committee consists solely of Independent Trustees.
At the outset of the review process, members of the Board’s independent staff and independent legal counsel met with representatives of Putnam Management to review the annual contract review materials furnished to the Contract Committee during the course of the previous year’s review and to discuss possible changes in these materials that might be necessary or desirable for the coming year. Following these discussions and in consultation with the Contract Committee, the Independent Trustees’ independent legal counsel requested that Putnam Management furnish specified
| |
| 18 | California Tax Exempt Income Fund |
information, together with any additional information that Putnam Management considered relevant, to the Contract Committee. Over the course of several months ending in June 2013, the Contract Committee met on a number of occasions with representatives of Putnam Management, and separately in executive session, to consider the information that Putnam Management provided. Throughout this process, the Contract Committee was assisted by the members of the Board’s independent staff and by independent legal counsel for the Putnam funds and the Independent Trustees.
In May 2013, the Contract Committee met in executive session to discuss and consider its preliminary recommendations with respect to the continuance of the contracts. At the Trustees’ June 20, 2013 meeting, the Contract Committee met in executive session with the other Independent Trustees to review a summary of the key financial data that the Contract Committee considered in the course of its review. The Contract Committee then presented its written report, which summarized the key factors that the Committee had considered and set forth its final recommendations. The Contract Committee then recommended, and the Independent Trustees approved, the continuance of your fund’s management and sub-management contracts, effective July 1, 2013, subject to certain changes in the sub-management contract noted below. (Because PIL is an affiliate of Putnam Management and Putnam Management remains fully responsible for all services provided by PIL, the Trustees have not evaluated PIL as a separate entity, and all subsequent references to Putnam Management below should be deemed to include reference to PIL as necessary or appropriate in the context.)
The Independent Trustees’ June 2013 approval was based on the following conclusions:
• That the fee schedule in effect for your fund represented reasonable compensation in light of the nature and quality of the services being provided to the fund, the fees paid by competitive funds, and the costs incurred by Putnam Management in providing services to the fund, and
• That the fee schedule represented an appropriate sharing between fund shareholders and Putnam Management of such economies of scale as may exist in the management of the fund at current asset levels.
These conclusions were based on a comprehensive consideration of all information provided to the Trustees and were not the result of any single factor. Some of the factors that figured particularly in the Trustees’ deliberations and how the Trustees considered these factors are described below, although individual Trustees may have evaluated the information presented differently, giving different weights to various factors. It is also important to recognize that the management arrangements for your fund and the other Putnam funds are the result of many years of review and discussion between the Independent Trustees and Putnam Management, that some aspects of the arrangements may receive greater scrutiny in some years than others, and that the Trustees’ conclusions may be based, in part, on their consideration of fee arrangements in previous years. For example, with some minor exceptions, the current fee arrangements in the management contracts for the Putnam funds were implemented at the beginning of 2010 following extensive review and discussion by the Trustees, as well as approval by shareholders.
As noted above, the Trustees considered administrative revisions to your fund’s sub-management contract. Putnam Management recommended that the sub-management contract be revised to reduce the sub-management fee that Putnam Management pays to PIL
| |
| California Tax Exempt Income Fund | 19 |
with respect to the portion of the portfolios of certain funds, but not your fund, that may be allocated to PIL from time to time. The Independent Trustees’ approval of this recommendation was based on their conclusion that these changes would have no practical effect on Putnam Management’s continued responsibility for the management of these funds or the costs borne by fund shareholders and would not result in any reduction in the nature and quality of services provided to the funds.
Management fee schedules and total expenses
The Trustees reviewed the management fee schedules in effect for all Putnam funds, including fee levels and breakpoints. The Trustees also reviewed the total expenses of each Putnam fund, recognizing that in most cases management fees represented the major, but not the sole, determinant of total costs to shareholders.
In reviewing fees and expenses, the Trustees generally focus their attention on material changes in circumstances — for example, changes in assets under management, changes in a fund’s investment style, changes in Putnam Management’s operating costs or profitability, or changes in competitive practices in the mutual fund industry — that suggest that consideration of fee changes might be warranted. The Trustees concluded that the circumstances did not warrant changes to the management fee structure of your fund.
Under its management contract, your fund has the benefit of breakpoints in its management fee schedule that provide shareholders with economies of scale in the form of reduced fee levels as assets under management in the Putnam family of funds increase. The Trustees concluded that the fee schedule in effect for your fund represented an appropriate sharing of economies of scale between fund shareholders and Putnam Management.
As in the past, the Trustees also focused on the competitiveness of each fund’s total expense ratio. In order to ensure that expenses of the Putnam funds continue to meet competitive standards, the Trustees and Putnam Management have implemented certain expense limitations. These expense limitations were: (i) a contractual expense limitation applicable to all retail open-end funds of 32 basis points on investor servicing fees and expenses and (ii) a contractual expense limitation applicable to all open-end funds of 20 basis points on so-called “other expenses” (i.e., all expenses exclusive of management fees, investor servicing fees, distribution fees, investment-related expenses, interest, taxes, brokerage commissions, extraordinary expenses and acquired fund fees and expenses). These expense limitations serve in particular to maintain competitive expense levels for funds with large numbers of small shareholder accounts and funds with relatively small net assets. Most funds, including your fund, had sufficiently low expenses that these expense limitations did not apply. Putnam Management’s support for these expense limitations was an important factor in the Trustees’ decision to approve the continuance of your fund’s management and sub-management contracts.
The Trustees reviewed comparative fee and expense information for a custom group of competitive funds selected by Lipper Inc. This comparative information included your fund’s percentile ranking for effective management fees and total expenses (excluding any applicable 12b-1 fee), which provides a general indication of your fund’s relative standing. In the custom peer group, your fund ranked in the second quintile in effective management fees (determined for your fund and the other funds in the custom peer group based on fund asset size and the applicable contractual management fee schedule) and in the second quintile in total expenses (excluding any applicable
| |
| 20 | California Tax Exempt Income Fund |
12b-1 fees) as of December 31, 2012 (the first quintile representing the least expensive funds and the fifth quintile the most expensive funds). The fee and expense data reported by Lipper as of December 31, 2012 reflected the most recent fiscal year-end data available in Lipper’s database at that time.
In connection with their review of the management fees and total expenses of the Putnam funds, the Trustees also reviewed the costs of the services provided and the profits realized by Putnam Management and its affiliates from their contractual relationships with the funds. This information included trends in revenues, expenses and profitability of Putnam Management and its affiliates relating to the investment management, investor servicing and distribution services provided to the funds. In this regard, the Trustees also reviewed an analysis of Putnam Management’s revenues, expenses and profitability, allocated on a fund-by-fund basis, with respect to the funds’ management, distribution, and investor servicing contracts. For each fund, the analysis presented information about revenues, expenses and profitability for each of the agreements separately and for the agreements taken together on a combined basis. The Trustees concluded that, at current asset levels, the fee schedules in place represented reasonable compensation for the services being provided and represented an appropriate sharing of such economies of scale as may exist in the management of the Putnam funds at that time.
The information examined by the Trustees as part of their annual contract review for the Putnam funds has included for many years information regarding fees charged by Putnam Management and its affiliates to institutional clients such as defined benefit pension plans, college endowments, and the like. This information included comparisons of those fees with fees charged to the funds, as well as an assessment of the differences in the services provided to these different types of clients. The Trustees observed that the differences in fee rates between institutional clients and mutual funds are by no means uniform when examined by individual asset sectors, suggesting that differences in the pricing of investment management services to these types of clients may reflect historical competitive forces operating in separate markets. The Trustees considered the fact that in many cases fee rates across different asset classes are higher on average for mutual funds than for institutional clients, as well as the differences between the services that Putnam Management provides to the Putnam funds and those that it provides to its institutional clients. The Trustees did not rely on these comparisons to any significant extent in concluding that the management fees paid by your fund are reasonable.
Investment performance
The quality of the investment process provided by Putnam Management represented a major factor in the Trustees’ evaluation of the quality of services provided by Putnam Management under your fund’s management contract. The Trustees were assisted in their review of the Putnam funds’ investment process and performance by the work of the investment oversight committees of the Trustees, which meet on a regular basis with the funds’ portfolio teams and with the Chief Investment Officer and other senior members of Putnam Management’s Investment Division throughout the year. The Trustees concluded that Putnam Management generally provides a high-quality investment process — based on the experience and skills of the individuals assigned to the management of fund portfolios, the resources made available to them, and in general Putnam Management’s ability to attract and retain high-quality personnel — but also recognized that this does not guarantee favorable investment results for every fund in every time period.
| |
| California Tax Exempt Income Fund | 21 |
The Trustees considered that 2012 was a year of strong competitive performance for many of the Putnam funds, with only a relatively small number of exceptions. They noted that this strong performance was exemplified by the fact that the Putnam funds were recognized by Barron’s as the best performing mutual fund complex for 2012 — the second time in four years that Putnam Management has achieved this distinction for the Putnam funds. They also noted, however, the disappointing investment performance of some funds for periods ended December 31, 2012 and considered information provided by Putnam Management regarding the factors contributing to the underperformance and actions being taken to improve the performance of these particular funds. The Trustees indicated their intention to continue to monitor performance trends to assess the effectiveness of these efforts and to evaluate whether additional actions to address areas of underperformance are warranted.
For purposes of evaluating investment performance, the Trustees generally focus on competitive industry rankings for the one-year, three-year, and five-year periods. For a number of Putnam funds with relatively unique investment mandates, the Trustees evaluated performance based on comparisons of their total returns with the returns of selected investment benchmarks or targeted returns. In the case of your fund, the Trustees considered that its class A share cumulative total return performance at net asset value was in the following quartiles of its Lipper Inc. peer group (Lipper California Municipal Debt Funds) for the one-year, three-year and five-year periods ended December 31, 2012 (the first quartile representing the best-performing funds and the fourth quartile the worst-performing funds):
| | | |
| One-year period | 3rd | | |
| | |
| Three-year period | 2nd | | |
| | |
| Five-year period | 2nd | | |
| | |
Over the one-year, three-year and five-year periods ended December 31, 2012, there were 118, 113 and 107 funds, respectively, in your fund’s Lipper peer group. (When considering performance information, shareholders should be mindful that past performance is not a guarantee of future results.)
Brokerage and soft-dollar allocations; investor servicing
The Trustees considered various potential benefits that Putnam Management may receive in connection with the services it provides under the management contract with your fund. These include benefits related to brokerage allocation and the use of soft dollars, whereby a portion of the commissions paid by a fund for brokerage may be used to acquire research services that are expected to be useful to Putnam Management in managing the assets of the fund and of other clients. Subject to policies established by the Trustees, soft dollars generated by these means are used primarily to acquire brokerage and research services that enhance Putnam Management’s investment capabilities and supplement Putnam Management’s internal research efforts. However, the Trustees noted that a portion of available soft dollars continues to be used to pay fund expenses. The Trustees indicated their continued intent to monitor regulatory and industry developments in this area with the assistance of their Brokerage Committee and also indicated their continued intent to monitor the allocation of the Putnam funds’ brokerage in order to ensure that the principle of seeking best price and execution remains paramount in the portfolio trading process.
Putnam Management may also receive benefits from payments that the funds make to Putnam Management’s affiliates for investor or distribution services. In conjunction with the annual review of your fund’s management and sub-management contracts, the Trustees
| |
| 22 | California Tax Exempt Income Fund |
reviewed your fund’s investor servicing agreement with Putnam Investor Services, Inc. (“PSERV”) and its distributor’s contracts and distribution plans with Putnam Retail Management Limited Partnership (“PRM”), both of which are affiliates of Putnam Management. The Trustees concluded that the fees payable by the funds to PSERV and PRM, as applicable, for such services are reasonable in relation to the nature and quality of such services, the fees paid by competitive funds, and the costs incurred by PSERV and PRM, as applicable, in providing such services.
| |
| California Tax Exempt Income Fund | 23 |
Financial statements
A guide to financial statements
These sections of the report, as well as the accompanying Notes, constitute the fund’s financial statements.
The fund’s portfolio lists all the fund’s investments and their values as of the last day of the reporting period. Holdings are organized by asset type and industry sector, country, or state to show areas of concentration and diversification.
Statement of assets and liabilities shows how the fund’s net assets and share price are determined. All investment and non-investment assets are added together. Any unpaid expenses and other liabilities are subtracted from this total. The result is divided by the number of shares to determine the net asset value per share, which is calculated separately for each class of shares. (For funds with preferred shares, the amount subtracted from total assets includes the liquidation preference of preferred shares.)
Statement of operations shows the fund’s net investment gain or loss. This is done by first adding up all the fund’s earnings — from dividends and interest income — and subtracting its operating expenses to determine net investment income (or loss). Then, any net gain or loss the fund realized on the sales of its holdings — as well as any unrealized gains or losses over the period — is added to or subtracted from the net investment result to determine the fund’s net gain or loss for the fiscal period.
Statement of changes in net assets shows how the fund’s net assets were affected by the fund’s net investment gain or loss, by distributions to shareholders, and by changes in the number of the fund’s shares. It lists distributions and their sources (net investment income or realized capital gains) over the current reporting period and the most recent fiscal year-end. The distributions listed here may not match the sources listed in the Statement of operations because the distributions are determined on a tax basis and may be paid in a different period from the one in which they were earned. Dividend sources are estimated at the time of declaration. Actual results may vary. Any non-taxable return of capital cannot be determined until final tax calculations are completed after the end of the fund’s fiscal year.
Financial highlights provide an overview of the fund’s investment results, per-share distributions, expense ratios, net investment income ratios, and portfolio turnover in one summary table, reflecting the five most recent reporting periods. In a semiannual report, the highlights table also includes the current reporting period.
| |
| 24 | California Tax Exempt Income Fund |
The fund’s portfolio 3/31/14 (Unaudited)
| |
| Key to holding’s abbreviations | |
| ABAG Association Of Bay Area Governments | Radian Insd. Radian Group Insured |
| AGM Assured Guaranty Municipal Corporation | SGI Syncora Guarantee, Inc. |
| AGO Assured Guaranty, Ltd. | U.S. Govt. Coll. U.S. Government Collateralized |
| AMBAC AMBAC Indemnity Corporation | VRDN Variable Rate Demand Notes, which are |
| COP Certificates of Participation | floating-rate securities with long-term maturities |
| FGIC Financial Guaranty Insurance Company | that carry coupons that reset and are payable upon |
| G.O. Bonds General Obligation Bonds | demand either daily, weekly or monthly. The rate |
| NATL National Public Finance Guarantee Corp. | shown is the current interest rate at the close of the |
| reporting period. |
| | | |
| MUNICIPAL BONDS AND NOTES (99.1%)* | Rating** | Principal amount | Value |
|
| California (96.3%) | | | |
| ABAG Fin. Auth. for Nonprofit Corps. Rev. Bonds | | | |
| (Sharp Hlth. Care), 6 1/4s, 8/1/39 | AA– | $14,000,000 | $15,862,979 |
| (Episcopal Sr. Cmntys.), 6 1/8s, 7/1/41 | BBB+/F | 2,045,000 | 2,190,890 |
| (Episcopal Sr. Cmntys.), Ser. A, 5s, 7/1/47 | BBB+/F | 1,500,000 | 1,459,590 |
| (Episcopal Sr. Cmntys.), Ser. A, 5s, 7/1/42 | BBB+/F | 700,000 | 688,499 |
| (O’Connor Woods), 5s, 1/1/33 | A | 2,300,000 | 2,397,129 |
|
| ABAG Fin. Auth. Non-Profit Corps Insd. Sr. | | | |
| Living Rev. Bonds | | | |
| (Odd Fellows Home of CA), Ser. A, 5s, 4/1/42 | A | 1,000,000 | 1,032,910 |
| (Odd Fellows Home), Ser. A, 5s, 4/1/32 | A | 3,000,000 | 3,194,430 |
|
| Alameda Cnty., Joint Pwrs. Auth. Lease Rev. | | | |
| Bonds (Multiple Cap.), Ser. A, 5s, 12/1/34 | AA | 4,960,000 | 5,374,655 |
|
| Alameda, Corridor Trans. Auth. Rev. Bonds, Ser. A, | | | |
| AMBAC, zero %, 10/1/19 | BBB+ | 15,000,000 | 13,001,100 |
|
| Anaheim Public Fin. Auth. Rev. Bonds | | | |
| (Convention Ctr. Expansion), 5s, 5/1/46 | AA– | 3,000,000 | 3,185,310 |
|
| Anaheim, Pub. Fin. Auth. Rev. Bonds | | | |
| (Elec. Syst. Distr. Fac.), Ser. A, 5 3/8s, 10/1/36 | AA– | 3,000,000 | 3,297,480 |
| (Distr. Syst.), NATL, 5s, 10/1/29 | AA– | 1,945,000 | 1,972,697 |
|
| Arcadia, Unified School Dist. G.O. Bonds (Election | | | |
| of 2006), Ser. A, AGM, zero %, 8/1/18 | Aa2 | 1,500,000 | 1,294,395 |
|
| Bay Area Toll Auth. of CA Rev. Bonds | | | |
| (Toll Bridge), Ser. S-4, 5s, 4/1/33 | A1 | 3,000,000 | 3,274,470 |
| Ser. F, U.S. Govt. Coll., 5s, 4/1/31 | | | |
| (Prerefunded 4/1/16) | AA | 5,000,000 | 5,461,700 |
|
| Burbank, Pub. Fin. Auth. Tax Alloc. Bonds (West | | | |
| Olive Redev.), AMBAC, 5s, 12/1/26 | BBB+ | 3,390,000 | 3,365,592 |
|
| CA Edl. Fac. Auth. Rev. Bonds | | | |
| (Claremont Graduate U.), Ser. A, 6s, 3/1/38 | Baa1 | 1,045,000 | 1,128,182 |
| (CA Lutheran U.), 5 3/4s, 10/1/38 | Baa1 | 5,000,000 | 5,268,300 |
| (Pacific U.), 5 1/2s, 11/1/39 | | | |
| (Prerefunded 11/1/19) | AAA/P | 100,000 | 122,164 |
| (U. of the Pacific), 5 1/2s, 11/1/39 | A2 | 1,085,000 | 1,144,523 |
| (U. of the Pacific), U.S. Govt. Coll., 5 1/2s, | | | |
| 11/1/39 (Prerefunded 11/1/19) | AAA/P | 65,000 | 79,212 |
| (CA College of Arts), 5 1/4s, 6/1/30 | Baa3 | 1,360,000 | 1,441,328 |
| |
| California Tax Exempt Income Fund | 25 |
| | | |
| MUNICIPAL BONDS AND NOTES (99.1%)* cont. | Rating** | Principal amount | Value |
|
| California cont. | | | |
| CA Edl. Fac. Auth. Rev. Bonds | | | |
| (U. of the Pacific), 5 1/4s, 11/1/29 | A2 | $1,265,000 | $1,355,726 |
| (Loyola-Marymount U.), Ser. A, 5 1/8s, 10/1/40 | A2 | 2,955,000 | 3,054,170 |
| (U. Redlands), Ser. A, 5 1/8s, 8/1/38 | A3 | 6,430,000 | 6,558,150 |
| (Claremont Graduate U.), Ser. A, 5 1/8s, 3/1/28 | Baa1 | 1,270,000 | 1,366,431 |
| (U. Southern CA), Ser. A, 5s, 10/1/39 | Aa1 | 3,000,000 | 3,220,470 |
| (U. of the Pacific), 5s, 11/1/36 | A2 | 10,005,000 | 10,124,059 |
| (U. of the Pacific), U.S. Govt. Coll., 5s, 11/1/36 | | | |
| (Prerefunded 11/1/15) | AAA/P | 730,000 | 785,166 |
| (U. of La Verne), Ser. A, 5s, 6/1/35 | Baa2 | 1,000,000 | 997,340 |
| (U. of La Verne), Ser. A, 5s, 6/1/31 | Baa2 | 1,970,000 | 1,975,378 |
| (Chapman U.), 5s, 4/1/31 | A2 | 2,425,000 | 2,570,161 |
| (CA College of Arts), 5s, 6/1/30 | Baa3 | 1,825,000 | 1,841,900 |
| (Lutheran U.), Ser. C, 5s, 10/1/29 | Baa1 | 1,500,000 | 1,503,255 |
| (Lutheran U.), Ser. C, 5s, 10/1/24 | Baa1 | 1,250,000 | 1,255,813 |
| (Lutheran U.), Ser. C, 4 1/2s, 10/1/19 | Baa1 | 2,830,000 | 2,855,810 |
| (Loyola-Marymount U.), Ser. A, NATL, | | | |
| zero %, 10/1/28 | A2 | 355,000 | 181,561 |
|
| CA Hlth. Fac. Fin. Auth. Rev. Bonds | | | |
| (Providence Hlth. & Svcs.), Ser. C, | | | |
| 6 1/2s, 10/1/38 | Aa2 | 5,400,000 | 6,157,457 |
| (Providence Hlth. & Svcs.), Ser. C, 6 1/2s, | | | |
| 10/1/38 (Prerefunded 10/1/18) | AAA/P | 100,000 | 123,666 |
| (Providence Hlth. & Svcs.), Class C, | | | |
| 6 1/4s, 10/1/28 | Aa2 | 3,350,000 | 3,822,752 |
| (Adventist Hlth. Syst.-West), Ser. A, | | | |
| 5 3/4s, 9/1/39 | A | 10,500,000 | 11,671,485 |
| (Sutter Hlth.), Ser. A, 5 1/4s, 11/15/46 | Aa3 | 10,000,000 | 10,324,800 |
| (Stanford Hosp.), Ser. A-2, 5 1/4s, 11/15/40 | Aa3 | 1,000,000 | 1,082,010 |
| (Scripps Hlth.), Ser. A, 5s, 11/15/40 | Aa3 | 1,500,000 | 1,574,475 |
| (Cedars Sinai Med. Ctr.), 5s, 8/15/39 | A1 | 5,400,000 | 5,545,314 |
| (Cedars-Sinai Med. Ctr.), 5s, 11/15/34 | A1 | 6,250,000 | 6,403,813 |
| (Scripps Hlth.), Ser. A, 5s, 11/15/32 | Aa3 | 1,000,000 | 1,062,360 |
| (CA-NV Methodist), 5s, 7/1/26 | A | 1,745,000 | 1,870,448 |
|
| CA Hsg. Fin. Agcy. Rev. Bonds | | | |
| Ser. J, 5 3/4s, 8/1/47 | A– | 1,295,000 | 1,310,592 |
| (Home Mtge.), Ser. H, FGIC, 5 3/4s, 8/1/30 | A– | 10,000 | 10,346 |
| (Multi-Fam. Hsg. III), Ser. B, NATL, | | | |
| 5 1/2s, 8/1/39 | AA | 1,650,000 | 1,648,070 |
| (Home Mtge.), Ser. I, 4 7/8s, 8/1/41 | A– | 4,060,000 | 3,773,242 |
| (Home Mtge.), Ser. M, 4 3/4s, 8/1/42 | A– | 4,990,000 | 4,569,343 |
| (Home Mtge.), Ser. K, 4 5/8s, 8/1/26 | A– | 2,500,000 | 2,501,375 |
|
| CA Infrastructure & Econ. Dev. Bank Rev. Bonds | | | |
| (CA Indpt. Syst. Operator), Ser. A, 6 1/4s, | | | |
| 2/1/39 (Prerefunded 2/1/15) | A | 12,000,000 | 12,607,320 |
| (Oakland Unified School Dist. Fin.), 5s, 8/15/22 | A | 4,985,000 | 5,120,343 |
|
| CA Infrastructure & Econ. Dev. Bank VRDN | | | |
| (Los Angeles Museum), Ser. A, 0.07s, 9/1/37 | VMIG1 | 12,795,000 | 12,795,000 |
| (Pacific Gas & Elec. Co.), Ser. B, 0.07s, 11/1/26 | VMIG1 | 14,500,000 | 14,500,000 |
|
| |
| 26 | California Tax Exempt Income Fund |
| | | |
| MUNICIPAL BONDS AND NOTES (99.1%)* cont. | Rating** | Principal amount | Value |
|
| California cont. | | | |
| CA Muni. Fin. Auth. COP (Cmnty. Hosp. | | | |
| Central CA) | | | |
| 5 1/4s, 2/1/46 | Baa1 | $5,500,000 | $5,515,345 |
| 5 1/4s, 2/1/37 | Baa1 | 13,150,000 | 13,231,267 |
|
| CA Muni. Fin. Auth. Mandatory Put Bonds | | | |
| (7/1/14) (Republic Services, Inc.), 0.45s, 9/1/21 | BBB+ | 2,500,000 | 2,500,000 |
|
| CA Muni. Fin. Auth. Rev. Bonds | | | |
| (U. of La Verne), Ser. A, 6 1/4s, 6/1/40 | Baa2 | 4,000,000 | 4,359,240 |
| (Emerson College), 6s, 1/1/42 | Baa1 | 1,000,000 | 1,108,120 |
| (Biola U.), 5 7/8s, 10/1/34 | Baa1 | 12,470,000 | 13,141,759 |
| (Biola U.), 5.8s, 10/1/28 | Baa1 | 220,000 | 239,395 |
| (Eisenhower Med. Ctr.), Ser. A, 5 3/4s, 7/1/40 | Baa2 | 9,000,000 | 9,396,630 |
| (Emerson College), 5 3/4s, 1/1/33 | Baa1 | 2,000,000 | 2,197,440 |
| (Loma Linda U.), 5s, 4/1/28 | A | 2,000,000 | 2,052,500 |
| (U. Students Coop Assn.), 5s, 4/1/22 | BBB– | 790,000 | 795,009 |
|
| CA Muni. Fin. Auth. Sr. Living Rev. Bonds (Pilgrim | | | |
| Place Claremont), Ser. A, 6 1/8s, 5/15/39 | A | 4,000,000 | 4,230,240 |
|
| CA Poll. Control Fin. Auth. Rev. Bonds | | | |
| (San Jose Wtr. Co.), 5.1s, 6/1/40 | A | 4,500,000 | 4,626,540 |
| (Wtr. Furnishing), 5s, 11/21/45 | Baa3 | 8,000,000 | 7,598,000 |
|
| CA Poll. Control Fin. Auth. VRDN (Pacific Gas & | | | |
| Electric Corp.), Class C, 0.06s, 11/1/26 | A–1+ | 12,200,000 | 12,200,000 |
|
| CA Poll. Control Fin. Auth. Solid Waste Disp. | | | |
| Rev. Bonds (Waste Management, Inc.), | | | |
| Ser. B, 5s, 7/1/27 | A– | 4,500,000 | 4,646,700 |
|
| CA Poll. Control Fin. Auth. Solid Waste Disp. 144A | | | |
| Rev. Bonds (Waste Management, Inc.), Ser. A-2, | | | |
| 5.4s, 4/1/25 | A– | 7,500,000 | 7,741,875 |
|
| CA Poll. Control Fin. Auth. Wtr. Fac. Rev. Bonds | | | |
| (American Wtr. Cap. Corp.), 5 1/4s, 8/1/40 | A– | 4,000,000 | 4,053,400 |
|
| CA State G.O. Bonds | | | |
| 6 1/2s, 4/1/33 | A1 | 35,000,000 | 42,730,100 |
| 5 3/4s, 4/1/31 | A1 | 39,620,000 | 45,832,020 |
| 5 1/4s, 4/1/35 | A1 | 10,000,000 | 11,006,100 |
| 5 1/4s, 2/1/29 | A1 | 2,000,000 | 2,246,480 |
| 5s, 12/1/43 | A1 | 1,500,000 | 1,604,250 |
| 5s, 11/1/43 | A1 | 4,500,000 | 4,810,634 |
| 5s, 4/1/37 | A1 | 2,000,000 | 2,146,720 |
|
| CA State VRDN, 0.07s, 5/1/33 | VMIG1 | 4,400,000 | 4,400,000 |
|
| CA State Pub. Wks. Board Rev. Bonds | | | |
| Ser. I-1, 6 1/8s, 11/1/29 | A2 | 3,000,000 | 3,550,830 |
| (Dept. of Ed. — Riverside Campus), Ser. B, | | | |
| 6 1/8s, 4/1/29 | A2 | 490,000 | 572,158 |
| (Dept. of Dev. Svcs. — Porterville), | | | |
| Ser. C, 6s, 4/1/27 | A2 | 575,000 | 674,837 |
| (Dept. of Ed. — Riverside Campus), | | | |
| Ser. B, 6s, 4/1/26 | A2 | 2,625,000 | 3,091,646 |
| (Trustees CA State U.), Ser. D, 6s, 4/1/26 | Aa3 | 1,365,000 | 1,614,740 |
| (Riverside Campus), Ser. B, 6s, 4/1/25 | A2 | 1,755,000 | 2,066,074 |
| |
| California Tax Exempt Income Fund | 27 |
| | | |
| MUNICIPAL BONDS AND NOTES (99.1%)* cont. | Rating** | Principal amount | Value |
|
| California cont. | | | |
| CA State Pub. Wks. Board Rev. Bonds | | | |
| (Dept. of Dev. Svcs. — Porterville), | | | |
| Ser. C, 6s, 4/1/24 | A2 | $3,615,000 | $4,270,761 |
| (Dept. of Ed. — Riverside Campus), | | | |
| Ser. B, 6s, 4/1/24 | A2 | 4,485,000 | 5,298,579 |
| Ser. G-1, 5 3/4s, 10/1/30 | A2 | 11,500,000 | 12,973,035 |
| Ser. A-1, 5 1/2s, 3/1/25 | A2 | 2,500,000 | 2,850,700 |
| (Various Cap.), Ser. I, 5s, 11/1/38 | A2 | 1,880,000 | 1,980,843 |
| (Regents U.), Ser. E, 5s, 4/1/29 | | | |
| (Prerefunded 4/1/19) | Aaa | 7,015,000 | 8,299,797 |
| (Regents U.), Ser. E, 5s, 4/1/28 | | | |
| (Prerefunded 4/1/19) | Aaa | 8,290,000 | 9,808,314 |
| (Dept. of Corrections-State Prisons), Ser. A, | | | |
| AMBAC, 5s, 12/1/19 | A2 | 15,000,000 | 16,601,400 |
|
| CA State U. Rev. Bonds (Systemwide), Ser. A, | | | |
| 5 3/4s, 11/1/28 | Aa2 | 5,000,000 | 5,814,350 |
|
| CA Statewide Cmnty. Dev. Auth. COP (The | | | |
| Internext Group), 5 3/8s, 4/1/30 | BBB+ | 7,490,000 | 7,507,901 |
|
| CA Statewide Cmnty. Dev. Auth. Rev. Bonds | | | |
| (Sr. Living — Presbyterian Homes), | | | |
| 7 1/4s, 11/15/41 | BBB– | 6,000,000 | 6,700,140 |
| (American Baptist Homes West), | | | |
| 6 1/4s, 10/1/39 | BBB | 4,500,000 | 4,701,465 |
| (Enloe Med. Ctr.), 6 1/4s, 8/15/33 | A | 6,500,000 | 7,284,745 |
| (Enloe Med. Ctr.), 6 1/4s, 8/15/28 | A | 5,000,000 | 5,690,950 |
| (Sutter Hlth.), Ser. A, 6s, 8/15/42 | Aa3 | 5,000,000 | 5,701,500 |
| (Irvine, LLC-UCI East Campus), 6s, 5/15/40 | Baa2 | 11,000,000 | 11,719,400 |
| (American Baptist Homes West), | | | |
| 5 3/4s, 10/1/25 | BBB | 950,000 | 1,014,857 |
| (Catholic Hlth. Care West), Ser. A, | | | |
| 5 1/2s, 7/1/30 | A | 3,820,000 | 4,105,621 |
| (Sutter Hlth.), Ser. B, 5 1/4s, 11/15/48 | Aa3 | 2,000,000 | 2,071,660 |
| (Kaiser Permanente), Ser. B, 5 1/4s, 3/1/45 | A+ | 19,000,000 | 19,219,259 |
| (American Baptist Homes of the West), | | | |
| 5s, 10/1/43 | BBB | 1,190,000 | 1,126,859 |
| (Episcopal Cmntys. and Svcs.), 5s, 5/15/42 | A–/F | 3,250,000 | 3,220,750 |
| (Kaiser Permanente), Ser. B, 5s, 3/1/41 | A+ | 1,815,000 | 1,836,018 |
| (Huntington Memorial Hosp.), 5s, 7/1/35 | A+ | 9,000,000 | 9,048,960 |
| (Episcopal Cmntys. and Svcs.), 5s, 5/15/32 | A–/F | 600,000 | 612,000 |
| (Henry Mayo Newhall Memorial Hosp.), 5s, | | | |
| 10/1/27 (Prerefunded 10/1/17) | A | 3,685,000 | 4,225,553 |
| (Terraces at San Joaquin Gardens), Ser. A, | | | |
| 5s, 10/1/22 | BB/P | 3,150,000 | 3,176,019 |
| (Henry Mayo Newhall Memorial Hosp.), 5s, | | | |
| 10/1/20 (Prerefunded 10/1/17) | A | 1,055,000 | 1,201,909 |
|
| CA Statewide Cmnty. Dev. Auth. 144A Rev. | | | |
| Bonds (Front Porch Cmntys. & Svcs.), Ser. A, | | | |
| 5 1/8s, 4/1/37 | BBB+ | 9,500,000 | 9,507,220 |
|
| |
| 28 | California Tax Exempt Income Fund |
| | | |
| MUNICIPAL BONDS AND NOTES (99.1%)* cont. | Rating** | Principal amount | Value |
|
| California cont. | | | |
| CA Statewide Cmnty. Dev. Auth. Special Tax | | | |
| Special Tax Bonds (Cmnty. Fac. Dist. No. 1- | | | |
| Zone 1B), zero %, 9/1/20 | BB/P | $875,000 | $594,519 |
|
| CA Statewide Fin. Auth. Tobacco Settlement Rev. | | | |
| Bonds, Class B, 5 5/8s, 5/1/29 | Baa3 | 2,360,000 | 2,359,858 |
|
| Carlsbad, Unified School Dist. G.O. Bonds, FGIC, | | | |
| NATL, zero %, 11/1/21 | Aa2 | 2,250,000 | 1,779,503 |
|
| Castaic Lake, Wtr. Agcy. COP (Water Syst. Impt.), | | | |
| AMBAC, zero %, 8/1/27 | AA | 10,000,000 | 5,635,300 |
|
| Chino Basin, Desalter Auth. Rev. Bonds, Ser. A, | | | |
| AGO, 5s, 6/1/30 | AA | 3,540,000 | 3,784,826 |
|
| Chula Vista, Cmnty. Fac. Dist. Special Tax Rev. | | | |
| Bonds (No. 07-I Otay Ranch Village Eleven), | | | |
| 5.1s, 9/1/26 | BBB–/P | 335,000 | 335,961 |
|
| Chula Vista, Indl. Dev. Rev. Bonds (San Diego Gas) | | | |
| Ser. C, 5 7/8s, 2/15/34 | Aa2 | 2,600,000 | 2,853,084 |
| Ser. D, 5 7/8s, 1/1/34 | Aa2 | 5,000,000 | 5,486,700 |
|
| Chula Vista, Muni. Fin. Auth. Special Tax Bonds | | | |
| 5 1/2s, 9/1/30 | BBB+ | 765,000 | 815,873 |
| 5 1/2s, 9/1/29 | BBB+ | 2,235,000 | 2,390,690 |
|
| Coast, Cmnty. College Dist. G.O. Bonds | | | |
| (Election 2012), Ser. A, 5s, 8/1/38 | Aa1 | 7,000,000 | 7,608,300 |
| NATL, zero %, 8/1/22 | Aa1 | 1,280,000 | 1,001,344 |
| NATL, zero %, 8/1/21 | Aa1 | 4,500,000 | 3,694,455 |
|
| Commerce, Redev. Agcy. Tax Alloc. Bonds (Redev. | | | |
| Area 1), zero %, 8/1/21 (Escrowed to maturity) | AAA/P | 41,145,000 | 29,038,906 |
|
| Contra Costa, Home Mtge. Fin. Auth. Rev. | | | |
| Bonds, Ser. G, NATL, zero %, 9/1/17 (Escrowed | | | |
| to maturity) | Aaa | 11,875,000 | 9,527,313 |
|
| Corona, Cmnty. Fac. Dist. Special Tax Bonds (No. | | | |
| 97-2 Eagle Glen), Ser. 97-2, 5 3/4s, 9/1/16 | BBB+/P | 1,820,000 | 1,837,363 |
|
| Corona-Norco, School Dist. Pub. Fin. Auth. | | | |
| Special Tax Bonds | | | |
| Ser. A, 5s, 9/1/35 | BBB+ | 585,000 | 599,988 |
| Ser. A, 5s, 9/1/32 | BBB+ | 1,125,000 | 1,175,636 |
| (Sr. Lien), Ser. A, 5s, 9/1/28 | BBB+ | 275,000 | 290,634 |
|
| Corona-Norco, Unified School Dist. Special Tax | | | |
| Bonds (Cmnty. Facs. Dist. No. 98-1), 5s, 9/1/28 | BBB+ | 1,590,000 | 1,645,443 |
|
| El Camino, Hosp. Dist. Rev. Bonds, Ser. A, AMBAC, | | | |
| 6 1/4s, 8/15/17 (Escrowed to maturity) | AAA/P | 6,010,000 | 6,470,546 |
|
| Folsom Cordova, Unified School Dist. G.O. Bonds | | | |
| (School Fac. Impt. Dist. No. 1), Ser. A, NATL, | | | |
| zero %, 10/1/25 | AA– | 1,505,000 | 904,415 |
|
| Foothill-De Anza, Cmnty. College Dist. G.O. | | | |
| Bonds, Ser. C, 5s, 8/1/40 | Aaa | 6,750,000 | 7,245,653 |
|
| Foothill/Eastern Corridor Agcy. Rev. Bonds | | | |
| Ser. A, 6s, 1/15/53 | BBB– | 8,000,000 | 8,485,200 |
| (CA Toll Roads), Ser. A, 5s, 1/1/35 | BBB– | 2,000,000 | 1,999,860 |
|
| Fullerton, Cmnty. Facs. Dist. No. 1 Special Tax | | | |
| Bonds (Amerige Heights), 5s, 9/1/32 | A– | 1,000,000 | 1,027,600 |
|
| |
| California Tax Exempt Income Fund | 29 |
| | | |
| MUNICIPAL BONDS AND NOTES (99.1%)* cont. | Rating** | Principal amount | Value |
|
| California cont. | | | |
| Garden Grove, Unified School Dist. G.O. Bonds | | | |
| (2010 Election), Ser. C | | | |
| 5s, 8/1/32 | Aa2 | $2,000,000 | $2,206,740 |
| 5s, 8/1/31 | Aa2 | 1,500,000 | 1,663,815 |
| 5s, 8/1/30 | Aa2 | 1,000,000 | 1,116,760 |
| 5s, 8/1/29 | Aa2 | 500,000 | 563,890 |
|
| Golden State Tobacco Securitization | | | |
| Corp. Rev. Bonds | | | |
| Ser. A-1, 5s, 6/1/33 | B3 | 8,000,000 | 6,240,560 |
| Ser. A, AGM, 4.55s, 6/1/22 | AA | 4,085,000 | 4,307,878 |
| Ser. A-1, 4 1/2s, 6/1/27 | B | 9,355,000 | 8,105,172 |
| Ser. A, AMBAC, zero %, 6/1/24 | A2 | 15,500,000 | 10,416,464 |
|
| Golden West, School Fin. Auth. Rev. Bonds, | | | |
| Ser. A, NATL | | | |
| zero %, 8/1/20 | AA– | 2,000,000 | 1,521,360 |
| zero %, 2/1/20 | AA– | 2,480,000 | 1,949,826 |
|
| Grossmont-Cuyamaca, Cmnty. College Dist. G.O. | | | |
| Bonds (Election 2012), Ser. A, 5 1/4s, 8/1/38 | Aa2 | 4,000,000 | 4,359,840 |
|
| Imperial Irrigation Elec. Dist. Rev. Bonds | | | |
| Ser. A, 6 1/4s, 11/1/31 | AA– | 1,000,000 | 1,162,850 |
| Ser. A, 5 1/2s, 11/1/41 | AA– | 9,000,000 | 9,612,720 |
| 5 1/8s, 11/1/38 | AA– | 7,000,000 | 7,389,130 |
| Ser. C, 5s, 11/1/41 | AA– | 7,195,000 | 7,405,885 |
|
| Infrastructure & Econ. Dev. Bank Rev. Bonds | | | |
| (J. David Gladstone Inst.), Ser. A, 5s, 10/1/31 | A– | 4,000,000 | 4,198,680 |
| (Indpt. Syst. Operator Corp.), 5s, 2/1/30 | A1 | 7,000,000 | 7,580,930 |
|
| Irvine, Impt. Board Act of 1915 Special | | | |
| Assmt. Bonds | | | |
| (Ltd. Oblig. Assmt. Dist. No. 13-1), 5s, 9/2/29 | BBB– | 705,000 | 724,691 |
| (Dist No. 12-1), 5s, 9/2/23 | BBB+ | 1,000,000 | 1,119,300 |
|
| Las Virgenes, Unified School Dist. G.O. Bonds | | | |
| Ser. A, AGM, 5s, 8/1/28 | Aa2 | 5,245,000 | 5,577,533 |
| AGM, zero %, 11/1/23 | Aa2 | 1,395,000 | 947,484 |
|
| Long Beach, Bond Fin. Auth. Rev. Bonds | | | |
| (Natural Gas), Ser. A, 5 1/2s, 11/15/28 | A– | 5,000,000 | 5,675,050 |
| (Aquarium of the Pacific), 5s, 11/1/30 | A1 | 1,000,000 | 1,066,130 |
| (Aquarium of the Pacific), 5s, 11/1/29 | A1 | 1,250,000 | 1,342,813 |
|
| Long Beach, Cmnty. College Dist. G.O. Bonds | | | |
| (2008 Election), Ser. B | | | |
| zero %, 8/1/34 | Aa2 | 1,500,000 | 548,580 |
| zero %, 8/1/33 | Aa2 | 625,000 | 244,744 |
|
| Los Angeles Cnty., School Dist. COP | | | |
| (Headquarters Bldg.), Ser. B | | | |
| 5s, 10/1/31 | A1 | 1,125,000 | 1,212,908 |
| 5s, 10/1/30 | A1 | 1,250,000 | 1,357,088 |
|
| Los Angeles, Cmnty. College Dist. G.O. Bonds | | | |
| (Election of 2008), Ser. A, 6s, 8/1/33 | Aa1 | 9,000,000 | 10,715,130 |
|
| Los Angeles, Cmnty. Redev. Agcy. Fin. Auth. Rev. | | | |
| Bonds (Bunker Hill), Ser. A, AGM, 5s, 12/1/27 | AA | 16,000,000 | 16,346,400 |
|
| |
| 30 | California Tax Exempt Income Fund |
| | | |
| MUNICIPAL BONDS AND NOTES (99.1%)* cont. | Rating** | Principal amount | Value |
|
| California cont. | | | |
| Los Angeles, Dept. of Arpt. Rev. Bonds | | | |
| (Los Angeles Intl. Arpt.) | | | |
| Ser. A, 5s, 5/15/40 | AA | $5,000,000 | $5,302,100 |
| Ser. D, 5s, 5/15/40 | AA | 11,500,000 | 12,194,830 |
| Ser. B, 5s, 5/15/32 | AA– | 1,000,000 | 1,082,870 |
| Ser. B, 5s, 5/15/31 | AA– | 1,190,000 | 1,295,291 |
| Ser. B, 5s, 5/15/30 | AA– | 1,100,000 | 1,205,303 |
| 5s, 5/15/29 | AA | 4,225,000 | 4,636,304 |
|
| Los Angeles, Dept. of Wtr. & Pwr. Rev. Bonds | | | |
| (Pwr. Syst.), Ser. B, 5s, 7/1/43 | Aa3 | 5,000,000 | 5,351,550 |
| (Wtr. Wks. Syst.), Ser. B, 5s, 7/1/31 | Aa2 | 2,000,000 | 2,267,200 |
|
| Los Angeles, Harbor Dept. Rev. Bonds, U.S. Govt. | | | |
| Coll., 7.6s, 10/1/18 (Escrowed to maturity) | AA+ | 11,435,000 | 13,393,472 |
|
| Los Angeles, Unified School Dist. G.O. Bonds | | | |
| Ser. D, 5s, 1/1/34 | Aa2 | 3,865,000 | 4,219,691 |
| Ser. F, 5s, 7/1/29 | Aa2 | 2,000,000 | 2,233,820 |
|
| Los Angeles, Wastewater Syst. Rev. Bonds, | | | |
| Ser. B, 5s, 6/1/30 | AA | 8,000,000 | 8,923,280 |
|
| M-S-R Energy Auth. Rev. Bonds, Ser. A, | | | |
| 6 1/2s, 11/1/39 | A– | 5,000,000 | 6,313,550 |
|
| Metro. Wtr. Dist. Rev. Bonds (Southern CA Wtr. | | | |
| Wks.), 5 3/4s, 8/10/18 | AAA | 15,000,000 | 17,015,249 |
|
| Modesto, Irrigation Dist. Elec. Rev. Bonds | | | |
| Ser. A, AGM, 5s, 7/1/32 | AA | 800,000 | 867,056 |
| Ser. A, AGM, 5s, 7/1/31 | AA | 1,600,000 | 1,739,296 |
| AGM, 5s, 7/1/30 | AA | 1,220,000 | 1,333,155 |
|
| Mt. San Antonio, Cmnty College Dist. G.O. Bonds | | | |
| (Election 2008), Ser. A-13, 5s, 8/1/34 | Aa2 | 2,000,000 | 2,201,760 |
|
| Murrieta Valley, Unified School Dist. G.O. Bonds, | | | |
| AGM, zero %, 9/1/31 | AA | 6,445,000 | 2,672,677 |
|
| Murrieta, Pub. Fin. Auth. Rev. Bonds, 5s, 9/1/26 | BBB– | 1,000,000 | 1,041,050 |
|
| Napa Valley, Cmnty. College Dist. G.O. Bonds | | | |
| (Election of 2002), Ser. C, NATL | | | |
| zero %, 8/1/22 | Aa2 | 5,000 | 3,641 |
| zero %, 8/1/21 | Aa2 | 8,575,000 | 6,584,571 |
|
| North Natomas, Cmnty. Fac. Special Tax Bonds | | | |
| (Dist. No. 4), Ser. E, 5 1/4s, 9/1/33 | BBB+ | 1,500,000 | 1,563,255 |
| (Dist. No. 4), Ser. D, 5s, 9/1/33 | BBB+/P | 3,685,000 | 3,617,491 |
| Ser. D, 5s, 9/1/26 | BBB+/P | 1,710,000 | 1,714,925 |
|
| Northern CA Pwr. Agcy. Rev. Bonds (Hydroelec. | | | |
| Project No. 1), Ser. A | | | |
| 5s, 7/1/32 | A+ | 700,000 | 755,335 |
| 5s, 7/1/30 | A+ | 1,000,000 | 1,095,310 |
|
| Oakland, Swr. Rev. Bonds, Ser. A, AGM, 5s, | | | |
| 6/15/26 (Prerefunded 6/15/14) | AA | 3,690,000 | 3,726,162 |
|
| Oakland, Unified School Dist. Alameda | | | |
| Cnty., G.O. Bonds | | | |
| (Election of 2012), 6 5/8s, 8/1/38 | BBB/P | 1,000,000 | 1,165,930 |
| (Election of 2006), Ser. A, 6 1/8s, 8/1/29 | BBB/P | 4,000,000 | 4,495,760 |
|
| |
| California Tax Exempt Income Fund | 31 |
| | | |
| MUNICIPAL BONDS AND NOTES (99.1%)* cont. | Rating** | Principal amount | Value |
|
| California cont. | | | |
| Orange Cnty., Cmnty. Fac. Dist. Special Tax Bonds | | | |
| (Ladera Ranch — No. 04-1), Ser. A | | | |
| 5s, 8/15/33 | BBB | $1,750,000 | $1,865,780 |
| 5s, 8/15/32 | BBB | 1,000,000 | 1,076,630 |
|
| Orange Cnty., Trans. Auth Toll Road Rev. Bonds | | | |
| (Sr. Lien — 91 Express Lane), 5s, 8/15/29 | A1 | 1,050,000 | 1,158,056 |
|
| Pico Rivera, Pub. Fin. Auth. Lease Rev. Bonds | | | |
| 5 3/4s, 9/1/39 | A+ | 6,000,000 | 6,421,740 |
| 5 1/2s, 9/1/31 | A+ | 1,000,000 | 1,074,310 |
|
| Port of Oakland, Rev. Bonds (Sr. Lien), Ser. P | | | |
| 5s, 5/1/33 | A+ | 1,860,000 | 1,942,826 |
| 5s, 5/1/31 | A+ | 1,000,000 | 1,054,290 |
|
| Poway, Unified School Dist. G.O. Bonds (Election | | | |
| of 2008), zero %, 8/1/29 | Aa2 | 11,350,000 | 5,850,925 |
|
| Poway, Unified School Dist. Pub. Fin. Auth. | | | |
| Special Tax Bonds | | | |
| 5s, 9/15/32 | BBB | 500,000 | 507,515 |
| 5s, 9/15/28 | BBB | 1,110,000 | 1,148,850 |
|
| Rancho Cordova, Cmnty. Fac. Dist. Special Tax | | | |
| Bonds (Sunridge Anatolia), Ser. 03-1, 5s, 9/1/32 | BB+/P | 1,250,000 | 1,256,763 |
|
| Redding, Elec. Syst. Rev. Bonds, NATL, 6.368s, | | | |
| 7/1/22 (Escrowed to maturity) | AA– | 8,950,000 | 10,700,888 |
|
| Redwood City, Redev. Agcy., Tax Alloc. Bonds | | | |
| (Redev. Area 2-A), AMBAC, zero %, 7/15/22 | A– | 3,230,000 | 2,163,002 |
|
| Richmond, JT Pwrs. Fin. Auth. Rev. Bonds (Lease | | | |
| Civic Ctr.), AGO, 5 3/4s, 8/1/29 | AA | 2,000,000 | 2,255,200 |
|
| Rio Linda, Unified School Dist. G.O. Bonds | | | |
| (Election of 2006), AGM, 5s, 8/1/31 | AA | 6,000,000 | 6,196,200 |
|
| Ripon, Redev. Agcy. Tax Alloc. Bonds (Cmnty. | | | |
| Redev.), NATL, 4 3/4s, 11/1/36 | Baa1 | 1,440,000 | 1,322,179 |
|
| Riverside Cnty., Pub. Fin. Auth. COP, | | | |
| 5.8s, 5/15/29 | B–/P | 4,250,000 | 3,184,950 |
|
| Riverside Cnty., Trans. Comm. Toll Rev. Bonds, | | | |
| Ser. A, 5 3/4s, 6/1/44 | BBB– | 750,000 | 783,038 |
|
| Rohnert Pk., Cmnty. Dev. Agcy. Tax Alloc. Bonds | | | |
| (Rohnert Redev.), NATL, zero %, 8/1/25 | AA– | 1,340,000 | 776,945 |
|
| Roseville, Elec. Syst. Fin. Auth. Rev. | | | |
| Bonds, 5s, 2/1/28 | A+ | 2,895,000 | 3,203,897 |
|
| Sacramento Cnty., Arpt. Syst. Rev. Bonds | | | |
| 5s, 7/1/40 | A | 2,650,000 | 2,718,344 |
| Ser. A, AGM, 5s, 7/1/28 | AA | 1,500,000 | 1,618,035 |
| Ser. A, AGM, 5s, 7/1/26 | AA | 5,000,000 | 5,376,950 |
| Ser. A, AGM, 5s, 7/1/25 | AA | 3,990,000 | 4,302,337 |
|
| Sacramento, City Fin. Auth. Tax Alloc. Bonds | | | |
| Ser. A, FGIC, NATL, zero %, 12/1/23 | AA– | 15,815,000 | 10,086,491 |
| Ser. A, FGIC, NATL, zero %, 12/1/22 | AA– | 7,500,000 | 5,049,600 |
| (Cap. Appn.), Ser. A, FGIC, NATL, | | | |
| zero %, 12/1/19 | AA– | 5,000,000 | 4,024,700 |
|
| |
| 32 | California Tax Exempt Income Fund |
| | | |
| MUNICIPAL BONDS AND NOTES (99.1%)* cont. | Rating** | Principal amount | Value |
|
| California cont. | | | |
| Sacramento, Muni. Util. Dist. Rev. Bonds | | | |
| Ser. Y, 5s, 8/15/32 | AA– | $1,500,000 | $1,644,810 |
| Ser. B, 5s, 8/15/31 | AA– | 2,905,000 | 3,230,709 |
| Ser. Y, 5s, 8/15/31 | AA– | 500,000 | 550,920 |
| Ser. X, 5s, 8/15/28 | AA– | 1,650,000 | 1,830,906 |
|
| Sacramento, Muni. Util. Dist. Elec. Rev. Bonds, | | | |
| Ser. K, AMBAC, 5 1/4s, 7/1/24 | AA– | 11,520,000 | 13,492,799 |
|
| Sacramento, Muni. Util. Dist. Fin. Auth. Rev. Bonds | | | |
| (Cosumnes), NATL, 5s, 7/1/19 | AA– | 1,070,000 | 1,126,068 |
|
| Sacramento, Regl. Trans. Dist. Rev. Bonds | | | |
| (Farebox), 5s, 3/1/42 | A2 | 7,290,000 | 7,429,749 |
|
| San Bernardino, Cmnty. College Dist. G.O. | | | |
| Bonds (Election of 2002), Ser. A, 6 1/4s, 8/1/33 | | | |
| (Prerefunded 8/1/18) | Aa2 | 1,000,000 | 1,219,900 |
|
| San Diego Cmnty. Facs. Dist. No. 3 Special Tax | | | |
| Bonds, 5s, 9/1/36 | BBB–/P | 990,000 | 980,734 |
|
| San Diego Cnty., Regl. Arpt. Auth. Rev. Bonds, | | | |
| Ser. B, 5s, 7/1/38 | A1 | 2,000,000 | 2,085,580 |
|
| San Diego, Pub. Fac. Fin. Auth. Rev. Bonds, Ser. A | | | |
| 5 1/4s, 3/1/40 | AA– | 1,000,000 | 1,055,570 |
| 5 1/4s, 9/1/35 | AA– | 1,500,000 | 1,594,590 |
| 5 1/4s, 3/1/25 | AA– | 6,065,000 | 6,669,620 |
| 5s, 9/1/26 | AA– | 6,265,000 | 6,766,701 |
|
| San Diego, Pub. Fac. Fin. Auth. Tax Alloc. | | | |
| Bonds (Southcrest), Ser. B, Radian Insd., | | | |
| 5 1/8s, 10/1/22 | Baa3 | 1,000,000 | 1,008,740 |
|
| San Diego, Pub. Fac. Fin. Auth. Swr. Rev. | | | |
| Bonds, Ser. A | | | |
| 5 1/4s, 5/15/29 | Aa3 | 1,245,000 | 1,424,367 |
| 5 1/8s, 5/15/29 | Aa3 | 7,885,000 | 8,913,598 |
|
| San Diego, Redev. Agcy. Tax Alloc. Bonds (Centre | | | |
| City), Ser. A, SGI, 5s, 9/1/22 | A | 4,665,000 | 4,709,364 |
|
| San Diego, Unified School Dist. G.O. Bonds | | | |
| (Election of 2008), Ser. C, zero %, 7/1/44 | Aa3 | 10,000,000 | 2,193,200 |
|
| San Francisco City & Cnty. Arpt. Comm. Intl. | | | |
| Arpt. Rev. Bonds | | | |
| Ser. A, 5 1/4s, 5/1/33 | A1 | 4,000,000 | 4,307,880 |
| 5s, 5/1/29 | A1 | 5,200,000 | 5,717,712 |
|
| San Francisco City & Cnty., Redev. Agcy. Cmnty. | | | |
| Successor Special Tax Bonds (No. 6 Mission Bay | | | |
| South Pub. Impts.), Ser. A, 5s, 8/1/31 | BB+/P | 1,140,000 | 1,150,750 |
|
| San Francisco, City & Cnty. Arpt. Comm. Rev. | | | |
| Bonds (Intl. Arpt.) | | | |
| Ser. 34D, AGO, 5 1/4s, 5/1/25 | AA | 2,250,000 | 2,532,128 |
| Ser. F, 5s, 5/1/40 | A1 | 4,750,000 | 4,920,858 |
| Ser. G, 5s, 5/1/40 | A1 | 4,400,000 | 4,558,268 |
|
| San Francisco, City & Cnty. Redev. Fin. Auth. Tax | | | |
| Alloc. Bonds | | | |
| (Mission Bay North Redev.), Ser. C, | | | |
| 6 3/4s, 8/1/41 | A– | 1,000,000 | 1,157,000 |
| (Mission Bay South), Ser. D, 6 5/8s, 8/1/39 | BBB+ | 1,250,000 | 1,349,925 |
|
| |
| California Tax Exempt Income Fund | 33 |
| | | |
| MUNICIPAL BONDS AND NOTES (99.1%)* cont. | Rating** | Principal amount | Value |
|
| California cont. | | | |
| San Francisco, City & Cnty., Redev. Agcy. Cmnty. | | | |
| Successor Tax Alloc. Bonds (Mission Bay’s), | | | |
| Ser. A, 5s, 8/1/43 | BBB+ | $1,750,000 | $1,812,755 |
|
| San Joaquin Cnty., Trans. Auth. Rev. Bonds, Ser. A, | | | |
| 5 1/2s, 3/1/41 | AA | 7,000,000 | 7,757,470 |
|
| San Joaquin Hills, Trans. Corridor Agcy. Rev. | | | |
| Bonds (Toll Road), Ser. A, 5s, 1/1/33 | BB– | 15,125,000 | 14,045,528 |
|
| San Jose, Redev. Agcy. Tax Alloc. Bonds (Merged | | | |
| Area Redev.), Ser. B, Radian Insd., 5s, 8/1/32 | BBB | 3,935,000 | 3,897,460 |
|
| San Juan, Basin Auth. Rev. Bonds (Ground Wtr. | | | |
| Recvy.), AMBAC, 5s, 12/1/34 | A/P | 1,000,000 | 999,980 |
|
| San Mateo Cnty., Cmnty. College G.O. Bonds | | | |
| (Election of 2005) | | | |
| Ser. B, NATL, zero %, 9/1/27 | Aaa | 10,545,000 | 6,440,886 |
| Ser. A, NATL, zero %, 9/1/26 | Aaa | 4,000,000 | 2,562,600 |
|
| Santa Barbara Cnty., Waterfront COP, AMBAC, | | | |
| 5s, 10/1/27 | A3 | 4,590,000 | 4,592,479 |
|
| Santa Clara, Elec. Rev. Rev. Bonds, Ser. A | | | |
| 6s, 7/1/31 | A+ | 2,500,000 | 2,898,475 |
| 5 1/4s, 7/1/32 | A+ | 4,000,000 | 4,356,120 |
|
| Santaluz, Cmnty. Facs. Dist. No. 2 Special | | | |
| Tax Rev. Bonds | | | |
| (Impt. Area No. 3), Ser. B, 6.2s, 9/1/30 | BBB/P | 495,000 | 497,599 |
| (Impt. Area No. 3), Ser. B, 6.1s, 9/1/21 | BBB/P | 500,000 | 503,775 |
| (Impt. Area No. 1), Ser. A, 5 1/4s, 9/1/27 | | | |
| (Prerefunded 9/1/21) | BBB+ | 3,285,000 | 3,451,352 |
| (Impt. Area No. 1), Ser. A, 5 1/4s, 9/1/26 | | | |
| (Prerefunded 9/1/21) | BBB+ | 1,490,000 | 1,578,968 |
| (Impt. Area No. 1), Ser. A, 5.1s, 9/1/30 | | | |
| (Prerefunded 9/1/21) | BBB+ | 490,000 | 503,362 |
|
| Saugus, Unified School Dist. G.O. Bonds, FGIC, | | | |
| NATL, zero %, 8/1/24 | Aa2 | 1,210,000 | 823,574 |
|
| Semitropic, Impt. Dist. Wtr. Storage Rev. | | | |
| Bonds, Ser. A | | | |
| SGI, 5 1/8s, 12/1/35 (Prerefunded 12/1/14) | A+ | 3,000,000 | 3,099,180 |
| 5s, 12/1/35 | A+ | 12,000,000 | 12,592,559 |
|
| Solano, Cmnty. College Dist. G.O. Bonds (Election | | | |
| of 2002), Ser. B, FGIC, NATL, zero %, 8/1/25 | Aa3 | 9,020,000 | 5,272,190 |
|
| South Orange Cnty., Pub. Fin. Auth. Special Tax | | | |
| Bonds, Ser. A | | | |
| 5s, 8/15/32 | BBB+ | 1,000,000 | 1,044,820 |
| 5s, 8/15/30 | BBB+ | 1,130,000 | 1,196,659 |
|
| Southern CA Pub. Pwr. Auth. Rev. Bonds | | | |
| (Natural Gas No. 1), Ser. A, 5 1/4s, 11/1/24 | A– | 2,850,000 | 3,201,833 |
| (Natural Gas), Ser. A, 5 1/4s, 11/1/21 | A– | 1,500,000 | 1,706,505 |
| Ser. A, 5s, 7/1/40 | AA– | 6,860,000 | 7,340,955 |
|
| Stockton, Pub. Wtr. Fin. Auth. Rev. Bonds (Delta | | | |
| Wtr. Supply), Ser. A | | | |
| 6 1/4s, 10/1/40 | A– | 1,250,000 | 1,383,900 |
| 6 1/4s, 10/1/38 | A– | 2,235,000 | 2,483,398 |
| 6 1/8s, 10/1/35 | A– | 750,000 | 829,283 |
|
| |
| 34 | California Tax Exempt Income Fund |
| | | |
| MUNICIPAL BONDS AND NOTES (99.1%)* cont. | Rating** | Principal amount | Value |
|
| California cont. | | | |
| Stockton, Unified School Dist. G.O. Bonds | | | |
| (Election 2012), Ser. A, AGM, 5s, 8/1/38 | AA | $1,000,000 | $1,045,930 |
|
| Sunnyvale, Cmnty. Fac. Dist. Special Tax Rev. | | | |
| Bonds, 7.65s, 8/1/21 | B+/P | 3,875,000 | 3,881,200 |
|
| Tobacco Securitization Auth. of Southern | | | |
| CA Rev. Bonds | | | |
| Class A1-SNR, 5 1/8s, 6/1/46 | B+ | 5,000,000 | 3,746,200 |
| Ser. A1-SNR, 5s, 6/1/37 | BB+ | 2,000,000 | 1,529,520 |
|
| Tracy, Operational Partnership, Joint Powers Auth. | | | |
| Lease Rev. Bonds, AGO | | | |
| 6 3/8s, 10/1/38 | AA | 2,200,000 | 2,493,194 |
| 6 1/4s, 10/1/33 | AA | 3,000,000 | 3,423,360 |
|
| Tuolumne Wind Project Auth. Rev. Bonds | | | |
| (Tuolumne Co.), Ser. A | | | |
| 5 7/8s, 1/1/29 | A+ | 6,000,000 | 6,877,260 |
| 5 5/8s, 1/1/29 | A+ | 1,000,000 | 1,127,960 |
|
| Turlock, Irrigation Dist. Rev. Bonds, | | | |
| Ser. A, 5s, 1/1/40 | A+ | 14,640,000 | 15,095,596 |
|
| Twin Rivers, Unified School Dist. G.O. Bonds, | | | |
| Ser. A, 5s, 8/1/40 | AA | 2,000,000 | 2,121,020 |
|
| U. of CA Rev. Bonds | | | |
| Ser. O, 5 1/4s, 5/15/39 | Aa2 | 10,000,000 | 10,730,600 |
| Ser. AI, 5s, 5/15/32 | Aa2 | 3,000,000 | 3,365,970 |
|
| Ventura Cnty., COP (Pub. Fin. Auth. III) | | | |
| 5 3/4s, 8/15/29 | AA+ | 1,500,000 | 1,674,645 |
| 5 3/4s, 8/15/28 | AA+ | 1,745,000 | 1,970,088 |
|
| West Kern, Cmnty. Coll. Dist. G.O. Bonds (Election | | | |
| of 2004), Ser. B, SGI, zero %, 11/1/24 | A1 | 2,395,000 | 1,465,285 |
|
| Yucaipa Special Tax Bonds (Cmnty. Fac. Dist. No. | | | |
| 98-1 Chapman Heights), 5 3/8s, 9/1/30 | BBB+ | 2,350,000 | 2,452,672 |
|
| | | | 1,323,806,007 |
| Guam (0.3%) | | | |
| Territory of GU, Bus. Privilege Tax Rev. Bonds, | | | |
| Ser. A, 5s, 1/1/31 | A | 1,000,000 | 1,032,980 |
|
| Territory of GU, Govt. Wtr. Wks. Auth. Wtr. & | | | |
| Waste Wtr. Syst. Rev. Bonds, 5 5/8s, 7/1/40 | A– | 2,450,000 | 2,539,032 |
|
| Territory of GU, Pwr. Auth. Rev. Bonds, Ser. A, | | | |
| 5s, 10/1/30 | AA | 1,000,000 | 1,052,280 |
|
| | | | 4,624,292 |
| Mississippi (0.2%) | | | |
| Jackson Cnty., Port Fac. VRDN (Chevron USA, | | | |
| Inc.), 0.07s, 6/1/23 | P–1 | 3,200,000 | 3,200,000 |
|
| | | | 3,200,000 |
| Missouri (0.3%) | | | |
| MO State Hlth. & Edl. Fac. Auth. VRDN | | | |
| (Washington U. (The)), Ser. C, 0.95s, 9/1/30 | VMIG1 | 3,500,000 | 3,500,000 |
|
| | | | 3,500,000 |
| Puerto Rico (1.2%) | | | |
| Children’s Trust Fund Tobacco Settlement | | | |
| (The) Rev. Bonds (Asset Backed Bonds), | | | |
| 5 5/8s, 5/15/43 | Ba2 | 4,000,000 | 3,474,920 |
|
| |
| California Tax Exempt Income Fund | 35 |
| | | |
| MUNICIPAL BONDS AND NOTES (99.1%)* cont. | Rating** | Principal amount | Value |
|
| Puerto Rico cont. | | | |
| Cmnwlth. of PR, Aqueduct & Swr. Auth. Rev. | | | |
| Bonds, Ser. A, 6s, 7/1/38 | BB+ | $2,350,000 | $1,759,892 |
|
| Cmnwlth. of PR, Elec. Pwr. Auth. Rev. Bonds, | | | |
| Ser. AAA, 5 1/4s, 7/1/28 | BBB | 3,290,000 | 2,152,910 |
|
| Cmnwlth. of PR, Hwy. & Trans. Auth. Rev. Bonds, | | | |
| Ser. AA, 5s, 7/1/28 | Ba1 | 1,200,000 | 882,324 |
|
| Cmnwlth. of PR, Sales Tax Fin. Corp. Rev. | | | |
| Bonds, Ser. C | | | |
| 5 1/4s, 8/1/40 | AA– | 6,250,000 | 5,319,187 |
| 5s, 8/1/40 | AA– | 3,915,000 | 3,212,766 |
|
| | | | 16,801,999 |
| Texas (0.3%) | | | |
| Tarrant Cnty., Cultural Ed. Fac. Fin. Corp. VRDN | | | |
| (TX Hlth. Resources), Ser. C, 0.09s, 11/15/33 | VMIG1 | 4,105,000 | 4,105,000 |
|
| | | | 4,105,000 |
| Virgin Islands (0.2%) | | | |
| VI Pub. Fin. Auth. Rev. Bonds, Ser. A, 5s, 10/1/25 | Baa2 | 2,000,000 | 2,127,500 |
|
| | | | 2,127,500 |
| Wyoming (0.3%) | | | |
| Uinta Cnty., Poll. Control VRDN (Chevron Corp.), | | | |
| 0.07s, 8/15/20 | P–1 | 4,000,000 | 4,000,000 |
|
| | | | 4,000,000 |
| |
| TOTAL INVESTMENTS | | | |
|
| Total investments (cost $1,261,361,129) | | | $1,362,164,798 |
Notes to the fund’s portfolio
Unless noted otherwise, the notes to the fund’s portfolio are for the close of the fund’s reporting period, which ran from October 1, 2013 through March 31, 2014 (the reporting period). Within the following notes to the portfolio, references to “ASC 820” represent Accounting Standards Codification 820 Fair Value Measurements and Disclosures and references to “OTC”, if any, represent over-the-counter.
* Percentages indicated are based on net assets of $1,375,122,245.
** The Moody’s, Standard & Poor’s or Fitch ratings indicated are believed to be the most recent ratings available at the close of the reporting period for the securities listed. Ratings are generally ascribed to securities at the time of issuance. While the agencies may from time to time revise such ratings, they undertake no obligation to do so, and the ratings do not necessarily represent what the agencies would ascribe to these securities at the close of the reporting period. Securities rated by Putnam are indicated by “/P.” Securities rated by Fitch are indicated by “/F.” The rating of an insured security represents what is believed to be the most recent rating of the insurer’s claims-paying ability available at the close of the reporting period, if higher than the rating of the direct issuer of the bond, and does not reflect any subsequent changes. Security ratings are defined in the Statement of Additional Information.
144A after the name of an issuer represents securities exempt from registration under Rule 144A under the Securities Act of 1933, as amended. These securities may be resold in transactions exempt from registration, normally to qualified institutional buyers.
The rates shown on Mandatory Put Bonds are the current interest rates at the close of the reporting period.
The dates shown parenthetically on Mandatory Put Bonds represent the next mandatory put dates.
The dates shown parenthetically on prerefunded bonds represent the next prerefunding dates.
The dates shown on debt obligations are the original maturity dates.
| |
| 36 | California Tax Exempt Income Fund |
The fund had the following sector concentrations greater than 10% at the close of the reporting period (as a percentage of net assets):
| |
| Utilities | 17.3% |
| State debt | 15.7 |
| Health care | 13.3 |
| Local debt | 11.9 |
ASC 820 establishes a three-level hierarchy for disclosure of fair value measurements. The valuation hierarchy is based upon the transparency of inputs to the valuation of the fund’s investments. The three levels are defined as follows:
Level 1: Valuations based on quoted prices for identical securities in active markets.
Level 2: Valuations based on quoted prices in markets that are not active or for which all significant inputs are observable, either directly or indirectly.
Level 3: Valuations based on inputs that are unobservable and significant to the fair value measurement.
The following is a summary of the inputs used to value the fund’s net assets as of the close of the reporting period:
| | | |
| | | Valuation inputs | |
|
| Investments in securities: | Level 1 | Level 2 | Level 3 |
|
| Municipal bonds and notes | $— | $1,362,164,798 | $— |
|
| Totals by level | $— | $1,362,164,798 | $— |
The accompanying notes are an integral part of these financial statements.
| |
| California Tax Exempt Income Fund | 37 |
Statement of assets and liabilities 3/31/14 (Unaudited)
| |
| ASSETS | |
|
| Investment in securities, at value (Note 1): | |
| Unaffiliated issuers (identified cost $1,261,361,129) | $1,362,164,798 |
|
| Cash | 3,624,310 |
|
| Interest and other receivables | 18,481,146 |
|
| Prepaid assets | 9,116 |
|
| Receivable for shares of the fund sold | 1,600,515 |
|
| Total assets | 1,385,879,885 |
| |
| LIABILITIES | |
|
| Payable for investments purchased | 5,632,570 |
|
| Payable for shares of the fund repurchased | 2,107,574 |
|
| Payable for compensation of Manager (Note 2) | 505,370 |
|
| Payable for custodian fees (Note 2) | 3,965 |
|
| Payable for investor servicing fees (Note 2) | 115,017 |
|
| Payable for Trustee compensation and expenses (Note 2) | 458,230 |
|
| Payable for administrative services (Note 2) | 2,198 |
|
| Payable for distribution fees (Note 2) | 725,192 |
|
| Distributions payable to shareholders | 1,095,948 |
|
| Other accrued expenses | 111,576 |
|
| Total liabilities | 10,757,640 |
| | |
| Net assets | $1,375,122,245 |
|
| |
| REPRESENTED BY | |
|
| Paid-in capital (Unlimited shares authorized) (Notes 1 and 4) | $1,334,252,061 |
|
| Undistributed net investment income (Note 1) | 4,976,361 |
|
| Accumulated net realized loss on investments (Note 1) | (64,909,846) |
|
| Net unrealized appreciation of investments | 100,803,669 |
|
| Total — Representing net assets applicable to capital shares outstanding | $1,375,122,245 |
| |
| COMPUTATION OF NET ASSET VALUE AND OFFERING PRICE | |
|
| Net asset value and redemption price per class A share | |
| ($1,273,639,202 divided by 159,404,896 shares) | $7.99 |
|
| Offering price per class A share (100/96.00 of $7.99)* | $8.32 |
|
| Net asset value and offering price per class B share ($6,735,389 divided by 843,745 shares)** | $7.98 |
|
| Net asset value and offering price per class C share ($43,554,139 divided by 5,422,835 shares)** | $8.03 |
|
| Net asset value and redemption price per class M share ($2,707,521 divided by 339,768 shares) | $7.97 |
|
| Offering price per class M share (100/96.75 of $7.97)† | $8.24 |
|
| Net asset value, offering price and redemption price per class Y share | |
| ($48,485,994 divided by 6,053,603 shares) | $8.01 |
|
* On single retail sales of less than $100,000. On sales of $100,000 or more the offering price is reduced.
** Redemption price per share is equal to net asset value less any applicable contingent deferred sales charge.
† On single retail sales of less than $50,000. On sales of $50,000 or more the offering price is reduced.
The accompanying notes are an integral part of these financial statements.
| |
| 38 | California Tax Exempt Income Fund |
Statement of operations Six months ended 3/31/14 (Unaudited)
| |
| INTEREST INCOME | $33,696,172 |
|
| EXPENSES | |
|
| Compensation of Manager (Note 2) | $3,020,180 |
|
| Investor servicing fees (Note 2) | 350,224 |
|
| Custodian fees (Note 2) | 7,925 |
|
| Trustee compensation and expenses (Note 2) | 51,528 |
|
| Distribution fees (Note 2) | 1,655,336 |
|
| Administrative services (Note 2) | 20,368 |
|
| Interest and fees expense (Note 2) | 18,578 |
|
| Other | 176,337 |
|
| Total expenses | 5,300,476 |
| | |
| Expense reduction (Note 2) | (1,321) |
|
| Net expenses | 5,299,155 |
| | |
| Net investment income | 28,397,017 |
|
| |
| Net realized gain on investments (Notes 1 and 3) | 723,768 |
|
| Net unrealized appreciation of investments during the period | 30,871,513 |
|
| Net gain on investments | 31,595,281 |
| | |
| Net increase in net assets resulting from operations | $59,992,298 |
|
The accompanying notes are an integral part of these financial statements.
| |
| California Tax Exempt Income Fund | 39 |
Statement of changes in net assets
| | |
| DECREASE IN NET ASSETS | Six months ended 3/31/14* | Year ended 9/30/13 |
|
| Operations: | | |
| Net investment income | $28,397,017 | $66,182,226 |
|
| Net realized gain on investments | 723,768 | 467,722 |
|
| Net unrealized appreciation (depreciation) of investments | 30,871,513 | (107,755,169) |
|
| Net increase (decrease) in net assets resulting | | |
| from operations | 59,992,298 | (41,105,221) |
|
| Distributions to shareholders (Note 1): | | |
| From ordinary income | | |
| Taxable net investment income | | |
|
| Class A | (409,586) | (449,977) |
|
| Class B | (2,231) | (2,532) |
|
| Class C | (13,699) | (17,269) |
|
| Class M | (840) | (884) |
|
| Class Y | (15,055) | (17,032) |
|
| From tax-exempt net investment income | | |
| Class A | (26,082,363) | (60,484,380) |
|
| Class B | (118,250) | (282,787) |
|
| Class C | (716,030) | (1,816,311) |
|
| Class M | (49,544) | (109,057) |
|
| Class Y | (1,017,706) | (2,487,802) |
|
| Decrease from capital share transactions (Note 4) | (106,468,064) | (161,018,450) |
|
| Total decrease in net assets | (74,901,070) | (267,791,702) |
| |
| NET ASSETS | | |
|
| Beginning of period | 1,450,023,315 | 1,717,815,017 |
|
| End of period (including undistributed net investment | | |
| income of $4,976,361 and $5,004,648, respectively) | $1,375,122,245 | $1,450,023,315 |
|
* Unaudited.
The accompanying notes are an integral part of these financial statements.
| |
| 40 | California Tax Exempt Income Fund |
|
| This page left blank intentionally. |
| |
| California Tax Exempt Income Fund | 41 |
Financial highlights (For a common share outstanding throughout the period)
| | | | | | | | | | | | | | | |
| INVESTMENT OPERATIONS: | | LESS DISTRIBUTIONS: | | | | | RATIOS AND SUPPLEMENTAL DATA: |
|
| | | | | | | | | | | | | | | Ratio of | |
| | Net asset | | Net realized | | | | | | | | | | Ratio | net investment | |
| | value, | | and unrealized | Total from | From | From | | | | | Total return | Net assets, | of expenses | income (loss) | |
| | beginning | Net investment | gain (loss) | investment | net investment | net realized gain | Total | Redemption | Non-recurring | Net asset value, | at net asset | end of period | to average | to average | Portfolio |
| Period ended | of period | income (loss) | on investments | operations | income | on investments | distributions | fees | reimbursements | end of period | value (%) a | (in thousands) | net assets (%) b,c | net assets (%) c | turnover (%) |
|
| Class A | | | | | | | | | | | | | | | |
| March 31, 2014** | $7.81 | .16 | .18 | .34 | (.16) | — | (.16) | — | — | $7.99 | 4.42 * | $1,273,639 | .37 * | 2.05 * | 8 * |
| September 30, 2013 | 8.34 | .33 | (.53) | (.20) | (.33) | — | (.33) | — | — | 7.81 | (2.50) | 1,338,414 | .74 | 4.03 | 11 |
| September 30, 2012 | 7.83 | .34 | .51 | .85 | (.34) | — | (.34) | — | — | 8.34 | 11.12 | 1,591,810 | .75 | 4.30 | 6 |
| September 30, 2011 | 7.99 | .36 | (.16) | .20 | (.36) | — | (.36) | — | — d | 7.83 | 2.75 | 1,466,160 | .75 | 4.77 | 9 |
| September 30, 2010 | 7.93 | .36 | .07 | .43 | (.37) | — | (.37) | — e | — | 7.99 | 5.64 | 1,627,229 | .76 | 4.74 | 16 |
| September 30, 2009 | 7.30 | .36 | .62 | .98 | (.35) | — | (.35) | — e | — | 7.93 | 14.12 | 1,655,447 | .80 f | 4.98 f | 26 |
|
| Class B | | | | | | | | | | | | | | | |
| March 31, 2014** | $7.80 | .14 | .18 | .32 | (.14) | — | (.14) | — | — | $7.98 | 4.09 * | $6,735 | .69 * | 1.73 * | 8 * |
| September 30, 2013 | 8.34 | .28 | (.54) | (.26) | (.28) | — | (.28) | — | — | 7.80 | (3.24) | 7,255 | 1.37 | 3.40 | 11 |
| September 30, 2012 | 7.83 | .29 | .51 | .80 | (.29) | — | (.29) | — | — | 8.34 | 10.42 | 8,749 | 1.38 | 3.67 | 6 |
| September 30, 2011 | 7.98 | .31 | (.15) | .16 | (.31) | — | (.31) | — | — d | 7.83 | 2.24 | 8,615 | 1.38 | 4.15 | 9 |
| September 30, 2010 | 7.92 | .31 | .07 | .38 | (.32) | — | (.32) | — e | — | 7.98 | 4.97 | 15,928 | 1.39 | 4.14 | 16 |
| September 30, 2009 | 7.29 | .31 | .63 | .94 | (.31) | — | (.31) | — e | — | 7.92 | 13.37 | 29,276 | 1.44 f | 4.35 f | 26 |
|
| Class C | | | | | | | | | | | | | | | |
| March 31, 2014** | $7.85 | .13 | .18 | .31 | (.13) | — | (.13) | — | — | $8.03 | 3.99 * | $43,554 | .76 * | 1.65 * | 8 * |
| September 30, 2013 | 8.38 | .27 | (.53) | (.26) | (.27) | — | (.27) | — | — | 7.85 | (3.25) | 47,175 | 1.52 | 3.25 | 11 |
| September 30, 2012 | 7.87 | .28 | .51 | .79 | (.28) | — | (.28) | — | — | 8.38 | 10.19 | 56,923 | 1.53 | 3.51 | 6 |
| September 30, 2011 | 8.03 | .30 | (.16) | .14 | (.30) | — | (.30) | — | — d | 7.87 | 1.95 | 45,516 | 1.53 | 3.99 | 9 |
| September 30, 2010 | 7.96 | .30 | .08 | .38 | (.31) | — | (.31) | — e | — | 8.03 | 4.95 | 51,872 | 1.54 | 3.95 | 16 |
| September 30, 2009 | 7.33 | .30 | .63 | .93 | (.30) | — | (.30) | — e | — | 7.96 | 13.18 | 44,289 | 1.59 f | 4.18 f | 26 |
|
| Class M | | | | | | | | | | | | | | | |
| March 31, 2014** | $7.79 | .15 | .18 | .33 | (.15) | — | (.15) | — | — | $7.97 | 4.28 * | $2,708 | .51 * | 1.91 * | 8 * |
| September 30, 2013 | 8.32 | .31 | (.53) | (.22) | (.31) | — | (.31) | — | — | 7.79 | (2.78) | 2,606 | 1.02 | 3.75 | 11 |
| September 30, 2012 | 7.81 | .32 | .51 | .83 | (.32) | — | (.32) | — | — | 8.32 | 10.83 | 3,341 | 1.03 | 4.00 | 6 |
| September 30, 2011 | 7.97 | .34 | (.16) | .18 | (.34) | — | (.34) | — | — d | 7.81 | 2.45 | 2,590 | 1.03 | 4.48 | 9 |
| September 30, 2010 | 7.91 | .34 | .06 | .40 | (.34) | — | (.34) | — e | — | 7.97 | 5.34 | 3,011 | 1.04 | 4.46 | 16 |
| September 30, 2009 | 7.28 | .34 | .62 | .96 | (.33) | — | (.33) | — e | — | 7.91 | 13.81 | 3,775 | 1.09 f | 4.69 f | 26 |
|
| Class Y | | | | | | | | | | | | | | | |
| March 31, 2014** | $7.83 | .17 | .18 | .35 | (.17) | — | (.17) | — | — | $8.01 | 4.52 * | $48,486 | .26 * | 2.15 * | 8 * |
| September 30, 2013 | 8.36 | .35 | (.53) | (.18) | (.35) | — | (.35) | — | — | 7.83 | (2.28) | 54,574 | .52 | 4.25 | 11 |
| September 30, 2012 | 7.85 | .36 | .51 | .87 | (.36) | — | (.36) | — | — | 8.36 | 11.30 | 56,992 | .53 | 4.49 | 6 |
| September 30, 2011 | 8.01 | .38 | (.16) | .22 | (.38) | — | (.38) | — | — d | 7.85 | 2.99 | 34,064 | .53 | 4.98 | 9 |
| September 30, 2010 | 7.94 | .38 | .07 | .45 | (.38) | — | (.38) | — e | — | 8.01 | 6.01 | 24,888 | .54 | 4.95 | 16 |
| September 30, 2009 | 7.31 | .37 | .63 | 1.00 | (.37) | — | (.37) | — e | — | 7.94 | 14.34 | 18,410 | .59 f | 5.18 f | 26 |
|
See notes to financial highlights at the end of this section.
The accompanying notes are an integral part of these financial statements.
| | | |
| 42 | California Tax Exempt Income Fund | California Tax Exempt Income Fund | 43 |
Financial highlights (Continued)
* Not annualized.
** Unaudited.
a Total return assumes dividend reinvestment and does not reflect the effect of sales charges.
b Includes amounts paid through expense offset arrangements (Note 2). Also excludes acquired fund fees, if any.
c Includes interest and fees expense associated with borrowings which amounted to the following (Note 1):
| |
| | Percentage of |
| | average net assets |
|
| March 31, 2014 | <0.01% |
|
| September 30, 2013 | <0.01 |
|
| September 30, 2012 | <0.01 |
|
| September 30, 2011 | <0.01 |
|
| September 30, 2010 | <0.01 |
|
| September 30, 2009 | <0.01 |
|
d Reflects a non-recurring reimbursement related to restitution amounts in connection with a distribution plan approved by the Securities and Exchange Commission (the SEC) which amounted to less than $0.01 per share outstanding on July 21, 2011. Also reflects a non-recurring reimbursement related to short-term trading related lawsuits, which amounted to less than $0.01 per share outstanding on May 11, 2011.
e Amount represents less than $0.01 per share.
f Reflects an involuntary contractual expense limitation in effect during the period. As a result of such limitation, the expenses of each class of the fund reflect a reduction as of the following amounts (Note 2):
| |
| | Percentage of |
| | average net assets |
|
| September 30, 2010 | 0.01% |
|
| September 30, 2009 | <0.01 |
|
The accompanying notes are an integral part of these financial statements.
| |
| 44 | California Tax Exempt Income Fund |
Notes to financial statements 3/31/14 (Unaudited)
Within the following Notes to financial statements, references to “State Street” represent State Street Bank and Trust Company, references to “the SEC” represent the Securities and Exchange Commission, references to “Putnam Management” represent Putnam Investment Management, LLC, the fund’s manager, an indirect wholly-owned subsidiary of Putnam Investments, LLC and references to “OTC”, if any, represent over-the-counter. Unless otherwise noted, the “reporting period” represents the period from October 1, 2013 through March 31, 2014.
Putnam California Tax Exempt Income Fund (the fund) is a Massachusetts business trust, which is registered under the Investment Company Act of 1940, as amended, as a diversified open-end management investment company. The investment objective of the fund is to seek as high a level of current income exempt from federal income tax and California personal income tax as Putnam Management believes to be consistent with preservation of capital. The fund invests mainly in bonds that pay interest that is exempt from federal income tax and California personal income tax (but that may be subject to federal alternative minimum tax (AMT)), are investment-grade in quality, and have intermediate- to long-term maturities (three years or longer). Putnam Management may consider, among other factors, credit, interest rate and prepayment risks, as well as general market conditions, when deciding whether to buy or sell investments.
The fund offers class A, class B, class C, class M and class Y shares. Class A and class M shares are sold with a maximum front-end sales charge of 4.00% and 3.25%, respectively, and generally do not pay a contingent deferred sales charge. Class B shares, which convert to class A shares after approximately eight years, do not pay a front-end sales charge and are subject to a contingent deferred sales charge if those shares are redeemed within six years of purchase. Class C shares have a one-year 1.00% contingent deferred sales charge and do not convert to class A shares. The expenses for class A, class B, class C, and class M shares may differ based on the distribution fee of each class, which is identified in Note 2. Class Y shares, which are sold at net asset value, are generally subject to the same expenses as class A, class B, class C, and class M shares, but do not bear a distribution fee. Class Y shares are not available to all investors.
In the normal course of business, the fund enters into contracts that may include agreements to indemnify another party under given circumstances. The fund’s maximum exposure under these arrangements is unknown as this would involve future claims that may be, but have not yet been, made against the fund. However, the fund’s management team expects the risk of material loss to be remote.
Note 1: Significant accounting policies
The following is a summary of significant accounting policies consistently followed by the fund in the preparation of its financial statements. The preparation of financial statements is in conformity with accounting principles generally accepted in the United States of America and requires management to make estimates and assumptions that affect the reported amounts of assets and liabilities in the financial statements and the reported amounts of increases and decreases in net assets from operations. Actual results could differ from those estimates. Subsequent events after the Statement of assets and liabilities date through the date that the financial statements were issued have been evaluated in the preparation of the financial statements.
Investment income, realized and unrealized gains and losses and expenses of the fund are borne pro-rata based on the relative net assets of each class to the total net assets of the fund, except that each class bears expenses unique to that class (including the distribution fees applicable to such classes). Each class votes as a class only with respect to its own distribution plan or other matters on which a class vote is required by law or determined by the Trustees. If the fund were liquidated, shares of each class would receive their pro-rata share of the net assets of the fund. In addition, the Trustees declare separate dividends on each class of shares.
Security valuation Tax-exempt bonds and notes are generally valued on the basis of valuations provided by an independent pricing service approved by the Trustees. Such services use information with respect to transactions in bonds, quotations from bond dealers, market transactions in comparable securities and various relationships between securities in determining value. These securities will generally be categorized as Level 2.
Certain investments, including certain restricted and illiquid securities and derivatives, are also valued at fair value following procedures approved by the Trustees. Such valuations and procedures are reviewed periodically by the Trustees. These valuations consider such factors as significant market or specific security events such as interest rate or credit quality changes, various relationships with other securities, discount rates, U.S. Treasury, U.S. swap and credit yields, index levels, convexity exposures and recovery rates. These securities are classified as Level 2 or as Level 3 depending on the priority of the significant inputs. The fair value of securities is generally determined
| |
| California Tax Exempt Income Fund | 45 |
as the amount that the fund could reasonably expect to realize from an orderly disposition of such securities over a reasonable period of time. By its nature, a fair value price is a good faith estimate of the value of a security in a current sale and does not reflect an actual market price, which may be different by a material amount.
Security transactions and related investment income Security transactions are recorded on the trade date (the date the order to buy or sell is executed). Gains or losses on securities sold are determined on the identified cost basis.
Interest income is recorded on the accrual basis. All premiums/discounts are amortized/accreted on a yield-to-maturity basis. The premium in excess of the call price, if any, is amortized to the call date; thereafter, any remaining premium is amortized to maturity.
Tender option bond transactions The fund may participate in transactions whereby a fixed-rate bond is transferred to a tender option bond trust (TOB trust) sponsored by a broker. The TOB trust funds the purchase of the fixed rate bonds by issuing floating-rate bonds to third parties and allowing the fund to retain the residual interest in the TOB trust’s assets and cash flows, which are in the form of inverse floating rate bonds. The inverse floating rate bonds held by the fund give the fund the right to (1) cause the holders of the floating rate bonds to tender their notes at par, and (2) to have the fixed-rate bond held by the TOB trust transferred to the fund, causing the TOB trust to collapse. The fund accounts for the transfer of the fixed-rate bond to the TOB trust as a secured borrowing by including the fixed-rate bond in the fund’s portfolio and including the floating rate bond as a liability in the Statement of assets and liabilities. At the close of the reporting period, the fund no longer holds investments in TOB trusts. For the reporting period ended, the fund incurred interest expense of $18,578 for these investments based on an average interest rate of 0.06%.
Interfund lending The fund, along with other Putnam funds, may participate in an interfund lending program pursuant to an exemptive order issued by the SEC. This program allows the fund to borrow from other Putnam funds that permit such transactions. Interfund lending transactions are subject to each fund’s investment policies and borrowing and lending limits. Interest earned or paid on the interfund lending transaction will be based on the average of certain current market rates. During the reporting period, the fund did not utilize the program.
Line of credit The fund participates, along with other Putnam funds, in a $315 million unsecured committed line of credit and a $185 million unsecured uncommitted line of credit, both provided by State Street. Borrowings may be made for temporary or emergency purposes, including the funding of shareholder redemption requests and trade settlements. Interest is charged to the fund based on the fund’s borrowing at a rate equal to the Federal Funds rate plus 1.25% for the committed line of credit and the Federal Funds rate plus 1.30% for the uncommitted line of credit. A closing fee equal to 0.02% of the committed line of credit and $50,000 for the uncommitted line of credit has been paid by the participating funds. In addition, a commitment fee of 0.11% per annum on any unutilized portion of the committed line of credit is allocated to the participating funds based on their relative net assets and paid quarterly. During the reporting period, the fund had no borrowings against these arrangements.
Federal taxes It is the policy of the fund to distribute all of its income within the prescribed time period and otherwise comply with the provisions of the Internal Revenue Code of 1986, as amended (the Code), applicable to regulated investment companies. It is also the intention of the fund to distribute an amount sufficient to avoid imposition of any excise tax under Section 4982 of the Code.
The fund is subject to the provisions of Accounting Standards Codification 740 Income Taxes (ASC 740). ASC 740 sets forth a minimum threshold for financial statement recognition of the benefit of a tax position taken or expected to be taken in a tax return. The fund did not have a liability to record for any unrecognized tax benefits in the accompanying financial statements. No provision has been made for federal taxes on income, capital gains or unrealized appreciation on securities held nor for excise tax on income and capital gains. Each of the fund’s federal tax returns for the prior three fiscal years remains subject to examination by the Internal Revenue Service.
| |
| 46 | California Tax Exempt Income Fund |
At September 30, 2013, the fund had a capital loss carryover of $58,231,947 available to the extent allowed by the Code to offset future net capital gain, if any. The amounts of the carryovers and the expiration dates are:
| | | |
| Loss carryover |
|
| Short-term | Long-term | Total | Expiration |
|
| $2,292,763 | $10,748,879 | $13,041,642 | * |
|
| 766,815 | N/A | 766,815 | September 30, 2016 |
|
| 12,478,683 | N/A | 12,478,683 | September 30, 2017 |
|
| 1,872,123 | N/A | 1,872,123 | September 30, 2018 |
|
| 30,072,684 | N/A | 30,072,684 | September 30, 2019 |
|
* Under the Regulated Investment Company Modernization Act of 2010, the fund will be permitted to carry forward capital losses incurred in taxable years beginning after December 22, 2010 for an unlimited period. However, any losses incurred will be required to be utilized prior to the losses incurred in pre-enactment tax years. As a result of this ordering rule, pre-enactment capital loss carryforwards may be more likely to expire unused. Additionally, post-enactment capital losses that are carried forward will retain their character as either short-term or long-term capital losses rather than being considered all short-term as under previous law.
Pursuant to federal income tax regulations applicable to regulated investment companies, the fund has elected to defer certain capital losses of $6,394,360 recognized during the period between November 1, 2012 and September 30, 2013 to its fiscal year ending September 30, 2014.
The aggregate identified cost on a tax basis is $1,261,368,550, resulting in gross unrealized appreciation and depreciation of $110,639,981 and $9,843,733, respectively, or net unrealized appreciation of $100,796,248.
Distributions to shareholders Income dividends are recorded daily by the fund and are paid monthly. Distributions from capital gains, if any, are recorded on the ex-dividend date and paid at least annually. The amount and character of income and gains to be distributed are determined in accordance with income tax regulations which may differ from generally accepted accounting principles. Dividend sources are estimated at the time of declaration. Actual results may vary. Any non-taxable return of capital cannot be determined until final tax calculations are completed after the end of the fund’s fiscal year. Reclassifications are made to the fund’s capital accounts to reflect income and gains available for distribution (or available capital loss carryovers) under income tax regulations.
Note 2: Management fee, administrative services and other transactions
The fund pays Putnam Management a management fee (based on the fund’s average net assets and computed and paid monthly) at annual rates that may vary based on the average of the aggregate net assets of most open-end funds, as defined in the fund’s management contract, sponsored by Putnam Management. Such annual rates may vary as follows:
| | | | |
| 0.590% | of the first $5 billion, | | 0.390% | of the next $50 billion, |
| |
|
| 0.540% | of the next $5 billion, | | 0.370% | of the next $50 billion, |
| |
|
| 0.490% | of the next $10 billion, | | 0.360% | of the next $100 billion and |
| |
|
| 0.440% | of the next $10 billion, | | 0.355% | of any excess thereafter. |
| |
|
The fund’s shareholders approved the fund’s current management contract with Putnam Management effective February 27, 2014. Shareholders were asked to approve the fund’s management contract following the death on October 8, 2013 of The Honourable Paul G. Desmarais, who had controlled directly and indirectly a majority of the voting shares of Power Corporation of Canada, the ultimate parent company of Putnam Management. The substantive terms of the management contract, including terms relating to fees, are identical to the terms of the fund’s previous management contract and reflect the rates provided in the table above.
Putnam Management has contractually agreed, through June 30, 2014, to waive fees or reimburse the fund’s expenses to the extent necessary to limit the cumulative expenses of the fund, exclusive of brokerage, interest, taxes, investment-related expenses, extraordinary expenses, acquired fund fees and expenses and payments under the fund’s investor servicing contract, investment management contract and distribution plans, on a fiscal year-to-date basis to an annual rate of 0.20% of the fund’s average net assets over such fiscal year-to-date period. During the reporting period, the fund’s expenses were not reduced as a result of this limit.
| |
| California Tax Exempt Income Fund | 47 |
Putnam Investments Limited (PIL), an affiliate of Putnam Management, is authorized by the Trustees to manage a separate portion of the assets of the fund as determined by Putnam Management from time to time. Putnam Management pays a quarterly sub-management fee to PIL for its services at an annual rate of 0.40% of the average net assets of the portion of the fund managed by PIL.
The fund reimburses Putnam Management an allocated amount for the compensation and related expenses of certain officers of the fund and their staff who provide administrative services to the fund. The aggregate amount of all such reimbursements is determined annually by the Trustees.
Custodial functions for the fund’s assets are provided by State Street. Custody fees are based on the fund’s asset level, the number of its security holdings and transaction volumes.
Putnam Investor Services, Inc., an affiliate of Putnam Management, provides investor servicing agent functions to the fund. Putnam Investor Services, Inc. received fees for investor servicing based on the fund’s retail asset level, the number of shareholder accounts in the fund and the level of defined contribution plan assets in the fund. Investor servicing fees will not exceed an annual rate of 0.32% of the fund’s average net assets. During the reporting period, the expenses for each class of shares related to investor servicing fees were as follows:
| | | | |
| Class A | $324,647 | | Class M | 662 |
| |
|
| Class B | 1,744 | | Class Y | 12,047 |
| |
|
| Class C | 11,124 | | Total | $350,224 |
| |
|
The fund has entered into expense offset arrangements with Putnam Investor Services, Inc. and State Street whereby Putnam Investor Services, Inc.’s and State Street’s fees are reduced by credits allowed on cash balances. For the reporting period, the fund’s expenses were reduced by $1,321 under the expense offset arrangements.
Each independent Trustee of the fund receives an annual Trustee fee, of which $869, as a quarterly retainer, has been allocated to the fund, and an additional fee for each Trustees meeting attended. Trustees also are reimbursed for expenses they incur relating to their services as Trustees.
The fund has adopted a Trustee Fee Deferral Plan (the Deferral Plan) which allows the Trustees to defer the receipt of all or a portion of Trustees fees payable on or after July 1, 1995. The deferred fees remain invested in certain Putnam funds until distribution in accordance with the Deferral Plan.
The fund has adopted an unfunded noncontributory defined benefit pension plan (the Pension Plan) covering all Trustees of the fund who have served as a Trustee for at least five years and were first elected prior to 2004. Benefits under the Pension Plan are equal to 50% of the Trustee’s average annual attendance and retainer fees for the three years ended December 31, 2005. The retirement benefit is payable during a Trustee’s lifetime, beginning the year following retirement, for the number of years of service through December 31, 2006. Pension expense for the fund is included in Trustee compensation and expenses in the Statement of operations. Accrued pension liability is included in Payable for Trustee compensation and expenses in the Statement of assets and liabilities. The Trustees have terminated the Pension Plan with respect to any Trustee first elected after 2003.
The fund has adopted distribution plans (the Plans) with respect to its class A, class B, class C and class M shares pursuant to Rule 12b–1 under the Investment Company Act of 1940. The purpose of the Plans is to compensate Putnam Retail Management Limited Partnership, an indirect wholly-owned subsidiary of Putnam Investments, LLC, for services provided and expenses incurred in distributing shares of the fund. The Plans provide for payments by the fund to Putnam Retail Management Limited Partnership at an annual rate of up to 0.35%, 1.00%, 1.00% and 1.00% of the average net assets attributable to class A, class B, class C and class M shares, respectively. The Trustees have approved payment by the fund at the annual rate of 0.85%, 1.00% and 0.50% of the average net assets for class B, class C and class M shares, respectively. For class A shares, the annual payment rate will equal the weighted average of (i) 0.20% on the net assets of the fund attributable to class A shares purchased and paid for prior to April 1, 2005 and (ii) 0.25% on all other net assets of the fund attributable to class A shares. During the reporting period, the class specific expenses related to distribution fees were as follows:
| | | | |
| Class A | $1,398,379 | | Class M | 6,570 |
| |
|
| Class B | 29,436 | | Total | $1,655,336 |
| |
|
| Class C | 220,951 | | | |
| | |
| |
| 48 | California Tax Exempt Income Fund |
For the reporting period, Putnam Retail Management Limited Partnership, acting as underwriter, received net commissions of $25,726 and $104 from the sale of class A and class M shares, respectively, and received $2,307 and $3 in contingent deferred sales charges from redemptions of class B and class C shares, respectively.
A deferred sales charge of up to 1.00% is assessed on certain redemptions of class A shares. For the reporting period, Putnam Retail Management Limited Partnership, acting as underwriter, received $101 on class A redemptions.
Note 3: Purchases and sales of securities
During the reporting period, cost of purchases and proceeds from sales of investment securities other than short-term investments aggregated $98,301,374 and $188,912,200, respectively. There were no purchases or proceeds from sales of long-term U.S. government securities.
Note 4: Capital shares
At the close of the reporting period, there was an unlimited number of shares of beneficial interest authorized. Transactions in capital shares were as follows:
| | | | |
| | Six months ended 3/31/14 | Year ended 9/30/13 |
|
| Class A | Shares | Amount | Shares | Amount |
|
| Shares sold | 3,268,314 | $25,700,788 | 18,304,324 | $152,049,316 |
|
| Shares issued in connection with | | | | |
| reinvestment of distributions | 2,547,921 | 20,080,092 | 5,564,631 | 45,654,343 |
|
| | 5,816,235 | 45,780,880 | 23,868,955 | 197,703,659 |
|
| Shares repurchased | (17,817,374) | (139,819,979) | (43,259,365) | (352,812,645) |
|
| Net decrease | (12,001,139) | $(94,039,099) | (19,390,410) | $(155,108,986) |
|
| |
| | Six months ended 3/31/14 | Year ended 9/30/13 |
|
| Class B | Shares | Amount | Shares | Amount |
|
| Shares sold | 16,867 | $132,118 | 106,757 | $884,105 |
|
| Shares issued in connection with | | | | |
| reinvestment of distributions | 13,885 | 109,296 | 29,889 | 245,025 |
|
| | 30,752 | 241,414 | 136,646 | 1,129,130 |
|
| Shares repurchased | (116,936) | (917,484) | (256,328) | (2,073,639) |
|
| Net decrease | (86,184) | $(676,070) | (119,682) | $(944,509) |
|
| |
| | Six months ended 3/31/14 | Year ended 9/30/13 |
|
| Class C | Shares | Amount | Shares | Amount |
|
| Shares sold | 325,293 | $2,580,871 | 1,326,280 | $11,124,158 |
|
| Shares issued in connection with | | | | |
| reinvestment of distributions | 71,978 | 570,079 | 168,765 | 1,391,477 |
|
| | 397,271 | 3,150,950 | 1,495,045 | 12,515,635 |
|
| Shares repurchased | (985,220) | (7,762,750) | (2,274,273) | (18,502,278) |
|
| Net decrease | (587,949) | $(4,611,800) | (779,228) | $(5,986,643) |
|
| |
| California Tax Exempt Income Fund | 49 |
| | | | |
| | Six months ended 3/31/14 | Year ended 9/30/13 |
|
| Class M | Shares | Amount | Shares | Amount |
|
| Shares sold | 5,047 | $39,542 | 49,061 | $406,798 |
|
| Shares issued in connection with | | | | |
| reinvestment of distributions | 5,660 | 44,477 | 11,896 | 97,392 |
|
| | 10,707 | 84,019 | 60,957 | 504,190 |
|
| Shares repurchased | (5,572) | (43,476) | (127,770) | (1,057,692) |
|
| Net increase (decrease) | 5,135 | $40,543 | (66,813) | $(553,502) |
|
| |
| | Six months ended 3/31/14 | Year ended 9/30/13 |
|
| Class Y | Shares | Amount | Shares | Amount |
|
| Shares sold | 940,696 | $7,405,019 | 3,320,617 | $27,371,431 |
|
| Shares issued in connection with | | | | |
| reinvestment of distributions | 78,433 | 619,496 | 206,529 | 1,699,796 |
|
| | 1,019,129 | 8,024,515 | 3,527,146 | 29,071,227 |
|
| Shares repurchased | (1,938,113) | (15,206,153) | (3,370,241) | (27,496,037) |
|
| Net increase (decrease) | (918,984) | $(7,181,638) | 156,905 | $1,575,190 |
|
Note 5: Market, credit and other risks
In the normal course of business, the fund trades financial instruments and enters into financial transactions where risk of potential loss exists due to changes in the market (market risk) or failure of the contracting party to the transaction to perform (credit risk). The fund may be exposed to additional credit risk that an institution or other entity with which the fund has unsettled or open transactions will default. The fund concentrates a majority of its investments in the state of California and may be affected by economic and political developments in that state.
| |
| 50 | California Tax Exempt Income Fund |
Shareholder meeting results (Unaudited)
February 27, 2014 special meeting
At the meeting, each of the nominees for Trustees was elected as follows:
| | |
| | Votes for | Votes withheld |
|
| Liaquat Ahamed | 110,812,770 | 4,413,756 |
|
| Ravi Akhoury | 110,832,522 | 4,394,004 |
|
| Barbara M. Baumann | 111,144,678 | 4,081,848 |
|
| Jameson A. Baxter | 111,072,448 | 4,154,078 |
|
| Charles B. Curtis | 110,995,194 | 4,231,332 |
|
| Robert J. Darretta | 110,997,346 | 4,229,180 |
|
| Katinka Domotorffy | 111,134,472 | 4,092,054 |
|
| John A. Hill | 111,117,487 | 4,109,039 |
|
| Paul L. Joskow | 111,087,977 | 4,138,549 |
|
| Kenneth R. Leibler | 111,111,280 | 4,115,246 |
|
| Robert E. Patterson | 111,114,551 | 4,111,975 |
|
| George Putnam, III | 111,113,763 | 4,112,763 |
|
| Robert L. Reynolds | 111,106,511 | 4,120,015 |
|
| W. Thomas Stephens | 111,135,762 | 4,090,764 |
|
A proposal to approve a new management contract between the fund and Putnam Management was approved as follows:
| | | |
| Votes | Votes | | Broker |
| for | against | Abstentions | non-votes |
|
| 88,487,167 | 2,870,510 | 6,719,299 | 17,149,550 |
|
March 7, 2014 special meeting
A proposal to adopt an Amended and Restated Declaration of Trust, with respect to which the February 27, 2014 meeting had been adjourned, was approved as follows:
| | | |
| Votes | Votes | | Broker |
| for | against | Abstentions | non-votes |
|
| 92,862,472 | 3,145,166 | 8,858,120 | 15,726,007 |
|
All tabulations are rounded to the nearest whole number.
| |
| California Tax Exempt Income Fund | 51 |
Services for shareholders
Investor services
Systematic investment plan Tell us how much you wish to invest regularly — weekly, semimonthly, or monthly — and the amount you choose will be transferred automatically from your checking or savings account. There’s no additional fee for this service, and you can suspend it at any time. This plan may be a great way to save for college expenses or to plan for your retirement.
Please note that regular investing does not guarantee a profit or protect against loss in a declining market. Before arranging a systematic investment plan, consider your financial ability to continue making purchases in periods when prices are low.
Systematic exchange You can make regular transfers from one Putnam fund to another Putnam fund. There are no additional fees for this service, and you can cancel or change your options at any time.
Dividends PLUS You can choose to have the dividend distributions from one of your Putnam funds automatically reinvested in another Putnam fund at no additional charge.
Free exchange privilege You can exchange money between Putnam funds free of charge, as long as they are the same class of shares. A signature guarantee is required if you are exchanging more than $500,000. The fund reserves the right to revise or terminate the exchange privilege.
Reinstatement privilege If you’ve sold Putnam shares or received a check for a dividend or capital gain, you may reinvest the proceeds with Putnam within 90 days of the transaction and they will be reinvested at the fund’s current net asset value — with no sales charge. However, reinstatement of class B shares may have special tax consequences. Ask your financial or tax representative for details.
Check-writing service You have ready access to many Putnam accounts. It’s as simple as writing a check, and there are no special fees or service charges. For more information about the check-writing service, call Putnam or visit our website.
Dollar cost averaging When you’re investing for long-term goals, it’s time, not timing, that counts. Investing on a systematic basis is a better strategy than trying to figure out when the markets will go up or down. This means investing the same amount of money regularly over a long period. This method of investing is called dollar cost averaging. When a fund’s share price declines, your investment dollars buy more shares at lower prices. When it increases, they buy fewer shares. Over time, you will pay a lower average price per share.
For more information
Visit the Individual Investors section at putnam.com A secure section of our website contains complete information on your account, including balances and transactions, updated daily. You may also conduct transactions, such as exchanges, additional investments, and address changes. Log on today to get your password.
Call us toll free at 1-800-225-1581 Ask a helpful Putnam representative or your financial advisor for details about any of these or other services, or see your prospectus.
| |
| 52 | California Tax Exempt Income Fund |
Fund information
Founded over 75 years ago, Putnam Investments was built around the concept that a balance between risk and reward is the hallmark of a well-rounded financial program. We manage over 100 funds across income, value, blend, growth, asset allocation, absolute return, and global sector categories.
| | |
| Investment Manager | Trustees | Robert R. Leveille |
| Putnam Investment | Jameson A. Baxter, Chair | Vice President and |
| Management, LLC | Liaquat Ahamed | Chief Compliance Officer |
| One Post Office Square | Ravi Akhoury | |
| Boston, MA 02109 | Barbara M. Baumann | Michael J. Higgins |
| | Charles B. Curtis | Vice President, Treasurer, |
| Investment Sub-Manager | Robert J. Darretta | and Clerk |
| Putnam Investments Limited | Katinka Domotorffy | |
| 57–59 St James’s Street | John A. Hill | Janet C. Smith |
| London, England SW1A 1LD | Paul L. Joskow | Vice President, |
| | Kenneth R. Leibler | Principal Accounting Officer, |
| Marketing Services | Robert E. Patterson | and Assistant Treasurer |
| Putnam Retail Management | George Putnam, III | |
| One Post Office Square | Robert L. Reynolds | Susan G. Malloy |
| Boston, MA 02109 | W. Thomas Stephens | Vice President and |
| | | Assistant Treasurer |
| Custodian | Officers | |
| State Street Bank | Robert L. Reynolds | James P. Pappas |
| and Trust Company | President | Vice President |
| | | |
| Legal Counsel | Jonathan S. Horwitz | Mark C. Trenchard |
| Ropes & Gray LLP | Executive Vice President, | Vice President and |
| | Principal Executive Officer, and | BSA Compliance Officer |
| Compliance Liaison | |
| | | Nancy E. Florek |
| | Steven D. Krichmar | Vice President, Director of |
| | Vice President and | Proxy Voting and Corporate |
| | Principal Financial Officer | Governance, Assistant Clerk, |
| | | and Associate Treasurer |
| | Robert T. Burns | |
| | Vice President and | |
| | Chief Legal Officer | |
This report is for the information of shareholders of Putnam California Tax Exempt Income Fund. It may also be used as sales literature when preceded or accompanied by the current prospectus, the most recent copy of Putnam’s Quarterly Performance Summary, and Putnam’s Quarterly Ranking Summary. For more recent performance, please visit putnam.com. Investors should carefully consider the investment objectives, risks, charges, and expenses of a fund, which are described in its prospectus. For this and other information or to request a prospectus or summary prospectus, call 1-800-225-1581 toll free. Please read the prospectus carefully before investing. The fund’s Statement of Additional Information contains additional information about the fund’s Trustees and is available without charge upon request by calling 1-800-225-1581.
| |
| Item 3. Audit Committee Financial Expert: |
| |
| Item 4. Principal Accountant Fees and Services: |
| |
| Item 5. Audit Committee of Listed Registrants |
| |
| Item 6. Schedule of Investments: |
| |
| The registrant’s schedule of investments in unaffiliated issuers is included in the report to shareholders in Item 1 above. |
| |
| Item 7. Disclosure of Proxy Voting Policies and Procedures For Closed-End Management Investment Companies: |
| |
| Item 8. Portfolio Managers of Closed-End Investment Companies |
| |
| Item 9. Purchases of Equity Securities by Closed-End Management Investment Companies and Affiliated Purchasers: |
| |
| Item 10. Submission of Matters to a Vote of Security Holders: |
| |
| Item 11. Controls and Procedures: |
| |
| (a) The registrant’s principal executive officer and principal financial officer have concluded, based on their evaluation of the effectiveness of the design and operation of the registrant’s disclosure controls and procedures as of a date within 90 days of the filing date of this report, that the design and operation of such procedures are generally effective to provide reasonable assurance that information required to be disclosed by the registrant in this report is recorded, processed, summarized and reported within the time periods specified in the Commission’s rules and forms. |
| |
| (b) Changes in internal control over financial reporting: Not applicable |
| |
| (a)(2) Separate certifications for the principal executive officer and principal financial officer of the registrant as required by Rule 30a-2(a) under the Investment Company Act of 1940, as amended, are filed herewith. |
| |
| (b) The certifications required by Rule 30a-2(b) under the Investment Company Act of 1940, as amended, are filed herewith. |
| |
| Putnam California Tax Exempt Income Fund |
| |
| By (Signature and Title): |
| |
| /s/Janet C. Smith
Janet C. Smith
Principal Accounting Officer
|
| |
| Pursuant to the requirements of the Securities Exchange Act of 1934 and the Investment Company Act of 1940, this report has been signed below by the following persons on behalf of the registrant and in the capacities and on the dates indicated. |
| |
| By (Signature and Title): |
| |
| /s/Jonathan S. Horwitz
Jonathan S. Horwitz
Principal Executive Officer
|
| |
| By (Signature and Title): |
| |
| /s/Steven D. Krichmar
Steven D. Krichmar
Principal Financial Officer
|