| | |
| UNITED STATES
SECURITIES AND EXCHANGE COMMISSION |
| | |
| CERTIFIED SHAREHOLDER REPORT OF REGISTERED
MANAGEMENT INVESTMENT COMPANIES
|
| | |
| Investment Company Act file number: | (811-03630) |
| | |
| Exact name of registrant as specified in charter: | Putnam California Tax Exempt Income Fund |
| | |
| Address of principal executive offices: | One Post Office Square, Boston, Massachusetts 02109 |
| | |
| Name and address of agent for service: | Robert T. Burns, Vice President
One Post Office Square
Boston, Massachusetts 02109 |
| | |
| Copy to: | Bryan Chegwidden, Esq.
Ropes & Gray LLP
1211 Avenue of the Americas
New York, New York 10036 |
| | |
| Registrant's telephone number, including area code: | (617) 292-1000 |
| | |
| Date of fiscal year end: | September 30, 2016 |
| | |
| Date of reporting period: | October 1, 2015 — March 31, 2016 |
| | |
|
Item 1. Report to Stockholders: | |
| | |
| The following is a copy of the report transmitted to stockholders pursuant to Rule 30e-1 under the Investment Company Act of 1940: | |
Putnam
California Tax Exempt
Income Fund
Semiannual report
3 | 31 | 16
| | | |
| Message from the Trustees | 1 | | |
| | |
| About the fund | 2 | | |
| | |
| Performance snapshot | 4 | | |
| | |
| Interview with your fund’s portfolio manager | 5 | | |
| | |
| Your fund’s performance | 11 | | |
| | |
| Your fund’s expenses | 13 | | |
| | |
| Terms and definitions | 15 | | |
| | |
| Other information for shareholders | 16 | | |
| | |
| Financial statements | 17 | | |
| | |
Consider these risks before investing: Bond prices may fall or fail to rise over time for several reasons, including general financial market conditions, changing market perceptions of the risk of default, changes in government intervention, and factors related to a specific issuer or industry. These factors may also lead to periods of high volatility and reduced liquidity in the bond markets. Single-state investments are at risk of common economic forces and other factors affecting a state’s tax-exempt investments. This may result in greater losses and volatility. Capital gains, if any, are taxed at the federal and, in most cases, state levels. For some investors, investment income may be subject to the federal alternative minimum tax. Bond investments are subject to interest-rate risk (the risk of bond prices falling if interest rates rise) and credit risk (the risk of an issuer defaulting on interest or principal payments). Interest-rate risk is greater for longer-term bonds, and credit risk is greater for below-investment-grade bonds. Unlike bonds, funds that invest in bonds have fees and expenses. Tax-exempt bonds may be issued under the Internal Revenue Code only by limited types of issuers for limited types of projects. As a result, the fund’s investments may be focused in certain market segments and be more vulnerable to fluctuations in the values of the securities it holds than a more broadly invested fund. Interest the fund receives might be taxable. You can lose money by investing in the fund.
Message from the Trustees
Dear Fellow Shareholder:
After enduring significant volatility in early 2016, markets around the world have shown fresh signs of strength as investor sentiment has improved. Many factors had fueled turbulence in the financial markets, including oil price volatility, uncertainty about U.S. monetary policy, and concerns about the ripple effects of China’s economic slowdown.
In the United States, investors were encouraged by the Federal Reserve’s decision in March to hold off on raising interest rates and dialing back its 2016 rate-hike forecast to two hikes instead of four. Recent U.S. economic data also have been positive, with improvements in employment, manufacturing, and consumer confidence. Meanwhile, policymakers in Europe, China, Japan, and many emerging markets continue their efforts to lift economic growth rates.
Putnam’s portfolio managers are positioned to maneuver in all types of markets with active investment strategies and support from teams of equity and fixed-income research analysts. The interview on the following pages provides an overview of your fund’s performance for the reporting period ended March 31, 2016, as well as an outlook for the coming months.
In today’s market environment, it may be helpful to consult your financial advisor to ensure that your investment portfolio is aligned with your goals, time horizon, and risk tolerance.
As always, thank you for investing with Putnam.


Current performance may be lower or higher than the quoted past performance, which cannot guarantee future results. Share price, principal value, and return will fluctuate, and you may have a gain or a loss when you sell your shares. Performance of class A shares assumes reinvestment of distributions and does not account for taxes. Fund returns in the bar chart do not reflect a sales charge of 4.00%; had they, returns would have been lower. See pages 5 and 11–13 for additional performance information. For a portion of the periods, the fund had expense limitations, without which returns would have been lower. To obtain the most recent month-end performance, visit putnam.com.
* Returns for the six-month period are not annualized, but cumulative.
| |
| 4 | California Tax Exempt Income Fund |
Interview with your fund’s portfolio manager

The six-month reporting period ended March 31, 2016, proved to be a hospitable environment for fixed-income securities. How did municipal bonds perform?
Amid heightened market uncertainty surrounding U.S. central bank policy, low commodity prices, and China’s economic slowdown, municipal bonds maintained their positive monthly momentum during the reporting period. Much of the asset class’s advance occurred in January, when the Barclays Municipal Bond Index rose 1.19%.
After the Federal Reserve took the widely expected first step on the path of gradual normalization of interest rates in December 2015, investors began pricing in additional increases in 2016. However, a deep slide in oil prices early in 2016 fueled worries of slowing economic growth globally and raised questions about the central bank’s interest-rate policy. In January, the asset class benefited from a flight to quality in response to market volatility, slower growth, and a dovish Fed. At its March meeting, the central bank’s Federal Open Market Committee reduced its rate-hike forecast for the remainder of the year to two increases from the four that policymakers had anticipated at their December 2015 meeting.
In the final weeks of the reporting period, diminished expectations for near-term rate hikes and increased expectations for a more gradual pace of future hikes helped to support municipal bond prices. Fed Chair
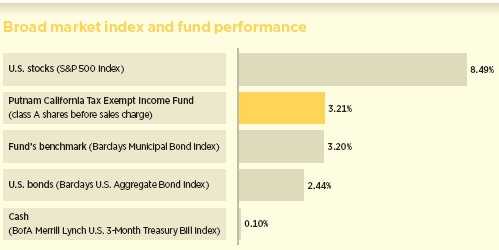
This comparison shows your fund’s performance in the context of broad market indexes for the six months ended 3/31/16. See pages 4 and 11–13 for additional fund performance information. Index descriptions can be found on page 15.
| |
| California Tax Exempt Income Fund | 5 |
Janet Yellen reaffirmed that the central bank would move cautiously.
Why has the asset class been so resilient?
Municipal bond prices have benefited from favorable market technicals, or their supply/demand dynamics, as well as generally stable credit fundamentals. New-issue supply has fallen, while demand, as measured by mutual fund inflows, has been consistent, with over $13.5 billion in new assets during the first quarter of 2016. Demand for municipal bonds has been dominated by households at the retail level, which comprise about 70% of municipal bond investors. Meanwhile, the biggest change that we have seen has come in the bank channel, whose shares of municipal bond assets have doubled since 2008. As such, demand for municipal bonds appears to have moved beyond its traditional base of tax-sensitive investors to include investors drawn to their high-quality, relatively low-volatility income potential, in our view.
Overall, we believe that municipal credit fundamentals are sound and defaults have been low. Credit rating upgrades of issuers have exceeded downgrades due to economic and financial stabilization across most public finance sectors. At the local level, property values have improved, contributing to modest increases in tax receipts.
We do continue to see weakness in some isolated high-profile credits. Fiscal economic data remain troubling in Puerto Rico. Investors closely monitored developments leading up to the constitutionally guaranteed Government Development Bank [GDB] debt service payment due May 1, which the

Allocations are shown as a percentage of the fund’s net assets as of 3/31/16. Cash and net other assets, if any, represent the market value weights of cash, derivatives, short-term securities, and other unclassified assets in the portfolio. Summary information may differ from the information in the portfolio schedule notes included in the financial statements due to the inclusion of derivative securities, any interest accruals, the use of different classifications of securities for presentation purposes and rounding. Holdings and allocations may vary over time.
| |
| 6 | California Tax Exempt Income Fund |
U.S. territory ultimately failed to pay. [The fund did not own GDB debt during the reporting period.] Investors also followed a Republican-sponsored bill to address Puerto Rico’s fiscal crisis, which the House failed to bring for a vote before the May 1 debt service payment. A separate restructuring law was recently discussed in a U.S. Supreme Court hearing. Known as the Recovery Act, the proposal would allow some public agencies to ask bondholders to accept losses on securities in the form of lower payments. However, it is not certain that the proposal will become law. A high degree of uncertainty remains as to the timing and scope of Puerto Rico’s debt restructuring, especially as multiple legal challenges are likely, in our view.

We are also closely following a handful of states and municipalities grappling with budget challenges posed by unfunded pension liabilities and health-care costs. However, while these various issuers, as well as Puerto Rico, are facing long-running headwinds, in our view, investors have shown a willingness to isolate these situations from the overall municipal market.
How did Putnam California Tax Exempt Income Fund perform in this environment?
For the six months ended March 31, 2016, the fund’s class A shares before sales charges edged out their benchmark, the Barclays
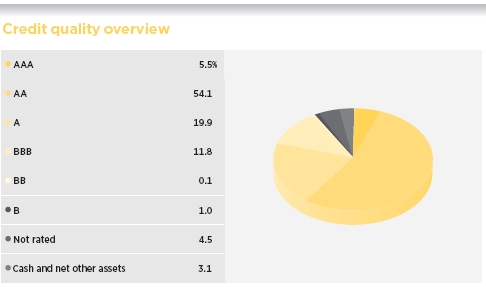
Credit qualities are shown as a percentage of net assets as of 3/31/16. A bond rated BBB or higher (SP-3 or higher, for short-term debt) is considered investment grade. This chart reflects the highest security rating provided by one or more of Standard & Poor’s, Moody’s, and Fitch. Ratings may vary over time.
Cash and net other assets, if any, represent the market value weights of cash, derivatives, and short-term securities in the portfolio. The fund itself has not been rated by an independent rating agency.
| |
| California Tax Exempt Income Fund | 7 |
Municipal Bond Index, but underperformed the average return of their Lipper peer group.
With the Fed beginning the process of normalizing interest rates, what was your investment approach during the reporting period?
Many of the same investment themes remain in place — namely, duration positioning, or interest-rate sensitivity, that is slightly below the median of the fund’s Lipper peer group; an overweight exposure to municipal bonds rated Baa relative to the benchmark; a preference for essential service utilities, continuing-care retirement communities, and higher education bonds relative to the fund’s Lipper peer group; and an underweight exposure to Puerto Rico issuers relative to the fund’s peers. However, at the beginning of 2016, in response to market volatility, marginal growth, and a dovish Fed, we extended duration by a modest amount, becoming slightly less defensive.
As the second quarter begins, we expect to move through a seasonally weaker period for municipal bond returns, as technicals generally are less favorable in March and April. We expect this negative seasonality to occur again this year due to a combination of heavier new issue supply (March new issue supply averaged 36% more than February new issue levels) and possible income-tax-related selling before April’s tax deadline. If realized, this temporary imbalance could present some interesting buying opportunities, in our view.
We do not expect municipal credit spreads [the difference in yield between higher- and lower-quality municipal bonds] to widen by a large margin in the near term, nor do
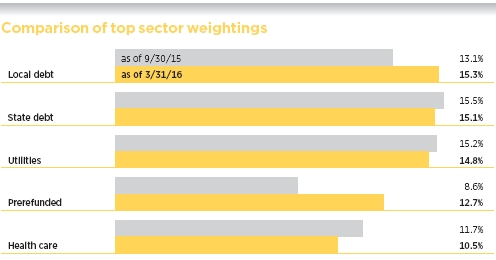
This chart shows how the fund’s top weightings have changed over the past six months. Allocations are shown as a percentage of the fund’s net assets. Current period summary information may differ from the portfolio schedule included in the financial statements due to the inclusion of any interest accruals, the exclusion of as-of trades, if any, the use of different classifications of securities for presentation purposes and rounding. Holdings and allocations may vary over time.
| |
| 8 | California Tax Exempt Income Fund |
we believe that spreads will tighten. In our opinion, downside risks include flows to the asset class turning decidedly negative or interest rates spiking higher. Against this backdrop, we expect to maintain a slightly defensive, shorter-duration position and a somewhat higher cash allocation in the portfolio relative to the fund’s Lipper peers.
The Fed’s forecast for the number of rate hikes for the remainder of 2016 was reduced at its March meeting. What is your current outlook for rates and the municipal bond market?
With the Fed’s current assessment that an accommodative policy is appropriate given global risk factors and its decision to leave its benchmark rate unchanged at its April meeting, Yellen continues to communicate a dovish bias — leading some to believe that the next rate hike won’t occur until 2017. Ultimately, however, the path remains dictated by data releases and global macroeconomic factors, in our view. As such, we expect gradual rate increases, but the timing of any such increases remains uncertain.
Municipal bonds were among the best-performing asset classes in 2015. As we saw in the first quarter of 2016, the asset class began the year on solid footing, with many investors drawn during the period to the relative stability and income potential of municipal bonds as a refuge from global macroeconomic volatility.
Thank you, Thalia, for your time and insights today.
The views expressed in this report are exclusively those of Putnam Management and are subject to change. They are not meant as investment advice.
Please note that the holdings discussed in this report may not have been held by the fund for the entire period. Portfolio composition is subject to review in accordance with the fund’s investment strategy and may vary in the future. Current and future portfolio holdings are subject to risk. Statements in the Q&A concerning the fund’s performance or portfolio composition relative to those of the fund’s Lipper peer group may reference information produced by Lipper Inc. or through a third party.
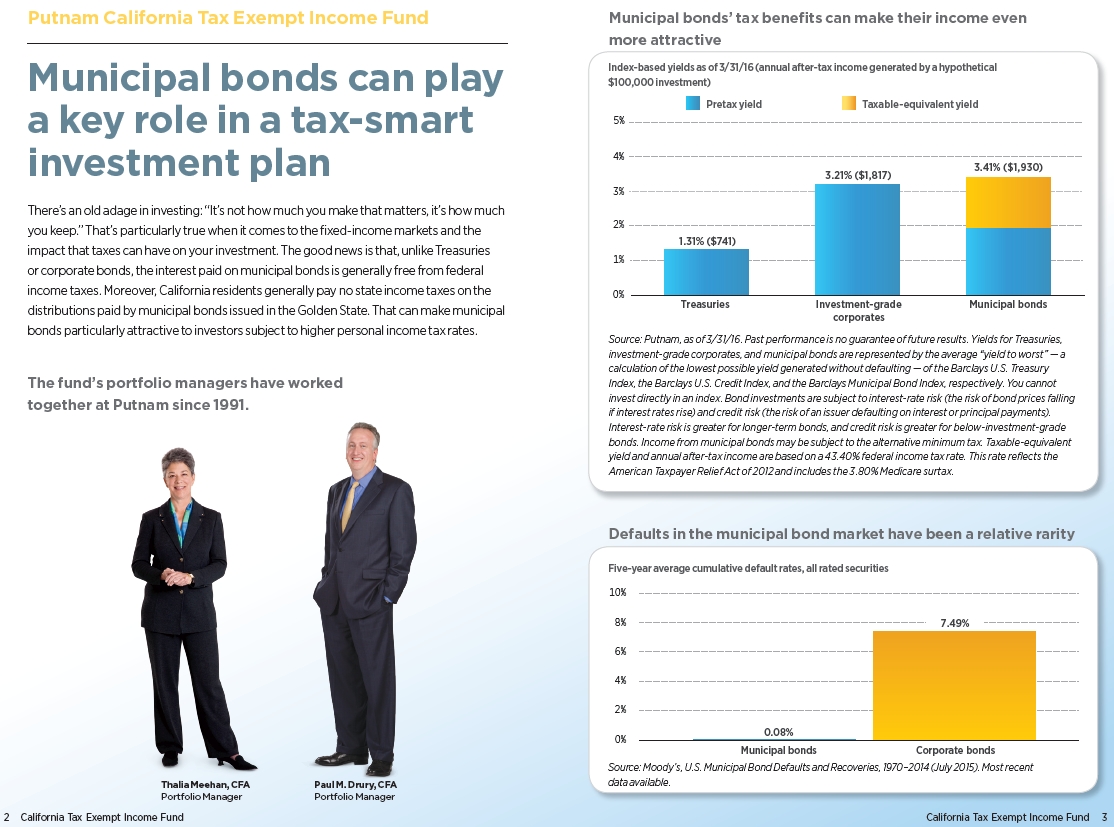
Portfolio Manager Thalia Meehan holds a B.A. from Williams College. Thalia joined Putnam in 1989 and has been in the investment industry since 1983.
In addition to Thalia, your fund’s portfolio manager is Paul M. Drury, CFA. He holds a B.A. from Suffolk University. Paul has been in the investment industry since he joined Putnam in 1989.
| |
| California Tax Exempt Income Fund | 9 |
IN THE NEWS
Since its introduction in January 2012, the Federal Reserve’s interest-rate path “dot plot” has become something of a must-read for Fed watchers. The dot plot’s origins date to 2011, when the Fed was seeking a way to convey publicly more information about the central bank’s outlook. Before every other Fed meeting, officials on the policy-setting Federal Open Market Committee (FOMC) submit updated forecasts for economic growth, unemployment, inflation, and interest-rate hikes. The dots, published as a graph in the quarterly “Summary of Economic Projections,” represent anonymously delivered forecasts from individual FOMC members. In recent months, the dot plot has been criticized by some for conveying an overly hawkish message, but Federal Reserve Chair Janet Yellen has defended the dot plot, saying it should be used to manage expectations about future hikes and not be viewed as a definitive rate path. Meanwhile, after its March 2016 meeting, the Fed released a dot plot more aligned with current market expectations — reducing the number of rate hikes this year to two from the four predicted in December. So, for now, the Fed and the market appear to be on the same page.
| |
| 10 | California Tax Exempt Income Fund |
Your fund’s performance
This section shows your fund’s performance, price, and distribution information for periods ended March 31, 2016, the end of the first half of its current fiscal year. In accordance with regulatory requirements for mutual funds, we also include expense information taken from the fund’s current prospectus. Performance should always be considered in light of a fund’s investment strategy. Data represent past performance. Past performance does not guarantee future results. More recent returns may be less or more than those shown. Investment return and principal value will fluctuate, and you may have a gain or a loss when you sell your shares. Performance information does not reflect any deduction for taxes a shareholder may owe on fund distributions or on the redemption of fund shares. For the most recent month-end performance, please visit the Individual Investors section at putnam.com or call Putnam at 1-800-225-1581. Class Y shares are not available to all investors. See the Terms and Definitions section in this report for definitions of the share classes offered by your fund.
Fund performance Total return for periods ended 3/31/16
| | | | | | | | | |
| | Class A | Class B | Class C | Class M | Class Y |
| (inception dates) | (4/29/83) | (1/4/93) | (7/26/99) | (2/14/95) | (1/2/08) |
|
| | Before | After | | | | | Before | After | Net |
| | sales | sales | Before | After | Before | After | sales | sales | asset |
| | charge | charge | CDSC | CDSC | CDSC | CDSC | charge | charge | value |
|
| Annual average | | | | | | | | | |
| (life of fund) | 6.48% | 6.35% | 6.26% | 6.26% | 5.64% | 5.64% | 6.10% | 5.99% | 6.55% |
|
| 10 years | 57.59 | 51.29 | 49.62 | 49.62 | 45.82 | 45.82 | 53.25 | 48.27 | 60.92 |
| Annual average | 4.65 | 4.23 | 4.11 | 4.11 | 3.84 | 3.84 | 4.36 | 4.02 | 4.87 |
|
| 5 years | 39.05 | 33.48 | 34.92 | 32.92 | 33.82 | 33.82 | 37.21 | 32.75 | 40.80 |
| Annual average | 6.81 | 5.95 | 6.17 | 5.86 | 6.00 | 6.00 | 6.53 | 5.83 | 7.08 |
|
| 3 years | 11.59 | 7.13 | 9.50 | 6.51 | 8.92 | 8.92 | 10.68 | 7.08 | 12.42 |
| Annual average | 3.72 | 2.32 | 3.07 | 2.13 | 2.89 | 2.89 | 3.44 | 2.31 | 3.98 |
|
| 1 year | 3.59 | –0.55 | 3.06 | –1.94 | 2.88 | 1.88 | 3.43 | 0.07 | 3.93 |
|
| 6 months | 3.21 | –0.92 | 3.01 | –1.99 | 2.91 | 1.91 | 3.20 | –0.15 | 3.44 |
|
Current performance may be lower or higher than the quoted past performance, which cannot guarantee future results. After-sales-charge returns for class A and M shares reflect the deduction of the maximum 4.00% and 3.25% sales charge, respectively, levied at the time of purchase. Class B share returns after contingent deferred sales charge (CDSC) reflect the applicable CDSC, which is 5% in the first year, declining over time to 1% in the sixth year, and is eliminated thereafter. Class C share returns after CDSC reflect a 1% CDSC for the first year that is eliminated thereafter. Class Y shares have no initial sales charge or CDSC. Performance for class B, C, M, and Y shares before their inception is derived from the historical performance of class A shares, adjusted for the applicable sales charge (or CDSC) and the higher operating expenses for such shares, except for class Y shares, for which 12b-1 fees are not applicable.
For a portion of the periods, the fund had expense limitations, without which returns would have been lower.
Class B share performance reflects conversion to class A shares after eight years.
| |
| California Tax Exempt Income Fund | 11 |
Fund price and distribution information For the six-month period ended 3/31/16
| | | | | | | |
| Distributions | Class A | Class B | Class C | Class M | Class Y |
|
| Number | 6 | 6 | 6 | 6 | 6 |
|
| Income1 | $0.150865 | $0.124729 | $0.118274 | $0.139186 | $0.159739 |
|
| Capital gains2 | — | — | — | — | — |
|
| Total | $0.150865 | $0.124729 | $0.118274 | $0.139186 | $0.159739 |
|
| | Before | After | Net | Net | Before | After | Net |
| | sales | sales | asset | asset | sales | sales | asset |
| Share value | charge | charge | value | value | charge | charge | value |
|
| 9/30/15 | $8.19 | $8.53 | $8.18 | $8.23 | $8.16 | $8.43 | $8.21 |
|
| 3/31/16 | 8.30 | 8.65 | 8.30 | 8.35 | 8.28 | 8.56 | 8.33 |
|
| | Before | After | Net | Net | Before | After | Net |
| | sales | sales | asset | asset | sales | sales | asset |
| Current rate (end of period) | charge | charge | value | value | charge | charge | value |
|
| Current dividend rate3 | 3.30% | 3.17% | 2.67% | 2.50% | 3.03% | 2.93% | 3.50% |
|
| Taxable equivalent4 | 6.72 | 6.46 | 5.44 | 5.09 | 6.17 | 5.97 | 7.13 |
|
| Current 30-day SEC yield5 | N/A | 1.42 | 0.85 | 0.70 | N/A | 1.16 | 1.69 |
|
| Taxable equivalent4 | N/A | 2.89 | 1.73 | 1.43 | N/A | 2.36 | 3.44 |
|
The classification of distributions, if any, is an estimate. Before-sales-charge share value and current dividend rate for class A and M shares, if applicable, do not take into account any sales charge levied at the time of purchase. After-sales-charge share value, current dividend rate, and current 30-day SEC yield, if applicable, are calculated assuming that the maximum sales charge (4.00% for class A shares and 3.25% for class M shares) was levied at the time of purchase. Final distribution information will appear on your year-end tax forms.
1 For some investors, investment income may be subject to the federal alternative minimum tax.
2 Capital gains, if any, are taxable for federal and, in most cases, state purposes.
3 Most recent distribution, including any return of capital and excluding capital gains, annualized and divided by share price before or after sales charge at period-end.
4 Assumes maximum 50.93% federal and state combined tax rate for 2016. Results for investors subject to lower tax rates would not be as advantageous.
5 Based only on investment income and calculated using the maximum offering price for each share class, in accordance with SEC guidelines.
| |
| 12 | California Tax Exempt Income Fund |
Comparative index returns For periods ended 3/31/16
| | |
| | | Lipper California |
| | Barclays Municipal | Municipal Debt Funds |
| | Bond Index | category average* |
|
| Annual average (life of fund) | 6.87% | 6.55% |
|
| 10 years | 60.78 | 55.84 |
| Annual average | 4.86 | 4.52 |
|
| 5 years | 31.26 | 40.98 |
| Annual average | 5.59 | 7.08 |
|
| 3 years | 11.29 | 13.13 |
| Annual average | 3.63 | 4.19 |
|
| 1 year | 3.98 | 4.34 |
|
| 6 months | 3.20 | 3.82 |
|
Index and Lipper results should be compared with fund performance before sales charge, before CDSC, or at net asset value.
* Over the 6-month, 1-year, 3-year, 5-year, 10-year, and life-of-fund periods ended 3/31/16, there were 128, 127, 119, 109, 87, and 3 funds, respectively, in this Lipper category.
Your fund’s expenses
As a mutual fund investor, you pay ongoing expenses, such as management fees, distribution fees (12b-1 fees), and other expenses. Using the following information, you can estimate how these expenses affect your investment and compare them with the expenses of other funds. You may also pay one-time transaction expenses, including sales charges (loads) and redemption fees, which are not shown in this section and would have resulted in higher total expenses. For more information, see your fund’s prospectus or talk to your financial representative.
Expense ratios
| | | | | |
| | Class A | Class B | Class C | Class M | Class Y |
|
| Total annual operating expenses for the fiscal | | | | | |
| year ended 9/30/15 | 0.74% | 1.37% | 1.52% | 1.02% | 0.52% |
|
| Annualized expense ratio for the six-month | | | | | |
| period ended 3/31/16 | 0.76% | 1.39% | 1.54% | 1.04% | 0.54% |
|
Fiscal-year expense information in this table is taken from the most recent prospectus, is subject to change, and may differ from that shown for the annualized expense ratio and in the financial highlights of this report.
Expenses are shown as a percentage of average net assets.
| |
| California Tax Exempt Income Fund | 13 |
Expenses per $1,000
The following table shows the expenses you would have paid on a $1,000 investment in each class of the fund from 10/1/15 to 3/31/16. It also shows how much a $1,000 investment would be worth at the close of the period, assuming actual returns and expenses.
| | | | | |
| | Class A | Class B | Class C | Class M | Class Y |
|
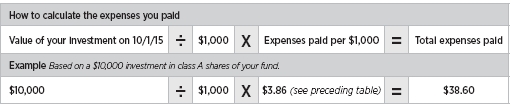
| Expenses paid per $1,000*† | $3.86 | $7.05 | $7.81 | $5.28 | $2.75 |
|
| Ending value (after expenses) | $1,032.10 | $1,030.10 | $1,029.10 | $1,032.00 | $1,034.40 |
|
* Expenses for each share class are calculated using the fund’s annualized expense ratio for each class, which represents the ongoing expenses as a percentage of average net assets for the six months ended 3/31/16. The expense ratio may differ for each share class.
† Expenses are calculated by multiplying the expense ratio by the average account value for the period; then multiplying the result by the number of days in the period; and then dividing that result by the number of days in the year.
Estimate the expenses you paid
To estimate the ongoing expenses you paid for the six months ended 3/31/16, use the following calculation method. To find the value of your investment on 10/1/15, call Putnam at 1-800-225-1581.
Compare expenses using the SEC’s method
The Securities and Exchange Commission (SEC) has established guidelines to help investors assess fund expenses. Per these guidelines, the following table shows your fund’s expenses based on a $1,000 investment, assuming a hypothetical 5% annualized return. You can use this information to compare the ongoing expenses (but not transaction expenses or total costs) of investing in the fund with those of other funds. All mutual fund shareholder reports will provide this information to help you make this comparison. Please note that you cannot use this information to estimate your actual ending account balance and expenses paid during the period.
| | | | | |
| | Class A | Class B | Class C | Class M | Class Y |
|
| Expenses paid per $1,000*† | $3.84 | $7.01 | $7.77 | $5.25 | $2.73 |
|
| Ending value (after expenses) | $1,021.20 | $1,018.05 | $1,017.30 | $1,019.80 | $1,022.30 |
|
* Expenses for each share class are calculated using the fund’s annualized expense ratio for each class, which represents the ongoing expenses as a percentage of average net assets for the six months ended 3/31/16. The expense ratio may differ for each share class.
† Expenses are calculated by multiplying the expense ratio by the average account value for the six-month period; then multiplying the result by the number of days in the six-month period; and then dividing that result by the number of days in the year.
| |
| 14 | California Tax Exempt Income Fund |
Terms and definitions
Important terms
Total return shows how the value of the fund’s shares changed over time, assuming you held the shares through the entire period and reinvested all distributions in the fund.
Before sales charge, or net asset value, is the price, or value, of one share of a mutual fund, without a sales charge. Before-sales-charge figures fluctuate with market conditions, and are calculated by dividing the net assets of each class of shares by the number of outstanding shares in the class.
After sales charge is the price of a mutual fund share plus the maximum sales charge levied at the time of purchase. After-sales-charge performance figures shown here assume the 4.00% maximum sales charge for class A shares and 3.25% for class M shares.
Contingent deferred sales charge (CDSC) is generally a charge applied at the time of the redemption of class B or C shares and assumes redemption at the end of the period. Your fund’s class B CDSC declines over time from a 5% maximum during the first year to 1% during the sixth year. After the sixth year, the CDSC no longer applies. The CDSC for class C shares is 1% for one year after purchase.
Share classes
Class A shares are generally subject to an initial sales charge and no CDSC (except on certain redemptions of shares bought without an initial sales charge).
Class B shares are not subject to an initial sales charge and may be subject to a CDSC.
Class C shares are not subject to an initial sales charge and are subject to a CDSC only if the shares are redeemed during the first year.
Class M shares have a lower initial sales charge and a higher 12b-1 fee than class A shares and no CDSC.
Class Y shares are not subject to an initial sales charge or CDSC, and carry no 12b-1 fee. They are generally only available to corporate and institutional clients and clients in other approved programs.
Fixed-income terms
Current rate is the annual rate of return earned from dividends or interest of an investment. Current rate is expressed as a percentage of the price of a security, fund share, or principal investment.
Yield curve is a graph that plots the yields of bonds with equal credit quality against their differing maturity dates, ranging from shortest to longest. It is used as a benchmark for other debt, such as mortgage or bank lending rates.
Comparative indexes
Barclays Municipal Bond Index is an unmanaged index of long-term fixed-rate investment-grade tax-exempt bonds.
Barclays U.S. Aggregate Bond Index is an unmanaged index of U.S. investment-grade fixed-income securities.
BofA Merrill Lynch U.S. 3-Month Treasury Bill Index is an unmanaged index that seeks to measure the performance of U.S. Treasury bills available in the marketplace.
S&P 500 Index is an unmanaged index of common stock performance.
Indexes assume reinvestment of all distributions and do not account for fees. Securities and performance of a fund and an index will differ. You cannot invest directly in an index.
Lipper is a third-party industry-ranking entity that ranks mutual funds. Its rankings
| |
| California Tax Exempt Income Fund | 15 |
do not reflect sales charges. Lipper rankings are based on total return at net asset value relative to other funds that have similar current investment styles or objectives as determined by Lipper. Lipper may change a fund’s category assignment at its discretion. Lipper category averages reflect performance trends for funds within a category.
Other information for shareholders
Important notice regarding delivery of shareholder documents
In accordance with Securities and Exchange Commission (SEC) regulations, Putnam sends a single copy of annual and semiannual shareholder reports, prospectuses, and proxy statements to Putnam shareholders who share the same address, unless a shareholder requests otherwise. If you prefer to receive your own copy of these documents, please call Putnam at 1-800-225-1581, and Putnam will begin sending individual copies within 30 days.
Proxy voting
Putnam is committed to managing our mutual funds in the best interests of our shareholders. The Putnam funds’ proxy voting guidelines and procedures, as well as information regarding how your fund voted proxies relating to portfolio securities during the 12-month period ended June 30, 2015, are available in the Individual Investors section of putnam.com, and on the SEC’s website, www.sec.gov. If you have questions about finding forms on the SEC’s website, you may call the SEC at 1-800-SEC-0330. You may also obtain the Putnam funds’ proxy voting guidelines and procedures at no charge by calling Putnam’s Shareholder Services at 1-800-225-1581.
Fund portfolio holdings
The fund will file a complete schedule of its portfolio holdings with the SEC for the first and third quarters of each fiscal year on Form N-Q. Shareholders may obtain the fund’s Form N-Q on the SEC’s website at www.sec.gov. In addition, the fund’s Form N-Q may be reviewed and copied at the SEC’s Public Reference Room in Washington, D.C. You may call the SEC at 1-800-SEC-0330 for information about the SEC’s website or the operation of the Public Reference Room.
Trustee and employee fund ownership
Putnam employees and members of the Board of Trustees place their faith, confidence, and, most importantly, investment dollars in Putnam mutual funds. As of March 31, 2016, Putnam employees had approximately $477,000,000 and the Trustees had approximately $127,000,000 invested in Putnam mutual funds. These amounts include investments by the Trustees’ and employees’ immediate family members as well as investments through retirement and deferred compensation plans.
| |
| 16 | California Tax Exempt Income Fund |
Financial statements
A guide to financial statements
These sections of the report, as well as the accompanying Notes, constitute the fund’s financial statements.
The fund’s portfolio lists all the fund’s investments and their values as of the last day of the reporting period. Holdings are organized by asset type and industry sector, country, or state to show areas of concentration and diversification.
Statement of assets and liabilities shows how the fund’s net assets and share price are determined. All investment and non-investment assets are added together. Any unpaid expenses and other liabilities are subtracted from this total. The result is divided by the number of shares to determine the net asset value per share, which is calculated separately for each class of shares. (For funds with preferred shares, the amount subtracted from total assets includes the liquidation preference of preferred shares.)
Statement of operations shows the fund’s net investment gain or loss. This is done by first adding up all the fund’s earnings — from dividends and interest income — and subtracting its operating expenses to determine net investment income (or loss). Then, any net gain or loss the fund realized on the sales of its holdings — as well as any unrealized gains or losses over the period — is added to or subtracted from the net investment result to determine the fund’s net gain or loss for the fiscal period.
Statement of changes in net assets shows how the fund’s net assets were affected by the fund’s net investment gain or loss, by distributions to shareholders, and by changes in the number of the fund’s shares. It lists distributions and their sources (net investment income or realized capital gains) over the current reporting period and the most recent fiscal year-end. The distributions listed here may not match the sources listed in the Statement of operations because the distributions are determined on a tax basis and may be paid in a different period from the one in which they were earned. Dividend sources are estimated at the time of declaration. Actual results may vary. Any non-taxable return of capital cannot be determined until final tax calculations are completed after the end of the fund’s fiscal year.
Financial highlights provide an overview of the fund’s investment results, per-share distributions, expense ratios, net investment income ratios, and portfolio turnover in one summary table, reflecting the five most recent reporting periods. In a semiannual report, the highlights table also includes the current reporting period.
| |
| California Tax Exempt Income Fund | 17 |
The fund’s portfolio 3/31/16 (Unaudited)
Key to holding’s abbreviations
| |
| ABAG Association Of Bay Area Governments | FNMA Coll. Federal National Mortgage |
| AGC Assured Guaranty Corp. | Association Collateralized |
| AGM Assured Guaranty Municipal Corporation | G.O. Bonds General Obligation Bonds |
| AMBAC AMBAC Indemnity Corporation | NATL National Public Finance Guarantee Corp. |
| BAM Build America Mutual | Radian Insd. Radian Group Insured |
| COP Certificates of Participation | U.S. Govt. Coll. U.S. Government Collateralized |
| FGIC Financial Guaranty Insurance Company | VRDN Variable Rate Demand Notes, which are |
| FHL Banks Coll. Federal Home Loan Banks | floating-rate securities with long-term maturities |
| System Collateralized | that carry coupons that reset and are payable upon |
| FHLMC Coll. Federal Home Loan Mortgage | demand either daily, weekly or monthly. The rate |
| Corporation Collateralized | shown is the current interest rate at the close of the |
| | reporting period. |
| | | |
| MUNICIPAL BONDS AND NOTES (99.2%)* | Rating** | Principal amount | Value |
|
| California (95.3%) | | | |
| ABAG Fin. Auth. for Nonprofit Corps. Rev. Bonds | | | |
| (Sharp Hlth. Care), 6 1/4s, 8/1/39 | Aa3 | $14,000,000 | $16,196,320 |
| (Episcopal Sr. Cmntys.), 6 1/8s, 7/1/41 | BBB+/F | 2,045,000 | 2,368,683 |
| (Episcopal Sr. Cmntys.), Ser. A, 5s, 7/1/42 | BBB+/F | 700,000 | 763,273 |
| (O’Connor Woods), 5s, 1/1/33 | AA– | 2,300,000 | 2,650,727 |
|
| ABAG Fin. Auth. Non-Profit Corps Insd. Sr. Living | | | |
| Rev. Bonds (Odd Fellows Home of CA), Ser. A | | | |
| 5s, 4/1/42 | AA– | 1,000,000 | 1,113,250 |
| 5s, 4/1/32 | AA– | 3,000,000 | 3,467,790 |
|
| Alameda Cnty., Joint Pwrs. Auth. Lease Rev. | | | |
| Bonds (Multiple Cap.), Ser. A, 5s, 12/1/34 | AA | 4,960,000 | 5,818,973 |
|
| Alameda, Corridor Trans. Auth. Rev. Bonds, Ser. A, | | | |
| AMBAC, zero %, 10/1/19 | BBB+ | 5,000,000 | 4,637,300 |
|
| Anaheim, Pub. Fin. Auth. Rev. Bonds | | | |
| (Elec. Syst. Distr. Fac.), Ser. A, 5 3/8s, 10/1/36 | Aa3 | 3,000,000 | 3,498,630 |
| Ser. A, 5s, 5/1/39 | AA– | 1,000,000 | 1,172,930 |
|
| Arcadia, Unified School Dist. G.O. Bonds (Election | | | |
| of 2006), Ser. A, AGM | | | |
| zero %, 8/1/41 | Aa1 | 7,680,000 | 2,234,650 |
| zero %, 8/1/40 | Aa1 | 10,160,000 | 3,112,211 |
| zero %, 8/1/18 | Aa1 | 1,500,000 | 1,389,930 |
|
| Bay Area Toll Auth. of CA Rev. Bonds | | | |
| Ser. S-6, 5s, 10/1/54 | AA– | 8,650,000 | 9,980,024 |
| Ser. F-1, 5s, 4/1/54 | AA | 14,330,000 | 16,528,365 |
|
| CA Hlth. Fac. Fin. Auth. Rev. Bonds | | | |
| (Providence Hlth. & Svcs.), Ser. C, 6 1/2s, | | | |
| 10/1/38 (Prerefunded 10/1/18) | AAA/P | 100,000 | 113,938 |
| (Providence Hlth. & Svcs.), Ser. C, U.S. Govt. | | | |
| Coll., 6 1/2s, 10/1/38 (Prerefunded 10/1/18) | Aa3 | 5,400,000 | 6,159,888 |
| (Providence Hlth. & Svcs.), Class C, U.S. Govt. | | | |
| Coll., 6 1/4s, 10/1/28 (Prerefunded 10/1/18) | Aa3 | 3,350,000 | 3,800,810 |
| |
| 18 | California Tax Exempt Income Fund |
| | | |
| MUNICIPAL BONDS AND NOTES (99.2%)* cont. | Rating** | Principal amount | Value |
|
| California cont. | | | |
| CA Hlth. Fac. Fin. Auth. Rev. Bonds | | | |
| (Adventist Hlth. Syst.-West), Ser. A, | | | |
| 5 3/4s, 9/1/39 | A | $10,500,000 | $11,882,430 |
| (Sutter Hlth.), Ser. A, 5 1/4s, 11/15/46 | Aa3 | 10,000,000 | 10,267,500 |
| (Stanford Hosp.), Ser. A-2, 5 1/4s, 11/15/40 | Aa3 | 1,000,000 | 1,176,900 |
| (Scripps Hlth.), Ser. A, 5s, 11/15/40 | AA | 1,500,000 | 1,686,795 |
| (Cedars Sinai Med. Ctr.), 5s, 8/15/39 | Aa3 | 5,400,000 | 6,022,782 |
| (Scripps Hlth.), Ser. A, 5s, 11/15/32 | AA | 1,000,000 | 1,145,880 |
| (CA-NV Methodist), 5s, 7/1/26 | | | |
| (Prerefunded 7/1/16) | AA– | 1,745,000 | 1,764,055 |
|
| CA Hsg. Fin. Agcy. Rev. Bonds (Home Mtge.) | | | |
| Ser. I, 4 7/8s, 8/1/41 | A2 | 3,110,000 | 3,113,763 |
| Ser. M, 4 3/4s, 8/1/42 | A2 | 2,200,000 | 2,206,952 |
| Ser. K, 4 5/8s, 8/1/26 | A2 | 2,440,000 | 2,447,784 |
|
| CA Muni. Fin. Auth. COP (Cmnty. Hosp. | | | |
| Central CA) | | | |
| 5 1/4s, 2/1/46 | A– | 4,860,000 | 4,993,699 |
| U.S. Govt. Coll., 5 1/4s, 2/1/46 | | | |
| (Prerefunded 2/1/17) | AAA/P | 640,000 | 664,314 |
| 5 1/4s, 2/1/37 | A– | 7,710,000 | 7,928,501 |
| U.S. Govt. Coll., 5 1/4s, 2/1/37 | | | |
| (Prerefunded 2/1/17) | AAA/P | 5,440,000 | 5,646,666 |
|
| CA Muni. Fin. Auth. Rev. Bonds | | | |
| (U. of La Verne), Ser. A, 6 1/4s, 6/1/40 | Baa1 | 4,000,000 | 4,505,840 |
| (Emerson College), 6s, 1/1/42 | Baa1 | 1,000,000 | 1,194,340 |
| (Biola U.), 5 7/8s, 10/1/34 | Baa1 | 12,470,000 | 13,504,387 |
| (Biola U.), 5.8s, 10/1/28 | Baa1 | 220,000 | 242,121 |
| (Eisenhower Med. Ctr.), Ser. A, 5 3/4s, 7/1/40 | Baa2 | 9,000,000 | 10,153,620 |
| (Emerson College), 5 3/4s, 1/1/33 | Baa1 | 1,000,000 | 1,186,220 |
| (Loma Linda U.), 5s, 4/1/28 | A | 2,000,000 | 2,075,700 |
| (U. Students Coop Assn.), 5s, 4/1/22 | BBB | 790,000 | 817,832 |
|
| CA Muni. Fin. Auth. Sr. Living Rev. Bonds (Pilgrim | | | |
| Place Claremont), Ser. A, 6 1/8s, 5/15/39 | AA– | 3,000,000 | 3,487,860 |
|
| CA School Fin. Auth. Rev. Bonds (Kipp | | | |
| LA Projects), Ser. A, 5 1/8s, 7/1/44 | BBB– | 1,000,000 | 1,089,960 |
|
| CA State G.O. Bonds | | | |
| 6 1/2s, 4/1/33 | Aa3 | 28,000,000 | 32,478,600 |
| 5 3/4s, 4/1/31 | Aa3 | 30,000,000 | 34,185,900 |
| 5 1/4s, 4/1/35 | Aa3 | 10,000,000 | 11,887,900 |
| 5s, 9/1/45 | Aa3 | 2,500,000 | 2,990,950 |
| 5s, 8/1/45 | Aa3 | 4,000,000 | 4,731,880 |
| 5s, 3/1/45 | Aa3 | 4,165,000 | 4,897,082 |
| 5s, 10/1/44 | Aa3 | 13,905,000 | 16,374,389 |
| 5s, 12/1/43 | Aa3 | 1,500,000 | 1,767,765 |
| 5s, 11/1/43 | Aa3 | 6,645,000 | 7,819,570 |
| 5s, 4/1/37 | Aa3 | 2,000,000 | 2,358,100 |
|
| CA State VRDN, 0.32s, 5/1/33 | VMIG1 | 4,400,000 | 4,400,000 |
|
| |
| California Tax Exempt Income Fund | 19 |
| | | |
| MUNICIPAL BONDS AND NOTES (99.2%)* cont. | Rating** | Principal amount | Value |
|
| California cont. | | | |
| CA State Edl. Fac. Auth. Rev. Bonds | | | |
| (CA Lutheran U.), 5 3/4s, 10/1/38 | Baa1 | $5,000,000 | $5,476,050 |
| (Pacific U.), 5 1/2s, 11/1/39 | | | |
| (Prerefunded 11/1/19) | AAA/P | 100,000 | 115,866 |
| (U. of the Pacific), 5 1/2s, 11/1/39 | A2 | 1,085,000 | 1,229,316 |
| (U. of the Pacific), U.S. Govt. Coll., 5 1/2s, | | | |
| 11/1/39 (Prerefunded 11/1/19) | AAA/P | 65,000 | 75,313 |
| (CA College of Arts), 5 1/4s, 6/1/30 | Baa2 | 1,360,000 | 1,534,842 |
| (U. of the Pacific), 5 1/4s, 11/1/29 | A2 | 1,265,000 | 1,436,471 |
| (Loyola-Marymount U.), Ser. A, 5 1/8s, 10/1/40 | A2 | 2,955,000 | 3,274,170 |
| (U. Redlands), Ser. A, 5 1/8s, 8/1/38 | | | |
| (Prerefunded 8/1/18) | A3 | 6,430,000 | 7,074,800 |
| (Pepperdine U.), 5s, 10/1/49 | AA | 2,000,000 | 2,363,880 |
| (Pepperdine U.), 5s, 9/1/45 | AA | 1,000,000 | 1,179,880 |
| (Santa Clara U.), 5s, 4/1/45 | Aa3 | 2,500,000 | 2,891,375 |
| (Pepperdine U.), 5s, 12/1/44 | AA | 2,000,000 | 2,342,760 |
| (Pepperdine U.), 5s, 10/1/41 | AA | 1,500,000 | 1,785,810 |
| (U. of Redlands), Ser. A, 5s, 10/1/38 ## | A3 | 500,000 | 577,815 |
| (U. of Redlands), Ser. A, 5s, 10/1/37 ## | A3 | 425,000 | 491,933 |
| (U. of the Pacific), 5s, 11/1/36 | A2 | 500,000 | 590,875 |
| (U. of Redlands), Ser. A, 5s, 10/1/36 ## | A3 | 750,000 | 870,210 |
| (U. of Redlands), Ser. A, 5s, 10/1/35 | A3 | 1,000,000 | 1,145,680 |
| (Chapman U.), 5s, 4/1/31 | A2 | 2,425,000 | 2,773,739 |
| (Loyola-Marymount U.), Ser. A, NATL, | | | |
| zero %, 10/1/28 | A2 | 355,000 | 244,148 |
|
| CA State Edl. Fac. Auth. Rev. Bonds | | | |
| (Occidental College) | | | |
| 5s, 10/1/45 | Aa3 | 425,000 | 495,886 |
| 5s, 10/1/38 | Aa3 | 595,000 | 699,077 |
| 5s, 10/1/35 | Aa3 | 500,000 | 594,315 |
| 5s, 10/1/34 | Aa3 | 960,000 | 1,147,286 |
|
| CA State Hlth. Fac. Fin. Auth. Rev. Bonds (Sutter | | | |
| Health), Ser. A, 5s, 11/15/46 | Aa3 | 5,500,000 | 6,457,550 |
|
| CA State Infrastructure & Econ. Dev. | | | |
| Bank Rev. Bonds | | | |
| (Academy Motion Picture Arts & Sciences Oblig. | | | |
| Group), 5s, 11/1/41 | Aa2 | 1,000,000 | 1,141,100 |
| (J. David Gladstone Inst.), Ser. A, 5s, 10/1/31 | A– | 4,000,000 | 4,607,360 |
| (Indpt. Syst. Operator Corp.), 5s, 2/1/30 | A1 | 7,000,000 | 8,177,190 |
| (Oakland Unified School Dist. Fin.), 5s, 8/15/22 | AA– | 4,985,000 | 5,478,615 |
|
| CA State Infrastructure & Econ. Dev. Bank VRDN | | | |
| (Los Angeles Museum), Ser. A, 0.32s, 9/1/37 | VMIG1 | 3,295,000 | 3,295,000 |
|
| CA State Muni. Fin. Auth Mobile Home Park Rev. | | | |
| Bonds (Caritas Affordable Hsg., Inc.), Ser. A, | | | |
| 5s, 8/15/30 | BBB | 1,000,000 | 1,135,810 |
|
| CA State Muni. Fin. Auth. Student Hsg. Rev. Bonds | | | |
| (Bowles Hall Foundation), Ser. A, 5s, 6/1/35 | Baa3 | 1,270,000 | 1,425,473 |
|
| CA State Poll. Control Fin. Auth. Rev. Bonds | | | |
| (San Jose Wtr. Co.), 5.1s, 6/1/40 | A | 4,500,000 | 4,975,785 |
| (Wtr. Furnishing), 5s, 11/21/45 | Baa3 | 8,000,000 | 8,779,680 |
|
| |
| 20 | California Tax Exempt Income Fund |
| | | |
| MUNICIPAL BONDS AND NOTES (99.2%)* cont. | Rating** | Principal amount | Value |
|
| California cont. | | | |
| CA State Poll. Control Fin. Auth. Solid Waste Disp. | | | |
| 144A Mandatory Put Bonds (5/2/16) (Republic | | | |
| Svcs., Inc.), Ser. A, 0.65s, 8/1/23 | BBB+ | $1,200,000 | $1,199,712 |
|
| CA State Poll. Control Fin. Auth. Wtr. Fac. | | | |
| Rev. Bonds (American Wtr. Cap. Corp.), | | | |
| 5 1/4s, 8/1/40 | A | 4,000,000 | 4,484,480 |
|
| CA State Pub. Wks. Board Rev. Bonds | | | |
| Ser. I-1, 6 1/8s, 11/1/29 | A1 | 3,000,000 | 3,497,910 |
| (Dept. of Ed. — Riverside Campus), Ser. B, | | | |
| 6 1/8s, 4/1/29 | A1 | 490,000 | 558,316 |
| (Dept. of Dev. Svcs. — Porterville), | | | |
| Ser. C, 6s, 4/1/27 | A1 | 575,000 | 653,608 |
| (Dept. of Ed. — Riverside Campus), | | | |
| Ser. B, 6s, 4/1/26 | A1 | 2,625,000 | 2,987,198 |
| (Riverside Campus), Ser. B, 6s, 4/1/25 | A1 | 1,755,000 | 1,999,366 |
| (Dept. of Ed. — Riverside Campus), | | | |
| Ser. B, 6s, 4/1/24 | A1 | 4,485,000 | 5,115,187 |
| Ser. G-1, 5 3/4s, 10/1/30 | A1 | 10,000,000 | 11,468,800 |
| Ser. A-1, 5 1/2s, 3/1/25 | A1 | 2,500,000 | 2,872,800 |
| Ser. B, 5s, 10/1/39 | A1 | 1,500,000 | 1,733,085 |
| (Various Cap.), Ser. I, 5s, 11/1/38 | A1 | 1,880,000 | 2,178,488 |
| (Regents U.), Ser. E, U.S. Govt. Coll., 5s, 4/1/29 | | | |
| (Prerefunded 4/1/19) | Aaa | 7,015,000 | 7,883,457 |
| (Regents U.), Ser. E, U.S. Govt. Coll., 5s, 4/1/28 | | | |
| (Prerefunded 4/1/19) | Aaa | 8,290,000 | 9,316,302 |
| (Dept. of Corrections-State Prisons), Ser. A, | | | |
| AMBAC, 5s, 12/1/19 | A1 | 5,420,000 | 5,952,949 |
|
| CA State Tobacco Securitization Agcy. Rev. Bonds | | | |
| (Kern Cnty. Tobacco Funding Corp.), 5s, 6/1/40 | BBB+/F | 5,000,000 | 5,442,750 |
|
| CA State U. Rev. Bonds | | | |
| (Systemwide), Ser. A, 5 3/4s, 11/1/28 | Aa2 | 5,000,000 | 5,726,600 |
| (Systemwide), Ser. A, 5s, 11/1/45 ## | Aa2 | 1,500,000 | 1,783,950 |
| Ser. A, 5s, 11/1/38 | Aa2 | 2,250,000 | 2,711,295 |
| Ser. A, 5s, 11/1/35 | Aa2 | 4,500,000 | 5,440,320 |
|
| CA Statewide Cmnty. Dev. Auth. COP (The | | | |
| Internext Group), 5 3/8s, 4/1/30 | BBB+ | 4,120,000 | 4,132,030 |
|
| CA Statewide Cmnty. Dev. Auth. Rev. Bonds | | | |
| (Sr. Living — Presbyterian Homes), | | | |
| 7 1/4s, 11/15/41 | BBB– | 6,000,000 | 7,071,300 |
| (Enloe Med. Ctr.), 6 1/4s, 8/15/33 | | | |
| (Prerefunded 8/15/18) | AA– | 6,500,000 | 7,341,620 |
| (Enloe Med. Ctr.), 6 1/4s, 8/15/28 | | | |
| (Prerefunded 8/15/18) | AA– | 5,000,000 | 5,647,400 |
| (Sutter Hlth.), Ser. A, 6s, 8/15/42 | Aa3 | 5,000,000 | 5,991,950 |
| (Irvine, LLC-UCI East Campus), 6s, 5/15/40 | | | |
| (Prerefunded 5/15/18) | Baa1 | 11,000,000 | 12,202,300 |
| (American Baptist Homes West), | | | |
| 5 3/4s, 10/1/25 | BBB+/F | 950,000 | 1,086,040 |
| (Catholic Hlth. Care West), Ser. A, | | | |
| 5 1/2s, 7/1/30 | A | 3,770,000 | 3,988,434 |
| |
| California Tax Exempt Income Fund | 21 |
| | | |
| MUNICIPAL BONDS AND NOTES (99.2%)* cont. | Rating** | Principal amount | Value |
|
| California cont. | | | |
| CA Statewide Cmnty. Dev. Auth. Rev. Bonds | | | |
| (899 Charleston, LLC), Ser. A, 5 3/8s, 11/1/49 | BB/P | $1,000,000 | $1,031,470 |
| (Sutter Hlth.), Ser. B, 5 1/4s, 11/15/48 | Aa3 | 2,000,000 | 2,163,960 |
| (899 Charleston, LLC), Ser. A, 5 1/4s, 11/1/44 | BB/P | 300,000 | 308,112 |
| (American Baptist Homes of the West), | | | |
| 5s, 10/1/45 | BBB+/F | 2,550,000 | 2,826,140 |
| AGM, 5s, 11/15/44 | AA | 5,195,000 | 5,877,104 |
| (American Baptist Homes of the West), | | | |
| 5s, 10/1/43 | BBB+/F | 1,190,000 | 1,307,298 |
| (Episcopal Cmntys. and Svcs.), 5s, 5/15/42 | A–/F | 3,250,000 | 3,534,635 |
| (Enloe Med. Ctr.), 5s, 8/15/38 | AA– | 2,750,000 | 3,216,400 |
| (Enloe Med. Ctr.), 5s, 8/15/35 | AA– | 1,580,000 | 1,876,155 |
| (Episcopal Cmntys. and Svcs.), 5s, 5/15/32 | A–/F | 600,000 | 665,826 |
| (Henry Mayo Newhall Memorial Hosp.), 5s, | | | |
| 10/1/27 (Prerefunded 10/1/17) | AA– | 3,685,000 | 3,919,845 |
| (Terraces at San Joaquin Gardens), Ser. A, | | | |
| 5s, 10/1/22 | BB/P | 3,150,000 | 3,399,386 |
| (Cmnty. Fac. Dist. No. 1-Zone 1B), | | | |
| zero %, 9/1/20 | BB/P | 625,000 | 479,225 |
|
| CA Statewide Cmnty. Dev. Auth. 144A Rev. Bonds | | | |
| (American Baptist Homes West), | | | |
| 6 1/4s, 10/1/39 | BBB+/F | 4,500,000 | 5,203,980 |
| (Front Porch Cmntys. & Svcs.), Ser. A, | | | |
| 5 1/8s, 4/1/37 | BBB+ | 9,500,000 | 9,665,395 |
|
| CA Statewide Cmnty. Dev. Auth. Student Hsg. | | | |
| Rev. Bonds (CHF-Irvine, LLC), 5s, 5/15/40 | Baa1 | 2,000,000 | 2,305,100 |
|
| CA Statewide Fin. Auth. Tobacco Settlement Rev. | | | |
| Bonds, Class B, 5 5/8s, 5/1/29 | Baa3 | 2,160,000 | 2,209,097 |
|
| Carlsbad, Unified School Dist. G.O. Bonds, FGIC, | | | |
| NATL, zero %, 11/1/21 | Aa2 | 2,250,000 | 2,069,078 |
|
| Castaic Lake, Wtr. Agcy. COP (Water Syst. Impt.), | | | |
| AMBAC, zero %, 8/1/27 | AA+ | 10,000,000 | 7,381,200 |
|
| Cerritos, G.O. Bonds (Cerritos Cmnty. College | | | |
| Dist.), Ser. A, 5s, 8/1/39 | Aa2 | 9,275,000 | 10,795,080 |
|
| Chino Basin, Desalter Auth. Rev. Bonds, Ser. A, | | | |
| AGC, 5s, 6/1/30 | AA | 2,000,000 | 2,162,560 |
|
| Chula Vista, Indl. Dev. Rev. Bonds (San Diego Gas) | | | |
| Ser. C, 5 7/8s, 2/15/34 | Aa2 | 2,600,000 | 2,980,458 |
| Ser. D, 5 7/8s, 1/1/34 | Aa2 | 5,000,000 | 5,731,650 |
|
| Chula Vista, Muni. Fin. Auth. Special Tax Bonds | | | |
| 5 1/2s, 9/1/30 | BBB+ | 740,000 | 853,516 |
| 5 1/2s, 9/1/29 | BBB+ | 2,165,000 | 2,512,612 |
|
| Clovis, Unified School Dist. G.O. Bonds (Election | | | |
| 2012), Ser. D, 5s, 8/1/37 | Aa2 | 3,000,000 | 3,511,260 |
|
| Coast, Cmnty. College Dist. G.O. Bonds | | | |
| (Election 2012), Ser. A, 5s, 8/1/38 | Aa1 | 7,000,000 | 8,083,040 |
| NATL, zero %, 8/1/22 | Aa1 | 1,280,000 | 1,152,256 |
| NATL, zero %, 8/1/21 | Aa1 | 4,500,000 | 4,158,135 |
|
| |
| 22 | California Tax Exempt Income Fund |
| | | |
| MUNICIPAL BONDS AND NOTES (99.2%)* cont. | Rating** | Principal amount | Value |
|
| California cont. | | | |
| Commerce, Redev. Agcy. Tax Alloc. Bonds | | | |
| (Redev. Area 1), U.S. Govt. Coll., zero %, 8/1/21 | | | |
| (Escrowed to maturity) | AAA/P | $18,000,000 | $14,064,480 |
|
| Contra Costa, Home Mtge. Fin. Auth. Rev. | | | |
| Bonds, Ser. G, NATL, zero %, 9/1/17 (Escrowed | | | |
| to maturity) | Aaa | 4,525,000 | 4,231,282 |
|
| Corona-Norco, School Dist. Pub. Fin. Auth. | | | |
| Special Tax Bonds | | | |
| Ser. A, 5s, 9/1/35 | A– | 585,000 | 644,196 |
| Ser. A, 5s, 9/1/32 | A– | 1,125,000 | 1,256,760 |
| (Sr. Lien), Ser. A, 5s, 9/1/28 | A– | 275,000 | 313,231 |
|
| Corona-Norco, Unified School Dist. Special Tax | | | |
| Bonds (Cmnty. Fac. Dist. No. 98-1), 5s, 9/1/28 | A– | 1,590,000 | 1,782,899 |
|
| Desert Cmnty. College Dist. G.O. | | | |
| Bonds, 5s, 8/1/36 | Aa2 | 1,000,000 | 1,202,980 |
|
| El Camino, Hosp. Dist. Rev. Bonds, Ser. A, AMBAC, | | | |
| 6 1/4s, 8/15/17 (Escrowed to maturity) | AAA/P | 3,185,000 | 3,322,688 |
|
| Emeryville, Redev. Successor Agcy. Tax Alloc. | | | |
| Bonds, Ser. A, AGM | | | |
| 5s, 9/1/34 | AA | 500,000 | 580,240 |
| 5s, 9/1/33 | AA | 385,000 | 449,607 |
| 5s, 9/1/32 | AA | 450,000 | 528,093 |
| 5s, 9/1/31 | AA | 590,000 | 698,241 |
| 5s, 9/1/30 | AA | 815,000 | 976,786 |
|
| Folsom Cordova, Unified School Dist. G.O. Bonds | | | |
| (School Fac. Impt. Dist. No. 1), Ser. A, NATL, | | | |
| zero %, 10/1/25 | AA– | 1,505,000 | 1,151,656 |
|
| Fontana, Cmnty. Facs. Special Tax Bonds (Sierra | | | |
| Hills School Dist. No. 22) | | | |
| 5s, 9/1/34 | BBB–/P | 1,000,000 | 1,123,090 |
| 5s, 9/1/31 | BBB–/P | 880,000 | 995,218 |
|
| Foothill-De Anza, Cmnty. College Dist. G.O. | | | |
| Bonds, Ser. C, 5s, 8/1/40 | Aaa | 6,750,000 | 7,782,075 |
|
| Foothill/Eastern Corridor Agcy. Rev. Bonds, | | | |
| Ser. A, 6s, 1/15/53 | BBB– | 8,000,000 | 9,500,800 |
|
| Fullerton, Cmnty. Fac. Dist. No. 1 Special Tax | | | |
| Bonds (Amerige Heights), 5s, 9/1/32 | A– | 1,000,000 | 1,148,380 |
|
| Garden Grove, Unified School Dist. G.O. Bonds | | | |
| (2010 Election), Ser. C | | | |
| 5s, 8/1/32 | Aa2 | 2,000,000 | 2,391,680 |
| 5s, 8/1/31 | Aa2 | 1,500,000 | 1,798,275 |
| 5s, 8/1/30 | Aa2 | 1,000,000 | 1,204,120 |
| 5s, 8/1/29 | Aa2 | 500,000 | 604,715 |
|
| Golden State Tobacco Securitization | | | |
| Corp. Rev. Bonds | | | |
| Ser. A, 5s, 6/1/45 | A1 | 10,000,000 | 11,581,700 |
| Ser. A, 5s, 6/1/40 | A1 | 5,000,000 | 5,825,700 |
| Ser. A-1, 5s, 6/1/33 | B3 | 8,000,000 | 7,872,800 |
| Ser. A, AMBAC, zero %, 6/1/24 | A1 | 12,000,000 | 9,862,320 |
|
| |
| California Tax Exempt Income Fund | 23 |
| | | |
| MUNICIPAL BONDS AND NOTES (99.2%)* cont. | Rating** | Principal amount | Value |
|
| California cont. | | | |
| Grossmont-Cuyamaca, Cmnty. College Dist. G.O. | | | |
| Bonds (Election 2012), Ser. A, 5 1/4s, 8/1/38 | Aa2 | $4,000,000 | $4,811,800 |
|
| Hartnell Cmnty. College Dist. G.O. Bonds, Ser. A | | | |
| zero %, 8/1/37 | Aa2 | 3,500,000 | 1,487,255 |
| zero %, 8/1/36 | Aa2 | 4,750,000 | 2,133,273 |
| zero %, 8/1/35 | Aa2 | 1,000,000 | 473,000 |
|
| Hayward, Unified School Dist. G.O. | | | |
| Bonds, 5s, 8/1/38 | A+ | 1,995,000 | 2,271,088 |
|
| Imperial Irrigation Elec. Dist. Rev. Bonds | | | |
| Ser. A, 6 1/4s, 11/1/31 | AA– | 1,000,000 | 1,213,570 |
| Ser. A, 5 1/2s, 11/1/41 | AA– | 9,000,000 | 10,450,890 |
| Ser. C, 5s, 11/1/37 | AA– | 1,500,000 | 1,796,595 |
| Ser. C, 5s, 11/1/36 | AA– | 1,460,000 | 1,758,672 |
| Ser. A, 5 1/8s, 11/1/38 | AA– | 365,000 | 400,493 |
| Ser. A, U.S. Govt. Coll., 5 1/8s, 11/1/38 | | | |
| (Prerefunded 11/1/18) | AAA/P | 1,635,000 | 1,812,447 |
|
| Inland Valley, Dev. Agcy. Successor Tax Alloc. | | | |
| Bonds, Ser. A, 5 1/4s, 9/1/37 | A– | 4,925,000 | 5,658,530 |
|
| Irvine, Cmnty. Fac. Dist. No. 13-3 Special Tax | | | |
| Bonds (Great Park Impt. Area No. 1), 5s, 9/1/39 | BBB–/P | 1,000,000 | 1,113,770 |
|
| Irvine, Impt. Board Act of 1915 Special | | | |
| Assmt. Bonds | | | |
| (Ltd. Oblig. Assmt. Dist. No. 13-1), 5s, 9/2/29 | BBB+ | 705,000 | 816,277 |
| (Dist No. 12-1), 5s, 9/2/23 | BBB+ | 1,000,000 | 1,174,320 |
|
| Irvine, Unified School Dist. Special Tax Bonds, | | | |
| BAM, 5s, 9/1/38 | AA | 2,500,000 | 2,900,875 |
|
| Jurupa, Pub. Fin. Auth. Special Tax Bonds, Ser. A | | | |
| 5s, 9/1/33 | A– | 600,000 | 701,664 |
| 5s, 9/1/32 | A– | 2,475,000 | 2,908,595 |
|
| Kaweah, Delta Hlth. Care Dist. Rev. Bonds, | | | |
| Ser. B, 5s, 6/1/40 | A3 | 1,500,000 | 1,702,560 |
|
| La Verne, COP (Brethren Hillcrest Homes), | | | |
| 5s, 5/15/29 | BBB–/F | 635,000 | 700,964 |
|
| Lake Elsinore, Pub. Fin. Auth. Local Agcy. Special | | | |
| Tax Bonds (Canyon Hills Impt. Areas), Ser. A & C | | | |
| 5s, 9/1/33 | BB+/P | 1,105,000 | 1,221,368 |
| 5s, 9/1/31 | BB+/P | 1,045,000 | 1,171,184 |
|
| Las Virgenes, Unified School Dist. G.O. Bonds | | | |
| Ser. A, AGM, 5s, 8/1/28 (Prerefunded 8/1/16) | Aa2 | 5,245,000 | 5,322,259 |
| AGM, zero %, 11/1/23 | Aa2 | 1,395,000 | 1,176,710 |
|
| Long Beach Marina, Rev. Bonds, 5s, 5/15/40 | BBB/F | 1,000,000 | 1,130,280 |
|
| Long Beach, Bond Fin. Auth. Rev. Bonds | | | |
| (Natural Gas Purchase), Ser. A, | | | |
| 5 1/2s, 11/15/28 | Baa1 | 5,000,000 | 6,244,550 |
| (Aquarium of the Pacific), 5s, 11/1/30 | A1 | 1,000,000 | 1,168,920 |
| (Aquarium of the Pacific), 5s, 11/1/29 | A1 | 1,250,000 | 1,464,050 |
|
| |
| 24 | California Tax Exempt Income Fund |
| | | |
| MUNICIPAL BONDS AND NOTES (99.2%)* cont. | Rating** | Principal amount | Value |
|
| California cont. | | | |
| Long Beach, Cmnty. College Dist. G.O. Bonds | | | |
| (2008 Election), Ser. B | | | |
| 5s, 8/1/39 | Aa2 | $5,000,000 | $5,902,800 |
| zero %, 8/1/34 | Aa2 | 1,500,000 | 801,510 |
| zero %, 8/1/33 | Aa2 | 625,000 | 349,131 |
|
| Long Beach, Unified School Dist. G.O. Bonds, | | | |
| Ser. D-1, zero %, 8/1/37 | Aa2 | 1,000,000 | 426,370 |
|
| Los Angeles Ctny., Pub. Wks. Fin. Auth. Lease | | | |
| Rev. Bonds, Ser. D, 5s, 12/1/45 | AA | 3,000,000 | 3,494,160 |
|
| Los Angeles Cnty., Pub. Wks. Fin. Auth. Rev. | | | |
| Bonds, Ser. A, 5s, 12/1/44 | AA | 1,000,000 | 1,152,250 |
|
| Los Angeles Cnty., School Dist. COP | | | |
| (Headquarters Bldg.), Ser. B | | | |
| 5s, 10/1/31 | A1 | 1,125,000 | 1,321,200 |
| 5s, 10/1/30 | A1 | 1,250,000 | 1,474,638 |
|
| Los Angeles, Cmnty. College Dist. G.O. Bonds | | | |
| (Election of 2008), Ser. A, U.S. Govt. Coll., 6s, | | | |
| 8/1/33 (Prerefunded 8/1/19) | Aa1 | 9,000,000 | 10,505,340 |
|
| Los Angeles, Cmnty. Fac. Dist. No. 4 Special Tax | | | |
| Bonds (Playa Vista Phase 1) | | | |
| 5s, 9/1/31 | BBB+ | 1,500,000 | 1,729,815 |
| 5s, 9/1/30 | BBB+ | 1,500,000 | 1,741,935 |
| 5s, 9/1/29 | BBB+ | 1,500,000 | 1,754,160 |
|
| Los Angeles, Dept. of Arpt. Rev. Bonds | | | |
| Ser. D, 5s, 5/15/41 | AA | 4,000,000 | 4,602,520 |
| (Los Angeles Intl. Arpt.), Ser. A, 5s, 5/15/40 | AA | 5,000,000 | 5,718,750 |
| (Los Angeles Intl. Arpt.), Ser. D, 5s, 5/15/40 | AA | 11,500,000 | 13,153,125 |
| Ser. D, 5s, 5/15/36 | AA | 1,375,000 | 1,595,151 |
| (Sr. Intl. Private Activity), 5s, 5/15/35 | AA | 2,000,000 | 2,298,800 |
| (Los Angeles Intl. Arpt.), Ser. B, 5s, 5/15/32 | AA– | 1,000,000 | 1,176,880 |
| (Los Angeles Intl. Arpt.), Ser. B, 5s, 5/15/31 | AA– | 1,190,000 | 1,405,628 |
| (Los Angeles Intl. Arpt.), Ser. B, 5s, 5/15/30 | AA– | 1,100,000 | 1,304,886 |
| (Los Angeles Intl. Arpt.), 5s, 5/15/29 | AA | 4,225,000 | 4,951,151 |
|
| Los Angeles, Dept. of Wtr. & Pwr. Rev. Bonds | | | |
| Ser. D, 5s, 7/1/44 | Aa3 | 5,000,000 | 5,848,250 |
| (Pwr. Syst.), Ser. B, 5s, 7/1/43 | Aa3 | 7,000,000 | 8,163,190 |
| (Pwr. Syst.), Ser. B, 5s, 7/1/43 | Aa3 | 1,500,000 | 1,741,710 |
| (Wtr. Wks. Syst.), Ser. B, 5s, 7/1/31 | AA+ | 2,000,000 | 2,396,460 |
|
| Los Angeles, Harbor Dept. Rev. Bonds, FNMA | | | |
| Coll., FHLMC Coll., 7.6s, 10/1/18 (Escrowed | | | |
| to maturity) | AA+ | 7,350,000 | 8,037,740 |
|
| Los Angeles, Unified School Dist. G.O. Bonds | | | |
| Ser. D, 5s, 1/1/34 | Aa2 | 3,865,000 | 4,320,954 |
| Ser. F, 5s, 7/1/29 | Aa2 | 2,000,000 | 2,246,800 |
| (Election 2008), Ser. A, 5s, 7/1/40 ## | Aa2 | 2,000,000 | 2,366,640 |
|
| Los Angeles, Waste Wtr. Syst. Rev. Bonds | | | |
| (Green Bond), Ser. C, 5s, 6/1/45 | AA+ | 2,500,000 | 2,952,450 |
| Ser. B, 5s, 6/1/30 | AA | 8,000,000 | 9,593,520 |
|
| |
| California Tax Exempt Income Fund | 25 |
| | | |
| MUNICIPAL BONDS AND NOTES (99.2%)* cont. | Rating** | Principal amount | Value |
|
| California cont. | | | |
| M-S-R Energy Auth. Rev. Bonds, Ser. A, | | | |
| 6 1/2s, 11/1/39 | BBB+ | $6,000,000 | $8,507,580 |
|
| Merced, City School Dist. G.O. Bonds (Election | | | |
| 2014), 5s, 8/1/45 | Aa3 | 3,500,000 | 4,068,540 |
|
| Merced, Union High School Dist. G.O. Bonds, AGM | | | |
| zero %, 8/1/44 | AA | 8,655,000 | 2,253,589 |
| zero %, 8/1/39 | AA | 5,005,000 | 1,718,717 |
|
| Metro. Wtr. Dist. Rev. Bonds (Southern CA Wtr. | | | |
| Wks.), 5 3/4s, 8/10/18 | AAA | 12,100,000 | 12,868,229 |
|
| Modesto, Irrigation Dist. Elec. Rev. Bonds, | | | |
| Ser. A, AGM | | | |
| 5s, 7/1/32 | AA | 800,000 | 917,392 |
| 5s, 7/1/31 | AA | 1,600,000 | 1,843,856 |
|
| Modesto, Irrigation Dist. Fin. Auth. Elec. Syst. Rev. | | | |
| Bonds, Ser. A, 5s, 10/1/40 | A+ | 2,790,000 | 3,181,019 |
|
| Mt. San Antonio, Cmnty College Dist. G.O. Bonds | | | |
| (Election 2008), Ser. A-13, 5s, 8/1/34 | Aa2 | 2,000,000 | 2,312,320 |
|
| Murrieta Valley, Unified School Dist. G.O. Bonds, | | | |
| AGM, zero %, 9/1/31 | AA | 2,000,000 | 1,173,660 |
|
| Murrieta, Pub. Fin. Auth. Special Tax | | | |
| Bonds, 5s, 9/1/26 | BBB– | 1,000,000 | 1,150,940 |
|
| Napa Valley, Cmnty. College Dist. G.O. Bonds | | | |
| (Election of 2002), Ser. C, NATL | | | |
| zero %, 8/1/22 | Aa2 | 5,000 | 3,857 |
| zero %, 8/1/21 | Aa2 | 6,750,000 | 5,477,423 |
| zero %, 8/1/21 (Prerefunded 8/1/17) | Aa2 | 1,825,000 | 1,478,597 |
|
| North Natomas, Cmnty. Fac. Special Tax Bonds | | | |
| (Dist. No. 4), Ser. E, 5 1/4s, 9/1/33 | BBB+ | 1,500,000 | 1,697,055 |
|
| Northern CA Pwr. Agcy. Rev. Bonds (Hydroelec. | | | |
| Project No. 1), Ser. A | | | |
| 5s, 7/1/32 | A+ | 700,000 | 822,577 |
| 5s, 7/1/30 | A+ | 1,000,000 | 1,188,020 |
|
| Oakland, G.O. Bonds, Ser. A, 5s, 1/15/35 | Aa2 | 2,000,000 | 2,344,740 |
|
| Oakland, Alameda Cnty. Unified School | | | |
| Dist. G.O. Bonds | | | |
| (Election of 2012), 6 5/8s, 8/1/38 | BBB/P | 1,000,000 | 1,202,110 |
| (Election of 2006), Ser. A, 6 1/8s, 8/1/29 | BBB/P | 4,000,000 | 4,508,400 |
| Ser. A, 5s, 8/1/40 | BBB+/P | 1,000,000 | 1,133,700 |
|
| Orange Cnty., Cmnty. Fac. Dist. Special Tax Bonds | | | |
| (Ladera Ranch — No. 04-1), Ser. A | | | |
| 5s, 8/15/33 | BBB | 1,750,000 | 1,955,608 |
| 5s, 8/15/32 | BBB | 1,000,000 | 1,120,150 |
|
| Orange Cnty., Sanitation Dist. Waste Wtr. Rev. | | | |
| Bonds, Ser. A, 5s, 2/1/37 | AAA | 3,190,000 | 3,777,853 |
|
| Orange Cnty., Trans. Auth Toll Road Rev. Bonds | | | |
| (91 Express Lane), 5s, 8/15/29 | AA– | 1,050,000 | 1,255,065 |
|
| Pico Rivera, Pub. Fin. Auth. Lease Rev. Bonds | | | |
| 5 3/4s, 9/1/39 | A+ | 6,000,000 | 6,807,060 |
| 5 1/2s, 9/1/31 | A+ | 1,000,000 | 1,134,090 |
|
| |
| 26 | California Tax Exempt Income Fund |
| | | |
| MUNICIPAL BONDS AND NOTES (99.2%)* cont. | Rating** | Principal amount | Value |
|
| California cont. | | | |
| Port of Oakland, Rev. Bonds, Ser. P | | | |
| 5s, 5/1/33 | A+ | $1,860,000 | $2,099,196 |
| 5s, 5/1/31 | A+ | 1,000,000 | 1,140,620 |
|
| Poway, Unified School Dist. G.O. Bonds (Election | | | |
| of 2008), zero %, 8/1/29 | Aa3 | 11,350,000 | 7,724,016 |
|
| Poway, Unified School Dist. Pub. Fin. Auth. | | | |
| Special Tax Bonds | | | |
| 5s, 9/15/32 | BBB | 500,000 | 557,785 |
| 5s, 9/15/28 | BBB | 1,110,000 | 1,253,945 |
|
| Rancho Cordova, Cmnty. Fac. Dist. Special Tax | | | |
| Bonds (Sunridge Anatolia), Ser. 03-1, 5s, 9/1/32 | BB+/P | 1,250,000 | 1,386,225 |
|
| Redding, Elec. Syst. Rev. Bonds, NATL, 6.368s, | | | |
| 7/1/22 (Escrowed to maturity) | AA– | 3,000,000 | 3,486,060 |
|
| Redwood City, Redev. Agcy., Tax Alloc. Bonds | | | |
| (Redev. Area 2-A), AMBAC, zero %, 7/15/22 | A– | 3,230,000 | 2,749,861 |
|
| Rio Linda, Unified School Dist. G.O. Bonds | | | |
| (Election of 2006), AGM, 5s, 8/1/31 | AA | 6,000,000 | 6,297,300 |
|
| Ripon, Redev. Agcy. Tax Alloc. Bonds (Cmnty. | | | |
| Redev.), NATL, 4 3/4s, 11/1/36 | A3 | 1,410,000 | 1,431,940 |
|
| Riverside Cnty., Trans. Comm. Toll Rev. Bonds, | | | |
| Ser. A, 5 3/4s, 6/1/44 | BBB– | 750,000 | 864,675 |
|
| Rocklin, Special Tax Bonds, 5s, 9/1/35 | BB/P | 3,500,000 | 3,814,965 |
|
| Rohnert Pk., Cmnty. Dev. Agcy. Tax Alloc. Bonds | | | |
| (Rohnert Redev.), NATL, zero %, 8/1/25 | AA– | 1,340,000 | 1,004,075 |
|
| Roseville, Special Tax Bonds (Westpark Cmnty. | | | |
| Pub. Fac. Dist. No. 1) | | | |
| 5s, 9/1/37 | BBB–/P | 1,250,000 | 1,369,725 |
| 5s, 9/1/33 | BBB–/P | 1,000,000 | 1,094,950 |
|
| Roseville, Elec. Syst. Fin. Auth. Rev. Bonds | | | |
| 5s, 2/1/34 | A+ | 1,625,000 | 1,886,073 |
| 5s, 2/1/33 | A+ | 1,455,000 | 1,695,803 |
| 5s, 2/1/32 | A+ | 500,000 | 585,185 |
| 5s, 2/1/28 | A+ | 2,895,000 | 3,423,164 |
|
| Sacramento Cnty., Arpt. Syst. Rev. Bonds, | | | |
| Ser. A, AGM | | | |
| 5s, 7/1/28 | AA | 1,500,000 | 1,630,395 |
| 5s, 7/1/26 | AA | 5,000,000 | 5,446,300 |
| 5s, 7/1/25 | AA | 3,990,000 | 4,347,065 |
|
| Sacramento, City Fin. Auth. Tax Alloc. Bonds, | | | |
| Ser. A, FGIC, NATL | | | |
| zero %, 12/1/23 | AA– | 10,000,000 | 8,324,400 |
| zero %, 12/1/22 | AA– | 7,500,000 | 6,470,850 |
|
| Sacramento, Muni. Util. Dist. Rev. Bonds | | | |
| Ser. Y, 5s, 8/15/32 | Aa3 | 1,500,000 | 1,801,230 |
| Ser. B, 5s, 8/15/31 | Aa3 | 2,905,000 | 3,485,506 |
| Ser. Y, 5s, 8/15/31 | Aa3 | 500,000 | 602,085 |
| Ser. X, 5s, 8/15/28 | Aa3 | 1,650,000 | 1,960,431 |
|
| Sacramento, Muni. Util. Dist. Elec. Rev. Bonds, | | | |
| Ser. K, AMBAC, 5 1/4s, 7/1/24 | Aa3 | 11,520,000 | 14,287,910 |
|
| |
| California Tax Exempt Income Fund | 27 |
| | | |
| MUNICIPAL BONDS AND NOTES (99.2%)* cont. | Rating** | Principal amount | Value |
|
| California cont. | | | |
| Sacramento, Muni. Util. Dist. Fin. Auth. | | | |
| Rev. Bonds (Cosumnes), NATL, 5s, 7/1/19 | | | |
| (Prerefunded 7/1/16) | A3 | $1,070,000 | $1,081,545 |
|
| Sacramento, Regl. Trans. Dist. Rev. Bonds | | | |
| (Farebox), 5s, 3/1/42 | A3 | 2,890,000 | 3,224,084 |
|
| San Bernardino Cnty., Special Tax | | | |
| Bonds, 5s, 9/1/33 | BBB–/P | 2,500,000 | 2,742,325 |
|
| San Bernardino, Cmnty. College Dist. G.O. Bonds | | | |
| (Election of 2002), Ser. A, 6 1/4s, 8/1/33 | | | |
| (Prerefunded 8/1/18) | Aa2 | 1,000,000 | 1,126,120 |
| (Election of 2008), Ser. D, 5s, 8/1/45 | Aa2 | 1,500,000 | 1,751,625 |
|
| San Diego Cmnty. Fac. Dist. No. 3 Special Tax | | | |
| Bonds, 5s, 9/1/36 | BBB–/P | 985,000 | 1,067,917 |
|
| San Diego Cnty., Regl. Arpt. Auth. Rev. Bonds, | | | |
| Ser. B, 5s, 7/1/38 | A1 | 2,000,000 | 2,244,620 |
|
| San Diego, Pub. Fac. Fin. Auth. Rev. Bonds | | | |
| Ser. A, 5 1/4s, 3/1/40 | AA– | 1,000,000 | 1,133,220 |
| Ser. A, 5 1/4s, 9/1/35 | AA– | 1,500,000 | 1,716,840 |
| Ser. A, 5 1/4s, 3/1/25 | AA– | 6,065,000 | 7,064,815 |
| (Cap. Impt.), Ser. A, 5s, 10/15/35 | AA– | 500,000 | 600,225 |
| Ser. A, 5s, 9/1/26 | AA– | 6,265,000 | 7,222,355 |
|
| San Diego, Pub. Fac. Fin. Auth. Tax Alloc. | | | |
| Bonds (Southcrest), Ser. B, Radian Insd., | | | |
| 5 1/8s, 10/1/22 | AA | 1,000,000 | 1,065,430 |
|
| San Diego, Pub. Fac. Fin. Auth. Swr. Rev. | | | |
| Bonds, Ser. A | | | |
| 5 1/4s, 5/15/29 (Prerefunded 5/15/20) | AA+ | 1,245,000 | 1,459,227 |
| 5 1/8s, 5/15/29 (Prerefunded 5/15/19) | AA+ | 7,885,000 | 8,917,698 |
| 5s, 5/15/37 | AA+ | 2,000,000 | 2,424,320 |
|
| San Diego, Unified School Dist. G.O. Bonds | | | |
| (Election of 2008), Ser. C, zero %, 7/1/44 | Aa2 | 10,000,000 | 3,304,400 |
|
| San Francisco City & Cnty. Arpt. Comm. Intl. | | | |
| Arpt. Rev. Bonds | | | |
| Ser. A, 5 1/4s, 5/1/33 | A1 | 4,000,000 | 4,619,200 |
| 5s, 5/1/29 | A1 | 2,000,000 | 2,377,960 |
|
| San Francisco City & Cnty., Intl. Arpt. Comm. Rev. | | | |
| Bonds, Ser. B, 5s, 5/1/43 | A1 | 3,280,000 | 3,717,486 |
|
| San Francisco City & Cnty., Redev. Agcy. Cmnty. | | | |
| Successor Special Tax Bonds (No. 6 Mission Bay | | | |
| South Pub. Impts.), Ser. A, 5s, 8/1/31 | BBB–/P | 1,140,000 | 1,252,450 |
|
| San Francisco, City & Cnty. Arpt. Comm. Rev. | | | |
| Bonds (Intl. Arpt.) | | | |
| Ser. 34D, AGC, 5 1/4s, 5/1/25 | | | |
| (Prerefunded 5/1/18) | AA | 2,250,000 | 2,459,250 |
| Ser. F, 5s, 5/1/40 | A1 | 4,750,000 | 5,280,955 |
| Ser. G, 5s, 5/1/40 | A1 | 4,400,000 | 4,891,832 |
|
| |
| 28 | California Tax Exempt Income Fund |
| | | |
| MUNICIPAL BONDS AND NOTES (99.2%)* cont. | Rating** | Principal amount | Value |
|
| California cont. | | | |
| San Francisco, City & Cnty. Redev. Fin. Auth. Tax | | | |
| Alloc. Bonds | | | |
| (Mission Bay North Redev.), Ser. C, | | | |
| 6 3/4s, 8/1/41 | A– | $1,000,000 | $1,194,910 |
| (Mission Bay South Redev.), Ser. D, | | | |
| 6 5/8s, 8/1/39 | BBB+ | 1,250,000 | 1,415,913 |
|
| San Francisco, City & Cnty., Redev. Agcy. Cmnty. | | | |
| Successor Tax Alloc. Bonds (Mission Bay South | | | |
| Redev.), Ser. A, 5s, 8/1/43 | A– | 1,750,000 | 1,930,040 |
|
| San Joaquin Cnty., Trans. Auth. Rev. Bonds, Ser. A, | | | |
| 5 1/2s, 3/1/41 | AA | 7,000,000 | 8,272,110 |
|
| San Joaquin Hills, Trans. Corridor Agcy. Toll Road | | | |
| Rev. Bonds, Ser. A, 5s, 1/15/34 | BBB– | 7,125,000 | 7,983,563 |
|
| San Jose, Redev. Agcy. Tax Alloc. Bonds (Merged | | | |
| Area Redev.), Ser. B, Radian Insd., 5s, 8/1/32 | AA | 3,935,000 | 3,973,602 |
|
| San Marcos, Unified School Dist. G.O. Bonds | | | |
| (Election 2010), Ser. B, zero %, 8/1/51 | Aa3 | 11,425,000 | 2,570,397 |
|
| San Mateo Cnty., Cmnty. College G.O. Bonds | | | |
| (Election of 2005) | | | |
| Ser. B, NATL, zero %, 9/1/27 | Aaa | 10,545,000 | 7,969,806 |
| Ser. A, NATL, zero %, 9/1/26 | Aaa | 4,000,000 | 3,162,680 |
|
| Santa Clara, Elec. Rev. Rev. Bonds, Ser. A | | | |
| 6s, 7/1/31 | A+ | 2,500,000 | 3,050,600 |
| 5 1/4s, 7/1/32 | A+ | 4,000,000 | 4,700,000 |
|
| Santa Clara Valley, Wtr. Dist. Rev. Bonds, | | | |
| Ser. A, 5s, 6/1/46 | Aa1 | 1,500,000 | 1,783,035 |
|
| Santaluz, Cmnty. Fac. Dist. No. 2 Special Tax | | | |
| Bonds (Impt. Area No. 1), Ser. A | | | |
| 5 1/4s, 9/1/27 (Prerefunded 9/1/21) | BBB+ | 3,270,000 | 3,693,727 |
| 5 1/4s, 9/1/26 (Prerefunded 9/1/21) | BBB+ | 1,485,000 | 1,683,827 |
| 5.1s, 9/1/30 (Prerefunded 9/1/21) | BBB+ | 480,000 | 533,477 |
|
| Saugus, Unified School Dist. G.O. Bonds, FGIC, | | | |
| NATL, zero %, 8/1/24 | Aa2 | 1,210,000 | 1,014,391 |
|
| School Fin. Fac. Auth. 144A Rev. Bonds (Kipp | | | |
| LA Projects), Ser. A, 5s, 7/1/45 | BBB– | 1,500,000 | 1,614,825 |
|
| Solano, Cmnty. College Dist. G.O. Bonds (Election | | | |
| of 2002), Ser. B, FGIC, NATL, zero %, 8/1/25 | | | |
| (Prerefunded 8/1/16) | Aa3 | 9,020,000 | 5,824,575 |
|
| South Orange Cnty., Pub. Fin. Auth. Special Tax | | | |
| Bonds, Ser. A | | | |
| 5s, 8/15/32 | BBB+ | 1,000,000 | 1,124,410 |
| 5s, 8/15/30 | BBB+ | 1,130,000 | 1,278,448 |
|
| South Western Cmnty. College Dist. G.O. Bonds | | | |
| (Election 2008), Ser. D | | | |
| 5s, 8/1/44 | Aa2 | 4,000,000 | 4,663,920 |
| zero %, 8/1/37 | Aa2 | 3,100,000 | 1,237,644 |
|
| Southern CA Pub. Pwr. Auth. Rev. Bonds | | | |
| (Natural Gas No. 1), Ser. A, 5 1/4s, 11/1/24 | A3 | 2,850,000 | 3,412,419 |
| (Natural Gas), Ser. A, 5 1/4s, 11/1/21 | A3 | 1,500,000 | 1,745,505 |
| Ser. A, 5s, 7/1/40 | AA– | 6,860,000 | 7,600,811 |
|
| |
| California Tax Exempt Income Fund | 29 |
| | | |
| MUNICIPAL BONDS AND NOTES (99.2%)* cont. | Rating** | Principal amount | Value |
|
| California cont. | | | |
| Stockton, Pub. Wtr. Fin. Auth. Rev. Bonds (Delta | | | |
| Wtr. Supply), Ser. A | | | |
| 6 1/4s, 10/1/40 | A | $1,250,000 | $1,548,100 |
| 6 1/4s, 10/1/38 | A | 2,235,000 | 2,781,703 |
| 6 1/8s, 10/1/35 | A | 750,000 | 936,953 |
|
| Stockton, Unified School Dist. G.O. Bonds | | | |
| (Election 2012), Ser. A, AGM, 5s, 8/1/38 | AA | 1,000,000 | 1,130,560 |
|
| Sunnyvale, Cmnty. Fac. Dist. Special Tax Bonds, | | | |
| 7.65s, 8/1/21 | B+/P | 3,105,000 | 3,114,067 |
|
| Sweetwater, G.O. Bonds (Union High School | | | |
| Dist.), 5s, 8/1/35 | A1 | 2,330,000 | 2,776,265 |
|
| Tobacco Securitization Auth. of Southern | | | |
| CA Rev. Bonds | | | |
| Class A1-SNR, 5 1/8s, 6/1/46 | B+ | 5,000,000 | 4,942,850 |
| Ser. A1-SNR, 5s, 6/1/37 | BB+ | 2,000,000 | 1,981,820 |
|
| Tracy, Operational Partnership, Joint Powers Auth. | | | |
| Lease Rev. Bonds, AGC | | | |
| 6 3/8s, 10/1/38 | AA | 2,200,000 | 2,470,248 |
| 6 1/4s, 10/1/33 | AA | 3,000,000 | 3,373,560 |
|
| Tuolumne Wind Project Auth. Rev. Bonds | | | |
| (Tuolumne Co.), Ser. A | | | |
| 5 7/8s, 1/1/29 | AA– | 6,000,000 | 6,739,560 |
| 5 5/8s, 1/1/29 | AA– | 1,000,000 | 1,116,550 |
|
| Turlock, Irrigation Dist. Rev. Bonds, | | | |
| Ser. A, 5s, 1/1/40 | AA– | 12,640,000 | 13,955,812 |
|
| Tustin Cmnty., Fac. Dist. Special Tax Bonds | | | |
| (No. 06-1 Legacy Columbus Villages), | | | |
| Ser. A, 5s, 9/1/37 | BBB+ | 2,100,000 | 2,386,587 |
|
| Twin Rivers, Unified School Dist. G.O. Bonds, | | | |
| Ser. A, BAM, 5s, 8/1/40 | AA | 2,000,000 | 2,250,240 |
|
| U. of CA Rev. Bonds | | | |
| Ser. O, 5 1/4s, 5/15/39 | AA | 8,380,000 | 9,350,572 |
| Ser. O, FHL Banks Coll., U.S. Govt. Coll., 5 1/4s, | | | |
| 5/15/39 (Prerefunded 5/15/19) | AAA/P | 1,620,000 | 1,833,030 |
| Ser. AI, 5s, 5/15/32 | Aa2 | 3,000,000 | 3,554,430 |
|
| Union, G.O. Bonds, Ser. A, 5s, 9/1/44 | Aa1 | 1,890,000 | 2,178,036 |
|
| Ventura Cnty., COP (Pub. Fin. Auth. III) | | | |
| 5 3/4s, 8/15/29 | AA+ | 1,500,000 | 1,728,975 |
| 5 3/4s, 8/15/28 | AA+ | 1,745,000 | 2,012,002 |
|
| Yucaipa Special Tax Bonds (Cmnty. Fac. Dist. No. | | | |
| 98-1 Chapman Heights), 5 3/8s, 9/1/30 | BBB+ | 2,350,000 | 2,612,895 |
|
| | 1,297,525,525 |
| Delaware (0.6%) | | | |
| DE State Hlth. Fac. Auth. VRDN (Christiana Care), | | | |
| Ser. A, 0.34s, 10/1/38 | VMIG1 | 8,050,000 | 8,050,000 |
|
| | | | 8,050,000 |
| |
| 30 | California Tax Exempt Income Fund |
| | | |
| MUNICIPAL BONDS AND NOTES (99.2%)* cont. | Rating** | Principal amount | Value |
|
| Guam (0.3%) | | | |
| Territory of GU, Bus. Privilege Tax Rev. Bonds, | | | |
| Ser. A, 5s, 1/1/31 | A | $1,000,000 | $1,120,910 |
|
| Territory of GU, Govt. Wtr. Wks. Auth. Wtr. & | | | |
| Waste Wtr. Syst. Rev. Bonds, 5 5/8s, 7/1/40 | A– | 2,450,000 | 2,733,343 |
|
| Territory of GU, Pwr. Auth. Rev. Bonds, Ser. A, | | | |
| AGM, 5s, 10/1/30 | AA | 1,000,000 | 1,167,140 |
|
| | 5,021,393 |
| Indiana (0.6%) | | | |
| IN State Fin. Auth. VRDN, Ser. A-3, 0.38s, 2/1/37 | VMIG1 | 8,000,000 | 8,000,000 |
|
| | 8,000,000 |
| Missouri (0.6%) | | | |
| MO State Hlth. & Edl. Fac. Auth. VRDN (WA U. | | | |
| (The)), Ser. C, 0.35s, 9/1/30 | VMIG1 | 8,300,000 | 8,300,000 |
|
| | 8,300,000 |
| Nevada (0.3%) | | | |
| Reno, Sales Tax VRDN (Reno Trans. Rail Access | | | |
| Corridor (ReTRAC)), 0.42s, 6/1/42 | VMIG1 | 4,350,000 | 4,350,000 |
|
| | 4,350,000 |
| Puerto Rico (0.3%) | | | |
| Children’s Trust Fund Tobacco Settlement (The) | | | |
| Rev. Bonds, 5 5/8s, 5/15/43 | Ba2 | 4,000,000 | 4,015,040 |
|
| | 4,015,040 |
| Texas (0.6%) | | | |
| Harris Cnty., Cultural Ed. Fac. Fin. Corp. VRDN | | | |
| (The Methodist Hosp.), Ser. C-1, 0.34s, 12/1/24 | A-1+ | 8,535,000 | 8,535,000 |
|
| | 8,535,000 |
| Utah (0.4%) | | | |
| Murray City, Hosp. VRDN (IHC Hlth. Svcs., Inc.), | | | |
| Ser. A, 0.35s, 5/15/37 | VMIG1 | 5,105,000 | 5,105,000 |
|
| | 5,105,000 |
| Virgin Islands (0.2%) | | | |
| VI Pub. Fin. Auth. Rev. Bonds, Ser. A, 5s, 10/1/25 | Baa2 | 2,000,000 | 2,222,160 |
|
| | | | 2,222,160 |
| |
| TOTAL INVESTMENTS | | | |
|
| Total investments (cost $1,211,079,514) | | | $1,351,124,118 |
Notes to the fund’s portfolio
Unless noted otherwise, the notes to the fund’s portfolio are for the close of the fund’s reporting period, which ran from October 1, 2015 through March 31, 2016 (the reporting period). Within the following notes to the portfolio, references to “ASC 820” represent Accounting Standards Codification 820 Fair Value Measurements and Disclosures and references to “OTC”, if any, represent over-the-counter.
* Percentages indicated are based on net assets of $1,361,912,088.
** The Moody’s, Standard & Poor’s or Fitch ratings indicated are believed to be the most recent ratings available at the close of the reporting period for the securities listed. Ratings are generally ascribed to securities at the time of issuance. While the agencies may from time to time revise such ratings, they undertake no obligation to do so, and the ratings do not necessarily represent what the agencies would ascribe to these securities at the close of the reporting period. Securities rated by Putnam are indicated by “/P.” Securities rated by Fitch are indicated by “/F.” If a security is insured, it will usually be rated by the ratings organizations based on the financial strength of the insurer. For further details regarding security ratings, please see the Statement of Additional Information.
## Forward commitment, in part or in entirety (Note 1).
| |
| California Tax Exempt Income Fund | 31 |
144A after the name of an issuer represents securities exempt from registration under Rule 144A under the Securities Act of 1933, as amended. These securities may be resold in transactions exempt from registration, normally to qualified institutional buyers.
On Mandatory Put Bonds, the rates shown are the current interest rates at the close of the reporting period and the dates shown represent the next mandatory put dates.
The dates shown parenthetically on prerefunded bonds represent the next prerefunding dates.
The dates shown on debt obligations are the original maturity dates.
The fund had the following sector (concentration)(concentrations) greater than 10% at the close of the reporting period (as a percentage of net assets):
| | | | | |
| State debt | 15.7% | | | | |
| Local debt | 15.1 | | | | |
| Utilities | 14.6 | | | | |
| Health care | 11.9 | | | | |
| Prerefunded | 11.2 | | | | |
ASC 820 establishes a three-level hierarchy for disclosure of fair value measurements. The valuation hierarchy is based upon the transparency of inputs to the valuation of the fund’s investments. The three levels are defined as follows:
Level 1: Valuations based on quoted prices for identical securities in active markets.
Level 2: Valuations based on quoted prices in markets that are not active or for which all significant inputs are observable, either directly or indirectly.
Level 3: Valuations based on inputs that are unobservable and significant to the fair value measurement.
The following is a summary of the inputs used to value the fund’s net assets as of the close of the reporting period:
| | | | |
| | | | | Valuation inputs | |
|
| Investments in securities: | | Level 1 | Level 2 | Level 3 |
|
| Municipal bonds and notes | | $— | $1,351,124,118 | $— |
|
| Totals by level | | $— | $1,351,124,118 | $— |
During the reporting period, transfers within the fair value hierarchy, if any, did not represent, in the aggregate, more than 1% of the fund’s net assets measured as of the end of the period. Transfers are accounted for using the end of period pricing valuation method.
The accompanying notes are an integral part of these financial statements.
| |
| 32 | California Tax Exempt Income Fund |
Statement of assets and liabilities 3/31/16 (Unaudited)
| |
| ASSETS | |
|
| Investment in securities, at value (Note 1): | |
| Unaffiliated issuers (identified cost $1,211,079,514) | $1,351,124,118 |
|
| Cash | 327,596 |
|
| Interest and other receivables | 16,975,616 |
|
| Receivable for shares of the fund sold | 3,780,107 |
|
| Prepaid assets | 7,682 |
|
| Total assets | 1,372,215,119 |
| |
| LIABILITIES | |
|
| Payable for purchases of delayed delivery securities (Note 1) | 6,044,878 |
|
| Payable for shares of the fund repurchased | 1,480,888 |
|
| Payable for compensation of Manager (Note 2) | 498,278 |
|
| Payable for custodian fees (Note 2) | 6,537 |
|
| Payable for investor servicing fees (Note 2) | 151,565 |
|
| Payable for Trustee compensation and expenses (Note 2) | 462,857 |
|
| Payable for administrative services (Note 2) | 4,667 |
|
| Payable for distribution fees (Note 2) | 707,442 |
|
| Distributions payable to shareholders | 828,418 |
|
| Other accrued expenses | 117,501 |
|
| Total liabilities | 10,303,031 |
| | |
| Net assets | $1,361,912,088 |
|
| |
| REPRESENTED BY | |
|
| Paid-in capital (Unlimited shares authorized) (Notes 1 and 4) | $1,268,018,498 |
|
| Undistributed net investment income (Note 1) | 6,734,931 |
|
| Accumulated net realized loss on investments (Note 1) | (52,885,945) |
|
| Net unrealized appreciation of investments | 140,044,604 |
|
| Total — Representing net assets applicable to capital shares outstanding | $1,361,912,088 |
| |
| COMPUTATION OF NET ASSET VALUE AND OFFERING PRICE | |
|
| Net asset value and redemption price per class A share | |
| ($1,234,806,378 divided by 148,688,019 shares) | $8.30 |
|
| Offering price per class A share (100/96.00 of $8.30)* | $8.65 |
|
| Net asset value and offering price per class B share ($5,200,043 divided by 626,813 shares)** | $8.30 |
|
| Net asset value and offering price per class C share ($54,009,020 divided by 6,466,604 shares)** | $8.35 |
|
| Net asset value and redemption price per class M share ($2,822,177 divided by 340,799 shares) | $8.28 |
|
| Offering price per class M share (100/96.75 of $8.28)† | $8.56 |
|
| Net asset value, offering price and redemption price per class Y share | |
| ($65,074,470 divided by 7,814,681 shares) | $8.33 |
|
* On single retail sales of less than $100,000. On sales of $100,000 or more the offering price is reduced.
** Redemption price per share is equal to net asset value less any applicable contingent deferred sales charge.
† On single retail sales of less than $50,000. On sales of $50,000 or more the offering price is reduced.
The accompanying notes are an integral part of these financial statements.
| |
| California Tax Exempt Income Fund | 33 |
Statement of operations Six months ended 3/31/16 (Unaudited)
| |
| INTEREST INCOME | $28,917,428 |
|
| EXPENSES | |
|
| Compensation of Manager (Note 2) | $2,913,620 |
|
| Investor servicing fees (Note 2) | 457,167 |
|
| Custodian fees (Note 2) | 7,747 |
|
| Trustee compensation and expenses (Note 2) | 54,951 |
|
| Distribution fees (Note 2) | 1,600,198 |
|
| Administrative services (Note 2) | 22,488 |
|
| Other | 148,746 |
|
| Total expenses | 5,204,917 |
| | |
| Expense reduction (Note 2) | (808) |
|
| Net expenses | 5,204,109 |
| | |
| Net investment income | 23,713,319 |
|
| |
| Net realized gain on investments (Notes 1 and 3) | 413,793 |
|
| Net unrealized appreciation of investments during the period | 19,492,315 |
|
| Net gain on investments | 19,906,108 |
| | |
| Net increase in net assets resulting from operations | $43,619,427 |
|
The accompanying notes are an integral part of these financial statements.
| |
| 34 | California Tax Exempt Income Fund |
Statement of changes in net assets
| | |
| INCREASE (DECREASE) IN NET ASSETS | Six months ended 3/31/16* | Year ended 9/30/15 |
|
| Operations: | | |
| Net investment income | $23,713,319 | $50,731,925 |
|
| Net realized gain on investments | 413,793 | 13,862,388 |
|
| Net unrealized appreciation (depreciation) of investments | 19,492,315 | (20,521,449) |
|
| Net increase in net assets resulting from operations | 43,619,427 | 44,072,864 |
|
| Distributions to shareholders (Note 1): | | |
| From ordinary income | | |
| Taxable net investment income | | |
|
| Class A | (980,960) | (671,620) |
|
| Class B | (4,205) | (3,271) |
|
| Class C | (39,045) | (23,673) |
|
| Class M | (2,338) | (1,512) |
|
| Class Y | (48,678) | (30,683) |
|
| From tax-exempt net investment income | | |
| Class A | (21,457,688) | (46,020,235) |
|
| Class B | (75,277) | (181,206) |
|
| Class C | (668,224) | (1,310,498) |
|
| Class M | (46,698) | (96,310) |
|
| Class Y | (1,125,437) | (2,240,057) |
|
| Increase (decrease) from capital share transactions (Note 4) | 3,040,263 | (42,087,297) |
|
| Total increase (decrease) in net assets | 22,211,140 | (48,593,498) |
| |
| NET ASSETS | | |
|
| Beginning of period | 1,339,700,948 | 1,388,294,446 |
|
| End of period (including undistributed net investment | | |
| income of $6,734,931 and $7,470,162, respectively) | $1,361,912,088 | $1,339,700,948 |
|
* Unaudited.
The accompanying notes are an integral part of these financial statements.
| |
| California Tax Exempt Income Fund | 35 |
Financial highlights (For a common share outstanding throughout the period)
| | | | | | | | | | | | | | |
| INVESTMENT OPERATIONS: | | LESS DISTRIBUTIONS: | | | RATIOS AND SUPPLEMENTAL DATA: | |
|
| | | | | | | | | | | | | Ratio | Ratio | |
| | | | Net realized | | | From | | | | | | of expenses | of net investment | |
| | Net asset value, | | and unrealized | Total from | From | net realized | | | | Total return | Net assets, | to average | income (loss) | Portfolio |
| | beginning | Net investment | gain (loss) | investment | net investment | gain | Total | Non-recurring | Net asset value, | at net asset | end of period | net assets | to average | turnover |
| Period ended | of period | income (loss) | on investments | operations | income | on investments | distributions | reimbursements | end of period | value (%)a | (in thousands) | (%)b,c | net assets (%)c | (%) |
|
| Class A | | | | | | | | | | | | | | |
| March 31, 2016** | $8.19 | .15 | .11 | .26 | (.15) | — | (.15) | — | $8.30 | 3.21* | $1,234,806 | .38* | 1.77* | 6* |
| September 30, 2015 | 8.23 | .31 | (.04) | .27 | (.31) | — | (.31) | — | 8.19 | 3.29 | 1,226,347 | .74 | 3.73 | 14 |
| September 30, 2014 | 7.81 | .32 | .42 | .74 | (.32) | — | (.32) | — | 8.23 | 9.63 | 1,278,391 | .74 | 3.99 | 11 |
| September 30, 2013 | 8.34 | .33 | (.53) | (.20) | (.33) | — | (.33) | — | 7.81 | (2.50) | 1,338,414 | .74 | 4.03 | 11 |
| September 30, 2012 | 7.83 | .34 | .51 | .85 | (.34) | — | (.34) | — | 8.34 | 11.12 | 1,591,810 | .75 | 4.30 | 6 |
| September 30, 2011 | 7.99 | .36 | (.16) | .20 | (.36) | — | (.36) | —d | 7.83 | 2.75 | 1,466,160 | .75 | 4.77 | 9 |
|
| Class B | | | | | | | | | | | | | | |
| March 31, 2016** | $8.18 | .12 | .12 | .24 | (.12) | — | (.12) | — | $8.30 | 3.01* | $5,200 | .69* | 1.46* | 6* |
| September 30, 2015 | 8.22 | .25 | (.04) | .21 | (.25) | — | (.25) | — | 8.18 | 2.64 | 5,360 | 1.37 | 3.10 | 14 |
| September 30, 2014 | 7.80 | .27 | .42 | .69 | (.27) | — | (.27) | — | 8.22 | 8.96 | 6,364 | 1.37 | 3.36 | 11 |
| September 30, 2013 | 8.34 | .28 | (.54) | (.26) | (.28) | — | (.28) | — | 7.80 | (3.24) | 7,255 | 1.37 | 3.40 | 11 |
| September 30, 2012 | 7.83 | .29 | .51 | .80 | (.29) | — | (.29) | — | 8.34 | 10.42 | 8,749 | 1.38 | 3.67 | 6 |
| September 30, 2011 | 7.98 | .31 | (.15) | .16 | (.31) | — | (.31) | —d | 7.83 | 2.24 | 8,615 | 1.38 | 4.15 | 9 |
|
| Class C | | | | | | | | | | | | | | |
| March 31, 2016** | $8.23 | .12 | .12 | .24 | (.12) | — | (.12) | — | $8.35 | 2.91* | $54,009 | .77* | 1.38* | 6* |
| September 30, 2015 | 8.27 | .24 | (.04) | .20 | (.24) | — | (.24) | — | 8.23 | 2.46 | 46,944 | 1.52 | 2.95 | 14 |
| September 30, 2014 | 7.85 | .25 | .42 | .67 | (.25) | — | (.25) | — | 8.27 | 8.73 | 44,233 | 1.52 | 3.21 | 11 |
| September 30, 2013 | 8.38 | .27 | (.53) | (.26) | (.27) | — | (.27) | — | 7.85 | (3.25) | 47,175 | 1.52 | 3.25 | 11 |
| September 30, 2012 | 7.87 | .28 | .51 | .79 | (.28) | — | (.28) | — | 8.38 | 10.19 | 56,923 | 1.53 | 3.51 | 6 |
| September 30, 2011 | 8.03 | .30 | (.16) | .14 | (.30) | — | (.30) | —d | 7.87 | 1.95 | 45,516 | 1.53 | 3.99 | 9 |
|
| Class M | | | | | | | | | | | | | | |
| March 31, 2016** | $8.16 | .14 | .12 | .26 | (.14) | — | (.14) | — | $8.28 | 3.20* | $2,822 | .52* | 1.63* | 6* |
| September 30, 2015 | 8.20 | .28 | (.04) | .24 | (.28) | — | (.28) | — | 8.16 | 3.00 | 3,033 | 1.02 | 3.45 | 14 |
| September 30, 2014 | 7.79 | .29 | .41 | .70 | (.29) | — | (.29) | — | 8.20 | 9.22 | 2,670 | 1.02 | 3.71 | 11 |
| September 30, 2013 | 8.32 | .31 | (.53) | (.22) | (.31) | — | (.31) | — | 7.79 | (2.78) | 2,606 | 1.02 | 3.75 | 11 |
| September 30, 2012 | 7.81 | .32 | .51 | .83 | (.32) | — | (.32) | — | 8.32 | 10.83 | 3,341 | 1.03 | 4.00 | 6 |
| September 30, 2011 | 7.97 | .34 | (.16) | .18 | (.34) | — | (.34) | —d | 7.81 | 2.45 | 2,590 | 1.03 | 4.48 | 9 |
|
| Class Y | | | | | | | | | | | | | | |
| March 31, 2016** | $8.21 | .16 | .12 | .28 | (.16) | — | (.16) | — | $8.33 | 3.44* | $65,074 | .27* | 1.88* | 6* |
| September 30, 2015 | 8.25 | .32 | (.04) | .28 | (.32) | — | (.32) | — | 8.21 | 3.50 | 58,017 | .52 | 3.95 | 14 |
| September 30, 2014 | 7.83 | .33 | .42 | .75 | (.33) | — | (.33) | — | 8.25 | 9.85 | 56,636 | .52 | 4.20 | 11 |
| September 30, 2013 | 8.36 | .35 | (.53) | (.18) | (.35) | — | (.35) | — | 7.83 | (2.28) | 54,574 | .52 | 4.25 | 11 |
| September 30, 2012 | 7.85 | .36 | .51 | .87 | (.36) | — | (.36) | — | 8.36 | 11.30 | 56,992 | .53 | 4.49 | 6 |
| September 30, 2011 | 8.01 | .38 | (.16) | .22 | (.38) | — | (.38) | —d | 7.85 | 2.99 | 34,064 | .53 | 4.98 | 9 |
|
See notes to financial highlights at the end of this section.
The accompanying notes are an integral part of these financial statements.
| | | |
| 36 | California Tax Exempt Income Fund | California Tax Exempt Income Fund | 37 |
Financial highlights (Continued)
* Not annualized.
** Unaudited.
a Total return assumes dividend reinvestment and does not reflect the effect of sales charges.
b Includes amounts paid through expense offset arrangements, if any (Note 2). Also excludes acquired fund fees, if any.
c Includes interest and fees expense associated with borrowings which amounted to the following (Note 1):
| |
| | Percentage of |
| | average net assets |
|
| September 30, 2014 | <0.01% |
|
| September 30, 2013 | <0.01 |
|
| September 30, 2012 | <0.01 |
|
| September 30, 2011 | <0.01 |
|
d Reflects a non-recurring reimbursement related to restitution amounts in connection with a distribution plan approved by the Securities and Exchange Commission (the SEC) which amounted to less than $0.01 per share outstanding on July 21, 2011. Also reflects a non-recurring reimbursement related to short-term trading related lawsuits, which amounted to less than $0.01 per share outstanding on May 11, 2011.
The accompanying notes are an integral part of these financial statements.
| |
| 38 | California Tax Exempt Income Fund |
Notes to financial statements 3/31/16 (Unaudited)
Within the following Notes to financial statements, references to “State Street” represent State Street Bank and Trust Company, references to “the SEC” represent the Securities and Exchange Commission, references to “Putnam Management” represent Putnam Investment Management, LLC, the fund’s manager, an indirect wholly-owned subsidiary of Putnam Investments, LLC and references to “OTC”, if any, represent over-the-counter. Unless otherwise noted, the “reporting period” represents the period from October 1, 2015 through March 31, 2016.
Putnam California Tax Exempt Income Fund (the fund) is a Massachusetts business trust, which is registered under the Investment Company Act of 1940, as amended, as a diversified open-end management investment company. The goal of the fund is to seek as high a level of current income exempt from federal income tax and California personal income tax as Putnam Management believes to be consistent with preservation of capital. The fund invests mainly in bonds that pay interest that is exempt from federal income tax and California personal income tax (but that may be subject to federal alternative minimum tax (AMT)), are investment-grade in quality, and have intermediate- to long-term maturities (three years or longer). Under normal circumstances, Putnam Management invests so that at least 90% of the fund’s income distributions are exempt from federal income tax and California personal income tax, except during times of adverse market conditions, when more than 10% of the fund’s income distributions could be subject to these taxes. This investment policy cannot be changed without the approval of the fund’s shareholders. Putnam Management may consider, among other factors, credit, interest rate and prepayment risks, as well as general market conditions, when deciding whether to buy or sell investments.
The fund offers class A, class B, class C, class M and class Y shares. Class A and class M shares are sold with a maximum front-end sales charge of 4.00% and 3.25%, respectively. Class A shares generally are not subject to a contingent deferred sales charge and class M shares are not subject to a contingent deferred sales charge. Class B shares, which convert to class A shares after approximately eight years, do not pay a front-end sales charge and are subject to a contingent deferred sales charge if those shares are redeemed within six years of purchase. Class C shares have a one-year 1.00% contingent deferred sales charge and do not convert to class A shares. The expenses for class A, class B, class C, and class M shares may differ based on the distribution fee of each class, which is identified in Note 2. Class Y shares, which are sold at net asset value, are generally subject to the same expenses as class A, class B, class C, and class M shares, but do not bear a distribution fee. Class Y shares are not available to all investors.
In the normal course of business, the fund enters into contracts that may include agreements to indemnify another party under given circumstances. The fund’s maximum exposure under these arrangements is unknown as this would involve future claims that may be, but have not yet been, made against the fund. However, the fund’s management team expects the risk of material loss to be remote.
Note 1: Significant accounting policies
The following is a summary of significant accounting policies consistently followed by the fund in the preparation of its financial statements. The preparation of financial statements is in conformity with accounting principles generally accepted in the United States of America and requires management to make estimates and assumptions that affect the reported amounts of assets and liabilities in the financial statements and the reported amounts of increases and decreases in net assets from operations. Actual results could differ from those estimates. Subsequent events after the Statement of assets and liabilities date through the date that the financial statements were issued have been evaluated in the preparation of the financial statements.
Investment income, realized and unrealized gains and losses and expenses of the fund are borne pro-rata based on the relative net assets of each class to the total net assets of the fund, except that each class bears expenses unique to that class (including the distribution fees applicable to such classes). Each class votes as a class only with respect to its own distribution plan or other matters on which a class vote is required by law or determined by the Trustees. If the fund were liquidated, shares of each class would receive their pro-rata share of the net assets of the fund. In addition, the Trustees declare separate dividends on each class of shares.
Security valuation Portfolio securities and other investments are valued using policies and procedures adopted by the Board of Trustees. The Trustees have formed a Pricing Committee to oversee the implementation of these procedures and have delegated responsibility for valuing the fund’s assets in accordance with these procedures to Putnam Management. Putnam Management has established an internal Valuation Committee that is responsible for making fair value determinations, evaluating the effectiveness of the pricing policies of the fund and reporting to the Pricing Committee.
| |
| California Tax Exempt Income Fund | 39 |
Tax-exempt bonds and notes are generally valued on the basis of valuations provided by an independent pricing service approved by the Trustees. Such services use information with respect to transactions in bonds, quotations from bond dealers, market transactions in comparable securities and various relationships between securities in determining value. These securities will generally be categorized as Level 2.
Certain investments, including certain restricted and illiquid securities and derivatives, are also valued at fair value following procedures approved by the Trustees. To assess the continuing appropriateness of fair valuations, the Valuation Committee reviews and affirms the reasonableness of such valuations on a regular basis after considering all relevant information that is reasonably available. Such valuations and procedures are reviewed periodically by the Trustees. These valuations consider such factors as significant market or specific security events such as interest rate or credit quality changes, various relationships with other securities, discount rates, U.S. Treasury, U.S. swap and credit yields, index levels, convexity exposures, recovery rates, sales and other multiples and resale restrictions. These securities are classified as Level 2 or as Level 3 depending on the priority of the significant inputs. The fair value of securities is generally determined as the amount that the fund could reasonably expect to realize from an orderly disposition of such securities over a reasonable period of time. By its nature, a fair value price is a good faith estimate of the value of a security in a current sale and does not reflect an actual market price, which may be different by a material amount.
Security transactions and related investment income Security transactions are recorded on the trade date (the date the order to buy or sell is executed). Gains or losses on securities sold are determined on the identified cost basis.
Interest income is recorded on the accrual basis. All premiums/discounts are amortized/accreted on a yield-to-maturity basis. The premium in excess of the call price, if any, is amortized to the call date; thereafter, any remaining premium is amortized to maturity.
Securities purchased or sold on a delayed delivery basis may be settled at a future date beyond customary settlement time; interest income is accrued based on the terms of the securities. Losses may arise due to changes in the fair value of the underlying securities or if the counterparty does not perform under the contract.
Interfund lending The fund, along with other Putnam funds, may participate in an interfund lending program pursuant to an exemptive order issued by the SEC. This program allows the fund to borrow from other Putnam funds that permit such transactions. Interfund lending transactions are subject to each fund’s investment policies and borrowing and lending limits. Interest earned or paid on the interfund lending transaction will be based on the average of certain current market rates. During the reporting period, the fund did not utilize the program.
Lines of credit The fund participates, along with other Putnam funds, in a $392.5 million syndicated unsecured committed line of credit provided by State Street ($292.5 million) and Northern Trust Company ($100 million) and a $235.5 million unsecured uncommitted line of credit provided by State Street. Borrowings may be made for temporary or emergency purposes, including the funding of shareholder redemption requests and trade settlements. Interest is charged to the fund based on the fund’s borrowing at a rate equal to the higher of (1) the Federal Funds rate and (2) the overnight LIBOR plus 1.25% for the committed line of credit and the Federal Funds rate plus 1.30% for the uncommitted line of credit. A closing fee equal to 0.04% of the committed line of credit and 0.04% of the uncommitted line of credit has been paid by the participating funds. In addition, a commitment fee of 0.16% per annum on any unutilized portion of the committed line of credit is allocated to the participating funds based on their relative net assets and paid quarterly. During the reporting period, the fund had no borrowings against these arrangements.
Federal taxes It is the policy of the fund to distribute all of its income within the prescribed time period and otherwise comply with the provisions of the Internal Revenue Code of 1986, as amended (the Code), applicable to regulated investment companies. It is also the intention of the fund to distribute an amount sufficient to avoid imposition of any excise tax under Section 4982 of the Code.
The fund is subject to the provisions of Accounting Standards Codification 740 Income Taxes (ASC 740). ASC 740 sets forth a minimum threshold for financial statement recognition of the benefit of a tax position taken or expected to be taken in a tax return. The fund did not have a liability to record for any unrecognized tax benefits in the accompanying financial statements. No provision has been made for federal taxes on income, capital gains or unrealized appreciation on securities held nor for excise tax on income and capital gains. Each of the fund’s federal tax returns for the prior three fiscal years remains subject to examination by the Internal Revenue Service.
| |
| 40 | California Tax Exempt Income Fund |
At September 30, 2015 the fund had a capital loss carryover of $50,520,374 available to the extent allowed by the Code to offset future net capital gain, if any. The amounts of the carryovers and the expiration dates are:
| | | |
| Loss carryover |
|
| Short-term | Long-term | Total | Expiration |
|
| $5,330,069 | $— | $5,330,069 | * |
|
| 766,815 | N/A | 766,815 | September 30, 2016 |
|
| 12,478,683 | N/A | 12,478,683 | September 30, 2017 |
|
| 1,872,123 | N/A | 1,872,123 | September 30, 2018 |
|
| 30,072,684 | N/A | 30,072,684 | September 30, 2019 |
|
* Under the Regulated Investment Company Modernization Act of 2010, the fund will be permitted to carry forward capital losses incurred in taxable years beginning after December 22, 2010 for an unlimited period. However, any losses incurred will be required to be utilized prior to the losses incurred in pre-enactment tax years. As a result of this ordering rule, pre-enactment capital loss carryforwards may be more likely to expire unused. Additionally, post-enactment capital losses that are carried forward will retain their character as either short-term or long-term capital losses rather than being considered all short-term as under previous law.
Pursuant to federal income tax regulations applicable to regulated investment companies, the fund has elected to defer certain capital losses of $1,295,478 recognized during the period between November 1, 2014 and September 30, 2015 to its fiscal year ending September 30, 2016.
The aggregate identified cost on a tax basis is $1,210,336,019, resulting in gross unrealized appreciation and depreciation of $140,950,170 and $162,071, respectively, or net unrealized appreciation of $140,788,099.
Distributions to shareholders Income dividends are recorded daily by the fund and are paid monthly. Distributions from capital gains, if any, are recorded on the ex-dividend date and paid at least annually. The amount and character of income and gains to be distributed are determined in accordance with income tax regulations which may differ from generally accepted accounting principles. Dividend sources are estimated at the time of declaration. Actual results may vary. Any non-taxable return of capital cannot be determined until final tax calculations are completed after the end of the fund’s fiscal year. Reclassifications are made to the fund’s capital accounts to reflect income and gains available for distribution (or available capital loss carryovers) under income tax regulations.
Note 2: Management fee, administrative services and other transactions
The fund pays Putnam Management a management fee (based on the fund’s average net assets and computed and paid monthly) at annual rates that may vary based on the average of the aggregate net assets of most open-end funds, as defined in the fund’s management contract, sponsored by Putnam Management. Such annual rates may vary as follows:
| | | | |
| 0.590% | of the first $5 billion, | | 0.390% | of the next $50 billion, |
| |
|
| 0.540% | of the next $5 billion, | | 0.370% | of the next $50 billion, |
| |
|
| 0.490% | of the next $10 billion, | | 0.360% | of the next $100 billion and |
| |
|
| 0.440% | of the next $10 billion, | | 0.355% | of any excess thereafter. |
| |
|
Putnam Management has contractually agreed, through January 30, 2017, to waive fees or reimburse the fund’s expenses to the extent necessary to limit the cumulative expenses of the fund, exclusive of brokerage, interest, taxes, investment-related expenses, extraordinary expenses, acquired fund fees and expenses and payments under the fund’s investor servicing contract, investment management contract and distribution plans, on a fiscal year-to-date basis to an annual rate of 0.20% of the fund’s average net assets over such fiscal year-to-date period. During the reporting period, the fund’s expenses were not reduced as a result of this limit.
Putnam Investments Limited (PIL), an affiliate of Putnam Management, is authorized by the Trustees to manage a separate portion of the assets of the fund as determined by Putnam Management from time to time. Putnam Management will pay a quarterly sub-management fee to PIL for its services at an annual rate of 0.40% of the average net assets of the portion of the fund managed by PIL.
| |
| California Tax Exempt Income Fund | 41 |
The fund reimburses Putnam Management an allocated amount for the compensation and related expenses of certain officers of the fund and their staff who provide administrative services to the fund. The aggregate amount of all such reimbursements is determined annually by the Trustees.
Custodial functions for the fund’s assets are provided by State Street. Custody fees are based on the fund’s asset level, the number of its security holdings and transaction volumes.
Putnam Investor Services, Inc., an affiliate of Putnam Management, provides investor servicing agent functions to the fund. Putnam Investor Services, Inc. received fees for investor servicing that included (1) a per account fee for each direct and underlying non-defined contribution account (“retail account”) of the fund and each of the other funds in its specified category, which was totaled and then allocated to each fund in the category based on its average daily net assets; (2) a specified rate of the fund’s assets attributable to defined contribution plan accounts; and (3) a specified rate based on the average net assets in retail accounts. Putnam Investor Services has agreed that the aggregate investor servicing fees for each fund’s retail and defined contribution accounts will not exceed an annual rate of 0.320% of the fund’s average assets attributable to such accounts. During the reporting period, the expenses for each class of shares related to investor servicing fees were as follows:
| | | | |
| Class A | $416,829 | | Class M | 984 |
| |
|
| Class B | 1,784 | | Class Y | 20,673 |
| |
|
| Class C | 16,897 | | Total | $457,167 |
| |
|
The fund has entered into expense offset arrangements with Putnam Investor Services, Inc. and State Street whereby Putnam Investor Services, Inc.’s and State Street’s fees are reduced by credits allowed on cash balances. For the reporting period, the fund’s expenses were reduced by $808 under the expense offset arrangements.
Each Independent Trustee of the fund receives an annual Trustee fee, of which $931, as a quarterly retainer, has been allocated to the fund, and an additional fee for each Trustees meeting attended. Trustees also are reimbursed for expenses they incur relating to their services as Trustees.
The fund has adopted a Trustee Fee Deferral Plan (the Deferral Plan) which allows the Trustees to defer the receipt of all or a portion of Trustees fees payable on or after July 1, 1995. The deferred fees remain invested in certain Putnam funds until distribution in accordance with the Deferral Plan.
The fund has adopted an unfunded noncontributory defined benefit pension plan (the Pension Plan) covering all Trustees of the fund who have served as a Trustee for at least five years and were first elected prior to 2004. Benefits under the Pension Plan are equal to 50% of the Trustee’s average annual attendance and retainer fees for the three years ended December 31, 2005. The retirement benefit is payable during a Trustee’s lifetime, beginning the year following retirement, for the number of years of service through December 31, 2006. Pension expense for the fund is included in Trustee compensation and expenses in the Statement of operations. Accrued pension liability is included in Payable for Trustee compensation and expenses in the Statement of assets and liabilities. The Trustees have terminated the Pension Plan with respect to any Trustee first elected after 2003.
The fund has adopted distribution plans (the Plans) with respect to its class A, class B, class C and class M shares pursuant to Rule 12b–1 under the Investment Company Act of 1940. The purpose of the Plans is to compensate Putnam Retail Management Limited Partnership, an indirect wholly-owned subsidiary of Putnam Investments, LLC, for services provided and expenses incurred in distributing shares of the fund. The Plans provide for payments by the fund to Putnam Retail Management Limited Partnership at an annual rate of up to 0.35%, 1.00%, 1.00% and 1.00% of the average net assets attributable to class A, class B, class C and class M shares, respectively. The Trustees have approved payment by the fund at the annual rate of 0.85%, 1.00% and 0.50% of the average net assets for class B, class C and class M shares, respectively. For class A shares, the annual payment rate will equal the weighted average of (i) 0.20% on the net assets of the fund attributable to class A shares purchased and paid for prior to April 1, 2005 and (ii) 0.25% on all other net assets of the fund attributable to class A shares. During the reporting period, the class specific expenses related to distribution fees were as follows:
| | | | |
| Class A | $1,321,820 | | Class M | 7,243 |
| |
|
| Class B | 22,329 | | Total | $1,600,198 |
| |
|
| Class C | 248,806 | | | |
| | |
| |
| 42 | California Tax Exempt Income Fund |
For the reporting period, Putnam Retail Management Limited Partnership, acting as underwriter, received net commissions of $40,252 and $97 from the sale of class A and class M shares, respectively, and received no monies in contingent deferred sales charges from redemptions of class B and class C shares.
A deferred sales charge of up to 1.00% is assessed on certain redemptions of class A shares. For the reporting period, Putnam Retail Management Limited Partnership, acting as underwriter, received $5,388 on class A redemptions.
Note 3: Purchases and sales of securities
During the reporting period, the cost of purchases and the proceeds from sales, excluding short-term investments, were as follows:
| | |
| | Cost of purchases | Proceeds from sales |
|
| Investments in securities (Long-term) | $91,228,357 | $78,544,829 |
|
| U.S. government securities (Long-term) | — | — |
|
| Total | $91,228,357 | $78,544,829 |
|
The fund may purchase or sell investments from or to other Putnam funds in the ordinary course of business, which can reduce the fund’s transaction costs, at prices determined in accordance with SEC requirements and policies approved by the Trustees. During the reporting period, purchases or sales from or to other Putnam funds, if any, did not represent more than 5% of the fund’s total cost of purchases and/or total proceeds from sales.
Note 4: Capital shares
At the close of the reporting period, there were an unlimited number of shares of beneficial interest authorized. Transactions in capital shares were as follows:
| | | | |
| | Six months ended 3/31/16 | Year ended 9/30/15 |
|
| Class A | Shares | Amount | Shares | Amount |
|
| Shares sold | 6,334,709 | $52,230,054 | 9,952,072 | $82,132,249 |
|
| Shares issued in connection with | | | | |
| reinvestment of distributions | 2,128,125 | 17,553,607 | 4,390,175 | 36,195,391 |
|
| | 8,462,834 | 69,783,661 | 14,342,247 | 118,327,640 |
|
| Shares repurchased | (9,563,668) | (78,776,643) | (19,956,925) | (164,430,719) |
|
| Net decrease | (1,100,834) | $(8,992,982) | (5,614,678) | $(46,103,079) |
|
| |
| | Six months ended 3/31/16 | Year ended 9/30/15 |
|
| Class B | Shares | Amount | Shares | Amount |
|
| Shares sold | 25,246 | $208,112 | 37,287 | $307,642 |
|
| Shares issued in connection with | | | | |
| reinvestment of distributions | 9,244 | 76,178 | 21,054 | 173,415 |
|
| | 34,490 | 284,290 | 58,341 | 481,057 |
|
| Shares repurchased | (63,027) | (518,811) | (177,276) | (1,455,952) |
|
| Net decrease | (28,537) | $(234,521) | (118,935) | $(974,895) |
|
| |
| | Six months ended 3/31/16 | Year ended 9/30/15 |
|
| Class C | Shares | Amount | Shares | Amount |
|
| Shares sold | 1,065,387 | $8,838,165 | 1,081,005 | $8,963,776 |
|
| Shares issued in connection with | | | | |
| reinvestment of distributions | 68,026 | 564,475 | 128,090 | 1,061,456 |
|
| | 1,133,413 | 9,402,640 | 1,209,095 | 10,025,232 |
|
| Shares repurchased | (368,917) | (3,055,252) | (855,569) | (7,087,052) |
|
| Net increase | 764,496 | $6,347,388 | 353,526 | $2,938,180 |
|
| |
| California Tax Exempt Income Fund | 43 |
| | | | |
| | Six months ended 3/31/16 | Year ended 9/30/15 |
|
| Class M | Shares | Amount | Shares | Amount |
|
| Shares sold | 5,967 | $49,404 | 43,028 | $352,347 |
|
| Shares issued in connection with | | | | |
| reinvestment of distributions | 5,196 | 42,752 | 10,435 | 85,764 |
|
| | 11,163 | 92,156 | 53,463 | 438,111 |
|
| Shares repurchased | (41,855) | (344,240) | (7,477) | (61,525) |
|
| Net increase (decrease) | (30,692) | $(252,084) | 45,986 | $376,586 |
|
| |
| | Six months ended 3/31/16 | Year ended 9/30/15 |
|
| Class Y | Shares | Amount | Shares | Amount |
|
| Shares sold | 1,459,564 | $12,069,116 | 1,790,406 | $14,812,642 |
|
| Shares issued in connection with | | | | |
| reinvestment of distributions | 99,329 | 821,964 | 189,139 | 1,563,145 |
|
| | 1,558,893 | 12,891,080 | 1,979,545 | 16,375,787 |
|
| Shares repurchased | (811,874) | (6,718,618) | (1,779,395) | (14,699,876) |
|
| Net increase | 747,019 | $6,172,462 | 200,150 | $1,675,911 |
|
Note 5: Market, credit and other risks
In the normal course of business, the fund trades financial instruments and enters into financial transactions where risk of potential loss exists due to changes in the market (market risk) or failure of the contracting party to the transaction to perform (credit risk). The fund may be exposed to additional credit risk that an institution or other entity with which the fund has unsettled or open transactions will default. The fund focuses a majority of its investments in the state of California and may be affected by economic and political developments in that state.
| |
| 44 | California Tax Exempt Income Fund |
Fund information
Founded over 75 years ago, Putnam Investments was built around the concept that a balance between risk and reward is the hallmark of a well-rounded financial program. We manage over 100 funds across income, value, blend, growth, asset allocation, absolute return, and global sector categories.
| | |
| Investment Manager | Trustees | Robert T. Burns |
| Putnam Investment | Jameson A. Baxter, Chair | Vice President and |
| Management, LLC | Liaquat Ahamed | Chief Legal Officer |
| One Post Office Square | Ravi Akhoury | |
| Boston, MA 02109 | Barbara M. Baumann | James F. Clark |
| | Robert J. Darretta | Chief Compliance Officer |
| Investment Sub-Manager | Katinka Domotorffy | |
| Putnam Investments Limited | John A. Hill | Michael J. Higgins |
| 57–59 St James’s Street | Paul L. Joskow | Vice President, Treasurer, |
| London, England SW1A 1LD | Kenneth R. Leibler | and Clerk |
| | Robert E. Patterson | |
| Marketing Services | George Putnam, III | Janet C. Smith |
| Putnam Retail Management | Robert L. Reynolds | Vice President, |
| One Post Office Square | W. Thomas Stephens | Principal Accounting Officer, |
| Boston, MA 02109 | | and Assistant Treasurer |
| | Officers | |
| Custodian | Robert L. Reynolds | Susan G. Malloy |
| State Street Bank | President | Vice President and |
| and Trust Company | | Assistant Treasurer |
| | Jonathan S. Horwitz | |
| Legal Counsel | Executive Vice President, | James P. Pappas |
| Ropes & Gray LLP | Principal Executive Officer, and | Vice President |
| | Compliance Liaison | |
| | | Mark C. Trenchard |
| | Steven D. Krichmar | Vice President and |
| | Vice President and | BSA Compliance Officer |
| | Principal Financial Officer | |
| | | Nancy E. Florek |
| | | Vice President, Director of |
| | | Proxy Voting and Corporate |
| | | Governance, Assistant Clerk, |
| | | and Associate Treasurer |
This report is for the information of shareholders of Putnam California Tax Exempt Income Fund. It may also be used as sales literature when preceded or accompanied by the current prospectus, the most recent copy of Putnam’s Quarterly Performance Summary, and Putnam’s Quarterly Ranking Summary. For more recent performance, please visit putnam.com. Investors should carefully consider the investment objectives, risks, charges, and expenses of a fund, which are described in its prospectus. For this and other information or to request a prospectus or summary prospectus, call 1-800-225-1581 toll free. Please read the prospectus carefully before investing. The fund’s Statement of Additional Information contains additional information about the fund’s Trustees and is available without charge upon request by calling 1-800-225-1581.

| |
| Item 3. Audit Committee Financial Expert: |
| |
| Item 4. Principal Accountant Fees and Services: |
| |
| Item 5. Audit Committee of Listed Registrants |
| |
| Item 6. Schedule of Investments: |
| |
| The registrant's schedule of investments in unaffiliated issuers is included in the report to shareholders in Item 1 above. |
| |
| Item 7. Disclosure of Proxy Voting Policies and Procedures For Closed-End Management Investment Companies: |
| |
| Item 8. Portfolio Managers of Closed-End Investment Companies |
| |
| Item 9. Purchases of Equity Securities by Closed-End Management Investment Companies and Affiliated Purchasers: |
| |
| Item 10. Submission of Matters to a Vote of Security Holders: |
| |
| Item 11. Controls and Procedures: |
| |
| (a) The registrant's principal executive officer and principal financial officer have concluded, based on their evaluation of the effectiveness of the design and operation of the registrant's disclosure controls and procedures as of a date within 90 days of the filing date of this report, that the design and operation of such procedures are generally effective to provide reasonable assurance that information required to be disclosed by the registrant in this report is recorded, processed, summarized and reported within the time periods specified in the Commission's rules and forms. |
| |
| (b) Changes in internal control over financial reporting: Not applicable |
| |
| (a)(2) Separate certifications for the principal executive officer and principal financial officer of the registrant as required by Rule 30a-2(a) under the Investment Company Act of 1940, as amended, are filed herewith. |
| |
| (b) The certifications required by Rule 30a-2(b) under the Investment Company Act of 1940, as amended, are filed herewith. |
| |
| Putnam California Tax Exempt Income Fund |
| |
| By (Signature and Title): |
| |
| /s/ Janet C. Smith
Janet C. Smith
Principal Accounting Officer
|
| |
| Pursuant to the requirements of the Securities Exchange Act of 1934 and the Investment Company Act of 1940, this report has been signed below by the following persons on behalf of the registrant and in the capacities and on the dates indicated. |
| |
| By (Signature and Title): |
| |
| /s/ Jonathan S. Horwitz
Jonathan S. Horwitz
Principal Executive Officer
|
| |
| By (Signature and Title): |
| |
| /s/ Steven D. Krichmar
Steven D. Krichmar
Principal Financial Officer
|