CERTIFIED SHAREHOLDER REPORT OF REGISTERED MANAGEMENT INVESTMENT COMPANIES
Investment Company Act file number:
(811-03630)
Exact name of registrant as specified in charter:
Putnam California Tax Exempt Income Fund
Address of principal executive offices:
One Post Office Square, Boston, Massachusetts 02109
Name and address of agent for service:
Robert T. Burns, Vice President One Post Office Square Boston, Massachusetts 02109
Copy to:
Bryan Chegwidden, Esq. Ropes & Gray LLP 1211 Avenue of the Americas New York, New York 10036
Registrant’s telephone number, including area code:
(617) 292-1000
Date of fiscal year end:
September 30, 2015
Date of reporting period:
October 1, 2014 – March 31, 2015
Item 1. Report to Stockholders:
The following is a copy of the report transmitted to stockholders pursuant to Rule 30e-1 under the Investment Company Act of 1940:
Putnam California Tax Exempt Income Fund
Semiannual report 3 | 31 | 15
Message from the Trustees
1
About the fund
2
Performance snapshot
4
Interview with your fund’s portfolio manager
5
Your fund’s performance
11
Your fund’s expenses
13
Terms and definitions
15
Other information for shareholders
16
Financial statements
17
Consider these risks before investing: The value of bonds in the fund’s portfolio may fall or fail to rise over extended periods of time for a variety of reasons, including general financial market conditions, changing market perceptions of the risk of default, changes in government intervention, and factors related to a specific issuer. These factors may also lead to periods of high volatility and reduced liquidity in the bond markets. Single-state investments are at risk of common economic forces and other factors affecting a state’s tax-exempt investments. This may result in greater losses and volatility. Capital gains, if any, are taxed at the federal and, in most cases, state levels. For some investors, investment income may be subject to the federal alternative minimum tax. Bond investments are subject to interest-rate risk (the risk of bond prices falling if interest rates rise) and credit risk (the risk of an issuer defaulting on interest or principal payments). Interest-rate risk is greater for longer-term bonds, and credit risk is greater for below-investment-grade bonds. Unlike bonds, funds that invest in bonds have fees and expenses. Tax-exempt bonds may be issued under the Internal Revenue Code only by limited types of issuers for limited types of projects. As a result, the fund’s investments may be focused in certain market segments and be more vulnerable to fluctuations in the values of the securities it holds than a more broadly invested fund. Interest the fund receives might be taxable. You can lose money by investing in the fund.
Message from the Trustees
Dear Fellow Shareholder:
The month of March 2015 marked the six-year milestone of the bull market in U.S. stocks, and this June will be the sixth anniversary of the beginning of the U.S. economic recovery as dated by the National Bureau of Economic Research, which has traced the chronology of U.S. business cycles back to 1854.
While six years is above the historical average on both counts, reaching these milestones does not necessarily indicate anything about the sustainability of the expansion or the market advance. However, we believe it is an unusually long period for the Federal Reserve to have refrained from raising interest rates. The Fed now appears poised to act, and speculation is mounting about where equity and fixed-income markets around the world could go from this point forward. Your portfolio manager provides a perspective in the following pages.
At this juncture of the market cycle, you might consult your financial advisor who can help you review your goals and risk profile, and explain the importance of timely adjustments to keep your portfolio equipped for all seasons.
As you make progress toward your long-term financial goals, markets may move in different directions. With Putnam, you are aligned with a group of portfolio managers and analysts who are experienced in navigating through changing markets with consistent strategies. They are dedicated to active, fundamental research and to helping you meet your financial needs.
As always, thank you for investing with Putnam.
Respectfully yours,
Robert L. Reynolds President and Chief Executive Officer Putnam Investments
Jameson A. Baxter Chair, Board of Trustees
May 12, 2015
Performance snapshot
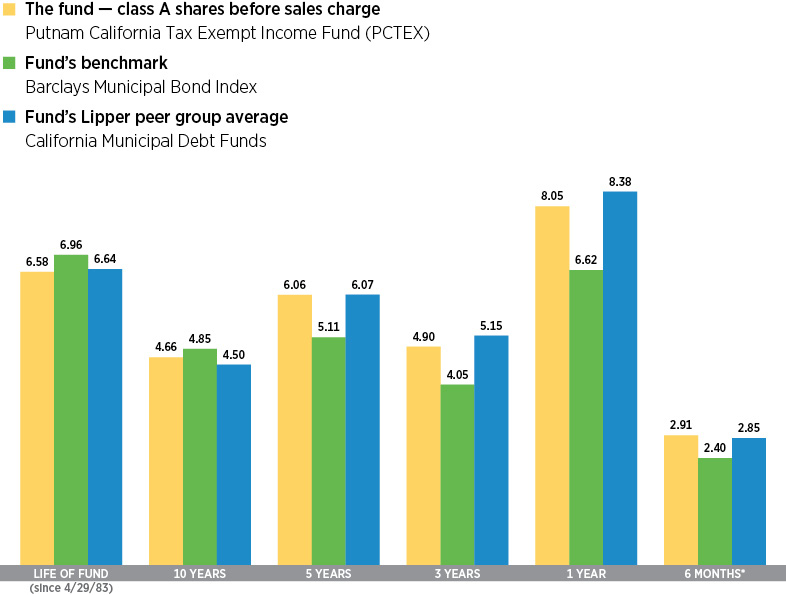
Annualized total return (%) comparison as of 3/31/15
Current performance may be lower or higher than the quoted past performance, which cannot guarantee future results. Share price, principal value, and return will fluctuate, and you may have a gain or a loss when you sell your shares. Performance of class A shares assumes reinvestment of distributions and does not account for taxes. Fund returns in the bar chart do not reflect a sales charge of 4.00%; had they, returns would have been lower. See pages 5 and 11–13 for additional performance information. For a portion of the periods, the fund had expense limitations, without which returns would have been lower. To obtain the most recent month-end performance, visit putnam.com.
*Returns for the six-month period are not annualized, but cumulative.
4 California Tax Exempt Income Fund
Interview with your fund’s portfolio manager
Thalia Meehan, CFA
What was the market environment like for municipal bonds during the six-month reporting period ended March 31, 2015?
Uncertainties surrounding the timing of the Federal Reserve’s first rate hike since June 2006 contributed to heightened interest-rate volatility during the period, as did growth worries and diverging central bank policies around the globe. Prospects for higher U.S. interest rates contributed to a rally in the U.S. dollar, which appreciated strongly against foreign currencies. Falling energy prices also added another dimension to the debate about growth as lower prices rippled through the economy and helped to ease inflationary pressures. Geopolitical tensions in the Middle East sparked a flight to quality at times during the period, as investors generally became more cautious in their outlook.
Municipal bonds benefited from the Fed’s forward guidance during the period, which suggested that the central bank remained in no rush to raise interest rates. This past December, Fed officials modified their policy statement by adding that they “can be patient” on the timing of their first rate increase. Subsequently, in March, the Fed dropped the word “patient” from its statement about plans for raising interest rates — a change in wording that was expected, but the central bank also tempered its outlook for the U.S. economy and inflation. Chair Janet Yellen added that when rates start to increase, they might not approach
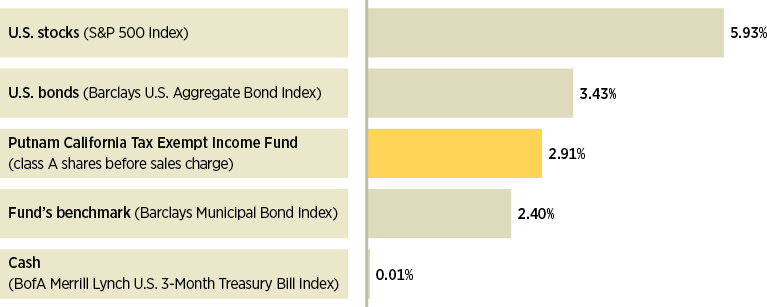
Broad market index and fund performance
This comparison shows your fund’s performance in the context of broad market indexes for the six months ended 3/31/15. See pages 4 and 11–13 for additional fund performance information. Index descriptions can be found on page 15.
California Tax Exempt Income Fund 5
long-term “normal” levels for some time. The overall dovish tone of Yellen’s statement was well received by investors, as it signaled a more gradual path to the normalization of interest rates than many investors had anticipated.
How did Putnam California Tax Exempt Income Fund perform against this backdrop?
With interest rates low and fundamental credit quality stable, investors continued to seek out the yields offered by relatively riskier municipal bonds further out on the maturity spectrum as well as for those in the lower-rated, higher-yielding sectors. Consequently, credit spreads [the difference in yield between higher- and lower-quality municipal bonds] tightened during the period, resulting in slightly better returns for lower-quality investments than for higher-quality investments.
Municipal bond prices also benefited from favorable technicals, as inflows continued throughout the quarter. While supply is up significantly year over year, it has been dominated by refunding issuance, as municipal issuers replaced their older, higher-coupon bonds with lower-yield debt. The increased supply has generally been met with strong demand.
The fund was well positioned for this environment, outperforming its benchmark, the Barclays Municipal Bond Index, and the average return of its Lipper peer group for the six months ended March 31, 2015.
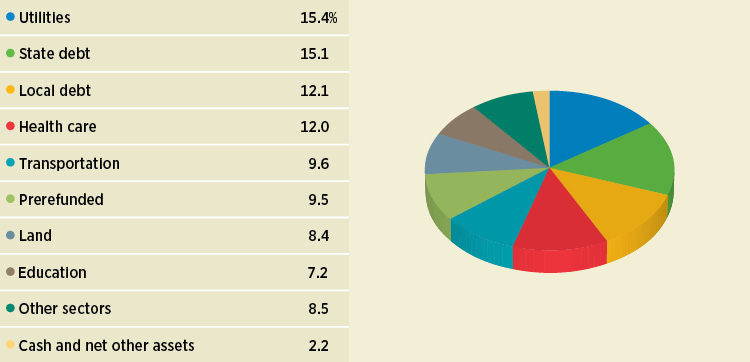
Sector allocations
Allocations are shown as a percentage of the fund’s net assets as of 3/31/15. Cash and net other assets, if any, represent the market value weights of cash, derivatives, short-term securities, and other unclassified assets in the portfolio. Summary information may differ from the information in the portfolio schedule notes included in the financial statements due to the inclusion of derivative securities, any interest accruals, and the use of different classifications of securities for presentation purposes. Holdings and allocations may vary over time.
6 California Tax Exempt Income Fund
“The general fiscal health and creditworthiness of the municipal bond market is solid, in our opinion.”
Thalia Meehan, CFA
Are your key investment themes, with their defensive orientation, still in place?
We maintained our slightly defensive bias in the portfolio because we believed that the municipal bond market’s attractive returns in 2014 could be attributed primarily to a combination of lower interest rates and strong market technicals. We kept the fund’s duration positioning, or interest-rate sensitivity, below the median of its Lipper peer group. We achieved this by maintaining a slightly higher-than-average cash position in the portfolio to help shelter it from price pressures, given the risk of interest rates moving higher. We also believed that carrying a slightly higher-than-average cash balance gave us greater flexibility to act swiftly in the event that timely investment opportunities presented themselves.
As for portfolio positioning, the fund retained an overweight exposure to municipal bonds rated A and Baa relative to the benchmark during the quarter. We continued to emphasize essential service revenue bonds, which are typically issued by state and local government entities to finance specific revenue-generating projects, and underweighted local general obligation [G.O.] bonds relative to the benchmark. These securities rely on the taxing power of the issuer and the health of the local economy
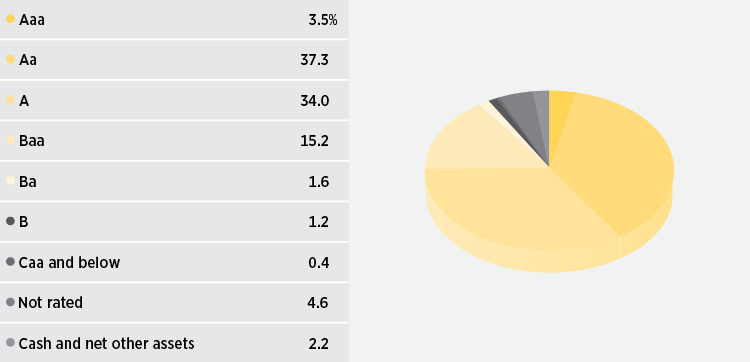
Credit quality overview
Credit qualities are shown as a percentage of the fund’s net assets as of 3/31/15. A bond rated Baa or higher (MIG3/VMIG3 or higher, for short-term debt) is considered investment grade. The chart reflects Moody’s ratings; percentages may include bonds or derivatives not rated by Moody’s but rated by Standard & Poor’s (S&P) or, if unrated by S&P, by Fitch ratings, and then included in the closest equivalent Moody’s rating based on analysis of these agencies’ respective ratings criteria. Moody’s ratings are used in recognition of its prominence among rating agencies and breadth of coverage of rated securities. Ratings may vary over time.
Cash and net other assets, if any, represent the market value weights of cash, derivatives, short-term securities, and other unclassified assets in the portfolio. The fund itself has not been rated by an independent rating agency.
California Tax Exempt Income Fund 7
to make payments from property taxes or sales and income taxes. At the sector level, we favored transportation, higher education, and essential service utilities bonds in the portfolio relative to the fund’s Lipper peer group. Overall, this positioning contributed positively to performance.
Our shorter-duration interest-rate positioning was a modest detractor from relative performance versus our Lipper peers, as interest rates moved lower during the period. An underweight exposure to Puerto Rico bonds also dampened results as compared with the fund’s Lipper peer group. However, we currently plan to maintain our underweight exposure to issuers in Puerto Rico, given our negative credit outlook for the Commonwealth. Finally, our underweight to non-rated bonds versus our Lipper peers was a headwind for performance, as demand for high-yield municipal bonds helped push prices higher.
How do you think the dramatic decline in oil prices will play out across the municipal bond market?
Lower oil and energy prices should be a net positive for the municipal bond market, in our opinion. Certain sectors, such as transportation — notably airlines — and toll roads, could see a positive impact from the decline in prices. However, we believe that oil-producing states, such as Texas, North Dakota, and Alaska, are likely to see falling revenues as production decreases or ceases for a period of time. In the cases of Alaska and
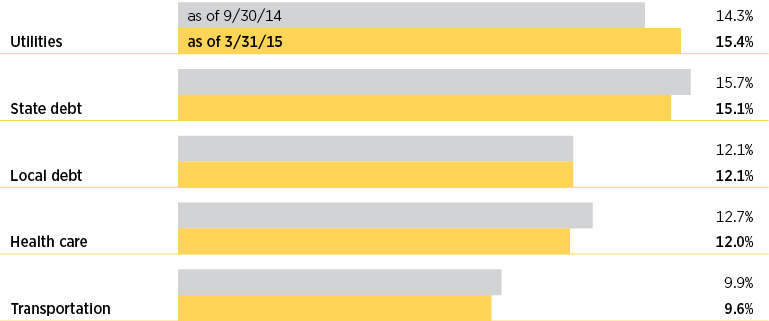
Comparison of top sector weightings
This chart shows how the fund’s top weightings have changed over the past six months. Allocations are shown as a percentage of the fund’s net assets. Current period summary information may differ from the information in the portfolio schedule notes included in the financial statements due to the inclusion of derivative securities, any interest accruals, and the use of different classifications of securities for presentation purposes. Holdings and allocations may vary over time.
8 California Tax Exempt Income Fund
North Dakota, however, these states typically have not issued much municipal bond debt and have set aside healthy reserves to ease budget pressures that typically accompany such a downturn. In the case of Texas, we believe the decline in oil and energy prices is likely to be more widely felt. If oil prices remain low for an extended period of time, affected issuers may come under more pressure and be subject to credit downgrades or defaults. The susceptibility of local G.O. bonds to macroeconomic developments, such as a sharp decline in oil prices, reinforces our predisposition to underweight G.O. bonds in the portfolio relative to the benchmark.
What factors are likely to influence the performance of municipal bonds in the coming months?
Questions about the timing of a Fed interest rate hike are likely to dominate the public discourse and fuel market volatility until the central bank acts. Yellen has acknowledged that we could see a rate increase as early as June, but many analysts are looking for the Fed to act in the latter part of 2015. Thus, we believe the Fed’s actions, along with the direction of longer-term U.S. Treasuries, will highly influence the performance of municipal bonds in 2015.
The general fiscal health and creditworthiness of the municipal bond market is solid, in our opinion. Despite some high-profile outliers, such as Detroit and Puerto Rico that have garnered much media attention, defaults are expected to remain low and could even decline further as the U.S. economy recovers. The default rate, which stood at 0.03% for 2014 [BofA Merrill Lynch], is a tiny fraction of the $3.6 trillion municipal bond market, and we don’t believe defaults are likely to increase meaningfully in the foreseeable future. That said, we would expect the State of Illinois and City of Chicago to continue to be in the headlines, as they contend with budget and pension issues.
Ultimately, prospects for tax reform appear to constitute little risk at this point, in our opinion. However, we are closely monitoring the various proposals and believe any momentum for change will more likely come after the 2016 elections.
With credit spreads the tightest that they have been in five years, we expect performance will be driven less by price appreciation potential and more by the tax-free income opportunities afforded by municipal bonds. In today’s low-interest-rate environment where investors continue to search for attractive yield opportunities, we believe many will look to tax-exempt investments to help them keep more of what they earn.
Thank you, Thalia, for your time and insights today.
The views expressed in this report are exclusively those of Putnam Management and are subject to change. They are not meant as investment advice.
Please note that the holdings discussed in this report may not have been held by the fund for the entire period. Portfolio composition is subject to review in accordance with the fund’s investment strategy and may vary in the future. Current and future portfolio holdings are subject to risk.
Portfolio Manager Thalia Meehan holds a B.A. from Williams College. Thalia joined Putnam in 1989 and has been in the investment industry since 1983. In addition to Thalia, your fund’s portfolio managers are Paul M. Drury, CFA, and Susan A. McCormack, CFA.
California Tax Exempt Income Fund 9
IN THE NEWS
Although the U.S. economy is showing positive trends, uneven growth in consumer spending remains a bit perplexing. Despite rising personal income and lower energy costs, consumer spending in the United States rose by only 0.1% in February after dropping 0.2% in January, according to the Commerce Department. Harsh winter weather during those months, with heavy snowfalls blanketing the Northeast and Midwest, may have discouraged millions of Americans from heading to stores. Amid weak spending, the pace of hiring also slowed to 126,000 new jobs in March, the lowest since December 2013. These soft readings, however, might be as temporary as the weather. The personal savings rate rose from 5.5% in January to 5.8% in February, with Americans reaching their highest levels in savings in more than two years. In short, consumers have money to spend, and a rebound in economic activity, along the lines of that seen in 2014, may be likely.
10 California Tax Exempt Income Fund
Your fund’s performance
This section shows your fund’s performance, price, and distribution information for periods ended March 31, 2015, the end of the first half of its current fiscal year. In accordance with regulatory requirements for mutual funds, we also include expense information taken from the fund’s current prospectus. Performance should always be considered in light of a fund’s investment strategy. Data represent past performance. Past performance does not guarantee future results. More recent returns may be less or more than those shown. Investment return and principal value will fluctuate, and you may have a gain or a loss when you sell your shares. Performance information does not reflect any deduction for taxes a shareholder may owe on fund distributions or on the redemption of fund shares. For the most recent month-end performance, please visit the Individual Investors section at putnam.com or call Putnam at 1-800-225-1581. Class Y shares are not available to all investors. See the Terms and Definitions section in this report for definitions of the share classes offered by your fund.
Fund performance Total return for periods ended 3/31/15
Class A
Class B
Class C
Class M
Class Y
(inception dates)
(4/29/83)
(1/4/93)
(7/26/99)
(2/14/95)
(1/2/08)
Before sales charge
After sales charge
Before CDSC
After CDSC
Before CDSC
After CDSC
Before sales charge
After sales charge
Net asset value
Annual average
(life of fund)
6.58%
6.44%
6.35%
6.35%
5.73%
5.73%
6.18%
6.07%
6.63%
10 years
57.74
51.43
50.12
50.12
45.79
45.79
53.17
48.19
60.55
Annual average
4.66
4.24
4.15
4.15
3.84
3.84
4.36
4.01
4.85
5 years
34.23
28.86
30.07
28.07
29.08
29.08
32.27
27.97
35.78
Annual average
6.06
5.20
5.40
5.07
5.24
5.24
5.75
5.06
6.31
3 years
15.45
10.83
13.29
10.29
12.68
12.68
14.38
10.66
16.16
Annual average
4.90
3.49
4.25
3.32
4.06
4.06
4.58
3.44
5.12
1 year
8.05
3.73
7.38
2.38
7.17
6.17
7.64
4.14
8.26
6 months
2.91
–1.21
2.59
–2.41
2.49
1.49
2.77
–0.57
3.01
Current performance may be lower or higher than the quoted past performance, which cannot guarantee future results. After-sales-charge returns for class A and M shares reflect the deduction of the maximum 4.00% and 3.25% sales charge, respectively, levied at the time of purchase. Class B share returns after contingent deferred sales charge (CDSC) reflect the applicable CDSC, which is 5% in the first year, declining over time to 1% in the sixth year, and is eliminated thereafter. Class C share returns after CDSC reflect a 1% CDSC for the first year that is eliminated thereafter. Class Y shares have no initial sales charge or CDSC. Performance for class B, C, M, and Y shares before their inception is derived from the historical performance of class A shares, adjusted for the applicable sales charge (or CDSC) and the higher operating expenses for such shares, except for class Y shares, for which 12b-1 fees are not applicable.
For a portion of the periods, the fund had expense limitations, without which returns would have been lower.
Class B share performance reflects conversion to class A shares after eight years.
California Tax Exempt Income Fund 11
Fund price and distribution information For the six-month period ended 3/31/15
Distributions
Class A
Class B
Class C
Class M
Class Y
Number
6
6
6
6
6
Income 1
$0.157772
$0.131529
$0.125070
$0.146052
$0.166696
Capital gains 2
—
—
—
—
—
Total
$0.157772
$0.131529
$0.125070
$0.146052
$0.166696
Share value
Before sales charge
After sales charge
Net asset value
Net asset value
Before sales charge
After sales charge
Net asset value
9/30/14
$8.23
$8.57
$8.22
$8.27
$8.20
$8.48
$8.25
3/31/15
8.31
8.66
8.30
8.35
8.28
8.56
8.33
Current rate (end of period)
Before sales charge
After sales charge
Net asset value
Net asset value
Before sales charge
After sales charge
Net asset value
Current dividend rate 3
3.58%
3.43%
2.95%
2.77%
3.31%
3.20%
3.78%
Taxable equivalent 4
7.30
6.99
6.01
5.64
6.75
6.52
7.70
Current 30-day SEC yield 5
N/A
1.79
1.23
1.09
N/A
1.53
2.08
Taxable equivalent 4
N/A
3.65
2.51
2.22
N/A
3.12
4.24
The classification of distributions, if any, is an estimate. Before-sales-charge share value and current dividend rate for class A and M shares, if applicable, do not take into account any sales charge levied at the time of purchase. After-sales-charge share value, current dividend rate, and current 30-day SEC yield, if applicable, are calculated assuming that the maximum sales charge (4.00% for class A shares and 3.25% for class M shares) was levied at the time of purchase. Final distribution information will appear on your year-end tax forms.
1 For some investors, investment income may be subject to the federal alternative minimum tax.
2 Capital gains, if any, are taxable for federal and, in most cases, state purposes.
3 Most recent distribution, including any return of capital and excluding capital gains, annualized and divided by share price before or after sales charge at period-end.
4 Assumes maximum 50.93% federal and state combined tax rate for 2015. Results for investors subject to lower tax rates would not be as advantageous.
5 Based only on investment income and calculated using the maximum offering price for each share class, in accordance with SEC guidelines.
12 California Tax Exempt Income Fund
Comparative index returns For periods ended 3/31/15
Barclays Municipal Bond Index
Lipper California Municipal Debt Funds category average*
Annual average (life of fund)
6.96%
6.64%
10 years
60.51
55.49
Annual average
4.85
4.50
5 years
28.30
34.40
Annual average
5.11
6.07
3 years
12.65
16.29
Annual average
4.05
5.15
1 year
6.62
8.38
6 months
2.40
2.85
Index and Lipper results should be compared with fund performance before sales charge, before CDSC, or at net asset value.
*Over the 6-month, 1-year, 3-year, 5-year, 10-year, and life-of-fund periods ended 3/31/15, there were 127, 127, 111, 108, 85, and 3 funds, respectively, in this Lipper category.
Your fund’s expenses
As a mutual fund investor, you pay ongoing expenses, such as management fees, distribution fees (12b-1 fees), and other expenses. Using the following information, you can estimate how these expenses affect your investment and compare them with the expenses of other funds. You may also pay one-time transaction expenses, including sales charges (loads) and redemption fees, which are not shown in this section and would have resulted in higher total expenses. For more information, see your fund’s prospectus or talk to your financial representative.
Expense ratios
Class A
Class B
Class C
Class M
Class Y
Total annual operating expenses for the fiscal year ended 9/30/14
0.74%
1.37%
1.52%
1.02%
0.52%
Annualized expense ratio for the six-month period ended 3/31/15
0.73%
1.36%
1.51%
1.01%
0.51%
Fiscal-year expense information in this table is taken from the most recent prospectus, is subject to change, and may differ from that shown for the annualized expense ratio and in the financial highlights of this report.
California Tax Exempt Income Fund 13
Expenses per $1,000
The following table shows the expenses you would have paid on a $1,000 investment in the fund from October 1, 2014, to March 31, 2015. It also shows how much a $1,000 investment would be worth at the close of the period, assuming actual returns and expenses.
Class A
Class B
Class C
Class M
Class Y
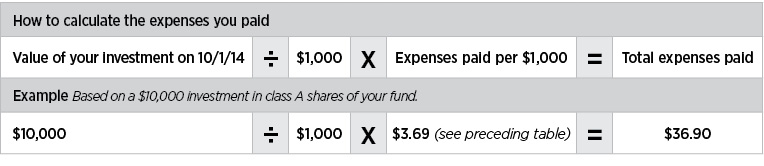
Expenses paid per $1,000*†
$3.69
$6.87
$7.62
$5.11
$2.58
Ending value (after expenses)
$1,029.10
$1,025.90
$1,024.90
$1,027.70
$1,030.10
*Expenses for each share class are calculated using the fund’s annualized expense ratio for each class, which represents the ongoing expenses as a percentage of average net assets for the six months ended 3/31/15. The expense ratio may differ for each share class.
†Expenses are calculated by multiplying the expense ratio by the average account value for the period; then multiplying the result by the number of days in the period; and then dividing that result by the number of days in the year.
Estimate the expenses you paid
To estimate the ongoing expenses you paid for the six months ended March 31, 2015, use the following calculation method. To find the value of your investment on October 1, 2014, call Putnam at 1-800-225-1581.
Compare expenses using the SEC’s method
The Securities and Exchange Commission (SEC) has established guidelines to help investors assess fund expenses. Per these guidelines, the following table shows your fund’s expenses based on a $1,000 investment, assuming a hypothetical 5% annualized return. You can use this information to compare the ongoing expenses (but not transaction expenses or total costs) of investing in the fund with those of other funds. All mutual fund shareholder reports will provide this information to help you make this comparison. Please note that you cannot use this information to estimate your actual ending account balance and expenses paid during the period.
Class A
Class B
Class C
Class M
Class Y
Expenses paid per $1,000*†
$3.68
$6.84
$7.59
$5.09
$2.57
Ending value (after expenses)
$1,021.29
$1,018.15
$1,017.40
$1,019.90
$1,022.39
*Expenses for each share class are calculated using the fund’s annualized expense ratio for each class, which represents the ongoing expenses as a percentage of average net assets for the six months ended 3/31/15. The expense ratio may differ for each share class.
†Expenses are calculated by multiplying the expense ratio by the average account value for the six-month period; then multiplying the result by the number of days in the six-month period; and then dividing that result by the number of days in the year.
14 California Tax Exempt Income Fund
Terms and definitions
Important terms
Total return shows how the value of the fund’s shares changed over time, assuming you held the shares through the entire period and reinvested all distributions in the fund.
Before sales charge, or net asset value, is the price, or value, of one share of a mutual fund, without a sales charge. Before-sales-charge figures fluctuate with market conditions, and are calculated by dividing the net assets of each class of shares by the number of outstanding shares in the class.
After sales charge is the price of a mutual fund share plus the maximum sales charge levied at the time of purchase. After-sales-charge performance figures shown here assume the 4.00% maximum sales charge for class A shares and 3.25% for class M shares.
Contingent deferred sales charge (CDSC) is generally a charge applied at the time of the redemption of class B or C shares and assumes redemption at the end of the period. Your fund’s class B CDSC declines over time from a 5% maximum during the first year to 1% during the sixth year. After the sixth year, the CDSC no longer applies. The CDSC for class C shares is 1% for one year after purchase.
Share classes
Class A shares are generally subject to an initial sales charge and no CDSC (except on certain redemptions of shares bought without an initial sales charge).
Class B shares are not subject to an initial sales charge and may be subject to a CDSC.
Class C shares are not subject to an initial sales charge and are subject to a CDSC only if the shares are redeemed during the first year.
Class M shares have a lower initial sales charge and a higher 12b-1 fee than class A shares and no CDSC (except on certain redemptions of shares bought without an initial sales charge).
Class Y shares are not subject to an initial sales charge or CDSC, and carry no 12b-1 fee. They are generally only available to corporate and institutional clients and clients in other approved programs.
Fixed-income terms
Current rate is the annual rate of return earned from dividends or interest of an investment. Current rate is expressed as a percentage of the price of a security, fund share, or principal investment.
Yield curve is a graph that plots the yields of bonds with equal credit quality against their differing maturity dates, ranging from shortest to longest. It is used as a benchmark for other debt, such as mortgage or bank lending rates.
Comparative indexes
Barclays Municipal Bond Index is an unmanaged index of long-term fixed-rate investment-grade tax-exempt bonds.
Barclays U.S. Aggregate Bond Index is an unmanaged index of U.S. investment-grade fixed-income securities.
BofA Merrill Lynch U.S. 3-Month Treasury Bill Index is an unmanaged index that seeks to measure the performance of U.S. Treasury bills available in the marketplace.
S&P 500 Index is an unmanaged index of common stock performance.
Indexes assume reinvestment of all distributions and do not account for fees. Securities and performance of a fund and an index will differ. You cannot invest directly in an index.
Lipper is a third-party industry-ranking entity that ranks mutual funds. Its rankings do not reflect sales charges. Lipper rankings
California Tax Exempt Income Fund 15
are based on total return at net asset value relative to other funds that have similar current investment styles or objectives as determined by Lipper. Lipper may change a fund’s category assignment at its discretion. Lipper category averages reflect performance trends for funds within a category.
Other information for shareholders
Important notice regarding delivery of shareholder documents
In accordance with Securities and Exchange Commission (SEC) regulations, Putnam sends a single copy of annual and semiannual shareholder reports, prospectuses, and proxy statements to Putnam shareholders who share the same address, unless a shareholder requests otherwise. If you prefer to receive your own copy of these documents, please call Putnam at 1-800-225-1581, and Putnam will begin sending individual copies within 30 days.
Proxy voting
Putnam is committed to managing our mutual funds in the best interests of our shareholders. The Putnam funds’ proxy voting guidelines and procedures, as well as information regarding how your fund voted proxies relating to portfolio securities during the 12-month period ended June 30, 2014, are available in the Individual Investors section of putnam.com, and on the SEC’s website, www.sec.gov. If you have questions about finding forms on the SEC’s website, you may call the SEC at 1-800-SEC-0330. You may also obtain the Putnam funds’ proxy voting guidelines and procedures at no charge by calling Putnam’s Shareholder Services at 1-800-225-1581.
Fund portfolio holdings
The fund will file a complete schedule of its portfolio holdings with the SEC for the first and third quarters of each fiscal year on Form N-Q. Shareholders may obtain the fund’s Form N-Q on the SEC’s website at www.sec.gov. In addition, the fund’s Form N-Q may be reviewed and copied at the SEC’s Public Reference Room in Washington, D.C. You may call the SEC at 1-800-SEC-0330 for information about the SEC’s website or the operation of the Public Reference Room.
Trustee and employee fund ownership
Putnam employees and members of the Board of Trustees place their faith, confidence, and, most importantly, investment dollars in Putnam mutual funds. As of March 31, 2015, Putnam employees had approximately $494,000,000 and the Trustees had approximately $141,000,000 invested in Putnam mutual funds. These amounts include investments by the Trustees’ and employees’ immediate family members as well as investments through retirement and deferred compensation plans.
16 California Tax Exempt Income Fund
Financial statements
A guide to financial statements
These sections of the report, as well as the accompanying Notes, constitute the fund’s financial statements.
The fund’s portfolio lists all the fund’s investments and their values as of the last day of the reporting period. Holdings are organized by asset type and industry sector, country, or state to show areas of concentration and diversification.
Statement of assets and liabilities shows how the fund’s net assets and share price are determined. All investment and non-investment assets are added together. Any unpaid expenses and other liabilities are subtracted from this total. The result is divided by the number of shares to determine the net asset value per share, which is calculated separately for each class of shares. (For funds with preferred shares, the amount subtracted from total assets includes the liquidation preference of preferred shares.)
Statement of operations shows the fund’s net investment gain or loss. This is done by first adding up all the fund’s earnings — from dividends and interest income — and subtracting its operating expenses to determine net investment income (or loss). Then, any net gain or loss the fund realized on the sales of its holdings — as well as any unrealized gains or losses over the period — is added to or subtracted from the net investment result to determine the fund’s net gain or loss for the fiscal period.
Statement of changes in net assets shows how the fund’s net assets were affected by the fund’s net investment gain or loss, by distributions to shareholders, and by changes in the number of the fund’s shares. It lists distributions and their sources (net investment income or realized capital gains) over the current reporting period and the most recent fiscal year-end. The distributions listed here may not match the sources listed in the Statement of operations because the distributions are determined on a tax basis and may be paid in a different period from the one in which they were earned. Dividend sources are estimated at the time of declaration. Actual results may vary. Any non-taxable return of capital cannot be determined until final tax calculations are completed after the end of the fund’s fiscal year.
Financial highlights provide an overview of the fund’s investment results, per-share distributions, expense ratios, net investment income ratios, and portfolio turnover in one summary table, reflecting the five most recent reporting periods. In a semiannual report, the highlights table also includes the current reporting period.
California Tax Exempt Income Fund 17
The fund’s portfolio 3/31/15 (Unaudited)
Key to holding’s abbreviations
ABAG Association Of Bay Area Governments
AGM Assured Guaranty Municipal Corporation
AGO Assured Guaranty, Ltd.
AMBAC AMBAC Indemnity Corporation
BAM Build America Mutual
COP Certificates of Participation
FGIC Financial Guaranty Insurance Company
FHLMC Coll. Federal Home Loan Mortgage Corporation Collateralized
FNMA Coll. Federal National Mortgage Association Collateralized
G.O. Bonds General Obligation Bonds
NATL National Public Finance Guarantee Corp.
Radian Insd. Radian Group Insured
SGI Syncora Guarantee, Inc.
U.S. Govt. Coll. U.S. Government Collateralized
VRDN Variable Rate Demand Notes, which are floating-rate securities with long-term maturities that carry coupons that reset and are payable upon demand either daily, weekly or monthly. The rate shown is the current interest rate at the close of the reporting period.
MUNICIPAL BONDS AND NOTES (99.3%)*
Rating**
Principal amount
Value
California (95.4%)
ABAG Fin. Auth. for Nonprofit Corps. Rev. Bonds
(Sharp Hlth. Care), 6 1/4s, 8/1/39
Aa3
$14,000,000
$16,704,660
(Episcopal Sr. Cmntys.), 6 1/8s, 7/1/41
BBB+/F
2,045,000
2,372,241
(Episcopal Sr. Cmntys.), Ser. A, 5s, 7/1/42
BBB+/F
700,000
764,764
(O’Connor Woods), 5s, 1/1/33
A+
2,300,000
2,606,636
ABAG Fin. Auth. Non-Profit Corps Insd. Sr. Living Rev. Bonds
Murray City, Hosp. VRDN (IHC Hlth. Svcs., Inc.), Ser. A, 0.02s, 5/15/37
VMIG1
3,965,000
3,965,000
3,965,000
Virgin Islands (0.2%)
VI Pub. Fin. Auth. Rev. Bonds, Ser. A, 5s, 10/1/25
Baa2
2,000,000
2,242,660
2,242,660
TOTAL INVESTMENTS
Total investments (cost $1,230,988,763)
$1,372,720,694
Notes to the fund’s portfolio
Unless noted otherwise, the notes to the fund’s portfolio are for the close of the fund’s reporting period, which ran from October 1, 2014 through March 31, 2015 (the reporting period). Within the following notes to the portfolio, references to “ASC 820” represent Accounting Standards Codification 820 Fair Value Measurements and Disclosures and references to “OTC”, if any, represent over-the-counter.
*
Percentages indicated are based on net assets of $1,383,003,431.
**
The Moody’s, Standard & Poor’s or Fitch ratings indicated are believed to be the most recent ratings available at the close of the reporting period for the securities listed. Ratings are generally ascribed to securities at the time of issuance. While the agencies may from time to time revise such ratings, they undertake no obligation to do so, and the ratings do not necessarily represent what the agencies would ascribe to these securities at the close of the reporting period. Securities rated by Putnam are indicated by “/P.” Securities rated by Fitch are indicated by “/F.” If a security is insured, it will usually be rated by the ratings organizations based on the financial strength of the insurer. For further details regarding security ratings, please see the Statement of Additional Information.
144A after the name of an issuer represents securities exempt from registration under Rule 144A under the Securities Act of 1933, as amended. These securities may be resold in transactions exempt from registration, normally to qualified institutional buyers.
The dates shown parenthetically on prerefunded bonds represent the next prerefunding dates.
The dates shown on debt obligations are the original maturity dates.
30 California Tax Exempt Income Fund
The fund had the following sector concentrations greater than 10% at the close of the reporting period (as a percentage of net assets):
Utilities
15.3%
State debt
15.2
Health care
13.5
Local debt
12.1
ASC 820 establishes a three-level hierarchy for disclosure of fair value measurements. The valuation hierarchy is based upon the transparency of inputs to the valuation of the fund’s investments. The three levels are defined as follows:
Level 1: Valuations based on quoted prices for identical securities in active markets.
Level 2: Valuations based on quoted prices in markets that are not active or for which all significant inputs are observable, either directly or indirectly.
Level 3: Valuations based on inputs that are unobservable and significant to the fair value measurement.
The following is a summary of the inputs used to value the fund’s net assets as of the close of the reporting period:
Valuation inputs
Investments in securities:
Level 1
Level 2
Level 3
Municipal bonds and notes
$—
$1,372,720,694
$—
Totals by level
$—
$1,372,720,694
$—
During the reporting period, transfers within the fair value hierarchy, if any, did not represent, in the aggregate, more than 1% of the fund’s net assets measured as of the end of the period.
The accompanying notes are an integral part of these financial statements.
California Tax Exempt Income Fund 31
Statement of assets and liabilities 3/31/15 (Unaudited)
ASSETS
Investment in securities, at value, including of securities on loan (Note 1):
Payable for Trustee compensation and expenses (Note 2)
454,037
Payable for administrative services (Note 2)
4,824
Payable for distribution fees (Note 2)
722,527
Distributions payable to shareholders
980,661
Other accrued expenses
132,238
Total liabilities
10,839,049
Net assets
$1,383,003,431
REPRESENTED BY
Paid-in capital (Unlimited shares authorized) (Notes 1 and 4)
$1,288,607,632
Undistributed net investment income (Note 1)
4,537,726
Accumulated net realized loss on investments and foreign currency transactions (Note 1)
(51,873,858)
Net unrealized appreciation of investments
141,731,931
Total — Representing net assets applicable to capital shares outstanding
$1,383,003,431
COMPUTATION OF NET ASSET VALUE AND OFFERING PRICE
Net asset value and redemption price per class A share ($1,269,334,462 divided by 152,836,340 shares)
$8.31
Offering price per class A share (100/96.00 of $8.31)*
$8.66
Net asset value and offering price per class B share ($6,085,414 divided by 733,441 shares)**
$8.30
Net asset value and offering price per class C share ($46,376,052 divided by 5,553,785 shares)**
$8.35
Net asset value and redemption price per class M share ($2,856,949 divided by 344,952 shares)
$8.28
Offering price per class M share (100/96.75 of $8.28)†
$8.56
Net asset value, offering price and redemption price per class Y share ($58,350,554 divided by 7,007,645 shares)
$8.33
*
On single retail sales of less than $100,000. On sales of $100,000 or more the offering price is reduced.
**
Redemption price per share is equal to net asset value less any applicable contingent deferred sales charge.
†
On single retail sales of less than $50,000. On sales of $50,000 or more the offering price is reduced.
The accompanying notes are an integral part of these financial statements.
32 California Tax Exempt Income Fund
Statement of operations Six months ended 3/31/15 (Unaudited)
INTEREST INCOME
$31,073,955
EXPENSES
Compensation of Manager (Note 2)
$2,955,285
Investor servicing fees (Note 2)
402,123
Custodian fees (Note 2)
9,412
Trustee compensation and expenses (Note 2)
10,337
Distribution fees (Note 2)
1,628,784
Administrative services (Note 2)
21,090
Other
130,184
Total expenses
5,157,215
Expense reduction (Note 2)
(824)
Net expenses
5,156,391
Net investment income
25,917,564
Net realized gain on investments (Notes 1 and 3)
12,773,087
Net unrealized appreciation of investments during the period
658,193
Net gain on investments
13,431,280
Net increase in net assets resulting from operations
$39,348,844
The accompanying notes are an integral part of these financial statements.
California Tax Exempt Income Fund 33
Statement of changes in net assets
DECREASE IN NET ASSETS
Six months ended 3/31/15*
Year ended 9/30/14
Operations:
Net investment income
$25,917,564
$55,275,695
Net realized gain on investments
12,773,087
485,594
Net unrealized appreciation of investments
658,193
71,141,582
Net increase in net assets resulting from operations
39,348,844
126,902,871
Distributions to shareholders (Note 1):
From ordinary income
Taxable net investment income
Class A
(671,620)
(409,586)
Class B
(3,271)
(2,231)
Class C
(23,673)
(13,699)
Class M
(1,512)
(840)
Class Y
(30,683)
(15,055)
From tax-exempt net investment income
Class A
(23,527,588)
(50,778,096)
Class B
(94,850)
(223,926)
Class C
(655,543)
(1,383,610)
Class M
(48,316)
(97,327)
Class Y
(1,124,903)
(2,052,777)
Decrease from capital share transactions (Note 4)
(18,457,900)
(133,654,593)
Total decrease in net assets
(5,291,015)
(61,728,869)
NET ASSETS
Beginning of period
1,388,294,446
1,450,023,315
End of period (including undistributed net investment income of $4,537,726 and $4,802,121, respectively)
$1,383,003,431
$1,388,294,446
*
Unaudited.
The accompanying notes are an integral part of these financial statements.
34 California Tax Exempt Income Fund
This page left blank intentionally.
California Tax Exempt Income Fund 35
Financial highlights (For a common share outstanding throughout the period)
INVESTMENT OPERATIONS:
LESS DISTRIBUTIONS:
RATIOS AND SUPPLEMENTAL DATA:
Period ended
Net asset value, beginning of period
Net investment income (loss)
Net realized and unrealized gain (loss) on investments
Total from investment operations
From net investment income
From net realized gain on investments
Total distributions
Redemption fees
Non-recurring reimbursements
Net asset value, end of period
Total return at net asset value (%)a
Net assets, end of period (in thousands)
Ratio of expenses to average net assets (%)b,c
Ratio of net investment income (loss) to average net assets (%)c
Portfolio turnover (%)
Class A
March 31, 2015**
$8.23
.16
.08
.24
(.16)
—
(.16)
—
—
$8.31
2.91*
$1,269,334
.36*
1.88*
9*
September 30, 2014
7.81
.32
.42
.74
(.32)
—
(.32)
—
—
8.23
9.63
1,278,391
.74
3.99
11
September 30, 2013
8.34
.33
(.53)
(.20)
(.33)
—
(.33)
—
—
7.81
(2.50)
1,338,414
.74
4.03
11
September 30, 2012
7.83
.34
.51
.85
(.34)
—
(.34)
—
—
8.34
11.12
1,591,810
.75
4.30
6
September 30, 2011
7.99
.36
(.16)
.20
(.36)
—
(.36)
—
—d
7.83
2.75
1,466,160
.75
4.77
9
September 30, 2010
7.93
.36
.07
.43
(.37)
—
(.37)
—e
—
7.99
5.64
1,627,229
.76f
4.74f
16
Class B
March 31, 2015**
$8.22
.13
.08
.21
(.13)
—
(.13)
—
—
$8.30
2.59*
$6,085
.68*
1.56*
9*
September 30, 2014
7.80
.27
.42
.69
(.27)
—
(.27)
—
—
8.22
8.96
6,364
1.37
3.36
11
September 30, 2013
8.34
.28
(.54)
(.26)
(.28)
—
(.28)
—
—
7.80
(3.24)
7,255
1.37
3.40
11
September 30, 2012
7.83
.29
.51
.80
(.29)
—
(.29)
—
—
8.34
10.42
8,749
1.38
3.67
6
September 30, 2011
7.98
.31
(.15)
.16
(.31)
—
(.31)
—
—d
7.83
2.24
8,615
1.38
4.15
9
September 30, 2010
7.92
.31
.07
.38
(.32)
—
(.32)
—e
—
7.98
4.97
15,928
1.39f
4.14f
16
Class C
March 31, 2015**
$8.27
.13
.08
.21
(.13)
—
(.13)
—
—
$8.35
2.49*
$46,376
.75*
1.49*
9*
September 30, 2014
7.85
.25
.42
.67
(.25)
—
(.25)
—
—
8.27
8.73
44,233
1.52
3.21
11
September 30, 2013
8.38
.27
(.53)
(.26)
(.27)
—
(.27)
—
—
7.85
(3.25)
47,175
1.52
3.25
11
September 30, 2012
7.87
.28
.51
.79
(.28)
—
(.28)
—
—
8.38
10.19
56,923
1.53
3.51
6
September 30, 2011
8.03
.30
(.16)
.14
(.30)
—
(.30)
—
—d
7.87
1.95
45,516
1.53
3.99
9
September 30, 2010
7.96
.30
.08
.38
(.31)
—
(.31)
—e
—
8.03
4.95
51,872
1.54f
3.95f
16
Class M
March 31, 2015**
$8.20
.15
.08
.23
(.15)
—
(.15)
—
—
$8.28
2.77*
$2,857
.50*
1.74*
9*
September 30, 2014
7.79
.29
.41
.70
(.29)
—
(.29)
—
—
8.20
9.22
2,670
1.02
3.71
11
September 30, 2013
8.32
.31
(.53)
(.22)
(.31)
—
(.31)
—
—
7.79
(2.78)
2,606
1.02
3.75
11
September 30, 2012
7.81
.32
.51
.83
(.32)
—
(.32)
—
—
8.32
10.83
3,341
1.03
4.00
6
September 30, 2011
7.97
.34
(.16)
.18
(.34)
—
(.34)
—
—d
7.81
2.45
2,590
1.03
4.48
9
September 30, 2010
7.91
.34
.06
.40
(.34)
—
(.34)
—e
—
7.97
5.34
3,011
1.04f
4.46f
16
Class Y
March 31, 2015**
$8.25
.17
.08
.25
(.17)
—
(.17)
—
—
$8.33
3.01*
$58,351
.25*
1.99*
9*
September 30, 2014
7.83
.33
.42
.75
(.33)
—
(.33)
—
—
8.25
9.85
56,636
.52
4.20
11
September 30, 2013
8.36
.35
(.53)
(.18)
(.35)
—
(.35)
—
—
7.83
(2.28)
54,574
.52
4.25
11
September 30, 2012
7.85
.36
.51
.87
(.36)
—
(.36)
—
—
8.36
11.30
56,992
.53
4.49
6
September 30, 2011
8.01
.38
(.16)
.22
(.38)
—
(.38)
—
—d
7.85
2.99
34,064
.53
4.98
9
September 30, 2010
7.94
.38
.07
.45
(.38)
—
(.38)
—e
—
8.01
6.01
24,888
.54f
4.95f
16
See notes to financial highlights at the end of this section.
The accompanying notes are an integral part of these financial statements.
36
California Tax Exempt Income Fund
California Tax Exempt Income Fund
37
Financial highlights (Continued)
* Not annualized.
** Unaudited.
a Total return assumes dividend reinvestment and does not reflect the effect of sales charges.
b Includes amounts paid through expense offset arrangements, if any (Note 2). Also excludes acquired fund fees, if any.
c Includes interest and fees expense associated with borrowings which amounted to the following (Note 1):
Percentage of average net assets
September 30, 2014
<0.01%
September 30, 2013
<0.01
September 30, 2012
<0.01
September 30, 2011
<0.01
September 30, 2010
<0.01
d Reflects a non-recurring reimbursement related to restitution amounts in connection with a distribution plan approved by the Securities and Exchange Commission (the SEC) which amounted to less than $0.01 per share outstanding on July 21, 2011. Also reflects a non-recurring reimbursement related to short-term trading related lawsuits, which amounted to less than $0.01 per share outstanding on May 11, 2011.
e Amount represents less than $0.01 per share.
f Reflects an involuntary contractual expense limitation in effect during the period. As a result of such limitation, the expenses of each class of the fund reflect a reduction as of the following amounts (Note 2):
Percentage of average net assets
September 30, 2010
0.01%
The accompanying notes are an integral part of these financial statements.
38 California Tax Exempt Income Fund
Notes to financial statements 3/31/15 (Unaudited)
Within the following Notes to financial statements, references to “State Street” represent State Street Bank and Trust Company, references to “the SEC” represent the Securities and Exchange Commission, references to “Putnam Management” represent Putnam Investment Management, LLC, the fund’s manager, an indirect wholly-owned subsidiary of Putnam Investments, LLC and references to “OTC”, if any, represent over-the-counter. Unless otherwise noted, the “reporting period” represents the period from October 1, 2014 through March 31, 2015.
Putnam California Tax Exempt Income Fund (the fund) is a Massachusetts business trust, which is registered under the Investment Company Act of 1940, as amended, as a diversified open-end management investment company. The goal of the fund is to seek as high a level of current income exempt from federal income tax and California personal income tax as Putnam Management believes to be consistent with preservation of capital. The fund invests mainly in bonds that pay interest that is exempt from federal income tax and California personal income tax (but that may be subject to federal alternative minimum tax (AMT)), are investment-grade in quality, and have intermediate- to long-term maturities (three years or longer). Putnam Management may consider, among other factors, credit, interest rate and prepayment risks, as well as general market conditions, when deciding whether to buy or sell investments.
The fund offers class A, class B, class C, class M and class Y shares. Class A and class M shares are sold with a maximum front-end sales charge of 4.00% and 3.25%, respectively, and generally do not pay a contingent deferred sales charge. Class B shares, which convert to class A shares after approximately eight years, do not pay a front-end sales charge and are subject to a contingent deferred sales charge if those shares are redeemed within six years of purchase. Class C shares have a one-year 1.00% contingent deferred sales charge and do not convert to class A shares. The expenses for class A, class B, class C, and class M shares may differ based on the distribution fee of each class, which is identified in Note 2. Class Y shares, which are sold at net asset value, are generally subject to the same expenses as class A, class B, class C, and class M shares, but do not bear a distribution fee. Class Y shares are not available to all investors.
In the normal course of business, the fund enters into contracts that may include agreements to indemnify another party under given circumstances. The fund’s maximum exposure under these arrangements is unknown as this would involve future claims that may be, but have not yet been, made against the fund. However, the fund’s management team expects the risk of material loss to be remote.
Note 1: Significant accounting policies
The following is a summary of significant accounting policies consistently followed by the fund in the preparation of its financial statements. The preparation of financial statements is in conformity with accounting principles generally accepted in the United States of America and requires management to make estimates and assumptions that affect the reported amounts of assets and liabilities in the financial statements and the reported amounts of increases and decreases in net assets from operations. Actual results could differ from those estimates. Subsequent events after the Statement of assets and liabilities date through the date that the financial statements were issued have been evaluated in the preparation of the financial statements.
Investment income, realized and unrealized gains and losses and expenses of the fund are borne pro-rata based on the relative net assets of each class to the total net assets of the fund, except that each class bears expenses unique to that class (including the distribution fees applicable to such classes). Each class votes as a class only with respect to its own distribution plan or other matters on which a class vote is required by law or determined by the Trustees. If the fund were liquidated, shares of each class would receive their pro-rata share of the net assets of the fund. In addition, the Trustees declare separate dividends on each class of shares.
Security valuation Portfolio securities and other investments are valued using policies and procedures adopted by the Board of Trustees. The Trustees have formed a Pricing Committee to oversee the implementation of these procedures and have delegated responsibility for valuing the fund’s assets in accordance with these procedures to Putnam Management. Putnam Management has established an internal Valuation Committee that is responsible for making fair value determinations, evaluating the effectiveness of the pricing policies of the fund and reporting to the Pricing Committee.
Tax-exempt bonds and notes are generally valued on the basis of valuations provided by an independent pricing service approved by the Trustees. Such services use information with respect to transactions in bonds, quotations from bond dealers, market transactions in comparable securities and various relationships between securities in determining value. These securities will generally be categorized as Level 2.
California Tax Exempt Income Fund 39
Certain investments, including certain restricted and illiquid securities and derivatives, are also valued at fair value following procedures approved by the Trustees. To assess the continuing appropriateness of fair valuations, the Valuation Committee reviews and affirms the reasonableness of such valuations on a regular basis after considering all relevant information that is reasonably available. Such valuations and procedures are reviewed periodically by the Trustees. These valuations consider such factors as significant market or specific security events such as interest rate or credit quality changes, various relationships with other securities, discount rates, U.S. Treasury, U.S. swap and credit yields, index levels, convexity exposures, recovery rates, sales and other multiples and resale restrictions. These securities are classified as Level 2 or as Level 3 depending on the priority of the significant inputs. The fair value of securities is generally determined as the amount that the fund could reasonably expect to realize from an orderly disposition of such securities over a reasonable period of time. By its nature, a fair value price is a good faith estimate of the value of a security in a current sale and does not reflect an actual market price, which may be different by a material amount.
Security transactions and related investment income Security transactions are recorded on the trade date (the date the order to buy or sell is executed). Gains or losses on securities sold are determined on the identified cost basis.
Interest income is recorded on the accrual basis. All premiums/discounts are amortized/accreted on a yield-to-maturity basis. The premium in excess of the call price, if any, is amortized to the call date; thereafter, any remaining premium is amortized to maturity.
Interfund lending The fund, along with other Putnam funds, may participate in an interfund lending program pursuant to an exemptive order issued by the SEC. This program allows the fund to borrow from other Putnam funds that permit such transactions. Interfund lending transactions are subject to each fund’s investment policies and borrowing and lending limits. Interest earned or paid on the interfund lending transaction will be based on the average of certain current market rates. During the reporting period, the fund did not utilize the program.
Lines of credit The fund participates, along with other Putnam funds, in a $392.5 million unsecured committed line of credit and a $235.5 million unsecured uncommitted line of credit, both provided by State Street. Borrowings may be made for temporary or emergency purposes, including the funding of shareholder redemption requests and trade settlements. Interest is charged to the fund based on the fund’s borrowing at a rate equal to the Federal Funds rate plus 1.25% for the committed line of credit and the Federal Funds rate plus 1.30% for the uncommitted line of credit. A closing fee equal to 0.04% of the committed line of credit and 0.04% of the uncommitted line of credit has been paid by the participating funds. In addition, a commitment fee of 0.11% per annum on any unutilized portion of the committed line of credit is allocated to the participating funds based on their relative net assets and paid quarterly. During the reporting period, the fund had no borrowings against these arrangements.
Federal taxes It is the policy of the fund to distribute all of its income within the prescribed time period and otherwise comply with the provisions of the Internal Revenue Code of 1986, as amended (the Code), applicable to regulated investment companies. It is also the intention of the fund to distribute an amount sufficient to avoid imposition of any excise tax under Section 4982 of the Code.
The fund is subject to the provisions of Accounting Standards Codification 740 Income Taxes (ASC 740). ASC 740 sets forth a minimum threshold for financial statement recognition of the benefit of a tax position taken or expected to be taken in a tax return. The fund did not have a liability to record for any unrecognized tax benefits in the accompanying financial statements. No provision has been made for federal taxes on income, capital gains or unrealized appreciation on securities held nor for excise tax on income and capital gains. Each of the fund’s federal tax returns for the prior three fiscal years remains subject to examination by the Internal Revenue Service.
40 California Tax Exempt Income Fund
At September 30, 2014, the fund had a capital loss carryover of $63,711,613 available to the extent allowed by the Code to offset future net capital gain, if any. The amounts of the carryovers and the expiration dates are:
Loss carryover
Short-term
Long-term
Total
Expiration
$7,694,809
$10,826,499
$18,521,308
*
766,815
N/A
766,815
September 30, 2016
12,478,683
N/A
12,478,683
September 30, 2017
1,872,123
N/A
1,872,123
September 30, 2018
30,072,684
N/A
30,072,684
September 30, 2019
*Under the Regulated Investment Company Modernization Act of 2010, the fund will be permitted to carry forward capital losses incurred in taxable years beginning after December 22, 2010 for an unlimited period. However, any losses incurred will be required to be utilized prior to the losses incurred in pre-enactment tax years. As a result of this ordering rule, pre-enactment capital loss carryforwards may be more likely to expire unused. Additionally, post-enactment capital losses that are carried forward will retain their character as either short-term or long-term capital losses rather than being considered all short-term as under previous law.
Pursuant to federal income tax regulations applicable to regulated investment companies, the fund has elected to defer $922,683 of certain losses recognized during the period from November 1, 2013 to September 30, 2014 to its fiscal year ending September 30, 2014.
The aggregate identified cost on a tax basis is $1,230,129,298, resulting in gross unrealized appreciation and depreciation of $147,487,389 and $4,895,993, respectively, or net unrealized appreciation of $142,591,396.
Distributions to shareholders Income dividends are recorded daily by the fund and are paid monthly. Distributions from capital gains, if any, are recorded on the ex-dividend date and paid at least annually. The amount and character of income and gains to be distributed are determined in accordance with income tax regulations which may differ from generally accepted accounting principles. Dividend sources are estimated at the time of declaration. Actual results may vary. Any non-taxable return of capital cannot be determined until final tax calculations are completed after the end of the fund’s fiscal year. Reclassifications are made to the fund’s capital accounts to reflect income and gains available for distribution (or available capital loss carryovers) under income tax regulations.
Note 2: Management fee, administrative services and other transactions
The fund pays Putnam Management a management fee (based on the fund’s average net assets and computed and paid monthly) at annual rates that may vary based on the average of the aggregate net assets of most open-end funds, as defined in the fund’s management contract, sponsored by Putnam Management. Such annual rates may vary as follows:
0.590%
of the first $5 billion,
0.540%
of the next $5 billion,
0.490%
of the next $10 billion,
0.440%
of the next $10 billion,
0.390%
of the next $50 billion,
0.370%
of the next $50 billion,
0.360%
of the next $100 billion and
0.355%
of any excess thereafter.
Putnam Management has contractually agreed, through June 30, 2015, to waive fees or reimburse the fund’s expenses to the extent necessary to limit the cumulative expenses of the fund, exclusive of brokerage, interest, taxes, investment-related expenses, extraordinary expenses, acquired fund fees and expenses and payments under the fund’s investor servicing contract, investment management contract and distribution plans, on a fiscal year-to-date basis to an annual rate of 0.20% of the fund’s average net assets over such fiscal year-to-date period. During the reporting period, the fund’s expenses were not reduced as a result of this limit.
Putnam Investments Limited (PIL), an affiliate of Putnam Management, is authorized by the Trustees to manage a separate portion of the assets of the fund as determined by Putnam Management from time to time. Putnam Management pays a quarterly sub-management fee to PIL for its services at an annual rate of 0.40% of the average net assets of the portion of the fund managed by PIL.
California Tax Exempt Income Fund 41
The fund reimburses Putnam Management an allocated amount for the compensation and related expenses of certain officers of the fund and their staff who provide administrative services to the fund. The aggregate amount of all such reimbursements is determined annually by the Trustees.
Custodial functions for the fund’s assets are provided by State Street. Custody fees are based on the fund’s asset level, the number of its security holdings and transaction volumes.
Putnam Investor Services, Inc., an affiliate of Putnam Management, provides investor servicing agent functions to the fund. Putnam Investor Services, Inc. received fees for investor servicing that included (1) a per account fee for each direct and underlying non-defined contribution account (“retail account”) of the fund and each of the other funds in its specified category, which was totaled and then allocated to each fund in the category based on its average daily net assets; (2) a specified rate of the fund’s assets attributable to defined contribution plan accounts; and (3) for the portion of the fund’s fiscal year beginning after January 1, 2015, a specified rate based on the average net assets in retail accounts. Putnam Investor Services has agreed that the aggregate investor servicing fees for each fund’s retail and defined contribution accounts will not exceed an annual rate of 0.320% of the fund’s average assets attributable to such accounts. During the reporting period, the expenses for each class of shares related to investor servicing fees were as follows:
Class A
$369,481
Class B
1,792
Class C
13,228
Class M
822
Class Y
16,800
Total
$402,123
The fund has entered into expense offset arrangements with Putnam Investor Services, Inc. and State Street whereby Putnam Investor Services, Inc.’s and State Street’s fees are reduced by credits allowed on cash balances. For the reporting period, the fund’s expenses were reduced by $824 under the expense offset arrangements.
Each Independent Trustee of the fund receives an annual Trustee fee, of which $770, as a quarterly retainer, has been allocated to the fund, and an additional fee for each Trustees meeting attended. Trustees also are reimbursed for expenses they incur relating to their services as Trustees.
The fund has adopted a Trustee Fee Deferral Plan (the Deferral Plan) which allows the Trustees to defer the receipt of all or a portion of Trustees fees payable on or after July 1, 1995. The deferred fees remain invested in certain Putnam funds until distribution in accordance with the Deferral Plan.
The fund has adopted an unfunded noncontributory defined benefit pension plan (the Pension Plan) covering all Trustees of the fund who have served as a Trustee for at least five years and were first elected prior to 2004. Benefits under the Pension Plan are equal to 50% of the Trustee’s average annual attendance and retainer fees for the three years ended December 31, 2005. The retirement benefit is payable during a Trustee’s lifetime, beginning the year following retirement, for the number of years of service through December 31, 2006. Pension expense for the fund is included in Trustee compensation and expenses in the Statement of operations. Accrued pension liability is included in Payable for Trustee compensation and expenses in the Statement of assets and liabilities. The Trustees have terminated the Pension Plan with respect to any Trustee first elected after 2003.
The fund has adopted distribution plans (the Plans) with respect to its class A, class B, class C and class M shares pursuant to Rule 12b–1 under the Investment Company Act of 1940. The purpose of the Plans is to compensate Putnam Retail Management Limited Partnership, an indirect wholly-owned subsidiary of Putnam Investments, LLC, for services provided and expenses incurred in distributing shares of the fund. The Plans provide for payments by the fund to Putnam Retail Management Limited Partnership at an annual rate of up to 0.35%, 1.00%, 1.00% and 1.00% of the average net assets attributable to class A, class B, class C and class M shares, respectively. The Trustees have approved payment by the fund at the annual rate of 0.85%, 1.00% and 0.50% of the average net assets for class B, class C and class M shares, respectively. For class A shares, the annual payment rate will equal the weighted average of (i) 0.20% on the net assets of the fund attributable to class A shares purchased and paid for prior to April 1, 2005 and (ii) 0.25% on all other net assets of the fund attributable to class A shares. During the reporting period, the class specific expenses related to distribution fees were as follows:
Class A
$1,369,285
Class B
26,229
Class C
226,225
Class M
7,045
Total
$1,628,784
42 California Tax Exempt Income Fund
For the reporting period, Putnam Retail Management Limited Partnership, acting as underwriter, received net commissions of $31,881 and $327 from the sale of class A and class M shares, respectively, and received $15 and $31 in contingent deferred sales charges from redemptions of class B and class C shares, respectively.
A deferred sales charge of up to 1.00% is assessed on certain redemptions of class A shares. For the reporting period, Putnam Retail Management Limited Partnership, acting as underwriter, received $320 on class A redemptions.
Note 3: Purchases and sales of securities
During the reporting period, the cost of purchases and the proceeds from sales, excluding short-term investments, were as follows:
Cost of purchases
Proceeds from sales
Investments in securities (Long-term)
$124,146,450
$127,538,995
U.S. government securities (Long-term)
—
—
Total
$124,146,450
$127,538,995
Note 4: Capital shares
At the close of the reporting period, there were an unlimited number of shares of beneficial interest authorized. Transactions in capital shares were as follows:
Six months ended 3/31/15
Year ended 9/30/14
Class A
Shares
Amount
Shares
Amount
Shares sold
5,599,525
$46,520,075
7,474,360
$59,918,545
Shares issued in connection with reinvestment of distributions
2,251,285
18,700,129
4,853,502
38,900,168
7,850,810
65,220,204
12,327,862
98,818,713
Shares repurchased
(10,418,001)
(86,396,865)
(28,330,366)
(225,448,945)
Net decrease
(2,567,191)
$(21,176,661)
(16,002,504)
$(126,630,232)
Six months ended 3/31/15
Year ended 9/30/14
Class B
Shares
Amount
Shares
Amount
Shares sold
25,764
$213,425
31,544
$251,410
Shares issued in connection with reinvestment of distributions
11,066
91,819
25,922
207,426
36,830
305,244
57,466
458,836
Shares repurchased
(77,674)
(643,847)
(213,110)
(1,698,618)
Net decrease
(40,844)
$(338,603)
(155,644)
$(1,239,782)
Six months ended 3/31/15
Year ended 9/30/14
Class C
Shares
Amount
Shares
Amount
Shares sold
516,410
$4,315,754
678,627
$5,470,981
Shares issued in connection with reinvestment of distributions
64,805
540,982
136,290
1,097,712
581,215
4,856,736
814,917
6,568,693
Shares repurchased
(376,012)
(3,139,021)
(1,477,119)
(11,778,644)
Net increase (decrease)
205,203
$1,717,715
(662,202)
$(5,209,951)
California Tax Exempt Income Fund 43
Six months ended 3/31/15
Year ended 9/30/14
Class M
Shares
Amount
Shares
Amount
Shares sold
19,865
$164,008
9,833
$78,462
Shares issued in connection with reinvestment of distributions
5,274
43,670
10,802
86,334
25,139
207,678
20,635
164,796
Shares repurchased
(5,692)
(46,981)
(29,763)
(239,388)
Net increase (decrease)
19,447
$160,697
(9,128)
$(74,592)
Six months ended 3/31/15
Year ended 9/30/14
Class Y
Shares
Amount
Shares
Amount
Shares sold
914,919
$7,622,812
2,478,401
$19,976,244
Shares issued in connection with reinvestment of distributions
95,437
794,834
159,406
1,282,344
1,010,356
8,417,646
2,637,807
21,258,588
Shares repurchased
(870,223)
(7,238,694)
(2,742,882)
(21,758,624)
Net increase (decrease)
140,133
$1,178,952
(105,075)
$(500,036)
Note 5: Market, credit and other risks
In the normal course of business, the fund trades financial instruments and enters into financial transactions where risk of potential loss exists due to changes in the market (market risk) or failure of the contracting party to the transaction to perform (credit risk). The fund may be exposed to additional credit risk that an institution or other entity with which the fund has unsettled or open transactions will default. The fund focuses a majority of its investments in the state of California and may be affected by economic and political developments in that state.
44 California Tax Exempt Income Fund
Fund information
Founded over 75 years ago, Putnam Investments was built around the concept that a balance between risk and reward is the hallmark of a well-rounded financial program. We manage over 100 funds across income, value, blend, growth, asset allocation, absolute return, and global sector categories.
Investment Manager
Putnam Investment Management, LLC One Post Office Square Boston, MA 02109
Investment Sub-Manager
Putnam Investments Limited 57–59 St James’s Street London, England SW1A 1LD
Marketing Services
Putnam Retail Management One Post Office Square Boston, MA 02109
Custodian
State Street Bank and Trust Company
Legal Counsel
Ropes & Gray LLP
Trustees
Jameson A. Baxter, Chair Liaquat Ahamed Ravi Akhoury Barbara M. Baumann Charles B. Curtis Robert J. Darretta Katinka Domotorffy John A. Hill Paul L. Joskow Kenneth R. Leibler Robert E. Patterson George Putnam, III Robert L. Reynolds W. Thomas Stephens
Officers
Robert L. Reynolds President
Jonathan S. Horwitz Executive Vice President, Principal Executive Officer, and Compliance Liaison
Steven D. Krichmar Vice President and Principal Financial Officer
Robert T. Burns Vice President and Chief Legal Officer
Robert R. Leveille Vice President and Chief Compliance Officer
Michael J. Higgins Vice President, Treasurer, and Clerk
Janet C. Smith Vice President, Principal Accounting Officer, and Assistant Treasurer
Susan G. Malloy Vice President and Assistant Treasurer
James P. Pappas Vice President
Mark C. Trenchard Vice President and BSA Compliance Officer
Nancy E. Florek Vice President, Director of Proxy Voting and Corporate Governance, Assistant Clerk, and Associate Treasurer
This report is for the information of shareholders of Putnam California Tax Exempt Income Fund. It may also be used as sales literature when preceded or accompanied by the current prospectus, the most recent copy of Putnam’s Quarterly Performance Summary, and Putnam’s Quarterly Ranking Summary. For more recent performance, please visit putnam.com. Investors should carefully consider the investment objectives, risks, charges, and expenses of a fund, which are described in its prospectus. For this and other information or to request a prospectus or summary prospectus, call 1-800-225-1581 toll free. Please read the prospectus carefully before investing. The fund’s Statement of Additional Information contains additional information about the fund’s Trustees and is available without charge upon request by calling 1-800-225-1581.
Item 2. Code of Ethics:
Not applicable
Item 3. Audit Committee Financial Expert:
Not applicable
Item 4. Principal Accountant Fees and Services:
Not applicable
Item 5. Audit Committee of Listed Registrants
Not applicable
Item 6. Schedule of Investments:
The registrant’s schedule of investments in unaffiliated issuers is included in the report to shareholders in Item 1 above.
Item 7. Disclosure of Proxy Voting Policies and Procedures For Closed-End Management Investment Companies:
Not applicable
Item 8. Portfolio Managers of Closed-End Investment Companies
Not Applicable
Item 9. Purchases of Equity Securities by Closed-End Management Investment Companies and Affiliated Purchasers:
Not applicable
Item 10. Submission of Matters to a Vote of Security Holders:
Not applicable
Item 11. Controls and Procedures:
(a) The registrant’s principal executive officer and principal financial officer have concluded, based on their evaluation of the effectiveness of the design and operation of the registrant’s disclosure controls and procedures as of a date within 90 days of the filing date of this report, that the design and operation of such procedures are generally effective to provide reasonable assurance that information required to be disclosed by the registrant in this report is recorded, processed, summarized and reported within the time periods specified in the Commission’s rules and forms.
(b) Changes in internal control over financial reporting: Not applicable
Item 12. Exhibits:
(a)(1) Not applicable
(a)(2) Separate certifications for the principal executive officer and principal financial officer of the registrant as required by Rule 30a-2(a) under the Investment Company Act of 1940, as amended, are filed herewith.
(b) The certifications required by Rule 30a-2(b) under the Investment Company Act of 1940, as amended, are filed herewith.
Putnam California Tax Exempt Income Fund
By (Signature and Title):
/s/ Janet C. Smith Janet C. Smith Principal Accounting Officer
Date: May 29, 2015
Pursuant to the requirements of the Securities Exchange Act of 1934 and the Investment Company Act of 1940, this report has been signed below by the following persons on behalf of the registrant and in the capacities and on the dates indicated.
By (Signature and Title):
/s/ Jonathan S. Horwitz Jonathan S. Horwitz Principal Executive Officer
Date: May 29, 2015
By (Signature and Title):
/s/ Steven D. Krichmar Steven D. Krichmar Principal Financial Officer
Date: May 29, 2015
We use cookies on this site to provide a more responsive and personalized service. Continuing to browse, clicking I Agree, or closing this banner indicates agreement. See our Cookie Policy for more information.