UNITED STATES
SECURITIES AND EXCHANGE COMMISSION
Washington, D.C. 20549
FORM N-CSR
CERTIFIED SHAREHOLDER REPORT OF REGISTERED
MANAGEMENT INVESTMENT COMPANIES
| Investment Company Act file number | 811-03706 | |||||
| AMERICAN CENTURY CALIFORNIA TAX-FREE AND MUNICIPAL FUNDS | ||||||
| (Exact name of registrant as specified in charter) | ||||||
| 4500 MAIN STREET, KANSAS CITY, MISSOURI | 64111 | |||||
| (Address of principal executive offices) | (Zip Code) | |||||
CHARLES A. ETHERINGTON 4500 MAIN STREET, KANSAS CITY, MISSOURI 64111 | ||||||
| (Name and address of agent for service) | ||||||
| Registrant’s telephone number, including area code: | 816-531-5575 | |||||
| Date of fiscal year end: | 08-31 | |||||
| Date of reporting period: | 08-31-2015 | |||||
ITEM 1. REPORTS TO STOCKHOLDERS.
| ANNUAL REPORT | AUGUST 31, 2015 |


California Long-Term Tax-Free Fund
| Table of Contents |
| President’s Letter | 2 | |
| Performance | 3 | |
| Portfolio Commentary | ||
| Fund Characteristics | ||
| Shareholder Fee Example | ||
| Schedule of Investments | ||
| Statement of Assets and Liabilities | ||
| Statement of Operations | ||
| Statement of Changes in Net Assets | ||
| Notes to Financial Statements | ||
| Financial Highlights | ||
| Report of Independent Registered Public Accounting Firm | ||
| Management | ||
| Approval of Management Agreement | ||
| Additional Information | ||
Any opinions expressed in this report reflect those of the author as of the date of the report, and do not necessarily represent the opinions of American Century Investments® or any other person in the American Century Investments organization. Any such opinions are subject to change at any time based upon market or other conditions and American Century Investments disclaims any responsibility to update such opinions. These opinions may not be relied upon as investment advice and, because investment decisions made by American Century Investments funds are based on numerous factors, may not be relied upon as an indication of trading intent on behalf of any American Century Investments fund. Security examples are used for representational purposes only and are not intended as recommendations to purchase or sell securities. Performance information for comparative indices and securities is provided to American Century Investments by third party vendors. To the best of American Century Investments’ knowledge, such information is accurate at the time of printing.
| President’s Letter |
 | Dear Investor: Thank you for reviewing this annual report for the 12 months ended August 31, 2015. It provides investment performance and portfolio information for the reporting period, plus longer-term historical performance data. Annual reports remain important vehicles for conveying information about fund returns, including market and economic factors that affected performance during the reporting period. For additional, updated investment and market insights, we encourage you to visit our website, americancentury.com. |
| Jonathan Thomas | |
Municipal Market Relatively Stable Overall (Ex-Puerto Rico and Chicago) in a Period of Increased Volatility
Broad market index returns for municipal bonds (munis) were mostly positive for the 12 months, primarily a carryover from favorable muni market conditions during the first five months of the reporting period. During those first five months (mostly during late 2014), the muni market was still rebounding after selling off in 2013. The 2014 rebound reflected a favorable combination of constrained inflation, improving U.S. economic and credit conditions, strong demand for yield, relatively low muni issuance, and the unexpected U.S. Treasury market rally.
Positive momentum from 2014 carried into January 2015, then reversed during the next four months. We believe munis struggled from February into June this year due to: 1) low, post-rally muni yields not attracting investors, 2) supply (particularly from refinancing activity) increasing while demand was declining, and 3) the downgrade of Chicago’s debt to high-yield status in May.
Deteriorating credit conditions in Puerto Rico also created headlines as the summer progressed, but the broader muni market became a bastion of stability because of its relatively high overall credit quality. During the last two months of the reporting period, comparative stability in muni market performance played out against a broader global backdrop of increased capital market volatility. This was triggered in part by China’s economic slowdown and by diverging central bank policies as the U.S. Federal Reserve seeks to reduce its monetary stimulus while other central banks are still pursuing theirs at full throttle amid generally soft global growth conditions. We expect more monetary policy divergence between the U.S. and the rest of the world in coming months, accompanied by continued market volatility. This could present both challenges and opportunities for active investment managers. In this environment, we continue to believe in a disciplined, diversified, long-term investment approach, using professionally managed stock and bond portfolios to meet financial goals. We appreciate your continued trust in us.
Sincerely,

Jonathan Thomas
President and Chief Executive Officer
American Century Investments
2
| Performance |
| Total Returns as of August 31, 2015 | ||||||
| Average Annual Returns | ||||||
Ticker Symbol | 1 year | 5 years | 10 years | Since Inception | Inception Date | |
| Investor Class | BCLTX | 2.86% | 4.54% | 4.33% | 6.41% | 11/9/83 |
| Barclays Municipal Bond Index | — | 2.52% | 3.96% | 4.49% | 7.04%(1) | — |
| Institutional Class | BCLIX | 2.97% | 4.74% | — | 5.46% | 3/1/10 |
| A Class | ALTAX | 9/28/07 | ||||
| No sales charge* | 2.60% | 4.28% | — | 4.50% | ||
| With sales charge* | -1.99% | 3.32% | — | 3.89% | ||
| C Class | ALTCX | 1.83% | 3.50% | — | 3.72% | 9/28/07 |
*Sales charges include initial sales charges and contingent deferred sales charges (CDSCs), as applicable. A Class shares have a 4.50% maximum initial sales charge and may be subject to a maximum CDSC of 1.00%. C Class shares redeemed within 12 months of purchase are subject to a maximum CDSC of 1.00%. The SEC requires that mutual funds provide performance information net of maximum sales charges in all cases where charges could be applied.
| (1) | Since October 31, 1983, the date nearest the Investor Class’s inception for which data are available. |
Data presented reflect past performance. Past performance is no guarantee of future results. Current performance may be higher or lower than the performance shown. Investment return and principal value will fluctuate, and redemption value may be more or less than original cost. Data assumes reinvestment of dividends and capital gains, and none of the charts reflect the deduction of taxes that a shareholder would pay on fund distributions or the redemption of fund shares. To obtain performance data current to the most recent month end, please call 1-800-345-2021 or visit americancentury.com. For additional information about the fund, please consult the prospectus.
3
| Growth of $10,000 Over 10 Years |
| $10,000 investment made August 31, 2005 |
| Performance for other share classes will vary due to differences in fee structure. |
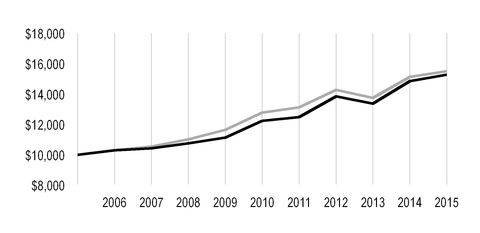
| Value on August 31, 2015 | |
| Investor Class — $15,276 | |
| Barclays Municipal Bond Index — $15,513 | |
| Total Annual Fund Operating Expenses | |||
| Investor Class | Institutional Class | A Class | C Class |
| 0.47% | 0.27% | 0.72% | 1.47% |
The total annual fund operating expenses shown is as stated in the fund’s prospectus current as of the date of this report. The prospectus may vary from the expense ratio shown elsewhere in this report because it is based on a different time period, includes acquired fund fees and expenses, and, if applicable, does not include fee waivers or expense reimbursements.
Data presented reflect past performance. Past performance is no guarantee of future results. Current performance may be higher or lower than the performance shown. Investment return and principal value will fluctuate, and redemption value may be more or less than original cost. Data assumes reinvestment of dividends and capital gains, and none of the charts reflect the deduction of taxes that a shareholder would pay on fund distributions or the redemption of fund shares. To obtain performance data current to the most recent month end, please call 1-800-345-2021 or visit americancentury.com. For additional information about the fund, please consult the prospectus.
4
| Portfolio Commentary |
Portfolio Managers: Joseph Gotelli, Alan Kruss, and Steven Permut
Performance Summary
California Long-Term Tax-Free returned 2.86%* for the 12 months ended August 31, 2015. The fund’s benchmark, the Barclays Municipal Bond Index, returned 2.52%. Fund returns reflect operating expenses, while index returns do not.
The fund’s absolute return for the reporting period reflected the positive overall performance of municipal bonds (munis) despite a backdrop of increasing global market volatility. The muni market generally rallied during the first five months of the period, following the U.S. Treasury market higher. Global divergence of central bank policy, whereby the Federal Reserve (the Fed) was scaling back its stimulus programs as other leading central banks were increasing theirs in response to weak growth rates, created an environment in which U.S. Treasury yields were relatively more attractive than government bond yields in Europe and elsewhere. A muted inflation backdrop also aided U.S. bond returns. Furthermore, a combination of factors specific to munis, including generally improving credit conditions among issuers and modest demand for munis in the face of reduced supply, also supported broad muni market gains.
Beginning in February 2015, muni market volatility emerged and persisted into June. Mounting speculation about when the Fed would raise its federal funds rate target pushed interest rates higher, slowing demand for investment-grade fixed-income securities in general. In the muni market, demand subsided (particularly from mutual fund investors) as municipalities boosted issuance of securities ahead of the Fed’s expected interest rate hike, which most investors believed would occur later in 2015. These supply/demand factors suppressed returns. In addition, credit rating agency Moody’s downgraded Chicago’s debt to high-yield status, which put pressure on other muni issuers with large unfunded pension liabilities. Late in the period, concerns about slowing growth in China rocked the global financial markets. Investment-grade munis, which represented a source of relative stability during this market unrest, rebounded in the final two months of the period, benefiting from their quality characteristics and tax benefits.
Overall, strong performance early and late in the period more than offset the weaker results in the middle months. Longer-maturity and lower-quality munis generally fared better than shorter-maturity and the highest-quality securities. Revenue bonds outperformed general obligation (GO) bonds, and California munis generally outperformed national muni benchmarks. The fund’s outperformance versus its benchmark was due primarily to its longer maturity and single-state focus relative to the national benchmark. Security selection also aided results.
Credit Improvements, Particularly in California, Negated Negative Headlines Elsewhere
Despite negative headlines regarding Chicago, Puerto Rico, and other isolated issuers, muni market fundamentals generally remained positive and continued to provide support to the broad market. We believe the problems in Chicago and Puerto Rico are due largely to their own circumstances and should not be viewed as indicative of any particular systemic municipal market problem.
* All fund returns referenced in this commentary are for Investor Class shares. Performance for other share classes will vary due to differences in fee structure; when Investor Class performance exceeds that of the fund's benchmark, other share classes may not. See page 3 for returns for all share classes.
5
From a broad fiscal standpoint, state and local finances in California and across the U.S. generally improved due to increased revenue collections and spending constraints. California’s economy gained ground, as indicated by job growth (which exceeded the U.S. average) and real estate gains. Following enactment of California’s 2015-2016 budget, which mandates contributions to the state’s “rainy day” fund and the paydown of previous deficit loans, Standard & Poor’s raised the state’s bond credit rating to “AA-,” its highest level in 14 years.
From a national credit rating perspective, muni credit-rating upgrades outpaced downgrades in the fourth quarter of 2014 and first quarter of 2015. In addition, the national muni default rate remained low. We continue to believe it is unlikely any states will default, but select isolated state, local, and commonwealth credit ratings could be pressured by special circumstances.
Longer Maturity, California Biases Were Main Relative Performance Contributors
Our focus on longer-maturity securities and maintaining a longer duration (price sensitivity to interest rate changes) versus the benchmark was a primary contributor to the fund’s outperformance. In general, longer-term interest rates declined and shorter-term rates increased during the 12-month period. This caused the yield curve to flatten, and longer-maturity/duration securities generally outperformed their shorter-maturity/duration counterparts. We used U.S. Treasury futures as part of our duration strategy.
The portfolio’s California bias compared with the national benchmark and our preference for revenue bonds over GO bonds also aided results. Within the revenue bond sector, we favored lease revenue, special tax, transportation, and hospital bonds. Our selections among certain lower-quality California munis also boosted the fund’s relative performance. Conversely, small positions in select Puerto Rico munis detracted from fund performance. In light of the escalating fiscal challenges facing Puerto Rico, we began reducing the portfolio’s position in the commonwealth’s munis in early 2015. By the end of July, we had exited all Puerto Rico debt. Although we no longer have any direct Puerto Rico exposure, we expect the commonwealth to continue to distract the muni market due to the sheer size and prevalence of its outstanding debt.
Global Market Volatility Likely to Persist
We believe interest rates will increase as the U.S. economy continues to improve, but the time frame for rate normalization may be extended due to weak global growth. Given this backdrop and continued uncertainty about the Fed’s monetary policy strategy, we expect market volatility to persist ahead of any action on short-term interest rates. The near-term effect this backdrop will have on muni supply remains unclear. On one hand, it may increase issuance as municipalities seek to refinance their debt and issue securities before the Fed raises rates significantly higher. On the other hand, it may lead to reduced overall muni supply as issuers have less incentive to refinance as rates rise. We have marginally increased the fund’s credit quality, believing the volatile backdrop may lead to credit spread widening (an increase in the yield differential between higher-quality and lower-quality munis of similar maturity), which would favor higher-quality securities. We expect fundamental credit research, active management, and security selection to become increasingly important as rates normalize.
We continue to monitor the impact of California’s drought on the state economy and individual bond issuers. We do not expect the drought to have a broad impact on the credit ratings of water bond issuers within the state, given the financial strength of most water utilities. With regard to the state economy, the drought could slow growth in more agriculturally oriented areas, but they represent only 2% of California’s diverse economy.
6
| Fund Characteristics |
| AUGUST 31, 2015 | |
| Portfolio at a Glance | |
| Weighted Average Maturity | 16.9 years |
| Average Duration (Modified) | 5.1 years |
| Top Five Sectors | % of fund investments |
| Hospital | 13% |
| General Obligation (GO) - Local | 12% |
| General Obligation (GO) - State | 12% |
| Lease Revenue | 10% |
| Prerefunded | 8% |
| Types of Investments in Portfolio | % of net assets |
| Municipal Securities | 98.7% |
| Other Assets and Liabilities | 1.3% |
7
| Shareholder Fee Example |
Fund shareholders may incur two types of costs: (1) transaction costs, including sales charges (loads) on purchase payments and redemption/exchange fees; and (2) ongoing costs, including management fees; distribution and service (12b-1) fees; and other fund expenses. This example is intended to help you understand your ongoing costs (in dollars) of investing in your fund and to compare these costs with the ongoing cost of investing in other mutual funds.
The example is based on an investment of $1,000 made at the beginning of the period and held for the entire period from March 1, 2015 to August 31, 2015.
Actual Expenses
The table provides information about actual account values and actual expenses for each class. You may use the information, together with the amount you invested, to estimate the expenses that you paid over the period. First, identify the share class you own. Then simply divide your account value by $1,000 (for example, an $8,600 account value divided by $1,000 = 8.6), then multiply the result by the number under the heading “Expenses Paid During Period” to estimate the expenses you paid on your account during this period.
If you hold Investor Class shares of any American Century Investments fund, or Institutional Class shares of the American Century Diversified Bond Fund, in an American Century Investments account (i.e., not a financial intermediary or retirement plan account), American Century Investments may charge you a $12.50 semiannual account maintenance fee if the value of those shares is less than $10,000. We will redeem shares automatically in one of your accounts to pay the $12.50 fee. In determining your total eligible investment amount, we will include your investments in all personal accounts (including American Century Investments Brokerage accounts) registered under your Social Security number. Personal accounts include individual accounts, joint accounts, UGMA/UTMA accounts, personal trusts, Coverdell Education Savings Accounts and IRAs (including traditional, Roth, Rollover, SEP-, SARSEP- and SIMPLE-IRAs), and certain other retirement accounts. If you have only business, business retirement, employer-sponsored or American Century Investments Brokerage accounts, you are currently not subject to this fee. If you are subject to the Account Maintenance Fee, your account value could be reduced by the fee amount.
Hypothetical Example for Comparison Purposes
The table also provides information about hypothetical account values and hypothetical expenses based on the actual expense ratio of each class of your fund and an assumed rate of return of 5% per year before expenses, which is not the actual return of a fund’s share class. The hypothetical account values and expenses may not be used to estimate the actual ending account balance or expenses you paid for the period. You may use this information to compare the ongoing costs of investing in your fund and other funds. To do so, compare this 5% hypothetical example with the 5% hypothetical examples that appear in the shareholder reports of the other funds.
Please note that the expenses shown in the table are meant to highlight your ongoing costs only and do not reflect any transactional costs, such as sales charges (loads) or redemption/exchange fees. Therefore, the table is useful in comparing ongoing costs only, and will not help you determine the relative total costs of owning different funds. In addition, if these transactional costs were included, your costs would have been higher.
8
| Beginning Account Value 3/1/15 | Ending Account Value 8/31/15 | Expenses Paid During Period(1) 3/1/15 - 8/31/15 | Annualized Expense Ratio(1) | |
| Actual | ||||
| Investor Class | $1,000 | $1,002.60 | $2.37 | 0.47% |
| Institutional Class | $1,000 | $1,003.60 | $1.36 | 0.27% |
| A Class | $1,000 | $1,001.30 | $3.63 | 0.72% |
| C Class | $1,000 | $997.60 | $7.40 | 1.47% |
| Hypothetical | ||||
| Investor Class | $1,000 | $1,022.84 | $2.40 | 0.47% |
| Institutional Class | $1,000 | $1,023.84 | $1.38 | 0.27% |
| A Class | $1,000 | $1,021.58 | $3.67 | 0.72% |
| C Class | $1,000 | $1,017.80 | $7.48 | 1.47% |
| (1) | Expenses are equal to the class's annualized expense ratio listed in the table above, multiplied by the average account value over the period, multiplied by 184, the number of days in the most recent fiscal half-year, divided by 365, to reflect the one-half year period. |
9
| Schedule of Investments |
AUGUST 31, 2015
| Principal Amount | Value | |||||
| MUNICIPAL SECURITIES — 98.7% | ||||||
| California — 97.7% | ||||||
| ABAG Finance Authority for Nonprofit Corps. Rev., (Sharp HealthCare), 6.25%, 8/1/39 | $ | 1,200,000 | $ | 1,402,044 | ||
| ABAG Finance Authority for Nonprofit Corps. Rev., Series 2011 A, (Sharp HealthCare), 6.00%, 8/1/30 | 1,000,000 | 1,214,660 | ||||
| ABAG Finance Authority for Nonprofit Corps. Rev., Series 2014 A, (Sharp HealthCare), 5.00%, 8/1/43 | 500,000 | 554,370 | ||||
Alameda Corridor Transportation Authority Rev., Capital Appreciation, Series 1999 A, 0.00%, 10/1/32 (NATL-RE)(1) | 1,000,000 | 482,240 | ||||
Alameda Corridor Transportation Authority Rev., Capital Appreciation, Series 1999 A, (Senior Lien), 0.00%, 10/1/35 (NATL-RE)(1) | 3,750,000 | 1,575,450 | ||||
| Alum Rock Union Elementary School District GO, Series 2013 A, (Election of 2012), 6.00%, 8/1/39 | 1,000,000 | 1,221,020 | ||||
| Anaheim Public Financing Authority Rev., (Electric System Distribution), 5.25%, 10/1/39 | 2,500,000 | 2,786,475 | ||||
| Anaheim Public Financing Authority Rev., Series 2011 A, (Electric System Distribution Facilities), 5.375%, 10/1/36 | 300,000 | 350,340 | ||||
| Anaheim Public Financing Authority Rev., Series 2014 A, (Anaheim Convention Center Expansion Project), 5.00%, 5/1/34 | 550,000 | 622,165 | ||||
| Anaheim Public Financing Authority Rev., Series 2014 A, (Anaheim Convention Center Expansion Project), 5.00%, 5/1/46 | 2,200,000 | 2,456,674 | ||||
| Bay Area Toll Authority Toll Bridge Rev., Series 2001 A, (San Francisco Bay Area), VRDN, 1.27%, 9/3/15 | 1,000,000 | 983,850 | ||||
Bay Area Toll Authority Toll Bridge Rev., Series 2006 F, (San Francisco Bay Area), 5.00%, 4/1/16, Prerefunded at 100% of Par(2) | 3,000,000 | 3,084,000 | ||||
| Bay Area Toll Authority Toll Bridge Rev., Series 2007 A-1, (San Francisco Bay Area), VRDN, 0.72%, 9/3/15 | 550,000 | 547,624 | ||||
Bay Area Toll Authority Toll Bridge Rev., Series 2008 F-1, (San Francisco Bay Area), 5.00%, 4/1/18, Prerefunded at 100% of Par(2) | 2,135,000 | 2,366,712 | ||||
| Bay Area Toll Authority Toll Bridge Rev., Series 2008 G-1, (San Francisco Bay Area), VRDN, 1.12%, 9/3/15 | 1,250,000 | 1,237,837 | ||||
Bay Area Toll Authority Toll Bridge Rev., Series 2009 F-1, (San Francisco Bay Area), 5.25%, 4/1/19, Prerefunded at 100% of Par(2) | 1,500,000 | 1,726,995 | ||||
| Bay Area Toll Authority Toll Bridge Rev., Series 2013 S-4, (San Francisco Bay Area), 5.00%, 4/1/43 | 2,655,000 | 2,948,032 | ||||
| Bay Area Toll Authority Toll Bridge Rev., Series 2014 S-6, (San Francisco Bay Area), 5.00%, 10/1/54 | 3,000,000 | 3,263,610 | ||||
| Brea Redevelopment Agency Tax Allocation Rev., 4.00%, 8/1/16 | 1,245,000 | 1,287,417 | ||||
| California Department of Water Resources Power Supply Rev., Series 2005 G-4, 5.00%, 5/1/16 | 1,450,000 | 1,496,342 | ||||
California Department of Water Resources Power Supply Rev., Series 2008 H, 5.00%, 5/1/18, Prerefunded at 100% of Par(2) | 1,785,000 | 1,984,170 | ||||
| California Department of Water Resources Power Supply Rev., Series 2008 H, 5.00%, 5/1/21 | 715,000 | 794,301 | ||||
| California Department of Water Resources Power Supply Rev., Series 2010 L, 5.00%, 5/1/18 | 2,000,000 | 2,223,620 | ||||
California Department of Water Resources Power Supply Rev., Series 2010 L, 5.00%, 5/1/20, Prerefunded at 100% of Par(2) | 790,000 | 925,651 | ||||
| California Department of Water Resources Power Supply Rev., Series 2010 L, 5.00%, 5/1/22 | 485,000 | 561,305 | ||||
10
| Principal Amount | Value | |||||
California Economic Recovery GO, Series 2009 A, 5.00%, 7/1/16(2) | $ | 1,700,000 | $ | 1,767,830 | ||
| California Educational Facilities Authority Rev., (Chapman University), 5.00%, 4/1/25 | 285,000 | 341,022 | ||||
| California Educational Facilities Authority Rev., (Harvey Mudd College), 5.25%, 12/1/41 | 2,000,000 | 2,229,280 | ||||
| California Educational Facilities Authority Rev., (Pepperdine University), 5.00%, 12/1/44 | 1,000,000 | 1,132,810 | ||||
| California Educational Facilities Authority Rev., (Santa Clara University), 5.625%, 4/1/37 | 5,000,000 | 5,520,350 | ||||
| California Educational Facilities Authority Rev., (University of the Pacific), 5.00%, 11/1/33 | 500,000 | 563,675 | ||||
| California Educational Facilities Authority Rev., Series 2009 A, (University of Southern California), 5.00%, 10/1/39 | 2,000,000 | 2,208,380 | ||||
| California GO, 5.00%, 2/1/27 | 3,000,000 | 3,506,250 | ||||
| California GO, 5.00%, 2/1/28 | 1,000,000 | 1,163,480 | ||||
| California GO, 5.00%, 3/1/28 | 2,000,000 | 2,366,960 | ||||
| California GO, 5.25%, 9/1/32 | 2,000,000 | 2,309,500 | ||||
| California GO, 5.00%, 11/1/32 | 1,500,000 | 1,622,535 | ||||
| California GO, 6.50%, 4/1/33 | 5,000,000 | 5,924,750 | ||||
| California GO, 5.00%, 4/1/38 | 2,500,000 | 2,716,225 | ||||
| California GO, 6.00%, 4/1/38 | 2,500,000 | 2,913,875 | ||||
| California GO, 6.00%, 11/1/39 | 5,000,000 | 5,952,250 | ||||
| California GO, 5.50%, 3/1/40 | 3,000,000 | 3,486,210 | ||||
California GO, 5.00%, 10/1/41(3) | 2,000,000 | 2,233,820 | ||||
California GO, 5.00%, 8/1/45(4) | 1,000,000 | 1,131,900 | ||||
| California GO, Series 2012 B, VRN, 0.92%, 9/3/15 | 2,000,000 | 2,018,600 | ||||
| California GO, Series 2012 B, VRN, 1.02%, 9/3/15 | 800,000 | 811,312 | ||||
| California GO, Series 2012 B, VRN, 1.17%, 9/3/15 | 960,000 | 981,802 | ||||
| California Health Facilities Financing Authority Rev., (Cedars-Sinai Medical Center), 5.00%, 8/15/21 | 1,000,000 | 1,178,440 | ||||
| California Health Facilities Financing Authority Rev., Series 2007 A, (Sutter Health), 5.25%, 11/15/46 | 1,500,000 | 1,560,630 | ||||
| California Health Facilities Financing Authority Rev., Series 2008 A, (Lucile Salter Packard Children's Hospital), VRDN, 1.45%, 3/15/17 | 150,000 | 152,022 | ||||
California Health Facilities Financing Authority Rev., Series 2008 C, (Providence Health & Services), 6.50%, 10/1/18, Prerefunded at 100% of Par(2) | 1,000,000 | 1,172,240 | ||||
| California Health Facilities Financing Authority Rev., Series 2009 A, (Catholic Healthcare West), 6.00%, 7/1/39 | 3,400,000 | 3,887,152 | ||||
| California Health Facilities Financing Authority Rev., Series 2009 A, (Children's Hospital of Orange County), 6.50%, 11/1/38 | 4,500,000 | 5,351,175 | ||||
| California Health Facilities Financing Authority Rev., Series 2009 A, (St. Joseph Health System), 5.75%, 7/1/39 | 1,000,000 | 1,144,450 | ||||
| California Health Facilities Financing Authority Rev., Series 2009 B, (Providence Health & Services), 5.50%, 10/1/39 | 1,000,000 | 1,142,050 | ||||
| California Health Facilities Financing Authority Rev., Series 2009 C, (St. Joseph Health System), VRDN, 5.00%, 10/18/22 | 800,000 | 956,064 | ||||
| California Health Facilities Financing Authority Rev., Series 2010 A, (Scripps Memorial Hospital), 5.00%, 11/15/19 | 1,000,000 | 1,149,610 | ||||
| California Health Facilities Financing Authority Rev., Series 2011 B, (Sutter Health), 6.00%, 8/15/42 | 1,500,000 | 1,774,230 | ||||
| California Health Facilities Financing Authority Rev., Series 2011 D, (Sutter Health), 5.25%, 8/15/31 | 1,000,000 | 1,169,370 | ||||
11
| Principal Amount | Value | |||||
| California Health Facilities Financing Authority Rev., Series 2012 A, (Stanford Hospital & Clinics), 5.00%, 8/15/51 | $ | 500,000 | $ | 543,685 | ||
| California Health Facilities Financing Authority Rev., Series 2013 A, (St. Joseph Health System), 5.00%, 7/1/37 | 180,000 | 201,359 | ||||
| California Health Facilities Financing Authority Rev., Series 2013 A, (Sutter Health), 5.00%, 8/15/52 | 1,500,000 | 1,635,465 | ||||
| California Health Facilities Financing Authority Rev., Series 2014 A, (Lucile Salter Packard Children's Hospital), 5.00%, 8/15/43 | 1,000,000 | 1,120,980 | ||||
| California Infrastructure & Economic Development Bank Rev., Series 2012 A-1, (J. Paul Getty Trust), 4.00%, 10/1/15 | 325,000 | 326,076 | ||||
| California Infrastructure & Economic Development Bank Rev., Series 2013 A, (Los Angeles County Museum of Art Project), VRDN, 1.89%, 9/3/15 | 1,000,000 | 1,028,880 | ||||
| California Infrastructure & Economic Development Bank Rev., Series 2015 A, (The Colburn School), VRDN, 1.02%, 9/3/15 | 935,000 | 930,054 | ||||
| California Municipal Finance Authority Rev., Series 2010 A, (University of La Verne), 6.25%, 6/1/40 | 1,000,000 | 1,142,310 | ||||
California Municipal Finance Authority Rev., Series 2011 B, (Azusa Pacific University), 8.00%, 4/1/21, Prerefunded at 100% of Par(2) | 665,000 | 889,677 | ||||
| California Municipal Finance Authority Rev., Series 2011, (Emerson College), 6.00%, 1/1/42 | 2,000,000 | 2,386,900 | ||||
| California Municipal Finance Authority Rev., Series 2014 A, (Touro College and University System), 5.25%, 1/1/34 | 300,000 | 325,416 | ||||
| California Municipal Finance Authority Rev., Series 2014 A, (Touro College and University System), 5.25%, 1/1/40 | 1,000,000 | 1,069,410 | ||||
| California Municipal Finance Authority Rev., Series 2015 A, (Community Medical Centers), 5.00%, 2/1/40 | 1,420,000 | 1,527,579 | ||||
| California Municipal Finance Authority Rev., Series 2015 B, (Azusa Pacific University), 5.00%, 4/1/41 | 500,000 | 532,135 | ||||
California Pollution Control Financing Authority Rev., 5.00%, 11/21/45(5) | 1,000,000 | 1,029,960 | ||||
| California Pollution Control Financing Authority Rev., Series 1996 E, (Pacific Gas & Electric Co.), VRDN, 0.01%, 9/1/15 (LOC: JPMorgan Chase Bank N.A.) | 5,800,000 | 5,800,000 | ||||
| California Pollution Control Financing Authority Rev., Series 1996 F, (Pacific Gas & Electric Co.), VRDN, 0.01%, 9/1/15 (LOC: JPMorgan Chase Bank N.A.) | 1,000,000 | 1,000,000 | ||||
| California Public Works Board Lease Rev., Series 2009 G-1, (Various Capital Projects), 5.75%, 10/1/30 | 2,000,000 | 2,339,320 | ||||
| California Public Works Board Lease Rev., Series 2009 H, (Department of Correction and Rehabilitation), 5.75%, 11/1/29 | 1,685,000 | 1,975,882 | ||||
| California Public Works Board Lease Rev., Series 2011 D, (Judicial Council Projects), 5.25%, 12/1/26 | 1,000,000 | 1,200,540 | ||||
| California Public Works Board Lease Rev., Series 2012 A, (Various Capital Projects), 5.00%, 4/1/25 | 1,700,000 | 1,994,236 | ||||
| California Public Works Board Lease Rev., Series 2012 A, (Various Capital Projects), 5.00%, 4/1/37 | 2,170,000 | 2,417,879 | ||||
| California Public Works Board Lease Rev., Series 2012 D, (California State University Projects), 5.00%, 9/1/36 | 500,000 | 554,720 | ||||
| California Public Works Board Lease Rev., Series 2013 H, (California State University Projects), 5.00%, 9/1/38 | 1,865,000 | 2,094,693 | ||||
| California Public Works Board Lease Rev., Series 2013 I, (Various Capital Projects), 5.00%, 11/1/38 | 1,500,000 | 1,692,630 | ||||
| California State University Systemwide Rev., Series 2015 A, 5.00%, 11/1/19 | 1,000,000 | 1,156,310 | ||||
| California Statewide Communities Development Authority Rev., Series 2015 A, (Adventist Health System/West), 5.00%, 3/1/35 | 715,000 | 798,233 | ||||
12
| Principal Amount | Value | |||||
| California Statewide Communities Development Authority Rev., (Cottage Health System Obligated Group), 5.25%, 11/1/30 | $ | 1,000,000 | $ | 1,131,960 | ||
| California Statewide Communities Development Authority Rev., (Trinity Health Corp.), 5.00%, 12/1/41 | 500,000 | 554,175 | ||||
| California Statewide Communities Development Authority Rev., Series 2001 C, (Kaiser Permanente), 5.25%, 8/1/31 | 3,000,000 | 3,112,650 | ||||
California Statewide Communities Development Authority Rev., Series 2005 A, (Thomas Jefferson School of Law), 4.875%, 10/1/15, Prerefunded at 100% of Par(2) | 900,000 | 903,591 | ||||
| California Statewide Communities Development Authority Rev., Series 2008 C, (John Muir Health), VRDN, 0.01%, 9/1/15 (LOC: Wells Fargo Bank N.A.) | 600,000 | 600,000 | ||||
| California Statewide Communities Development Authority Rev., Series 2012 A, (Kaiser Permanente), 5.00%, 4/1/42 | 2,780,000 | 3,051,495 | ||||
| California Statewide Communities Development Authority Rev., Series 2014 A, (Henry Mayo Newhall Memorial Hospital), 5.25%, 10/1/43 (AGM) | 750,000 | 837,435 | ||||
| California Statewide Communities Development Authority Rev., Series 2014 A, (Loma Linda University Medical Center), 5.25%, 12/1/44 | 500,000 | 522,500 | ||||
| California Statewide Communities Development Authority Rev., Series 2014 A, (Loma Linda University Medical Center), 5.50%, 12/1/54 | 500,000 | 528,345 | ||||
| California Statewide Communities Development Authority Rev., Series 2014 A, (Los Angeles Jewish Home), 5.00%, 8/1/44 (GA: Jewish Home Foundation) | 500,000 | 558,820 | ||||
| California Statewide Communities Development Authority Rev., Series 2014 B, (Huntington Memorial Hospital), 5.00%, 7/1/34 | 500,000 | 556,340 | ||||
| California Statewide Communities Development Authority Rev., Series 2014 B, (Huntington Memorial Hospital), 5.00%, 7/1/44 | 1,300,000 | 1,435,057 | ||||
| California Statewide Communities Development Authority Rev., Series 2015, (American Baptist Homes of the West), 5.00%, 10/1/45 | 600,000 | 636,318 | ||||
| California University Systemwide Rev., Series 2009 A, 5.25%, 11/1/34 | 2,230,000 | 2,520,993 | ||||
| Carson Redevelopment Agency Successor Agency Tax Allocation Rev., Series 2014 A, (Project Area No. 1), 5.00%, 10/1/19 (AGM) | 485,000 | 548,889 | ||||
| Carson Redevelopment Agency Successor Agency Tax Allocation Rev., Series 2014 A, (Project Area No. 1), 5.00%, 10/1/20 (AGM) | 785,000 | 903,190 | ||||
| City of Irvine Improvement Bond Act of 1915 Special Assessment Rev., (Assessment District No. 12-1), 4.00%, 9/2/17 | 365,000 | 387,141 | ||||
| City of Irvine Improvement Bond Act of 1915 Special Assessment Rev., (Assessment District No. 12-1), 4.00%, 9/2/18 | 375,000 | 405,172 | ||||
| City of Irvine Improvement Bond Act of 1915 Special Assessment Rev., (Assessment District No. 12-1), 4.00%, 9/2/19 | 600,000 | 657,552 | ||||
| City of Irvine Improvement Bond Act of 1915 Special Assessment Rev., (Assessment District No. 15-1), 5.00%, 9/2/26 | 1,000,000 | 1,188,970 | ||||
| City of Riverside Rev., Series 2015 A, (Sewer), 5.00%, 8/1/40 | 500,000 | 560,145 | ||||
| City of Tulare Sewer Rev., 5.00%, 11/15/23 (AGM) | 675,000 | 801,124 | ||||
| Coalinga Public Financing Authority Local Obligation Rev., Series 1998 A, (Senior Lien), 6.375%, 9/15/21 (Ambac) | 1,320,000 | 1,510,661 | ||||
Del Mar Race Track Authority Rev., 5.00%, 10/1/35(5) | 660,000 | 710,728 | ||||
| East Side Union High School District GO, 5.00%, 8/1/23 | 265,000 | 318,941 | ||||
| East Side Union High School District GO, 5.00%, 8/1/24 | 150,000 | 182,198 | ||||
| East Side Union High School District GO, 5.00%, 8/1/33 | 600,000 | 692,238 | ||||
| Eastern Municipal Water District Water & Sewer Rev., Series 2011 A, 4.00%, 7/1/16 | 400,000 | 412,648 | ||||
13
| Principal Amount | Value | |||||
| Folsom Cordova Unified School District No. 2 Facilities Improvement GO, Series 2014, 4.00%, 10/1/15 | $ | 245,000 | $ | 245,801 | ||
| Folsom Cordova Unified School District No. 4 Facilities Improvement GO, Series 2014 A, (Election of 2012), 4.00%, 10/1/15 | 250,000 | 250,810 | ||||
| Foothill/Eastern Transportation Corridor Agency Toll Road Rev., Series 2013 A, 5.75%, 1/15/46 | 1,000,000 | 1,153,390 | ||||
| Foothill/Eastern Transportation Corridor Agency Toll Road Rev., Series 2013 A, 6.00%, 1/15/49 | 3,250,000 | 3,806,790 | ||||
| Foothill/Eastern Transportation Corridor Agency Toll Road Rev., Series 2013 B-3, VRDN, 5.50%, 1/15/23 | 1,000,000 | 1,152,500 | ||||
| Foothill/Eastern Transportation Corridor Agency Toll Road Rev., Series 2013 C, 6.50%, 1/15/43 | 500,000 | 591,675 | ||||
Foothill/Eastern Transportation Corridor Agency Toll Road Rev., Capital Appreciation, Series 2013 A, 0.00%, 1/15/24(6) | 700,000 | 526,953 | ||||
Foothill/Eastern Transportation Corridor Agency Toll Road Rev., Capital Appreciation, Series 2013 A, 0.00%, 1/15/42(1) | 1,250,000 | 353,913 | ||||
Foothill/Eastern Transportation Corridor Agency Toll Road Rev., Capital Appreciation, Series 2015 A, 0.00%, 1/15/33(1) | 600,000 | 265,866 | ||||
| Golden State Tobacco Securitization Corp. Settlement Rev., Series 2007 A-1, 4.50%, 6/1/27 | 445,000 | 424,730 | ||||
| Golden State Tobacco Securitization Corp. Settlement Rev., Series 2007 A-1, 5.00%, 6/1/33 | 750,000 | 637,582 | ||||
Golden State Tobacco Securitization Corp. Settlement Rev., Capital Appreciation, Series 2005 A, 0.00%, 6/1/25 (AGM)(1) | 1,000,000 | 742,480 | ||||
Grossmont Healthcare District GO, Series 2011 B, (Election of 2006), 6.00%, 7/15/21, Prerefunded at 100% of Par(2) | 1,000,000 | 1,251,590 | ||||
| Grossmont Union High School District GO, Series 2013 E, (Election of 2008), 5.00%, 8/1/43 | 1,000,000 | 1,108,010 | ||||
| Hayward Area Recreation and Park District COP, 5.125%, 1/1/39 | 1,000,000 | 1,108,140 | ||||
| Inland Valley Development Agency Tax Allocation Rev., Series 2014 A, 5.25%, 9/1/37 | 555,000 | 615,967 | ||||
| Inland Valley Development Agency Tax Allocation Rev., Series 2014 A, 5.00%, 9/1/44 | 590,000 | 632,161 | ||||
| Irvine Community Facilities District No. 2013-3 Special Tax Rev., (Great Park Improvement Area No. 1), 5.00%, 9/1/49 | 1,000,000 | 1,071,840 | ||||
| La Verne COP, (Brethren Hillcrest Homes), 5.00%, 5/15/29 | 635,000 | 688,359 | ||||
| Long Beach Bond Finance Authority Natural Gas Purchase Rev., Series 2007 A, 5.00%, 11/15/35 | 330,000 | 371,003 | ||||
| Long Beach Bond Finance Authority Natural Gas Purchase Rev., Series 2007 A, 5.50%, 11/15/37 | 695,000 | 820,135 | ||||
| Long Beach Marina Rev., Series 2015, (Alamitos Bay Marina Project), 5.00%, 5/15/40 | 1,250,000 | 1,344,450 | ||||
Los Alamitos Unified School District COP, Capital Appreciation, (Capital Projects), 0.00%, 8/1/24(6) | 1,100,000 | 819,467 | ||||
Los Angeles Community College District GO, Series 2007 A, (Election of 2001), 5.00%, 8/1/17, Prerefunded at 100% of Par (NATL-RE/FGIC)(2) | 1,425,000 | 1,545,868 | ||||
| Los Angeles Community College District GO, Series 2015 C, 5.00%, 6/1/26 | 295,000 | 367,818 | ||||
| Los Angeles County Regional Financing Authority Rev., Series 2014 B-1, (MonteCedro, Inc.), 3.00%, 11/15/21 (California Mortgage Insurance) | 355,000 | 357,272 | ||||
| Los Angeles County Regional Financing Authority Rev., Series 2014 B-2, (MonteCedro, Inc.), 3.00%, 11/15/20 (California Mortgage Insurance) | 275,000 | 276,878 | ||||
14
| Principal Amount | Value | |||||
| Los Angeles County Regional Financing Authority Rev., Series 2014 B-3, (MonteCedro, Inc.), 2.50%, 11/15/20 (California Mortgage Insurance) | $ | 625,000 | $ | 628,325 | ||
| Los Angeles County Sanitation Districts Financing Authority Rev., Series 2015 A, (Capital Projects), 5.00%, 10/1/35 | 1,500,000 | 1,721,340 | ||||
Los Angeles Department of Airports Rev., Series 2008 C, (Los Angeles International Airport), 5.25%, 5/15/18, Prerefunded at 100% of Par(2) | 2,120,000 | 2,374,464 | ||||
| Los Angeles Department of Airports Rev., Series 2010 A, (Los Angeles International Airport), 5.00%, 5/15/40 | 1,000,000 | 1,127,810 | ||||
| Los Angeles Department of Airports Rev., Series 2010 B, (Los Angeles International Airport), 5.00%, 5/15/40 | 2,000,000 | 2,249,900 | ||||
| Los Angeles Department of Water & Power System Rev., Series 2011 A, 5.00%, 7/1/19 | 1,000,000 | 1,143,550 | ||||
| Los Angeles Department of Water & Power System Rev., Series 2008 A-1, 5.25%, 7/1/38 | 4,000,000 | 4,405,720 | ||||
| Los Angeles Harbor Department Rev., Series 2009 A, 5.00%, 8/1/27 | 500,000 | 568,030 | ||||
| Los Angeles Harbor Department Rev., Series 2011 B, 5.00%, 8/1/24 | 525,000 | 625,842 | ||||
| Los Angeles Unified School District COP, Series 2010 A, (Multiple Properties), 5.00%, 12/1/15 | 1,000,000 | 1,012,240 | ||||
| Los Angeles Unified School District COP, Series 2012 B, (Headquarters Building Project), 5.00%, 10/1/30 | 3,000,000 | 3,396,600 | ||||
Los Angeles Unified School District GO, Series 2006 F, (Election of 2004), 5.00%, 7/1/16, Prerefunded at 100% of Par (FGIC)(2) | 2,000,000 | 2,078,260 | ||||
| Los Angeles Unified School District GO, Series 2007 H, (Election of 2004), 5.00%, 7/1/32 (AGM) | 1,020,000 | 1,088,238 | ||||
| Los Angeles Unified School District GO, Series 2009 I, (Election of 2004), 5.00%, 7/1/29 | 2,000,000 | 2,279,860 | ||||
| Los Angeles Unified School District GO, Series 2010 KRY, 5.25%, 7/1/26 | 1,000,000 | 1,164,290 | ||||
| Los Angeles Unified School District GO, Series 2011 A-1, 4.00%, 7/1/17 | 1,000,000 | 1,063,790 | ||||
| Los Angeles Unified School District GO, Series 2011 A-1, 5.00%, 7/1/18 | 1,280,000 | 1,429,914 | ||||
| Los Angeles Unified School District GO, Series 2014 B, 5.00%, 7/1/18 | 2,000,000 | 2,234,240 | ||||
| Los Angeles Unified School District GO, Series 2014 C, 5.00%, 7/1/30 | 690,000 | 810,991 | ||||
| M-S-R Energy Authority Rev., Series 2009 A, 7.00%, 11/1/34 (GA: Citigroup, Inc.) | 1,000,000 | 1,367,650 | ||||
| M-S-R Energy Authority Rev., Series 2009 B, 7.00%, 11/1/34 (GA: Citigroup, Inc.) | 880,000 | 1,203,532 | ||||
| M-S-R Energy Authority Rev., Series 2009 B, 6.50%, 11/1/39 (GA: Citigroup, Inc.) | 425,000 | 558,480 | ||||
Manhattan Beach Unified School District GO, Capital Appreciation, Series 2009 A, (Election of 2008), 0.00%, 9/1/29(1) | 5,905,000 | 3,770,520 | ||||
| Modesto Irrigation District COP, Series 2009 A, 5.75%, 10/1/34 | 2,500,000 | 2,830,475 | ||||
| Mount San Antonio Community College District GO, Series 2013 A, (Election of 2008), 5.00%, 8/1/34 | 1,000,000 | 1,150,620 | ||||
| New Haven Unified School District GO, 12.00%, 8/1/18 (AGM) | 880,000 | 1,158,643 | ||||
Newport Beach Rev., Series 2011 A, (Hoag Memorial Hospital Presbyterian), 6.00%, 12/1/21, Prerefunded at 100% of Par(2) | 1,000,000 | 1,258,010 | ||||
| North Lake Tahoe Public Financing Authority Rev., 5.00%, 12/1/21 | 500,000 | 590,810 | ||||
| Oakland Unified School District Alameda County GO, Series 2012 A, (Election of 2006), 5.50%, 8/1/32 | 1,000,000 | 1,131,730 | ||||
| Oakland Unified School District Alameda County GO, Series 2013, (Election of 2012), 6.625%, 8/1/38 | 460,000 | 561,269 | ||||
15
| Principal Amount | Value | |||||
| Oakland Unified School District Alameda County GO, Series 2015 A, 5.00%, 8/1/40 | $ | 450,000 | $ | 491,148 | ||
| Ontario Public Financing Authority Rev., 5.00%, 7/1/43 | 1,000,000 | 1,122,330 | ||||
| Orange County Sanitation District Rev., Series 2014 B, 4.00%, 11/15/16 | 2,000,000 | 2,084,020 | ||||
| Orange County Transportation Authority Rev., (Senior Lien), 5.00%, 8/15/25 | 1,000,000 | 1,188,390 | ||||
| Oxnard Financing Authority Rev., 5.00%, 6/1/32 (AGM) | 1,500,000 | 1,674,240 | ||||
| Oxnard Financing Authority Wastewater Rev., 5.00%, 6/1/33 (AGM) | 1,000,000 | 1,106,600 | ||||
Oxnard School District GO, Series 2015 D, (Election of 2012), 3.00%, 8/1/20 (AGM)(6) | 700,000 | 710,024 | ||||
| Palomar Pomerado Health Care District COP, 6.75%, 11/1/39 | 500,000 | 547,335 | ||||
| Palomar Pomerado Health Care District COP, 6.00%, 11/1/41 | 750,000 | 796,327 | ||||
Palomar Pomerado Health GO, Capital Appreciation, Series 2009 A, (Election of 2004), 0.00%, 8/1/19 (AGC)(6) | 1,670,000 | 1,751,262 | ||||
Palos Verdes Peninsula Unified School District GO, Series 2009 R, (Election of 2005), 0.00%, 8/1/33(1) | 2,600,000 | 1,367,158 | ||||
Paramount Unified School District GO, Capital Appreciation, (Election of 2006), 0.00%, 8/1/51 (BAM)(1) | 7,500,000 | 768,075 | ||||
| Pomona Unified School District GO, Series 2000 A, 6.55%, 8/1/29 (NATL-RE) | 1,000,000 | 1,265,650 | ||||
| Pomona Unified School District GO, Series 2001 A, 6.15%, 8/1/30 (NATL-RE) | 855,000 | 1,028,249 | ||||
| Porterville Public Financing Authority Sewer Rev., 5.625%, 10/1/36 | 1,500,000 | 1,772,025 | ||||
Poway Unified School District GO, Capital Appreciation, (School Facilities Improvement), 0.00%, 8/1/41(1) | 2,110,000 | 665,051 | ||||
| Poway Unified School District Public Financing Authority Rev., 7.875%, 9/15/39 | 1,010,000 | 1,201,183 | ||||
| Rio Elementary School District Community Facilities District No. 1 Special Tax Rev., 5.00%, 9/1/30 | 645,000 | 702,502 | ||||
| Riverside County Asset Leasing Corp. Rev., Series 2013 A, (Public Defender and Probation Building), 5.00%, 11/1/43 | 1,000,000 | 1,087,180 | ||||
| Riverside County Redevelopment Agency Tax Allocation Rev., Series 2010 E, (Interstate 215 Corridor), 6.50%, 10/1/40 | 625,000 | 731,981 | ||||
| Sacramento County Airport System Rev., Series 2009 D, (Grant Revenue Bonds), 5.625%, 7/1/29 | 1,000,000 | 1,112,810 | ||||
| Sacramento County Sanitation Districts Financing Authority Rev., Series 2007 B, VRN, 0.72%, 9/1/15 (NATL-RE/FGIC) | 1,500,000 | 1,334,205 | ||||
| Saddleback Valley Unified School District Public Financing Authority Special Tax Rev., Series 1997 A, 6.00%, 9/1/16 (AGM) | 1,000,000 | 1,053,130 | ||||
San Bernardino Community College District GO, Capital Appreciation, Series 2009 B, (Election of 2008), 0.00%, 8/1/19(6) | 7,400,000 | 7,268,280 | ||||
| San Buenaventura Rev., (Community Memorial Health System), 7.50%, 12/1/41 | 1,350,000 | 1,642,639 | ||||
| San Diego Community College District GO, (Election of 2002), 5.00%, 8/1/25 | 500,000 | 601,505 | ||||
| San Diego County Regional Airport Authority Rev., Series 2010 A, 5.00%, 7/1/40 | 1,500,000 | 1,668,015 | ||||
| San Diego County Regional Airport Authority Rev., Series 2013 A, 5.00%, 7/1/43 | 1,000,000 | 1,110,630 | ||||
| San Diego County Water Authority Rev., Series 2011 S-1, (Subordinate Lien), 5.00%, 7/1/16 | 1,665,000 | 1,725,373 | ||||
| San Diego Public Facilities Financing Authority Lease Rev., Series 2015 A, (Capital Improvement Projects), 5.00%, 10/15/44 | 1,300,000 | 1,425,437 | ||||
| San Diego Public Facilities Financing Authority Sewer Rev., Series 2009 A, 5.25%, 5/15/34 | 2,000,000 | 2,265,680 | ||||
16
| Principal Amount | Value | |||||
| San Diego Public Facilities Financing Authority Water Rev., Series 2012 A, 5.00%, 8/1/30 | $ | 2,000,000 | $ | 2,299,300 | ||
| San Diego Unified Port District Rev., Series 2013 A, 5.00%, 9/1/24 | 500,000 | 591,710 | ||||
San Diego Unified School District GO, Capital Appreciation, Series 2010 C, (Election of 2008), 0.00%, 7/1/44(1) | 2,880,000 | 824,573 | ||||
San Diego Unified School District GO, Capital Appreciation, Series 2012 E, (Election of 2008), 0.00%, 7/1/49(1) | 1,000,000 | 228,210 | ||||
| San Francisco City and County Airports Commission Rev., Series 2009 E, (San Francisco International Airport), 5.25%, 5/1/23 | 3,000,000 | 3,419,400 | ||||
| San Francisco City and County Airports Commission Rev., Series 2010 F, (San Francisco International Airport), 5.00%, 5/1/40 | 2,150,000 | 2,348,208 | ||||
| San Francisco City and County COP, Series 2009 A, (Multiple Capital Improvement Projects), 5.00%, 4/1/29 | 1,170,000 | 1,312,518 | ||||
| San Francisco City and County Public Utilities Commission Rev., Series 2011 A, 5.00%, 11/1/41 | 1,000,000 | 1,127,450 | ||||
| San Francisco City and County Public Utilities Commission Rev., Series 2015 A, 5.00%, 11/1/45 | 1,000,000 | 1,123,820 | ||||
| San Francisco City and County Redevelopment Financing Authority Tax Allocation Rev., Series 2011 D, (Mission Bay South Redevelopment), 6.625%, 8/1/27 | 500,000 | 607,485 | ||||
| San Francisco City and County Successor Agency Tax Allocation Rev., Series 2014 A, (Mission Bay South Redevelopment), 5.00%, 8/1/31 | 400,000 | 446,580 | ||||
| San Francisco City and County Successor Agency Tax Allocation Rev., Series 2014 A, (Mission Bay South Redevelopment), 5.00%, 8/1/43 | 500,000 | 543,820 | ||||
| San Joaquin Hills Transportation Corridor Agency Rev., (Senior Lien), 5.00%, 1/15/34 | 1,000,000 | 1,082,350 | ||||
| San Joaquin Hills Transportation Corridor Agency Rev., (Senior Lien), 5.00%, 1/15/44 | 1,000,000 | 1,060,610 | ||||
| San Joaquin Hills Transportation Corridor Agency Rev., Series 2014 B, (Junior Lien), 5.25%, 1/15/44 | 1,000,000 | 1,079,800 | ||||
| San Mateo Special Tax Rev., (Community Facilities District No. 2008-1-Bay Meadows), 5.875%, 9/1/32 | 685,000 | 780,592 | ||||
| San Mateo Special Tax Rev., (Community Facilities District No. 2008-1-Bay Meadows), 5.50%, 9/1/44 | 750,000 | 825,787 | ||||
| Santa Clara Electric Rev., Series 2011 A, 5.00%, 7/1/30 | 500,000 | 551,160 | ||||
| Santa Cruz County Redevelopment Successor Agency Tax Allocation Rev., Series 2015 A, 5.00%, 9/1/35 (AGM) | 1,500,000 | 1,696,590 | ||||
| Santa Monica Redevelopment Agency Tax Allocation, (Earthquake Recovery Redevelopment), 5.00%, 7/1/42 | 400,000 | 435,796 | ||||
| Santa Monica Redevelopment Agency Tax Allocation, (Earthquake Recovery Redevelopment), 5.875%, 7/1/42 | 400,000 | 475,348 | ||||
Santa Rosa Wastewater Rev., Capital Appreciation, Series 2002 B, 0.00%, 9/1/24 (Ambac)(1) | 2,000,000 | 1,542,300 | ||||
| South Placer Wastewater Authority Rev., VRN, 0.35%, 9/3/15 | 1,650,000 | 1,638,334 | ||||
| Southern California Public Power Authority Rev., Series 2013 A, (Southern Transmission), 5.00%, 7/1/17 | 1,050,000 | 1,136,110 | ||||
| Stockton Public Financing Authority Rev., Series 2010 A, (Delta Water Supply Project), 6.25%, 10/1/40 | 750,000 | 895,845 | ||||
| Stockton Public Financing Authority Wastewater Rev., 5.00%, 9/1/27 (BAM) | 1,000,000 | 1,160,710 | ||||
| Stockton Unified School District GO, Series 2014 A, (Election of 2012), 5.00%, 8/1/42 (AGM) | 430,000 | 477,635 | ||||
| Successor Agency to the Redevelopment Agency of the City of Cathedral City Tax Allocation Rev., Series 2014 A, (Merged Redevelopment Project Area), 5.00%, 8/1/28 (AGM) | 1,190,000 | 1,356,064 | ||||
17
| Principal Amount | Value | |||||
| Successor Agency to the Richmond County Redevelopment Agency Tax Allocation Rev., Series 2014 A, 5.00%, 9/1/19 (BAM) | $ | 110,000 | $ | 124,281 | ||
| Successor Agency to the Richmond County Redevelopment Agency Tax Allocation Rev., Series 2014 A, 5.00%, 9/1/20 (BAM) | 70,000 | 80,447 | ||||
| Successor Agency to the Richmond County Redevelopment Agency Tax Allocation Rev., Series 2014 A, 5.00%, 9/1/21 (BAM) | 250,000 | 289,753 | ||||
| Successor Agency to the Richmond County Redevelopment Agency Tax Allocation Rev., Series 2014 A, 5.00%, 9/1/22 (BAM) | 200,000 | 233,976 | ||||
| Successor Agency to the Richmond County Redevelopment Agency Tax Allocation Rev., Series 2014 A, 5.00%, 9/1/23 (BAM) | 200,000 | 234,468 | ||||
| Successor Agency to the Richmond County Redevelopment Agency Tax Allocation Rev., Series 2014 A, 5.00%, 9/1/24 (BAM) | 65,000 | 76,231 | ||||
| Successor Agency to the Richmond County Redevelopment Agency Tax Allocation Rev., Series 2014 A, 4.50%, 9/1/25 (BAM) | 25,000 | 28,106 | ||||
| Successor Agency to the Richmond County Redevelopment Agency Tax Allocation Rev., Series 2014 A, 5.00%, 9/1/25 (BAM) | 25,000 | 29,111 | ||||
| Susanville Public Financing Authority Rev., Series 2010 B, (Utility Enterprises), 6.00%, 6/1/45 | 1,000,000 | 1,116,390 | ||||
| Taft Public Financing Authority Lease Rev., Series 1997 A, (Community Correctional Facility Acquisition), 6.05%, 1/1/17 | 745,000 | 747,898 | ||||
| Tobacco Securitization Authority of Southern California Settlement Rev., Series 2006 A-1, 5.00%, 6/1/37 | 500,000 | 433,220 | ||||
| Tuolumne Wind Project Authority Rev., Series 2009 A, 5.625%, 1/1/29 | 1,200,000 | 1,363,272 | ||||
| Tustin Unified School District Special Tax Rev., (Community Facilities District No. 06-1), 6.00%, 9/1/40 | 2,000,000 | 2,303,360 | ||||
| University of California Rev., Series 2013 AF, 5.00%, 5/15/25 | 1,000,000 | 1,202,680 | ||||
| University of California Rev., Series 2013 AK, VRDN, 5.00%, 5/15/23 | 2,000,000 | 2,427,960 | ||||
| Val Verde Unified School District COP, Series 2015 A, 5.00%, 8/1/35 (BAM) | 675,000 | 762,217 | ||||
Ventura County Community College District GO, Series 2008 C, (Election of 2002), 5.50%, 8/1/18, Prerefunded at 100% of Par(2) | 3,000,000 | 3,401,910 | ||||
Yosemite Community College District GO, Capital Appreciation, Series 2010 D, (Election of 2004), 0.00%, 8/1/38(1) | 3,000,000 | 1,102,800 | ||||
| 335,391,968 | ||||||
| Guam — 1.0% | ||||||
Guam Government GO, Series 2009 A, 6.75%, 11/15/29, Prerefunded at 100% of Par(2) | 900,000 | 1,093,698 | ||||
| Guam Power Authority Rev., Series 2010 A, 5.50%, 10/1/40 | 2,150,000 | 2,371,751 | ||||
| 3,465,449 | ||||||
TOTAL INVESTMENT SECURITIES — 98.7% (Cost $306,716,323) | 338,857,417 | |||||
| OTHER ASSETS AND LIABILITIES — 1.3% | 4,316,086 | |||||
| TOTAL NET ASSETS — 100.0% | $ | 343,173,503 | ||||
| FUTURES CONTRACTS | ||||||||||
| Contracts Sold | Expiration Date | Underlying Face Amount at Value | Unrealized Appreciation (Depreciation) | |||||||
| 5 | U.S. Treasury Long Bonds | December 2015 | $ | 773,125 | $ | 5,926 | ||||
| 9 | U.S. Treasury Ultra Long Bonds | December 2015 | 1,425,656 | 10,949 | ||||||
| $ | 2,198,781 | $ | 16,875 | |||||||
18
| NOTES TO SCHEDULE OF INVESTMENTS | ||
| AGC | - | Assured Guaranty Corporation |
| AGM | - | Assured Guaranty Municipal Corporation |
| BAM | - | Build America Mutual Assurance Company |
| COP | - | Certificates of Participation |
| FGIC | - | Financial Guaranty Insurance Company |
| GA | - | Guaranty Agreement |
| GO | - | General Obligation |
| LOC | - | Letter of Credit |
| NATL-RE | - | National Public Finance Guarantee Corporation - Reinsured |
| VRDN | - | Variable Rate Demand Note. Interest reset date is indicated. Rate shown is effective at the period end. |
| VRN | - | Variable Rate Note. Interest reset date is indicated. Rate shown is effective at the period end. |
| (1) | Security is a zero-coupon bond. Zero-coupon securities are issued at a substantial discount from their value at maturity. |
| (2) | Escrowed to maturity in U.S. government securities or state and local government securities. |
| (3) | Security, or a portion thereof, has been pledged at the custodian bank or with a broker for margin requirements on futures contracts. At the period end, the aggregate value of securities pledged was $72,399. |
| (4) | When-issued security. The issue price and yield are fixed on the date of the commitment, but payment and delivery are scheduled for a future date. |
| (5) | Restricted security exempt from registration pursuant to Rule 144A under the Securities Act of 1933. These securities may be sold without restriction to qualified institutional investors and have been deemed liquid under policies approved by the Board of Trustees. The aggregate value of these securities at the period end was $1,740,688, which represented 0.5% of total net assets. |
| (6) | Coupon rate adjusts periodically based upon a predetermined schedule. Interest reset date is indicated. Rate shown is effective at the period end. |
See Notes to Financial Statements.
19
| Statement of Assets and Liabilities |
| AUGUST 31, 2015 | |||
| Assets | |||
| Investment securities, at value (cost of $306,716,323) | $ | 338,857,417 | |
| Cash | 2,150,065 | ||
| Receivable for capital shares sold | 42,612 | ||
| Receivable for variation margin on futures contracts | 8,313 | ||
| Interest receivable | 3,888,422 | ||
| 344,946,829 | |||
| Liabilities | |||
| Payable for investments purchased | 1,127,170 | ||
| Payable for capital shares redeemed | 288,540 | ||
| Accrued management fees | 135,583 | ||
| Distribution and service fees payable | 7,432 | ||
| Dividends payable | 214,601 | ||
| 1,773,326 | |||
| Net Assets | $ | 343,173,503 | |
| Net Assets Consist of: | |||
| Capital paid in | $ | 312,632,612 | |
| Accumulated net realized loss | (1,617,078 | ) | |
| Net unrealized appreciation | 32,157,969 | ||
| $ | 343,173,503 | ||
| Net Assets | Shares Outstanding | Net Asset Value Per Share | ||||
| Investor Class | $329,151,575 | 28,133,540 | $11.70 | |||
| Institutional Class | $301,045 | 25,731 | $11.70 | |||
| A Class | $6,654,894 | 568,903 | $11.70* | |||
| C Class | $7,065,989 | 603,878 | $11.70 | |||
*Maximum offering price $12.25 (net asset value divided by 0.955).
See Notes to Financial Statements.
20
| Statement of Operations |
| YEAR ENDED AUGUST 31, 2015 | |||
| Investment Income (Loss) | |||
| Income: | |||
| Interest | $ | 13,411,023 | |
| Expenses: | |||
| Management fees | 1,638,689 | ||
| Distribution and service fees: | |||
| A Class | 17,372 | ||
| C Class | 71,635 | ||
| Trustees' fees and expenses | 17,504 | ||
| Other expenses | 341 | ||
| 1,745,541 | |||
| Net investment income (loss) | 11,665,482 | ||
| Realized and Unrealized Gain (Loss) | |||
| Net realized gain (loss) on: | |||
| Investment transactions | 153,627 | ||
| Futures contract transactions | (473,245 | ) | |
| (319,618 | ) | ||
| Change in net unrealized appreciation (depreciation) on: | |||
| Investments | (1,659,353 | ) | |
| Futures contracts | 72,365 | ||
| (1,586,988 | ) | ||
| Net realized and unrealized gain (loss) | (1,906,606 | ) | |
| Net Increase (Decrease) in Net Assets Resulting from Operations | $ | 9,758,876 | |
See Notes to Financial Statements.
21
| Statement of Changes in Net Assets |
| YEARS ENDED AUGUST 31, 2015 AND AUGUST 31, 2014 | ||||||
| Increase (Decrease) in Net Assets | August 31, 2015 | August 31, 2014 | ||||
| Operations | ||||||
| Net investment income (loss) | $ | 11,665,482 | $ | 11,823,725 | ||
| Net realized gain (loss) | (319,618 | ) | (408,332 | ) | ||
| Change in net unrealized appreciation (depreciation) | (1,586,988 | ) | 26,529,584 | |||
| Net increase (decrease) in net assets resulting from operations | 9,758,876 | 37,944,977 | ||||
| Distributions to Shareholders | ||||||
| From net investment income: | ||||||
| Investor Class | (11,274,436 | ) | (11,420,347 | ) | ||
| Institutional Class | (9,947 | ) | (1,087 | ) | ||
| A Class | (213,905 | ) | (235,820 | ) | ||
| C Class | (167,194 | ) | (166,471 | ) | ||
| Decrease in net assets from distributions | (11,665,482 | ) | (11,823,725 | ) | ||
| Capital Share Transactions | ||||||
| Net increase (decrease) in net assets from capital share transactions (Note 5) | (14,190,101 | ) | (29,319,234 | ) | ||
| Net increase (decrease) in net assets | (16,096,707 | ) | (3,197,982 | ) | ||
| Net Assets | ||||||
| Beginning of period | 359,270,210 | 362,468,192 | ||||
| End of period | $ | 343,173,503 | $ | 359,270,210 | ||
See Notes to Financial Statements.
22
| Notes to Financial Statements |
AUGUST 31, 2015
1. Organization
American Century California Tax-Free and Municipal Funds (the trust) is registered under the Investment Company Act of 1940, as amended (the 1940 Act), as an open-end management investment company and is organized as a Massachusetts business trust. California Long-Term Tax-Free Fund (the fund) is one fund in a series issued by the trust. The fund is diversified as defined under the 1940 Act. The fund’s investment objectives are to seek safety of principal and high current income that is exempt from federal and California income taxes.
The fund offers the Investor Class, the Institutional Class, the A Class and the C Class. The A Class may incur an initial sales charge. The A Class and C Class may be subject to a contingent deferred sales charge. The share classes differ principally in their respective sales charges and distribution and shareholder servicing expenses and arrangements. The Institutional Class is made available to institutional shareholders or through financial intermediaries whose clients do not require the same level of shareholder and administrative services as shareholders of other classes. As a result, the Institutional Class is charged a lower unified management fee.
2. Significant Accounting Policies
The following is a summary of significant accounting policies consistently followed by the fund in preparation of its financial statements. The fund is an investment company and follows accounting and reporting guidance in accordance with accounting principles generally accepted in the United States of America. This may require management to make certain estimates and assumptions at the date of the financial statements. Actual results could differ from these estimates. Management evaluated the impact of events or transactions occurring through the date the financial statements were issued that would merit recognition or disclosure.
Investment Valuations — The fund determines the fair value of its investments and computes its net asset value per share at the close of regular trading (usually 4 p.m. Eastern time) on the New York Stock Exchange (NYSE) on each day the NYSE is open. The Board of Trustees has adopted valuation policies and procedures to guide the investment advisor in the fund’s investment valuation process and to provide methodologies for the oversight of the fund’s pricing function.
Fixed income securities maturing in greater than 60 days at the time of purchase are valued at the evaluated mean as provided by independent pricing services or at the mean of the most recent bid and asked prices as provided by investment dealers. Fixed income securities maturing within 60 days at the time of purchase may be valued at cost, plus or minus any amortized discount or premium or at the evaluated mean as provided by an independent pricing service. Evaluated mean prices are commonly derived through utilization of market models, which may consider, among other factors: trade data, quotations from dealers and active market makers, relevant yield curve and spread data, related sector levels, creditworthiness, trade data or market information on comparable securities, and other relevant security specific information.
Exchange-traded futures contracts are valued at the settlement price as provided by the appropriate clearing corporation.
If the fund determines that the market price for an investment is not readily available or the valuation methods mentioned above do not reflect an investment’s fair value, such investment is valued as determined in good faith by the Board of Trustees or its delegate, in accordance with policies and procedures adopted by the Board of Trustees. In its determination of fair value, the fund may review several factors including, but not limited to, market information regarding the specific investment or comparable investments and correlation with other investment types, futures indices or general market indicators. Circumstances that may cause the fund to use these procedures to value an investment include, but are not limited to: an investment has been declared in default or is distressed; trading in a security has been suspended during the trading day or a security is not actively trading on its principal exchange; prices received from a regular pricing source are deemed unreliable; or there is a foreign market holiday and no trading occurred.
The fund monitors for significant events occurring after the close of an investment’s primary exchange but before the fund’s net asset value per share is determined. Significant events may include, but are not limited to: corporate announcements and transactions; governmental action and political unrest that could impact a
23
specific investment or an investment sector; or armed conflicts, natural disasters and similar events that could affect investments in a specific country or region.
Security Transactions — Security transactions are accounted for as of the trade date. Net realized gains and losses are determined on the identified cost basis, which is also used for federal income tax purposes.
Investment Income — Interest income is recorded on the accrual basis and includes accretion of discounts and amortization of premiums.
Segregated Assets — In accordance with the 1940 Act, the fund segregates assets on its books and records to cover certain types of investments, including, but not limited to, futures contracts and when-issued securities. American Century Investment Management, Inc. (ACIM) (the investment advisor) monitors, on a daily basis, the securities segregated to ensure the fund designates a sufficient amount of liquid assets, marked-to-market daily. The fund may also receive assets or be required to pledge assets at the custodian bank or with a broker for margin requirements on futures contracts.
Income Tax Status — It is the fund’s policy to distribute substantially all net investment income and net realized gains to shareholders and to otherwise qualify as a regulated investment company under provisions of the Internal Revenue Code. Accordingly, no provision has been made for income taxes. The fund files U.S. federal, state, local and non-U.S. tax returns as applicable. The fund's tax returns are subject to examination by the relevant taxing authority until expiration of the applicable statute of limitations, which is generally three years from the date of filing but can be longer in certain jurisdictions. At this time, management believes there are no uncertain tax positions which, based on their technical merit, would not be sustained upon examination and for which it is reasonably possible that the total amounts of unrecognized tax benefits will significantly change in the next twelve months.
Multiple Class — All shares of the fund represent an equal pro rata interest in the net assets of the class to which such shares belong, and have identical voting, dividend, liquidation and other rights and the same terms and conditions, except for class specific expenses and exclusive rights to vote on matters affecting only individual classes. Income, non-class specific expenses, and realized and unrealized capital gains and losses of the fund are allocated to each class of shares based on their relative net assets.
Distributions to Shareholders — Distributions from net investment income, if any, are declared daily and paid monthly. Distributions from net realized gains, if any, are generally declared and paid annually.
Indemnifications — Under the trust’s organizational documents, its officers and trustees are indemnified against certain liabilities arising out of the performance of their duties to the fund. In addition, in the normal course of business, the fund enters into contracts that provide general indemnifications. The maximum exposure under these arrangements is unknown as this would involve future claims that may be made against a fund. The risk of material loss from such claims is considered by management to be remote.
3. Fees and Transactions with Related Parties
Certain officers and trustees of the trust are also officers and/or directors of American Century Companies, Inc. (ACC). The trust's investment advisor, ACIM, the trust's distributor, American Century Investment Services, Inc. (ACIS), and the trust's transfer agent, American Century Services, LLC, are wholly owned, directly or indirectly, by ACC.
Management Fees — The trust has entered into a management agreement with ACIM, under which ACIM provides the fund with investment advisory and management services in exchange for a single, unified management fee (the fee) per class. The agreement provides that all expenses of managing and operating the fund, except distribution and service fees, brokerage expenses, taxes, interest, fees and expenses of the independent trustees (including legal counsel fees), and extraordinary expenses, will be paid by ACIM. The fee is computed and accrued daily based on each class’s daily net assets and paid monthly in arrears. The fee consists of (1) an Investment Category Fee based on the daily net assets of the fund and certain other accounts managed by the investment advisor that are in the same broad investment category as the fund and (2) a Complex Fee based on the assets of all the funds in the American Century Investments family of funds. The rates for the Investment Category Fee range from 0.1625% to 0.2800%. The rates for the Complex Fee range from 0.2500% to 0.3100% for the Investor Class, A Class and C Class. The rates for the Complex Fee range from 0.0500% to 0.1100% for the Institutional Class. The effective annual management fee for each class for the year ended August 31, 2015 was 0.46% for the Investor Class, A Class and C Class and 0.26% for the Institutional Class.
24
Distribution and Service Fees — The Board of Trustees has adopted a separate Master Distribution and Individual Shareholder Services Plan for each of the A Class and C Class (collectively the plans), pursuant to Rule 12b-1 of the 1940 Act. The plans provide that the A Class will pay ACIS an annual distribution and service fee of 0.25%. The plans provide that the C Class will pay ACIS an annual distribution and service fee of 1.00%, of which 0.25% is paid for individual shareholder services and 0.75% is paid for distribution services. The fees are computed and accrued daily based on each class’s daily net assets and paid monthly in arrears. The fees are used to pay financial intermediaries for distribution and individual shareholder services. Fees incurred under the plans during the year ended August 31, 2015 are detailed in the Statement of Operations.
Trustees’ Fees and Expenses — The Board of Trustees is responsible for overseeing the investment advisor’s management and operations of the fund. The trustees receive detailed information about the fund and its investment advisor regularly throughout the year, and meet at least quarterly with management of the investment advisor to review reports about fund operations. The fund’s officers do not receive compensation from the fund.
4. Investment Transactions
Purchases and sales of investment securities, excluding short-term investments, for the year ended August 31, 2015 were $110,320,403 and $124,497,812, respectively.
5. Capital Share Transactions
Transactions in shares of the fund were as follows (unlimited number of shares authorized):
| Year ended August 31, 2015 | Year ended August 31, 2014 | |||||||||
| Shares | Amount | Shares | Amount | |||||||
| Investor Class | ||||||||||
| Sold | 1,043,154 | $ | 12,296,446 | 810,047 | $ | 9,260,925 | ||||
| Issued in reinvestment of distributions | 721,400 | 8,508,080 | 748,186 | 8,549,754 | ||||||
| Redeemed | (2,905,163 | ) | (34,174,882 | ) | (3,957,261 | ) | (44,883,445 | ) | ||
| (1,140,609 | ) | (13,370,356 | ) | (2,399,028 | ) | (27,072,766 | ) | |||
| Institutional Class | ||||||||||
| Sold | 22,124 | 259,950 | — | — | ||||||
| Issued in reinvestment of distributions | 843 | 9,947 | 94 | 1,087 | ||||||
| 22,967 | 269,897 | 94 | 1,087 | |||||||
| A Class | ||||||||||
| Sold | 51,183 | 601,935 | 65,096 | 758,402 | ||||||
| Issued in reinvestment of distributions | 17,971 | 211,962 | 19,845 | 226,631 | ||||||
| Redeemed | (161,544 | ) | (1,910,307 | ) | (207,496 | ) | (2,337,854 | ) | ||
| (92,390 | ) | (1,096,410 | ) | (122,555 | ) | (1,352,821 | ) | |||
| C Class | ||||||||||
| Sold | 44,530 | 529,113 | 66,577 | 752,167 | ||||||
| Issued in reinvestment of distributions | 8,302 | 97,919 | 8,434 | 96,390 | ||||||
| Redeemed | (52,774 | ) | (620,264 | ) | (154,263 | ) | (1,743,291 | ) | ||
| 58 | 6,768 | (79,252 | ) | (894,734 | ) | |||||
| Net increase (decrease) | (1,209,974 | ) | $ | (14,190,101 | ) | (2,600,741 | ) | $ | (29,319,234 | ) |
25
6. Fair Value Measurements
The fund’s investments valuation process is based on several considerations and may use multiple inputs to determine the fair value of the investments held by the fund. In conformity with accounting principles generally accepted in the United States of America, the inputs used to determine a valuation are classified into three broad levels.
| • | Level 1 valuation inputs consist of unadjusted quoted prices in an active market for identical investments. |
| • | Level 2 valuation inputs consist of direct or indirect observable market data (including quoted prices for comparable investments, evaluations of subsequent market events, interest rates, prepayment speeds, credit risk, etc.). These inputs also consist of quoted prices for identical investments initially expressed in local currencies that are adjusted through translation into U.S. dollars. |
| • | Level 3 valuation inputs consist of unobservable data (including a fund’s own assumptions). |
The level classification is based on the lowest level input that is significant to the fair valuation measurement. The valuation inputs are not necessarily an indication of the risks associated with investing in these securities or other financial instruments. There were no significant transfers between levels during the period.
As of period end, the fund’s investment securities and unrealized appreciation (depreciation) on futures contracts were classified as Level 2 and Level 1, respectively. The Schedule of Investments provides additional information on the fund’s portfolio holdings.
7. Derivative Instruments
Interest Rate Risk — The fund is subject to interest rate risk in the normal course of pursuing its investment objectives. The value of bonds generally declines as interest rates rise. A fund may enter into futures contracts based on a bond index or a specific underlying security. A fund may purchase futures contracts to gain exposure to increases in market value or sell futures contracts to protect against a decline in market value. Upon entering into a futures contract, a fund will segregate cash, cash equivalents or other appropriate liquid securities on its records in amounts sufficient to meet requirements. Subsequent payments (variation margin) are made or received daily, in cash, by a fund. The variation margin is equal to the daily change in the contract value and is recorded as unrealized gains and losses. A fund recognizes a realized gain or loss when the futures contract is closed or expires. Net realized and unrealized gains or losses occurring during the holding period of futures contracts are a component of net realized gain (loss) on futures contract transactions and change in net unrealized appreciation (depreciation) on futures contracts, respectively. One of the risks of entering into futures contracts is the possibility that the change in value of the contract may not correlate with the changes in value of the underlying securities. The fund's average exposure to interest rate risk derivative instruments held during the period was 85 contracts.
The value of interest rate risk derivative instruments as of August 31, 2015, is disclosed on the Statement of Assets and Liabilities as an asset of $8,313 in receivable for variation margin on futures contracts.* For the year ended August 31, 2015, the effect of interest rate risk derivative instruments on the Statement of Operations was $(473,245) in net realized gain (loss) on futures contract transactions and $72,365 in change in net unrealized appreciation (depreciation) on futures contracts.
* Included in the unrealized appreciation (depreciation) on futures contracts as reported in the Schedule of Investments.
8. Risk Factors
The fund concentrates its investments in a single state and therefore may have more exposure to credit risk related to the state of California than a fund with a broader geographical diversification.
26
9. Federal Tax Information
The tax character of distributions paid during the years ended August 31, 2015 and August 31, 2014 were as follows:
| 2015 | 2014 | |||||
| Distributions Paid From | ||||||
| Exempt income | $ | 11,664,699 | $ | 11,823,725 | ||
| Taxable ordinary income | $ | 783 | — | |||
| Long-term capital gains | — | — | ||||
The book-basis character of distributions made during the year from net investment income or net realized gains may differ from their ultimate characterization for federal income tax purposes. These differences reflect the differing character of certain income items and net realized gains and losses for financial statement and tax purposes, and may result in reclassification among certain capital accounts on the financial statements.
As of August 31, 2015, the federal tax cost of investments and the components of distributable earnings on a tax-basis were as follows:
| Federal tax cost of investments | $ | 306,716,323 | |
| Gross tax appreciation of investments | $ | 32,352,056 | |
| Gross tax depreciation of investments | (210,962 | ) | |
| Net tax appreciation (depreciation) of investments | 32,141,094 | ||
| Net tax appreciation (depreciation) on derivatives | — | ||
| Net tax appreciation (depreciation) | $ | 32,141,094 | |
| Other book-to-tax adjustments | $ | (40,241 | ) |
| Undistributed exempt income | — | ||
| Accumulated short-term capital losses | $ | (1,442,386 | ) |
| Accumulated long-term capital losses | $ | (117,576 | ) |
The cost of investments for federal income tax purposes was the same as the cost for financial reporting purposes. The difference between book-basis and tax-basis unrealized appreciation (depreciation) is attributable primarily to the realization for tax purposes of unrealized gains (losses) on futures contracts. Other book-to-tax adjustments are attributable primarily to the tax deferral of losses on straddle positions.
Accumulated capital losses represent net capital loss carryovers that may be used to offset future realized capital gains for federal income tax purposes. Any unlimited losses will be required to be utilized prior to the losses which carry an expiration date. Future capital loss carryover utilization in any given year may be subject to Internal Revenue Code limitations. Capital loss carryovers expire as follows:
| 2019 | Unlimited (Short-Term) | Unlimited (Long-Term) |
| $(457,823) | $(984,563) | $(117,576) |
27
| Financial Highlights |
| For a Share Outstanding Throughout the Years Ended August 31 (except as noted) | |||||||||||||
| Per-Share Data | Ratios and Supplemental Data | ||||||||||||
| Income From Investment Operations: | Ratio to Average Net Assets of: | ||||||||||||
Net Asset Value, Beginning of Period | Net Investment Income (Loss)(1) | Net Realized and Unrealized Gain (Loss) | Total From Investment Operations | Distributions From Net Investment Income | Net Asset Value, End of Period | Total Return(2) | Operating Expenses | Net Investment Income (Loss) | Portfolio Turnover Rate | Net Assets, End of Period (in thousands) | |||
| Investor Class | |||||||||||||
| 2015 | $11.76 | 0.39 | (0.06) | 0.33 | (0.39) | $11.70 | 2.86% | 0.47% | 3.33% | 31% | $329,152 | ||
| 2014 | $10.94 | 0.38 | 0.82 | 1.20 | (0.38) | $11.76 | 11.10% | 0.47% | 3.32% | 46% | $344,356 | ||
| 2013 | $11.70 | 0.37 | (0.76) | (0.39) | (0.37) | $10.94 | (3.45)% | 0.47% | 3.19% | 44% | $346,396 | ||
| 2012 | $10.94 | 0.41 | 0.77 | 1.18 | (0.42) | $11.70 | 10.92% | 0.47% | 3.65% | 76% | $412,713 | ||
| 2011 | $11.20 | 0.47 | (0.27) | 0.20 | (0.46) | $10.94 | 2.02% | 0.48% | 4.38% | 63% | $379,586 | ||
| Institutional Class | |||||||||||||
| 2015 | $11.77 | 0.42 | (0.07) | 0.35 | (0.42) | $11.70 | 2.97% | 0.27% | 3.53% | 31% | $301 | ||
| 2014 | $10.94 | 0.40 | 0.83 | 1.23 | (0.40) | $11.77 | 11.42% | 0.27% | 3.52% | 46% | $33 | ||
| 2013 | $11.70 | 0.40 | (0.76) | (0.36) | (0.40) | $10.94 | (3.26)% | 0.27% | 3.39% | 44% | $29 | ||
| 2012 | $10.94 | 0.44 | 0.76 | 1.20 | (0.44) | $11.70 | 11.14% | 0.27% | 3.85% | 76% | $30 | ||
| 2011 | $11.20 | 0.49 | (0.26) | 0.23 | (0.49) | $10.94 | 2.22% | 0.28% | 4.58% | 63% | $27 | ||
28
| For a Share Outstanding Throughout the Years Ended August 31 (except as noted) | |||||||||||||
| Per-Share Data | Ratios and Supplemental Data | ||||||||||||
| Income From Investment Operations: | Ratio to Average Net Assets of: | ||||||||||||
Net Asset Value, Beginning of Period | Net Investment Income (Loss)(1) | Net Realized and Unrealized Gain (Loss) | Total From Investment Operations | Distributions From Net Investment Income | Net Asset Value, End of Period | Total Return(2) | Operating Expenses | Net Investment Income (Loss) | Portfolio Turnover Rate | Net Assets, End of Period (in thousands) | |||
| A Class | |||||||||||||
| 2015 | $11.76 | 0.36 | (0.06) | 0.30 | (0.36) | $11.70 | 2.60% | 0.72% | 3.08% | 31% | $6,655 | ||
| 2014 | $10.94 | 0.35 | 0.82 | 1.17 | (0.35) | $11.76 | 10.83% | 0.72% | 3.07% | 46% | $7,778 | ||
| 2013 | $11.70 | 0.34 | (0.76) | (0.42) | (0.34) | $10.94 | (3.70)% | 0.72% | 2.94% | 44% | $8,572 | ||
| 2012 | $10.94 | 0.38 | 0.77 | 1.15 | (0.39) | $11.70 | 10.64% | 0.72% | 3.40% | 76% | $16,214 | ||
| 2011 | $11.20 | 0.44 | (0.26) | 0.18 | (0.44) | $10.94 | 1.77% | 0.73% | 4.13% | 63% | $11,044 | ||
| C Class | |||||||||||||
| 2015 | $11.76 | 0.28 | (0.06) | 0.22 | (0.28) | $11.70 | 1.83% | 1.47% | 2.33% | 31% | $7,066 | ||
| 2014 | $10.94 | 0.26 | 0.82 | 1.08 | (0.26) | $11.76 | 10.00% | 1.47% | 2.32% | 46% | $7,104 | ||
| 2013 | $11.70 | 0.26 | (0.76) | (0.50) | (0.26) | $10.94 | (4.41)% | 1.47% | 2.19% | 44% | $7,471 | ||
| 2012 | $10.94 | 0.30 | 0.76 | 1.06 | (0.30) | $11.70 | 9.82% | 1.47% | 2.65% | 76% | $11,321 | ||
| 2011 | $11.20 | 0.36 | (0.26) | 0.10 | (0.36) | $10.94 | 1.01% | 1.48% | 3.38% | 63% | $7,120 | ||
| Notes to Financial Highlights |
| (1) | Computed using average shares outstanding throughout the period. |
| (2) | Total returns are calculated based on the net asset value of the last business day and do not reflect applicable sales charges, if any. Total returns for periods less than one year are not annualized. |
See Notes to Financial Statements.
29
| Report of Independent Registered Public Accounting Firm |
To the Trustees of the American Century California Tax-Free and Municipal Funds and Shareholders of the California Long-Term Tax-Free Fund:
In our opinion, the accompanying statement of assets and liabilities, including the schedule of investments, and the related statements of operations and of changes in net assets and the financial highlights present fairly, in all material respects, the financial position of the California Long-Term Tax-Free Fund (one of the four funds in the American Century California Tax-Free and Municipal Funds, hereafter referred to as the "Fund") at August 31, 2015, the results of its operations for the year then ended, the changes in its net assets for each of the two years in the period then ended and the financial highlights for each of the five years in the period then ended, in conformity with accounting principles generally accepted in the United States of America. These financial statements and financial highlights (hereafter referred to as "financial statements") are the responsibility of the Fund's management. Our responsibility is to express an opinion on these financial statements based on our audits. We conducted our audits of these financial statements in accordance with the standards of the Public Company Accounting Oversight Board (United States). Those standards require that we plan and perform the audit to obtain reasonable assurance about whether the financial statements are free of material misstatement. An audit includes examining, on a test basis, evidence supporting the amounts and disclosures in the financial statements, assessing the accounting principles used and significant estimates made by management, and evaluating the overall financial statement presentation. We believe that our audits, which included confirmation of securities at August 31, 2015 by correspondence with the custodian and brokers, provide a reasonable basis for our opinion.
PricewaterhouseCoopers LLP
Kansas City, Missouri
October 21, 2015
30
| Management |
Board of Trustees
The individuals listed below serve as trustees of the funds. Each trustee will continue to serve in this capacity until death, retirement, resignation or removal from office. The board has adopted a mandatory retirement age for trustees who are not “interested persons,” as that term is defined in the Investment Company Act (independent trustees). Independent trustees shall retire on December 31 of the year in which they reach their 75th birthday; provided, however, that on or after January 1, 2022, independent trustees shall retire on December 31 of the year in which they reach their 76th birthday.
Mr. Thomas is an “interested person” because he currently serves as President and Chief Executive Officer of American Century Companies, Inc. (ACC), the parent company of American Century Investment Management, Inc. (ACIM or the advisor). The other trustees (more than three-fourths of the total number) are independent. They are not employees, directors or officers of, and have no financial interest in, ACC or any of its wholly owned, direct or indirect, subsidiaries, including ACIM, American Century Investment Services, Inc. (ACIS) and American Century Services, LLC (ACS), and they do not have any other affiliations, positions or relationships that would cause them to be considered “interested persons” under the Investment Company Act. The trustees serve in this capacity for eight (in the case of Mr. Thomas, 15) registered investment companies in the American Century Investments family of funds.
The following table presents additional information about the trustees. The mailing address for each trustee other than Mr. Thomas is 1665 Charleston Road, Mountain View, California 94043. The mailing address for Mr. Thomas is 4500 Main Street, Kansas City, Missouri 64111.
Name (Year of Birth) | Position(s) Held with Funds | Length of Time Served | Principal Occupation(s) During Past 5 Years | Number of American Century Portfolios Overseen by Trustee | Other Directorships Held During Past 5 Years |
| Independent Trustees | |||||
| Tanya S. Beder (1955) | Trustee | Since 2011 | Chairman and CEO, SBCC Group Inc. (independent advisory services) (2006 to present) | 46 | CYS Investments, Inc. (NYSE mortgage arbitrage REIT) |
| Jeremy I. Bulow (1954) | Trustee | Since 2011 | Professor of Economics, Stanford University, Graduate School of Business (1979 to present) | 46 | None |
| Ronald J. Gilson (1946) | Trustee and Chairman of the Board | Since 1995 (Chairman since 2005) | Charles J. Meyers Professor of Law and Business, Stanford Law School (1979 to present); Marc and Eva Stern Professor of Law and Business, Columbia University School of Law (1992 to present) | 46 | None |
| Frederick L. A. Grauer (1946) | Trustee | Since 2008 | Senior Advisor, BlackRock, Inc. (investment management firm) (2010 to 2011, 2013 to present) | 46 | None |
| Peter F. Pervere (1947) | Trustee | Since 2007 | Retired | 46 | None |
31
Name (Year of Birth) | Position(s) Held with Funds | Length of Time Served | Principal Occupation(s) During Past 5 Years | Number of American Century Portfolios Overseen by Trustee | Other Directorships Held During Past 5 Years |
| Independent Trustee | |||||
| John B. Shoven (1947) | Trustee | Since 2002 | Professor of Economics, Stanford University (1973 to present) | 46 | Cadence Design Systems; Exponent; Financial Engines |
| Interested Trustee | |||||
| Jonathan S. Thomas (1963) | Trustee and President | Since 2007 | President and Chief Executive Officer, ACC (March 2007 to present). Also serves as Chief Executive Officer, ACS; Executive Vice President, ACIM; Director, ACC, ACIM and other ACC subsidiaries | 124 | BioMed Valley Discoveries, Inc. |
The Statement of Additional Information has additional information about the fund's trustees and is available without charge, upon request, by calling 1-800-345-2021.
32
Officers
The following table presents certain information about the executive officers of the funds. Each officer serves as an officer for each of the 15 investment companies in the American Century family of funds, unless otherwise noted. No officer is compensated for his or her service as an officer of the funds. The listed officers are interested persons of the funds and are appointed or re-appointed on an annual basis. The mailing address for each of the officers listed below is 4500 Main Street, Kansas City, Missouri 64111.
Name (Year of Birth) | Offices with the Funds | Principal Occupation(s) During the Past Five Years |
| Jonathan S. Thomas (1963) | Trustee and President since 2007 | President and Chief Executive Officer, ACC (March 2007 to present). Also serves as Chief Executive Officer, ACS; Executive Vice President, ACIM; Director, ACC, ACIM and other ACC subsidiaries |
| Amy D. Shelton (1964) | Chief Compliance Officer and Vice President since 2014 | Chief Compliance Officer, American Century funds, (March 2014 to present); Chief Compliance Officer, ACIM (February 2014 to present); Chief Compliance Officer, ACIS (October 2009 to present); Vice President, Client Interactions and Marketing, ACIS (February 2013 to January 2014); Director, Client Interactions and Marketing, ACIS (June 2007 to January 2013). Also serves as Vice President, ACIS |
| Charles A. Etherington (1957) | General Counsel since 2007 and Senior Vice President since 2006 | Attorney, ACC (February 1994 to present); Vice President, ACC (November 2005 to present); General Counsel, ACC (March 2007 to present). Also serves as General Counsel, ACIM, ACS, ACIS and other ACC subsidiaries; and Senior Vice President, ACIM and ACS |
| C. Jean Wade (1964) | Vice President, Treasurer and Chief Financial Officer since 2012 | Vice President, ACS (February 2000 to present) |
| Robert J. Leach (1966) | Vice President since 2006 and Assistant Treasurer since 2012 | Vice President, ACS (February 2000 to present) |
| David H. Reinmiller (1963) | Vice President since 2001 | Attorney, ACC (January 1994 to present); Associate General Counsel, ACC (January 2001 to present). Also serves as Vice President, ACIM and ACS |
| Ward D. Stauffer (1960) | Secretary since 2005 | Attorney, ACC (June 2003 to present) |
33
| Approval of Management Agreement |
At a meeting held on June 16, 2015, the Fund’s Board of Trustees unanimously approved the renewal of the management agreement pursuant to which American Century Investment Management, Inc. (the “Advisor”) acts as the investment advisor for the Fund. Under Section 15(c) of the Investment Company Act, contracts for investment advisory services are required to be reviewed, evaluated, and approved by a majority of a fund’s directors/trustees, including a majority of the independent Trustees, each year. The Board regards this annual evaluation and renewal as one of its most important responsibilities.
The independent Trustees have memorialized a statement regarding the relationship between their ongoing obligations to oversee and evaluate the performance of the Advisor and their annual consideration of renewal of the management agreement. In that statement, the independent Trustees noted that their assessment of the Advisor’s performance is an ongoing process that takes place over the entire year and is informed by all of the extensive information that the Board and its committees receive and consider over time. This information, together with the materials provided in connection with the review, are central to the Board’s assessment of the Advisor’s performance and its determination whether to renew the Fund’s management agreement.
Prior to its consideration of the renewal of the management agreement, the Board requested and reviewed extensive data and analysis relating to the proposed renewal. This information and analysis was compiled by the Advisor and certain independent providers of evaluation data concerning the Fund and the services provided to the Fund by the Advisor.
In connection with its consideration of the renewal of the management agreement, the Board’s review and evaluation of the services provided by the Advisor included, but was not limited to, the following:
| • | the nature, extent, and quality of investment management, shareholder services, and other services provided by the Advisor to the Fund; |
| • | the wide range of other programs and services the Advisor provides to the Fund and its shareholders on a routine and non-routine basis; |
| • | the investment performance of the Fund, including data comparing the Fund’s performance to appropriate benchmarks and/or a peer group of other mutual funds with similar investment objectives and strategies; |
| • | the cost of owning the Fund compared to the cost of owning similar funds; |
| • | the Advisor’s compliance policies, procedures, and regulatory experience; |
| • | financial data showing the cost of services provided to the Fund, the profitability of the Fund to the Advisor, and the overall profitability of the Advisor; |
| • | possible economies of scale associated with the Advisor’s management of the Fund and other accounts under its management; |
| • | data comparing services provided and charges to other investment management clients of the Advisor; |
| • | acquired fund fees and expenses; |
| • | payments by the Fund and the Advisor to financial intermediaries whose clients are investors in the Fund; and |
| • | any collateral benefits derived by the Advisor from the management of the Fund. |
In keeping with its practice, the Board held two in-person meetings to review and discuss the information provided in response to their request. The independent Trustees also had the benefit of the advice of their independent counsel throughout the process.
34
Factors Considered
The Trustees considered all of the information provided by the Advisor, the independent data providers, and the independent Trustees’ independent counsel in connection with the review, and evaluated such information for the Fund. In connection with their review, the Trustees did not identify any single factor as being all-important or controlling and each Trustee may have attributed different levels of importance to different factors. In deciding to renew the management agreement, the Board based its decision on a number of factors, including the following:
Nature, Extent and Quality of Services - Generally. Under the management agreement, the Advisor is responsible for providing or arranging for all services necessary for the operation of the Fund. The Board noted that under the management agreement, the Advisor provides or arranges at its own expense a wide variety of services including:
| • | constructing and designing the Fund |
| • | portfolio research and security selection |
| • | initial capitalization/funding |
| • | securities trading |
| • | Fund administration |
| • | custody of Fund assets |
| • | daily valuation of the Fund’s portfolio |
| • | shareholder servicing and transfer agency, including shareholder confirmations, recordkeeping, and communications |
| • | legal services (except the independent Trustees’ counsel) |
| • | regulatory and portfolio compliance |
| • | financial reporting |
| • | marketing and distribution (except amounts paid by the Fund under Rule 12b-1 plans) |
The Board noted that many of these services have expanded over time both in terms of quantity and complexity in response to shareholder demands, competition in the industry, changing distribution channels, and the changing regulatory environment.
Investment Management, Shareholder, and Other Services. The nature of the investment management services provided to the Fund is quite complex and allows Fund shareholders access to professional money management, instant diversification of their investments within an asset class, the opportunity to easily diversify among asset classes by investing in or exchanging among various American Century Investments funds, and liquidity. In evaluating investment performance, the Board expects the Advisor to manage the Fund in accordance with its investment objectives and approved strategies. Further, the Trustees recognize that the Advisor has an obligation to seek the best execution of fund trades. In providing these services, the Advisor utilizes teams of investment professionals (portfolio managers, analysts, research assistants, and securities traders) who require extensive information technology, research, training, compliance, and other systems to conduct their business. The Board, directly and through its Portfolio Committee, regularly reviews investment performance information for the Fund, together with comparative information for appropriate benchmarks and/or peer groups of similarly-managed funds, over different time horizons. The Trustees also review detailed performance information during the management agreement approval process. If performance concerns are identified, the Fund receives special reviews until performance improves, during which the Board discusses with the Advisor the reasons for such results (e.g., market conditions, security selection) and any efforts being undertaken to improve performance. The Fund’s performance was above its benchmark for the three- and five-year periods and below its benchmark for the one- and ten-year periods reviewed by the Board. The Board discussed the Fund’s performance with the Advisor and was satisfied with the efforts being undertaken by the Advisor. The Board found the investment management services provided by the Advisor to the Fund to be satisfactory and consistent with the management agreement.
35
Under the management agreement, the Advisor provides the Fund with a comprehensive package of transfer agency, shareholder, and other services. The Board, directly and through various committees of the Board, regularly reviews reports and evaluations of such services at its regular meetings. These reports include, but are not limited to, information regarding the operational efficiency and accuracy of the shareholder and transfer agency services provided, staffing levels, shareholder satisfaction (as measured by external as well as internal sources), technology support, new products and services offered to Fund shareholders, securities trading activities, portfolio valuation services, auditing services, and legal and operational compliance activities.
Certain aspects of shareholder and transfer agency service level efficiency and the quality of securities trading activities are measured by independent third party providers and are presented in comparison to other fund groups not managed by the Advisor. The Board found the services provided by the Advisor to the Fund under the management agreement to be competitive and of high quality.
Costs of Services and Profitability. The Advisor provides detailed information concerning its cost of providing various services to the Fund, its profitability in managing the Fund, its overall profitability, and its financial condition. The Trustees have reviewed with the Advisor the methodology used to prepare this financial information. This information is considered in evaluating the Advisor’s financial condition, its ability to continue to provide services under the management agreement, and the reasonableness of the current management fee. The Board concluded that the Advisor’s profits were reasonable in light of the services provided to the Fund.
Ethics. The Board generally considers the Advisor’s commitment to providing quality services to shareholders and to conducting its business ethically. They noted that the Advisor’s practices generally meet or exceed industry best practices.
Economies of Scale. The Board also reviewed information provided by the Advisor regarding the possible existence of economies of scale in connection with the management of the Fund. The Board concluded that economies of scale are difficult to measure and predict with precision, especially on a fund-by-fund basis. The Board concluded that the Advisor is appropriately sharing economies of scale through its competitive fee structure, offering competitive fees from fund inception, and through reinvestment in its business to provide shareholders enhanced and expanded services.
Comparison to Other Funds’ Fees. The management agreement provides that the Fund pays the Advisor a single, all-inclusive (or unified) management fee for providing all services necessary for the management and operation of the Fund, other than brokerage expenses, taxes, interest, extraordinary expenses, the fees and expenses of the Fund’s independent Trustees (including their independent legal counsel), and expenses incurred in connection with the provision of shareholder services and distribution services under a plan adopted pursuant to Rule 12b-1 under the 1940 Act. Under the unified fee structure, the Advisor is responsible for providing all investment advisory, custody, audit, administrative, compliance, recordkeeping, marketing, and shareholder services, or arranging and supervising third parties to provide such services. By contrast, most other funds are charged a variety of fees, including an investment advisory fee, a transfer agency fee, an administrative fee, distribution charges, and other expenses. Other than their investment advisory fees and any applicable Rule 12b-1 fees, all other components of the total fees charged by these other funds may be increased without shareholder approval. The Board believes the unified fee structure is a benefit to Fund shareholders because it clearly discloses to shareholders the cost of owning Fund shares, and, since the unified fee cannot be increased without a vote of Fund shareholders, it shifts to the Advisor the risk of increased costs of operating the Fund and provides a direct incentive to minimize administrative inefficiencies. Part of the Board’s analysis of fee levels involves reviewing certain evaluative data compiled by an independent provider and comparing the Fund’s unified fee to the total expense ratio of peer funds. The unified fee charged to shareholders of the Fund was below the median of the total expense ratios of the Fund’s peer universe. The Board concluded that the management fee paid by the Fund to the Advisor under the management agreement is reasonable in light of the services provided to the Fund.
36
Comparison to Fees and Services Provided to Other Clients of the Advisor. The Board also requested and received information from the Advisor concerning the nature of the services, fees, costs, and profitability of its advisory services to advisory clients other than the Fund. They observed that these varying types of client accounts require different services and involve different regulatory and entrepreneurial risks than the management of the Fund. The Board analyzed this information and concluded that the fees charged and services provided to the Fund were reasonable by comparison.
Payments to Intermediaries. The Trustees also requested and received a description of payments made to intermediaries by the Fund and the Advisor. These payments include various payments made by the Fund or the Advisor to different types of intermediaries and recordkeepers for distribution and service activities provided for the Fund.
Collateral or “Fall-Out” Benefits Derived by the Advisor. The Board considered the existence of collateral benefits the Advisor may receive as a result of its relationship with the Fund. The Board noted that the Advisor’s primary business is managing mutual funds and it generally does not use fund or shareholder information to generate profits in other lines of business, and therefore does not derive any significant collateral benefits from them. The Board noted that the Advisor receives proprietary research from broker-dealers that execute fund portfolio transactions. The Board also determined that the Advisor is able to provide investment management services to certain clients other than the Fund, at least in part, due to its existing infrastructure built to serve the fund complex.
Existing Relationship. The Board also considered whether there was any reason for not continuing the existing arrangement with the Advisor. In this regard, the Board was mindful of the potential disruptions of the Fund’s operations and various risks, uncertainties, and other effects that could occur as a result of a decision not to continue such relationship. In particular, the Board recognized that most shareholders have invested in the Fund on the strength of the Advisor’s industry standing and reputation and in the expectation that the Advisor will have a continuing role in providing advisory services to the Fund.
Conclusion of the Trustees. As a result of this process, the Board, including all of the independent Trustees and assisted by the advice of independent legal counsel, taking into account all of the factors discussed above and the information provided by the Advisor and others in connection with its review and throughout the year, concluded that the management agreement between the Fund and the Advisor is fair and reasonable in light of the services provided and should be renewed.
37
| Additional Information |
Proxy Voting Policies
Descriptions of the principles and policies that the fund’s investment advisor uses in exercising the voting rights associated with the securities purchased and/or held by the fund are available without charge, upon request, by calling 1-800-345-2021 or visiting the “About Us” page of American Century Investments’ website at americancentury.com. A description of the policies is also available on the Securities and Exchange Commission’s website at sec.gov. Information regarding how the investment advisor voted proxies relating to portfolio securities during the most recent 12-month period ended June 30 is available on the “About Us” page at americancentury.com. It is also available at sec.gov.
Quarterly Portfolio Disclosure
The fund files its complete schedule of portfolio holdings with the Securities and Exchange Commission (SEC) for the first and third quarters of each fiscal year on Form N-Q. The fund’s Forms N-Q are available on the SEC’s website at sec.gov, and may be reviewed and copied at the SEC’s Public Reference Room in Washington, DC. Information on the operation of the Public Reference Room may be obtained by calling 1-800-SEC-0330. The fund also makes its complete schedule of portfolio holdings for the most recent quarter of its fiscal year available on its website at americancentury.com and, upon request, by calling 1-800-345-2021.
Other Tax Information
The following information is provided pursuant to provisions of the Internal Revenue Code.
The fund designates $11,657,562 as exempt interest dividends for the fiscal year ended August 31, 2015.
38
| Notes |
39
| Notes |
40
| ||
| Contact Us | americancentury.com | |
| Automated Information Line | 1-800-345-8765 | |
| Investor Services Representative | 1-800-345-2021 or 816-531-5575 | |
| Investors Using Advisors | 1-800-378-9878 | |
| Business, Not-For-Profit, Employer-Sponsored Retirement Plans | 1-800-345-3533 | |
| Banks and Trust Companies, Broker-Dealers, Financial Professionals, Insurance Companies | 1-800-345-6488 | |
| Telecommunications Relay Service for the Deaf | 711 | |
| American Century California Tax-Free and Municipal Funds | ||
Investment Advisor: American Century Investment Management, Inc. Kansas City, Missouri | ||
This report and the statements it contains are submitted for the general information of our shareholders. The report is not authorized for distribution to prospective investors unless preceded or accompanied by an effective prospectus. | ||
©2015 American Century Proprietary Holdings, Inc. All rights reserved. CL-ANN-86899 1510 | ||
| ANNUAL REPORT | AUGUST 31, 2015 |
California Tax-Free Money Market Fund
| Table of Contents |
| President’s Letter | ||
| Performance | 3 | |
| Fund Characteristics | ||
| Shareholder Fee Example | ||
| Schedule of Investments | ||
| Statement of Assets and Liabilities | ||
| Statement of Operations | ||
| Statement of Changes in Net Assets | ||
| Notes to Financial Statements | ||
| Financial Highlights | ||
| Report of Independent Registered Public Accounting Firm | ||
| Management | ||
| Approval of Management Agreement | ||
| Additional Information | ||
Any opinions expressed in this report reflect those of the author as of the date of the report, and do not necessarily represent the opinions of American Century Investments® or any other person in the American Century Investments organization. Any such opinions are subject to change at any time based upon market or other conditions and American Century Investments disclaims any responsibility to update such opinions. These opinions may not be relied upon as investment advice and, because investment decisions made by American Century Investments funds are based on numerous factors, may not be relied upon as an indication of trading intent on behalf of any American Century Investments fund. Security examples are used for representational purposes only and are not intended as recommendations to purchase or sell securities. Performance information for comparative indices and securities is provided to American Century Investments by third party vendors. To the best of American Century Investments’ knowledge, such information is accurate at the time of printing.
| President’s Letter |
| Dear Investor: Thank you for reviewing this annual report for the 12 months ended August 31, 2015. It provides investment performance and portfolio information for the reporting period, plus longer-term historical performance data. Annual reports remain important vehicles for conveying information about fund returns, including market and economic factors that affected performance during the reporting period. For additional, updated investment and market insights, we encourage you to visit our website, americancentury.com. |
| Jonathan Thomas | |
Municipal Market Relatively Stable Overall (Ex-Puerto Rico and Chicago) in a Period of Increased Volatility
Broad market index returns for municipal bonds (munis) were mostly positive for the 12 months, primarily a carryover from favorable muni market conditions during the first five months of the reporting period. During those first five months (mostly during late 2014), the muni market was still rebounding after selling off in 2013. The 2014 rebound reflected a favorable combination of constrained inflation, improving U.S. economic and credit conditions, strong demand for yield, relatively low muni issuance, and the unexpected U.S. Treasury market rally.
Positive momentum from 2014 carried into January 2015, then reversed during the next four months. We believe munis struggled from February into June this year due to: 1) low, post-rally muni yields not attracting investors, 2) supply (particularly from refinancing activity) increasing while demand was declining, and 3) the downgrade of Chicago’s debt to high-yield status in May.
Deteriorating credit conditions in Puerto Rico also created headlines as the summer progressed, but the broader muni market became a bastion of stability because of its relatively high overall credit quality. During the last two months of the reporting period, comparative stability in muni market performance played out against a broader global backdrop of increased capital market volatility. This was triggered in part by China’s economic slowdown and by diverging central bank policies as the U.S. Federal Reserve seeks to reduce its monetary stimulus while other central banks are still pursuing theirs at full throttle amid generally soft global growth conditions. We expect more monetary policy divergence between the U.S. and the rest of the world in coming months, accompanied by continued market volatility. This could present both challenges and opportunities for active investment managers. In this environment, we continue to believe in a disciplined, diversified, long-term investment approach, using professionally managed stock and bond portfolios to meet financial goals. We appreciate your continued trust in us.
Sincerely,
Jonathan Thomas
President and Chief Executive Officer
American Century Investments
2
| Performance |
| Total Returns as of August 31, 2015 | ||||||
| Average Annual Returns | ||||||
Ticker Symbol | 1 year | 5 years | 10 years | Since Inception | Inception Date | |
| Investor Class | BCTXX | 0.01%(1) | 0.01%(1) | 0.90%(1) | 2.45%(1) | 11/9/83 |
| (1) | Returns would have been lower if a portion of the management fee had not been waived. |
| Total Annual Fund Operating Expenses |
Investor Class 0.50% |
The total annual fund operating expenses shown is as stated in the fund’s prospectus current as of the date of this report. The prospectus may vary from the expense ratio shown elsewhere in this report because it is based on a different time period, includes acquired fund fees and expenses, and, if applicable, does not include fee waivers or expense reimbursements.
Data presented reflect past performance. Past performance is no guarantee of future
results. Current performance may be higher or lower than the performance shown. To obtain performance data current to the most recent month end, please call 1-800-345-2021 or visit americancentury.com. For additional information about the fund, please consult the prospectus.
An investment in the fund is neither insured nor guaranteed by the Federal Deposit
Insurance Corporation or any other government agency. Although the fund seeks to
preserve the value of your investment at $1.00 per share, it is possible to lose money by investing in the fund.
The 7-day current yield more closely reflects the current earnings of the fund than the total return.
3
| Fund Characteristics |
| AUGUST 31, 2015 | |
| 7-Day Current Yield | |
After waiver(1) | 0.01% |
| Before waiver | (0.38)% |
| 7-Day Effective Yield | |
After waiver(1) | 0.01% |
| (1) Yields would have been lower if a portion of the management fee had not been waived. | |
| Portfolio at a Glance | |
| Weighted Average Maturity | 24 days |
| Weighted Average Life | 60 days |
| Portfolio Composition by Maturity | % of fund investments |
| 1-30 days | 91% |
| 31-90 days | 3% |
| 91-180 days | 1% |
| More than 180 days | 5% |
4
| Shareholder Fee Example |
Fund shareholders may incur two types of costs: (1) transaction costs, including sales charges (loads) on purchase payments and redemption/exchange fees; and (2) ongoing costs, including management fees; distribution and service (12b-1) fees; and other fund expenses. This example is intended to help you understand your ongoing costs (in dollars) of investing in your fund and to compare these costs with the ongoing cost of investing in other mutual funds.
The example is based on an investment of $1,000 made at the beginning of the period and held for the entire period from March 1, 2015 to August 31, 2015.
Actual Expenses
The table provides information about actual account values and actual expenses for each class. You may use the information, together with the amount you invested, to estimate the expenses that you paid over the period. First, identify the share class you own. Then simply divide your account value by $1,000 (for example, an $8,600 account value divided by $1,000 = 8.6), then multiply the result by the number under the heading “Expenses Paid During Period” to estimate the expenses you paid on your account during this period.
If you hold Investor Class shares of any American Century Investments fund, or Institutional Class shares of the American Century Diversified Bond Fund, in an American Century Investments account (i.e., not a financial intermediary or retirement plan account), American Century Investments may charge you a $12.50 semiannual account maintenance fee if the value of those shares is less than $10,000. We will redeem shares automatically in one of your accounts to pay the $12.50 fee. In determining your total eligible investment amount, we will include your investments in all personal accounts (including American Century Investments Brokerage accounts) registered under your Social Security number. Personal accounts include individual accounts, joint accounts, UGMA/UTMA accounts, personal trusts, Coverdell Education Savings Accounts and IRAs (including traditional, Roth, Rollover, SEP-, SARSEP- and SIMPLE-IRAs), and certain other retirement accounts. If you have only business, business retirement, employer-sponsored or American Century Investments Brokerage accounts, you are currently not subject to this fee. If you are subject to the Account Maintenance Fee, your account value could be reduced by the fee amount.
Hypothetical Example for Comparison Purposes
The table also provides information about hypothetical account values and hypothetical expenses based on the actual expense ratio of each class of your fund and an assumed rate of return of 5% per year before expenses, which is not the actual return of a fund’s share class. The hypothetical account values and expenses may not be used to estimate the actual ending account balance or expenses you paid for the period. You may use this information to compare the ongoing costs of investing in your fund and other funds. To do so, compare this 5% hypothetical example with the 5% hypothetical examples that appear in the shareholder reports of the other funds.
Please note that the expenses shown in the table are meant to highlight your ongoing costs only and do not reflect any transactional costs, such as sales charges (loads) or redemption/exchange fees. Therefore, the table is useful in comparing ongoing costs only, and will not help you determine the relative total costs of owning different funds. In addition, if these transactional costs were included, your costs would have been higher.
5
| Beginning Account Value 3/1/15 | Ending Account Value 8/31/15 | Expenses Paid During Period(1)3/1/15 - 8/31/15 | Annualized Expense Ratio(1) | |
| Actual | ||||
| Investor Class (after waiver) | $1,000 | $1,000.10 | $0.71 | 0.14% |
| Investor Class (before waiver) | $1,000 | $1,000.10(2) | $2.52 | 0.50% |
| Hypothetical | ||||
| Investor Class (after waiver) | $1,000 | $1,024.50 | $0.71 | 0.14% |
| Investor Class (before waiver) | $1,000 | $1,022.69 | $2.55 | 0.50% |
| (1) | Expenses are equal to the class's annualized expense ratio listed in the table above, multiplied by the average account value over the period, multiplied by 184, the number of days in the most recent fiscal half-year, divided by 365, to reflect the one-half year period. |
| (2) | Ending account value assumes the return earned after waiver and would have been lower if a portion of the management fee had not been waived. |
6
| Schedule of Investments |
AUGUST 31, 2015
| Principal Amount | Value | |||||
| MUNICIPAL SECURITIES — 99.1% | ||||||
| California — 99.1% | ||||||
| California GO, Series 2004 B-2, (Kindergarten), VRDN, 0.01%, 9/1/15 (LOC: Citibank N.A.) | $ | 2,500,000 | $ | 2,500,000 | ||
| California Health Facilities Financing Authority Rev., Series 1988 B, (Catholic Healthcare), VRDN, 0.15%, 9/2/15 (NATL-RE)(LOC: JPMorgan Chase Bank N.A.) | 1,700,000 | 1,700,000 | ||||
| California Health Facilities Financing Authority Rev., Series 2011 B, (Sutter Health), 5.00%, 8/15/16 | 1,000,000 | 1,044,719 | ||||
| California Infrastructure & Economic Development Bank Rev., (Bay Area Toll Bridges), VRDN, 0.05%, 9/3/15 (LOC: MUFG Union Bank N.A.) | 2,030,000 | 2,030,000 | ||||
| California Infrastructure & Economic Development Bank Rev., (Catalina Museum Project), VRDN, 0.05%, 9/3/15 (LOC: Bank of the West) | 1,000,000 | 1,000,000 | ||||
| California Infrastructure & Economic Development Bank Rev., (Columbia College), VRDN, 0.06%, 9/3/15 (LOC: Rabobank Nederland N.V.) | 3,285,000 | 3,285,000 | ||||
| California Infrastructure & Economic Development Bank Rev., (Goodwill Industries of Orange County), VRDN, 0.07%, 9/3/15 (LOC: Wells Fargo Bank N.A.) | 2,425,000 | 2,425,000 | ||||
| California Infrastructure & Economic Development Bank Rev., (Kennfoods USA), VRDN, 0.04%, 9/3/15 (LOC: Bank of the West) | 1,190,000 | 1,190,000 | ||||
| California Infrastructure & Economic Development Bank Rev., (SRI International), VRDN, 0.03%, 9/3/15 (LOC: Wells Fargo Bank N.A.) | 6,200,000 | 6,200,000 | ||||
| California Infrastructure & Economic Development Bank Rev., Series 2008 A, (iWorks, Inc.), VRDN, 0.03%, 9/3/15 (LOC: City National Bank and FHLB) | 1,335,000 | 1,335,000 | ||||
| California Municipal Finance Authority Rev., Series 2008 A, (Central Coast YMCA), VRDN, 0.07%, 9/3/15 (LOC: Pacific Capital Bank N.A. and FHLB) | 5,080,000 | 5,080,000 | ||||
| California Municipal Finance Authority Rev., Series 2010 A, (Southwest Community Health Center), VRDN, 0.05%, 9/3/15 (LOC: Comerica Bank) | 3,905,000 | 3,905,000 | ||||
| California Municipal Finance Authority Rev., Series 2012 A, (High Desert Partnership in Academic Excellence Foundation), VRDN, 0.05%, 9/3/15 (LOC: MUFG Union Bank N.A.) | 2,000,000 | 2,000,000 | ||||
| California Pollution Control Financing Authority Rev., (Musco Family Olive), VRDN, 0.07%, 9/3/15 (LOC: Bank of the West) | 3,200,000 | 3,200,000 | ||||
| California Pollution Control Financing Authority Rev., Series 1996 E, (Pacific Gas & Electric Co.), VRDN, 0.01%, 9/1/15 (LOC: JPMorgan Chase Bank N.A.) | 3,800,000 | 3,800,000 | ||||
| California Pollution Control Financing Authority Rev., Series 2010 A, (Alameda Country Industries), VRDN, 0.04%, 9/2/15 (LOC: Bank of the West) | 2,460,000 | 2,460,000 | ||||
| California State Enterprise Development Authority Rev., (Community Hospice, Inc.), VRDN, 0.02%, 9/3/15 (LOC: Bank of Stockton and FHLB) | 3,595,000 | 3,595,000 | ||||
| California State Enterprise Development Authority Rev., (Humane Society Silicon Valley), VRDN, 0.02%, 9/3/15 (LOC: First Republic Bank and FHLB) | 6,395,000 | 6,395,000 | ||||
| California State Enterprise Development Authority Rev., (LBM Partnership LP), VRDN, 0.03%, 9/3/15 (LOC: Wells Fargo Bank N.A.) | 2,750,000 | 2,750,000 | ||||
7
| Principal Amount | Value | |||||
California State University PUTTERs Rev., Series 2008-2646Z, VRDN, 0.10%, 9/3/15 (AGM)(LIQ FAC: JPMorgan Chase Bank N.A.)(1) | $ | 3,590,000 | $ | 3,590,000 | ||
| California Statewide Communities Development Authority Rev., (Goodwill of Santa Cruz), VRDN, 0.11%, 9/3/15 (LOC: Wells Fargo Bank N.A.) | 2,200,000 | 2,200,000 | ||||
| City of Irvine Improvement Bond Act of 1915 Special Assessment Rev., (Assessment District No. 87-8), VRDN, 0.01%, 9/1/15 (LOC: State Street Bank & Trust Co.) | 1,100,000 | 1,100,000 | ||||
| City of Los Angeles GO, 2.00%, 6/30/16 | 5,000,000 | 5,069,469 | ||||
| City of Oakland GO, Series 2015 A, 2.00%, 1/15/16 | 1,865,000 | 1,877,369 | ||||
| City of Oroville Rev., Series 2012 A, (Oroville Hospital), VRDN, 0.05%, 9/3/15 (LOC: Comerica Bank) | 6,135,000 | 6,135,000 | ||||
| City of Reedley COP, (Mennonite Brethren Homes), VRDN, 0.03%, 9/3/15 (LOC: Bank of the Sierra and FHLB) | 7,000,000 | 7,000,000 | ||||
| City of Riverside Water Rev., Series 2011 A, VRN, 0.06%, 9/3/15 | 10,560,000 | 10,560,000 | ||||
| Contra Costa County Public Financing Authority Rev., Series 2015 B, (Capital Projects), 3.00%, 6/1/16 | 1,000,000 | 1,019,755 | ||||
| County of Los Angeles Rev., 5.00%, 6/30/16 | 3,500,000 | 3,636,064 | ||||
| County of Riverside Rev., Series 2014 D, 1.50%, 10/14/15 | 5,000,000 | 5,007,998 | ||||
| County of San Bernardino Rev., Series 2004 A, (WLP Parkview Place Apartments), VRDN, 0.04%, 9/3/15 (LOC: FNMA) | 3,420,000 | 3,420,000 | ||||
| County of Yolo Rev., (Beckett Hall, Inc.), VRDN, 0.08%, 9/3/15 (LOC: Bank of the West and California State Teacher's Retirement System) | 6,375,000 | 6,375,000 | ||||
| Eastern Municipal Water District Water & Sewer Rev., Series 2012 A, VRN, 0.06%, 9/3/15 | 4,000,000 | 4,000,000 | ||||
| Eastern Municipal Water District Water & Sewer Rev., Series 2013 A, (Flexible Index Mode), VRN, 0.06%, 9/3/15 | 6,000,000 | 6,000,000 | ||||
| Hesperia Public Financing Authority Rev., (1993 Street Improvement Project), VRDN, 0.09%, 9/2/15 (LOC: Bank of the West) | 1,000,000 | 1,000,000 | ||||
| Hesperia Public Financing Authority Rev., Series 1998 B, (Water & Administration Facilities), VRDN, 0.09%, 9/2/15 (LOC: Bank of the West) | 710,000 | 710,000 | ||||
| Irvine Ranch Water District Rev., Series 2011 A-1, VRN, 0.05%, 9/3/15 | 2,000,000 | 2,000,000 | ||||
| Irvine Ranch Water District Rev., Series 2011 A-2, VRN, 0.05%, 9/3/15 | 5,000,000 | 5,000,000 | ||||
JP Morgan Chase PUTTERs/DRIVERs Trust, Series 2011-4005Z, VRDN, 0.10%, 9/3/15 (AGM)(LIQ FAC: JPMorgan Chase Bank N.A.)(1) | 6,590,000 | 6,590,000 | ||||
| Los Angeles County Community Development Commission COP, (Willowbrook Partnership), VRDN, 0.06%, 9/2/15 (LOC: Wells Fargo Bank N.A.) | 2,300,000 | 2,300,000 | ||||
| Metropolitan Water District of Southern California Rev., Series 2009 A-2, VRN, 0.07%, 9/3/15 | 3,250,000 | 3,250,000 | ||||
| Metropolitan Water District of Southern California Rev., Series 2011 A-1, VRN, 0.04%, 9/3/15 | 7,500,000 | 7,500,000 | ||||
| Metropolitan Water District of Southern California Rev., Series 2015 E, VRN, 0.09%, 9/3/15 | 7,000,000 | 7,000,000 | ||||
| Monterey Peninsula Water Management District COP, (Wastewater Reclamation), VRDN, 0.03%, 9/3/15 (LOC: Wells Fargo Bank N.A.) | 2,700,000 | 2,700,000 | ||||
| Pittsburg Public Financing Authority Rev., VRDN, 0.03%, 9/3/15 (LOC: Bank of the West) | 3,395,000 | 3,395,000 | ||||
| Santa Clara County Housing Authority Rev., Series 2003 A, VRDN, 0.04%, 9/3/15 (LOC: Citibank N.A.) | 1,230,000 | 1,230,000 | ||||
8
| Principal Amount | Value | |||||
State of California Puttable Floating Options Rev., VRDN, 0.09%, 9/3/15 (AGM)(LIQ FAC: Bank of America N.A.)(1) | $ | 3,480,000 | $ | 3,480,000 | ||
State of California Puttable Floating Options Rev., VRDN, 0.15%, 9/3/15 (LIQ FAC: Bank of America N.A.)(1) | 5,000,000 | 5,000,000 | ||||
| Town of Apple Valley COP, (Public Facilities Financing), VRDN, 0.05%, 9/3/15 (LOC: MUFG Union Bank N.A.) | 1,480,000 | 1,480,000 | ||||
| Town of Hillsborough COP, Series 2003 A, (Water & Sewer System), VRDN, 0.01%, 9/3/15 (SBBPA: JPMorgan Chase Bank N.A.) | 2,790,000 | 2,790,000 | ||||
| Town of Hillsborough COP, Series 2006 A, (Water & Sewer System), VRDN, 0.01%, 9/3/15 (SBBPA: JPMorgan Chase Bank N.A.) | 7,075,000 | 7,075,000 | ||||
| Victorville Joint Powers Finance Authority Lease Rev., Series 2007 A, (Cogeneration Facility), VRDN, 0.87%, 9/3/15 (LOC: BNP Paribas) | 12,475,000 | 12,475,000 | ||||
| TOTAL INVESTMENT SECURITIES — 99.1% | 197,860,374 | |||||
| OTHER ASSETS AND LIABILITIES — 0.9% | 1,783,133 | |||||
| TOTAL NET ASSETS — 100.0% | $ | 199,643,507 | ||||
| NOTES TO SCHEDULE OF INVESTMENTS | ||
| AGM | - | Assured Guaranty Municipal Corporation |
| COP | - | Certificates of Participation |
| DRIVERs | - | Derivative Inverse Tax-Exempt Receipts |
| FHLB | - | Federal Home Loan Bank |
| FNMA | - | Federal National Mortgage Association |
| GO | - | General Obligation |
| LIQ FAC | - | Liquidity Facilities |
| LOC | - | Letter of Credit |
| NATL-RE | - | National Public Finance Guarantee Corporation - Reinsured |
| PUTTERs | - | Puttable Tax-Exempt Receipts |
| SBBPA | - | Standby Bond Purchase Agreement |
| VRDN | - | Variable Rate Demand Note. Interest reset date is indicated. Rate shown is effective at the period end. |
| VRN | - | Variable Rate Note. Interest reset date is indicated. Rate shown is effective at the period end. |
| (1) | Restricted security exempt from registration pursuant to Rule 144A under the Securities Act of 1933. These securities may be sold without restriction to qualified institutional investors and have been deemed liquid under policies approved by the Board of Trustees. The aggregate value of these securities at the period end was $18,660,000, which represented 9.3% of total net assets. |
See Notes to Financial Statements.
9
| Statement of Assets and Liabilities |
| AUGUST 31, 2015 | |||
| Assets | |||
| Investment securities, at value (amortized cost and cost for federal income tax purposes) | $ | 197,860,374 | |
| Cash | 686,235 | ||
| Receivable for investments sold | 790,000 | ||
| Receivable for capital shares sold | 224,194 | ||
| Interest receivable | 144,025 | ||
| 199,704,828 | |||
| Liabilities | |||
| Payable for capital shares redeemed | 44,634 | ||
| Accrued management fees | 16,687 | ||
| 61,321 | |||
| Net Assets | $ | 199,643,507 | |
| Investor Class Capital Shares | |||
| Shares outstanding (unlimited number of shares authorized) | 199,642,797 | ||
| Net Asset Value Per Share | $ | 1.00 | |
| Net Assets Consist of: | |||
| Capital paid in | $ | 199,642,803 | |
| Undistributed net realized gain | 704 | ||
| $ | 199,643,507 | ||
See Notes to Financial Statements.
10
| Statement of Operations |
| YEAR ENDED AUGUST 31, 2015 | |||
| Investment Income (Loss) | |||
| Income: | |||
| Interest | $ | 284,825 | |
| Expenses: | |||
| Management fees | 1,025,989 | ||
| Trustees' fees and expenses | 11,158 | ||
| Other expenses | 52 | ||
| 1,037,199 | |||
| Fees waived | (773,052 | ) | |
| 264,147 | |||
| Net investment income (loss) | 20,678 | ||
| Net realized gain (loss) on investment transactions | 2,697 | ||
| Net Increase (Decrease) in Net Assets Resulting from Operations | $ | 23,375 | |
See Notes to Financial Statements.
11
| Statement of Changes in Net Assets |
| YEARS ENDED AUGUST 31, 2015 AND AUGUST 31, 2014 | ||||||
| Increase (Decrease) in Net Assets | August 31, 2015 | August 31, 2014 | ||||
| Operations | ||||||
| Net investment income (loss) | $ | 20,678 | $ | 22,836 | ||
| Net realized gain (loss) | 2,697 | 5,114 | ||||
| Net increase (decrease) in net assets resulting from operations | 23,375 | 27,950 | ||||
| Distributions to Shareholders | ||||||
| From net investment income | (20,678 | ) | (22,836 | ) | ||
| Capital Share Transactions | ||||||
| Proceeds from shares sold | 56,838,279 | 67,371,636 | ||||
| Proceeds from reinvestment of distributions | 20,265 | 22,032 | ||||
| Payments for shares redeemed | (78,259,625 | ) | (87,438,069 | ) | ||
| Net increase (decrease) in net assets from capital share transactions | (21,401,081 | ) | (20,044,401 | ) | ||
| Net increase (decrease) in net assets | (21,398,384 | ) | (20,039,287 | ) | ||
| Net Assets | ||||||
| Beginning of period | 221,041,891 | 241,081,178 | ||||
| End of period | $ | 199,643,507 | $ | 221,041,891 | ||
| Transactions in Shares of the Fund | ||||||
| Sold | 56,838,279 | 67,371,636 | ||||
| Issued in reinvestment of distributions | 20,265 | 22,032 | ||||
| Redeemed | (78,259,625 | ) | (87,438,069 | ) | ||
| Net increase (decrease) in shares of the fund | (21,401,081 | ) | (20,044,401 | ) | ||
See Notes to Financial Statements.
12
| Notes to Financial Statements |
AUGUST 31, 2015
1. Organization
American Century California Tax-Free and Municipal Funds (the trust) is registered under the Investment Company Act of 1940, as amended (the 1940 Act), as an open-end management investment company and is organized as a Massachusetts business trust. California Tax-Free Money Market Fund (the fund) is one fund in a series issued by the trust. The fund is diversified as defined under Rule 2a-7 of the 1940 Act. The fund’s investment objectives are to seek safety of principal and high current income that is exempt from federal and California income taxes.
2. Significant Accounting Policies
The following is a summary of significant accounting policies consistently followed by the fund in preparation of its financial statements. The fund is an investment company and follows accounting and reporting guidance in accordance with accounting principles generally accepted in the United States of America. This may require management to make certain estimates and assumptions at the date of the financial statements. Actual results could differ from these estimates. Management evaluated the impact of events or transactions occurring through the date the financial statements were issued that would merit recognition or disclosure.
Investment Valuations — The fund determines the fair value of its investments and computes its net asset value (NAV) per share at the close of regular trading (usually 4 p.m. Eastern time) on the New York Stock Exchange (NYSE) on each day the NYSE is open. Investments are generally valued at amortized cost, which approximates fair value. If the fund determines that amortized cost does not reflect an investment’s fair value, such investment is valued as determined in good faith by the Board of Trustees or its delegate, in accordance with policies and procedures adopted by the Board of Trustees.
Security Transactions — Security transactions are accounted for as of the trade date. Net realized gains and losses are determined on the identified cost basis, which is also used for federal income tax purposes.
Investment Income — Interest income is recorded on the accrual basis and includes accretion of discounts and amortization of premiums.
Income Tax Status — It is the fund’s policy to distribute substantially all net investment income and net realized gains to shareholders and to otherwise qualify as a regulated investment company under provisions of the Internal Revenue Code. Accordingly, no provision has been made for income taxes. The fund files U.S. federal, state, local and non-U.S. tax returns as applicable. The fund's tax returns are subject to examination by the relevant taxing authority until expiration of the applicable statute of limitations, which is generally three years from the date of filing but can be longer in certain jurisdictions. At this time, management believes there are no uncertain tax positions which, based on their technical merit, would not be sustained upon examination and for which it is reasonably possible that the total amounts of unrecognized tax benefits will significantly change in the next twelve months.
Distributions to Shareholders — Distributions from net investment income, if any, are declared daily and paid monthly. The fund may make short-term capital gains distributions to comply with the distribution requirements of the Internal Revenue Code. The fund does not expect to realize any long-term capital gains, and accordingly, does not expect to pay any long-term capital gains distributions.
Indemnifications — Under the trust’s organizational documents, its officers and trustees are indemnified against certain liabilities arising out of the performance of their duties to the fund. In addition, in the normal course of business, the fund enters into contracts that provide general indemnifications. The maximum exposure under these arrangements is unknown as this would involve future claims that may be made against a fund. The risk of material loss from such claims is considered by management to be remote.
13
3. Fees and Transactions with Related Parties
Certain officers and trustees of the trust are also officers and/or directors of American Century Companies, Inc. (ACC). The trust's investment advisor, American Century Investment Management, Inc. (ACIM), the trust's distributor, American Century Investment Services, Inc., and the trust's transfer agent, American Century Services, LLC, are wholly owned, directly or indirectly, by ACC.
Management Fees — The trust has entered into a management agreement with ACIM, under which ACIM provides the fund with investment advisory and management services in exchange for a single, unified management fee (the fee). The agreement provides that all expenses of managing and operating the fund, except distribution and service fees, brokerage expenses, taxes, interest, fees and expenses of the independent trustees (including legal counsel fees), and extraordinary expenses, will be paid by ACIM. The fee is computed and accrued daily based on the daily net assets of the fund and paid monthly in arrears. The fee consists of (1) an Investment Category Fee based on the daily net assets of the fund and certain other accounts managed by the investment advisor that are in the same broad investment category as the fund and (2) a Complex Fee based on the assets of all the funds in the American Century Investments family of funds. The rates for the Investment Category Fee range from 0.1570% to 0.2700%. The rates for the Complex Fee range from 0.2500% to 0.3100%. In order to maintain a positive yield, ACIM may voluntarily waive a portion of the management fee on a daily basis. The fee waiver may be revised or terminated at any time without notice. The effective annual management fee for the year ended August 31, 2015 was 0.49% before waiver and 0.12% after waiver.
Trustees’ Fees and Expenses — The Board of Trustees is responsible for overseeing the investment advisor’s management and operations of the fund. The trustees receive detailed information about the fund and its investment advisor regularly throughout the year, and meet at least quarterly with management of the investment advisor to review reports about fund operations. The fund’s officers do not receive compensation from the fund.
4. Fair Value Measurements
The fund’s investments valuation process is based on several considerations and may use multiple inputs to determine the fair value of the investments held by the fund. In conformity with accounting principles generally accepted in the United States of America, the inputs used to determine a valuation are classified into three broad levels.
| • | Level 1 valuation inputs consist of unadjusted quoted prices in an active market for identical investments. |
| • | Level 2 valuation inputs consist of direct or indirect observable market data (including quoted prices for comparable investments, evaluations of subsequent market events, interest rates, prepayment speeds, credit risk, etc.). These inputs also consist of quoted prices for identical investments initially expressed in local currencies that are adjusted through translation into U.S. dollars. |
| • | Level 3 valuation inputs consist of unobservable data (including a fund’s own assumptions). |
The level classification is based on the lowest level input that is significant to the fair valuation measurement. The valuation inputs are not necessarily an indication of the risks associated with investing in these securities or other financial instruments. There were no significant transfers between levels during the period.
As of period end, the fund’s investment securities were classified as Level 2. The Schedule of Investments provides additional information on the fund’s portfolio holdings.
5. Risk Factors
The fund concentrates its investments in a single state and therefore may have more exposure to credit risk related to the state of California than a fund with a broader geographical diversification.
14
6. Federal Tax Information
The tax character of distributions paid during the years ended August 31, 2015 and August 31, 2014 were as follows:
| 2015 | 2014 | |||||
| Distributions Paid From | ||||||
| Exempt income | $ | 20,678 | $ | 22,836 | ||
| Long-term capital gains | — | — | ||||
The book-basis character of distributions made during the year from net investment income or net realized gains may differ from their ultimate characterization for federal income tax purposes. These differences reflect the differing character of certain income items and net realized gains and losses for financial statement and tax purposes, and may result in reclassification among certain capital accounts on the financial statements.
As of August 31, 2015, the fund had accumulated long-term gains for federal income tax purposes of $704.
7. Money Market Fund Reform
In July 2014, the Securities and Exchange Commission adopted amendments to the rules that govern money market mutual funds. The amendments consist of structural and operational reforms intended to make money market funds more resilient for investors. In response to the amendments to the rules, beginning in the fall of 2016, the board will have the ability to impose a liquidity fee or suspend redemptions in times of severe market stress and the fund will only be available to shareholders who are retail investors. The fund will continue to offer a stable NAV. Management anticipates there will be no changes to the financial statement disclosures.
15
| Financial Highlights |
| For a Share Outstanding Throughout the Years Ended August 31 (except as noted) | ||||||||||||||
| Per-Share Data | Ratios and Supplemental Data | |||||||||||||
| Distributions From: | Ratio to Average Net Assets of: | |||||||||||||
Net Asset Value, Beginning of Period | Income From Investment Operations: Net Investment Income (Loss) | Net Investment Income | Net Realized Gains | Total Distributions | Net Asset Value, End of Period | Total Return(1) | Operating Expenses | Operating Expenses (before expense waiver) | Net Investment Income (Loss) | Net Investment Income (Loss) (before expense waiver) | Net Assets, End of Period (in thousands) | |||
| Investor Class | ||||||||||||||
| 2015 | $1.00 | —(2) | —(2) | — | —(2) | $1.00 | 0.01% | 0.13% | 0.50% | 0.01% | (0.36)% | $199,644 | ||
| 2014 | $1.00 | —(2) | —(2) | — | —(2) | $1.00 | 0.01% | 0.16% | 0.50% | 0.01% | (0.33)% | $221,042 | ||
| 2013 | $1.00 | —(2) | —(2) | — | —(2) | $1.00 | 0.01% | 0.28% | 0.50% | 0.01% | (0.21)% | $241,081 | ||
| 2012 | $1.00 | —(2) | —(2) | —(2) | —(2) | $1.00 | 0.01% | 0.40% | 0.50% | 0.01% | (0.09)% | $263,397 | ||
| 2011 | $1.00 | —(2) | —(2) | —(2) | —(2) | $1.00 | 0.01% | 0.38% | 0.50% | 0.01% | (0.11)% | $299,366 | ||
| Notes to Financial Highlights |
| (1) | Total returns are calculated based on the net asset value of the last business day. Total returns for periods less than one year are not annualized. |
| (2) | Per-share amount was less than $0.005. |
See Notes to Financial Statements.
16
| Report of Independent Registered Public Accounting Firm |
To the Trustees of the American Century California Tax-Free and Municipal Funds and Shareholders of the California Tax-Free Money Market Fund:
In our opinion, the accompanying statement of assets and liabilities, including the schedule of investments, and the related statements of operations and of changes in net assets and the financial highlights present fairly, in all material respects, the financial position of the California Tax-Free Money Market Fund (one of the four funds in the American Century California Tax-Free and Municipal Funds, hereafter referred to as the "Fund") at August 31, 2015, the results of its operations for the year then ended, the changes in its net assets for each of the two years in the period then ended and the financial highlights for each of the five years in the period then ended, in conformity with accounting principles generally accepted in the United States of America. These financial statements and financial highlights (hereafter referred to as "financial statements") are the responsibility of the Fund's management. Our responsibility is to express an opinion on these financial statements based on our audits. We conducted our audits of these financial statements in accordance with the standards of the Public Company Accounting Oversight Board (United States). Those standards require that we plan and perform the audit to obtain reasonable assurance about whether the financial statements are free of material misstatement. An audit includes examining, on a test basis, evidence supporting the amounts and disclosures in the financial statements, assessing the accounting principles used and significant estimates made by management, and evaluating the overall financial statement presentation. We believe that our audits, which included confirmation of securities at August 31, 2015 by correspondence with the custodian and brokers, provide a reasonable basis for our opinion.
PricewaterhouseCoopers LLP
Kansas City, Missouri
October 21, 2015
17
| Management |
Board of Trustees
The individuals listed below serve as trustees of the funds. Each trustee will continue to serve in this capacity until death, retirement, resignation or removal from office. The board has adopted a mandatory retirement age for trustees who are not “interested persons,” as that term is defined in the Investment Company Act (independent trustees). Independent trustees shall retire on December 31 of the year in which they reach their 75th birthday; provided, however, that on or after January 1, 2022, independent trustees shall retire on December 31 of the year in which they reach their 76th birthday.
Mr. Thomas is an “interested person” because he currently serves as President and Chief Executive Officer of American Century Companies, Inc. (ACC), the parent company of American Century Investment Management, Inc. (ACIM or the advisor). The other trustees (more than three-fourths of the total number) are independent. They are not employees, directors or officers of, and have no financial interest in, ACC or any of its wholly owned, direct or indirect, subsidiaries, including ACIM, American Century Investment Services, Inc. (ACIS) and American Century Services, LLC (ACS), and they do not have any other affiliations, positions or relationships that would cause them to be considered “interested persons” under the Investment Company Act. The trustees serve in this capacity for eight (in the case of Mr. Thomas, 15) registered investment companies in the American Century Investments family of funds.
The following table presents additional information about the trustees. The mailing address for each trustee other than Mr. Thomas is 1665 Charleston Road, Mountain View, California 94043. The mailing address for Mr. Thomas is 4500 Main Street, Kansas City, Missouri 64111.
Name (Year of Birth) | Position(s) Held with Funds | Length of Time Served | Principal Occupation(s) During Past 5 Years | Number of American Century Portfolios Overseen by Trustee | Other Directorships Held During Past 5 Years |
| Independent Trustees | |||||
| Tanya S. Beder (1955) | Trustee | Since 2011 | Chairman and CEO, SBCC Group Inc. (independent advisory services) (2006 to present) | 46 | CYS Investments, Inc. (NYSE mortgage arbitrage REIT) |
| Jeremy I. Bulow (1954) | Trustee | Since 2011 | Professor of Economics, Stanford University, Graduate School of Business (1979 to present) | 46 | None |
| Ronald J. Gilson (1946) | Trustee and Chairman of the Board | Since 1995 (Chairman since 2005) | Charles J. Meyers Professor of Law and Business, Stanford Law School (1979 to present); Marc and Eva Stern Professor of Law and Business, Columbia University School of Law (1992 to present) | 46 | None |
| Frederick L. A. Grauer (1946) | Trustee | Since 2008 | Senior Advisor, BlackRock, Inc. (investment management firm) (2010 to 2011, 2013 to present) | 46 | None |
| Peter F. Pervere (1947) | Trustee | Since 2007 | Retired | 46 | None |
18
Name (Year of Birth) | Position(s) Held with Funds | Length of Time Served | Principal Occupation(s) During Past 5 Years | Number of American Century Portfolios Overseen by Trustee | Other Directorships Held During Past 5 Years |
| Independent Trustee | |||||
| John B. Shoven (1947) | Trustee | Since 2002 | Professor of Economics, Stanford University (1973 to present) | 46 | Cadence Design Systems; Exponent; Financial Engines |
| Interested Trustee | |||||
| Jonathan S. Thomas (1963) | Trustee and President | Since 2007 | President and Chief Executive Officer, ACC (March 2007 to present). Also serves as Chief Executive Officer, ACS; Executive Vice President, ACIM; Director, ACC, ACIM and other ACC subsidiaries | 124 | BioMed Valley Discoveries, Inc. |
The Statement of Additional Information has additional information about the fund's trustees and is available without charge, upon request, by calling 1-800-345-2021.
19
Officers
The following table presents certain information about the executive officers of the funds. Each officer serves as an officer for each of the 15 investment companies in the American Century family of funds, unless otherwise noted. No officer is compensated for his or her service as an officer of the funds. The listed officers are interested persons of the funds and are appointed or re-appointed on an annual basis. The mailing address for each of the officers listed below is 4500 Main Street, Kansas City, Missouri 64111.
Name (Year of Birth) | Offices with the Funds | Principal Occupation(s) During the Past Five Years |
| Jonathan S. Thomas (1963) | Trustee and President since 2007 | President and Chief Executive Officer, ACC (March 2007 to present). Also serves as Chief Executive Officer, ACS; Executive Vice President, ACIM; Director, ACC, ACIM and other ACC subsidiaries |
| Amy D. Shelton (1964) | Chief Compliance Officer and Vice President since 2014 | Chief Compliance Officer, American Century funds, (March 2014 to present); Chief Compliance Officer, ACIM (February 2014 to present); Chief Compliance Officer, ACIS (October 2009 to present); Vice President, Client Interactions and Marketing, ACIS (February 2013 to January 2014); Director, Client Interactions and Marketing, ACIS (June 2007 to January 2013). Also serves as Vice President, ACIS |
| Charles A. Etherington (1957) | General Counsel since 2007 and Senior Vice President since 2006 | Attorney, ACC (February 1994 to present); Vice President, ACC (November 2005 to present); General Counsel, ACC (March 2007 to present). Also serves as General Counsel, ACIM, ACS, ACIS and other ACC subsidiaries; and Senior Vice President, ACIM and ACS |
| C. Jean Wade (1964) | Vice President, Treasurer and Chief Financial Officer since 2012 | Vice President, ACS (February 2000 to present) |
| Robert J. Leach (1966) | Vice President since 2006 and Assistant Treasurer since 2012 | Vice President, ACS (February 2000 to present) |
| David H. Reinmiller (1963) | Vice President since 2001 | Attorney, ACC (January 1994 to present); Associate General Counsel, ACC (January 2001 to present). Also serves as Vice President, ACIM and ACS |
| Ward D. Stauffer (1960) | Secretary since 2005 | Attorney, ACC (June 2003 to present) |
20
| Approval of Management Agreement |
At a meeting held on June 16, 2015, the Fund’s Board of Trustees unanimously approved the renewal of the management agreement pursuant to which American Century Investment Management, Inc. (the “Advisor”) acts as the investment advisor for the Fund. Under Section 15(c) of the Investment Company Act, contracts for investment advisory services are required to be reviewed, evaluated, and approved by a majority of a fund’s directors/trustees, including a majority of the independent Trustees, each year. The Board regards this annual evaluation and renewal as one of its most important responsibilities.
The independent Trustees have memorialized a statement regarding the relationship between their ongoing obligations to oversee and evaluate the performance of the Advisor and their annual consideration of renewal of the management agreement. In that statement, the independent Trustees noted that their assessment of the Advisor’s performance is an ongoing process that takes place over the entire year and is informed by all of the extensive information that the Board and its committees receive and consider over time. This information, together with the materials provided in connection with the review, are central to the Board’s assessment of the Advisor’s performance and its determination whether to renew the Fund’s management agreement.
Prior to its consideration of the renewal of the management agreement, the Board requested and reviewed extensive data and analysis relating to the proposed renewal. This information and analysis was compiled by the Advisor and certain independent providers of evaluation data concerning the Fund and the services provided to the Fund by the Advisor.
In connection with its consideration of the renewal of the management agreement, the Board’s review and evaluation of the services provided by the Advisor included, but was not limited to, the following:
| • | the nature, extent, and quality of investment management, shareholder services, and other services provided by the Advisor to the Fund; |
| • | the wide range of other programs and services the Advisor provides to the Fund and its shareholders on a routine and non-routine basis; |
| • | the investment performance of the Fund, including data comparing the Fund’s performance to appropriate benchmarks and/or a peer group of other mutual funds with similar investment objectives and strategies; |
| • | the cost of owning the Fund compared to the cost of owning similar funds; |
| • | the Advisor’s compliance policies, procedures, and regulatory experience; |
| • | financial data showing the cost of services provided to the Fund, the profitability of the Fund to the Advisor, and the overall profitability of the Advisor; |
| • | possible economies of scale associated with the Advisor’s management of the Fund and other accounts under its management; |
| • | data comparing services provided and charges to other investment management clients of the Advisor; |
| • | acquired fund fees and expenses; |
| • | payments by the Fund and the Advisor to financial intermediaries whose clients are investors in the Fund; and |
| • | any collateral benefits derived by the Advisor from the management of the Fund. |
In keeping with its practice, the Board held two in-person meetings to review and discuss the information provided in response to their request. The independent Trustees also had the benefit of the advice of their independent counsel throughout the process.
21
Factors Considered
The Trustees considered all of the information provided by the Advisor, the independent data providers, and the independent Trustees’ independent counsel in connection with the review, and evaluated such information for the Fund. In connection with their review, the Trustees did not identify any single factor as being all-important or controlling and each Trustee may have attributed different levels of importance to different factors. In deciding to renew the management agreement, the Board based its decision on a number of factors, including the following:
Nature, Extent and Quality of Services - Generally. Under the management agreement, the Advisor is responsible for providing or arranging for all services necessary for the operation of the Fund. The Board noted that under the management agreement, the Advisor provides or arranges at its own expense a wide variety of services including:
| • | constructing and designing the Fund |
| • | portfolio research and security selection |
| • | initial capitalization/funding |
| • | securities trading |
| • | Fund administration |
| • | custody of Fund assets |
| • | daily valuation of the Fund’s portfolio |
| • | shareholder servicing and transfer agency, including shareholder confirmations, recordkeeping, and communications |
| • | legal services (except the independent Trustees’ counsel) |
| • | regulatory and portfolio compliance |
| • | financial reporting |
| • | marketing and distribution (except amounts paid by the Fund under Rule 12b-1 plans) |
The Board noted that many of these services have expanded over time both in terms of quantity and complexity in response to shareholder demands, competition in the industry, changing distribution channels, and the changing regulatory environment.
Investment Management, Shareholder, and Other Services. The nature of the investment management services provided to the Fund is quite complex and allows Fund shareholders access to professional money management, instant diversification of their investments within an asset class, the opportunity to easily diversify among asset classes by investing in or exchanging among various American Century Investments funds, and liquidity. In evaluating investment performance, the Board expects the Advisor to manage the Fund in accordance with its investment objectives and approved strategies. Further, the Trustees recognize that the Advisor has an obligation to seek the best execution of fund trades. In providing these services, the Advisor utilizes teams of investment professionals (portfolio managers, analysts, research assistants, and securities traders) who require extensive information technology, research, training, compliance, and other systems to conduct their business. The Board, directly and through its Portfolio Committee, regularly reviews investment performance information for the Fund, together with comparative information for appropriate benchmarks and/or peer groups of similarly-managed funds, over different time horizons. The Trustees also review detailed performance information during the management agreement approval process. If performance concerns are identified, the Fund receives special reviews until performance improves, during which the Board discusses with the Advisor the reasons for such results (e.g., market conditions, security selection) and any efforts being undertaken to improve performance. The Fund’s performance was in the first quartile of its peer group for the one-, three-, five-, and ten-year periods reviewed by the Board. The Board found the investment management services provided by the Advisor to the Fund to be satisfactory and consistent with the management agreement.
Under the management agreement, the Advisor provides the Fund with a comprehensive package of transfer agency, shareholder, and other services. The Board, directly and through various committees of the Board, regularly reviews reports and evaluations of such services at its regular
22
meetings. These reports include, but are not limited to, information regarding the operational efficiency and accuracy of the shareholder and transfer agency services provided, staffing levels, shareholder satisfaction (as measured by external as well as internal sources), technology support, new products and services offered to Fund shareholders, securities trading activities, portfolio valuation services, auditing services, and legal and operational compliance activities.
Certain aspects of shareholder and transfer agency service level efficiency and the quality of securities trading activities are measured by independent third party providers and are presented in comparison to other fund groups not managed by the Advisor. The Board found the services provided by the Advisor to the Fund under the management agreement to be competitive and of high quality.
Costs of Services and Profitability. The Advisor provides detailed information concerning its cost of providing various services to the Fund, its profitability in managing the Fund, its overall profitability, and its financial condition. The Trustees have reviewed with the Advisor the methodology used to prepare this financial information. This information is considered in evaluating the Advisor’s financial condition, its ability to continue to provide services under the management agreement, and the reasonableness of the current management fee. The Board concluded that the Advisor’s profits were reasonable in light of the services provided to the Fund.
Ethics. The Board generally considers the Advisor’s commitment to providing quality services to shareholders and to conducting its business ethically. They noted that the Advisor’s practices generally meet or exceed industry best practices.
Economies of Scale. The Board also reviewed information provided by the Advisor regarding the possible existence of economies of scale in connection with the management of the Fund. The Board concluded that economies of scale are difficult to measure and predict with precision, especially on a fund-by-fund basis. The Board concluded that the Advisor is appropriately sharing economies of scale through its competitive fee structure, offering competitive fees from fund inception, and through reinvestment in its business to provide shareholders enhanced and expanded services.
Comparison to Other Funds’ Fees. The management agreement provides that the Fund pays the Advisor a single, all-inclusive (or unified) management fee for providing all services necessary for the management and operation of the Fund, other than brokerage expenses, taxes, interest, extraordinary expenses, the fees and expenses of the Fund’s independent Trustees (including their independent legal counsel), and expenses incurred in connection with the provision of shareholder services and distribution services under a plan adopted pursuant to Rule 12b-1 under the 1940 Act. Under the unified fee structure, the Advisor is responsible for providing all investment advisory, custody, audit, administrative, compliance, recordkeeping, marketing, and shareholder services, or arranging and supervising third parties to provide such services. By contrast, most other funds are charged a variety of fees, including an investment advisory fee, a transfer agency fee, an administrative fee, distribution charges, and other expenses. Other than their investment advisory fees and any applicable Rule 12b-1 fees, all other components of the total fees charged by these other funds may be increased without shareholder approval. The Board believes the unified fee structure is a benefit to Fund shareholders because it clearly discloses to shareholders the cost of owning Fund shares, and, since the unified fee cannot be increased without a vote of Fund shareholders, it shifts to the Advisor the risk of increased costs of operating the Fund and provides a direct incentive to minimize administrative inefficiencies. Part of the Board’s analysis of fee levels involves reviewing certain evaluative data compiled by an independent provider and comparing the Fund’s unified fee to the total expense ratio of peer funds. Given the industry-wide proliferation of fee waivers to support positive money market fund yields, the Board recognized that net fee comparisons may be less statistically relevant than in prior years. With that in mind, the Board reviewed peer data both on a gross basis and net of applicable waivers. The Board concluded that the management fee paid by the Fund to the Advisor under the management agreement is reasonable in light of the services provided to the Fund.
23
Comparison to Fees and Services Provided to Other Clients of the Advisor. The Board also requested and received information from the Advisor concerning the nature of the services, fees, costs, and profitability of its advisory services to advisory clients other than the Fund. They observed that these varying types of client accounts require different services and involve different regulatory and entrepreneurial risks than the management of the Fund. The Board analyzed this information and concluded that the fees charged and services provided to the Fund were reasonable by comparison.
Payments to Intermediaries. The Trustees also requested and received a description of payments made to intermediaries by the Fund and the Advisor. These payments include various payments made by the Fund or the Advisor to different types of intermediaries and recordkeepers for distribution and service activities provided for the Fund.
Collateral or “Fall-Out” Benefits Derived by the Advisor. The Board considered the existence of collateral benefits the Advisor may receive as a result of its relationship with the Fund. The Board noted that the Advisor’s primary business is managing mutual funds and it generally does not use fund or shareholder information to generate profits in other lines of business, and therefore does not derive any significant collateral benefits from them. The Board noted that the Advisor receives proprietary research from broker-dealers that execute fund portfolio transactions. The Board also determined that the Advisor is able to provide investment management services to certain clients other than the Fund, at least in part, due to its existing infrastructure built to serve the fund complex.
Existing Relationship. The Board also considered whether there was any reason for not continuing the existing arrangement with the Advisor. In this regard, the Board was mindful of the potential disruptions of the Fund’s operations and various risks, uncertainties, and other effects that could occur as a result of a decision not to continue such relationship. In particular, the Board recognized that most shareholders have invested in the Fund on the strength of the Advisor’s industry standing and reputation and in the expectation that the Advisor will have a continuing role in providing advisory services to the Fund.
Conclusion of the Trustees. As a result of this process, the Board, including all of the independent Trustees and assisted by the advice of independent legal counsel, taking into account all of the factors discussed above and the information provided by the Advisor and others in connection with its review and throughout the year, concluded that the management agreement between the Fund and the Advisor is fair and reasonable in light of the services provided and should be renewed.
24
| Additional Information |
Proxy Voting Policies
Descriptions of the principles and policies that the fund’s investment advisor uses in exercising the voting rights associated with the securities purchased and/or held by the fund are available without charge, upon request, by calling 1-800-345-2021 or visiting the “About Us” page of American Century Investments’ website at americancentury.com. A description of the policies is also available on the Securities and Exchange Commission’s website at sec.gov. Information regarding how the investment advisor voted proxies relating to portfolio securities during the most recent 12-month period ended June 30 is available on the “About Us” page at americancentury.com. It is also available at sec.gov.
Quarterly Portfolio Disclosure
The fund files its complete schedule of portfolio holdings with the Securities and Exchange Commission (SEC) for the first and third quarters of each fiscal year on Form N-Q. The fund’s Forms N-Q are available on the SEC’s website at sec.gov, and may be reviewed and copied at the SEC’s Public Reference Room in Washington, DC. Information on the operation of the Public Reference Room may be obtained by calling 1-800-SEC-0330. The fund also makes its complete schedule of portfolio holdings for the most recent quarter of its fiscal year available on its website at americancentury.com and, upon request, by calling 1-800-345-2021.
Other Tax Information
The following information is provided pursuant to provisions of the Internal Revenue Code.
The fund designates $20,678 as exempt interest dividends for the fiscal year ended August 31, 2015.
25
| Notes |
26
| Notes |
27
| Notes |
28
| ||
| Contact Us | americancentury.com | |
| Automated Information Line | 1-800-345-8765 | |
| Investor Services Representative | 1-800-345-2021 or 816-531-5575 | |
| Investors Using Advisors | 1-800-378-9878 | |
| Business, Not-For-Profit, Employer-Sponsored Retirement Plans | 1-800-345-3533 | |
| Banks and Trust Companies, Broker-Dealers, Financial Professionals, Insurance Companies | 1-800-345-6488 | |
| Telecommunications Relay Service for the Deaf | 711 | |
| American Century California Tax-Free and Municipal Funds | ||
Investment Advisor: American Century Investment Management, Inc. Kansas City, Missouri | ||
This report and the statements it contains are submitted for the general information of our shareholders. The report is not authorized for distribution to prospective investors unless preceded or accompanied by an effective prospectus. | ||
| ©2015 American Century Proprietary Holdings, Inc. All rights reserved. CL-ANN-86901 1510 | ||
| ANNUAL REPORT | AUGUST 31, 2015 |
California Intermediate-Term Tax-Free Bond Fund
| Table of Contents |
| President’s Letter | 2 | |
| Performance | 3 | |
| Portfolio Commentary | ||
| Fund Characteristics | ||
| Shareholder Fee Example | ||
| Schedule of Investments | ||
| Statement of Assets and Liabilities | ||
| Statement of Operations | ||
| Statement of Changes in Net Assets | ||
| Notes to Financial Statements | ||
| Financial Highlights | ||
| Report of Independent Registered Public Accounting Firm | ||
| Management | ||
| Approval of Management Agreement | ||
| Additional Information | ||
Any opinions expressed in this report reflect those of the author as of the date of the report, and do not necessarily represent the opinions of American Century Investments® or any other person in the American Century Investments organization. Any such opinions are subject to change at any time based upon market or other conditions and American Century Investments disclaims any responsibility to update such opinions. These opinions may not be relied upon as investment advice and, because investment decisions made by American Century Investments funds are based on numerous factors, may not be relied upon as an indication of trading intent on behalf of any American Century Investments fund. Security examples are used for representational purposes only and are not intended as recommendations to purchase or sell securities. Performance information for comparative indices and securities is provided to American Century Investments by third party vendors. To the best of American Century Investments’ knowledge, such information is accurate at the time of printing.
| President’s Letter |
| Dear Investor: Thank you for reviewing this annual report for the 12 months ended August 31, 2015. It provides investment performance and portfolio information for the reporting period, plus longer-term historical performance data. Annual reports remain important vehicles for conveying information about fund returns, including market and economic factors that affected performance during the reporting period. For additional, updated investment and market insights, we encourage you to visit our website, americancentury.com. |
| Jonathan Thomas | |
Municipal Market Relatively Stable Overall (Ex-Puerto Rico and Chicago) in a Period of Increased Volatility
Broad market index returns for municipal bonds (munis) were mostly positive for the 12 months, primarily a carryover from favorable muni market conditions during the first five months of the reporting period. During those first five months (mostly during late 2014), the muni market was still rebounding after selling off in 2013. The 2014 rebound reflected a favorable combination of constrained inflation, improving U.S. economic and credit conditions, strong demand for yield, relatively low muni issuance, and the unexpected U.S. Treasury market rally.
Positive momentum from 2014 carried into January 2015, then reversed during the next four months. We believe munis struggled from February into June this year due to: 1) low, post-rally muni yields not attracting investors, 2) supply (particularly from refinancing activity) increasing while demand was declining, and 3) the downgrade of Chicago’s debt to high-yield status in May.
Deteriorating credit conditions in Puerto Rico also created headlines as the summer progressed, but the broader muni market became a bastion of stability because of its relatively high overall credit quality. During the last two months of the reporting period, comparative stability in muni market performance played out against a broader global backdrop of increased capital market volatility. This was triggered in part by China’s economic slowdown and by diverging central bank policies as the U.S. Federal Reserve seeks to reduce its monetary stimulus while other central banks are still pursuing theirs at full throttle amid generally soft global growth conditions. We expect more monetary policy divergence between the U.S. and the rest of the world in coming months, accompanied by continued market volatility. This could present both challenges and opportunities for active investment managers. In this environment, we continue to believe in a disciplined, diversified, long-term investment approach, using professionally managed stock and bond portfolios to meet financial goals. We appreciate your continued trust in us.
Sincerely,
Jonathan Thomas
President and Chief Executive Officer
American Century Investments
2
| Performance |
| Total Returns as of August 31, 2015 | ||||||
| Average Annual Returns | ||||||
Ticker Symbol | 1 year | 5 years | 10 years | Since Inception | Inception Date | |
| Investor Class | BCITX | 1.68% | 3.36% | 3.92% | 5.45% | 11/9/83 |
| Barclays 7 Year Municipal Bond Index | — | 1.77% | 3.44% | 4.59% | N/A(1) | — |
| Institutional Class | BCTIX | 1.88% | 3.55% | — | 4.23% | 3/1/10 |
| A Class | BCIAX | 3/1/10 | ||||
| No sales charge* | 1.42% | 3.08% | — | 3.76% | ||
| With sales charge* | -3.12% | 2.13% | — | 2.89% | ||
| C Class | BCIYX | 0.67% | 2.33% | — | 3.01% | 3/1/10 |
| * | Sales charges include initial sales charges and contingent deferred sales charges (CDSCs), as applicable. A Class shares have a 4.50% maximum initial sales charge and may be subject to a maximum CDSC of 1.00%. C Class shares redeemed within 12 months of purchase are subject to a maximum CDSC of 1.00%. The SEC requires that mutual funds provide performance information net of maximum sales charges in all cases where charges could be applied. |
| (1) | Benchmark data first available January 1990. |
Data presented reflect past performance. Past performance is no guarantee of future results. Current performance may be higher or lower than the performance shown. Investment return and principal value will fluctuate, and redemption value may be more or less than original cost. Data assumes reinvestment of dividends and capital gains, and none of the charts reflect the deduction of taxes that a shareholder would pay on fund distributions or the redemption of fund shares. To obtain performance data current to the most recent month end, please call 1-800-345-2021 or visit americancentury.com. For additional information about the fund, please consult the prospectus.
3
| Growth of $10,000 Over 10 Years |
| $10,000 investment made August 31, 2005 |
| Performance for other share classes will vary due to differences in fee structure. |
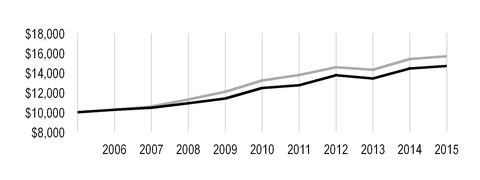
| Value on August 31, 2015 | |
| Investor Class — $14,688 | |
| Barclays 7 Year Municipal Bond Index — $15,667 | |
| Total Annual Fund Operating Expenses | |||
| Investor Class | Institutional Class | A Class | C Class |
| 0.47% | 0.27% | 0.72% | 1.47% |
The total annual fund operating expenses shown is as stated in the fund’s prospectus current as of the date of this report. The prospectus may vary from the expense ratio shown elsewhere in this report because it is based on a different time period, includes acquired fund fees and expenses, and, if applicable, does not include fee waivers or expense reimbursements.
Data presented reflect past performance. Past performance is no guarantee of future results. Current performance may be higher or lower than the performance shown. Investment return and principal value will fluctuate, and redemption value may be more or less than original cost. Data assumes reinvestment of dividends and capital gains, and none of the charts reflect the deduction of taxes that a shareholder would pay on fund distributions or the redemption of fund shares. To obtain performance data current to the most recent month end, please call 1-800-345-2021 or visit americancentury.com. For additional information about the fund, please consult the prospectus.
4
| Portfolio Commentary |
Portfolio Managers: Joseph Gotelli, Alan Kruss, and Steven Permut
Performance Summary
California Intermediate-Term Tax-Free Bond returned 1.68%* for the 12 months ended August 31, 2015. The fund’s benchmark, the Barclays 7 Year Municipal Bond Index, returned 1.77%. Fund returns reflect operating expenses, while index returns do not.
The fund’s absolute return for the reporting period reflected the positive overall performance of municipal bonds (munis) despite a backdrop of increasing global market volatility. The muni market generally rallied during the first five months of the period, following the U.S. Treasury market higher. Global divergence of central bank policy, whereby the Federal Reserve (the Fed) was scaling back its stimulus programs as other leading central banks were increasing theirs in response to weak growth rates, created an environment in which U.S. Treasury yields were relatively more attractive than government bond yields in Europe and elsewhere. A muted inflation backdrop also aided U.S. bond returns. Furthermore, a combination of factors specific to munis, including generally improving credit conditions among issuers and modest demand for munis in the face of reduced supply, also supported broad muni market gains.
Beginning in February 2015, muni market volatility emerged and persisted into June. Mounting speculation about when the Fed would raise its federal funds rate target pushed interest rates higher, slowing demand for investment-grade fixed-income securities in general. In the muni market, demand subsided (particularly from mutual fund investors) as municipalities boosted issuance of securities ahead of the Fed’s expected interest rate hike, which most investors believed would occur later in 2015. These supply/demand factors suppressed returns. In addition, credit rating agency Moody’s downgraded Chicago’s debt to high-yield status, which put pressure on other muni issuers with large unfunded pension liabilities. Late in the period, concerns about slowing growth in China rocked the global financial markets. Investment-grade munis, which represented a source of relative stability during this market unrest, rebounded in the final two months of the period, benefiting from their quality characteristics and tax benefits.
Overall, strong performance early and late in the period more than offset the weaker results in the middle months. Longer-maturity and lower-quality munis generally fared better than shorter-maturity and the highest-quality securities. Revenue bonds outperformed general obligation (GO) bonds, and California munis generally outperformed national muni benchmarks. The fund’s underperformance versus its benchmark was due primarily to our shorter duration (less price sensitivity to interest rate changes) early in the period and our limited exposure to Puerto Rico. These factors are detailed on page 6.
Credit Improvements, Particularly in California, Negated Negative Headlines Elsewhere
Despite negative headlines regarding Chicago, Puerto Rico, and other isolated issuers, muni market fundamentals generally remained positive and continued to provide support to the broad market. We believe the problems in Chicago and Puerto Rico are due largely to their own circumstances and should not be viewed as indicative of any particular systemic municipal market problem.
* All fund returns referenced in this commentary are for Investor Class shares. Performance for other share classes will vary due to differences in fee structure; when Investor Class performance exceeds that of the fund's benchmark, other share classes may not. See page 3 for returns for all share classes.
5
From a broad fiscal standpoint, state and local finances in California and across the U.S. generally improved due to increased revenue collections and spending constraints. California’s economy gained ground, as indicated by job growth (which exceeded the U.S. average) and real estate gains. Following enactment of California’s 2015-2016 budget, which mandates contributions to the state’s “rainy day” fund and the paydown of previous deficit loans, Standard & Poor’s raised the state’s bond credit rating to “AA-,” its highest level in 14 years.
From a national credit rating perspective, muni credit-rating upgrades outpaced downgrades in the fourth quarter of 2014 and first quarter of 2015. In addition, the national muni default rate remained low. We continue to believe it is unlikely any states will default, but select isolated state, local, and commonwealth credit ratings could be pressured by special circumstances.
Short Duration Was Main Relative Performance Detractor; Security Selection Was Mixed
Early in the reporting period, we expected improving economic data and the Fed’s October 2014 conclusion of its bond purchase program to push interest rates higher. This prompted us to initiate a shorter-than-benchmark duration. We used U.S. Treasury futures as part of this duration strategy. But longer-term interest rates defied investor expectations and declined during that time frame, causing our duration strategy to detract from relative performance. With global and technical factors, rather than U.S. economic fundamentals, influencing the interest rate environment, we extended the portfolio’s duration to a neutral position by the end of 2014.
Meanwhile, security selection produced mixed results relative to the benchmark. In addition to the portfolio’s California bias compared with the national benchmark, our preference for revenue bonds over GO bonds generally aided results. Within the revenue sector, we favored lease revenue, special tax, transportation, and hospital bonds. Conversely, small positions in select Puerto Rico munis detracted from fund performance. In light of the escalating fiscal challenges facing Puerto Rico, we began reducing the portfolio’s position in the commonwealth’s munis in early 2015. By the end of July, we had exited all Puerto Rico debt. Although we no longer have any direct Puerto Rico exposure, we expect the commonwealth to continue to distract the muni market due to the sheer size and prevalence of its outstanding debt.
Global Market Volatility Likely to Persist
We believe interest rates will increase as the U.S. economy continues to improve, but the time frame for rate normalization may be extended due to weak global growth. Given this backdrop and continued uncertainty about the Fed’s monetary policy strategy, we expect market volatility to persist ahead of any action on short-term interest rates. The near-term effect this backdrop will have on muni supply remains unclear. On one hand, it may increase issuance as municipalities seek to refinance their debt and issue securities before the Fed raises rates significantly higher. On the other hand, it may lead to reduced overall muni supply as issuers have less incentive to refinance as rates rise. We have marginally increased the fund’s credit quality, believing the volatile backdrop may lead to credit spread widening (an increase in the yield differential between higher-quality and lower-quality munis of similar maturity), which would favor higher-quality securities. We expect fundamental credit research, active management, and security selection to become increasingly important as rates normalize.
We continue to monitor the impact of California’s drought on the state economy and individual bond issuers. We do not expect the drought to have a broad impact on the credit ratings of water bond issuers within the state, given the financial strength of most water utilities. With regard to the state economy, the drought could slow growth in more agriculturally oriented areas, but they represent only 2% of California’s diverse economy.
6
| Fund Characteristics |
| AUGUST 31, 2015 | |
| Portfolio at a Glance | |
| Weighted Average Maturity | 9.0 years |
| Average Duration (Modified) | 4.5 years |
| Top Five Sectors | % of fund investments |
| Public Power | 13% |
| Lease Revenue | 11% |
| General Obligation (GO) - Local | 11% |
| General Obligation (GO) - State | 10% |
| Prerefunded | 9% |
| Types of Investments in Portfolio | % of net assets |
| Municipal Securities | 99.0% |
| Other Assets and Liabilities | 1.0% |
7
| Shareholder Fee Example |
Fund shareholders may incur two types of costs: (1) transaction costs, including sales charges (loads) on purchase payments and redemption/exchange fees; and (2) ongoing costs, including management fees; distribution and service (12b-1) fees; and other fund expenses. This example is intended to help you understand your ongoing costs (in dollars) of investing in your fund and to compare these costs with the ongoing cost of investing in other mutual funds.
The example is based on an investment of $1,000 made at the beginning of the period and held for the entire period from March 1, 2015 to August 31, 2015.
Actual Expenses
The table provides information about actual account values and actual expenses for each class. You may use the information, together with the amount you invested, to estimate the expenses that you paid over the period. First, identify the share class you own. Then simply divide your account value by $1,000 (for example, an $8,600 account value divided by $1,000 = 8.6), then multiply the result by the number under the heading “Expenses Paid During Period” to estimate the expenses you paid on your account during this period.
If you hold Investor Class shares of any American Century Investments fund, or Institutional Class shares of the American Century Diversified Bond Fund, in an American Century Investments account (i.e., not a financial intermediary or retirement plan account), American Century Investments may charge you a $12.50 semiannual account maintenance fee if the value of those shares is less than $10,000. We will redeem shares automatically in one of your accounts to pay the $12.50 fee. In determining your total eligible investment amount, we will include your investments in all personal accounts (including American Century Investments Brokerage accounts) registered under your Social Security number. Personal accounts include individual accounts, joint accounts, UGMA/UTMA accounts, personal trusts, Coverdell Education Savings Accounts and IRAs (including traditional, Roth, Rollover, SEP-, SARSEP- and SIMPLE-IRAs), and certain other retirement accounts. If you have only business, business retirement, employer-sponsored or American Century Investments Brokerage accounts, you are currently not subject to this fee. If you are subject to the Account Maintenance Fee, your account value could be reduced by the fee amount.
Hypothetical Example for Comparison Purposes
The table also provides information about hypothetical account values and hypothetical expenses based on the actual expense ratio of each class of your fund and an assumed rate of return of 5% per year before expenses, which is not the actual return of a fund’s share class. The hypothetical account values and expenses may not be used to estimate the actual ending account balance or expenses you paid for the period. You may use this information to compare the ongoing costs of investing in your fund and other funds. To do so, compare this 5% hypothetical example with the 5% hypothetical examples that appear in the shareholder reports of the other funds.
Please note that the expenses shown in the table are meant to highlight your ongoing costs only and do not reflect any transactional costs, such as sales charges (loads) or redemption/exchange fees. Therefore, the table is useful in comparing ongoing costs only, and will not help you determine the relative total costs of owning different funds. In addition, if these transactional costs were included, your costs would have been higher.
8
| Beginning Account Value 3/1/15 | Ending Account Value 8/31/15 | Expenses Paid During Period(1)3/1/15 - 8/31/15 | Annualized Expense Ratio(1) | |
| Actual | ||||
| Investor Class | $1,000 | $1,002.80 | $2.37 | 0.47% |
| Institutional Class | $1,000 | $1,003.00 | $1.36 | 0.27% |
| A Class | $1,000 | $1,000.70 | $3.63 | 0.72% |
| C Class | $1,000 | $997.80 | $7.40 | 1.47% |
| Hypothetical | ||||
| Investor Class | $1,000 | $1,022.84 | $2.40 | 0.47% |
| Institutional Class | $1,000 | $1,023.84 | $1.38 | 0.27% |
| A Class | $1,000 | $1,021.58 | $3.67 | 0.72% |
| C Class | $1,000 | $1,017.80 | $7.48 | 1.47% |
| (1) | Expenses are equal to the class's annualized expense ratio listed in the table above, multiplied by the average account value over the period, multiplied by 184, the number of days in the most recent fiscal half-year, divided by 365, to reflect the one-half year period. |
9
| Schedule of Investments |
AUGUST 31, 2015
| Principal Amount | Value | |||||
| MUNICIPAL SECURITIES — 99.0% | ||||||
| California — 98.5% | ||||||
| ABAG Finance Authority for Nonprofit Corps. Rev., Series 2011 A, (Sharp HealthCare), 6.00%, 8/1/30 | $ | 2,500,000 | $ | 3,036,650 | ||
| ABAG Finance Authority for Nonprofit Corps. Rev., Series 2012, (Jackson Laboratory), 4.00%, 7/1/16 | 270,000 | 277,800 | ||||
| ABAG Finance Authority for Nonprofit Corps. Rev., Series 2012, (Jackson Laboratory), 5.00%, 7/1/17 | 1,000,000 | 1,073,610 | ||||
| ABAG Finance Authority for Nonprofit Corps. Rev., Series 2012, (Jackson Laboratory), 5.00%, 7/1/18 | 500,000 | 551,730 | ||||
| ABAG Finance Authority for Nonprofit Corps. Rev., Series 2014 A, (Sharp HealthCare), 5.00%, 8/1/33 | 1,450,000 | 1,638,790 | ||||
Alameda Corridor Transportation Authority Rev., Capital Appreciation, Series 1999 A, (Senior Lien), 0.00%, 10/1/35 (NATL-RE)(1) | 9,000,000 | 3,781,080 | ||||
| Alameda Corridor Transportation Authority Rev., Series 2013 A, (Senior Lien), 5.00%, 10/1/20 | 3,010,000 | 3,525,312 | ||||
| Alameda Corridor Transportation Authority Rev., Series 2013 A, (Senior Lien), 5.00%, 10/1/24 | 2,000,000 | 2,391,720 | ||||
| Alum Rock Union Elementary School District GO, Series 2013 A, (Election of 2012), 6.00%, 8/1/39 | 1,500,000 | 1,831,530 | ||||
| Anaheim Public Financing Authority Rev., Series 2011 A, (Electric System Distribution Facilities), 5.375%, 10/1/36 | 700,000 | 817,460 | ||||
| Anaheim Public Financing Authority Rev., Series 2012 A, (Electric System Distribution Facilities), 5.00%, 10/1/23 | 1,200,000 | 1,443,012 | ||||
| Anaheim Public Financing Authority Rev., Series 2012 A, (Electric System Distribution Facilities), 5.00%, 10/1/24 | 2,275,000 | 2,711,618 | ||||
| Anaheim Public Financing Authority Rev., Series 2014 A, (Anaheim Convention Center Expansion Project), 5.00%, 5/1/25 | 1,000,000 | 1,191,420 | ||||
| Anaheim Public Financing Authority Rev., Series 2014 A, (Anaheim Convention Center Expansion Project), 5.00%, 5/1/28 | 1,100,000 | 1,280,147 | ||||
| Anaheim Public Financing Authority Rev., Series 2014 A, (Anaheim Convention Center Expansion Project), 5.00%, 5/1/29 | 1,250,000 | 1,443,625 | ||||
| Anaheim Public Financing Authority Rev., Series 2014 A, (Anaheim Convention Center Expansion Project), 5.00%, 5/1/34 | 3,360,000 | 3,800,866 | ||||
| Anaheim Public Financing Authority Rev., Series 2014 A, (Anaheim Convention Center Expansion Project), 5.00%, 5/1/39 | 1,550,000 | 1,740,929 | ||||
| Anaheim Public Financing Authority Rev., Series 2014 A, (Anaheim Convention Center Expansion Project), 5.00%, 5/1/46 | 2,000,000 | 2,233,340 | ||||
| Bay Area Toll Authority Toll Bridge Rev., Series 2001 A, (San Francisco Bay Area), VRDN, 1.27%, 9/3/15 | 5,000,000 | 4,919,250 | ||||
| Bay Area Toll Authority Toll Bridge Rev., Series 2007 A-1, (San Francisco Bay Area), VRDN, 0.72%, 9/3/15 | 1,000,000 | 995,680 | ||||
Bay Area Toll Authority Toll Bridge Rev., Series 2007 F, (San Francisco Bay Area), 5.00%, 4/1/17, Prerefunded at 100% of Par(2) | 2,000,000 | 2,142,920 | ||||
| Bay Area Toll Authority Toll Bridge Rev., Series 2008 G-1, (San Francisco Bay Area), VRDN, 1.12%, 9/3/15 | 2,500,000 | 2,475,675 | ||||
Bay Area Toll Authority Toll Bridge Rev., Series 2009 F-1, (San Francisco Bay Area), 5.25%, 4/1/19, Prerefunded at 100% of Par(2) | 5,000,000 | 5,756,650 | ||||
| Bay Area Toll Authority Toll Bridge Rev., Series 2012 F-1, (San Francisco Bay Area), 5.00%, 4/1/24 | 1,500,000 | 1,800,870 | ||||
| Bay Area Toll Authority Toll Bridge Rev., Series 2012 F-1, (San Francisco Bay Area), 5.00%, 4/1/25 | 3,500,000 | 4,186,980 | ||||
10
| Principal Amount | Value | |||||
| Bay Area Toll Authority Toll Bridge Rev., Series 2012 F-1, (San Francisco Bay Area), 5.00%, 4/1/28 | $ | 7,185,000 | $ | 8,384,176 | ||
| Bay Area Toll Authority Toll Bridge Rev., Series 2013 S-4, (San Francisco Bay Area), 5.00%, 4/1/43 | 5,610,000 | 6,229,176 | ||||
| Bay Area Toll Authority Toll Bridge Rev., Series 2014 B, (San Francisco Bay Area), VRDN, 1.50%, 4/2/18 | 3,000,000 | 3,029,580 | ||||
| Bay Area Toll Authority Toll Bridge Rev., Series 2014 E, (San Francisco Bay Area), 2.00%, 4/1/34 | 2,000,000 | 2,019,140 | ||||
| Bay Area Toll Authority Toll Bridge Rev., Series 2014 S-6, (San Francisco Bay Area), 5.00%, 10/1/54 | 8,500,000 | 9,246,895 | ||||
| California Department of Water Resources Power Supply Rev., Series 2005 F-5, 5.00%, 5/1/22 | 1,800,000 | 1,998,450 | ||||
| California Department of Water Resources Power Supply Rev., Series 2005 G-4, 5.00%, 5/1/16 | 3,230,000 | 3,333,231 | ||||
California Department of Water Resources Power Supply Rev., Series 2008 H, 5.00%, 5/1/18, Prerefunded at 100% of Par(2) | 3,570,000 | 3,968,341 | ||||
| California Department of Water Resources Power Supply Rev., Series 2008 H, 5.00%, 5/1/21 | 1,430,000 | 1,588,601 | ||||
California Department of Water Resources Power Supply Rev., Series 2009 AG, (Center Valley Project), 5.00%, 12/1/19, Prerefunded at 100% of Par(2) | 905,000 | 1,053,936 | ||||
| California Department of Water Resources Power Supply Rev., Series 2009 AG, (Center Valley Project), 5.00%, 12/1/25 | 95,000 | 109,614 | ||||
| California Department of Water Resources Power Supply Rev., Series 2010 L, 5.00%, 5/1/16 | 5,000,000 | 5,159,800 | ||||
| California Department of Water Resources Power Supply Rev., Series 2010 L, 5.00%, 5/1/17 | 5,000,000 | 5,376,150 | ||||
| California Department of Water Resources Power Supply Rev., Series 2010 L, 5.00%, 5/1/18 | 3,000,000 | 3,335,430 | ||||
| California Department of Water Resources Power Supply Rev., Series 2010 L, 5.00%, 5/1/19 | 7,000,000 | 8,009,190 | ||||
California Department of Water Resources Power Supply Rev., Series 2010 L, 5.00%, 5/1/20, Prerefunded at 100% of Par(2) | 1,860,000 | 2,179,381 | ||||
California Department of Water Resources Power Supply Rev., Series 2010 L, 5.00%, 5/1/20, Prerefunded at 100% of Par(2) | 11,165,000 | 13,082,142 | ||||
| California Department of Water Resources Power Supply Rev., Series 2010 L, 5.00%, 5/1/21 | 1,140,000 | 1,322,149 | ||||
| California Department of Water Resources Power Supply Rev., Series 2010 L, 5.00%, 5/1/22 | 6,835,000 | 7,910,351 | ||||
| California Department of Water Resources Power Supply Rev., Series 2010 M, 5.00%, 5/1/16 | 2,000,000 | 2,063,920 | ||||
| California Department of Water Resources Power Supply Rev., Series 2011 N, 5.00%, 5/1/20 | 14,215,000 | 16,659,411 | ||||
| California Department of Water Resources Power Supply Rev., Series 2011 N, 5.00%, 5/1/21 | 10,000,000 | 11,938,800 | ||||
| California Department of Water Resources Rev., Series 2014 AT, (Center Valley Project), VRDN, 0.32%, 9/3/15 | 4,500,000 | 4,483,755 | ||||
California Economic Recovery GO, Series 2009 A, 5.00%, 7/1/16, Prerefunded at 100% of Par(2) | 2,000,000 | 2,079,280 | ||||
California Economic Recovery GO, Series 2009 A, 5.00%, 7/1/18(2) | 5,435,000 | 6,075,623 | ||||
California Economic Recovery GO, Series 2009 A, 5.00%, 7/1/18(2) | 1,565,000 | 1,749,467 | ||||
California Economic Recovery GO, Series 2009 A, 5.00%, 7/1/19(2) | 4,505,000 | 5,187,417 | ||||
| California Educational Facilities Authority Rev., (Chapman University), 5.00%, 4/1/21 | 750,000 | 871,223 | ||||
| California Educational Facilities Authority Rev., (Chapman University), 5.00%, 4/1/24 | 930,000 | 1,106,216 | ||||
11
| Principal Amount | Value | |||||
| California Educational Facilities Authority Rev., (Chapman University), 5.00%, 4/1/31 | $ | 1,455,000 | $ | 1,613,013 | ||
| California Educational Facilities Authority Rev., (San Francisco University), 5.00%, 10/1/16 | 1,200,000 | 1,261,284 | ||||
| California Educational Facilities Authority Rev., (San Francisco University), 5.00%, 10/1/21 | 750,000 | 884,730 | ||||
| California Educational Facilities Authority Rev., (Santa Clara University), 5.00%, 4/1/18 | 500,000 | 551,690 | ||||
| California Educational Facilities Authority Rev., (Santa Clara University), 5.00%, 4/1/19 | 700,000 | 776,279 | ||||
| California Educational Facilities Authority Rev., (Santa Clara University), 5.25%, 4/1/23 | 2,000,000 | 2,210,600 | ||||
California Educational Facilities Authority Rev., (University of the Pacific), 5.00%, 11/1/15, Prerefunded at 100% of Par(2) | 70,000 | 70,562 | ||||
| California Educational Facilities Authority Rev., (University of the Pacific), 5.00%, 11/1/33 | 1,000,000 | 1,127,350 | ||||
| California Educational Facilities Authority Rev., (University of the Pacific), 5.00%, 11/1/36 | 975,000 | 982,829 | ||||
| California Educational Facilities Authority Rev., Series 2009 A, (Pomona College), 5.00%, 1/1/24 | 2,100,000 | 2,367,309 | ||||
| California Educational Facilities Authority Rev., Series 2009 A, (University of Southern California), 5.00%, 10/1/39 | 2,950,000 | 3,257,360 | ||||
| California Educational Facilities Authority Rev., Series 2010 A, (Loyola Marymount University), 5.00%, 10/1/30 | 1,365,000 | 1,530,192 | ||||
| California Educational Facilities Authority Rev., Series 2012 A, (University of the Pacific), 4.50%, 11/1/15 | 1,240,000 | 1,248,730 | ||||
| California Educational Facilities Authority Rev., Series 2012 A, (University of the Pacific), 4.50%, 11/1/17 | 1,000,000 | 1,077,720 | ||||
| California Educational Facilities Authority Rev., Series 2015 A, (University of Southern California), 5.00%, 10/1/25 | 1,875,000 | 2,353,687 | ||||
| California GO, 5.00%, 9/1/15 | 9,115,000 | 9,115,000 | ||||
| California GO, 5.00%, 11/1/16 (Ambac) | 1,575,000 | 1,661,830 | ||||
| California GO, 5.00%, 9/1/17 | 2,500,000 | 2,716,425 | ||||
| California GO, 5.00%, 10/1/17 | 2,170,000 | 2,364,996 | ||||
| California GO, 5.50%, 4/1/18 | 2,535,000 | 2,836,259 | ||||
| California GO, 5.00%, 8/1/18 | 2,260,000 | 2,403,826 | ||||
| California GO, 5.00%, 9/1/18 | 1,000,000 | 1,120,440 | ||||
| California GO, 5.00%, 9/1/19 | 7,645,000 | 8,778,295 | ||||
| California GO, 5.00%, 3/1/20 | 1,690,000 | 1,852,730 | ||||
| California GO, 5.00%, 8/1/20 | 5,000,000 | 5,316,700 | ||||
| California GO, 5.25%, 10/1/20 | 5,000,000 | 5,826,250 | ||||
| California GO, 5.00%, 3/1/22 | 5,000,000 | 5,116,550 | ||||
| California GO, 5.00%, 9/1/22 | 2,000,000 | 2,393,460 | ||||
| California GO, 5.00%, 3/1/23 | 10,000,000 | 11,997,900 | ||||
| California GO, 5.50%, 4/1/24 | 4,600,000 | 5,319,762 | ||||
| California GO, 5.00%, 8/1/24 | 1,260,000 | 1,337,629 | ||||
California GO, 5.00%, 8/1/26(3) | 4,800,000 | 5,805,504 | ||||
| California GO, 5.00%, 12/1/26 | 1,045,000 | 1,246,716 | ||||
| California GO, 5.00%, 2/1/27 | 14,000,000 | 16,362,500 | ||||
| California GO, 5.00%, 2/1/28 | 5,795,000 | 6,742,367 | ||||
| California GO, 5.00%, 3/1/28 | 8,000,000 | 9,467,840 | ||||
| California GO, 5.75%, 4/1/28 | 5,000,000 | 5,808,900 | ||||
| California GO, 5.00%, 11/1/29 | 2,625,000 | 3,066,840 | ||||
12
| Principal Amount | Value | |||||
| California GO, 5.75%, 4/1/31 | $ | 5,000,000 | $ | 5,793,650 | ||
| California GO, 5.00%, 11/1/32 | 1,890,000 | 2,044,394 | ||||
| California GO, 6.50%, 4/1/33 | 5,000,000 | 5,924,750 | ||||
| California GO, 6.00%, 4/1/38 | 3,000,000 | 3,496,650 | ||||
| California GO, Series 2012 B, VRN, 0.92%, 9/3/15 | 2,000,000 | 2,018,600 | ||||
| California GO, Series 2012 B, VRN, 1.02%, 9/3/15 | 800,000 | 811,312 | ||||
| California GO, Series 2012 B, VRN, 1.17%, 9/3/15 | 960,000 | 981,802 | ||||
| California GO, VRDN, 4.00%, 12/1/16 | 3,000,000 | 3,081,660 | ||||
| California Health Facilities Financing Authority Rev., (Cedars-Sinai Medical Center), 5.00%, 8/15/18 | 1,000,000 | 1,117,840 | ||||
| California Health Facilities Financing Authority Rev., (NCROC Paradise Valley Estates), 5.70%, 12/1/24 (Ambac/California Mortgage Insurance) | 1,455,000 | 1,650,086 | ||||
| California Health Facilities Financing Authority Rev., Series 2008 A, (Lucile Salter Packard Children's Hospital), VRDN, 1.45%, 3/15/17 | 2,000,000 | 2,026,960 | ||||
| California Health Facilities Financing Authority Rev., Series 2008 A, (Scripps Health), 5.00%, 10/1/17 | 1,400,000 | 1,526,406 | ||||
| California Health Facilities Financing Authority Rev., Series 2008 A, (Sutter Health), 5.50%, 8/15/17 | 1,000,000 | 1,097,340 | ||||
| California Health Facilities Financing Authority Rev., Series 2008 A, (Sutter Health), 5.25%, 8/15/22 | 3,335,000 | 3,751,408 | ||||
| California Health Facilities Financing Authority Rev., Series 2008 B, (Lucile Salter Packard Children's Hospital), VRDN, 1.45%, 3/15/17 | 2,200,000 | 2,229,656 | ||||
| California Health Facilities Financing Authority Rev., Series 2008 C, (Lucile Salter Packard Children's Hospital), VRDN, 1.45%, 3/15/17 | 1,355,000 | 1,373,265 | ||||
California Health Facilities Financing Authority Rev., Series 2008 C, (Providence Health & Services), 6.25%, 10/1/18, Prerefunded at 100% of Par(2) | 3,250,000 | 3,785,080 | ||||
California Health Facilities Financing Authority Rev., Series 2008 C, (Providence Health & Services), 6.50%, 10/1/18, Prerefunded at 100% of Par(2) | 40,000 | 46,876 | ||||
California Health Facilities Financing Authority Rev., Series 2008 C, (Providence Health & Services), 6.50%, 10/1/18, Prerefunded at 100% of Par(2) | 2,085,000 | 2,443,411 | ||||
| California Health Facilities Financing Authority Rev., Series 2009 A, (Catholic Healthcare West), 5.00%, 7/1/18 | 3,000,000 | 3,329,460 | ||||
| California Health Facilities Financing Authority Rev., Series 2009 A, (Children's Hospital of Orange County), 6.25%, 11/1/29 | 5,000,000 | 5,915,650 | ||||
| California Health Facilities Financing Authority Rev., Series 2009 A, (St. Joseph Health System), 5.50%, 7/1/29 | 1,500,000 | 1,708,230 | ||||
| California Health Facilities Financing Authority Rev., Series 2009 A, (St. Joseph Health System), 5.75%, 7/1/39 | 1,000,000 | 1,144,450 | ||||
| California Health Facilities Financing Authority Rev., Series 2009 C, (St. Joseph Health System), VRDN, 5.00%, 10/18/22 | 11,020,000 | 13,169,782 | ||||
| California Health Facilities Financing Authority Rev., Series 2010 A, (Stanford Hospital), 5.00%, 11/15/25 | 2,000,000 | 2,281,480 | ||||
| California Health Facilities Financing Authority Rev., Series 2011 B, (St. Joseph Health System), VRDN, 0.01%, 9/1/15 (LOC: U.S. Bank N.A.) | 2,900,000 | 2,900,000 | ||||
| California Health Facilities Financing Authority Rev., Series 2011 B, (Sutter Health), 6.00%, 8/15/42 | 1,000,000 | 1,182,820 | ||||
| California Health Facilities Financing Authority Rev., Series 2011 D, (Sutter Health), 5.00%, 8/15/18 | 1,305,000 | 1,462,044 | ||||
| California Health Facilities Financing Authority Rev., Series 2011 D, (Sutter Health), 5.00%, 8/15/22 | 1,650,000 | 1,972,954 | ||||
| California Health Facilities Financing Authority Rev., Series 2012 A, (Stanford Hospital & Clinics), 5.00%, 8/15/51 | 1,000,000 | 1,087,370 | ||||
13
| Principal Amount | Value | |||||
| California Health Facilities Financing Authority Rev., Series 2012 B, (Lucile Salter Packard Children's Hospital), 5.00%, 8/15/25 | $ | 5,855,000 | $ | 6,793,791 | ||
| California Health Facilities Financing Authority Rev., Series 2013 A, (St. Joseph Health System), 5.00%, 7/1/37 | 890,000 | 995,607 | ||||
| California Health Facilities Financing Authority Rev., Series 2013 A, (Sutter Health), 5.00%, 8/15/52 | 4,000,000 | 4,361,240 | ||||
| California Infrastructure & Economic Development Bank Rev., (Columbia College), VRDN, 0.06%, 9/3/15 (LOC: Rabobank Nederland N.V.) | 1,520,000 | 1,520,000 | ||||
| California Infrastructure & Economic Development Bank Rev., Series 2000 A, (Scripps Research Institute), 5.625%, 7/1/20 | 675,000 | 677,970 | ||||
California Infrastructure & Economic Development Bank Rev., Series 2003 A, (Bay Area Toll Bridges Seismic Retrofit 1st Lien), 5.125%, 7/1/26, Prerefunded at 100% of Par (Ambac)(2) | 5,000,000 | 6,389,000 | ||||
| California Infrastructure & Economic Development Bank Rev., Series 2010 A, (University of California, San Francisco Neuroscience Building), 5.00%, 5/15/22 | 3,735,000 | 4,346,681 | ||||
| California Infrastructure & Economic Development Bank Rev., Series 2011 A-1, (J. Paul Getty Trust), VRDN, 0.30%, 9/3/15 | 5,000,000 | 5,009,300 | ||||
| California Infrastructure & Economic Development Bank Rev., Series 2012 A-1, (J. Paul Getty Trust), 4.00%, 10/1/15 | 975,000 | 978,227 | ||||
| California Infrastructure & Economic Development Bank Rev., Series 2013 A, (Los Angeles County Museum of Art Project), VRDN, 1.89%, 9/3/15 | 3,000,000 | 3,086,640 | ||||
| California Infrastructure & Economic Development Bank Rev., Series 2015 A, (The Colburn School), VRDN, 1.02%, 9/3/15 | 4,375,000 | 4,351,856 | ||||
| California Infrastructure & Economic Development Bank Rev., Series 2015 B-2, (J. Paul Getty Trust), VRDN, 0.30%, 9/3/15 | 2,750,000 | 2,730,090 | ||||
| California Municipal Finance Authority Rev., (Community Hospitals Central), 5.00%, 2/1/17 | 2,000,000 | 2,112,860 | ||||
| California Municipal Finance Authority Rev., Series 2007, (Loma Linda University), 5.00%, 4/1/23 | 1,145,000 | 1,189,964 | ||||
| California Municipal Finance Authority Rev., Series 2007, (Loma Linda University), 5.00%, 4/1/28 | 2,000,000 | 2,060,100 | ||||
| California Municipal Finance Authority Rev., Series 2008 A, (Biola University), 5.00%, 10/1/18 | 1,000,000 | 1,095,380 | ||||
| California Municipal Finance Authority Rev., Series 2010 A, (Eisenhower Medical Center), 5.00%, 7/1/19 | 605,000 | 672,464 | ||||
| California Municipal Finance Authority Rev., Series 2010 A, (Eisenhower Medical Center), 5.25%, 7/1/21 | 1,760,000 | 1,997,494 | ||||
| California Municipal Finance Authority Rev., Series 2010 A, (University of Louisiana Verne), 5.00%, 6/1/17 | 2,290,000 | 2,422,202 | ||||
| California Municipal Finance Authority Rev., Series 2011, (Emerson College), 5.75%, 1/1/33 | 2,250,000 | 2,584,800 | ||||
| California Municipal Finance Authority Rev., Series 2011, (Emerson College), 6.00%, 1/1/42 | 1,000,000 | 1,193,450 | ||||
| California Municipal Finance Authority Rev., Series 2015 A, (Community Medical Centers), 5.00%, 2/1/22 | 1,000,000 | 1,143,880 | ||||
| California Municipal Finance Authority Rev., Series 2015 A, (Community Medical Centers), 5.00%, 2/1/23 | 520,000 | 599,409 | ||||
| California Municipal Finance Authority Rev., Series 2015 A, (Community Medical Centers), 5.00%, 2/1/25 | 1,925,000 | 2,238,582 | ||||
| California Municipal Finance Authority Rev., Series 2015 A, (Community Medical Centers), 5.00%, 2/1/27 | 295,000 | 335,810 | ||||
| California Municipal Finance Authority Rev., Series 2015 A, (Community Medical Centers), 5.00%, 2/1/28 | 735,000 | 826,177 | ||||
| California Municipal Finance Authority Rev., Series 2015 A, (Community Medical Centers), 5.00%, 2/1/29 | 1,000,000 | 1,115,600 | ||||
14
| Principal Amount | Value | |||||
| California Municipal Finance Authority Rev., Series 2015 B, (Azusa Pacific University), 5.00%, 4/1/27 | $ | 1,165,000 | $ | 1,301,305 | ||
| California Pollution Control Financing Authority Rev., Series 1996 C, (Pacific Gas & Electric Co.), VRDN, 0.01%, 9/1/15 (LOC: JPMorgan Chase Bank N.A.) | 3,300,000 | 3,300,000 | ||||
| California Public Works Board Lease Rev., Series 2006 A, (California State University), 5.00%, 10/1/16 (NATL-RE/FGIC) | 1,500,000 | 1,576,020 | ||||
| California Public Works Board Lease Rev., Series 2009 A, (Department of General Services - Building 8 & 9), 6.25%, 4/1/34 | 2,435,000 | 2,850,533 | ||||
| California Public Works Board Lease Rev., Series 2009 B, (Department of Education - Riverside Campus), 6.00%, 4/1/27 | 2,130,000 | 2,476,743 | ||||
| California Public Works Board Lease Rev., Series 2009 I-1, (Various Capital Projects), 6.375%, 11/1/34 | 2,500,000 | 3,000,125 | ||||
| California Public Works Board Lease Rev., Series 2011 D, (Judicial Council Projects), 5.00%, 12/1/15 | 4,000,000 | 4,048,720 | ||||
| California Public Works Board Lease Rev., Series 2011 D, (Judicial Council Projects), 5.25%, 12/1/26 | 2,000,000 | 2,401,080 | ||||
| California Public Works Board Lease Rev., Series 2012 A, (Various Capital Projects), 5.00%, 4/1/21 | 3,000,000 | 3,533,550 | ||||
| California Public Works Board Lease Rev., Series 2012 A, (Various Capital Projects), 5.00%, 4/1/22 | 2,100,000 | 2,504,691 | ||||
| California Public Works Board Lease Rev., Series 2012 A, (Various Capital Projects), 5.00%, 4/1/23 | 2,000,000 | 2,358,240 | ||||
| California Public Works Board Lease Rev., Series 2012 A, (Various Capital Projects), 5.00%, 4/1/25 | 1,800,000 | 2,111,544 | ||||
| California Public Works Board Lease Rev., Series 2012 A, (Various Capital Projects), 5.00%, 4/1/37 | 4,545,000 | 5,064,175 | ||||
| California Public Works Board Lease Rev., Series 2012 D, (California State University Projects), 5.00%, 9/1/36 | 1,000,000 | 1,109,440 | ||||
| California Public Works Board Lease Rev., Series 2012 G, (Various Capital Projects), 4.00%, 11/1/17 | 1,250,000 | 1,340,112 | ||||
| California Public Works Board Lease Rev., Series 2013 H, (California State University Projects), 5.00%, 9/1/38 | 4,500,000 | 5,054,220 | ||||
| California Public Works Board Lease Rev., Series 2013 I, (Various Capital Projects), 5.00%, 11/1/38 | 2,400,000 | 2,708,208 | ||||
| California Public Works Board Lease Rev., Series 2014 A, (Various Correctional Facilities), 5.00%, 9/1/25 | 5,000,000 | 6,007,750 | ||||
California School Finance Authority Rev., Series 2015 A, (Alliance for College-Ready Public School Project), 3.00%, 7/1/19(4) | 1,025,000 | 1,033,610 | ||||
California School Finance Authority Rev., Series 2015 A, (Alliance for College-Ready Public School Project), 3.00%, 7/1/20(4) | 1,115,000 | 1,116,204 | ||||
| California State University Systemwide Rev., Series 2011 A, 5.00%, 11/1/20 | 1,250,000 | 1,479,412 | ||||
| California State University Systemwide Rev., Series 2011 A, 5.00%, 11/1/24 | 5,000,000 | 5,873,850 | ||||
| California State University Systemwide Rev., Series 2014 A, 5.00%, 11/1/32 | 1,750,000 | 2,040,832 | ||||
| California State University Systemwide Rev., Series 2015 A, 5.00%, 11/1/18 | 1,800,000 | 2,032,254 | ||||
| California State University Systemwide Rev., Series 2015 A, 5.00%, 11/1/19 | 1,000,000 | 1,156,310 | ||||
| California State University Systemwide Rev., Series 2015 A, 5.00%, 11/1/21 | 1,000,000 | 1,196,580 | ||||
| California Statewide Communities Development Authority Rev., (Cottage Health System Obligated Group), 5.00%, 11/1/16 | 750,000 | 788,400 | ||||
| California Statewide Communities Development Authority Rev., (Cottage Health System Obligated Group), 5.00%, 11/1/17 | 815,000 | 885,017 | ||||
15
| Principal Amount | Value | |||||
| California Statewide Communities Development Authority Rev., (Cottage Health System Obligated Group), 4.00%, 11/1/18 | $ | 200,000 | $ | 217,898 | ||
| California Statewide Communities Development Authority Rev., (Cottage Health System Obligated Group), 5.00%, 11/1/18 | 515,000 | 574,622 | ||||
| California Statewide Communities Development Authority Rev., (Cottage Health System Obligated Group), 4.00%, 11/1/19 | 200,000 | 221,440 | ||||
| California Statewide Communities Development Authority Rev., (Cottage Health System Obligated Group), 5.00%, 11/1/20 | 100,000 | 116,548 | ||||
| California Statewide Communities Development Authority Rev., (Cottage Health System Obligated Group), 4.00%, 11/1/21 | 150,000 | 167,426 | ||||
| California Statewide Communities Development Authority Rev., (Cottage Health System Obligated Group), 5.00%, 11/1/22 | 125,000 | 148,205 | ||||
| California Statewide Communities Development Authority Rev., (Cottage Health System Obligated Group), 5.00%, 11/1/23 | 150,000 | 179,744 | ||||
| California Statewide Communities Development Authority Rev., (Cottage Health System Obligated Group), 5.00%, 11/1/24 | 200,000 | 239,968 | ||||
| California Statewide Communities Development Authority Rev., (John Muir Health), 5.00%, 7/1/20 | 2,225,000 | 2,552,542 | ||||
| California Statewide Communities Development Authority Rev., (Southern California Edison Co.), VRDN, 1.375%, 4/2/18 | 1,775,000 | 1,780,840 | ||||
| California Statewide Communities Development Authority Rev., (St. Joseph Remarketing), 5.125%, 7/1/24 (NATL-RE) | 2,000,000 | 2,224,020 | ||||
| California Statewide Communities Development Authority Rev., (Trinity Health Corp.), 5.00%, 12/1/41 | 1,570,000 | 1,740,109 | ||||
| California Statewide Communities Development Authority Rev., Series 2002 B, (Pooled Financing Program), 5.20%, 10/1/18 (AGM) | 440,000 | 441,782 | ||||
| California Statewide Communities Development Authority Rev., Series 2007 A, (California Baptist University), 5.30%, 11/1/18 | 1,480,000 | 1,564,227 | ||||
| California Statewide Communities Development Authority Rev., Series 2007 A, (California Baptist University), 5.40%, 11/1/27 | 1,000,000 | 1,035,550 | ||||
California Statewide Communities Development Authority Rev., Series 2007 A, (Henry Mayo Newhall Memorial Hospital), 5.00%, 10/1/17, Prerefunded at 100% of Par (California Mortgage Insurance)(2) | 1,000,000 | 1,090,840 | ||||
California Statewide Communities Development Authority Rev., Series 2007 A, (Valleycare Health System), 4.80%, 7/15/17(2) | 1,325,000 | 1,401,969 | ||||
California Statewide Communities Development Authority Rev., Series 2007 A, (Valleycare Health System), 5.00%, 7/15/17, Prerefunded at 100% of Par(2) | 2,460,000 | 2,663,393 | ||||
| California Statewide Communities Development Authority Rev., Series 2009 A, (Kaiser Permanente), 5.00%, 4/1/19 | 1,450,000 | 1,651,173 | ||||
| California Statewide Communities Development Authority Rev., Series 2009 E-2, (Kaiser Permanente), VRDN, 5.00%, 5/1/17 | 5,000,000 | 5,359,400 | ||||
| California Statewide Communities Development Authority Rev., Series 2012 A, (Kaiser Permanente), 5.00%, 4/1/42 | 8,400,000 | 9,220,344 | ||||
| California Statewide Communities Development Authority Rev., Series 2014 A, (Loma Linda University Medical Center), 5.25%, 12/1/29 | 1,500,000 | 1,617,810 | ||||
| California Statewide Communities Development Authority Rev., Series 2014 B, (Huntington Memorial Hospital), 5.00%, 7/1/22 | 475,000 | 553,380 | ||||
| California Statewide Communities Development Authority Rev., Series 2014 B, (Huntington Memorial Hospital), 5.00%, 7/1/23 | 600,000 | 703,770 | ||||
| California Statewide Communities Development Authority Rev., Series 2014 B, (Huntington Memorial Hospital), 5.00%, 7/1/24 | 750,000 | 887,003 | ||||
| California Statewide Communities Development Authority Rev., Series 2014 B, (Huntington Memorial Hospital), 5.00%, 7/1/25 | 800,000 | 932,104 | ||||
| California Statewide Communities Development Authority Rev., Series 2014 B, (Huntington Memorial Hospital), 5.00%, 7/1/26 | 885,000 | 1,023,299 | ||||
16
| Principal Amount | Value | |||||
| California Statewide Communities Development Authority Rev., Series 2014 B, (Huntington Memorial Hospital), 5.00%, 7/1/27 | $ | 1,880,000 | $ | 2,161,173 | ||
| California Statewide Communities Development Authority Rev., Series 2014 B, (Los Angeles Jewish Home), 3.00%, 8/1/21 (GA: Jewish Home Foundation/California Mortgage Insurance) | 3,900,000 | 3,959,592 | ||||
| California Statewide Communities Development Authority Rev., Series 2015 A, (Adventist Health System/West), 5.00%, 3/1/23 | 1,190,000 | 1,386,148 | ||||
| California Statewide Communities Development Authority Rev., Series 2015 A, (Adventist Health System/West), 5.00%, 3/1/24 | 800,000 | 939,040 | ||||
| California Statewide Communities Development Authority Rev., Series 2015 A, (Adventist Health System/West), 5.00%, 3/1/25 | 750,000 | 885,683 | ||||
| California Statewide Communities Development Authority Rev., Series 2015 A, (Adventist Health System/West), 5.00%, 3/1/26 | 1,000,000 | 1,184,150 | ||||
| California Statewide Communities Development Authority Rev., Series 2015 A, (Adventist Health System/West), 5.00%, 3/1/27 | 1,590,000 | 1,859,807 | ||||
Calleguas-Las Virgenes Public Financing Authority Rev., Series 2007 A, (Municipal Water District), 5.00%, 7/1/16, Prerefunded at 100% of Par (NATL-RE/FGIC)(2) | 1,000,000 | 1,040,070 | ||||
| Capistrano Unified School District Special Tax Rev., (Community Facilities District No. 87-1), 5.00%, 9/1/18 (Ambac) | 3,115,000 | 3,250,658 | ||||
| Carson Redevelopment Agency Successor Agency Tax Allocation Rev., Series 2014 A, (Merged and Amended Project Area), 4.00%, 10/1/15 | 625,000 | 626,994 | ||||
| Carson Redevelopment Agency Successor Agency Tax Allocation Rev., Series 2014 A, (Merged and Amended Project Area), 4.00%, 10/1/16 | 525,000 | 545,375 | ||||
| Carson Redevelopment Agency Successor Agency Tax Allocation Rev., Series 2014 A, (Merged and Amended Project Area), 4.00%, 10/1/17 | 675,000 | 719,672 | ||||
| Carson Redevelopment Agency Successor Agency Tax Allocation Rev., Series 2014 A, (Project Area No. 1), 5.00%, 10/1/19 (AGM) | 315,000 | 356,495 | ||||
| Chaffey Joint Union High School District GO, Series 2013 A, (Election of 2012), 5.00%, 8/1/30 | 3,125,000 | 3,595,687 | ||||
| Chaffey Joint Union High School District GO, Series 2013 A, (Election of 2012), 5.00%, 8/1/32 | 1,220,000 | 1,393,545 | ||||
| Chula Vista Rev., Series 2006 A, (San Diego Gas and Electric), 1.65%, 7/1/18 | 8,165,000 | 8,171,287 | ||||
| City of Fontana Special Tax Rev., (Community Facilities District No. 22), 4.00%, 9/1/18 | 740,000 | 790,919 | ||||
| City of Fontana Special Tax Rev., (Community Facilities District No. 22), 4.00%, 9/1/19 | 390,000 | 421,610 | ||||
| City of Fontana Special Tax Rev., (Community Facilities District No. 22), 5.00%, 9/1/20 | 545,000 | 616,221 | ||||
| City of Fontana Special Tax Rev., (Community Facilities District No. 22), 5.00%, 9/1/22 | 520,000 | 597,958 | ||||
| City of Fontana Special Tax Rev., (Community Facilities District No. 22), 5.00%, 9/1/24 | 575,000 | 667,397 | ||||
| City of Irvine Improvement Bond Act of 1915 Special Assessment Rev., (Assessment District No. 15-1), 2.00%, 9/2/16 | 850,000 | 862,351 | ||||
| City of Irvine Improvement Bond Act of 1915 Special Assessment Rev., (Assessment District No. 15-1), 4.00%, 9/2/17 | 360,000 | 381,838 | ||||
| City of Irvine Improvement Bond Act of 1915 Special Assessment Rev., (Assessment District No. 12-1), 4.00%, 9/2/17 | 850,000 | 901,561 | ||||
| City of Irvine Improvement Bond Act of 1915 Special Assessment Rev., (Assessment District No. 12-1), 4.00%, 9/2/18 | 875,000 | 945,403 | ||||
| City of Irvine Improvement Bond Act of 1915 Special Assessment Rev., (Assessment District No. 15-1), 4.00%, 9/2/19 | 1,375,000 | 1,505,006 | ||||
| City of Irvine Improvement Bond Act of 1915 Special Assessment Rev., (Assessment District No. 12-1), 4.00%, 9/2/19 | 1,400,000 | 1,534,288 | ||||
17
| Principal Amount | Value | |||||
| City of Irvine Improvement Bond Act of 1915 Special Assessment Rev., (Assessment District No. 15-1), 5.00%, 9/2/26 | $ | 500,000 | $ | 594,485 | ||
| City of La Verne COP, (Brethren Hillcrest Homes), 5.00%, 5/15/20 | 640,000 | 716,275 | ||||
| City of La Verne COP, (Brethren Hillcrest Homes), 5.00%, 5/15/21 | 315,000 | 354,233 | ||||
| City of La Verne COP, (Brethren Hillcrest Homes), 5.00%, 5/15/22 | 225,000 | 253,663 | ||||
| City of Riverside Sewer Rev., Series 2015 A, 5.00%, 8/1/25 | 1,630,000 | 1,962,373 | ||||
| City of Riverside Sewer Rev., Series 2015 A, 5.00%, 8/1/26 | 3,400,000 | 4,041,580 | ||||
City of Roseville Water Utility COP, 5.00%, 12/1/26(3) | 1,690,000 | 2,052,251 | ||||
City of Roseville Water Utility COP, 5.00%, 12/1/27(3) | 2,250,000 | 2,702,745 | ||||
Clovis Unified School District GO, Capital Appreciation, Series 2004 A, (Election of 2004), 0.00%, 8/1/24 (NATL-RE)(1) | 5,935,000 | 4,728,830 | ||||
| Corcoran Joint Unified School District COP, VRDN, 2.70%, 12/1/21 (AGM) | 4,500,000 | 4,506,165 | ||||
Del Mar Race Track Authority Rev., 4.00%, 10/1/20(4) | 1,330,000 | 1,436,067 | ||||
| East Side Union High School District GO, Series 2012, 5.00%, 8/1/25 | 1,405,000 | 1,633,355 | ||||
| East Side Union High School District GO, Series 2013, 5.00%, 8/1/29 | 2,450,000 | 2,802,236 | ||||
| Eastern Municipal Water District Water & Sewer COP, Series 2008 H, 5.00%, 7/1/24 | 1,000,000 | 1,108,530 | ||||
| Eastern Municipal Water District Water & Sewer Rev., Series 2011 A, 4.00%, 7/1/16 | 600,000 | 618,972 | ||||
| Fairfield Redevelopment Agency Tax Allocation Rev., 4.00%, 8/1/16 | 1,525,000 | 1,576,011 | ||||
| Folsom Cordova Unified School District No. 2 Facilities Improvement GO, Series 2014, 4.00%, 10/1/15 | 570,000 | 571,864 | ||||
| Folsom Cordova Unified School District No. 4 Facilities Improvement GO, Series 2014 A, (Election of 2012), 4.00%, 10/1/15 | 605,000 | 606,960 | ||||
Foothill/Eastern Transportation Corridor Agency Toll Road Rev., Capital Appreciation, Series 1995 A, (Senior Lien), 0.00%, 1/1/26(1)(2) | 10,000,000 | 7,669,000 | ||||
Foothill/Eastern Transportation Corridor Agency Toll Road Rev., Capital Appreciation, Series 2013 A, 0.00%, 1/15/24(5) | 1,600,000 | 1,204,464 | ||||
Foothill/Eastern Transportation Corridor Agency Toll Road Rev., Capital Appreciation, Series 2013 A, 0.00%, 1/15/42(1) | 4,820,000 | 1,364,687 | ||||
| Foothill/Eastern Transportation Corridor Agency Toll Road Rev., Series 2013 A, 6.00%, 1/15/49 | 3,000,000 | 3,513,960 | ||||
| Foothill/Eastern Transportation Corridor Agency Toll Road Rev., Series 2013 B-1, VRDN, 5.00%, 1/15/18 | 3,750,000 | 3,979,612 | ||||
| Foothill/Eastern Transportation Corridor Agency Toll Road Rev., Series 2013 B-2, VRDN, 5.00%, 1/15/20 | 5,000,000 | 5,494,800 | ||||
| Foothill/Eastern Transportation Corridor Agency Toll Road Rev., Series 2013 B-3, VRDN, 5.50%, 1/15/23 | 2,750,000 | 3,169,375 | ||||
| Foothill/Eastern Transportation Corridor Agency Toll Road Rev., Series 2013 C, (Junior Lien), 6.25%, 1/15/33 | 3,000,000 | 3,532,110 | ||||
Golden State Tobacco Securitization Corp. Settlement Rev., Capital Appreciation, Series 2005 A, 0.00%, 6/1/25 (AGM)(1) | 2,000,000 | 1,484,960 | ||||
| Golden State Tobacco Securitization Corp. Settlement Rev., Series 2007 A-1, 4.50%, 6/1/27 | 1,270,000 | 1,212,152 | ||||
| Golden State Tobacco Securitization Corp. Settlement Rev., Series 2007 A-1, 5.00%, 6/1/33 | 1,250,000 | 1,062,638 | ||||
| Golden State Tobacco Securitization Corp. Settlement Rev., Series 2013 A, 5.00%, 6/1/21 | 1,000,000 | 1,174,900 | ||||
| Golden State Tobacco Securitization Corp. Settlement Rev., Series 2013 A, 5.00%, 6/1/29 | 6,650,000 | 7,568,232 | ||||
18
| Principal Amount | Value | |||||
| Golden State Tobacco Securitization Corp. Settlement Rev., Series 2013 A, 5.00%, 6/1/30 | $ | 1,000,000 | $ | 1,132,910 | ||
| Golden State Tobacco Securitization Corp. Settlement Rev., Series 2015 A, 3.00%, 6/1/17 | 1,000,000 | 1,040,970 | ||||
| Golden State Tobacco Securitization Corp. Settlement Rev., Series 2015 A, 4.00%, 6/1/18 | 2,885,000 | 3,123,647 | ||||
| Golden State Tobacco Securitization Corp. Settlement Rev., Series 2015 A, 5.00%, 6/1/19 | 1,000,000 | 1,138,250 | ||||
| Golden State Tobacco Securitization Corp. Settlement Rev., Series 2015 A, 5.00%, 6/1/20 | 1,000,000 | 1,159,990 | ||||
| Golden State Tobacco Securitization Corp. Settlement Rev., Series 2015 A, 5.00%, 6/1/21 | 1,000,000 | 1,174,900 | ||||
| Grossmont-Cuyamaca Community College District GO, Series 2013 A, (Election of 2012), 5.00%, 8/1/25 | 680,000 | 809,880 | ||||
| Grossmont-Cuyamaca Community College District GO, Series 2013 A, (Election of 2012), 5.00%, 8/1/26 | 685,000 | 808,019 | ||||
| Grossmont-Cuyamaca Community College District GO, Series 2013 A, (Election of 2012), 5.25%, 8/1/27 | 750,000 | 903,915 | ||||
| Hayward Area Recreation and Park District COP, 5.125%, 1/1/39 | 1,750,000 | 1,939,245 | ||||
| Huntington Beach Union High School District GO, 5.00%, 8/1/26 | 3,030,000 | 3,593,277 | ||||
| Inland Valley Development Agency Tax Allocation Rev., Series 2014 A, 5.25%, 9/1/37 | 1,110,000 | 1,231,934 | ||||
| Inland Valley Development Agency Tax Allocation Rev., Series 2014 A, 5.00%, 9/1/44 | 1,175,000 | 1,258,966 | ||||
| Irvine Community Facilities District No. 2013-3 Special Tax Rev., (Great Park Improvement Area No.1), 5.00%, 9/1/39 | 1,000,000 | 1,076,000 | ||||
| Irvine Ranch Water District Rev., Series 2009 B, VRDN, 0.01%, 9/1/15 (LOC: Bank of America N.A.) | 3,900,000 | 3,900,000 | ||||
| Irvine Unified School District Financing Authority Special Tax Rev., Series 2006 A, (Group II), 4.75%, 9/1/16 | 600,000 | 617,736 | ||||
| Irvine Unified School District Financing Authority Special Tax Rev., Series 2006 A, (Group II), 5.00%, 9/1/20 | 745,000 | 767,700 | ||||
| Jurupa Public Financing Authority Special Tax Rev., Series 2014 A, 5.00%, 9/1/23 | 625,000 | 734,519 | ||||
| Jurupa Public Financing Authority Special Tax Rev., Series 2014 A, 5.00%, 9/1/24 | 680,000 | 805,406 | ||||
| Jurupa Public Financing Authority Special Tax Rev., Series 2014 A, 5.00%, 9/1/25 | 1,000,000 | 1,168,750 | ||||
| La Quinta Redevelopment Successor Agency Tax Allocation Rev., Series 2013 A, (La Quinta Redevelopment Project Areas 1&2), 5.00%, 9/1/19 | 1,150,000 | 1,303,123 | ||||
| La Quinta Redevelopment Successor Agency Tax Allocation Rev., Series 2013 A, (La Quinta Redevelopment Project Areas 1&2), 5.00%, 9/1/20 | 1,045,000 | 1,200,956 | ||||
| Long Beach Bond Finance Authority Natural Gas Purchase Rev., Series 2007 A, 5.00%, 11/15/35 | 1,215,000 | 1,365,964 | ||||
| Long Beach Harbor Rev., Series 2014 C, 5.00%, 11/15/18 | 22,000,000 | 24,867,920 | ||||
| Long Beach Marina Rev., Series 2015, (Alamitos Bay Marina Project), 5.00%, 5/15/23 | 650,000 | 749,112 | ||||
| Long Beach Marina Rev., Series 2015, (Alamitos Bay Marina Project), 5.00%, 5/15/24 | 250,000 | 290,110 | ||||
| Long Beach Marina Rev., Series 2015, (Alamitos Bay Marina Project), 5.00%, 5/15/25 | 500,000 | 578,935 | ||||
| Long Beach Marina Rev., Series 2015, (Alamitos Bay Marina Project), 5.00%, 5/15/27 | 800,000 | 907,448 | ||||
| Long Beach Marina Rev., Series 2015, (Alamitos Bay Marina Project), 5.00%, 5/15/28 | 600,000 | 674,040 | ||||
19
| Principal Amount | Value | |||||
| Long Beach Marina Rev., Series 2015, (Alamitos Bay Marina Project), 5.00%, 5/15/40 | $ | 2,500,000 | $ | 2,688,900 | ||
Los Alamitos Unified School District COP, Capital Appreciation, (Capital Projects), 0.00%, 8/1/24(5) | 2,100,000 | 1,564,437 | ||||
Los Altos Elementary School District GO, 5.00%, 8/1/16, Prerefunded at 100% of Par (Ambac)(2) | 1,045,000 | 1,090,865 | ||||
| Los Altos Elementary School District GO, 5.00%, 8/1/19 (Ambac) | 1,455,000 | 1,519,835 | ||||
Los Angeles Community College District GO, Series 2007 A, (Election of 2001), 5.00%, 8/1/17, Prerefunded at 100% of Par (NATL-RE/FGIC)(2) | 2,000,000 | 2,169,640 | ||||
| Los Angeles Community College District GO, Series 2015 C, 5.00%, 6/1/26 | 2,115,000 | 2,637,067 | ||||
| Los Angeles County COP, (Disney Concert Hall), 5.00%, 3/1/21 | 1,195,000 | 1,397,756 | ||||
| Los Angeles County COP, (Disney Concert Hall), 5.00%, 3/1/22 | 1,000,000 | 1,185,520 | ||||
| Los Angeles County COP, (Disney Concert Hall), 5.00%, 3/1/23 | 1,955,000 | 2,332,608 | ||||
| Los Angeles County Metropolitan Transportation Authority Sales Tax Rev., Series 2008 B, (Proposition A), 5.00%, 7/1/31 | 1,000,000 | 1,096,870 | ||||
| Los Angeles County Metropolitan Transportation Authority Sales Tax Rev., Series 2010 A, (General Union Station), 5.00%, 7/1/20 | 3,000,000 | 3,477,870 | ||||
| Los Angeles County Metropolitan Transportation Authority Sales Tax Rev., Series 2013 A, (Proposition A), 5.00%, 7/1/21 | 2,470,000 | 2,953,453 | ||||
| Los Angeles County Redevelopment Authority Tax Allocation Rev., Series 2013 D, (Redevelopment Project Areas), 4.00%, 9/1/15 | 2,000,000 | 2,000,000 | ||||
| Los Angeles County Redevelopment Authority Tax Allocation Rev., Series 2013 D, (Redevelopment Project Areas), 5.00%, 9/1/16 | 2,000,000 | 2,089,640 | ||||
Los Angeles County Redevelopment Authority Tax Allocation Rev., Capital Appreciation, Series 2013 E, (Covina Revitalization Redevelopment Project No. 1), 0.00%, 12/1/19 (AGM)(1) | 1,500,000 | 1,370,160 | ||||
| Los Angeles County Regional Financing Authority Rev., Series 2014 B-1, (MonteCedro, Inc.), 3.00%, 11/15/21 (California Mortgage Insurance) | 1,170,000 | 1,177,488 | ||||
| Los Angeles County Regional Financing Authority Rev., Series 2014 B-2, (MonteCedro, Inc.), 3.00%, 11/15/20 (California Mortgage Insurance) | 950,000 | 956,489 | ||||
| Los Angeles County Regional Financing Authority Rev., Series 2014 B-3, (MonteCedro, Inc.), 2.50%, 11/15/20 (California Mortgage Insurance) | 2,000,000 | 2,010,640 | ||||
| Los Angeles County Sanitation Districts Financing Authority Rev., Series 2015 A, (Capital Projects), 5.00%, 10/1/23 | 2,855,000 | 3,453,979 | ||||
| Los Angeles County Sanitation Districts Financing Authority Rev., Series 2015 A, (Capital Projects), 5.00%, 10/1/26 | 2,700,000 | 3,286,845 | ||||
| Los Angeles Department of Airports Rev., Series 2008 C, (Los Angeles International Airport), 5.00%, 5/15/18 | 750,000 | 834,375 | ||||
| Los Angeles Department of Airports Rev., Series 2010 A, (Los Angeles International Airport), 5.00%, 5/15/40 | 3,000,000 | 3,383,430 | ||||
| Los Angeles Department of Airports Rev., Series 2010 D, (Los Angeles International Airport), 5.00%, 5/15/24 | 3,040,000 | 3,528,832 | ||||
| Los Angeles Department of Airports Rev., Series 2015 C, (Los Angeles International Airport), 5.00%, 5/15/26 | 1,500,000 | 1,808,880 | ||||
| Los Angeles Department of Airports Rev., Series 2015 C, (Los Angeles International Airport), 5.00%, 5/15/27 | 1,280,000 | 1,524,762 | ||||
| Los Angeles Department of Water & Power System Rev., Series 2001 B-2, VRDN, 0.01%, 9/1/15 (SBBPA: Royal Bank of Canada) | 3,500,000 | 3,500,000 | ||||
| Los Angeles Department of Water & Power System Rev., Series 2008 A-1, 5.25%, 7/1/38 | 5,000,000 | 5,507,150 | ||||
| Los Angeles Department of Water & Power System Rev., Series 2008 A-2, 5.25%, 7/1/32 | 3,535,000 | 3,915,366 | ||||
20
| Principal Amount | Value | |||||
| Los Angeles Department of Water & Power System Rev., Series 2011 A, 4.00%, 7/1/16 | $ | 1,000,000 | $ | 1,032,220 | ||
| Los Angeles Department of Water & Power System Rev., Series 2011 A, 5.00%, 7/1/18 | 780,000 | 870,418 | ||||
| Los Angeles Department of Water & Power System Rev., Series 2012 A, 5.00%, 7/1/26 | 1,000,000 | 1,169,470 | ||||
| Los Angeles Department of Water & Power System Rev., Series 2012 C, 5.00%, 1/1/16 | 8,750,000 | 8,786,050 | ||||
| Los Angeles Department of Water & Power System Rev., Series 2012 C, 5.00%, 7/1/24 | 1,500,000 | 1,809,465 | ||||
| Los Angeles Department of Water & Power System Rev., Series 2013 B, 5.00%, 7/1/27 | 6,470,000 | 7,626,707 | ||||
| Los Angeles Department of Water & Power System Rev., Series 2014 B, 5.00%, 7/1/25 | 700,000 | 842,282 | ||||
| Los Angeles Department of Water & Power System Rev., Series 2014 B, 5.00%, 7/1/26 | 1,300,000 | 1,542,554 | ||||
| Los Angeles Harbor Department Rev., Series 2011 B, 5.00%, 8/1/24 | 1,225,000 | 1,460,298 | ||||
| Los Angeles Municipal Improvement Corp. Rev., Series 2012 C, 5.00%, 3/1/25 | 3,000,000 | 3,444,870 | ||||
| Los Angeles Unified School District COP, Series 2012 B, (Headquarters Building Project), 5.00%, 10/1/29 | 1,700,000 | 1,931,727 | ||||
Los Angeles Unified School District GO, Series 2006 F, (Election of 2004), 5.00%, 7/1/16, Prerefunded at 100% of Par (FGIC)(2) | 4,000,000 | 4,156,520 | ||||
Los Angeles Unified School District GO, Series 2006 F, (Election of 2004), 5.00%, 7/1/16, Prerefunded at 100% of Par (FGIC)(2) | 175,000 | 181,923 | ||||
| Los Angeles Unified School District GO, Series 2006 F, (Election of 2004), 5.00%, 7/1/18 (FGIC) | 1,055,000 | 1,097,791 | ||||
| Los Angeles Unified School District GO, Series 2007 H, (Election of 2004), 5.00%, 7/1/32 (AGM) | 2,000,000 | 2,133,800 | ||||
| Los Angeles Unified School District GO, Series 2009 I, (Election of 2004), 5.00%, 7/1/29 | 4,000,000 | 4,559,720 | ||||
| Los Angeles Unified School District GO, Series 2010 KRY, 5.25%, 7/1/26 | 3,000,000 | 3,492,870 | ||||
| Los Angeles Unified School District GO, Series 2011 A-1, 4.00%, 7/1/17 | 1,000,000 | 1,063,790 | ||||
| Los Angeles Unified School District GO, Series 2011 A-1, 5.00%, 7/1/18 | 2,565,000 | 2,865,413 | ||||
| Los Angeles Unified School District GO, Series 2011 A-1, 5.00%, 7/1/24 | 5,140,000 | 6,046,953 | ||||
| Los Angeles Unified School District GO, Series 2011 A-2, 5.00%, 7/1/21 | 3,000,000 | 3,556,770 | ||||
| Los Angeles Unified School District GO, Series 2014 B, 5.00%, 7/1/18 | 6,665,000 | 7,445,605 | ||||
| Los Angeles Unified School District GO, Series 2014 C, 5.00%, 7/1/24 | 5,000,000 | 6,129,500 | ||||
| Los Angeles Unified School District GO, Series 2014 C, 5.00%, 7/1/26 | 3,555,000 | 4,296,182 | ||||
| Los Angeles Unified School District GO, Series 2014 C, 5.00%, 7/1/27 | 1,050,000 | 1,261,029 | ||||
| Los Angeles Unified School District GO, Series 2014 C, 5.00%, 7/1/30 | 1,155,000 | 1,357,529 | ||||
Los Angeles Wastewater System Rev., Series 2009 A, 5.75%, 6/1/19, Prerefunded at 100% of Par(2) | 1,650,000 | 1,937,611 | ||||
| Los Angeles Wastewater System Rev., Series 2009 A, 5.75%, 6/1/34 | 1,325,000 | 1,529,487 | ||||
| M-S-R Energy Authority Rev., Series 2009 B, 7.00%, 11/1/34 (GA: Citigroup, Inc.) | 5,000,000 | 6,838,250 | ||||
21
| Principal Amount | Value | |||||
| M-S-R Energy Authority Rev., Series 2009 B, 6.50%, 11/1/39 (GA: Citigroup, Inc.) | $ | 1,000,000 | $ | 1,314,070 | ||
| Metropolitan Water District of Southern California Rev., Series 2011 A-2, VRDN, 0.40%, 9/3/15 | 10,000,000 | 9,976,500 | ||||
| Metropolitan Water District of Southern California Rev., Series 2011 A-4, VRDN, 0.40%, 9/3/15 | 5,000,000 | 4,988,250 | ||||
Mount San Antonio Community College District GO, Capital Appreciation, Series 2005 A, (Election of 2001), 0.00%, 8/1/16 (NATL-RE)(1)(2) | 5,000,000 | 4,989,150 | ||||
| Mount San Antonio Community College District GO, Series 2013 A, (Election of 2008), 5.00%, 8/1/34 | 2,000,000 | 2,301,240 | ||||
| Murrieta Public Financing Authority Special Tax Rev., 5.00%, 9/1/17 | 1,000,000 | 1,076,720 | ||||
| Murrieta Public Financing Authority Special Tax Rev., 5.00%, 9/1/21 | 1,200,000 | 1,384,476 | ||||
| Natomas Unified School District GO, 5.00%, 9/1/26 (BAM) | 1,785,000 | 2,115,743 | ||||
| Newark Unified School District GO, Series 2014 B, 5.00%, 8/1/44 | 6,030,000 | 6,698,003 | ||||
Newport Beach Rev., Series 2011 A, (Hoag Memorial Hospital Presbyterian), 6.00%, 12/1/21, Prerefunded at 100% of Par(2) | 1,000,000 | 1,258,010 | ||||
| North Lake Tahoe Public Financing Authority Rev., 4.00%, 12/1/19 | 1,000,000 | 1,109,360 | ||||
| Northern California Power Agency Rev., Series 2010 A, 5.00%, 7/1/16 | 1,000,000 | 1,040,550 | ||||
| Northern California Power Agency Rev., Series 2010 A, 5.00%, 8/1/19 | 2,000,000 | 2,264,840 | ||||
| Northern California Power Agency Rev., Series 2010 A, 5.00%, 8/1/20 | 1,515,000 | 1,723,494 | ||||
| Northern California Power Agency Rev., Series 2010 A, 5.00%, 8/1/21 | 2,050,000 | 2,297,045 | ||||
| Northern California Power Agency Rev., Series 2010 A, 5.25%, 8/1/22 | 4,250,000 | 4,823,537 | ||||
| Northern California Power Agency Rev., Series 2012 A, 5.00%, 7/1/26 | 1,750,000 | 2,036,352 | ||||
| Northern California Power Agency Rev., Series 2012 A, 5.00%, 7/1/27 | 2,000,000 | 2,308,840 | ||||
| Oakland Sewer Rev., Series 2014 A, 5.00%, 6/15/26 | 1,200,000 | 1,436,220 | ||||
| Oakland Unified School District Alameda County GO, Series 2012 A, (Election of 2006), 5.00%, 8/1/22 | 750,000 | 857,783 | ||||
| Oakland Unified School District Alameda County GO, Series 2012 A, (Election of 2006), 5.50%, 8/1/32 | 2,150,000 | 2,433,219 | ||||
| Oakland Unified School District Alameda County GO, Series 2013, (Election of 2012), 6.625%, 8/1/38 | 1,410,000 | 1,720,411 | ||||
| Oakland Unified School District Alameda County GO, Series 2015 A, 5.00%, 8/1/20 | 1,670,000 | 1,889,238 | ||||
| Oakland Unified School District Alameda County GO, Series 2015 A, 5.00%, 8/1/21 | 610,000 | 693,954 | ||||
| Oakland Unified School District Alameda County GO, Series 2015 A, 5.00%, 8/1/22 | 500,000 | 571,855 | ||||
| Oakland Unified School District Alameda County GO, Series 2015 A, 5.00%, 8/1/23 | 1,400,000 | 1,608,474 | ||||
| Oakland Unified School District Alameda County GO, Series 2015 A, 5.00%, 8/1/25 | 650,000 | 749,782 | ||||
| Oakland Unified School District Alameda County GO, Series 2015 A, 5.00%, 8/1/40 | 950,000 | 1,036,868 | ||||
| Oakland-Alameda County Coliseum Authority Lease Rev., Series 2012 A, 5.00%, 2/1/18 | 3,345,000 | 3,663,912 | ||||
| Oakland-Alameda County Coliseum Authority Lease Rev., Series 2012 A, 5.00%, 2/1/25 | 4,065,000 | 4,651,823 | ||||
| Ontario Public Financing Authority Rev., 5.00%, 7/1/43 | 2,000,000 | 2,244,660 | ||||
22
| Principal Amount | Value | |||||
| Orange County Community Facilities District Special Tax Rev., Series 2014 A, (Ladera Ranch), 5.00%, 8/15/28 | $ | 1,960,000 | $ | 2,219,700 | ||
| Orange County Improvement Bond Act of 1915 Special Assessment Rev., (Newport Coast Phase IV Assessment District No. 01-1), 4.45%, 9/2/15 | 280,000 | 280,031 | ||||
| Orange County Improvement Bond Act of 1915 Special Assessment Rev., (Newport Coast Phase IV Assessment District No. 01-1), 4.55%, 9/2/16 | 210,000 | 213,786 | ||||
Orange County Sanitation District COP, Series 2007 B, 5.00%, 2/1/17, Prerefunded at 100% of Par (AGM)(2) | 2,750,000 | 2,915,220 | ||||
| Orange County Sanitation District Rev., Series 2014 B, 4.00%, 11/15/16 | 6,500,000 | 6,773,065 | ||||
| Orange County Transportation Authority Rev., (Senior Lien 91 Express Lanes), 5.00%, 8/15/24 | 1,000,000 | 1,200,910 | ||||
| Orange County Water District Rev., Series 2013 A, 5.00%, 8/15/33 | 4,000,000 | 4,617,480 | ||||
| Oxnard Financing Authority Rev., 5.00%, 6/1/25 (AGM) | 2,000,000 | 2,349,920 | ||||
| Oxnard Financing Authority Rev., 5.00%, 6/1/26 (AGM) | 3,690,000 | 4,289,588 | ||||
| Oxnard Financing Authority Rev., 5.00%, 6/1/28 (AGM) | 1,515,000 | 1,736,448 | ||||
| Oxnard Financing Authority Rev., 5.00%, 6/1/32 (AGM) | 1,000,000 | 1,116,160 | ||||
Oxnard School District GO, Series 2015 D, (Election of 2012), 3.00%, 8/1/20 (AGM)(5) | 2,800,000 | 2,840,096 | ||||
| Palm Springs Financing Authority Lease Rev., Series 2012 B, (Downtown Revitalization Project), 4.00%, 6/1/16 | 1,335,000 | 1,368,922 | ||||
| Palm Springs Financing Authority Lease Rev., Series 2012 B, (Downtown Revitalization Project), 5.00%, 6/1/23 | 1,230,000 | 1,428,854 | ||||
| Palomar Pomerado Health Care District COP, 5.25%, 11/1/21 | 1,000,000 | 1,080,050 | ||||
| Palomar Pomerado Health Care District COP, 6.00%, 11/1/41 | 1,120,000 | 1,189,182 | ||||
Palomar Pomerado Health GO, Capital Appreciation, 0.00%, 8/1/18 (NATL-RE)(1) | 3,615,000 | 3,449,469 | ||||
Palomar Pomerado Health GO, Capital Appreciation, Series 2009 A, (Election of 2004), 0.00%, 8/1/19 (AGC)(5) | 1,660,000 | 1,740,776 | ||||
| Peralta Community College District GO, 5.00%, 8/1/17 | 2,085,000 | 2,260,661 | ||||
| Peralta Community College District GO, 5.00%, 8/1/22 | 2,145,000 | 2,568,552 | ||||
| Pittsburg Redevelopment Agency Tax Allocation Rev., Series 2004 A, (Los Medanos Community), VRDN, 0.01%, 9/1/15 (LOC: State Street Bank & Trust Co. and California State Teacher's Retirement System) | 5,180,000 | 5,180,000 | ||||
| Port of Oakland Rev., Series 2007 C, (Intermediate Lien), 5.00%, 11/1/16 (NATL-RE) | 1,270,000 | 1,340,371 | ||||
| Port of Oakland Rev., Series 2007 C, (Intermediate Lien), 5.00%, 11/1/17 (NATL-RE) | 2,375,000 | 2,596,492 | ||||
| Porterville Public Financing Authority Sewer Rev., 5.625%, 10/1/36 | 2,500,000 | 2,953,375 | ||||
Poway Unified School District GO, Capital Appreciation, (School Facilities Improvement), 0.00%, 8/1/41(1) | 2,780,000 | 876,228 | ||||
| Poway Unified School District Public Financing Authority Special Tax Rev., 5.00%, 9/15/19 (Ambac) | 1,150,000 | 1,235,020 | ||||
| Poway Unified School District Public Financing Authority Special Tax Rev., 5.00%, 9/15/20 (Ambac) | 1,205,000 | 1,294,086 | ||||
| Poway Unified School District Public Financing Authority Special Tax Rev., Series 2015 A, 2.00%, 9/1/15 | 650,000 | 650,000 | ||||
| Poway Unified School District Public Financing Authority Special Tax Rev., Series 2015 A, 2.00%, 9/1/16 | 1,285,000 | 1,300,793 | ||||
| Poway Unified School District Public Financing Authority Special Tax Rev., Series 2015 A, 3.00%, 9/1/17 | 670,000 | 693,390 | ||||
| Rancho Mirage Joint Powers Financing Authority Rev., Series 2007 A, (Eisenhower Medical Center), 5.00%, 7/1/21 | 1,000,000 | 1,050,110 | ||||
23
| Principal Amount | Value | |||||
| Rancho Santa Fe Community Services District Special Tax Rev., Series 2011 A, (Superior Lien), 5.125%, 9/1/22 | $ | 790,000 | $ | 908,034 | ||
| Rancho Santa Fe Community Services District Special Tax Rev., Series 2011 A, (Superior Lien), 5.25%, 9/1/23 | 1,300,000 | 1,493,089 | ||||
| Rancho Santa Fe Community Services District Special Tax Rev., Series 2011 A, (Superior Lien), 5.375%, 9/1/24 | 1,410,000 | 1,619,300 | ||||
Regents of the University of California Rev., Series 2009 Q, 5.25%, 5/15/17, Prerefunded at 101% of Par(2) | 1,910,000 | 2,080,792 | ||||
| Regents of the University of California Rev., Series 2009 Q, 5.25%, 5/15/23 | 90,000 | 98,010 | ||||
| Rio Elementary School District Community Facilities District No. 1 Special Tax Rev., 5.00%, 9/1/24 | 700,000 | 786,002 | ||||
| Riverside County Asset Leasing Corp. Rev., Series 2013 A, (Public Defender and Probation Building), 5.00%, 11/1/43 | 1,000,000 | 1,087,180 | ||||
| Riverside County COP, Series 2007 A, (Public Safety Communication), 5.00%, 11/1/15 (Ambac) | 3,035,000 | 3,058,127 | ||||
| Riverside County Redevelopment Agency Tax Allocation Rev., Series 2010 E, (Interstate 215 Corridor), 6.50%, 10/1/40 | 935,000 | 1,095,044 | ||||
| Riverside County Transportation Commission Rev., Series 2013 A, (Limited Tax), 5.25%, 6/1/39 | 1,335,000 | 1,536,291 | ||||
| Sacramento City Financing Authority Lease Rev., Series 1993 A, 5.40%, 11/1/20 (Ambac) | 2,800,000 | 3,066,504 | ||||
| Sacramento City Financing Authority Rev., 5.00%, 12/1/16 (NATL-RE/FGIC) | 2,500,000 | 2,530,075 | ||||
| Sacramento County Airport System Rev., Series 2009 B, 4.25%, 7/1/16 | 1,000,000 | 1,031,570 | ||||
| Sacramento County Airport System Rev., Series 2010, 5.00%, 7/1/20 | 1,000,000 | 1,150,490 | ||||
| Sacramento County Airport System Rev., Series 2010, 5.00%, 7/1/23 | 1,000,000 | 1,130,400 | ||||
| Sacramento County Airport System Rev., Series 2010, 5.00%, 7/1/24 | 1,000,000 | 1,142,750 | ||||
| Sacramento County Sanitation Districts Financing Authority Rev., Series 2007 A, 5.25%, 12/1/21 (NATL-RE/FGIC) | 1,000,000 | 1,203,470 | ||||
| Sacramento County Sanitation Districts Financing Authority Rev., Series 2007 B, VRN, 0.72%, 9/1/15 (NATL-RE/FGIC) | 2,500,000 | 2,223,675 | ||||
| Sacramento County Sanitation Districts Financing Authority Rev., Series 2015, (Cosumnes Project), 3.00%, 7/1/17 | 18,730,000 | 19,572,850 | ||||
| Sacramento County Sanitation Districts Financing Authority Rev., Series 2015, (Cosumnes Project), 4.00%, 7/1/18 | 6,000,000 | 6,529,680 | ||||
| Sacramento Municipal Utility District Electric Rev., Series 1997 K, 5.70%, 7/1/17 (Ambac) | 3,105,000 | 3,399,261 | ||||
| Sacramento Municipal Utility District Electric Rev., Series 1997 K, 5.25%, 7/1/24 (Ambac) | 3,000,000 | 3,618,480 | ||||
| Sacramento Municipal Utility District Electric Rev., Series 2012 Y, 5.00%, 8/15/24 | 1,500,000 | 1,818,660 | ||||
| Sacramento Municipal Utility District Electric Rev., Series 2012 Y, 5.00%, 8/15/25 | 5,000,000 | 6,021,350 | ||||
| Sacramento Regional Transit District Rev., (Farebox Revenue), 4.00%, 3/1/16 | 440,000 | 447,564 | ||||
| Sacramento Regional Transit District Rev., (Farebox Revenue), 4.00%, 3/1/17 | 1,000,000 | 1,045,590 | ||||
| Sacramento Regional Transit District Rev., (Farebox Revenue), 5.00%, 3/1/18 | 250,000 | 273,053 | ||||
| San Bernardino Community College District GO, Series 2008 A, (Election of 2002), 5.25%, 8/1/18 | 350,000 | 392,613 | ||||
San Bernardino Community College District GO, Series 2008 A, (Election of 2002), 5.50%, 8/1/18, Prerefunded at 100% of Par(2) | 300,000 | 340,563 | ||||
24
| Principal Amount | Value | |||||
San Bernardino Community College District GO, Series 2008 A, (Election of 2002), 6.25%, 8/1/18, Prerefunded at 100% of Par(2) | $ | 8,000,000 | $ | 9,254,320 | ||
San Bernardino Community College District GO, Capital Appreciation, Series 2009 B, (Election of 2008), 0.00%, 8/1/19(5) | 9,840,000 | 9,664,848 | ||||
| San Buenaventura Rev., (Community Memorial Health System), 8.00%, 12/1/26 | 2,000,000 | 2,597,920 | ||||
| San Buenaventura Rev., (Community Memorial Health System), 7.50%, 12/1/41 | 1,200,000 | 1,460,124 | ||||
| San Diego Community College District GO, (Election of 2002), 5.00%, 8/1/30 | 3,000,000 | 3,498,090 | ||||
| San Diego Convention Center Expansion Financing Authority Rev., Series 2012 A, 4.00%, 4/15/17 | 1,250,000 | 1,314,887 | ||||
| San Diego Convention Center Expansion Financing Authority Rev., Series 2012 A, 4.00%, 4/15/18 | 1,160,000 | 1,242,731 | ||||
| San Diego County Regional Airport Authority Rev., Series 2010 A, 5.00%, 7/1/19 | 1,290,000 | 1,462,718 | ||||
| San Diego County Regional Airport Authority Rev., Series 2010 A, 5.00%, 7/1/21 | 2,000,000 | 2,285,040 | ||||
| San Diego County Regional Airport Authority Rev., Series 2010 A, 5.00%, 7/1/34 | 750,000 | 841,568 | ||||
| San Diego County Regional Airport Authority Rev., Series 2010 A, 5.00%, 7/1/40 | 740,000 | 822,887 | ||||
| San Diego County Regional Airport Authority Rev., Series 2013 A, 4.00%, 7/1/18 | 300,000 | 326,928 | ||||
| San Diego County Regional Airport Authority Rev., Series 2013 A, 4.00%, 7/1/19 | 400,000 | 442,308 | ||||
| San Diego County Regional Transportation Commission Rev., Series 2012 A, 5.00%, 4/1/21 | 5,940,000 | 7,073,293 | ||||
| San Diego County Water Authority Rev., Series 2011 S-1, (Subordinate Lien), 5.00%, 7/1/16 | 2,780,000 | 2,880,803 | ||||
| San Diego Public Facilities Financing Authority Lease Rev., Series 2015 A, (Capital Improvement Projects), 5.00%, 10/15/44 | 4,970,000 | 5,449,555 | ||||
San Diego Public Facilities Financing Authority Sewer Rev., Series 2009 B, 5.00%, 5/15/19, Prerefunded at 100% of Par(2) | 3,680,000 | 4,191,594 | ||||
San Diego Public Facilities Financing Authority Sewer Rev., Series 2010 A, 5.25%, 5/15/20, Prerefunded at 100% of Par(2) | 3,400,000 | 4,003,908 | ||||
| San Diego Public Facilities Financing Authority Tax Allocation Rev., Series 2007 B, (Southcrest and Central Imperial Redevelopment), 5.125%, 10/1/22 (Radian) | 1,230,000 | 1,296,924 | ||||
| San Diego Public Facilities Financing Authority Water Rev., Series 2009 A, 5.00%, 8/1/21 | 1,000,000 | 1,117,540 | ||||
| San Diego Public Facilities Financing Authority Water Rev., Series 2012 A, 5.00%, 8/1/21 | 2,000,000 | 2,372,900 | ||||
| San Diego Public Facilities Financing Authority Water Rev., Series 2012 A, 5.00%, 8/1/24 | 2,000,000 | 2,377,100 | ||||
| San Diego Unified Port District Rev., Series 2013 A, 5.00%, 9/1/23 | 250,000 | 297,323 | ||||
| San Diego Unified Port District Rev., Series 2013 A, 5.00%, 9/1/26 | 750,000 | 870,825 | ||||
San Diego Unified School District GO, Capital Appreciation, Series 2010 C, (Election of 2008), 0.00%, 7/1/36(1) | 7,895,000 | 3,338,085 | ||||
| San Francisco Bay Area Rapid Transit District Rev., Series 2012 A, 5.00%, 7/1/24 | 500,000 | 596,050 | ||||
| San Francisco Bay Area Rapid Transit District Rev., Series 2012 A, 5.00%, 7/1/25 | 500,000 | 593,775 | ||||
| San Francisco Bay Area Rapid Transit District Rev., Series 2012 A, 5.00%, 7/1/26 | 1,000,000 | 1,178,120 | ||||
| San Francisco City and County Airports Commission Rev., Series 2008 34-D, (San Francisco International Airport), 5.00%, 5/1/17 (AGC) | 3,375,000 | 3,630,487 | ||||
25
| Principal Amount | Value | |||||
| San Francisco City and County Airports Commission Rev., Series 2008 34-D, (San Francisco International Airport), 5.00%, 5/1/18 (AGC) | $ | 2,000,000 | $ | 2,224,000 | ||
| San Francisco City and County Airports Commission Rev., Series 2009 D, (San Francisco International Airport), 4.00%, 5/1/24 | 1,625,000 | 1,823,396 | ||||
| San Francisco City and County Airports Commission Rev., Series 2009 E, (San Francisco International Airport), 5.25%, 5/1/23 | 3,500,000 | 3,989,300 | ||||
| San Francisco City and County Airports Commission Rev., Series 2010 C, (San Francisco International Airport), (Governmental Purpose), 5.00%, 5/1/19 | 1,500,000 | 1,712,955 | ||||
| San Francisco City and County Airports Commission Rev., Series 2011 D, (San Francisco International Airport), 5.00%, 5/1/24 | 4,025,000 | 4,710,377 | ||||
| San Francisco City and County Airports Commission Rev., Series 2011 D, (San Francisco International Airport), 5.00%, 5/1/29 | 6,270,000 | 7,259,594 | ||||
| San Francisco City and County Airports Commission Rev., Series 2012 B, (San Francisco International Airport), 5.00%, 5/1/26 | 1,250,000 | 1,474,112 | ||||
| San Francisco City and County COP, Series 2009 A, (Multiple Capital Improvement Projects), 5.00%, 4/1/17 | 2,440,000 | 2,614,972 | ||||
| San Francisco City and County COP, Series 2009 A, (Multiple Capital Improvement Projects), 5.00%, 4/1/29 | 1,170,000 | 1,312,518 | ||||
| San Francisco City and County COP, Series 2010 A, 5.00%, 10/1/19 | 2,930,000 | 3,373,573 | ||||
| San Francisco City and County GO, Series 2015 R-1, 5.00%, 6/15/25 | 1,880,000 | 2,263,689 | ||||
| San Francisco City and County Public Utilities Water Commission Rev., Series 2010 A, 5.00%, 10/1/21 | 5,000,000 | 5,976,000 | ||||
| San Francisco City and County Public Utilities Water Commission Rev., Series 2010 A, 5.00%, 11/1/28 | 2,780,000 | 3,209,705 | ||||
| San Francisco City and County Public Utilities Water Commission Rev., Series 2015 A, 5.00%, 11/1/28 | 1,055,000 | 1,239,414 | ||||
| San Francisco City and County Public Utilities Water Commission Rev., Series 2015 A, 5.00%, 11/1/34 | 1,435,000 | 1,635,441 | ||||
| San Francisco City and County Public Utilities Water Commission Rev., Series 2015 A, 5.00%, 11/1/35 | 1,415,000 | 1,610,128 | ||||
| San Francisco City and County Public Utilities Water Commission Rev., Series 2015 A, 5.00%, 11/1/36 | 1,585,000 | 1,796,566 | ||||
| San Francisco City and County Redevelopment Agency Tax Allocation Rev., Series 2014 C, 3.00%, 8/1/16 | 3,000,000 | 3,074,040 | ||||
| San Francisco City and County Redevelopment Financing Authority Tax Allocation Rev., Series 2011 D, (Mission Bay South Redevelopment), 5.00%, 8/1/16 | 440,000 | 454,854 | ||||
| San Francisco City and County Redevelopment Financing Authority Tax Allocation Rev., Series 2011 D, (Mission Bay South Redevelopment), 5.00%, 8/1/17 | 465,000 | 493,565 | ||||
| San Francisco City and County Redevelopment Financing Authority Tax Allocation Rev., Series 2011 D, (Mission Bay South Redevelopment), 5.50%, 8/1/18 | 485,000 | 531,284 | ||||
| San Francisco City and County Redevelopment Financing Authority Tax Allocation Rev., Series 2011 D, (Mission Bay South Redevelopment), 6.00%, 8/1/19 | 510,000 | 592,044 | ||||
| San Francisco City and County Redevelopment Financing Authority Tax Allocation Rev., Series 2011 D, (Mission Bay South Redevelopment), 6.00%, 8/1/20 | 515,000 | 612,144 | ||||
| San Francisco City and County Successor Agency Tax Allocation Rev., Series 2014 A, (Mission Bay South Redevelopment Project), 5.00%, 8/1/21 | 460,000 | 526,465 | ||||
| San Francisco City and County Successor Agency Tax Allocation Rev., Series 2014 A, (Mission Bay South Redevelopment Project), 5.00%, 8/1/26 | 425,000 | 486,795 | ||||
26
| Principal Amount | Value | |||||
| San Francisco City and County Successor Agency Tax Allocation Rev., Series 2014 A, (Mission Bay South Redevelopment Project), 5.00%, 8/1/27 | $ | 550,000 | $ | 625,306 | ||
| San Francisco City and County Successor Agency Tax Allocation Rev., Series 2014 A, (Mission Bay South Redevelopment Project), 5.00%, 8/1/28 | 370,000 | 417,423 | ||||
| San Francisco City and County Successor Agency Tax Allocation Rev., Series 2014 A, (Mission Bay South Redevelopment Project), 5.00%, 8/1/43 | 1,000,000 | 1,087,640 | ||||
San Joaquin Hills Transportation Corridor Agency Rev., Capital Appreciation, (Senior Lien), 0.00%, 1/1/16(1)(2) | 15,000,000 | 14,994,450 | ||||
San Joaquin Hills Transportation Corridor Agency Rev., Capital Appreciation, (Senior Lien), 0.00%, 1/1/17(1)(2) | 1,000,000 | 994,360 | ||||
San Joaquin Hills Transportation Corridor Agency Rev., Capital Appreciation, (Senior Lien), 0.00%, 1/1/26(1)(2) | 1,400,000 | 1,075,844 | ||||
| San Joaquin Hills Transportation Corridor Agency Rev., (Senior Lien), 5.00%, 1/15/34 | 9,000,000 | 9,741,150 | ||||
| San Jose Airport Rev., Series 2014 C, 5.00%, 3/1/27 | 1,295,000 | 1,512,236 | ||||
| San Jose Airport Rev., Series 2014 C, 5.00%, 3/1/28 | 1,500,000 | 1,739,295 | ||||
| San Jose Airport Rev., Series 2014 C, 5.00%, 3/1/30 | 1,750,000 | 2,002,420 | ||||
| San Jose Airport Rev., Series 2014 C, 5.00%, 3/1/31 | 1,000,000 | 1,138,620 | ||||
| San Jose Unified School District GO, Series 2015 C, 5.00%, 8/1/16 | 1,100,000 | 1,149,489 | ||||
| San Jose Unified School District GO, Series 2015 C, 5.00%, 8/1/17 | 900,000 | 978,354 | ||||
| San Jose Unified School District GO, Series 2015, 5.00%, 8/1/17 | 1,160,000 | 1,260,990 | ||||
| San Jose Unified School District GO, Series 2015, 5.00%, 8/1/18 | 2,100,000 | 2,357,943 | ||||
| San Jose Unified School District GO, Series 2015, 5.00%, 8/1/19 | 1,000,000 | 1,152,130 | ||||
San Mateo County Transportation District Sales Tax Rev., Series 1993 A, 5.25%, 6/1/18 (NATL-RE)(2) | 2,680,000 | 3,006,183 | ||||
| San Mateo Joint Powers Financing Authority Rev., (Maple Street Correctional Center), 5.00%, 6/15/17 | 860,000 | 929,075 | ||||
| San Mateo Joint Powers Financing Authority Rev., (Maple Street Correctional Center), 5.00%, 6/15/18 | 1,000,000 | 1,115,910 | ||||
| San Mateo Special Tax Rev., (Community Facilities District No. 2008-1-Bay Meadows), 5.875%, 9/1/32 | 690,000 | 786,290 | ||||
San Ramon Valley Unified School District GO, (Election of 2002), 5.00%, 8/1/16, Prerefunded at 100% of Par (NATL-RE)(2) | 1,000,000 | 1,043,510 | ||||
| Santa Clara County Financing Authority Lease Rev., Series 2012 A, (Capital Projects), 4.00%, 2/1/17 | 2,055,000 | 2,154,585 | ||||
| Santa Clara Electric Rev., Series 2011 A, 5.00%, 7/1/30 | 1,000,000 | 1,102,320 | ||||
| Santa Clara Valley Transportation Authority Sales Tax Rev., Series 2010 B, 5.00%, 4/1/20 | 4,000,000 | 4,680,760 | ||||
| Santa Fe Springs Community Development Commission Tax Allocation Rev., 5.375%, 9/1/16 (NATL-RE) | 430,000 | 431,785 | ||||
| Santa Maria Joint Union High School District GO, 5.00%, 8/1/25 | 1,585,000 | 1,865,703 | ||||
| Santa Monica Redevelopment Agency Tax Allocation, (Earthquake Recovery Redevelopment), 5.00%, 7/1/42 | 600,000 | 653,694 | ||||
| Santa Monica Redevelopment Agency Tax Allocation, (Earthquake Recovery Redevelopment), 5.875%, 7/1/42 | 600,000 | 713,022 | ||||
| Santa Monica-Malibu Unified School District GO, Series 2015 B, (Election of 2012), 5.00%, 7/1/17 | 3,375,000 | 3,649,219 | ||||
Santa Rosa Wastewater Rev., Capital Appreciation, Series 2002 B, 0.00%, 9/1/24 (Ambac)(1) | 7,000,000 | 5,398,050 | ||||
| Shasta Lake Public Finance Authority Rev., 5.00%, 4/1/19 | 2,400,000 | 2,406,888 | ||||
| Shasta Lake Public Finance Authority Rev., 5.00%, 4/1/22 | 2,130,000 | 2,138,094 | ||||
27
| Principal Amount | Value | |||||
| South Orange County Public Financing Authority Rev., (Juvenile Justice Center), 4.25%, 6/1/17 | $ | 2,000,000 | $ | 2,122,840 | ||
| South Orange County Public Financing Authority Rev., (Juvenile Justice Center), 4.50%, 6/1/18 | 2,700,000 | 2,954,124 | ||||
| South Placer Wastewater Authority Rev., VRN, 0.35%, 9/3/15 | 3,350,000 | 3,326,315 | ||||
South San Francisco Unified School District GO, Capital Appreciation, Series 2012 C, 0.00%, 6/1/16(1)(2) | 2,000,000 | 1,996,300 | ||||
| South Tahoe Joint Powers Financing Authority Rev., Series 2005 A, (Redevelopment Project Area No. 1), 5.00%, 10/1/19 (Ambac) | 50,000 | 50,115 | ||||
| Southern California Public Power Authority Rev., Series 2008 A, (Southern Transmission), 5.00%, 7/1/22 | 2,875,000 | 3,210,599 | ||||
Southern California Public Power Authority Rev., Series 2008 B, (Southern Transmission), 6.00%, 7/1/18, Prerefunded at 100% of Par(2) | 2,000,000 | 2,291,660 | ||||
| Southern California Public Power Authority Rev., Series 2011 A, (Southern Transmission), 5.00%, 7/1/21 | 2,780,000 | 3,277,286 | ||||
| Southern California Public Power Authority Rev., Series 2012 A, (Southern Transmission), 4.00%, 7/1/16 | 2,055,000 | 2,120,863 | ||||
| Southern California Public Power Authority Rev., Series 2012 A, (Southern Transmission), 5.00%, 7/1/18 | 1,880,000 | 2,100,186 | ||||
| Southern California Public Power Authority Rev., Series 2013 A, (Southern Transmission), 5.00%, 7/1/18 | 2,000,000 | 2,234,240 | ||||
| Southern California Public Power Authority Rev., Series 2013 A, (Southern Transmission), 5.00%, 7/1/20 | 4,000,000 | 4,690,120 | ||||
| Stockton Public Financing Authority Rev., Series 2010 A, (Delta Water Supply Project), 6.25%, 10/1/38 | 1,500,000 | 1,801,050 | ||||
| Stockton Public Financing Authority Wastewater Rev., 5.00%, 9/1/22 (BAM) | 1,410,000 | 1,668,171 | ||||
| Stockton Public Financing Authority Wastewater Rev., 5.00%, 9/1/23 (BAM) | 1,435,000 | 1,709,702 | ||||
| Stockton Public Financing Authority Wastewater Rev., 5.00%, 9/1/24 (BAM) | 1,090,000 | 1,309,035 | ||||
| Stockton Public Financing Authority Wastewater Rev., 5.00%, 9/1/25 (BAM) | 2,255,000 | 2,675,512 | ||||
| Stockton Public Financing Authority Wastewater Rev., 5.00%, 9/1/26 (BAM) | 1,495,000 | 1,749,000 | ||||
| Stockton Unified School District GO, Series 2014 A, (Election of 2012), 5.00%, 8/1/27 (AGM) | 530,000 | 620,556 | ||||
| Stockton Unified School District GO, Series 2014 A, (Election of 2012), 5.00%, 8/1/28 (AGM) | 255,000 | 295,303 | ||||
| Stockton Unified School District GO, Series 2014 A, (Election of 2012), 5.00%, 8/1/42 (AGM) | 865,000 | 960,825 | ||||
| Successor Agency to the Former Milpitas Redevelopment Agency Tax Allocation Rev., (Redevelopment Project Area No. 1), 5.00%, 9/1/25 | 2,325,000 | 2,831,873 | ||||
| Successor Agency to the Former Milpitas Redevelopment Agency Tax Allocation Rev., (Redevelopment Project Area No. 1), 5.00%, 9/1/26 | 4,185,000 | 5,043,971 | ||||
| Successor Agency to the Richmond County Redevelopment Agency Tax Allocation Rev., Series 2014 A, 5.00%, 9/1/19 (BAM) | 400,000 | 451,932 | ||||
| Successor Agency to the Richmond County Redevelopment Agency Tax Allocation Rev., Series 2014 A, 5.00%, 9/1/20 (BAM) | 260,000 | 298,802 | ||||
| Successor Agency to the Richmond County Redevelopment Agency Tax Allocation Rev., Series 2014 A, 5.00%, 9/1/21 (BAM) | 170,000 | 197,032 | ||||
| Successor Agency to the Richmond County Redevelopment Agency Tax Allocation Rev., Series 2014 A, 5.00%, 9/1/22 (BAM) | 250,000 | 292,470 | ||||
| Successor Agency to the Richmond County Redevelopment Agency Tax Allocation Rev., Series 2014 A, 5.00%, 9/1/23 (BAM) | 300,000 | 351,702 | ||||
28
| Principal Amount | Value | |||||
| Successor Agency to the Richmond County Redevelopment Agency Tax Allocation Rev., Series 2014 A, 5.00%, 9/1/24 (BAM) | $ | 250,000 | $ | 293,195 | ||
| Successor Agency to the Richmond County Redevelopment Agency Tax Allocation Rev., Series 2014 A, 4.50%, 9/1/25 (BAM) | 90,000 | 101,183 | ||||
| Successor Agency to the Richmond County Redevelopment Agency Tax Allocation Rev., Series 2014 A, 5.00%, 9/1/25 (BAM) | 80,000 | 93,154 | ||||
Sulphur Springs Union School District GO, Series 1991 A, 0.00%, 9/1/15 (NATL-RE)(1) | 3,040,000 | 3,040,000 | ||||
| Temecula Valley Unified School District Financing Authority Special Tax Rev., 4.00%, 9/1/17 (BAM) | 415,000 | 441,406 | ||||
| Temecula Valley Unified School District Financing Authority Special Tax Rev., 5.00%, 9/1/18 (BAM) | 325,000 | 362,333 | ||||
| Temecula Valley Unified School District Financing Authority Special Tax Rev., 5.00%, 9/1/19 (BAM) | 265,000 | 302,201 | ||||
| Temecula Valley Unified School District Financing Authority Special Tax Rev., 5.00%, 9/1/20 (BAM) | 400,000 | 463,564 | ||||
| Temecula Valley Unified School District Financing Authority Special Tax Rev., 5.00%, 9/1/21 (BAM) | 515,000 | 603,740 | ||||
| Temecula Valley Unified School District Financing Authority Special Tax Rev., 5.00%, 9/1/22 (BAM) | 275,000 | 324,830 | ||||
| Tobacco Securitization Authority of Southern California Settlement Rev., Series 2006 A-1, 5.00%, 6/1/37 | 1,750,000 | 1,516,270 | ||||
| Tri-Dam Power Authority Rev., 4.00%, 11/1/15 | 1,310,000 | 1,315,725 | ||||
| Tuolumne Wind Project Authority Rev., Series 2009 A, 5.625%, 1/1/29 | 1,000,000 | 1,136,060 | ||||
| Twin Rivers Unified School District COP, (School Facilities Bridge Funding Program), VRDN, 3.45%, 7/1/18 (AGM) | 3,000,000 | 3,004,590 | ||||
| Twin Rivers Unified School District COP, (School Facilities Bridge Funding Program), VRDN, 3.20%, 6/1/20 (AGM) | 3,750,000 | 3,754,575 | ||||
| Twin Rivers Unified School District COP, (School Facilities Bridge Funding Program), VRDN, 3.20%, 6/1/20 (AGM) | 2,500,000 | 2,503,050 | ||||
| University of California Regents Medical Center Pooled Rev., Series 2008 D, 5.00%, 5/15/27 | 1,000,000 | 1,041,270 | ||||
University of California Rev., Series 2009 O, 5.25%, 5/15/19, Prerefunded at 100% of Par(2) | 1,255,000 | 1,447,329 | ||||
| University of California Rev., Series 2009 O, 5.25%, 5/15/39 | 6,495,000 | 7,310,317 | ||||
| University of California Rev., Series 2010 S, 5.00%, 5/15/20 | 1,405,000 | 1,573,923 | ||||
| University of California Rev., Series 2010 S, 5.00%, 5/15/40 | 1,250,000 | 1,374,812 | ||||
| University of California Rev., Series 2012 G, (Limited Project), 5.00%, 5/15/26 | 6,150,000 | 7,295,991 | ||||
| University of California Rev., Series 2012 G, (Limited Project), 5.00%, 5/15/42 | 1,640,000 | 1,842,064 | ||||
| University of California Rev., Series 2013 AF, 5.00%, 5/15/25 | 7,250,000 | 8,719,430 | ||||
| University of California Rev., Series 2013 AK, VRDN, 5.00%, 5/15/23 | 7,935,000 | 9,632,931 | ||||
| University of California Rev., Series 2015 I, 5.00%, 5/15/26 | 11,300,000 | 13,725,319 | ||||
| Upper Santa Clara Valley Joint Powers Authority Rev., Series 2015 A, 4.00%, 8/1/18 | 600,000 | 651,906 | ||||
| Upper Santa Clara Valley Joint Powers Authority Rev., Series 2015 A, 4.00%, 8/1/19 | 600,000 | 661,254 | ||||
| West Contra Costa Unified School District GO, Series 2014 A, 5.00%, 8/1/30 | 2,000,000 | 2,288,980 | ||||
| West Contra Costa Unified School District GO, Series 2014 A, 5.00%, 8/1/33 | 3,000,000 | 3,383,700 | ||||
| West Contra Costa Unified School District GO, Series 2014 A, 5.00%, 8/1/34 | 1,200,000 | 1,352,484 | ||||
29
| Principal Amount | Value | |||||
| West Contra Costa Unified School District GO, Series 2014 A, 5.00%, 8/1/35 | $ | 1,500,000 | $ | 1,690,605 | ||
| West Sacramento Financing Authority Special Tax Rev., Series 2006 A, 5.00%, 9/1/18 (XLCA) | 1,500,000 | 1,658,850 | ||||
| West Sacramento Financing Authority Special Tax Rev., Series 2006 A, 5.00%, 9/1/19 (XLCA) | 1,000,000 | 1,126,520 | ||||
| West Sacramento Financing Authority Special Tax Rev., Series 2006 A, 5.00%, 9/1/20 (XLCA) | 1,200,000 | 1,374,144 | ||||
Yosemite Community College District GO, Capital Appreciation, Series 2010 D, (Election of 2004), 0.00%, 8/1/38(1) | 6,000,000 | 2,205,600 | ||||
| 1,483,465,340 | ||||||
| Guam — 0.2% | ||||||
| Guam Government GO, Series 2009 A, 6.00%, 11/15/19 | 1,000,000 | 1,111,170 | ||||
| Guam Power Authority Rev., Series 2012 A, 5.00%, 10/1/19 (AGM) | 1,000,000 | 1,140,870 | ||||
| 2,252,040 | ||||||
| U.S. Virgin Islands — 0.3% | ||||||
| Virgin Islands Public Finance Authority Rev., Series 2014 C, 5.00%, 10/1/24 | 3,330,000 | 3,785,777 | ||||
| Virgin Islands Public Finance Authority Rev., Series 2014 C, 5.00%, 10/1/30 | 1,000,000 | 1,084,220 | ||||
| 4,869,997 | ||||||
TOTAL INVESTMENT SECURITIES — 99.0% (Cost $1,414,472,825) | 1,490,587,377 | |||||
| OTHER ASSETS AND LIABILITIES — 1.0% | 15,085,945 | |||||
| TOTAL NET ASSETS — 100.0% | $ | 1,505,673,322 | ||||
30
| NOTES TO SCHEDULE OF INVESTMENTS | ||
| AGC | - | Assured Guaranty Corporation |
| AGM | - | Assured Guaranty Municipal Corporation |
| BAM | - | Build America Mutual Assurance Company |
| COP | - | Certificates of Participation |
| FGIC | - | Financial Guaranty Insurance Company |
| GA | - | Guaranty Agreement |
| GO | - | General Obligation |
| LOC | - | Letter of Credit |
| NATL-RE | - | National Public Finance Guarantee Corporation - Reinsured |
| SBBPA | - | Standby Bond Purchase Agreement |
| VRDN | - | Variable Rate Demand Note. Interest reset date is indicated. Rate shown is effective at the period end. |
| VRN | - | Variable Rate Note. Interest reset date is indicated. Rate shown is effective at the period end. |
| XLCA | - | XL Capital Ltd. |
| (1) | Security is a zero-coupon bond. Zero-coupon securities are issued at a substantial discount from their value at maturity. |
| (2) | Escrowed to maturity in U.S. government securities or state and local government securities. |
| (3) | When-issued security. The issue price and yield are fixed on the date of the commitment, but payment and delivery are scheduled for a future date. |
| (4) | Restricted security exempt from registration pursuant to Rule 144A under the Securities Act of 1933. These securities may be sold without restriction to qualified institutional investors and have been deemed liquid under policies approved by the Board of Trustees. The aggregate value of these securities at the period end was $3,585,881, which represented 0.2% of total net assets. |
| (5) | Coupon rate adjusts periodically based upon a predetermined schedule. Interest reset date is indicated. Rate shown is effective at the period end. |
See Notes to Financial Statements.
31
| Statement of Assets and Liabilities |
| AUGUST 31, 2015 | |||
| Assets | |||
| Investment securities, at value (cost of $1,414,472,825) | $ | 1,490,587,377 | |
| Cash | 17,395,517 | ||
| Receivable for investments sold | 230,200 | ||
| Receivable for capital shares sold | 1,623,913 | ||
| Interest receivable | 15,813,351 | ||
| 1,525,650,358 | |||
| Liabilities | |||
| Payable for investments purchased | 17,367,018 | ||
| Payable for capital shares redeemed | 1,456,782 | ||
| Accrued management fees | 552,430 | ||
| Distribution and service fees payable | 22,200 | ||
| Dividends payable | 578,606 | ||
| 19,977,036 | |||
| Net Assets | $ | 1,505,673,322 | |
| Net Assets Consist of: | |||
| Capital paid in | $ | 1,440,680,759 | |
| Distributions in excess of net investment income | (1,918 | ) | |
| Accumulated net realized loss | (11,120,071 | ) | |
| Net unrealized appreciation | 76,114,552 | ||
| $ | 1,505,673,322 | ||
| Net Assets | Shares Outstanding | Net Asset Value Per Share | ||||
| Investor Class | $1,216,942,527 | 102,666,496 | $11.85 | |||
| Institutional Class | $232,891,811 | 19,645,337 | $11.85 | |||
| A Class | $39,308,119 | 3,315,787 | $11.85* | |||
| C Class | $16,530,865 | 1,393,736 | $11.86 | |||
*Maximum offering price $12.41 (net asset value divided by 0.955).
See Notes to Financial Statements.
32
| Statement of Operations |
| YEAR ENDED AUGUST 31, 2015 | |||
| Investment Income (Loss) | |||
| Income: | |||
| Interest | $ | 41,159,534 | |
| Expenses: | |||
| Management fees | 6,160,382 | ||
| Distribution and service fees: | |||
| A Class | 92,611 | ||
| C Class | 170,132 | ||
| Trustees' fees and expenses | 69,785 | ||
| Other expenses | 1,583 | ||
| 6,494,493 | |||
| Net investment income (loss) | 34,665,041 | ||
| Realized and Unrealized Gain (Loss) | |||
| Net realized gain (loss) on: | |||
| Investment transactions | (2,296,778 | ) | |
| Futures contract transactions | (1,714,522 | ) | |
| (4,011,300 | ) | ||
| Change in net unrealized appreciation (depreciation) on: | |||
| Investments | (6,909,604 | ) | |
| Futures contracts | 340,296 | ||
| (6,569,308 | ) | ||
| Net realized and unrealized gain (loss) | (10,580,608 | ) | |
| Net Increase (Decrease) in Net Assets Resulting from Operations | $ | 24,084,433 | |
See Notes to Financial Statements.
33
| Statement of Changes in Net Assets |
| YEARS ENDED AUGUST 31, 2015 AND AUGUST 31, 2014 | ||||||
| Increase (Decrease) in Net Assets | August 31, 2015 | August 31, 2014 | ||||
| Operations | ||||||
| Net investment income (loss) | $ | 34,665,041 | $ | 32,010,281 | ||
| Net realized gain (loss) | (4,011,300 | ) | (6,859,484 | ) | ||
| Change in net unrealized appreciation (depreciation) | (6,569,308 | ) | 68,861,398 | |||
| Net increase (decrease) in net assets resulting from operations | 24,084,433 | 94,012,195 | ||||
| Distributions to Shareholders | ||||||
| From net investment income: | ||||||
| Investor Class | (27,681,317 | ) | (25,864,125 | ) | ||
| Institutional Class | (5,936,358 | ) | (5,083,283 | ) | ||
| A Class | (805,038 | ) | (785,120 | ) | ||
| C Class | (242,328 | ) | (277,753 | ) | ||
| Decrease in net assets from distributions | (34,665,041 | ) | (32,010,281 | ) | ||
| Capital Share Transactions | ||||||
| Net increase (decrease) in net assets from capital share transactions (Note 5) | 193,414,589 | 43,859,066 | ||||
| Net increase (decrease) in net assets | 182,833,981 | 105,860,980 | ||||
| Net Assets | ||||||
| Beginning of period | 1,322,839,341 | 1,216,978,361 | ||||
| End of period | $ | 1,505,673,322 | $ | 1,322,839,341 | ||
| Distributions in excess of net investment income | $ | (1,918 | ) | $ | (1,918 | ) |
See Notes to Financial Statements.
34
| Notes to Financial Statements |
AUGUST 31, 2015
1. Organization
American Century California Tax-Free and Municipal Funds (the trust) is registered under the Investment Company Act of 1940, as amended (the 1940 Act), as an open-end management investment company and is organized as a Massachusetts business trust. California Intermediate-Term Tax-Free Bond Fund (the fund) is one fund in a series issued by the trust. The fund is diversified as defined under the 1940 Act. The fund’s investment objectives are to seek safety of principal and high current income that is exempt from federal and California income taxes.
The fund offers the Investor Class, the Institutional Class, the A Class and the C Class. The A Class may incur an initial sales charge. The A Class and C Class may be subject to a contingent deferred sales charge. The share classes differ principally in their respective sales charges and distribution and shareholder servicing expenses and arrangements. The Institutional Class is made available to institutional shareholders or through financial intermediaries whose clients do not require the same level of shareholder and administrative services as shareholders of other classes. As a result, the Institutional Class is charged a lower unified management fee.
2. Significant Accounting Policies
The following is a summary of significant accounting policies consistently followed by the fund in preparation of its financial statements. The fund is an investment company and follows accounting and reporting guidance in accordance with accounting principles generally accepted in the United States of America. This may require management to make certain estimates and assumptions at the date of the financial statements. Actual results could differ from these estimates. Management evaluated the impact of events or transactions occurring through the date the financial statements were issued that would merit recognition or disclosure.
Investment Valuations — The fund determines the fair value of its investments and computes its net asset value per share at the close of regular trading (usually 4 p.m. Eastern time) on the New York Stock Exchange (NYSE) on each day the NYSE is open. The Board of Trustees has adopted valuation policies and procedures to guide the investment advisor in the fund’s investment valuation process and to provide methodologies for the oversight of the fund’s pricing function.
Fixed income securities maturing in greater than 60 days at the time of purchase are valued at the evaluated mean as provided by independent pricing services or at the mean of the most recent bid and asked prices as provided by investment dealers. Fixed income securities maturing within 60 days at the time of purchase may be valued at cost, plus or minus any amortized discount or premium or at the evaluated mean as provided by an independent pricing service. Evaluated mean prices are commonly derived through utilization of market models, which may consider, among other factors: trade data, quotations from dealers and active market makers, relevant yield curve and spread data, related sector levels, creditworthiness, trade data or market information on comparable securities, and other relevant security specific information.
Exchange-traded futures contracts are valued at the settlement price as provided by the appropriate clearing corporation.
If the fund determines that the market price for an investment is not readily available or the valuation methods mentioned above do not reflect an investment’s fair value, such investment is valued as determined in good faith by the Board of Trustees or its delegate, in accordance with policies and procedures adopted by the Board of Trustees. In its determination of fair value, the fund may review several factors including, but not limited to, market information regarding the specific investment or comparable investments and correlation with other investment types, futures indices or general market indicators. Circumstances that may cause the fund to use these procedures to value an investment include, but are not limited to: an investment has been declared in default or is distressed; trading in a security has been suspended during the trading day or a security is not actively trading on its principal exchange; prices received from a regular pricing source are deemed unreliable; or there is a foreign market holiday and no trading occurred.
35
The fund monitors for significant events occurring after the close of an investment’s primary exchange but before the fund’s net asset value per share is determined. Significant events may include, but are not limited to: corporate announcements and transactions; governmental action and political unrest that could impact a specific investment or an investment sector; or armed conflicts, natural disasters and similar events that could affect investments in a specific country or region.
Security Transactions — Security transactions are accounted for as of the trade date. Net realized gains and losses are determined on the identified cost basis, which is also used for federal income tax purposes.
Investment Income — Interest income is recorded on the accrual basis and includes accretion of discounts and amortization of premiums.
Segregated Assets — In accordance with the 1940 Act, the fund segregates assets on its books and records to cover certain types of investments, including, but not limited to, futures contracts and when-issued securities. American Century Investment Management, Inc. (ACIM) (the investment advisor) monitors, on a daily basis, the securities segregated to ensure the fund designates a sufficient amount of liquid assets, marked-to-market daily. The fund may also receive assets or be required to pledge assets at the custodian bank or with a broker for margin requirements on futures contracts.
Income Tax Status — It is the fund’s policy to distribute substantially all net investment income and net realized gains to shareholders and to otherwise qualify as a regulated investment company under provisions of the Internal Revenue Code. Accordingly, no provision has been made for income taxes. The fund files U.S. federal, state, local and non-U.S. tax returns as applicable. The fund's tax returns are subject to examination by the relevant taxing authority until expiration of the applicable statute of limitations, which is generally three years from the date of filing but can be longer in certain jurisdictions. At this time, management believes there are no uncertain tax positions which, based on their technical merit, would not be sustained upon examination and for which it is reasonably possible that the total amounts of unrecognized tax benefits will significantly change in the next twelve months.
Multiple Class — All shares of the fund represent an equal pro rata interest in the net assets of the class to which such shares belong, and have identical voting, dividend, liquidation and other rights and the same terms and conditions, except for class specific expenses and exclusive rights to vote on matters affecting only individual classes. Income, non-class specific expenses, and realized and unrealized capital gains and losses of the fund are allocated to each class of shares based on their relative net assets.
Distributions to Shareholders — Distributions from net investment income, if any, are declared daily and paid monthly. Distributions from net realized gains, if any, are generally declared and paid annually.
Indemnifications — Under the trust’s organizational documents, its officers and trustees are indemnified against certain liabilities arising out of the performance of their duties to the fund. In addition, in the normal course of business, the fund enters into contracts that provide general indemnifications. The maximum exposure under these arrangements is unknown as this would involve future claims that may be made against a fund. The risk of material loss from such claims is considered by management to be remote.
3. Fees and Transactions with Related Parties
Certain officers and trustees of the trust are also officers and/or directors of American Century Companies, Inc. (ACC). The trust's investment advisor, ACIM, the trust's distributor, American Century Investment Services, Inc. (ACIS), and the trust's transfer agent, American Century Services, LLC, are wholly owned, directly or indirectly, by ACC.
Management Fees — The trust has entered into a management agreement with ACIM, under which ACIM provides the fund with investment advisory and management services in exchange for a single, unified management fee (the fee) per class. The agreement provides that all expenses of managing and operating the fund, except distribution and service fees, brokerage expenses, taxes, interest, fees and expenses of the independent trustees (including legal counsel fees), and extraordinary expenses, will be paid by ACIM. The fee is computed and accrued daily based on each class’s daily net assets and paid monthly in arrears. The fee consists of (1) an Investment Category Fee based on the daily net assets of the fund and certain other accounts managed by the investment advisor that are in the same broad investment category as the fund and (2) a Complex Fee based on the assets of all the funds in the American Century Investments family of funds. The rates for the Investment Category Fee range from 0.1625% to 0.2800%. The rates for the Complex Fee range from 0.2500% to 0.3100% for the Investor Class, A Class and C Class. The rates for the Complex Fee range from 0.0500% to 0.1100% for the Institutional Class. The effective annual management fee for each
36
class for the year ended August 31, 2015 was 0.46% for the Investor Class, A Class and C Class and 0.26% for the Institutional Class.
Distribution and Service Fees — The Board of Trustees has adopted a separate Master Distribution and Individual Shareholder Services Plan for each of the A Class and C Class (collectively the plans), pursuant to Rule 12b-1 of the 1940 Act. The plans provide that the A Class will pay ACIS an annual distribution and service fee of 0.25%. The plans provide that the C Class will pay ACIS an annual distribution and service fee of 1.00%, of which 0.25% is paid for individual shareholder services and 0.75% is paid for distribution services. The fees are computed and accrued daily based on each class’s daily net assets and paid monthly in arrears. The fees are used to pay financial intermediaries for distribution and individual shareholder services. Fees incurred under the plans during the year ended August 31, 2015 are detailed in the Statement of Operations.
Trustees’ Fees and Expenses — The Board of Trustees is responsible for overseeing the investment advisor’s management and operations of the fund. The trustees receive detailed information about the fund and its investment advisor regularly throughout the year, and meet at least quarterly with management of the investment advisor to review reports about fund operations. The fund’s officers do not receive compensation from the fund.
4. Investment Transactions
Purchases and sales of investment securities, excluding short-term investments, for the year ended August 31, 2015 were $625,695,374 and $421,838,344, respectively.
5. Capital Share Transactions
Transactions in shares of the fund were as follows (unlimited number of shares authorized):
| Year ended August 31, 2015 | Year ended August 31, 2014 | |||||||||
| Shares | Amount | Shares | Amount | |||||||
| Investor Class | ||||||||||
| Sold | 26,776,444 | $ | 319,070,899 | 24,531,130 | $ | 286,984,446 | ||||
| Issued in reinvestment of distributions | 1,802,765 | 21,478,133 | 1,661,821 | 19,494,941 | ||||||
| Redeemed | (15,057,358 | ) | (179,336,810 | ) | (25,078,750 | ) | (293,064,366 | ) | ||
| 13,521,851 | 161,212,222 | 1,114,201 | 13,415,021 | |||||||
| Institutional Class | ||||||||||
| Sold | 5,629,481 | 67,112,507 | 7,699,496 | 89,816,972 | ||||||
| Issued in reinvestment of distributions | 488,458 | 5,819,299 | 426,353 | 5,003,950 | ||||||
| Redeemed | (3,891,831 | ) | (46,318,259 | ) | (4,812,425 | ) | (56,223,255 | ) | ||
| 2,226,108 | 26,613,547 | 3,313,424 | 38,597,667 | |||||||
| A Class | ||||||||||
| Sold | 1,248,227 | 14,886,390 | 985,147 | 11,535,307 | ||||||
| Issued in reinvestment of distributions | 60,961 | 726,450 | 61,146 | 716,986 | ||||||
| Redeemed | (748,912 | ) | (8,926,577 | ) | (1,514,835 | ) | (17,686,371 | ) | ||
| 560,276 | 6,686,263 | (468,542 | ) | (5,434,078 | ) | |||||
| C Class | ||||||||||
| Sold | 312,075 | 3,713,825 | 373,398 | 4,376,131 | ||||||
| Issued in reinvestment of distributions | 16,567 | 197,590 | 18,937 | 222,074 | ||||||
| Redeemed | (419,832 | ) | (5,008,858 | ) | (626,960 | ) | (7,317,749 | ) | ||
| (91,190 | ) | (1,097,443 | ) | (234,625 | ) | (2,719,544 | ) | |||
| Net increase (decrease) | 16,217,045 | $ | 193,414,589 | 3,724,458 | $ | 43,859,066 | ||||
37
6. Fair Value Measurements
The fund’s investments valuation process is based on several considerations and may use multiple inputs to determine the fair value of the investments held by the fund. In conformity with accounting principles generally accepted in the United States of America, the inputs used to determine a valuation are classified into three broad levels.
| • | Level 1 valuation inputs consist of unadjusted quoted prices in an active market for identical investments. |
| • | Level 2 valuation inputs consist of direct or indirect observable market data (including quoted prices for comparable investments, evaluations of subsequent market events, interest rates, prepayment speeds, credit risk, etc.). These inputs also consist of quoted prices for identical investments initially expressed in local currencies that are adjusted through translation into U.S. dollars. |
| • | Level 3 valuation inputs consist of unobservable data (including a fund’s own assumptions). |
The level classification is based on the lowest level input that is significant to the fair valuation measurement. The valuation inputs are not necessarily an indication of the risks associated with investing in these securities or other financial instruments. There were no significant transfers between levels during the period.
As of period end, the fund’s investment securities were classified as Level 2. The Schedule of Investments provides additional information on the fund’s portfolio holdings.
7. Derivative Instruments
Interest Rate Risk — The fund is subject to interest rate risk in the normal course of pursuing its investment objectives. The value of bonds generally declines as interest rates rise. A fund may enter into futures contracts based on a bond index or a specific underlying security. A fund may purchase futures contracts to gain exposure to increases in market value or sell futures contracts to protect against a decline in market value. Upon entering into a futures contract, a fund will segregate cash, cash equivalents or other appropriate liquid securities on its records in amounts sufficient to meet requirements. Subsequent payments (variation margin) are made or received daily, in cash, by a fund. The variation margin is equal to the daily change in the contract value and is recorded as unrealized gains and losses. A fund recognizes a realized gain or loss when the futures contract is closed or expires. Net realized and unrealized gains or losses occurring during the holding period of futures contracts are a component of net realized gain (loss) on futures contract transactions and change in net unrealized appreciation (depreciation) on futures contracts, respectively. One of the risks of entering into futures contracts is the possibility that the change in value of the contract may not correlate with the changes in value of the underlying securities. The fund's average exposure to interest rate risk derivative instruments held during the period was 270 contracts.
At period end, the fund did not have any derivative instruments disclosed on the Statement of Assets and Liabilities. For the year ended August 31, 2015, the effect of interest rate risk derivative instruments on the Statement of Operations was $(1,714,522) in net realized gain (loss) on futures contract transactions and $340,296 in change in net unrealized appreciation (depreciation) on futures contracts.
8. Risk Factors
The fund concentrates its investments in a single state and therefore may have more exposure to credit risk related to the state of California than a fund with a broader geographical diversification.
9. Federal Tax Information
The tax character of distributions paid during the years ended August 31, 2015 and August 31, 2014 were as follows:
| 2015 | 2014 | |||||
| Distributions Paid From | ||||||
| Exempt income | $ | 34,662,983 | $ | 32,010,281 | ||
| Taxable ordinary income | $ | 2,058 | — | |||
| Long-term capital gains | — | — | ||||
38
The book-basis character of distributions made during the year from net investment income or net realized gains may differ from their ultimate characterization for federal income tax purposes. These differences reflect the differing character of certain income items and net realized gains and losses for financial statement and tax purposes, and may result in reclassification among certain capital accounts on the financial statements.
As of August 31, 2015, the federal tax cost of investments and the components of distributable earnings on a tax-basis were as follows:
| Federal tax cost of investments | $ | 1,414,472,825 | |
| Gross tax appreciation of investments | $ | 77,220,872 | |
| Gross tax depreciation of investments | (1,106,320 | ) | |
| Net tax appreciation (depreciation) of investments | 76,114,552 | ||
| Net tax appreciation (depreciation) on derivatives | — | ||
| Net tax appreciation (depreciation) | $ | 76,114,552 | |
| Other book-to-tax adjustments | $ | (37,391 | ) |
| Undistributed exempt income | — | ||
| Accumulated short-term capital losses | $ | (4,461,809 | ) |
| Accumulated long-term capital losses | $ | (6,622,789 | ) |
The cost of investments for federal income tax purposes was the same as the cost for financial reporting purposes. Other book-to-tax adjustments are attributable primarily to the tax deferral of losses on straddle positions.
Accumulated capital losses represent net capital loss carryovers that may be used to offset future realized capital gains for federal income tax purposes. The capital loss carryovers may be carried forward for an unlimited period. Future capital loss carryover utilization in any given year may be subject to Internal Revenue Code limitations.
39
| Financial Highlights |
| For a Share Outstanding Throughout the Years Ended August 31 (except as noted) | |||||||||||||||
| Per-Share Data | Ratios and Supplemental Data | ||||||||||||||
| Income From Investment Operations: | Distributions From: | Ratio to Average Net Assets of: | |||||||||||||
Net Asset Value, Beginning of Period | Net Investment Income (Loss)(1) | Net Realized and Unrealized Gain (Loss) | Total From Investment Operations | Net Investment Income | Net Realized Gains | Total Distributions | Net Asset Value, End of Period | Total Return(2) | Operating Expenses | Net Investment Income (Loss) | Portfolio Turnover Rate | Net Assets, End of Period (in thousands) | |||
| Investor Class | |||||||||||||||
| 2015 | $11.94 | 0.29 | (0.09) | 0.20 | (0.29) | — | (0.29) | $11.85 | 1.68% | 0.47% | 2.42% | 30% | $1,216,943 | ||
| 2014 | $11.36 | 0.29 | 0.58 | 0.87 | (0.29) | — | (0.29) | $11.94 | 7.68% | 0.47% | 2.52% | 52% | $1,064,224 | ||
| 2013 | $11.96 | 0.30 | (0.60) | (0.30) | (0.30) | —(3) | (0.30) | $11.36 | (2.51)% | 0.47% | 2.48% | 46% | $1,000,450 | ||
| 2012 | $11.41 | 0.36 | 0.55 | 0.91 | (0.36) | — | (0.36) | $11.96 | 8.06% | 0.47% | 3.04% | 55% | $1,026,796 | ||
| 2011 | $11.56 | 0.40 | (0.15) | 0.25 | (0.40) | — | (0.40) | $11.41 | 2.27% | 0.48% | 3.57% | 49% | $814,078 | ||
| Institutional Class | |||||||||||||||
| 2015 | $11.94 | 0.31 | (0.09) | 0.22 | (0.31) | — | (0.31) | $11.85 | 1.88% | 0.27% | 2.62% | 30% | $232,892 | ||
| 2014 | $11.37 | 0.32 | 0.57 | 0.89 | (0.32) | — | (0.32) | $11.94 | 7.90% | 0.27% | 2.72% | 52% | $207,978 | ||
| 2013 | $11.96 | 0.32 | (0.59) | (0.27) | (0.32) | —(3) | (0.32) | $11.37 | (2.32)% | 0.27% | 2.68% | 46% | $160,329 | ||
| 2012 | $11.41 | 0.38 | 0.55 | 0.93 | (0.38) | — | (0.38) | $11.96 | 8.28% | 0.27% | 3.24% | 55% | $87,170 | ||
| 2011 | $11.57 | 0.42 | (0.16) | 0.26 | (0.42) | — | (0.42) | $11.41 | 2.39% | 0.28% | 3.77% | 49% | $37,381 | ||
40
| For a Share Outstanding Throughout the Years Ended August 31 (except as noted) | |||||||||||||||
| Per-Share Data | Ratios and Supplemental Data | ||||||||||||||
| Income From Investment Operations: | Distributions From: | Ratio to Average Net Assets of: | |||||||||||||
Net Asset Value, Beginning of Period | Net Investment Income (Loss)(1) | Net Realized and Unrealized Gain (Loss) | Total From Investment Operations | Net Investment Income | Net Realized Gains | Total Distributions | Net Asset Value, End of Period | Total Return(2) | Operating Expenses | Net Investment Income (Loss) | Portfolio Turnover Rate | Net Assets, End of Period (in thousands) | |||
| A Class | |||||||||||||||
| 2015 | $11.94 | 0.26 | (0.09) | 0.17 | (0.26) | — | (0.26) | $11.85 | 1.42% | 0.72% | 2.17% | 30% | $39,308 | ||
| 2014 | $11.37 | 0.27 | 0.57 | 0.84 | (0.27) | — | (0.27) | $11.94 | 7.41% | 0.72% | 2.27% | 52% | $32,899 | ||
| 2013 | $11.96 | 0.27 | (0.59) | (0.32) | (0.27) | —(3) | (0.27) | $11.37 | (2.76)% | 0.72% | 2.23% | 46% | $36,644 | ||
| 2012 | $11.41 | 0.32 | 0.56 | 0.88 | (0.33) | — | (0.33) | $11.96 | 7.79% | 0.72% | 2.79% | 55% | $36,341 | ||
| 2011 | $11.57 | 0.37 | (0.16) | 0.21 | (0.37) | — | (0.37) | $11.41 | 1.93% | 0.73% | 3.32% | 49% | $15,077 | ||
| C Class | |||||||||||||||
| 2015 | $11.95 | 0.17 | (0.09) | 0.08 | (0.17) | — | (0.17) | $11.86 | 0.67% | 1.47% | 1.42% | 30% | $16,531 | ||
| 2014 | $11.37 | 0.18 | 0.58 | 0.76 | (0.18) | — | (0.18) | $11.95 | 6.71% | 1.47% | 1.52% | 52% | $17,738 | ||
| 2013 | $11.97 | 0.18 | (0.60) | (0.42) | (0.18) | —(3) | (0.18) | $11.37 | (3.56)% | 1.47% | 1.48% | 46% | $19,555 | ||
| 2012 | $11.42 | 0.23 | 0.56 | 0.79 | (0.24) | — | (0.24) | $11.97 | 6.99% | 1.47% | 2.04% | 55% | $14,361 | ||
| 2011 | $11.57 | 0.29 | (0.15) | 0.14 | (0.29) | — | (0.29) | $11.42 | 1.27% | 1.48% | 2.57% | 49% | $4,157 | ||
| Notes to Financial Highlights |
| (1) | Computed using average shares outstanding throughout the period. |
| (2) | Total returns are calculated based on the net asset value of the last business day and do not reflect applicable sales charges, if any. Total returns for periods less than one year are not annualized. |
| (3) | Per-share amount was less than $0.005. |
See Notes to Financial Statements.
41
| Report of Independent Registered Public Accounting Firm |
To the Trustees of the American Century California Tax-Free and Municipal Funds and Shareholders of the California Intermediate-Term Tax-Free Bond Fund:
In our opinion, the accompanying statement of assets and liabilities, including the schedule of investments, and the related statements of operations and of changes in net assets and the financial highlights present fairly, in all material respects, the financial position of the California Intermediate-Term Tax-Free Bond Fund (one of the four funds in the American Century California Tax-Free and Municipal Funds, hereafter referred to as the "Fund") at August 31, 2015, the results of its operations for the year then ended, the changes in its net assets for each of the two years in the period then ended and the financial highlights for each of the five years in the period then ended, in conformity with accounting principles generally accepted in the United States of America. These financial statements and financial highlights (hereafter referred to as "financial statements") are the responsibility of the Fund's management. Our responsibility is to express an opinion on these financial statements based on our audits. We conducted our audits of these financial statements in accordance with the standards of the Public Company Accounting Oversight Board (United States). Those standards require that we plan and perform the audit to obtain reasonable assurance about whether the financial statements are free of material misstatement. An audit includes examining, on a test basis, evidence supporting the amounts and disclosures in the financial statements, assessing the accounting principles used and significant estimates made by management, and evaluating the overall financial statement presentation. We believe that our audits, which included confirmation of securities at August 31, 2015 by correspondence with the custodian and brokers, provide a reasonable basis for our opinion.
PricewaterhouseCoopers LLP
Kansas City, Missouri
October 21, 2015
42
| Management |
Board of Trustees
The individuals listed below serve as trustees of the funds. Each trustee will continue to serve in this capacity until death, retirement, resignation or removal from office. The board has adopted a mandatory retirement age for trustees who are not “interested persons,” as that term is defined in the Investment Company Act (independent trustees). Independent trustees shall retire on December 31 of the year in which they reach their 75th birthday; provided, however, that on or after January 1, 2022, independent trustees shall retire on December 31 of the year in which they reach their 76th birthday.
Mr. Thomas is an “interested person” because he currently serves as President and Chief Executive Officer of American Century Companies, Inc. (ACC), the parent company of American Century Investment Management, Inc. (ACIM or the advisor). The other trustees (more than three-fourths of the total number) are independent. They are not employees, directors or officers of, and have no financial interest in, ACC or any of its wholly owned, direct or indirect, subsidiaries, including ACIM, American Century Investment Services, Inc. (ACIS) and American Century Services, LLC (ACS), and they do not have any other affiliations, positions or relationships that would cause them to be considered “interested persons” under the Investment Company Act. The trustees serve in this capacity for eight (in the case of Mr. Thomas, 15) registered investment companies in the American Century Investments family of funds.
The following table presents additional information about the trustees. The mailing address for each trustee other than Mr. Thomas is 1665 Charleston Road, Mountain View, California 94043. The mailing address for Mr. Thomas is 4500 Main Street, Kansas City, Missouri 64111.
Name (Year of Birth) | Position(s) Held with Funds | Length of Time Served | Principal Occupation(s) During Past 5 Years | Number of American Century Portfolios Overseen by Trustee | Other Directorships Held During Past 5 Years |
| Independent Trustees | |||||
| Tanya S. Beder (1955) | Trustee | Since 2011 | Chairman and CEO, SBCC Group Inc. (independent advisory services) (2006 to present) | 46 | CYS Investments, Inc. (NYSE mortgage arbitrage REIT) |
| Jeremy I. Bulow (1954) | Trustee | Since 2011 | Professor of Economics, Stanford University, Graduate School of Business (1979 to present) | 46 | None |
| Ronald J. Gilson (1946) | Trustee and Chairman of the Board | Since 1995 (Chairman since 2005) | Charles J. Meyers Professor of Law and Business, Stanford Law School (1979 to present); Marc and Eva Stern Professor of Law and Business, Columbia University School of Law (1992 to present) | 46 | None |
| Frederick L. A. Grauer (1946) | Trustee | Since 2008 | Senior Advisor, BlackRock, Inc. (investment management firm) (2010 to 2011, 2013 to present) | 46 | None |
| Peter F. Pervere (1947) | Trustee | Since 2007 | Retired | 46 | None |
43
Name (Year of Birth) | Position(s) Held with Funds | Length of Time Served | Principal Occupation(s) During Past 5 Years | Number of American Century Portfolios Overseen by Trustee | Other Directorships Held During Past 5 Years |
| Independent Trustee | |||||
| John B. Shoven (1947) | Trustee | Since 2002 | Professor of Economics, Stanford University (1973 to present) | 46 | Cadence Design Systems; Exponent; Financial Engines |
| Interested Trustee | |||||
| Jonathan S. Thomas (1963) | Trustee and President | Since 2007 | President and Chief Executive Officer, ACC (March 2007 to present). Also serves as Chief Executive Officer, ACS; Executive Vice President, ACIM; Director, ACC, ACIM and other ACC subsidiaries | 124 | BioMed Valley Discoveries, Inc. |
The Statement of Additional Information has additional information about the fund's trustees and is available without charge, upon request, by calling 1-800-345-2021.
44
Officers
The following table presents certain information about the executive officers of the funds. Each officer serves as an officer for each of the 15 investment companies in the American Century family of funds, unless otherwise noted. No officer is compensated for his or her service as an officer of the funds. The listed officers are interested persons of the funds and are appointed or re-appointed on an annual basis. The mailing address for each of the officers listed below is 4500 Main Street, Kansas City, Missouri 64111.
Name (Year of Birth) | Offices with the Funds | Principal Occupation(s) During the Past Five Years |
| Jonathan S. Thomas (1963) | Trustee and President since 2007 | President and Chief Executive Officer, ACC (March 2007 to present). Also serves as Chief Executive Officer, ACS; Executive Vice President, ACIM; Director, ACC, ACIM and other ACC subsidiaries |
| Amy D. Shelton (1964) | Chief Compliance Officer and Vice President since 2014 | Chief Compliance Officer, American Century funds, (March 2014 to present); Chief Compliance Officer, ACIM (February 2014 to present); Chief Compliance Officer, ACIS (October 2009 to present); Vice President, Client Interactions and Marketing, ACIS (February 2013 to January 2014); Director, Client Interactions and Marketing, ACIS (June 2007 to January 2013). Also serves as Vice President, ACIS |
| Charles A. Etherington (1957) | General Counsel since 2007 and Senior Vice President since 2006 | Attorney, ACC (February 1994 to present); Vice President, ACC (November 2005 to present); General Counsel, ACC (March 2007 to present). Also serves as General Counsel, ACIM, ACS, ACIS and other ACC subsidiaries; and Senior Vice President, ACIM and ACS |
| C. Jean Wade (1964) | Vice President, Treasurer and Chief Financial Officer since 2012 | Vice President, ACS (February 2000 to present) |
| Robert J. Leach (1966) | Vice President since 2006 and Assistant Treasurer since 2012 | Vice President, ACS (February 2000 to present) |
| David H. Reinmiller (1963) | Vice President since 2001 | Attorney, ACC (January 1994 to present); Associate General Counsel, ACC (January 2001 to present). Also serves as Vice President, ACIM and ACS |
| Ward D. Stauffer (1960) | Secretary since 2005 | Attorney, ACC (June 2003 to present) |
45
| Approval of Management Agreement |
At a meeting held on June 16, 2015, the Fund’s Board of Trustees unanimously approved the renewal of the management agreement pursuant to which American Century Investment Management, Inc. (the “Advisor”) acts as the investment advisor for the Fund. Under Section 15(c) of the Investment Company Act, contracts for investment advisory services are required to be reviewed, evaluated, and approved by a majority of a fund’s directors/trustees, including a majority of the independent Trustees, each year. The Board regards this annual evaluation and renewal as one of its most important responsibilities.
The independent Trustees have memorialized a statement regarding the relationship between their ongoing obligations to oversee and evaluate the performance of the Advisor and their annual consideration of renewal of the management agreement. In that statement, the independent Trustees noted that their assessment of the Advisor’s performance is an ongoing process that takes place over the entire year and is informed by all of the extensive information that the Board and its committees receive and consider over time. This information, together with the materials provided in connection with the review, are central to the Board’s assessment of the Advisor’s performance and its determination whether to renew the Fund’s management agreement.
Prior to its consideration of the renewal of the management agreement, the Board requested and reviewed extensive data and analysis relating to the proposed renewal. This information and analysis was compiled by the Advisor and certain independent providers of evaluation data concerning the Fund and the services provided to the Fund by the Advisor.
In connection with its consideration of the renewal of the management agreement, the Board’s review and evaluation of the services provided by the Advisor included, but was not limited to, the following:
| • | the nature, extent, and quality of investment management, shareholder services, and other services provided by the Advisor to the Fund; |
| • | the wide range of other programs and services the Advisor provides to the Fund and its shareholders on a routine and non-routine basis; |
| • | the investment performance of the Fund, including data comparing the Fund’s performance to appropriate benchmarks and/or a peer group of other mutual funds with similar investment objectives and strategies; |
| • | the cost of owning the Fund compared to the cost of owning similar funds; |
| • | the Advisor’s compliance policies, procedures, and regulatory experience; |
| • | financial data showing the cost of services provided to the Fund, the profitability of the Fund to the Advisor, and the overall profitability of the Advisor; |
| • | possible economies of scale associated with the Advisor’s management of the Fund and other accounts under its management; |
| • | data comparing services provided and charges to other investment management clients of the Advisor; |
| • | acquired fund fees and expenses; |
| • | payments by the Fund and the Advisor to financial intermediaries whose clients are investors in the Fund; and |
| • | any collateral benefits derived by the Advisor from the management of the Fund. |
In keeping with its practice, the Board held two in-person meetings to review and discuss the information provided in response to their request. The independent Trustees also had the benefit of the advice of their independent counsel throughout the process.
46
Factors Considered
The Trustees considered all of the information provided by the Advisor, the independent data providers, and the independent Trustees’ independent counsel in connection with the review, and evaluated such information for the Fund. In connection with their review, the Trustees did not identify any single factor as being all-important or controlling and each Trustee may have attributed different levels of importance to different factors. In deciding to renew the management agreement, the Board based its decision on a number of factors, including the following:
Nature, Extent and Quality of Services - Generally. Under the management agreement, the Advisor is responsible for providing or arranging for all services necessary for the operation of the Fund. The Board noted that under the management agreement, the Advisor provides or arranges at its own expense a wide variety of services including:
| • | constructing and designing the Fund |
| • | portfolio research and security selection |
| • | initial capitalization/funding |
| • | securities trading |
| • | Fund administration |
| • | custody of Fund assets |
| • | daily valuation of the Fund’s portfolio |
| • | shareholder servicing and transfer agency, including shareholder confirmations, recordkeeping, and communications |
| • | legal services (except the independent Trustees’ counsel) |
| • | regulatory and portfolio compliance |
| • | financial reporting |
| • | marketing and distribution (except amounts paid by the Fund under Rule 12b-1 plans) |
The Board noted that many of these services have expanded over time both in terms of quantity and complexity in response to shareholder demands, competition in the industry, changing distribution channels, and the changing regulatory environment.
Investment Management, Shareholder, and Other Services. The nature of the investment management services provided to the Fund is quite complex and allows Fund shareholders access to professional money management, instant diversification of their investments within an asset class, the opportunity to easily diversify among asset classes by investing in or exchanging among various American Century Investments funds, and liquidity. In evaluating investment performance, the Board expects the Advisor to manage the Fund in accordance with its investment objectives and approved strategies. Further, the Trustees recognize that the Advisor has an obligation to seek the best execution of fund trades. In providing these services, the Advisor utilizes teams of investment professionals (portfolio managers, analysts, research assistants, and securities traders) who require extensive information technology, research, training, compliance, and other systems to conduct their business. The Board, directly and through its Portfolio Committee, regularly reviews investment performance information for the Fund, together with comparative information for appropriate benchmarks and/or peer groups of similarly-managed funds, over different time horizons. The Trustees also review detailed performance information during the management agreement approval process. If performance concerns are identified, the Fund receives special reviews until performance improves, during which the Board discusses with the Advisor the reasons for such results (e.g., market conditions, security selection) and any efforts being undertaken to improve performance. The Fund’s performance was below its benchmark for the one-, three-, five-, and ten-year periods reviewed by the Board. The Board discussed the Fund’s performance with the Advisor and was satisfied with the efforts being undertaken by the Advisor. The Board found the investment management services provided by the Advisor to the Fund to be satisfactory and consistent with the management agreement.
Under the management agreement, the Advisor provides the Fund with a comprehensive package of transfer agency, shareholder, and other services. The Board, directly and through various
47
committees of the Board, regularly reviews reports and evaluations of such services at its regular meetings. These reports include, but are not limited to, information regarding the operational efficiency and accuracy of the shareholder and transfer agency services provided, staffing levels, shareholder satisfaction (as measured by external as well as internal sources), technology support, new products and services offered to Fund shareholders, securities trading activities, portfolio valuation services, auditing services, and legal and operational compliance activities.
Certain aspects of shareholder and transfer agency service level efficiency and the quality of securities trading activities are measured by independent third party providers and are presented in comparison to other fund groups not managed by the Advisor. The Board found the services provided by the Advisor to the Fund under the management agreement to be competitive and of high quality.
Costs of Services and Profitability. The Advisor provides detailed information concerning its cost of providing various services to the Fund, its profitability in managing the Fund, its overall profitability, and its financial condition. The Trustees have reviewed with the Advisor the methodology used to prepare this financial information. This information is considered in evaluating the Advisor’s financial condition, its ability to continue to provide services under the management agreement, and the reasonableness of the current management fee. The Board concluded that the Advisor’s profits were reasonable in light of the services provided to the Fund.
Ethics. The Board generally considers the Advisor’s commitment to providing quality services to shareholders and to conducting its business ethically. They noted that the Advisor’s practices generally meet or exceed industry best practices.
Economies of Scale. The Board also reviewed information provided by the Advisor regarding the possible existence of economies of scale in connection with the management of the Fund. The Board concluded that economies of scale are difficult to measure and predict with precision, especially on a fund-by-fund basis. The Board concluded that the Advisor is appropriately sharing economies of scale through its competitive fee structure, offering competitive fees from fund inception, and through reinvestment in its business to provide shareholders enhanced and expanded services.
Comparison to Other Funds’ Fees. The management agreement provides that the Fund pays the Advisor a single, all-inclusive (or unified) management fee for providing all services necessary for the management and operation of the Fund, other than brokerage expenses, taxes, interest, extraordinary expenses, the fees and expenses of the Fund’s independent Trustees (including their independent legal counsel), and expenses incurred in connection with the provision of shareholder services and distribution services under a plan adopted pursuant to Rule 12b-1 under the 1940 Act. Under the unified fee structure, the Advisor is responsible for providing all investment advisory, custody, audit, administrative, compliance, recordkeeping, marketing, and shareholder services, or arranging and supervising third parties to provide such services. By contrast, most other funds are charged a variety of fees, including an investment advisory fee, a transfer agency fee, an administrative fee, distribution charges, and other expenses. Other than their investment advisory fees and any applicable Rule 12b-1 fees, all other components of the total fees charged by these other funds may be increased without shareholder approval. The Board believes the unified fee structure is a benefit to Fund shareholders because it clearly discloses to shareholders the cost of owning Fund shares, and, since the unified fee cannot be increased without a vote of Fund shareholders, it shifts to the Advisor the risk of increased costs of operating the Fund and provides a direct incentive to minimize administrative inefficiencies. Part of the Board’s analysis of fee levels involves reviewing certain evaluative data compiled by an independent provider and comparing the Fund’s unified fee to the total expense ratio of peer funds. The unified fee charged to shareholders of the Fund was below the median of the total expense ratios of the Fund’s peer group. The Board concluded that the management fee paid by the Fund to the Advisor under the management agreement is reasonable in light of the services provided to the Fund.
48
Comparison to Fees and Services Provided to Other Clients of the Advisor. The Board also requested and received information from the Advisor concerning the nature of the services, fees, costs, and profitability of its advisory services to advisory clients other than the Fund. They observed that these varying types of client accounts require different services and involve different regulatory and entrepreneurial risks than the management of the Fund. The Board analyzed this information and concluded that the fees charged and services provided to the Fund were reasonable by comparison.
Payments to Intermediaries. The Trustees also requested and received a description of payments made to intermediaries by the Fund and the Advisor. These payments include various payments made by the Fund or the Advisor to different types of intermediaries and recordkeepers for distribution and service activities provided for the Fund.
Collateral or “Fall-Out” Benefits Derived by the Advisor. The Board considered the existence of collateral benefits the Advisor may receive as a result of its relationship with the Fund. The Board noted that the Advisor’s primary business is managing mutual funds and it generally does not use fund or shareholder information to generate profits in other lines of business, and therefore does not derive any significant collateral benefits from them. The Board noted that the Advisor receives proprietary research from broker-dealers that execute fund portfolio transactions. The Board also determined that the Advisor is able to provide investment management services to certain clients other than the Fund, at least in part, due to its existing infrastructure built to serve the fund complex.
Existing Relationship. The Board also considered whether there was any reason for not continuing the existing arrangement with the Advisor. In this regard, the Board was mindful of the potential disruptions of the Fund’s operations and various risks, uncertainties, and other effects that could occur as a result of a decision not to continue such relationship. In particular, the Board recognized that most shareholders have invested in the Fund on the strength of the Advisor’s industry standing and reputation and in the expectation that the Advisor will have a continuing role in providing advisory services to the Fund.
Conclusion of the Trustees. As a result of this process, the Board, including all of the independent Trustees and assisted by the advice of independent legal counsel, taking into account all of the factors discussed above and the information provided by the Advisor and others in connection with its review and throughout the year, concluded that the management agreement between the Fund and the Advisor is fair and reasonable in light of the services provided and should be renewed.
49
| Additional Information |
Proxy Voting Policies
Descriptions of the principles and policies that the fund’s investment advisor uses in exercising the voting rights associated with the securities purchased and/or held by the fund are available without charge, upon request, by calling 1-800-345-2021 or visiting the “About Us” page of American Century Investments’ website at americancentury.com. A description of the policies is also available on the Securities and Exchange Commission’s website at sec.gov. Information regarding how the investment advisor voted proxies relating to portfolio securities during the most recent 12-month period ended June 30 is available on the “About Us” page at americancentury.com. It is also available at sec.gov.
Quarterly Portfolio Disclosure
The fund files its complete schedule of portfolio holdings with the Securities and Exchange Commission (SEC) for the first and third quarters of each fiscal year on Form N-Q. The fund’s Forms N-Q are available on the SEC’s website at sec.gov, and may be reviewed and copied at the SEC’s Public Reference Room in Washington, DC. Information on the operation of the Public Reference Room may be obtained by calling 1-800-SEC-0330. The fund also makes its complete schedule of portfolio holdings for the most recent quarter of its fiscal year available on its website at americancentury.com and, upon request, by calling 1-800-345-2021.
Other Tax Information
The following information is provided pursuant to provisions of the Internal Revenue Code.
The fund designates $34,452,671 as exempt interest dividends for the fiscal year ended August 31, 2015.
50
| Notes |
51
| Notes |
52
| ||
| Contact Us | americancentury.com | |
| Automated Information Line | 1-800-345-8765 | |
| Investor Services Representative | 1-800-345-2021 or 816-531-5575 | |
| Investors Using Advisors | 1-800-378-9878 | |
| Business, Not-For-Profit, Employer-Sponsored Retirement Plans | 1-800-345-3533 | |
| Banks and Trust Companies, Broker-Dealers, Financial Professionals, Insurance Companies | 1-800-345-6488 | |
| Telecommunications Relay Service for the Deaf | 711 | |
| American Century California Tax-Free and Municipal Funds | ||
Investment Advisor: American Century Investment Management, Inc. Kansas City, Missouri | ||
This report and the statements it contains are submitted for the general information of our shareholders. The report is not authorized for distribution to prospective investors unless preceded or accompanied by an effective prospectus. | ||
| ©2015 American Century Proprietary Holdings, Inc. All rights reserved. CL-ANN-86900 1510 | ||
| ANNUAL REPORT | AUGUST 31, 2015 |
California High-Yield Municipal Fund
| Table of Contents |
| President’s Letter | 2 | |
| Performance | 3 | |
| Portfolio Commentary | ||
| Fund Characteristics | ||
| Shareholder Fee Example | ||
| Schedule of Investments | ||
| Statement of Assets and Liabilities | ||
| Statement of Operations | ||
| Statement of Changes in Net Assets | ||
| Notes to Financial Statements | ||
| Financial Highlights | ||
| Report of Independent Registered Public Accounting Firm | ||
| Management | ||
| Approval of Management Agreement | ||
| Additional Information | ||
Any opinions expressed in this report reflect those of the author as of the date of the report, and do not necessarily represent the opinions of American Century Investments® or any other person in the American Century Investments organization. Any such opinions are subject to change at any time based upon market or other conditions and American Century Investments disclaims any responsibility to update such opinions. These opinions may not be relied upon as investment advice and, because investment decisions made by American Century Investments funds are based on numerous factors, may not be relied upon as an indication of trading intent on behalf of any American Century Investments fund. Security examples are used for representational purposes only and are not intended as recommendations to purchase or sell securities. Performance information for comparative indices and securities is provided to American Century Investments by third party vendors. To the best of American Century Investments’ knowledge, such information is accurate at the time of printing.
| President’s Letter |
| Dear Investor: Thank you for reviewing this annual report for the 12 months ended August 31, 2015. It provides investment performance and portfolio information for the reporting period, plus longer-term historical performance data. Annual reports remain important vehicles for conveying information about fund returns, including market and economic factors that affected performance during the reporting period. For additional, updated investment and market insights, we encourage you to visit our website, americancentury.com. |
| Jonathan Thomas | |
Municipal Market Relatively Stable Overall (Ex-Puerto Rico and Chicago) in a Period of Increased Volatility
Broad market index returns for municipal bonds (munis) were mostly positive for the 12 months, primarily a carryover from favorable muni market conditions during the first five months of the reporting period. During those first five months (mostly during late 2014), the muni market was still rebounding after selling off in 2013. The 2014 rebound reflected a favorable combination of constrained inflation, improving U.S. economic and credit conditions, strong demand for yield, relatively low muni issuance, and the unexpected U.S. Treasury market rally.
Positive momentum from 2014 carried into January 2015, then reversed during the next four months. We believe munis struggled from February into June this year due to: 1) low, post-rally muni yields not attracting investors, 2) supply (particularly from refinancing activity) increasing while demand was declining, and 3) the downgrade of Chicago’s debt to high-yield status in May.
Deteriorating credit conditions in Puerto Rico also created headlines as the summer progressed, but the broader muni market became a bastion of stability because of its relatively high overall credit quality. During the last two months of the reporting period, comparative stability in muni market performance played out against a broader global backdrop of increased capital market volatility. This was triggered in part by China’s economic slowdown and by diverging central bank policies as the U.S. Federal Reserve seeks to reduce its monetary stimulus while other central banks are still pursuing theirs at full throttle amid generally soft global growth conditions. We expect more monetary policy divergence between the U.S. and the rest of the world in coming months, accompanied by continued market volatility. This could present both challenges and opportunities for active investment managers. In this environment, we continue to believe in a disciplined, diversified, long-term investment approach, using professionally managed stock and bond portfolios to meet financial goals. We appreciate your continued trust in us.
Sincerely,
Jonathan Thomas
President and Chief Executive Officer
American Century Investments
2
| Performance |
| Total Returns as of August 31, 2015 | ||||||
| Average Annual Returns | ||||||
Ticker Symbol | 1 year | 5 years | 10 years | Since Inception | Inception Date | |
| Investor Class | BCHYX | 4.32% | 5.68% | 4.70% | 5.97% | 12/30/86 |
| Barclays Municipal Bond Index | — | 2.52% | 3.96% | 4.49% | 6.12%(1) | — |
| Institutional Class | BCHIX | 4.53% | 5.89% | — | 6.67% | 3/1/10 |
| A Class | CAYAX | 1/31/03 | ||||
| No sales charge* | 4.06% | 5.42% | 4.44% | 5.03% | ||
| With sales charge* | -0.59% | 4.44% | 3.96% | 4.65% | ||
| C Class | CAYCX | 3.29% | 4.63% | 3.67% | 4.27% | 1/31/03 |
* Sales charges include initial sales charges and contingent deferred sales charges (CDSCs), as applicable. A Class shares have a 4.50% maximum initial sales charge and may be subject to a maximum CDSC of 1.00%. C Class shares redeemed within 12 months of purchase are subject to a maximum CDSC of 1.00%. The SEC requires that mutual funds provide performance information net of maximum sales charges in all cases where charges could be applied.
| (1) | Since December 31, 1986, the date nearest the Investor Class's inception for which data are available. |
Data presented reflect past performance. Past performance is no guarantee of future results. Current performance may be higher or lower than the performance shown. Investment return and principal value will fluctuate, and redemption value may be more or less than original cost. Data assumes reinvestment of dividends and capital gains, and none of the charts reflect the deduction of taxes that a shareholder would pay on fund distributions or the redemption of fund shares. To obtain performance data current to the most recent month end, please call 1-800-345-2021 or visit americancentury.com. For additional information about the fund, please consult the prospectus.
3
| Growth of $10,000 Over 10 Years |
| $10,000 investment made August 31, 2005 |
| Performance for other share classes will vary due to differences in fee structure. |
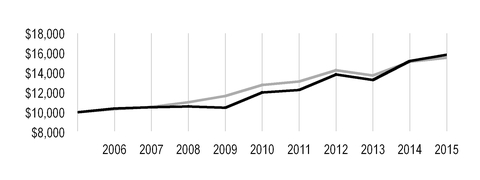
| Value on August 31, 2015 | |
| Investor Class — $15,840 | |
| Barclays Municipal Bond Index — $15,513 | |
| Total Annual Fund Operating Expenses | |||
| Investor Class | Institutional Class | A Class | C Class |
| 0.50% | 0.30% | 0.75% | 1.50% |
The total annual fund operating expenses shown is as stated in the fund’s prospectus current as of the date of this report. The prospectus may vary from the expense ratio shown elsewhere in this report because it is based on a different time period, includes acquired fund fees and expenses, and, if applicable, does not include fee waivers or expense reimbursements.
Data presented reflect past performance. Past performance is no guarantee of future results. Current performance may be higher or lower than the performance shown. Investment return and principal value will fluctuate, and redemption value may be more or less than original cost. Data assumes reinvestment of dividends and capital gains, and none of the charts reflect the deduction of taxes that a shareholder would pay on fund distributions or the redemption of fund shares. To obtain performance data current to the most recent month end, please call 1-800-345-2021 or visit americancentury.com. For additional information about the fund, please consult the prospectus.
4
| Portfolio Commentary |
Portfolio Managers: Alan Kruss, Joseph Gotelli, and Steven Permut
Performance Summary
California High-Yield Municipal returned 4.32%* for the 12 months ended August 31, 2015. The fund’s national investment-grade benchmark, the Barclays Municipal Bond Index, returned 2.52%.
The fund’s absolute return reflected the positive overall performance of California municipal bonds (munis) despite a backdrop of increasing global market volatility. The muni market generally rallied during the first five months of the period, following the U.S. Treasury market higher. Global divergence of central bank policy, whereby the Federal Reserve (the Fed) was scaling back its stimulus programs as other leading central banks were increasing theirs in response to weak growth rates, created an environment in which U.S. Treasury yields were relatively more attractive than government bond yields in Europe and elsewhere. A muted inflation backdrop also aided U.S. bond returns. Furthermore, a combination of factors specific to munis, including generally improving credit conditions among issuers and modest demand for munis in the face of reduced supply, also supported broad muni market gains, particularly high-yield munis.
Beginning in February 2015, muni market volatility emerged and persisted into June. Mounting speculation about when the Fed would raise its federal funds rate target pushed interest rates higher, slowing demand for investment-grade fixed-income securities in general. In the muni market, demand subsided (particularly from mutual fund investors) as municipalities boosted issuance of securities ahead of the Fed’s expected interest rate hike, which most investors believed would occur later in 2015. These supply/demand factors suppressed returns. In addition, credit rating agency Moody’s downgraded Chicago’s debt to high-yield status, which put pressure on other muni issuers with large unfunded pension liabilities. Late in the period, concerns about slowing growth in China rocked the global financial markets. Investment-grade munis, which represented a source of relative stability during this market unrest, rebounded in the final two months of the period, benefiting from their quality characteristics and tax benefits.
Overall, strong performance early and late in the period more than offset the weaker results in the middle months. Longer-maturity and lower-quality munis generally fared better than shorter-maturity and the highest-quality securities. Revenue bonds outperformed general obligation (GO) bonds, and California munis generally outperformed national muni benchmarks. The fund’s outperformance versus its benchmark was due primarily to its single-state focus and longer duration (price sensitivity to interest rate changes) relative to the national benchmark. Security selection within the California high-yield muni universe also aided results.
Credit Improvements, Particularly in California, Negated Negative Headlines Elsewhere
Despite negative headlines regarding Chicago, Puerto Rico, and other isolated issuers, muni market fundamentals generally remained positive and continued to provide support to the broad market. We believe the problems in Chicago and Puerto Rico are due largely to their own circumstances and should not be viewed as indicative of any particular systemic municipal market problem.
* | All fund returns referenced in this commentary are for Investor Class shares. Performance for other share classes will vary due to differences in fee structures; when Investor Class performance exceeds that of the fund’s benchmark, other share classes may not. See page 3 for returns for all share classes. |
5
From a broad fiscal standpoint, state and local finances in California and across the U.S. generally improved due to increased revenue collections and spending constraints. California’s economy gained ground, as indicated by job growth (which exceeded the U.S. average) and real estate gains. Following enactment of California’s 2015-2016 budget, which mandates contributions to the state’s “rainy day” fund and the paydown of previous deficit loans, Standard & Poor’s raised the state’s bond credit rating to “AA-,” its highest level in 14 years.
From a national credit rating perspective, muni credit-rating upgrades outpaced downgrades in the fourth quarter of 2014 and first quarter of 2015. In addition, the national muni default rate remained low. We continue to believe it is unlikely any states will default, but select isolated state, local, and commonwealth credit ratings could be pressured by special circumstances.
California Bias, Security Selection, Longer Duration Were Main Relative Performance Contributors
The portfolio’s California bias compared with the national benchmark and our preference for revenue bonds over GO bonds contributed to the fund’s outperformance. Within the revenue sector, we favored special tax, transportation, and lease revenue bonds.
Our focus on longer-maturity securities and maintaining a longer duration versus the benchmark also contributed to the fund’s outperformance. In general, longer-term interest rates declined and shorter-term rates increased during the 12-month period. This caused the yield curve to flatten, and longer-maturity/duration securities generally outperformed their shorter-maturity/duration counterparts. We used U.S. Treasury futures as part of our duration strategy.
Meanwhile, small positions in select Puerto Rico munis detracted from fund performance. In light of the escalating fiscal challenges facing Puerto Rico, we began reducing the portfolio’s position in the commonwealth’s munis in early 2015. By the end of July, we had exited all Puerto Rico debt. Although we no longer have any direct Puerto Rico exposure, we expect the commonwealth to continue to distract the muni market due to the sheer size and prevalence of its outstanding debt.
Global Market Volatility Likely to Persist
We believe interest rates will increase as the U.S. economy continues to improve, but the time frame for rate normalization may be extended due to weak global growth. Given this backdrop and continued uncertainty about the Fed’s monetary policy strategy, we expect market volatility to persist ahead of any action on short-term interest rates. The near-term effect this backdrop will have on muni supply remains unclear. On one hand, it may increase issuance as municipalities seek to refinance their debt and issue securities before the Fed raises rates significantly higher. On the other hand, it may lead to reduced overall muni supply as issuers have less incentive to refinance as rates rise. We believe the volatile backdrop may lead to credit spread widening (an increase in the yield differential between higher-quality and lower-quality munis of similar maturity), which may reveal compelling buying opportunities among lower-quality credits. We expect fundamental credit research, active management, and security selection to become increasingly important as rates normalize.
We continue to monitor the impact of California’s drought on the state economy and individual bond issuers. We do not expect the drought to have a broad impact on the credit ratings of water bond issuers within the state, given the financial strength of most water utilities. With regard to the state economy, the drought could slow growth in more agriculturally oriented areas, but they represent only 2% of California’s diverse economy.
6
| Fund Characteristics |
| AUGUST 31, 2015 | |
| Portfolio at a Glance | |
| Weighted Average Maturity | 19.5 years |
| Average Duration (Modified) | 5.7 years |
| Top Five Sectors | % of fund investments |
| Special Tax | 24% |
| Hospital | 10% |
| Tollroads | 9% |
| General Obligation (GO) - Local | 9% |
| Lease Revenue | 8% |
| Types of Investments in Portfolio | % of net assets |
| Municipal Securities | 98.6% |
| Other Assets and Liabilities | 1.4% |
7
| Shareholder Fee Example |
Fund shareholders may incur two types of costs: (1) transaction costs, including sales charges (loads) on purchase payments and redemption/exchange fees; and (2) ongoing costs, including management fees; distribution and service (12b-1) fees; and other fund expenses. This example is intended to help you understand your ongoing costs (in dollars) of investing in your fund and to compare these costs with the ongoing cost of investing in other mutual funds.
The example is based on an investment of $1,000 made at the beginning of the period and held for the entire period from March 1, 2015 to August 31, 2015.
Actual Expenses
The table provides information about actual account values and actual expenses for each class. You may use the information, together with the amount you invested, to estimate the expenses that you paid over the period. First, identify the share class you own. Then simply divide your account value by $1,000 (for example, an $8,600 account value divided by $1,000 = 8.6), then multiply the result by the number under the heading “Expenses Paid During Period” to estimate the expenses you paid on your account during this period.
If you hold Investor Class shares of any American Century Investments fund, or Institutional Class shares of the American Century Diversified Bond Fund, in an American Century Investments account (i.e., not a financial intermediary or retirement plan account), American Century Investments may charge you a $12.50 semiannual account maintenance fee if the value of those shares is less than $10,000. We will redeem shares automatically in one of your accounts to pay the $12.50 fee. In determining your total eligible investment amount, we will include your investments in all personal accounts (including American Century Investments Brokerage accounts) registered under your Social Security number. Personal accounts include individual accounts, joint accounts, UGMA/UTMA accounts, personal trusts, Coverdell Education Savings Accounts and IRAs (including traditional, Roth, Rollover, SEP-, SARSEP- and SIMPLE-IRAs), and certain other retirement accounts. If you have only business, business retirement, employer-sponsored or American Century Investments Brokerage accounts, you are currently not subject to this fee. If you are subject to the Account Maintenance Fee, your account value could be reduced by the fee amount.
Hypothetical Example for Comparison Purposes
The table also provides information about hypothetical account values and hypothetical expenses based on the actual expense ratio of each class of your fund and an assumed rate of return of 5% per year before expenses, which is not the actual return of a fund’s share class. The hypothetical account values and expenses may not be used to estimate the actual ending account balance or expenses you paid for the period. You may use this information to compare the ongoing costs of investing in your fund and other funds. To do so, compare this 5% hypothetical example with the 5% hypothetical examples that appear in the shareholder reports of the other funds.
Please note that the expenses shown in the table are meant to highlight your ongoing costs only and do not reflect any transactional costs, such as sales charges (loads) or redemption/exchange fees. Therefore, the table is useful in comparing ongoing costs only, and will not help you determine the relative total costs of owning different funds. In addition, if these transactional costs were included, your costs would have been higher.
8
| Beginning Account Value 3/1/15 | Ending Account Value 8/31/15 | Expenses Paid During Period(1)3/1/15 - 8/31/15 | Annualized Expense Ratio(1) | |
| Actual | ||||
| Investor Class | $1,000 | $1,005.40 | $2.53 | 0.50% |
| Institutional Class | $1,000 | $1,006.40 | $1.52 | 0.30% |
| A Class | $1,000 | $1,004.10 | $3.79 | 0.75% |
| C Class | $1,000 | $1,000.30 | $7.56 | 1.50% |
| Hypothetical | ||||
| Investor Class | $1,000 | $1,022.69 | $2.55 | 0.50% |
| Institutional Class | $1,000 | $1,023.69 | $1.53 | 0.30% |
| A Class | $1,000 | $1,021.43 | $3.82 | 0.75% |
| C Class | $1,000 | $1,017.64 | $7.63 | 1.50% |
| (1) | Expenses are equal to the class's annualized expense ratio listed in the table above, multiplied by the average account value over the period, multiplied by 184, the number of days in the most recent fiscal half-year, divided by 365, to reflect the one-half year period. |
9
| Schedule of Investments |
AUGUST 31, 2015
| Principal Amount | Value | |||||
| MUNICIPAL SECURITIES — 98.6% | ||||||
| California — 96.9% | ||||||
| ABAG Finance Authority for Nonprofit Corps. Rev., (Jackson Laboratory), 5.00%, 7/1/37 | $ | 2,000,000 | $ | 2,212,840 | ||
| ABAG Finance Authority for Nonprofit Corps. Rev., Series 2012 C-1, (Episcopal Senior Communities), 3.00%, 7/1/19 | 200,000 | 200,142 | ||||
| ABAG Finance Authority for Nonprofit Corps. Rev., Series 2014 A, (Sharp HealthCare), 5.00%, 8/1/43 | 3,500,000 | 3,880,590 | ||||
ABC Unified School District GO, Capital Appreciation, Series 2000 B, 0.00%, 8/1/21 (NATL-RE)(1) | 1,000,000 | 882,440 | ||||
| Alameda Corridor Transportation Authority Rev., Series 2013 A, 5.00%, 10/1/26 | 2,000,000 | 2,336,760 | ||||
| Alameda Corridor Transportation Authority Rev., Series 2013 A, 5.00%, 10/1/27 (AGM) | 2,000,000 | 2,353,040 | ||||
| Alameda Corridor Transportation Authority Rev., Series 2013 A, 5.00%, 10/1/29 (AGM) | 1,000,000 | 1,159,700 | ||||
| Alhambra Rev., Series 2010 A, (Atherton Baptist Homes), 7.50%, 1/1/30 | 1,535,000 | 1,646,288 | ||||
| Anaheim Public Financing Authority Rev., Series 2014 A, (Anaheim Convention Center Expansion Project), 5.00%, 5/1/46 | 4,400,000 | 4,913,348 | ||||
| Arcadia Unified School District GO, Series 2014 B, 5.00%, 6/1/44 | 5,000,000 | 5,577,300 | ||||
| Bay Area Toll Authority Toll Bridge Rev., Series 2001 A, (San Francisco Bay Area), VRDN, 1.27%, 9/3/15 | 1,000,000 | 983,850 | ||||
| Bay Area Toll Authority Toll Bridge Rev., Series 2007 A-1, (San Francisco Bay Area), VRDN, 0.72%, 9/3/15 | 1,450,000 | 1,443,736 | ||||
| Bay Area Toll Authority Toll Bridge Rev., Series 2008 G-1, (San Francisco Bay Area), VRDN, 1.12%, 9/3/15 | 2,500,000 | 2,475,675 | ||||
| Bay Area Toll Authority Toll Bridge Rev., Series 2013 S-4, (San Francisco Bay Area), 5.00%, 4/1/43 | 1,000,000 | 1,110,370 | ||||
| Bay Area Toll Authority Toll Bridge Rev., Series 2014 S-6, (San Francisco Bay Area), 5.00%, 10/1/54 | 5,000,000 | 5,439,350 | ||||
Beaumont Financing Authority Local Agency Special Tax Rev., Series 2005 B, 5.40%, 9/1/15, Prerefunded at 102% of Par(2) | 1,390,000 | 1,417,800 | ||||
| Beaumont Financing Authority Local Agency Special Tax Rev., Series 2008 A, (Improvement Area No. 19C), 6.875%, 9/1/36 | 1,050,000 | 1,086,120 | ||||
Beaumont Unified School District GO, Capital Appreciation, Series 2011 C, (Election of 2008), 0.00%, 8/1/40 (AGM)(1) | 2,000,000 | 635,720 | ||||
Berryessa Union School District GO, Capital Appreciation, Series 2000 A, 0.00%, 8/1/21 (AGM)(1) | 1,190,000 | 1,019,259 | ||||
Berryessa Union School District GO, Capital Appreciation, Series 2000 A, 0.00%, 8/1/22 (AGM)(1) | 1,220,000 | 997,948 | ||||
Berryessa Union School District GO, Capital Appreciation, Series 2000 A, 0.00%, 8/1/23 (AGM)(1) | 1,000,000 | 780,450 | ||||
| California County Tobacco Securitization Agency Rev., 5.65%, 6/1/41 | 1,500,000 | 1,358,760 | ||||
California County Tobacco Securitization Agency Rev., Series 2006 A, 0.00%, 6/1/50(1) | 20,000,000 | 1,177,000 | ||||
| California Educational Facilities Authority Rev., (Chapman University), 5.00%, 4/1/25 | 715,000 | 855,548 | ||||
| California Educational Facilities Authority Rev., (Chapman University), 5.00%, 4/1/31 | 1,820,000 | 2,017,652 | ||||
| California Educational Facilities Authority Rev., (Pepperdine University), 5.00%, 9/1/33 | 2,000,000 | 2,275,220 | ||||
10
| Principal Amount | Value | |||||
| California GO, 5.00%, 11/1/19 | $ | 5,000,000 | $ | 5,766,100 | ||
| California GO, 5.25%, 2/1/30 | 5,000,000 | 5,784,700 | ||||
| California GO, 6.00%, 4/1/38 | 5,000,000 | 5,827,750 | ||||
| California GO, 5.00%, 2/1/43 | 5,650,000 | 6,300,767 | ||||
| California GO, Series 2004 A-1, (Kindergarten), VRDN, 0.01%, 9/1/15 (LOC: Citibank N.A.) | 4,400,000 | 4,400,000 | ||||
| California GO, Series 2012 B, VRN, 0.92%, 9/3/15 | 2,000,000 | 2,018,600 | ||||
| California GO, Series 2012 B, VRN, 1.02%, 9/3/15 | 800,000 | 811,312 | ||||
| California GO, Series 2012 B, VRN, 1.17%, 9/3/15 | 960,000 | 981,802 | ||||
| California GO, Series 2013, 5.00%, 2/1/38 | 4,635,000 | 5,204,595 | ||||
| California GO, VRDN, 4.00%, 12/1/16 | 2,000,000 | 2,054,440 | ||||
| California Health Facilities Financing Authority Rev., (Cedars-Sinai Medical Center), 5.00%, 8/15/39 | 2,000,000 | 2,218,220 | ||||
| California Health Facilities Financing Authority Rev., Series 2008 A, (Lucile Salter Packard Children's Hospital), VRDN, 1.45%, 3/15/17 | 1,910,000 | 1,935,747 | ||||
| California Health Facilities Financing Authority Rev., Series 2008 A, (Scripps Health), 5.50%, 10/1/20 | 1,500,000 | 1,710,570 | ||||
California Health Facilities Financing Authority Rev., Series 2008 C, (Providence Health & Services), 6.50%, 10/1/18, Prerefunded at 100% of Par(2) | 1,000,000 | 1,172,240 | ||||
| California Health Facilities Financing Authority Rev., Series 2009 A, (Catholic Healthcare West), 6.00%, 7/1/39 | 4,300,000 | 4,916,104 | ||||
| California Health Facilities Financing Authority Rev., Series 2009 A, (Children's Hospital of Orange County), 6.50%, 11/1/38 | 3,000,000 | 3,567,450 | ||||
| California Health Facilities Financing Authority Rev., Series 2009 C, (St. Joseph Health System), VRDN, 5.00%, 10/18/22 | 2,200,000 | 2,629,176 | ||||
| California Health Facilities Financing Authority Rev., Series 2011 B, (St. Joseph Health System), VRDN, 0.01%, 9/1/15 (LOC: U.S. Bank N.A.) | 8,800,000 | 8,800,000 | ||||
| California Health Facilities Financing Authority Rev., Series 2011 D, (Sutter Health), 5.25%, 8/15/31 | 2,030,000 | 2,373,821 | ||||
| California Health Facilities Financing Authority Rev., Series 2011 D, (Sutter Health), 5.00%, 8/15/35 | 2,000,000 | 2,277,420 | ||||
| California Health Facilities Financing Authority Rev., Series 2012 A, (City of Hope), 5.00%, 11/15/39 | 1,910,000 | 2,105,679 | ||||
| California Health Facilities Financing Authority Rev., Series 2012 A, (Stanford Hospital & Clinics), 5.00%, 8/15/51 | 2,500,000 | 2,718,425 | ||||
| California Health Facilities Financing Authority Rev., Series 2012 B, (Lucile Salter Packard Children's Hospital), 5.00%, 8/15/26 | 1,020,000 | 1,172,031 | ||||
| California Health Facilities Financing Authority Rev., Series 2013 A, (St. Joseph Health System), 5.00%, 7/1/37 | 445,000 | 497,804 | ||||
| California Health Facilities Financing Authority Rev., Series 2013 A, (Sutter Health), 5.00%, 8/15/52 | 5,000,000 | 5,451,550 | ||||
| California Health Facilities Financing Authority Rev., Series 2014 A, (Providence Health and Services), 5.00%, 10/1/38 | 2,000,000 | 2,266,600 | ||||
| California Infrastructure & Economic Development Bank Rev., Series 2013 A, (Los Angeles County Museum of Art Project), VRDN, 1.89%, 9/3/15 | 1,000,000 | 1,028,880 | ||||
| California Infrastructure & Economic Development Bank Rev., Series 2015 A, (The Colburn School), VRDN, 1.02%, 9/3/15 | 2,190,000 | 2,178,415 | ||||
| California Mobilehome Park Financing Authority Rev., Series 2006 B, (Union City Tropics), 5.50%, 12/15/41 | 2,000,000 | 2,029,520 | ||||
| California Municipal Finance Authority COP, Series 2009, (Community Hospitals of Central California Obligated Group), 5.50%, 2/1/39 | 1,450,000 | 1,619,317 | ||||
| California Municipal Finance Authority Rev., (Biola University), 5.875%, 10/1/34 | 1,000,000 | 1,088,040 | ||||
11
| Principal Amount | Value | |||||
| California Municipal Finance Authority Rev., (Northbay Healthcare Group), Series 2015, 5.00%, 11/1/35 | $ | 350,000 | $ | 378,994 | ||
| California Municipal Finance Authority Rev., (Northbay Healthcare Group), Series 2015, 5.00%, 11/1/40 | 500,000 | 538,225 | ||||
| California Municipal Finance Authority Rev., (Northbay Healthcare Group), Series 2015, 5.00%, 11/1/44 | 300,000 | 321,507 | ||||
California Municipal Finance Authority Rev., Series 2011 B, (Azusa Pacific University), 8.00%, 4/1/21, Prerefunded at 100% of Par(2) | 3,335,000 | 4,461,763 | ||||
| California Municipal Finance Authority Rev., Series 2014 A, (Caritas Affordable Housing, Inc. Project), 5.00%, 8/15/20 | 600,000 | 685,866 | ||||
| California Municipal Finance Authority Rev., Series 2014 A, (Caritas Affordable Housing, Inc. Project), 5.00%, 8/15/22 | 360,000 | 416,340 | ||||
| California Municipal Finance Authority Rev., Series 2014 A, (Touro College and University System), 5.25%, 1/1/34 | 950,000 | 1,030,484 | ||||
| California Municipal Finance Authority Rev., Series 2014 A, (Touro College and University System), 5.25%, 1/1/40 | 1,750,000 | 1,871,467 | ||||
| California Municipal Finance Authority Rev., Series 2015 A, (Bowles Hall Foundation), 5.00%, 6/1/50 | 1,750,000 | 1,871,065 | ||||
| California Municipal Finance Authority Rev., Series 2015 A, (Community Medical Centers), 5.00%, 2/1/46 | 2,500,000 | 2,673,125 | ||||
| California Municipal Finance Authority Rev., Series 2015 B, (Azusa Pacific University), 5.00%, 4/1/41 | 1,860,000 | 1,979,542 | ||||
California Pollution Control Financing Authority Rev., 5.00%, 11/21/45(3) | 3,165,000 | 3,259,823 | ||||
| California Pollution Control Financing Authority Rev., Series 1996 C, (Pacific Gas & Electric Co.), VRDN, 0.01%, 9/1/15 (LOC: JPMorgan Chase Bank N.A.) | 1,900,000 | 1,900,000 | ||||
| California Pollution Control Financing Authority Rev., Series 1996 F, (Pacific Gas & Electric Co.), VRDN, 0.01%, 9/1/15 (LOC: JPMorgan Chase Bank N.A.) | 3,600,000 | 3,600,000 | ||||
| California Public Works Board Lease Rev., Series 2009 G-1, (Various Capital Projects), 5.75%, 10/1/30 | 2,000,000 | 2,339,320 | ||||
| California Public Works Board Lease Rev., Series 2010 A-1, (Various Capital Projects), 5.00%, 3/1/17 | 1,000,000 | 1,067,080 | ||||
| California Public Works Board Lease Rev., Series 2010 A-1, (Various Capital Projects), 6.00%, 3/1/35 | 1,250,000 | 1,476,475 | ||||
| California Public Works Board Lease Rev., Series 2011 C, (State Prisons), 5.75%, 10/1/31 | 1,000,000 | 1,215,050 | ||||
| California Public Works Board Lease Rev., Series 2011 D, (Judicial Council Projects), 5.00%, 12/1/15 | 3,335,000 | 3,375,620 | ||||
| California Public Works Board Lease Rev., Series 2011 D, (Judicial Council Projects), 5.00%, 12/1/31 | 975,000 | 1,113,977 | ||||
| California Public Works Board Lease Rev., Series 2012 A, (Various Capital Projects), 5.00%, 4/1/25 | 1,500,000 | 1,759,620 | ||||
| California Public Works Board Lease Rev., Series 2012 A, (Various Capital Projects), 5.00%, 4/1/37 | 5,465,000 | 6,089,267 | ||||
| California Public Works Board Lease Rev., Series 2012 D, (California State University Projects), 5.00%, 9/1/36 | 500,000 | 554,720 | ||||
| California Public Works Board Lease Rev., Series 2012 G, (Various Capital Projects), 4.00%, 11/1/17 | 1,235,000 | 1,324,031 | ||||
| California Public Works Board Lease Rev., Series 2013 H, (California State University Projects), 5.00%, 9/1/38 | 1,500,000 | 1,684,740 | ||||
| California Public Works Board Lease Rev., Series 2013 I, (Various Capital Projects), 5.00%, 11/1/38 | 2,350,000 | 2,651,787 | ||||
| California Public Works Board Lease Rev., Series 2014 A, (Various Correctional Facilities), 5.00%, 9/1/39 | 7,000,000 | 7,867,930 | ||||
California School Finance Authority Rev., (KIPP LA Projects), 5.00%, 7/1/45(4) | 1,650,000 | 1,733,622 | ||||
12
| Principal Amount | Value | |||||
| California School Finance Authority Rev., Series 2014 A, (KIPP LA Projects), 4.125%, 7/1/24 | $ | 475,000 | $ | 497,871 | ||
| California School Finance Authority Rev., Series 2014 A, (KIPP LA Projects), 5.00%, 7/1/34 | 500,000 | 529,750 | ||||
| California School Finance Authority Rev., Series 2014 A, (KIPP LA Projects), 5.125%, 7/1/44 | 700,000 | 739,578 | ||||
| California School Finance Authority Rev., Series 2014 A, (View Park Elementary and Middle Schools), 6.00%, 10/1/49 | 700,000 | 721,350 | ||||
California School Finance Authority Rev., Series 2015 A, (Alliance College-Ready Public School Project) 5.00%, 7/1/45(3) | 5,000,000 | 5,120,650 | ||||
California State University Rev., Series 2005 C, 5.00%, 11/1/15, Prerefunded at 100% of Par (NATL-RE)(2) | 3,680,000 | 3,710,139 | ||||
| California State University Rev., Series 2005 C, 5.00%, 11/1/30 (NATL-RE) | 1,320,000 | 1,330,811 | ||||
| California Statewide Communities Development Authority Rev., (Cottage Health System Obligated Group), 5.25%, 11/1/30 | 1,250,000 | 1,414,950 | ||||
| California Statewide Communities Development Authority Rev., (Episcopal Communities and Services), 5.00%, 5/15/42 | 1,500,000 | 1,604,205 | ||||
| California Statewide Communities Development Authority Rev., (Lancer Educational Student Housing), 5.625%, 6/1/33 | 2,500,000 | 2,535,550 | ||||
| California Statewide Communities Development Authority Rev., (Orinda Wilder Project), 5.00%, 9/1/37 | 4,515,000 | 4,773,439 | ||||
| California Statewide Communities Development Authority Rev., (Southern California Edison Co.), VRDN, 1.375%, 4/2/18 | 4,350,000 | 4,364,311 | ||||
California Statewide Communities Development Authority Rev., (Southern California Presbyterian Homes), 7.25%, 11/15/41(3) | 2,500,000 | 2,911,875 | ||||
| California Statewide Communities Development Authority Rev., (Trinity Health Corp.), 5.00%, 12/1/41 | 1,100,000 | 1,219,185 | ||||
| California Statewide Communities Development Authority Rev., Series 2001 C, (Kaiser Permanente), 5.25%, 8/1/31 | 4,000,000 | 4,150,200 | ||||
| California Statewide Communities Development Authority Rev., Series 2004 D, (Sutter Health), 5.05%, 8/15/38 (AGM) | 1,650,000 | 1,758,933 | ||||
| California Statewide Communities Development Authority Rev., Series 2007 A, (California Baptist University), 5.50%, 11/1/38 | 7,000,000 | 7,053,760 | ||||
| California Statewide Communities Development Authority Rev., Series 2012 A, (Kaiser Permanente), 5.00%, 4/1/42 | 6,000,000 | 6,585,960 | ||||
| California Statewide Communities Development Authority Rev., Series 2013 A, (American Baptist Homes of the West), 5.00%, 10/1/43 | 1,200,000 | 1,265,400 | ||||
| California Statewide Communities Development Authority Rev., Series 2014 A, (899 Charleston Project), 5.25%, 11/1/44 | 1,500,000 | 1,524,435 | ||||
| California Statewide Communities Development Authority Rev., Series 2014 A, (Henry Mayo Newhall Memorial Hospital), 5.25%, 10/1/43 (AGM) | 1,000,000 | 1,116,580 | ||||
| California Statewide Communities Development Authority Rev., Series 2014 A, (Loma Linda University Medical Center), 5.25%, 12/1/44 | 1,000,000 | 1,045,000 | ||||
| California Statewide Communities Development Authority Rev., Series 2014 A, (Loma Linda University Medical Center), 5.50%, 12/1/54 | 1,500,000 | 1,585,035 | ||||
| California Statewide Communities Development Authority Rev., Series 2014 A, (Los Angeles Jewish Home), 5.00%, 8/1/44 (GA: Jewish Home Foundation) | 1,600,000 | 1,788,224 | ||||
| California Statewide Communities Development Authority Rev., Series 2014 B, (Huntington Memorial Hospital), 5.00%, 7/1/34 | 1,500,000 | 1,669,020 | ||||
| California Statewide Communities Development Authority Rev., Series 2014 B, (Huntington Memorial Hospital), 5.00%, 7/1/44 | 2,760,000 | 3,046,736 | ||||
13
| Principal Amount | Value | |||||
| California Statewide Communities Development Authority Rev., Series 2014 B, (Los Angeles Jewish Home), 3.00%, 8/1/21 (GA: Jewish Home Foundation/California Mortgage Insurance) | $ | 1,300,000 | $ | 1,319,864 | ||
| California Statewide Communities Development Authority Rev., Series 2015, (American Baptist Homes of the West), 5.00%, 10/1/45 | 2,400,000 | 2,545,272 | ||||
| California Statewide Communities Development Authority Rev., Series 2015, (Independence Support LLC Project), 7.00%, 6/1/45 | 7,000,000 | 6,745,340 | ||||
| California Statewide Communities Development Authority Rev., Series 2015 A, (Adventist Health System/West), 5.00%, 3/1/35 | 1,785,000 | 1,992,792 | ||||
| Carson Redevelopment Agency Tax Allocation Rev., Series 2009 A, (Project Area No. 1), 7.00%, 10/1/36 | 2,000,000 | 2,345,980 | ||||
| Chaffey Joint Union High School District GO, Series 2013 A, (Election of 2012), 5.00%, 8/1/32 | 2,000,000 | 2,284,500 | ||||
| Chula Vista Industrial Development Rev., Series 2004 D, (San Diego Gas), 5.875%, 1/1/34 | 1,000,000 | 1,147,820 | ||||
| City of Irvine Improvement Bond Act of 1915 Special Assessment Rev., (Assessment District No. 12-1), 5.00%, 9/2/24 | 700,000 | 803,047 | ||||
| City of Irvine Improvement Bond Act of 1915 Special Assessment Rev., (Assessment District No. 12-1), 5.00%, 9/2/26 | 600,000 | 676,350 | ||||
| City of Irvine Improvement Bond Act of 1915 Special Assessment Rev., (Assessment District No. 13-1), 5.00%, 9/2/29 | 700,000 | 781,004 | ||||
| City of Irvine Improvement Bond Act of 1915 Special Assessment Rev., (Assessment District No. 13-1), 5.00%, 9/2/30 | 350,000 | 389,722 | ||||
| City of Irvine Improvement Bond Act of 1915 Special Assessment Rev., (Assessment District No. 15-2), 5.00%, 9/2/42 | 1,500,000 | 1,600,980 | ||||
| City of Tulare Sewer Rev., 5.00%, 11/15/22 (AGM) | 500,000 | 589,570 | ||||
| City of Tulare Sewer Rev., 5.00%, 11/15/24 (AGM) | 500,000 | 595,860 | ||||
| City of Tulare Sewer Rev., 5.00%, 11/15/25 (AGM) | 400,000 | 476,900 | ||||
| City of Riverside Rev., Series 2015 A, (Sewer), 5.00%, 8/1/40 | 2,000,000 | 2,240,580 | ||||
| Clovis Unified School District GO, Series 2013 B, (Election of 2012), 5.00%, 8/1/38 | 3,000,000 | 3,370,470 | ||||
Corcoran COP, 8.75%, 6/1/16 (Acquired 4/28/92, cost $140,000)(5) | 140,000 | 144,123 | ||||
Del Mar Race Track Authority Rev., 5.00%, 10/1/29(3) | 1,010,000 | 1,098,516 | ||||
Del Mar Race Track Authority Rev., 5.00%, 10/1/35(3) | 2,000,000 | 2,153,720 | ||||
Duarte Unified School District GO, Capital Appreciation, Series 1999 B, 0.00%, 11/1/23 (AGM)(1) | 1,150,000 | 889,261 | ||||
| East Side Union High School District GO, Series 2013, 5.00%, 8/1/29 | 1,050,000 | 1,200,959 | ||||
| Eastern Municipal Water District Community Facilities District No. 2000-01 Special Tax Rev., (French Valley), 5.00%, 9/1/36 | 3,575,000 | 3,840,122 | ||||
| Eastern Municipal Water District Water and Sewer COP, Series 2008 H, 5.00%, 7/1/33 | 4,000,000 | 4,387,480 | ||||
| El Dorado County Community Facilities District No. 2001-1 Special Tax Rev., (Promontory Specific), 6.30%, 9/1/31 | 2,500,000 | 2,500,000 | ||||
| Emeryville Redevelopment Agency Tax Allocation Rev., Series 2014 A, 5.00%, 9/1/31 (AGM) | 590,000 | 670,995 | ||||
| Emeryville Redevelopment Agency Tax Allocation Rev., Series 2014 A, 5.00%, 9/1/34 (AGM) | 1,000,000 | 1,132,270 | ||||
| Escondido Joint Powers Financing Authority Rev., (Water Systems Financing), 5.00%, 9/1/31 | 1,355,000 | 1,505,513 | ||||
| Fairfield Redevelopment Agency Tax Allocation Rev., 4.00%, 8/1/16 | 1,000,000 | 1,033,450 | ||||
Foothill-De Anza Community College District GO, Capital Appreciation, 0.00%, 8/1/21 (NATL-RE)(1) | 3,000,000 | 2,647,320 | ||||
Foothill / Eastern Transportation Corridor Agency Toll Road Rev., Capital Appreciation, Series 2013 A, 0.00%, 1/15/24(6) | 2,200,000 | 1,656,138 | ||||
Foothill / Eastern Transportation Corridor Agency Toll Road Rev., Capital Appreciation, Series 2013 A, 0.00%, 1/15/42(1) | 6,000,000 | 1,698,780 | ||||
14
| Principal Amount | Value | |||||
| Foothill / Eastern Transportation Corridor Agency Toll Road Rev., Series 2013 A, 6.00%, 1/15/49 | $ | 27,500,000 | $ | 32,211,300 | ||
| Foothill / Eastern Transportation Corridor Agency Toll Road Rev., Series 2013 B-3, VRDN, 5.50%, 1/15/23 | 3,750,000 | 4,321,875 | ||||
| Foothill / Eastern Transportation Corridor Agency Toll Road Rev., Series 2013 C, 6.50%, 1/15/43 | 4,000,000 | 4,733,400 | ||||
| Fremont Community Facilities District No. 1 Special Tax Rev., (Pacific Commons) 5.00%, 9/1/40 | 3,000,000 | 3,195,180 | ||||
| Fremont Community Facilities District No. 1 Special Tax Rev., (Pacific Commons), 5.00%, 9/1/45 | 2,000,000 | 2,122,840 | ||||
| Golden State Tobacco Securitization Corp. Settlement Rev., Series 2007 A-1, 4.50%, 6/1/27 | 4,650,000 | 4,438,192 | ||||
| Golden State Tobacco Securitization Corp. Settlement Rev., Series 2007 A-1, 5.00%, 6/1/33 | 3,000,000 | 2,550,330 | ||||
| Golden State Tobacco Securitization Corp. Settlement Rev., Series 2007 A-1, 5.125%, 6/1/47 | 7,000,000 | 5,488,770 | ||||
| Golden State Tobacco Securitization Corp. Settlement Rev., Series 2007 A-1, 5.75%, 6/1/47 | 10,000,000 | 8,594,700 | ||||
| Golden State Tobacco Securitization Corp. Settlement Rev., Series 2007 A-2, 5.30%, 6/1/37 | 3,000,000 | 2,474,760 | ||||
| Golden State Tobacco Securitization Corp. Settlement Rev., Series 2013 A, 5.00%, 6/1/29 | 1,500,000 | 1,707,120 | ||||
| Grossmont Union High School District GO, Series 2013 E, (Election of 2008), 5.00%, 8/1/43 | 1,225,000 | 1,357,312 | ||||
| Hayward Area Recreation and Park District COP, 5.125%, 1/1/39 | 1,500,000 | 1,662,210 | ||||
| Hayward Unified School District GO, 4.00%, 8/1/17 (AGM) | 1,650,000 | 1,751,557 | ||||
| Hemet Unified School District Financing Authority Special Tax Rev., 5.00%, 9/1/34 | 350,000 | 378,011 | ||||
| Hemet Unified School District Financing Authority Special Tax Rev., 5.00%, 9/1/39 | 2,100,000 | 2,249,751 | ||||
| Hesperia Community Facilities District No. 2005-1 Special Tax Rev., (Belgate Development Restructuring), 5.00%, 9/1/29 | 1,060,000 | 1,138,620 | ||||
| Hesperia Community Facilities District No. 2005-1 Special Tax Rev., (Belgate Development Restructuring), 5.00%, 9/1/35 | 2,690,000 | 2,832,032 | ||||
| Hesperia Public Financing Authority Tax Allocation Rev., Series 2007 A, (Redevelopment and Housing), 5.50%, 9/1/32 (XLCA) | 3,000,000 | 3,080,640 | ||||
| Hesperia Public Financing Authority Tax Allocation Rev., Series 2007 A, (Redevelopment and Housing), 5.50%, 9/1/37 (XLCA) | 2,025,000 | 2,073,823 | ||||
| Huntington Beach Community Facilities District Special Tax Rev., (Huntington Center), 5.375%, 9/1/33 | 1,700,000 | 1,901,875 | ||||
| Independent Cities Finance Authority Mobile Home Park Rev., (Palomar Estates East), Series 2015, 5.00%, 9/15/36 | 1,000,000 | 1,026,990 | ||||
| Independent Cities Finance Authority Mobile Home Park Rev., (Palomar Estates East), Series 2015, 5.00%, 9/15/36 | 1,500,000 | 1,583,595 | ||||
| Independent Cities Finance Authority Mobile Home Park Rev., (Rancho Feliz and Las Casitas de Sonoma), 5.00%, 10/15/47 | 5,000,000 | 5,170,100 | ||||
| Independent Cities Finance Authority Mobile Home Park Rev., Series 2011 A, (Castle Mobile Estates), 6.75%, 8/15/46 | 2,500,000 | 2,858,775 | ||||
| Independent Cities Finance Authority Mobile Home Park Rev., Series 2012 A, (Augusta Communities), 5.00%, 5/15/39 | 2,500,000 | 2,638,100 | ||||
Independent Cities Lease Finance Authority Rev., Series 2006 B, (San Juan Mobile Estates), 5.55%, 5/15/16, Prerefunded at 100% of Par(2) | 500,000 | 518,590 | ||||
Independent Cities Lease Finance Authority Rev., Series 2006 B, (San Juan Mobile Estates), 5.85%, 5/15/16, Prerefunded at 100% of Par(2) | 1,150,000 | 1,195,184 | ||||
| Independent Cities Lease Finance Authority Rev., Series 2007 A, (Santa Rosa Leisure Mobilehome Park), 5.70%, 11/15/47 | 3,430,000 | 3,543,327 | ||||
15
| Principal Amount | Value | |||||
| Inland Valley Development Agency Tax Allocation Rev., Series 2014 A, 5.25%, 9/1/37 | $ | 1,110,000 | $ | 1,231,934 | ||
| Inland Valley Development Agency Tax Allocation Rev., Series 2014 A, 5.00%, 9/1/44 | 2,680,000 | 2,871,513 | ||||
| Irvine Community Facilities District No. 2013-3 Special Tax Rev., (Great Park Improvement Area No. 1), 5.00%, 9/1/49 | 4,500,000 | 4,823,280 | ||||
| Irvine Unified School District Special Tax Rev., (Community Facilities District No. 06-1), 6.70%, 9/1/35 | 515,000 | 594,676 | ||||
Jurupa Community Services District Special Tax Rev., Series 2008 A, (Community Facilities District No. 25), 8.875%, 9/1/18, Prerefunded at 100% of Par(2) | 2,000,000 | 2,475,400 | ||||
| Jurupa Community Services District Special Tax Rev., Series 2013 A, (Community Facilities District No. 31), 5.00%, 9/1/37 | 250,000 | 270,363 | ||||
| Jurupa Community Services District Special Tax Rev., Series 2013 A, (Community Facilities District No. 31), 5.00%, 9/1/42 | 1,000,000 | 1,078,460 | ||||
| Jurupa Public Financing Authority Special Tax Rev., Series 2014 A, 5.00%, 9/1/31 | 1,100,000 | 1,229,151 | ||||
| Jurupa Public Financing Authority Special Tax Rev., Series 2014 A, 5.00%, 9/1/42 | 1,000,000 | 1,089,160 | ||||
| La Verne COP, (Brethren Hillcrest Homes), 5.00%, 5/15/36 | 1,100,000 | 1,164,185 | ||||
| Lake Elsinore Public Financing Authority Rev., 5.00%, 9/1/40 | 2,380,000 | 2,544,863 | ||||
| Lammersville Joint Unified School District Special Tax Rev., (Mountain House), 6.00%, 9/1/43 | 1,250,000 | 1,440,350 | ||||
| Long Beach Bond Finance Authority Natural Gas Purchase Rev., Series 2007 A, 5.50%, 11/15/37 | 1,150,000 | 1,357,058 | ||||
| Long Beach Marina Rev., Series 2015, (Alamitos Bay Marina Project), 5.00%, 5/15/45 | 5,245,000 | 5,615,192 | ||||
Los Alamitos Unified School District COP, Capital Appreciation, (Capital Projects), 0.00%, 8/1/24(6) | 1,300,000 | 968,461 | ||||
Los Angeles Community College District GO, Series 2008 F-1, (Election of 2003), 5.00%, 8/1/18, Prerefunded at 100% of Par(2) | 2,000,000 | 2,241,040 | ||||
| Los Angeles Community College District GO, Series 2015 C, 5.00%, 6/1/26 | 590,000 | 735,636 | ||||
| Los Angeles Community Facilities District No. 3 Special Tax Rev., (Cascades Business Park & Golf Course), 6.40%, 9/1/22 | 995,000 | 1,011,935 | ||||
| Los Angeles County COP, (Disney Concert Hall), 5.00%, 3/1/23 | 1,000,000 | 1,193,150 | ||||
| Los Angeles County Regional Financing Authority Rev., Series 2014 B-1, (MonteCedro, Inc.), 3.00%, 11/15/21 (California Mortgage Insurance) | 475,000 | 478,040 | ||||
| Los Angeles County Regional Financing Authority Rev., Series 2014 B-2, (MonteCedro, Inc.), 3.00%, 11/15/20 (California Mortgage Insurance) | 400,000 | 402,732 | ||||
| Los Angeles County Regional Financing Authority Rev., Series 2014 B-3, (MonteCedro, Inc.), 2.50%, 11/15/20 (California Mortgage Insurance) | 875,000 | 879,655 | ||||
| Los Angeles County Schools COP, Series 2015 A, (Compton Unified School District), 4.00%, 6/1/18 (AGM) | 1,650,000 | 1,770,252 | ||||
| Los Angeles County Schools COP, Series 2015 A, (Compton Unified School District), 5.00%, 6/1/19 (AGM) | 1,200,000 | 1,350,300 | ||||
| Los Angeles County Schools COP, Series 2015 A, (Compton Unified School District), 5.00%, 6/1/20 (AGM) | 1,305,000 | 1,489,162 | ||||
| Los Angeles County Schools COP, Series 2015 A, (Compton Unified School District), 5.00%, 6/1/21 (AGM) | 1,895,000 | 2,181,012 | ||||
Los Angeles Department of Airports Rev., Series 2010 A, (Los Angeles International Airport), 5.00%, 5/15/40(7) | 2,000,000 | 2,255,620 | ||||
| Los Angeles Department of Water & Power System Rev., Series 2013 B, 5.00%, 7/1/30 | 3,500,000 | 4,064,830 | ||||
16
| Principal Amount | Value | |||||
| Los Angeles Unified School District COP, Series 2012 B, (Headquarters Building Project), 5.00%, 10/1/29 | $ | 350,000 | $ | 397,709 | ||
| Los Angeles Unified School District COP, Series 2012 B, (Headquarters Building Project), 5.00%, 10/1/31 | 3,500,000 | 3,946,005 | ||||
| Los Angeles Unified School District GO, Series 2011 A-1, 5.00%, 7/1/24 | 3,430,000 | 4,035,223 | ||||
| Los Angeles Unified School District GO, Series 2014 B, 5.00%, 7/1/18 | 3,335,000 | 3,725,595 | ||||
| Los Angeles Unified School District GO, Series 2014 C, 5.00%, 7/1/30 | 1,155,000 | 1,357,529 | ||||
| Los Angeles Wastewater System Rev., Series 2012 B, 5.00%, 6/1/32 | 3,000,000 | 3,459,030 | ||||
| M-S-R Energy Authority Rev., Series 2009 A, 7.00%, 11/1/34 (GA: Citigroup, Inc.) | 1,700,000 | 2,325,005 | ||||
| M-S-R Energy Authority Rev., Series 2009 B, 6.50%, 11/1/39 (GA: Citigroup, Inc.) | 4,000,000 | 5,256,280 | ||||
| Milpitas Improvement Bond Act of 1915 Special Assessment Rev., Series 1996 A, (Local Improvement District No. 18), 6.75%, 9/2/16 | 495,000 | 495,089 | ||||
| Modesto Irrigation District COP, Series 2009 A, (Capital Improvements), 6.00%, 10/1/39 | 3,000,000 | 3,439,260 | ||||
| Montebello Community Redevelopment Agency Tax Allocation Rev., Series 2009 A, (Montebello Hills Redevelopment), 8.10%, 3/1/27 | 2,000,000 | 2,396,160 | ||||
| Moorpark Mobile Home Park Rev., Series 2011 A, (Villa Delaware Arroyo), 6.50%, 5/15/41 | 4,000,000 | 4,503,160 | ||||
| Murrieta Community Facilities District No. 2002-2 Special Tax Rev., Series 2004 A, (The Oaks Improvement Area), 6.00%, 9/1/34 | 1,880,000 | 1,883,384 | ||||
| Murrieta Public Financing Authority Special Tax Rev., 5.00%, 9/1/31 | 1,735,000 | 1,898,715 | ||||
| Northern California Power Agency Rev., Series 2012 A, (Hydroelectric Project No. 1), 5.00%, 7/1/31 | 1,090,000 | 1,234,534 | ||||
Norwalk-La Mirada Unified School District GO, Capital Appreciation, Series 2009 E, (Election of 2002), 0.00%, 8/1/38 (AGC)(1) | 10,000,000 | 3,570,400 | ||||
Oakland Redevelopment Agency Rev., 5.00%, 9/1/16, Prerefunded at 100% of Par (Ambac)(2) | 5,000,000 | 5,236,250 | ||||
| Oakland Unified School District Alameda County GO, Series 2009 A, (Election of 2006), 6.125%, 8/1/29 | 2,500,000 | 2,845,250 | ||||
| Oakland Unified School District Alameda County GO, Series 2012 A, (Election of 2006), 5.50%, 8/1/32 | 2,150,000 | 2,433,219 | ||||
| Oakland Unified School District Alameda County GO, Series 2013, (Election of 2012), 6.625%, 8/1/38 | 770,000 | 939,516 | ||||
| Oakland Unified School District Alameda County GO, Series 2015 A, 5.00%, 8/1/35 | 1,200,000 | 1,320,096 | ||||
| Oakland Unified School District Alameda County GO, Series 2015 A, 5.00%, 8/1/40 | 1,000,000 | 1,091,440 | ||||
| Oceanside Community Development Commission Tax Allocation Rev., (Downtown Redevelopment), 5.70%, 9/1/25 | 3,500,000 | 3,507,000 | ||||
| Ohlone Community College District GO, Series 2011 A, (Election of 2010), 5.00%, 8/1/31 | 3,000,000 | 3,465,540 | ||||
| Orange County Community Facilities District No. 06-1 Special Tax Rev., (Del Rio Public Improvements), 5.00%, 10/1/40 (AGM) | 2,000,000 | 2,222,440 | ||||
| Orange County Transportation Authority Rev., (Senior Lien), 5.00%, 8/15/30 | 2,400,000 | 2,744,736 | ||||
| Orange County Water District Rev., Series 2013 A, 5.00%, 8/15/33 | 1,900,000 | 2,193,303 | ||||
| Oxnard Financing Authority Wastewater Rev., 5.00%, 6/1/33 (AGM) | 2,095,000 | 2,318,327 | ||||
| Oxnard Financing Authority Wastewater Rev., 5.00%, 6/1/34 (AGM) | 2,750,000 | 3,017,162 | ||||
| Palm Springs Financing Authority Lease Rev., Series 2012 B, (Downtown Revitalization Project), 5.00%, 6/1/35 | 4,000,000 | 4,377,880 | ||||
| Palomar Pomerado Health Care District COP, 6.75%, 11/1/39 | 2,750,000 | 3,010,342 | ||||
17
| Principal Amount | Value | |||||
Paramount Unified School District GO, Capital Appreciation, (Election of 2006), 0.00%, 8/1/51 (BAM)(1) | $ | 12,500,000 | $ | 1,280,125 | ||
Patterson Joint Unified School District GO, Capital Appreciation, Series 2009 B, (Election of 2008), 0.00%, 3/1/49 (AGM)(1) | 8,160,000 | 1,823,352 | ||||
| Perris Public Financing Authority Special Tax Rev., Series 2008 A, (Community Facilities District No. 2005-4), 6.60%, 9/1/38 | 2,140,000 | 2,186,588 | ||||
| Perris Union High School District Financing Authority Special Tax Rev., 5.00%, 9/1/41 | 2,000,000 | 2,155,700 | ||||
| Pleasant Valley School District / Ventura County GO, Series 2002 A, 5.85%, 8/1/31 (NATL-RE) | 4,835,000 | 5,682,962 | ||||
| Poway Unified School District Public Financing Authority Rev., 7.875%, 9/15/39 | 3,760,000 | 4,471,730 | ||||
| Poway Unified School District Public Financing Authority Special Tax Rev., Series 2015 A, 5.00%, 9/1/34 | 1,000,000 | 1,092,100 | ||||
| Poway Unified School District Public Financing Authority Special Tax Rev., Series 2015 A, 5.00%, 9/1/35 | 1,000,000 | 1,088,920 | ||||
| Poway Unified School District Public Financing Authority Special Tax Rev., Series 2015 A, 5.00%, 9/1/36 | 1,250,000 | 1,358,275 | ||||
| Poway Unified School District Special Tax Rev., (Community Facilities District No. 6-4S), 5.00%, 9/1/36 | 600,000 | 648,870 | ||||
Redwood City Redevelopment Agency Tax Allocation Rev., Capital Appreciation, Series 2003 A, (Redevelopment Project Area 2), 0.00%, 7/15/28 (Ambac)(1) | 3,405,000 | 1,897,334 | ||||
| Rio Elementary School District Community Facilities District No. 1 Special Tax Rev., 5.00%, 9/1/35 | 2,550,000 | 2,727,888 | ||||
| Rio Elementary School District Community Facilities District No. 1 Special Tax Rev., Series 2013, 5.50%, 9/1/39 | 1,785,000 | 1,955,682 | ||||
| River Islands Public Financing Authority Community Facilities District No. 2003-1 Special Tax Rev., Series 2015 A-1, (Public Improvements), 5.50%, 9/1/45 | 1,500,000 | 1,547,685 | ||||
| River Islands Public Financing Authority Community Facilities District No. 2003-1 Special Tax Rev., Series 2015 B, (Public Improvements), 5.50%, 9/1/45 | 5,000,000 | 5,158,950 | ||||
| Riverside County Community Facilities Districts Special Tax Rev., (Tax No. 04-2-Lake Hills Crest), 5.00%, 9/1/30 | 1,035,000 | 1,125,956 | ||||
| Riverside County Community Facilities Districts Special Tax Rev., (Tax No. 04-2-Lake Hills Crest), 5.00%, 9/1/35 | 2,520,000 | 2,701,667 | ||||
| Riverside County Community Facilities Districts Special Tax Rev., (Tax No. 05-8 Scott Road), 5.00%, 9/1/42 | 3,000,000 | 3,178,470 | ||||
| Riverside County Community Facilities Districts Special Tax Rev., (Tax No. 07-2-Clinton Keith Road), 5.00%, 9/1/40 | 2,250,000 | 2,337,952 | ||||
| Riverside County Community Facilities Districts Special Tax Rev., (Tax No. 07-2-Clinton Keith Road), 5.00%, 9/1/44 | 2,735,000 | 2,826,349 | ||||
| Riverside County Redevelopment Agency Tax Allocation Rev., Series 2010 E, (Interstate 215 Corridor), 6.25%, 10/1/30 | 2,200,000 | 2,591,182 | ||||
| Riverside County Transportation Commission Rev., Series 2013 A, (Limited Tax), 5.25%, 6/1/39 | 800,000 | 920,624 | ||||
| Riverside County Transportation Commission Rev., Series 2013 A, (Senior Lien), 5.75%, 6/1/44 | 500,000 | 565,965 | ||||
Riverside County Transportation Commission Rev., Capital Appreciation, Series 2013 B, (Senior Lien), 0.00%, 6/1/43(1) | 5,000,000 | 1,255,600 | ||||
| Romoland School District Special Tax Rev., (Community Facilities District No. 1, Improvement Area 1), 5.00%, 9/1/35 | 4,685,000 | 5,021,430 | ||||
| Romoland School District Special Tax Rev., (Community Facilities District No. 1, Improvement Area 1), 5.40%, 9/1/36 | 3,990,000 | 3,990,000 | ||||
| Romoland School District Special Tax Rev., (Community Facilities District No. 1, Improvement Area 1), 5.00%, 9/1/38 | 2,900,000 | 3,091,922 | ||||
18
| Principal Amount | Value | |||||
| Romoland School District Special Tax Rev., (Community Facilities District No. 1, Improvement Area 3), 5.00%, 9/1/43 | $ | 2,640,000 | $ | 2,746,445 | ||
| Roseville Community Facilities District No. 1 Special Tax Rev., (The Fountains), 6.125%, 9/1/38 | 2,600,000 | 2,748,460 | ||||
| Roseville Finance Authority Electric System Rev., 5.00%, 2/1/37 | 925,000 | 1,017,167 | ||||
| Roseville Westbrook Community Facilities District No. 1 Special Tax Rev., (Public Facilities), 5.00%, 9/1/44 | 1,650,000 | 1,603,272 | ||||
| Roseville Westpark Community Facilities District No. 1 Special Tax Rev., 5.00%, 9/1/37 | 1,250,000 | 1,339,413 | ||||
| Sacramento Airport System Rev., Series 2009 D, (Grant Revenue Bonds), 6.00%, 7/1/35 | 4,000,000 | 4,486,160 | ||||
| Sacramento Municipal Utility District Electric Rev., Series 2012 Y, 5.00%, 8/15/31 | 625,000 | 727,213 | ||||
| Sacramento Municipal Utility District Electric Rev., Series 2012 Y, 5.00%, 8/15/33 | 1,000,000 | 1,160,770 | ||||
| Sacramento Regional Transit District Rev., (Farebox Revenue), 5.00%, 3/1/42 | 1,300,000 | 1,435,577 | ||||
| Sacramento Transportation Authority Sales Tax Rev., (Measure A), 5.00%, 10/1/24 | 1,055,000 | 1,258,436 | ||||
| San Bernardino Community Facilities District No. 2002-1 Special Tax Rev., (Kaiser Commerce Center), 5.00%, 9/1/33 | 3,000,000 | 3,213,150 | ||||
| San Buenaventura Rev., (Community Memorial Health System), 7.50%, 12/1/41 | 9,350,000 | 11,376,799 | ||||
| San Diego County Regional Airport Authority Rev., Series 2013 A, 5.00%, 7/1/24 | 300,000 | 357,162 | ||||
| San Diego County Regional Airport Authority Rev., Series 2013 A, 5.00%, 7/1/25 | 955,000 | 1,123,137 | ||||
| San Diego County Regional Airport Authority Rev., Series 2013 A, 5.00%, 7/1/26 | 500,000 | 581,655 | ||||
| San Diego County Regional Airport Authority Rev., Series 2013 A, 5.00%, 7/1/43 | 2,500,000 | 2,776,575 | ||||
| San Diego County Regional Airport Authority Rev., Series 2014 A, (Rental Car Facility), 5.00%, 7/1/44 | 1,500,000 | 1,649,280 | ||||
| San Diego County Water Authority Rev., 5.00%, 5/1/33 | 1,500,000 | 1,737,135 | ||||
| San Diego Public Facilities Financing Authority Lease Rev., Series 2012 A, (Capital Improvement Projects), 5.00%, 4/15/37 | 2,000,000 | 2,195,700 | ||||
| San Diego Public Facilities Financing Authority Lease Rev., Series 2015 A, (Capital Improvement Projects), 5.00%, 10/15/44 | 2,660,000 | 2,916,663 | ||||
| San Diego Public Facilities Financing Authority Water Rev., Series 2012 A, 5.00%, 8/1/30 | 2,000,000 | 2,299,300 | ||||
| San Diego Redevelopment Agency Tax Allocation Rev., Series 2009 A, (North Park Redevelopment), 7.00%, 11/1/39 | 3,000,000 | 3,527,850 | ||||
| San Diego Unified Port District Rev., Series 2013 A, 5.00%, 9/1/26 | 750,000 | 870,825 | ||||
| San Francisco City and County Airports Commission Rev., Series 2008 34-D, (San Francisco International Airport), 5.25%, 5/1/26 | 3,000,000 | 3,332,790 | ||||
| San Francisco City and County Airports Commission Rev., Series 2011 D, 5.00%, 5/1/31 | 5,390,000 | 6,106,169 | ||||
| San Francisco City and County Redevelopment Financing Authority Tax Allocation Rev., Series 2009 D, (Mission Bay South Redevelopment), 6.625%, 8/1/39 | 2,000,000 | 2,291,600 | ||||
| San Francisco City and County Redevelopment Financing Authority Tax Allocation Rev., Series 2011 C, (Mission Bay South Redevelopment), 6.75%, 8/1/41 | 1,000,000 | 1,203,760 | ||||
| San Francisco City and County Redevelopment Financing Authority Tax Allocation Rev., Series 2011 D, (Mission Bay South Redevelopment), 7.00%, 8/1/41 | 1,250,000 | 1,497,350 | ||||
19
| Principal Amount | Value | |||||
| San Francisco City and County Successor Agency Tax Allocation Rev., Series 2014 A, (Mission Bay South Redevelopment Project), 5.00%, 8/1/33 | $ | 780,000 | $ | 863,889 | ||
| San Francisco City and County Successor Agency Tax Allocation Rev., Series 2014 A, (Mission Bay South Redevelopment Project), 5.00%, 8/1/43 | 1,000,000 | 1,087,640 | ||||
| San Gorgonio Memorial Health Care District GO, 4.00%, 8/1/17 | 435,000 | 459,308 | ||||
| San Gorgonio Memorial Health Care District GO, 4.00%, 8/1/18 | 515,000 | 553,666 | ||||
| San Gorgonio Memorial Health Care District GO, 5.00%, 8/1/20 | 1,000,000 | 1,147,880 | ||||
| San Gorgonio Memorial Health Care District GO, 5.00%, 8/1/21 | 275,000 | 317,853 | ||||
San Joaquin Hills Transportation Corridor Agency Rev., Capital Appreciation, Series 1997 A, 0.00%, 1/15/25 (NATL-RE)(1) | 3,090,000 | 2,112,324 | ||||
San Joaquin Hills Transportation Corridor Agency Rev., Capital Appreciation, Series 1997 A, 0.00%, 1/15/29 (NATL-RE)(1) | 165,000 | 92,804 | ||||
San Joaquin Hills Transportation Corridor Agency Rev., Capital Appreciation, Series 1997 A, 0.00%, 1/15/31 (NATL-RE)(1) | 16,000,000 | 8,133,760 | ||||
San Joaquin Hills Transportation Corridor Agency Rev., Capital Appreciation, Series 1997 A, 0.00%, 1/15/32 (NATL-RE)(1) | 290,000 | 139,951 | ||||
San Joaquin Hills Transportation Corridor Agency Rev., Capital Appreciation, Series 1997 A, 0.00%, 1/15/36 (NATL-RE)(1) | 1,335,000 | 513,027 | ||||
| San Joaquin Hills Transportation Corridor Agency Rev., Series 2014 B, (Junior Lien), 5.25%, 1/15/44 | 6,000,000 | 6,478,800 | ||||
| San Jose Airport Rev., Series 2011 A-2, 5.25%, 3/1/34 | 2,605,000 | 2,926,691 | ||||
| San Mateo Special Tax Rev., (Community Facilities District No. 2008-1-Bay Meadows), 6.00%, 9/1/42 | 500,000 | 568,150 | ||||
| San Mateo Special Tax Rev., (Community Facilities District No. 2008-1-Bay Meadows), 5.50%, 9/1/44 | 2,250,000 | 2,477,362 | ||||
Santa Barbara Secondary High School District GO, Series 2011 A, (Election of 2010), 0.00%, 8/1/36(1) | 10,000,000 | 4,046,900 | ||||
Santa Barbara Secondary High School District GO, Series 2011 A, (Election of 2010), 0.00%, 8/1/40(1) | 3,795,000 | 1,259,143 | ||||
| Santa Cruz County Redevelopment Agency Tax Allocation Rev., Series 2009 A, (Live Oak/Soquel Community Improvement), 7.00%, 9/1/36 | 3,000,000 | 3,516,240 | ||||
| Santa Margarita Water District Special Tax Rev., Series 2013, (Communities Facilities District No. 2013-1, Village of Sendero), 5.625%, 9/1/43 | 1,250,000 | 1,385,488 | ||||
| Santaluz Community Facilities District No. 2 Special Tax Rev., Series 2011 A, (Improvement Area No. 1), 5.10%, 9/1/30 | 465,000 | 509,533 | ||||
| Saugus-Castaic School Facilities Financing Authority Special Tax Rev., (Community Facilities District No. 2006-1C), 6.00%, 9/1/43 | 1,480,000 | 1,672,666 | ||||
Silicon Valley Tobacco Securitization Authority Rev., Capital Appreciation, Series 2007 A, (Santa Clara County Tobacco Securitization Corp.), 0.00%, 6/1/36(1) | 1,000,000 | 230,220 | ||||
| South Placer Wastewater Authority Rev., VRN, 0.35%, 9/3/15 | 2,985,000 | 2,963,896 | ||||
| Southern California Public Power Authority Rev., Series 2007 A, 5.00%, 11/1/33 | 3,755,000 | 4,262,526 | ||||
Southern Mono Health Care District GO, Capital Appreciation, Series 2002 A, (Election of 2001), 0.00%, 8/1/26 (NATL-RE)(1) | 1,800,000 | 1,095,606 | ||||
Southwestern Community College District GO, Capital Appreciation, Series 2011 C, (Election of 2008), 0.00%, 8/1/46(1) | 5,425,000 | 1,326,087 | ||||
| Stockton Public Financing Authority Rev., Series 2010 A, (Delta Water Supply Project), 6.25%, 10/1/40 | 1,750,000 | 2,090,305 | ||||
| Stockton Public Financing Authority Wastewater Rev., 5.00%, 9/1/28 (BAM) | 2,215,000 | 2,538,922 | ||||
| Stockton Public Financing Authority Wastewater Rev., 5.00%, 9/1/29 (BAM) | 1,750,000 | 1,987,317 | ||||
20
| Principal Amount | Value | |||||
| Stockton Unified School District GO, Series 2014 A, (Election of 2012), 5.00%, 8/1/42 (AGM) | $ | 705,000 | $ | 783,100 | ||
Successor Agency to the Redevelopment Agency of the City & County of San Francisco Communities Facilities District No. 6 Special Tax Rev., Capital Appreciation, Series 2013 C, (Mission Bay South Public Improvements), 0.00%, 8/1/43 (BAM)(1) | 5,500,000 | 1,153,735 | ||||
| Successor Agency to the Redevelopment Agency of the City of Cathedral City Tax Allocation Rev., Series 2014 A, (Merged Redevelopment Project Area), 5.00%, 8/1/29 (AGM) | 1,250,000 | 1,418,125 | ||||
| Successor Agency to the Redevelopment Agency of the City of Cathedral City Tax Allocation Rev., Series 2014 A, (Merged Redevelopment Project Area), 5.00%, 8/1/30 (AGM) | 1,315,000 | 1,484,267 | ||||
| Successor Agency to the Redevelopment Agency of the City of Cathedral City Tax Allocation Rev., Series 2014 A, (Merged Redevelopment Project Area), 5.00%, 8/1/31 (AGM) | 1,380,000 | 1,554,225 | ||||
| Successor Agency to the Richmond County Redevelopment Agency Tax Allocation Rev., Series 2014 A, 5.00%, 9/1/19 (BAM) | 215,000 | 242,913 | ||||
| Successor Agency to the Richmond County Redevelopment Agency Tax Allocation Rev., Series 2014 A, 5.00%, 9/1/20 (BAM) | 140,000 | 160,894 | ||||
| Successor Agency to the Richmond County Redevelopment Agency Tax Allocation Rev., Series 2014 A, 5.00%, 9/1/21 (BAM) | 200,000 | 231,802 | ||||
| Successor Agency to the Richmond County Redevelopment Agency Tax Allocation Rev., Series 2014 A, 5.00%, 9/1/22 (BAM) | 300,000 | 350,964 | ||||
| Successor Agency to the Richmond County Redevelopment Agency Tax Allocation Rev., Series 2014 A, 5.00%, 9/1/23 (BAM) | 200,000 | 234,468 | ||||
| Successor Agency to the Richmond County Redevelopment Agency Tax Allocation Rev., Series 2014 A, 5.00%, 9/1/24 (BAM) | 135,000 | 158,325 | ||||
| Successor Agency to the Richmond County Redevelopment Agency Tax Allocation Rev., Series 2014 A, 4.50%, 9/1/25 (BAM) | 45,000 | 50,591 | ||||
| Successor Agency to the Richmond County Redevelopment Agency Tax Allocation Rev., Series 2014 A, 5.00%, 9/1/25 (BAM) | 45,000 | 52,399 | ||||
| Sunnyvale Community Facilities District No. 1 Special Tax Rev., 7.75%, 8/1/32 | 6,500,000 | 6,512,350 | ||||
| Susanville Public Financing Authority Rev., Series 2010 B, (Utility Enterprises), 6.00%, 6/1/45 | 3,000,000 | 3,349,170 | ||||
Tahoe-Truckee Unified School District GO, Capital Appreciation, Series 1999 A, (Improvement District No. 2), 0.00%, 8/1/22 (NATL-RE)(1) | 2,690,000 | 2,244,375 | ||||
Tahoe-Truckee Unified School District GO, Capital Appreciation, Series 1999 A, (Improvement District No. 2), 0.00%, 8/1/23 (NATL-RE)(1) | 2,220,000 | 1,763,968 | ||||
| Tobacco Securitization Authority of Northern California Settlement Rev., Series 2005 A-1, 5.50%, 6/1/45 | 2,000,000 | 1,618,960 | ||||
| Tobacco Securitization Authority of Southern California Settlement Rev., Series 2006 A-1, 5.00%, 6/1/37 | 2,250,000 | 1,949,490 | ||||
| Tracy Community Facilities District No. 2006-1 Special Tax Rev., (NEI Phase II), 5.75%, 9/1/36 | 3,105,000 | 3,107,484 | ||||
| Tracy Public Financing Authority Special Tax Rev., Series 2014 A, 4.00%, 9/2/18 | 1,900,000 | 2,041,018 | ||||
| Tracy Public Financing Authority Special Tax Rev., Series 2014 A, 5.00%, 9/2/19 | 2,285,000 | 2,574,235 | ||||
| Tracy Public Financing Authority Special Tax Rev., Series 2014 A, 5.00%, 9/2/20 | 2,100,000 | 2,404,836 | ||||
| Tri-Dam Power Authority Rev., 4.00%, 5/1/16 | 2,165,000 | 2,200,484 | ||||
| Tri-Dam Power Authority Rev., 4.00%, 11/1/16 | 2,165,000 | 2,225,014 | ||||
| Tuolumne Wind Project Authority Rev., Series 2009 A, 5.875%, 1/1/29 | 2,000,000 | 2,300,320 | ||||
| Turlock Public Financing Authority Tax Allocation Rev., 7.50%, 9/1/39 | 2,770,000 | 3,447,791 | ||||
21
| Principal Amount | Value | |||||
| Tustin Community Facilities District No. 06-1 Special Tax Rev., Series 2007 A, (Tustin Legacy/Columbus Villages), 6.00%, 9/1/36 | $ | 4,945,000 | $ | 5,165,250 | ||
| Tustin Community Facilities District No. 07-1 Special Tax Rev., (Tustin Legacy/Retail Center), 6.00%, 9/1/37 | 1,300,000 | 1,348,997 | ||||
| Tustin Public Financing Authority Rev., 5.00%, 4/1/43 | 1,000,000 | 1,111,080 | ||||
| Tustin Unified School District Special Tax Rev., (Community Facilities District No. 06-1), 5.75%, 9/1/30 | 1,000,000 | 1,109,160 | ||||
| Tustin Unified School District Special Tax Rev., (Community Facilities District No. 06-1), 6.00%, 9/1/40 | 1,500,000 | 1,727,520 | ||||
| Twin Rivers Unified School District COP, (School Facilities Bridge Funding Program), VRDN, 3.20%, 6/1/20 (AGM) | 1,750,000 | 1,752,135 | ||||
| Twin Rivers Unified School District COP, (School Facilities Bridge Funding Program), VRDN, 3.20%, 6/1/20 (AGM) | 1,000,000 | 1,001,220 | ||||
| University of California System Rev., Series 2012 G, 5.00%, 5/15/37 | 5,000,000 | 5,677,850 | ||||
| Val Verde Unified School District Special Tax Rev., 5.00%, 9/1/37 | 1,750,000 | 1,877,172 | ||||
Val Verde Unified School District Special Tax Rev., (Community Facilities District No. 1, Improvement Area A), 5.40%, 9/1/15, Prerefunded at 102% of Par(2) | 2,500,000 | 2,550,000 | ||||
Val Verde Unified School District Special Tax Rev., (Community Facilities District No. 1, Improvement Area A), 5.45%, 9/1/15, Prerefunded at 102% of Par(2) | 2,600,000 | 2,652,000 | ||||
Ventura County Community College District GO, Series 2008 C, (Election of 2002), 5.50%, 8/1/18, Prerefunded at 100% of Par(2) | 1,600,000 | 1,814,352 | ||||
| Whittier Health Facilities Rev., (Presbyterian Intercommunity Hospital), 5.00%, 6/1/44 | 3,500,000 | 3,805,900 | ||||
Yosemite Community College District GO, Capital Appreciation, (Election of 2004), 0.00%, 8/1/16 (AGM)(1) | 3,545,000 | 3,535,748 | ||||
Yuba City Unified School District GO, Capital Appreciation, 0.00%, 3/1/25 (NATL-RE)(1) | 1,500,000 | 1,062,810 | ||||
| 835,992,556 | ||||||
| Guam — 1.3% | ||||||
| Guam Government Business Privilege Tax Rev., Series 2011 A, 5.125%, 1/1/42 | 1,000,000 | 1,078,580 | ||||
| Guam Government GO, Series 2009 A, 7.00%, 11/15/39 | 7,230,000 | 8,859,497 | ||||
| Guam Power Authority Rev., Series 2012 A, 5.00%, 10/1/34 | 850,000 | 910,614 | ||||
| 10,848,691 | ||||||
| U.S. Virgin Islands — 0.4% | ||||||
| Virgin Islands Public Finance Authority Rev., Series 2009 A, (Diageo Matching Fund Bonds), 6.75%, 10/1/37 | 2,000,000 | 2,256,780 | ||||
| Virgin Islands Public Finance Authority Rev., Series 2010 B, (Subordinated Lien), 5.25%, 10/1/29 | 1,500,000 | 1,633,620 | ||||
| 3,890,400 | ||||||
TOTAL INVESTMENT SECURITIES — 98.6% (Cost $796,278,126) | 850,731,647 | |||||
| OTHER ASSETS AND LIABILITIES — 1.4% | 11,788,507 | |||||
| TOTAL NET ASSETS — 100.0% | $ | 862,520,154 | ||||
| FUTURES CONTRACTS | |||||||||
| Contracts Sold | Expiration Date | Underlying Face Amount at Value | Unrealized Appreciation (Depreciation) | ||||||
| 82 | U.S. Treasury 10-Year Notes | December 2015 | $ | 10,419,125 | $ | 40,815 | |||
| 31 | U.S. Treasury Ultra Long Bonds | December 2015 | 4,910,594 | 37,712 | |||||
| $ | 15,329,719 | $ | 78,527 | ||||||
22
| NOTES TO SCHEDULE OF INVESTMENTS | ||
| AGC | - | Assured Guaranty Corporation |
| AGM | - | Assured Guaranty Municipal Corporation |
| BAM | - | Build America Mutual Assurance Company |
| COP | - | Certificates of Participation |
| GA | - | Guaranty Agreement |
| GO | - | General Obligation |
| LOC | - | Letter of Credit |
| NATL-RE | - | National Public Finance Guarantee Corporation - Reinsured |
| NATL-RE-IBC | - | National Public Finance Guarantee Corporation - Reinsured - Insured Bond Certificates |
| VRDN | - | Variable Rate Demand Note. Interest reset date is indicated. Rate shown is effective at the period end. |
| VRN | - | Variable Rate Note. Interest reset date is indicated. Rate shown is effective at the period end. |
| XLCA | - | XL Capital Ltd. |
| (1) | Security is a zero-coupon bond. Zero-coupon securities are issued at a substantial discount from their value at maturity. |
| (2) | Escrowed to maturity in U.S. government securities or state and local government securities. |
| (3) | Restricted security exempt from registration pursuant to Rule 144A under the Securities Act of 1933. These securities may be sold without restriction to qualified institutional investors and have been deemed liquid under policies approved by the Board of Trustees. The aggregate value of these securities at the period end was $14,544,584, which represented 1.7% of total net assets. |
| (4) | When-issued security. The issue price and yield are fixed on the date of the commitment, but payment and delivery are scheduled for a future date. |
| (5) | Restricted security that may not be offered for public sale without being registered with the Securities and Exchange Commission and/or may be subject to resale, redemption or transferability restrictions. The aggregate value of these securities at the period end was $144,123, which represented less than 0.05% of total net assets. |
| (6) | Coupon rate adjusts periodically based upon a predetermined schedule. Interest reset date is indicated. Rate shown is effective at the period end. |
| (7) | Security, or a portion thereof, has been pledged at the custodian bank or with a broker for margin requirements on futures contracts. At the period end, the aggregate value of securities pledged was $319,227. |
See Notes to Financial Statements.
23
| Statement of Assets and Liabilities |
| AUGUST 31, 2015 | |||
| Assets | |||
| Investment securities, at value (cost of $796,278,126) | $ | 850,731,647 | |
| Cash | 2,199,550 | ||
| Receivable for investments sold | 1,276,375 | ||
| Receivable for capital shares sold | 948,628 | ||
| Receivable for variation margin on futures contracts | 29,938 | ||
| Interest receivable | 10,982,552 | ||
| 866,168,690 | |||
| Liabilities | |||
| Payable for investments purchased | 1,727,930 | ||
| Payable for capital shares redeemed | 1,158,506 | ||
| Accrued management fees | 345,662 | ||
| Distribution and service fees payable | 48,534 | ||
| Dividends payable | 367,904 | ||
| 3,648,536 | |||
| Net Assets | $ | 862,520,154 | |
| Net Assets Consist of: | |||
| Capital paid in | $ | 850,998,894 | |
| Accumulated net realized loss | (43,010,788 | ) | |
| Net unrealized appreciation | 54,532,048 | ||
| $ | 862,520,154 | ||
| Net Assets | Shares Outstanding | Net Asset Value Per Share | ||||
| Investor Class | $631,701,750 | 61,328,356 | $10.30 | |||
| Institutional Class | $83,750,654 | 8,133,581 | $10.30 | |||
| A Class | $119,150,409 | 11,566,673 | $10.30* | |||
| C Class | $27,917,341 | 2,709,883 | $10.30 | |||
*Maximum offering price $10.79 (net asset value divided by 0.955).
See Notes to Financial Statements.
24
| Statement of Operations |
| YEAR ENDED AUGUST 31, 2015 | |||
| Investment Income (Loss) | |||
| Income: | |||
| Interest | $ | 35,636,302 | |
| Expenses: | |||
| Management fees | 3,984,118 | ||
| Distribution and service fees: | |||
| A Class | 299,495 | ||
| C Class | 258,241 | ||
| Trustees' fees and expenses | 41,093 | ||
| Other expenses | 1,103 | ||
| 4,584,050 | |||
| Net investment income (loss) | 31,052,252 | ||
| Realized and Unrealized Gain (Loss) | |||
| Net realized gain (loss) on: | |||
| Investment transactions | (3,114,111 | ) | |
| Futures contract transactions | (573,036 | ) | |
| (3,687,147 | ) | ||
| Change in net unrealized appreciation (depreciation) on: | |||
| Investments | 6,549,308 | ||
| Futures contracts | 188,044 | ||
| 6,737,352 | |||
| Net realized and unrealized gain (loss) | 3,050,205 | ||
| Net Increase (Decrease) in Net Assets Resulting from Operations | $ | 34,102,457 | |
See Notes to Financial Statements.
25
| Statement of Changes in Net Assets |
| YEARS ENDED AUGUST 31, 2015 AND AUGUST 31, 2014 | ||||||
| Increase (Decrease) in Net Assets | August 31, 2015 | August 31, 2014 | ||||
| Operations | ||||||
| Net investment income (loss) | $ | 31,052,252 | $ | 28,107,044 | ||
| Net realized gain (loss) | (3,687,147 | ) | (8,891,827 | ) | ||
| Change in net unrealized appreciation (depreciation) | 6,737,352 | 72,787,362 | ||||
| Net increase (decrease) in net assets resulting from operations | 34,102,457 | 92,002,579 | ||||
| Distributions to Shareholders | ||||||
| From net investment income: | ||||||
| Investor Class | (22,933,451 | ) | (21,039,865 | ) | ||
| Institutional Class | (3,213,866 | ) | (2,298,420 | ) | ||
| A Class | (4,194,466 | ) | (4,046,008 | ) | ||
| C Class | (710,469 | ) | (722,751 | ) | ||
| Decrease in net assets from distributions | (31,052,252 | ) | (28,107,044 | ) | ||
| Capital Share Transactions | ||||||
| Net increase (decrease) in net assets from capital share transactions (Note 5) | 72,245,980 | 95,617,869 | ||||
| Net increase (decrease) in net assets | 75,296,185 | 159,513,404 | ||||
| Net Assets | ||||||
| Beginning of period | 787,223,969 | 627,710,565 | ||||
| End of period | $ | 862,520,154 | $ | 787,223,969 | ||
See Notes to Financial Statements.
26
| Notes to Financial Statements |
AUGUST 31, 2015
1. Organization
American Century California Tax-Free and Municipal Funds (the trust) is registered under the Investment Company Act of 1940, as amended (the 1940 Act), as an open-end management investment company and is organized as a Massachusetts business trust. California High-Yield Municipal Fund (the fund) is one fund in a series issued by the trust. The fund is nondiversified as defined under the 1940 Act. The fund’s investment objective is to seek high current income that is exempt from federal and California income taxes.
The fund offers the Investor Class, the Institutional Class, the A Class and the C Class. The A Class may incur an initial sales charge. The A Class and C Class may be subject to a contingent deferred sales charge. The share classes differ principally in their respective sales charges and distribution and shareholder servicing expenses and arrangements. The Institutional Class is made available to institutional shareholders or through financial intermediaries whose clients do not require the same level of shareholder and administrative services as shareholders of other classes. As a result, the Institutional Class is charged a lower unified management fee.
2. Significant Accounting Policies
The following is a summary of significant accounting policies consistently followed by the fund in preparation of its financial statements. The fund is an investment company and follows accounting and reporting guidance in accordance with accounting principles generally accepted in the United States of America. This may require management to make certain estimates and assumptions at the date of the financial statements. Actual results could differ from these estimates. Management evaluated the impact of events or transactions occurring through the date the financial statements were issued that would merit recognition or disclosure.
Investment Valuations — The fund determines the fair value of its investments and computes its net asset value per share at the close of regular trading (usually 4 p.m. Eastern time) on the New York Stock Exchange (NYSE) on each day the NYSE is open. The Board of Trustees has adopted valuation policies and procedures to guide the investment advisor in the fund’s investment valuation process and to provide methodologies for the oversight of the fund’s pricing function.
Fixed income securities maturing in greater than 60 days at the time of purchase are valued at the evaluated mean as provided by independent pricing services or at the mean of the most recent bid and asked prices as provided by investment dealers. Fixed income securities maturing within 60 days at the time of purchase may be valued at cost, plus or minus any amortized discount or premium or at the evaluated mean as provided by an independent pricing service. Evaluated mean prices are commonly derived through utilization of market models, which may consider, among other factors: trade data, quotations from dealers and active market makers, relevant yield curve and spread data, related sector levels, creditworthiness, trade data or market information on comparable securities, and other relevant security specific information.
Exchange-traded futures contracts are valued at the settlement price as provided by the appropriate clearing corporation.
If the fund determines that the market price for an investment is not readily available or the valuation methods mentioned above do not reflect an investment’s fair value, such investment is valued as determined in good faith by the Board of Trustees or its delegate, in accordance with policies and procedures adopted by the Board of Trustees. In its determination of fair value, the fund may review several factors including, but not limited to, market information regarding the specific investment or comparable investments and correlation with other investment types, futures indices or general market indicators. Circumstances that may cause the fund to use these procedures to value an investment include, but are not limited to: an investment has been declared in default or is distressed; trading in a security has been suspended during the trading day or a security is not actively trading on its principal exchange; prices received from a regular pricing source are deemed unreliable; or there is a foreign market holiday and no trading occurred.
The fund monitors for significant events occurring after the close of an investment’s primary exchange but before the fund’s net asset value per share is determined. Significant events may include, but are not limited to: corporate announcements and transactions; governmental action and political unrest that could impact a
27
specific investment or an investment sector; or armed conflicts, natural disasters and similar events that could affect investments in a specific country or region.
Security Transactions — Security transactions are accounted for as of the trade date. Net realized gains and losses are determined on the identified cost basis, which is also used for federal income tax purposes.
Investment Income — Interest income is recorded on the accrual basis and includes accretion of discounts and amortization of premiums.
Segregated Assets — In accordance with the 1940 Act, the fund segregates assets on its books and records to cover certain types of investments, including, but not limited to, futures contracts and when-issued securities. American Century Investment Management, Inc. (ACIM) (the investment advisor) monitors, on a daily basis, the securities segregated to ensure the fund designates a sufficient amount of liquid assets, marked-to-market daily. The fund may also receive assets or be required to pledge assets at the custodian bank or with a broker for margin requirements on futures contracts.
Income Tax Status — It is the fund’s policy to distribute substantially all net investment income and net realized gains to shareholders and to otherwise qualify as a regulated investment company under provisions of the Internal Revenue Code. Accordingly, no provision has been made for income taxes. The fund files U.S. federal, state, local and non-U.S. tax returns as applicable. The fund's tax returns are subject to examination by the relevant taxing authority until expiration of the applicable statute of limitations, which is generally three years from the date of filing but can be longer in certain jurisdictions. At this time, management believes there are no uncertain tax positions which, based on their technical merit, would not be sustained upon examination and for which it is reasonably possible that the total amounts of unrecognized tax benefits will significantly change in the next twelve months.
Multiple Class — All shares of the fund represent an equal pro rata interest in the net assets of the class to which such shares belong, and have identical voting, dividend, liquidation and other rights and the same terms and conditions, except for class specific expenses and exclusive rights to vote on matters affecting only individual classes. Income, non-class specific expenses, and realized and unrealized capital gains and losses of the fund are allocated to each class of shares based on their relative net assets.
Distributions to Shareholders — Distributions from net investment income, if any, are declared daily and paid monthly. Distributions from net realized gains, if any, are generally declared and paid annually.
Indemnifications — Under the trust’s organizational documents, its officers and trustees are indemnified against certain liabilities arising out of the performance of their duties to the fund. In addition, in the normal course of business, the fund enters into contracts that provide general indemnifications. The maximum exposure under these arrangements is unknown as this would involve future claims that may be made against a fund. The risk of material loss from such claims is considered by management to be remote.
3. Fees and Transactions with Related Parties
Certain officers and trustees of the trust are also officers and/or directors of American Century Companies, Inc. (ACC). The trust's investment advisor, ACIM, the trust's distributor, American Century Investment Services, Inc. (ACIS), and the trust's transfer agent, American Century Services, LLC, are wholly owned, directly or indirectly, by ACC.
Management Fees — The trust has entered into a management agreement with ACIM, under which ACIM provides the fund with investment advisory and management services in exchange for a single, unified management fee (the fee) per class. The agreement provides that all expenses of managing and operating the fund, except distribution and service fees, brokerage expenses, taxes, interest, fees and expenses of the independent trustees (including legal counsel fees), and extraordinary expenses, will be paid by ACIM. The fee is computed and accrued daily based on each class’s daily net assets and paid monthly in arrears. The fee consists of (1) an Investment Category Fee based on the daily net assets of the fund and certain other accounts managed by the investment advisor that are in the same broad investment category as the fund and (2) a Complex Fee based on the assets of all the funds in the American Century Investments family of funds. The rates for the Investment Category Fee range from 0.1925% to 0.3100%. The rates for the Complex Fee range from 0.2500% to 0.3100% for the Investor Class, A Class and C Class. The rates for the Complex Fee range from 0.0500% to 0.1100% for the Institutional Class. The effective annual management fee for each class for the year ended August 31, 2015 was 0.49% for the Investor Class, A Class and C Class and 0.29% for the Institutional Class.
28
Distribution and Service Fees — The Board of Trustees has adopted a separate Master Distribution and Individual Shareholder Services Plan for each of the A Class and C Class (collectively the plans), pursuant to Rule 12b-1 of the 1940 Act. The plans provide that the A Class will pay ACIS an annual distribution and service fee of 0.25%. The plans provide that the C Class will pay ACIS an annual distribution and service fee of 1.00%, of which 0.25% is paid for individual shareholder services and 0.75% is paid for distribution services. The fees are computed and accrued daily based on each class’s daily net assets and paid monthly in arrears. The fees are used to pay financial intermediaries for distribution and individual shareholder services. Fees incurred under the plans during the year ended August 31, 2015 are detailed in the Statement of Operations.
Trustees’ Fees and Expenses — The Board of Trustees is responsible for overseeing the investment advisor’s management and operations of the fund. The trustees receive detailed information about the fund and its investment advisor regularly throughout the year, and meet at least quarterly with management of the investment advisor to review reports about fund operations. The fund’s officers do not receive compensation from the fund.
4. Investment Transactions
Purchases and sales of investment securities, excluding short-term investments, for the year ended August 31, 2015 were $412,470,375 and $341,655,213, respectively.
5. Capital Share Transactions
Transactions in shares of the fund were as follows (unlimited number of shares authorized):
| Year ended August 31, 2015 | Year ended August 31, 2014 | |||||||||
| Shares | Amount | Shares | Amount | |||||||
| Investor Class | ||||||||||
| Sold | 16,300,335 | $ | 168,967,153 | 15,882,335 | $ | 156,596,677 | ||||
| Issued in reinvestment of distributions | 1,815,379 | 18,804,585 | 1,714,004 | 16,912,464 | ||||||
| Redeemed | (12,572,062 | ) | (130,008,836 | ) | (12,405,479 | ) | (120,628,325 | ) | ||
| 5,543,652 | 57,762,902 | 5,190,860 | 52,880,816 | |||||||
| Institutional Class | ||||||||||
| Sold | 2,159,763 | 22,373,675 | 5,728,096 | 55,538,884 | ||||||
| Issued in reinvestment of distributions | 303,391 | 3,141,909 | 228,973 | 2,272,854 | ||||||
| Redeemed | (1,799,790 | ) | (18,737,563 | ) | (1,189,921 | ) | (11,672,509 | ) | ||
| 663,364 | 6,778,021 | 4,767,148 | 46,139,229 | |||||||
| A Class | ||||||||||
| Sold | 2,760,616 | 28,582,741 | 3,825,431 | 37,763,518 | ||||||
| Issued in reinvestment of distributions | 373,436 | 3,869,303 | 371,960 | 3,668,495 | ||||||
| Redeemed | (2,771,772 | ) | (28,720,194 | ) | (4,275,743 | ) | (41,490,768 | ) | ||
| 362,280 | 3,731,850 | (78,352 | ) | (58,755 | ) | |||||
| C Class | ||||||||||
| Sold | 758,896 | 7,858,572 | 551,061 | 5,440,645 | ||||||
| Issued in reinvestment of distributions | 49,897 | 516,947 | 50,962 | 502,244 | ||||||
| Redeemed | (425,841 | ) | (4,402,312 | ) | (959,654 | ) | (9,286,310 | ) | ||
| 382,952 | 3,973,207 | (357,631 | ) | (3,343,421 | ) | |||||
| Net increase (decrease) | 6,952,248 | $ | 72,245,980 | 9,522,025 | $ | 95,617,869 | ||||
29
6. Fair Value Measurements
The fund’s investments valuation process is based on several considerations and may use multiple inputs to determine the fair value of the investments held by the fund. In conformity with accounting principles generally accepted in the United States of America, the inputs used to determine a valuation are classified into three broad levels.
| • | Level 1 valuation inputs consist of unadjusted quoted prices in an active market for identical investments. |
| • | Level 2 valuation inputs consist of direct or indirect observable market data (including quoted prices for comparable investments, evaluations of subsequent market events, interest rates, prepayment speeds, credit risk, etc.). These inputs also consist of quoted prices for identical investments initially expressed in local currencies that are adjusted through translation into U.S. dollars. |
| • | Level 3 valuation inputs consist of unobservable data (including a fund’s own assumptions). |
The level classification is based on the lowest level input that is significant to the fair valuation measurement. The valuation inputs are not necessarily an indication of the risks associated with investing in these securities or other financial instruments. There were no significant transfers between levels during the period.
As of period end, the fund’s investment securities and unrealized appreciation (depreciation) on futures contracts were classified as Level 2 and Level 1, respectively. The Schedule of Investments provides additional information on the fund’s portfolio holdings.
7. Derivative Instruments
Interest Rate Risk — The fund is subject to interest rate risk in the normal course of pursuing its investment objectives. The value of bonds generally declines as interest rates rise. A fund may enter into futures contracts based on a bond index or a specific underlying security. A fund may purchase futures contracts to gain exposure to increases in market value or sell futures contracts to protect against a decline in market value. Upon entering into a futures contract, a fund will segregate cash, cash equivalents or other appropriate liquid securities on its records in amounts sufficient to meet requirements. Subsequent payments (variation margin) are made or received daily, in cash, by a fund. The variation margin is equal to the daily change in the contract value and is recorded as unrealized gains and losses. A fund recognizes a realized gain or loss when the futures contract is closed or expires. Net realized and unrealized gains or losses occurring during the holding period of futures contracts are a component of net realized gain (loss) on futures contract transactions and change in net unrealized appreciation (depreciation) on futures contracts, respectively. One of the risks of entering into futures contracts is the possibility that the change in value of the contract may not correlate with the changes in value of the underlying securities. The fund's average exposure to interest rate risk derivative instruments held during the period was 358 contracts.
The value of interest rate risk derivative instruments as of August 31, 2015, is disclosed on the Statement of Assets and Liabilities as an asset of $29,938 in receivable for variation margin on futures contracts.* For the year ended August 31, 2015, the effect of interest rate risk derivative instruments on the Statement of Operations was $(573,036) in net realized gain (loss) on futures contract transactions and $188,044 in change in net unrealized appreciation (depreciation) on futures contracts.
* Included in the unrealized appreciation (depreciation) on futures contracts as reported in the Schedule of Investments.
8. Risk Factors
The fund concentrates its investments in a single state and therefore may have more exposure to credit risk related to the state of California than a fund with a broader geographical diversification. The fund invests in lower-rated debt securities, which are subject to substantial risks including liquidity risk and credit risk.
30
9. Federal Tax Information
The tax character of distributions paid during the years ended August 31, 2015 and August 31, 2014 were as follows:
| 2015 | 2014 | |||||
| Distributions Paid From | ||||||
| Exempt income | $ | 31,004,444 | $ | 28,094,462 | ||
| Taxable ordinary income | $ | 47,808 | $ | 12,582 | ||
| Long-term capital gains | — | — | ||||
The book-basis character of distributions made during the year from net investment income or net realized gains may differ from their ultimate characterization for federal income tax purposes. These differences reflect the differing character of certain income items and net realized gains and losses for financial statement and tax purposes, and may result in reclassification among certain capital accounts on the financial statements.
As of August 31, 2015, the federal tax cost of investments and the components of distributable earnings on a tax-basis were as follows:
| Federal tax cost of investments | $ | 796,278,126 | |
| Gross tax appreciation of investments | $ | 56,644,592 | |
| Gross tax depreciation of investments | (2,191,071 | ) | |
| Net tax appreciation (depreciation) of investments | 54,453,521 | ||
| Net tax appreciation (depreciation) on derivatives | — | ||
| Net tax appreciation (depreciation) | $ | 54,453,521 | |
| Other book-to-tax adjustments | $ | (127,154 | ) |
| Undistributed exempt income | — | ||
| Accumulated short-term capital losses | $ | (36,306,087 | ) |
| Accumulated long-term capital losses | $ | (6,499,020 | ) |
The cost of investments for federal income tax purposes was the same as the cost for financial reporting purposes. The difference between book-basis and tax-basis unrealized appreciation (depreciation) is attributable primarily to the realization for tax purposes of unrealized gains (losses) on futures contracts. Other book-to-tax adjustments are attributable primarily to the tax deferral of losses on straddle positions.
Accumulated capital losses represent net capital loss carryovers that may be used to offset future realized capital gains for federal income tax purposes. Any unlimited losses will be required to be utilized prior to the losses which carry an expiration date. Future capital loss carryover utilization in any given year may be subject to Internal Revenue Code limitations. Capital loss carryovers expire as follows:
| 2017 | 2018 | 2019 | Unlimited (Short-Term) | Unlimited (Long-Term) |
| $(9,518,848) | $(12,885,340) | $(6,203,529) | $(7,698,370) | $(6,499,020) |
31
| Financial Highlights |
| For a Share Outstanding Throughout the Years Ended August 31 (except as noted) | |||||||||||||||
| Per-Share Data | Ratios and Supplemental Data | ||||||||||||||
| Income From Investment Operations: | Ratio to Average Net Assets of: | ||||||||||||||
Net Asset Value, Beginning of Period | Net Investment Income (Loss)(1) | Net Realized and Unrealized Gain (Loss) | Total From Investment Operations | Distributions From Net Investment Income | Net Asset Value, End of Period | Total Return(2) | Operating Expenses | Operating Expenses (before expense waiver) | Net Investment Income (Loss) | Net Investment Income (Loss) (before expense waiver) | Portfolio Turnover Rate | Net Assets, End of Period (in thousands) | |||
| Investor Class | |||||||||||||||
| 2015 | $10.25 | 0.39 | 0.05 | 0.44 | (0.39) | $10.30 | 4.32% | 0.50% | 0.50% | 3.75% | 3.75% | 41% | $631,702 | ||
| 2014 | $9.33 | 0.41 | 0.92 | 1.33 | (0.41) | $10.25 | 14.50% | 0.50% | 0.50% | 4.14% | 4.14% | 57% | $571,924 | ||
| 2013 | $10.13 | 0.40 | (0.80) | (0.40) | (0.40) | $9.33 | (4.14)% | 0.50% | 0.50% | 3.99% | 3.99% | 81% | $472,141 | ||
| 2012 | $9.40 | 0.45 | 0.73 | 1.18 | (0.45) | $10.13 | 12.79% | 0.50% | 0.50% | 4.55% | 4.55% | 48% | $506,399 | ||
| 2011 | $9.69 | 0.47 | (0.29) | 0.18 | (0.47) | $9.40 | 2.07% | 0.49% | 0.51% | 5.10% | 5.08% | 37% | $374,467 | ||
| Institutional Class | |||||||||||||||
| 2015 | $10.25 | 0.41 | 0.05 | 0.46 | (0.41) | $10.30 | 4.53% | 0.30% | 0.30% | 3.95% | 3.95% | 41% | $83,751 | ||
| 2014 | $9.33 | 0.43 | 0.92 | 1.35 | (0.43) | $10.25 | 14.73% | 0.30% | 0.30% | 4.34% | 4.34% | 57% | $76,561 | ||
| 2013 | $10.13 | 0.42 | (0.80) | (0.38) | (0.42) | $9.33 | (3.94)% | 0.30% | 0.30% | 4.19% | 4.19% | 81% | $25,217 | ||
| 2012 | $9.40 | 0.46 | 0.74 | 1.20 | (0.47) | $10.13 | 13.01% | 0.30% | 0.30% | 4.75% | 4.75% | 48% | $22,287 | ||
| 2011 | $9.69 | 0.49 | (0.29) | 0.20 | (0.49) | $9.40 | 2.27% | 0.29% | 0.31% | 5.30% | 5.28% | 37% | $9,784 | ||
32
| For a Share Outstanding Throughout the Years Ended August 31 (except as noted) | |||||||||||||||
| Per-Share Data | Ratios and Supplemental Data | ||||||||||||||
| Income From Investment Operations: | Ratio to Average Net Assets of: | ||||||||||||||
Net Asset Value, Beginning of Period | Net Investment Income (Loss)(1) | Net Realized and Unrealized Gain (Loss) | Total From Investment Operations | Distributions From Net Investment Income | Net Asset Value, End of Period | Total Return(2) | Operating Expenses | Operating Expenses (before expense waiver) | Net Investment Income (Loss) | Net Investment Income (Loss) (before expense waiver) | Portfolio Turnover Rate | Net Assets, End of Period (in thousands) | |||
| A Class | |||||||||||||||
| 2015 | $10.25 | 0.36 | 0.05 | 0.41 | (0.36) | $10.30 | 4.06% | 0.75% | 0.75% | 3.50% | 3.50% | 41% | $119,150 | ||
| 2014 | $9.33 | 0.38 | 0.92 | 1.30 | (0.38) | $10.25 | 14.21% | 0.75% | 0.75% | 3.89% | 3.89% | 57% | $114,878 | ||
| 2013 | $10.13 | 0.38 | (0.80) | (0.42) | (0.38) | $9.33 | (4.38)% | 0.75% | 0.75% | 3.74% | 3.74% | 81% | $105,296 | ||
| 2012 | $9.40 | 0.42 | 0.73 | 1.15 | (0.42) | $10.13 | 12.51% | 0.75% | 0.75% | 4.30% | 4.30% | 48% | $117,162 | ||
| 2011 | $9.69 | 0.45 | (0.29) | 0.16 | (0.45) | $9.40 | 1.82% | 0.74% | 0.76% | 4.85% | 4.83% | 37% | $89,028 | ||
| C Class | |||||||||||||||
| 2015 | $10.25 | 0.28 | 0.05 | 0.33 | (0.28) | $10.30 | 3.29% | 1.50% | 1.50% | 2.75% | 2.75% | 41% | $27,917 | ||
| 2014 | $9.33 | 0.31 | 0.92 | 1.23 | (0.31) | $10.25 | 13.37% | 1.50% | 1.50% | 3.14% | 3.14% | 57% | $23,860 | ||
| 2013 | $10.13 | 0.30 | (0.80) | (0.50) | (0.30) | $9.33 | (5.09)% | 1.50% | 1.50% | 2.99% | 2.99% | 81% | $25,056 | ||
| 2012 | $9.40 | 0.35 | 0.73 | 1.08 | (0.35) | $10.13 | 11.67% | 1.50% | 1.50% | 3.55% | 3.55% | 48% | $29,388 | ||
| 2011 | $9.69 | 0.38 | (0.29) | 0.09 | (0.38) | $9.40 | 1.06% | 1.49% | 1.51% | 4.10% | 4.08% | 37% | $23,917 | ||
| Notes to Financial Highlights |
| (1) | Computed using average shares outstanding throughout the period. |
| (2) | Total returns are calculated based on the net asset value of the last business day and do not reflect applicable sales charges, if any. Total returns for periods less than one year are not annualized. |
See Notes to Financial Statements.
33
| Report of Independent Registered Public Accounting Firm |
To the Trustees of the American Century California Tax-Free and Municipal Funds and Shareholders of the California High-Yield Municipal Fund:
In our opinion, the accompanying statement of assets and liabilities, including the schedule of investments, and the related statements of operations and of changes in net assets and the financial highlights present fairly, in all material respects, the financial position of the California High-Yield Municipal Fund (one of the four funds in the American Century California Tax-Free and Municipal Funds, hereafter referred to as the "Fund") at August 31, 2015, the results of its operations for the year then ended, the changes in its net assets for each of the two years in the period then ended and the financial highlights for each of the five years in the period then ended, in conformity with accounting principles generally accepted in the United States of America. These financial statements and financial highlights (hereafter referred to as "financial statements") are the responsibility of the Fund's management. Our responsibility is to express an opinion on these financial statements based on our audits. We conducted our audits of these financial statements in accordance with the standards of the Public Company Accounting Oversight Board (United States). Those standards require that we plan and perform the audit to obtain reasonable assurance about whether the financial statements are free of material misstatement. An audit includes examining, on a test basis, evidence supporting the amounts and disclosures in the financial statements, assessing the accounting principles used and significant estimates made by management, and evaluating the overall financial statement presentation. We believe that our audits, which included confirmation of securities at August 31, 2015 by correspondence with the custodian and brokers, provide a reasonable basis for our opinion.
PricewaterhouseCoopers LLP
Kansas City, Missouri
October 21, 2015
34
| Management |
Board of Trustees
The individuals listed below serve as trustees of the funds. Each trustee will continue to serve in this capacity until death, retirement, resignation or removal from office. The board has adopted a mandatory retirement age for trustees who are not “interested persons,” as that term is defined in the Investment Company Act (independent trustees). Independent trustees shall retire on December 31 of the year in which they reach their 75th birthday; provided, however, that on or after January 1, 2022, independent trustees shall retire on December 31 of the year in which they reach their 76th birthday.
Mr. Thomas is an “interested person” because he currently serves as President and Chief Executive Officer of American Century Companies, Inc. (ACC), the parent company of American Century Investment Management, Inc. (ACIM or the advisor). The other trustees (more than three-fourths of the total number) are independent. They are not employees, directors or officers of, and have no financial interest in, ACC or any of its wholly owned, direct or indirect, subsidiaries, including ACIM, American Century Investment Services, Inc. (ACIS) and American Century Services, LLC (ACS), and they do not have any other affiliations, positions or relationships that would cause them to be considered “interested persons” under the Investment Company Act. The trustees serve in this capacity for eight (in the case of Mr. Thomas, 15) registered investment companies in the American Century Investments family of funds.
The following table presents additional information about the trustees. The mailing address for each trustee other than Mr. Thomas is 1665 Charleston Road, Mountain View, California 94043. The mailing address for Mr. Thomas is 4500 Main Street, Kansas City, Missouri 64111.
Name (Year of Birth) | Position(s) Held with Funds | Length of Time Served | Principal Occupation(s) During Past 5 Years | Number of American Century Portfolios Overseen by Trustee | Other Directorships Held During Past 5 Years |
| Independent Trustees | |||||
| Tanya S. Beder (1955) | Trustee | Since 2011 | Chairman and CEO, SBCC Group Inc. (independent advisory services) (2006 to present) | 46 | CYS Investments, Inc. (NYSE mortgage arbitrage REIT) |
| Jeremy I. Bulow (1954) | Trustee | Since 2011 | Professor of Economics, Stanford University, Graduate School of Business (1979 to present) | 46 | None |
| Ronald J. Gilson (1946) | Trustee and Chairman of the Board | Since 1995 (Chairman since 2005) | Charles J. Meyers Professor of Law and Business, Stanford Law School (1979 to present); Marc and Eva Stern Professor of Law and Business, Columbia University School of Law (1992 to present) | 46 | None |
| Frederick L. A. Grauer (1946) | Trustee | Since 2008 | Senior Advisor, BlackRock, Inc. (investment management firm) (2010 to 2011, 2013 to present) | 46 | None |
| Peter F. Pervere (1947) | Trustee | Since 2007 | Retired | 46 | None |
35
Name (Year of Birth) | Position(s) Held with Funds | Length of Time Served | Principal Occupation(s) During Past 5 Years | Number of American Century Portfolios Overseen by Trustee | Other Directorships Held During Past 5 Years |
| Independent Trustee | |||||
| John B. Shoven (1947) | Trustee | Since 2002 | Professor of Economics, Stanford University (1973 to present) | 46 | Cadence Design Systems; Exponent; Financial Engines |
| Interested Trustee | |||||
| Jonathan S. Thomas (1963) | Trustee and President | Since 2007 | President and Chief Executive Officer, ACC (March 2007 to present). Also serves as Chief Executive Officer, ACS; Executive Vice President, ACIM; Director, ACC, ACIM and other ACC subsidiaries | 124 | BioMed Valley Discoveries, Inc. |
The Statement of Additional Information has additional information about the fund's trustees and is available without charge, upon request, by calling 1-800-345-2021.
36
Officers
The following table presents certain information about the executive officers of the funds. Each officer serves as an officer for each of the 15 investment companies in the American Century family of funds, unless otherwise noted. No officer is compensated for his or her service as an officer of the funds. The listed officers are interested persons of the funds and are appointed or re-appointed on an annual basis. The mailing address for each of the officers listed below is 4500 Main Street, Kansas City, Missouri 64111.
Name (Year of Birth) | Offices with the Funds | Principal Occupation(s) During the Past Five Years |
| Jonathan S. Thomas (1963) | Trustee and President since 2007 | President and Chief Executive Officer, ACC (March 2007 to present). Also serves as Chief Executive Officer, ACS; Executive Vice President, ACIM; Director, ACC, ACIM and other ACC subsidiaries |
| Amy D. Shelton (1964) | Chief Compliance Officer and Vice President since 2014 | Chief Compliance Officer, American Century funds, (March 2014 to present); Chief Compliance Officer, ACIM (February 2014 to present); Chief Compliance Officer, ACIS (October 2009 to present); Vice President, Client Interactions and Marketing, ACIS (February 2013 to January 2014); Director, Client Interactions and Marketing, ACIS (June 2007 to January 2013). Also serves as Vice President, ACIS |
| Charles A. Etherington (1957) | General Counsel since 2007 and Senior Vice President since 2006 | Attorney, ACC (February 1994 to present); Vice President, ACC (November 2005 to present); General Counsel, ACC (March 2007 to present). Also serves as General Counsel, ACIM, ACS, ACIS and other ACC subsidiaries; and Senior Vice President, ACIM and ACS |
| C. Jean Wade (1964) | Vice President, Treasurer and Chief Financial Officer since 2012 | Vice President, ACS (February 2000 to present) |
| Robert J. Leach (1966) | Vice President since 2006 and Assistant Treasurer since 2012 | Vice President, ACS (February 2000 to present) |
| David H. Reinmiller (1963) | Vice President since 2001 | Attorney, ACC (January 1994 to present); Associate General Counsel, ACC (January 2001 to present). Also serves as Vice President, ACIM and ACS |
| Ward D. Stauffer (1960) | Secretary since 2005 | Attorney, ACC (June 2003 to present) |
37
| Approval of Management Agreement |
At a meeting held on June 16, 2015, the Fund’s Board of Trustees unanimously approved the renewal of the management agreement pursuant to which American Century Investment Management, Inc. (the “Advisor”) acts as the investment advisor for the Fund. Under Section 15(c) of the Investment Company Act, contracts for investment advisory services are required to be reviewed, evaluated, and approved by a majority of a fund’s directors/trustees, including a majority of the independent Trustees, each year. The Board regards this annual evaluation and renewal as one of its most important responsibilities.
The independent Trustees have memorialized a statement regarding the relationship between their ongoing obligations to oversee and evaluate the performance of the Advisor and their annual consideration of renewal of the management agreement. In that statement, the independent Trustees noted that their assessment of the Advisor’s performance is an ongoing process that takes place over the entire year and is informed by all of the extensive information that the Board and its committees receive and consider over time. This information, together with the materials provided in connection with the review, are central to the Board’s assessment of the Advisor’s performance and its determination whether to renew the Fund’s management agreement.
Prior to its consideration of the renewal of the management agreement, the Board requested and reviewed extensive data and analysis relating to the proposed renewal. This information and analysis was compiled by the Advisor and certain independent providers of evaluation data concerning the Fund and the services provided to the Fund by the Advisor.
In connection with its consideration of the renewal of the management agreement, the Board’s review and evaluation of the services provided by the Advisor included, but was not limited to, the following:
| • | the nature, extent, and quality of investment management, shareholder services, and other services provided by the Advisor to the Fund; |
| • | the wide range of other programs and services the Advisor provides to the Fund and its shareholders on a routine and non-routine basis; |
| • | the investment performance of the Fund, including data comparing the Fund’s performance to appropriate benchmarks and/or a peer group of other mutual funds with similar investment objectives and strategies; |
| • | the cost of owning the Fund compared to the cost of owning similar funds; |
| • | the Advisor’s compliance policies, procedures, and regulatory experience; |
| • | financial data showing the cost of services provided to the Fund, the profitability of the Fund to the Advisor, and the overall profitability of the Advisor; |
| • | possible economies of scale associated with the Advisor’s management of the Fund and other accounts under its management; |
| • | data comparing services provided and charges to other investment management clients of the Advisor; |
| • | acquired fund fees and expenses; |
| • | payments by the Fund and the Advisor to financial intermediaries whose clients are investors in the Fund; and |
| • | any collateral benefits derived by the Advisor from the management of the Fund. |
In keeping with its practice, the Board held two in-person meetings to review and discuss the information provided in response to their request. The independent Trustees also had the benefit of the advice of their independent counsel throughout the process.
38
Factors Considered
The Trustees considered all of the information provided by the Advisor, the independent data providers, and the independent Trustees’ independent counsel in connection with the review, and evaluated such information for the Fund. In connection with their review, the Trustees did not identify any single factor as being all-important or controlling and each Trustee may have attributed different levels of importance to different factors. In deciding to renew the management agreement, the Board based its decision on a number of factors, including the following:
Nature, Extent and Quality of Services - Generally. Under the management agreement, the Advisor is responsible for providing or arranging for all services necessary for the operation of the Fund. The Board noted that under the management agreement, the Advisor provides or arranges at its own expense a wide variety of services including:
| • | constructing and designing the Fund |
| • | portfolio research and security selection |
| • | initial capitalization/funding |
| • | securities trading |
| • | Fund administration |
| • | custody of Fund assets |
| • | daily valuation of the Fund’s portfolio |
| • | shareholder servicing and transfer agency, including shareholder confirmations, recordkeeping, and communications |
| • | legal services (except the independent Trustees’ counsel) |
| • | regulatory and portfolio compliance |
| • | financial reporting |
| • | marketing and distribution (except amounts paid by the Fund under Rule 12b-1 plans) |
The Board noted that many of these services have expanded over time both in terms of quantity and complexity in response to shareholder demands, competition in the industry, changing distribution channels, and the changing regulatory environment.
Investment Management, Shareholder, and Other Services. The nature of the investment management services provided to the Fund is quite complex and allows Fund shareholders access to professional money management, instant diversification of their investments within an asset class, the opportunity to easily diversify among asset classes by investing in or exchanging among various American Century Investments funds, and liquidity. In evaluating investment performance, the Board expects the Advisor to manage the Fund in accordance with its investment objectives and approved strategies. Further, the Trustees recognize that the Advisor has an obligation to seek the best execution of fund trades. In providing these services, the Advisor utilizes teams of investment professionals (portfolio managers, analysts, research assistants, and securities traders) who require extensive information technology, research, training, compliance, and other systems to conduct their business. The Board, directly and through its Portfolio Committee, regularly reviews investment performance information for the Fund, together with comparative information for appropriate benchmarks and/or peer groups of similarly-managed funds, over different time horizons. The Trustees also review detailed performance information during the management agreement approval process. If performance concerns are identified, the Fund receives special reviews until performance improves, during which the Board discusses with the Advisor the reasons for such results (e.g., market conditions, security selection) and any efforts being undertaken to improve performance. The Fund’s performance was above its benchmark for the three-, five-, and ten-year periods and below its benchmark for the one-year period reviewed by the Board. The Board discussed the Fund’s performance with the Advisor and was satisfied with the efforts being undertaken by the Advisor. The Board found the investment management services provided by the Advisor to the Fund to be satisfactory and consistent with the management agreement.
39
Under the management agreement, the Advisor provides the Fund with a comprehensive package of transfer agency, shareholder, and other services. The Board, directly and through various committees of the Board, regularly reviews reports and evaluations of such services at its regular meetings. These reports include, but are not limited to, information regarding the operational efficiency and accuracy of the shareholder and transfer agency services provided, staffing levels, shareholder satisfaction (as measured by external as well as internal sources), technology support, new products and services offered to Fund shareholders, securities trading activities, portfolio valuation services, auditing services, and legal and operational compliance activities.
Certain aspects of shareholder and transfer agency service level efficiency and the quality of securities trading activities are measured by independent third party providers and are presented in comparison to other fund groups not managed by the Advisor. The Board found the services provided by the Advisor to the Fund under the management agreement to be competitive and of high quality.
Costs of Services and Profitability. The Advisor provides detailed information concerning its cost of providing various services to the Fund, its profitability in managing the Fund, its overall profitability, and its financial condition. The Trustees have reviewed with the Advisor the methodology used to prepare this financial information. This information is considered in evaluating the Advisor’s financial condition, its ability to continue to provide services under the management agreement, and the reasonableness of the current management fee. The Board concluded that the Advisor’s profits were reasonable in light of the services provided to the Fund.
Ethics. The Board generally considers the Advisor’s commitment to providing quality services to shareholders and to conducting its business ethically. They noted that the Advisor’s practices generally meet or exceed industry best practices.
Economies of Scale. The Board also reviewed information provided by the Advisor regarding the possible existence of economies of scale in connection with the management of the Fund. The Board concluded that economies of scale are difficult to measure and predict with precision, especially on a fund-by-fund basis. The Board concluded that the Advisor is appropriately sharing economies of scale through its competitive fee structure, offering competitive fees from fund inception, and through reinvestment in its business to provide shareholders enhanced and expanded services.
Comparison to Other Funds’ Fees. The management agreement provides that the Fund pays the Advisor a single, all-inclusive (or unified) management fee for providing all services necessary for the management and operation of the Fund, other than brokerage expenses, taxes, interest, extraordinary expenses, the fees and expenses of the Fund’s independent Trustees (including their independent legal counsel), and expenses incurred in connection with the provision of shareholder services and distribution services under a plan adopted pursuant to Rule 12b-1 under the 1940 Act. Under the unified fee structure, the Advisor is responsible for providing all investment advisory, custody, audit, administrative, compliance, recordkeeping, marketing, and shareholder services, or arranging and supervising third parties to provide such services. By contrast, most other funds are charged a variety of fees, including an investment advisory fee, a transfer agency fee, an administrative fee, distribution charges, and other expenses. Other than their investment advisory fees and any applicable Rule 12b-1 fees, all other components of the total fees charged by these other funds may be increased without shareholder approval. The Board believes the unified fee structure is a benefit to Fund shareholders because it clearly discloses to shareholders the cost of owning Fund shares, and, since the unified fee cannot be increased without a vote of Fund shareholders, it shifts to the Advisor the risk of increased costs of operating the Fund and provides a direct incentive to minimize administrative inefficiencies. Part of the Board’s analysis of fee levels involves reviewing certain evaluative data compiled by an independent provider and comparing the Fund’s unified fee to the total expense ratio of peer funds. The unified fee charged to shareholders of the Fund was below the median of the total expense ratios of the Fund’s peer group. The Board concluded that the management fee paid by the Fund to the Advisor under the management agreement is reasonable in light of the services provided to the Fund.
40
Comparison to Fees and Services Provided to Other Clients of the Advisor. The Board also requested and received information from the Advisor concerning the nature of the services, fees, costs, and profitability of its advisory services to advisory clients other than the Fund. They observed that these varying types of client accounts require different services and involve different regulatory and entrepreneurial risks than the management of the Fund. The Board analyzed this information and concluded that the fees charged and services provided to the Fund were reasonable by comparison.
Payments to Intermediaries. The Trustees also requested and received a description of payments made to intermediaries by the Fund and the Advisor. These payments include various payments made by the Fund or the Advisor to different types of intermediaries and recordkeepers for distribution and service activities provided for the Fund.
Collateral or “Fall-Out” Benefits Derived by the Advisor. The Board considered the existence of collateral benefits the Advisor may receive as a result of its relationship with the Fund. The Board noted that the Advisor’s primary business is managing mutual funds and it generally does not use fund or shareholder information to generate profits in other lines of business, and therefore does not derive any significant collateral benefits from them. The Board noted that the Advisor receives proprietary research from broker-dealers that execute fund portfolio transactions. The Board also determined that the Advisor is able to provide investment management services to certain clients other than the Fund, at least in part, due to its existing infrastructure built to serve the fund complex.
Existing Relationship. The Board also considered whether there was any reason for not continuing the existing arrangement with the Advisor. In this regard, the Board was mindful of the potential disruptions of the Fund’s operations and various risks, uncertainties, and other effects that could occur as a result of a decision not to continue such relationship. In particular, the Board recognized that most shareholders have invested in the Fund on the strength of the Advisor’s industry standing and reputation and in the expectation that the Advisor will have a continuing role in providing advisory services to the Fund.
Conclusion of the Trustees. As a result of this process, the Board, including all of the independent Trustees and assisted by the advice of independent legal counsel, taking into account all of the factors discussed above and the information provided by the Advisor and others in connection with its review and throughout the year, concluded that the management agreement between the Fund and the Advisor is fair and reasonable in light of the services provided and should be renewed.
41
| Additional Information |
Proxy Voting Policies
Descriptions of the principles and policies that the fund’s investment advisor uses in exercising the voting rights associated with the securities purchased and/or held by the fund are available without charge, upon request, by calling 1-800-345-2021 or visiting the “About Us” page of American Century Investments’ website at americancentury.com. A description of the policies is also available on the Securities and Exchange Commission’s website at sec.gov. Information regarding how the investment advisor voted proxies relating to portfolio securities during the most recent 12-month period ended June 30 is available on the “About Us” page at americancentury.com. It is also available at sec.gov.
Quarterly Portfolio Disclosure
The fund files its complete schedule of portfolio holdings with the Securities and Exchange Commission (SEC) for the first and third quarters of each fiscal year on Form N-Q. The fund’s Forms N-Q are available on the SEC’s website at sec.gov, and may be reviewed and copied at the SEC’s Public Reference Room in Washington, DC. Information on the operation of the Public Reference Room may be obtained by calling 1-800-SEC-0330. The fund also makes its complete schedule of portfolio holdings for the most recent quarter of its fiscal year available on its website at americancentury.com and, upon request, by calling 1-800-345-2021.
Other Tax Information
The following information is provided pursuant to provisions of the Internal Revenue Code.
The fund designates $30,952,402 as exempt interest dividends for the fiscal year ended August 31, 2015.
42
| Notes |
43
| Notes |
44
| ||
| Contact Us | americancentury.com | |
| Automated Information Line | 1-800-345-8765 | |
| Investor Services Representative | 1-800-345-2021 or 816-531-5575 | |
| Investors Using Advisors | 1-800-378-9878 | |
| Business, Not-For-Profit, Employer-Sponsored Retirement Plans | 1-800-345-3533 | |
| Banks and Trust Companies, Broker-Dealers, Financial Professionals, Insurance Companies | 1-800-345-6488 | |
| Telecommunications Relay Service for the Deaf | 711 | |
| American Century California Tax-Free and Municipal Funds | ||
Investment Advisor: American Century Investment Management, Inc. Kansas City, Missouri | ||
| This report and the statements it contains are submitted for the general information of our shareholders. The report is not authorized for distribution to prospective investors unless preceded or accompanied by an effective prospectus. | ||
| ©2015 American Century Proprietary Holdings, Inc. All rights reserved. CL-ANN-86898 1510 | ||
ITEM 2. CODE OF ETHICS.
| (a) | The registrant has adopted a Code of Ethics for Senior Financial Officers that applies to the registrant’s principal executive officer, principal financial officer, principal accounting officer, and persons performing similar functions. |
| (b) | No response required. |
| (c) | None. |
| (d) | None. |
| (e) | Not applicable. |
| (f) | The registrant’s Code of Ethics for Senior Financial Officers was filed as Exhibit 12 (a)(1) to American Century Asset Allocation Portfolios, Inc.’s Annual Certified Shareholder Report on Form N-CSR, File No. 811-21591, on September 29, 2005, and is incorporated herein by reference. |
ITEM 3. AUDIT COMMITTEE FINANCIAL EXPERT.
| (a)(1) | The registrant’s board has determined that the registrant has at least one audit committee financial expert serving on its audit committee. |
| (a)(2) | M. Jeannine Strandjord, Stephen E. Yates, Thomas A. Brown and John R. Whitten are the registrant’s designated audit committee financial experts. They are “independent” as defined in Item 3 of Form N-CSR. |
| (a)(3) | Not applicable. |
| (b) | No response required. |
| (c) | No response required. |
| (d) | No response required. |
ITEM 4. PRINCIPAL ACCOUNTANT FEES AND SERVICES.
| (a) | Audit Fees. |
The aggregate fees billed for each of the last two fiscal years for professional services rendered by the principal accountant for the audit of the registrant’s annual financial statements or services that are normally provided by the accountant in connection with statutory and regulatory filings or engagements for those fiscal years were as follows:
FY 2014: $110,736
FY 2015: $113,068
| (b) | Audit-Related Fees. |
The aggregate fees billed in each of the last two fiscal years for assurance and related services by the principal accountant that are reasonably related to the performance of the audit of the registrant’s financial statements and are not reported under paragraph (a) of this Item were as follows:
For services rendered to the registrant:
FY 2014: $0
FY 2015: $0
Fees required to be approved pursuant to paragraph (c)(7)(ii) of Rule 2-01 of Regulation S-X (relating to certain engagements for non-audit services with the registrant’s investment adviser and its affiliates):
FY 2014: $0
FY 2015: $0
| (c) | Tax Fees. |
The aggregate fees billed in each of the last two fiscal years for professional services rendered by the principal accountant for tax compliance, tax advice, and tax planning were as follows:
For services rendered to the registrant:
FY 2014: $0
FY 2015: $0
Fees required to be approved pursuant to paragraph (c)(7)(ii) of Rule 2-01 of Regulation S-X (relating to certain engagements for non-audit services with the registrant’s investment adviser and its affiliates):
FY 2014: $0
FY 2015: $0
| (d) | All Other Fees. |
The aggregate fees billed in each of the last two fiscal years for products and services provided by the principal accountant, other than the services reported in paragraphs (a) through (c) of this Item were as follows:
For services rendered to the registrant:
FY 2014: $0
FY 2015: $0
Fees required to be approved pursuant to paragraph (c)(7)(ii) of Rule 2-01 of Regulation S-X (relating to certain engagements for non-audit services with the registrant’s investment adviser and its affiliates):
FY 2014: $0
FY 2015: $0
| (e)(1) | In accordance with paragraph (c)(7)(i)(A) of Rule 2-01 of Regulation S-X, before the accountant is engaged by the registrant to render audit or non-audit services, the engagement is approved by the registrant’s audit committee. Pursuant to paragraph (c)(7)(ii) of Rule 2-01 of Regulation S-X, the registrant’s audit committee also pre-approves its accountant’s engagements for non-audit services with the registrant’s investment adviser, its parent company, and any entity controlled by, or under common control with the investment adviser that provides ongoing services to the registrant, if the engagement relates directly to the operations and financial reporting of the registrant. |
| (e)(2) | All services described in each of paragraphs (b) through (d) of this Item were pre-approved before the engagement by the registrant’s audit committee pursuant to paragraph (c)(7)(i)(A) of Rule 2-01 of Regulation S-X. Consequently, none of such services were required to be approved by the audit committee pursuant to paragraph (c)(7)(i)(C). |
| (f) | The percentage of hours expended on the principal accountant’s engagement to audit the registrant’s financial statements for the most recent fiscal year that were attributed to work performed by persons other than the principal accountant’s full-time, permanent employees was less than 50%. |
| (g) | The aggregate non-audit fees billed by the registrant’s accountant for services rendered to the registrant, and rendered to the registrant’s investment adviser (not including any sub-adviser whose role is primarily portfolio management and is subcontracted with or overseen by another investment adviser), and any entity controlling, controlled by, or under common control with the adviser that provides ongoing services to the registrant for each of the last two fiscal years of the registrant were as follows: |
FY 2014: $108,075
FY 2015: $313,694
| (h) | The registrant’s investment adviser and accountant have notified the registrant’s audit committee of all non-audit services that were rendered by the registrant’s accountant to the registrant’s investment adviser, its parent company, and any entity controlled by, or under common control with the investment adviser that provides services to the registrant, which services were not required to be pre-approved pursuant to paragraph (c)(7)(ii) of Rule 2-01 of Regulation S-X. The notification provided to the registrant’s audit committee included sufficient details regarding such services to allow the registrant’s audit committee to consider the continuing independence of its principal accountant. |
ITEM 5. AUDIT COMMITTEE OF LISTED REGISTRANTS.
Not applicable.
ITEM 6. INVESTMENTS.
| (a) | The schedule of investments is included as part of the report to stockholders filed under Item 1 of this Form. |
| (b) | Not applicable. |
ITEM 7. DISCLOSURE OF PROXY VOTING POLICIES AND PROCEDURES FOR CLOSED-END MANAGEMENT INVESTMENT COMPANIES.
Not applicable.
ITEM 8. PORTFOLIO MANAGERS OF CLOSED-END MANAGEMENT INVESTMENT COMPANIES.
Not applicable.
ITEM 9. PURCHASES OF EQUITY SECURITIES BY CLOSED-END MANAGEMENT INVESTMENT COMPANY AND AFFILIATED PURCHASERS.
Not applicable.
ITEM 10. SUBMISSION OF MATTERS TO A VOTE OF SECURITY HOLDERS.
During the reporting period, there were no material changes to the procedures by which shareholders may recommend nominees to the registrant’s board.
ITEM 11. CONTROLS AND PROCEDURES.
| (a) | The registrant's principal executive officer and principal financial officer have concluded that the registrant's disclosure controls and procedures (as defined in Rule 30a-3(c) under the Investment Company Act of 1940) are effective based on their evaluation of these controls and procedures as of a date within 90 days of the filing date of this report. |
| (b) | There were no changes in the registrant's internal control over financial reporting (as defined in Rule 30a-3(d) under the Investment Company Act of 1940) that occurred during the registrant's second fiscal quarter of the period covered by this report that have materially affected, or are reasonably likely to materially affect, the registrant's internal control over financial reporting. |
ITEM 12. EXHIBITS.
| (a)(1) | Registrant’s Code of Ethics for Senior Financial Officers, which is the subject of the disclosure required by Item 2 of Form N-CSR, was filed as Exhibit 12(a)(1) to American Century Asset Allocation Portfolios, Inc.’s Certified Shareholder Report on Form N-CSR, File No. 811-21591, on September 29, 2005. |
| (a)(2) | Separate certifications by the registrant’s principal executive officer and principal financial officer, pursuant to Section 302 of the Sarbanes-Oxley Act of 2002 and Rule 30a-2(a) under the Investment Company Act of 1940, are filed and attached hereto as EX-99.CERT. |
| (a)(3) | Not applicable. |
| (b) | A certification by the registrant’s chief executive officer and chief financial officer, pursuant to Section 906 of the Sarbanes-Oxley Act of 2002, is furnished and attached hereto as EX-99.906CERT. |
SIGNATURES
Pursuant to the requirements of the Securities Exchange Act of 1934 and the Investment Company Act of 1940, the registrant has duly caused this report to be signed on its behalf by the undersigned, thereunto duly authorized.
| Registrant: | American Century California Tax-Free and Municipal Funds | |||
| By: | /s/ Jonathan S. Thomas | |||
| Name: | Jonathan S. Thomas | |||
| Title: | President | |||
| Date: | October 29, 2015 | |||
Pursuant to the requirements of the Securities Exchange Act of 1934 and the Investment Company Act of 1940, this report has been signed below by the following persons on behalf of the registrant and in the capacities and on the dates indicated.
| By: | /s/ Jonathan S. Thomas | |
| Name: | Jonathan S. Thomas | |
| Title: | President | |
| (principal executive officer) | ||
| Date: | October 29, 2015 | |
| By: | /s/ C. Jean Wade | |
| Name: | C. Jean Wade | |
| Title: | Vice President, Treasurer, and | |
| Chief Financial Officer | ||
| (principal financial officer) | ||
| Date: | October 29, 2015 | |