UNITED STATES
SECURITIES AND EXCHANGE COMMISSION
Washington, D.C. 20549
FORM N-CSR
CERTIFIED SHAREHOLDER REPORT OF REGISTERED MANAGEMENT
INVESTMENT COMPANIES
| Investment Company Act file number: | 811-03712 | |
| Exact name of registrant as specified in charter: | Prudential Investment Portfolios, Inc. 14 | |
| Address of principal executive offices: | 655 Broad Street, 17th Floor | |
| Newark, New Jersey 07102 | ||
| Name and address of agent for service: | Deborah A. Docs | |
| 655 Broad Street, 17th Floor | ||
| Newark, New Jersey 07102 | ||
| Registrant’s telephone number, including area code: | 800-225-1852 | |
| Date of fiscal year end: | 2/28/2017 | |
| Date of reporting period: | 2/28/2017 | |
Item 1 – Reports to Stockholders

PRUDENTIAL GOVERNMENT INCOME FUND
ANNUAL REPORT
FEBRUARY 28, 2017

To enroll in e-delivery, go to pgiminvestments.com/edelivery
| Objective: Seek high current return |
Highlights
PRUDENTIAL GOVERNMENT INCOME FUND
| • | The Fund benefited from the active management of its duration positioning. |
| • | Sector allocations against the Bloomberg Barclays US Government Bond Index (the Index) added to relative performance, highlighted by an overweight in commercial mortgage-backed securities. |
| • | The Fund was hurt by its curve positioning strategy, as the portfolio was positioned to benefit from a flatter yield curve. |
This report is not authorized for distribution to prospective investors unless preceded or accompanied by a current prospectus.
The views expressed in this report and information about the Fund’s portfolio holdings are for the period covered by this report and are subject to change thereafter.
Mutual funds are distributed by Prudential Investment Management Services LLC (PIMS), member SIPC. PGIM Fixed Income is a unit of PGIM, Inc. (PGIM), a registered investment adviser. PIMS and PGIM are Prudential Financial companies. © 2017 Prudential Financial, Inc. and its related entities. The Prudential logo and the Rock symbol are service marks of Prudential Financial, Inc. and its related entities, registered in many jurisdictions worldwide.
| 2 | Visit our website at pgiminvestments.com |
Letter from the President

Dear Shareholder:
We hope you find the annual report for the Prudential Government Income Fund informative and useful. The report covers performance for the 12-month period ended February 28, 2017. We are proud to announce that Prudential Investments will be known as PGIM® Investments, effective April 3, 2017. Why PGIM? This new name was chosen to further align with the global investment management businesses of Prudential Financial, which rebranded from Prudential Investment Management in January 2016. This new name allows for one brand and reflects our ability and commitment to delivering investment solutions to clients around the globe. Please keep in mind that only the Fund adviser’s name is changing: The name of your Fund and its management and operation will not change.
The reporting period was dominated by headline events. Most prominent was the surprising end to a dramatic US election season, as Donald Trump was elected 45th president of the US. In the wake of the election, investor sentiment was positive for both the economy and the markets in anticipation of a more pro-business environment under a Trump-led administration. Another major headline event was Brexit—the term used to represent Britain’s decision to leave the European Union. This referendum raised further economic and political uncertainty over the future of existing trade and commerce agreements. Meanwhile, the US economy’s recovery strengthened as labor markets tightened.
Equity markets in the US reached new highs as stocks experienced powerful gains after the US election, as equity investors appeared to believe that the new administration would quickly implement measures to boost growth. European stocks generally advanced as the eurozone economy continued to experience slow growth. Most Asian markets gained. In aggregate, emerging markets turned in very strong results.
In a move widely anticipated by the markets, the Federal Reserve raised its federal funds rate by 0.25% during its December 2016 policy meeting. Shortly after the reporting period on March 15, the Federal Reserve decided to hike rates by 0.25%. Additional rate hikes are planned for 2017. Overall, fixed income markets experienced mixed returns, as rising interest rates and concerns over potential inflation jolted bond markets later in the period.
Given the uncertainty in today’s investment environment, we believe that active professional portfolio management offers a potential advantage. Active managers often have the knowledge and flexibility to find the best investment opportunities in the most challenging markets.
Even so, it’s best if investment decisions are based on your long-term goals rather than on short-term market and economic developments. We also encourage you to work with an experienced financial advisor who can help you set goals, determine your tolerance for risk, build a diversified plan that’s right for you, and make adjustments when necessary.
At PGIM Investments, we consider it a great privilege and responsibility to help investors participate in opportunities across global markets while meeting their toughest investment challenges. We’re part of PGIM, the 9th-largest global investment manager with more than $1 trillion in assets under management. This investment expertise allows us to deliver actively managed funds and strategies to meet the needs of investors around the globe.
Thank you for choosing our family of funds.
Sincerely,

Stuart S. Parker, President
Prudential Government Income Fund
April 14, 2017
| Prudential Government Income Fund | 3 |
Your Fund’s Performance (unaudited)
Performance data quoted represent past performance. Past performance does not guarantee future results. The investment return and principal value of an investment will fluctuate, so that an investor’s shares, when redeemed, may be worth more or less than their original cost. Current performance may be lower or higher than the past performance data quoted. An investor may obtain performance data as of the most recent month-end by visiting our website at www.pgiminvestments.com or by calling (800) 225-1852.
| Cumulative Total Returns (Without Sales Charges) as of 2/28/17 | ||||||||||||||
| One Year (%) | Five Years (%) | Ten Years (%) | Since Inception (%) | |||||||||||
| Class A | –0.24 | 7.81 | 43.44 | — | ||||||||||
| Class B | –1.01 | 3.74 | 33.07 | — | ||||||||||
| Class C | –1.01 | 3.85 | 34.17 | — | ||||||||||
| Class Q | N/A | N/A | N/A | –2.39 (8/9/16) | ||||||||||
| Class R | –0.49 | 6.37 | 39.92 | — | ||||||||||
| Class Z | 0.00 | 9.16 | 47.11 | — | ||||||||||
| Bloomberg Barclays US Government Bond Index | –1.15 | 7.24 | 44.99 | — | ||||||||||
| Bloomberg Barclays US Aggregate ex-Credit Index | –0.42 | 8.85 | 46.84 | — | ||||||||||
| Lipper General US Government Funds Average | –0.99 | 5.64 | 38.70 | — | ||||||||||
| Average Annual Total Returns (With Sales Charges) as of 2/28/17 | ||||||||||||||
| One Year (%) | Five Years (%) | Ten Years (%) | Since Inception (%) | |||||||||||
Class A | –4.73 | 0.58 | 3.20 | — | ||||||||||
Class B | –5.92 | 0.55 | 2.90 | — | ||||||||||
Class C | –1.99 | 0.76 | 2.98 | — | ||||||||||
Class Q | N/A | N/A | N/A | N/A (8/9/16) | ||||||||||
Class R | –0.49 | 1.24 | 3.42 | — | ||||||||||
Class Z | 0.00 | 1.77 | 3.94 | | — | | ||||||||
| Bloomberg Barclays US Government Bond Index | –1.15 | 1.41 | 3.78 | — | ||||||||||
| Bloomberg Barclays US Aggregate ex-Credit Index | –0.42 | 1.71 | 3.92 | — | ||||||||||
| Lipper General US Government Funds Average | –0.99 | 1.09 | 3.28 | — | ||||||||||
| 4 | Visit our website at pgiminvestments.com |
| Average Annual Total Returns (Without Sales Charges) as of 2/28/17 | ||||||||
| One Year (%) | Five Years (%) | Ten Years (%) | Since Inception (%) | |||||
Class A | –0.24 | 1.52 | 3.67 | — | ||||
| Class B | –1.01 | 0.74 | 2.90 | — | ||||
Class C | –1.01 | 0.76 | 2.98 | — | ||||
| Class Q | N/A | N/A | N/A | N/A (8/9/16) | ||||
| Class R | –0.49 | 1.24 | 3.42 | — | ||||
Class Z | 0.00 | 1.77 | 3.94 | — | ||||
Growth of a $10,000 Investment
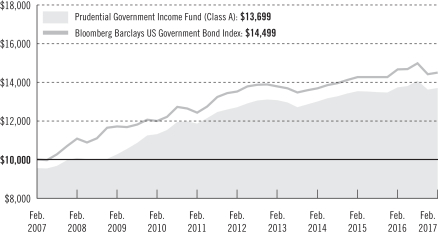
The graph compares a $10,000 investment in the Prudential Government Income Fund (Class A shares) with a similar investment in the Bloomberg Barclays US Government Bond Index by portraying the initial account values at the beginning of the 10-year period for Class A shares (February 28, 2007) and the account values at the end of the current fiscal year (February 28, 2017) as measured on a quarterly basis. For purposes of the graph, and unless otherwise indicated, it has been assumed that (a) the maximum applicable front-end sales charge was deducted from the initial $10,000 investment in Class A shares; (b) all recurring fees (including management fees) were deducted; and (c) all dividends and distributions were reinvested. The line graph provides information for Class A shares only. As indicated in the tables provided earlier, performance for Class B, Class C, Class Q, Class R, and Class Z shares will vary due to the differing charges and expenses applicable to each share class (as indicated in the following paragraphs). Without waiver of fees and/or expense reimbursement, if any, the Fund’s returns would have been lower.
| Prudential Government Income Fund | 5 |
Your Fund’s Performance (continued)
Past performance does not predict future performance. Total returns and the ending account values in the graph include changes in share price and reinvestment of dividends and capital gains distributions in a hypothetical investment for the periods shown. The Fund’s total returns do not reflect the deduction of income taxes on an individual’s investment. Taxes may reduce your actual investment returns on income or gains paid by the Fund or any gains you may realize if you sell your shares.
Source: PGIM Investments LLC and Lipper Inc.
Inception returns are provided for any share class with less than 10 calendar years of returns.
The returns in the tables do not reflect the deduction of taxes that a shareholder would pay on Fund distributions or following the redemption of Fund shares. The average annual total returns take into account applicable sales charges which are described for each share class in the table below.
| Class A | Class B* | Class C | Class Q | Class R | Class Z | |||||||
| Maximum initial sales charge | 4.50% of the public offering price | None | None | None | None | None | ||||||
| Contingent deferred sales charge (CDSC) (as a percentage of the lower of original purchase price or net asset value at redemption) | 1% on sales of $1 million or more made within 12 months of purchase | 5% (Yr. 1) 4% (Yr. 2) 3% (Yr. 3) 2% (Yr. 4) 1% (Yr. 5) 1% (Yr. 6) 0% (Yr. 7) | 1% on sales made within 12 months of purchase | None | None | None | ||||||
| Annual distribution and service (12b-1) fees (shown as a percentage of average daily net assets) | .25% | 1% up to $3 billion, .80% next $1 billion, and .50% over $4 billion | 1% | None | .75% (.50% currently) | None |
*Class B shares are closed to all purchase activity and no additional Class B shares may be purchased or acquired except by exchange from Class B shares of another Fund or through dividend or capital gains reinvestment.
| 6 | Visit our website at pgiminvestments.com |
Benchmark Definitions
Bloomberg Barclays US Government Bond Index—The Bloomberg Barclays US Government Bond Index is an unmanaged index of securities issued or backed by the US Government, its agencies, and instrumentalities with between one and 30 years remaining to maturity. It gives a broad look at how US Government bonds have performed. The cumulative total return for the Index measured from the month-end closest to the inception date through 2/28/17 is –3.66% for Class Q shares. Class Q shares have been in existence for less than one year and have no average annual total return performance information.
Bloomberg Barclays US Aggregate ex-Credit Index—The Bloomberg Barclays US Aggregate ex-Credit Index is an unmanaged index that represents securities that are SEC registered, taxable, and dollar denominated. The Index covers the US investment-grade fixed rate bond market, with index components for government and corporate securities, mortgage pass-through securities, and asset-backed securities. These major sectors are subdivided into more specific indexes that are calculated and reported on a regular basis. The cumulative total return for the Index measured from the month-end closest to the inception date through 2/28/17 is –2.60% for Class Q shares. Class Q shares have been in existence for less than one year and have no average annual total return performance information.
Lipper General US Government Funds Average—The Lipper General US Government Funds Average (Lipper Average) is based on the average return of all funds in the Lipper General US Government Funds category for the periods noted. Funds in the Lipper Average invest primarily in US government and agency issues. The cumulative total return for the Lipper Average measured from the month-end closest to the inception date through 2/28/17 is –3.36% for Class Q shares. Class Q shares have been in existence for less than one year and have no average annual total return performance information.
Investors cannot invest directly in an index or average. The returns for the Indexes would be lower if they included the effects of sales charges, operating expenses of a mutual fund, or taxes. Returns for the Lipper Average reflect the deduction of operating expenses, but not sales charges or taxes.
| Credit Quality expressed as a percentage of total investments as of 2/28/17 (%) | ||||
| AAA | 99.9 | |||
| A | 0.4 | |||
| Cash/Cash Equivalents | –0.3 | |||
| Total Investments | 100.0 | |||
Source: PGIM Fixed Income
Credit ratings reflect the highest rating assigned by a nationally recognized statistical rating organization (NRSRO) such as Moody’s Investor Service, Inc. (Moody’s), Standard & Poor’s (S&P), or Fitch, Inc. (Fitch). Credit ratings reflect the common nomenclature used by both S&P and Fitch. Where applicable, ratings are converted to the comparable S&P/Fitch rating tier statistical rating organizations and are widely used. The Not Rated category consists of securities that have not been rated by a NRSRO and may include derivative instruments that could have a negative value. Credit ratings are subject to change. Values may not sum to 100.0% due to rounding.
| Prudential Government Income Fund | 7 |
Your Fund’s Performance (continued)
| Distributions and Yields as of 2/28/17 | ||||||
| Total Distributions Paid for 12 Months ($) | SEC 30-Day Subsidized Yield* (%) | SEC 30-Day Unsubsidized Yield** (%) | ||||
| Class A | 0.15 | 1.20 | 1.20 | |||
| Class B | 0.07 | 0.51 | 0.51 | |||
| Class C | 0.08 | 0.50 | 0.50 | |||
| Class Q | 0.08 | 1.66 | 1.66 | |||
| Class R | 0.13 | 1.00 | 0.76 | |||
| Class Z | 0.17 | 1.51 | 1.51 | |||
*SEC 30-Day Subsidized Yield (%)—A standardized yield calculation created by the Securities and Exchange Commission, it reflects the income earned during a 30-day period, after the deduction of the Fund’s net expenses (net of any expense waivers or reimbursements).
**SEC 30-Day Unsubsidized Yield (%)—A standardized yield calculation created by the Securities and Exchange Commission, it reflects the income earned during a 30-day period, after the deduction of the Fund’s gross expenses.
| 8 | Visit our website at pgiminvestments.com |
Strategy and Performance Overview
How did the Fund perform?
The Prudential Government Income Fund’s Class A shares returned -0.24% during the 12-month reporting period that ended February 28, 2017. However, the Fund outperformed the -1.15% return of the Bloomberg Barclays US Aggregate ex-Credit Index and the -0.42% return of the Lipper General US Government Funds Average neither of which include the effect of mutual fund operating expenses. In addition, the Fund outpaced the Bloomberg Barclays US Government Bond Index, which declined -0.99% during the period.
What were market conditions?
| • | In the second quarter of 2016, interest rates in developed markets followed a gradual trajectory downward before accelerating to historic lows after the UK’s surprise vote in June to leave the European Union (commonly known as Brexit). In the US, the two-year to 10-year segment of the Treasury yield curve flattened. US agency mortgage-backed securities (MBS) slightly underperformed Treasuries, while commercial mortgage-backed securities (CMBS) outpaced Treasures. |
| • | Investors anxiously awaited central bank guidance for much of the third quarter, with global yields remaining relatively range-bound. The Federal Reserve (Fed) kept the target federal funds rate unchanged but lowered its dot plot trajectory, which provoked flattening along the US Treasury yield curve. (The dot plot shows the projections of the 16 members of the Fed’s interest rate setting body. Each dot represents a member’s view on where the federal funds rate should be at the end of various calendar years.) Agency MBS outperformed Treasuries as credit spreads (yield differentials) tightened. In general, MBS performance was driven by strong demand, including outsized buying by banks and non-US investors. MBS prepayments rose, leading the Fed to increase its MBS reinvestments. CMBS outperformed Treasuries during the third quarter. |
| • | The government bond markets were influenced during the fourth quarter by expectations for expanded fiscal policies in the US, signs of policy restraint or tightening from major central banks, and firming inflation prospects as oil prices rose. After Donald Trump was elected president in the November election, Treasury yields surged and the Treasury yield curve steepened. In December, the Fed raised the target federal funds rate by 25 basis points to a range between 0.50% and 0.75%. A basis point is 1/100th of a percent. Most fixed income sectors, including agency MBS and CMBS, outperformed Treasuries during the fourth quarter. |
| • | In January, Treasury performance was roughly flat. Two-year notes underperformed slightly as their yields increased by two basis points, while thirty-year bond yields were unchanged. Two-year yields underperformed as investors were hung up on comments by Fed Chairman Yellen implying multiple hikes were appropriate in 2017 as the US economy continues to grow. Yields were initially lower in the early part of the month and then began to sell-off following Yellen’s testimony. |
| Prudential Government Income Fund | 9 |
Strategy and Performance Overview (continued)
| • | During February, Treasuries were mixed as the curve flattened. Two year notes underperformed on the curve as yields increased by six basis points. Thirty year bonds outperformed on the curve as its yield decreased by seven basis points. The major driver of the selloff in the front end of the curve was a repricing of monetary policy tightening. Members of the Federal Reserve were hawkish and steered the market to price a higher probability of a tightening of monetary policy at its next meeting on March 14-15. |
What worked?
| • | The Fund benefited from the active management of its duration positioning. (Duration measures the approximate price volatility of a bond portfolio for a given change in interest rates.) During the reporting period, the Fund was positioned between a short duration position of 0.2 years and a long duration position of 0.6 years. At period end, it held a long duration position of 0.1 years. |
| • | Sector allocations added to relative performance, highlighted by an overweight in CMBS. |
| • | Security selection bolstered returns, with holdings of interest rate swaps and collateralized loan obligations contributing most positively. (For a complete list of holdings, refer to the Portfolio of Investments section of this report.) |
What didn’t work?
| • | The Fund was hurt by its curve positioning strategy, as the portfolio was positioned to benefit from a flatter yield curve. A curve positioning strategy attempts to gain from changes in the Treasury yield curve. |
| • | Individual investment selection in CMBS also detracted from the Fund’s returns. |
Did the Fund use derivatives and how did they affect performance?
| • | The Fund held futures contracts on US Treasury securities and interest rate swaps to help manage the portfolio’s duration and yield curve exposure and to reduce its sensitivity to changes in the levels of interest rates. Overall, this strategy had a positive impact on performance during the reporting period. |
Current outlook
| • | PGIM Fixed Income believes 2017 could be one of the busiest in several years in terms of the US monetary policy agenda. Comments from Fed chair Janet Yellen and other Fed officials have led the markets to reassess the path for Fed rate hikes. At the end of the period, the markets expected the Fed to raise the target federal funds rate at its March policy meeting. |
| • | In the MBS market, investors are trying to anticipate when the Fed might begin tapering its balance sheet, rallying on perceived delays due to the lack of a clear plan and selling |
| 10 | Visit our website at pgiminvestments.com |
off on expectations of a Fed rate hike in March. The interest rate on a 30-year mortgage ended the period at 4.25%. |
| • | Within CMBS, PGIM Fixed Income continues to find value in high-quality securities among new-issue conduit deals. |
| Prudential Government Income Fund | 11 |
Fees and Expenses (unaudited)
As a shareholder of the Fund, you incur two types of costs: (1) transaction costs, including sales charges (loads) on purchase payments and redemptions, as applicable, and (2) ongoing costs, including management fees, distribution and/or service (12b-1) fees, and other Fund expenses, as applicable. This example is intended to help you understand your ongoing costs (in dollars) of investing in the Fund and to compare these costs with the ongoing costs of investing in other mutual funds.
The example is based on an investment of $1,000 held through the six-month period ended February 28, 2017. The example is for illustrative purposes only; you should consult the Prospectus for information on initial and subsequent minimum investment requirements.
Actual Expenses
The first line for each share class in the table on the following page provides information about actual account values and actual expenses. You may use the information on this line, together with the amount you invested, to estimate the expenses that you paid over the period. Simply divide your account value by $1,000 (for example, an $8,600 account value ÷ $1,000 = 8.6), then multiply the result by the number on the first line under the heading “Expenses Paid During the Six-Month Period” to estimate the expenses you paid on your account during this period.
Hypothetical Example for Comparison Purposes
The second line for each share class in the table on the following page provides information about hypothetical account values and hypothetical expenses based on the Fund’s actual expense ratio and an assumed rate of return of 5% per year before expenses, which is not the Fund’s actual return. The hypothetical account values and expenses should not be used to estimate the actual ending account balance or expenses you paid for the period. You may use this information to compare the ongoing costs of investing in the Fund and other funds. To do so, compare this 5% hypothetical example with the 5% hypothetical examples that appear in the shareholder reports of the other funds.
The Fund’s transfer agent may charge additional fees to holders of certain accounts that are not included in the expenses shown in the table on the following page. These fees apply to individual retirement accounts (IRAs) and Section 403(b) accounts. As of the close of the six-month period covered by the table, IRA fees included an annual maintenance fee of $15 per account (subject to a maximum annual maintenance fee of $25 for all accounts held by the same shareholder). Section 403(b) accounts are charged an annual $25 fiduciary maintenance fee. Some of the fees may vary in amount, or may be waived, based on your total account balance or the number of PGIM Investments funds, including the Fund, that you own. You should consider the additional fees that were charged to your
| 12 | Visit our website at pgiminvestments.com |
Fund account over the six-month period when you estimate the total ongoing expenses paid over the period and the impact of these fees on your ending account value, as these additional expenses are not reflected in the information provided in the expense table. Additional fees have the effect of reducing investment returns.
Please note that the expenses shown in the table are meant to highlight your ongoing costs only and do not reflect any transactional costs such as sales charges (loads). Therefore, the second line for each share class in the table is useful in comparing ongoing costs only and will not help you determine the relative total costs of owning different funds. In addition, if these transactional costs were included, your costs would have been higher.
| Prudential Government Income Fund | Beginning Account Value September 1, 2016 | Ending Account February 28, 2017 | Annualized Expense Ratio Based on the Six-Month Period | Expenses Paid During the Six-Month Period* | ||||||||||||||
| Class A | Actual | $ | 1,000.00 | $ | 973.20 | 1.04 | % | $ | 5.09 | |||||||||
| Hypothetical | $ | 1,000.00 | $ | 1,019.64 | 1.04 | % | $ | 5.21 | ||||||||||
| Class B | Actual | $ | 1,000.00 | $ | 969.60 | 1.79 | % | $ | 8.74 | |||||||||
| Hypothetical | $ | 1,000.00 | $ | 1,015.92 | 1.79 | % | $ | 8.95 | ||||||||||
| Class C | Actual | $ | 1,000.00 | $ | 969.60 | 1.79 | % | $ | 8.74 | |||||||||
| Hypothetical | $ | 1,000.00 | $ | 1,015.92 | 1.79 | % | $ | 8.95 | ||||||||||
| Class Q | Actual | $ | 1,000.00 | $ | 975.20 | 0.62 | % | $ | 3.04 | |||||||||
| Hypothetical | $ | 1,000.00 | $ | 1,021.72 | 0.62 | % | $ | 3.11 | ||||||||||
| Class R | Actual | $ | 1,000.00 | $ | 972.00 | 1.29 | % | $ | 6.31 | |||||||||
| Hypothetical | $ | 1,000.00 | $ | 1,018.40 | 1.29 | % | $ | 6.46 | ||||||||||
| Class Z | Actual | $ | 1,000.00 | $ | 974.40 | 0.79 | % | $ | 3.87 | |||||||||
| Hypothetical | $ | 1,000.00 | $ | 1,020.88 | 0.79 | % | $ | 3.96 | ||||||||||
* Fund expenses (net of fee waivers or subsidies, if any) for each share class are equal to the annualized expense ratio for
| each | share class (provided in the table), multiplied by the average account value over the period, multiplied by the 181 |
| days | in the six-month period ended February 28, 2017, and divided by the 365 days in the Fund’s fiscal year ended |
| February | 28, 2017 (to reflect the six-month period). Expenses presented in the table include the expenses of any |
| underlying | portfolios in which the Fund may invest. |
| Prudential Government Income Fund | 13 |
Fees and Expenses (continued)
The Fund’s annualized expense ratios for the 12-month period ended February 28, 2017, are as follows:
| Class | Gross Operating Expenses (%) | Net Operating Expenses (%) | ||
| A | 1.02 | 1.02 | ||
| B | 1.76 | 1.76 | ||
| C | 1.77 | 1.77 | ||
| Q | 0.62 | 0.62 | ||
| R | 1.52 | 1.27 | ||
| Z | 0.77 | 0.77 |
Net operating expenses shown above reflect fee waivers and/or expense reimbursements. Additional information on Fund expenses and any fee waivers and/or expense reimbursements can be found in the “Financial Highlights” tables in this report and in the Notes to the Financial Statements in this report.
| 14 | Visit our website at pgiminvestments.com |
Portfolio of Investments
as of February 28, 2017
| Description | Interest Rate | Maturity Date | Principal Amount (000)# | Value (Note 1) | ||||||||||||
LONG-TERM INVESTMENTS 100.1% | ||||||||||||||||
ASSET-BACKED SECURITIES 6.4% | ||||||||||||||||
Collateralized Loan Obligations 6.4% | ||||||||||||||||
Battalion CLO Ltd., Series 2014-7A, Class A1, 144A | 2.623 | %(a) | 10/17/26 | 1,250 | $ | 1,253,150 | ||||||||||
Benefit Street Partners CLO Ltd., Series 2015-VIIA, Class A1A, 144A | 2.554 | (a) | 07/18/27 | 250 | 251,326 | |||||||||||
BlueMountain CLO Ltd., Series 2015-1A, Class A1R, 144A | 2.352 | (a) | 04/13/27 | 1,250 | 1,250,502 | |||||||||||
Brookside Mill CLO Ltd., Series 2013-1A, Class A1, 144A | 2.173 | (a) | 04/17/25 | 500 | 500,390 | |||||||||||
Carlyle Global Market Strategies CLO Ltd., Series 2014-2A, Class AR, 144A | 2.289 | (a) | 05/15/25 | 1,000 | 1,004,362 | |||||||||||
Catamaran CLO Ltd., Series 2015-1A, Class A, 144A | 2.591 | (a) | 04/22/27 | 1,000 | 1,001,518 | |||||||||||
Eaton Vance CLO Ltd., Series 2014-1A, Class AR, 144A | 2.232 | (a) | 07/15/26 | 4,500 | 4,508,055 | |||||||||||
Flagship CLO Ltd., Series 2014-8A, Class AR, 144A | 2.085 | (a) | 01/16/26 | 4,500 | 4,500,076 | |||||||||||
Jackson Mill CLO Ltd., Series 2015-1A, Class A, 144A | 2.563 | (a) | 04/15/27 | 1,750 | 1,752,567 | |||||||||||
KVK CLO Ltd., Series 2014-1A, Class A1R, 144A^ | 2.339 | (a) | 05/15/26 | 5,000 | 4,997,500 | |||||||||||
Limerock CLO LLC, Series 2014-3A, Class A1R, 144A | 2.570 | (a) | 10/20/26 | 2,450 | 2,454,386 | |||||||||||
Magnetite Ltd., Series 2014-9A, Class A1, 144A(b) | 2.458 | (a) | 07/25/26 | 3,465 | 3,475,590 | |||||||||||
OZLM Funding Ltd., Series 2012-1A, Class A1R, 144A | 2.561 | (a) | 07/22/27 | 1,000 | 1,000,239 | |||||||||||
Palmer Square CLO Ltd., Series 2015-1A, Class A1, 144A | 2.552 | (a) | 05/21/27 | 750 | 753,371 | |||||||||||
Shackleton CLO Ltd., Series 2014-5A, Class A, 144A | 2.534 | (a) | 05/07/26 | 1,250 | 1,250,257 | |||||||||||
Sound Point CLO Ltd., Series 2015-2A, Class A, 144A | 2.550 | (a) | 07/20/27 | 1,250 | 1,254,825 | |||||||||||
|
| |||||||||||||||
| 31,208,114 | ||||||||||||||||
Non-Residential Mortgage-Backed Security | ||||||||||||||||
Small Business Administration Participation Certificates, Series 1998-20I, Class 1 | 6.000 | 09/01/18 | 212 | 215,303 | ||||||||||||
|
| |||||||||||||||
TOTAL ASSET-BACKED SECURITIES | 31,423,417 | |||||||||||||||
|
| |||||||||||||||
COMMERCIAL MORTGAGE-BACKED SECURITIES 15.8% |
| |||||||||||||||
Citigroup Commercial Mortgage Trust, | 3.515 | 09/10/58 | 2,500 | 2,561,348 | ||||||||||||
Fannie Mae-Aces, | 2.377 | 05/25/22 | 3,250 | 3,217,548 | ||||||||||||
Series 2012-M2, Class A2 | 2.717 | 02/25/22 | 270 | 272,155 | ||||||||||||
Series 2014-M2, Class A2 | 3.513 | (a) | 12/25/23 | 3,950 | 4,109,892 | |||||||||||
Series 2015-M1, Class AB2 | 2.465 | 09/25/24 | 999 | 969,564 | ||||||||||||
Series 2015-M17, Class A2 | 2.940 | (a) | 11/25/25 | 2,900 | 2,910,457 | |||||||||||
Series 2016-M11, Class A2 | 2.369 | (a) | 07/25/26 | 2,600 | 2,478,317 | |||||||||||
Series 2016-M13, Class A2 | 2.476 | (a) | 09/25/26 | 4,400 | 4,237,315 | |||||||||||
See Notes to Financial Statements.
| Prudential Government Income Fund | 15 |
Portfolio of Investments (continued)
as of February 28, 2017
| Description | Interest Rate | Maturity Date | Principal Amount (000)# | Value (Note 1) | ||||||||||||
COMMERCIAL MORTGAGE-BACKED SECURITIES (Continued) |
| |||||||||||||||
FHLMC Multifamily Structured Pass-Through Certificates, | 5.085 | % | 03/25/19 | 500 | $ | 527,589 | ||||||||||
Series K008, Class X1, IO | 1.619 | (a) | 06/25/20 | 26,623 | 1,028,571 | |||||||||||
Series K019, Class X1, IO | 1.691 | (a) | 03/25/22 | 25,783 | 1,793,182 | |||||||||||
Series K020, Class X1, IO | 1.439 | (a) | 05/25/22 | 14,560 | 891,574 | |||||||||||
Series K021, Class X1, IO | 1.478 | (a) | 06/25/22 | 15,808 | 1,012,880 | |||||||||||
Series K025, Class X1, IO | 0.881 | (a) | 10/25/22 | 40,636 | 1,637,829 | |||||||||||
Series K034, Class A2 | 3.531 | (a) | 07/25/23 | 7,800 | 8,261,719 | |||||||||||
Series K038, Class A2 | 3.389 | 03/25/24 | 6,800 | 7,137,021 | ||||||||||||
Series K041, Class A2 | 3.171 | 10/25/24 | 6,000 | 6,199,198 | ||||||||||||
Series K044, Class A2 | 2.811 | 01/25/25 | 5,000 | 5,028,664 | ||||||||||||
Series K045, Class A2 | 3.023 | 01/25/25 | 6,000 | 6,118,360 | ||||||||||||
Series K060, Class AM | 3.300 | 10/25/26 | 3,860 | 3,939,936 | ||||||||||||
Series K151, Class A3 | 3.511 | 04/25/30 | 900 | 925,597 | ||||||||||||
Series K710, Class X1, IO | 1.757 | (a) | 05/25/19 | 12,504 | 384,777 | |||||||||||
Series K711, Class X1, IO | 1.691 | (a) | 07/25/19 | 12,298 | 386,551 | |||||||||||
Series KS03, Class A4 | 3.161 | (a) | 05/25/25 | 4,000 | 4,047,697 | |||||||||||
JPMBB Commercial Mortgage Securities Trust, | 3.515 | 03/15/49 | 2,500 | 2,558,700 | ||||||||||||
JPMorgan Chase Commercial Mortgage Securities Trust, | ||||||||||||||||
Series 2006-LDP7, Class AM | 5.928 | (a) | 04/17/45 | 52 | 52,043 | |||||||||||
Series 2013-LC11, Class A4 | 2.694 | 04/15/46 | 1,000 | 1,006,846 | ||||||||||||
Morgan Stanley Bank of America Merrill Lynch Trust, | 2.834 | 05/15/46 | 1,000 | 1,003,554 | ||||||||||||
Wells Fargo Commercial Mortgage Trust, | 3.572 | 09/15/58 | 2,500 | 2,572,558 | ||||||||||||
|
| |||||||||||||||
TOTAL COMMERCIAL MORTGAGE-BACKED SECURITIES |
| 77,271,442 | ||||||||||||||
|
| |||||||||||||||
CORPORATE BONDS 1.0% | ||||||||||||||||
Diversified Financial Services | ||||||||||||||||
Private Export Funding Corp., U.S. Gov’t. Gtd. Notes | 3.550 | 01/15/24 | 2,085 | 2,228,294 | ||||||||||||
Private Export Funding Corp., U.S. Gov’t. Gtd. Notes | 4.300 | 12/15/21 | 2,660 | 2,916,083 | ||||||||||||
|
| |||||||||||||||
TOTAL CORPORATE BONDS |
| 5,144,377 | ||||||||||||||
|
| |||||||||||||||
NON-CORPORATE FOREIGN AGENCY 0.1% | ||||||||||||||||
CDP Financial, Inc. (Canada), Sr. Unsec’d. Notes, 144A (cost $468,647) | 3.150 | 07/24/24 | 470 | 478,910 | ||||||||||||
|
| |||||||||||||||
See Notes to Financial Statements.
| 16 |
| Description | Interest Rate | Maturity Date | Principal Amount (000)# | Value (Note 1) | ||||||||||||
MUNICIPAL BONDS 0.6% | ||||||||||||||||
California 0.1% | ||||||||||||||||
California Educational Facilities Authority, Revenue Bonds, BABs | 5.000 | % | 06/01/46 | 275 | $ | 354,926 | ||||||||||
Pennsylvania 0.2% | ||||||||||||||||
Pennsylvania Turnpike Commission, Revenue Bonds, BABs | 5.000 | 12/01/46 | 1,100 | 1,208,460 | ||||||||||||
Texas 0.2% | ||||||||||||||||
University of Texas System (The), Revenue Bonds, BABs | 5.000 | 08/15/47 | 610 | 778,128 | ||||||||||||
Washington 0.1% | ||||||||||||||||
Central Puget Sound Regional Transit Authority, Revenue Bonds, BABs | 5.000 | 11/01/46 | 400 | 511,932 | ||||||||||||
|
| |||||||||||||||
TOTAL MUNICIPAL BONDS |
| 2,853,446 | ||||||||||||||
|
| |||||||||||||||
RESIDENTIAL MORTGAGE-BACKED SECURITIES 0.2% |
| |||||||||||||||
Federal Home Loan Mortgage Corp., REMICS, | ||||||||||||||||
Series 2002-2496, Class PM | 5.500 | 09/15/17 | 82 | 82,373 | ||||||||||||
Series 2002-2501, Class MC | 5.500 | 09/15/17 | 1 | 1,074 | ||||||||||||
Series 2002-2513, Class HC | 5.000 | 10/15/17 | 197 | 197,857 | ||||||||||||
Federal National Mortgage Assoc., REMICS, Series 2002-57, Class ND | 5.500 | 09/25/17 | 5 | 4,897 | ||||||||||||
Merrill Lynch Mortgage Investors Trust, Series 2003-E, Class A1 | 1.398 | (a) | 10/25/28 | 91 | 86,965 | |||||||||||
Structured Adjustable Rate Mortgage Loan Trust, Series 2004-1, Class 4A3 | 3.370 | (a) | 02/25/34 | 423 | 424,999 | |||||||||||
|
| |||||||||||||||
TOTAL RESIDENTIAL MORTGAGE-BACKED SECURITIES |
| 798,165 | ||||||||||||||
|
| |||||||||||||||
U.S. GOVERNMENT AGENCY OBLIGATIONS 43.2% |
| |||||||||||||||
Federal Home Loan Banks | 1.000 | 12/19/17 | 4,400 | 4,404,413 | ||||||||||||
Federal Home Loan Mortgage Corp. | 2.500 | TBA | 3,500 | 3,496,719 | ||||||||||||
Federal Home Loan Mortgage Corp. | 2.500 | 03/01/30 | 1,579 | 1,585,302 | ||||||||||||
Federal Home Loan Mortgage Corp. | 3.000 | TBA | 7,000 | 6,947,112 | ||||||||||||
Federal Home Loan Mortgage Corp. | 3.000 | 10/01/28 | 339 | 349,352 | ||||||||||||
Federal Home Loan Mortgage Corp. | 3.000 | 06/01/29 | 968 | 997,614 | ||||||||||||
Federal Home Loan Mortgage Corp. | 3.500 | 08/01/26 | 601 | 630,313 | ||||||||||||
Federal Home Loan Mortgage Corp. | 3.500 | 01/01/27 | 321 | 336,258 | ||||||||||||
Federal Home Loan Mortgage Corp. | 3.500 | 06/01/42 | 2,233 | 2,301,089 | ||||||||||||
Federal Home Loan Mortgage Corp. | 4.000 | TBA | 6,250 | 6,569,003 | ||||||||||||
Federal Home Loan Mortgage Corp. | 4.000 | 06/01/26 | 215 | 226,632 | ||||||||||||
See Notes to Financial Statements.
| Prudential Government Income Fund | 17 |
Portfolio of Investments (continued)
as of February 28, 2017
| Description | Interest Rate | Maturity Date | Principal Amount (000)# | Value (Note 1) | ||||||||||||
U.S. GOVERNMENT AGENCY OBLIGATIONS (Continued) |
| |||||||||||||||
Federal Home Loan Mortgage Corp. | 4.000 | % | 09/01/26 | 542 | $ | 571,350 | ||||||||||
Federal Home Loan Mortgage Corp. | 4.000 | 11/01/39 | 1,590 | 1,678,150 | ||||||||||||
Federal Home Loan Mortgage Corp. | 4.000 | 09/01/40 | 1,104 | 1,165,545 | ||||||||||||
Federal Home Loan Mortgage Corp. | 4.000 | 12/01/40 | 601 | 634,886 | ||||||||||||
Federal Home Loan Mortgage Corp. | 4.000 | 12/01/40 | 840 | 887,208 | ||||||||||||
Federal Home Loan Mortgage Corp. | 4.000 | 04/01/42 | 2,367 | 2,499,694 | ||||||||||||
Federal Home Loan Mortgage Corp. | 4.000 | 10/01/45 | 784 | 825,092 | ||||||||||||
Federal Home Loan Mortgage Corp. | 4.500 | TBA | 3,500 | 3,758,250 | ||||||||||||
Federal Home Loan Mortgage Corp. | 4.500 | 09/01/39 | 2,472 | 2,665,479 | ||||||||||||
Federal Home Loan Mortgage Corp. | 5.000 | 06/01/33 | 1,156 | 1,275,446 | ||||||||||||
Federal Home Loan Mortgage Corp. | 5.000 | 03/01/34 | 106 | 116,320 | ||||||||||||
Federal Home Loan Mortgage Corp. | 5.000 | 05/01/34 | 1,436 | 1,573,190 | ||||||||||||
Federal Home Loan Mortgage Corp. | 5.000 | 05/01/34 | 123 | 135,050 | ||||||||||||
Federal Home Loan Mortgage Corp. | 5.500 | 05/01/37 | 184 | 203,936 | ||||||||||||
Federal Home Loan Mortgage Corp. | 5.500 | 01/01/38 | 156 | 173,695 | ||||||||||||
Federal Home Loan Mortgage Corp. | 6.000 | 08/01/32 | 47 | 52,739 | ||||||||||||
Federal Home Loan Mortgage Corp. | 6.000 | 12/01/33 | 89 | 102,874 | ||||||||||||
Federal Home Loan Mortgage Corp. | 6.000 | 09/01/34 | 155 | 175,262 | ||||||||||||
Federal Home Loan Mortgage Corp. | 6.500 | 09/01/32 | 238 | 267,282 | ||||||||||||
Federal Home Loan Mortgage Corp. | 6.500 | 09/01/32 | 72 | 81,222 | ||||||||||||
Federal Home Loan Mortgage Corp. | 7.000 | 09/01/32 | 34 | 35,316 | ||||||||||||
Federal Home Loan Mortgage Corp. | 8.000 | 03/01/22 | 19 | 19,050 | ||||||||||||
Federal Home Loan Mortgage Corp. | 8.000 | 08/01/22 | 4 | 3,632 | ||||||||||||
Federal Home Loan Mortgage Corp. | 8.500 | 05/01/17 | — | (c) | 17 | |||||||||||
Federal Home Loan Mortgage Corp. | 8.500 | 05/01/17 | — | (c) | 371 | |||||||||||
Federal Home Loan Mortgage Corp. | 8.500 | 06/01/17 | — | (c) | 31 | |||||||||||
Federal Home Loan Mortgage Corp. | 8.500 | 07/01/17 | — | (c) | 29 | |||||||||||
Federal Home Loan Mortgage Corp. | 8.500 | 09/01/17 | 2 | 1,564 | ||||||||||||
Federal Home Loan Mortgage Corp. | 8.500 | 06/01/18 | — | (c) | 43 | |||||||||||
Federal Home Loan Mortgage Corp. | 8.500 | 09/01/19 | 3 | 2,712 | ||||||||||||
Federal Home Loan Mortgage Corp. | 9.000 | 01/01/20 | 6 | 5,592 | ||||||||||||
Federal National Mortgage Assoc. | 1.000 | 10/24/19 | 5,000 | 4,934,095 | ||||||||||||
Federal National Mortgage Assoc. | 2.000 | 08/01/31 | 777 | 756,999 | ||||||||||||
Federal National Mortgage Assoc. | 2.500 | TBA | 1,500 | 1,501,875 | ||||||||||||
Federal National Mortgage Assoc. | 2.500 | TBA | 2,500 | 2,378,279 | ||||||||||||
Federal National Mortgage Assoc. | 3.000 | TBA | 2,500 | 2,566,015 | ||||||||||||
Federal National Mortgage Assoc. | 3.000 | TBA | 11,000 | 10,926,093 | ||||||||||||
Federal National Mortgage Assoc. | 3.000 | 01/01/27 | 1,079 | 1,113,694 | ||||||||||||
Federal National Mortgage Assoc. | 3.000 | 08/01/28 | 1,881 | 1,936,556 | ||||||||||||
Federal National Mortgage Assoc. | 3.000 | 02/01/31 | 4,093 | 4,213,428 | ||||||||||||
Federal National Mortgage Assoc. | 3.000 | 11/01/36 | 1,963 | 1,986,319 | ||||||||||||
Federal National Mortgage Assoc. | 3.000 | 12/01/42 | 1,602 | 1,597,472 | ||||||||||||
Federal National Mortgage Assoc. | 3.000 | 07/01/43 | 3,175 | 3,163,040 | ||||||||||||
See Notes to Financial Statements.
| 18 |
| Description | Interest Rate | Maturity Date | Principal Amount (000)# | Value (Note 1) | ||||||||||||
U.S. GOVERNMENT AGENCY OBLIGATIONS (Continued) |
| |||||||||||||||
Federal National Mortgage Assoc. | 3.500 | % | TBA | 20,000 | $ | 20,501,562 | ||||||||||
Federal National Mortgage Assoc. | 3.500 | 09/01/26 | 374 | 390,755 | ||||||||||||
Federal National Mortgage Assoc. | 3.500 | 03/01/27 | 954 | 997,429 | ||||||||||||
Federal National Mortgage Assoc. | 3.500 | 10/01/41 | 3,507 | 3,614,822 | ||||||||||||
Federal National Mortgage Assoc. | 3.500 | 12/01/41 | 939 | 967,631 | ||||||||||||
Federal National Mortgage Assoc. | 3.500 | 03/01/42 | 833 | 858,203 | ||||||||||||
Federal National Mortgage Assoc. | 3.500 | 05/01/42 | 4,296 | 4,426,498 | ||||||||||||
Federal National Mortgage Assoc. | 4.000 | TBA | 750 | 788,209 | ||||||||||||
Federal National Mortgage Assoc. | 4.000 | TBA | 3,000 | 3,148,945 | ||||||||||||
Federal National Mortgage Assoc. | 4.000 | 09/01/40 | 1,807 | 1,903,934 | ||||||||||||
Federal National Mortgage Assoc. | 4.000 | 07/01/42 | 723 | 762,310 | ||||||||||||
Federal National Mortgage Assoc. | 4.000 | 09/01/44 | 2,048 | 2,154,103 | ||||||||||||
Federal National Mortgage Assoc. | 4.500 | 01/01/20 | 63 | 65,117 | ||||||||||||
Federal National Mortgage Assoc. | 4.500 | 04/01/41 | 2,071 | 2,231,076 | ||||||||||||
Federal National Mortgage Assoc. | 5.000 | 07/01/18 | 10 | 9,740 | ||||||||||||
Federal National Mortgage Assoc. | 5.000 | 08/01/18 | 41 | 42,146 | ||||||||||||
Federal National Mortgage Assoc. | 5.000 | 01/01/19 | 220 | 226,359 | ||||||||||||
Federal National Mortgage Assoc. | 5.000 | 02/01/19 | 191 | 195,699 | ||||||||||||
Federal National Mortgage Assoc. | 5.000 | 11/01/19 | 72 | 74,948 | ||||||||||||
Federal National Mortgage Assoc. | 5.000 | 12/01/31 | 75 | 82,053 | ||||||||||||
Federal National Mortgage Assoc. | 5.000 | 03/01/34 | 590 | 647,897 | ||||||||||||
Federal National Mortgage Assoc. | 5.000 | 07/01/35 | 240 | 263,527 | ||||||||||||
Federal National Mortgage Assoc. | 5.000 | 09/01/35 | 129 | 142,954 | ||||||||||||
Federal National Mortgage Assoc. | 5.000 | 11/01/35 | 127 | 140,122 | ||||||||||||
Federal National Mortgage Assoc. | 5.000 | 05/01/36 | 95 | 104,854 | ||||||||||||
Federal National Mortgage Assoc. | 5.500 | 10/01/18 | 57 | 58,435 | ||||||||||||
Federal National Mortgage Assoc. | 5.500 | 10/01/18 | 63 | 64,000 | ||||||||||||
Federal National Mortgage Assoc. | 5.500 | 11/01/18 | 41 | 41,862 | ||||||||||||
Federal National Mortgage Assoc. | 5.500 | 02/01/34 | 516 | 580,724 | ||||||||||||
Federal National Mortgage Assoc. | 5.500 | 09/01/34 | 883 | 994,442 | ||||||||||||
Federal National Mortgage Assoc. | 5.500 | 02/01/35 | 796 | 902,535 | ||||||||||||
Federal National Mortgage Assoc. | 5.500 | 06/01/35 | 297 | 331,497 | ||||||||||||
Federal National Mortgage Assoc. | 5.500 | 06/01/35 | 284 | 317,667 | ||||||||||||
Federal National Mortgage Assoc. | 5.500 | 09/01/35 | 567 | 631,018 | ||||||||||||
Federal National Mortgage Assoc. | 5.500 | 09/01/35 | 188 | 209,173 | ||||||||||||
Federal National Mortgage Assoc. | 5.500 | 10/01/35 | 583 | 652,983 | ||||||||||||
Federal National Mortgage Assoc. | 5.500 | 11/01/35 | 1,346 | 1,513,718 | ||||||||||||
Federal National Mortgage Assoc. | 5.500 | 11/01/35 | 1,558 | 1,752,666 | ||||||||||||
Federal National Mortgage Assoc. | 5.500 | 11/01/36 | 17 | 18,529 | ||||||||||||
Federal National Mortgage Assoc. | 6.000 | 08/01/21 | 66 | 69,546 | ||||||||||||
Federal National Mortgage Assoc. | 6.000 | 09/01/21 | 26 | 27,822 | ||||||||||||
Federal National Mortgage Assoc. | 6.000 | 07/01/22 | 3 | 3,256 | ||||||||||||
Federal National Mortgage Assoc. | 6.000 | 09/01/33 | 1 | 1,541 | ||||||||||||
See Notes to Financial Statements.
| Prudential Government Income Fund | 19 |
Portfolio of Investments (continued)
as of February 28, 2017
| Description | Interest Rate | Maturity Date | Principal Amount (000)# | Value (Note 1) | ||||||||||||
U.S. GOVERNMENT AGENCY OBLIGATIONS (Continued) |
| |||||||||||||||
Federal National Mortgage Assoc. | 6.000 | % | 11/01/33 | 2 | $ | 1,868 | ||||||||||
Federal National Mortgage Assoc. | 6.000 | 02/01/34 | 1 | 1,204 | ||||||||||||
Federal National Mortgage Assoc. | 6.000 | 06/01/34 | — | (c) | 287 | |||||||||||
Federal National Mortgage Assoc. | 6.000 | 09/01/34 | — | (c) | 464 | |||||||||||
Federal National Mortgage Assoc. | 6.000 | 09/01/34 | 32 | 35,712 | ||||||||||||
Federal National Mortgage Assoc. | 6.000 | 09/01/34 | 36 | 40,421 | ||||||||||||
Federal National Mortgage Assoc. | 6.000 | 10/01/34 | 56 | 62,935 | ||||||||||||
Federal National Mortgage Assoc. | 6.000 | 11/01/34 | 4 | 5,012 | ||||||||||||
Federal National Mortgage Assoc. | 6.000 | 11/01/34 | 54 | 60,933 | ||||||||||||
Federal National Mortgage Assoc. | 6.000 | 02/01/35 | 2 | 2,060 | ||||||||||||
Federal National Mortgage Assoc. | 6.000 | 03/01/35 | 22 | 24,903 | ||||||||||||
Federal National Mortgage Assoc. | 6.000 | 04/01/35 | 1 | 1,404 | ||||||||||||
Federal National Mortgage Assoc. | 6.000 | 12/01/35 | 258 | 293,704 | ||||||||||||
Federal National Mortgage Assoc. | 6.000 | 01/01/36 | 476 | 539,768 | ||||||||||||
Federal National Mortgage Assoc. | 6.000 | 05/01/36 | 40 | 45,601 | ||||||||||||
Federal National Mortgage Assoc. | 6.000 | 05/01/36 | 491 | 556,017 | ||||||||||||
Federal National Mortgage Assoc. | 6.000 | 05/01/36 | 171 | 194,096 | ||||||||||||
Federal National Mortgage Assoc.(d) | 6.250 | 05/15/29 | 210 | 282,115 | ||||||||||||
Federal National Mortgage Assoc.(d) | 6.500 | 07/01/32 | 1,021 | 1,169,636 | ||||||||||||
Federal National Mortgage Assoc. | 6.500 | 08/01/32 | 399 | 448,534 | ||||||||||||
Federal National Mortgage Assoc. | 6.500 | 09/01/32 | 104 | 116,993 | ||||||||||||
Federal National Mortgage Assoc. | 6.500 | 10/01/32 | 928 | 1,050,510 | ||||||||||||
Federal National Mortgage Assoc. | 6.500 | 10/01/32 | 129 | 145,817 | ||||||||||||
Federal National Mortgage Assoc. | 6.500 | 10/01/37 | 640 | 720,716 | ||||||||||||
Federal National Mortgage Assoc. | 7.000 | 05/01/24 | 35 | 36,871 | ||||||||||||
Federal National Mortgage Assoc. | 7.000 | 05/01/24 | 26 | 27,411 | ||||||||||||
Federal National Mortgage Assoc. | 7.000 | 05/01/24 | 33 | 35,204 | ||||||||||||
Federal National Mortgage Assoc. | 7.000 | 05/01/24 | 10 | 9,657 | ||||||||||||
Federal National Mortgage Assoc. | 7.000 | 05/01/24 | 8 | 8,346 | ||||||||||||
Federal National Mortgage Assoc. | 7.000 | 05/01/24 | 133 | 148,997 | ||||||||||||
Federal National Mortgage Assoc. | 7.000 | 12/01/31 | 373 | 428,255 | ||||||||||||
Federal National Mortgage Assoc. | 7.000 | 12/01/31 | 1 | 1,404 | ||||||||||||
Federal National Mortgage Assoc. | 7.000 | 09/01/33 | 72 | 73,835 | ||||||||||||
Federal National Mortgage Assoc. | 7.000 | 10/01/33 | 34 | 34,168 | ||||||||||||
Federal National Mortgage Assoc. | 7.000 | 11/01/33 | 12 | 12,561 | ||||||||||||
Federal National Mortgage Assoc. | 7.000 | 11/01/33 | 75 | 77,074 | ||||||||||||
Federal National Mortgage Assoc. | 7.000 | 02/01/36 | 14 | 14,821 | ||||||||||||
Federal National Mortgage Assoc. | 9.000 | 04/01/25 | 6 | 7,073 | ||||||||||||
Federal National Mortgage Assoc. | 9.500 | 01/01/25 | 3 | 3,194 | ||||||||||||
Federal National Mortgage Assoc. | 9.500 | 01/01/25 | 9 | 9,207 | ||||||||||||
Federal National Mortgage Assoc. | 9.500 | 01/01/25 | 2 | 2,164 | ||||||||||||
Federal National Mortgage Assoc. | 9.500 | 02/01/25 | 3 | 2,960 | ||||||||||||
Government National Mortgage Assoc. | 3.000 | TBA | 9,500 | 9,612,812 | ||||||||||||
See Notes to Financial Statements.
| 20 |
| Description | Interest Rate | Maturity Date | Principal Amount (000)# | Value (Note 1) | ||||||||||||
U.S. GOVERNMENT AGENCY OBLIGATIONS (Continued) |
| |||||||||||||||
Government National Mortgage Assoc. | 3.000 | % | 03/15/45 | 3,562 | $ | 3,605,726 | ||||||||||
Government National Mortgage Assoc. | 3.500 | TBA | 10,500 | 10,915,078 | ||||||||||||
Government National Mortgage Assoc. | 3.500 | 03/20/45 | 3,060 | 3,185,781 | ||||||||||||
Government National Mortgage Assoc. | 3.500 | 04/20/45 | 1,732 | 1,803,340 | ||||||||||||
Government National Mortgage Assoc. | 4.000 | TBA | 4,000 | 4,226,015 | ||||||||||||
Government National Mortgage Assoc. | 4.000 | 02/20/41 | 784 | 834,712 | ||||||||||||
Government National Mortgage Assoc. | 4.500 | TBA | 3,500 | 3,765,781 | ||||||||||||
Government National Mortgage Assoc. | 4.500 | 02/20/40 | 489 | 528,006 | ||||||||||||
Government National Mortgage Assoc. | 4.500 | 01/20/41 | 275 | 297,008 | ||||||||||||
Government National Mortgage Assoc. | 4.500 | 02/20/41 | 1,402 | 1,514,183 | ||||||||||||
Government National Mortgage Assoc. | 4.500 | 03/20/41 | 716 | 772,782 | ||||||||||||
Government National Mortgage Assoc. | 5.000 | 07/15/33 | 774 | 866,899 | ||||||||||||
Government National Mortgage Assoc. | 5.000 | 09/15/33 | 868 | 963,896 | ||||||||||||
Government National Mortgage Assoc. | 5.000 | 04/15/34 | 69 | 75,846 | ||||||||||||
Government National Mortgage Assoc. | 5.500 | 02/15/34 | 575 | 642,135 | ||||||||||||
Government National Mortgage Assoc. | 5.500 | 02/15/36 | 145 | 162,500 | ||||||||||||
Government National Mortgage Assoc. | 7.000 | 03/15/22 | 1 | 944 | ||||||||||||
Government National Mortgage Assoc. | 7.000 | 12/15/22 | — | (c) | 445 | |||||||||||
Government National Mortgage Assoc. | 7.000 | 12/15/22 | 1 | 1,401 | ||||||||||||
Government National Mortgage Assoc. | 7.000 | 01/15/23 | 4 | 4,506 | ||||||||||||
Government National Mortgage Assoc. | 7.000 | 01/15/23 | 1 | 1,217 | ||||||||||||
Government National Mortgage Assoc. | 7.000 | 01/15/23 | 2 | 2,432 | ||||||||||||
Government National Mortgage Assoc. | 7.000 | 01/15/23 | 5 | 5,789 | ||||||||||||
Government National Mortgage Assoc. | 7.000 | 01/15/23 | — | (c) | 177 | |||||||||||
Government National Mortgage Assoc. | 7.000 | 01/15/23 | 3 | 2,855 | ||||||||||||
Government National Mortgage Assoc. | 7.000 | 02/15/23 | 4 | 4,105 | ||||||||||||
Government National Mortgage Assoc. | 7.000 | 03/15/23 | 5 | 4,905 | ||||||||||||
Government National Mortgage Assoc. | 7.000 | 03/15/23 | 3 | 3,292 | ||||||||||||
Government National Mortgage Assoc. | 7.000 | 04/15/23 | 2 | 1,620 | ||||||||||||
Government National Mortgage Assoc. | 7.000 | 04/15/23 | 2 | 1,540 | ||||||||||||
Government National Mortgage Assoc. | 7.000 | 04/15/23 | 4 | 4,271 | ||||||||||||
Government National Mortgage Assoc. | 7.000 | 04/15/23 | 6 | 6,242 | ||||||||||||
Government National Mortgage Assoc. | 7.000 | 05/15/23 | 1 | 1,354 | ||||||||||||
Government National Mortgage Assoc. | 7.000 | 05/15/23 | 11 | 10,560 | ||||||||||||
Government National Mortgage Assoc. | 7.000 | 05/15/23 | 5 | 4,983 | ||||||||||||
Government National Mortgage Assoc. | 7.000 | 05/15/23 | 7 | 7,191 | ||||||||||||
Government National Mortgage Assoc. | 7.000 | 05/15/23 | 7 | 7,259 | ||||||||||||
Government National Mortgage Assoc. | 7.000 | 05/15/23 | 3 | 3,354 | ||||||||||||
Government National Mortgage Assoc. | 7.000 | 05/15/23 | — | (c) | 469 | |||||||||||
Government National Mortgage Assoc. | 7.000 | 05/15/23 | 53 | 56,116 | ||||||||||||
Government National Mortgage Assoc. | 7.000 | 05/15/23 | 2 | 2,053 | ||||||||||||
Government National Mortgage Assoc. | 7.000 | 05/15/23 | 3 | 2,742 | ||||||||||||
Government National Mortgage Assoc. | 7.000 | 05/15/23 | 1 | 822 | ||||||||||||
See Notes to Financial Statements.
| Prudential Government Income Fund | 21 |
Portfolio of Investments (continued)
as of February 28, 2017
| Description | Interest Rate | Maturity Date | Principal Amount (000)# | Value (Note 1) | ||||||||||||
U.S. GOVERNMENT AGENCY OBLIGATIONS (Continued) |
| |||||||||||||||
Government National Mortgage Assoc. | 7.000 | % | 05/15/23 | — | (c) | $ | 211 | |||||||||
Government National Mortgage Assoc. | 7.000 | 05/15/23 | 3 | 3,285 | ||||||||||||
Government National Mortgage Assoc. | 7.000 | 06/15/23 | 1 | 1,307 | ||||||||||||
Government National Mortgage Assoc. | 7.000 | 06/15/23 | 2 | 2,349 | ||||||||||||
Government National Mortgage Assoc. | 7.000 | 06/15/23 | 5 | 4,550 | ||||||||||||
Government National Mortgage Assoc. | 7.000 | 06/15/23 | 3 | 2,703 | ||||||||||||
Government National Mortgage Assoc. | 7.000 | 06/15/23 | 3 | 3,562 | ||||||||||||
Government National Mortgage Assoc. | 7.000 | 06/15/23 | 1 | 1,340 | ||||||||||||
Government National Mortgage Assoc. | 7.000 | 06/15/23 | — | (c) | 284 | |||||||||||
Government National Mortgage Assoc. | 7.000 | 06/15/23 | 2 | 2,582 | ||||||||||||
Government National Mortgage Assoc. | 7.000 | 06/15/23 | — | (c) | 344 | |||||||||||
Government National Mortgage Assoc. | 7.000 | 07/15/23 | 1 | 1,048 | ||||||||||||
Government National Mortgage Assoc. | 7.000 | 07/15/23 | 2 | 1,691 | ||||||||||||
Government National Mortgage Assoc. | 7.000 | 07/15/23 | 4 | 3,880 | ||||||||||||
Government National Mortgage Assoc. | 7.000 | 07/15/23 | — | (c) | 488 | |||||||||||
Government National Mortgage Assoc. | 7.000 | 07/15/23 | 4 | 3,824 | ||||||||||||
Government National Mortgage Assoc. | 7.000 | 07/15/23 | 19 | 19,683 | ||||||||||||
Government National Mortgage Assoc. | 7.000 | 07/15/23 | 2 | 2,185 | ||||||||||||
Government National Mortgage Assoc. | 7.000 | 07/15/23 | 1 | 573 | ||||||||||||
Government National Mortgage Assoc. | 7.000 | 07/15/23 | 5 | 4,751 | ||||||||||||
Government National Mortgage Assoc. | 7.000 | 07/15/23 | 3 | 2,688 | ||||||||||||
Government National Mortgage Assoc. | 7.000 | 07/15/23 | 1 | 1,102 | ||||||||||||
Government National Mortgage Assoc. | 7.000 | 08/15/23 | 4 | 4,273 | ||||||||||||
Government National Mortgage Assoc. | 7.000 | 08/15/23 | 1 | 1,536 | ||||||||||||
Government National Mortgage Assoc. | 7.000 | 08/15/23 | 1 | 1,331 | ||||||||||||
Government National Mortgage Assoc. | 7.000 | 08/15/23 | 8 | 7,829 | ||||||||||||
Government National Mortgage Assoc. | 7.000 | 08/15/23 | 4 | 4,656 | ||||||||||||
Government National Mortgage Assoc. | 7.000 | 08/15/23 | 1 | 1,477 | ||||||||||||
Government National Mortgage Assoc. | 7.000 | 08/15/23 | 6 | 6,675 | ||||||||||||
Government National Mortgage Assoc. | 7.000 | 08/15/23 | 1 | 540 | ||||||||||||
Government National Mortgage Assoc. | 7.000 | 08/15/23 | 9 | 9,950 | ||||||||||||
Government National Mortgage Assoc. | 7.000 | 08/15/23 | 4 | 3,730 | ||||||||||||
Government National Mortgage Assoc. | 7.000 | 08/15/23 | 6 | 6,593 | ||||||||||||
Government National Mortgage Assoc. | 7.000 | 08/15/23 | 2 | 2,030 | ||||||||||||
Government National Mortgage Assoc. | 7.000 | 08/15/23 | 1 | 1,438 | ||||||||||||
Government National Mortgage Assoc. | 7.000 | 08/15/23 | 10 | 10,246 | ||||||||||||
Government National Mortgage Assoc. | 7.000 | 08/15/23 | 2 | 2,149 | ||||||||||||
Government National Mortgage Assoc. | 7.000 | 08/15/23 | 1 | 763 | ||||||||||||
Government National Mortgage Assoc. | 7.000 | 08/15/23 | 2 | 1,836 | ||||||||||||
Government National Mortgage Assoc. | 7.000 | 09/15/23 | 2 | 2,641 | ||||||||||||
Government National Mortgage Assoc. | 7.000 | 09/15/23 | 2 | 1,884 | ||||||||||||
Government National Mortgage Assoc. | 7.000 | 09/15/23 | 14 | 15,540 | ||||||||||||
Government National Mortgage Assoc. | 7.000 | 09/15/23 | 1 | 1,472 | ||||||||||||
See Notes to Financial Statements.
| 22 |
| Description | Interest Rate | Maturity Date | Principal Amount (000)# | Value (Note 1) | ||||||||||||
U.S. GOVERNMENT AGENCY OBLIGATIONS (Continued) |
| |||||||||||||||
Government National Mortgage Assoc. | 7.000 | % | 09/15/23 | 2 | $ | 1,723 | ||||||||||
Government National Mortgage Assoc. | 7.000 | 09/15/23 | 2 | 1,586 | ||||||||||||
Government National Mortgage Assoc. | 7.000 | 09/15/23 | 2 | 2,140 | ||||||||||||
Government National Mortgage Assoc. | 7.000 | 09/15/23 | 48 | 51,418 | ||||||||||||
Government National Mortgage Assoc. | 7.000 | 10/15/23 | 1 | 1,149 | ||||||||||||
Government National Mortgage Assoc. | 7.000 | 10/15/23 | — | (c) | 301 | |||||||||||
Government National Mortgage Assoc. | 7.000 | 10/15/23 | — | (c) | 437 | |||||||||||
Government National Mortgage Assoc. | 7.000 | 10/15/23 | 2 | 1,616 | ||||||||||||
Government National Mortgage Assoc. | 7.000 | 10/15/23 | 5 | 4,897 | ||||||||||||
Government National Mortgage Assoc. | 7.000 | 10/15/23 | 14 | 14,803 | ||||||||||||
Government National Mortgage Assoc. | 7.000 | 10/15/23 | 3 | 3,259 | ||||||||||||
Government National Mortgage Assoc. | 7.000 | 10/15/23 | 2 | 2,215 | ||||||||||||
Government National Mortgage Assoc. | 7.000 | 10/15/23 | 6 | 5,947 | ||||||||||||
Government National Mortgage Assoc. | 7.000 | 10/15/23 | 2 | 2,521 | ||||||||||||
Government National Mortgage Assoc. | 7.000 | 10/15/23 | 1 | 1,018 | ||||||||||||
Government National Mortgage Assoc. | 7.000 | 10/15/23 | 2 | 2,393 | ||||||||||||
Government National Mortgage Assoc. | 7.000 | 10/15/23 | 4 | 3,566 | ||||||||||||
Government National Mortgage Assoc. | 7.000 | 10/15/23 | 6 | 6,372 | ||||||||||||
Government National Mortgage Assoc. | 7.000 | 10/15/23 | 2 | 1,928 | ||||||||||||
Government National Mortgage Assoc. | 7.000 | 10/15/23 | 1 | 725 | ||||||||||||
Government National Mortgage Assoc. | 7.000 | 10/15/23 | 9 | 9,256 | ||||||||||||
Government National Mortgage Assoc. | 7.000 | 10/15/23 | 2 | 1,705 | ||||||||||||
Government National Mortgage Assoc. | 7.000 | 10/15/23 | 1 | 1,284 | ||||||||||||
Government National Mortgage Assoc. | 7.000 | 10/15/23 | 13 | 13,939 | ||||||||||||
Government National Mortgage Assoc. | 7.000 | 10/15/23 | 2 | 2,293 | ||||||||||||
Government National Mortgage Assoc. | 7.000 | 10/15/23 | 1 | 1,473 | ||||||||||||
Government National Mortgage Assoc. | 7.000 | 10/15/23 | 18 | 17,982 | ||||||||||||
Government National Mortgage Assoc. | 7.000 | 10/15/23 | 3 | 2,687 | ||||||||||||
Government National Mortgage Assoc. | 7.000 | 10/15/23 | 2 | 2,183 | ||||||||||||
Government National Mortgage Assoc. | 7.000 | 10/15/23 | 8 | 8,526 | ||||||||||||
Government National Mortgage Assoc. | 7.000 | 10/15/23 | 6 | 6,405 | ||||||||||||
Government National Mortgage Assoc. | 7.000 | 10/15/23 | 58 | 61,849 | ||||||||||||
Government National Mortgage Assoc. | 7.000 | 10/15/23 | 51 | 52,981 | ||||||||||||
Government National Mortgage Assoc. | 7.000 | 10/15/23 | 6 | 6,434 | ||||||||||||
Government National Mortgage Assoc. | 7.000 | 10/15/23 | 7 | 6,912 | ||||||||||||
Government National Mortgage Assoc. | 7.000 | 10/15/23 | 10 | 10,520 | ||||||||||||
Government National Mortgage Assoc. | 7.000 | 11/15/23 | 4 | 3,943 | ||||||||||||
Government National Mortgage Assoc. | 7.000 | 11/15/23 | 17 | 18,157 | ||||||||||||
Government National Mortgage Assoc. | 7.000 | 11/15/23 | 2 | 1,722 | ||||||||||||
Government National Mortgage Assoc. | 7.000 | 11/15/23 | 12 | 12,482 | ||||||||||||
Government National Mortgage Assoc. | 7.000 | 11/15/23 | 2 | 2,543 | ||||||||||||
Government National Mortgage Assoc. | 7.000 | 11/15/23 | 6 | 5,950 | ||||||||||||
Government National Mortgage Assoc. | 7.000 | 11/15/23 | 9 | 9,683 | ||||||||||||
Government National Mortgage Assoc. | 7.000 | 11/15/23 | 3 | 2,834 | ||||||||||||
Government National Mortgage Assoc. | 7.000 | 11/15/23 | 15 | 15,646 | ||||||||||||
See Notes to Financial Statements.
| Prudential Government Income Fund | 23 |
Portfolio of Investments (continued)
as of February 28, 2017
| Description | Interest Rate | Maturity Date | Principal Amount (000)# | Value (Note 1) | ||||||||||||
U.S. GOVERNMENT AGENCY OBLIGATIONS (Continued) |
| |||||||||||||||
Government National Mortgage Assoc. | 7.000 | % | 11/15/23 | 5 | $ | 4,696 | ||||||||||
Government National Mortgage Assoc. | 7.000 | 11/15/23 | 3 | 2,799 | ||||||||||||
Government National Mortgage Assoc. | 7.000 | 11/15/23 | 1 | 882 | ||||||||||||
Government National Mortgage Assoc. | 7.000 | 11/15/23 | 3 | 3,258 | ||||||||||||
Government National Mortgage Assoc. | 7.000 | 11/15/23 | 2 | 1,955 | ||||||||||||
Government National Mortgage Assoc. | 7.000 | 11/15/23 | 5 | 4,996 | ||||||||||||
Government National Mortgage Assoc. | 7.000 | 11/15/23 | 10 | 10,176 | ||||||||||||
Government National Mortgage Assoc. | 7.000 | 11/15/23 | 6 | 6,473 | ||||||||||||
Government National Mortgage Assoc. | 7.000 | 11/15/23 | 6 | 5,740 | ||||||||||||
Government National Mortgage Assoc. | 7.000 | 11/15/23 | 8 | 8,985 | ||||||||||||
Government National Mortgage Assoc. | 7.000 | 11/15/23 | 14 | 14,899 | ||||||||||||
Government National Mortgage Assoc. | 7.000 | 11/15/23 | 2 | 2,476 | ||||||||||||
Government National Mortgage Assoc. | 7.000 | 11/15/23 | 1 | 636 | ||||||||||||
Government National Mortgage Assoc. | 7.000 | 11/15/23 | 4 | 3,873 | ||||||||||||
Government National Mortgage Assoc. | 7.000 | 11/15/23 | 2 | 2,069 | ||||||||||||
Government National Mortgage Assoc. | 7.000 | 12/15/23 | 1 | 1,334 | ||||||||||||
Government National Mortgage Assoc. | 7.000 | 12/15/23 | 4 | 4,190 | ||||||||||||
Government National Mortgage Assoc. | 7.000 | 12/15/23 | 5 | 4,870 | ||||||||||||
Government National Mortgage Assoc. | 7.000 | 12/15/23 | 34 | 36,277 | ||||||||||||
Government National Mortgage Assoc. | 7.000 | 12/15/23 | 7 | 7,609 | ||||||||||||
Government National Mortgage Assoc. | 7.000 | 12/15/23 | 19 | 19,255 | ||||||||||||
Government National Mortgage Assoc. | 7.000 | 12/15/23 | 2 | 1,941 | ||||||||||||
Government National Mortgage Assoc. | 7.000 | 12/15/23 | 1 | 1,476 | ||||||||||||
Government National Mortgage Assoc. | 7.000 | 12/15/23 | 2 | 1,990 | ||||||||||||
Government National Mortgage Assoc. | 7.000 | 12/15/23 | 3 | 2,969 | ||||||||||||
Government National Mortgage Assoc. | 7.000 | 12/15/23 | 7 | 6,861 | ||||||||||||
Government National Mortgage Assoc. | 7.000 | 12/15/23 | 1 | 903 | ||||||||||||
Government National Mortgage Assoc. | 7.000 | 12/15/23 | 6 | 6,219 | ||||||||||||
Government National Mortgage Assoc. | 7.000 | 12/15/23 | 12 | 13,127 | ||||||||||||
Government National Mortgage Assoc. | 7.000 | 12/15/23 | 2 | 1,739 | ||||||||||||
Government National Mortgage Assoc. | 7.000 | 12/15/23 | 2 | 2,489 | ||||||||||||
Government National Mortgage Assoc. | 7.000 | 12/15/23 | 1 | 1,232 | ||||||||||||
Government National Mortgage Assoc. | 7.000 | 12/15/23 | 6 | 6,006 | ||||||||||||
Government National Mortgage Assoc. | 7.000 | 12/15/23 | 11 | 11,983 | ||||||||||||
Government National Mortgage Assoc. | 7.000 | 12/15/23 | 7 | 6,709 | ||||||||||||
Government National Mortgage Assoc. | 7.000 | 12/15/23 | 1 | 595 | ||||||||||||
Government National Mortgage Assoc. | 7.000 | 12/15/23 | 10 | 9,981 | ||||||||||||
Government National Mortgage Assoc. | 7.000 | 12/15/23 | 2 | 2,196 | ||||||||||||
Government National Mortgage Assoc. | 7.000 | 12/15/23 | 2 | 1,886 | ||||||||||||
Government National Mortgage Assoc. | 7.000 | 12/15/23 | 1 | 1,419 | ||||||||||||
Government National Mortgage Assoc. | 7.000 | 12/15/23 | 3 | 3,311 | ||||||||||||
Government National Mortgage Assoc. | 7.000 | 12/15/23 | 3 | 3,387 | ||||||||||||
Government National Mortgage Assoc. | 7.000 | 12/15/23 | — | (c) | 101 | |||||||||||
Government National Mortgage Assoc. | 7.000 | 12/15/23 | 3 | 3,347 | ||||||||||||
See Notes to Financial Statements.
| 24 |
| Description | Interest Rate | Maturity Date | Principal Amount (000)# | Value (Note 1) | ||||||||||||
U.S. GOVERNMENT AGENCY OBLIGATIONS (Continued) |
| |||||||||||||||
Government National Mortgage Assoc. | 7.000 | % | 12/15/23 | 6 | $ | 6,054 | ||||||||||
Government National Mortgage Assoc. | 7.000 | 12/15/23 | 10 | 11,182 | ||||||||||||
Government National Mortgage Assoc. | 7.000 | 12/15/23 | 5 | 5,398 | ||||||||||||
Government National Mortgage Assoc. | 7.000 | 12/15/23 | 6 | 5,842 | ||||||||||||
Government National Mortgage Assoc. | 7.000 | 12/15/23 | 21 | 22,459 | ||||||||||||
Government National Mortgage Assoc. | 7.000 | 01/15/24 | 6 | 6,610 | ||||||||||||
Government National Mortgage Assoc. | 7.000 | 01/15/24 | 2 | 1,829 | ||||||||||||
Government National Mortgage Assoc. | 7.000 | 01/15/24 | 3 | 3,342 | ||||||||||||
Government National Mortgage Assoc. | 7.000 | 01/15/24 | 7 | 6,800 | ||||||||||||
Government National Mortgage Assoc. | 7.000 | 01/15/24 | 2 | 2,093 | ||||||||||||
Government National Mortgage Assoc. | 7.000 | 01/15/24 | — | (c) | 491 | |||||||||||
Government National Mortgage Assoc. | 7.000 | 01/15/24 | 3 | 3,370 | ||||||||||||
Government National Mortgage Assoc. | 7.000 | 01/15/24 | 3 | 3,011 | ||||||||||||
Government National Mortgage Assoc. | 7.000 | 01/15/24 | 4 | 3,707 | ||||||||||||
Government National Mortgage Assoc. | 7.000 | 01/15/24 | 9 | 9,383 | ||||||||||||
Government National Mortgage Assoc. | 7.000 | 01/15/24 | 4 | 3,624 | ||||||||||||
Government National Mortgage Assoc. | 7.000 | 01/15/24 | 1 | 1,286 | ||||||||||||
Government National Mortgage Assoc. | 7.000 | 01/15/24 | 2 | 1,865 | ||||||||||||
Government National Mortgage Assoc. | 7.000 | 01/15/24 | 5 | 5,355 | ||||||||||||
Government National Mortgage Assoc. | 7.000 | 02/15/24 | 1 | 877 | ||||||||||||
Government National Mortgage Assoc. | 7.000 | 02/15/24 | 5 | 4,868 | ||||||||||||
Government National Mortgage Assoc. | 7.000 | 02/15/24 | 2 | 2,154 | ||||||||||||
Government National Mortgage Assoc. | 7.000 | 02/15/24 | 1 | 973 | ||||||||||||
Government National Mortgage Assoc. | 7.000 | 02/15/24 | 1 | 527 | ||||||||||||
Government National Mortgage Assoc. | 7.000 | 02/15/24 | 15 | 15,659 | ||||||||||||
Government National Mortgage Assoc. | 7.000 | 02/15/24 | 3 | 3,029 | ||||||||||||
Government National Mortgage Assoc. | 7.000 | 03/15/24 | 4 | 4,215 | ||||||||||||
Government National Mortgage Assoc. | 7.000 | 03/15/24 | 2 | 2,470 | ||||||||||||
Government National Mortgage Assoc. | 7.000 | 03/15/24 | 3 | 2,939 | ||||||||||||
Government National Mortgage Assoc. | 7.000 | 03/15/24 | 2 | 1,615 | ||||||||||||
Government National Mortgage Assoc. | 7.000 | 03/15/24 | — | (c) | 145 | |||||||||||
Government National Mortgage Assoc. | 7.000 | 03/15/24 | — | (c) | 89 | |||||||||||
Government National Mortgage Assoc. | 7.000 | 03/15/24 | 3 | 3,065 | ||||||||||||
Government National Mortgage Assoc. | 7.000 | 03/15/24 | 2 | 2,087 | ||||||||||||
Government National Mortgage Assoc. | 7.000 | 04/15/24 | 2 | 1,572 | ||||||||||||
Government National Mortgage Assoc. | 7.000 | 04/15/24 | 4 | 4,389 | ||||||||||||
Government National Mortgage Assoc. | 7.000 | 04/15/24 | 3 | 2,585 | ||||||||||||
Government National Mortgage Assoc. | 7.000 | 04/15/24 | 1 | 981 | ||||||||||||
Government National Mortgage Assoc. | 7.000 | 04/15/24 | 8 | 8,487 | ||||||||||||
Government National Mortgage Assoc. | 7.000 | 04/15/24 | 13 | 14,141 | ||||||||||||
Government National Mortgage Assoc. | 7.000 | 04/15/24 | 3 | 2,908 | ||||||||||||
Government National Mortgage Assoc. | 7.000 | 04/15/24 | 1 | 893 | ||||||||||||
Government National Mortgage Assoc. | 7.000 | 04/15/24 | 1 | 1,019 | ||||||||||||
Government National Mortgage Assoc. | 7.000 | 04/15/24 | 2 | 2,003 | ||||||||||||
See Notes to Financial Statements.
| Prudential Government Income Fund | 25 |
Portfolio of Investments (continued)
as of February 28, 2017
| Description | Interest Rate | Maturity Date | Principal Amount (000)# | Value (Note 1) | ||||||||||||
U.S. GOVERNMENT AGENCY OBLIGATIONS (Continued) |
| |||||||||||||||
Government National Mortgage Assoc. | 7.000 | % | 04/15/24 | — | (c) | $ | 434 | |||||||||
Government National Mortgage Assoc. | 7.000 | 04/15/24 | 1 | 714 | ||||||||||||
Government National Mortgage Assoc. | 7.000 | 04/15/24 | 3 | 3,113 | ||||||||||||
Government National Mortgage Assoc. | 7.000 | 04/15/24 | 6 | 5,892 | ||||||||||||
Government National Mortgage Assoc. | 7.000 | 04/15/24 | 4 | 3,678 | ||||||||||||
Government National Mortgage Assoc. | 7.000 | 04/15/24 | 1 | 1,129 | ||||||||||||
Government National Mortgage Assoc. | 7.000 | 04/15/24 | 3 | 3,121 | ||||||||||||
Government National Mortgage Assoc. | 7.000 | 05/15/24 | 6 | 5,980 | ||||||||||||
Government National Mortgage Assoc. | 7.000 | 05/15/24 | 3 | 3,310 | ||||||||||||
Government National Mortgage Assoc. | 7.000 | 05/15/24 | 9 | 8,662 | ||||||||||||
Government National Mortgage Assoc. | 7.000 | 05/15/24 | 6 | 5,764 | ||||||||||||
Government National Mortgage Assoc. | 7.000 | 05/15/24 | 6 | 6,348 | ||||||||||||
Government National Mortgage Assoc. | 7.000 | 05/15/24 | 6 | 6,175 | ||||||||||||
Government National Mortgage Assoc. | 7.000 | 05/15/24 | 3 | 3,211 | ||||||||||||
Government National Mortgage Assoc. | 7.000 | 05/15/24 | 9 | 9,469 | ||||||||||||
Government National Mortgage Assoc. | 7.000 | 05/15/24 | 2 | 2,226 | ||||||||||||
Government National Mortgage Assoc. | 7.000 | 05/15/24 | 12 | 12,970 | ||||||||||||
Government National Mortgage Assoc. | 7.000 | 05/15/24 | — | (c) | 377 | |||||||||||
Government National Mortgage Assoc. | 7.000 | 05/15/24 | 1 | 900 | ||||||||||||
Government National Mortgage Assoc. | 7.000 | 06/15/24 | 1 | 1,563 | ||||||||||||
Government National Mortgage Assoc. | 7.000 | 06/15/24 | 3 | 2,708 | ||||||||||||
Government National Mortgage Assoc. | 7.000 | 06/15/24 | 9 | 8,963 | ||||||||||||
Government National Mortgage Assoc. | 7.000 | 06/15/24 | 1 | 722 | ||||||||||||
Government National Mortgage Assoc. | 7.000 | 06/15/24 | 8 | 8,560 | ||||||||||||
Government National Mortgage Assoc. | 7.000 | 06/15/24 | 4 | 4,123 | ||||||||||||
Government National Mortgage Assoc. | 7.000 | 06/15/24 | 12 | 12,906 | ||||||||||||
Government National Mortgage Assoc. | 7.000 | 06/15/24 | 5 | 4,946 | ||||||||||||
Government National Mortgage Assoc. | 7.000 | 06/15/24 | 7 | 7,144 | ||||||||||||
Government National Mortgage Assoc. | 7.000 | 06/15/24 | 1 | 753 | ||||||||||||
Government National Mortgage Assoc. | 7.000 | 07/15/24 | 4 | 3,752 | ||||||||||||
Government National Mortgage Assoc. | 7.000 | 07/15/24 | 3 | 3,346 | ||||||||||||
Government National Mortgage Assoc. | 7.000 | 10/15/24 | 11 | 12,028 | ||||||||||||
Government National Mortgage Assoc. | 7.000 | 02/15/29 | 22 | 23,335 | ||||||||||||
Government National Mortgage Assoc. | 7.500 | 01/15/23 | 1 | 539 | ||||||||||||
Government National Mortgage Assoc. | 7.500 | 01/15/23 | — | (c) | 270 | |||||||||||
Government National Mortgage Assoc. | 7.500 | 03/15/23 | 1 | 1,488 | ||||||||||||
Government National Mortgage Assoc. | 7.500 | 05/15/23 | 1 | 1,038 | ||||||||||||
Government National Mortgage Assoc. | 7.500 | 05/15/23 | 8 | 8,128 | ||||||||||||
Government National Mortgage Assoc. | 7.500 | 06/15/23 | 1 | 574 | ||||||||||||
Government National Mortgage Assoc. | 7.500 | 07/15/23 | — | (c) | 252 | |||||||||||
Government National Mortgage Assoc. | 7.500 | 07/15/23 | — | (c) | 308 | |||||||||||
Government National Mortgage Assoc. | 7.500 | 07/15/23 | 1 | 801 | ||||||||||||
Government National Mortgage Assoc. | 7.500 | 09/15/23 | 4 | 3,820 | ||||||||||||
See Notes to Financial Statements.
| 26 |
| Description | Interest Rate | Maturity Date | Principal Amount (000)# | Value (Note 1) | ||||||||||||
U.S. GOVERNMENT AGENCY OBLIGATIONS (Continued) |
| |||||||||||||||
Government National Mortgage Assoc. | 7.500 | % | 09/15/23 | — | (c) | $ | 227 | |||||||||
Government National Mortgage Assoc. | 7.500 | 10/15/23 | 6 | 6,514 | ||||||||||||
Government National Mortgage Assoc. | 7.500 | 10/15/23 | 11 | 12,406 | ||||||||||||
Government National Mortgage Assoc. | 7.500 | 11/15/23 | 2 | 1,703 | ||||||||||||
Government National Mortgage Assoc. | 7.500 | 11/15/23 | 12 | 12,757 | ||||||||||||
Government National Mortgage Assoc. | 7.500 | 12/15/23 | 6 | 5,934 | ||||||||||||
Government National Mortgage Assoc. | 7.500 | 12/15/23 | 2 | 1,777 | ||||||||||||
Government National Mortgage Assoc. | 7.500 | 01/15/24 | 1 | 1,294 | ||||||||||||
Government National Mortgage Assoc. | 7.500 | 01/15/24 | 4 | 4,571 | ||||||||||||
Government National Mortgage Assoc. | 7.500 | 01/15/24 | 4 | 4,303 | ||||||||||||
Government National Mortgage Assoc. | 7.500 | 01/15/24 | 1 | 1,052 | ||||||||||||
Government National Mortgage Assoc. | 7.500 | 01/15/24 | 18 | 18,843 | ||||||||||||
Government National Mortgage Assoc. | 7.500 | 01/15/24 | 16 | 17,456 | ||||||||||||
Government National Mortgage Assoc. | 7.500 | 01/15/24 | 4 | 4,404 | ||||||||||||
Government National Mortgage Assoc. | 7.500 | 02/15/24 | 1 | 1,289 | ||||||||||||
Government National Mortgage Assoc. | 7.500 | 02/15/24 | 15 | 16,131 | ||||||||||||
Government National Mortgage Assoc. | 7.500 | 03/15/24 | 2 | 1,764 | ||||||||||||
Government National Mortgage Assoc. | 7.500 | 03/15/24 | 1 | 898 | ||||||||||||
Government National Mortgage Assoc. | 7.500 | 03/15/24 | 4 | 4,131 | ||||||||||||
Government National Mortgage Assoc. | 7.500 | 04/15/24 | 3 | 3,341 | ||||||||||||
Government National Mortgage Assoc. | 7.500 | 04/15/24 | 8 | 8,104 | ||||||||||||
Government National Mortgage Assoc. | 7.500 | 04/15/24 | 4 | 3,686 | ||||||||||||
Government National Mortgage Assoc. | 7.500 | 05/15/24 | 2 | 2,240 | ||||||||||||
Government National Mortgage Assoc. | 7.500 | 05/15/24 | 1 | 961 | ||||||||||||
Government National Mortgage Assoc. | 7.500 | 05/15/24 | 2 | 1,852 | ||||||||||||
Government National Mortgage Assoc. | 7.500 | 06/15/24 | 2 | 1,681 | ||||||||||||
Government National Mortgage Assoc. | 7.500 | 06/15/24 | 4 | 4,424 | ||||||||||||
Government National Mortgage Assoc. | 7.500 | 06/15/24 | 8 | 8,440 | ||||||||||||
Government National Mortgage Assoc. | 7.500 | 06/15/24 | 7 | 6,915 | ||||||||||||
Government National Mortgage Assoc. | 7.500 | 07/15/24 | 16 | 15,652 | ||||||||||||
Government National Mortgage Assoc. | 7.500 | 07/15/24 | 7 | 6,672 | ||||||||||||
Government National Mortgage Assoc. | 8.500 | 04/15/25 | 180 | 209,762 | ||||||||||||
Government National Mortgage Assoc. | 9.500 | 06/15/17 | — | (c) | 168 | |||||||||||
Government National Mortgage Assoc. | 9.500 | 07/15/17 | — | (c) | 445 | |||||||||||
Government National Mortgage Assoc. | 9.500 | 07/15/17 | — | (c) | 266 | |||||||||||
Government National Mortgage Assoc. | 9.500 | 12/15/17 | 2 | 2,181 | ||||||||||||
Government National Mortgage Assoc. | 9.500 | 08/20/20 | — | (c) | 79 | |||||||||||
Government National Mortgage Assoc. | 9.500 | 07/20/21 | — | (c) | 34 | |||||||||||
Government National Mortgage Assoc. | 9.500 | 08/20/21 | 7 | 6,574 | ||||||||||||
Hashemite Kingdom of Jordan, USAID Bond, U.S. Gov’t. Gtd. Notes | 2.578 | 06/30/22 | 2,285 | 2,330,364 | ||||||||||||
Hashemite Kingdom of Jordan, USAID Bond, U.S. Gov’t. Gtd. Notes | 3.000 | 06/30/25 | 2,269 | 2,326,717 | ||||||||||||
See Notes to Financial Statements.
| Prudential Government Income Fund | 27 |
Portfolio of Investments (continued)
as of February 28, 2017
| Description | Interest Rate | Maturity Date | Principal Amount (000)# | Value (Note 1) | ||||||||||||
U.S. GOVERNMENT AGENCY OBLIGATIONS (Continued) |
| |||||||||||||||
Israel Government, USAID Bond, U.S. Gov’t. Gtd. Notes | 5.500 | % | 09/18/23 | 2,700 | $ | 3,207,387 | ||||||||||
Residual Funding Corp. Strips Principal, Unsec’d. Notes, PO | 1.605 | (e) | 01/15/21 | 3,548 | 3,294,698 | |||||||||||
Residual Funding Corp. Strips Principal, Unsec’d. Notes, PO | 2.862 | (e) | 01/15/30 | 1,260 | 830,854 | |||||||||||
Residual Funding Corp. Strips Principal, Unsec’d. Notes, PO | 2.958 | (e) | 04/15/30 | 1,415 | 935,754 | |||||||||||
Tennessee Valley Authority, Sr. Unsec’d. Notes | 2.875 | 02/01/27 | 510 | 511,765 | ||||||||||||
Tennessee Valley Authority, Sr. Unsec’d. Notes | 6.750 | 11/01/25 | 1,300 | 1,703,281 | ||||||||||||
Tennessee Valley Authority, Sr. Unsec’d. Notes | 7.125 | 05/01/30 | 1,170 | 1,679,192 | ||||||||||||
Ukraine Government, USAID Bonds, U.S. Gov’t. Gtd. Notes | 1.471 | 09/29/21 | 5,400 | 5,289,214 | ||||||||||||
|
| |||||||||||||||
TOTAL U.S. GOVERNMENT AGENCY OBLIGATIONS |
| 211,064,887 | ||||||||||||||
|
| |||||||||||||||
U.S. TREASURY OBLIGATIONS 32.8% | ||||||||||||||||
U.S. Treasury Bonds | 2.500 | 02/15/45 | 2,865 | 2,598,085 | ||||||||||||
U.S. Treasury Bonds | 2.500 | 05/15/46 | 1,210 | 1,094,624 | ||||||||||||
U.S. Treasury Bonds | 2.750 | 11/15/42 | 1,945 | 1,866,821 | ||||||||||||
U.S. Treasury Bonds(f) | 2.875 | 05/15/43 | 2,185 | 2,144,800 | ||||||||||||
U.S. Treasury Bonds | 2.875 | 11/15/46 | 2,610 | 2,559,329 | ||||||||||||
U.S. Treasury Bonds | 3.000 | 11/15/44 | 900 | 903,551 | ||||||||||||
U.S. Treasury Bonds | 3.000 | 05/15/45 | 8,950 | 8,980,770 | ||||||||||||
U.S. Treasury Bonds | 4.250 | 11/15/40 | 9,920 | 12,200,052 | ||||||||||||
U.S. Treasury Bonds | 4.750 | 02/15/41 | 2,635 | 3,477,378 | ||||||||||||
U.S. Treasury Bonds | 8.125 | 08/15/21 | 955 | 1,211,582 | ||||||||||||
U.S. Treasury Notes | 0.750 | 02/28/18 | 5 | 4,990 | ||||||||||||
U.S. Treasury Notes | 1.375 | 04/30/21 | 25,855 | 25,432,840 | ||||||||||||
U.S. Treasury Notes | 1.625 | 04/30/23 | 10,170 | 9,889,928 | ||||||||||||
U.S. Treasury Notes | 1.750 | 03/31/22 | 6,280 | 6,226,030 | ||||||||||||
U.S. Treasury Notes | 2.000 | 11/30/22 | 3,605 | 3,596,972 | ||||||||||||
U.S. Treasury Notes | 2.125 | 06/30/21 | 14,850 | 15,044,327 | ||||||||||||
U.S. Treasury Notes | 2.125 | 09/30/21 | 22,355 | 22,611,725 | ||||||||||||
U.S. Treasury Notes | 2.125 | 12/31/22 | 1,005 | 1,009,082 | ||||||||||||
U.S. Treasury Notes | 2.125 | 02/29/24 | 3,935 | 3,920,090 | ||||||||||||
U.S. Treasury Notes | 2.250 | 12/31/23 | 13,900 | 13,973,295 | ||||||||||||
U.S. Treasury Strips Coupon | 1.881 | (e) | 05/15/31 | 1,100 | 742,760 | |||||||||||
U.S. Treasury Strips Coupon | 1.898 | (e) | 08/15/29 | 1,100 | 788,062 | |||||||||||
U.S. Treasury Strips Coupon | 2.037 | (e) | 02/15/22 | 1,875 | 1,696,725 | |||||||||||
U.S. Treasury Strips Coupon | 2.100 | (e) | 11/15/35 | 2,200 | 1,270,100 | |||||||||||
U.S. Treasury Strips Coupon | 2.184 | (e) | 02/15/28 | 695 | 522,569 | |||||||||||
U.S. Treasury Strips Coupon | 2.241 | (e) | 05/15/28 | 345 | 257,058 | |||||||||||
U.S. Treasury Strips Coupon | 2.264 | (e) | 08/15/40 | 2,200 | 1,067,570 | |||||||||||
See Notes to Financial Statements.
| 28 |
| Description | Interest Rate | Maturity Date | Principal Amount (000)# | Value (Note 1) | ||||||||||||
U.S. TREASURY OBLIGATIONS (Continued) |
| |||||||||||||||
U.S. Treasury Strips Coupon | 2.280 | (e)% | 02/15/29 | 345 | $ | 250,569 | ||||||||||
U.S. Treasury Strips Coupon | 2.384 | (e) | 05/15/29 | 710 | 512,124 | |||||||||||
U.S. Treasury Strips Coupon | 2.404 | (e) | 08/15/21 | 5,070 | 4,653,733 | |||||||||||
U.S. Treasury Strips Coupon(d)(f) | 3.076 | (e) | 08/15/24 | 6,700 | 5,627,967 | |||||||||||
U.S. Treasury Strips Principal, PO | 2.543 | (e) | 02/15/45 | 1,365 | 579,038 | |||||||||||
U.S. Treasury Strips Principal, PO | 2.545 | (e) | 05/15/43 | 1,580 | 709,140 | |||||||||||
U.S. Treasury Strips Principal, PO | 2.873 | (e) | 05/15/45 | 2,470 | 1,041,016 | |||||||||||
U.S. Treasury Strips Principal, PO | 3.005 | (e) | 11/15/44 | 1,045 | 447,477 | |||||||||||
U.S. Treasury Strips Principal, PO | 3.626 | (e) | 05/15/44 | 2,865 | 1,249,977 | |||||||||||
|
| |||||||||||||||
TOTAL U.S. TREASURY OBLIGATIONS | 160,162,156 | |||||||||||||||
|
| |||||||||||||||
TOTAL LONG-TERM INVESTMENTS | 489,196,800 | |||||||||||||||
|
| |||||||||||||||
SHORT-TERM INVESTMENT 19.3% | ||||||||||||||||
Shares | ||||||||||||||||
AFFILIATED MUTUAL FUND | ||||||||||||||||
Prudential Investment Portfolios 2 - Prudential Core | 94,087,827 | 94,087,827 | ||||||||||||||
|
| |||||||||||||||
TOTAL INVESTMENTS, BEFORE SECURITY SOLD SHORT 119.4% | 583,284,627 | |||||||||||||||
|
| |||||||||||||||
Principal | ||||||||||||||||
SECURITY SOLD SHORT (0.3)% | ||||||||||||||||
U.S. GOVERNMENT AGENCY OBLIGATION | ||||||||||||||||
Federal National Mortgage Assoc. | 3.500 | TBA | 1,500 | (1,535,391 | ) | |||||||||||
|
| |||||||||||||||
TOTAL INVESTMENTS, NET OF SECURITY SOLD SHORT 119.1% |
| 581,749,236 | ||||||||||||||
Liabilities in excess of other assets(h) (19.1)% | (93,285,299 | ) | ||||||||||||||
|
| |||||||||||||||
NET ASSETS 100.0% | $488,463,937 | |||||||||||||||
|
| |||||||||||||||
The following abbreviations are used in the annual report:
144A—Security was purchased pursuant to Rule 144A under the Securities Act of 1933 and may not be resold subject to that rule except to qualified institutional buyers. Unless otherwise noted, 144A securities are deemed to be liquid.
Aces—Alternative Credit Enhancements Securities
See Notes to Financial Statements.
| Prudential Government Income Fund | 29 |
Portfolio of Investments (continued)
as of February 28, 2017
BABs—Build America Bonds
CLO—Collateralized Loan Obligation
FHLMC—Federal Home Loan Mortgage Corp.
IO—Interest Only (Principal amount represents notional)
LIBOR—London Interbank Offered Rate
OTC—Over-the-counter
PO—Principal Only
REMICS—Real Estate Mortgage Investment Conduit Security
Strips—Separate Trading of Registered Interest and Principal of Securities
TBA—To Be Announced
USAID—United States Agency for International Development
USOIS—United States Overnight Index Swap
| # | Principal or notional amount is shown in U.S. dollars unless otherwise stated. |
| ^ | Indicates a Level 3 security. The aggregate value of Level 3 securities is $4,997,500 and 1.0% of net assets. |
| (a) | Variable rate instrument. The interest rate shown reflects the rate in effect at February 28, 2017. |
| (b) | Indicates a security that has been deemed illiquid; the value of $3,475,590 is approximately 0.7% of net assets. (unaudited) |
| (c) | Less than $500 par. |
| (d) | Represents security, or a portion thereof, segregated as collateral for futures contracts. |
| (e) | Represents zero coupon bond or principal only securities. Rate represents yield to maturity at purchase date. |
| (f) | Represents security, or a portion thereof, segregated as collateral for centrally cleared swap agreements. |
| (g) | PGIM Investments LLC, the manager of the Fund also serves as manager of the Prudential Investment Portfolios 2 - Prudential Core Ultra Short Bond Fund. |
| (h) | Includes net unrealized appreciation (depreciation) on the following derivative contracts held at reporting period end: |
Futures contracts outstanding at February 28, 2017:
| Number of Contracts | Type | Expiration Date | Value at Trade Date | Value at February 28, 2017 | Unrealized Appreciation (Depreciation) | |||||||||||||||
| Long Positions: | ||||||||||||||||||||
| 580 | 2 Year U.S. Treasury Notes | Jun. 2017 | $ | 125,474,392 | $ | 125,515,625 | $ | 41,233 | ||||||||||||
| 347 | 10 Year U.S. Treasury Notes | Jun. 2017 | 43,117,922 | 43,228,609 | 110,687 | |||||||||||||||
| 14 | 30 Year U.S. Ultra Treasury Bonds | Jun. 2017 | 2,235,225 | 2,264,938 | 29,713 | |||||||||||||||
|
| |||||||||||||||||||
| 181,633 | ||||||||||||||||||||
|
| |||||||||||||||||||
| Short Positions: | ||||||||||||||||||||
| 32 | 5 Year U.S. Treasury Notes | Jun. 2017 | 3,768,708 | 3,766,500 | 2,208 | |||||||||||||||
| 81 | 20 Year U.S. Treasury Bonds | Jun. 2017 | 12,166,904 | 12,284,156 | (117,252 | ) | ||||||||||||||
|
| |||||||||||||||||||
| (115,044 | ) | |||||||||||||||||||
|
| |||||||||||||||||||
| $ | 66,589 | |||||||||||||||||||
|
| |||||||||||||||||||
U.S. Government Agency Obligations and a U.S. Treasury Obligation with a combined market value of $955,326 have been segregated with JPMorgan Chase to cover requirements for open futures contracts at February 28, 2017.
See Notes to Financial Statements.
| 30 |
Interest rate swap agreements outstanding at February 28, 2017:
Notional | Termination Date | Fixed Rate | Floating Rate | Value at Trade Date | Value at February 28, 2017 | Unrealized Appreciation (Depreciation) | ||||||||||||||||||
Centrally cleared swap agreements: | ||||||||||||||||||||||||
| 110,460 | 09/09/17 | 0.539% | 1 Day USOIS(1) | $ | 400 | $ | 175,588 | $ | 175,188 | |||||||||||||||
| 95,020 | 10/18/17 | 0.607% | 1 Day USOIS(1) | 236 | 144,946 | 144,710 | ||||||||||||||||||
| 54,305 | 11/09/17 | 0.626% | 1 Day USOIS(1) | 272 | 94,161 | 93,889 | ||||||||||||||||||
| 910 | 05/31/21 | 1.849% | 3 Month LIBOR(2) | 16 | (3,152 | ) | (3,168 | ) | ||||||||||||||||
| 11,181 | 05/31/21 | 1.948% | 3 Month LIBOR(2) | 195 | 5,992 | 5,797 | ||||||||||||||||||
| 2,590 | 01/22/22 | 2.467% | 3 Month LIBOR(1) | 165 | (56,668 | ) | (56,833 | ) | ||||||||||||||||
| 8,210 | 05/31/22 | 2.217% | 3 Month LIBOR(1) | 194 | (81,160 | ) | (81,354 | ) | ||||||||||||||||
| 945 | 11/30/22 | 1.850% | 3 Month LIBOR(1) | 21 | 11,191 | 11,170 | ||||||||||||||||||
| 7,560 | 11/30/22 | 1.982% | 3 Month LIBOR(1) | 190 | 34,612 | 34,422 | ||||||||||||||||||
| 11,118 | 08/02/23 | —(3) | —(3) | 1,030 | 14,093 | 13,063 | ||||||||||||||||||
| 7,340 | 08/02/23 | —(4) | —(4) | (2,329 | ) | 8,155 | 10,484 | |||||||||||||||||
| 2,845 | 08/03/23 | —(5) | —(5) | (1,024 | ) | 3,362 | 4,386 | |||||||||||||||||
| 5,880 | 08/19/23 | 0.898% | 1 Day USOIS(1) | 181 | 294,038 | 293,857 | ||||||||||||||||||
| 8,075 | 10/27/23 | 1.073% | 1 Day USOIS(1) | 194 | 334,915 | 334,721 | ||||||||||||||||||
| 7,185 | 11/15/23 | 2.209% | 3 Month LIBOR(1) | 189 | (24,004 | ) | (24,193 | ) | ||||||||||||||||
| 20 | 11/15/23 | 2.217% | 3 Month LIBOR(1) | (22 | ) | (76 | ) | (54 | ) | |||||||||||||||
| 13,090 | 12/20/23 | 2.932% | 3 Month LIBOR(1) | 255 | (644,983 | ) | (645,238 | ) | ||||||||||||||||
| 8,000 | 09/17/24 | 2.732% | 3 Month LIBOR(1) | 133 | (290,266 | ) | (290,399 | ) | ||||||||||||||||
| 2,920 | 09/04/25 | 2.214% | 3 Month LIBOR(1) | 171 | 10,269 | 10,098 | ||||||||||||||||||
| 8,520 | 01/08/26 | 2.210% | 3 Month LIBOR(1) | 92 | 46,492 | 46,400 | ||||||||||||||||||
| 115 | 05/15/26 | 1.652% | 3 Month LIBOR(1) | 6 | 6,261 | 6,255 | ||||||||||||||||||
|
|
|
|
|
| |||||||||||||||||||
| $ | 565 | $ | 83,766 | $ | 83,201 | |||||||||||||||||||
|
|
|
|
|
| |||||||||||||||||||
U.S. Treasury Obligations with a market value of $2,585,284 have been segregated with Citigroup Global Markets to cover requirements for open centrally cleared interest rate swap contracts at February 28, 2017.
| (1) | The Fund pays the fixed rated and receives the floating rate. |
| (2) | The Fund pays the floating rate and receives the fixed rate. |
| (3) | The Fund pays the floating rate of 3 Month LIBOR and receives the floating rate of 1 Day USOIS plus 38.5 bps. |
| (4) | The Fund pays the floating rate of 3 Month LIBOR and receives the floating rate of 1 Day USOIS plus 38.25 bps. |
| (5) | The Fund pays the floating rate of 3 Month LIBOR and receives the floating rate of 1 Day USOIS plus 38.375 bps. |
Fair Value Measurements:
Various inputs are used in determining the value of the Fund’s investments. These inputs are summarized in the three broad levels listed below.
Level 1—quoted prices generally in active markets for identical securities.
Level 2—quoted prices for similar securities, interest rates and yield curves, prepayment speeds, foreign currency exchange rates and other observable inputs.
See Notes to Financial Statements.
| Prudential Government Income Fund | 31 |
Portfolio of Investments (continued)
as of February 28, 2017
Level 3—unobservable inputs for securities valued in accordance with Board approved fair valuation procedures.
The following is a summary of the inputs used as of February 28, 2017 in valuing such portfolio securities:
| Level 1 | Level 2 | Level 3 | ||||||||||
Investments in Securities | ||||||||||||
Asset-Backed Securities | ||||||||||||
Collateralized Loan Obligations | $ | — | $ | 26,210,614 | $ | 4,997,500 | ||||||
Non-Residential Mortgage-Backed Security | — | 215,303 | — | |||||||||
Commercial Mortgage-Backed Securities | — | 77,271,442 | — | |||||||||
Corporate Bonds | — | 5,144,377 | — | |||||||||
Non-Corporate Foreign Agency | — | 478,910 | — | |||||||||
Municipal Bonds | — | 2,853,446 | — | |||||||||
Residential Mortgage-Backed Securities | — | 798,165 | — | |||||||||
U.S. Government Agency Obligations | — | 211,064,887 | — | |||||||||
U.S. Treasury Obligations | — | 160,162,156 | — | |||||||||
Affiliated Mutual Fund | 94,087,827 | — | — | |||||||||
U.S. Government Agency Obligation-Short | — | (1,535,391 | ) | — | ||||||||
Other Financial Instruments* | ||||||||||||
Futures Contracts | 66,589 | — | — | |||||||||
Centrally Cleared Interest Rate Swap Agreements | — | 83,201 | — | |||||||||
|
|
|
|
|
| |||||||
Total | $ | 94,154,416 | $ | 482,747,110 | $ | 4,997,500 | ||||||
|
|
|
|
|
| |||||||
The following is a reconciliation of assets in which unobservable inputs (Level 3) were used in determining fair value:
| Asset-Backed Collateralized Loan Obligations | ||||
Balance as of 2/29/2016 | $ | — | ||
Realized gain (loss) | — | |||
Change in unrealized appreciation (depreciation)** | (2,500 | ) | ||
Purchases/Exchanges/Issuances | 5,000,000 | |||
Sales/Paydowns | — | |||
Accrued discount/premium | — | |||
Transfers into Level 3 | — | |||
Transfers out of Level 3 | — | |||
|
| |||
Balance as of 2/28/2017 | $ | 4,997,500 | ||
|
| |||
| * | Other financial instruments are derivative instruments not reflected in the Portfolio of Investments, such as futures, forwards and centrally cleared swap contracts, which are recorded at the unrealized appreciation (depreciation) on the instrument, and OTC swap contracts which are recorded at fair value. |
| ** | Of which $(2,500) was relating to securities held at the reporting period end. |
See Notes to Financial Statements.
| 32 |
During the period, there were no transfers between Level 1, Level 2 and Level 3 to report.
Level 3 securities as presented in the table above are being fair valued using pricing methodologies approved by the Board, which contain unobservable inputs as follows:
Level 3 Securities | Fair Value as of February 28, 2017 | Valuation Methodology | Unobservable Inputs | |||||||||
Asset-Backed Collateralized Loan Obligations | $ | 4,997,500 | Market Approach | Single Broker Indicative Quote | ||||||||
|
| |||||||||||
Industry Classification:
The industry classification of investments and liabilities in excess of other assets shown as a percentage of net assets as of February 28, 2017 were as follows (unaudited):
U.S. Government Agency Obligations | 42.9 | % | ||
U.S. Treasury Obligations | 32.8 | |||
Affiliated Mutual Fund | 19.3 | |||
Commercial Mortgage-Backed Securities | 15.8 | |||
Collateralized Loan Obligations | 6.4 | |||
Diversified Financial Services | 1.0 | |||
Municipal Bonds | 0.6 | |||
Residential Mortgage-Backed Securities | 0.2 | |||
Foreign Government Agency Obligations | 0.1 | |||
|
| |||
| 119.1 | ||||
Liabilities in excess of other assets | (19.1 | ) | ||
|
| |||
| 100.0 | % | |||
|
|
Effects of Derivative Instruments on the Financial Statements and Primary Underlying Risk Exposure:
The Fund invested in derivative instruments during the reporting period. The primary type of risk associated with these derivative instruments is interest rate contracts risk. The effect of such derivative instruments on the Fund’s financial position and financial performance as reflected in the Statement of Assets and Liabilities and Statement of Operations is presented in the summary below.
See Notes to Financial Statements.
| Prudential Government Income Fund | 33 |
Portfolio of Investments (continued)
as of February 28, 2017
Fair values of derivative instruments as of February 28, 2017 as presented in the Statement of Assets and Liabilities:
Derivatives not accounted for as hedging instruments, carried at fair value | Asset Derivatives | Liability Derivatives | ||||||||||
Balance Sheet Location | Fair Value | Balance Sheet Location | Fair Value | |||||||||
| Interest rate contracts | Due from/to broker—variation margin futures | $ | 183,841 | * | Due from/to broker—variation margin futures | $ | 117,252 | * | ||||
| Interest rate contracts | Due from/to broker—variation margin swaps | 1,184,440 | * | Due from/to broker—variation margin swaps | 1,101,239 | * | ||||||
|
|
|
| |||||||||
Total | $ | 1,368,281 | $ | 1,218,491 | ||||||||
|
|
|
| |||||||||
| * | Includes cumulative appreciation (depreciation) as reported in the schedule of open futures and centrally cleared swap contracts. Only unsettled variation margin receivable (payable) is reported within the Statement of Assets and Liabilities. |
The effects of derivative instruments on the Statement of Operations for the year ended February 28, 2017 are as follows:
Amount of Realized Gain (Loss) on Derivatives Recognized in Income | ||||||||||||||||||||||||
Derivatives not accounted | Futures | Options Purchased* | Options Written | Swaps | Forward Rate Agreements | Total | ||||||||||||||||||
Interest rate contracts | $ | (136,246 | ) | $ | (448,155 | ) | $ | 180,438 | $ | (62,963 | ) | $ | 19,095 | $ | (447,831 | ) | ||||||||
|
|
|
|
|
|
|
|
|
|
|
| |||||||||||||
| * | Included in net realized gain (loss) on investment transactions in the Statement of Operations. |
Change in Unrealized Appreciation (Depreciation) on Derivatives Recognized in Income | ||||||||||||||||||||
Derivatives not accounted | Futures | Options Purchased* | Options Written | Swaps | Total | |||||||||||||||
Interest rate contracts | $ | (975,183 | ) | $ | 242,037 | $ | (85,146 | ) | $ | 4,427,087 | $ | 3,608,795 | ||||||||
|
|
|
|
|
|
|
|
|
| |||||||||||
| * | Included in net change in unrealized appreciation (depreciation) on investments in the Statement of Operations. |
See Notes to Financial Statements.
| 34 |
For the year ended February 28, 2017, the Fund’s average volume of derivative activities are as follows:
Options | Options Written(2) | Futures Contracts— Long Positions(3) | Futures Contracts— Short Positions(3) | Forward Rate Agreements(2) | Interest Rate Swap Agreements(2) | Total Return Swap Agreements(2) | ||||||||||||||||||||
| $ | 100,832 | $ | 97,019,000 | $ | 171,951,000 | $ | 51,105,931 | $ | 18,800,000 | $ | 244,604,000 | $ | 2,640,000 | |||||||||||||
| (1) | Cost. |
| (2) | Notional Amount in USD. |
| (3) | Value at Trade Date. |
See Notes to Financial Statements.
| Prudential Government Income Fund | 35 |
Statement of Assets & Liabilities
as of February 28, 2017
Assets | ||||
Investments at value: | ||||
Unaffiliated investments (cost $490,979,508) | $ | 489,196,800 | ||
Affiliated investments (cost $94,087,827) | 94,087,827 | |||
Cash | 3,003 | |||
Receivable for investments sold | 91,074,336 | |||
Dividends and interest receivable | 1,920,660 | |||
Receivable for Fund shares sold | 687,156 | |||
Prepaid expenses | 2,833 | |||
|
| |||
Total Assets | 676,972,615 | |||
|
| |||
Liabilities | ||||
Payable for investments purchased | 185,450,349 | |||
Securities sold short, at value (proceeds received $1,535,931) | 1,535,391 | |||
Payable for Fund shares reacquired | 904,181 | |||
Accrued expenses | 210,987 | |||
Management fee payable | 187,954 | |||
Distribution fee payable | 80,236 | |||
Dividends payable | 65,822 | |||
Affiliated transfer agent fee payable | 47,469 | |||
Due to broker—variation margin swaps | 11,818 | |||
Due to broker—variation margin futures | 11,301 | |||
Deferred directors’ fees | 3,170 | |||
|
| |||
Total Liabilities | 188,508,678 | |||
|
| |||
Net Assets | $ | 488,463,937 | ||
|
| |||
Net assets were comprised of: | ||||
Common stock, at par | $ | 511,818 | ||
Paid-in capital in excess of par | 487,805,426 | |||
|
| |||
| 488,317,244 | ||||
Undistributed net investment income | 366,954 | |||
Accumulated net realized gain on investment transactions | 1,414,695 | |||
Net unrealized depreciation on investments | (1,634,956 | ) | ||
|
| |||
Net assets, February 28, 2017 | $ | 488,463,937 | ||
|
| |||
See Notes to Financial Statements.
| 36 |
Class A | ||||
Net asset value and redemption price per share ($328,834,526 ÷ 34,438,406 shares of common stock issued and outstanding) | $ | 9.55 | ||
Maximum sales charge (4.50% of offering price) | 0.45 | |||
|
| |||
Maximum offering price to public | $ | 10.00 | ||
|
| |||
Class B | ||||
Net asset value, offering price and redemption price per share ($1,973,098 ÷ 206,328 shares of common stock issued and outstanding) | $ | 9.56 | ||
|
| |||
Class C | ||||
Net asset value, offering price and redemption price per share ($11,125,891 ÷ 1,162,580 shares of common stock issued and outstanding) | $ | 9.57 | ||
|
| |||
Class Q | ||||
Net asset value, offering price and redemption price per share ($33,955,874 ÷ 3,565,954 shares of common stock issued and outstanding) | $ | 9.52 | ||
|
| |||
Class R | ||||
Net asset value, offering price and redemption price per share ($16,242,815 ÷ 1,698,524 shares of common stock issued and outstanding) | $ | 9.56 | ||
|
| |||
Class Z | ||||
Net asset value, offering price and redemption price per share ($96,331,733 ÷ 10,110,019 shares of common stock issued and outstanding) | $ | 9.53 | ||
|
| |||
See Notes to Financial Statements.
| Prudential Government Income Fund | 37 |
Statement of Operations
Year Ended February 28, 2017
Net Investment Income (Loss) |
| |||
Income | ||||
Interest income | $ | 9,494,233 | ||
Affiliated dividend income | 883,872 | |||
Income from securities lending, net (including affiliated income of $8,399) | 8,399 | |||
|
| |||
Total income | 10,386,504 | |||
|
| |||
Expenses | ||||
Management fee | 2,507,009 | |||
Distribution fee—Class A | 884,307 | |||
Distribution fee—Class B | 28,020 | |||
Distribution fee—Class C | 125,705 | |||
Distribution fee—Class R | 121,921 | |||
Transfer agent’s fees and expenses (including affiliated expense of $251,500) | 864,000 | |||
Custodian and accounting fees | 162,000 | |||
Registration fees | 130,000 | |||
Shareholders’ reports | 67,000 | |||
Audit fee | 46,000 | |||
Legal fees and expenses | 21,000 | |||
Directors’ fees | 17,000 | |||
Insurance expenses | 6,000 | |||
Miscellaneous | 11,861 | |||
|
| |||
Total expenses | 4,991,823 | |||
Less: Distribution fee waiver—Class R | (40,642 | ) | ||
|
| |||
Net expenses | 4,951,181 | |||
|
| |||
Net investment income (loss) | 5,435,323 | |||
|
| |||
Realized And Unrealized Gain (Loss) On Investment Transactions | ||||
Net realized gain (loss) on: | ||||
Investment transactions (including affiliated of $525,582) | 4,164,753 | |||
Futures transactions | (136,246 | ) | ||
Options written transactions | 180,438 | |||
Forward rate agreement transactions | 19,095 | |||
Swap agreement transactions | (62,963 | ) | ||
|
| |||
| 4,165,077 | ||||
|
| |||
Net change in unrealized appreciation (depreciation) on: | ||||
Investments (including affiliated of $(514,905)) | (14,200,548 | ) | ||
Futures | (975,183 | ) | ||
Options written | (85,146 | ) | ||
Swap agreements | 4,427,087 | |||
|
| |||
| (10,833,790 | ) | |||
|
| |||
Net gain (loss) on investment transactions | (6,668,713 | ) | ||
|
| |||
Net Increase (Decrease) In Net Assets Resulting From Operations | $ | (1,233,390 | ) | |
|
| |||
See Notes to Financial Statements.
| 38 |
Statement of Changes in Net Assets
| Year Ended February 28, | ||||||||
| 2017 | 2016 | |||||||
Increase (Decrease) in Net Assets | ||||||||
Operations | ||||||||
Net investment income (loss) | $ | 5,435,323 | $ | 4,034,478 | ||||
Net realized gain (loss) on investment transactions | 4,165,077 | 2,551,646 | ||||||
Net change in unrealized appreciation (depreciation) on investments | (10,833,790 | ) | 477,143 | |||||
|
|
|
| |||||
Net increase (decrease) in net assets resulting from operations | (1,233,390 | ) | 7,063,267 | |||||
|
|
|
| |||||
Dividends and Distributions (Note 1) | ||||||||
Dividends from net investment income | ||||||||
Class A | (4,033,885 | ) | (3,797,611 | ) | ||||
Class B | (10,011 | ) | (9,444 | ) | ||||
Class C | (46,166 | ) | (30,808 | ) | ||||
Class Q | (157,500 | ) | — | |||||
Class R | (144,069 | ) | (106,166 | ) | ||||
Class Z | (1,474,216 | ) | (1,238,123 | ) | ||||
|
|
|
| |||||
| (5,865,847 | ) | (5,182,152 | ) | |||||
|
|
|
| |||||
Distributions from net realized gains | ||||||||
Class A | (1,377,495 | ) | (4,208,227 | ) | ||||
Class B | (11,865 | ) | (38,301 | ) | ||||
Class C | (48,872 | ) | (113,527 | ) | ||||
Class R | (59,044 | ) | (150,428 | ) | ||||
Class Z | (407,057 | ) | (983,440 | ) | ||||
|
|
|
| |||||
| (1,904,333 | ) | (5,493,923 | ) | |||||
|
|
|
| |||||
Fund share transactions (Net of share conversions) (Note 6) | ||||||||
Net proceeds from shares sold | 123,319,211 | 127,492,469 | ||||||
Net asset value of shares issued in reinvestment of dividends and distributions | 6,775,932 | 9,357,356 | ||||||
Cost of shares reacquired | (143,557,282 | ) | (135,794,341 | ) | ||||
|
|
|
| |||||
Net increase (decrease) in net assets from Fund share transactions | (13,462,139 | ) | 1,055,484 | |||||
|
|
|
| |||||
Total increase (decrease) | (22,465,709 | ) | (2,557,324 | ) | ||||
Net Assets: | ||||||||
Beginning of year | 510,929,646 | 513,486,970 | ||||||
|
|
|
| |||||
End of year(a) | $ | 488,463,937 | $ | 510,929,646 | ||||
|
|
|
| |||||
(a) Includes undistributed net investment income of: | $ | 366,954 | $ | 295,609 | ||||
|
|
|
| |||||
See Notes to Financial Statements.
| Prudential Government Income Fund | 39 |
Notes to Financial Statements
Prudential Investment Portfolios, Inc. 14 (the “Company”) is a diversified open-end management investment company registered under the Investment Company Act of 1940, as amended, (“1940 Act”). The Company consists of two funds: Prudential Government Income Fund (the “Fund”) and Prudential Floating Rate Income Fund. These financial statements relate to Prudential Government Income Fund.
The Fund’s investment objective is to seek high current return.
Note 1. Accounting Policies
The Fund follows investment company accounting and reporting guidance of the Financial Accounting Standards Board (“FASB”) Accounting Standard Codification Topic 946 Financial Services—Investment Companies. The following accounting policies conform to U.S. generally accepted accounting principles. The Company and the Fund consistently follow such policies in the preparation of its financial statements.
Securities Valuation: The Fund holds securities and other assets that are fair valued at the close of each day (generally 4:00 PM Eastern time) the New York Stock Exchange (“NYSE”) is open for trading. Fair value is the price that would be received to sell an asset or paid to transfer a liability in an orderly transaction between market participants on the measurement date. The Board of Directors (the “Board”) has adopted Valuation Procedures for security valuation under which fair valuation responsibilities have been delegated to PGIM Investments LLC (“PGIM Investments” or the “Manager”) (formerly known as Prudential Investments LLC). Under the current Valuation Procedures, the established Valuation Committee is responsible for supervising the valuation of portfolio securities and other assets. The Valuation Procedures permit the Fund to utilize independent pricing vendor services, quotations from market makers, and alternative valuation methods when market quotations are either not readily available or not deemed representative of fair value. A record of the Valuation Committee’s actions is subject to the Board’s review, approval, and ratification at its next regularly-scheduled quarterly meeting.
Various inputs determine how the Fund’s investments are valued, all of which are categorized according to the three broad levels (Level 1, 2, or 3) detailed in the table following the Portfolio of Investments.
Derivative instruments such as futures or options that are traded on a national securities exchange are valued at the last sale price as of the close of trading on the applicable exchange where the security principally trades. Securities traded via NASDAQ are valued at the NASDAQ official closing price. To the extent these securities are valued at the last sale price or NASDAQ official closing price, they are classified as Level 1 in the fair value hierarchy.
| 40 |
In the event that no sale or official closing price on valuation date exists, these securities are generally valued at the mean between the last reported bid and ask prices, or at the last bid price in the absence of an ask price. These securities are classified as Level 2 in the fair value hierarchy.
Investments in open-end, non-exchange-traded mutual funds are valued at their net asset values as of the close of the NYSE on the date of valuation. These securities are classified as Level 1 in the fair value hierarchy since they may be purchased or sold at their net asset values on the date of valuation.
Fixed income securities traded in the OTC market are generally classified as Level 2 in the fair value hierarchy. Such fixed income securities are typically valued using the market approach which generally involves obtaining data from an approved independent third-party vendor source. The portfolios utilize the market approach as the primary method to value securities when market prices of identical or comparable instruments are available. The third-party vendors’ valuation techniques used to derive the evaluated bid price are based on evaluating observable inputs, including but not limited to, yield curves, yield spreads, credit ratings, deal terms, tranche level attributes, default rates, cash flows, prepayment speeds, broker/dealer quotations and reported trades. Certain Level 3 securities are also valued using the market approach when obtaining a single broker quote or when utilizing recent transaction prices for identical or comparable securities.
OTC derivative instruments are generally valued using pricing vendor services, which derive the valuation based on inputs such as underlying asset prices, indices, spreads, interest rates, and exchange rates. These instruments are categorized as Level 2 in the fair value hierarchy.
Centrally cleared swaps listed or traded on a multilateral or trade facility platform, such as a registered exchange, are generally valued at the daily settlement price determined by the respective exchange. These securities are classified as Level 2 in the fair value hierarchy, as the daily settlement price is not public.
Securities and other assets that cannot be priced according to the methods described above are valued based on pricing methodologies approved by the Board. In the event that unobservable inputs are used when determining such valuations, the securities will be classified as Level 3 in the fair value hierarchy.
When determining the fair value of securities, some of the factors influencing the valuation include: the nature of any restrictions on disposition of the securities; assessment of the
| Prudential Government Income Fund | 41 |
Notes to Financial Statements (continued)
general liquidity of the securities; the issuer’s financial condition and the markets in which it does business; the cost of the investment; the size of the holding and the capitalization of the issuer; the prices of any recent transactions or bids/offers for such securities or any comparable securities; any available analyst media or other reports or information deemed reliable by the investment adviser regarding the issuer or the markets or industry in which it operates. Using fair value to price securities may result in a value that is different from a security’s most recent closing price and from the price used by other mutual funds to calculate their net asset values.
Restricted and Illiquid Securities: Subject to guidelines adopted by the Board, the Fund may invest up to 15% of its net assets in illiquid securities, including those which are restricted as to disposition under securities law (“restricted securities”). Restricted securities are valued pursuant to the valuation procedures noted above. Illiquid securities are those that, because of the absence of a readily available market or due to legal or contractual restrictions on resale, cannot be sold within seven days in the ordinary course of business at approximately the amount at which the Fund has valued the investment. Therefore, the Fund may find it difficult to sell illiquid securities at the time considered most advantageous by its Subadviser and may incur expenses that would not be incurred in the sale of securities that were freely marketable. Certain securities that would otherwise be considered illiquid because of legal restrictions on resale to the general public may be traded among qualified institutional buyers under Rule 144A of the Securities Act of 1933. These Rule 144A securities, as well as commercial paper that is sold in private placements under Section 4(2) of the Securities Act, may be deemed liquid by the Fund’s Subadviser under the guidelines adopted by the Trustees of the Fund. However, the liquidity of the Fund’s investments in Rule 144A securities could be impaired if trading does not develop or declines.
Concentration of Risk: The ability of debt securities issuers (other than those issued or guaranteed by the U.S. Government) held by the Fund to meet its obligations may be affected by the economic or political developments in a specific industry, region or country.
Financial Futures Contracts: A financial futures contract is an agreement to purchase (long) or sell (short) an agreed amount of securities at a set price for delivery on a future date. Upon entering into a financial futures contract, the Fund is required to pledge to the broker an amount of cash and/or other assets equal to a certain percentage of the contract amount. This amount is known as the “initial margin.” Subsequent payments, known as “variation margin,” are made or received by the Fund each day, depending on the daily fluctuations in the value of the underlying security. Such variation margin is recorded for financial statement purposes on a daily basis as unrealized gain or loss. When the contract expires or is closed, the gain or loss is realized and is presented in the Statement of Operations as net realized gain or loss on futures transactions.
| 42 |
The Fund invested in financial futures contracts in order to hedge its existing portfolio securities, or securities the Fund intends to purchase, against fluctuations in value caused by changes in prevailing interest rates or foreign currency exchange rates. Should interest rates move unexpectedly, the Fund may not achieve the anticipated benefits of the financial futures contracts and may realize a loss. The use of futures transactions involves the risk of imperfect correlation in movements in the price of futures contracts, interest rates and the underlying hedged assets. With exchange-traded futures contracts, there is minimal counterparty credit risk to the Fund since the exchanges’ clearing house acts as counterparty to all exchange-traded futures and guarantees the futures contracts against default.
Options: The Fund purchased and wrote options in order to hedge against adverse market movements or fluctuations in value caused by changes in prevailing interest rates or foreign currency exchange rates, with respect to securities which the Fund currently owns or intends to purchase. The Fund may also use options to gain additional market exposure. The Fund’s principal reason for writing options is to realize, through receipt of premiums, a greater current return than would be realized on the underlying security alone. When the Fund purchases an option, it pays a premium and an amount equal to that premium is recorded as an asset. When the Fund writes an option, it receives a premium and an amount equal to that premium is recorded as a liability. The asset or liability is adjusted daily to reflect the current market value of the option. If an option expires unexercised, the Fund realizes a gain or loss to the extent of the premium received or paid. If an option is exercised, the premium received or paid is recorded as an adjustment to the proceeds from the sale or the cost of the purchase in determining whether the Fund has realized a gain or loss. The difference between the premium and the amount received or paid at the closing of a purchase or sale transaction is also treated as a realized gain or loss. Gain or loss on purchased options is included in net realized gain or loss on investment transactions. Gain or loss on written options is presented separately as net realized gain or loss on options written. The Fund, as writer of an option, may have no control over whether the underlying securities may be sold (called) or purchased (put). As a result, the Fund bears the market risk of an unfavorable change in the price of the security underlying the written option. The Fund, as purchaser of an OTC option, bears the risk of the potential inability of the counterparties to meet the terms of their contracts.
With exchange-traded options contracts, there is minimal counterparty credit risk to the Fund since the exchanges’ clearinghouse acts as counterparty to all exchange traded options and guarantees the options contracts against default.
Forward Rate Agreements: Forward rate agreements represent an agreement between counterparties to exchange cash flows based on the difference between two interest rates, applied to a notional principal amount on a fixed future date. The Fund entered into forward rate agreements to gain yield exposure based on anticipated market conditions at the specified termination date of the agreement.
Swap Agreements: The Fund may enter into credit default, interest rate, total return and other forms of swap agreements. A swap agreement is an agreement to exchange the
| Prudential Government Income Fund | 43 |
Notes to Financial Statements (continued)
return generated by one instrument for the return generated by another instrument. Swap agreements are negotiated in the OTC market and may be executed either directly with counterparty (“OTC-traded”) or through a central clearing facility, such as a registered commodities exchange. Swap agreements are valued daily at current market value and any change in value is included in the net unrealized appreciation or depreciation on investments. Centrally cleared swaps pay or receive an amount known as “variation margin”, based on daily changes in the valuation of the swap contract. Payments received or paid by the Fund are recorded as realized gains or losses upon termination or maturity of the swap. Risk of loss may exceed amounts recognized on the Statements of Assets and Liabilities. Swap agreements outstanding at period end, if any, are listed on the Portfolio of Investments.
Interest Rate Swaps: Interest rate swaps represent agreements between counterparties to exchange cash flows based on the difference between two interest rates, applied to a notional principal amount for a specified period. The Fund is subject to interest rate risk exposure in the normal course of pursuing its investment objectives. The Fund used interest rate swaps to either maintain its ability to generate steady cash flow by receiving a stream of fixed rate payments or to increase exposure to prevailing market rates by receiving floating rate payments using interest rate swap contracts. The Fund’s maximum risk of loss from counterparty credit risk is the discounted net value of the cash flows to be received from the counterparty over the contract’s remaining life.
Total Return Swaps: In a total return swap, one party would receive payments based on the market value of the security or the commodity involved, or total return of a specific referenced asset, such as an equity, index or bond, and in return pay a fixed amount. The Fund is subject to risk exposures associated with the referenced asset in the normal course of pursuing its investment objectives. The Fund entered into total return swaps to manage its exposure to a security or an index. The Fund’s maximum risk of loss from counterparty credit risk is the change in the value of the security, in the Fund’s favor, from the point of entering into the contract.
When-Issued and Delayed-Delivery Securities: The Fund may purchase securities, including money market obligations, municipal bonds or other obligations, on a when-issued, delayed-delivery or forward commitment basis. When the Fund makes this type of purchase, the price and interest rate are fixed at the time of purchase, but delivery and payment for the obligations take place at a later time. The Fund does not earn interest income until the date the obligations are expected to be delivered. These types of investments potentially leverage the Fund, which could magnify losses. The Fund will segregate liquid assets, marked-to-market daily, with a value equal to any such investments.
| 44 |
Master Netting Arrangements: The Fund is subject to various Master Agreements, or netting arrangements, with select counterparties. These are agreements which a subadviser may have negotiated and entered into on behalf of the Fund. A master netting arrangement between the Fund and the counterparty permits the Fund to offset amounts payable by the Fund to the same counterparty against amounts to be received; and by the receipt of collateral from the counterparty by the Fund to cover the Fund’s exposure to the counterparty. However, there is no assurance that such mitigating factors are easily enforceable. In addition to master netting arrangements, the right to set-off exists when all the conditions are met such that each of the parties owes the other determinable amounts, the reporting party has the right to set-off the amount owed with the amount owed by the other party, the reporting party intends to set-off and the right of set-off is enforceable by law. During the reporting period, there were no intention to settle on a net basis and all amounts are presented on a gross basis on the statement of Assets and Liabilities.
The Company, on behalf of the Fund, is a party to ISDA (International Swaps and Derivatives Association, Inc.) Master Agreements with certain counterparties that govern OTC derivative and foreign exchange contracts entered into from time to time. The Master Agreements may contain provisions regarding, among other things, the parties’ general obligations, representations, agreements, collateral requirements, events of default and early termination. With respect to certain counterparties, in accordance with the terms of the Master Agreements, collateral posted to the Fund is held in a segregated account by the Fund’s custodian and with respect to those amounts which can be sold or re-pledged, is presented in the Portfolio of Investments. Collateral pledged by the Fund is segregated by the Fund’s custodian and identified in the Portfolio of Investments. Collateral can be in the form of cash or debt securities issued by the U.S. Government or related agencies or other securities as agreed to by the Fund and the applicable counterparty. Collateral requirements are determined based on the Fund’s net position with each counterparty. Termination events applicable to the Fund may occur upon a decline in the Fund’s net assets below a specified threshold over a certain period of time. Termination events applicable to counterparties may occur upon a decline in the counterparty’s long-term and short term credit ratings below a specified level. In each case, upon occurrence, the other party may elect to terminate early and cause settlement of all derivative and foreign exchange contracts outstanding, including the payment of any losses and costs resulting from such early termination, as reasonably determined by the terminating party. Any decision by one or more of the Fund’s counterparties to elect early termination could impact the Fund’s future derivative activity.
In addition to each instrument’s primary underlying risk exposure (e.g. interest rate, credit, equity or foreign exchange, etc.), swap agreements involve, to varying degrees, elements of credit, market and documentation risk. Such risks involve the possibility that no liquid market for these agreements will exist, the counterparty to the agreement may default on its obligation to perform or disagree on the contractual terms of the agreement, and changes in net interest rates will be unfavorable. In connection with these agreements, securities in the portfolio may be identified or received as collateral from the counterparty in accordance with the terms of the respective swap agreements to provide or receive assets of value and
| Prudential Government Income Fund | 45 |
Notes to Financial Statements (continued)
to serve as recourse in the event of default or bankruptcy/insolvency of either party. Such OTC derivative agreements include conditions which, when materialized, give the counterparty the right to cause an early termination of the transactions under those agreements. Any election by the counterparty for early termination of the contract(s) may impact the amounts reported on financial statements.
As of February 28, 2017, the Fund has not met conditions under such agreements which give the counterparty the right to call for an early termination.
Written options, forward rate agreements, swaps and financial futures contracts involve elements of market risk in excess of the amounts reflected on the Statement of Assets and Liabilities. Such risks may be mitigated by engaging in master netting arrangements.
Dollar Rolls: The Fund enters into mortgage dollar rolls in which the Fund sells mortgage securities for delivery in the current month, realizing a gain or loss, and simultaneously contracts to repurchase somewhat similar (same type, coupon and maturity) securities on a specified future date. During the roll period, the Fund forgoes principal and interest paid on the securities. The Fund is compensated by the interest earned on the cash proceeds of the initial sale and by the lower repurchase price at the future date. The difference between the sales proceeds and the lower repurchase price is recorded as a realized gain or loss on investment transactions. The Fund maintains a segregated account, the dollar value of which is at least equal to its obligations, with respect to dollar rolls. The Fund accounts for mortgage dollar roll transactions as purchases and sales which, as a result, can increase its portfolio turnover rate.
Securities Lending: The Fund may lend its portfolio securities to banks and broker-dealers. The loans are secured by collateral at least equal to the market value of the securities loaned. Collateral pledged by each borrower is invested in an affiliated money market fund and is marked to market daily, based on the previous day’s market value, such that the value of the collateral exceeds the value of the loaned securities. Loans are subject to termination at the option of the borrower or the Fund. Upon termination of the loan, the borrower will return to the Fund securities identical to the loaned securities. Should the borrower of the securities fail financially, the Fund has the right to repurchase the securities in the open market using the collateral. The Fund recognizes income, net of any rebate and securities lending agent fees, for lending its securities in the form of fees or interest on the investment of any cash received as collateral. The borrower receives all interest and dividends from the securities loaned and such payments are passed back to the lender in amounts equivalent thereto. The Fund also continues to recognize any unrealized gain (loss) in the market price of the securities loaned and on the change in the value of the collateral invested that may occur during the term of the loan. In addition, realized gain
| 46 |
(loss) is recognized on changes in the value of the collateral invested upon liquidation of the collateral. Net earnings from securities lending are disclosed on the Statement of Operations as “Income from securities lending, net”.
Securities Transactions and Net Investment Income: Securities transactions are recorded on the trade date. Realized gains (losses) from investment and currency transactions are calculated on the specific identification method. Dividend income is recorded on the ex-date. Interest income, including amortization of premium and accretion of discount on debt securities, as required, is recorded on the accrual basis. Expenses are recorded on the accrual basis, which may require the use of certain estimates by management that may differ from actual.
Net investment income or loss (other than distribution fees, which are charged directly to the respective class and transfer agency fees specific to Class Q shares which are charged to that share class) and unrealized and realized gains (losses) are allocated daily to each class of shares based upon the relative proportion of adjusted net assets of each class at the beginning of the day.
Dividends and Distributions: The Fund expects to pay dividends from net investment income monthly and distributions from net realized capital gains, if any, annually. Dividends and distributions to shareholders, which are determined in accordance with federal income tax regulations and which may differ from generally accepted accounting principles, are recorded on the ex-date. Permanent book/tax differences relating to income and gain (loss) are reclassified amongst undistributed net investment income, accumulated net realized gain (loss) and paid-in capital in excess of par, as appropriate.
Taxes: It is the Fund’s policy to continue to meet the requirements of the Internal Revenue Code applicable to regulated investment companies and to distribute all of its taxable net investment income and capital gains, if any, to its shareholders. Therefore, no federal income tax provision is required.
Estimates: The preparation of financial statements requires management to make estimates and assumptions that affect the reported amounts and disclosures in the financial statements. Actual results could differ from these estimates.
Note 2. Agreements
The Company, on behalf of the Fund, has a management agreement with PGIM Investments. Pursuant to this agreement, PI has responsibility for all investment advisory services and supervises the subadviser’s performance of such services. PGIM Investments has entered into a subadvisory agreement with PGIM, Inc. which provides subadvisory services to the Fund through its PGIM Fixed Income unit. The subadvisory agreement provides that PGIM, Inc. will furnish investment advisory services in connection with the management of the Fund. In connection therewith, PGIM, Inc. is obligated to keep certain books and records of the Fund. PGIM Investments pays for the services of PGIM, Inc., the
| Prudential Government Income Fund | 47 |
Notes to Financial Statements (continued)
cost of compensation of officers and employees of the Fund, occupancy and certain clerical and bookkeeping costs of the Fund. The Fund bears all other costs and expenses.
The management fee paid to PGIM Investments is accrued daily and payable monthly at an annual rate of .50% of the Fund’s average daily net assets up to and including $1 billion, .45% of the Fund’s average daily net assets of the next $1 billion, .35% of the Fund’s average daily net assets of the next $1 billion, and .30% of the average daily net assets of the Fund in excess of $3 billion. The effective management fee rate was .50% for the year ended February 28, 2017.
The Company, on behalf of the Fund, has a distribution agreement with Prudential Investment Management Services LLC (“PIMS”), which acts as the distributor of the Class A, Class B, Class C, Class Q, Class R and Class Z shares of the Fund. The Fund compensates PIMS for distributing and servicing the Fund’s Class A, Class B, Class C and Class R shares pursuant to plans of distribution (the “Distribution Plans”), regardless of expenses actually incurred by PIMS. The distribution fees for Class A, B, C and R shares are accrued daily and payable monthly. No distribution or service fees are paid to PIMS as distributor of the Class Q or Class Z shares of the Fund.
Pursuant to the Distribution Plans, the Fund compensates PIMS for distribution related activities at an annual rate of up to .25%, 1% and .75% of the average daily net assets of the Class A, C and R shares, respectively. PIMS has contractually agreed through June 30, 2018 to limit such expenses to .50% of the average daily net assets of the R shares.
Pursuant to the Class B Plan, the Fund compensates PIMS for distribution related activities at an annual rate of up to 1% of the average daily net assets of the Class B shares up to $3 billion, .80% of the next $1 billion of such assets and .50% of such assets in excess of $4 billion. The effective distribution fee rate for Class B was 1% for the year ended February 28, 2017.
PIMS has advised the Fund that it has received $154,765 in front-end sales charges resulting from sales of Class A shares during the year ended February 28, 2017. From these fees, PIMS paid such sales charges to affiliated broker-dealers which in turn paid commissions to salespersons and incurred other distribution costs.
PIMS has advised the Fund that for the year ended February 28, 2017, it received $22, $5,885 and $1,899 in contingent deferred sales charges imposed upon redemptions by certain Class A, Class B and Class C shareholders, respectively.
PGIM Investments, PGIM, Inc. and PIMS are indirect, wholly-owned subsidiaries of Prudential Financial, Inc. (“Prudential”).
| 48 |
Note 3. Other Transactions with Affiliates
Prudential Mutual Fund Services LLC (“PMFS”), an affiliate of PGIM Investments and an indirect, wholly-owned subsidiary of Prudential, serves as the Fund’s transfer agent. Transfer agent’s fees and expenses in the Statement of Operations include certain out-of-pocket expenses paid to non-affiliates, where applicable.
Prior to July 7, 2016, PGIM, Inc. was the Fund’s securities lending agent. Net earnings from securities lending, if any, are disclosed on the Statement of Operations as “Income from securities lending, net.” At the June 2016 meeting of the Board, the Board approved compensation to PGIM, Inc. related to securities lending activities. The payment was for services provided from February 5, 2016 to July 5, 2016 and totalled $1,160.
Effective July 7, 2016, the Board replaced PGIM, Inc., an indirect, wholly-owned subsidiary of Prudential, as securities lending agent with a third party agent (eSecLending).
The Fund may enter into certain securities purchase or sale transactions under Board approved Rule 17a-7 procedures. Rule 17a-7 is an exemptive rule under the 1940 Act, that permits purchase and sale transactions among affiliated investment companies, or between an investment company and a person that is affiliated solely by reason of having a common (or affiliated) investment adviser, common directors, and/or common officers. Such transactions are subject to ratification by the Board.
The Fund may invest in the Prudential Core Short-Term Bond Fund, pursuant to an exemptive order received from the Securities and Exchange Commission, its overnight sweep cash in the Prudential Core Ultra Short Bond Fund (the “Core Funds”) and its securities lending cash collateral in the Prudential Institutional Money Market Fund, (the “Money Market Fund”), each a series of Prudential Investment Portfolios 2, registered under the 1940 Act and managed by PGIM Investments. Earnings from the Core Funds and Money Market Fund are disclosed on the Statement of Operations as “Affiliated dividend income” and “Income from securities lending, net”, respectively.
Note 4. Portfolio Securities
The cost of purchases and proceeds from sales of portfolio securities, (excluding short-term investments and U.S. Treasury securities), for the year ended February 28, 2017, aggregated $3,331,458,460 and $3,394,166,481, respectively.
| Prudential Government Income Fund | 49 |
Notes to Financial Statements (continued)
Transactions in options written during the year ended February 28, 2017, were as follows:
| Notional Amount (000) | Premiums Received | |||||||
Options outstanding at February 29, 2016 | 484,120 | $ | 87,863 | |||||
Options written | 161,500 | 181,123 | ||||||
Options closed | (64,000 | ) | (131,747 | ) | ||||
Options expired | (581,620 | ) | (137,239 | ) | ||||
|
|
|
| |||||
Options outstanding at February 28, 2017 | — | $ | — | |||||
|
|
|
| |||||
Note 5. Distributions and Tax Information
Distributions to shareholders, which are determined in accordance with federal income tax regulations and which may differ from generally accepted accounting principles, are recorded on the ex-date. In order to present undistributed net investment income, accumulated net realized gain on investment transactions and paid-in capital in excess of par on the Statement of Assets and Liabilities that more closely represent their tax character, certain adjustments have been made to undistributed net investment income and accumulated net realized gain on investment transactions. For the year ended February 28, 2017, the adjustments were to increase undistributed net investment income and decrease accumulated net realized gain on investment transactions by $501,869 due to differences in the treatment for book and tax purposes of premium amortization, paydown gains (losses) and swaps. Net investment income, net realized gain (loss) on investment transactions and net assets were not affected by this change.
For the years ended February 28, 2017 and February 29, 2016, the tax character of dividends paid by the Fund were $7,770,180 and $10,676,075 of ordinary income, respectively.
As of February 28, 2017, the accumulated undistributed earnings on a tax basis was $1,411,625 of ordinary income and $1,423,834 of long-term capital gains. This differs from the amount shown on the Statement of Assets and Liabilities primarily due to cumulative timing differences between financial and tax reporting.
The United States federal income tax basis of investments and total net unrealized depreciation as of February 28, 2017 were as follows:
Tax Basis | Appreciation | Depreciation | Net | Other Cost Basis | Total Net | |||||
| $585,973,851 | $4,551,416 | $(7,240,640) | $(2,689,224) | $69,451 | $(2,619,773) |
| 50 |
The difference between book basis and tax basis was primarily attributable to deferred losses on wash sales and the difference in the treatment of premium amortization for book and tax purposes. The other cost basis adjustments are primarily attributable to appreciation (depreciation) of swaps, futures and options.
Management has analyzed the Fund’s tax positions taken on federal, state and local income tax returns for all open tax years and has concluded that no provision for income tax is required in the Fund’s financial statements for the current reporting period. The Fund’s federal, state and local income and federal excise tax returns for tax years for which the applicable statutes of limitations have not expired are subject to examination by the Internal Revenue Service and state departments of revenue.
Note 6. Capital
The Fund offers Class A, Class B, Class C, Class Q, Class R and Class Z shares. Class A shares are sold with a front-end sales charge of up to 4.50% and all investors who purchase Class A shares in an amount of $1 million or more and sell these shares within 12 months of purchase are subject to a contingent deferred sales charge (“CDSC”) of 1%, including investors who purchase their shares through broker-dealers affiliated with Prudential. Class B shares are sold with a CDSC which declines from 5% to zero depending on the period of time the shares are held. Class B shares automatically convert to Class A shares on a quarterly basis approximately seven years after purchase. Class C shares purchased are subject to a CDSC of 1% for 12 months from the date of purchase. A special exchange privilege is also available for shareholders who qualified to purchase Class A shares at net asset value. Class Q, Class R and Class Z shares are not subject to any sales or redemption charge and are available exclusively for sale to a limited group of investors.
Under certain circumstances, an exchange may be made from specified share classes of the Fund to one or more other share classes of the Fund as presented in the table of transactions in shares of common stock.
There are 3.4 billion shares of common stock, $.01 par value per share, divided into seven classes, designated Class A, Class B, Class C, Class Q, Class R, Class T and Class Z common stock, each of which consists of 230 million, 5 million, 495 million, 500 million, 500 million, 270 million and 500 million authorized shares, respectively. The Fund currently does not have any Class T shares outstanding.
As of February 28, 2017, Prudential owned 1,025 Class Q shares of the Fund. In addition, four shareholders of record held 41% of the Fund’s outstanding shares on behalf of multiple beneficial owners.
| Prudential Government Income Fund | 51 |
Notes to Financial Statements (continued)
Transactions in shares of common stock were as follows:
Class A | Shares | Amount | ||||||
Year ended February 28, 2017: | ||||||||
Shares sold | 4,429,044 | $ | 43,021,817 | |||||
Shares issued in reinvestment of dividends and distributions | 468,033 | 4,542,225 | ||||||
Shares reacquired | (8,267,529 | ) | (80,205,446 | ) | ||||
|
|
|
| |||||
Net increase (decrease) in shares outstanding before conversion | (3,370,452 | ) | (32,641,404 | ) | ||||
Shares issued upon conversion from other share class(es) | 64,624 | 625,506 | ||||||
Shares reacquired upon conversion into other share class(es) | (496,033 | ) | (4,754,192 | ) | ||||
|
|
|
| |||||
Net increase (decrease) in shares outstanding | (3,801,861 | ) | $ | (36,770,090 | ) | |||
|
|
|
| |||||
Year ended February 29, 2016: | ||||||||
Shares sold | 5,000,430 | $ | 48,180,887 | |||||
Shares issued in reinvestment of dividends and distributions | 707,366 | 6,819,567 | ||||||
Shares reacquired | (6,840,933 | ) | (65,897,882 | ) | ||||
|
|
|
| |||||
Net increase (decrease) in shares outstanding before conversion | (1,133,137 | ) | (10,897,428 | ) | ||||
Shares issued upon conversion from other share class(es) | 61,017 | 586,520 | ||||||
Shares reacquired upon conversion into other share class(es) | (296,520 | ) | (2,842,038 | ) | ||||
|
|
|
| |||||
Net increase (decrease) in shares outstanding | (1,368,640 | ) | $ | (13,152,946 | ) | |||
|
|
|
| |||||
Class B | ||||||||
Year ended February 28, 2017: | ||||||||
Shares sold | 79,968 | $ | 778,272 | |||||
Shares issued in reinvestment of dividends and distributions | 1,936 | 18,812 | ||||||
Shares reacquired | (129,049 | ) | (1,249,106 | ) | ||||
|
|
|
| |||||
Net increase (decrease) in shares outstanding before conversion | (47,145 | ) | (452,022 | ) | ||||
Shares reacquired upon conversion into other share class(es) | (63,584 | ) | (616,100 | ) | ||||
|
|
|
| |||||
Net increase (decrease) in shares outstanding | (110,729 | ) | $ | (1,068,122 | ) | |||
|
|
|
| |||||
Year ended February 29, 2016: | ||||||||
Shares sold | 58,501 | $ | 564,915 | |||||
Shares issued in reinvestment of dividends and distributions | 4,173 | 40,313 | ||||||
Shares reacquired | (76,549 | ) | (739,211 | ) | ||||
|
|
|
| |||||
Net increase (decrease) in shares outstanding before conversion | (13,875 | ) | (133,983 | ) | ||||
Shares reacquired upon conversion into other share class(es) | (57,284 | ) | (551,231 | ) | ||||
|
|
|
| |||||
Net increase (decrease) in shares outstanding | (71,159 | ) | $ | (685,214 | ) | |||
|
|
|
| |||||
| 52 |
Class C | Shares | Amount | ||||||
Year ended February 28, 2017: | ||||||||
Shares sold | 376,987 | $ | 3,671,427 | |||||
Shares issued in reinvestment of dividends and distributions | 9,228 | 89,629 | ||||||
Shares reacquired | (467,673 | ) | (4,522,293 | ) | ||||
|
|
|
| |||||
Net increase (decrease) in shares outstanding before conversion | (81,458 | ) | (761,237 | ) | ||||
Shares reacquired upon conversion into other share class(es) | (38,663 | ) | (368,409 | ) | ||||
|
|
|
| |||||
Net increase (decrease) in shares outstanding | (120,121 | ) | $ | (1,129,646 | ) | |||
|
|
|
| |||||
Year ended February 29, 2016: | ||||||||
Shares sold | 534,884 | $ | 5,167,891 | |||||
Shares issued in reinvestment of dividends and distributions | 14,028 | 135,640 | ||||||
Shares reacquired | (285,439 | ) | (2,752,767 | ) | ||||
|
|
|
| |||||
Net increase (decrease) in shares outstanding before conversion | 263,473 | 2,550,764 | ||||||
Shares reacquired upon conversion into other share class(es) | (1,938 | ) | (18,509 | ) | ||||
|
|
|
| |||||
Net increase (decrease) in shares outstanding | 261,535 | $ | 2,532,255 | |||||
|
|
|
| |||||
Class Q | ||||||||
Period ended February 28, 2017*: | ||||||||
Shares sold | 359,932 | $ | 3,416,086 | |||||
Shares issued in reinvestment of dividends and distributions | 16,417 | 157,500 | ||||||
Shares reacquired | (344,179 | ) | (3,312,887 | ) | ||||
|
|
|
| |||||
Net increase (decrease) in shares outstanding before conversion | 32,170 | 260,699 | ||||||
Shares issued upon conversion from other share class(es) | 3,533,784 | 34,085,996 | ||||||
|
|
|
| |||||
Net increase (decrease) in shares outstanding | 3,565,954 | $ | 34,346,695 | |||||
|
|
|
| |||||
Class R | ||||||||
Year ended February 28, 2017: | ||||||||
Shares sold | 781,369 | $ | 7,624,379 | |||||
Shares issued in reinvestment of dividends and distributions | 16,299 | 158,309 | ||||||
Shares reacquired | (665,638 | ) | (6,457,847 | ) | ||||
|
|
|
| |||||
Net increase (decrease) in shares outstanding | 132,030 | $ | 1,324,841 | |||||
|
|
|
| |||||
Year ended February 29, 2016: | ||||||||
Shares sold | 808,801 | $ | 7,814,755 | |||||
Shares issued in reinvestment of dividends and distributions | 20,354 | 196,581 | ||||||
Shares reacquired | (598,157 | ) | (5,772,627 | ) | ||||
|
|
|
| |||||
Net increase (decrease) in shares outstanding | 230,998 | $ | 2,238,709 | |||||
|
|
|
| |||||
| Prudential Government Income Fund | 53 |
Notes to Financial Statements (continued)
Class Z | Shares | Amount | ||||||
Year ended February 28, 2017: | ||||||||
Shares sold | 6,678,316 | $ | 64,807,230 | |||||
Shares issued in reinvestment of dividends and distributions | 186,895 | 1,809,457 | ||||||
Shares reacquired | (4,954,385 | ) | (47,809,703 | ) | ||||
|
|
|
| |||||
Net increase (decrease) in shares outstanding before conversion | 1,910,826 | 18,806,984 | ||||||
Shares issued upon conversion from other share class(es) | 535,060 | 5,113,195 | ||||||
Shares reacquired upon conversion into other share class(es) | (3,531,155 | ) | (34,085,996 | ) | ||||
|
|
|
| |||||
Net increase (decrease) in shares outstanding | (1,085,269 | ) | $ | (10,165,817 | ) | |||
|
|
|
| |||||
Year ended February 29, 2016: | ||||||||
Shares sold | 6,847,204 | $ | 65,764,021 | |||||
Shares issued in reinvestment of dividends and distributions | 225,119 | 2,165,255 | ||||||
Shares reacquired | (6,300,385 | ) | (60,631,854 | ) | ||||
|
|
|
| |||||
Net increase (decrease) in shares outstanding before conversion | 771,938 | 7,297,422 | ||||||
Shares issued upon conversion from other share class(es) | 297,274 | 2,842,064 | ||||||
Shares reacquired upon conversion into other share class(es) | (1,734 | ) | (16,806 | ) | ||||
|
|
|
| |||||
Net increase (decrease) in shares outstanding | 1,067,478 | $ | 10,122,680 | |||||
|
|
|
| |||||
| * | Commencement of offering was August 9, 2016. |
Note 7. Borrowings
The Fund, along with other affiliated registered investment companies (the “Funds”), is a party to a Syndicated Credit Agreement (“SCA”) with a group of banks. The purpose of the SCA is to provide an alternative source of temporary funding for capital share redemptions. The SCA provides for a commitment of $900 million for the period October 6, 2016 through October 5, 2017. The Funds pay an annualized commitment fee of .15% of the unused portion of the SCA. Prior to October 6, 2016, the Funds had a prior SCA that provided a commitment of $900 million in which the Funds paid an annualized commitment fee of .11% of the unused portion of the prior SCA. For the SCA and the prior SCA, the Fund’s portion of the commitment fee for the unused amount, allocated based upon a method approved by the Board, is accrued daily and paid quarterly. The interest on borrowings under each SCA is paid monthly and at a per annum interest rate based upon a contractual spread plus the higher of (1) the effective federal funds rate, (2) the 1-month LIBOR rate or (3) zero percent.
The Fund did not utilize the SCA during the year ended February 28, 2017.
Note 8. New Accounting Pronouncements
In December 2016, the FASB released an Accounting Standards Update (“ASU”) that makes technical changes to various sections of the Accounting Standards Codification (“ASC”), including Topic 820, Fair Value Measurement. The changes to Topic 820 are
| 54 |
intended to clarify the difference between a valuation approach and a valuation technique. The changes to ASC 820-10-50-2 require a reporting entity to disclose, for Level 2 and Level 3 fair value measurements, a change in either or both a valuation approach and a valuation technique and the reason(s) for the change. The changes to Topic 820 are effective for fiscal years, and interim periods within those fiscal years, beginning after December 15, 2016. At this time, management is evaluating the implications of the ASU and its impact on the financial statements and disclosures has not yet been determined.
On October 13, 2016, the Securities and Exchange Commission (“SEC”) adopted new rules and forms and amended existing rules and forms which are intended to modernize and enhance the reporting and disclosure of information by registered investment companies and to improve the quality of information that funds provide to investors, including modifications to Regulation S-X which would require standardized, enhanced disclosure about derivatives in investment company financial statements. The new rules also enhance disclosure regarding fund liquidity and redemption practices. Also under the new rules, the SEC will permit open-end funds, with the exception of money market funds, to offer swing pricing, subject to board approval and review. The compliance dates of the modifications to Regulation S-X are August 1, 2017 and other amendments and rules are generally June 1, 2018 and December 1, 2018. Management is currently evaluating the impacts to the financial statement disclosures, if any.
| Prudential Government Income Fund | 55 |
Financial Highlights
| Class A Shares | ||||||||||||||||||||
| Year Ended February 28/29, | ||||||||||||||||||||
| 2017(a) | 2016(a) | 2015(a) | 2014(a) | 2013 | ||||||||||||||||
| Per Share Operating Performance: | ||||||||||||||||||||
| Net Asset Value, Beginning Of Year | $9.72 | $9.79 | $9.52 | $9.78 | $10.01 | |||||||||||||||
| Income (loss) from investment operations: | ||||||||||||||||||||
| Net investment income (loss) | .10 | .08 | .11 | .14 | .17 | |||||||||||||||
| Net realized and unrealized gain (loss) on investment transactions | (.12 | ) | .06 | .28 | (.19 | ) | .12 | |||||||||||||
| Total from investment operations | (.02 | ) | .14 | .39 | (.05 | ) | .29 | |||||||||||||
| Less Dividends and Distributions: | ||||||||||||||||||||
| Dividends from net investment income | (.11 | ) | (.10 | ) | (.12 | ) | (.15 | ) | (.22 | ) | ||||||||||
| Distributions from net realized gains | (.04 | ) | (.11 | ) | - | (.06 | ) | (.30 | ) | |||||||||||
| Total dividends and distributions | (.15 | ) | (.21 | ) | (.12 | ) | (.21 | ) | (.52 | ) | ||||||||||
| Net asset value, end of year | $9.55 | $9.72 | $9.79 | $9.52 | $9.78 | |||||||||||||||
| Total Return(b): | (.24)% | 1.41% | 4.08% | (.47)% | 2.87% | |||||||||||||||
| Ratios/Supplemental Data: | ||||||||||||||||||||
| Net assets, end of year (000) | $328,835 | $371,571 | $387,663 | $412,384 | $469,188 | |||||||||||||||
| Average net assets (000) | $353,716 | $373,443 | $403,927 | $435,734 | $511,930 | |||||||||||||||
| Ratios to average net assets(c): | ||||||||||||||||||||
| Expenses after waivers and/or expense reimbursement(e) | 1.02% | .99% | 1.01% | .97% | .93% | |||||||||||||||
| Expenses before waivers and/or expense reimbursement(e) | 1.02% | .99% | 1.06% | 1.02% | .98% | |||||||||||||||
| Net investment income (loss) | 1.05% | .79% | 1.15% | 1.48% | 1.73% | |||||||||||||||
| Portfolio turnover rate(d) | 759% | 778% | 817% | 1,042% | 1,251% | |||||||||||||||
| (a) | Calculated based on average shares outstanding during the year. |
| (b) | Total return does not consider the effects of sales loads. Total return is calculated assuming a purchase of a share on the first day and a sale on the last day of each year reported and includes reinvestment of dividends and distributions, if any. Total returns may reflect adjustments to conform to generally accepted accounting principles. |
| (c) | Does not include expenses of the underlying portfolios in which the Fund invests. |
| (d) | The Fund accounts for mortgage dollar roll transactions as purchases and sales which, as a result, can increase its portfolio turnover rate. |
| (e) | The distributor of the Fund had contractually agreed to limit its distribution and service (12b-1) fees to .25% of the average daily net assets through March 8, 2015. Effective March 9, 2015, the contractual distribution and service (12b-1) fees were reduced from .30% to .25% of average daily net assets. |
See Notes to Financial Statements.
| 56 |
| Class B Shares | ||||||||||||||||||||
| Year Ended February 28/29, | ||||||||||||||||||||
| 2017(a) | 2016(a) | 2015(a) | 2014(a) | 2013 | ||||||||||||||||
| Per Share Operating Performance: | ||||||||||||||||||||
| Net Asset Value, Beginning Of Year | $9.73 | $9.80 | $9.53 | $9.80 | $10.03 | |||||||||||||||
| Income (loss) from investment operations: | ||||||||||||||||||||
| Net investment income (loss) | .03 | - | (e) | .04 | .07 | .08 | ||||||||||||||
| Net realized and unrealized gain (loss) on investment transactions | (.13 | ) | .07 | .27 | (.20 | ) | .13 | |||||||||||||
| Total from investment operations | (.10 | ) | .07 | .31 | (.13 | ) | .21 | |||||||||||||
| Less Dividends and Distributions: | ||||||||||||||||||||
| Dividends from net investment income | (.03 | ) | (.03 | ) | (.04 | ) | (.08 | ) | (.14 | ) | ||||||||||
| Distributions from net realized gains | (.04 | ) | (.11 | ) | - | (.06 | ) | (.30 | ) | |||||||||||
| Total dividends and distributions | (.07 | ) | (.14 | ) | (.04 | ) | (.14 | ) | (.44 | ) | ||||||||||
| Net asset value, end of year | $9.56 | $9.73 | $9.80 | $9.53 | $9.80 | |||||||||||||||
| Total Return(b): | (1.01)% | .69% | 3.30% | (1.32)% | 2.11% | |||||||||||||||
| Ratios/Supplemental Data: | ||||||||||||||||||||
| Net assets, end of year (000) | $1,973 | $3,085 | $3,805 | $5,687 | $9,408 | |||||||||||||||
| Average net assets (000) | $2,802 | $3,151 | $4,682 | $7,274 | $10,975 | |||||||||||||||
| Ratios to average net assets(c): | ||||||||||||||||||||
| Expenses after waivers and/or expense reimbursement | 1.76% | 1.74% | 1.76% | 1.72% | 1.68% | |||||||||||||||
| Expenses before waivers and/or expense reimbursement | 1.76% | 1.74% | 1.76% | 1.72% | 1.68% | |||||||||||||||
| Net investment income (loss) | .30% | .04% | .40% | .75% | .98% | |||||||||||||||
| Portfolio turnover rate(d) | 759% | 778% | 817% | 1,042% | 1,251% | |||||||||||||||
| (a) | Calculated based on average shares outstanding during the year. |
| (b) | Total return does not consider the effects of sales loads. Total return is calculated assuming a purchase of a share on the first day and a sale on the last day of each year reported and includes reinvestment of dividends and distributions, if any. Total returns may reflect adjustments to conform to generally accepted accounting principles. |
| (c) | Does not include expenses of the underlying portfolios in which the Fund invests. |
| (d) | The Fund accounts for mortgage dollar roll transactions as purchases and sales which, as a result, can increase its portfolio turnover rate. |
| (e) | Less than $.005 per share. |
See Notes to Financial Statements.
| Prudential Government Income Fund | 57 |
Financial Highlights (continued)
| Class C Shares | ||||||||||||||||||||
| Year Ended February 28/29, | ||||||||||||||||||||
| 2017(a) | 2016(a) | 2015(a) | 2014(a) | 2013 | ||||||||||||||||
| Per Share Operating Performance: | ||||||||||||||||||||
| Net Asset Value, Beginning Of Year | $9.74 | $9.81 | $9.54 | $9.80 | $10.03 | |||||||||||||||
| Income (loss) from investment operations: | ||||||||||||||||||||
| Net investment income (loss) | .03 | - | (e) | .04 | .07 | .10 | ||||||||||||||
| Net realized and unrealized gain (loss) on investment transactions | (.12 | ) | .07 | .27 | (.19 | ) | .11 | |||||||||||||
| Total from investment operations | (.09 | ) | .07 | .31 | (.12 | ) | .21 | |||||||||||||
| Less Dividends and Distributions: | ||||||||||||||||||||
| Dividends from net investment income | (.04 | ) | (.03 | ) | (.04 | ) | (.08 | ) | (.14 | ) | ||||||||||
| Distributions from net realized gains | (.04 | ) | (.11 | ) | - | (.06 | ) | (.30 | ) | |||||||||||
| Total dividends and distributions | (.08 | ) | (.14 | ) | (.04 | ) | (.14 | ) | (.44 | ) | ||||||||||
| Net asset value, end of year | $9.57 | $9.74 | $9.81 | $9.54 | $9.80 | |||||||||||||||
| Total Return(b): | (1.01)% | .69% | 3.30% | (1.22)% | 2.11% | |||||||||||||||
| Ratios/Supplemental Data: | ||||||||||||||||||||
| Net assets, end of year (000) | $11,126 | $12,488 | $10,016 | $11,114 | $20,274 | |||||||||||||||
| Average net assets (000) | $12,570 | $10,548 | $10,394 | $15,601 | $21,678 | |||||||||||||||
| Ratios to average net assets(c): | ||||||||||||||||||||
| Expenses after waivers and/or expense reimbursement | 1.77% | 1.74% | 1.76% | 1.72% | 1.68% | |||||||||||||||
| Expenses before waivers and/or expense reimbursement | 1.77% | 1.74% | 1.76% | 1.72% | 1.68% | |||||||||||||||
| Net investment income (loss) | .30% | .03% | .40% | .75% | .97% | |||||||||||||||
| Portfolio turnover rate(d) | 759% | 778% | 817% | 1,042% | 1,251% | |||||||||||||||
| (a) | Calculated based on average shares outstanding during the year. |
| (b) | Total return does not consider the effects of sales loads. Total return is calculated assuming a purchase of a share on the first day and a sale on the last day of each year reported and includes reinvestment of dividends and distributions, if any. Total returns may reflect adjustments to conform to generally accepted accounting principles. |
| (c) | Does not include expenses of the underlying portfolios in which the Fund invests. |
| (d) | The Fund accounts for mortgage dollar roll transactions as purchases and sales which, as a result, can increase its portfolio turnover rate. |
| (e) | Less than $.005 per share. |
See Notes to Financial Statements.
| 58 |
| Class Q Shares | ||||
August 9, Feburary 28, | ||||
| Per Share Operating Performance(b): | ||||
| Net Asset Value, Beginning Of Period | $9.84 | |||
| Income (loss) from investment operations: | ||||
| Net investment income (loss) | .08 | |||
| Net realized and unrealized gain (loss) on investment transactions | (.32 | ) | ||
| Total from investment operations | (.24 | ) | ||
| Less Dividends and Distributions: | ||||
| Dividends from net investment income | (.08 | ) | ||
| Total dividends and distributions | (.08 | ) | ||
| Net asset value, end of period | $9.52 | |||
| Total Return(c): | (2.39)% | |||
| Ratios/Supplemental Data: | ||||
| Net assets, end of period (000) | $33,956 | |||
| Average net assets (000) | $17,541 | |||
| Ratios to average net assets(d): | ||||
| Expenses after waivers and/or expense reimbursement | .62% | (f) | ||
| Expenses before waivers and/or expense reimbursement | .62% | (f) | ||
| Net investment income (loss) | 1.47% | (f) | ||
| Portfolio turnover rate(e) | 759% | (g) | ||
| (a) | Commencement of operations. |
| (b) | Calculated based on average shares outstanding during the period. |
| (c) | Total return is calculated assuming a purchase of a share on the first day and a sale on the last day of each period reported and includes reinvestment of dividends and distributions, if any. Total returns may reflect adjustments to conform to generally accepted accounting principles. Total returns for periods of less than one full year are not annualized. |
| (d) | Does not include expenses of the underlying portfolios in which the Fund invests. |
| (e) | The Fund accounts for mortgage dollar roll transactions as purchases and sales which, as a result, can increase its portfolio turnover rate. |
| (f) | Annualized. |
| (g) | Not annualized. |
See Notes to Financial Statements.
| Prudential Government Income Fund | 59 |
Financial Highlights (continued)
| Class R Shares | ||||||||||||||||||||
| Year Ended February 28/29, | ||||||||||||||||||||
| 2017(a) | 2016(a) | 2015(a) | 2014(a) | 2013 | ||||||||||||||||
| Per Share Operating Performance: | ||||||||||||||||||||
| Net Asset Value, Beginning Of Year | $9.73 | $9.80 | $9.53 | $9.80 | $10.03 | |||||||||||||||
| Income (loss) from investment operations: | ||||||||||||||||||||
| Net investment income (loss) | .08 | .05 | .09 | .12 | .15 | |||||||||||||||
| Net realized and unrealized gain (loss) on investment transactions | (.12 | ) | .06 | .27 | (.20 | ) | .11 | |||||||||||||
| Total from investment operations | (.04 | ) | .11 | .36 | (.08 | ) | .26 | |||||||||||||
| Less Dividends and Distributions: | ||||||||||||||||||||
| Dividends from net investment income | (.09 | ) | (.07 | ) | (.09 | ) | (.13 | ) | (.19 | ) | ||||||||||
| Distributions from net realized gains | (.04 | ) | (.11 | ) | - | (.06 | ) | (.30 | ) | |||||||||||
| Total dividends and distributions | (.13 | ) | (.18 | ) | (.09 | ) | (.19 | ) | (.49 | ) | ||||||||||
| Net asset value, end of year | $9.56 | $9.73 | $9.80 | $9.53 | $9.80 | |||||||||||||||
| Total Return(b): | (.49 | )% | 1.16% | 3.82% | (.82 | )% | 2.62% | |||||||||||||
| Ratios/Supplemental Data: | ||||||||||||||||||||
| Net assets, end of year (000) | $16,243 | $15,242 | $13,089 | $10,560 | $10,316 | |||||||||||||||
| Average net assets (000) | $16,257 | $13,851 | $12,178 | $10,227 | $9,701 | |||||||||||||||
| Ratios to average net assets(c): | ||||||||||||||||||||
| Expenses after waivers and/or expense reimbursement | 1.27% | 1.24% | 1.26% | 1.22% | 1.18% | |||||||||||||||
| Expenses before waivers and/or expense reimbursement | 1.52% | 1.49% | 1.51% | 1.47% | 1.43% | |||||||||||||||
| Net investment income (loss) | .81% | .53% | .90% | 1.22% | 1.47% | |||||||||||||||
| Portfolio turnover rate(d) | 759% | 778% | 817% | 1,042% | 1,251% | |||||||||||||||
| (a) | Calculated based on average shares outstanding during the year. |
| (b) | Total return is calculated assuming a purchase of a share on the first day and a sale on the last day of each year reported and includes reinvestment of dividends and distributions, if any. Total returns may reflect adjustments to conform to generally accepted accounting principles. |
| (c) | Does not include expenses of the underlying portfolios in which the Fund invests. |
| (d) | The Fund accounts for mortgage dollar roll transactions as purchases and sales which, as a result, can increase its portfolio turnover rate. |
See Notes to Financial Statements.
| 60 |
| Class Z Shares | ||||||||||||||||||||
| Year Ended February 28/29, | ||||||||||||||||||||
| 2017(a) | 2016(a) | 2015(a) | 2014(a) | 2013 | ||||||||||||||||
| Per Share Operating Performance: | ||||||||||||||||||||
| Net Asset Value, Beginning Of Year | $9.70 | $9.77 | $9.50 | $9.76 | $9.99 | |||||||||||||||
| Income (loss) from investment operations: | ||||||||||||||||||||
| Net investment income (loss) | .13 | .10 | .13 | .17 | .20 | |||||||||||||||
| Net realized and unrealized gain (loss) on investment transactions | (.13 | ) | .06 | .28 | (.19 | ) | .11 | |||||||||||||
| Total from investment operations | .00 | .16 | .41 | (.02 | ) | .31 | ||||||||||||||
| Less Dividends and Distributions: | ||||||||||||||||||||
| Dividends from net investment income | (.13 | ) | (.12 | ) | (.14 | ) | (.18 | ) | (.24 | ) | ||||||||||
| Distributions from net realized gains | (.04 | ) | (.11 | ) | - | (.06 | ) | (.30 | ) | |||||||||||
| Total dividends and distributions | (.17 | ) | (.23 | ) | (.14 | ) | (.24 | ) | (.54 | ) | ||||||||||
| Net asset value, end of year | $9.53 | $9.70 | $9.77 | $9.50 | $9.76 | |||||||||||||||
| Total Return(b): | .00% | 1.67% | 4.34% | (.22 | )% | 3.13% | ||||||||||||||
| Ratios/Supplemental Data: | ||||||||||||||||||||
| Net assets, end of year (000) | $96,332 | $108,544 | $98,913 | $73,888 | $95,710 | |||||||||||||||
| Average net assets (000) | $106,342 | $98,389 | $79,893 | $83,182 | $95,810 | |||||||||||||||
| Ratios to average net assets(c): | ||||||||||||||||||||
| Expenses after waivers and/or expense reimbursement | .77% | .74% | .76% | .72% | .68% | |||||||||||||||
| Expenses before waivers and/or expense reimbursement | .77% | .74% | .76% | .72% | .68% | |||||||||||||||
| Net investment income (loss) | 1.31% | 1.03% | 1.40% | 1.74% | 1.97% | |||||||||||||||
| Portfolio turnover rate(d) | 759% | 778% | 817% | 1,042% | 1,251% | |||||||||||||||
| (a) | Calculated based on average shares outstanding during the year. |
| (b) | Total return is calculated assuming a purchase of a share on the first day and a sale on the last day of each year reported and includes reinvestment of dividends and distributions, if any. Total returns may reflect adjustments to conform to generally accepted accounting principles. |
| (c) | Does not include expenses of the underlying portfolios in which the Fund invests. |
| (d) | The Fund accounts for mortgage dollar roll transactions as purchases and sales which, as a result, can increase its portfolio turnover rate. |
See Notes to Financial Statements.
| Prudential Government Income Fund | 61 |
Report of Independent Registered Public Accounting Firm
The Board of Directors and Shareholders
Prudential Investment Portfolios, Inc. 14:
We have audited the accompanying statement of assets and liabilities of Prudential Government Income Fund (the “Fund”), one of the two series constituting Prudential Investment Portfolios, Inc. 14, including the portfolio of investments, as of February 28, 2017, and the related statement of operations for the year then ended, the statements of changes in net assets for each of the years in the two-year period then ended, and the financial highlights for each of the years in the five-year period then ended. These financial statements and financial highlights are the responsibility of the Fund’s management. Our responsibility is to express an opinion on these financial statements and financial highlights based on our audits.
We conducted our audits in accordance with the standards of the Public Company Accounting Oversight Board (United States). Those standards require that we plan and perform the audit to obtain reasonable assurance about whether the financial statements and financial highlights are free of material misstatement. An audit includes examining, on a test basis, evidence supporting the amounts and disclosures in the financial statements. Our procedures included confirmation of securities owned as of February 28, 2017, by correspondence with the custodian, transfer agent and brokers or by other appropriate auditing procedures when replies from brokers were not received. An audit also includes assessing the accounting principles used and significant estimates made by management, as well as evaluating the overall financial statement presentation. We believe that our audits provide a reasonable basis for our opinion.
In our opinion, the financial statements and financial highlights referred to above present fairly, in all material respects, the financial position of the Fund as of February 28, 2017, and the results of its operations for the year then ended, the changes in its net assets for each of the years in the two-year period then ended, and the financial highlights for each of the years in the five-year period then ended, in conformity with U.S. generally accepted accounting principles.

New York, New York
April 18, 2017
| 62 |
Tax Information (unaudited)
For the year ended February 28, 2017, the Fund reports the maximum amount allowable but not less than 77.76% as interest-related dividends in accordance with Section 871(k)(1) and 881(e)(1) of the Internal Revenue Code.
In January 2018, you will be advised on IRS Form 1099-DIV or substitute 1099-DIV, as to the Federal tax status of the dividends received by you in calendar year 2017.
We are required by Massachusetts, Missouri and Oregon to inform you that dividends which have been derived from interest on federal obligations are not taxable to shareholders providing the Mutual Fund meets certain requirements mandated by the respective state’s taxing authorities. We are pleased to report that 22.01% of the dividends paid by the Fund qualify for such deduction.
For more detailed information regarding your state and local taxes, you should contact your tax adviser or the state/local taxing authorities.
| Prudential Government Income Fund | 63 |
INFORMATION ABOUT BOARD MEMBERS AND OFFICERS
(Unaudited)
Information about Board Members and Officers of the Funds is set forth below. Board Members who are not deemed to be “interested persons” of the Funds, as defined in the 1940 Act, are referred to as “Independent Board Members.” Board Members who are deemed to be “interested persons” of the Funds are referred to as “Interested Board Members.” The Board Members are responsible for the overall supervision of the operations of the Funds and perform the various duties imposed on the directors of investment companies by the 1940 Act. The Board in turn elects the Officers, who are responsible for administering the day-to-day operations of the Funds.
| Independent Board Members(1) | ||||
Name, Address, Age Position(s) Portfolios Overseen | Principal Occupation(s) During Past Five Years | Other Directorships Held During Past Five Years | ||
Ellen S. Alberding (59) Board Member Portfolios Overseen: 88 | President and Board Member, The Joyce Foundation (charitable foundation) (since 2002); Vice Chair, City Colleges of Chicago (community college system) (since 2011); Trustee, Skills for America’s Future (national initiative to connect employers to community colleges) (since 2011); Trustee, National Park Foundation (charitable foundation for national park system) (since 2009); Trustee, Economic Club of Chicago (since 2009). | None. | ||
Kevin J. Bannon (64) Board Member Portfolios Overseen: 88 | Managing Director (April 2008-May 2015) and Chief Investment Officer (October 2008-November 2013) of Highmount Capital LLC (registered investment adviser); formerly Executive Vice President and Chief Investment Officer (April 1993-August 2007) of Bank of New York Company; President (May 2003-May 2007) of BNY Hamilton Family of Mutual Funds. | Director of Urstadt Biddle Properties (equity real estate investment trust) (since September 2008). | ||
Linda W. Bynoe (64) Board Member Portfolios Overseen: 88 | President and Chief Executive Officer (since March 1995) and formerly Chief Operating Officer (December 1989-February 1995) of Telemat Ltd. (management consulting); formerly Vice President (January 1985-June 1989) at Morgan Stanley & Co. (broker-dealer). | Director of Simon Property Group, Inc. (retail real estate) (May 2003-May 2012); Director of Anixter International, Inc. (communication products distributor) (since January 2006); Director of Northern Trust Corporation (financial services) (since April 2006); Trustee of Equity Residential (residential real estate) (since December 2009). | ||
Visit our website at pgiminvestments.com
| Independent Board Members(1) | ||||
Name, Address, Age Position(s) Portfolios Overseen | Principal Occupation(s) During Past Five Years | Other Directorships Held During Past Five Years | ||
Keith F. Hartstein (60) Board Member & Independent Chair Portfolios Overseen: 88 | Retired; Member (since November 2014) of the Governing Council of the Independent Directors Council (organization of independent mutual fund directors); formerly President and Chief Executive Officer (2005-2012), Senior Vice President (2004-2005), Senior Vice President of Sales and Marketing (1997-2004), and various executive management positions (1990-1997), John Hancock Funds, LLC (asset management); Chairman, Investment Company Institute’s Sales Force Marketing Committee (2003-2008). | None. | ||
Michael S. Hyland, CFA (71) Board Member Portfolios Overseen: 88 | Retired (since February 2005); formerly Senior Managing Director (July 2001-February 2005) of Bear Stearns & Co, Inc.; Global Partner, INVESCO (1999-2001); Managing Director and President of Salomon Brothers Asset Management (1989-1999). | None. | ||
Richard A. Redeker (73) Board Member & Independent Vice Chair Portfolios Overseen: 88 | Retired Mutual Fund Senior Executive (47 years); Management Consultant; Director, Mutual Fund Directors Forum (since 2014); Independent Directors Council (organization of independent mutual fund directors)-Executive Committee, Chair of Policy Steering Committee, Governing Council. | None. | ||
Stephen G. Stoneburn (73) Board Member Portfolios Overseen: 88 | Chairman (since July 2011), President and Chief Executive Officer (since June 1996) of Frontline Medical Communications (publishing company); formerly President (June 1995-June 1996) of Argus Integrated Media, Inc.; Senior Vice President and Managing Director (January 1993-1995) of Cowles Business Media; Senior Vice President of Fairchild Publications, Inc. (1975-1989). | None. | ||
Prudential Government Income Fund
| Interested Board Members(1) | ||||
Name, Address, Age Position(s) Portfolios Overseen | Principal Occupation(s) During Past Five Years | Other Directorships Held During Past Five Years | ||
Stuart S. Parker (54) Board Member & President Portfolios Overseen: 88 | President of PGIM Investments LLC (formerly known as Prudential Investments LLC) (since January 2012); Executive Vice President of Prudential Investment Management Services LLC (since December 2012); Executive Vice President of Jennison Associates LLC and Head of Retail Distribution of PGIM Investments LLC (June 2005-December 2011). | None. | ||
Scott E. Benjamin (43) Board Member & Vice President Portfolios Overseen: 88 | Executive Vice President (since June 2009) of PGIM Investments LLC; Executive Vice President (June 2009-June 2012) and Vice President (since June 2012) of Prudential Investment Management Services LLC; Executive Vice President (since September 2009) of AST Investment Services, Inc.; Senior Vice President of Product Development and Marketing, PGIM Investments (since February 2006); Vice President of Product Development and Product Management, Prudential Investments (2003-2006). | None. | ||
Grace C. Torres* (57) Board Member Portfolios Overseen: 86 | Retired; formerly Treasurer and Principal Financial and Accounting Officer of the PGIM Investments Funds, Target Funds, Advanced Series Trust, Prudential Variable Contract Accounts and The Prudential Series Fund (1998-June 2014); Assistant Treasurer (March 1999-June 2014) and Senior Vice President (September 1999-June 2014) of PGIM Investments LLC; Assistant Treasurer (May 2003-June 2014) and Vice President (June 2005-June 2014) of AST Investment Services, Inc.; Senior Vice President and Assistant Treasurer (May 2003-June 2014) of Prudential Annuities Advisory Services, Inc. | Director (since July 2015) of Sun Bancorp, Inc. N.A. | ||
* Note: Prior to her retirement in 2014, Ms. Torres was employed by PGIM Investments LLC. Due to her prior employment, she is considered to be an “interested person” under the 1940 Act. Ms. Torres is a Non-Management Interested Board Member.
(1) The year that each Board Member joined the Fund’s Board is as follows:
Ellen S. Alberding, 2013; Kevin J. Bannon, 2008; Linda W. Bynoe, 2005; Keith F. Hartstein, 2013; Michael S. Hyland, 2008; Richard A. Redeker, 1993; Stephen G. Stoneburn, 2003; Grace C. Torres, 2014; Stuart S. Parker, Board Member and President since 2012; Scott E. Benjamin, Board Member since 2010 and Vice President since 2009.
Visit our website at pgiminvestments.com
| Fund Officers(a) | ||||
Name, Address and Age Position with Fund | Principal Occupation(s) During Past Five Years | Length of Service as Fund Officer | ||
Raymond A. O’Hara (61) Chief Legal Officer | Vice President and Corporate Counsel (since July 2010) of Prudential Insurance Company of America (Prudential); Vice President (March 2011-Present) of Pruco Life Insurance Company and Pruco Life Insurance Company of New Jersey; Vice President and Corporate Counsel (March 2011-Present) of Prudential Annuities Life Assurance Corporation; Chief Legal Officer of PGIM Investments LLC (since June 2012); Chief Legal Officer of Prudential Mutual Fund Services LLC (since June 2012) and Corporate Counsel of AST Investment Services, Inc. (since June 2012); formerly Assistant Vice President and Corporate Counsel (September 2008-July 2010) of The Hartford Financial Services Group, Inc.; formerly Associate (September 1980-December 1987) and Partner (January 1988–August 2008) of Blazzard & Hasenauer, P.C. (formerly, Blazzard, Grodd & Hasenauer, P.C.). | Since 2012 | ||
Chad A. Earnst (42) Chief Compliance Officer | Chief Compliance Officer (September 2014-Present) of PGIM Investments LLC; Chief Compliance Officer (September 2014-Present) of the PGIM Investments Funds, Target Funds, Advanced Series Trust, The Prudential Series Fund, Prudential’s Gibraltar Fund, Inc., Prudential Global Short Duration High Yield Income Fund, Inc., Prudential Short Duration High Yield Fund, Inc. and Prudential Jennison MLP Income Fund, Inc.; formerly Assistant Director (March 2010-August 2014) of the Asset Management Unit, Division of Enforcement, US Securities & Exchange Commission; Assistant Regional Director (January 2010-August 2014), Branch Chief (June 2006–December 2009) and Senior Counsel (April 2003-May 2006) of the Miami Regional Office, Division of Enforcement, US Securities & Exchange Commission. | Since 2014 | ||
Deborah A. Docs (59) Secretary | Vice President and Corporate Counsel (since January 2001) of Prudential; Vice President (since December 1996) and Assistant Secretary (since March 1999) of PGIM Investments LLC; formerly Vice President and Assistant Secretary (May 2003-June 2005) of AST Investment Services, Inc. | Since 2004 | ||
Jonathan D. Shain (58) Assistant Secretary | Vice President and Corporate Counsel (since August 1998) of Prudential; Vice President and Assistant Secretary (since May 2001) of PGIM Investments LLC; Vice President and Assistant Secretary (since February 2001) of Prudential Mutual Fund Services LLC; formerly Vice President and Assistant Secretary (May 2003-June 2005) of AST Investment Services, Inc. | Since 2005 | ||
Claudia DiGiacomo (42) Assistant Secretary | Vice President and Corporate Counsel (since January 2005) of Prudential; Vice President and Assistant Secretary of PGIM Investments LLC (since December 2005); Associate at Sidley Austin Brown & Wood LLP (1999-2004). | Since 2005 | ||
Prudential Government Income Fund
| Fund Officers(a) | ||||
Name, Address and Age Position with Fund | Principal Occupation(s) During Past Five Years | Length of Service as Fund Officer | ||
Andrew R. French (54) Assistant Secretary | Vice President and Corporate Counsel (since February 2010) of Prudential; formerly Director and Corporate Counsel (2006-2010) of Prudential; Vice President and Assistant Secretary (since January 2007) of PGIM Investments LLC; Vice President and Assistant Secretary (since January 2007) of Prudential Mutual Fund Services LLC. | Since 2006 | ||
Theresa C. Thompson (54) Deputy Chief Compliance Officer | Vice President, Compliance, PGIM Investments LLC (since April 2004); and Director, Compliance, PGIM Investments LLC (2001-2004). | Since 2008 | ||
Charles H. Smith (43) Anti-Money Laundering Compliance Officer | Vice President, Corporate Compliance, Anti-Money Laundering Unit (since January 2015) of Prudential; committee member of the American Council of Life Insurers Anti-Money Laundering and Critical Infrastructure Committee (since January 2016); formerly Global Head of Economic Sanctions Compliance at AIG Property Casualty (February 2007 – December 2014); Assistant Attorney General at the New York State Attorney General’s Office, Division of Public Advocacy. (August 1998 —January 2007). | Since 2016 | ||
M. Sadiq Peshimam (53) Treasurer and Principal Financial and Accounting Officer | Vice President (since 2005) of PGIM Investments LLC; formerly Assistant Treasurer of funds in the Prudential Mutual Fund Complex (2006-2014). | Since 2006 | ||
Peter Parrella (58) Assistant Treasurer | Vice President (since 2007) and Director (2004-2007) within Prudential Mutual Fund Administration; formerly Tax Manager at SSB Citi Fund Management LLC (1997-2004). | Since 2007 | ||
Lana Lomuti (49) Assistant Treasurer | Vice President (since 2007) and Director (2005-2007), within Prudential Mutual Fund Administration; formerly Assistant Treasurer (December 2007-February 2014) of The Greater China Fund, Inc. | Since 2014 | ||
Linda McMullin (55) Assistant Treasurer | Vice President (since 2011) and Director (2008-2011) within Prudential Mutual Fund Administration. | Since 2014 | ||
Kelly A. Coyne (48) Assistant Treasurer | Director, Investment Operations of Prudential Mutual Fund Services LLC (since 2010). | Since 2015 | ||
(a) Excludes Mr. Parker and Mr. Benjamin, interested Board Members who also serve as President and Vice President, respectively.
Explanatory Notes to Tables:
| ∎ | Board Members are deemed to be “Interested,” as defined in the 1940 Act, by reason of their affiliation with PGIM Investments LLC and/or an affiliate of PGIM Investments LLC. |
| ∎ | Unless otherwise noted, the address of all Board Members and Officers is c/o PGIM Investments LLC, 655 Broad Street, Newark, New Jersey 07102-4410. |
| ∎ | There is no set term of office for Board Members or Officers. The Board Members have adopted a retirement policy, which calls for the retirement of Board Members on December 31 of the year in which they reach the age of 75. |
| ∎ | “Other Directorships Held” includes only directorships of companies required to register or file reports with the SEC under the 1934 Act (that is, “public companies”) or other investment companies registered under the 1940 Act. |
Visit our website at pgiminvestments.com
| ∎ | “Portfolios Overseen” includes all investment companies managed by PGIM Investments LLC. The investment companies for which PGIM Investments LLC serves as manager include the PGIM Investments Mutual Funds, The Prudential Variable Contract Accounts, Target Mutual Funds, Prudential Short Duration High Yield Fund, Inc., Prudential Global Short Duration High Yield Fund, Inc., The Prudential Series Fund, Prudential’s Gibraltar Fund, Inc. and the Advanced Series Trust. |
Prudential Government Income Fund
| ∎ TELEPHONE | ∎ WEBSITE | |||
655 Broad Street Newark, NJ 07102 | (800) 225-1852 | www.pgiminvestments.com |
| PROXY VOTING |
| The Board of Directors of the Fund has delegated to the Fund’s investment subadviser the responsibility for voting any proxies and maintaining proxy recordkeeping with respect to the Fund. A description of these proxy voting policies and procedures is available without charge, upon request, by calling (800) 225-1852. Information regarding how the Fund voted proxies relating to portfolio securities during the most recent 12-month period ended June 30 is available on the Fund’s website and on the Securities and Exchange Commission’s website. |
| DIRECTORS |
| Ellen S. Alberding • Kevin J. Bannon • Scott E. Benjamin • Linda W. Bynoe • Keith F. Hartstein • Michael S. Hyland • Stuart S. Parker • Richard A. Redeker • Stephen G. Stoneburn • Grace C. Torres |
| OFFICERS |
| Stuart S. Parker, President • Scott E. Benjamin, Vice President • M. Sadig Peshimam, Treasurer and Principal Financial and Accounting Officer • Raymond A. O’Hara, Chief Legal Officer • Deborah A. Docs, Secretary • Chad A. Earnst, Chief Compliance Officer • Theresa C. Thompson, Deputy Chief Compliance Officer • Charles H. Smith, Anti-Money Laundering Compliance Officer • Jonathan D. Shain, Assistant Secretary • Claudia DiGiacomo, Assistant Secretary • Andrew R. French, Assistant Secretary • Peter Parrella, Assistant Treasurer • Lana Lomuti, Assistant Treasurer • Linda McMullin, Assistant Treasurer • Kelly A. Coyne, Assistant Treasurer |
| MANAGER | PGIM Investments LLC | 655 Broad Street Newark, NJ 07102 | ||
| ||||
| INVESTMENT SUBADVISER | PGIM Fixed Income | 655 Broad Street Newark, NJ 07102 | ||
| ||||
| DISTRIBUTOR | Prudential Investment Management Services LLC | 655 Broad Street Newark, NJ 07102 | ||
| ||||
| CUSTODIAN | The Bank of New York Mellon | 225 Liberty Street New York, NY 10286 | ||
| ||||
| TRANSFER AGENT | Prudential Mutual Fund Services LLC | PO Box 9658 Providence, RI 02940 | ||
| ||||
| INDEPENDENT REGISTERED PUBLIC ACCOUNTING FIRM | KPMG LLP | 345 Park Avenue New York, NY 10154 | ||
| ||||
| FUND COUNSEL | Willkie Farr & Gallagher LLP | 787 Seventh Avenue New York, NY 10019 | ||
| ||||
| An investor should consider the investment objectives, risks, charges, and expenses of the Fund carefully before investing. The prospectus and summary prospectus contain this and other information about the Fund. An investor may obtain a prospectus and summary prospectus by visiting our website at www.pgiminvestments.com or by calling (800) 225-1852. The prospectus and summary prospectus should be read carefully before investing. |
| E-DELIVERY |
| To receive your mutual fund documents online, go to www.pgiminvestments.com/edelivery and enroll. Instead of receiving printed documents by mail, you will receive notification via email when new materials are available. You can cancel your enrollment or change your email address at any time by visiting the website address above. |
| SHAREHOLDER COMMUNICATIONS WITH DIRECTORS |
| Shareholders can communicate directly with the Board of Directors by writing to the Chair of the Board, Prudential Government Income Fund, PGIM Investments, Attn: Board of Directors, 655 Broad Street, Newark, NJ 07102. Shareholders can communicate directly with an individual Director by writing to the same address. Communications are not screened before being delivered to the addressee. |
| AVAILABILITY OF PORTFOLIO SCHEDULE |
| The Fund files its complete schedule of portfolio holdings with the Securities and Exchange Commission for the first and third quarters of each fiscal year on Form N-Q. The Fund’s Forms N-Q are available on the Commission’s website at www.sec.gov. The Fund’s Forms N-Q may also be reviewed and copied at the Commission’s Public Reference Room in Washington, D.C. Information on the operation and location of the Public Reference Room may be obtained by calling 1-800-SEC-0330. The Fund’s schedule of portfolio holdings is also available on the Fund’s website as of the end of each month no sooner than 15 days after the end of the month. |
| The Fund’s Statement of Additional Information contains additional information about the Fund’s Directors and is available without charge, upon request, by calling (800) 225-1852. |
Mutual Funds:
| ARE NOT INSURED BY THE FDIC OR ANY FEDERAL GOVERNMENT AGENCY | MAY LOSE VALUE | ARE NOT A DEPOSIT OF OR GUARANTEED BY ANY BANK OR ANY BANK AFFILIATE |
PRUDENTIAL GOVERNMENT INCOME FUND
| SHARE CLASS | A | B | C | Q | R | Z | ||||||
| NASDAQ | PGVAX | PBGPX | PRICX | PGIQX | JDRVX | PGVZX | ||||||
| CUSIP | 74439V107 | 74439V206 | 74439V305 | 74439V875 | 74439V503 | 74439V404 |
MF128E

PRUDENTIAL FLOATING RATE INCOME FUND
ANNUAL REPORT
FEBRUARY 28, 2017

To enroll in e-delivery, go to pgiminvestments.com/edelivery
| Objective: To maximize current income. Capital appreciation is a secondary investment objective, but only when consistent with the Fund’s primary objective. |
Highlights
PRUDENTIAL FLOATING RATE INCOME FUND
| • | The Fund’s underweight positions relative to the Credit Suisse Leveraged Loan Index (the Index) in the media/telecommunications, food/tobacco, aerospace, and service sectors contributed positively to relative performance. |
| • | The Fund’s underweights in commodity-related industries, including those in the energy and metals/minerals sectors, which rallied during the period, detracted from relative performance. |
| • | Security selection in the energy, manufacturing, and gaming/leisure sectors limited relative returns. |
This report is not authorized for distribution to prospective investors unless preceded or accompanied by a current prospectus.
The views expressed in this report and information about the Fund’s portfolio holdings are for the period covered by this report and are subject to change thereafter.
Mutual funds are distributed by Prudential Investment Management Services LLC (PIMS), member SIPC. PGIM Fixed Income is a unit of PGIM, Inc. (PGIM), a registered investment adviser. PIMS and PGIM are Prudential Financial companies. © 2017 Prudential Financial, Inc. and its related entities. The Prudential logo and the Rock symbol are service marks of Prudential Financial, Inc. and its related entities, registered in many jurisdictions worldwide.
| 2 | Visit our website at pgiminvestments.com |
Letter from the President

Dear Shareholder:
We hope you find the annual report for the Prudential Floating Rate Income Fund informative and useful. The report covers performance for the 12-month period ended February 28, 2017. We are proud to announce that Prudential Investments will be known as PGIM® Investments, effective April 3, 2017. Why PGIM? This new name was chosen to further align with the global investment management businesses of Prudential Financial, which rebranded from Prudential Investment Management in January 2016. This new name allows for one brand and reflects our ability and commitment to delivering investment solutions to clients around the globe. Please keep in mind that only the Fund adviser’s name is changing: The name of your Fund and its management and operation will not change.
The reporting period was dominated by headline events. Most prominent was the surprising end to a dramatic US election season, as Donald Trump was elected 45th president of the US. In the wake of the election, investor sentiment was positive for both the economy and the markets in anticipation of a more pro-business environment under a Trump-led administration. Another major headline event was Brexit—the term used to represent Britain’s decision to leave the European Union. This referendum raised further economic and political uncertainty over the future of existing trade and commerce agreements. Meanwhile, the US economy’s recovery strengthened as labor markets tightened.
Equity markets in the US reached new highs as stocks experienced powerful gains after the US election, as equity investors appeared to believe that the new administration would quickly implement measures to boost growth. European stocks generally advanced as the eurozone economy continued to experience slow growth. Most Asian markets gained. In aggregate, emerging markets turned in very strong results.
In a move widely anticipated by the markets, the Federal Reserve raised its federal funds rate by 0.25% during its December 2016 policy meeting. Shortly after the reporting period on March 15, the Federal Reserve decided to hike rates by 0.25%. Additional rate hikes are planned for 2017. Overall, fixed income markets experienced mixed returns, as rising interest rates and concerns over potential inflation jolted bond markets later in the period.
Given the uncertainty in today’s investment environment, we believe that active professional portfolio management offers a potential advantage. Active managers often have the knowledge and flexibility to find the best investment opportunities in the most challenging markets.
Even so, it’s best if investment decisions are based on your long-term goals rather than on short-term market and economic developments. We also encourage you to work with an experienced financial advisor who can help you set goals, determine your tolerance for risk, build a diversified plan that’s right for you, and make adjustments when necessary.
At PGIM Investments, we consider it a great privilege and responsibility to help investors participate in opportunities across global markets while meeting their toughest investment challenges. We’re part of PGIM, the 9th-largest global investment manager with more than $1 trillion in assets under management. This investment expertise allows us to deliver actively managed funds and strategies to meet the needs of investors around the globe.
Thank you for choosing our family of funds.
Sincerely,

Stuart S. Parker, President
Prudential Floating Rate Income Fund
April 14, 2017
| Prudential Floating Rate Income Fund | 3 |
Your Fund’s Performance (unaudited)
Performance data quoted represent past performance. Past performance does not guarantee future results. The investment return and principal value of an investment will fluctuate, so that an investor’s shares, when redeemed, may be worth more or less than their original cost. Current performance may be lower or higher than the past performance data quoted. An investor may obtain performance data as of the most recent month-end by visiting our website at www.pgiminvestments.com or by calling (800) 225-1852.
| Cumulative Total Returns (Without Sales Charges) as of 2/28/17 | ||||||||||
| One Year (%) | Five Years (%) | Since Inception (%) | ||||||||
| Class A | 10.46 | 23.06 | 26.39 (3/30/11) | |||||||
| Class C | 9.64 | 18.41 | 20.90 (3/30/11) | |||||||
| Class Q | 10.79 | N/A | 7.07 (4/27/15) | |||||||
| Class Z | 10.76 | 24.64 | 28.41 (3/30/11) | |||||||
| Credit Suisse Leveraged Loan Index | 12.55 | 27.71 | — | |||||||
| Lipper Loan Participation Funds Average | 11.63 | 21.76 | — | |||||||
| Average Annual Total Returns (With Sales Charges) as of 2/28/17 | ||||||||||
| One Year (%) | Five Years (%) | Since Inception (%) | ||||||||
| Class A | 6.87 | 3.55 | 3.46 (3/30/11) | |||||||
| Class C | 8.64 | 3.44 | 3.26 (3/30/11) | |||||||
| Class Q | 10.79 | N/A | 3.77 (4/27/15) | |||||||
| Class Z | 10.76 | 4.50 | 4.31 (3/30/11) | |||||||
| Credit Suisse Leveraged Loan Index | 12.55 | 5.01 | — | |||||||
| Lipper Loan Participation Funds Average | 11.63 | 4.00 | — | |||||||
| Average Annual Total Returns (Without Sales Charges) as of 2/28/17 | ||||||||||
| One Year (%) | Five Years (%) | Since Inception (%) | ||||||||
| Class A | 10.46 | 4.24 | 4.03 (3/30/11) | |||||||
| Class C | 9.64 | 3.44 | 3.26 (3/30/11) | |||||||
| Class Q | 10.79 | N/A | 3.77 (4/27/15) | |||||||
| Class Z | 10.76 | 4.50 | 4.31 (3/30/11) | |||||||
| 4 | Visit our website at pgiminvestments.com |
Growth of a $10,000 Investment
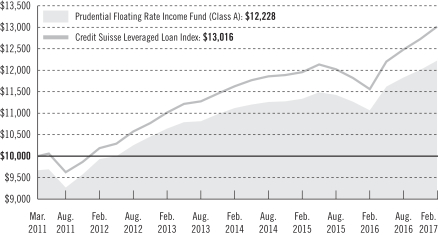
The graph compares a $10,000 investment in the Prudential Floating Rate Income Fund (Class A shares) with a similar investment in the Credit Suisse Leveraged Loan Index by portraying the initial account values at the commencement of operations of Class A shares (March 30, 2011) and the account values at the end of the current fiscal year (February 28, 2017) as measured on a quarterly basis. For purposes of the graph, and unless otherwise indicated, it has been assumed that (a) the maximum applicable front-end sales charge was deducted from the initial $10,000 investment in Class A shares; (b) all recurring fees (including management fees) were deducted; and (c) all dividends and distributions were reinvested. The line graph provides information for Class A shares only. As indicated in the tables provided earlier, performance for Class C, Class Q, and Class Z shares will vary due to the differing charges and expenses applicable to each share class (as indicated in the following paragraphs). Without waiver of fees and/or expense reimbursement, if any, the Fund’s returns would have been lower.
Past performance does not predict future performance. Total returns and the ending account values in the graph include changes in share price and reinvestment of dividends and capital gains distributions in a hypothetical investment for the periods shown. The Fund’s total returns do not reflect the deduction of income taxes on an individual’s investment. Taxes may reduce your actual investment returns on income or gains paid by the Fund or any gains you may realize if you sell your shares.
Source: PGIM Investments LLC and Lipper Inc.
Inception returns are provided for any share class with less than 10 calendar years of returns.
| Prudential Floating Rate Income Fund | 5 |
Your Fund’s Performance (continued)
The returns in the tables do not reflect the deduction of taxes that a shareholder would pay on Fund distributions or following the redemption of Fund shares. The average annual total returns take into account applicable sales charges, which are described for each share class in the table below.
| Class A | Class C | Class Q | Class Z | |||||
| Maximum initial sales charge | 3.25% of the public offering price | None | None | None | ||||
| Contingent deferred sales charge (CDSC) (as a percentage of the lower of original purchase price or net asset value at redemption) | 1% on sales of $1 million or more made within 12 months of purchase | 1% on sales made within 12 months of purchase | None | None | ||||
| Annual distribution and service (12b-1) fees (shown as a percentage of average daily net assets) | .25% | 1% | None | None |
Benchmark Definitions
Credit Suisse Leveraged Loan Index—The Credit Suisse Leveraged Loan Index is an unmanaged index that represents the investable universe of the dollar-denominated leveraged loan market. The cumulative total returns for the Index measured from the month-end closest to the inception date through 2/28/17 are 30.16% for Class A, C, and Z shares and 7.47% for Class Q shares. The average annual total returns for the Index measured from the month-end closest to the inception date through 2/28/17 are 4.56% for Class A, C and Z shares and 4.01% for Class Q shares.
Lipper Loan Participation Funds Average—The Lipper Loan Participation Funds Average (Lipper Average) is based on the average return of all funds in the Lipper Loan Participation Funds category for the periods noted. Funds in the Lipper Average invest primarily in participation interests in collateralized senior corporate loans that have floating or variable rates. The cumulative total returns for the Lipper Average measured from the month-end closest to the inception date through 2/28/17 are 23.99% for Class A, C, and Z shares and 5.81% for Class Q shares. The average annual total returns for the Lipper Average measured from the month-end closest to the inception date through 2/28/17 are 3.69% for Class A, C and Z shares and 3.13% for Class Q shares.
Investors cannot invest directly in an index or average. The returns for the Index would be lower if they included the effects of sales charges, operating expenses of a mutual fund, or taxes. Returns for the Lipper Average reflect the deduction of operating expenses, but not sales charges or taxes. The Since Inception returns for the Index and the Lipper Average are measured from the closest month-end to inception date for the indicated share class.
| 6 | Visit our website at pgiminvestments.com |
| Credit Quality expressed as a percentage of total investments as of 2/28/17 (%) | ||||
| AA | 1.0 | |||
| A | 0.5 | |||
| BBB | 4.3 | |||
| BB | 31.3 | |||
| B | 59.3 | |||
| CCC | 1.9 | |||
| CC | 0.2 | |||
| C | 0.0 | |||
| D | 0.2 | |||
| Not Rated | 0.3 | |||
| Cash/Cash Equivalents | 1.0 | |||
| Total Investments | 100.0 | |||
Source: PGIM Fixed Income
Credit ratings reflect the highest rating assigned by a nationally recognized statistical rating organization (NRSRO) such as Moody’s Investor Service, Inc. (Moody’s), Standard & Poor’s (S&P), or Fitch, Inc. (Fitch). Credit ratings reflect the common nomenclature used by both S&P and Fitch. Where applicable, ratings are converted to the comparable S&P/Fitch rating tier nomenclature. These rating agencies are independent, and are widely used. The Not Rated category consists of securities that have not been rated by a NRSRO. Credit ratings are subject to change. Values may not sum to 100.0% due to rounding.
| Distributions and Yields as of 2/28/17 | ||||||
| Total Distributions Paid for 12 Months ($) | SEC 30-Day Subsidized Yield* (%) | SEC 30-Day Unsubsidized Yield** (%) | ||||
| Class A | 0.40 | 3.78 | 3.59 | |||
| Class C | 0.33 | 3.16 | 2.95 | |||
| Class Q | 0.43 | 4.21 | 4.06 | |||
| Class Z | 0.43 | 4.16 | 3.95 | |||
*SEC 30-Day Subsidized Yield (%)—A standardized yield calculation created by the Securities and Exchange Commission, it reflects the income earned during a 30-day period, after the deduction of the fund’s net expenses (net of any expense waivers or reimbursements).
**SEC 30-Day Unsubsidized Yield (%)—A standardized yield calculation created by the Securities and Exchange Commission, it reflects the income earned during a 30-day period, after the deduction of the Fund’s gross expenses.
| Prudential Floating Rate Income Fund | 7 |
Strategy and Performance Overview
How did the Fund perform?
The Prudential Floating Rate Income Fund’s Class A shares returned 10.46% for the 12-month reporting period ended February 28, 2017, underperforming the 12.55% return of the Index. The Fund also underperformed the 11.63% return of the Lipper Loan Participation Funds Average.
What were market conditions?
| • | Floating rate loans, which are provided by banks and other lenders to below-investment-grade companies, recorded strong returns during the second quarter of 2016, with lower-rated loans outperforming higher-rated loans. New issuance increased, but year-to-date levels were below those seen during the same timeframe in 2015. |
| • | In the third quarter, the floating rate loan market stabilized in the aftermath of the UK’s surprise vote in June to leave the European Union (commonly known as Brexit) and highly anticipated policy meetings by the Bank of Japan and the Federal Reserve (Fed). Floating rate loans posted strong returns, led by the resurgence of commodity-related sectors and the outperformance of lower-rated credits. CCC-rated loans generally outpaced B-rated and BB-rated loans. |
| • | Driven by robust demand, floating rate loans continued to perform well during the fourth quarter. CCC-rated loans finished ahead of B-rated and BB-rated loans. With investment inflows totaling $13.5 billion, net flow activity turned positive, with $7.4 billion entering the asset class during 2016. |
| • | Floating rate loans as represented by the Credit Suisse Leveraged Loan Index posted positive returns for the first two months of 2017; February’s 0.6% return represented the twelfth consecutive monthly gain. A majority of the index remains higher than par value and fund flows continue to be strong, with January and February 2017 inflows of $7.5 billion. While on the surface the $219 billion in January and February in gross new issuance looks almost ten times larger than the same period from the prior year, a majority of the increase is repricing/refinancing activity and true “new money” transactions are not keeping pace with demand. Defaults remain low, with the par-weighted default rate from JP Morgan at 1.55% at the end of February, or 0.7% excluding commodities. |
What worked?
| • | The Fund’s underweight positions in the media/telecommunications, food/tobacco, aerospace, and service sectors contributed positively to relative performance. |
| • | Security selection added to results, highlighted by the Fund’s holdings in the media/telecommunications, health care, information technology, and service sectors. |
| • | The Fund benefited from overweights in energy issuers American Energy-Marcellus and California Resources. In addition, an overweight in BMC Software (information |
| 8 | Visit our website at pgiminvestments.com |
technology) and a lack of exposure to Avago Technologies Cayman Finance (information technology) added value. |
| • | An underweight position and security selection in Ba-rated loans bolstered relative returns. |
What didn’t work?
| • | Industry selection overall hurt results during the reporting period. The Fund’s underweights in commodity-related industries, including those in the energy and metals/minerals sectors, which rallied during the period, detracted from relative performance. Overweight positions in retail and housing were also negative. |
| • | Security selection in the energy, manufacturing, and gaming/leisure sectors limited relative returns. |
| • | The Fund’s underweight in lower-quality loans (CCC-rated and below), which outperformed during the period, hindered performance. Holdings of B-rated loans also dampened results. |
| • | Performance was hampered by avoiding Arch Coal (metals/minerals), Clear Channel Communications (media/telecommunications), and energy issuers Seadrill Partners and CJ Holding. |
Did the Fund use derivatives, and how did they affect performance?
| • | The Fund held interest-rate swaps to help manage the Fund’s duration and yield curve exposure and to reduce its sensitivity to changes in the levels of interest rates. Overall, this strategy did not have an impact on performance during the reporting period. |
Current outlook
| • | PGIM Fixed Income believes that floating rate loans offer protection against anticipated Fed interest-rate increases. |
| • | In the view of PGIM Fixed Income, market technicals (or, supply and demand conditions) should remain supportive of floating rate loans, though the potential upside may be capped because floating rate loans are callable. (When a security is callable, the issuer can repay them before maturity.) |
| • | At the end of the reporting period, the Fund’s largest overweight positions were in the manufacturing, chemicals, and information technology sectors. The largest underweights were in the media/telecommunications, gaming/leisure, and aerospace sectors. |
| Prudential Floating Rate Income Fund | 9 |
Fees and Expenses (unaudited)
As a shareholder of the Fund, you incur two types of costs: (1) transaction costs, including sales charges (loads) on purchase payments and redemptions, as applicable, and (2) ongoing costs, including management fees, distribution and/or service (12b-1) fees, and other Fund expenses, as applicable. This example is intended to help you understand your ongoing costs (in dollars) of investing in the Fund and to compare these costs with the ongoing costs of investing in other mutual funds.
The example is based on an investment of $1,000 held through the six-month period ended February 28, 2017. The example is for illustrative purposes only; you should consult the Prospectus for information on initial and subsequent minimum investment requirements.
Actual Expenses
The first line for each share class in the table on the following page provides information about actual account values and actual expenses. You may use the information on this line, together with the amount you invested, to estimate the expenses that you paid over the period. Simply divide your account value by $1,000 (for example, an $8,600 account value ÷ $1,000 = 8.6), then multiply the result by the number on the first line under the heading “Expenses Paid During the Six-Month Period” to estimate the expenses you paid on your account during this period.
Hypothetical Example for Comparison Purposes
The second line for each share class in the table on the following page provides information about hypothetical account values and hypothetical expenses based on the Fund’s actual expense ratio and an assumed rate of return of 5% per year before expenses, which is not the Fund’s actual return. The hypothetical account values and expenses should not be used to estimate the actual ending account balance or expenses you paid for the period. You may use this information to compare the ongoing costs of investing in the Fund and other funds. To do so, compare this 5% hypothetical example with the 5% hypothetical examples that appear in the shareholder reports of the other funds.
The Fund’s transfer agent may charge additional fees to holders of certain accounts that are not included in the expenses shown in the table on the following page. These fees apply to individual retirement accounts (IRAs) and Section 403(b) accounts. As of the close of the six-month period covered by the table, IRA fees included an annual maintenance fee of $15 per account (subject to a maximum annual maintenance fee of $25 for all accounts held by the same shareholder). Section 403(b) accounts are charged an annual $25 fiduciary maintenance fee. Some of the fees may vary in amount, or may be waived, based on your total account balance or the number of PGIM Investments funds, including the Fund, that you own. You should consider the additional fees that were charged to your Fund account over the six-month period when you estimate the total ongoing expenses paid over the period and the impact of these fees on your ending account value, as these
| 10 | Visit our website at pgiminvestments.com |
additional expenses are not reflected in the information provided in the expense table. Additional fees have the effect of reducing investment returns.
Please note that the expenses shown in the table are meant to highlight your ongoing costs only and do not reflect any transactional costs such as sales charges (loads). Therefore, the second line for each share class in the table is useful in comparing ongoing costs only and will not help you determine the relative total costs of owning different funds. In addition, if these transactional costs were included, your costs would have been higher.
| Prudential Floating Rate Income Fund | Beginning Account Value | Ending Account Value February 28, 2017 | Annualized Expense Ratio | Expenses Paid During the Six-Month Period* | ||||||||||||||
| Class A | Actual | $ | 1,000.00 | $ | 1,033.50 | 0.96 | % | $ | 4.84 | |||||||||
| Hypothetical | $ | 1,000.00 | $ | 1,020.03 | 0.96 | % | $ | 4.81 | ||||||||||
| Class C | Actual | $ | 1,000.00 | $ | 1,029.70 | 1.71 | % | $ | 8.61 | |||||||||
| Hypothetical | $ | 1,000.00 | $ | 1,016.31 | 1.71 | % | $ | 8.55 | ||||||||||
| Class Q | Actual | $ | 1,000.00 | $ | 1,035.20 | 0.65 | % | $ | 3.28 | |||||||||
| Hypothetical | $ | 1,000.00 | $ | 1,021.57 | 0.65 | % | $ | 3.26 | ||||||||||
| Class Z | Actual | $ | 1,000.00 | $ | 1,034.90 | 0.71 | % | $ | 3.58 | |||||||||
| Hypothetical | $ | 1,000.00 | $ | 1,021.27 | 0.71 | % | $ | 3.56 | ||||||||||
*Fund expenses (net of fee waivers or subsidies, if any) for each share class are equal to the annualized expense ratio for
| each | share class (provided in the table), multiplied by the average account value over the period, multiplied by the 181 |
| days | in the six-month period ended February 28, 2017, and divided by the 365 days in the Fund’s fiscal year ended |
| February | 28, 2017 (to reflect the six-month period). Expenses presented in the table include the expenses of any |
| underlying | portfolios in which the Fund may invest. |
The Fund’s annualized expense ratios for the 12-month period ended February 28, 2017, are as follows:
| Class | Gross Operating Expenses (%) | Net Operating Expenses (%) | ||
| A | 1.14 | 1.00 | ||
| C | 1.89 | 1.75 | ||
| Q | 0.82 | 0.67 | ||
| Z | 0.89 | 0.75 |
Net operating expenses shown above reflect fee waivers and/or expense reimbursements. Additional information on Fund expenses and any fee waivers and/or expense reimbursements can be found in the “Financial Highlights” tables in this report and in the Notes to the Financial Statements in this report.
| Prudential Floating Rate Income Fund | 11 |
Portfolio of Investments
as of February 28, 2017
| Description | Interest Rate | Maturity Date | Principal Amount (000)# | Value (Note 1) | ||||||||||||
LONG-TERM INVESTMENTS 98.7% | ||||||||||||||||
ASSET-BACKED SECURITIES 1.5% | ||||||||||||||||
Collateralized Loan Obligations | ||||||||||||||||
Atrium X (Cayman Islands), | 2.673 | %(a) | 07/16/25 | 1,000 | $ | 1,000,111 | ||||||||||
Battalion CLO Ltd. (Cayman Islands), | 4.410 | 04/17/26 | 250 | 252,464 | ||||||||||||
Mountain View CLO Ltd. (Cayman Islands), | 2.768 | (a) | 04/12/24 | 2,000 | 1,969,982 | |||||||||||
Octagon Investment Partners 25 Ltd. | 3.230 | (a) | 10/20/26 | 1,000 | 1,006,033 | |||||||||||
Regatta V Funding Ltd. (Cayman Islands), | 3.238 | (a) | 10/25/26 | 1,000 | 1,002,540 | |||||||||||
West CLO Ltd. (Cayman Islands), | 4.439 | (a) | 10/30/23 | 2,500 | 2,509,645 | |||||||||||
|
| |||||||||||||||
TOTAL ASSET-BACKED SECURITIES | 7,740,775 | |||||||||||||||
|
| |||||||||||||||
BANK LOANS(a) 93.3% | ||||||||||||||||
Aerospace & Defense 1.0% | ||||||||||||||||
Sequa Corp. | 5.250 | 06/19/17 | 368 | 353,401 | ||||||||||||
Standard Aero Ltd. | 5.250 | 07/07/22 | 1,861 | 1,871,245 | ||||||||||||
Transdigm, Inc. | 3.852 | 05/14/22 | 516 | 517,975 | ||||||||||||
Transdigm, Inc. | 3.957 | 06/09/23 | 1,369 | 1,375,809 | ||||||||||||
Transdigm, Inc. | 3.984 | 06/04/21 | 491 | 492,412 | ||||||||||||
Transdigm, Inc. | 4.054 | 02/28/20 | 400 | 401,700 | ||||||||||||
|
| |||||||||||||||
| 5,012,542 | ||||||||||||||||
Automotive 3.1% | ||||||||||||||||
American Tire Distributors, Inc. | 5.250 | 09/01/21 | 2,805 | 2,786,549 | ||||||||||||
BBB Industries LLC | 6.035 | 11/03/21 | 1,246 | 1,251,853 | ||||||||||||
CH Hold Corp. | — | (f) | 02/01/24 | 50 | 50,542 | |||||||||||
CH Hold Corp. | 4.034 | 02/01/24 | 500 | 505,416 | ||||||||||||
Chrysler Group LLC | 3.280 | 12/31/18 | 607 | 607,275 | ||||||||||||
Federal-Mogul Holdings Corp. | 4.000 | 04/16/18 | 1,077 | 1,072,894 | ||||||||||||
Federal-Mogul Holdings Corp. | 4.750 | 04/15/21 | 1,430 | 1,416,192 | ||||||||||||
Gates Global LLC | 4.250 | 07/06/21 | 1,826 | 1,826,389 | ||||||||||||
Horizon Global Corp.(b) | 7.000 | 06/30/21 | 622 | 631,030 | ||||||||||||
Inteva Products LLC | 9.750 | 09/08/21 | 223 | 222,917 | ||||||||||||
Sage Automotive Holdings, Inc.(b) | 6.034 | 11/08/22 | 2,550 | 2,556,375 | ||||||||||||
Tectum Holdings, Inc. | 5.791 | 08/24/23 | 1,647 | 1,664,626 | ||||||||||||
TI Group Automotive Systems LLC | 3.531 | 06/30/22 | 444 | 446,597 | ||||||||||||
Tower Auto Holdings USA LLC | 4.041 | 04/23/20 | 1,038 | 1,035,649 | ||||||||||||
Tweddle Group, Inc.(b) | 7.000 | 10/24/22 | 425 | 420,750 | ||||||||||||
|
| |||||||||||||||
| 16,495,054 | ||||||||||||||||
See Notes to Financial Statements.
| Prudential Floating Rate Income Fund | 13 |
Portfolio of Investments (continued)
as of February 28, 2017
| Description | Interest Rate | Maturity Date | Principal Amount (000)# | Value (Note 1) | ||||||||||||
BANK LOANS(a) (Continued) |
| |||||||||||||||
Brokerage 1.0% | ||||||||||||||||
Hamilton Lane Advisors LLC | 4.281 | % | 07/08/22 | 712 | $ | 713,113 | ||||||||||
Istar, Inc.(b) | 4.750 | 07/01/20 | 373 | 378,618 | ||||||||||||
LPL Holdings, Inc. | 4.781 | 11/21/22 | 494 | 498,706 | ||||||||||||
National Financial Partners Corp. | 4.500 | 01/08/24 | 1,250 | 1,261,459 | ||||||||||||
RCS Capital Corp.(b) | 6.500 | 05/23/21 | 323 | 305,465 | ||||||||||||
VFH Parent LLC | 4.497 | 10/27/22 | 1,952 | 1,970,528 | ||||||||||||
|
| |||||||||||||||
| 5,127,889 | ||||||||||||||||
Building Materials & Construction 3.7% | ||||||||||||||||
Apex Tool Group LLC | 4.500 | 01/31/20 | 2,072 | 2,053,751 | ||||||||||||
Beazer Homes USA, Inc.(b) | 6.750 | 03/11/18 | 295 | 291,696 | ||||||||||||
Builders FirstSource, Inc. | 4.052 | 02/23/24 | 1,751 | 1,752,355 | ||||||||||||
CHI Overhead Doors, Inc. | 4.250 | 07/29/22 | 2,317 | 2,315,112 | ||||||||||||
Headwaters, Inc. | 4.000 | 03/24/22 | 1,873 | 1,878,976 | ||||||||||||
Interior Logic Group, Inc. | 7.100 | 03/02/24 | 1,875 | 1,828,125 | ||||||||||||
Jeld-Wen, Inc. | 4.750 | 07/01/22 | 722 | 725,960 | ||||||||||||
LBM Borrower LLC | 6.288 | 08/20/22 | 2,138 | 2,139,946 | ||||||||||||
PriSo Acquisition Corp.(b) | 4.000 | 05/09/22 | 1,441 | 1,447,924 | ||||||||||||
Quikrete Holdings, Inc. | 4.243 | 11/15/23 | 2,750 | 2,782,846 | ||||||||||||
Wilsonart LLC | 4.500 | 12/19/23 | 1,979 | 1,991,610 | ||||||||||||
|
| |||||||||||||||
| 19,208,301 | ||||||||||||||||
Cable 3.2% | ||||||||||||||||
Casa Systems, Inc.(b) | 4.970 | 12/20/23 | 1,000 | 1,000,000 | ||||||||||||
DigitalGlobe, Inc. | 3.746 | 01/15/24 | 500 | 502,292 | ||||||||||||
Hargray Communications Group, Inc. | 4.750 | 06/26/19 | 997 | 1,005,327 | ||||||||||||
Hemisphere Media Holdings LLC | 4.534 | 02/28/24 | 500 | 498,750 | ||||||||||||
Intelsat Jackson Holdings SA | 3.750 | 06/30/19 | 1,700 | 1,680,875 | ||||||||||||
Numericable US LLC (France) | 4.275 | 01/14/25 | 998 | 1,003,913 | ||||||||||||
Numericable US LLC (France) | 5.243 | 01/15/24 | 844 | 850,374 | ||||||||||||
Quebecor Media, Inc. (Canada) | 3.539 | 08/17/20 | 1,480 | 1,483,656 | ||||||||||||
Telenet Financing USD LLC (Belgium) | 3.998 | 01/31/25 | 950 | 958,313 | ||||||||||||
Telesat LLC (Canada) | 4.039 | 11/17/23 | 1,324 | 1,333,804 | ||||||||||||
UPC Financing Partnership (Netherlands) | 3.520 | 04/15/25 | 3,175 | 3,193,853 | ||||||||||||
Virgin Media Investment Holdings, Ltd. | 3.520 | 01/31/25 | 1,625 | 1,633,634 | ||||||||||||
Xplornet Communications, Inc. (Canada)(b) | 7.038 | 07/25/20 | 1,822 | 1,844,838 | ||||||||||||
|
| |||||||||||||||
| 16,989,629 | ||||||||||||||||
Capital Goods 7.5% | ||||||||||||||||
Allflex Holdings III, Inc. | 4.580 | 07/17/20 | 1,036 | 1,040,920 | ||||||||||||
Avolon Borrower I Luxembourg (Luxembourg) | 3.793 | 03/31/22 | 3,475 | 3,533,314 | ||||||||||||
See Notes to Financial Statements.
| 14 |
| Description | Interest Rate | Maturity Date | Principal Amount (000)# | Value (Note 1) | ||||||||||||
BANK LOANS(a) (Continued) |
| |||||||||||||||
Capital Goods (cont’d.) | ||||||||||||||||
Blount International, Inc. | 7.250 | % | 04/12/23 | 600 | $ | 604,500 | ||||||||||
Brand Energy & Infrastructure Services, Inc. | 4.750 | 11/26/20 | 1,759 | 1,755,611 | ||||||||||||
Casella Waste Systems, Inc.(b) | 4.025 | 10/17/23 | 375 | 376,875 | ||||||||||||
Columbus McKinnon Corp.(b) | 4.030 | 01/31/24 | 475 | 477,375 | ||||||||||||
Cortes NP Acquisition Corp. | 6.054 | 11/30/23 | 798 | 803,319 | ||||||||||||
CPM Holdings, Inc. | 6.000 | 04/11/22 | 1,040 | 1,047,504 | ||||||||||||
Crosby US Acquisition Corp. | 4.041 | 11/23/20 | 966 | 884,837 | ||||||||||||
Doosan Infracore International, Inc. | 4.554 | 05/28/21 | 546 | 552,454 | ||||||||||||
Douglas Dynamics LLC(b) | 4.534 | 12/31/21 | 813 | 815,496 | ||||||||||||
Dynacast International LLC(b) | 4.500 | 01/28/22 | 615 | 621,450 | ||||||||||||
Filtration Group, Inc. | 4.303 | 11/20/20 | 452 | 455,430 | ||||||||||||
Filtration Group, Inc. | 4.303 | 11/23/20 | 198 | 199,337 | ||||||||||||
Forterra Finance LLC | 4.500 | 10/25/23 | 948 | 954,140 | ||||||||||||
Harsco Corp. | 6.000 | 11/02/23 | 500 | 509,375 | ||||||||||||
Hillman Group, Inc. (The) | 4.500 | 06/30/21 | 491 | 493,640 | ||||||||||||
Ilpea Parent, Inc.(b) | 6.555 | 02/28/23 | 1,000 | 985,000 | ||||||||||||
Infiltrator Water Technologies LLC | 4.555 | 05/27/22 | 2,288 | 2,293,826 | ||||||||||||
K&N Engineering, Inc.(b) | 5.750 | 10/20/23 | 1,385 | 1,388,463 | ||||||||||||
Manitowoc Foodservice | 5.750 | 03/03/23 | 550 | 555,156 | ||||||||||||
Milacron LLC(b) | 4.037 | 09/28/23 | 700 | 702,625 | ||||||||||||
Neff Rental LLC | 7.540 | 06/09/21 | 788 | 787,690 | ||||||||||||
North American Lifting Holdings, Inc. | 5.552 | 11/27/20 | 491 | 449,402 | ||||||||||||
Pelican Products, Inc. | 5.265 | 04/11/20 | 419 | 417,174 | ||||||||||||
Penn Engineering & Manufacturing Corp. | 4.038 | 08/27/21 | 640 | 640,527 | ||||||||||||
RBS Global, Inc./Rexnord LLC | 3.770 | 08/21/23 | 1,213 | 1,220,348 | ||||||||||||
Safway Group Holding LLC | 5.803 | 08/21/23 | 2,222 | 2,250,638 | ||||||||||||
STS Operating, Inc.(b) | 4.784 | 02/12/21 | 340 | 325,960 | ||||||||||||
Synagro Infrastructure Co., Inc.(c) | 6.300 | 08/22/20 | 168 | 152,771 | ||||||||||||
Tank Holding Corp. | 5.259 | 03/16/22 | 977 | 972,975 | ||||||||||||
TKC Holdings, Inc. | 4.785 | 02/28/23 | 1,325 | 1,335,766 | ||||||||||||
TKC Holdings, Inc. | 8.535 | 02/01/24 | 575 | 575,359 | ||||||||||||
U.S. Security Associates Holdings, Inc. | 6.000 | 07/14/23 | 848 | 852,821 | ||||||||||||
Unifrax I LLC | 4.304 | 11/28/18 | 1,725 | 1,716,628 | ||||||||||||
University Support Services LLC | 6.260 | 07/06/22 | 2,504 | 2,519,398 | ||||||||||||
USS Parent Holding Corp. | 5.560 | 08/11/23 | 154 | 154,133 | ||||||||||||
USS Parent Holding Corp. | 5.500 | 08/11/23 | 1,044 | 1,047,055 | ||||||||||||
WASH Multifamily Laundry Systems LLC(b) | 4.250 | 05/16/22 | 1,414 | 1,418,900 | ||||||||||||
WCA Waste Systems, Inc. | 3.784 | 08/11/23 | 648 | 650,604 | ||||||||||||
WireCo WorldGroup, Inc. | 6.500 | 09/29/23 | 574 | 578,581 | ||||||||||||
|
| |||||||||||||||
| 39,117,377 | ||||||||||||||||
See Notes to Financial Statements.
| Prudential Floating Rate Income Fund | 15 |
Portfolio of Investments (continued)
as of February 28, 2017
| Description | Interest Rate | Maturity Date | Principal Amount (000)# | Value (Note 1) | ||||||||||||
BANK LOANS(a) (Continued) |
| |||||||||||||||
Chemicals 3.8% | ||||||||||||||||
A. Schulman, Inc.(b) | 4.030 | % | 06/01/22 | 434 | $ | 434,107 | ||||||||||
Alpha 3 BV Alpha US BidCo (Netherlands) | 4.037 | 01/31/24 | 1,200 | 1,207,876 | ||||||||||||
Avantor Performance Materials Holdings, Inc. | 6.000 | 06/21/22 | 1,804 | 1,821,347 | ||||||||||||
Chemours Co. LLC (The) | 3.790 | 05/12/22 | 1,778 | 1,784,270 | ||||||||||||
Colouroz Investment 2 LLC | 8.250 | 09/05/22 | 200 | 197,000 | ||||||||||||
Cyanco Intermediate Corp. | 5.500 | 05/01/20 | 1,417 | 1,417,939 | ||||||||||||
Emerald Performance Materials LLC | 8.784 | 08/01/22 | 300 | 301,425 | ||||||||||||
Ennis-Flint, Inc. | 5.000 | 06/13/23 | 1,291 | 1,295,178 | ||||||||||||
MacDermid, Inc. | 4.500 | 06/07/20 | 762 | 770,860 | ||||||||||||
MacDermid, Inc. | 5.000 | 06/07/23 | 1,173 | 1,185,415 | ||||||||||||
Methanol Holdings DE LLC(b) | 4.498 | 06/30/22 | 493 | 485,112 | ||||||||||||
Nexeo Solutions LLC | 5.263 | 06/09/23 | 2,169 | 2,184,222 | ||||||||||||
Oxea Finance LLC | 4.273 | 01/15/20 | 484 | 473,773 | ||||||||||||
Plaskolite, Inc.(b) | 5.750 | 11/03/22 | 769 | 776,558 | ||||||||||||
PQ Corp. | 5.288 | 11/04/22 | 945 | 956,295 | ||||||||||||
Solenis International LP | 7.750 | 07/31/22 | 200 | 197,400 | ||||||||||||
Sonneborn, Inc. | 4.750 | 12/10/20 | 790 | 791,034 | ||||||||||||
Tata Chemicals NA, Inc.(b) | 3.784 | 08/07/20 | 585 | 585,163 | ||||||||||||
Tronox Pigments Netherlands BV | 4.500 | 03/19/20 | 521 | 523,550 | ||||||||||||
Univar, Inc. | 3.608 | 07/01/22 | 2,435 | 2,434,836 | ||||||||||||
|
| |||||||||||||||
| 19,823,360 | ||||||||||||||||
Consumer 6.1% | ||||||||||||||||
24 Hour Fitness Worldwide, Inc.(b) | 4.750 | 05/28/21 | 869 | 855,207 | ||||||||||||
4L Technologies, Inc. | 5.270 | 05/08/20 | 1,797 | 1,729,962 | ||||||||||||
Acosta, Inc. | 4.289 | 09/26/21 | 729 | 709,282 | ||||||||||||
Advantage Sales & Marketing, Inc. | 4.291 | 07/23/21 | 887 | 883,155 | ||||||||||||
Advantage Sales & Marketing, Inc. | 7.538 | 07/25/22 | 750 | 735,704 | ||||||||||||
Augusta Sportswear, Inc. | 5.500 | 10/26/23 | 1,087 | 1,088,442 | ||||||||||||
Coinstar LLC | 5.250 | 09/27/23 | 549 | 553,426 | ||||||||||||
Cole Haan, Inc. | 5.060 | 02/01/20 | 1,731 | 1,531,751 | ||||||||||||
Fitness International LLC | 6.000 | 07/01/20 | 728 | 733,258 | ||||||||||||
Hoffmaster Group, Inc. | 5.552 | 11/21/23 | 1,625 | 1,645,313 | ||||||||||||
Life Time Fitness, Inc. | 4.037 | 06/10/22 | 666 | 668,795 | ||||||||||||
NBTY, Inc.(b) | 4.538 | 05/05/23 | 1,393 | 1,394,702 | ||||||||||||
Planet Fitness Holdings LLC | 4.498 | 03/31/21 | 723 | 725,900 | ||||||||||||
PODS LLC | 4.250 | 02/02/22 | 1,315 | 1,321,797 | ||||||||||||
Revlon Consumer Products Corp. | 4.451 | 09/07/23 | 1,222 | 1,228,485 | ||||||||||||
Royal Holdings, Inc. | 4.250 | 06/20/22 | 1,141 | 1,147,900 | ||||||||||||
Royal Oak Enterpises, LLC | 5.750 | 07/01/23 | 1,498 | 1,508,920 | ||||||||||||
Serta Simmons Bedding LLC | 4.500 | 11/08/23 | 1,475 | 1,481,501 | ||||||||||||
Spin Holdco, Inc. | 4.285 | 11/14/19 | 1,496 | 1,489,637 | ||||||||||||
SRAM Corp.(b) | 4.040 | 04/10/20 | 1,193 | 1,185,852 | ||||||||||||
See Notes to Financial Statements.
| 16 |
| Description | Interest Rate | Maturity Date | Principal Amount (000)# | Value (Note 1) | ||||||||||||
BANK LOANS(a) (Continued) |
| |||||||||||||||
Consumer (cont’d.) | ||||||||||||||||
Sterling Midco Holdings, Inc. | 5.750 | % | 06/20/22 | 1,737 | $ | 1,731,180 | ||||||||||
Strategic Partners Acquisition Corp.(b) | 5.500 | 06/30/23 | 1,446 | 1,458,526 | ||||||||||||
TMK Hawk Parent Corp. | 5.250 | 10/01/21 | 1,294 | 1,299,323 | ||||||||||||
Travelport Finance Luxembourg SARL (Luxembourg) | 4.291 | 09/02/21 | 1,590 | 1,601,049 | ||||||||||||
TruGreen LP | 6.500 | 04/13/23 | 721 | 727,687 | ||||||||||||
Wand Intermediate I LP | 4.750 | 09/17/21 | 813 | 820,100 | ||||||||||||
Water Pik, Inc. | 5.759 | 07/08/20 | 1,442 | 1,441,098 | ||||||||||||
|
| |||||||||||||||
| 31,697,952 | ||||||||||||||||
Electric 2.5% | ||||||||||||||||
Calpine Corp. | 3.750 | 05/31/23 | 198 | 199,034 | ||||||||||||
Calpine Corp. | 3.750 | 01/15/24 | 2,146 | 2,154,876 | ||||||||||||
Calpine Corp. | 3.775 | 01/15/23 | 743 | 745,594 | ||||||||||||
Dynegy, Inc. | 4.284 | 02/07/24 | 2,950 | 2,976,698 | ||||||||||||
Intergen NV | 5.500 | 06/12/20 | 1,005 | 1,004,076 | ||||||||||||
Lightstone Generation LLC | 6.500 | 01/30/24 | 407 | 410,790 | ||||||||||||
Lightstone Generation LLC | 6.539 | 01/30/24 | 4,268 | 4,313,297 | ||||||||||||
USIC Holdings, Inc. | 4.750 | 12/08/23 | 1,175 | 1,184,158 | ||||||||||||
|
| |||||||||||||||
| 12,988,523 | ||||||||||||||||
Energy - Other�� 2.1% | ||||||||||||||||
American Energy Marcellus LLC | 5.250 | 08/04/20 | 1,500 | 1,065,000 | ||||||||||||
American Energy Marcellus LLC | 8.534 | 08/04/21 | 300 | 41,000 | ||||||||||||
California Resources Corp. | 11.375 | 12/31/21 | 1,275 | 1,434,375 | ||||||||||||
Drillships Financing Holding, Inc. | 6.000 | 03/31/21 | 364 | 298,229 | ||||||||||||
Fairmount Minerals Ltd. | 4.500 | 09/05/19 | 1,500 | 1,474,999 | ||||||||||||
Fieldwood Energy LLC(b) | 8.000 | 08/31/20 | 362 | 346,185 | ||||||||||||
Fieldwood Energy LLC | 8.375 | 09/30/20 | 1,489 | 1,303,200 | ||||||||||||
Floatel Delaware LLC(b) | 6.000 | 06/29/20 | 365 | 319,102 | ||||||||||||
FTS International, Inc. | 5.750 | 04/16/21 | 251 | 240,755 | ||||||||||||
Hi-Crush Partners LP | 4.789 | 04/28/21 | 1,082 | 1,055,517 | ||||||||||||
MEG Energy Corp. (Canada) | 4.530 | 12/31/23 | 2,073 | 2,082,657 | ||||||||||||
Pacific Drilling SA | 4.500 | 06/04/18 | 359 | 162,113 | ||||||||||||
Targa Resources Partners LP(b) | 5.750 | 02/27/22 | 974 | 984,172 | ||||||||||||
Westway Group, Inc.(b) | 4.500 | 02/27/20 | 475 | 454,813 | ||||||||||||
|
| |||||||||||||||
| 11,262,117 | ||||||||||||||||
Energy - Refining 1.3% | ||||||||||||||||
Citgo Holdings, Inc. | 9.500 | 05/12/18 | 2,349 | 2,381,332 | ||||||||||||
Citgo Petroleum Corp. | 4.539 | 07/29/21 | 1,081 | 1,085,255 | ||||||||||||
See Notes to Financial Statements.
| Prudential Floating Rate Income Fund | 17 |
Portfolio of Investments (continued)
as of February 28, 2017
| Description | Interest Rate | Maturity Date | Principal Amount (000)# | Value (Note 1) | ||||||||||||
BANK LOANS(a) (Continued) |
| |||||||||||||||
Energy - Refining (cont’d.) | ||||||||||||||||
Western Refining, Inc. | 5.284 | % | 11/12/20 | 2,258 | $ | 2,266,513 | ||||||||||
Western Refining, Inc. | 5.500 | 06/30/23 | 932 | 935,679 | ||||||||||||
|
| |||||||||||||||
| 6,668,779 | ||||||||||||||||
Entertainment 0.2% | ||||||||||||||||
AMF Bowling Centers, Inc. | 6.000 | 09/19/23 | 1,022 | 1,024,994 | ||||||||||||
Food 2.9% | ||||||||||||||||
Amplify Snack Brands, Inc. | 6.500 | 09/01/23 | 1,897 | 1,859,361 | ||||||||||||
Chefs’ Warehouse, Inc. (The)(b) | 6.750 | 06/22/22 | 1,086 | 1,099,306 | ||||||||||||
Constellation Brands Canada, Inc. (Canada) | 4.750 | 12/15/23 | 650 | 655,959 | ||||||||||||
Focus Brands, Inc. | 5.000 | 10/05/23 | 434 | 438,933 | ||||||||||||
Hearthside Group Holdings LLC(b) | 4.025 | 06/02/21 | 1,389 | 1,399,022 | ||||||||||||
High Liner Foods, Inc. (Canada) | 4.250 | 04/26/21 | 1,000 | 997,500 | ||||||||||||
JBS USA LLC (Brazil) | 3.539 | 10/30/22 | 3,600 | 3,610,501 | ||||||||||||
Milk Specialties Co. | 5.000 | 08/16/23 | 898 | 903,922 | ||||||||||||
Mill US Acquisition LLC | 5.000 | 07/03/20 | 2,426 | 2,260,052 | ||||||||||||
Shearer’s Foods LLC | 4.938 | 06/30/21 | 1,933 | 1,930,250 | ||||||||||||
|
| |||||||||||||||
| 15,154,806 | ||||||||||||||||
Gaming 2.0% | ||||||||||||||||
Affinity Gaming LLC | 4.500 | 07/01/23 | 997 | 1,000,611 | ||||||||||||
Caesars Entertainment Resort Properties LLC | 7.015 | 10/11/20 | 2,782 | 2,804,838 | ||||||||||||
CCM Merger, Inc.(b) | 4.031 | 08/06/21 | 1,412 | 1,425,785 | ||||||||||||
Golden Nugget, Inc. | 4.500 | 11/21/19 | 336 | 339,764 | ||||||||||||
Golden Nugget, Inc. | 4.552 | 11/21/19 | 784 | 792,783 | ||||||||||||
Scientific Games International, Inc. | 6.000 | 10/01/21 | 2,395 | 2,427,389 | ||||||||||||
Station Casinos LLC | 3.280 | 06/08/23 | 1,624 | 1,633,252 | ||||||||||||
|
| |||||||||||||||
| 10,424,422 | ||||||||||||||||
Health Care & Pharmaceutical 13.9% | ||||||||||||||||
Acadia Healthcare Co., Inc. | 3.781 | 02/16/23 | 1,439 | 1,450,515 | ||||||||||||
Air Medical Group Holdings, Inc. | 4.250 | 04/28/22 | 1,240 | 1,237,389 | ||||||||||||
Alliance HealthCare Services, Inc. | 4.250 | 06/03/19 | 3,307 | 3,277,627 | ||||||||||||
Amneal Pharmaceuticals LLC | 4.501 | 11/01/19 | 1,682 | 1,671,691 | ||||||||||||
Arbor Pharmaceuticals LLC | 6.000 | 07/05/23 | 1,222 | 1,233,234 | ||||||||||||
ATI Holdings LLC | 5.536 | 05/10/23 | 2,616 | 2,635,861 | ||||||||||||
Boston Luxembourg III SARL (Germany) | 4.000 | 08/28/19 | 247 | 246,720 | ||||||||||||
Capsugel Holdings US, Inc. | 4.000 | 07/31/21 | 1,482 | 1,483,458 | ||||||||||||
Carecore National LLC(b) | 5.500 | 03/05/21 | 1,985 | 1,992,473 | ||||||||||||
CCS Intermediate Holdings LLC(b) | 5.041 | 07/23/21 | 220 | 182,548 | ||||||||||||
Change Healthcare Holdings LLC | 3.750 | 02/28/24 | 3,875 | 3,883,881 | ||||||||||||
See Notes to Financial Statements.
| 18 |
| Description | Interest Rate | Maturity Date | Principal Amount (000)# | Value (Note 1) | ||||||||||||
BANK LOANS(a) (Continued) |
| |||||||||||||||
Health Care & Pharmaceutical (cont’d.) | ||||||||||||||||
CHG Healthcare Services, Inc. | 4.750 | % | 06/07/23 | 1,995 | $ | 2,014,200 | ||||||||||
CHS/Community Health Systems, Inc. | 4.180 | 12/31/18 | 500 | 498,333 | ||||||||||||
CHS/Community Health Systems, Inc. | 3.750 | 12/31/19 | 2,693 | 2,668,268 | ||||||||||||
CHS/Community Health Systems, Inc. | 4.039 | 01/27/21 | 1,990 | 1,954,397 | ||||||||||||
ContextMedia Health LLC(b) | 7.500 | 12/23/21 | 1,650 | 1,567,500 | ||||||||||||
Curo Health Services Holdings, Inc. | 5.789 | 02/07/22 | 2,121 | 2,126,796 | ||||||||||||
Endo Luxembourgh Finance I Co. SARL | 3.813 | 09/30/22 | 2,738 | 2,746,987 | ||||||||||||
Envision Healthcare Corp. | 3.906 | 12/01/23 | 1,145 | 1,152,298 | ||||||||||||
Explorer Holdings, Inc. | 6.000 | 05/02/23 | 945 | 954,702 | ||||||||||||
FHC Health Systems, Inc. | 5.000 | 12/23/21 | 987 | 947,364 | ||||||||||||
Genoa A Qol Healthcare Co. LLC | 4.750 | 10/30/23 | 1,497 | 1,505,608 | ||||||||||||
Grifols Worldwide Operations USA, Inc. | 3.282 | 01/31/25 | 1,300 | 1,305,070 | ||||||||||||
Horizon Pharma, Inc.(b) | 5.000 | 05/07/21 | 869 | 880,252 | ||||||||||||
Kindred Healthcare, Inc. | 4.313 | 04/09/21 | 2,234 | 2,213,440 | ||||||||||||
Lannett Co., Inc. | 6.375 | 11/25/22 | 2,482 | 2,457,360 | ||||||||||||
Mallinckrodt International Finance SA (Luxembourg) | 3.748 | 09/24/24 | 825 | 828,609 | ||||||||||||
Mallinckrodt International Finance SA (Luxembourg) | 3.748 | 09/24/24 | 1,240 | 1,241,907 | ||||||||||||
MJ Acquisition Corp. | 4.001 | 06/01/22 | 1,037 | 1,040,442 | ||||||||||||
MPH Acquisition Holdings LLC | 5.038 | 06/07/23 | 1,025 | 1,040,043 | ||||||||||||
Opal Acquisition, Inc. | 5.052 | 11/27/20 | 491 | 462,281 | ||||||||||||
Ortho Clinical Diagnostics | 4.750 | 06/30/21 | 2,273 | 2,248,394 | ||||||||||||
Pharmaceutical Product Development LLC | 4.250 | 08/18/22 | 2,059 | 2,069,265 | ||||||||||||
Quorum Health Corp. | 6.789 | 04/29/22 | 937 | 930,801 | ||||||||||||
RadNet Management, Inc. | — | (f) | 07/01/23 | 211 | 211,910 | |||||||||||
RadNet Management, Inc. | 8.000 | 03/25/21 | 2,693 | 2,689,967 | ||||||||||||
RPI Finance Trust | 3.525 | 10/14/22 | 423 | 427,259 | ||||||||||||
Select Medical Corp. | 4.534 | 02/28/24 | 2,800 | 2,805,250 | ||||||||||||
Select Medical Corp. | 6.000 | 03/03/21 | 1,340 | 1,346,574 | ||||||||||||
Surgery Center Holdings, Inc. | 4.750 | 11/03/20 | 1,745 | 1,755,270 | ||||||||||||
Team Health Holdings, Inc. | 3.772 | 01/31/24 | 1,900 | 1,891,095 | ||||||||||||
US Renal Care, Inc. | 5.250 | 12/30/22 | 1,390 | 1,279,017 | ||||||||||||
Valeant Pharmaceuticals International, | 4.540 | 10/20/18 | 338 | 337,196 | ||||||||||||
Valeant Pharmaceuticals International, | 5.270 | 12/11/19 | 856 | 859,758 | ||||||||||||
Valeant Pharmaceuticals International, | 5.272 | 08/05/20 | 2,050 | 2,057,049 | ||||||||||||
Valeant Pharmaceuticals International, | 5.530 | 04/01/22 | 1,946 | 1,956,970 | ||||||||||||
Vizient, Inc. | 5.000 | 02/11/23 | 806 | 816,661 | ||||||||||||
|
| |||||||||||||||
| 72,583,690 | ||||||||||||||||
See Notes to Financial Statements.
| Prudential Floating Rate Income Fund | 19 |
Portfolio of Investments (continued)
as of February 28, 2017
| Description | Interest Rate | Maturity Date | Principal Amount (000)# | Value (Note 1) | ||||||||||||
BANK LOANS(a) (Continued) |
| |||||||||||||||
Insurance 0.8% | ||||||||||||||||
AmWins Group, Inc. | 3.791 | % | 01/25/24 | 1,750 | $ | 1,756,927 | ||||||||||
AmWins Group, Inc. | 7.791 | 01/24/25 | 560 | 565,425 | ||||||||||||
Hyperion Insurance Group Ltd. (United Kingdom) | 5.500 | 04/29/22 | 1,537 | 1,539,518 | ||||||||||||
Sedgwick Claims Management Services, Inc. | 6.804 | 02/28/22 | 250 | 250,625 | ||||||||||||
|
| |||||||||||||||
| 4,112,495 | ||||||||||||||||
Media & Entertainment 2.3% | ||||||||||||||||
Beasley Broadcast Group, Inc. | 7.000 | 11/01/23 | 359 | 358,048 | ||||||||||||
CBS Radio, Inc. | 4.500 | 10/17/23 | 430 | 433,630 | ||||||||||||
Getty Images, Inc. | 4.750 | 10/18/19 | 979 | 860,646 | ||||||||||||
Learfield Communications, Inc.(b) | 4.250 | 12/31/23 | 1,125 | 1,137,656 | ||||||||||||
Lions Gate Entertainment Corp. | 3.953 | 12/08/23 | 700 | 704,025 | ||||||||||||
Match Group, Inc.(b) | 4.201 | 11/16/22 | 977 | 990,575 | ||||||||||||
Mood Media Corp. (Canada) | 7.000 | 05/01/19 | 492 | 483,547 | ||||||||||||
NEP Broadcasting LLC | 10.000 | 07/22/20 | 543 | 548,964 | ||||||||||||
NEP/NCP Holdco, Inc. | 4.291 | 01/22/20 | 1,226 | 1,227,775 | ||||||||||||
Nielsen Finance LLC | 3.442 | 10/04/23 | 599 | 604,560 | ||||||||||||
Stadium Management Group | 5.070 | 02/27/20 | 1,294 | 1,287,733 | ||||||||||||
Tribune Media Co. | 3.781 | 12/27/20 | 77 | 77,098 | ||||||||||||
Tribune Media Co. | 4.039 | 01/27/24 | 458 | 460,518 | ||||||||||||
Univision Communications, Inc. | 4.000 | 03/01/20 | 1,754 | 1,759,822 | ||||||||||||
WMG Acquisition Corp. | 3.785 | 11/01/23 | 1,000 | 1,004,464 | ||||||||||||
|
| |||||||||||||||
| 11,939,061 | ||||||||||||||||
Metals & Mining 1.0% | ||||||||||||||||
Global Brass & Copper, Inc.(b) | 5.274 | 07/18/23 | 474 | 480,920 | ||||||||||||
Minerals Technologies, Inc.(b) | 4.750 | 05/10/21 | 225 | 226,687 | ||||||||||||
Murray Energy Corp. | 8.250 | 04/16/20 | 1,169 | 1,151,632 | ||||||||||||
Peabody Energy Corp.(b) | 5.560 | 02/28/22 | 575 | 584,344 | ||||||||||||
Phoenix Services International LLC | 8.500 | 06/30/19 | 1,735 | 1,742,653 | ||||||||||||
Westmoreland Coal Co.(b) | 7.500 | 12/16/20 | 171 | 157,322 | ||||||||||||
Zekelman Industries, Inc. | 3.750 | 06/14/21 | 847 | 854,472 | ||||||||||||
|
| |||||||||||||||
| 5,198,030 | ||||||||||||||||
Other Industry 3.8% | ||||||||||||||||
AlixPartners LLP | 4.039 | 07/28/22 | 1,683 | 1,697,709 | ||||||||||||
Altisource Solutions SARL (Luxembourg)(b) | 4.500 | 12/09/20 | 835 | 813,825 | ||||||||||||
Asurion LLC | 8.500 | 03/03/21 | 1,000 | 1,010,938 | ||||||||||||
AVSC Holding Corp. | 4.538 | 01/25/21 | 598 | 598,462 | ||||||||||||
Daseke, Inc.(b) | 6.560 | 02/28/24 | 250 | 251,875 | ||||||||||||
Edelman Financial Group, Inc. | 6.500 | 12/19/22 | 1,639 | 1,642,556 | ||||||||||||
See Notes to Financial Statements.
| 20 |
| Description | Interest Rate | Maturity Date | Principal Amount (000)# | Value (Note 1) | ||||||||||||
BANK LOANS(a) (Continued) |
| |||||||||||||||
Other Industry (cont’d.) |
| |||||||||||||||
GCA Services Group, Inc. | 6.070 | % | 03/01/23 | 418 | $ | 420,141 | ||||||||||
Laureate Education, Inc. | 5.000 | 06/18/18 | 1,000 | 1,005,000 | ||||||||||||
Laureate Education, Inc. | 9.510 | 03/17/21 | 2,136 | 2,154,025 | ||||||||||||
Mannington Mills, Inc. | 4.750 | 10/01/21 | 1,098 | 1,106,907 | ||||||||||||
Merrill Communications LLC(b) | 6.250 | 06/01/22 | 1,414 | 1,409,972 | ||||||||||||
Ocwen Loan Servicing LLC | 6.000 | 12/07/20 | 475 | 477,969 | ||||||||||||
Onsite Rental Group Operation Pty. Ltd.(c) | 5.500 | 07/30/21 | 220 | 169,352 | ||||||||||||
Osmose Utility Services, Inc. | 4.750 | 08/22/22 | 370 | 372,164 | ||||||||||||
Packers Holdings LLC(b) | 4.750 | 12/02/21 | 1,024 | 1,039,620 | ||||||||||||
Power Buyer LLC | 4.284 | 05/06/20 | 1,211 | 1,210,737 | ||||||||||||
Precyse Acquisition Corp. | 6.500 | 10/20/22 | 1,246 | 1,258,202 | ||||||||||||
SAI Global, Inc. (Australia)(b) | 0.948 | 12/08/23 | 1,275 | 1,294,125 | ||||||||||||
USAGM HoldCo LLC | 4.763 | 07/28/22 | 990 | 993,712 | ||||||||||||
USAGM HoldCo LLC | 5.500 | 07/28/22 | 1,167 | 1,173,249 | ||||||||||||
|
| |||||||||||||||
| 20,100,540 | ||||||||||||||||
Packaging 4.2% |
| |||||||||||||||
Anchor Glass Container Corp. | 4.250 | 12/07/23 | 600 | 605,250 | ||||||||||||
Berlin Packaging LLC | 4.500 | 10/01/21 | 1,747 | 1,760,571 | ||||||||||||
Berry Plastics Corp. | 3.281 | 01/19/24 | 1,500 | 1,509,375 | ||||||||||||
Bway Holdings Co. | 4.787 | 08/14/23 | 2,605 | 2,607,247 | ||||||||||||
Charter NEX US Holdings, Inc. | 5.250 | 02/07/22 | 634 | 637,837 | ||||||||||||
Exopack Holdings SA (Luxembourg) | 4.509 | 05/08/19 | 1,688 | 1,698,761 | ||||||||||||
Expera Specialty Solutions LLC(b) | 5.784 | 11/03/23 | 673 | 676,679 | ||||||||||||
Flex Acquisition Co., Inc. | 4.250 | 12/29/23 | 2,375 | 2,392,071 | ||||||||||||
Husky Injection Molding Systems Ltd. (Canada) | 4.250 | 06/30/21 | 1,554 | 1,561,839 | ||||||||||||
Plaze, Inc. | 5.250 | 07/31/22 | 1,641 | 1,645,375 | ||||||||||||
Pregis Holding I Corp. | 4.500 | 05/20/21 | 1,388 | 1,386,172 | ||||||||||||
Pro Mach, Inc. | 4.750 | 10/22/21 | 2,112 | 2,110,982 | ||||||||||||
ProAmpac PG Borrower LLC | 5.056 | 11/20/23 | 1,500 | 1,517,344 | ||||||||||||
Reynolds Group Holdings, Inc. | 4.034 | 02/05/23 | 1,097 | 1,102,791 | ||||||||||||
Signode Industrial Group US, Inc. | 4.000 | 05/01/21 | 967 | 976,938 | ||||||||||||
|
| |||||||||||||||
| 22,189,232 | ||||||||||||||||
Paper 0.1% |
| |||||||||||||||
Caraustar Industries, Inc. | 8.000 | 05/01/19 | 427 | 431,956 | ||||||||||||
Real Estate 0.6% |
| |||||||||||||||
Americold Realty Operating Partnership LP | 4.750 | 12/01/22 | 893 | 904,713 | ||||||||||||
Capital Automotive LP(b) | 6.000 | 04/30/20 | 850 | 858,500 | ||||||||||||
DTZ US Borrower LLC | 4.288 | 11/04/21 | 1,213 | 1,219,682 | ||||||||||||
|
| |||||||||||||||
| 2,982,895 | ||||||||||||||||
See Notes to Financial Statements.
| Prudential Floating Rate Income Fund | 21 |
Portfolio of Investments (continued)
as of February 28, 2017
| Description | Interest Rate | Maturity Date | Principal Amount (000)# | Value (Note 1) | ||||||||||||
BANK LOANS(a) (Continued) |
| |||||||||||||||
Restaurants 0.6% |
| |||||||||||||||
BC Unlimited Liability Co. (Canada) | 3.750 | % | 02/28/24 | 1,128 | $ | 1,128,369 | ||||||||||
CEC Entertainment, Inc. | 4.034 | 02/12/21 | 1,647 | 1,637,467 | ||||||||||||
Landry’s, Inc. | 4.029 | 10/04/23 | 525 | 530,532 | ||||||||||||
|
| |||||||||||||||
| 3,296,368 | ||||||||||||||||
Retailers 7.2% |
| |||||||||||||||
Academy Ltd. | 5.000 | 07/01/22 | 2,233 | 1,763,798 | ||||||||||||
At Home Holding III, Inc. | 4.539 | 06/03/22 | 1,414 | 1,415,422 | ||||||||||||
Bass Pro Group LLC | 4.198 | 06/05/20 | 2,479 | 2,390,597 | ||||||||||||
Bass Pro Group LLC | 5.970 | 12/15/23 | 1,925 | 1,847,097 | ||||||||||||
CNT Holdings III Corp. | 4.288 | 01/23/23 | 1,519 | 1,528,050 | ||||||||||||
EyeMart Express LLC(b) | 5.000 | 12/18/21 | 502 | 507,476 | ||||||||||||
Floor & Decor Outlets of America, Inc.(b) | 5.250 | 09/30/23 | 1,247 | 1,246,875 | ||||||||||||
Fullbeauty Brands, Inc. | 5.750 | 10/14/22 | 1,142 | 972,707 | ||||||||||||
Harbor Freight Tools USA, Inc. | 3.778 | 08/18/23 | 1,323 | 1,323,331 | ||||||||||||
Hudsons Bay Co. (Canada) | 4.250 | 09/30/22 | 1,688 | 1,653,414 | ||||||||||||
JC Penney Corp., Inc. | 5.250 | 06/23/23 | 1,059 | 1,047,115 | ||||||||||||
Lands’ End, Inc. | 4.250 | 04/02/21 | 612 | 452,872 | ||||||||||||
Leslie’s Poolmart, Inc. | 5.250 | 08/16/23 | 1,799 | 1,801,773 | ||||||||||||
Men’s Warehouse, Inc. (The)(b) | 5.000 | 06/18/21 | 2,250 | 2,148,750 | ||||||||||||
Neiman Marcus Group Ltd. LLC | 4.250 | 10/25/20 | 2,465 | 1,983,790 | ||||||||||||
NVA Holdings, Inc.(b) | 4.553 | 08/14/21 | 351 | 352,408 | ||||||||||||
NVA Holdings, Inc. | 4.750 | 08/16/21 | 1,188 | 1,192,642 | ||||||||||||
NVA Holdings, Inc. | 8.000 | 08/14/22 | 1,225 | 1,229,083 | ||||||||||||
Party City Holdings, Inc. | 3.855 | 08/19/22 | 949 | 942,995 | ||||||||||||
Petco Animal Supplies, Inc. | 4.272 | 01/26/23 | 1,983 | 1,907,822 | ||||||||||||
PetSmart, Inc. | 4.000 | 03/11/22 | 2,977 | 2,928,577 | ||||||||||||
Rite Aid Corp. | 4.875 | 06/21/21 | 3,525 | 3,531,609 | ||||||||||||
Rite Aid Corp. | 5.750 | 08/21/20 | 375 | 376,031 | ||||||||||||
Sears Roebuck Acceptance Corp. | 5.500 | 06/30/18 | 1,477 | 1,459,524 | ||||||||||||
Vision Holding Corp. | 4.000 | 03/12/21 | 1,936 | 1,933,333 | ||||||||||||
|
| |||||||||||||||
| 37,937,091 | ||||||||||||||||
Supermarkets 1.0% |
| |||||||||||||||
Albertsons LLC | 3.780 | 08/25/21 | 722 | 729,328 | ||||||||||||
Albertsons LLC | 4.248 | 12/21/22 | 1,469 | 1,490,090 | ||||||||||||
Albertsons LLC | 4.248 | 06/22/23 | 1,116 | 1,131,735 | ||||||||||||
GOBP Holdings, Inc. | 5.000 | 10/21/21 | 1,353 | 1,351,381 | ||||||||||||
Supervalu, Inc. | 5.500 | 03/21/19 | 482 | 485,194 | ||||||||||||
|
| |||||||||||||||
| 5,187,728 | ||||||||||||||||
See Notes to Financial Statements.
| 22 |
| Description | Interest Rate | Maturity Date | Principal Amount (000)# | Value (Note 1) | ||||||||||||
BANK LOANS(a) (Continued) |
| |||||||||||||||
Technology 14.3% |
| |||||||||||||||
ACTIVE Network, Inc. | 6.034 | % | 11/13/20 | 1,411 | $ | 1,407,743 | ||||||||||
Alorica, Inc. | 5.748 | 06/30/22 | 730 | 735,637 | ||||||||||||
Ancestry.com, Inc. | 4.288 | 10/19/23 | 1,350 | 1,354,387 | ||||||||||||
Ancestry.com, Inc. | 9.250 | 10/18/24 | 675 | 690,750 | ||||||||||||
Aptean Holdings, Inc. | 6.000 | 12/20/22 | 600 | 604,875 | ||||||||||||
Avaya, Inc. | 6.304 | 05/29/20 | 1,351 | 1,072,270 | ||||||||||||
Avaya, Inc. | 6.500 | 03/30/18 | 127 | 101,318 | ||||||||||||
Avaya, Inc. | 8.541 | 02/28/18 | 450 | 462,488 | ||||||||||||
BMC Software Finance, Inc. | 5.000 | 09/10/20 | 7,180 | 7,216,854 | ||||||||||||
Camelot Finance LP | 4.750 | 10/03/23 | 524 | 529,448 | ||||||||||||
Cavium, Inc.(b) | 3.780 | 08/16/22 | 481 | 485,263 | ||||||||||||
CompuCom Systems, Inc. | 4.284 | 05/11/20 | 277 | 222,727 | ||||||||||||
Compuware Corp. | 5.250 | 12/15/21 | 2,059 | 2,058,421 | ||||||||||||
Dell International LLC | 3.198 | 09/07/21 | 741 | 741,154 | ||||||||||||
Dell International LLC | 3.534 | 09/07/23 | 2,000 | 2,011,562 | ||||||||||||
Dell International LLC | 4.040 | 09/07/23 | 2,419 | 2,432,530 | ||||||||||||
Donnelley Financial Solutions, Inc. | 5.000 | 09/30/23 | 343 | 346,000 | ||||||||||||
EagleView Technology Corp. | 5.250 | 07/15/22 | 691 | 689,954 | ||||||||||||
Evergreen Skills SARL | 5.750 | 04/28/21 | 1,833 | 1,675,275 | ||||||||||||
Evergreen Skills SARL | 9.250 | 04/28/22 | 475 | 332,500 | ||||||||||||
Evertec Group LLC | 3.523 | 04/17/20 | 765 | 761,548 | ||||||||||||
First Data Corp. | 3.948 | 07/10/22 | 3,125 | 3,152,741 | ||||||||||||
Genesys Telecom Labs, Inc. | 5.025 | 12/01/23 | 1,925 | 1,946,656 | ||||||||||||
GlobalLogic Holdings, Inc.(b) | 5.500 | 06/20/22 | 1,000 | 1,013,750 | ||||||||||||
Go Daddy Operating Co. LLC | 3.560 | 02/15/24 | 1,075 | 1,076,478 | ||||||||||||
GTCR Valor Companies, Inc. | 7.000 | 06/16/23 | 1,843 | 1,852,711 | ||||||||||||
Hyland Software, Inc. | 4.285 | 07/01/22 | 1,064 | 1,077,987 | ||||||||||||
Infor US, Inc. | 3.750 | 02/01/22 | 741 | 741,396 | ||||||||||||
Informatica Corp. | 4.500 | 08/05/22 | 2,607 | 2,591,682 | ||||||||||||
Information Resources, Inc. | 5.250 | 01/18/24 | 1,625 | 1,643,790 | ||||||||||||
Internet Brands, Inc. | 4.759 | 07/08/21 | 1,220 | 1,222,561 | ||||||||||||
IPC Systems, Inc.(b) | 5.500 | 08/06/21 | 1,436 | 1,339,398 | ||||||||||||
Kronos, Inc. | 5.000 | 11/01/23 | 2,050 | 2,070,287 | ||||||||||||
Kronos, Inc. | 9.250 | 11/01/24 | 400 | 412,375 | ||||||||||||
Lattice Semiconductor Corp.(b) | 5.260 | 03/10/21 | 2,158 | 2,152,460 | ||||||||||||
Linxens (Luxembourg) | 4.554 | 10/14/22 | 1,915 | 1,918,897 | ||||||||||||
Linxens (Luxembourg)(b) | 9.500 | 10/16/23 | 300 | 297,750 | ||||||||||||
MA FinanceCo. LLC | 4.789 | 11/20/19 | 289 | 290,813 | ||||||||||||
MA FinanceCo. LLC (United Kingdom) | 4.789 | 11/19/21 | 249 | 250,649 | ||||||||||||
Masergy Holdings, Inc. | 5.500 | 12/15/23 | 1,550 | 1,559,687 | ||||||||||||
Micron Technologies, Inc. | 4.540 | 04/26/22 | 1,619 | 1,640,281 | ||||||||||||
MTS Systems Corp.(b) | 5.259 | 07/05/23 | 673 | 682,571 | ||||||||||||
See Notes to Financial Statements.
| Prudential Floating Rate Income Fund | 23 |
Portfolio of Investments (continued)
as of February 28, 2017
| Description | Interest Rate | Maturity Date | Principal Amount (000)# | Value (Note 1) | ||||||||||||
BANK LOANS(a) (Continued) |
| |||||||||||||||
Technology (cont’d.) |
| |||||||||||||||
ON Semiconductor Corp. | 4.248 | % | 03/31/23 | 973 | $ | 981,613 | ||||||||||
Optiv Security, Inc. | 4.291 | 02/01/24 | 650 | 654,062 | ||||||||||||
Presidio Holdings Ltd. | 4.500 | 02/02/22 | 1,086 | 1,092,585 | ||||||||||||
Rackspace Hosting, Inc. | 4.535 | 11/03/23 | 2,100 | 2,121,328 | ||||||||||||
RP Crown Parent LLC | 4.500 | 10/12/23 | 1,475 | 1,483,112 | ||||||||||||
Sabre Global, Inc. | 3.810 | 02/28/24 | 625 | 629,375 | ||||||||||||
Seahawk Holding (Cayman) Ltd. | 7.000 | 10/31/22 | 1,222 | 1,240,267 | ||||||||||||
Shaw Data Centre LP | 4.500 | 03/30/22 | 673 | 679,289 | ||||||||||||
Sirius Computer Solutions, Inc. | 5.289 | 10/30/22 | 866 | 873,900 | ||||||||||||
Sirius Computer Solutions, Inc. | 10.539 | 10/30/23 | 250 | 252,917 | ||||||||||||
Solera Holdings, Inc. | 4.310 | 03/03/23 | 1,221 | 1,229,053 | ||||||||||||
Sophia LP | 4.750 | 09/30/22 | 613 | 614,531 | ||||||||||||
SourceHOV LLC | 7.750 | 10/31/19 | 345 | 340,225 | ||||||||||||
Synchronoss Technologies, Inc. | 3.810 | 01/19/24 | 1,725 | 1,726,294 | ||||||||||||
Syniverse Holdings, Inc. | 4.039 | 04/23/19 | 234 | 212,261 | ||||||||||||
Syniverse Holdings, Inc. | 4.041 | 04/23/19 | 237 | 214,405 | ||||||||||||
Veritas US, Inc. | 6.662 | 01/27/23 | 570 | 570,914 | ||||||||||||
Vestcom Parent Holdings, Inc.(b) | 5.250 | 12/19/23 | 2,000 | 2,000,000 | ||||||||||||
Western Digital Corp. | 4.748 | 04/29/23 | 1,950 | 1,960,866 | ||||||||||||
Xerox Business Services LLC | 6.498 | 12/07/23 | 1,000 | 1,015,938 | ||||||||||||
|
| |||||||||||||||
| 74,760,559 | ||||||||||||||||
Telecommunications 2.8% |
| |||||||||||||||
Cable Wireless Communications PLC | 5.698 | 12/30/22 | 1,250 | 1,264,584 | ||||||||||||
Global Tel*Link Corp. | 5.000 | 05/22/20 | 1,797 | 1,789,763 | ||||||||||||
Global Tel*Link Corp. | 9.000 | 11/23/20 | 300 | 291,469 | ||||||||||||
GTT Communications, Inc. | 5.000 | 01/09/24 | 1,850 | 1,877,173 | ||||||||||||
Level 3 Finance, Inc. | 3.292 | 02/28/24 | 1,550 | 1,557,750 | ||||||||||||
LTS Buyer LLC | 4.207 | 04/13/20 | 1,435 | 1,445,209 | ||||||||||||
Mitel Networks Corp. | 5.539 | 04/29/22 | 998 | 1,006,271 | ||||||||||||
Securus Technologies Holdings, Inc. | 5.250 | 04/30/20 | 1,315 | 1,313,837 | ||||||||||||
Securus Technologies Holdings, Inc. | 9.000 | 04/30/21 | 250 | 247,891 | ||||||||||||
Sprint Communications, Inc. | 3.313 | 02/02/24 | 3,225 | 3,227,419 | ||||||||||||
Windstream Services LLC | 4.997 | 03/29/21 | 175 | 176,308 | ||||||||||||
Windstream Services LLC | 4.998 | 03/29/21 | 525 | 530,250 | ||||||||||||
|
| |||||||||||||||
| 14,727,924 | ||||||||||||||||
Transportation 0.3% |
| |||||||||||||||
Worldwide Express Operations LLC(b) | 5.535 | 02/02/24 | 750 | 752,813 | ||||||||||||
XPO Logistics, Inc. | 4.285 | 11/01/21 | 868 | 875,073 | ||||||||||||
|
| |||||||||||||||
| 1,627,886 | ||||||||||||||||
TOTAL BANK LOANS | 488,071,200 | |||||||||||||||
|
| |||||||||||||||
See Notes to Financial Statements.
| 24 |
| Description | Interest Rate | Maturity Date | Principal Amount (000)# | Value (Note 1) | ||||||||||||
CORPORATE BONDS 3.9% |
| |||||||||||||||
Agriculture 0.1% |
| |||||||||||||||
Vector Group Ltd., Sr. Sec’d. Notes, 144A | 6.125 | % | 02/01/25 | 700 | $ | 721,000 | ||||||||||
Building Materials 0.3% |
| |||||||||||||||
James Hardie International Finance Ltd. (Ireland), Gtd. Notes, 144A | 5.875 | 02/15/23 | 200 | 207,500 | ||||||||||||
US Concrete, Inc., Gtd. Notes, 144A | 6.375 | 06/01/24 | 1,000 | 1,057,500 | ||||||||||||
|
| |||||||||||||||
| 1,265,000 | ||||||||||||||||
Coal 0.3% |
| |||||||||||||||
Consol Energy, Inc., Gtd. Notes(d) | 8.000 | 04/01/23 | 1,500 | 1,563,750 | ||||||||||||
Computers 0.1% | ||||||||||||||||
Diamond 1 Finance Corp./Diamond 2 Finance Corp., Sr. Sec’d. Notes, 144A | 4.420 | 06/15/21 | 530 | 555,782 | ||||||||||||
Cosmetics/Personal Care | ||||||||||||||||
First Quality Finance Co., Inc., Sr. Unsec’d. Notes, 144A(c) | 4.625 | 05/15/21 | 140 | 139,125 | ||||||||||||
Distribution/Wholesale 0.2% | ||||||||||||||||
Global Partners LP/GLP Finance Corp., Gtd. Notes | 6.250 | 07/15/22 | 1,125 | 1,102,500 | ||||||||||||
Diversified Financial Services 0.3% | ||||||||||||||||
KCG Holdings, Inc., Sr. Sec’d. Notes, 144A | 6.875 | 03/15/20 | 1,250 | 1,246,875 | ||||||||||||
Electric 0.2% | ||||||||||||||||
Dynegy, Inc., Gtd. Notes | 6.750 | 11/01/19 | 250 | 257,500 | ||||||||||||
NRG Energy, Inc., Gtd. Notes | 7.250 | 05/15/26 | 550 | 565,812 | ||||||||||||
|
| |||||||||||||||
| 823,312 | ||||||||||||||||
Entertainment 0.4% | ||||||||||||||||
Cinemark USA, Inc., Gtd. Notes | 5.125 | 12/15/22 | 250 | 257,500 | ||||||||||||
Scientific Games International, Inc., Sr. Sec’d. | 7.000 | 01/01/22 | 1,875 | 1,994,531 | ||||||||||||
|
| |||||||||||||||
| 2,252,031 | ||||||||||||||||
Food 0.1% | ||||||||||||||||
Ingles Markets, Inc., Sr. Unsec’d. Notes | 5.750 | �� | 06/15/23 | 350 | 361,375 | |||||||||||
Pilgrim’s Pride Corp., Gtd. Notes, 144A | 5.750 | 03/15/25 | 265 | 272,288 | ||||||||||||
|
| |||||||||||||||
| 633,663 | ||||||||||||||||
See Notes to Financial Statements.
| Prudential Floating Rate Income Fund | 25 |
Portfolio of Investments (continued)
as of February 28, 2017
| Description | Interest Rate | Maturity Date | Principal Amount (000)# | Value (Note 1) | ||||||||||||
CORPORATE BONDS (Continued) | ||||||||||||||||
Healthcare-Products 0.3% | ||||||||||||||||
Concordia International Corp. (Canada), Sr. Sec’d. Notes, 144A | 9.000 | % | 04/01/22 | 1,325 | $ | 1,166,000 | ||||||||||
Mallinckrodt International Finance SA, Gtd. Notes | 4.750 | 04/15/23 | 200 | 178,000 | ||||||||||||
|
| |||||||||||||||
| 1,344,000 | ||||||||||||||||
Healthcare-Services 0.5% | ||||||||||||||||
CHS/Community Health Systems, Inc., Gtd. Notes(d) | 8.000 | 11/15/19 | 500 | 488,750 | ||||||||||||
Select Medical Corp., Gtd. Notes | 6.375 | 06/01/21 | 500 | 503,125 | ||||||||||||
Tenet Healthcare Corp., | 5.500 | 03/01/19 | 650 | 656,500 | ||||||||||||
Sr. Unsec’d. Notes | 8.125 | 04/01/22 | 700 | 733,250 | ||||||||||||
Universal Health Services, Inc., Sr. Sec’d. | 4.750 | 08/01/22 | 250 | 257,500 | ||||||||||||
|
| |||||||||||||||
| 2,639,125 | ||||||||||||||||
Lodging & Gaming 0.4% | ||||||||||||||||
Boyd Gaming Corp., Gtd. Notes | 6.375 | 04/01/26 | 300 | 324,375 | ||||||||||||
FelCor Lodging LP, Sr. Sec’d. Notes | 5.625 | 03/01/23 | 350 | 366,583 | ||||||||||||
Jack Ohio Finance LLC/Jack Ohio Finance 1 Corp., Sr. Sec’d. Notes, 144A | 6.750 | 11/15/21 | 750 | 778,125 | ||||||||||||
MGM Resorts International, Gtd. Notes | 8.625 | 02/01/19 | 250 | 276,250 | ||||||||||||
Sugarhouse HSP Gaming Prop Mezz LP/Sugarhouse HSP Gaming Finance Corp., Sr. Sec’d. Notes, 144A(c) | 6.375 | 06/01/21 | 500 | 505,000 | ||||||||||||
|
| |||||||||||||||
| 2,250,333 | ||||||||||||||||
Media 0.1% | ||||||||||||||||
DISH DBS Corp., Gtd. Notes | 7.875 | 09/01/19 | 250 | 278,750 | ||||||||||||
Sinclair Television Group, Inc., Sr. Unsec’d. Notes, 144A | 5.875 | 03/15/26 | 250 | 256,563 | ||||||||||||
|
| |||||||||||||||
| 535,313 | ||||||||||||||||
Oil & Gas 0.1% | ||||||||||||||||
Alta Mesa Holdings LP/Alta Mesa Finance Sevices Corp., Gtd. Notes, 144A | 7.875 | 12/15/24 | 450 | 475,875 | ||||||||||||
Retail 0.1% | ||||||||||||||||
Hot Topic, Inc., Sr. Sec’d. Notes, 144A(c) | 9.250 | 06/15/21 | 100 | 101,500 | ||||||||||||
Rite Aid Corp., Gtd. Notes, 144A(d) | 6.125 | 04/01/23 | 500 | 529,825 | ||||||||||||
|
| |||||||||||||||
| 631,325 | ||||||||||||||||
See Notes to Financial Statements.
| 26 |
| Description | Interest Rate | Maturity Date | Principal Amount (000)# | Value (Note 1) | ||||||||||||
CORPORATE BONDS (Continued) | ||||||||||||||||
Software 0.1% | ||||||||||||||||
Infor US, Inc., Gtd. Notes(c) | 6.500 | % | 05/15/22 | 425 | $ | 442,000 | ||||||||||
Telecommunications 0.3% | ||||||||||||||||
Sprint Spectrum Co. LLC/Sprint Spectrum Co. II LLC/Sprint Spectrum Co. III LLC, Sr. Sec’d. Notes, 144A | 3.360 | 03/20/23 | 1,500 | 1,505,625 | ||||||||||||
|
| |||||||||||||||
TOTAL CORPORATE BONDS | 20,126,634 | |||||||||||||||
|
| |||||||||||||||
Shares | ||||||||||||||||
COMMON STOCK |
| |||||||||||||||
Other Industry |
| |||||||||||||||
RCS Capital Corp.(original cost $9,676; purchased 06/23/16)*(b)(c)(e) |
| 2,419 | 35,076 | |||||||||||||
|
| |||||||||||||||
TOTAL LONG-TERM INVESTMENTS | 515,973,685 | |||||||||||||||
|
| |||||||||||||||
SHORT-TERM INVESTMENTS 9.7% | ||||||||||||||||
AFFILIATED MUTUAL FUNDS | ||||||||||||||||
Prudential Investment Portfolios 2 - Prudential Core Ultra Short Bond Fund(h) | 48,314,227 | 48,314,227 | ||||||||||||||
Prudential Investment Portfolios 2 - Prudential Institutional Money Market Fund | 2,571,290 | 2,572,062 | ||||||||||||||
|
| |||||||||||||||
TOTAL SHORT-TERM INVESTMENTS | 50,886,289 | |||||||||||||||
|
| |||||||||||||||
TOTAL INVESTMENTS 108.4% | 566,859,974 | |||||||||||||||
Liabilities in excess of other assets(i) (8.4)% | (43,690,203 | ) | ||||||||||||||
|
| |||||||||||||||
NET ASSETS 100.0% | $ | 523,169,771 | ||||||||||||||
|
| |||||||||||||||
The following abbreviations are used in the annual report:
144A—Security was purchased pursuant to Rule 144A under the Securities Act of 1933 and may not be resold subject to that rule except to qualified institutional buyers. Unless otherwise noted, 144A securities are deemed to be liquid.
CLO—Collateralized Loan Obligation
L2—Level 2
L3—Level 3
LIBOR—London Interbank Offered Rate
OTC—Over-the-counter
See Notes to Financial Statements.
| Prudential Floating Rate Income Fund | 27 |
Portfolio of Investments (continued)
as of February 28, 2017
| # | Principal amount shown in U.S. dollars unless otherwise stated. |
| * | Non-income producing security. |
| (a) | Variable rate instrument. The interest rate shown reflects the rate in effect at February 28, 2017. |
| (b) | Indicates a Level 3 security. The aggregate value of Level 3 securities is $56,751,915 and 10.8% of net assets. |
| (c) | Indicates a security or securities that have been deemed illiquid; the aggregate value of $1,544,824 is approximately 0.3% of net assets. (unaudited) |
| (d) | All or a portion of security is on loan. The aggregate market value of such securities, including those sold and pending settlement, is $2,513,433; cash collateral of $2,570,348 (included in liabilities) was received with which the Fund purchased highly liquid short-term investments. |
| (e) | Indicates a restricted security; the aggregate original cost of the restricted securities is $9,676. The aggregate value of $35,076 is 0.0% of net assets. |
| (f) | Interest rate is not available as of February 28, 2017. |
| (g) | Represents security purchased with cash collateral received for securities on loan and includes dividend reinvestment. |
| (h) | PGIM Investments LLC, the manager of the Fund, also serves as manager of the Prudential Investment Portfolios 2 - Prudential Core Ultra Short Bond Fund and Prudential Institutional Money Market Fund. |
| (i) | Includes net unrealized appreciation (depreciation) on the following derivative contracts held at reporting period end: |
Interest rate swap agreements outstanding at February 28, 2017:
Notional | Termination Date | Fixed Rate | Floating Rate | Value at Trade Date | Value at February 28, 2017 | Unrealized Appreciation (Depreciation) | ||||||||||||||||||
Centrally cleared swap agreements: | ||||||||||||||||||||||||
| 3,000 | 02/03/19 | 1.538% | 3 Month LIBOR(1) | $ | 157 | $ | 1,487 | $ | 1,330 | |||||||||||||||
| 7,500 | 02/02/22 | 1.994% | 3 Month LIBOR(1) | 8,681 | (979 | ) | (9,660 | ) | ||||||||||||||||
| 2,500 | 02/03/24 | 2.228% | 3 Month LIBOR(1) | 164 | (11,257 | ) | (11,421 | ) | ||||||||||||||||
|
|
|
|
|
| |||||||||||||||||||
| $ | 9,002 | $ | (10,749 | ) | $ | (19,751 | ) | |||||||||||||||||
|
|
|
|
|
| |||||||||||||||||||
Cash of $426,000 has been segregated with Citigroup Global Markets to cover requirements for open centrally cleared interest rate swap contracts at February 28, 2017.
| (1) | The Fund pays the fixed rate and receives the floating rate. |
| (2) | The Fund pays the floating rate and receives the fixed rate. |
Fair Value Measurements:
Various inputs are used in determining the value of the Fund’s investments. These inputs are summarized in the three broad levels listed below.
Level 1—quoted prices generally in active markets for identical securities.
Level 2—quoted prices for similar securities, interest rates and yield curves, prepayment speeds, foreign currency exchange rates and other observable inputs.
Level 3—unobservable inputs for securities valued in accordance with Board approved fair valuation procedures.
See Notes to Financial Statements.
| 28 |
The following is a summary of the inputs used as of February 28, 2017 in valuing such portfolio securities:
| Level 1 | Level 2 | Level 3 | ||||||||||
Investments in Securities | ||||||||||||
Asset-Backed Securities | ||||||||||||
Collateralized Loan Obligations | $ | — | $ | 7,740,775 | $ | — | ||||||
Bank Loans | — | 431,354,361 | 56,716,839 | |||||||||
Corporate Bonds | — | 20,126,634 | — | |||||||||
Common Stock | ||||||||||||
Other Industry | — | — | 35,076 | |||||||||
Affiliated Mutual Funds | 50,886,289 | — | — | |||||||||
Other Financial Instruments* | ||||||||||||
Centrally Cleared Interest Rate Swap Agreements | — | (19,751 | ) | — | ||||||||
|
|
|
|
|
| |||||||
Total | $ | 50,886,289 | $ | 459,202,019 | $ | 56,751,915 | ||||||
|
|
|
|
|
| |||||||
The following is a reconciliation of assets in which unobservable inputs (Level 3) were used in determining fair value:
| Bank Loans | Common Stock | |||||||
Balance as of 2/29/16 | $ | 30,641,618 | $ | — | ||||
Realized gain (loss) | 21,914 | — | ||||||
Change in unrealized appreciation (depreciation)** | 12,439,532 | 25,400 | ||||||
Purchases/Exchanges/Issuances | 46,793,399 | 9,676 | ||||||
Sales/Paydowns | (26,410,820 | ) | — | |||||
Accrued discount/premium | 44,183 | — | ||||||
Transfers into Level 3 | 4,910,678 | — | ||||||
Transfers out of Level 3 | (11,723,665 | ) | — | |||||
|
|
|
| |||||
Balance as of 02/28/17 | $ | 56,716,839 | $ | 35,076 | ||||
|
|
|
| |||||
| * | Other financial instruments are derivative instruments not reflected in the Portfolio of Investments, such as futures, forwards and centrally cleared swap contracts, which are recorded at the unrealized appreciation (depreciation) on the instrument, and OTC swap contracts which are recorded at fair value. |
| ** | Of which, $1,453,001 was relating to securities held at the reporting period end. |
Level 3 securities as presented in the table above are being fair valued using pricing methodologies approved by the Board, which contain unobservable inputs as follows:
Level 3 | Fair Value as of February 28, 2017 | Valuation Methodology | Unobservable Inputs | Range (Weighted Average) | ||||||||||||
Common Stock | $ | 35,076 | Market Approach | Single Broker Indicative Quote | $14.50 | |||||||||||
Bank Loans | 56,716,839 | Market Approach | Single Broker Indicative Quote | $83.00 - $101.63 ($99.59) | ||||||||||||
|
| |||||||||||||||
Total | $ | 56,751,915 | ||||||||||||||
|
| |||||||||||||||
See Notes to Financial Statements.
| Prudential Floating Rate Income Fund | 29 |
Portfolio of Investments (continued)
as of February 28, 2017
It is the Fund’s policy to recognize transfers in and transfers out at the fair value as of the beginning of period. At the reporting period end, securities transferred levels as follows:
Investments in Securities | Amount Transferred | Level Transfer | Logic | |||||||
Bank Loans | $ | 11,723,665 | L3 to L2 | Single Broker Indicative Quote to Multiple Broker Quotes | ||||||
Bank Loans | $ | 4,910,678 | L2 to L3 | Multiple Broker Quotes to Single Broker Indicative Quote | ||||||
Industry Classification:
The industry classification of investments and liabilities in excess of other assets shown as a percentage of net assets as of February 28, 2017 were as follows (unaudited):
Technology | 14.3 | % | ||
Health Care & Pharmaceutical | 13.9 | |||
Affiliated Mutual Funds (including 0.5% of collateral for securities on loan) | 9.7 | |||
Capital Goods | 7.5 | |||
Retailers | 7.2 | |||
Consumer | 6.1 | |||
Packaging | 4.2 | |||
Other Industry | 3.8 | |||
Chemicals | 3.8 | |||
Building Materials & Construction | 3.7 | |||
Cable | 3.2 | |||
Automotive | 3.1 | |||
Telecommunications | 3.1 | |||
Foods | 2.9 | |||
Electric | 2.7 | |||
Media & Entertainment | 2.3 | |||
Energy—Other | 2.1 | |||
Gaming | 2.0 | |||
Collateralized Loan Obligations | 1.5 | |||
Energy—Refining | 1.3 | |||
Metals & Mining | 1.0 | |||
Supermarkets | 1.0 | |||
Brokerage | 1.0 | |||
Aerospace & Defense | 1.0 | |||
Insurance | 0.8 | |||
Restaurants | 0.6 | |||
Entertainment | 0.6 | |||
Real Estate | 0.6 | |||
Healthcare-Services | 0.5 | |||
Lodging & Gaming | 0.4 | |||
Transportation | 0.3 | |||
Coal | 0.3 | |||
Healthcare-Products | 0.3 | |||
Building Materials | 0.3 | |||
Diversified Financial Services | 0.3 | |||
Distribution/Wholesale | 0.2 | |||
Agriculture | 0.1 | |||
Food | 0.1 | |||
Retail | 0.1 | |||
Computers | 0.1 | |||
Media | 0.1 | |||
Oil & Gas | 0.1 | |||
Software | 0.1 | |||
Paper | 0.1 | |||
|
| |||
| 108.4 | ||||
Liabilities in excess of other assets | (8.4 | ) | ||
|
| |||
| 100.0 | % | |||
|
|
See Notes to Financial Statements.
| 30 |
Effects of Derivative Instruments on the Financial Statements and Primary Underlying Risk Exposure:
The Fund invested in derivative instruments during the reporting period. The primary type of risk associated with these derivative instruments is interest rate risk. The effect of such derivative instruments on the Fund’s financial position and financial performance as reflected in the Statement of Assets and Liabilities and Statement of Operations is presented in the summary below.
Fair values of derivative instruments as of February 28, 2017 as presented in the Statement of Assets and Liabilities:
Derivatives not accounted for | Asset Derivatives | Liability Derivatives | ||||||||||
Balance Sheet | Fair Value | Balance Sheet | Fair Value | |||||||||
| Interest rate contracts | Due from/to broker—variation margin swaps | $ | 1,330 | * | Due from/to broker—variation margin swaps | $ | 21,081 | * | ||||
|
|
|
| |||||||||
| * | Includes cumulative appreciation/depreciation as reported in schedule of open futures and centrally cleared swap contracts. Only unsettled variation margin receivable (payable) is reported within the Statement of Assets and Liabilities. |
The effects of derivative instruments on the Statement of Operations for the year ended February 28, 2017 are as follows:
Amount of Realized Gain (Loss) on Derivatives Recognized in Income | ||||
Derivatives not accounted for as hedging | Swaps | |||
Interest rate contracts | (8,537 | ) | ||
|
| |||
Change in Unrealized Appreciation (Depreciation) on Derivatives Recognized in Income | ||||
Derivatives not accounted for as hedging | Swaps | |||
Interest rate contracts | (19,751 | ) | ||
|
| |||
For the year ended February 28, 2017, the Fund’s average notional amount for interest rate swap agreements was $2,600,000.
Financial Instruments/Transactions—Summary of Offsetting and Netting Arrangements:
The Fund invested in financial transactions during the reporting period that are either offset in accordance with current requirements or are subject to enforceable master netting arrangements or similar agreements that permit offsetting. The information about offsetting
See Notes to Financial Statements.
| Prudential Floating Rate Income Fund | 31 |
Portfolio of Investments (continued)
as of February 28, 2017
and related netting arrangements for financial transactions, where the legal right to set-off exists, is presented in the summary below.
Offsetting of financial instruments/transactions assets and liabilities:
Description | Gross Amounts of Recognized Assets(1) | Collateral Received(2) | Net Amount | |||||||||
Securities on Loan | $ | 2,513,433 | $ | (2,513,433 | ) | $ | — | |||||
|
| |||||||||||
| (1) | Amount represents market value. |
| (2) | Collateral amount disclosed by the Fund is limited to the market value of financial instruments/transactions. |
See Notes to Financial Statements.
| 32 |
This Page Intentionally Left Blank
Statement of Assets & Liabilities
as of February 28, 2017
Assets | ||||
Investments at value, including securities on loan of $2,513,433: | ||||
Unaffiliated investments (cost $514,668,752) | $ | 515,973,685 | ||
Affiliated investments (cost $50,885,953) | 50,886,289 | |||
Cash | 1,117,643 | |||
Foreign currency, at value (cost $8,012) | 7,502 | |||
Deposit with broker for centrally cleared swaps | 426,000 | |||
Receivable for investments sold | 29,137,933 | |||
Interest receivable | 2,217,276 | |||
Receivable for Fund shares sold | 1,922,400 | |||
Due from broker—variation margin swaps | 1,863 | |||
Prepaid expenses | 1,516 | |||
|
| |||
Total Assets | 601,692,107 | |||
|
| |||
Liabilities | ||||
Payable for investments purchased | 74,325,497 | |||
Payable to broker for collateral for securities on loan | 2,570,348 | |||
Payable for Fund shares reacquired | 1,153,683 | |||
Management fee payable | 174,156 | |||
Accrued expenses | 142,865 | |||
Dividends payable | 95,170 | |||
Distribution fee payable | 55,077 | |||
Affiliated transfer agent fee payable | 5,540 | |||
|
| |||
Total Liabilities | 78,522,336 | |||
|
| |||
Net Assets | $ | 523,169,771 | ||
|
| |||
Net assets were comprised of: | ||||
Common stock, at par | $ | 525,367 | ||
Paid-in capital in excess of par | 521,111,745 | |||
|
| |||
| 521,637,112 | ||||
Undistributed net investment income | 323,577 | |||
Accumulated net realized loss on investment and foreign currency transactions | (75,926 | ) | ||
Net unrealized appreciation on investments and foreign currencies | 1,285,008 | |||
|
| |||
Net assets, February 28, 2017 | $ | 523,169,771 | ||
|
| |||
See Notes to Financial Statements.
| 34 |
Class A | ||||
Net asset value and redemption price per share | ||||
($69,733,347 ÷ 7,007,335 shares of common stock issued and outstanding) | $ | 9.95 | ||
Maximum sales charge (3.25% of offering price) | 0.33 | |||
|
| |||
Maximum offering price to public | $ | 10.28 | ||
|
| |||
Class C | ||||
Net asset value, offering price and redemption price per share | ||||
($54,091,999 ÷ 5,434,311 shares of common stock issued and outstanding) | $ | 9.95 | ||
|
| |||
Class Q | ||||
Net asset value, offering price and redemption price per share | ||||
($32,058,480 ÷ 3,219,374 shares of common stock issued and outstanding) | $ | 9.96 | ||
|
| |||
Class Z | ||||
Net asset value, offering price and redemption price per share | ||||
($367,285,945 ÷ 36,875,715 shares of common stock issued and outstanding) | $ | 9.96 | ||
|
| |||
See Notes to Financial Statements.
| Prudential Floating Rate Income Fund | 35 |
Statement of Operations
Year Ended February 28, 2017
Net Investment Income (Loss) | ||||
Income | ||||
Interest income (net of foreign withholding taxes of $4,550) | $ | 16,720,544 | ||
Affiliated dividend income | 242,697 | |||
Income from securities lending, net (including affiliated income of $796) | 4,302 | |||
|
| |||
Total income | 16,967,543 | |||
|
| |||
Expenses | ||||
Management fee | 2,214,000 | |||
Distribution fee—Class A | 146,872 | |||
Distribution fee—Class C | 399,077 | |||
Transfer agent’s fees and expenses (including affiliated expense of $22,600) | 251,000 | |||
Custodian and accounting fees | 203,000 | |||
Registration fees | 111,000 | |||
Audit fee | 64,000 | |||
Shareholders’ reports | 36,000 | |||
Legal fees and expenses | 23,000 | |||
Directors’ fees | 13,000 | |||
Insurance expenses | 3,000 | |||
Miscellaneous | 12,777 | |||
|
| |||
Total expenses | 3,476,726 | |||
Less: Management fee waiver and/or expense reimbursement | (477,232 | ) | ||
|
| |||
Net expenses | 2,999,494 | |||
|
| |||
Net investment income (loss) | 13,968,049 | |||
|
| |||
Realized And Unrealized Gain (Loss) On Investment And Foreign Currency Transactions | ||||
Net realized gain (loss) on: | ||||
Investment transactions (including affiliated of $24) | 971,471 | |||
Swap agreement transactions | (8,537 | ) | ||
Foreign currency transactions | 103 | |||
|
| |||
| 963,037 | ||||
|
| |||
Net change in unrealized appreciation (depreciation) on: | ||||
Investments (including affiliated of $336) | 14,833,755 | |||
Swap agreements | (19,751 | ) | ||
Foreign currencies | (510 | ) | ||
|
| |||
| 14,813,494 | ||||
|
| |||
Net gain (loss) on investment and foreign currency transactions | 15,776,531 | |||
|
| |||
Net Increase (Decrease) In Net Assets Resulting From Operations | $ | 29,744,580 | ||
|
| |||
See Notes to Financial Statements.
| 36 |
Statement of Changes in Net Assets
| Year Ended February 28/29 | ||||||||
| 2017 | 2016 | |||||||
Increase (Decrease) in Net Assets | ||||||||
Operations | ||||||||
Net investment income (loss) | $ | 13,968,049 | $ | 6,928,887 | ||||
Net realized gain (loss) on investment and foreign currency transactions | 963,037 | (860,286 | ) | |||||
Net change in unrealized appreciation (depreciation) on investments and foreign currencies | 14,813,494 | (12,350,897 | ) | |||||
|
|
|
| |||||
Net increase (decrease) in net assets resulting from operations | 29,744,580 | (6,282,296 | ) | |||||
|
|
|
| |||||
Dividends from net investment income (Note 1) | ||||||||
Class A | (2,387,961 | ) | (1,452,085 | ) | ||||
Class C | (1,325,883 | ) | (938,774 | ) | ||||
Class Q | (250,104 | ) | (314 | ) | ||||
Class Z | (9,805,011 | ) | (4,380,417 | ) | ||||
|
|
|
| |||||
| (13,768,959 | ) | (6,771,590 | ) | |||||
|
|
|
| |||||
Fund share transactions (Net of share conversions) (Note 6) | ||||||||
Net proceeds from shares sold | 409,278,596 | 229,688,066 | ||||||
Net asset value of shares issued in reinvestment of dividends and distributions | 12,679,633 | 6,053,111 | ||||||
Cost of shares reacquired | (133,057,932 | ) | (113,688,908 | ) | ||||
|
|
|
| |||||
Net increase (decrease) in net assets from Fund share transactions | 288,900,297 | 122,052,269 | ||||||
|
|
|
| |||||
Total increase (decrease) | 304,875,918 | 108,998,383 | ||||||
Net Assets: | ||||||||
Beginning of year | 218,293,853 | 109,295,470 | ||||||
|
|
|
| |||||
End of year(a) | $ | 523,169,771 | $ | 218,293,853 | ||||
|
|
|
| |||||
(a) Includes undistributed net investment income of: | $ | 323,577 | $ | 115,337 | ||||
|
|
|
| |||||
See Notes to Financial Statements.
| Prudential Floating Rate Income Fund | 37 |
Notes to Financial Statements
Prudential Investment Portfolios, Inc. 14 (the “Company”) is a diversified open-end management investment company, registered under the Investment Company Act of 1940, as amended (“1940 Act”). The Company consists of two investment portfolios: Prudential Floating Rate Income Fund (the “Fund”) and Prudential Government Income Fund. These financial statements relate to Prudential Floating Rate Income Fund. The Fund’s primary investment objective is to maximize current income. The secondary investment objective is to seek capital appreciation when consistent with the Fund’s primary investment objective.
Note 1. Accounting Policies
The Fund follows investment company accounting and reporting guidance of the Financial Accounting Standards Board (“FASB”) Accounting Standard Codification Topic 946 Financial Services—Investment Companies. The following accounting policies conform to U.S. generally accepted accounting principles. The Fund consistently follows such policies in the preparation of its financial statements.
Securities Valuation: The Fund holds securities and other assets that are fair valued at the close of each day (generally, 4:00 PM Eastern time) the New York Stock Exchange (“NYSE”) is open for trading. Fair value is the price that would be received to sell an asset or paid to transfer a liability in an orderly transaction between market participants on the measurement date. The Board of Directors (the “Board”) has adopted Valuation Procedures for security valuation under which fair valuation responsibilities have been delegated to PGIM Investments LLC (“PGIM Investments” or “the Manager”) (formerly known as Prudential Investments LLC). Under the current Valuation Procedures, the established Valuation Committee is responsible for supervising the valuation of portfolio securities and other assets. The Valuation Procedures permit the Fund to utilize independent pricing vendor services, quotations from market makers, and alternative valuation methods when market quotations are either not readily available or not deemed representative of fair value. A record of the Valuation Committee’s actions is subject to the Board’s review, approval, and ratification at its next regularly scheduled quarterly meeting.
Various inputs determine how the Fund’s investments are valued, all of which are categorized according to the three broad levels (Level 1, 2, or 3) detailed in the table following the Portfolio of Investments.
Common stocks and derivative instruments such as futures or options that are traded on a national securities exchange are valued at the last sale price as of the close of trading on the applicable exchange where the security principally trades. Securities traded via NASDAQ are valued at the NASDAQ official closing price. To the extent these securities are valued at the last sale price or NASDAQ official closing price, they are classified as Level 1 in the fair value hierarchy.
| 38 |
Investments in open-end, non-exchange-traded mutual funds are valued at their net asset values as of the close of the NYSE on the date of valuation. These securities are classified as Level 1 in the fair value hierarchy since they may be purchased or sold at their net asset values on the date of valuation.
Fixed income securities traded in the OTC market are generally classified as Level 2 in the fair value hierarchy. Such fixed income securities are typically valued using the market approach which generally involves obtaining data from an approved independent third-party vendor source. The portfolios utilize the market approach as the primary method to value securities when market prices of identical or comparable instruments are available. The third-party vendors’ valuation techniques used to derive the evaluated bid price is based on evaluating observable inputs, including but not limited to, yield curves, yield spreads, credit ratings, deal terms, tranche level attributes, default rates, cash flows, prepayment speeds, broker/dealer quotations and reported trades. Certain Level 3 securities are also valued using the market approach when obtaining a single broker quote or when utilizing recent transaction prices for identical or comparable securities.
Bank loans are generally valued using the market approach at prices provided by approved independent pricing vendors. The pricing vendors utilize broker/dealer quotations and provide prices based on the average of such quotations. Bank loans valued using such vendor prices are generally classified as Level 2 in the fair value hierarchy. Bank loans valued based on a single broker quote or at the original transaction price are classified as Level 3 in the fair value hierarchy.
OTC derivative instruments are generally valued using pricing vendor services, which derive the valuation based on inputs such as underlying asset prices, indices, spreads, interest rates, and exchange rates. These instruments are categorized as Level 2 in the fair value hierarchy.
Centrally cleared swaps listed or traded on a multilateral or trade facility platform, such as a registered exchange, are generally valued at the daily settlement price determined by the respective exchange. These securities are classified as Level 2 in the fair value hierarchy, as the daily settlement price is not public.
Securities and other assets that cannot be priced according to the methods described above are valued based on pricing methodologies approved by the Board. In the event that unobservable inputs are used when determining such valuations, the securities will be classified as Level 3 in the fair value hierarchy.
When determining the fair value of securities, some of the factors influencing the valuation include: the nature of any restrictions on disposition of the securities; assessment of the general liquidity of the securities; the issuer’s financial condition and the markets in which it does business; the cost of the investment; the size of the holding and the capitalization of the issuer; the prices of any recent transactions or bids/offers for such securities or any comparable securities; any available analyst media or other reports or information deemed reliable by the investment adviser regarding the issuer or the markets or industry in which it operates. Using
| Prudential Floating Rate Income Fund | 39 |
Notes to Financial Statements (continued)
fair value to price securities may result in a value that is different from a security’s most recent closing price and from the price used by other mutual funds to calculate their net asset values.
Restricted and Illiquid Securities: Subject to guidelines adopted by the Board, the Fund may invest up to 15% of its net assets in illiquid securities, including those which are restricted as to disposition under securities law (“restricted securities”). Restricted securities are valued pursuant to the valuation procedures noted above. Illiquid securities are those that, because of the absence of a readily available market or due to legal or contractual restrictions on resale, cannot be sold within seven days in the ordinary course of business at approximately the amount at which the Fund has valued the investment. Therefore, the Fund may find it difficult to sell illiquid securities at the time considered most advantageous by its Subadviser and may incur expenses that would not be incurred in the sale of securities that were freely marketable. Certain securities that would otherwise be considered illiquid because of legal restrictions on resale to the general public may be traded among qualified institutional buyers under Rule 144A of the Securities Act of 1933. These Rule 144A securities, as well as commercial paper that is sold in private placements under Section 4(2) of the Securities Act, may be deemed liquid by the Fund’s Subadviser under the guidelines adopted by the Directors of the Fund. However, the liquidity of the Fund’s investments in Rule 144A securities could be impaired if trading does not develop or declines.
Foreign Currency Translation: The books and records of the Fund are maintained in U.S. dollars. Foreign currency amounts are translated into U.S. dollars on the following basis:
(i) market value of investment securities, other assets and liabilities—at the current rates of exchange;
(ii) purchases and sales of investment securities, income and expenses—at the rates of exchange prevailing on the respective dates of such transactions.
Although the net assets of the Fund are presented at the foreign exchange rates and market values at the close of the period, the Fund does not generally isolate that portion of the results of operations arising as a result of changes in the foreign exchange rates from the fluctuations arising from changes in the market prices of long-term portfolio securities held at the end of the period. Similarly, the Fund does not isolate the effect of changes in foreign exchange rates from the fluctuations arising from changes in the market prices of long-term portfolio securities sold during the period. Accordingly, holding period realized foreign currency gains (losses) are included in the reported net realized gains (losses) on investment transactions. Notwithstanding the above, the Fund does isolate the effect of fluctuations in foreign currency exchange rates when determining the gain (loss) upon the sale or maturity of foreign currency denominated debt obligations; such amounts are included in net realized gains (losses) on foreign currency transactions.
| 40 |
Additionally, net realized gains (losses) on foreign currency transactions represent net foreign exchange gains (losses) from holdings of foreign currencies, forward currency contracts, disposition of foreign currencies, currency gains (losses) realized between the trade and settlement dates on securities transactions, and the difference between the amounts of interest, dividends and foreign withholding taxes recorded on the Fund’s books and the U.S. dollar equivalent amounts actually received or paid. Net unrealized currency gains (losses) from valuing foreign currency denominated assets and liabilities (other than investments) at period end exchange rates are reflected as a component of net unrealized appreciation (depreciation) on foreign currencies.
Swap Agreements: The Fund may enter into credit default, interest rate, total return and other forms of swap agreements. A swap agreement is an agreement to exchange the return generated by one instrument for the return generated by another instrument. Swap agreements are negotiated in the OTC market and may be executed either directly with counterparty (“OTC-traded”) or through a central clearing facility, such as a registered commodities exchange. Swap agreements are valued daily at current market value and any change in value is included in the net unrealized appreciation or depreciation on investments. Centrally cleared swaps pay or receive an amount, known as “variation margin”, based on daily changes in the valuation of a swap contract. Payments received or paid by the Fund are recorded as realized gains (losses) upon termination or maturity of the swap. Risk of loss may exceed amounts recognized on the Statement of Assets and Liabilities. Swap agreements outstanding at period end, if any, are listed on the Portfolio of Investments.
Concentration of Risk: The ability of debt securities issuers (other than those issued or guaranteed by the U.S. Government) held by the Fund to meet its obligations may be affected by the economic or political developments in a specific industry, region or country. Foreign security and currency transactions may involve certain considerations and risks not typically associated with those of domestic origin as a result of, among other factors, the possibility of political or economic instability or the level of governmental supervision and regulation of foreign securities markets.
Bank Loans: The Fund invests at least 80% of its investable assets in bank loans. Such bank loans are arranged through private negotiations between a corporation or other institution that is the borrower and one or more financial institutions that are the lenders. Most bank loans are senior in rank (“senior loans”) in the event of bankruptcy to most other securities of the issuer, such as common stock or publicly-issued bonds. Bank loans are often secured by specific collateral of the issuer so that holders of the loans will have a priority claim on those assets in the event of default or bankruptcy of the issuer. Bank loans are often structured and administered by a financial institution that acts as agent for the holders of the loan. Loans can be acquired directly through the agent, by assignment from another holder of the loan, or as a participation interest in another holder’s portion of the loan. Participations and assignments involve special types of risk, including credit risk and liquidity risk.
| Prudential Floating Rate Income Fund | 41 |
Notes to Financial Statements (continued)
Securities Transactions and Net Investment Income: Securities transactions are recorded on the trade date. Realized gains (losses) from investment transactions are calculated on the specific identification method. Interest income, including amortization of premium and accretion of discount on debt securities, as required, is recorded on the accrual basis. Expenses are recorded on the accrual basis, which may require the use of certain estimates by management, that may differ from actual.
Net investment income or loss (other than distribution fees which are charged directly to the respective class and transfer agency fees specific to Class Q shares which are charged to that share class) and unrealized and realized gains (losses) are allocated daily to each class of shares based upon the relative proportion of adjusted net assets of each class at the beginning of the day.
Payment-in-Kind Securities: The Fund may invest in the open market or receive pursuant to debt restructuring, securities that pay-in-kind (PIK) the interest due on such debt instruments. The PIK interest, computed at the contractual rate specified, is added to the existing principal balance of the debt when issued bonds have same terms as the bond or recorded as a separate bond when terms are different from the existing debt, and is recorded as interest income.
Securities Lending: The Fund may lend its portfolio securities to banks and broker-dealers. The loans are secured by collateral at least equal to the market value of the securities loaned. Collateral pledged by each borrower is invested in an affiliated money market fund and is marked to market daily, based on the previous day’s market value, such that the value of the collateral exceeds the value of the loaned securities. Loans are subject to termination at the option of the borrower or the Fund. Pursuant to the repositioning of the money market fund as an ultra-short bond fund, for the period March 31, 2016 through July 18, 2016 the collateral was invested in an ultra-short bond fund. Upon termination of the loan, the borrower will return to the Fund securities identical to the loaned securities. Should the borrower of the securities fail financially, the Fund has the right to repurchase the securities in the open market using the collateral. The Fund recognizes income, net of any rebate and securities lending agent fees, for lending its securities in the form of fees or interest on the investment of any cash received as collateral. The borrower receives all interest and dividends from the securities loaned and such payments are passed back to the lender in amounts equivalent thereto. The Fund also continues to recognize any unrealized gain (loss) in the market price of the securities loaned and on the change in the value of the collateral invested that may occur during the term of the loan. In addition, realized gain (loss) is recognized on changes in the value of the collateral invested upon liquidation of the collateral.
Dividends and Distributions: The Fund expects to pay dividends from net investment income monthly and distributions from net realized capital gains, if any, annually.
| 42 |
Dividends and distributions to shareholders, which are determined in accordance with federal income tax regulations and which may differ from generally accepted accounting principles, are recorded on the ex-date. Permanent book/tax differences relating to income and gain (loss) are reclassified amongst undistributed net investment income, accumulated net realized gain (loss) and paid-in capital in excess of par, as appropriate.
Taxes: It is the Fund’s policy to continue to meet the requirements of the Internal Revenue Code applicable to regulated investment companies and to distribute all of its taxable net investment income and capital gains, if any, to its shareholders. Therefore, no federal income tax provision is required. Withholding taxes on foreign dividends and interest and foreign capital gains tax are recorded net of reclaimable amount at the time the related income is earned.
Estimates: The preparation of the financial statements requires management to make estimates and assumptions that affect the reported amounts and disclosures in the financial statements. Actual results could differ from those estimates.
Note 2. Agreements
The Company, on behalf of the Fund, has a management agreement with PGIM Investments. Pursuant to this agreement, PGIM Investments has responsibility for all investment advisory services and supervises the subadviser’s performance of such services. PGIM Investments has entered into a subadvisory agreement with PGIM, Inc., which provides subadvisory services to the Funds through its PGIM Fixed Income unit. The subadvisory agreement provides that PGIM, Inc. will furnish investment advisory services in connection with the management of the Fund. In connection therewith, PGIM, Inc. is obligated to keep certain books and records of the Fund. PGIM Investments pays for the services of PGIM, Inc. the cost of compensation of officers of the Fund, occupancy and certain clerical and bookkeeping costs of the Fund. The Fund bears all other costs and expenses.
Effective October 1, 2016, the management fee paid to PGIM Investments is accrued daily and payable monthly, at an annual rate of .65% of the Fund’s average daily net assets up to $5 billion and .625% of the Fund’s average daily net assets in excess of $5 billion. Prior to October 1, 2016, the management fee paid to PGIM Investments was accrued daily and payable monthly, at an annual rate of .70% of the Fund’s average daily net assets up to $5 billion and .675% of the Fund’s average daily net assets in excess of $5 billion. The effective management fee rate before any waivers and/or expense reimbursement was .67% for the year ended February 28, 2017. The effective management fee rate, net of waivers and/or expense reimbursement, was .53%.
Effective October 1, 2016, PGIM Investments has contractually agreed through June 30, 2018 to limit the net annual operating expenses (exclusive of distribution and service (12b-1) fees, taxes (such as income and foreign withholdings taxes, stamp duty and deferred tax expenses), interest, underlying funds, brokerage, extraordinary and certain other expenses such as
| Prudential Floating Rate Income Fund | 43 |
Notes to Financial Statements (continued)
dividend, broker charges and interest expense on short sales) of each class of shares of the Fund to .70% of the Fund’s average daily net assets. In addition, PGIM Investments has contractually agreed through June 30, 2018 to limit net annual operating expenses (exclusive of distribution and service (12b-1) fees, transfer agency expenses (including sub-transfer agency and networking fees), taxes (such as income and foreign withholdings taxes, stamp duty and deferred tax expenses), interest, underlying funds, brokerage, extraordinary and certain other expenses such as dividend, broker charges and interest expense on short sales) of each class of shares of the Fund to .65% of the Fund’s average daily net assets. Prior to October 1, 2016, PGIM Investments had contractually agreed to limit the net annual operating expenses (exclusive of distribution and service (12b-1) fees, taxes (such as income and foreign withholdings taxes, stamp duty and deferred tax expenses), interest, underlying funds, brokerage, extraordinary and certain other expenses such as dividend, broker charges and interest expense on short sales) of each class of shares of the Fund to .80% of the Fund’s average daily net assets. Expenses waived/reimbursed by the Manager in accordance with this agreement may be recouped by the Manager within the same fiscal year during which such waiver/reimbursement is made if such recoupment can be realized without exceeding the expense limit in effect at the time of the recoupment for that fiscal year.
The Company, on behalf of the Fund, has a distribution agreement with Prudential Investment Management Services LLC (“PIMS”), which acts as the distributor of the Class A, Class C, Class Q and Class Z shares of the Fund. The Fund compensates PIMS for distributing and servicing the Fund’s Class A and Class C shares pursuant to plans of distribution (the “Class A and C Plans”), regardless of expenses actually incurred by PIMS. The distribution fees are accrued daily and payable monthly. No distribution or service fees are paid to PIMS as distributor of the Class Q and Class Z shares of the Fund.
Pursuant to the Class A and C Plans, the Fund compensates PIMS for distribution related activities at an annual rate of up to .25% and 1% of the average daily net assets of the Class A and C shares, respectively.
PIMS has advised the Fund that it has received $180,358 in front-end sales charges resulting from sales of Class A shares during the year ended February 28, 2017. From these fees, PIMS paid such sales charges to affiliated broker-dealers, which in turn paid commissions to salespersons and incurred other distribution costs.
PIMS has advised the Fund that for the year ended February 28, 2017 it received $8 and $7,670 in contingent deferred sales charges imposed upon redemptions by certain Class A and Class C shareholders, respectively.
PGIM Investments, PGIM, Inc. and PIMS are indirect, wholly-owned subsidiaries of Prudential Financial, Inc. (“Prudential”).
| 44 |
Note 3. Other Transactions with Affiliates
Prudential Mutual Fund Services LLC (“PMFS”), an affiliate of PGIM Investments and an indirect, wholly-owned subsidiary of Prudential, serves as the Fund’s transfer agent. Transfer agent’s fees and expenses on the Statement of Operations include certain out-of-pocket expenses paid to non-affiliates, where applicable.
Prior to July 7, 2016, PGIM, Inc. was the Fund’s securities lending agent. Net earnings from securities lending, if any, are disclosed on the Statement of Operations as “Income from securities lending, net.”
Effective July 7, 2016, the Board replaced PGIM, Inc. as securities lending agent with a third party agent (eSecLending).
The Fund may enter into certain securities purchase or sale transactions under Board approved Rule 17a-7 procedures. Rule 17a-7 is an exemptive rule under the 1940 Act, that permits purchase and sale transactions among affiliated investment companies, or between an investment company and a person that is affiliated solely by reason of having a common (or affiliated) investment adviser, common directors and/or common officers. Such transactions are subject to ratification by the Board.
The Fund may invest its overnight sweep cash in the Prudential Core Ultra Short Bond Fund (the “Core Fund”), and its securities lending cash collateral in the Prudential Institutional Money Market Fund, (the “Money Market Fund”), each a series of Prudential Investments Portfolios 2, registered under the 1940 Act and managed by PGIM Investments. For the period ended February 28, 2017, PGIM, Inc. was compensated $463 for managing the Fund’s securities lending cash collateral through its subadvisory services to the Money Market Fund. Earnings from the Core Fund and Money Market Fund are disclosed on the Statement of Operations as “Affiliated dividend income” and “Income from securities lending, net”, respectively.
Note 4. Portfolio Securities
The cost of purchases and proceeds from sales of portfolio securities, (excluding short-term investments and U.S. Treasury securities), for the year ended February 28, 2017, were $506,708,900 and $218,339,109, respectively.
Note 5. Distributions and Tax Information
Distributions to shareholders, which are determined in accordance with federal income tax regulations and which may differ from generally accepted accounting principles, are recorded on the ex-date. In order to present undistributed net investment income, accumulated net realized loss on investment and foreign currency transactions and paid-in capital in excess of par on the Statement of Assets and Liabilities that more closely represent their tax character, certain adjustments have been made to undistributed net investment income and accumulated net realized loss on investment and foreign currency transactions. For the year ended February 28, 2017, the adjustments were to increase undistributed net investment income and increase accumulated net realized loss on investment and foreign
| Prudential Floating Rate Income Fund | 45 |
Notes to Financial Statements (continued)
currency transactions by $9,150 due to differences in the treatment for book and tax purposes of certain transactions involving foreign currency transactions, paydowns, swaps and premium amortization. Net investment income, net realized gain (loss) on investment and foreign currency transactions and net assets were not affected by this change.
For the years ended February 28, 2017 and February 29, 2016, the tax character of distributions paid by the Fund were $13,768,959 and $6,771,590 of ordinary income, respectively.
As of February 28, 2017 the accumulated undistributed earnings on a tax basis was $421,995 of ordinary income. This differs from the amount shown on the Statement of Assets and Liabilities primarily due to cumulative timing differences.
The United States federal income tax basis of the Fund’s investments and the total net unrealized appreciation as of February 28, 2017 were as follows:
Tax Basis | Appreciation | Depreciation | Net Unrealized | Other Cost Basis | Total Net | |||||
| $565,507,457 | $5,319,167 | $(3,966,650) | $1,352,517 | $(20,261) | $1,332,256 |
The difference between book basis and tax basis was primarily attributable to deferred losses on wash sales and the difference in the treatment of premium amortization for book and tax purposes. The other cost basis adjustment was primarily attributable to appreciation (depreciation) of swaps and foreign currencies.
For federal income tax purposes, the Fund had a capital loss carryforward as of February 28, 2017 of approximately $123,000 which can be carried forward for an unlimited period. The Fund utilized approximately $984,000 of its capital loss carryforward to offset net taxable gains realized in the fiscal year ended February 28, 2017. No capital gains distributions are expected to be paid to shareholders until net gains have been realized in excess of such losses.
Management has analyzed the Fund’s tax positions taken on federal, state and local income tax returns for all open tax years and has concluded that no provision for income tax is required in the Fund’s financial statements for the current reporting period. The Fund’s federal, state and local income and federal excise tax returns for tax years for which the applicable statutes of limitations have not expired are subject to examination by the Internal Revenue Service and state departments of revenue.
| 46 |
Note 6. Capital
The Fund offers Class A, Class C, Class Q and Class Z shares. Class A shares are sold with front-end sales charge of up to 3.25%. Investors who purchase $1 million or more of Class A shares and sell these shares within 12 months of purchase are subject to a 1% contingent deferred sales charge (“CDSC”), but are not subject to an initial sales charge. The Class A CDSC is waived for purchases by certain retirement or benefit plans. Class C shares redeemed within 12 months of purchase are subject to a 1% CDSC. A special exchange privilege is also available for shareholders who qualified to purchase Class A shares at net asset value. Class Q and Class Z shares are not subject to any sales or redemption charge and are available only to a limited group of investors.
Under certain circumstances, an exchange may be made from specified share classes of the Fund to one or more other share classes of the Fund as presented in the table of transactions in shares of common stock.
There are 900 million shares of common stock authorized, $.01 par value per share, divided into five classes, designated Class A, Class C, Class Q, Class Z and Class T shares, each of which consists of 150 million, 200 million, 250 million, 250 million, and 50 million shares, respectively. The Fund currently does not have any Class T shares outstanding.
As of February 28, 2017, Prudential through its affiliates owned 1,075 Class Q shares of the Fund. In addition, six shareholders of record held 67% of Fund outstanding shares.
Transactions in shares of common stock were as follows:
Class A | Shares | Amount | ||||||
Year ended February 28, 2017: | ||||||||
Shares sold | 6,349,528 | $ | 62,677,787 | |||||
Shares issued in reinvestment of dividends and distributions | 216,371 | 2,128,544 | ||||||
Shares reacquired | (2,629,073 | ) | (25,878,117 | ) | ||||
|
|
|
| |||||
Net increase (decrease) in shares outstanding before conversion | 3,936,826 | 38,928,214 | ||||||
Shares issued upon conversion from other share class(es) | 108,158 | 1,062,836 | ||||||
Shares reacquired upon conversion into other share class(es) | (2,119,727 | ) | (21,034,150 | ) | ||||
|
|
|
| |||||
Net increase (decrease) in shares outstanding | 1,925,257 | $ | 18,956,900 | |||||
|
|
|
| |||||
Year ended February 29, 2016: | ||||||||
Shares sold | 5,686,359 | $ | 55,961,040 | |||||
Shares issued in reinvestment of dividends and distributions | 134,095 | 1,303,492 | ||||||
Shares reacquired | (3,066,875 | ) | (29,780,864 | ) | ||||
|
|
|
| |||||
Net increase (decrease) in shares outstanding before conversion | 2,753,579 | 27,483,668 | ||||||
Shares issued upon conversion from other share class(es) | 17,262 | 166,958 | ||||||
Shares reacquired upon conversion into other share class(es) | (17,873 | ) | (177,196 | ) | ||||
|
|
|
| |||||
Net increase (decrease) in shares outstanding | 2,752,968 | $ | 27,473,430 | |||||
|
|
|
| |||||
| Prudential Floating Rate Income Fund | 47 |
Notes to Financial Statements (continued)
Class C | Shares | Amount | ||||||
Year ended February 28, 2017: | ||||||||
Shares sold | 2,785,996 | $ | 27,473,152 | |||||
Shares issued in reinvestment of dividends and distributions | 131,452 | 1,292,612 | ||||||
Shares reacquired | (1,083,314 | ) | (10,605,347 | ) | ||||
|
|
|
| |||||
Net increase (decrease) in shares outstanding before conversion | 1,834,134 | 18,160,417 | ||||||
Shares reacquired upon conversion into other share class(es) | (132,766 | ) | (1,303,413 | ) | ||||
|
|
|
| |||||
Net increase (decrease) in shares outstanding | 1,701,368 | $ | 16,857,004 | |||||
|
|
|
| |||||
Year ended February 29, 2016: | ||||||||
Shares sold | 1,972,699 | $ | 19,388,349 | |||||
Shares issued in reinvestment of dividends and distributions | 93,373 | 910,135 | ||||||
Shares reacquired | (1,072,672 | ) | (10,451,403 | ) | ||||
|
|
|
| |||||
Net increase (decrease) in shares outstanding before conversion | 993,400 | 9,847,081 | ||||||
Shares reacquired upon conversion into other share class(es) | (116,912 | ) | (1,151,102 | ) | ||||
|
|
|
| |||||
Net increase (decrease) in shares outstanding | 876,488 | $ | 8,695,979 | |||||
|
|
|
| |||||
Class Q | ||||||||
Year ended February 28, 2017: | ||||||||
Shares sold | 1,617,848 | $ | 16,096,875 | |||||
Shares issued in reinvestment of dividends and distributions | 25,148 | 250,111 | ||||||
Shares reacquired | (17,469 | ) | (173,636 | ) | ||||
|
|
|
| |||||
Net increase (decrease) in shares outstanding before conversion | 1,625,527 | 16,173,350 | ||||||
Shares issued upon conversion from other share class(es) | 1,592,818 | 15,781,164 | ||||||
|
|
|
| |||||
Net increase (decrease) in shares outstanding | 3,218,345 | $ | 31,954,514 | |||||
|
|
|
| |||||
Period ended February 29, 2016*: | ||||||||
Shares sold | 997 | $ | 10,000 | |||||
Shares issued in reinvestment of dividends and distributions | 32 | 314 | ||||||
|
|
|
| |||||
Net increase (decrease) in shares outstanding | 1,029 | $ | 10,314 | |||||
|
|
|
| |||||
| 48 |
Class Z | Shares | Amount | ||||||
Year ended February 28, 2017: | ||||||||
Shares sold | 30,765,672 | $ | 303,030,782 | |||||
Shares issued in reinvestment of dividends and distributions | 913,668 | 9,008,366 | ||||||
Shares reacquired | (9,789,413 | ) | (96,400,832 | ) | ||||
|
|
|
| |||||
Net increase (decrease) in shares outstanding before conversion | 21,889,927 | 215,638,316 | ||||||
Shares issued upon conversion from other share class(es) | 2,229,646 | 22,118,961 | ||||||
Shares reacquired upon conversion into other share class(es) | (1,674,498 | ) | (16,625,398 | ) | ||||
|
|
|
| |||||
Net increase (decrease) in shares outstanding | 22,445,075 | $ | 221,131,879 | |||||
|
|
|
| |||||
Year ended February 29, 2016: | ||||||||
Shares sold | 15,673,739 | $ | 154,328,677 | |||||
Shares issued in reinvestment of dividends and distributions | 394,469 | 3,839,170 | ||||||
Shares reacquired | (7,554,346 | ) | (73,456,641 | ) | ||||
|
|
|
| |||||
Net increase (decrease) in shares outstanding before conversion | 8,513,862 | 84,711,206 | ||||||
Shares issued upon conversion from other shares class(es) | 134,635 | 1,328,299 | ||||||
Shares reacquired upon conversion into other share class(es) | (17,243 | ) | (166,959 | ) | ||||
|
|
|
| |||||
Net increase (decrease) in shares outstanding | 8,631,254 | $ | 85,872,546 | |||||
|
|
|
| |||||
| * | Commencement of offering was April 27, 2015. |
Note 7. Borrowings
The Fund, along with other affiliated registered investment companies (the “Funds”), is a party to a Syndicated Credit Agreement (“SCA”) with a group of banks. The purpose of the SCA is to provide an alternative source of temporary funding for capital share redemptions. The SCA provides for a commitment of $900 million for the period October 6, 2016 through October 5, 2017. The Funds pay an annualized commitment fee of .15% of the unused portion of the SCA. Prior to October 6, 2016, the Funds had a prior SCA that provided a commitment of $900 million in which the Funds paid an annualized commitment fee of .11% of the unused portion of the prior SCA. For the SCA and the prior SCA, the Fund’s portion of the commitment fee for the unused amount, allocated based upon a method approved by the Board, is accrued daily and paid quarterly. The interest on borrowings under each SCA is paid monthly and at a per annum interest rate based upon a contractual spread plus the higher of (1) the effective federal funds rate, (2) the 1-month LIBOR rate or (3) zero percent.
The Fund did not utilize the SCA during the year ended February 28, 2017.
Note 8. Recent Accounting Pronouncements and Reporting Updates
In December 2016, the FASB released an Accounting Standards Update (“ASU”) that makes technical changes to various sections of the Accounting Standards Codification (“ASC”), including Topic 820, Fair Value Measurement. The changes to Topic 820 are intended to clarify the difference between a valuation approach and a valuation technique. The changes to ASC 820-10-50-2 require a reporting entity to disclose, for Level 2 and Level 3 fair value measurements, a change in either or both a valuation approach and a
| Prudential Floating Rate Income Fund | 49 |
Notes to Financial Statements (continued)
valuation technique and the reason(s) for the change. The changes to Topic 820 are effective for fiscal years, and interim periods within those fiscal years, beginning after December 15, 2016. At this time, management is evaluating the implications of the ASU and its impact on the financial statements and disclosures has not yet been determined.
On October 13, 2016, the Securities and Exchange Commission (the “SEC”) adopted new rules and forms and amended existing rules and forms which are intended to modernize and enhance the reporting and disclosure of information by registered investment companies and to improve the quality of information that funds provide to investors, including modifications to Regulation S-X which would require standardized, enhanced disclosure about derivatives in investment company financial statements. The new rules also enhance disclosure regarding fund liquidity and redemption practices. Also under the new rules, the SEC will permit open-end funds, with the exception of money market funds, to offer swing pricing, subject to board approval and review. The compliance dates of the modifications to Regulation S-X are August 1, 2017 and other amendments and rules are generally June 1, 2018 and December 1, 2018. Management is currently evaluating the impacts to the financial statement disclosures, if any.
| 50 |
Financial Highlights
| Class A Shares | ||||||||||||||||||||
Year Ended February 28/29, | ||||||||||||||||||||
| 2017(d) | 2016(d) | 2015 | 2014 | 2013 | ||||||||||||||||
| Per Share Operating Performance: | ||||||||||||||||||||
| Net Asset Value, Beginning Of Year | $9.38 | $9.94 | $10.18 | $10.12 | $9.89 | |||||||||||||||
| Income (loss) from investment operations: | ||||||||||||||||||||
| Net investment income (loss) | .41 | .36 | .40 | .37 | .43 | |||||||||||||||
| Net realized and unrealized gain (loss) on investment transactions | .56 | (.57 | ) | (.22 | ) | .08 | .26 | |||||||||||||
| Total from investment operations | .97 | (.21 | ) | .18 | .45 | .69 | ||||||||||||||
| Less Dividends and Distributions: | ||||||||||||||||||||
| Dividends from net investment income | (.40 | ) | (.35 | ) | (.39 | ) | (.36 | ) | (.42 | ) | ||||||||||
| Distributions from net realized gains | - | - | (.03 | ) | (.03 | ) | (.04 | ) | ||||||||||||
| Total dividends and distributions | (.40 | ) | (.35 | ) | (.42 | ) | (.39 | ) | (.46 | ) | ||||||||||
| Net asset value, end of year | $9.95 | $9.38 | $9.94 | $10.18 | $10.12 | |||||||||||||||
| Total Return(a): | 10.46% | (2.24)% | 1.80% | 4.53% | 7.11% | |||||||||||||||
| Ratios/Supplemental Data: | ||||||||||||||||||||
| Net assets, end of year (000) | $69,733 | $47,683 | $23,158 | $34,211 | $22,059 | |||||||||||||||
| Average net assets (000) | $58,748 | $40,785 | $28,113 | $31,911 | $12,454 | |||||||||||||||
| Ratios to average net assets(b)(c): | ||||||||||||||||||||
| Expenses after waivers and/or expense reimbursement | 1.00% | 1.05% | 1.10% | 1.20% | 1.20% | |||||||||||||||
| Expenses before waivers and/or expense reimbursement | 1.14% | 1.34% | 1.60% | 1.60% | 1.92% | |||||||||||||||
| Net investment income (loss) | 4.16% | 3.65% | 3.89% | 3.65% | 4.35% | |||||||||||||||
| Portfolio turnover rate | 67% | 55% | 64% | 82% | 106% | |||||||||||||||
| (a) | Total return does not consider the effects of sales loads. Total return is calculated assuming a purchase of a share on the first day and a sale on the last day of each year reported and includes reinvestment of dividends and distributions, if any. Total returns may reflect adjustments to conform to generally accepted accounting principles. |
| (b) | Does not include expenses of the underlying portfolio in which the Fund invests. |
| (c) | The distributor of the Fund had contractually agreed to limit its distribution and service (12b-1) fees to .25% of the average daily net assets through March 8, 2015. Effective March 9, 2015, the contractual distribution and service (12b-1) fees were reduced from .30% to .25% of the average daily net assets. |
| (d) | Calculated based on average shares outstanding during the year. |
See Notes to Financial Statements.
| Prudential Floating Rate Income Fund | 51 |
Financial Highlights (continued)
| Class C Shares | ||||||||||||||||||||
Year Ended February 28/29, | ||||||||||||||||||||
| 2017(c) | 2016(c) | 2015 | 2014 | 2013 | ||||||||||||||||
| Per Share Operating Performance: | ||||||||||||||||||||
| Net Asset Value, Beginning Of Year | $9.38 | $9.95 | $10.19 | $10.13 | $9.90 | |||||||||||||||
| Income (loss) from investment operations: | ||||||||||||||||||||
| Net investment income (loss) | .33 | .28 | .32 | .29 | .36 | |||||||||||||||
| Net realized and unrealized gain (loss) on investment transactions | .57 | (.58 | ) | (.22 | ) | .08 | .26 | |||||||||||||
| Total from investment operations | .90 | (.30 | ) | .10 | .37 | .62 | ||||||||||||||
| Less Dividends and Distributions: | ||||||||||||||||||||
| Dividends from net investment income | (.33 | ) | (.27 | ) | (.31 | ) | (.28 | ) | (.35 | ) | ||||||||||
| Distributions from net realized gains | - | - | (.03 | ) | (.03 | ) | (.04 | ) | ||||||||||||
| Total dividends and distributions | (.33 | ) | (.27 | ) | (.34 | ) | (.31 | ) | (.39 | ) | ||||||||||
| Net asset value, end of year | $9.95 | $9.38 | $9.95 | $10.19 | $10.13 | |||||||||||||||
| Total Return(a): | 9.64% | (3.07)% | 1.04% | 3.74% | 6.29% | |||||||||||||||
| Ratios/Supplemental Data: | ||||||||||||||||||||
| Net assets, end of year (000) | $54,092 | $35,027 | $28,408 | $32,149 | $7,403 | |||||||||||||||
| Average net assets (000) | $39,905 | $33,571 | $31,363 | $21,337 | $2,997 | |||||||||||||||
| Ratios to average net assets(b): | ||||||||||||||||||||
| Expenses after waivers and/or expense reimbursement | 1.75% | 1.80% | 1.85% | 1.95% | 1.95% | |||||||||||||||
| Expenses before waivers and/or expense reimbursement | 1.89% | 2.11% | 2.30% | 2.35% | 2.62% | |||||||||||||||
| Net investment income (loss) | 3.41% | 2.88% | 3.15% | 2.91% | 3.57% | |||||||||||||||
| Portfolio turnover rate | 67% | 55% | 64% | 82% | 106% | |||||||||||||||
| (a) | Total return does not consider the effects of sales loads. Total return is calculated assuming a purchase of a share on the first day and a sale on the last day of each year reported and includes reinvestment of dividends and distributions, if any. Total returns may reflect adjustments to conform to generally accepted accounting principles. |
| (b) | Does not include expenses of the underlying portfolio in which the Fund invests. |
| (c) | Calculated based on average shares outstanding during the year. |
See Notes to Financial Statements.
| 52 |
| Class Q Shares | ||||||||||||
| Year Ended February 28, 2017 | April 27, 2015(a) through February 29, 2016 | |||||||||||
| Per Share Operating Performance(d): | ||||||||||||
| Net Asset Value, Beginning of Period | $9.39 | $10.03 | ||||||||||
| Income (loss) from investment operations: | ||||||||||||
| Net investment income (loss) | .45 | .32 | ||||||||||
| Net realized and unrealized gain (loss) on investment and foreign currency transactions | .55 | (.65 | ) | |||||||||
| Total from investment operations | 1.00 | (.33 | ) | |||||||||
| Less Dividends: | ||||||||||||
| Dividends from net investment income | (.43 | ) | (.31 | ) | ||||||||
| Net asset value, end of period | $9.96 | $9.39 | ||||||||||
| Total Return(b): | 10.79% | (3.35)% | ||||||||||
| Ratios/Supplemental Data: | ||||||||||||
| Net assets, end of period (000) | $32,058 | $10 | ||||||||||
| Average net assets (000) | $5,484 | $10 | ||||||||||
| Ratios to average net assets(c): | ||||||||||||
| Expenses after waivers and/or expense reimbursement | .67% | .80% | (e) | |||||||||
| Expenses before waivers and/or expense reimbursement | .82% | .99% | (e) | |||||||||
| Net investment income (loss) | 4.60% | 3.87% | (e) | |||||||||
| Portfolio turnover rate | 67% | 55% | (f) | |||||||||
| (a) | Commencement of operations. |
| (b) | Total return is calculated assuming a purchase of a share on the first day and a sale on the last day of each period reported and includes reinvestment of dividends and distributions, if any. Total returns may reflect adjustments to conform to generally accepted accounting principles. Total returns for periods of less than one full year are not annualized. |
| (c) | Does not include expenses of the underlying portfolio in which the Series invests. |
| (d) | Calculated based on average shares outstanding during the period. |
| (e) | Annualized. |
| (f) | Not annualized. |
See Notes to Financial Statements.
| Prudential Floating Rate Income Fund | 53 |
Financial Highlights (continued)
| Class Z Shares | ||||||||||||||||||||
Year Ended February 28/29, | ||||||||||||||||||||
| 2017(c) | 2016(c) | 2015 | 2014 | 2013 | ||||||||||||||||
| Per Share Operating Performance: | ||||||||||||||||||||
| Net Asset Value, Beginning Of Year | $9.39 | $9.95 | $10.19 | $10.14 | $9.91 | |||||||||||||||
| Income (loss) from investment operations: | ||||||||||||||||||||
| Net investment income (loss) | .43 | .38 | .42 | .40 | .46 | |||||||||||||||
| Net realized and unrealized gain (loss) on investment transactions | .57 | (.57 | ) | (.22 | ) | .06 | .26 | |||||||||||||
| Total from investment operations | 1.00 | (.19 | ) | .20 | .46 | .72 | ||||||||||||||
| Less Dividends and Distributions: | ||||||||||||||||||||
| Dividends from net investment income | (.43 | ) | (.37 | ) | (.41 | ) | (.38 | ) | (.45 | ) | ||||||||||
| Distributions from net realized gains | - | - | (.03 | ) | (.03 | ) | (.04 | ) | ||||||||||||
| Total dividends and distributions | (.43 | ) | (.37 | ) | (.44 | ) | (.41 | ) | (.49 | ) | ||||||||||
| Net asset value, end of year | $9.96 | $9.39 | $9.95 | $10.19 | $10.14 | |||||||||||||||
| Total Return(a): | 10.76% | (1.98)% | 2.05% | 4.68% | 7.36% | |||||||||||||||
| Ratios/Supplemental Data: | ||||||||||||||||||||
| Net assets, end of year (000) | $367,286 | $135,575 | $57,729 | $47,082 | $29,889 | |||||||||||||||
| Average net assets (000) | $224,436 | $115,125 | $52,159 | $44,076 | $27,983 | |||||||||||||||
| Ratios to average net assets(b): | ||||||||||||||||||||
| Expenses after waivers and/or expense reimbursement | .75% | .80% | .85% | .95% | .95% | |||||||||||||||
| Expenses before waivers and/or expense reimbursement | .89% | 1.09% | 1.30% | 1.31% | 1.62% | |||||||||||||||
| Net investment income (loss) | 4.42% | 3.88% | 4.16% | 3.85% | 4.63% | |||||||||||||||
| Portfolio turnover rate | 67% | 55% | 64% | 82% | 106% | |||||||||||||||
| (a) | Total return is calculated assuming a purchase of a share on the first day and a sale on the last day of each year reported and includes reinvestment of dividends and distributions, if any. Total returns may reflect adjustments to conform to generally accepted accounting principles. |
| (b) | Does not include expenses of the underlying portfolio in which the Fund invests. |
| (c) | Calculated based on average shares outstanding during the year. |
See Notes to Financial Statements.
| 54 |
Report of Independent Registered Public
Accounting Firm
The Board of Directors and Shareholders Prudential Investment Portfolios, Inc. 14:
We have audited the accompanying statement of assets and liabilities of Prudential Floating Rate Income Fund (the “Fund”), one of the two series constituting Prudential Investment Portfolios, Inc. 14, including the portfolio of investments, as of February 28, 2017, and the related statement of operations for the year then ended, the statements of changes in net assets for each of the years in the two-year period then ended, and the financial highlights for each of the years in the five-year period then ended. These financial statements and financial highlights are the responsibility of the Fund’s management. Our responsibility is to express an opinion on these financial statements and financial highlights based on our audits.
We conducted our audits in accordance with the standards of the Public Company Accounting Oversight Board (United States). Those standards require that we plan and perform the audit to obtain reasonable assurance about whether the financial statements and financial highlights are free of material misstatement. An audit includes examining, on a test basis, evidence supporting the amounts and disclosures in the financial statements. Our procedures included confirmation of securities owned as of February 28, 2017, by correspondence with the custodian, transfer agent and brokers or by other appropriate auditing procedures when replies from brokers were not received. An audit also includes assessing the accounting principles used and significant estimates made by management, as well as evaluating the overall financial statement presentation. We believe that our audits provide a reasonable basis for our opinion.
In our opinion, the financial statements and financial highlights referred to above present fairly, in all material respects, the financial position of the Fund as of February 28, 2017, and the results of its operations for the year then ended, the changes in its net assets for each of the years in the two-year period then ended, and the financial highlights for each of the years in the five-year period then ended, in conformity with U.S. generally accepted accounting principles.

New York, New York
April 17, 2017
| Prudential Floating Rate Income Fund | 55 |
Federal Income Tax Information (unaudited)
For the year ended February 28, 2017, the Fund reports the maximum amount allowable but not less than 97.97% as interest-related dividends in accordance with Sections 871(k)(1) and 881(e)(1) of the Internal Revenue Code.
In January 2018, you will be advised on IRS Form 1099-DIV or substitute 1099-DIV, as to the federal tax status of the dividends received by you in calendar year 2017.
| 56 |
INFORMATION ABOUT BOARD MEMBERS AND OFFICERS
(Unaudited)
Information about Board Members and Officers of the Funds is set forth below. Board Members who are not deemed to be “interested persons” of the Funds, as defined in the 1940 Act, are referred to as “Independent Board Members.” Board Members who are deemed to be “interested persons” of the Funds are referred to as “Interested Board Members.” The Board Members are responsible for the overall supervision of the operations of the Funds and perform the various duties imposed on the directors of investment companies by the 1940 Act. The Board in turn elects the Officers, who are responsible for administering the day-to-day operations of the Funds.
| Independent Board Members(1) | ||||
Name, Address, Age Position(s) Portfolios Overseen | Principal Occupation(s) During Past Five Years | Other Directorships Held During Past Five Years | ||
Ellen S. Alberding (59) Board Member Portfolios Overseen: 88 | President and Board Member, The Joyce Foundation (charitable foundation) (since 2002); Vice Chair, City Colleges of Chicago (community college system) (since 2011); Trustee, Skills for America’s Future (national initiative to connect employers to community colleges) (since 2011); Trustee, National Park Foundation (charitable foundation for national park system) (since 2009); Trustee, Economic Club of Chicago (since 2009). | None. | ||
Kevin J. Bannon (64) Board Member Portfolios Overseen: 88 | Managing Director (April 2008-May 2015) and Chief Investment Officer (October 2008-November 2013) of Highmount Capital LLC (registered investment adviser); formerly Executive Vice President and Chief Investment Officer (April 1993-August 2007) of Bank of New York Company; President (May 2003-May 2007) of BNY Hamilton Family of Mutual Funds. | Director of Urstadt Biddle Properties (equity real estate investment trust) (since September 2008). | ||
Linda W. Bynoe (64) Board Member Portfolios Overseen: 88 | President and Chief Executive Officer (since March 1995) and formerly Chief Operating Officer (December 1989-February 1995) of Telemat Ltd. (management consulting); formerly Vice President (January 1985-June 1989) at Morgan Stanley & Co. (broker-dealer). | Director of Simon Property Group, Inc. (retail real estate) (May 2003-May 2012); Director of Anixter International, Inc. (communication products distributor) (since January 2006); Director of Northern Trust Corporation (financial services) (since April 2006); Trustee of Equity Residential (residential real estate) (since December 2009). | ||
Prudential Floating Rate Income Fund
| Independent Board Members(1) | ||||
Name, Address, Age Position(s) Portfolios Overseen | Principal Occupation(s) During Past Five Years | Other Directorships Held During Past Five Years | ||
Keith F. Hartstein (60) Board Member & Independent Chair Portfolios Overseen: 88 | Retired; Member (since November 2014) of the Governing Council of the Independent Directors Council (organization of independent mutual fund directors); formerly President and Chief Executive Officer (2005-2012), Senior Vice President (2004-2005), Senior Vice President of Sales and Marketing (1997-2004), and various executive management positions (1990-1997), John Hancock Funds, LLC (asset management); Chairman, Investment Company Institute’s Sales Force Marketing Committee (2003-2008). | None. | ||
Michael S. Hyland, CFA (71) Board Member Portfolios Overseen: 88 | Retired (since February 2005); formerly Senior Managing Director (July 2001-February 2005) of Bear Stearns & Co, Inc.; Global Partner, INVESCO (1999-2001); Managing Director and President of Salomon Brothers Asset Management (1989-1999). | None. | ||
Richard A. Redeker (73) Board Member & Independent Vice Chair Portfolios Overseen: 88 | Retired Mutual Fund Senior Executive (47 years); Management Consultant; Director, Mutual Fund Directors Forum (since 2014); Independent Directors Council (organization of independent mutual fund directors)-Executive Committee, Chair of Policy Steering Committee, Governing Council. | None. | ||
Stephen G. Stoneburn (73) Board Member Portfolios Overseen: 88 | Chairman (since July 2011), President and Chief Executive Officer (since June 1996) of Frontline Medical Communications (publishing company); formerly President (June 1995-June 1996) of Argus Integrated Media, Inc.; Senior Vice President and Managing Director (January 1993-1995) of Cowles Business Media; Senior Vice President of Fairchild Publications, Inc. (1975-1989). | None. | ||
Visit our website at pgiminvestments.com
| Interested Board Members(1) | ||||
Name, Address, Age Position(s) Portfolios Overseen | Principal Occupation(s) During Past Five Years | Other Directorships Held During Past Five Years | ||
Stuart S. Parker (54) Board Member & President Portfolios Overseen: 88 | President of PGIM Investments LLC (formerly known as Prudential Investments LLC) (since January 2012); Executive Vice President of Prudential Investment Management Services LLC (since December 2012); Executive Vice President of Jennison Associates LLC and Head of Retail Distribution of PGIM Investments LLC (June 2005-December 2011). | None. | ||
Scott E. Benjamin (43) Board Member & Vice President Portfolios Overseen: 88 | Executive Vice President (since June 2009) of PGIM Investments LLC; Executive Vice President (June 2009-June 2012) and Vice President (since June 2012) of Prudential Investment Management Services LLC; Executive Vice President (since September 2009) of AST Investment Services, Inc.; Senior Vice President of Product Development and Marketing, PGIM Investments (since February 2006); Vice President of Product Development and Product Management, Prudential Investments (2003-2006). | None. | ||
Grace C. Torres* (57) Board Member Portfolios Overseen: 86 | Retired; formerly Treasurer and Principal Financial and Accounting Officer of the PGIM Investments Funds, Target Funds, Advanced Series Trust, Prudential Variable Contract Accounts and The Prudential Series Fund (1998-June 2014); Assistant Treasurer (March 1999-June 2014) and Senior Vice President (September 1999-June 2014) of PGIM Investments LLC; Assistant Treasurer (May 2003-June 2014) and Vice President (June 2005-June 2014) of AST Investment Services, Inc.; Senior Vice President and Assistant Treasurer (May 2003-June 2014) of Prudential Annuities Advisory Services, Inc. | Director (since July 2015) of Sun Bancorp, Inc. N.A. | ||
* Note: Prior to her retirement in 2014, Ms. Torres was employed by PGIM Investments LLC. Due to her prior employment, she is considered to be an “interested person” under the 1940 Act. Ms. Torres is a Non-Management Interested Board Member.
(1) The year that each Board Member joined the Fund’s Board is as follows:
Ellen S. Alberding, 2013; Kevin J. Bannon, 2008; Linda W. Bynoe, 2005; Keith F. Hartstein, 2013; Michael S. Hyland, 2008; Richard A. Redeker, 1993; Stephen G. Stoneburn, 2003; Grace C. Torres, 2014; Stuart S. Parker, Board Member and President since 2012; Scott E. Benjamin, Board Member since 2010 and Vice President since 2009.
Prudential Floating Rate Income Fund
| Fund Officers(a) | ||||
Name, Address and Age Position with Fund | Principal Occupation(s) During Past Five Years | Length of Service as Fund Officer | ||
Raymond A. O’Hara (61) Chief Legal Officer | Vice President and Corporate Counsel (since July 2010) of Prudential Insurance Company of America (Prudential); Vice President (March 2011-Present) of Pruco Life Insurance Company and Pruco Life Insurance Company of New Jersey; Vice President and Corporate Counsel (March 2011-Present) of Prudential Annuities Life Assurance Corporation; Chief Legal Officer of PGIM Investments LLC (since June 2012); Chief Legal Officer of Prudential Mutual Fund Services LLC (since June 2012) and Corporate Counsel of AST Investment Services, Inc. (since June 2012); formerly Assistant Vice President and Corporate Counsel (September 2008-July 2010) of The Hartford Financial Services Group, Inc.; formerly Associate (September 1980-December 1987) and Partner (January 1988–August 2008) of Blazzard & Hasenauer, P.C. (formerly, Blazzard, Grodd & Hasenauer, P.C.). | Since 2012 | ||
Chad A. Earnst (42) Chief Compliance Officer | Chief Compliance Officer (September 2014-Present) of PGIM Investments LLC; Chief Compliance Officer (September 2014-Present) of the PGIM Investments Funds, Target Funds, Advanced Series Trust, The Prudential Series Fund, Prudential’s Gibraltar Fund, Inc., Prudential Global Short Duration High Yield Income Fund, Inc., Prudential Short Duration High Yield Fund, Inc. and Prudential Jennison MLP Income Fund, Inc.; formerly Assistant Director (March 2010-August 2014) of the Asset Management Unit, Division of Enforcement, US Securities & Exchange Commission; Assistant Regional Director (January 2010-August 2014), Branch Chief (June 2006–December 2009) and Senior Counsel (April 2003-May 2006) of the Miami Regional Office, Division of Enforcement, US Securities & Exchange Commission. | Since 2014 | ||
Deborah A. Docs (59) Secretary | Vice President and Corporate Counsel (since January 2001) of Prudential; Vice President (since December 1996) and Assistant Secretary (since March 1999) of PGIM Investments LLC; formerly Vice President and Assistant Secretary (May 2003-June 2005) of AST Investment Services, Inc. | Since 2004 | ||
Jonathan D. Shain (58) Assistant Secretary | Vice President and Corporate Counsel (since August 1998) of Prudential; Vice President and Assistant Secretary (since May 2001) of PGIM Investments LLC; Vice President and Assistant Secretary (since February 2001) of Prudential Mutual Fund Services LLC; formerly Vice President and Assistant Secretary (May 2003-June 2005) of AST Investment Services, Inc. | Since 2005 | ||
Claudia DiGiacomo (42) Assistant Secretary | Vice President and Corporate Counsel (since January 2005) of Prudential; Vice President and Assistant Secretary of PGIM Investments LLC (since December 2005); Associate at Sidley Austin Brown & Wood LLP (1999-2004). | Since 2005 | ||
Visit our website at pgiminvestments.com
| Fund Officers(a) | ||||
Name, Address and Age Position with Fund | Principal Occupation(s) During Past Five Years | Length of Service as Fund Officer | ||
Andrew R. French (54) Assistant Secretary | Vice President and Corporate Counsel (since February 2010) of Prudential; formerly Director and Corporate Counsel (2006-2010) of Prudential; Vice President and Assistant Secretary (since January 2007) of PGIM Investments LLC; Vice President and Assistant Secretary (since January 2007) of Prudential Mutual Fund Services LLC. | Since 2006 | ||
Theresa C. Thompson (54) Deputy Chief Compliance Officer | Vice President, Compliance, PGIM Investments LLC (since April 2004); and Director, Compliance, PGIM Investments LLC (2001-2004). | Since 2008 | ||
Charles H. Smith (43) Anti-Money Laundering Compliance Officer | Vice President, Corporate Compliance, Anti-Money Laundering Unit (since January 2015) of Prudential; committee member of the American Council of Life Insurers Anti-Money Laundering and Critical Infrastructure Committee (since January 2016); formerly Global Head of Economic Sanctions Compliance at AIG Property Casualty (February 2007 – December 2014); Assistant Attorney General at the New York State Attorney General’s Office, Division of Public Advocacy. (August 1998 —January 2007). | Since 2016 | ||
M. Sadiq Peshimam (53) Treasurer and Principal Financial and Accounting Officer | Vice President (since 2005) of PGIM Investments LLC; formerly Assistant Treasurer of funds in the Prudential Mutual Fund Complex (2006-2014). | Since 2006 | ||
Peter Parrella (58) Assistant Treasurer | Vice President (since 2007) and Director (2004-2007) within Prudential Mutual Fund Administration; formerly Tax Manager at SSB Citi Fund Management LLC (1997-2004). | Since 2007 | ||
Lana Lomuti (49) Assistant Treasurer | Vice President (since 2007) and Director (2005-2007), within Prudential Mutual Fund Administration; formerly Assistant Treasurer (December 2007-February 2014) of The Greater China Fund, Inc. | Since 2014 | ||
Linda McMullin (55) Assistant Treasurer | Vice President (since 2011) and Director (2008-2011) within Prudential Mutual Fund Administration. | Since 2014 | ||
Kelly A. Coyne (48) Assistant Treasurer | Director, Investment Operations of Prudential Mutual Fund Services LLC (since 2010). | Since 2015 | ||
(a) Excludes Mr. Parker and Mr. Benjamin, interested Board Members who also serve as President and Vice President, respectively.
Explanatory Notes to Tables:
| ∎ | Board Members are deemed to be “Interested,” as defined in the 1940 Act, by reason of their affiliation with PGIM Investments LLC and/or an affiliate of PGIM Investments LLC. |
| ∎ | Unless otherwise noted, the address of all Board Members and Officers is c/o PGIM Investments LLC, 655 Broad Street, Newark, New Jersey 07102-4410. |
| ∎ | There is no set term of office for Board Members or Officers. The Board Members have adopted a retirement policy, which calls for the retirement of Board Members on December 31 of the year in which they reach the age of 75. |
| ∎ | “Other Directorships Held” includes only directorships of companies required to register or file reports with the SEC under the 1934 Act (that is, “public companies”) or other investment companies registered under the 1940 Act. |
Prudential Floating Rate Income Fund
| ∎ | “Portfolios Overseen” includes all investment companies managed by PGIM Investments LLC. The investment companies for which PGIM Investments LLC serves as manager include the PGIM Investments Mutual Funds, The Prudential Variable Contract Accounts, Target Mutual Funds, Prudential Short Duration High Yield Fund, Inc., Prudential Global Short Duration High Yield Fund, Inc., The Prudential Series Fund, Prudential’s Gibraltar Fund, Inc. and the Advanced Series Trust. |
Visit our website at pgiminvestments.com
| ∎ TELEPHONE | ∎ WEBSITE | |||
655 Broad Street Newark, NJ 07102 | (800) 225-1852 | www.pgiminvestments.com |
| PROXY VOTING |
| The Board of Directors of the Fund has delegated to the Fund’s investment subadviser the responsibility for voting any proxies and maintaining proxy recordkeeping with respect to the Fund. A description of these proxy voting policies and procedures is available without charge, upon request, by calling (800) 225-1852. Information regarding how the Fund voted proxies relating to portfolio securities during the most recent 12-month period ended June 30 is available on the Fund’s website and on the Securities and Exchange Commission’s website. |
| DIRECTORS |
| Ellen S. Alberding • Kevin J. Bannon • Scott E. Benjamin • Linda W. Bynoe • Keith F. Hartstein • Michael S. Hyland • Stuart S. Parker • Richard A. Redeker • Stephen G. Stoneburn • Grace C. Torres |
| OFFICERS |
| Stuart S. Parker, President • Scott E. Benjamin, Vice President • M. Sadiq Peshimam, Treasurer and Principal Financial and Accounting Officer • Raymond A. O’Hara, Chief Legal Officer • Deborah A. Docs, Secretary • Chad A. Earnst, Chief Compliance Officer • Theresa C. Thompson, Deputy Chief Compliance Officer • Charles H. Smith, Anti-Money Laundering Compliance Officer • Jonathan D. Shain, Assistant Secretary • Claudia DiGiacomo, Assistant Secretary • Andrew R. French, Assistant Secretary • Peter Parrella, Assistant Treasurer • Lana Lomuti, Assistant Treasurer • Linda McMullin, Assistant Treasurer • Kelly A. Coyne, Assistant Treasurer |
| MANAGER | PGIM Investments LLC | 655 Broad Street Newark, NJ 07102 | ||
| ||||
| INVESTMENT SUBADVISER | PGIM Fixed Income | 655 Broad Street Newark, NJ 07102 | ||
| ||||
| DISTRIBUTOR | Prudential Investment Management Services LLC | 655 Broad Street Newark, NJ 07102 | ||
| ||||
| CUSTODIAN | The Bank of New York Mellon | 225 Liberty Street New York, NY 10286 | ||
| ||||
| TRANSFER AGENT | Prudential Mutual Fund Services LLC | PO Box 9658 Providence, RI 02940 | ||
| ||||
| INDEPENDENT REGISTERED PUBLIC ACCOUNTING FIRM | KPMG LLP | 345 Park Avenue New York, NY 10154 | ||
| ||||
| FUND COUNSEL | Willkie Farr & Gallagher LLP | 787 Seventh Avenue New York, NY 10019 | ||
| ||||
| An investor should consider the investment objectives, risks, charges, and expenses of the Fund carefully before investing. The prospectus and summary prospectus contain this and other information about the Fund. An investor may obtain a prospectus and summary prospectus by visiting our website at www.pgiminvestments.com or by calling (800) 225-1852. The prospectus and summary prospectus should be read carefully before investing. |
| E-DELIVERY |
| To receive your mutual fund documents online, go to www.pgiminvestments.com/edelivery and enroll. Instead of receiving printed documents by mail, you will receive notification via email when new materials are available. You can cancel your enrollment or change your email address at any time by visiting the website address above. |
| SHAREHOLDER COMMUNICATIONS WITH DIRECTORS |
| Shareholders can communicate directly with the Board of Directors by writing to the Chair of the Board, Prudential Floating Rate Income Fund, PGIM Investments, Attn: Board of Directors, 655 Broad Street, Newark, NJ 07102. Shareholders can communicate directly with an individual Director by writing to the same address. Communications are not screened before being delivered to the addressee. |
| AVAILABILITY OF PORTFOLIO SCHEDULE |
| The Fund files its complete schedule of portfolio holdings with the Securities and Exchange Commission for the first and third quarters of each fiscal year on Form N-Q. The Fund’s Forms N-Q are available on the Commission’s website at www.sec.gov. The Fund’s Forms N-Q may also be reviewed and copied at the Commission’s Public Reference Room in Washington, D.C. Information on the operation and location of the Public Reference Room may be obtained by calling 1-800-SEC-0330. The Fund’s schedule of portfolio holdings is also available on the Fund’s website as of the end of each month no sooner than 15 days after the end of the month. |
| The Fund’s Statement of Additional Information contains additional information about the Fund’s Directors and is available without charge, upon request, by calling (800) 225-1852. |
Mutual Funds:
| ARE NOT INSURED BY THE FDIC OR ANY FEDERAL GOVERNMENT AGENCY | MAY LOSE VALUE | ARE NOT A DEPOSIT OF OR GUARANTEED BY ANY BANK OR ANY BANK AFFILIATE |
PRUDENTIAL FLOATING RATE INCOME FUND
| SHARE CLASS | A | C | Q | Z | ||||
| NASDAQ | FRFAX | FRFCX | PFRIX | FRFZX | ||||
| CUSIP | 74439V602 | 74439V701 | 74439V883 | 74439V800 |
MF211E
Item 2 – Code of Ethics – – See Exhibit (a)
As of the end of the period covered by this report, the registrant has adopted a code of ethics (the “Section 406 Standards for Investment Companies – Ethical Standards for Principal Executive and Financial Officers”) that applies to the registrant’s Principal Executive Officer and Principal Financial Officer; the registrant’s Principal Financial Officer also serves as the Principal Accounting Officer.
The registrant hereby undertakes to provide any person, without charge, upon request, a copy of the code of ethics. To request a copy of the code of ethics, contact the registrant 800-225-1852, and ask for a copy of the Section 406 Standards for Investment Companies - Ethical Standards for Principal Executive and Financial Officers.
Item 3 – Audit Committee Financial Expert –
The registrant’s Board has determined that Mr. Kevin J. Bannon, member of the Board’s Audit Committee is an “audit committee financial expert,” and that he is “independent,” for purposes of this Item.
Item 4 – Principal Accountant Fees and Services –
(a) Audit Fees
For the fiscal years ended February 28, 2017 and February 29, 2016, KPMG LLP (“KPMG”), the Registrant’s principal accountant, billed the Registrant $100,528 and $98,003, respectively, for professional services rendered for the audit of the Registrant’s annual financial statements or services that are normally provided in connection with statutory and regulatory filings.
(b) Audit-Related Fees
For the fiscal years ended February 28, 2017 and February 29, 2016: none.
(c) Tax Fees
For the fiscal years ended February 28, 2017 and February 29, 2016: none.
(d) All Other Fees
For the fiscal years ended February 28, 2017 and February 29, 2016: none.
(e) (1) Audit Committee Pre-Approval Policies and Procedures
THE PRUDENTIAL MUTUAL FUNDS
AUDIT COMMITTEE POLICY
On
Pre-Approval of Services Provided by the Independent Accountants
The Audit Committee of each Prudential Mutual Fund is charged with the responsibility to monitor the independence of the Fund’s independent accountants. As part of this responsibility, the Audit Committee must pre-approve the independent accounting firm’s engagement to render audit and/or permissible non-audit services, as required by law. In evaluating a proposed engagement of the independent accountants, the Audit Committee will assess the effect that the engagement might reasonably be expected to have on the accountant’s independence. The Committee’s evaluation will be based on:
| • | a review of the nature of the professional services expected to be provided, |
| • | a review of the safeguards put into place by the accounting firm to safeguard independence, and |
| • | periodic meetings with the accounting firm. |
Policy for Audit and Non-Audit Services Provided to the Funds
On an annual basis, the scope of audits for each Fund, audit fees and expenses, and audit-related and non-audit services (and fees proposed in respect thereof) proposed to be performed by the Fund’s independent accountants will be presented by the Treasurer and the independent accountants to the Audit Committee for review and, as appropriate, approval prior to the initiation of such services. Such presentation shall be accompanied by confirmation by both the Treasurer and the independent accountants that the proposed non-audit services will not adversely affect the independence of the independent accountants. Such proposed non-audit services shall be described in sufficient detail to enable the Audit Committee to assess the appropriateness of such services and fees, and the compatibility of the provision of such services with the auditor’s independence. The Committee shall receive periodic reports on the progress of the audit and other services which are approved by the Committee or by the Committee Chair pursuant to authority delegated in this Policy.
The categories of services enumerated under “Audit Services”, “Audit-related Services”, and “Tax Services” are intended to provide guidance to the Treasurer and the independent accountants as to those categories of services which the Committee believes are generally consistent with the independence of the independent accountants and which the Committee (or the Committee Chair) would expect upon the presentation of specific proposals to pre-approve. The enumerated categories are not intended as an exclusive list of audit, audit-related or tax services, which the Committee (or the Committee Chair) would consider for pre-approval.
Audit Services
The following categories of audit services are considered to be consistent with the role of the Fund’s independent accountants:
| ➣ | Annual Fund financial statement audits |
| ➣ | Seed audits (related to new product filings, as required) |
| ➣ | SEC and regulatory filings and consents |
Audit-related Services
The following categories of audit-related services are considered to be consistent with the role of the Fund’s independent accountants:
| ➣ | Accounting consultations |
| ➣ | Fund merger support services |
| ➣ | Agreed Upon Procedure Reports |
| ➣ | Attestation Reports |
| ➣ | Other Internal Control Reports |
Individual audit-related services that fall within one of these categories (except for fund merger support services) and are not presented to the Audit Committee as part of the annual pre-approval process are subject to an authorized pre-approval by the Audit Committee so long as the estimated fee for those services does not exceed $30,000. Any services provided under such pre-approval will be reported to the Audit Committee at its next regular meeting. Should the amount of such services exceed $30,000 any additional fees will be subject to pre-approval by the Committee Chair (or any other Committee member on whom this responsibility has been delegated). Fees related to fund merger support services are subject to a separate authorized pre-approval by the Audit Committee with fees determined on a per occurrence and merger complexity basis.
Tax Services
The following categories of tax services are considered to be consistent with the role of the Fund’s independent accountants:
| ➣ | Tax compliance services related to the filing or amendment of the following: |
| ◾ | Federal, state and local income tax compliance; and, |
| ◾ | Sales and use tax compliance |
| ➣ | Timely RIC qualification reviews |
| ➣ | Tax distribution analysis and planning |
| ➣ | Tax authority examination services |
| ➣ | Tax appeals support services |
| ➣ | Accounting methods studies |
| ➣ | Fund merger support services |
| ➣ | Tax consulting services and related projects |
Individual tax services that fall within one of these categories and are not presented to the Audit
Committee as part of the annual pre-approval process are subject to an authorized pre-approval by the Audit Committee so long as the estimated fee for those services does not exceed $30,000. Any services provided under such pre-approval will be reported to the Audit Committee at its next regular meeting. Should the amount of such services exceed $30,000 any additional fees will be subject to pre-approval by the Committee Chair (or any other Committee member on whom this responsibility has been delegated).
Other Non-Audit Services
Certain non-audit services that the independent accountants are legally permitted to render will be subject to pre-approval by the Committee or by one or more Committee members to whom the Committee has delegated this authority and who will report to the full Committee any pre-approval decisions made pursuant to this Policy. Non-audit services presented for pre-approval pursuant to this paragraph will be accompanied by a confirmation from both the Treasurer and the independent accountants that the proposed services will not adversely affect the independence of the independent accountants.
Proscribed Services
The Fund’s independent accountants will not render services in the following categories of non-audit services:
| ➣ | Bookkeeping or other services related to the accounting records or financial statements of the Fund |
| ➣ | Financial information systems design and implementation |
| ➣ | Appraisal or valuation services, fairness opinions, or contribution-in-kind reports |
| ➣ | Actuarial services |
| ➣ | Internal audit outsourcing services |
| ➣ | Management functions or human resources |
| ➣ | Broker or dealer, investment adviser, or investment banking services |
| ➣ | Legal services and expert services unrelated to the audit |
| ➣ | Any other service that the Public Company Accounting Oversight Board determines, by regulation, is impermissible. |
Pre-approval of Non-Audit Services Provided to Other Entities Within the Prudential Fund Complex
Certain non-audit services provided to Prudential Investments LLC or any of its affiliates that also provide ongoing services to the Prudential Mutual Funds will be subject to pre-approval by the Audit Committee. The only non-audit services provided to these entities that will require pre-approval are those related directly to the operations and financial reporting of the Funds. Individual projects that are not presented to the Audit Committee as part of the annual pre-approval process will be subject to pre-approval by the Committee Chair (or any other Committee member on whom this responsibility has been delegated) so long as the estimated fee for those services does not exceed $30,000. Services presented for pre-approval pursuant to this paragraph will be accompanied by a confirmation from both the Treasurer and the independent accountants that the proposed services will not adversely affect the independence of the independent accountants.
Although the Audit Committee will not pre-approve all services provided to Prudential Investments LLC and its affiliates, the Committee will receive an annual report from the Fund’s independent accounting firm showing the aggregate fees for all services provided to Prudential Investments and its affiliates.
(e) (2) Percentage of services referred to in 4(b) – 4(d) that were approved by the audit committee –
For the fiscal years ended February 28, 2017 and February 29, 2016: none.
(f) Percentage of hours expended attributable to work performed by other than full time employees of principal accountant if greater than 50%. | ||
The percentage of hours expended on the principal accountant’s engagement to audit the registrant’s financial statements for the most recent fiscal year that were attributed to work performed by persons other than the principal accountant’s full-time, permanent employees was 0%.
(g) Non-Audit Fees
The aggregate non-audit fees billed by KPMG for services rendered to the registrant’s investment adviser and any entity controlling, controlled by, or under common control with the investment adviser that provides ongoing services to the registrant for the fiscal years ended February 28, 2017 and February 29, 2016 was $0 and $0, respectively.
(h) Principal Accountant’s Independence
Not applicable as KPMG has not provided non-audit services to the registrant’s investment adviser and any entity controlling, controlled by, or under common control with the investment adviser that provides ongoing services to the registrant that were not pre-approved pursuant to Rule 2-01(c)(7)(ii) of Regulation S-X.
Item 5 – | Audit Committee of Listed Registrants – Not applicable. | |
Item 6 – | Schedule of Investments – The schedule is included as part of the report to shareholders filed under Item 1 of this Form. | |
Item 7 – | Disclosure of Proxy Voting Policies and Procedures for Closed-End Management Investment Companies – Not applicable. | |
Item 8 – | Portfolio Managers of Closed-End Management Investment Companies – Not applicable. | |
Item 9 – | Purchases of Equity Securities by Closed-End Management Investment Company and Affiliated Purchasers – Not applicable. | |
Item 10 – | Submission of Matters to a Vote of Security Holders – Not applicable. | |
Item 11 – | Controls and Procedures | |
(a) | It is the conclusion of the registrant’s principal executive officer and principal financial officer that the effectiveness of the registrant’s current disclosure controls and procedures (such disclosure controls and procedures having been evaluated within 90 days of the date of this filing) provide reasonable assurance that the information required to be disclosed by the registrant has been recorded, processed, summarized and reported within the time period specified in the Commission’s rules and forms and that the information required to be disclosed by the registrant has been accumulated and communicated to the registrant’s principal executive officer and principal financial officer in order to allow timely decisions regarding required disclosure. | |
(b) | There has been no significant change in the registrant’s internal control over financial reporting that occurred during the registrant’s most recent fiscal quarter of the period covered by this report that has materially affected, or is likely to materially affect, the registrant’s internal control over financial reporting. | |
Item 12 – Exhibits | ||
(a) | (1) Code of Ethics – Attached hereto as Exhibit EX-99.CODE-ETH | |
(2) Certifications pursuant to Section 302 of the Sarbanes-Oxley Act – Attached hereto as Exhibit EX-99.CERT. | ||
(3) Any written solicitation to purchase securities under Rule 23c-1. – Not applicable. | ||
(b) | Certifications pursuant to Section 906 of the Sarbanes-Oxley Act – Attached hereto as Exhibit EX-99.906CERT. | |
SIGNATURES
Pursuant to the requirements of the Securities Exchange Act of 1934 and the Investment Company Act of 1940, the registrant has duly caused this report to be signed on its behalf by the undersigned, thereunto duly authorized.
| Registrant: | Prudential Investment Portfolios, Inc. 14 | |
| By: | /s/ Deborah A. Docs | |
| Deborah A. Docs | ||
| Secretary | ||
| Date: | April 21, 2017 | |
Pursuant to the requirements of the Securities Exchange Act of 1934 and the Investment Company Act of 1940, this report has been signed below by the following persons on behalf of the registrant and in the capacities and on the dates indicated.
| By: | /s/ Stuart S. Parker | |
| Stuart S. Parker | ||
| President and Principal Executive Officer | ||
| Date: | April 21, 2017 | |
| By: | /s/ M. Sadiq Peshimam | |
| M. Sadiq Peshimam | ||
| Treasurer and Principal Financial and Accounting Officer | ||
| Date: | April 21, 2017 | |