UNITED STATES
SECURITIES AND EXCHANGE COMMISSION
Washington, D.C. 20549
FORM N-CSR
CERTIFIED SHAREHOLDER REPORT OF REGISTERED MANAGEMENT
INVESTMENT COMPANIES
| Investment Company Act file number: | 811-03712 | |
| Exact name of registrant as specified in charter: | Prudential Investment Portfolios, Inc. 14 | |
| Address of principal executive offices: | 655 Broad Street, 17th Floor | |
| Newark, New Jersey 07102 | ||
| Name and address of agent for service: | Deborah A. Docs | |
| 655 Broad Street, 17th Floor | ||
| Newark, New Jersey 07102 | ||
| Registrant’s telephone number, including area code: | 800-225-1852 | |
| Date of fiscal year end: | 2/28/2018 | |
| Date of reporting period: | 2/28/2018 | |
Item 1 – Reports to Stockholders

PRUDENTIAL GOVERNMENT INCOME FUND
ANNUAL REPORT
FEBRUARY 28, 2018


To enroll in e-delivery, go to pgiminvestments.com/edelivery
| Objective: Seek high current return |
Highlights (unaudited)
| • | The Fund benefited from its curve positioning strategy, as the Fund was positioned to benefit from a flatter yield curve. |
| • | Sector allocations added to relative performance, highlighted by an overweight (holding a larger percentage of securities than the Bloomberg Barclays US Government Bond Index) in commercial mortgage-backed securities. |
| • | The Fund was hurt by the active management of its duration positioning. The Fund was positioned for long duration, as rates rose at the beginning of 2018; this positioning detracted from performance. |
This report is not authorized for distribution to prospective investors unless preceded or accompanied by a current prospectus.
The views expressed in this report and information about the Fund’s portfolio holdings is for the period covered by this report and is subject to change thereafter.
Mutual funds are distributed by Prudential Investment Management Services LLC (PIMS), member SIPC. PGIM Fixed Income is a unit of PGIM, Inc. (PGIM), a registered investment adviser. PIMS and PGIM are Prudential Financial companies. © 2018 Prudential Financial, Inc. and its related entities. PGIM and the PGIM logo are service marks of Prudential Financial, Inc. and its related entities, registered in many jurisdictions worldwide.
| 2 | Visit our website at pgiminvestments.com |
PRUDENTIAL FUNDS — UPDATE
The Board of Directors/Trustees for the Fund has approved renaming the Fund’s Class Q shares as Class R6 shares, effective on June 11, 2018. The renaming of Class Q shares as Class R6 shares will not result in any changes to pricing, eligibility, or shareholder rights and obligations. The renamed Class R6 shares will not be exchangeable with Class R6 shares of the Prudential Day One Funds or the Prudential 60/40 Allocation Fund.
- Not part of the Annual Report -
| Prudential Government Income Fund | 3 |
PRUDENTIAL FUNDS — UPDATE
Effective on or about June 1, 2018 (the “Effective Date”), each Fund’s Class A, Class C, Class R and Class Z shares, as applicable, will be closed to investments by new group retirement plans, except as discussed below. Existing group retirement plans as of the Effective Date may keep their investments in their current share class and may continue to make additional purchases or exchanges of that class of shares. As of the Effective Date, all new group retirement plans wishing to add the Funds as new additions to the plan generally will be into one of the available Class Q shares, Class R2 shares, or Class R4 shares of the Funds.
In addition, on or about the Effective Date, the Class R shares of each Fund will be closed to all new investors, except as discussed below. Due to the closing of the Class R shares to new investors, effective on or about the Effective Date new IRA investors may only purchase Class A, Class C, Class Z or Class Q shares of the Funds, subject to share class eligibility. Following the Effective Date, no new accounts may be established in the Funds’ Class R shares and no Class R shares may be purchased or acquired by any new Class R shareholder, except as discussed below.
| Class A | Class C | Class Z | Class R | |||||
Existing Investors (Group Retirement Plans, IRAs, and all other investors) | No Change | No Change | No Change | No Change | ||||
| New Group Retirement Plans | Closed to group retirement plans wishing to add the share classes as new additions to plan menus on or about June 1, 2018, subject to certain exceptions below | |||||||
New IRAs | No Change | No Change | No Change | Closed to all new investors on or about June 1, 2018, subject to certain exceptions below | ||||
| All Other New Investors | No Change | No Change | No Change | |||||
- Not part of the Annual Report -
| 4 | Visit our website at pgiminvestments.com |
However, the following new investors may continue to purchase Class A, Class C, Class R and Class Z shares of a Fund, as applicable:
| • | Eligible group retirement plans who are exercising their one-time 90-day repurchase privilege in a Fund will be permitted to purchase such share classes. |
| • | Plan participants in a group retirement plan that offers Class A, Class C, Class R or Class Z shares of a Fund as of the Effective Date will be permitted to purchase such share classes of the Fund, even if the plan participant did not own shares of that class of the Fund as of the Effective Date. |
| • | Certain new group retirement plans will be permitted to offer such share classes of a Fund after the Effective Date, provided that the plan has or is actively negotiating a contractual agreement with the Fund’s distributor or service provider to offer such share classes of the Fund prior to or on the Effective Date. |
| • | New group retirement plans that combine with, replace or are otherwise affiliated with a current plan that invests in such share classes prior to or on the Effective Date will be permitted to purchase such share classes. |
The Funds also reserve the right to refuse any purchase order that might disrupt management of a Fund or to otherwise modify the closure policy at any time on a case-by-case basis.
- Not part of the Annual Report -
| Prudential Government Income Fund | 5 |
| 7 | ||||
| 8 | ||||
| 9 | ||||
| 13 | ||||
| 16 | ||||
| 19 | ||||
| 6 | Visit our website at pgiminvestments.com |

Dear Shareholder:
We hope you find the annual report for Prudential Government Income Fund informative and useful. The report covers performance for the 12-month period ended February 28, 2018.
We have important information to share with you. Effective June 11, 2018, Prudential Mutual Funds will be renamed from Prudential to PGIM Funds. Renaming our funds is part of our ongoing effort to further build our reputation and establish our global brand, which began when our firm adopted PGIM Investments as its name in April 2017. Please note that only the Fund’s name is changing. Your Fund’s management and operation, along with the Fund’s symbols, will remain the same.*
Over the reporting period, global economic growth continued its positive momentum, and central banks gradually tightened monetary policy. The US economy experienced moderate expansion and robust employment levels.
Equity returns were solid, due to healthy earnings expectations and the anticipated impact from tax reform. Global equities, including emerging markets, generally posted strong returns. US equities soared on new regulatory policy and revised corporate tax legislation. However, late in the period volatility arose on jitters over inflation and rising interest rates, tariffs, and a potential trade war.
In bond markets, US Treasury yields rose across both short and longer maturities. European bonds followed and often led during the period. In Japan, policy stance kept yields considerably lower. US corporate bonds handily outpaced Treasuries. Although most bond market sectors delivered positive returns, a great deal of gains were erased at the end of the period. Shortly afterward, the Federal Reserve hiked interest rates for the sixth time since 2015, based on confidence in the economy.
Regarding your investments with PGIM, we believe it is important to maintain a diversified portfolio of funds consistent with your tolerance for risk, time horizon, and financial goals.
Your financial advisor can help you create a diversified investment plan that may include funds covering all the basic asset classes and that reflects your personal investor profile and risk tolerance. However, diversification and asset allocation strategies do not assure a profit or protect against loss in declining markets.
At PGIM Investments, we consider it a great privilege and responsibility to help investors participate in opportunities across global markets while meeting their toughest investment challenges. PGIM is a top-10 global investment manager with more than $1 trillion in assets under management. This investment expertise allows us to deliver actively managed funds and strategies to meet the needs of investors around the globe.
Thank you for choosing our family of funds.
Sincerely,

Stuart S. Parker, President
Prudential Government Income Fund
April 16, 2018
*Note: The Prudential Day One Funds will not be changing their names.
| Prudential Government Income Fund | 7 |
Your Fund’s Performance (unaudited)
Performance data quoted represent past performance. Past performance does not guarantee future results. The investment return and principal value of an investment will fluctuate, so that an investor’s shares, when redeemed, may be worth more or less than their original cost. Current performance may be lower or higher than the past performance data quoted. An investor may obtain performance data as of the most recent month-end by visiting our website at www.pgiminvestments.com or by calling (800) 225-1852.
| Average Annual Total Returns as of 2/28/18 (with sales charges) | ||||||||||||||
| One Year (%) | Five Years (%) | Ten Years (%) | Since Inception (%) | |||||||||||
| Class A | –5.08 | –0.11 | 2.57 | — | ||||||||||
| Class B | –6.26 | –0.15 | 2.27 | — | ||||||||||
| Class C | –2.35 | 0.06 | 2.33 | — | ||||||||||
| Class R | –0.88 | 0.54 | 2.79 | — | ||||||||||
| Class Z | –0.36 | 1.07 | 3.31 | — | ||||||||||
| Class Q | –0.19 | N/A | N/A | –1.66 (8/9/16) | ||||||||||
| Bloomberg Barclays US Government Bond Index | –0.52 | 0.91 | 2.68 | — | ||||||||||
| Bloomberg Barclays US Aggregate ex-Credit Index | –0.20 | 1.25 | 3.09 | — | ||||||||||
| Lipper General US Government Funds Average | –0.74 | 0.57 | 2.47 | — | ||||||||||
| Average Annual Total Returns as of 2/28/18 (without sales charges) | ||||||||||||||
| One Year (%) | Five Years (%) | Ten Years (%) | Since Inception (%) | |||||||||||
Class A | –0.61 | 0.82 | 3.05 | — | ||||||||||
Class B | –1.40 | 0.04 | 2.27 | — | ||||||||||
Class C | –1.38 | 0.06 | 2.33 | — | ||||||||||
Class R | –0.88 | 0.54 | 2.79 | — | ||||||||||
Class Z | –0.36 | 1.07 | 3.31 | | — | | ||||||||
Class Q | –0.19 | N/A | N/A | –1.66 (8/9/16) | ||||||||||
| Bloomberg Barclays US Government Bond Index | –0.52 | 0.91 | 2.68 | — | ||||||||||
| Bloomberg Barclays US Aggregate ex-Credit Index | –0.20 | 1.25 | 3.09 | — | ||||||||||
| Lipper General US Government Funds Average | –0.74 | 0.57 | 2.47 | — | ||||||||||
| 8 | Visit our website at pgiminvestments.com |
Growth of a $10,000 Investment
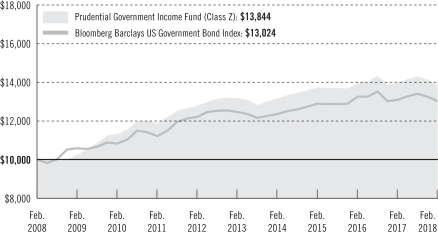
The graph compares a $10,000 investment in the Prudential Government Income Fund (Class Z shares) with a similar investment in the Bloomberg Barclays US Government Bond Index by portraying the initial account values at the beginning of the 10-year period for Class Z shares (February 29, 2008) and the account values at the end of the current fiscal year (February 28, 2018) as measured on a quarterly basis. For purposes of the graph, and unless otherwise indicated, it has been assumed that (a) all recurring fees (including management fees) were deducted; and (b) all dividends and distributions were reinvested. The line graph provides information for Class Z shares only. As indicated in the tables provided earlier, performance for Class A, Class B, Class C, Class R, and Class Q shares will vary due to the differing charges and expenses applicable to each share class (as indicated in the following paragraphs). Without waiver of fees and/or expense reimbursement, if any, the Fund’s returns would have been lower.
Past performance does not predict future performance. Total returns and the ending account values in the graph include changes in share price and reinvestment of dividends and capital gains distributions in a hypothetical investment for the periods shown. The Fund’s total returns do not reflect the deduction of income taxes on an individual’s investment. Taxes may reduce your actual investment returns on income or gains paid by the Fund or any gains you may realize if you sell your shares.
Source: PGIM Investments LLC and Lipper Inc.
Since Inception returns are provided for any share class with less than 10 fiscal years of returns. Since Inception returns for the Indexes and the Lipper Average are measured from the closest month-end to the class’ inception date.
| Prudential Government Income Fund | 9 |
Your Fund’s Performance (continued)
The returns in the tables do not reflect the deduction of taxes that a shareholder would pay on Fund distributions or following the redemption of Fund shares. The average annual total returns take into account applicable sales charges, which are described for each share class in the table below.
| Class A* | Class B** | Class C* | Class R* | Class Z* | Class Q*** | |||||||
| Maximum initial sales charge | 4.50% of the public offering price | None | None | None | None | None | ||||||
| Contingent deferred sales charge (CDSC) (as a percentage of the lower of original purchase price or net asset value at redemption) | 1.00% on sales of $1 million or more made within 12 months of purchase | 5.00% (Yr. 1) 4.00% (Yr. 2) 3.00% (Yr. 3) 2.00% (Yr. 4) 1.00% (Yr. 5) 1.00% (Yr. 6) 0.00% (Yr. 7) | 1.00% on sales made within 12 months of purchase | None | None | None | ||||||
| Annual distribution and service (12b-1) fees (shown as a percentage of average daily net assets) | 0.25% | 1.00% up to $3 billion, 0.80% next $1 billion, and 0.50% over $4 billion | 1.00% | 0.75% (0.50% currently) | None | None |
*Certain share classes will be generally closed to investments by new group retirement plans effective on or about June 1, 2018. Please see the ‘PRUDENTIAL FUNDS-UPDATE” on page 3 of this report for more information.
**Class B shares are closed to all purchase activity and no additional Class B shares may be purchased or acquired except by exchange from Class B shares of another Fund or through dividend or capital gains reinvestment.
***Class Q shares will be renamed as Class R6 shares effective on June 11, 2018. Please see the “PRUDENTIAL FUNDS-UPDATE” on page 3 of this report for more information.
Benchmark Definitions
Bloomberg Barclays US Government Bond Index—The Bloomberg Barclays US Government Bond Index is an unmanaged index of securities issued or backed by the US government, its agencies, and instrumentalities with between one and 30 years remaining to maturity. It gives a broad look at how US government bonds have performed. The average annual total returns for the Index through 2/28/18 measured from the month-end closest to the inception date of the Fund’s Class Q shares is –2.65%.
Bloomberg Barclays US Aggregate ex-Credit Index—The Bloomberg Barclays US Aggregate ex-Credit Index is an unmanaged index that represents securities that are SEC registered, taxable, and dollar denominated. The Index covers the US investment-grade fixed rate bond market, with index components for government and
| 10 | Visit our website at pgiminvestments.com |
corporate securities, mortgage pass-through securities, and asset-backed securities. These major sectors are subdivided into more specific indexes that are calculated and reported on a regular basis. The average annual total returns for the Index through 2/28/18 measured from the month-end closest to the inception date of the Fund’s Class Q shares is –1.78%.
Lipper General US Government Funds Average—The Lipper General US Government Funds Average (Lipper Average) is based on the average return of all funds in the Lipper General US Government Funds universe for the periods noted. Funds in the Lipper Average invest primarily in US government and agency issues. The average annual total returns for the Lipper Average through 2/28/18 measured from the month-end closest to the inception date of the Fund’s Class Q shares is –2.67%.
Investors cannot invest directly in an index or average. The returns for the Indexes would be lower if they included the effects of sales charges, operating expenses of a mutual fund, or taxes. Returns for the Lipper Average reflect the deduction of operating expenses, but not sales charges or taxes.
| Credit Quality expressed as a percentage of total investments as of 2/28/18 (%) | ||||
| AAA | 97.9 | |||
| AA | 1.2 | |||
| A | 1.0 | |||
| Not Rated | 0.9 | |||
| Cash/Cash Equivalents | –1.0 | |||
| Total Investments | 100.0 | |||
Source: PGIM Fixed Income
Credit ratings reflect the highest rating assigned by a nationally recognized statistical rating organization (NRSRO) such as Moody’s Investor Service, Inc. (Moody’s), S&P Global Ratings (S&P), or Fitch, Inc. (Fitch). Credit ratings reflect the common nomenclature used by both S&P and Fitch. Where applicable, ratings are converted to the comparable S&P/Fitch rating tier nomenclature used by both S&P and Fitch. These ratings agencies are independent and are widely used. The Not Rated category consists of securities that have not been rated by a NRSRO and may include derivative instruments that could have a negative value. Credit ratings are subject to change. Values may not sum to 100% due to rounding.
| Prudential Government Income Fund | 11 |
Your Fund’s Performance (continued)
| Distributions and Yields as of 2/28/18 | ||||||
| Total Distributions Paid for 12 Months ($) | SEC 30-Day Subsidized Yield* (%) | SEC 30-Day Unsubsidized Yield** (%) | ||||
| Class A | 0.21 | 1.88 | 1.88 | |||
| Class B | 0.13 | 0.91 | –2.99 | |||
| Class C | 0.13 | 1.03 | 1.03 | |||
| Class R | 0.18 | 1.59 | 1.34 | |||
| Class Z | 0.23 | 2.25 | 2.25 | |||
| Class Q | 0.25 | 2.36 | 2.36 | |||
*SEC 30-Day Subsidized Yield (%)—A standardized yield calculation created by the Securities and Exchange Commission, it reflects the income earned during a 30-day period, after the deduction of the Fund’s net expenses (net of any expense waivers or reimbursements).
**SEC 30-Day Unsubsidized Yield (%)—A standardized yield calculation created by the Securities and Exchange Commission, it reflects the income earned during a 30-day period, after the deduction of the Fund’s gross expenses.
| 12 | Visit our website at pgiminvestments.com |
Strategy and Performance Overview
How did the Fund perform?
The Prudential Government Income Fund’s Class Z shares returned –0.36% during the 12-month reporting period that ended February 28, 2018. The Fund outperformed the –0.52% return of the Bloomberg Barclays US Government Bond Index during the period, but underperformed the –0.20% return of the Bloomberg Barclays US Aggregate-ex Credit Index, neither of which include the effect of mutual fund operating expenses. In addition, the Fund outperformed the –0.74% return of the Lipper General US Government Funds Average.
What were market conditions?
| • | During the second quarter of 2017, developed markets central banks shifted towards tighter monetary policies. In the US, the front end of the Treasury yield curve rose as the Federal Reserve (Fed) hiked short-term interest rates in June and set the stage to start tapering its balance sheet by the end of the calendar year. US agency mortgage-backed securities (MBS) underperformed other high-quality spread sectors as net supply increased and outright buyers, such as banks and overseas investors, seemed willing to wait for better entry points to add exposure. Spread sectors are agency MBS, corporate bonds, emerging markets debt, and other types of debt securities that provide extra yield (spread) over similar-duration government bond sectors to compensate for the greater credit risk associated with investing in them. |
| • | Developed markets interest rates rose at the beginning of the third quarter after European Central Bank President Mario Draghi stated that “we can be more assured about the return of inflation to our objective than we were a few years ago.” In the US, prospects for further monetary policy tightening arrived as the Fed announced it would start trimming its balance sheet in October. The August US inflation report broke a multi-month streak of weaker-than-expected readings. This news, along with a hawkish Fed, lifted market expectations for a rate hike in December 2017. (Hawkish suggests higher interest rates.) Agency MBS benefited from favorable supply and demand dynamics, as investors underweighted the sector prior to the Fed’s tapering announcement and then sought to increase their positions amid strong buying by banks and in light of the Fed’s sizable reinvestment needs. |
| • | In the fourth quarter, US economic growth accelerated, increasing an estimated 2.3% in 2017 from 1.5% in 2016. A rebound in corporate profits, US dollar weakening, and broad-based, synchronized economic growth among US trading partners contributed to the economic improvement. Meanwhile, strong consumer spending was supported by a drop in the household saving rate over the past two years and a modest pick-up in borrowing. In December, the Fed raised short-term interest rates, as had been anticipated by the markets. Within agency MBS, 3.0% and 3.5% coupons performed well during the fourth quarter, largely because of strong buying by banks and due to taxable bond mutual fund inflows. Prepayment speeds remained contained, as they had through most of 2017, given that mortgage interest rates increased only slightly. |
| Prudential Government Income Fund | 13 |
Strategy and Performance Overview (continued)
| • | In January 2018, the US Treasury yield curve flattened, with short-term yields rising more than long-term yields. Stronger-than-expected economic data, increased consumer confidence, and elevated equity performance contributed to the broad increase in interest rates. |
| • | During February, the US Treasury yield curve steepened as long-term yields rose more than short-term yields. Stronger-than-expected economic data, particularly average hourly earnings and inflation, and the perceived hawkishness of new Fed Chair Jerome Powell, based on his congressional testimony, contributed to the increase in interest rates. |
| • | For the reporting period overall, corporate bonds broadly outpaced Treasuries, which slightly outperformed agency MBS. Although most bond market sectors delivered positive returns during the period, significant gains were erased due to volatility during January and February. |
What worked?
| • | The Fund benefited from its curve positioning strategy, as the Fund was positioned to benefit from a flatter yield curve. A curve positioning strategy attempts to gain from changes in the Treasury yield curve. |
| • | Sector allocations added to relative performance, highlighted by an overweight in commercial mortgage-backed securities. |
What didn’t work?
| • | The Fund was hurt by the active management of its duration positioning. (Duration measures the approximate price volatility of a bond portfolio for a given change in interest rates.) The Fund was positioned for long duration, as rates rose at the beginning of 2018; this detracted from performance. Over the reporting period the Fund was positioned between a short duration position of 0.3 years and a long duration position of 0.8 years. At period end, it held a long duration position of 0.2 years. |
| • | Positioning in municipal securities slightly detracted from performance. |
Did the Fund use derivatives, and how did they affect performance?
| • | The Fund held futures contracts on US Treasury securities and interest rate swaps to help manage the portfolio’s duration and yield curve exposure, which reduced its sensitivity to changes in the levels of interest rates. Overall, this strategy had a positive impact on performance during the reporting period. |
Current outlook
| • | Following exceptionally strong private-sector demand in the fourth quarter of 2017, first-quarter 2018 economic growth was tracking at a little less than 2%. PGIM Fixed Income thinks that some of the softness, which may prove temporary, is likely due to a |
| 14 | Visit our website at pgiminvestments.com |
hurricane-related surge in demand during the fourth quarter and could also be similar to the pattern of first-quarter economic weakness seen in three out of the last four years. |
| • | At the end of the reporting period, PGIM Fixed Income believed the tax cuts had begun to take effect, which could boost household disposable income and create more incentives, on the margin, for companies to invest. Also, PGIM Fixed Income expects the tax law, combined with increased government spending following a two-year budget deal, to lift US economic growth from an estimated 2.3% in 2017 to 2.9% in 2018. |
| • | In PGIM Fixed Income’s opinion, inflation is expected to firm in the first half of 2018 and to remain capped near 2% by the second half of the year. This view is based on continued competitive pressures in many industries, global production capacity, ongoing disinflation pressures from technology and demographics, and already-elevated household indebtedness. |
| • | PGIM Fixed Income thinks the combination of fiscal stimulus and firming inflation is likely to keep the Fed on a trajectory of three to four rate hikes in 2018. In congressional testimony near the end of the period, Fed Chair Powell noted that previous headwinds have turned into tailwinds for the US economy. However, unforeseen negative shocks could affect the Fed’s projections, in PGIM Fixed Income’s view. |
| Prudential Government Income Fund | 15 |
As a shareholder of the Fund, you incur two types of costs: (1) transaction costs, including sales charges (loads) on purchase payments and redemptions, as applicable, and (2) ongoing costs, including management fees, distribution and/or service (12b-1) fees, and other Fund expenses, as applicable. This example is intended to help you understand your ongoing costs (in dollars) of investing in the Fund and to compare these costs with the ongoing costs of investing in other mutual funds.
The example is based on an investment of $1,000 held through the six-month period ended February 28, 2018. The example is for illustrative purposes only; you should consult the Prospectus for information on initial and subsequent minimum investment requirements.
Actual Expenses
The first line for each share class in the table on the following page provides information about actual account values and actual expenses. You may use the information on this line, together with the amount you invested, to estimate the expenses that you paid over the period. Simply divide your account value by $1,000 (for example, an $8,600 account value ÷ $1,000 = 8.6), then multiply the result by the number on the first line under the heading “Expenses Paid During the Six-Month Period” to estimate the expenses you paid on your account during this period.
Hypothetical Example for Comparison Purposes
The second line for each share class in the table on the following page provides information about hypothetical account values and hypothetical expenses based on the Fund’s actual expense ratio and an assumed rate of return of 5% per year before expenses, which is not the Fund’s actual return. The hypothetical account values and expenses may not be used to estimate the actual ending account balance or expenses you paid for the period. You may use this information to compare the ongoing costs of investing in the Fund and other funds. To do so, compare this 5% hypothetical example with the 5% hypothetical examples that appear in the shareholder reports of the other funds.
The Fund’s transfer agent may charge additional fees to holders of certain accounts that are not included in the expenses shown in the table on the following page. These fees apply to individual retirement accounts (IRAs) and Section 403(b) accounts. As of the close of the six-month period covered by the table, IRA fees included an annual maintenance fee of $15 per account (subject to a maximum annual maintenance fee of $25 for all accounts held by the same shareholder). Section 403(b) accounts are charged an annual $25 fiduciary maintenance fee. Some of the fees may vary in amount, or may be waived, based on your total account balance or the number of Prudential funds, including the Fund, that you own. You should consider the additional fees that were charged to your Fund account
| 16 | Visit our website at pgiminvestments.com |
over the six-month period when you estimate the total ongoing expenses paid over the period and the impact of these fees on your ending account value, as these additional expenses are not reflected in the information provided in the expense table. Additional fees have the effect of reducing investment returns.
Please note that the expenses shown in the table are meant to highlight your ongoing costs only and do not reflect any transactional costs such as sales charges (loads). Therefore, the second line for each share class in the table is useful in comparing ongoing costs only and will not help you determine the relative total costs of owning different funds. In addition, if these transactional costs were included, your costs would have been higher.
| Prudential Government Income Fund | Beginning Account Value September 1, 2017 | Ending Account February 28, 2018 | Annualized Expense Ratio Based on the Six-Month Period | Expenses Paid During the Six-Month Period* | ||||||||||||||
| Class A | Actual | $ | 1,000.00 | $ | 972.10 | 1.00 | % | $ | 4.89 | |||||||||
| Hypothetical | $ | 1,000.00 | $ | 1,019.84 | 1.00 | % | $ | 5.01 | ||||||||||
| Class B | Actual | $ | 1,000.00 | $ | 968.10 | 1.83 | % | $ | 8.93 | |||||||||
| Hypothetical | $ | 1,000.00 | $ | 1,015.72 | 1.83 | % | $ | 9.15 | ||||||||||
| Class C | Actual | $ | 1,000.00 | $ | 968.20 | 1.81 | % | $ | 8.83 | |||||||||
| Hypothetical | $ | 1,000.00 | $ | 1,015.82 | 1.81 | % | $ | 9.05 | ||||||||||
| Class R | Actual | $ | 1,000.00 | $ | 970.70 | 1.30 | % | $ | 6.35 | |||||||||
| Hypothetical | $ | 1,000.00 | $ | 1,018.35 | 1.30 | % | $ | 6.51 | ||||||||||
| Class Z | Actual | $ | 1,000.00 | $ | 973.30 | 0.74 | % | $ | 3.62 | |||||||||
| Hypothetical | $ | 1,000.00 | $ | 1,021.12 | 0.74 | % | $ | 3.71 | ||||||||||
| Class Q | Actual | $ | 1,000.00 | $ | 974.00 | 0.59 | % | $ | 2.89 | |||||||||
| Hypothetical | $ | 1,000.00 | $ | 1,021.87 | 0.59 | % | $ | 2.96 | ||||||||||
* Fund expenses (net of fee waivers or subsidies, if any) for each share class are equal to the annualized expense ratio for each share class (provided in the table), multiplied by the average account value over the period, multiplied by the 181 days in the six-month period ended February 28, 2018, and divided by the 365 days in the Fund’s fiscal year ended February 28, 2018 (to reflect the six-month period). Expenses presented in the table include the expenses of any underlying funds in which the Fund may invest.
| Prudential Government Income Fund | 17 |
as of February 28, 2018
Description | Interest Rate | Maturity Date | Principal Amount (000)# | Value | ||||||||||||
LONG-TERM INVESTMENTS 99.7% | ||||||||||||||||
ASSET-BACKED SECURITIES 5.1% | ||||||||||||||||
Collateralized Loan Obligations 5.1% | ||||||||||||||||
Battalion CLO Ltd., Series 2014-7A, Class A1R, 144A, 3 Month LIBOR + 1.190% (original cost $1,250,000; purchased 03/22/17)(f) | 2.921 | %(c) | 10/17/26 | 1,250 | $ | 1,252,555 | ||||||||||
BlueMountain CLO Ltd., Series 2015-1A, Class A1R, 144A, 3 Month LIBOR + 1.330% | 3.052 | (c) | 04/13/27 | 1,250 | 1,250,729 | |||||||||||
Carlyle Global Market Strategies CLO Ltd., | 3.089 | (c) | 05/15/25 | 1,000 | 1,000,951 | |||||||||||
Eaton Vance CLO Ltd., Series 2014-1A, Class AR, 144A, 3 Month LIBOR + 1.200% | 2.922 | (c) | 07/15/26 | 4,500 | 4,509,364 | |||||||||||
Flagship CLO Ltd., Series 2014-8A, Class AR, 144A, 3 Month LIBOR + 1.250% | 2.972 | (c) | 01/16/26 | 4,500 | 4,504,764 | |||||||||||
Jackson Mill CLO Ltd., Series 2015-1A, Class A, 144A, 3 Month LIBOR + 1.540% | 3.262 | (c) | 04/15/27 | 1,750 | 1,755,226 | |||||||||||
KVK CLO Ltd., Series 2014-1A, Class A1R, 144A, | 3.139 | (c) | 05/15/26 | 5,000 | 5,017,204 | |||||||||||
Limerock CLO LLC, Series 2014-3A, Class A1R, 144A, 3 Month LIBOR + 1.200% | 2.945 | (c) | 10/20/26 | 2,450 | 2,455,197 | |||||||||||
|
| |||||||||||||||
| 21,745,990 | ||||||||||||||||
Small Business Loan 0.0% | ||||||||||||||||
Small Business Administration Participation Certificates, Series 1998-20I, Class 1 | 6.000 | 09/01/18 | 88 | 88,842 | ||||||||||||
|
| |||||||||||||||
TOTAL ASSET-BACKED SECURITIES | 21,834,832 | |||||||||||||||
|
| |||||||||||||||
COMMERCIAL MORTGAGE-BACKED SECURITIES 15.8% |
| |||||||||||||||
Bank, Series 2017-BNK5, Class A3 | 3.020 | 06/15/60 | 3,600 | 3,521,057 | ||||||||||||
Citigroup Commercial Mortgage Trust, | 3.515 | 09/10/58 | 2,500 | 2,514,206 | ||||||||||||
Deutsche Bank Commercial Mortgage Trust, Series 2017-C6, Class A3 | 3.269 | 06/10/50 | 3,600 | 3,578,867 | ||||||||||||
Fannie Mae-Aces, Series 2012-M2, Class A2 | 2.717 | 02/25/22 | 270 | 268,601 | ||||||||||||
Series 2014-M2, Class A2 | 3.513 | (cc) | 12/25/23 | 3,950 | 4,037,343 | |||||||||||
Series 2015-M1, Class AB2 | 2.465 | 09/25/24 | 772 | 725,665 | ||||||||||||
Series 2015-M17, Class A2 | 2.938 | (cc) | 11/25/25 | 2,900 | 2,861,498 | |||||||||||
Series 2016-M11, Class A2 | 2.369 | (cc) | 07/25/26 | 2,600 | 2,442,907 | |||||||||||
Series 2016-M13, Class A2 | 2.477 | (cc) | 09/25/26 | 4,400 | 4,150,745 | |||||||||||
See Notes to Financial Statements.
| Prudential Government Income Fund | 19 |
Schedule of Investments (continued)
as of February 28, 2018
Description | Interest Rate | Maturity Date | Principal Amount (000)# | Value | ||||||||||||
COMMERCIAL MORTGAGE-BACKED SECURITIES (Continued) |
| |||||||||||||||
FHLMC Multifamily Structured Pass-Through Certificates, | ||||||||||||||||
Series K008, Class X1, IO | 1.531 | %(cc) | 06/25/20 | 23,119 | $ | 659,955 | ||||||||||
Series K019, Class X1, IO | 1.673 | (cc) | 03/25/22 | 25,150 | 1,401,249 | |||||||||||
Series K020, Class X1, IO | 1.424 | (cc) | 05/25/22 | 14,228 | 697,141 | |||||||||||
Series K021, Class X1, IO | 1.463 | (cc) | 06/25/22 | 15,462 | 796,764 | |||||||||||
Series K025, Class X1, IO | 0.867 | (cc) | 10/25/22 | 39,813 | 1,309,980 | |||||||||||
Series K038, Class A2 | 3.389 | 03/25/24 | 6,800 | 6,930,638 | ||||||||||||
Series K041, Class A2 | 3.171 | 10/25/24 | 6,000 | 6,034,093 | ||||||||||||
Series K044, Class A2 | 2.811 | 01/25/25 | 5,000 | 4,911,957 | ||||||||||||
Series K060, Class AM | 3.300 | (cc) | 10/25/26 | 3,860 | 3,857,820 | |||||||||||
Series K064, Class AM | 3.327 | (cc) | 03/25/27 | 2,100 | 2,098,489 | |||||||||||
Series K068, Class AM | 3.315 | 08/25/27 | 3,200 | 3,187,318 | ||||||||||||
Series K151, Class A3 | 3.511 | 04/25/30 | 900 | 913,962 | ||||||||||||
Series K710, Class X1, IO | 1.731 | (cc) | 05/25/19 | 12,038 | 183,587 | |||||||||||
Series K711, Class X1, IO | 1.681 | (cc) | 07/25/19 | 12,009 | 188,062 | |||||||||||
Series KS03, Class A4 | 3.161 | (cc) | 05/25/25 | 4,000 | 3,963,998 | |||||||||||
JPMBB Commercial Mortgage Securities Trust, | 3.515 | 03/15/49 | 2,500 | 2,483,293 | ||||||||||||
JPMorgan Chase Commercial Mortgage Securities Trust, Series 2013-LC11, Class A4 | 2.694 | 04/15/46 | 867 | 853,349 | ||||||||||||
Morgan Stanley Bank of America Merrill Lynch Trust, Series 2013-C9, Class A3 | 2.834 | 05/15/46 | 1,000 | 984,229 | ||||||||||||
Wells Fargo Commercial Mortgage Trust, | 3.572 | 09/15/58 | 2,500 | 2,519,468 | ||||||||||||
|
| |||||||||||||||
TOTAL COMMERCIAL MORTGAGE-BACKED SECURITIES | 68,076,241 | |||||||||||||||
|
| |||||||||||||||
CORPORATE BONDS 2.0% | ||||||||||||||||
Diversified Financial Services | ||||||||||||||||
Private Export Funding Corp., Sr. Unsec’d. Notes, 144A | 2.650 | 02/16/21 | 3,185 | 3,179,060 | ||||||||||||
CDP Financial, Inc. (Canada), Gtd. Notes, 144A | 3.150 | 07/24/24 | 470 | 471,318 | ||||||||||||
Private Export Funding Corp., | ||||||||||||||||
U.S. Gov’t. Gtd. Notes | 4.300 | 12/15/21 | 2,660 | 2,811,019 | ||||||||||||
U.S. Gov’t. Gtd. Notes | 3.550 | 01/15/24 | 2,085 | 2,163,855 | ||||||||||||
|
| |||||||||||||||
TOTAL CORPORATE BONDS | 8,625,252 | |||||||||||||||
|
| |||||||||||||||
See Notes to Financial Statements.
| 20 |
Description | Interest Rate | Maturity Date | Principal Amount (000)# | Value | ||||||||||||
MUNICIPAL BONDS 0.3% | ||||||||||||||||
California 0.1% | ||||||||||||||||
California Educational Facilities Authority, Revenue Bonds, BABs | 5.000 | % | 06/01/46 | 275 | $ | 355,058 | ||||||||||
Texas 0.2% | ||||||||||||||||
University of Texas System (The), Revenue Bonds, BABs | 5.000 | 08/15/47 | 610 | 765,562 | ||||||||||||
|
| |||||||||||||||
TOTAL MUNICIPAL BONDS | 1,120,620 | |||||||||||||||
|
| |||||||||||||||
RESIDENTIAL MORTGAGE-BACKED SECURITIES 0.1% |
| |||||||||||||||
Merrill Lynch Mortgage Investors Trust, | 2.241 | (c) | 10/25/28 | 70 | 68,465 | |||||||||||
Structured Adjustable Rate Mortgage Loan Trust, Series 2004-1, Class 4A3 | 3.680 | (cc) | 02/25/34 | 323 | 325,139 | |||||||||||
|
| |||||||||||||||
TOTAL RESIDENTIAL MORTGAGE-BACKED SECURITIES (cost $394,100) | 393,604 | |||||||||||||||
|
| |||||||||||||||
U.S. GOVERNMENT AGENCY OBLIGATIONS 42.6% | ||||||||||||||||
Federal Home Loan Mortgage Corp. | 3.000 | 11/01/46 | 984 | 954,748 | ||||||||||||
Federal Home Loan Mortgage Corp. | 3.000 | 12/01/30 | 790 | 787,052 | ||||||||||||
Federal Home Loan Mortgage Corp. | 3.000 | 12/01/46 | 968 | 939,179 | ||||||||||||
Federal Home Loan Mortgage Corp. | 4.000 | 05/01/46 | 2,385 | 2,453,440 | ||||||||||||
Federal Home Loan Mortgage Corp. | 4.000 | 08/01/46 | 454 | 466,823 | ||||||||||||
Federal Home Loan Mortgage Corp. | 1.625 | 09/29/20 | 800 | 784,638 | ||||||||||||
Federal Home Loan Mortgage Corp. | 2.000 | 01/01/32 | 326 | 309,930 | ||||||||||||
Federal Home Loan Mortgage Corp. | 2.375 | 02/16/21 | 2,270 | 2,261,404 | ||||||||||||
Federal Home Loan Mortgage Corp. | 2.500 | 03/01/30 | 1,333 | 1,300,703 | ||||||||||||
Federal Home Loan Mortgage Corp. | 3.000 | 10/01/28 | 278 | 278,046 | ||||||||||||
Federal Home Loan Mortgage Corp. | 3.000 | 06/01/29 | 797 | 794,213 | ||||||||||||
Federal Home Loan Mortgage Corp. | 3.000 | 01/01/37 | 1,595 | 1,575,271 | ||||||||||||
Federal Home Loan Mortgage Corp. | 3.000 | 04/01/43 | 1,855 | 1,812,224 | ||||||||||||
Federal Home Loan Mortgage Corp. | 3.000 | 11/01/46 | 1,192 | 1,156,126 | ||||||||||||
Federal Home Loan Mortgage Corp. | 3.000 | 01/01/47 | 4,848 | 4,699,922 | ||||||||||||
Federal Home Loan Mortgage Corp.MTN | 3.208 | (s) | 12/11/25 | 1,100 | 863,942 | |||||||||||
Federal Home Loan Mortgage Corp. | 3.500 | 08/01/26 | 476 | 485,568 | ||||||||||||
Federal Home Loan Mortgage Corp. | 3.500 | 01/01/27 | 247 | 251,729 | ||||||||||||
Federal Home Loan Mortgage Corp. | 3.500 | 06/01/42 | 1,950 | 1,958,803 | ||||||||||||
Federal Home Loan Mortgage Corp. | 3.500 | 06/01/43 | 1,409 | 1,415,009 | ||||||||||||
Federal Home Loan Mortgage Corp. | 4.000 | 06/01/26 | 172 | 178,962 | ||||||||||||
Federal Home Loan Mortgage Corp. | 4.000 | 09/01/26 | 425 | 442,078 | ||||||||||||
Federal Home Loan Mortgage Corp. | 4.000 | 11/01/39 | 1,347 | 1,392,166 | ||||||||||||
See Notes to Financial Statements.
| Prudential Government Income Fund | 21 |
Schedule of Investments (continued)
as of February 28, 2018
Description | Interest Rate | Maturity Date | Principal Amount (000)# | Value | ||||||||||||
U.S. GOVERNMENT AGENCY OBLIGATIONS (Continued) |
| |||||||||||||||
Federal Home Loan Mortgage Corp. | 4.000 | % | 09/01/40 | 923 | $ | 953,439 | ||||||||||
Federal Home Loan Mortgage Corp. | 4.000 | 12/01/40 | 716 | 740,068 | ||||||||||||
Federal Home Loan Mortgage Corp. | 4.000 | 12/01/40 | 508 | 524,622 | ||||||||||||
Federal Home Loan Mortgage Corp. | 4.000 | 04/01/42 | 1,776 | 1,825,794 | ||||||||||||
Federal Home Loan Mortgage Corp. | 4.000 | 12/01/46 | 486 | 499,998 | ||||||||||||
Federal Home Loan Mortgage Corp. | 4.500 | 09/01/39 | 2,019 | 2,131,766 | ||||||||||||
Federal Home Loan Mortgage Corp. | 5.000 | 06/01/33 | 859 | 927,200 | ||||||||||||
Federal Home Loan Mortgage Corp. | 5.000 | 03/01/34 | 85 | 91,522 | ||||||||||||
Federal Home Loan Mortgage Corp. | 5.000 | 05/01/34 | 1,125 | 1,211,981 | ||||||||||||
Federal Home Loan Mortgage Corp. | 5.000 | 05/01/34 | 94 | 100,627 | ||||||||||||
Federal Home Loan Mortgage Corp. | 5.500 | 05/01/37 | 138 | 151,275 | ||||||||||||
Federal Home Loan Mortgage Corp. | 5.500 | 01/01/38 | 121 | 132,448 | ||||||||||||
Federal Home Loan Mortgage Corp. | 6.000 | 12/01/33 | 68 | �� | 77,218 | |||||||||||
Federal Home Loan Mortgage Corp. | 6.000 | 09/01/34 | 150 | 166,831 | ||||||||||||
Federal Home Loan Mortgage Corp. | 6.500 | 09/01/32 | 159 | 179,597 | ||||||||||||
Federal Home Loan Mortgage Corp. | 6.500 | 09/01/32 | 54 | 60,426 | ||||||||||||
Federal Home Loan Mortgage Corp. | 7.000 | 09/01/32 | 32 | 33,415 | ||||||||||||
Federal Home Loan Mortgage Corp. | 8.000 | 03/01/22 | 15 | 14,658 | ||||||||||||
Federal Home Loan Mortgage Corp. | 8.000 | 08/01/22 | 3 | 3,065 | ||||||||||||
Federal Home Loan Mortgage Corp. | 8.500 | 09/01/19 | 2 | 1,735 | ||||||||||||
Federal Home Loan Mortgage Corp. | 9.000 | 01/01/20 | 2 | 2,019 | ||||||||||||
Federal National Mortgage Assoc. | 3.000 | 01/01/31 | 447 | 445,782 | ||||||||||||
Federal National Mortgage Assoc. | 3.000 | 01/01/32 | 430 | 428,395 | ||||||||||||
Federal National Mortgage Assoc. | 3.000 | 08/01/43 | 699 | 682,219 | ||||||||||||
Federal National Mortgage Assoc. | 1.000 | 10/24/19 | 5,000 | 4,898,740 | ||||||||||||
Federal National Mortgage Assoc. | 2.000 | 08/01/31 | 691 | 657,266 | ||||||||||||
Federal National Mortgage Assoc. | 2.375 | 01/19/23 | 1,435 | 1,412,383 | ||||||||||||
Federal National Mortgage Assoc. | 2.500 | 08/01/28 | 874 | 858,567 | ||||||||||||
Federal National Mortgage Assoc. | 2.500 | 11/01/31 | 483 | 471,696 | ||||||||||||
Federal National Mortgage Assoc. | 2.500 | 02/01/43 | 350 | 328,474 | ||||||||||||
Federal National Mortgage Assoc. | 2.500 | 12/01/46 | 1,523 | 1,423,655 | ||||||||||||
Federal National Mortgage Assoc. | 3.000 | TBA | 1,000 | 968,591 | ||||||||||||
Federal National Mortgage Assoc. | 3.000 | 01/01/27 | 825 | 826,818 | ||||||||||||
Federal National Mortgage Assoc. | 3.000 | 08/01/28 | 1,541 | 1,539,815 | ||||||||||||
Federal National Mortgage Assoc. | 3.000 | 02/01/31 | 3,221 | 3,209,874 | ||||||||||||
Federal National Mortgage Assoc. | 3.000 | 11/01/32 | 500 | 498,296 | ||||||||||||
Federal National Mortgage Assoc. | 3.000 | 01/01/33 | 553 | 550,618 | ||||||||||||
Federal National Mortgage Assoc. | 3.000 | 01/01/33 | 400 | 398,638 | ||||||||||||
Federal National Mortgage Assoc. | 3.000 | 02/01/33 | 670 | 667,773 | ||||||||||||
Federal National Mortgage Assoc. | 3.000 | 03/01/33 | 6,500 | 6,477,861 | ||||||||||||
Federal National Mortgage Assoc. | 3.000 | 11/01/36 | 1,768 | 1,746,013 | ||||||||||||
Federal National Mortgage Assoc. | 3.000 | 12/01/42 | 1,452 | 1,418,318 | ||||||||||||
Federal National Mortgage Assoc. | 3.000 | 02/01/43 | 978 | 955,217 | ||||||||||||
See Notes to Financial Statements.
| 22 |
Description | Interest Rate | Maturity Date | Principal Amount (000)# | Value | ||||||||||||
U.S. GOVERNMENT AGENCY OBLIGATIONS (Continued) |
| |||||||||||||||
Federal National Mortgage Assoc. | 3.000 | % | 03/01/43 | 514 | $ | 501,548 | ||||||||||
Federal National Mortgage Assoc. | 3.000 | 04/01/43 | 890 | 869,016 | ||||||||||||
Federal National Mortgage Assoc. | 3.000 | 05/01/43 | 1,315 | 1,284,218 | ||||||||||||
Federal National Mortgage Assoc. | 3.000 | 06/01/43 | 1,031 | 1,007,107 | ||||||||||||
Federal National Mortgage Assoc. | 3.000 | 06/01/43 | 467 | 455,951 | ||||||||||||
Federal National Mortgage Assoc. | 3.000 | 07/01/43 | 2,865 | 2,796,781 | ||||||||||||
Federal National Mortgage Assoc. | 3.000 | 01/01/47 | 988 | 957,768 | ||||||||||||
Federal National Mortgage Assoc. | 3.500 | TBA | 1,500 | 1,497,170 | ||||||||||||
Federal National Mortgage Assoc. | 3.500 | 09/01/26 | 304 | 309,357 | ||||||||||||
Federal National Mortgage Assoc. | 3.500 | 03/01/27 | 734 | 747,070 | ||||||||||||
Federal National Mortgage Assoc. | 3.500 | 10/01/41 | 3,012 | 3,026,048 | ||||||||||||
Federal National Mortgage Assoc. | 3.500 | 12/01/41 | 813 | 816,814 | ||||||||||||
Federal National Mortgage Assoc. | 3.500 | 03/01/42 | 767 | 770,147 | ||||||||||||
Federal National Mortgage Assoc. | 3.500 | 05/01/42 | 3,693 | 3,709,350 | ||||||||||||
Federal National Mortgage Assoc. | 3.500 | 12/01/42 | 1,862 | 1,869,955 | ||||||||||||
Federal National Mortgage Assoc. | 3.500 | 03/01/43 | 914 | 918,028 | ||||||||||||
Federal National Mortgage Assoc. | 3.500 | 06/01/45 | 7,849 | 7,843,661 | ||||||||||||
Federal National Mortgage Assoc. | 3.500 | 12/01/46 | 2,370 | 2,369,056 | ||||||||||||
Federal National Mortgage Assoc. | 4.000 | 09/01/40 | 1,557 | 1,606,655 | ||||||||||||
Federal National Mortgage Assoc. | 4.000 | 01/01/41 | 2,034 | 2,099,370 | ||||||||||||
Federal National Mortgage Assoc. | 4.000 | 07/01/42 | 596 | 615,230 | ||||||||||||
Federal National Mortgage Assoc. | 4.000 | 09/01/44 | 1,679 | 1,723,958 | ||||||||||||
Federal National Mortgage Assoc. | 4.500 | 01/01/20 | 31 | 31,566 | ||||||||||||
Federal National Mortgage Assoc. | 4.500 | 04/01/41 | 1,733 | 1,829,663 | ||||||||||||
Federal National Mortgage Assoc. | 4.500 | 01/01/45 | 442 | 463,717 | ||||||||||||
Federal National Mortgage Assoc. | 5.000 | 07/01/18 | 2 | 2,213 | ||||||||||||
Federal National Mortgage Assoc. | 5.000 | 08/01/18 | 9 | 8,658 | ||||||||||||
Federal National Mortgage Assoc. | 5.000 | 01/01/19 | 62 | 63,170 | ||||||||||||
Federal National Mortgage Assoc. | 5.000 | 02/01/19 | 83 | 83,945 | ||||||||||||
Federal National Mortgage Assoc. | 5.000 | 11/01/19 | 38 | 38,453 | ||||||||||||
Federal National Mortgage Assoc. | 5.000 | 12/01/31 | 71 | 76,311 | ||||||||||||
Federal National Mortgage Assoc. | 5.000 | 03/01/34 | 473 | 511,262 | ||||||||||||
Federal National Mortgage Assoc. | 5.000 | 07/01/35 | 186 | 200,468 | ||||||||||||
Federal National Mortgage Assoc. | 5.000 | 09/01/35 | 99 | 106,799 | ||||||||||||
Federal National Mortgage Assoc. | 5.000 | 11/01/35 | 117 | 126,126 | ||||||||||||
Federal National Mortgage Assoc. | 5.000 | 05/01/36 | 74 | 79,874 | ||||||||||||
Federal National Mortgage Assoc. | 5.500 | 10/01/18 | 17 | 16,821 | ||||||||||||
Federal National Mortgage Assoc. | 5.500 | 10/01/18 | 17 | 17,150 | ||||||||||||
Federal National Mortgage Assoc. | 5.500 | 11/01/18 | 13 | 12,765 | ||||||||||||
Federal National Mortgage Assoc. | 5.500 | 02/01/34 | 424 | 465,602 | ||||||||||||
Federal National Mortgage Assoc. | 5.500 | 09/01/34 | 723 | 795,349 | ||||||||||||
Federal National Mortgage Assoc. | 5.500 | 02/01/35 | 652 | 719,150 | ||||||||||||
Federal National Mortgage Assoc. | 5.500 | 06/01/35 | 121 | 130,856 | ||||||||||||
See Notes to Financial Statements.
| Prudential Government Income Fund | 23 |
Schedule of Investments (continued)
as of February 28, 2018
Description | Interest Rate | Maturity Date | Principal Amount (000)# | Value | ||||||||||||
U.S. GOVERNMENT AGENCY OBLIGATIONS (Continued) |
| |||||||||||||||
Federal National Mortgage Assoc. | 5.500 | % | 06/01/35 | 271 | $ | 295,248 | ||||||||||
Federal National Mortgage Assoc. | 5.500 | 09/01/35 | 404 | 439,266 | ||||||||||||
Federal National Mortgage Assoc. | 5.500 | 09/01/35 | 115 | 124,727 | ||||||||||||
Federal National Mortgage Assoc. | 5.500 | 10/01/35 | 429 | 468,481 | ||||||||||||
Federal National Mortgage Assoc. | 5.500 | 11/01/35 | 857 | 940,978 | ||||||||||||
Federal National Mortgage Assoc. | 5.500 | 11/01/35 | 1,063 | 1,166,026 | ||||||||||||
Federal National Mortgage Assoc. | 5.500 | 11/01/36 | 13 | 14,018 | ||||||||||||
Federal National Mortgage Assoc. | 6.000 | 08/01/21 | 46 | 46,920 | ||||||||||||
Federal National Mortgage Assoc. | 6.000 | 09/01/21 | 18 | 19,112 | ||||||||||||
Federal National Mortgage Assoc. | 6.000 | 07/01/22 | 2 | 1,671 | ||||||||||||
Federal National Mortgage Assoc. | 6.000 | 09/01/33 | 1 | 669 | ||||||||||||
Federal National Mortgage Assoc. | 6.000 | 11/01/33 | 1 | 1,185 | ||||||||||||
Federal National Mortgage Assoc. | 6.000 | 02/01/34 | 1 | 706 | ||||||||||||
Federal National Mortgage Assoc. | 6.000 | 06/01/34 | — | (r) | 214 | |||||||||||
Federal National Mortgage Assoc. | 6.000 | 09/01/34 | — | (r) | 435 | |||||||||||
Federal National Mortgage Assoc. | 6.000 | 09/01/34 | 29 | 32,513 | ||||||||||||
Federal National Mortgage Assoc. | 6.000 | 09/01/34 | 31 | 34,507 | ||||||||||||
Federal National Mortgage Assoc. | 6.000 | 11/01/34 | 4 | 4,725 | ||||||||||||
Federal National Mortgage Assoc. | 6.000 | 11/01/34 | 41 | 45,659 | ||||||||||||
Federal National Mortgage Assoc. | 6.000 | 02/01/35 | 1 | 1,450 | ||||||||||||
Federal National Mortgage Assoc. | 6.000 | 03/01/35 | 21 | 23,215 | ||||||||||||
Federal National Mortgage Assoc. | 6.000 | 04/01/35 | 1 | 1,109 | ||||||||||||
Federal National Mortgage Assoc. | 6.000 | 12/01/35 | 190 | 210,594 | ||||||||||||
Federal National Mortgage Assoc. | 6.000 | 01/01/36 | 318 | 354,779 | ||||||||||||
Federal National Mortgage Assoc. | 6.000 | 05/01/36 | 475 | 531,152 | ||||||||||||
Federal National Mortgage Assoc. | 6.000 | 05/01/36 | 105 | 116,709 | ||||||||||||
Federal National Mortgage Assoc. | 6.250 | 05/15/29 | 210 | 269,363 | ||||||||||||
Federal National Mortgage Assoc. | 6.500 | 07/01/32 | 827 | 921,554 | ||||||||||||
Federal National Mortgage Assoc. | 6.500 | 08/01/32 | 334 | 371,932 | ||||||||||||
Federal National Mortgage Assoc. | 6.500 | 09/01/32 | 99 | 109,784 | ||||||||||||
Federal National Mortgage Assoc. | 6.500 | 10/01/32 | 760 | 847,000 | ||||||||||||
Federal National Mortgage Assoc. | 6.500 | 10/01/32 | 102 | 113,928 | ||||||||||||
Federal National Mortgage Assoc. | 6.500 | 10/01/37 | 486 | 541,929 | ||||||||||||
Federal National Mortgage Assoc. | 6.625 | 11/15/30 | 350 | 472,689 | ||||||||||||
Federal National Mortgage Assoc. | 7.000 | 05/01/24 | 102 | 110,871 | ||||||||||||
Federal National Mortgage Assoc. | 7.000 | 05/01/24 | 26 | 27,081 | ||||||||||||
Federal National Mortgage Assoc. | 7.000 | 05/01/24 | 21 | 21,564 | ||||||||||||
Federal National Mortgage Assoc. | 7.000 | 05/01/24 | 19 | 19,424 | ||||||||||||
Federal National Mortgage Assoc. | 7.000 | 05/01/24 | 7 | 6,919 | ||||||||||||
Federal National Mortgage Assoc. | 7.000 | 05/01/24 | 6 | 5,564 | ||||||||||||
Federal National Mortgage Assoc. | 7.000 | 12/01/31 | 358 | 407,401 | ||||||||||||
Federal National Mortgage Assoc. | 7.000 | 12/01/31 | 1 | 1,321 | ||||||||||||
Federal National Mortgage Assoc. | 7.000 | 09/01/33 | 69 | 70,884 | ||||||||||||
See Notes to Financial Statements.
| 24 |
Description | Interest Rate | Maturity Date | Principal Amount (000)# | Value | ||||||||||||
U.S. GOVERNMENT AGENCY OBLIGATIONS (Continued) |
| |||||||||||||||
Federal National Mortgage Assoc. | 7.000 | % | 10/01/33 | 33 | $ | 32,936 | ||||||||||
Federal National Mortgage Assoc. | 7.000 | 11/01/33 | 12 | 11,979 | ||||||||||||
Federal National Mortgage Assoc. | 7.000 | 11/01/33 | 72 | 73,927 | ||||||||||||
Federal National Mortgage Assoc. | 7.000 | 02/01/36 | 6 | 6,459 | ||||||||||||
Federal National Mortgage Assoc. | 9.000 | 04/01/25 | 5 | 5,450 | ||||||||||||
Federal National Mortgage Assoc. | 9.500 | 01/01/25 | 8 | 8,334 | ||||||||||||
Federal National Mortgage Assoc. | 9.500 | 01/01/25 | 2 | 1,837 | ||||||||||||
Federal National Mortgage Assoc. | 9.500 | 01/01/25 | 3 | 2,902 | ||||||||||||
Federal National Mortgage Assoc. | 9.500 | 02/01/25 | 3 | 2,585 | ||||||||||||
Government National Mortgage Assoc. | 3.000 | 10/20/46 | 457 | 447,605 | ||||||||||||
Government National Mortgage Assoc. | 2.500 | 12/20/46 | 642 | 608,083 | ||||||||||||
Government National Mortgage Assoc. | 3.000 | 03/15/45 | 2,887 | 2,826,218 | ||||||||||||
Government National Mortgage Assoc. | 3.000 | 02/20/47 | 8,251 | 8,072,694 | ||||||||||||
Government National Mortgage Assoc. | 3.500 | 04/20/42 | 474 | 479,981 | ||||||||||||
Government National Mortgage Assoc. | 3.500 | 01/20/43 | 2,628 | 2,658,604 | ||||||||||||
Government National Mortgage Assoc. | 3.500 | 04/20/43 | 1,228 | 1,242,486 | ||||||||||||
Government National Mortgage Assoc. | 3.500 | 03/20/45 | 2,401 | 2,419,273 | ||||||||||||
Government National Mortgage Assoc. | 3.500 | 04/20/45 | 1,356 | 1,365,853 | ||||||||||||
Government National Mortgage Assoc. | 3.500 | 07/20/46 | 4,977 | 5,011,471 | ||||||||||||
Government National Mortgage Assoc. | 3.500 | 01/20/47 | 1,033 | 1,039,728 | ||||||||||||
Government National Mortgage Assoc. | 4.000 | TBA | 5,250 | 5,379,609 | ||||||||||||
Government National Mortgage Assoc. | 4.000 | 02/20/41 | 633 | 660,925 | ||||||||||||
Government National Mortgage Assoc. | 4.000 | 06/20/44 | 1,410 | 1,458,874 | ||||||||||||
Government National Mortgage Assoc. | 4.000 | 08/20/44 | 418 | 432,802 | ||||||||||||
Government National Mortgage Assoc. | 4.000 | 11/20/45 | 970 | 1,001,939 | ||||||||||||
Government National Mortgage Assoc. | 4.000 | 11/20/46 | 968 | 998,361 | ||||||||||||
Government National Mortgage Assoc. | 4.500 | 02/20/40 | 384 | 403,468 | ||||||||||||
Government National Mortgage Assoc. | 4.500 | 01/20/41 | 221 | 232,409 | ||||||||||||
Government National Mortgage Assoc. | 4.500 | 02/20/41 | 1,109 | 1,166,328 | ||||||||||||
Government National Mortgage Assoc. | 4.500 | 03/20/41 | 570 | 599,365 | ||||||||||||
Government National Mortgage Assoc. | 4.500 | 06/20/44 | 843 | 890,594 | ||||||||||||
Government National Mortgage Assoc. | 4.500 | 02/20/46 | 85 | 89,382 | ||||||||||||
Government National Mortgage Assoc. | 4.500 | 03/20/46 | 443 | 463,349 | ||||||||||||
Government National Mortgage Assoc. | 4.500 | 03/20/47 | 2,984 | 3,120,453 | ||||||||||||
Government National Mortgage Assoc. | 5.000 | 07/15/33 | 641 | 690,093 | ||||||||||||
Government National Mortgage Assoc. | 5.000 | 09/15/33 | 779 | 839,556 | ||||||||||||
Government National Mortgage Assoc. | 5.000 | 04/15/34 | 67 | 70,353 | ||||||||||||
Government National Mortgage Assoc. | 5.500 | 02/15/34 | 554 | 610,230 | ||||||||||||
Government National Mortgage Assoc. | 5.500 | 02/15/36 | 140 | 155,152 | ||||||||||||
Government National Mortgage Assoc. | 7.000 | 03/15/22 | — | (r) | 412 | |||||||||||
Government National Mortgage Assoc. | 7.000 | 12/15/22 | — | (r) | 374 | |||||||||||
Government National Mortgage Assoc. | 7.000 | 12/15/22 | 1 | 1,152 | ||||||||||||
Government National Mortgage Assoc. | 7.000 | 01/15/23 | 1 | 526 | ||||||||||||
See Notes to Financial Statements.
| Prudential Government Income Fund | 25 |
Schedule of Investments (continued)
as of February 28, 2018
Description | Interest Rate | Maturity Date | Principal Amount (000)# | Value | ||||||||||||
U.S. GOVERNMENT AGENCY OBLIGATIONS (Continued) |
| |||||||||||||||
Government National Mortgage Assoc. | 7.000 | % | 01/15/23 | 2 | $ | 1,977 | ||||||||||
Government National Mortgage Assoc. | 7.000 | 01/15/23 | 3 | 3,150 | ||||||||||||
Government National Mortgage Assoc. | 7.000 | 01/15/23 | 2 | 2,262 | ||||||||||||
Government National Mortgage Assoc. | 7.000 | 01/15/23 | 4 | 3,787 | ||||||||||||
Government National Mortgage Assoc. | 7.000 | 02/15/23 | 3 | 3,474 | ||||||||||||
Government National Mortgage Assoc. | 7.000 | 03/15/23 | 2 | 2,567 | ||||||||||||
Government National Mortgage Assoc. | 7.000 | 03/15/23 | 4 | 4,133 | ||||||||||||
Government National Mortgage Assoc. | 7.000 | 04/15/23 | 1 | 1,227 | ||||||||||||
Government National Mortgage Assoc. | 7.000 | 04/15/23 | 3 | 2,809 | ||||||||||||
Government National Mortgage Assoc. | 7.000 | 04/15/23 | 1 | 1,360 | ||||||||||||
Government National Mortgage Assoc. | 7.000 | 04/15/23 | 5 | 5,152 | ||||||||||||
Government National Mortgage Assoc. | 7.000 | 05/15/23 | — | (r) | 394 | |||||||||||
Government National Mortgage Assoc. | 7.000 | 05/15/23 | 39 | 41,101 | ||||||||||||
Government National Mortgage Assoc. | 7.000 | 05/15/23 | 2 | 1,731 | ||||||||||||
Government National Mortgage Assoc. | 7.000 | 05/15/23 | 1 | 1,418 | ||||||||||||
Government National Mortgage Assoc. | 7.000 | 05/15/23 | 1 | 714 | ||||||||||||
Government National Mortgage Assoc. | 7.000 | 05/15/23 | — | (r) | 122 | |||||||||||
Government National Mortgage Assoc. | 7.000 | 05/15/23 | 3 | 2,573 | ||||||||||||
Government National Mortgage Assoc. | 7.000 | 05/15/23 | 3 | 2,755 | ||||||||||||
Government National Mortgage Assoc. | 7.000 | 05/15/23 | 1 | 879 | ||||||||||||
Government National Mortgage Assoc. | 7.000 | 05/15/23 | 9 | 9,151 | ||||||||||||
Government National Mortgage Assoc. | 7.000 | 05/15/23 | 4 | 3,536 | ||||||||||||
Government National Mortgage Assoc. | 7.000 | 05/15/23 | 6 | 6,251 | ||||||||||||
Government National Mortgage Assoc. | 7.000 | 05/15/23 | 1 | 898 | ||||||||||||
Government National Mortgage Assoc. | 7.000 | 06/15/23 | — | (r) | 238 | |||||||||||
Government National Mortgage Assoc. | 7.000 | 06/15/23 | 2 | 1,557 | ||||||||||||
Government National Mortgage Assoc. | 7.000 | 06/15/23 | — | (r) | 297 | |||||||||||
Government National Mortgage Assoc. | 7.000 | 06/15/23 | 1 | 797 | ||||||||||||
Government National Mortgage Assoc. | 7.000 | 06/15/23 | 2 | 1,767 | ||||||||||||
Government National Mortgage Assoc. | 7.000 | 06/15/23 | 4 | 3,948 | ||||||||||||
Government National Mortgage Assoc. | 7.000 | 06/15/23 | 1 | 504 | ||||||||||||
Government National Mortgage Assoc. | 7.000 | 06/15/23 | 2 | 2,268 | ||||||||||||
Government National Mortgage Assoc. | 7.000 | 06/15/23 | 3 | 3,026 | ||||||||||||
Government National Mortgage Assoc. | 7.000 | 07/15/23 | 1 | 901 | ||||||||||||
Government National Mortgage Assoc. | 7.000 | 07/15/23 | 3 | 2,737 | ||||||||||||
Government National Mortgage Assoc. | 7.000 | 07/15/23 | 17 | 17,029 | ||||||||||||
Government National Mortgage Assoc. | 7.000 | 07/15/23 | 1 | 813 | ||||||||||||
Government National Mortgage Assoc. | 7.000 | 07/15/23 | 1 | 754 | ||||||||||||
Government National Mortgage Assoc. | 7.000 | 07/15/23 | 2 | 1,615 | ||||||||||||
Government National Mortgage Assoc. | 7.000 | 07/15/23 | — | (r) | 284 | |||||||||||
Government National Mortgage Assoc. | 7.000 | 07/15/23 | 4 | 4,063 | ||||||||||||
Government National Mortgage Assoc. | 7.000 | 07/15/23 | 2 | 2,104 | ||||||||||||
Government National Mortgage Assoc. | 7.000 | 07/15/23 | — | (r) | 392 | |||||||||||
See Notes to Financial Statements.
| 26 |
Description | Interest Rate | Maturity Date | Principal Amount (000)# | Value | ||||||||||||
U.S. GOVERNMENT AGENCY OBLIGATIONS (Continued) |
| |||||||||||||||
Government National Mortgage Assoc. | 7.000 | % | 07/15/23 | 3 | $ | 3,219 | ||||||||||
Government National Mortgage Assoc. | 7.000 | 08/15/23 | 2 | 1,855 | ||||||||||||
Government National Mortgage Assoc. | 7.000 | 08/15/23 | 1 | 640 | ||||||||||||
Government National Mortgage Assoc. | 7.000 | 08/15/23 | 2 | 1,592 | ||||||||||||
Government National Mortgage Assoc. | 7.000 | 08/15/23 | 6 | 6,181 | ||||||||||||
Government National Mortgage Assoc. | 7.000 | 08/15/23 | 4 | 3,899 | ||||||||||||
Government National Mortgage Assoc. | 7.000 | 08/15/23 | 1 | 1,012 | ||||||||||||
Government National Mortgage Assoc. | 7.000 | 08/15/23 | 3 | 3,046 | ||||||||||||
Government National Mortgage Assoc. | 7.000 | 08/15/23 | 2 | 2,163 | ||||||||||||
Government National Mortgage Assoc. | 7.000 | 08/15/23 | 1 | 826 | ||||||||||||
Government National Mortgage Assoc. | 7.000 | 08/15/23 | — | (r) | 341 | |||||||||||
Government National Mortgage Assoc. | 7.000 | 08/15/23 | 8 | 8,498 | ||||||||||||
Government National Mortgage Assoc. | 7.000 | 08/15/23 | 3 | 3,199 | ||||||||||||
Government National Mortgage Assoc. | 7.000 | 08/15/23 | 6 | 5,706 | ||||||||||||
Government National Mortgage Assoc. | 7.000 | 08/15/23 | 1 | 1,479 | ||||||||||||
Government National Mortgage Assoc. | 7.000 | 08/15/23 | 1 | 785 | ||||||||||||
Government National Mortgage Assoc. | 7.000 | 08/15/23 | 5 | 5,091 | ||||||||||||
Government National Mortgage Assoc. | 7.000 | 08/15/23 | 1 | 1,135 | ||||||||||||
Government National Mortgage Assoc. | 7.000 | 09/15/23 | 2 | 1,784 | ||||||||||||
Government National Mortgage Assoc. | 7.000 | 09/15/23 | 1 | 1,280 | ||||||||||||
Government National Mortgage Assoc. | 7.000 | 09/15/23 | 12 | 12,196 | ||||||||||||
Government National Mortgage Assoc. | 7.000 | 09/15/23 | 1 | 1,114 | ||||||||||||
Government National Mortgage Assoc. | 7.000 | 09/15/23 | 1 | 1,362 | ||||||||||||
Government National Mortgage Assoc. | 7.000 | 09/15/23 | 1 | 742 | ||||||||||||
Government National Mortgage Assoc. | 7.000 | 09/15/23 | 2 | 1,584 | ||||||||||||
Government National Mortgage Assoc. | 7.000 | 09/15/23 | 39 | 40,801 | ||||||||||||
Government National Mortgage Assoc. | 7.000 | 10/15/23 | 50 | 52,490 | ||||||||||||
Government National Mortgage Assoc. | 7.000 | 10/15/23 | 43 | 44,258 | ||||||||||||
Government National Mortgage Assoc. | 7.000 | 10/15/23 | 12 | 12,719 | ||||||||||||
Government National Mortgage Assoc. | 7.000 | 10/15/23 | 2 | 2,138 | ||||||||||||
Government National Mortgage Assoc. | 7.000 | 10/15/23 | 1 | 663 | ||||||||||||
Government National Mortgage Assoc. | 7.000 | 10/15/23 | — | (r) | 242 | |||||||||||
Government National Mortgage Assoc. | 7.000 | 10/15/23 | — | (r) | 361 | |||||||||||
Government National Mortgage Assoc. | 7.000 | 10/15/23 | 2 | 1,579 | ||||||||||||
Government National Mortgage Assoc. | 7.000 | 10/15/23 | 5 | 4,788 | ||||||||||||
Government National Mortgage Assoc. | 7.000 | 10/15/23 | 2 | 2,110 | ||||||||||||
Government National Mortgage Assoc. | 7.000 | 10/15/23 | 2 | 1,982 | ||||||||||||
Government National Mortgage Assoc. | 7.000 | 10/15/23 | 3 | 3,134 | ||||||||||||
Government National Mortgage Assoc. | 7.000 | 10/15/23 | 5 | 5,449 | ||||||||||||
Government National Mortgage Assoc. | 7.000 | 10/15/23 | 2 | 1,692 | ||||||||||||
Government National Mortgage Assoc. | 7.000 | 10/15/23 | — | (r) | 176 | |||||||||||
Government National Mortgage Assoc. | 7.000 | 10/15/23 | 7 | 6,889 | ||||||||||||
Government National Mortgage Assoc. | 7.000 | 10/15/23 | 1 | 1,246 | ||||||||||||
See Notes to Financial Statements.
| Prudential Government Income Fund | 27 |
Schedule of Investments (continued)
as of February 28, 2018
Description | Interest Rate | Maturity Date | Principal Amount (000)# | Value | ||||||||||||
U.S. GOVERNMENT AGENCY OBLIGATIONS (Continued) |
| |||||||||||||||
Government National Mortgage Assoc. | 7.000 | % | 10/15/23 | 1 | $ | 1,027 | ||||||||||
Government National Mortgage Assoc. | 7.000 | 10/15/23 | 7 | 7,271 | ||||||||||||
Government National Mortgage Assoc. | 7.000 | 10/15/23 | 2 | 2,013 | ||||||||||||
Government National Mortgage Assoc. | 7.000 | 10/15/23 | 1 | 1,292 | ||||||||||||
Government National Mortgage Assoc. | 7.000 | 10/15/23 | 15 | 15,459 | ||||||||||||
Government National Mortgage Assoc. | 7.000 | 10/15/23 | 2 | 1,550 | ||||||||||||
Government National Mortgage Assoc. | 7.000 | 10/15/23 | 2 | 1,843 | ||||||||||||
Government National Mortgage Assoc. | 7.000 | 10/15/23 | 7 | 7,444 | ||||||||||||
Government National Mortgage Assoc. | 7.000 | 10/15/23 | 5 | 4,936 | ||||||||||||
Government National Mortgage Assoc. | 7.000 | 10/15/23 | 5 | 5,461 | ||||||||||||
Government National Mortgage Assoc. | 7.000 | 10/15/23 | 6 | 5,952 | ||||||||||||
Government National Mortgage Assoc. | 7.000 | 10/15/23 | 8 | 8,766 | ||||||||||||
Government National Mortgage Assoc. | 7.000 | 10/15/23 | 1 | 1,413 | ||||||||||||
Government National Mortgage Assoc. | 7.000 | 10/15/23 | 4 | 4,122 | ||||||||||||
Government National Mortgage Assoc. | 7.000 | 11/15/23 | 1 | 1,298 | ||||||||||||
Government National Mortgage Assoc. | 7.000 | 11/15/23 | 1 | 559 | ||||||||||||
Government National Mortgage Assoc. | 7.000 | 11/15/23 | 2 | 1,876 | ||||||||||||
Government National Mortgage Assoc. | 7.000 | 11/15/23 | 4 | 4,454 | ||||||||||||
Government National Mortgage Assoc. | 7.000 | 11/15/23 | 2 | 2,545 | ||||||||||||
Government National Mortgage Assoc. | 7.000 | 11/15/23 | 15 | 15,581 | ||||||||||||
Government National Mortgage Assoc. | 7.000 | 11/15/23 | 7 | 7,895 | ||||||||||||
Government National Mortgage Assoc. | 7.000 | 11/15/23 | 2 | 1,550 | ||||||||||||
Government National Mortgage Assoc. | 7.000 | 11/15/23 | 14 | 13,711 | ||||||||||||
Government National Mortgage Assoc. | 7.000 | 11/15/23 | 1 | 738 | ||||||||||||
Government National Mortgage Assoc. | 7.000 | 11/15/23 | 2 | 1,594 | ||||||||||||
Government National Mortgage Assoc. | 7.000 | 11/15/23 | — | (r) | 500 | |||||||||||
Government National Mortgage Assoc. | 7.000 | 11/15/23 | 3 | 2,822 | ||||||||||||
Government National Mortgage Assoc. | 7.000 | 11/15/23 | 2 | 1,607 | ||||||||||||
Government National Mortgage Assoc. | 7.000 | 11/15/23 | 4 | 3,893 | ||||||||||||
Government National Mortgage Assoc. | 7.000 | 11/15/23 | 8 | 8,419 | ||||||||||||
Government National Mortgage Assoc. | 7.000 | 11/15/23 | 5 | 5,289 | ||||||||||||
Government National Mortgage Assoc. | 7.000 | 11/15/23 | 5 | 4,986 | ||||||||||||
Government National Mortgage Assoc. | 7.000 | 11/15/23 | 7 | 7,596 | ||||||||||||
Government National Mortgage Assoc. | 7.000 | 11/15/23 | 10 | 11,014 | ||||||||||||
Government National Mortgage Assoc. | 7.000 | 11/15/23 | 2 | 1,951 | ||||||||||||
Government National Mortgage Assoc. | 7.000 | 11/15/23 | 2 | 1,814 | ||||||||||||
Government National Mortgage Assoc. | 7.000 | 11/15/23 | 1 | 1,203 | ||||||||||||
Government National Mortgage Assoc. | 7.000 | 11/15/23 | 10 | 10,319 | ||||||||||||
Government National Mortgage Assoc. | 7.000 | 12/15/23 | 4 | 4,511 | ||||||||||||
Government National Mortgage Assoc. | 7.000 | 12/15/23 | 5 | 5,082 | ||||||||||||
Government National Mortgage Assoc. | 7.000 | 12/15/23 | 18 | 19,243 | ||||||||||||
Government National Mortgage Assoc. | 7.000 | 12/15/23 | 27 | 27,964 | ||||||||||||
Government National Mortgage Assoc. | 7.000 | 12/15/23 | 1 | 1,111 | ||||||||||||
See Notes to Financial Statements.
| 28 |
Description | Interest Rate | Maturity Date | Principal Amount (000)# | Value | ||||||||||||
U.S. GOVERNMENT AGENCY OBLIGATIONS (Continued) |
| |||||||||||||||
Government National Mortgage Assoc. | 7.000 | % | 12/15/23 | 4 | $ | 3,685 | ||||||||||
Government National Mortgage Assoc. | 7.000 | 12/15/23 | 4 | 4,245 | ||||||||||||
Government National Mortgage Assoc. | 7.000 | 12/15/23 | 17 | 16,871 | ||||||||||||
Government National Mortgage Assoc. | 7.000 | 12/15/23 | 2 | 1,691 | ||||||||||||
Government National Mortgage Assoc. | 7.000 | 12/15/23 | 1 | 1,284 | ||||||||||||
Government National Mortgage Assoc. | 7.000 | 12/15/23 | 2 | 1,517 | ||||||||||||
Government National Mortgage Assoc. | 7.000 | 12/15/23 | 3 | 2,603 | ||||||||||||
Government National Mortgage Assoc. | 7.000 | 12/15/23 | 6 | 5,856 | ||||||||||||
Government National Mortgage Assoc. | 7.000 | 12/15/23 | 4 | 3,805 | ||||||||||||
Government National Mortgage Assoc. | 7.000 | 12/15/23 | 11 | 11,192 | ||||||||||||
Government National Mortgage Assoc. | 7.000 | 12/15/23 | 1 | 1,458 | ||||||||||||
Government National Mortgage Assoc. | 7.000 | 12/15/23 | 1 | 707 | ||||||||||||
Government National Mortgage Assoc. | 7.000 | 12/15/23 | 1 | 910 | ||||||||||||
Government National Mortgage Assoc. | 7.000 | 12/15/23 | 5 | 5,184 | ||||||||||||
Government National Mortgage Assoc. | 7.000 | 12/15/23 | 7 | 7,289 | ||||||||||||
Government National Mortgage Assoc. | 7.000 | 12/15/23 | 6 | 5,749 | ||||||||||||
Government National Mortgage Assoc. | 7.000 | 12/15/23 | 1 | 524 | ||||||||||||
Government National Mortgage Assoc. | 7.000 | 12/15/23 | 9 | 8,782 | ||||||||||||
Government National Mortgage Assoc. | 7.000 | 12/15/23 | 2 | 1,901 | ||||||||||||
Government National Mortgage Assoc. | 7.000 | 12/15/23 | 1 | 1,011 | ||||||||||||
Government National Mortgage Assoc. | 7.000 | 12/15/23 | 1 | 1,227 | ||||||||||||
Government National Mortgage Assoc. | 7.000 | 12/15/23 | 2 | 1,872 | ||||||||||||
Government National Mortgage Assoc. | 7.000 | 12/15/23 | 3 | 2,970 | ||||||||||||
Government National Mortgage Assoc. | 7.000 | 12/15/23 | 3 | 2,921 | ||||||||||||
Government National Mortgage Assoc. | 7.000 | 12/15/23 | 5 | 5,058 | ||||||||||||
Government National Mortgage Assoc. | 7.000 | 12/15/23 | 9 | 9,091 | ||||||||||||
Government National Mortgage Assoc. | 7.000 | 12/15/23 | 6 | 6,512 | ||||||||||||
Government National Mortgage Assoc. | 7.000 | 01/15/24 | 1 | 1,092 | ||||||||||||
Government National Mortgage Assoc. | 7.000 | 01/15/24 | 2 | 1,616 | ||||||||||||
Government National Mortgage Assoc. | 7.000 | 01/15/24 | 1 | 1,319 | ||||||||||||
Government National Mortgage Assoc. | 7.000 | 01/15/24 | 5 | 4,729 | ||||||||||||
Government National Mortgage Assoc. | 7.000 | 01/15/24 | 3 | 2,939 | ||||||||||||
Government National Mortgage Assoc. | 7.000 | 01/15/24 | 5 | 5,451 | ||||||||||||
Government National Mortgage Assoc. | 7.000 | 01/15/24 | 1 | 1,524 | ||||||||||||
Government National Mortgage Assoc. | 7.000 | 01/15/24 | — | (r) | 425 | |||||||||||
Government National Mortgage Assoc. | 7.000 | 01/15/24 | 2 | 2,107 | ||||||||||||
Government National Mortgage Assoc. | 7.000 | 01/15/24 | 3 | 2,631 | ||||||||||||
Government National Mortgage Assoc. | 7.000 | 01/15/24 | 3 | 3,120 | ||||||||||||
Government National Mortgage Assoc. | 7.000 | 01/15/24 | 8 | 8,234 | ||||||||||||
Government National Mortgage Assoc. | 7.000 | 01/15/24 | 5 | 4,821 | ||||||||||||
Government National Mortgage Assoc. | 7.000 | 02/15/24 | 13 | 13,260 | ||||||||||||
Government National Mortgage Assoc. | 7.000 | 02/15/24 | 1 | 727 | ||||||||||||
Government National Mortgage Assoc. | 7.000 | 02/15/24 | 2 | 2,206 | ||||||||||||
See Notes to Financial Statements.
| Prudential Government Income Fund | 29 |
Schedule of Investments (continued)
as of February 28, 2018
Description | Interest Rate | Maturity Date | Principal Amount (000)# | Value | ||||||||||||
U.S. GOVERNMENT AGENCY OBLIGATIONS (Continued) |
| |||||||||||||||
Government National Mortgage Assoc. | 7.000 | % | 02/15/24 | 4 | $ | 4,074 | ||||||||||
Government National Mortgage Assoc. | 7.000 | 02/15/24 | 2 | 1,905 | ||||||||||||
Government National Mortgage Assoc. | 7.000 | 02/15/24 | 1 | 854 | ||||||||||||
Government National Mortgage Assoc. | 7.000 | 02/15/24 | — | (r) | 466 | |||||||||||
Government National Mortgage Assoc. | 7.000 | 03/15/24 | 2 | 1,619 | ||||||||||||
Government National Mortgage Assoc. | 7.000 | 03/15/24 | 3 | 3,453 | ||||||||||||
Government National Mortgage Assoc. | 7.000 | 03/15/24 | 2 | 1,923 | ||||||||||||
Government National Mortgage Assoc. | 7.000 | 03/15/24 | 1 | 1,423 | ||||||||||||
Government National Mortgage Assoc. | 7.000 | 03/15/24 | — | (r) | 128 | |||||||||||
Government National Mortgage Assoc. | 7.000 | 03/15/24 | — | (r) | 32 | |||||||||||
Government National Mortgage Assoc. | 7.000 | 03/15/24 | 1 | 989 | ||||||||||||
Government National Mortgage Assoc. | 7.000 | 04/15/24 | 1 | 878 | ||||||||||||
Government National Mortgage Assoc. | 7.000 | 04/15/24 | 4 | 3,697 | ||||||||||||
Government National Mortgage Assoc. | 7.000 | 04/15/24 | 2 | 2,670 | ||||||||||||
Government National Mortgage Assoc. | 7.000 | 04/15/24 | 1 | 1,229 | ||||||||||||
Government National Mortgage Assoc. | 7.000 | 04/15/24 | 2 | 2,271 | ||||||||||||
Government National Mortgage Assoc. | 7.000 | 04/15/24 | 1 | 873 | ||||||||||||
Government National Mortgage Assoc. | 7.000 | 04/15/24 | 8 | 7,549 | ||||||||||||
Government National Mortgage Assoc. | 7.000 | 04/15/24 | 12 | 12,253 | ||||||||||||
Government National Mortgage Assoc. | 7.000 | 04/15/24 | 2 | 2,442 | ||||||||||||
Government National Mortgage Assoc. | 7.000 | 04/15/24 | 1 | 725 | ||||||||||||
Government National Mortgage Assoc. | 7.000 | 04/15/24 | 1 | 904 | ||||||||||||
Government National Mortgage Assoc. | 7.000 | 04/15/24 | 2 | 1,787 | ||||||||||||
Government National Mortgage Assoc. | 7.000 | 04/15/24 | — | (r) | 313 | |||||||||||
Government National Mortgage Assoc. | 7.000 | 04/15/24 | 1 | 591 | ||||||||||||
Government National Mortgage Assoc. | 7.000 | 04/15/24 | 5 | 5,169 | ||||||||||||
Government National Mortgage Assoc. | 7.000 | 04/15/24 | 3 | 2,912 | ||||||||||||
Government National Mortgage Assoc. | 7.000 | 05/15/24 | 5 | 4,968 | ||||||||||||
Government National Mortgage Assoc. | 7.000 | 05/15/24 | 2 | 2,553 | ||||||||||||
Government National Mortgage Assoc. | 7.000 | 05/15/24 | 8 | 7,690 | ||||||||||||
Government National Mortgage Assoc. | 7.000 | 05/15/24 | 5 | 5,070 | ||||||||||||
Government National Mortgage Assoc. | 7.000 | 05/15/24 | 3 | 3,188 | ||||||||||||
Government National Mortgage Assoc. | 7.000 | 05/15/24 | 4 | 4,281 | ||||||||||||
Government National Mortgage Assoc. | 7.000 | 05/15/24 | 3 | 2,546 | ||||||||||||
Government National Mortgage Assoc. | 7.000 | 05/15/24 | 8 | 8,233 | ||||||||||||
Government National Mortgage Assoc. | 7.000 | 05/15/24 | 2 | 1,926 | ||||||||||||
Government National Mortgage Assoc. | 7.000 | 05/15/24 | 11 | 11,238 | ||||||||||||
Government National Mortgage Assoc. | 7.000 | 05/15/24 | — | (r) | 306 | |||||||||||
Government National Mortgage Assoc. | 7.000 | 05/15/24 | 1 | 802 | ||||||||||||
Government National Mortgage Assoc. | 7.000 | 06/15/24 | — | (r) | 513 | |||||||||||
Government National Mortgage Assoc. | 7.000 | 06/15/24 | 1 | 1,318 | ||||||||||||
Government National Mortgage Assoc. | 7.000 | 06/15/24 | 2 | 1,888 | ||||||||||||
Government National Mortgage Assoc. | 7.000 | 06/15/24 | 8 | 7,906 | ||||||||||||
See Notes to Financial Statements.
| 30 |
Description | Interest Rate | Maturity Date | Principal Amount (000)# | Value | ||||||||||||
U.S. GOVERNMENT AGENCY OBLIGATIONS (Continued) |
| |||||||||||||||
Government National Mortgage Assoc. | 7.000 | % | 06/15/24 | 7 | $ | 7,322 | ||||||||||
Government National Mortgage Assoc. | 7.000 | 06/15/24 | 3 | 3,498 | ||||||||||||
Government National Mortgage Assoc. | 7.000 | 06/15/24 | 11 | 11,178 | ||||||||||||
Government National Mortgage Assoc. | 7.000 | 06/15/24 | 4 | 4,215 | ||||||||||||
Government National Mortgage Assoc. | 7.000 | 06/15/24 | 6 | 6,236 | ||||||||||||
Government National Mortgage Assoc. | 7.000 | 06/15/24 | — | (r) | 506 | |||||||||||
Government National Mortgage Assoc. | 7.000 | 07/15/24 | 3 | 3,282 | ||||||||||||
Government National Mortgage Assoc. | 7.000 | 07/15/24 | 2 | 1,935 | ||||||||||||
Government National Mortgage Assoc. | 7.000 | 10/15/24 | 10 | 10,072 | ||||||||||||
Government National Mortgage Assoc. | 7.000 | 02/15/29 | 7 | 7,294 | ||||||||||||
Government National Mortgage Assoc. | 7.500 | 01/15/23 | — | (r) | 169 | |||||||||||
Government National Mortgage Assoc. | 7.500 | 01/15/23 | — | (r) | 429 | |||||||||||
Government National Mortgage Assoc. | 7.500 | 03/15/23 | 1 | 1,193 | ||||||||||||
Government National Mortgage Assoc. | 7.500 | 05/15/23 | 6 | 6,731 | ||||||||||||
Government National Mortgage Assoc. | 7.500 | 05/15/23 | 1 | 806 | ||||||||||||
Government National Mortgage Assoc. | 7.500 | 06/15/23 | — | (r) | 414 | |||||||||||
Government National Mortgage Assoc. | 7.500 | 07/15/23 | — | (r) | 214 | |||||||||||
Government National Mortgage Assoc. | 7.500 | 07/15/23 | — | (r) | 256 | |||||||||||
Government National Mortgage Assoc. | 7.500 | 09/15/23 | 3 | 3,274 | ||||||||||||
Government National Mortgage Assoc. | 7.500 | 10/15/23 | 10 | 10,610 | ||||||||||||
Government National Mortgage Assoc. | 7.500 | 10/15/23 | 4 | 4,397 | ||||||||||||
Government National Mortgage Assoc. | 7.500 | 11/15/23 | 10 | 11,017 | ||||||||||||
Government National Mortgage Assoc. | 7.500 | 11/15/23 | 1 | 836 | ||||||||||||
Government National Mortgage Assoc. | 7.500 | 12/15/23 | 3 | 3,248 | ||||||||||||
Government National Mortgage Assoc. | 7.500 | 12/15/23 | 1 | 770 | ||||||||||||
Government National Mortgage Assoc. | 7.500 | 01/15/24 | 2 | 2,005 | ||||||||||||
Government National Mortgage Assoc. | 7.500 | 01/15/24 | 3 | 2,985 | ||||||||||||
Government National Mortgage Assoc. | 7.500 | 01/15/24 | — | (r) | 443 | |||||||||||
Government National Mortgage Assoc. | 7.500 | 01/15/24 | 15 | 15,505 | ||||||||||||
Government National Mortgage Assoc. | 7.500 | 01/15/24 | 14 | 14,883 | ||||||||||||
Government National Mortgage Assoc. | 7.500 | 01/15/24 | 3 | 3,624 | ||||||||||||
Government National Mortgage Assoc. | 7.500 | 02/15/24 | 1 | 1,123 | ||||||||||||
Government National Mortgage Assoc. | 7.500 | 02/15/24 | 13 | 13,762 | ||||||||||||
Government National Mortgage Assoc. | 7.500 | 03/15/24 | 1 | 782 | ||||||||||||
Government National Mortgage Assoc. | 7.500 | 03/15/24 | 2 | 1,504 | ||||||||||||
Government National Mortgage Assoc. | 7.500 | 03/15/24 | 4 | 3,664 | ||||||||||||
Government National Mortgage Assoc. | 7.500 | 04/15/24 | 3 | 2,956 | ||||||||||||
Government National Mortgage Assoc. | 7.500 | 04/15/24 | 7 | 7,177 | ||||||||||||
Government National Mortgage Assoc. | 7.500 | 04/15/24 | 3 | 3,198 | ||||||||||||
Government National Mortgage Assoc. | 7.500 | 05/15/24 | 2 | 1,996 | ||||||||||||
Government National Mortgage Assoc. | 7.500 | 05/15/24 | 1 | 763 | ||||||||||||
Government National Mortgage Assoc. | 7.500 | 05/15/24 | 1 | 1,395 | ||||||||||||
Government National Mortgage Assoc. | 7.500 | 06/15/24 | 6 | 6,174 | ||||||||||||
See Notes to Financial Statements.
| Prudential Government Income Fund | 31 |
Schedule of Investments (continued)
as of February 28, 2018
Description | Interest Rate | Maturity Date | Principal Amount (000)# | Value | ||||||||||||
U.S. GOVERNMENT AGENCY OBLIGATIONS (Continued) |
| |||||||||||||||
Government National Mortgage Assoc. | 7.500 | % | 06/15/24 | 1 | $ | 1,489 | ||||||||||
Government National Mortgage Assoc. | 7.500 | 06/15/24 | 3 | 3,025 | ||||||||||||
Government National Mortgage Assoc. | 7.500 | 06/15/24 | 4 | 4,580 | ||||||||||||
Government National Mortgage Assoc. | 7.500 | 07/15/24 | 14 | 13,732 | ||||||||||||
Government National Mortgage Assoc. | 7.500 | 07/15/24 | 6 | 5,855 | ||||||||||||
Government National Mortgage Assoc. | 8.500 | 04/15/25 | 154 | 174,019 | ||||||||||||
Government National Mortgage Assoc. | 9.500 | 08/20/20 | — | (r) | 53 | |||||||||||
Government National Mortgage Assoc. | 9.500 | 07/20/21 | — | (r) | 27 | |||||||||||
Government National Mortgage Assoc. | 9.500 | 08/20/21 | 5 | 5,270 | ||||||||||||
Hashemite Kingdom of Jordan, USAID Bond, U.S. Gov’t. Gtd. Notes | 3.000 | 06/30/25 | 2,269 | 2,277,115 | ||||||||||||
Israel Government, USAID Bond, U.S. Gov’t. Gtd. Notes | 5.500 | 09/18/23 | 2,700 | 3,064,556 | ||||||||||||
Residual Funding Corp. Strips Principal, | ||||||||||||||||
Unsec’d. Notes, PO | 1.605 | (s) | 01/15/21 | 3,548 | 3,302,749 | |||||||||||
Unsec’d. Notes, PO | 2.862 | (s) | 01/15/30 | 1,260 | 850,862 | |||||||||||
Unsec’d. Notes, PO | 3.099 | (s) | 04/15/30 | 2,915 | 1,949,429 | �� | ||||||||||
Tennessee Valley Authority, | ||||||||||||||||
Sr. Unsec’d. Notes | 2.875 | 02/01/27 | 335 | 329,451 | ||||||||||||
Sr. Unsec’d. Notes | 6.750 | 11/01/25 | 1,300 | 1,638,737 | ||||||||||||
Sr. Unsec’d. Notes | 7.125 | 05/01/30 | 1,170 | 1,617,068 | ||||||||||||
|
| |||||||||||||||
TOTAL U.S. GOVERNMENT AGENCY OBLIGATIONS | 182,973,416 | |||||||||||||||
|
| |||||||||||||||
U.S. TREASURY OBLIGATIONS 33.8% | ||||||||||||||||
U.S. Treasury Bonds | 2.500 | 02/15/45 | 2,120 | 1,876,862 | ||||||||||||
U.S. Treasury Bonds | 2.750 | 08/15/47 | 2,080 | 1,926,762 | ||||||||||||
U.S. Treasury Bonds | 2.875 | 05/15/43 | 250 | 239,443 | ||||||||||||
U.S. Treasury Bonds | 2.875 | 08/15/45 | 1,565 | 1,491,824 | ||||||||||||
U.S. Treasury Bonds | 2.875 | 11/15/46 | 440 | 418,516 | ||||||||||||
U.S. Treasury Bonds | 3.000 | 11/15/44 | 900 | 879,574 | ||||||||||||
U.S. Treasury Bonds | 3.000 | 05/15/45 | 5,240 | 5,118,825 | ||||||||||||
U.S. Treasury Bonds | 3.000 | 02/15/47 | 245 | 238,894 | ||||||||||||
U.S. Treasury Bonds | 3.000 | 05/15/47 | 1,800 | 1,754,297 | ||||||||||||
U.S. Treasury Bonds | 3.625 | 08/15/43 | 1,780 | 1,939,087 | ||||||||||||
U.S. Treasury Bonds | 3.750 | 11/15/43 | 215 | 238,986 | ||||||||||||
U.S. Treasury Bonds | 4.750 | 02/15/41 | 735 | 937,010 | ||||||||||||
U.S. Treasury Notes | 1.625 | 04/30/23 | 6,605 | 6,270,880 | ||||||||||||
U.S. Treasury Notes | 1.750 | 03/31/22 | 2,475 | 2,395,819 | ||||||||||||
U.S. Treasury Notes | 1.875 | 04/30/22 | 15,233 | 14,798,622 | ||||||||||||
U.S. Treasury Notes(k) | 2.000 | 11/30/22 | 3,050 | 2,963,027 | ||||||||||||
U.S. Treasury Notes | 2.000 | 06/30/24 | 4,795 | 4,580,911 | ||||||||||||
U.S. Treasury Notes | 2.125 | 06/30/21 | 3,820 | 3,775,384 | ||||||||||||
U.S. Treasury Notes | 2.125 | 09/30/21 | 20,060 | 19,781,824 | ||||||||||||
See Notes to Financial Statements.
| 32 |
Description | Interest Rate | Maturity Date | Principal Amount (000)# | Value | ||||||||||||
U.S. TREASURY OBLIGATIONS (Continued) |
| |||||||||||||||
U.S. Treasury Notes | 2.125 | % | 06/30/22 | 4,040 | $ | 3,961,252 | ||||||||||
U.S. Treasury Notes | 2.125 | 02/29/24 | 6,945 | 6,705,452 | ||||||||||||
U.S. Treasury Notes | 2.125 | 05/15/25 | 17,110 | 16,334,035 | ||||||||||||
U.S. Treasury Notes | 2.250 | 12/31/23 | 13,900 | 13,539,469 | ||||||||||||
U.S. Treasury Notes | 2.250 | 12/31/24 | 3,485 | 3,366,020 | ||||||||||||
U.S. Treasury Notes | 2.250 | 02/15/27 | 2,810 | 2,669,500 | ||||||||||||
U.S. Treasury Notes | 2.375 | 01/31/23 | 85 | 83,918 | ||||||||||||
U.S. Treasury Notes | 2.625 | 02/28/23 | 3,632 | 3,627,460 | ||||||||||||
U.S. Treasury Notes | 2.750 | 02/28/25 | 2,641 | 2,632,128 | ||||||||||||
U.S. Treasury Strips Coupon | 1.881 | (s) | 05/15/31 | 1,100 | 733,399 | |||||||||||
U.S. Treasury Strips Coupon | 1.898 | (s) | 08/15/29 | 1,100 | 778,087 | |||||||||||
U.S. Treasury Strips Coupon | 2.037 | (s) | 02/15/24 | 1,365 | 1,155,451 | |||||||||||
U.S. Treasury Strips Coupon | 2.100 | (s) | 11/15/35 | 2,200 | 1,262,838 | |||||||||||
U.S. Treasury Strips Coupon | 2.184 | (s) | 02/15/28 | 695 | 515,869 | |||||||||||
U.S. Treasury Strips Coupon | 2.241 | (s) | 05/15/28 | 345 | 253,912 | |||||||||||
U.S. Treasury Strips Coupon | 2.264 | (s) | 08/15/40 | 2,200 | 1,088,171 | |||||||||||
U.S. Treasury Strips Coupon | 2.280 | (s) | 02/15/29 | 345 | 247,975 | |||||||||||
U.S. Treasury Strips Coupon | 2.384 | (s) | 05/15/29 | 710 | 506,079 | |||||||||||
U.S. Treasury Strips Coupon | 2.404 | (s) | 08/15/21 | 3,185 | 2,920,408 | |||||||||||
U.S. Treasury Strips Coupon | 2.499 | (s) | 02/15/22 | 1,675 | 1,510,550 | |||||||||||
U.S. Treasury Strips Coupon(k) | 3.076 | (s) | 08/15/24 | 6,700 | 5,583,963 | |||||||||||
U.S. Treasury Strips Principal, PO | 2.543 | (s) | 02/15/45 | 1,365 | 584,562 | |||||||||||
U.S. Treasury Strips Principal, PO | 2.620 | (s) | 05/15/43 | 1,140 | 516,675 | |||||||||||
U.S. Treasury Strips Principal, PO | 2.873 | (s) | 05/15/45 | 2,470 | 1,050,676 | |||||||||||
U.S. Treasury Strips Principal, PO | 2.993 | (s) | 11/15/43 | 440 | 196,208 | |||||||||||
U.S. Treasury Strips Principal, PO | 3.005 | (s) | 11/15/44 | 1,045 | 451,585 | |||||||||||
U.S. Treasury Strips Principal, PO | 3.626 | (s) | 05/15/44 | 2,865 | 1,258,301 | |||||||||||
|
| |||||||||||||||
TOTAL U.S. TREASURY OBLIGATIONS | 145,160,490 | |||||||||||||||
|
| |||||||||||||||
TOTAL LONG-TERM INVESTMENTS | 428,184,455 | |||||||||||||||
|
| |||||||||||||||
Shares | ||||||||||||||||
SHORT-TERM INVESTMENT 3.4% | ||||||||||||||||
AFFILIATED MUTUAL FUND | ||||||||||||||||
Prudential Investment Portfolios 2 - Prudential Core Ultra Short Bond Fund | 14,788,490 | 14,788,490 | ||||||||||||||
|
| |||||||||||||||
TOTAL INVESTMENTS 103.1% |
| 442,972,945 | ||||||||||||||
Liabilities in excess of other assets(z) (3.1)% | (13,510,696 | ) | ||||||||||||||
|
| |||||||||||||||
NET ASSETS 100.0% | $ | 429,462,249 | ||||||||||||||
|
| |||||||||||||||
See Notes to Financial Statements.
| Prudential Government Income Fund | 33 |
Schedule of Investments (continued)
as of February 28, 2018
The following abbreviations are used in the annual report:
144A—Security was purchased pursuant to Rule 144A under the Securities Act of 1933 and may not be resold subject to that rule except to qualified institutional buyers. Unless otherwise noted, 144A securities are deemed to be liquid.
A—Annual payment frequency for swaps
S—Semiannual payment frequency for swaps
Q—Quarterly payment frequency for swaps
T—Swap payment upon termination
ACES—Alternative Credit Enhancements Securities
BABs—Build America Bonds
bps—Basis Points
CLO—Collateralized Loan Obligation
FHLMC—Federal Home Loan Mortgage Corp.
FICO—Financing Corp.
IO—Interest Only
L2—Level 2
L3—Level 3
LIBOR—London Interbank Offered Rate
MTN—Medium Term Note
OTC—Over-the-counter
PO—Principal Only
REMICS—Real Estate Mortgage Investment Conduit Security
Strips—Separate Trading of Registered Interest and Principal of Securities
TBA—To Be Announced
USAID—United States Agency for International Development
USOIS—United States Overnight Index Swap
| # | Principal amount is shown in U.S. dollars unless otherwise stated. |
| (c) | Variable rate instrument. The interest rate shown reflects the rate in effect at February 28, 2018. |
| (cc) | Variable rate instrument. The rate shown is based on the latest available information as of February 28, 2018. Certain variable rate securities are not based on a published reference rate and spread but are determined by the issuer or agent and are based on current market conditions. These securities do not indicate a reference rate and spread in their description. |
| (f) | Indicates a restricted security; the original cost of such security is $1,250,000. The value of $1,252,555 is approximately 0.3% of net assets. |
| (k) | Represents security, or a portion thereof, segregated as collateral for centrally cleared/exchange-traded derivatives. |
| (r) | Principal or notional amount is less than $500 par. |
| (s) | Represents zero coupon bond or principal only securities. Rate represents yield to maturity at purchase date. |
| (w) | PGIM Investments LLC, the manager of the Fund also serves as manager of the Prudential Investment Portfolios 2 - Prudential Core Ultra Short Bond Fund. |
| (z) | Includes net unrealized appreciation (depreciation) on the following derivative contracts held at reporting period end: |
See Notes to Financial Statements.
| 34 |
Futures contracts outstanding at February 28, 2018:
| Number of Contracts | Type | Expiration Date | Value at Trade Date | Current Notional Amount | Value / Unrealized Appreciation (Depreciation) | |||||||||||||||
| Long Positions: | ||||||||||||||||||||
| 646 | 2 Year U.S. Treasury Notes | Jun. 2018 | $ | 137,234,892 | $ | 137,254,813 | $ | 19,921 | ||||||||||||
| 462 | 5 Year U.S. Treasury Notes | Jun. 2018 | 52,625,322 | 52,635,516 | 10,194 | |||||||||||||||
| 436 | 10 Year U.S. Treasury Notes | Jun. 2018 | 52,367,720 | 52,340,438 | (27,282 | ) | ||||||||||||||
| 121 | 30 Year U.S. Ultra Treasury Bonds | Jun. 2018 | 18,642,907 | 18,860,875 | 217,968 | |||||||||||||||
|
| |||||||||||||||||||
| 220,801 | ||||||||||||||||||||
|
| |||||||||||||||||||
| Short Positions: | ||||||||||||||||||||
| 229 | 90 day Euro Dollar | Dec. 2018 | 56,136,013 | 55,801,575 | 334,438 | |||||||||||||||
| 50 | 10 Year U.S. Ultra Treasury Notes | Jun. 2018 | 6,400,312 | 6,403,125 | (2,813 | ) | ||||||||||||||
| 164 | 20 Year U.S. Treasury Bonds | Jun. 2018 | 23,440,287 | 23,523,750 | (83,463 | ) | ||||||||||||||
|
| |||||||||||||||||||
| 248,162 | ||||||||||||||||||||
|
| |||||||||||||||||||
| $ | 468,963 | |||||||||||||||||||
|
| |||||||||||||||||||
A security with a market value of $1,335,791 has been segregated with Citigroup Global Markets to cover requirement for open futures contracts at February 28, 2018.
Inflation Swap Agreements outstanding at February 28, 2018:
Notional Amount (000)# | Termination Date | Fixed | Floating Rate | Value at Trade Date | Value at February 28, 2018 | Unrealized Appreciation (Depreciation) | ||||||||||||||||
Centrally cleared swap agreements: | ||||||||||||||||||||||
| 1,050 | 10/25/27 | 2.160%(T) | U.S. CPI Urban Consumers NSA Index(2)(T) | $ | 24 | $ | (18,641 | ) | $ | (18,665 | ) | |||||||||||
|
|
|
|
|
| |||||||||||||||||
| (1) | The Fund pays the fixed rate and receives the floating rate. |
| (2) | The Fund pays the floating rate and receives the fixed rate. |
See Notes to Financial Statements.
| Prudential Government Income Fund | 35 |
Schedule of Investments (continued)
as of February 28, 2018
Interest rate swap agreements outstanding at February 28, 2018:
Notional Amount (000)# | Termination Date | Fixed Rate | Floating Rate | Value at Trade Date | Value at February 28, 2018 | Unrealized Appreciation (Depreciation) | ||||||||||||||||||
Centrally cleared swap agreements: | ||||||||||||||||||||||||
| 38,885 | 06/30/19 | 1.486%(A) | 1 Day USOIS(1)(A) | $ | (14,797 | ) | $ | 226,685 | $ | 241,482 | ||||||||||||||
| 8,820 | 06/30/19 | 1.502%(A) | 1 Day USOIS(1)(A) | (4,485 | ) | 48,999 | 53,484 | |||||||||||||||||
| 14,465 | 09/30/19 | 1.707%(A) | 1 Day USOIS(1)(A) | 4,073 | 69,672 | 65,599 | ||||||||||||||||||
| 20,905 | 12/31/19 | 1.840%(A) | 1 Day USOIS(1)(A) | 7,832 | 113,659 | 105,827 | ||||||||||||||||||
| 6,995 | 12/31/19 | 1.950%(A) | 1 Day USOIS(1)(A) | 1,724 | 24,829 | 23,105 | ||||||||||||||||||
| 2,115 | 12/31/19 | 2.040%(A) | 1 Day USOIS(1)(A) | 23 | 4,239 | 4,216 | ||||||||||||||||||
| 7,580 | 08/31/21 | 2.015%(S) | 3 Month LIBOR(2)(Q) | 62,254 | (173,793 | ) | (236,047 | ) | ||||||||||||||||
| 10,895 | 11/30/21 | 1.762%(S) | 3 Month LIBOR(2)(Q) | — | (322,974 | ) | (322,974 | ) | ||||||||||||||||
| 14,455 | 08/15/23 | 1.459%(S) | 3 Month LIBOR(1)(Q) | 716,971 | 965,806 | 248,835 | ||||||||||||||||||
| 1,385 | 11/15/23 | 2.209%(S) | 3 Month LIBOR(1)(Q) | 36 | 33,675 | 33,639 | ||||||||||||||||||
| 2,920 | 02/15/24 | 2.115%(S) | 3 Month LIBOR(1)(Q) | 7,402 | 107,617 | 100,215 | ||||||||||||||||||
| 5,496 | 02/15/24 | 2.151%(S) | 3 Month LIBOR(1)(Q) | (5,501 | ) | 191,571 | 197,072 | |||||||||||||||||
| 2,185 | 02/15/24 | 2.183%(S) | 3 Month LIBOR(1)(Q) | (4,754 | ) | 72,485 | 77,239 | |||||||||||||||||
| 1,865 | 08/15/24 | 2.168%(S) | 3 Month LIBOR(1)(Q) | — | 69,498 | 69,498 | ||||||||||||||||||
| 36,995 | 08/15/24 | 2.170%(S) | 3 Month LIBOR(1)(Q) | 43,752 | 1,374,867 | 1,331,115 | ||||||||||||||||||
| 6,770 | 08/15/24 | 2.176%(S) | 3 Month LIBOR(1)(Q) | 22,785 | 249,333 | 226,548 | ||||||||||||||||||
| 8,110 | 11/15/24 | 2.334%(S) | 3 Month LIBOR(1)(Q) | 21,190 | 239,823 | 218,633 | ||||||||||||||||||
| 6,650 | 02/12/25 | 2.408%(A) | 1 Day USOIS(1)(A) | — | 5,521 | 5,521 | ||||||||||||||||||
| 1,100 | 02/14/25 | —(3)(Q) | —(3)(Q) | — | 1,544 | 1,544 | ||||||||||||||||||
| 590 | 02/28/25 | 2.454%(A) | 1 Day USOIS(1)(A) | — | 533 | 533 | ||||||||||||||||||
| 2,920 | 09/04/25 | 2.214%(S) | 3 Month LIBOR(1)(Q) | 171 | 101,172 | 101,001 | ||||||||||||||||||
| 8,520 | 01/08/26 | 2.210%(S) | 3 Month LIBOR(1)(Q) | 93 | 371,022 | 370,929 | ||||||||||||||||||
| 115 | 05/15/26 | 1.652%(S) | 3 Month LIBOR(1)(Q) | 6 | 9,636 | 9,630 | ||||||||||||||||||
| 4,745 | 02/15/27 | 1.824%(A) | 1 Day USOIS(1)(A) | 53,761 | 246,142 | 192,381 | ||||||||||||||||||
| 1,575 | 02/15/27 | 1.899%(A) | 1 Day USOIS(1)(A) | 1,997 | 72,082 | 70,085 | ||||||||||||||||||
| 795 | 02/15/27 | 1.965%(A) | 1 Day USOIS(1)(A) | — | 32,129 | 32,129 | ||||||||||||||||||
| 2,625 | 02/15/27 | 2.067%(A) | 1 Day USOIS(1)(A) | (1,635 | ) | 84,128 | 85,763 | |||||||||||||||||
| 525 | 05/15/27 | 2.295%(S) | 3 Month LIBOR(1)(Q) | — | 22,774 | 22,774 | ||||||||||||||||||
| 4,650 | 02/15/36 | 2.338%(S) | 3 Month LIBOR(2)(Q) | (30,302 | ) | (417,478 | ) | (387,176 | ) | |||||||||||||||
| 145 | 11/15/43 | 2.659%(S) | 3 Month LIBOR(1)(Q) | — | 8,399 | 8,399 | ||||||||||||||||||
|
|
|
|
|
| |||||||||||||||||||
| $ | 882,596 | $ | 3,833,595 | $ | 2,950,999 | |||||||||||||||||||
|
|
|
|
|
| |||||||||||||||||||
A security with a market value of $3,196,194 has been segregated with Citigroup Global Markets to cover requirements for open centrally cleared swap contracts at February 28, 2018.
| (1) | The Fund pays the fixed rate and receives the floating rate. |
| (2) | The Fund pays the floating rate and receives the fixed rate. |
| (3) | The Fund pays quarterly the floating rate of 3 Month LIBOR and receives quarterly the floating rate of 1 Day USOIS plus 38.25bps. |
See Notes to Financial Statements.
| 36 |
Fair Value Measurements:
Various inputs are used in determining the value of the Fund’s investments. These inputs are summarized in the three broad levels listed below.
Level 1—unadjusted quoted prices generally in active markets for identical securities.
Level 2—quoted prices for similar securities, interest rates and yield curves, prepayment speeds, foreign currency exchange rates and other observable inputs.
Level 3—unobservable inputs for securities valued in accordance with Board approved fair valuation procedures.
The following is a summary of the inputs used as of February 28, 2018 in valuing such portfolio securities:
| Level 1 | Level 2 | Level 3 | ||||||||||
Investments in Securities | ||||||||||||
Asset-Backed Securities | ||||||||||||
Collateralized Loan Obligations | $ | — | $ | 21,745,990 | $ | — | ||||||
Small Business Loan | — | 88,842 | — | |||||||||
Commercial Mortgage-Backed Securities | — | 68,076,241 | — | |||||||||
Corporate Bonds | — | 8,625,252 | — | |||||||||
Municipal Bonds | — | 1,120,620 | — | |||||||||
Residential Mortgage-Backed Securities | — | 393,604 | — | |||||||||
U.S. Government Agency Obligations | — | 182,973,416 | — | |||||||||
U.S. Treasury Obligations | — | 145,160,490 | — | |||||||||
Affiliated Mutual Fund | 14,788,490 | — | — | |||||||||
Other Financial Instruments* | ||||||||||||
Futures Contracts | 468,963 | — | — | |||||||||
Centrally Cleared Inflation Swap Agreements | — | (18,665 | ) | — | ||||||||
Centrally Cleared Interest Rate Swap Agreements | — | 2,950,999 | — | |||||||||
|
|
|
|
|
| |||||||
Total | $ | 15,257,453 | $ | 431,116,789 | $ | — | ||||||
|
|
|
|
|
| |||||||
See Notes to Financial Statements.
| Prudential Government Income Fund | 37 |
Schedule of Investments (continued)
as of February 28, 2018
The following is a reconciliation of assets in which unobservable inputs (Level 3) were used in determining fair value:
| Asset-Backed Securities— Collateralized Loan Obligations | ||||
Balance as of 2/28/17 | $ | 4,997,500 | ||
Realized gain (loss) | — | |||
Change in unrealized appreciation (depreciation) | — | |||
Purchases/Exchanges/Issuances | — | |||
Sales/Paydowns | — | |||
Accrued discount/premium | — | |||
Transfers into Level 3 | — | |||
Transfers out of Level 3 | (4,997,500 | ) | ||
|
| |||
Balance as of 2/28/18 | $ | — | ||
|
| |||
| * | Other financial instruments are derivative instruments not reflected in the Schedule of Investments, such as futures, forwards and centrally cleared swap contracts, which are recorded at the unrealized appreciation (depreciation) on the instrument, and OTC swap contracts which are recorded at fair value. |
It is the Fund’s policy to recognize transfers in and transfers out at the fair value as of the beginning of year. Securities transferred levels as follows:
Investments in Securities | Amount Transferred | Level Transfer | Logic | |||||||
Asset-Backed Securities—Collateralized Loan Obligations | $ | 4,997,500 | L3 to L2 | Single Broker Indicative Quote to Evaluated Bid | ||||||
Industry Classification:
The industry classification of investments and liabilities in excess of other assets shown as a percentage of net assets as of February 28, 2018 were as follows (unaudited):
U.S. Government Agency Obligations | 42.6 | % | ||
U.S. Treasury Obligations | 33.8 | |||
Commercial Mortgage-Backed Securities | 15.8 | |||
Collateralized Loan Obligations | 5.1 | |||
Affiliated Mutual Fund | 3.4 | |||
Diversified Financial Services | 2.0 | |||
Municipal Bonds | 0.3 | |||
Residential Mortgage-Backed Securities | 0.1 | % | ||
Small Business Loan | 0.0 | * | ||
|
| |||
| 103.1 | ||||
Liabilities in excess of other assets | (3.1 | ) | ||
|
| |||
| 100.0 | % | |||
|
|
| * | Less than +/- 0.05% |
See Notes to Financial Statements.
| 38 |
Effects of Derivative Instruments on the Financial Statements and Primary Underlying Risk Exposure:
The Fund invested in derivative instruments during the reporting period. The primary type of risk associated with these derivative instruments are interest rate contracts risk. The effect of such derivative instruments on the Fund’s financial position and financial performance as reflected in the Statement of Assets and Liabilities and Statement of Operations is presented in the summary below.
Fair values of derivative instruments as of February 28, 2018 as presented in the Statement of Assets and Liabilities:
Derivatives not accounted for as hedging instruments, carried at fair value | Asset Derivatives | Liability Derivatives | ||||||||||
Balance Sheet | Fair Value | Balance Sheet | Fair Value | |||||||||
| Interest rate contracts | Due from/to broker—variation margin futures | $ | 582,521 | * | Due from/to broker— variation margin futures | $ | 113,558 | * | ||||
| Interest rate contracts | Due from/to broker—variation margin swaps | 3,897,196 | * | Due from/to broker— variation margin swaps | 964,862 | * | ||||||
|
|
|
| |||||||||
Total | $ | 4,479,717 | $ | 1,078,420 | ||||||||
|
|
|
| |||||||||
| * | Includes cumulative appreciation (depreciation) as reported in the schedule of open futures and centrally cleared swap contracts. Only unsettled variation margin receivable (payable) is reported within the Statement of Assets and Liabilities. |
The effects of derivative instruments on the Statement of Operations for the year ended February 28, 2018 is as follows:
Amount of Realized Gain (Loss) on Derivatives Recognized in Income | ||||||||||||||||||||
Derivatives not accounted for as hedging instruments, carried at fair value | Options Purchased(1) | Options Written | Futures | Forward Rate Agreements | Swaps | |||||||||||||||
Interest rate contracts | $ | (593,097 | ) | $ | 513,179 | $ | (2,365,051 | ) | $ | 8,840 | $ | (78,915 | ) | |||||||
|
|
|
|
|
|
|
|
|
| |||||||||||
| (1) | Included in net realized gain (loss) on investment transactions in the Statement of Operations. |
See Notes to Financial Statements.
| Prudential Government Income Fund | 39 |
Schedule of Investments (continued)
as of February 28, 2018
Change in Unrealized Appreciation (Depreciation) on Derivatives Recognized in Income | ||||||||
Derivatives not accounted for as hedging instruments, carried at fair value | Futures | Swaps | ||||||
Interest rate contracts | $ | 402,374 | $ | 2,849,133 | ||||
|
|
|
| |||||
For the year ended February 28, 2018, the Fund’s average volume of derivative activities is as follows:
Options Purchased(1) | Options Written(2) | Futures Contracts— Long Positions(2) | Futures Contracts— Short Positions(2) | Forward Rate Agreements(3) | Interest Rate Swap Agreements(3) | Inflation Swaps(3) | ||||||||||||||||||||
| $ | 88,938 | $ | 220,000 | $ | 198,608,314 | $ | 64,430,091 | $ | 10,880,000 | $ | 305,162,600 | $ | 420,000 | |||||||||||||
| (1) | Cost. |
| (2) | Value at Trade Date. |
| (3) | Notional Amount in USD. |
See Notes to Financial Statements.
| 40 |
This Page Intentionally Left Blank
Statement of Assets & Liabilities
as of February 28, 2018
Assets | ||||
Investments at value: | ||||
Unaffiliated investments (cost $437,815,185) | $ | 428,184,455 | ||
Affiliated investments (cost $14,788,490) | 14,788,490 | |||
Cash | 415,170 | |||
Receivable for investments sold | 21,422,884 | |||
Dividends and interest receivable | 1,725,498 | |||
Receivable for Fund shares sold | 235,421 | |||
Due from broker—variation margin futures | 127,465 | |||
Prepaid expenses | 2,403 | |||
|
| |||
Total assets | 466,901,786 | |||
|
| |||
Liabilities | ||||
Payable for investments purchased | 36,235,606 | |||
Payable for Fund shares reacquired | 510,067 | |||
Due to broker—variation margin swaps | 184,566 | |||
Management fee payable | 161,566 | |||
Accrued expenses and other liabilities | 132,487 | |||
Dividends payable | 101,862 | |||
Distribution fee payable | 68,753 | |||
Affiliated transfer agent fee payable | 44,630 | |||
|
| |||
Total liabilities | 37,439,537 | |||
|
| |||
Net Assets | $ | 429,462,249 | ||
|
| |||
Net assets were comprised of: | ||||
Common stock, at par | $ | 462,702 | ||
Paid-in capital in excess of par | 441,072,970 | |||
|
| |||
| 441,535,672 | ||||
Undistributed net investment income | 457,004 | |||
Accumulated net realized loss on investment transactions | (6,298,956 | ) | ||
Net unrealized depreciation on investments | (6,231,471 | ) | ||
|
| |||
Net assets, February 28, 2018 | $ | 429,462,249 | ||
|
| |||
See Notes to Financial Statements.
| 42 |
Class A | ||||
Net asset value and redemption price per share | $ | 9.29 | ||
Maximum sales charge (4.50% of offering price) | 0.44 | |||
|
| |||
Maximum offering price to public | $ | 9.73 | ||
|
| |||
Class B | ||||
Net asset value, offering price and redemption price per share | $ | 9.30 | ||
|
| |||
Class C | ||||
Net asset value, offering price and redemption price per share | $ | 9.31 | ||
|
| |||
Class Q | ||||
Net asset value, offering price and redemption price per share | $ | 9.26 | ||
|
| |||
Class R | ||||
Net asset value, offering price and redemption price per share | $ | 9.30 | ||
|
| |||
Class Z | ||||
Net asset value, offering price and redemption price per share | $ | 9.27 | ||
|
| |||
See Notes to Financial Statements.
| Prudential Government Income Fund | 43 |
Statement of Operations
Year Ended February 28, 2018
Net Investment Income (Loss) | ||||
Income | ||||
Interest income | $ | 10,286,858 | ||
Affiliated dividend income | 589,823 | |||
Income from securities lending, net (including affiliated income of $92) | 148 | |||
|
| |||
Total income | 10,876,829 | |||
|
| |||
Expenses | ||||
Management fee | 2,351,586 | |||
Distribution fee(a) | 1,006,732 | |||
Transfer agent’s fees and expenses (including affiliated expense of $255,566)(a) | 792,526 | |||
Custodian and accounting fees | 145,061 | |||
Registration fees(a) | 104,587 | |||
Shareholders’ reports | 38,771 | |||
Audit fee | 36,614 | |||
Legal fees and expenses | 25,275 | |||
Directors’ fees | 17,367 | |||
Miscellaneous | 23,908 | |||
|
| |||
Total expenses | 4,542,427 | |||
Less: Fee waiver and/or expense reimbursement(a) | (6,694 | ) | ||
Distribution fee waiver(a) | (36,397 | ) | ||
|
| |||
Net expenses | 4,499,336 | |||
|
| |||
Net investment income (loss) | 6,377,493 | |||
|
| |||
Realized And Unrealized Gain (Loss) On Investments | ||||
Net realized gain (loss) on: | ||||
Investment transactions (including affiliated of $525,582) | (1,653,951 | ) | ||
Futures transactions | (2,365,051 | ) | ||
Options written transactions | 513,179 | |||
Forward rate agreement transactions | 8,840 | |||
Swap agreement transactions | (78,915 | ) | ||
|
| |||
| (3,575,898 | ) | |||
|
| |||
Net change in unrealized appreciation (depreciation) on: | ||||
Investments | (7,848,022 | ) | ||
Futures | 402,374 | |||
Swap agreements | 2,849,133 | |||
|
| |||
| (4,596,515 | ) | |||
|
| |||
Net gain (loss) on investment transactions | (8,172,413 | ) | ||
|
| |||
Net Increase (Decrease) In Net Assets Resulting From Operations | $ | (1,794,920 | ) | |
|
| |||
| (a) | Class specific expenses and waivers were as follows (see Note 1): |
| Class A | Class B | Class C | Class Q | Class R | Class Z | |||||||||||||||||||
Distribution fee | 782,039 | 14,973 | 100,529 | — | 109,191 | — | ||||||||||||||||||
Transfer agent’s fees and expenses | 581,450 | 3,551 | 17,385 | 25 | 26,904 | 163,211 | ||||||||||||||||||
Registration fees | 55,521 | 6,718 | 5,948 | 10,169 | 5,879 | 20,352 | ||||||||||||||||||
Fee waiver/or expense reimbursement | — | (6,694 | ) | — | — | — | — | |||||||||||||||||
Distribution fee waiver | — | — | — | — | (36,397 | ) | — | |||||||||||||||||
See Notes to Financial Statements.
| 44 |
Statements of Changes in Net Assets
| Year Ended February 28, | ||||||||
| 2018 | 2017 | |||||||
Increase (Decrease) in Net Assets | ||||||||
Operations | ||||||||
Net investment income (loss) | $ | 6,377,493 | $ | 5,435,323 | ||||
Net realized gain (loss) on investment transactions | (3,575,898 | ) | 4,165,077 | |||||
Net change in unrealized appreciation (depreciation) on investments | (4,596,515 | ) | (10,833,790 | ) | ||||
|
|
|
| |||||
Net increase (decrease) in net assets resulting from operations | (1,794,920 | ) | (1,233,390 | ) | ||||
|
|
|
| |||||
Dividends and Distributions | ||||||||
Dividends from net investment income | ||||||||
Class A | (5,155,183 | ) | (4,033,885 | ) | ||||
Class B | (12,479 | ) | (10,011 | ) | ||||
Class C | (86,388 | ) | (46,166 | ) | ||||
Class Q | (804,047 | ) | (157,500 | ) | ||||
Class R | (199,734 | ) | (144,069 | ) | ||||
Class Z | (1,766,595 | ) | (1,474,216 | ) | ||||
|
|
|
| |||||
| (8,024,426 | ) | (5,865,847 | ) | |||||
|
|
|
| |||||
Distributions from net realized gains | ||||||||
Class A | (1,607,061 | ) | (1,377,495 | ) | ||||
Class B | (8,284 | ) | (11,865 | ) | ||||
Class C | (52,194 | ) | (48,872 | ) | ||||
Class Q | (177,783 | ) | — | |||||
Class R | (73,887 | ) | (59,044 | ) | ||||
Class Z | (481,561 | ) | (407,057 | ) | ||||
|
|
|
| |||||
| (2,400,770 | ) | (1,904,333 | ) | |||||
|
|
|
| |||||
Fund share transactions (Net of share conversions) | ||||||||
Net proceeds from shares sold | 70,444,105 | 123,319,211 | ||||||
Net asset value of shares issued in reinvestment of dividends and distributions | 8,958,431 | 6,775,932 | ||||||
Cost of shares reacquired | (126,184,108 | ) | (143,557,282 | ) | ||||
|
|
|
| |||||
Net increase (decrease) in net assets from Fund share transactions | (46,781,572 | ) | (13,462,139 | ) | ||||
|
|
|
| |||||
Total increase (decrease) | (59,001,688 | ) | (22,465,709 | ) | ||||
Net Assets: | ||||||||
Beginning of year | 488,463,937 | 510,929,646 | ||||||
|
|
|
| |||||
End of year(a) | $ | 429,462,249 | $ | 488,463,937 | ||||
|
|
|
| |||||
(a) Includes undistributed/(distributions in excess of) net investment income of: | $ | 457,004 | $ | 366,954 | ||||
|
|
|
| |||||
See Notes to Financial Statements.
| Prudential Government Income Fund | 45 |
Notes to Financial Statements
Prudential Investment Portfolios, Inc. 14 (the “Company”) is registered under the Investment Company Act of 1940, as amended (“1940 Act”), as a diversified, open-end management investment company. The Company consists of two funds: Prudential Government Income Fund and Prudential Floating Rate Income Fund. These financial statements relate only to the Prudential Government Income Fund (the “Fund”).
The investment objective of the Fund is to seek high current return.
1. Accounting Policies
The Fund follows investment company accounting and reporting guidance of the Financial Accounting Standards Board (“FASB”) Accounting Standard Codification Topic 946 Financial Services—Investment Companies. The following accounting policies conform to U.S. generally accepted accounting principles. The Fund consistently follows such policies in the preparation of its financial statements.
Securities Valuation: The Fund holds securities and other assets and liabilities that are fair valued at the close of each day (generally, 4:00 PM Eastern time) the New York Stock Exchange (“NYSE”) is open for trading. Fair value is the price that would be received to sell an asset or paid to transfer a liability in an orderly transaction between market participants on the measurement date. The Board of Directors (the “Board”) has adopted valuation procedures for security valuation under which fair valuation responsibilities have been delegated to PGIM Investments LLC (“PGIM Investments” or “the Manager”). Under the current valuation procedures, the Valuation Committee is responsible for supervising the valuation of portfolio securities and other assets and liabilities. The valuation procedures permit the Fund to utilize independent pricing vendor services, quotations from market makers, and alternative valuation methods when market quotations are either not readily available or not deemed representative of fair value. A record of the Valuation Committee’s actions is subject to the Board’s review, approval, and ratification at its next regularly scheduled quarterly meeting.
Various inputs determine how the Fund’s investments are valued, all of which are categorized according to the three broad levels (Level 1, 2, or 3) detailed in the Schedule of Investments.
Derivative instruments, such as futures or options, that are traded on a national securities exchange are valued at the last sale price as of the close of trading on the applicable exchange where the security principally trades. Securities traded via NASDAQ are valued at the NASDAQ official closing price. To the extent these securities are valued at the last sale price or NASDAQ official closing price, they are classified as Level 1 in the fair value hierarchy. In the event that no sale or official closing price on valuation date exists, these securities are generally valued at the mean between the last reported bid and ask prices, or at the last bid price in the absence of an ask price. These securities are classified as Level 2 in the fair value hierarchy.
| 46 |
Investments in open-end, non-exchange-traded mutual funds are valued at their net asset values as of the close of the NYSE on the date of valuation. These securities are classified as Level 1 in the fair value hierarchy since they may be purchased or sold at their net asset values on the date of valuation.
Fixed income securities traded in the OTC market are generally classified as Level 2 in the fair value hierarchy. Such fixed income securities are typically valued using the market approach which generally involves obtaining data from an approved independent third-party vendor source. The Fund utilizes the market approach as the primary method to value securities when market prices of identical or comparable instruments are available. The third-party vendors’ valuation techniques used to derive the evaluated bid price are based on evaluating observable inputs, including but not limited to, yield curves, yield spreads, credit ratings, deal terms, tranche level attributes, default rates, cash flows, prepayment speeds, broker/dealer quotations and reported trades. Certain Level 3 securities are also valued using the market approach when obtaining a single broker quote or when utilizing transaction prices for identical securities that have been used in excess of five business days. During the reporting period, there were no changes to report with respect to the valuation approach and/or valuation techniques discussed above.
Centrally cleared swaps listed or traded on a multilateral or trade facility platform, such as a registered exchange, are generally valued at the daily settlement price determined by the respective exchange. These securities are classified as Level 2 in the fair value hierarchy, as the daily settlement price is not public.
Securities and other assets that cannot be priced according to the methods described above are valued based on pricing methodologies approved by the Board. In the event that unobservable inputs are used when determining such valuations, the securities will be classified as Level 3 in the fair value hierarchy.
When determining the fair value of securities, some of the factors influencing the valuation include: the nature of any restrictions on disposition of the securities; assessment of the general liquidity of the securities; the issuer’s financial condition and the markets in which it does business; the cost of the investment; the size of the holding and the capitalization of the issuer; the prices of any recent transactions or bids/offers for such securities or any comparable securities; any available analyst media or other reports or information deemed reliable by the Manager regarding the issuer or the markets or industry in which it operates. Using fair value to price securities may result in a value that is different from a security’s most recent closing price and from the price used by other unaffiliated mutual funds to calculate their net asset values.
Restricted and Illiquid Securities: Subject to guidelines adopted by the Board, the Fund may invest up to 15% of its net assets in illiquid securities, including those which are restricted as to disposition under securities law (“restricted securities”). Restricted securities are valued pursuant to the valuation procedures noted above. Illiquid securities are those that, because of the absence of a readily available market or due to legal or
| Prudential Government Income Fund | 47 |
Notes to Financial Statements (continued)
contractual restrictions on resale, cannot be sold within seven days in the ordinary course of business at approximately the amount at which the Fund has valued the investment. Therefore, the Fund may find it difficult to sell illiquid securities at the time considered most advantageous by its Subadviser and may incur transaction costs that would not be incurred in the sale of securities that were freely marketable. Certain securities that would otherwise be considered illiquid because of legal restrictions on resale to the general public may be traded among qualified institutional buyers under Rule 144A of the Securities Act of 1933. These Rule 144A securities, as well as commercial paper that is sold in private placements under Section 4(2) of the Securities Act, may be deemed liquid by the Fund’s Subadviser under the guidelines adopted by the Directors of the Fund. However, the liquidity of the Fund’s investments in Rule 144A securities could be impaired if trading does not develop or declines.
Options: The Fund purchased or wrote options in order to hedge against adverse market movements or fluctuations in value caused by changes in prevailing interest rates, value of equities or foreign currency exchange rates with respect to securities or financial instruments which the Fund currently owns or intends to purchase. The Fund may also use options to gain additional market exposure. The Fund’s principal reason for writing options is to realize, through receipt of premiums, a greater current return than would be realized on the underlying security alone. When the Fund purchases an option, it pays a premium and an amount equal to that premium is recorded as an asset. When the Fund writes an option, it receives a premium and an amount equal to that premium is recorded as a liability. The asset or liability is adjusted daily to reflect the current market value of the option. If an option expires unexercised, the Fund realizes a gain (loss) to the extent of the premium received or paid. If an option is exercised, the premium received or paid is recorded as an adjustment to the proceeds from the sale or the cost of the purchase in determining whether the Fund has realized a gain (loss). The difference between the premium and the amount received or paid at the closing of a purchase or sale transaction is also treated as a realized gain (loss). Gain (loss) on purchased options is included in net realized gain (loss) on investment transactions. Gain (loss) on written options is presented separately as net realized gain (loss) on options written transactions.
The Fund, as writer of an option, may have no control over whether the underlying securities or financial instruments may be sold (called) or purchased (put). As a result, the Fund bears the market risk of an unfavorable change in the price of the security or financial instrument underlying the written option. The Fund, as purchaser or an OTC option, bears the risk of the potential inability of the counterparties to meet the terms of their contracts. With exchange-traded options contracts, there is minimal counterparty credit risk to the Fund since the exchanges’ clearinghouse acts as counterparty to all exchange-traded options and guarantees the options contracts against default.
| 48 |
When the Fund writes an option on a swap, an amount equal to any premium received by the Fund is recorded as a liability and is subsequently adjusted to the current market value of the written option on the swap. If a call option on a swap is exercised, the Fund becomes obligated to pay a fixed interest rate (noted as the strike price) and receive a variable interest rate on a notional amount. If a put option on a swap is exercised, the Fund becomes obligated to pay a variable interest rate and receive a fixed interest rate (noted as the strike price) on a notional amount. Premiums received from writing options on swaps that expire or are exercised are treated as realized gains upon the expiration or exercise of such options on swaps. The risk associated with writing put and call options on swaps is that the Fund will be obligated to be party to a swap agreement if an option on a swap is exercised.
Financial Futures Contracts: A financial futures contract is an agreement to purchase (long) or sell (short) an agreed amount of securities at a set price for delivery on a future date. Upon entering into a financial futures contract, the Fund is required to pledge to the broker an amount of cash and/or other assets equal to a certain percentage of the contract amount. This amount is known as the “initial margin.” Subsequent payments, known as “variation margin,” are made or received by the Fund each day, depending on the daily fluctuations in the value of the underlying security. Such variation margin is recorded for financial statement purposes on a daily basis as unrealized gain (loss). When the contract expires or is closed, the gain (loss) is realized and is presented in the Statement of Operations as net realized gain (loss) on futures transactions.
The Fund invested in financial futures contracts in order to hedge its existing portfolio securities, or securities the Fund intends to purchase, against fluctuations in value caused by changes in prevailing interest rates. Should interest rates move unexpectedly, the Fund may not achieve the anticipated benefits of the financial futures contracts and may realize a loss. The use of futures transactions involves the risk of imperfect correlation in movements in the price of futures contracts, interest rates and the underlying hedged assets. Since futures contracts are exchange-traded, there is minimal counterparty credit risk to the Fund since the exchanges’ clearinghouse acts as counterparty to all exchange-traded futures and guarantees the futures contracts against default.
Forward Rate Agreements: Forward rate agreements represent an agreement between counterparties to exchange cash flows based on the difference between two interest rates, applied to a notional principal amount on a fixed future date. The Fund entered into forward rate agreements to gain yield exposure based on anticipated market conditions at the specified termination date of the agreement.
Swap Agreements: The Fund may enter into credit default, interest rate and other types of swap agreements. A swap agreement is an agreement to exchange the return generated by one instrument for the return generated by another instrument. Swap agreements are negotiated in the OTC market and may be executed either directly with counterparty (“OTC-traded”) or through a central clearing facility, such as a registered exchange. Swap agreements are valued daily at current market value and any change in value is included in the net unrealized appreciation (depreciation) on swap agreements. Centrally cleared
| Prudential Government Income Fund | 49 |
Notes to Financial Statements (continued)
swaps pay or receive an amount known as “variation margin”, based on daily changes in the valuation of the swap contract. Any upfront premiums paid and received are shown as swap premiums paid and swap premiums received in the Statement of Assets and Liabilities. Risk of loss may exceed amounts recognized on the Statement of Assets and Liabilities. Swap agreements outstanding at period end, if any, are listed on the Schedule of Investments.
Interest Rate Swaps: Interest rate swaps represent an agreement between counterparties to exchange cash flows based on the difference between two interest rates, applied to a notional principal amount for a specified period. The Fund is subject to interest rate risk exposure in the normal course of pursuing its investment objectives. The Fund used interest rate swaps to maintain its ability to generate steady cash flow by receiving a stream of fixed-rate payments and to increase exposure to prevailing market rates by receiving floating rate payments. The Fund’s maximum risk of loss from counterparty credit risk is the discounted net present value of the cash flows to be received from the counterparty over the contract’s remaining life.
Inflation Swaps: The Fund entered into inflation swap agreements to protect against fluctuations in inflation rates. Inflation swaps are characterized by one party paying a fixed rate in exchange for a floating rate that is derived from an inflation index, such as the Consumer Price Index or UK Retail Price Index. Inflation swaps subject the Fund to interest rate risk.
Master Netting Arrangements: The Fund is subject to various Master Agreements, or netting arrangements, with select counterparties. These are agreements which a subadviser may have negotiated and entered into on behalf of the Fund. A master netting arrangement between the Fund and the counterparty permits the Fund to offset amounts payable by the Fund to the same counterparty against amounts to be received; and by the receipt of collateral from the counterparty by the Fund to cover the Fund’s exposure to the counterparty. However, there is no assurance that such mitigating factors are easily enforceable. In addition to master netting arrangements, the right to set-off exists when all the conditions are met such that each of the parties owes the other determinable amounts, the reporting party has the right to set-off the amount owed with the amount owed by the other party, the reporting party intends to set-off and the right of set-off is enforceable by law. During the reporting period, there was no intention to settle on a net basis and all amounts are presented on a gross basis on the Statement of Assets and Liabilities.
The Company, on behalf of the Fund, is a party to ISDA (International Swaps and Derivatives Association, Inc.) Master Agreements with certain counterparties that govern OTC derivative and foreign exchange contracts entered into from time to time. The Master
| 50 |
Agreements may contain provisions regarding, among other things, the parties’ general obligations, representations, agreements, collateral requirements, events of default and early termination. With respect to certain counterparties, in accordance with the terms of the Master Agreements, collateral posted to the Fund is held in a segregated account by the Fund’s custodian and with respect to those amounts which can be sold or re-pledged, is presented in the Schedule of Investments. Collateral pledged by the Fund is segregated by the Fund’s custodian and identified in the Schedule of Investments. Collateral can be in the form of cash or debt securities issued by the U.S. Government or related agencies or other securities as agreed to by the Fund and the applicable counterparty. Collateral requirements are determined based on the Fund’s net position with each counterparty. Termination events applicable to the Fund may occur upon a decline in the Fund’s net assets below a specified threshold over a certain period of time. Termination events applicable to counterparties may occur upon a decline in the counterparty’s long-term and short-term credit ratings below a specified level. In each case, upon occurrence, the other party may elect to terminate early and cause settlement of all derivative and foreign exchange contracts outstanding, including the payment of any losses and costs resulting from such early termination, as reasonably determined by the terminating party. Any decision by one or more of the Fund’s counterparties to elect early termination could impact the Fund’s future derivative activity.
In addition to each instrument’s primary underlying risk exposure (e.g. interest rate, credit, equity or foreign exchange, etc.), swap agreements involve, to varying degrees, elements of credit, market and documentation risk. Such risks involve the possibility that no liquid market for these agreements will exist, the counterparty to the agreement may default on its obligation to perform or disagree on the contractual terms of the agreement, and changes in net interest rates will be unfavorable. In connection with these agreements, securities in the portfolio may be identified or received as collateral from the counterparty in accordance with the terms of the respective swap agreements to provide or receive assets of value and to serve as recourse in the event of default or bankruptcy/insolvency of either party. Such OTC derivative agreements include conditions which, when materialized, give the counterparty the right to cause an early termination of the transactions under those agreements. Any election by the counterparty for early termination of the contract(s) may impact the amounts reported on financial statements.
As of February 28, 2018, the Fund has not met conditions under such agreements which give the counterparty the right to call for an early termination.
Forward currency contracts, forward rate agreements, written options, short sales, swaps and financial futures contracts involve elements of both market and credit risk in excess of the amounts reflected on the Statement of Assets and Liabilities. Such risks may be mitigated by engaging in master netting arrangements.
Securities Lending: The Fund may lend its portfolio securities to banks and broker-dealers. The loans are secured by collateral at least equal to the market value of the securities loaned. Collateral pledged by each borrower is invested in an affiliated money market fund and is marked to market daily, based on the previous day’s market value, such that the
| Prudential Government Income Fund | 51 |
Notes to Financial Statements (continued)
value of the collateral exceeds the value of the loaned securities. In the event of significant appreciation in value of securities on loan on the last business day of the reporting period, the financial statements may reflect a collateral value that is less than the market value of the loaned securities. Such shortfall is remedied as described above. Loans are subject to termination at the option of the borrower or the Fund. Upon termination of the loan, the borrower will return to the Fund securities identical to the loaned securities. Should the borrower of the securities fail financially, the Fund has the right to repurchase the securities in the open market using the collateral. The Fund recognizes income, net of any rebate and securities lending agent fees, for lending its securities in the form of fees or interest on the investment of any cash received as collateral. The borrower receives all interest and dividends from the securities loaned and such payments are passed back to the lender in amounts equivalent thereto. The Fund also continues to recognize any unrealized gain (loss) in the market price of the securities loaned and on the change in the value of the collateral invested that may occur during the term of the loan. In addition, realized gain (loss) is recognized on changes in the value of the collateral invested upon liquidation of the collateral. Net earnings from securities lending are disclosed on the Statement of Operations as “Income from securities lending, net”.
Mortgage Dollar Rolls: The Fund entered into mortgage dollar rolls in which the Fund sells mortgage securities for delivery in the current month, realizing a gain (loss), and simultaneously enters into contracts to repurchase somewhat similar (same type, coupon and maturity) securities on a specified future date. During the roll period, the Fund forgoes principal and interest paid on the securities. The Fund is compensated by the interest earned on the cash proceeds of the initial sale and by the lower repurchase price at the future date. The difference between the sale proceeds and the lower repurchase price is recorded as a realized gain on investment transactions. The Fund maintains a segregated account, the dollar value of which is at least equal to its obligations, with respect to dollar rolls. The Fund is subject to the risk that the market value of the securities the Fund is obligated to repurchase under the agreement may decline below the repurchase price.
Concentration of Risk: The ability of debt securities issuers (other than those issued or guaranteed by the U.S. Government) held by the Fund to meet their obligations may be affected by the economic or political developments in a specific industry, region or country. U.S. Government and agency securities are subject to market risk, interest rate risk and credit risk. Not all U.S. Government securities are insured or guaranteed by the full faith and credit of the U.S. Government; some are only insured or guaranteed by the issuing agency, which must rely on its own resources to repay the debt.
Securities Transactions and Net Investment Income: Securities transactions are recorded on the trade date. Realized gains (losses) from investment and currency transactions are calculated on the specific identification method. Dividend income is recorded on the ex-date. Expenses are recorded on an accrual basis, which may require the use of certain
| 52 |
estimates by management that may differ from actual. Net investment income or loss (other than class specific expenses and waivers, which are allocated as noted below) and unrealized and realized gains (losses) are allocated daily to each class of shares based upon the relative proportion of adjusted net assets of each class at the beginning of the day.
Class specific expenses and waivers, where applicable, are charged to the respective share classes. Class specific expenses include Distribution fees and Distribution fee waivers, and effective January 1, 2018, Transfer Agent’s fees and expenses, Registration fees and Fee waiver and/or expense reimbursement. Prior to January 1, 2018 Transfer Agent’s fees and expenses, Registration fees and Fee waiver and/or expense reimbursement were not designated as class specific expenses and were allocated daily to each class of shares based upon the relative proportion of adjusted net assets of each class at the beginning of the day.
Taxes: It is the Fund’s policy to continue to meet the requirements of the Internal Revenue Code applicable to regulated investment companies and to distribute all of its taxable net investment income and capital gains, if any, to its shareholders. Therefore, no federal income tax provision is required. Withholding taxes on foreign dividends, interest and capital gains, if any, are recorded, net of reclaimable amounts, at the time the related income is earned.
Dividends and Distributions: The Fund expects to pay dividends from net investment income monthly and distributions from net realized capital gains, if any, at least annually. Dividends and distributions to shareholders, which are determined in accordance with federal income tax regulations and which may differ from generally accepted accounting principles, are recorded on the ex-date. Permanent book/tax differences relating to income and gain (loss) are reclassified amongst undistributed net investment income, accumulated net realized gain (loss) and paid-in capital in excess of par, as appropriate.
Estimates: The preparation of financial statements requires management to make estimates and assumptions that affect the reported amounts and disclosures in the financial statements. Actual results could differ from those estimates.
2. Agreements
The Company, on behalf of the Fund, has a management agreement with PGIM Investments. Pursuant to this agreement, PGIM Investments has responsibility for all investment advisory services and supervises the subadviser’s performance of such services. In addition, under the management agreement, PGIM Investments provides all of the administrative functions necessary for the organization, operation and management of the Fund. PGIM Investments administers the corporate affairs of the Fund and, in connection therewith, furnishes the Fund with office facilities, together with those ordinary clerical and bookkeeping services which are not being furnished by, the Fund’s custodian (the Custodian), and the Fund’s transfer agent. PGIM Investments is also responsible for the staffing and management of dedicated groups of legal, marketing, compliance and related personnel necessary for the operation of the Fund. The legal, marketing, compliance and related personnel are also responsible for the management and oversight
| Prudential Government Income Fund | 53 |
Notes to Financial Statements (continued)
of the various service providers to the Fund, including, but not limited to, the custodian, transfer agent, and accounting agent.
PGIM Investments has entered into a subadvisory agreement with PGIM, Inc., which provides subadvisory services to the Fund through its PGIM Fixed Income unit. The subadvisory agreement provides that PGIM, Inc. will furnish investment advisory services in connection with the management of the Fund. In connection therewith, PGIM, Inc. is obligated to keep certain books and records of the Fund. PGIM Investments pays for the services of PGIM, Inc., the cost of compensation of officers of the Fund, occupancy and certain clerical and bookkeeping costs of the Fund. The Fund bears all other costs and expenses.
The management fee paid to PGIM Investments is accrued daily and payable monthly at an annual rate of 0.50% of the Fund’s average daily net assets up to and including $1 billion, 0.45% of the Fund’s average daily net assets of the next $1 billion, 0.35% of the Fund’s average daily net assets of the next $1 billion, and 0.30% of the average daily net assets of the Fund in excess of $3 billion. The effective management fee rate before any waivers and/or expense reimbursement was 0.50% for the year ended February 28, 2018. The effective management fee rate net of waivers and/or expense reimbursement was 0.50%.
Effective January 1, 2018, PGIM Investments has voluntarily agreed to limit the net annual operating expenses (exclusive of taxes (such as income and foreign withholding taxes, stamp duty and deferred tax expenses), interest, acquired fund fees and expenses, brokerage, extraordinary and certain other expenses such as dividend, broker charges and interest expense on short sales) to 2.03% of average daily net assets for Class B shares. Expenses waived/reimbursed by the Manager in accordance with this agreement may be recouped by the Manager within the same fiscal year during which such waiver/ reimbursement is made if such recoupment can be realized without exceeding the expense limit in effect at the time of the recoupment for that fiscal year.
The Company, on behalf of the Fund, has a distribution agreement with Prudential Investment Management Services LLC (“PIMS”) which acts as the distributor of the Class A, Class B, Class C, Class Q, Class R and Class Z shares of the Fund. The Fund compensates PIMS for distributing and servicing the Fund’s Class A, Class B, Class C and Class R shares, pursuant to the plans of distribution (the “Distribution Plans”), regardless of expenses actually incurred by PIMS. The distribution fees for Class A, B, C and R are accrued daily and payable monthly. No distribution or service fees are paid to PIMS as distributor of the Class Q or Class Z shares of the Fund.
Pursuant to the Distribution Plans, the Fund compensates PIMS for distribution related activities at an annual rate of up to 0.25%, 1% and 0.75% of the average daily net assets of the Class A, C and R shares, respectively. PIMS has contractually agreed through June 30, 2018 to limit such expenses to 0.50% of the average daily net assets of the R shares.
| 54 |
Pursuant to the Class B Plan, the Fund compensates PIMS for distribution related activities at an annual rate of up to 1% of the average daily net assets of the Class B shares up to $3 billion, 0.80% of the next $1 billion of such assets and 0.50% of such assets in excess of $4 billion. The effective distribution fee rate for Class B was 1% for the year ended February 28, 2018.
PIMS has advised the Fund that it has received $67,652 in front-end sales charges resulting from sales of Class A shares, during the year ended February 28, 2018. From these fees, PIMS paid such sales charges to affiliated broker-dealers, which in turn paid commissions to sales persons and incurred other distribution costs.
PIMS has advised the Fund that for the year ended February 28, 2018, it received $55, $2,027 and $726 in contingent deferred sales charges imposed upon redemptions by certain Class A, Class B and Class C shareholders.
PGIM Investments, PGIM, Inc. and PIMS are indirect, wholly-owned subsidiaries of Prudential Financial, Inc. (“Prudential”).
3. Other Transactions with Affiliates
Prudential Mutual Fund Services LLC (“PMFS”), an affiliate of PGIM Investments and an indirect, wholly-owned subsidiary of Prudential, serves as the Fund’s transfer agent. Transfer agent’s fees and expenses in the Statement of Operations include certain out-of-pocket expenses paid to non-affiliates, where applicable.
The Fund may enter into certain securities purchase or sale transactions under Board approved Rule 17a-7 procedures. Rule 17a-7 is an exemptive rule under the 1940 Act, that permits purchase and sale transactions among affiliated investment companies, or between an investment company and a person that is affiliated solely by reason of having a common (or affiliated) investment adviser, common directors, and/or common officers. Such transactions are subject to ratification by the Board. For the reporting period ended February 28, 2018 no such transactions were entered into by the Fund.
The Fund may invest its overnight sweep cash in the Prudential Core Ultra Short Bond Fund (the “Core Fund”), and its securities lending cash collateral in the Prudential Institutional Money Market Fund (the “Money Market Fund”), each a series of Prudential Investment Portfolios 2, registered under the 1940 Act and managed by PGIM Investments. For the year ended February 28, 2018, PGIM, Inc. was compensated $51 by PGIM Investments for managing the Fund’s securities lending cash collateral as subadviser to the Money Market Fund. The Fund also invests in the Prudential Core Short-Term Bond Fund, pursuant to an exemptive order received from the Securities and Exchange Commission (“SEC”), a series of Prudential Investment Portfolios 2 (together with Prudential Core Ultra Short Bond Fund, the “Core Funds”), registered under the 1940 Act and managed by PGIM Investments. Earnings from the Core Funds and Money Market Fund are disclosed on the Statement of Operations as “Affiliated dividend income” and “Income from securities lending, net”, respectively.
| Prudential Government Income Fund | 55 |
Notes to Financial Statements (continued)
4. Portfolio Securities
The aggregate cost of purchases and proceeds from sales of portfolio securities (excluding short-term investments and U.S. Government securities) for the year ended February 28, 2018, were $1,716,995,238 and $1,753,414,652, respectively.
5. Distributions and Tax Information
Distributions to shareholders, which are determined in accordance with federal income tax regulations and which may differ from generally accepted accounting principles, are recorded on the ex-date. In order to present undistributed net investment income, accumulated net realized loss on investment transactions and paid-in capital in excess of par on the Statement of Assets and Liabilities that more closely represent their tax character, certain adjustments have been made to undistributed net investment income and accumulated net realized loss on investment transactions. For the year ended February 28, 2018, the adjustments were to increase undistributed net investment income and increase accumulated net realized loss on investment transactions by $1,736,983 due to differences in the treatment for book and tax purposes of premium amortization, paydown gains (losses) and swaps. Net investment income, net realized gain (loss) on investment transactions and net assets were not affected by this change.
For the year ended February 28, 2018, the tax character of dividends paid by the Fund were $9,001,362 of ordinary income and $1,423,834 of long-term capital gains. For the year ended February 28, 2017, the tax character of dividends paid by the Fund was $7,770,180 of ordinary income.
As of February 28, 2018, the accumulated undistributed earnings on a tax basis was $515,896 of ordinary income. This differs from the amount shown on the Statement of Assets and Liabilities primarily due to cumulative timing differences between financial and tax reporting.
The United States federal income tax basis of the Fund’s investments and the net unrealized depreciation as of February 28, 2018 were as follows:
Tax Basis | Gross Unrealized | Gross Unrealized | Net | |||
| $454,129,707 | $1,694,263 | $(9,449,729) | $(7,755,466) |
The difference between book basis and tax basis was primarily attributable to deferred losses on wash sales, the difference in the treatment of premium amortization for book and tax purposes, and appreciation (depreciation) of swaps and futures.
| 56 |
The Fund elected to treat post-October capital losses of approximately $4,732,000 as having been incurred in the following fiscal year (February 28, 2019).
Management has analyzed the Fund’s tax positions taken on federal, state and local income tax returns for all open tax years and has concluded that no provision for income tax is required in the Fund’s financial statements for the current reporting period. The Fund’s federal, state and local income and federal excise tax returns for tax years for which the applicable statutes of limitations have not expired are subject to examination by the Internal Revenue Service and state departments of revenue.
6. Capital and Ownership
The Fund offers Class A, Class B, Class C, Class Q, Class R and Class Z shares. Class A shares are sold with a maximum front-end sales charge of 4.50%. Investors who purchase $1 million or more of Class A shares and sell these shares within 12 months of purchase are subject to a contingent deferred sales charge (“CDSC”) of 1%, although they are not subject to an initial sales charge. The Class A CDSC is waived for certain retirement and/or benefit plans. A special exchange privilege is also available for shareholders who qualified to purchase Class A shares at net asset value. Class B shares are sold with a CDSC which declines from 5% to zero depending on the period of time the shares are held. Class B shares automatically convert to Class A shares on a quarterly basis approximately seven years after purchase. Class B shares are closed to new purchases. Class C shares are sold with a CDSC of 1% on sales made within 12 months of purchase. Class R shares are available to certain retirement plans, clearing and settlement firms. Class Q, Class R and Class Z shares are not subject to any sales or redemption charge and are offered exclusively for sale to a limited group of investors.
Under certain circumstances, an exchange may be made from specified share classes of the Fund to one or more other share classes of the Fund as presented in the table of transactions in shares of common stock.
There are 2.5 billion shares of common stock, $0.01 par value per share, divided into seven classes, designated Class A, Class B, Class C, Class Q, Class R, Class T and Class Z common stock, each of which consists of 230 million, 5 million, 495 million, 500 million, 500 million, 270 million and 500 million authorized shares, respectively. The Fund currently does not have any Class T shares outstanding.
As of February 28, 2018, Prudential owned 1,340,414 Class Q shares of the Fund. In addition, 4 shareholders of record held 46% of the Fund’s outstanding shares.
| Prudential Government Income Fund | 57 |
Notes to Financial Statements (continued)
Transactions in shares of common stock were as follows:
Class A | Shares | Amount | ||||||
Year ended February 28, 2018: | ||||||||
Shares sold | 2,569,711 | $ | 24,511,457 | |||||
Shares issued in reinvestment of dividends and distributions | 582,955 | 5,559,746 | ||||||
Shares reacquired | (6,418,474 | ) | (61,196,268 | ) | ||||
|
|
|
| |||||
Net increase (decrease) in shares outstanding before conversion | (3,265,808 | ) | (31,125,065 | ) | ||||
Shares issued upon conversion from other share class(es) | 54,207 | 517,919 | ||||||
Shares reacquired upon conversion into other share class(es) | (100,707 | ) | (963,228 | ) | ||||
|
|
|
| |||||
Net increase (decrease) in shares outstanding | (3,312,308 | ) | $ | (31,570,374 | ) | |||
|
|
|
| |||||
Year ended February 28, 2017: | ||||||||
Shares sold | 4,429,044 | $ | 43,021,817 | |||||
Shares issued in reinvestment of dividends and distributions | 468,033 | 4,542,225 | ||||||
Shares reacquired | (8,267,529 | ) | (80,205,446 | ) | ||||
|
|
|
| |||||
Net increase (decrease) in shares outstanding before conversion | (3,370,452 | ) | (32,641,404 | ) | ||||
Shares issued upon conversion from other share class(es) | 64,624 | 625,506 | ||||||
Shares reacquired upon conversion into other share class(es) | (496,033 | ) | (4,754,192 | ) | ||||
|
|
|
| |||||
Net increase (decrease) in shares outstanding | (3,801,861 | ) | $ | (36,770,090 | ) | |||
|
|
|
| |||||
Class B | ||||||||
Year ended February 28, 2018: | ||||||||
Shares sold | 5,465 | $ | 52,108 | |||||
Shares issued in reinvestment of dividends and distributions | 1,826 | 17,463 | ||||||
Shares reacquired | (43,268 | ) | (413,237 | ) | ||||
|
|
|
| |||||
Net increase (decrease) in shares outstanding before conversion | (35,977 | ) | (343,666 | ) | ||||
Shares reacquired upon conversion into other share class(es) | (42,089 | ) | (402,450 | ) | ||||
|
|
|
| |||||
Net increase (decrease) in shares outstanding | (78,066 | ) | $ | (746,116 | ) | |||
|
|
|
| |||||
Year ended February 28, 2017: | ||||||||
Shares sold | 79,968 | $ | 778,272 | |||||
Shares issued in reinvestment of dividends and distributions | 1,936 | 18,812 | ||||||
Shares reacquired | (129,049 | ) | (1,249,106 | ) | ||||
|
|
|
| |||||
Net increase (decrease) in shares outstanding before conversion | (47,145 | ) | (452,022 | ) | ||||
Shares reacquired upon conversion into other share class(es) | (63,584 | ) | (616,100 | ) | ||||
|
|
|
| |||||
Net increase (decrease) in shares outstanding | (110,729 | ) | $ | (1,068,122 | ) | |||
|
|
|
| |||||
| 58 |
Class C | Shares | Amount | ||||||
Year ended February 28, 2018: | ||||||||
Shares sold | 116,485 | $ | 1,105,194 | |||||
Shares issued in reinvestment of dividends and distributions | 13,859 | 132,586 | ||||||
Shares reacquired | (291,502 | ) | (2,782,228 | ) | ||||
|
|
|
| |||||
Net increase (decrease) in shares outstanding before conversion | (161,158 | ) | (1,544,448 | ) | ||||
Shares reacquired upon conversion into other share class(es) | (34,315 | ) | (328,141 | ) | ||||
|
|
|
| |||||
Net increase (decrease) in shares outstanding | (195,473 | ) | $ | (1,872,589 | ) | |||
|
|
|
| |||||
Year ended February 28, 2017: | ||||||||
Shares sold | 376,987 | $ | 3,671,427 | |||||
Shares issued in reinvestment of dividends and distributions | 9,228 | 89,629 | ||||||
Shares reacquired | (467,673 | ) | (4,522,293 | ) | ||||
|
|
|
| |||||
Net increase (decrease) in shares outstanding before conversion | (81,458 | ) | (761,237 | ) | ||||
Shares reacquired upon conversion into other share class(es) | (38,663 | ) | (368,409 | ) | ||||
|
|
|
| |||||
Net increase (decrease) in shares outstanding | (120,121 | ) | $ | (1,129,646 | ) | |||
|
|
|
| |||||
Class Q | ||||||||
Year ended February 28, 2018: | ||||||||
Shares sold | 1,638,021 | $ | 15,564,503 | |||||
Shares issued in reinvestment of dividends and distributions | 103,313 | 981,765 | ||||||
Shares reacquired | (756,024 | ) | (7,184,685 | ) | ||||
|
|
|
| |||||
Net increase (decrease) in shares outstanding before conversion | 985,310 | 9,361,583 | ||||||
Shares issued upon conversion from other share class(es) | 13,804 | 131,588 | ||||||
Shares reacquired upon conversion into other share class(es) | (4,072 | ) | (38,969 | ) | ||||
|
|
|
| |||||
Net increase (decrease) in shares outstanding | 995,042 | $ | 9,454,202 | |||||
|
|
|
| |||||
Period ended February 28, 2017*: | ||||||||
Shares sold | 359,932 | $ | 3,416,086 | |||||
Shares issued in reinvestment of dividends and distributions | 16,417 | 157,500 | ||||||
Shares reacquired | (344,179 | ) | (3,312,887 | ) | ||||
|
|
|
| |||||
Net increase (decrease) in shares outstanding before conversion | 32,170 | 260,699 | ||||||
Shares issued upon conversion from other share class(es) | 3,533,784 | 34,085,996 | ||||||
|
|
|
| |||||
Net increase (decrease) in shares outstanding | 3,565,954 | $ | 34,346,695 | |||||
|
|
|
| |||||
Class R | ||||||||
Year ended February 28, 2018: | ||||||||
Shares sold | 301,035 | $ | 2,877,091 | |||||
Shares issued in reinvestment of dividends and distributions | 22,287 | 212,931 | ||||||
Shares reacquired | (546,995 | ) | (5,226,245 | ) | ||||
|
|
|
| |||||
Net increase (decrease) in shares outstanding | (223,673 | ) | $ | (2,136,223 | ) | |||
|
|
|
| |||||
Year ended February 28, 2017: | ||||||||
Shares sold | 781,369 | $ | 7,624,379 | |||||
Shares issued in reinvestment of dividends and distributions | 16,299 | 158,309 | ||||||
Shares reacquired | (665,638 | ) | (6,457,847 | ) | ||||
|
|
|
| |||||
Net increase (decrease) in shares outstanding | 132,030 | $ | 1,324,841 | |||||
|
|
|
| |||||
| Prudential Government Income Fund | 59 |
Notes to Financial Statements (continued)
Class Z | Shares | Amount | ||||||
Year ended February 28, 2018: |
| |||||||
Shares sold | 2,770,828 | $ | 26,333,752 | |||||
Shares issued in reinvestment of dividends and distributions | 215,748 | 2,053,940 | ||||||
Shares reacquired | (5,197,283 | ) | (49,381,445 | ) | ||||
|
|
|
| |||||
Net increase (decrease) in shares outstanding before conversion | (2,210,707 | ) | (20,993,753 | ) | ||||
Shares issued upon conversion from other share class(es) | 113,593 | 1,083,281 | ||||||
|
|
|
| |||||
Net increase (decrease) in shares outstanding | (2,097,114 | ) | $ | (19,910,472 | ) | |||
|
|
|
| |||||
Year ended February 28, 2017: |
| |||||||
Shares sold | 6,678,316 | $ | 64,807,230 | |||||
Shares issued in reinvestment of dividends and distributions | 186,895 | 1,809,457 | ||||||
Shares reacquired | (4,954,385 | ) | (47,809,703 | ) | ||||
|
|
|
| |||||
Net increase (decrease) in shares outstanding before conversion | 1,910,826 | 18,806,984 | ||||||
Shares issued upon conversion from other shares class(es) | 535,060 | 5,113,195 | ||||||
Shares reacquired upon conversion into other share class(es) | (3,531,155 | ) | (34,085,996 | ) | ||||
|
|
|
| |||||
Net increase (decrease) in shares outstanding | (1,085,269 | ) | $ | (10,165,817 | ) | |||
|
|
|
| |||||
| * | Commencement of offering was August 9, 2016. |
7. Borrowings
The Company, on behalf of the Fund, along with other affiliated registered investment companies (the “Funds”), is a party to a Syndicated Credit Agreement (“SCA”) with a group of banks. The purpose of the SCA is to provide an alternative source of temporary funding for capital share redemptions. The SCA provides for a commitment of $900 million for the period October 5, 2017 through October 4, 2018. The Funds pay an annualized commitment fee of 0.15% of the unused portion of the SCA. The Fund’s portion of the commitment fee for the unused amount, allocated based upon a method approved by the Board, is accrued daily and paid quarterly. Prior to October 5, 2017, the Funds had another SCA that provided a commitment of $900 million and the Funds paid an annualized commitment fee of 0.15% of the unused portion of the SCA. The interest on borrowings under the SCAs is paid monthly and at a per annum interest rate based upon a contractual spread plus the higher of (1) the effective federal funds rate, (2) the 1-month LIBOR rate or (3) zero percent.
Other affiliated registered investment companies that are parties to the SCA include portfolios that are subject to a predetermined mathematical formula used to manage certain benefit guarantees offered under variable annuity contracts. The formula may result in large scale asset flows into and out of these portfolios. Consequently, these portfolios may be more likely to utilize the SCA for purposes of funding redemptions. It may be possible for those portfolios to fully exhaust the committed amount of the SCA, thereby requiring the Manager to allocate available funding per a Board-approved methodology designed to treat the Funds in the SCA equitably.
The Fund did not utilize the SCA during the year ended February 28, 2018.
| 60 |
Financial Highlights
| Class A Shares | ||||||||||||||||||||
Year Ended February 28/29, | ||||||||||||||||||||
| 2018 | 2017 | 2016 | 2015 | 2014 | ||||||||||||||||
| Per Share Operating Performance(a): | ||||||||||||||||||||
| Net Asset Value, Beginning of Year | $9.55 | $9.72 | $9.79 | $9.52 | $9.78 | |||||||||||||||
| Income (loss) from investment operations: | ||||||||||||||||||||
| Net investment income (loss) | 0.12 | 0.10 | 0.08 | 0.11 | 0.14 | |||||||||||||||
| Net realized and unrealized gain (loss) on investment transactions | (0.17 | ) | (0.12 | ) | 0.06 | 0.28 | (0.19 | ) | ||||||||||||
| Total from investment operations | (0.05 | ) | (0.02 | ) | 0.14 | 0.39 | (0.05 | ) | ||||||||||||
| Less Dividends and Distributions: | ||||||||||||||||||||
| Dividends from net investment income | (0.16 | ) | (0.11 | ) | (0.10 | ) | (0.12 | ) | (0.15 | ) | ||||||||||
| Distributions from net realized gains | (0.05 | ) | (0.04 | ) | (0.11 | ) | - | (0.06 | ) | |||||||||||
| Total dividends and distributions | (0.21 | ) | (0.15 | ) | (0.21 | ) | (0.12 | ) | (0.21 | ) | ||||||||||
| Net asset value, end of year | $9.29 | $9.55 | $9.72 | $9.79 | $9.52 | |||||||||||||||
| Total Return(b): | (0.61)% | (0.24)% | 1.41% | 4.08% | (0.47)% | |||||||||||||||
| Ratios/Supplemental Data: | ||||||||||||||||||||
| Net assets, end of year (000) | $289,049 | $328,835 | $371,571 | $387,663 | $412,384 | |||||||||||||||
| Average net assets (000) | $312,816 | $353,716 | $373,443 | $403,927 | $435,734 | |||||||||||||||
| Ratios to average net assets(c): | ||||||||||||||||||||
| Expenses after waivers and/or expense reimbursement(e) | 1.01% | 1.02% | 0.99% | 1.01% | 0.97% | |||||||||||||||
| Expenses before waivers and/or expense reimbursement(e) | 1.01% | 1.02% | 0.99% | 1.06% | 1.02% | |||||||||||||||
| Net investment income (loss) | 1.30% | 1.05% | 0.79% | 1.15% | 1.48% | |||||||||||||||
| Portfolio turnover rate(d) | 428% | 759% | 778% | 817% | 1,042% | |||||||||||||||
| (a) | Calculated based on average shares outstanding during the year. |
| (b) | Total return does not consider the effects of sales loads. Total return is calculated assuming a purchase of a share on the first day and a sale on the last day of each year reported and includes reinvestment of dividends and distributions, if any. Total returns may reflect adjustments to conform to generally accepted accounting principles. |
| (c) | Does not include expenses of the underlying funds in which the Fund invests. |
| (d) | The Fund accounts for mortgage dollar roll transactions, when applicable, as purchases and sales which, as a result, can increase its portfolio turnover rate. |
| (e) | The distributor of the Fund had contractually agreed to limit its distribution and service (12b-1) fees to .25% of the average daily net assets through March 8, 2015. Effective March 9, 2015, the contractual distribution and service (12b-1) fees were reduced from 0.30% to 0.25% of average daily net assets. |
See Notes to Financial Statements.
| Prudential Government Income Fund | 61 |
Financial Highlights (continued)
| Class B Shares | ||||||||||||||||||||
Year Ended February 28/29, | ||||||||||||||||||||
| 2018 | 2017 | 2016 | 2015 | 2014 | ||||||||||||||||
| Per Share Operating Performance(a): | ||||||||||||||||||||
| Net Asset Value, Beginning of Year | $9.56 | $9.73 | $9.80 | $9.53 | $9.80 | |||||||||||||||
| Income (loss) from investment operations: | ||||||||||||||||||||
| Net investment income (loss) | 0.05 | 0.03 | - | (e) | 0.04 | 0.07 | ||||||||||||||
| Net realized and unrealized gain (loss) on investment transactions | (0.18 | ) | (0.13 | ) | 0.07 | 0.27 | (0.20 | ) | ||||||||||||
| Total from investment operations | (0.13 | ) | (0.10 | ) | 0.07 | 0.31 | (0.13 | ) | ||||||||||||
| Less Dividends and Distributions: | ||||||||||||||||||||
| Dividends from net investment income | (0.08 | ) | (0.03 | ) | (0.03 | ) | (0.04 | ) | (0.08 | ) | ||||||||||
| Distributions from net realized gains | (0.05 | ) | (0.04 | ) | (0.11 | ) | - | (0.06 | ) | |||||||||||
| Total dividends and distributions | (0.13 | ) | (0.07 | ) | (0.14 | ) | (0.04 | ) | (0.14 | ) | ||||||||||
| Net asset value, end of year | $9.30 | $9.56 | $9.73 | $9.80 | $9.53 | |||||||||||||||
| Total Return(b): | (1.40)% | (1.01)% | 0.69% | 3.30% | (1.32)% | |||||||||||||||
| Ratios/Supplemental Data: | ||||||||||||||||||||
| Net assets, end of year (000) | $1,193 | $1,973 | $3,085 | $3,805 | $5,687 | |||||||||||||||
| Average net assets (000) | $1,497 | $2,802 | $3,151 | $4,682 | $7,274 | |||||||||||||||
| Ratios to average net assets(c): | ||||||||||||||||||||
| Expenses after waivers and/or expense reimbursement | 1.80% | 1.76% | 1.74% | 1.76% | 1.72% | |||||||||||||||
| Expenses before waivers and/or expense reimbursement | 2.25% | 1.76% | 1.74% | 1.76% | 1.72% | |||||||||||||||
| Net investment income (loss) | 0.49% | 0.30% | 0.04% | 0.40% | 0.75% | |||||||||||||||
| Portfolio turnover rate(d) | 428% | 759% | 778% | 817% | 1,042% | |||||||||||||||
| (a) | Calculated based on average shares outstanding during the year. |
| (b) | Total return does not consider the effects of sales loads. Total return is calculated assuming a purchase of a share on the first day and a sale on the last day of each year reported and includes reinvestment of dividends and distributions, if any. Total returns may reflect adjustments to conform to generally accepted accounting principles. |
| (c) | Does not include expenses of the underlying funds in which the Fund invests. |
| (d) | The Fund accounts for mortgage dollar roll transactions, when applicable, as purchases and sales which, as a result, can increase its portfolio turnover rate. |
| (e) | Less than $0.005 per share. |
See Notes to Financial Statements.
| 62 |
| Class C Shares | ||||||||||||||||||||
Year Ended February 28/29, | ||||||||||||||||||||
| 2018 | 2017 | 2016 | 2015 | 2014 | ||||||||||||||||
| Per Share Operating Performance(a): | ||||||||||||||||||||
| Net Asset Value, Beginning of Year | $9.57 | $9.74 | $9.81 | $9.54 | $9.80 | |||||||||||||||
| Income (loss) from investment operations: | ||||||||||||||||||||
| Net investment income (loss) | 0.05 | 0.03 | - | (e) | 0.04 | 0.07 | ||||||||||||||
| Net realized and unrealized gain (loss) on investment transactions | (0.18 | ) | (0.12 | ) | 0.07 | 0.27 | (0.19 | ) | ||||||||||||
| Total from investment operations | (0.13 | ) | (0.09 | ) | 0.07 | 0.31 | (0.12 | ) | ||||||||||||
| Less Dividends and Distributions: | ||||||||||||||||||||
| Dividends from net investment income | (0.08 | ) | (0.04 | ) | (0.03 | ) | (0.04 | ) | (0.08 | ) | ||||||||||
| Distributions from net realized gains | (0.05 | ) | (0.04 | ) | (0.11 | ) | - | (0.06 | ) | |||||||||||
| Total dividends and distributions | (0.13 | ) | (0.08 | ) | (0.14 | ) | (0.04 | ) | (0.14 | ) | ||||||||||
| Net asset value, end of year | $9.31 | $9.57 | $9.74 | $9.81 | $9.54 | |||||||||||||||
| Total Return(b): | (1.38)% | (1.01)% | 0.69% | 3.30% | (1.22)% | |||||||||||||||
| Ratios/Supplemental Data: | ||||||||||||||||||||
| Net assets, end of year (000) | $9,001 | $11,126 | $12,488 | $10,016 | $11,114 | |||||||||||||||
| Average net assets (000) | $10,053 | $12,570 | $10,548 | $10,394 | $15,601 | |||||||||||||||
| Ratios to average net assets(c): | ||||||||||||||||||||
| Expenses after waivers and/or expense reimbursement | 1.79% | 1.77% | 1.74% | 1.76% | 1.72% | |||||||||||||||
| Expenses before waivers and/or expense reimbursement | 1.79% | 1.77% | 1.74% | 1.76% | 1.72% | |||||||||||||||
| Net investment income (loss) | 0.51% | 0.30% | 0.03% | 0.40% | 0.75% | |||||||||||||||
| Portfolio turnover rate(d) | 428% | 759% | 778% | 817% | 1,042% | |||||||||||||||
| (a) | Calculated based on average shares outstanding during the year. |
| (b) | Total return does not consider the effects of sales loads. Total return is calculated assuming a purchase of a share on the first day and a sale on the last day of each year reported and includes reinvestment of dividends and distributions, if any. Total returns may reflect adjustments to conform to generally accepted accounting principles. |
| (c) | Does not include expenses of the underlying funds in which the Fund invests. |
| (d) | The Fund accounts for mortgage dollar roll transactions, when applicable, as purchases and sales which, as a result, can increase its portfolio turnover rate. |
| (e) | Less than $0.005 per share. |
See Notes to Financial Statements.
| Prudential Government Income Fund | 63 |
Financial Highlights (continued)
| Class Q Shares | ||||||||||||
Year Ended | August 9, February 28, | |||||||||||
| Per Share Operating Performance(b): | ||||||||||||
| Net Asset Value, Beginning of Period | $9.52 | $9.84 | ||||||||||
| Income (loss) from investment operations: | ||||||||||||
| Net investment income (loss) | 0.17 | 0.08 | ||||||||||
| Net realized and unrealized gain (loss) on investment transactions | (0.18 | ) | (0.32 | ) | ||||||||
| Total from investment operations | (0.01 | ) | (0.24 | ) | ||||||||
| Less Dividends and Distributions: | ||||||||||||
| Dividends from net investment income | (0.20 | ) | (0.08 | ) | ||||||||
| Distributions from net realized gains | (0.05 | ) | - | |||||||||
| Total dividends and distributions | (0.25 | ) | (0.08 | ) | ||||||||
| Net asset value, end of period | $9.26 | $9.52 | ||||||||||
| Total Return(c): | (0.19)% | (2.39)% | ||||||||||
| Ratios/Supplemental Data: | ||||||||||||
| Net assets, end of period (000) | $42,239 | $33,956 | ||||||||||
| Average net assets (000) | $38,343 | $17,541 | ||||||||||
| Ratios to average net assets(d): | ||||||||||||
| Expenses after waivers and/or expense reimbursement | 0.59% | 0.62% | (f) | |||||||||
| Expenses before waivers and/or expense reimbursement | 0.59% | 0.62% | (f) | |||||||||
| Net investment income (loss) | 1.75% | 1.47% | (f) | |||||||||
| Portfolio turnover rate(e) | 428% | 759% | (g) | |||||||||
| (a) | Commencement of operations. |
| (b) | Calculated based on average shares outstanding during the period. |
| (c) | Total return is calculated assuming a purchase of a share on the first day and a sale on the last day of each period reported and includes reinvestment of dividends and distributions, if any. Total returns may reflect adjustments to conform to generally accepted accounting principles. Total returns for periods of less than one full year are not annualized. |
| (d) | Does not include expenses of the underlying funds in which the Fund invests. |
| (e) | The Fund accounts for mortgage dollar roll transactions, when applicable, as purchases and sales which, as a result, can increase its portfolio turnover rate. |
| (f) | Annualized. |
| (g) | Not annualized. |
See Notes to Financial Statements.
| 64 |
| Class R Shares | ||||||||||||||||||||
Year Ended February 28/29, | ||||||||||||||||||||
| 2018 | 2017 | 2016 | 2015 | 2014 | ||||||||||||||||
| Per Share Operating Performance(a): | ||||||||||||||||||||
| Net Asset Value, Beginning of Year | $9.56 | $9.73 | $9.80 | $9.53 | $9.80 | |||||||||||||||
| Income (loss) from investment operations: | ||||||||||||||||||||
| Net investment income (loss) | 0.10 | 0.08 | 0.05 | 0.09 | 0.12 | |||||||||||||||
| Net realized and unrealized gain (loss) on investment transactions | (0.18 | ) | (0.12 | ) | 0.06 | 0.27 | (0.20 | ) | ||||||||||||
| Total from investment operations | (0.08 | ) | (0.04 | ) | 0.11 | 0.36 | (0.08 | ) | ||||||||||||
| Less Dividends and Distributions: | ||||||||||||||||||||
| Dividends from net investment income | (0.13 | ) | (0.09 | ) | (0.07 | ) | (0.09 | ) | (0.13 | ) | ||||||||||
| Distributions from net realized gains | (0.05 | ) | (0.04 | ) | (0.11 | ) | - | (0.06 | ) | |||||||||||
| Total dividends and distributions | (0.18 | ) | (0.13 | ) | (0.18 | ) | (0.09 | ) | (0.19 | ) | ||||||||||
| Net asset value, end of year | $9.30 | $9.56 | $9.73 | $9.80 | $9.53 | |||||||||||||||
| Total Return(b): | (0.88)% | (0.49)% | 1.16% | 3.82% | (0.82)% | |||||||||||||||
| Ratios/Supplemental Data: | ||||||||||||||||||||
| Net assets, end of year (000) | $13,718 | $16,243 | $15,242 | $13,089 | $10,560 | |||||||||||||||
| Average net assets (000) | $14,559 | $16,257 | $13,851 | $12,178 | $10,227 | |||||||||||||||
| Ratios to average net assets(c): | ||||||||||||||||||||
| Expenses after waivers and/or expense reimbursement | 1.29% | 1.27% | 1.24% | 1.26% | 1.22% | |||||||||||||||
| Expenses before waivers and/or expense reimbursement | 1.54% | 1.52% | 1.49% | 1.51% | 1.47% | |||||||||||||||
| Net investment income (loss) | 1.02% | 0.81% | 0.53% | 0.90% | 1.22% | |||||||||||||||
| Portfolio turnover rate(d) | 428% | 759% | 778% | 817% | 1,042% | |||||||||||||||
| (a) | Calculated based on average shares outstanding during the year. |
| (b) | Total return is calculated assuming a purchase of a share on the first day and a sale on the last day of each year reported and includes reinvestment of dividends and distributions, if any. Total returns may reflect adjustments to conform to generally accepted accounting principles. |
| (c) | Does not include expenses of the underlying funds in which the Fund invests. |
| (d) | The Fund accounts for mortgage dollar roll transactions, when applicable, as purchases and sales which, as a result, can increase its portfolio turnover rate. |
See Notes to Financial Statements.
| Prudential Government Income Fund | 65 |
Financial Highlights (continued)
| Class Z Shares | ||||||||||||||||||||
Year Ended February 28/29, | ||||||||||||||||||||
| 2018 | 2017 | 2016 | 2015 | 2014 | ||||||||||||||||
| Per Share Operating Performance(a): | ||||||||||||||||||||
| Net Asset Value, Beginning of Year | $9.53 | $9.70 | $9.77 | $9.50 | $9.76 | |||||||||||||||
| Income (loss) from investment operations: | ||||||||||||||||||||
| Net investment income (loss) | 0.15 | 0.13 | 0.10 | 0.13 | 0.17 | |||||||||||||||
| Net realized and unrealized gain (loss) on investment transactions | (0.18 | ) | (0.13 | ) | 0.06 | 0.28 | (0.19 | ) | ||||||||||||
| Total from investment operations | (0.03 | ) | 0.00 | 0.16 | 0.41 | (0.02 | ) | |||||||||||||
| Less Dividends and Distributions: | ||||||||||||||||||||
| Dividends from net investment income | (0.18 | ) | (0.13 | ) | (0.12 | ) | (0.14 | ) | (0.18 | ) | ||||||||||
| Distributions from net realized gains | (0.05 | ) | (0.04 | ) | (0.11 | ) | - | (0.06 | ) | |||||||||||
| Total dividends and distributions | (0.23 | ) | (0.17 | ) | (0.23 | ) | (0.14 | ) | (0.24 | ) | ||||||||||
| Net asset value, end of year | $9.27 | $9.53 | $9.70 | $9.77 | $9.50 | |||||||||||||||
| Total Return(b): | (0.36)% | 0.00% | 1.67% | 4.34% | (0.22)% | |||||||||||||||
| Ratios/Supplemental Data: | ||||||||||||||||||||
| Net assets, end of year (000) | $74,262 | $96,332 | $108,544 | $98,913 | $73,888 | |||||||||||||||
| Average net assets (000) | $93,050 | $106,342 | $98,389 | $79,893 | $83,182 | |||||||||||||||
| Ratios to average net assets(c): | ||||||||||||||||||||
| Expenses after waivers and/or expense reimbursement | 0.76% | 0.77% | 0.74% | 0.76% | 0.72% | |||||||||||||||
| Expenses before waivers and/or expense reimbursement | 0.76% | 0.77% | 0.74% | 0.76% | 0.72% | |||||||||||||||
| Net investment income (loss) | 1.55% | 1.31% | 1.03% | 1.40% | 1.74% | |||||||||||||||
| Portfolio turnover rate(d) | 428% | 759% | 778% | 817% | 1,042% | |||||||||||||||
| (a) | Calculated based on average shares outstanding during the year. |
| (b) | Total return is calculated assuming a purchase of a share on the first day and a sale on the last day of each year reported and includes reinvestment of dividends and distributions, if any. Total returns may reflect adjustments to conform to generally accepted accounting principles. |
| (c) | Does not include expenses of the underlying funds in which the Fund invests. |
| (d) | The Fund accounts for mortgage dollar roll transactions, when applicable, as purchases and sales which, as a result, can increase its portfolio turnover rate. |
See Notes to Financial Statements.
| 66 |
Report of Independent Registered Public Accounting Firm
To the Shareholders and Board of Directors
Prudential Investment Portfolios, Inc. 14:
Opinion on the Financial Statements
We have audited the accompanying statement of assets and liabilities of Prudential Government Income Fund (the “Fund”), a series of Prudential Investment Portfolios, Inc. 14, including the schedule of investments, as of February 28, 2018, the related statement of operations for the year then ended, the statements of changes in net assets for each of the years in the two-year period then ended, and the related notes (collectively, the “financial statements”) and the financial highlights for each of the years or periods in the five-year period then ended. In our opinion, the financial statements and financial highlights referred to above present fairly, in all material respects, the financial position of the Fund as of February 28, 2018, the results of its operations for the year then ended, the changes in its net assets for each of the years in the two-year period then ended, and the financial highlights for each of the years or periods in the five-year period then ended, in conformity with U.S. generally accepted accounting principles.
Basis for Opinion
These financial statements and financial highlights are the responsibility of the Fund’s management. Our responsibility is to express an opinion on these financial statements and financial highlights based on our audits. We are a public accounting firm registered with the Public Company Accounting Oversight Board (United States) (“PCAOB”) and are required to be independent with respect to the Fund in accordance with the U.S. federal securities laws and the applicable rules and regulations of the Securities and Exchange Commission and the PCAOB.
We conducted our audits in accordance with the standards of the PCAOB. Those standards require that we plan and perform the audit to obtain reasonable assurance about whether the financial statements and financial highlights are free of material misstatement, whether due to error or fraud. Our audits included performing procedures to assess the risks of material misstatement of the financial statements and financial highlights, whether due to error or fraud, and performing procedures that respond to those risks. Such procedures included examining, on a test basis, evidence supporting the amounts and disclosures in the financial statements and financial highlights. Such procedures also included confirmation of securities owned as of February 28, 2018, by correspondence with the custodian, transfer agent and brokers or by other appropriate auditing procedures when replies from brokers were not received. Our audits also included evaluating the accounting principles used and significant estimates made by management, as well as evaluating the overall presentation of the financial statements and financial highlights. We believe that our audits provide a reasonable basis for our opinion.

We have served as the auditor of one or more Prudential Retail investment companies since 2003.
New York, New York
April 17, 2018
| Prudential Government Income Fund | 67 |
Tax Information (unaudited)
We are advising you that during the year ended February 28, 2018, the Fund reports the maximum amount allowed per share but not less than $0.03 for Class A, B, C, Q, R and Z shares as a capital gain distribution in accordance with Section 852(b)(3)(C) of the Internal Revenue Code.
For the year ended February 28, 2018, the Fund reports the maximum amount allowable but not less than 85.88% as interest-related dividends in accordance with Section 871(k)(1) and 881(e)(1) of the Internal Revenue Code.
In January 2019, you will be advised on IRS Form 1099-DIV or substitute 1099-DIV, as to the Federal tax status of the dividends received by you in calendar year 2018.
We are required by Massachusetts, Missouri and Oregon to inform you that dividends which have been derived from interest on federal obligations are not taxable to shareholders provided that the Fund meets certain requirements mandated by the respective state’s taxing authorities. We are pleased to report that 30.22% of the dividends paid by the Fund qualify for such deduction.
For more detailed information regarding your state and local taxes, you should contact your tax adviser or the state/local taxing authorities.
| 68 |
INFORMATION ABOUT BOARD MEMBERS AND OFFICERS
(Unaudited)
Information about Board Members and Officers of the Funds is set forth below. Board Members who are not deemed to be “interested persons” of the Funds, as defined in the 1940 Act, are referred to as “Independent Board Members.” Board Members who are deemed to be “interested persons” of the Funds are referred to as “Interested Board Members.” The Board Members are responsible for the overall supervision of the operations of the Funds and perform the various duties imposed on the directors of investment companies by the 1940 Act. The Board in turn elects the Officers, who are responsible for administering the day-to-day operations of the Funds.
| Independent Board Members | ||||||
Name, Address, Age Position(s) Portfolios Overseen | Principal Occupation(s) During Past Five Years | Other Directorships Held During Past Five Years | Length of Board Service | |||
Ellen S. Alberding (60) Board Member Portfolios Overseen: 90 | President and Board Member, The Joyce Foundation (charitable foundation) (since 2002); Vice Chair, City Colleges of Chicago (community college system) (2011-2015); Trustee, National Park Foundation (charitable foundation for national park system) (2009-2018); Trustee, Economic Club of Chicago (since 2009); Trustee, Loyola University (since 2018). | None. | Since September 2013 | |||
Kevin J. Bannon (65) Board Member Portfolios Overseen: 90 | Retired; Managing Director (April 2008-May 2015) and Chief Investment Officer (October 2008-November 2013) of Highmount Capital LLC (registered investment adviser); formerly Executive Vice President and Chief Investment Officer (April 1993-August 2007) of Bank of New York Company; President (May 2003-May 2007) of BNY Hamilton Family of Mutual Funds. | Director of Urstadt Biddle Properties (equity real estate investment trust) (since September 2008). | Since July 2008 | |||
Linda W. Bynoe (65) Board Member Portfolios Overseen: 90 | President and Chief Executive Officer (since March 1995) and formerly Chief Operating Officer (December 1989-February 1995) of Telemat Ltd. (management consulting); formerly Vice President (January 1985-June 1989) at Morgan Stanley & Co. (broker-dealer). | Director of Anixter International, Inc. (communication products distributor) (since January 2006); Director of Northern Trust Corporation (financial services) (since April 2006); Trustee of Equity Residential (residential real estate) (since December 2009). | Since March 2005 | |||
Prudential Government Income Fund
| Independent Board Members | ||||||
Name, Address, Age Position(s) Portfolios Overseen | Principal Occupation(s) During Past Five Years | Other Directorships Held During Past Five Years | Length of Board Service | |||
Barry H. Evans (57)± Board Member Portfolios Overseen: 89 | Retired; Formerly President (2005-2016), Global Chief Operating Officer (2014-2016), Chief Investment Officer-Global Head of Fixed Income (1998-2014), and various portfolio manager roles (1986-2006), Manulife Asset Management U.S. | Director, Manulife Trust Company (since 2011); Director, Manulife Asset Management Limited (2015-2017); Formerly Chairman of the Board of Directors of Manulife Asset Management U.S. (2005-2016); Formerly Chairman of the Board, Declaration Investment Management and Research (2008-2016). | Since September 2017 | |||
Keith F. Hartstein (61) Board Member & Independent Chair Portfolios Overseen: 90 | Retired; Member (since November 2014) of the Governing Council of the Independent Directors Council (organization of independent mutual fund directors); formerly President and Chief Executive Officer (2005-2012), Senior Vice President (2004-2005), Senior Vice President of Sales and Marketing (1997-2004), and various executive management positions (1990-1997), John Hancock Funds, LLC (asset management); Chairman, Investment Company Institute’s Sales Force Marketing Committee (2003-2008). | None. | Since September 2013 | |||
Visit our website at pgiminvestments.com
| Independent Board Members | ||||||
Name, Address, Age Position(s) Portfolios Overseen | Principal Occupation(s) During Past Five Years | Other Directorships Held During Past Five Years | Length of Board Service | |||
Laurie Simon Hodrick (55)± Board Member Portfolios Overseen: 89 | A. Barton Hepburn Professor Emerita of Economics in the Faculty of Business, Columbia Business School (since 2018); Visiting Professor of Law, Stanford Law School (since 2015); Visiting Fellow at the Hoover Institution, Stanford University (since 2015); Sole Member, ReidCourt LLC (since 2008) (a consulting firm); formerly A. Barton Hepburn Professor of Economics in the Faculty of Business, Columbia Business School (1996-2017); formerly Managing Director, Global Head of Alternative Investment Strategies, Deutsche Bank (2006-2008). | Independent Director, Corporate Capital Trust (since April 2017) (a business development company). | Since September 2017 | |||
Michael S. Hyland, CFA (72) Board Member Portfolios Overseen: 90 | Retired (since February 2005); formerly Senior Managing Director (July 2001-February 2005) of Bear Stearns & Co, Inc.; Global Partner, INVESCO (1999-2001); Managing Director and President of Salomon Brothers Asset Management (1989-1999). | None. | Since July 2008 | |||
Richard A. Redeker (74) Board Member Portfolios Overseen: 90 | Retired Mutual Fund Senior Executive (50 years); Management Consultant; Director, Mutual Fund Directors Forum (since 2014); Independent Directors Council (organization of independent mutual fund directors)-Executive Committee, Chair of Policy Steering Committee, Governing Council. | None. | Since October 1993 | |||
Prudential Government Income Fund
| Independent Board Members | ||||||
Name, Address, Age Position(s) Portfolios Overseen | Principal Occupation(s) During Past Five Years | Other Directorships Held During Past Five Years | Length of Board Service | |||
Brian K. Reid (56)# Board Member Portfolios Overseen: 89 | Retired; formerly Chief Economist for the Investment Company Institute (ICI) (2005-2017); formerly Senior Economist and Director of Industry and Financial Analysis at the ICI (1998-2004); formerly Senior Economist, Industry and Financial Analysis at the ICI (1996-1998); formerly Staff Economist at the Federal Reserve Board (1989-1996); Director, ICI Mutual Insurance Company (2012-2017). | None. | Since March 2018 | |||
Stephen G. Stoneburn (74) Board Member Portfolios Overseen: 90 | Chairman (since July 2011), President and Chief Executive Officer (since June 1996) of Frontline Medical Communications (publishing company); formerly President (June 1995-June 1996) of Argus Integrated Media, Inc.; Senior Vice President and Managing Director (January 1993-1995) of Cowles Business Media; Senior Vice President of Fairchild Publications, Inc. (1975-1989). | None. | Since July 2003 | |||
| ± | Mr. Evans and Ms. Hodrick joined the Board effective as of September 1, 2017. |
| # | Mr. Reid joined the Board effective as of March 1, 2018. |
| Interested Board Members | ||||||
Name, Address, Age Position(s) Portfolios Overseen | Principal Occupation(s) During Past Five Years | Other Directorships Held During Past Five Years | Length of Board Service | |||
Stuart S. Parker (55) Board Member & President Portfolios Overseen: 90 | President of PGIM Investments LLC (formerly known as Prudential Investments LLC) (since January 2012); Executive Vice President of Prudential Investment Management Services LLC (since December 2012); Executive Vice President of Jennison Associates LLC and Head of Retail Distribution of PGIM Investments LLC (June 2005-December 2011). | None. | Since January 2012 | |||
Visit our website at pgiminvestments.com
| Interested Board Members | ||||||
Name, Address, Age Position(s) Portfolios Overseen | Principal Occupation(s) During Past Five Years | Other Directorships Held During Past Five Years | Length of Board Service | |||
Scott E. Benjamin (44) Board Member & Vice President Portfolios Overseen: 90 | Executive Vice President (since June 2009) of PGIM Investments LLC; Executive Vice President (June 2009-June 2012) and Vice President (since June 2012) of Prudential Investment Management Services LLC; Executive Vice President (since September 2009) of AST Investment Services, Inc.; Senior Vice President of Product Development and Marketing, PGIM Investments (since February 2006); Vice President of Product Development and Product Management, PGIM Investments LLC (2003-2006). | None. | Since March 2010 | |||
Grace C. Torres* (58) Board Member Portfolios Overseen: 89 | Retired; formerly Treasurer and Principal Financial and Accounting Officer of the Prudential Funds, Target Funds, Advanced Series Trust, Prudential Variable Contract Accounts and The Prudential Series Fund (1998-June 2014); Assistant Treasurer (March 1999-June 2014) and Senior Vice President (September 1999-June 2014) of PGIM Investments LLC; Assistant Treasurer (May 2003-June 2014) and Vice President (June 2005-June 2014) of AST Investment Services, Inc.; Senior Vice President and Assistant Treasurer (May 2003-June 2014) of Prudential Annuities Advisory Services, Inc. | Director (July 2015-January 2018) of Sun Bancorp, Inc. N.A. and Sun National Bank; Director (since January 2018) of OceanFirst Financial Corp. and OceanFirst Bank. | Since November 2014 | |||
| * | Note: Prior to her retirement in 2014, Ms. Torres was employed by PGIM Investments LLC. Due to her prior employment, she is considered to be an “interested person” under the 1940 Act. Ms. Torres is a Non-Management Interested Board Member. |
Prudential Government Income Fund
Fund Officers(a) | ||||
Name, Address and Age Position with Fund | Principal Occupation(s) During Past Five Years | Length of Service as Fund Officer | ||
Raymond A. O’Hara (62) Chief Legal Officer | Vice President and Corporate Counsel (since July 2010) of Prudential Insurance Company of America (Prudential); Vice President (March 2011-Present) of Pruco Life Insurance Company and Pruco Life Insurance Company of New Jersey; Vice President and Corporate Counsel (March 2011-Present) of Prudential Annuities Life Assurance Corporation; Chief Legal Officer of PGIM Investments LLC (since June 2012); Chief Legal Officer of Prudential Mutual Fund Services LLC (since June 2012) and Corporate Counsel of AST Investment Services, Inc. (since June 2012); formerly Assistant Vice President and Corporate Counsel (September 2008-July 2010) of The Hartford Financial Services Group, Inc.; formerly Associate (September 1980-December 1987) and Partner (January 1988-August 2008) of Blazzard & Hasenauer, P.C. (formerly, Blazzard, Grodd & Hasenauer, P.C.). | Since June 2012 | ||
Chad A. Earnst (42) Chief Compliance Officer | Chief Compliance Officer (September 2014-Present) of PGIM Investments LLC; Chief Compliance Officer (September 2014-Present) of the Prudential Funds, Target Funds, Advanced Series Trust, The Prudential Series Fund, Prudential’s Gibraltar Fund, Inc., Prudential Global Short Duration High Yield Income Fund, Inc., Prudential Short Duration High Yield Fund, Inc. and Prudential Jennison MLP Income Fund, Inc.; formerly Assistant Director (March 2010-August 2014) of the Asset Management Unit, Division of Enforcement, US Securities & Exchange Commission; Assistant Regional Director (January 2010-August 2014), Branch Chief (June 2006-December 2009) and Senior Counsel (April 2003-May 2006) of the Miami Regional Office, Division of Enforcement, US Securities & Exchange Commission. | Since September 2014 | ||
Dino Capasso (43) Deputy Chief Compliance Officer | Vice President and Deputy Chief Compliance Officer (June 2017-Present) of PGIM Investments LLC; formerly, Senior Vice President and Senior Counsel (January 2016-June 2017), and Vice President and Counsel (February 2012-December 2015) of Pacific Investment Management Company LLC. | Since March 2018 | ||
Deborah A. Docs (60) Secretary | Vice President and Corporate Counsel (since January 2001) of Prudential; Vice President (since December 1996) and Assistant Secretary (since March 1999) of PGIM Investments LLC; formerly Vice President and Assistant Secretary (May 2003-June 2005) of AST Investment Services, Inc. | Since May 2004 | ||
Visit our website at pgiminvestments.com
Fund Officers(a) | ||||
Name, Address and Age Position with Fund | Principal Occupation(s) During Past Five Years | Length of Service as Fund Officer | ||
Jonathan D. Shain (59) Assistant Secretary | Vice President and Corporate Counsel (since August 1998) of Prudential; Vice President and Assistant Secretary (since May 2001) of PGIM Investments LLC; Vice President and Assistant Secretary (since February 2001) of Prudential Mutual Fund Services LLC; formerly Vice President and Assistant Secretary (May 2003-June 2005) of AST Investment Services, Inc. | Since May 2005 | ||
Claudia DiGiacomo (43) Assistant Secretary | Vice President and Corporate Counsel (since January 2005) of Prudential; Vice President and Assistant Secretary of PGIM Investments LLC (since December 2005); Associate at Sidley Austin Brown & Wood LLP (1999-2004). | Since December 2005 | ||
Andrew R. French (55) Assistant Secretary | Vice President and Corporate Counsel (since February 2010) of Prudential; formerly Director and Corporate Counsel (2006-2010) of Prudential; Vice President and Assistant Secretary (since January 2007) of PGIM Investments LLC; Vice President and Assistant Secretary (since January 2007) of Prudential Mutual Fund Services LLC. | Since October 2006 | ||
Charles H. Smith (45) Anti-Money Laundering Compliance Officer | Vice President, Corporate Compliance, Anti-Money Laundering Unit (since January 2015) of Prudential; committee member of the American Council of Life Insurers Anti-Money Laundering and Critical Infrastructure Committee (since January 2016); formerly Global Head of Economic Sanctions Compliance at AIG Property Casualty (February 2007-December 2014); Assistant Attorney General at the New York State Attorney General’s Office, Division of Public Advocacy. (August 1998-January 2007). | Since January 2017 | ||
M. Sadiq Peshimam (54) Treasurer and Principal Financial and Accounting Officer | Vice President (since 2005) of PGIM Investments LLC; formerly Assistant Treasurer of funds in the Prudential Mutual Fund Complex (2006-2014). | Since February 2006 | ||
Peter Parrella (59) Assistant Treasurer | Vice President (since 2007) and Director (2004-2007) within Prudential Mutual Fund Administration; formerly Tax Manager at SSB Citi Fund Management LLC (1997-2004). | Since June 2007 | ||
Lana Lomuti (50) Assistant Treasurer | Vice President (since 2007) and Director (2005-2007), within Prudential Mutual Fund Administration; formerly Assistant Treasurer (December 2007-February 2014) of The Greater China Fund, Inc. | Since April 2014 | ||
Linda McMullin (56) Assistant Treasurer | Vice President (since 2011) and Director (2008-2011) within Prudential Mutual Fund Administration. | Since April 2014 | ||
Kelly A. Coyne (49) Assistant Treasurer | Director, Investment Operations of Prudential Mutual Fund Services LLC (since 2010). | Since March 2015 | ||
| (a) | Excludes Mr. Parker and Mr. Benjamin, interested Board Members who also serve as President and Vice President, respectively. |
Prudential Government Income Fund
Explanatory Notes to Tables:
| • | Board Members are deemed to be “Interested,” as defined in the 1940 Act, by reason of their affiliation with PGIM Investments LLC and/or an affiliate of PGIM Investments LLC. |
| • | Unless otherwise noted, the address of all Board Members and Officers is c/o PGIM Investments LLC, 655 Broad Street, Newark, New Jersey 07102-4410. |
| • | There is no set term of office for Board Members or Officers. The Board Members have adopted a retirement policy, which calls for the retirement of Board Members on December 31 of the year in which they reach the age of 75. |
| • | “Other Directorships Held” includes only directorships of companies required to register or file reports with the SEC under the 1934 Act (that is, “public companies”) or other investment companies registered under the 1940 Act. |
| • | “Portfolios Overseen” includes all investment companies managed by PGIM Investments LLC. The investment companies for which PGIM Investments LLC serves as manager include the Prudential Mutual Funds, The Prudential Variable Contract Accounts, PGIM ETF Trust, Prudential Short Duration High Yield Fund, Inc., Prudential Global Short Duration High Yield Fund, Inc., The Prudential Series Fund, Prudential’s Gibraltar Fund, Inc. and the Advanced Series Trust. |
Visit our website at pgiminvestments.com
| ∎ TELEPHONE | ∎ WEBSITE | |||
655 Broad Street Newark, NJ 07102 | (800) 225-1852 | www.pgiminvestments.com |
| PROXY VOTING |
| The Board of Directors of the Fund has delegated to the Fund’s investment subadviser the responsibility for voting any proxies and maintaining proxy recordkeeping with respect to the Fund. A description of these proxy voting policies and procedures is available without charge, upon request, by calling (800) 225-1852. Information regarding how the Fund voted proxies relating to portfolio securities during the most recent 12-month period ended June 30 is available on the Fund’s website and on the Securities and Exchange Commission’s website. |
| DIRECTORS |
| Ellen S. Alberding • Kevin J. Bannon • Scott E. Benjamin • Linda W. Bynoe • Barry H. Evans • Keith F. Hartstein • Laurie Simon Hodrick • Michael S. Hyland • Stuart S. Parker • Richard A. Redeker • Brian K. Reid • Stephen G. Stoneburn • Grace C. Torres |
| OFFICERS |
| Stuart S. Parker, President • Scott E. Benjamin, Vice President • M. Sadiq Peshimam, Treasurer and Principal Financial and Accounting Officer • Raymond A. O’Hara, Chief Legal Officer • Deborah A. Docs, Secretary • Chad A. Earnst, Chief Compliance Officer • Dino Capasso, Vice President and Deputy Chief Compliance Officer • Charles H. Smith, Anti-Money Laundering Compliance Officer • Jonathan D. Shain, Assistant Secretary • Claudia DiGiacomo, Assistant Secretary • Andrew R. French, Assistant Secretary • Peter Parrella, Assistant Treasurer • Lana Lomuti, Assistant Treasurer • Linda McMullin, Assistant Treasurer • Kelly A. Coyne, Assistant Treasurer |
| MANAGER | PGIM Investments LLC | 655 Broad Street Newark, NJ 07102 | ||
| ||||
| INVESTMENT SUBADVISER | PGIM Fixed Income | 655 Broad Street Newark, NJ 07102 | ||
| ||||
| DISTRIBUTOR | Prudential Investment Management Services LLC | 655 Broad Street Newark, NJ 07102 | ||
| ||||
| CUSTODIAN | The Bank of New York Mellon | 225 Liberty Street New York, NY 10286 | ||
| ||||
| TRANSFER AGENT | Prudential Mutual Fund Services LLC | PO Box 9658 Providence, RI 02940 | ||
| ||||
| INDEPENDENT REGISTERED PUBLIC ACCOUNTING FIRM | KPMG LLP | 345 Park Avenue New York, NY 10154 | ||
| ||||
| FUND COUNSEL | Willkie Farr & Gallagher LLP | 787 Seventh Avenue New York, NY 10019 | ||
| ||||
| An investor should consider the investment objectives, risks, charges, and expenses of the Fund carefully before investing. The prospectus and summary prospectus contain this and other information about the Fund. An investor may obtain a prospectus and summary prospectus by visiting our website at www.pgiminvestments.com or by calling (800) 225-1852. The prospectus and summary prospectus should be read carefully before investing. |
| E-DELIVERY |
| To receive your mutual fund documents online, go to www.pgiminvestments.com/edelivery and enroll. Instead of receiving printed documents by mail, you will receive notification via email when new materials are available. You can cancel your enrollment or change your email address at any time by visiting the website address above. |
| SHAREHOLDER COMMUNICATIONS WITH DIRECTORS |
| Shareholders can communicate directly with the Board of Directors by writing to the Chair of the Board, Prudential Government Income Fund, PGIM Investments, Attn: Board of Directors, 655 Broad Street, Newark, NJ 07102. Shareholders can communicate directly with an individual Director by writing to the same address. Communications are not screened before being delivered to the addressee. |
| AVAILABILITY OF PORTFOLIO SCHEDULE |
| The Fund files its complete schedule of portfolio holdings with the Securities and Exchange Commission for the first and third quarters of each fiscal year on Form N-Q. The Fund’s Forms N-Q are available on the Commission’s website at www.sec.gov. The Fund’s Forms N-Q may also be reviewed and copied at the Commission’s Public Reference Room in Washington, D.C. Information on the operation and location of the Public Reference Room may be obtained by calling 1-800-SEC-0330. The Fund’s schedule of portfolio holdings is also available on the Fund’s website as of the end of each month no sooner than 15 days after the end of the month. |
| The Fund’s Statement of Additional Information contains additional information about the Fund’s Directors and is available without charge, upon request, by calling (800) 225-1852. |
Mutual Funds:
| ARE NOT INSURED BY THE FDIC OR ANY FEDERAL GOVERNMENT AGENCY | MAY LOSE VALUE | ARE NOT A DEPOSIT OF OR GUARANTEED BY ANY BANK OR ANY BANK AFFILIATE |
PRUDENTIAL GOVERNMENT INCOME FUND
| SHARE CLASS | A | B | C | R | Z | Q | ||||||
| NASDAQ | PGVAX | PBGPX | PRICX | JDRVX | PGVZX | PGIQX | ||||||
| CUSIP | 74439V107 | 74439V206 | 74439V305 | 74439V503 | 74439V404 | 74439V875 |
MF128E

PRUDENTIAL FLOATING RATE INCOME FUND
ANNUAL REPORT
FEBRUARY 28, 2018


To enroll in e-delivery, go to pgiminvestments.com/edelivery
| Objective: To maximize current income. Capital appreciation is a secondary investment objective, but only when consistent with the Fund’s primary objective. |
Highlights (unaudited)
| • | Security selection was the primary driver of the Fund’s returns relevant to the Credit Suisse Leveraged Loan Index (the Index), highlighted by holdings in the transportation, retail, information technology, and energy sectors. |
| • | The Fund benefited from broad-based industry selection, including a modest overweight (holding a larger percentage of securities than the Index) in the energy sector and overweight positions in manufacturing, health care, and information technology. |
| • | The Fund was hampered by overweight positions in the retail and food & drug industries, as well as an underweight (holding a smaller percentage of securities than the Index) in the service industry. |
This report is not authorized for distribution to prospective investors unless preceded or accompanied by a current prospectus.
The views expressed in this report and information about the Fund’s portfolio holdings is for the period covered by this report and is subject to change thereafter.
Mutual funds are distributed by Prudential Investment Management Services LLC (PIMS), member SIPC. PGIM Fixed Income is a unit of PGIM, Inc. (PGIM), a registered investment adviser. PIMS and PGIM are Prudential Financial companies. © 2018 Prudential Financial, Inc. and its related entities. PGIM and the PGIM logo are service marks of Prudential Financial, Inc. and its related entities, registered in many jurisdictions worldwide.
| 2 | Visit our website at pgiminvestments.com |
PRUDENTIAL FUNDS — UPDATE
The Board of Directors/Trustees for the Fund has approved renaming the Fund’s Class Q shares as Class R6 shares, effective on June 11, 2018. The renaming of Class Q shares as Class R6 shares will not result in any changes to pricing, eligibility, or shareholder rights and obligations. The renamed Class R6 shares will not be exchangeable with Class R6 shares of the Prudential Day One Funds or the Prudential 60/40 Allocation Fund.
- Not part of the Annual Report -
| Prudential Floating Rate Income Fund | 3 |
PRUDENTIAL FUNDS — UPDATE
Effective on or about June 1, 2018 (the “Effective Date”), each Fund’s Class A, Class C, Class R and Class Z shares, as applicable, will be closed to investments by new group retirement plans, except as discussed below. Existing group retirement plans as of the Effective Date may keep their investments in their current share class and may continue to make additional purchases or exchanges of that class of shares. As of the Effective Date, all new group retirement plans wishing to add the Funds as new additions to the plan generally will be into one of the available Class Q shares, Class R2 shares, or Class R4 shares of the Funds.
In addition, on or about the Effective Date, the Class R shares of each Fund will be closed to all new investors, except as discussed below. Due to the closing of the Class R shares to new investors, effective on or about the Effective Date new IRA investors may only purchase Class A, Class C, Class Z or Class Q shares of the Funds, subject to share class eligibility. Following the Effective Date, no new accounts may be established in the Funds’ Class R shares and no Class R shares may be purchased or acquired by any new Class R shareholder, except as discussed below.
| Class A | Class C | Class Z | Class R | |||||
Existing Investors (Group Retirement Plans, IRAs, and all other investors) | No Change | No Change | No Change | No Change | ||||
| New Group Retirement Plans | Closed to group retirement plans wishing to add the share classes as new additions to plan menus on or about June 1, 2018, subject to certain exceptions below | |||||||
New IRAs | No Change | No Change | No Change | Closed to all new investors on or about June 1, 2018, subject to certain exceptions below | ||||
| All Other New Investors | No Change | No Change | No Change | |||||
- Not part of the Annual Report -
| 4 | Visit our website at pgiminvestments.com |
However, the following new investors may continue to purchase Class A, Class C, Class R and Class Z shares of a Fund, as applicable:
| • | Eligible group retirement plans who are exercising their one-time 90-day repurchase privilege in a Fund will be permitted to purchase such share classes. |
| • | Plan participants in a group retirement plan that offers Class A, Class C, Class R or Class Z shares of a Fund as of the Effective Date will be permitted to purchase such share classes of the Fund, even if the plan participant did not own shares of that class of the Fund as of the Effective Date. |
| • | Certain new group retirement plans will be permitted to offer such share classes of a Fund after the Effective Date, provided that the plan has or is actively negotiating a contractual agreement with the Fund’s distributor or service provider to offer such share classes of the Fund prior to or on the Effective Date. |
| • | New group retirement plans that combine with, replace or are otherwise affiliated with a current plan that invests in such share classes prior to or on the Effective Date will be permitted to purchase such share classes. |
The Funds also reserve the right to refuse any purchase order that might disrupt management of a Fund or to otherwise modify the closure policy at any time on a case-by-case basis.
- Not part of the Annual Report -
| Prudential Floating Rate Income Fund | 5 |
| 7 | ||||
| 8 | ||||
| 9 | ||||
| 12 | ||||
| 15 | ||||
| 17 | ||||
| 6 | Visit our website at pgiminvestments.com |

Dear Shareholder:
We hope you find the annual report for Prudential Floating Rate Income Fund informative and useful. The report covers performance for the 12-month period ended February 28, 2018.
We have important information to share with you. Effective June 11, 2018, Prudential Mutual Funds will be renamed from Prudential to PGIM Funds. Renaming our funds is part of our ongoing effort to further build our reputation and establish our global brand, which began when our firm adopted PGIM Investments as its name in April 2017. Please note that only the Fund’s name is changing. Your Fund’s management and operation, along with the Fund’s symbols, will remain the same.*
Over the reporting period, global economic growth continued its positive momentum, and central banks gradually tightened monetary policy. The US economy experienced moderate expansion and robust employment levels.
Equity returns were solid, due to healthy earnings expectations and the anticipated impact from tax reform. Global equities, including emerging markets, generally posted strong returns. US equities soared on new regulatory policy and revised corporate tax legislation. However, late in the period volatility arose on jitters over inflation and rising interest rates, tariffs, and a potential trade war.
In bond markets, US Treasury yields rose across both short and longer maturities. European bonds followed and often led during the period. In Japan, policy stance kept yields considerably lower. US corporate bonds handily outpaced Treasuries. Although most bond market sectors delivered positive returns, a great deal of gains were erased at the end of the period. Shortly afterward, the Federal Reserve hiked interest rates for the sixth time since 2015, based on confidence in the economy.
Regarding your investments with PGIM, we believe it is important to maintain a diversified portfolio of funds consistent with your tolerance for risk, time horizon, and financial goals.
Your financial advisor can help you create a diversified investment plan that may include funds covering all the basic asset classes and that reflects your personal investor profile and risk tolerance. However, diversification and asset allocation strategies do not assure a profit or protect against loss in declining markets.
At PGIM Investments, we consider it a great privilege and responsibility to help investors participate in opportunities across global markets while meeting their toughest investment challenges. PGIM is a top-10 global investment manager with more than $1 trillion in assets under management. This investment expertise allows us to deliver actively managed funds and strategies to meet the needs of investors around the globe.
Thank you for choosing our family of funds.
Sincerely,

Stuart S. Parker, President
Prudential Floating Rate Income Fund
April 16, 2018
*Note: The Prudential Day One Funds will not be changing their names.
| Prudential Floating Rate Income Fund | 7 |
Your Fund’s Performance (unaudited)
Performance data quoted represent past performance. Past performance does not guarantee future results. The investment return and principal value of an investment will fluctuate, so that an investor’s shares, when redeemed, may be worth more or less than their original cost. Current performance may be lower or higher than the past performance data quoted. An investor may obtain performance data as of the most recent month-end by visiting our website at www.pgiminvestments.com or by calling (800) 225-1852.
| Average Annual Total Returns as of 2/28/18 (with sales charges) | ||||||||||||
| One Year (%) | Five Years (%) | Since Inception (%) | ||||||||||
| Class A | 1.29 | 3.08 | 3.63 (3/30/11) | |||||||||
| Class C | 2.92 | 2.97 | 3.35 (3/30/11) | |||||||||
| Class Z | 4.86 | 3.99 | 4.39 (3/30/11) | |||||||||
| Class Q | 4.91 | N/A | 4.17 (4/27/15) | |||||||||
| Credit Suisse Leveraged Loan Index | 4.39 | 4.28 | — | |||||||||
| Lipper Loan Participation Funds Average | 3.53 | 3.29 | — | |||||||||
Average Annual Total Returns as of 2/28/18 (without sales charges) | ||||||||||||
| One Year (%) | Five Years (%) | Since Inception (%) | ||||||||||
| Class A | 4.70 | 3.76 | 4.13 (3/30/11) | |||||||||
| Class C | 3.92 | 2.97 | 3.35 (3/30/11) | |||||||||
| Class Z | 4.86 | 3.99 | 4.39 (3/30/11) | |||||||||
| Class Q | 4.91 | N/A | 4.17 (4/27/15) | |||||||||
| Credit Suisse Leveraged Loan Index | 4.39 | 4.28 | — | |||||||||
| Lipper Loan Participation Funds Average | 3.53 | 3.29 | — | |||||||||
| 8 | Visit our website at pgiminvestments.com |
Growth of a $10,000 Investment
The graph compares a $10,000 investment in the Prudential Floating Rate Income Fund (Class Z shares) with a similar investment in the Credit Suisse Leveraged Loan Index by portraying the initial account values at the commencement of operations of Class Z shares (March 30, 2011) and the account values at the end of the current fiscal year (February 28, 2018) as measured on a quarterly basis. For purposes of the graph, and unless otherwise indicated, it has been assumed that (a) all recurring fees (including management fees) were deducted; and (b) all dividends and distributions were reinvested. The line graph provides information for Class Z shares only. As indicated in the tables provided earlier, performance for Class A, Class C, and Class Q shares will vary due to the differing charges and expenses applicable to each share class (as indicated in the following paragraphs). Without waiver of fees and/or expense reimbursement, if any, the Fund’s returns would have been lower.
Past performance does not predict future performance. Total returns and the ending account values in the graph include changes in share price and reinvestment of dividends and capital gains distributions in a hypothetical investment for the periods shown. The Fund’s total returns do not reflect the deduction of income taxes on an individual’s investment. Taxes may reduce your actual investment returns on income or gains paid by the Fund or any gains you may realize if you sell your shares.
Source: PGIM Investments LLC, Lipper Inc., and Credit Suisse
Since Inception returns are provided for any share class with less than 10 fiscal years of returns. Since Inception returns for the Index and the Lipper Average are measured from the closest month-end to the Fund’s inception date.
| Prudential Floating Rate Income Fund | 9 |
Your Fund’s Performance (continued)
The returns in the tables do not reflect the deduction of taxes that a shareholder would pay on Fund distributions or following the redemption of Fund shares. The average annual total returns take into account applicable sales charges, which are described for each share class in the table below.
| Class A* | Class C* | Class Z* | Class Q** | |||||
| Maximum initial sales charge | 3.25% of the public offering price | None | None | None | ||||
| Contingent deferred sales charge (CDSC) (as a percentage of the lower of original purchase price or net asset value at redemption) | 1.00% on sales of $1 million or more made within 12 months of purchase | 1.00% on sales made within 12 months of purchase | None | None | ||||
| Annual distribution and service (12b-1) fees (shown as a percentage of average daily net assets) | 0.25% | 1.00% | None | None |
*Certain share classes will be generally closed to investments by new group retirement plans effective on or about June 1, 2018. Please see the ‘PRUDENTIAL FUNDS-UPDATE” on page 4 of this report for more information.
**Class Q shares will be renamed as Class R6 shares effective on June 11, 2018. Please see the “PRUDENTIAL FUNDS-UPDATE” on page 3 of this report for more information.
Benchmark Definitions
Credit Suisse Leveraged Loan Index—The Credit Suisse Leveraged Loan Index (the Index) is an unmanaged index that represents the investable universe of the dollar-denominated leveraged loan market. The average annual total returns for the Index through 2/28/18 measured from the month-end closest to the inception date of the Fund’s Class A, C, and Z shares is 4.53% and 4.14% for Class Q shares.
Lipper Loan Participation Funds Average—The Lipper Loan Participation Funds Average (Lipper Average) is based on the average return of all funds in the Lipper Loan Participation Funds universe for the periods noted. Funds in the Lipper Average invest primarily in participation interests in collateralized senior corporate loans that have floating or variable rates. The average annual total returns for the Lipper Average through 2/28/18 measured from the month-end closest to the inception date of the Fund’s Class A, C, and Z shares is 3.60% and 3.31% for Class Q shares.
Investors cannot invest directly in an index or average. The returns for the Index would be lower if they included the effects of sales charges, operating expenses of a mutual fund, or taxes. Returns for the Lipper Average reflect the deduction of operating expenses, but not sales charges or taxes.
| 10 | Visit our website at pgiminvestments.com |
| Credit Quality expressed as a percentage of total investments as of 2/28/18 (%) | ||||
| A | 0.5 | |||
| BBB | 2.7 | |||
| BB | 27.0 | |||
| B | 67.3 | |||
| CCC | 1.9 | |||
| Not Rated | 0.4 | |||
| Cash/Cash Equivalents | 0.2 | |||
| Total Investments | 100.0 | |||
Source: PGIM Fixed Income
Credit ratings reflect the highest rating assigned by a nationally recognized statistical rating organization (NRSRO) such as Moody’s Investor Service, Inc. (Moody’s), S&P Global Ratings (S&P), or Fitch, Inc. (Fitch). Credit ratings reflect the common nomenclature used by both S&P and Fitch. Where applicable, ratings are converted to the comparable S&P/Fitch rating tier nomenclature. These rating agencies are independent, and are widely used. The Not Rated category consists of securities that have not been rated by an NRSRO. Credit ratings are subject to change. Values may not sum to 100.0% due to rounding.
| Distributions and Yields as of 2/28/18 | ||||||
| Total Distributions Paid for 12 Months ($) | SEC 30-Day Subsidized Yield* (%) | SEC 30-Day Unsubsidized Yield** (%) | ||||
| Class A | 0.47 | 4.50 | 4.27 | |||
| Class C | 0.39 | 3.90 | 3.67 | |||
| Class Z | 0.49 | 4.90 | 4.73 | |||
| Class Q | 0.50 | 4.95 | 5.00 | |||
*SEC 30-Day Subsidized Yield (%)—A standardized yield calculation created by the Securities and Exchange Commission, it reflects the income earned during a 30-day period, after the deduction of the Fund’s net expenses (net of any expense waivers or reimbursements).
**SEC 30-Day Unsubsidized Yield (%)—A standardized yield calculation created by the Securities and Exchange Commission, it reflects the income earned during a 30-day period, after the deduction of the Fund’s gross expenses.
| Prudential Floating Rate Income Fund | 11 |
Strategy and Performance Overview
How did the Fund perform?
The Prudential Floating Rate Income Fund’s Class Z shares returned 4.86% for the 12-month reporting period ended February 28, 2018, outperforming the 4.39% return of the Credit Suisse Leveraged Loan Index (the Index). The Fund also outperformed the 3.53% return of the Lipper Loan Participation Funds Average.
What were market conditions?
| • | Despite rising equities and solid corporate earnings, loan prices declined modestly during the second quarter of 2017 in response to the record level of repricing activity that reduced borrowing costs. However, coupon return more than offset price losses during quarter. Investment inflows were positive, with more than $3.6 billion coming into the asset class. At the same time, new-issue volume was strong, with most of the proceeds being used for refinancing and repricing activities. |
| • | In the third quarter of 2017, the floating rate loan market advanced amid record high equity valuations and improving commodity prices. Lower-rated loans outperformed, with CCC-rated issues outpacing B- and BB-rated issues. Although retail floating rate loan mutual funds experienced investment outflows, the asset class was supported by strong demand from collateralized loan obligations (CLO), which are used by structured product vehicles that buy bank loan loans as underlying collateral. |
| • | During the fourth quarter of 2017, volatility increased in the financial markets overall, driven by uncertainty around US tax reform, questions surrounding global economic growth, and mounting idiosyncratic risk across a handful of sectors (retail, health care, and telecommunications). However, floating rate loans largely escaped the turbulence. Lower-rated loans continued to outperform, with CCC-rated issues outpacing B- and BB-rated issues. |
| • | The floating rate loan market was resilient during January and February 2018, as volatility continued across asset classes. US equities experienced their worst sell off since January 2016, crude oil prices fell, and the 10-year US Treasury yield rose to a four-year high. In contrast, floating rate loans provided positive returns as investor concerns about inflation increased. |
| • | Floating rate loans slightly outperformed high yield corporate bonds during the reporting period overall. Corporate bonds broadly outpaced Treasuries, which slightly outperformed agency mortgage-backed securities. Although most bond market sectors delivered positive returns during the period, significant gains were erased due to volatility during January and February. |
What worked?
| • | Security selection was the primary driver of the Fund’s relative returns, highlighted by holdings in the transportation, retail, information technology, and energy sectors. |
| 12 | Visit our website at pgiminvestments.com |
| • | In terms of individual issue selection, the Fund’s investments in Fieldwood Energy (energy), Avaya (information technology), Toys R Us (retail), HGIM Corp. (transportation), and Cole Haan (retail) were the top positive contributors to relative performance. |
| • | The Fund benefited from broad-based industry selection, including a modest overweight versus the Index in the energy sector and overweight positions in manufacturing, health care, and information technology. |
| • | An underweight in BB-rated floating rate loans, coupled with an overweight in B-rated floating rate loans, added to relative results. |
What didn’t work?
| • | The Fund was hampered by overweight positions in the retail and food & drug industries, as well as an underweight in the service industry. |
| • | The Fund’s underweight to lower-quality floating rate loans (CCC-rated and below), which outperformed during the period, hurt relative returns. |
| • | Overweights to Petco Animal Supplies and PetSmart (both retail) and an underweight to Concordia Healthcare (pharmaceuticals) were the largest single-name detractors from relative performance. |
Did the Fund use derivatives, and how did they affect performance?
| • | The Fund held interest rate swaps to help manage the portfolio’s duration and yield curve exposure and to reduce its sensitivity to changes in the levels of interest rates. Overall, this strategy had a negligible impact on performance during the reporting period. The Portfolio used credit default swaps to hedge credit risk of the portfolio in order to decrease credit risk. Credit default swaps establish exposure to a desired credit or index within the letter and spirit of the investment guidelines. The use of credit default swaps had a negligible impact on performance. |
Current outlook
| • | PGIM Fixed Income continues to believe that floating rate loans offer good protection against anticipated Federal Reserve interest rate increases. |
| • | In the view of PGIM Fixed Income, demand for floating rate loans should remain elevated due to CLO issuance, retail mutual fund demand, and global institutional investor interest. |
| • | PGIM Fixed Income believes that credit fundamentals remain strong as global economic growth accelerates, but has begun to notice weaker lender protections in certain credit agreements. Therefore, PGIM Fixed Income plans to remain vigilant about investment underwriting standards. |
| Prudential Floating Rate Income Fund | 13 |
Strategy and Performance Overview (continued)
| • | At the end of the reporting period, PGIM Fixed Income favored floating rate loans that are secured by hard assets (such as a manufacturing facility or real estate) and are senior secured. |
| • | In terms of sectors at the end of the period, the Fund was focused on more defensive industries, such as cable, health care, and specialty chemicals, that may be better able to withstand an extended or deep global economic slowdown. The Fund had less exposure to cyclical industries and companies in secular decline, including energy, independent power producers, department stores and apparel credits, and print media. |
| 14 | Visit our website at pgiminvestments.com |
As a shareholder of the Fund, you incur two types of costs: (1) transaction costs, including sales charges (loads) on purchase payments and redemptions, as applicable, and (2) ongoing costs, including management fees, distribution and/or service (12b-1) fees, and other Fund expenses, as applicable. This example is intended to help you understand your ongoing costs (in dollars) of investing in the Fund and to compare these costs with the ongoing costs of investing in other mutual funds.
The example is based on an investment of $1,000 held through the six-month period ended February 28, 2018. The example is for illustrative purposes only; you should consult the Prospectus for information on initial and subsequent minimum investment requirements.
Actual Expenses
The first line for each share class in the table on the following page provides information about actual account values and actual expenses. You may use the information on this line, together with the amount you invested, to estimate the expenses that you paid over the period. Simply divide your account value by $1,000 (for example, an $8,600 account value ÷ $1,000 = 8.6), then multiply the result by the number on the first line under the heading “Expenses Paid During the Six-Month Period” to estimate the expenses you paid on your account during this period.
Hypothetical Example for Comparison Purposes
The second line for each share class in the table on the following page provides information about hypothetical account values and hypothetical expenses based on the Fund’s actual expense ratio and an assumed rate of return of 5% per year before expenses, which is not the Fund’s actual return. The hypothetical account values and expenses may not be used to estimate the actual ending account balance or expenses you paid for the period. You may use this information to compare the ongoing costs of investing in the Fund and other funds. To do so, compare this 5% hypothetical example with the 5% hypothetical examples that appear in the shareholder reports of the other funds.
The Fund’s transfer agent may charge additional fees to holders of certain accounts that are not included in the expenses shown in the table on the following page. These fees apply to individual retirement accounts (IRAs) and Section 403(b) accounts. As of the close of the six-month period covered by the table, IRA fees included an annual maintenance fee of $15 per account (subject to a maximum annual maintenance fee of $25 for all accounts held by the same shareholder). Section 403(b) accounts are charged an annual $25 fiduciary maintenance fee. Some of the fees may vary in amount, or may be waived, based on your total account balance or the number of Prudential funds, including the Fund, that you own. You should consider the additional fees that were charged to your Fund account over the six-month period when you estimate the total ongoing expenses paid over the
| Prudential Floating Rate Income Fund | 15 |
Fees and Expenses (continued)
period and the impact of these fees on your ending account value, as these additional expenses are not reflected in the information provided in the expense table. Additional fees have the effect of reducing investment returns.
Please note that the expenses shown in the table are meant to highlight your ongoing costs only and do not reflect any transactional costs such as sales charges (loads). Therefore, the second line for each share class in the table is useful in comparing ongoing costs only and will not help you determine the relative total costs of owning different funds. In addition, if these transactional costs were included, your costs would have been higher.
| Prudential Floating Rate Income Fund | Beginning Account Value | Ending Account Value February 28, 2018 | Annualized Expense Ratio | Expenses Paid During the Six-Month Period* | ||||||||||||||
| Class A | Actual | $ | 1,000.00 | $ | 1,028.80 | 0.95 | % | $ | 4.78 | |||||||||
| Hypothetical | $ | 1,000.00 | $ | 1,020.08 | 0.95 | % | $ | 4.76 | ||||||||||
| Class C | Actual | $ | 1,000.00 | $ | 1,025.00 | 1.70 | % | $ | 8.54 | |||||||||
| Hypothetical | $ | 1,000.00 | $ | 1,016.36 | 1.70 | % | $ | 8.50 | ||||||||||
| Class Z | Actual | $ | 1,000.00 | $ | 1,030.10 | 0.70 | % | $ | 3.52 | |||||||||
| Hypothetical | $ | 1,000.00 | $ | 1,021.32 | 0.70 | % | $ | 3.51 | ||||||||||
| Class Q | Actual | $ | 1,000.00 | $ | 1,030.40 | 0.65 | % | $ | 3.27 | |||||||||
| Hypothetical | $ | 1,000.00 | $ | 1,021.57 | 0.65 | % | $ | 3.26 | ||||||||||
*Fund expenses (net of fee waivers or subsidies, if any) for each share class are equal to the annualized expense ratio for each share class (provided in the table), multiplied by the average account value over the period, multiplied by the 181 days in the six-month period ended February 28, 2018, and divided by the 365 days in the Fund’s fiscal year ended February 28, 2018 (to reflect the six-month period). Expenses presented in the table include the expenses of any underlying funds in which the Fund may invest.
| 16 | Visit our website at pgiminvestments.com |
as of February 28, 2018
| Description | Interest Rate | Maturity Date | Principal Amount (000)# | Value | ||||||||||||
LONG-TERM INVESTMENTS 94.8% |
| |||||||||||||||
ASSET-BACKED SECURITY 0.5% |
| |||||||||||||||
Collateralized Loan Obligation |
| |||||||||||||||
West CLO Ltd. (Cayman Islands), Series 2012-1A, Class B, 144A, 3 Month LIBOR + 3.400% | 5.167 | %(c) | 10/30/23 | 2,500 | $ | 2,501,687 | ||||||||||
|
| |||||||||||||||
BANK LOANS 90.1% |
| |||||||||||||||
Aerospace & Defense 1.4% |
| |||||||||||||||
Greenrock Finance, Inc., First Lien Initial USD Term B Loan, 3 Month LIBOR + 3.500%^ | 5.190 | (c) | 06/28/24 | 1,250 | 1,262,500 | |||||||||||
Sequa Mezzanine Holdings LLC, Initial Term Loan (First Lien), 3 Month LIBOR + 5.000% | 6.550 | (c) | 11/26/21 | 1,493 | 1,509,291 | |||||||||||
Standardaero Aviation Holdings, Inc., Initial Term Loan, 1 Month LIBOR + 3.750% | 5.400 | (c) | 07/07/22 | 2,812 | 2,833,761 | |||||||||||
Transdigm, Inc., New Tranche G Term Loans, | 4.100 | (c) | 08/22/24 | 1,961 | 1,966,890 | |||||||||||
|
| |||||||||||||||
| 7,572,442 | ||||||||||||||||
Automotive 3.2% |
| |||||||||||||||
American Tire Distributors, Inc., Initial Term Loan, 1 Month LIBOR + 4.250% | 5.900 | (c) | 09/01/21 | 1,458 | 1,470,894 | |||||||||||
BBB Industries US Holdings, Inc., Initial Term Loan (First Lien), 1 Month LIBOR + 4.500% | 6.150 | (c) | 11/03/21 | 1,183 | 1,188,590 | |||||||||||
Bright Bidco BV (Netherlands), 2018 Refinancing Term Loan B, 1 - 2 Month LIBOR + 3.500% | 5.170 | (c) | 06/28/24 | 2,164 | 2,196,587 | |||||||||||
Capital Automotive L.P., Initial Tranche B Term Loan (Second Lien), 1 Month LIBOR + 6.000% | 7.650 | (c) | 03/24/25 | 813 | 827,288 | |||||||||||
Dexko Global, Inc., Replacement US Dollar Term B Loan, 2 Month LIBOR + 3.500% | 5.250 | (c) | 07/24/24 | 1,147 | 1,156,207 | |||||||||||
Highline Aftermarket Acquisition LLC, Term Loan, 3 Month LIBOR + 4.250% | 6.000 | (c) | 03/18/24 | 621 | 623,114 | |||||||||||
Horizon Global Corp., | ||||||||||||||||
2017 Replacement Term Loan, 1 Month LIBOR + 4.500%^ | 6.150 | (c) | 06/30/21 | 955 | 955,400 | |||||||||||
Term Loan^ | — | (p) | 06/30/24 | 575 | 572,376 | |||||||||||
Innovative Xcessories & Services LLC, Term Loan, 3 Month LIBOR + 4.750% | 6.210 | (c) | 11/29/22 | 698 | 705,660 | |||||||||||
Navistar, Inc., Tranche B Term Loan, 1 Month LIBOR + 3.500% | 5.080 | (c) | 11/06/24 | 2,450 | 2,456,125 | |||||||||||
Sage Automotive Interiors, Inc., Initial Term Loan, 1 Month LIBOR + 5.000% | 6.650 | (c) | 11/08/22 | 2,525 | 2,546,589 | |||||||||||
See Notes to Financial Statements.
| Prudential Floating Rate Income Fund | 17 |
Schedule of Investments (continued)
as of February 28, 2018
| Description | Interest Rate | Maturity Date | Principal Amount (000)# | Value | ||||||||||||
BANK LOANS (Continued) |
| |||||||||||||||
Automotive (cont’d.) |
| |||||||||||||||
Superior Industries International, Inc., Closing Date Term Loan, 1 Month LIBOR + 4.500% | 6.150 | %(c) | 05/22/24 | 448 | $ | 451,323 | ||||||||||
Tower Automotive Holdings USA LLC, Third Refinancing Term Loan, 1 Month LIBOR + 2.750% | 4.380 | (c) | 03/07/24 | 1,670 | 1,671,129 | |||||||||||
Tweddle Group, Inc., Closing Date Term Loan, 3 Month LIBOR + 6.000%^ | 7.770 | (c) | 10/24/22 | 1,156 | 1,130,470 | |||||||||||
|
| |||||||||||||||
| 17,951,752 | ||||||||||||||||
Brokerage 0.9% |
| |||||||||||||||
Harnourvest Partners LLC, Term Loan | — | (p) | 02/28/25 | 1,650 | 1,647,938 | |||||||||||
Jefferies Finance LLC, Term Loan, 2 Month LIBOR + 2.500% | 4.310 | (c) | 08/02/24 | 799 | 799,811 | |||||||||||
NFP Corp., Term B Loan, 1 Month LIBOR + 3.000% | 4.650 | (c) | 01/08/24 | 1,238 | 1,241,699 | |||||||||||
VFH Parent LLC, Term B-1 Loan, 3 Month LIBOR + 3.250% | 4.940 | (c) | 12/30/21 | 1,548 | 1,560,326 | |||||||||||
|
| |||||||||||||||
| 5,249,774 | ||||||||||||||||
Building Materials & Construction 1.0% |
| |||||||||||||||
CHI Overhead Doors, Inc., Initial Term Loan, 3 Month LIBOR + 3.250% | 4.940 | (c) | 07/29/22 | 1,310 | 1,312,777 | |||||||||||
Interior Logic Group, Inc., Initial Term Loan, 1 Month LIBOR + 6.000%^ | 7.650 | (c) | 02/28/24 | 1,805 | 1,809,199 | |||||||||||
LBM Borrower LLC, Tranche C Term Loan, 3 Month LIBOR + 3.750% | 5.450 | (c) | 08/19/22 | 1,772 | 1,787,009 | |||||||||||
Quikrete Holdings, Inc., Initial Loan (First Lien), 1 Month LIBOR + 2.750% | 4.400 | (c) | 11/15/23 | 904 | 907,298 | |||||||||||
|
| |||||||||||||||
| 5,816,283 | ||||||||||||||||
Building Products 0.2% |
| |||||||||||||||
Forterra Finance LLC, Replacement Term Loan, 1 Month LIBOR + 3.000% | 4.650 | (c) | 10/25/23 | 1,460 | 1,369,218 | |||||||||||
Cable 2.5% |
| |||||||||||||||
Altice Financing SA (Luxembourg), October 2017 USD Term Loan, 3 Month LIBOR + 2.750% | 4.470 | (c) | 01/30/26 | 748 | 736,716 | |||||||||||
Intelsat Jackson Holdings SA (Luxembourg), Tranche B-3 Term Loan, 3 Month LIBOR + 3.750% | 5.710 | (c) | 11/27/23 | 2,300 | 2,281,671 | |||||||||||
Meredith Corp., Term Loan, 3 Month LIBOR + 3.000% | 4.660 | (c) | 01/31/25 | 950 | 954,898 | |||||||||||
Numericable U.S. LLC (France), | ||||||||||||||||
USD TLB-11 Term Loan, 3 Month LIBOR + 2.750% | 4.520 | (c) | 07/31/25 | 596 | 568,702 | |||||||||||
USD TLB-12 Term Loan, 3 Month LIBOR + 3.000% | 4.720 | (c) | 02/02/26 | 1,721 | 1,648,992 | |||||||||||
See Notes to Financial Statements.
| 18 |
| Description | Interest Rate | Maturity Date | Principal Amount (000)# | Value | ||||||||||||
BANK LOANS (Continued) |
| |||||||||||||||
Cable (cont’d.) |
| |||||||||||||||
Radiate Holdcco LLC, Term Loan | — | %(p) | 02/01/24 | 2,700 | $ | 2,695,499 | ||||||||||
Sinclair TV Grouup, Inc., Term Loan | — | (p) | 01/29/25 | 2,175 | 2,180,048 | |||||||||||
WideOpenWest Finance LLC, Refinancing Term B Loan, 1 Month LIBOR + 3.250% | 4.850 | (c) | 08/18/23 | 1,047 | 1,044,430 | |||||||||||
Xplornet Communications, Inc. (Canada), Term B Loan, 3 Month LIBOR + 4.750% | 6.440 | (c) | 09/09/21 | 1,953 | 1,971,048 | |||||||||||
|
| |||||||||||||||
| 14,082,004 | ||||||||||||||||
Capital Goods 8.5% |
| |||||||||||||||
American Traffic Solution, Term Loan^ | — | (p) | 02/23/25 | 1,000 | 1,005,000 | |||||||||||
Anvil International LLC, Initial Term Loan B, 1 - 2 Month LIBOR + 4.500%^ | 6.220 | (c) | 08/01/24 | 1,721 | 1,737,894 | |||||||||||
Apex Tool Group LLC, | ||||||||||||||||
First Lien Term Loan, 3 Month LIBOR + 3.750% | 5.400 | (c) | 02/01/22 | 350 | 349,750 | |||||||||||
First Lien Term Loan, 3 Month LIBOR + 3.750% | 5.400 | (c) | 01/31/20 | 1,522 | 1,521,483 | |||||||||||
AVSC Holdings Corp., Term Loan | — | (p) | 02/23/25 | 450 | 451,125 | |||||||||||
Blount International, Inc., Initial Term Loan, 1 Month LIBOR + 4.250% | 5.830 | (c) | 04/12/23 | 775 | 785,656 | |||||||||||
Brand Energy & Infrastructure Services, Inc., Initial Term Loan, 2 - 3 Month LIBOR + 4.250% | 5.960 | (c) | 06/21/24 | 3,507 | 3,531,246 | |||||||||||
CD&R Hydra Buyer, Inc., Initial Term Loan, 1 Month LIBOR + 3.750%^ | 5.330 | (c) | 12/11/24 | 650 | 653,250 | |||||||||||
Charah LLC, Initial Loan, 3 Month LIBOR + 6.250%^ | 7.710 | (c) | 10/25/24 | 875 | 883,750 | |||||||||||
Contanda LLC, Term Loan, 3 Month LIBOR + 3.500%^ | 5.190 | (c) | 02/27/20 | 575 | 559,187 | |||||||||||
CPM Acquisition Corp., | ||||||||||||||||
Initial Term Loan (First Lien), 1 Month LIBOR + 4.250% | 5.820 | (c) | 04/11/22 | 1,181 | 1,194,888 | |||||||||||
Second Lien Term Loan, 1 Month LIBOR + 8.250% | 9.900 | (c) | 04/10/23 | 200 | 202,500 | |||||||||||
Crosby US Acquisition Corp., First Lien Initial Term Loan, 3 Month LIBOR + 3.000% | 4.900 | (c) | 11/23/20 | 3,046 | 2,990,959 | |||||||||||
Diversitech Holdings, Inc., Initial Term Loan (First Lien), 3 Month LIBOR + 3.500% | 5.200 | (c) | 06/03/24 | 1,775 | 1,778,375 | |||||||||||
Douglas Dynamics LLC, 2017 Replacement Term Loan B, 3 Month LIBOR + 3.000%^ | 4.700 | (c) | 12/31/21 | 1,403 | 1,407,853 | |||||||||||
DXP Enterprises, Inc., Initial Term Loan, 1 Month LIBOR + 5.500%^ | 7.150 | (c) | 08/16/23 | 723 | 717,764 | |||||||||||
Dynacast International LLC, Term B-1 Loan (First Lien), 3 Month LIBOR + 3.250%^ | 4.940 | (c) | 01/28/22 | 2,094 | 2,106,824 | |||||||||||
Engineered Machinery Holdings, Inc., First Lien Initial Term Loan, 3 Month LIBOR + 3.250% | 4.940 | (c) | 07/19/24 | 1,375 | 1,378,437 | |||||||||||
See Notes to Financial Statements.
| Prudential Floating Rate Income Fund | 19 |
Schedule of Investments (continued)
as of February 28, 2018
| Description | Interest Rate | Maturity Date | Principal Amount (000)# | Value | ||||||||||||
BANK LOANS (Continued) |
| |||||||||||||||
Capital Goods (cont’d.) |
| |||||||||||||||
EXC Holdings III Corp, First Lien Initial USD Term Loan, 6 Month LIBOR + 3.500%^ | 5.160 | %(c) | 12/02/24 | 650 | $ | 655,687 | ||||||||||
Gopher Resource LLC, Term Loan | — | (p) | 03/31/25 | 975 | 982,312 | |||||||||||
Gopher Sub, Inc., Term Loan^ | — | (p) | 02/03/25 | 102 | 102,121 | |||||||||||
Helix Acquisition Holdings, Inc., First Lien Initial Term Loan, 3 Month LIBOR + 4.000%^ | 5.690 | (c) | 09/27/24 | 1,172 | 1,177,923 | |||||||||||
Hi-Crush Partners LP, Advance, 3 Month LIBOR + 4.000% | 5.660 | (c) | 12/16/24 | 575 | 580,031 | |||||||||||
Ilpea Parent, Inc., Term Loan, 1 Month LIBOR + 5.500%^ | 7.150 | (c) | 03/02/23 | 981 | 981,250 | |||||||||||
Janus International Group LLC, Term Loan^ | — | (p) | 03/31/25 | 450 | 448,875 | |||||||||||
K&N Parent, Inc., Initial Term Loan, 1 Month LIBOR + 4.750%^ | 6.400 | (c) | 10/20/23 | 1,471 | 1,448,588 | |||||||||||
Kemet Corp., Initial Term Loan, 1 Month LIBOR + 6.000%^ | 7.650 | (c) | 04/26/24 | 536 | 544,294 | |||||||||||
Milacron LLC, Term B Loan, 1 Month LIBOR + 2.750% | 4.400 | (c) | 09/28/23 | 1,349 | 1,352,414 | |||||||||||
North American Lifting Holdings, Inc., First Lien Term Loan, 3 Month LIBOR + 4.500% | 6.190 | (c) | 11/27/20 | 486 | 454,496 | |||||||||||
On Assignment, Inc., Term Loan | — | (p) | 04/30/25 | 1,200 | 1,204,500 | |||||||||||
Penn Engineering & Manufacturing Corp., Tranche B Term Loan, 1 Month LIBOR + 2.750%^ | 4.320 | (c) | 06/27/24 | 547 | 548,618 | |||||||||||
Pro Mach, Inc., Term Loan | — | (p) | 03/31/25 | 1,100 | 1,102,750 | |||||||||||
PSC Industrial Holdings Corp., Term Loan (First Lien), 1 Month LIBOR + 4.250% | 5.840 | (c) | 10/11/24 | 1,075 | 1,070,297 | |||||||||||
Robertshaw US Holdings Corp., Term Loan | — | (p) | 02/28/25 | 1,125 | 1,134,844 | |||||||||||
Safe Fleet Holdings LLC, Initial Term Loan (First Lien), 3 Month LIBOR + 3.000% | 4.780 | (c) | 02/03/25 | 1,475 | 1,475,922 | |||||||||||
Synagro Infrastructure Co., Inc., Term Loan, 3 Month LIBOR + 5.3750%^ | 7.065 | (c) | 08/21/20 | 168 | 158,663 | |||||||||||
Tank Holding Corp. (Roto Acquisition Corp.), Initial Term Loan, 1 - 3 Month LIBOR + 4.250% | 5.907 | (c) | 03/16/22 | 910 | 911,839 | |||||||||||
Thermon Holding Corp., Term B Loan, 1 Month LIBOR + 3.750% | 5.330 | (c) | 10/30/24 | 525 | 528,281 | |||||||||||
TRC Companies, Inc., Refinancing Term Loan, 1 Month LIBOR + 3.500%^ | 5.070 | (c) | 06/21/24 | 823 | 829,110 | |||||||||||
Unifrax I LLC, 2017 Incremental Dollar Term Loan, 3 Month LIBOR + 3.500% | 5.190 | (c) | 04/04/24 | 1,716 | 1,733,550 | |||||||||||
UOS LLC, Initial Term Loan, 1 Month LIBOR + 5.500%^ | 7.150 | (c) | 04/18/23 | 299 | 306,709 | |||||||||||
US Security Associates Holdings, Inc., Initial Term Loan, 3 Month LIBOR + 4.000% | 5.690 | (c) | 07/14/23 | 1,509 | 1,519,162 | |||||||||||
Vac, Inc. (Germany), Term Loan^ | — | (p) | 03/31/25 | 1,500 | 1,496,250 | |||||||||||
See Notes to Financial Statements.
| 20 |
| Description | Interest Rate | Maturity Date | Principal Amount (000)# | Value | ||||||||||||
BANK LOANS (Continued) |
| |||||||||||||||
Capital Goods (cont’d.) |
| |||||||||||||||
Vertiv Group Corp., Term B Loan, 1 Month LIBOR + 4.000% | 5.580 | %(c) | 11/30/23 | 1,071 | $ | 1,075,881 | ||||||||||
Wireco Worldgroup, Inc., First Lien Term Loan, 3 Month LIBOR + 5.500% | 7.480 | (c) | 09/29/23 | 568 | 572,071 | |||||||||||
|
| |||||||||||||||
| 47,652,379 | ||||||||||||||||
Chemicals 3.0% |
| |||||||||||||||
A Schulman, Inc., Initial US Term B Loan, 1 Month LIBOR + 3.250% | 4.865 | (c) | 06/01/22 | 429 | 429,912 | |||||||||||
Albaugh LLC, 2017 Refinancing Term Loan, 1 Month LIBOR + 3.500%^ | 5.140 | (c) | 12/06/24 | 825 | 833,250 | |||||||||||
Alpha US Bidco, Inc. (United Kingdom), Initial Term B-1 Loan, 3 Month LIBOR + 3.000% | 4.690 | (c) | 01/31/24 | 1,194 | 1,201,462 | |||||||||||
Colouroz Midco - Colouroz Investment 2 LLC (Germany), Second Lien Initial Term B-2 Loan, 3 Month LIBOR + 7.250% | 8.990 | (c) | 09/06/22 | 118 | 99,270 | |||||||||||
Cyanco Intermediate Corp., Initial Term Loan, 1 Month LIBOR + 4.500% | 6.150 | (c) | 05/01/20 | 1,342 | 1,342,757 | |||||||||||
Dubois Chemicals, Inc., | ||||||||||||||||
First Lien Delayed Draw Term Loan, 3 Month LIBOR + 3.750% | 5.338 | (c) | 03/15/24 | 82 | 81,871 | |||||||||||
First Lien Initial Term Loan, 1 Month LIBOR + 3.750% | 5.400 | (c) | 03/15/24 | 1,135 | 1,138,004 | |||||||||||
Emerald Performance Materials LLC, Second Lien Initial Term Loan, 1 Month LIBOR + 7.750% | 9.400 | (c) | 08/01/22 | 300 | 302,250 | |||||||||||
KMG Chemicals, Inc., Initial Term Loan, 1 Month LIBOR + 2.750% | 4.400 | (c) | 06/17/24 | 841 | 844,560 | |||||||||||
Macdermid, Inc., Tranche B-6 Term Loan, 1 Month LIBOR + 3.000% | 4.650 | (c) | 06/07/23 | 905 | 911,522 | |||||||||||
Nexeo Solutions, LLC, Term Loan B-1, 3 Month LIBOR + 3.250% | 5.063 | (c) | 06/09/23 | 1,689 | 1,707,705 | |||||||||||
Oxea Corp., Tranche B-2 Term Loan, 3 Month LIBOR + 3.500% | 5.250 | (c) | 10/11/24 | 1,845 | 1,849,988 | |||||||||||
Plaskolite LLC, Term Loan (First Lien), 3 Month LIBOR + 4.000%^ | 5.690 | (c) | 11/03/22 | 758 | 759,737 | |||||||||||
Road Infrastructure Investment Holdings, Inc., Term Loan (First Lien), 1 Month LIBOR + 3.500% | 5.070 | (c) | 06/13/23 | 1,528 | 1,527,086 | |||||||||||
Sonneborn LLC, Initial US Term Loan, 1 Month LIBOR + 3.750%^ | 5.400 | (c) | 12/10/20 | 665 | 662,467 | |||||||||||
Sonneborn Refined Products BV, Initial BV Term Loan, 1 Month LIBOR + 3.750%^ | 5.400 | (c) | 12/10/20 | 117 | 116,906 | |||||||||||
See Notes to Financial Statements.
| Prudential Floating Rate Income Fund | 21 |
Schedule of Investments (continued)
as of February 28, 2018
| Description | Interest Rate | Maturity Date | Principal Amount (000)# | Value | ||||||||||||
BANK LOANS (Continued) |
| |||||||||||||||
Chemicals (cont’d.) |
| |||||||||||||||
Tronox Finance LLC, | ||||||||||||||||
First Lien Blocked Dollar Term Loan, 3 Month LIBOR + 3.000% | 4.690 | %(c) | 09/23/24 | 363 | $ | 364,929 | ||||||||||
First Lien Initial Dollar Term Loan, 3 Month LIBOR + 3.000% | 4.690 | (c) | 09/23/24 | 837 | 842,143 | |||||||||||
WR Grace & Co., Term Loan | — | (p) | 03/31/25 | 1,500 | 1,503,125 | |||||||||||
|
| |||||||||||||||
| 16,518,944 | ||||||||||||||||
Consumer 6.0% |
| |||||||||||||||
Alphabet Holding Co., Inc., First Lien Initial Term Loan, 1 Month LIBOR + 3.500% | 5.150 | (c) | 09/26/24 | 1,372 | 1,320,129 | |||||||||||
Arctic Glacier Usa, Inc., Initial Term Loan, 1 Month LIBOR + 4.250% | 5.900 | (c) | 03/20/24 | 993 | 994,154 | |||||||||||
ASP MCS Acquisition Corp, Initial Term Loan, 1 Month LIBOR + 4.750%^ | 6.400 | (c) | 05/20/24 | 1,269 | 1,276,554 | |||||||||||
Calceus Acquisition, Inc., Tranche B Term Loan, 1 Month LIBOR + 4.000%^ | 5.650 | (c) | 01/31/20 | 2,307 | 2,278,325 | |||||||||||
DG Investment Intermediate Holdings 2, Inc., | ||||||||||||||||
First Lien Initial Term Loan, 3 Month LIBOR + 3.000% | 4.660 | (c) | 02/03/25 | 948 | 945,621 | |||||||||||
Second Lien Initial Term Loan, 3 Month LIBOR + 6.750%^ | 8.410 | (c) | 02/02/26 | 500 | 502,500 | |||||||||||
Diamond (BC) BV, Initial USD Term Loan, 2 Month LIBOR + 3.000% | 4.650 | (c) | 09/06/24 | 1,825 | 1,820,437 | |||||||||||
EAB Global, Inc., First Lien Term Loan, 3 Month LIBOR + 3.750%^ | 5.480 | (c) | 11/15/24 | 1,900 | 1,907,125 | |||||||||||
Galleria Co., Term B Loan, 1 Month LIBOR + 3.000%^ | 4.630 | (c) | 09/29/23 | 499 | 501,867 | |||||||||||
Global Appliance, Inc., Tranche B Term Loan, 1 Month LIBOR + 4.000% | 5.570 | (c) | 10/04/24 | 1,097 | 1,112,337 | |||||||||||
Hoffmaster Group, Inc., First Lien Initial Term Loan, 3 Month LIBOR + 4.500% | 6.190 | (c) | 11/21/23 | 1,609 | 1,624,837 | |||||||||||
Legalzoom.Com, Inc., First Lien Initial Term Loan, 1 Month LIBOR + 4.500%^ | 6.090 | (c) | 11/21/24 | 875 | 879,375 | |||||||||||
Oak Parent, Inc., Initial Term Loan, 1 Month LIBOR + 4.500%^ | 6.150 | (c) | 10/26/23 | 1,067 | 1,018,837 | |||||||||||
Ozark Holdings LLC, Initial Term Loan, 1 Month LIBOR + 3.250% | 4.820 | (c) | 07/03/23 | 1,525 | 1,525,000 | |||||||||||
Plaze, Inc., Term Loan, 3 Month LIBOR + 3.500%^ | 5.165 | (c) | 08/01/22 | 1,899 | 1,908,763 | |||||||||||
Pods LLC, Tranche B-3 Term Loan, 1 Month LIBOR + 3.000% | 4.580 | (c) | 12/06/24 | 1,946 | 1,957,785 | |||||||||||
See Notes to Financial Statements.
| 22 |
| Description | Interest Rate | Maturity Date | Principal Amount (000)# | Value | ||||||||||||
BANK LOANS (Continued) |
| |||||||||||||||
Consumer (cont’d.) |
| |||||||||||||||
Radio Systems Corp., Term Loan, 1 Month LIBOR + 3.500%^ | 5.150 | %(c) | 05/02/24 | 946 | $ | 949,108 | ||||||||||
Recess Holdings, Inc., | ||||||||||||||||
First Lien Delayed Draw Term Loan, 3 Month LIBOR + 3.750% | 5.443 | (c) | 09/18/24 | 107 | 107,612 | |||||||||||
First Lien Initial Term Loan, 3 Month LIBOR + 3.750% | 5.250 | (c) | 09/18/24 | 791 | 794,335 | |||||||||||
Revlon Consumer Products Corp., Initial Term B Loan, 1 Month LIBOR + 3.500% | 5.150 | (c) | 09/07/23 | 1,952 | 1,555,461 | |||||||||||
Rough Country LLC, First Lien Term Loan, 1 Month LIBOR + 4.500%^ | 6.070 | (c) | 05/25/23 | 852 | 853,727 | |||||||||||
Serta Simmons Bedding LLC, First Lien Initial Term Loan, 3 Month LIBOR + 3.500% | 5.240 | (c) | 11/08/23 | 2,154 | 2,078,197 | |||||||||||
Sterling Midco Holdings, Inc., Initial Term Loan (First Lien), 1 Month LIBOR + 3.500% | 5.150 | (c) | 06/19/24 | 1,720 | 1,723,830 | |||||||||||
Strategic Partners Acquisition Corp., Initial Term Loan, 1 Month LIBOR + 3.750%^ | 5.400 | (c) | 06/30/23 | 1,435 | 1,444,000 | |||||||||||
Truck Hero, Inc., First Lien Initial Term Loan, 3 Month LIBOR + 4.000% | 5.640 | (c) | 04/22/24 | 2,015 | 2,024,321 | |||||||||||
Trugreen Limited Partnership, New Term Loan B, 3 Month LIBOR + 4.000%^ | 5.540 | (c) | 04/13/23 | 716 | 718,640 | |||||||||||
|
| |||||||||||||||
| 33,822,877 | ||||||||||||||||
Electric 2.9% |
| |||||||||||||||
Calpine Corp., Term Loan (05/15), | ||||||||||||||||
3 Month LIBOR + 2.500% | 4.200 | (c) | 01/15/24 | 2,627 | 2,632,336 | |||||||||||
3 Month LIBOR + 2.500% | 4.200 | (c) | 01/15/23 | 735 | 738,101 | |||||||||||
Dynegy, Inc., Tranche C-2 Term Loan, 1 Month LIBOR + 2.750% | 4.350 | (c) | 02/07/24 | 2,972 | 2,988,969 | |||||||||||
Helix Gen Funding LLC, Term Loan, 3 Month LIBOR + 3.750% | 5.440 | (c) | 06/03/24 | 1,904 | 1,920,823 | |||||||||||
Intergen NV, Term Advance, 1 Month LIBOR + 4.500% | 6.080 | (c) | 06/15/20 | 465 | 465,014 | |||||||||||
Lightstone Holdco LLC, | ||||||||||||||||
2018 Refinancing Term B Facility, 1 Month LIBOR + 3.750% | 5.400 | (c) | 01/30/24 | 4,268 | 4,244,131 | |||||||||||
2018 Refinancing Term C Facility, 1 Month LIBOR + 3.750%^ | 5.400 | (c) | 01/30/24 | 271 | 256,109 | |||||||||||
Powerteam Services LLC, | ||||||||||||||||
First Lien Initial Term Loan, 3 Month LIBOR + 3.250% | 4.940 | (c) | 05/06/20 | 1,199 | 1,198,870 | |||||||||||
Term Loan | — | (p) | 03/31/25 | 1,500 | 1,500,000 | |||||||||||
|
| |||||||||||||||
| 15,944,353 | ||||||||||||||||
See Notes to Financial Statements.
| Prudential Floating Rate Income Fund | 23 |
Schedule of Investments (continued)
as of February 28, 2018
| Description | Interest Rate | Maturity Date | Principal Amount (000)# | Value | ||||||||||||
BANK LOANS (Continued) |
| |||||||||||||||
Energy - Other 2.4% |
| |||||||||||||||
Ascent Resources - Marcellus LLC, | ||||||||||||||||
First Lien Term Loan, 1 - 3 Month LIBOR + 4.250% | 5.444 | %(c) | 08/04/20 | 1,417 | $ | 819,999 | ||||||||||
Second Lien Term Loan, 1 - 3 Month LIBOR + 7.500% | 8.766 | (c) | 08/04/21 | 300 | 9,250 | |||||||||||
BCP Raptor LLC, Initial Term Loan, 1 - 2 Month LIBOR + 4.250% | 5.970 | (c) | 06/24/24 | 815 | 821,490 | |||||||||||
BCP Renaissance Parent LLC, Initial Term Loan, 3 Month LIBOR + 4.000% | 5.770 | (c) | 10/31/24 | 1,650 | 1,664,850 | |||||||||||
California Resources Corp., Term Loan (08/16), 1 Month LIBOR + 10.380%^ | 11.970 | (c) | 12/31/21 | 1,275 | 1,453,500 | |||||||||||
Consol Energy, Inc., Initial Term B Loan, 1 - 3 Month LIBOR + 6.000%^ | 7.820 | (c) | 11/28/22 | 1,375 | 1,409,375 | |||||||||||
FTS International, Inc., Initial Term Loan, 1 Month LIBOR + 4.750% | 6.320 | (c) | 04/16/21 | 222 | 221,340 | |||||||||||
Lucid Energy Group II Borrower LLC, Initial Term Loan, 3 Month LIBOR + 3.000%^ | 4.590 | (c) | 01/31/25 | 2,000 | 2,005,000 | |||||||||||
Medallion Midland Acquisition LLC, Initial Term Loan, 1 Month LIBOR + 3.250%^ | 4.900 | (c) | 10/30/24 | 1,125 | 1,125,000 | |||||||||||
MEG Energy Corp. (Canada), Initial Term Loan, 3 Month LIBOR + 3.500% | 5.200 | (c) | 12/29/23 | 2,057 | 2,058,953 | |||||||||||
Navitas Midstream Midland Basin LLC, Initial Term Loan, 1 Month LIBOR + 4.500%^ | 6.090 | (c) | 12/13/24 | 2,000 | 1,995,000 | |||||||||||
|
| |||||||||||||||
| 13,583,757 | ||||||||||||||||
Energy - Refining 0.5% |
| |||||||||||||||
Citgo Petroleum Corp., Term B Loan, 3 Month LIBOR + 3.500% | 5.190 | (c) | 07/29/21 | 2,870 | 2,855,915 | |||||||||||
Foods 3.3% |
| |||||||||||||||
Agro Merchants North America Holdings, Inc., First Lien Effective Date Loan, 1 Month LIBOR + 3.750%^ | 5.400 | (c) | 12/06/24 | 875 | 883,750 | |||||||||||
Allflex Holdings III, Inc., Initial Term Loan (First Lien), Private Placement, 3 Month LIBOR + 3.250% | 5.140 | (c) | 07/17/20 | 1,025 | 1,030,161 | |||||||||||
Chefs’ Warehouse Inc., (The), Term Loan, 1 Month LIBOR + 4.000% | 5.650 | (c) | 06/22/22 | 1,074 | 1,081,954 | |||||||||||
CSM Bakery Solutions LLC, | ||||||||||||||||
First Lien Term Loan, 3 Month LIBOR + 4.000% | 5.700 | (c) | 07/03/20 | 1,561 | 1,550,605 | |||||||||||
Term Loan (Second Lien), 3 Month LIBOR + 7.750%^ | 9.450 | (c) | 07/05/21 | 600 | 588,000 | |||||||||||
JBS USA LUX SA, Initial Term Loan, 3 Month LIBOR + 2.500% | 4.100 | (c) | 10/31/22 | 3,331 | 3,313,847 | |||||||||||
See Notes to Financial Statements.
| 24 |
| Description | Interest Rate | Maturity Date | Principal Amount (000)# | Value | ||||||||||||
BANK LOANS (Continued) |
| |||||||||||||||
Foods (cont’d.) |
| |||||||||||||||
Milk Specialties Company (D/B/A MSG Nutritional Ingredients), New Term Loan, 3 Month LIBOR + 4.000% | 5.690 | %(c) | 08/16/23 | 1,781 | $ | 1,788,513 | ||||||||||
Packers Holdings LLC, Initial Term Loan, 3 Month LIBOR + 3.250% | 4.740 | (c) | 12/04/24 | 1,625 | 1,626,354 | |||||||||||
Refresco Group NV (Netherlands), | ||||||||||||||||
Facility B (USD) Loan, 3 Month LIBOR + 2.750% | 4.590 | (c) | 01/29/25 | 500 | 501,562 | |||||||||||
Term Loan^ | — | (p) | 03/31/25 | 800 | 800,000 | |||||||||||
Shearer’s Foods LLC, | ||||||||||||||||
2015 Incremental Term Loan, 3 Month LIBOR + 4.250%^ | 5.940 | (c) | 06/30/21 | 495 | 496,187 | |||||||||||
First Lien Term Loan, 3 Month LIBOR + 3.940%^ | 5.630 | (c) | 06/30/21 | 1,914 | 1,923,262 | |||||||||||
Tacala LLC, Term Loan | — | (p) | 02/28/25 | 1,100 | 1,105,500 | |||||||||||
TKC Holdings, Inc., | ||||||||||||||||
Initial Term Loan (First Lien), 2 - 3 Month LIBOR + 4.250% | 5.970 | (c) | 02/01/23 | 938 | 948,429 | |||||||||||
Second Lien Initial Term Loan, 3 Month LIBOR + 8.000% | 9.780 | (c) | 02/01/24 | 825 | 830,500 | |||||||||||
|
| |||||||||||||||
| 18,468,624 | ||||||||||||||||
Gaming 2.0% |
| |||||||||||||||
Affinity Gaming LLC, Initial Term Loan, 3 Month LIBOR + 3.500% | 5.190 | (c) | 07/03/23 | 961 | 963,458 | |||||||||||
CBAC Borrower LLC, Term B Loan, 1 Month LIBOR + 4.000% | 5.650 | (c) | 06/28/24 | 1,426 | 1,438,730 | |||||||||||
Cyan Blue Holdco 3 Limited (United Kingdom), 2017 B2 Term Loan, 3 Month LIBOR + 3.500% | 5.190 | (c) | 08/23/24 | 2,043 | 2,050,536 | |||||||||||
Everi Payments, Inc., New Term B Loan, 1 Month LIBOR + 3.500% | 5.150 | (c) | 05/09/24 | 1,244 | 1,251,005 | |||||||||||
Golden Entertainment, Inc., First Lien Term B Loan, 1 Month LIBOR + 3.000% | 4.590 | (c) | 10/21/24 | 1,725 | 1,727,156 | |||||||||||
Greektown Holdings LLC, Initial Term Loan, 1 Month LIBOR + 2.750% | 4.650 | (c) | 04/25/24 | 2,139 | 2,139,250 | |||||||||||
Scientific Games International, Inc., Term B-5 Loan, 3 Month LIBOR + 2.750% | 4.450 | (c) | 08/14/24 | 1,650 | 1,656,961 | |||||||||||
|
| |||||||||||||||
| 11,227,096 | ||||||||||||||||
Health Care & Pharmaceutical 10.4% |
| |||||||||||||||
Air Med Group Holdings, Inc., Term Loan | — | (p) | 12/31/24 | 875 | 884,062 | |||||||||||
Air Medical Group Holdings, Inc., | ||||||||||||||||
2016 New Term Loan, 3 Month LIBOR + 4.000% | 5.670 | (c) | 04/28/22 | 522 | 524,686 | |||||||||||
Initial Term Loan, 3 Month LIBOR + 3.250% | 4.940 | (c) | 04/28/22 | 843 | 847,148 | |||||||||||
See Notes to Financial Statements.
| Prudential Floating Rate Income Fund | 25 |
Schedule of Investments (continued)
as of February 28, 2018
| Description | Interest Rate | Maturity Date | Principal Amount (000)# | Value | ||||||||||||
BANK LOANS (Continued) |
| |||||||||||||||
Health Care & Pharmaceutical (cont’d.) |
| |||||||||||||||
Air Methods Corp., Initial Term Loan, 3 Month LIBOR + 3.500% | 5.190 | %(c) | 04/22/24 | 1,721 | $ | 1,726,613 | ||||||||||
Alliance Healthcare Services, Inc., | ||||||||||||||||
First Lien Initial Term Loan, 1 - 3 Month LIBOR + 4.500% | 6.190 | (c) | 10/20/23 | 1,600 | 1,605,333 | |||||||||||
Second Lien Initial Term Loan, 1 - 3 Month LIBOR + 10.000%^ | 11.690 | (c) | 04/24/24 | 825 | 829,125 | |||||||||||
Amneal Pharmaceuticals LLC, Term Loan B, 3 Month LIBOR + 3.500% | 5.190 | (c) | 11/01/19 | 2,384 | 2,392,207 | |||||||||||
Arbor Pharmaceuticals LLC, Initial Term Loan, 3 Month LIBOR + 5.000% | 6.690 | (c) | 07/05/23 | 1,191 | 1,209,158 | |||||||||||
ATI Holdings Acquisition, Inc., Initial Term Loan (First Lien), 3 Month LIBOR + 3.500%^ | 5.200 | (c) | 05/10/23 | 2,590 | 2,612,607 | |||||||||||
Avantor, Inc., Initial Dollar Term Loan, 1 Month LIBOR + 4.000% | 5.650 | (c) | 11/21/24 | 2,375 | 2,397,760 | |||||||||||
CCS Intermediate Holdings LLC, First Lien Initial Term Loan, 3 Month LIBOR + 4.000%^ | 5.690 | (c) | 07/23/21 | 1,218 | 1,138,538 | |||||||||||
Change Healthcare Holdings LLC, Closing Date Term Loan, 1 Month LIBOR + 2.750% | 4.400 | (c) | 03/01/24 | 2,363 | 2,366,714 | |||||||||||
CHS/Community Health Systems, Inc., Incremental 2021 Term H Loan, 3 Month LIBOR + 3.000% | 4.980 | (c) | 01/27/21 | 1,347 | 1,315,936 | |||||||||||
Curo Health Services Holdings, Inc., 2017 Incremental Term Loan, 2 - 3 Month LIBOR + 4.000% | 5.745 | (c) | 02/07/22 | 2,100 | 2,094,702 | |||||||||||
Encapsys LLC, First Lien Initial Term Loan, 1 Month LIBOR + 3.250% | 4.900 | (c) | 11/07/24 | 1,325 | 1,327,760 | |||||||||||
Endo Luxembourg Finance Company I SARL, Initial Term Loan, 1 Month LIBOR + 4.250% | 5.940 | (c) | 04/29/24 | 2,258 | 2,252,011 | |||||||||||
Envision Healthcare Corp., Initial Term Loan, 1 Month LIBOR + 3.000% | 4.650 | (c) | 12/01/23 | 1,133 | 1,136,322 | |||||||||||
Explorer Holdings, Inc., Initial Term Loan, 3 Month LIBOR + 3.750% | 5.520 | (c) | 05/02/23 | 1,394 | 1,405,969 | |||||||||||
FHC Health Systems, Inc., Initial Term Loan, 1 Month LIBOR + 4.000% | 5.650 | (c) | 12/23/21 | 1,622 | 1,605,600 | |||||||||||
Genoa A Qol Healthcare Company LLC, First Lien Amendment No 1 Term Loan, 1 Month LIBOR + 3.250% | 4.900 | (c) | 10/30/23 | 1,482 | 1,490,693 | |||||||||||
Kindred Healthcare, Inc., New Term Loan, 3 Month LIBOR + 3.500% | 5.250 | (c) | 04/09/21 | 2,460 | 2,465,887 | |||||||||||
Lannett Co., Inc., Initial Tranche B Term Loan, 1 Month LIBOR + 5.380%^ | 7.020 | (c) | 11/25/22 | 2,290 | 2,284,302 | |||||||||||
See Notes to Financial Statements.
| 26 |
| Description | Interest Rate | Maturity Date | Principal Amount (000)# | Value | ||||||||||||
BANK LOANS (Continued) |
| |||||||||||||||
Health Care & Pharmaceutical (cont’d.) |
| |||||||||||||||
Mallinckrodt International Finance SA, | ||||||||||||||||
2017 Term B Loan, 3 Month LIBOR + 2.750% | 4.440 | %(c) | 09/24/24 | 1,582 | $ | 1,577,784 | ||||||||||
2018 Incremental Term Loan, 3 Month LIBOR + 3.000% | 4.820 | (c) | 02/24/25 | 325 | 325,542 | |||||||||||
Medical Solutions Holdings, Inc., First Lien Closing Date Term Loan, 1 Month LIBOR + 4.250% | 5.900 | (c) | 06/14/24 | 1,147 | 1,147,933 | |||||||||||
MPH Acquisition Holdings LLC, Tranche B Term Loan, 3 Month LIBOR + 3.000% | 4.690 | (c) | 06/07/23 | 1,946 | 1,955,206 | |||||||||||
NVA Holdings, Inc., Term Loan B-3, 3 Month LIBOR + 2.750% | 4.330 | (c) | 02/03/25 | 1,675 | 1,675,000 | |||||||||||
One Call Corp., First Lien Term B Loan, 3 Month LIBOR + 4.000% | 5.690 | (c) | 11/27/20 | 487 | 467,928 | |||||||||||
Ortho-Clinical Diagnostics Holdings Luxembourg SARL, Initial Term Loan, 3 Month LIBOR + 3.750% | 5.440 | (c) | 06/30/21 | 2,028 | 2,040,371 | |||||||||||
Pharmerica Corp., First Lien Term Loan, 1 Month LIBOR + 3.500%^ | 5.080 | (c) | 12/06/24 | 1,825 | 1,836,406 | |||||||||||
Radnet Management, Inc., Term B-1 Loan (First Lien), 3 Month LIBOR + 3.750% / PRIME + 3.750% | 6.063 | (c) | 06/30/23 | 1,120 | 1,126,781 | |||||||||||
Select Medical Corp., Tranche B Term Loan, 2 - 3 Month LIBOR + 3.500% / PRIME + 2.500% | 5.780 | (c) | 03/01/21 | 2,283 | 2,295,116 | |||||||||||
Surgery Center Holdings, Inc., Initial Term Loan, 1 Month LIBOR + 3.250% | 4.900 | (c) | 09/02/24 | 1,822 | 1,821,119 | |||||||||||
Team Health Holdings, Inc., Initial Term Loan, 1 Month LIBOR + 2.750% | 4.400 | (c) | 02/06/24 | 1,886 | 1,830,356 | |||||||||||
U.S. Anesthesia Partners, Inc., Initial Term Loan (First Lien), 1 Month LIBOR + 3.000% | 4.650 | (c) | 06/24/24 | 1,200 | 1,205,000 | |||||||||||
U.S. Renal Care, Inc., First Lien Initial Term Loan, 3 Month LIBOR + 4.250% | 5.940 | (c) | 12/30/22 | 1,773 | 1,778,696 | |||||||||||
Valeant Pharmaceuticals International, Inc., Series F-4 Tranche B Term Loan, 1 Month LIBOR + 3.500% | 5.080 | (c) | 04/01/22 | 934 | 943,994 | |||||||||||
|
| |||||||||||||||
| 57,940,365 | ||||||||||||||||
Insurance 0.7% |
| |||||||||||||||
Amwins Group, Inc., | ||||||||||||||||
First Lien Term Loan, 1 Month LIBOR + 2.750% | 4.365 | (c) | 01/25/24 | 1,133 | 1,137,991 | |||||||||||
Second Lien Term Loan, 1 Month LIBOR + 6.750% | 8.400 | (c) | 01/24/25 | 560 | 563,400 | |||||||||||
Hyperion Insurance Group Limited - Hyperion Refinance SARL (United Kingdom), Initial Dollar Term Loan, 1 Month LIBOR + 3.500% | 5.190 | (c) | 12/20/24 | 2,100 | 2,117,850 | |||||||||||
|
| |||||||||||||||
| 3,819,241 | ||||||||||||||||
See Notes to Financial Statements.
| Prudential Floating Rate Income Fund | 27 |
Schedule of Investments (continued)
as of February 28, 2018
| Description | Interest Rate | Maturity Date | Principal Amount (000)# | Value | ||||||||||||
BANK LOANS (Continued) |
| |||||||||||||||
Media & Entertainment 4.4% |
| |||||||||||||||
A-L Parent LLC, Initial Term Loan (First Lien), 1 Month LIBOR + 3.250%^ | 4.830 | %(c) | 12/01/23 | 1,253 | $ | 1,262,091 | ||||||||||
Acosta, Inc., Tranche B-1 Loan, 1 Month LIBOR + 3.250% | 4.900 | (c) | 09/26/21 | 728 | 639,906 | |||||||||||
Advantage Sales & Marketing, Inc., | ||||||||||||||||
First Lien Initial Term Loan, 2 - 3 Month LIBOR + 3.250% | 4.960 | (c) | 07/23/21 | 878 | 863,646 | |||||||||||
Term Loan | — | (p) | 07/25/21 | 425 | 418,246 | |||||||||||
Term Loan (Second Lien), 3 Month LIBOR + 6.500% | 8.270 | (c) | 07/25/22 | 750 | 721,875 | |||||||||||
Alpha Topco Limited - Delta 2 (Lux) SARL (United Kingdom), 2018 Incremental New Facility B3 (USD) Loan, 1 Month LIBOR + 2.500% | 4.150 | (c) | 02/01/24 | 1,000 | 999,375 | |||||||||||
Ancestry.Com Operations, Inc., Term B Loan, 1 Month LIBOR + 3.250% | 4.900 | (c) | 10/19/23 | 2,269 | 2,276,269 | |||||||||||
Ascend Learning LLC, Initial Term Loan, 1 Month LIBOR + 3.000% | 4.650 | (c) | 07/12/24 | 1,000 | 1,002,500 | |||||||||||
Barbri, Inc., First Lien Initial Term Loan, 3 Month LIBOR + 4.250% | 5.730 | (c) | 12/01/23 | 775 | 774,031 | |||||||||||
Beasley Mezzanine Holdings LLC, First Lien Initial Term B Loan, 3 Month LIBOR + 4.000% | 5.590 | (c) | 11/17/23 | 694 | 694,645 | |||||||||||
Clubcorp Holdings, Inc., First Lien Term B Loan, 3 Month LIBOR + 3.250% | 4.940 | (c) | 09/18/24 | 930 | 935,288 | |||||||||||
Deluxe Entertainment Services Group, Inc., Initial Term Loan, 3 Month LIBOR + 5.500%^ | 7.270 | (c) | 02/28/20 | 1,232 | 1,216,686 | |||||||||||
Hemisphere Media Holdings LLC, Term B-1 Loan, 1 Month LIBOR + 3.500%^ | 5.150 | (c) | 02/14/24 | 942 | 920,430 | |||||||||||
Intrawest Resorts Holdings, Inc., Initial Bluebird Term Loan, 1 Month LIBOR + 3.250% | 4.900 | (c) | 07/31/24 | 1,151 | 1,154,237 | |||||||||||
Kingpin Intermediate Holdings LLC, First Lien Initial Term Loan, 3 Month LIBOR + 4.250%^ | 5.730 | (c) | 07/03/24 | 1,816 | 1,843,113 | |||||||||||
Laureate Education, Inc., Series 2024 Term Loan, 1 Month LIBOR + 3.500% | 5.150 | (c) | 04/26/24 | 3,384 | 3,401,312 | |||||||||||
Learfield Communications, Inc., Term Loan^ | — | (p) | 12/01/23 | 1,011 | 1,016,109 | |||||||||||
NEP/NCP Holdco, Inc., New Term Loan (Second Lien), 1 Month LIBOR + 7.000%^ | 8.580 | (c) | 01/23/23 | 392 | 393,826 | |||||||||||
Shutterfly, Inc., Term Loan | — | (p) | 08/17/24 | 1,200 | 1,208,250 | |||||||||||
SMG US Midco 2, Inc., First Lien Initial Term Loan, 2 Month LIBOR + 3.250% | 4.890 | (c) | 01/23/25 | 625 | 629,101 | |||||||||||
Tribune Media Co., Term C Loan, 1 Month LIBOR + 3.000% | 4.650 | (c) | 01/27/24 | 433 | 433,370 | |||||||||||
Univision Communications, Inc., 2017 Replacement Term Loan, 1 Month LIBOR + 2.750% | 4.400 | (c) | 03/15/24 | 877 | 865,771 | |||||||||||
See Notes to Financial Statements.
| 28 |
| Description | Interest Rate | Maturity Date | Principal Amount (000)# | Value | ||||||||||||
BANK LOANS (Continued) |
| |||||||||||||||
Media & Entertainment (cont’d.) |
| |||||||||||||||
VIP Cinema Holdings, Inc., First Lien Initial Term Loan, 3 Month LIBOR + 6.000% | 7.700 | %(c) | 03/01/23 | 746 | $ | 750,134 | ||||||||||
|
| |||||||||||||||
| 24,420,211 | ||||||||||||||||
Metals & Mining 0.9% |
| |||||||||||||||
Fairmount Santrol, Inc., Initial Term Loan, 3 Month LIBOR + 6.000% | 7.690 | (c) | 11/01/22 | 950 | 953,166 | |||||||||||
Metal Services LLC, 2016 New Tranche B-2 Term Loan, 3 Month LIBOR + 7.500%^ | 9.190 | (c) | 06/28/19 | 1,717 | 1,717,422 | |||||||||||
Minerals Technologies, Inc., Term B-2 Loan^ | 4.750 | 05/07/21 | 225 | 227,250 | ||||||||||||
Murray Energy Corp., Term B-2 Loan Non-PIK, 3 Month LIBOR + 7.250% | 8.940 | (c) | 04/16/20 | 1,153 | 1,008,491 | |||||||||||
Phoenix Services International LLC, Term Loan | — | (p) | 03/31/25 | 1,350 | 1,353,375 | |||||||||||
|
| |||||||||||||||
| 5,259,704 | ||||||||||||||||
Non-Captive Finance 1.5% |
| |||||||||||||||
Avolon Tlb Borrower 1 (US) LLC (Ireland), Initial Term B-2 Loan, 1 Month LIBOR + 2.250% | 3.840 | (c) | 03/21/22 | 1,599 | 1,596,526 | |||||||||||
Edelman Financial Center LLC (The), Initial Term Loan, 3 Month LIBOR + 4.250% | 5.970 | (c) | 11/11/24 | 2,025 | 2,046,937 | |||||||||||
EIG Management Co. LLC, Term Loan^ | — | (p) | 02/28/25 | 350 | 352,625 | |||||||||||
GreenSky Holdings LLC, Closing Date Term Loan, 1 Month LIBOR + 4.000%^ | 5.690 | (c) | 08/26/24 | 1,721 | 1,724,989 | |||||||||||
Istar, Inc., New Term Loan B, 1 Month LIBOR + 3.000%^ | 4.585 | (c) | 10/01/21 | 501 | 504,863 | |||||||||||
Liquidnet Holdings, Inc., Term Loan, 1 Month LIBOR + 3.750%^ | 5.400 | (c) | 07/11/24 | 1,402 | 1,405,380 | |||||||||||
Pearl Intermediate Parent LLC, | ||||||||||||||||
First Lien Delayed Draw Term Loan, 3 Month LIBOR + 2.750% | 4.523 | (c) | 01/31/25 | 125 | 124,063 | |||||||||||
First Lien Initial Term Loan, 3 Month LIBOR + 2.750% | 4.340 | (c) | 01/31/25 | 425 | 421,812 | |||||||||||
|
| |||||||||||||||
| 8,177,195 | ||||||||||||||||
Other Industry 2.5% |
| |||||||||||||||
Alixpartners LLP, 2017 Refinancing Term Loan, 2 - 3 Month LIBOR + 2.750% | 4.440 | (c) | 04/04/24 | 1,390 | 1,396,881 | |||||||||||
Allied Universal Holdco LLC, Initial Term Loan (First Lien), 3 Month LIBOR + 3.750% | 5.440 | (c) | 07/28/22 | 2,141 | 2,115,898 | |||||||||||
Altisource Solutions SARL, Term B Loan, 1 Month LIBOR + 3.500% | 5.150 | (c) | 12/09/20 | 824 | 819,404 | |||||||||||
See Notes to Financial Statements.
| Prudential Floating Rate Income Fund | 29 |
Schedule of Investments (continued)
as of February 28, 2018
| Description | Interest Rate | Maturity Date | Principal Amount (000)# | Value | ||||||||||||
BANK LOANS (Continued) |
| |||||||||||||||
Other Industry (cont’d.) |
| |||||||||||||||
Asurion LLC, Second Lien Replacement B-2 Term Loan, 1 Month LIBOR + 6.000%^ | 7.650 | %(c) | 08/04/25 | 700 | $ | 718,375 | ||||||||||
Lineage Logistics, Term Loan^ | — | (p) | 02/28/25 | 1,525 | 1,526,906 | |||||||||||
Merrill Communications LLC, Initial Term Loan, 3 Month LIBOR + 5.250%^ | 7.020 | (c) | 06/01/22 | 1,257 | 1,262,855 | |||||||||||
Nthrive, Inc., First Lien Term B-2 Loan, 1 Month LIBOR + 4.500% | 6.150 | (c) | 10/20/22 | 1,483 | 1,485,680 | |||||||||||
SAI Global CIS US Group (Australia), First Lien Initial Dollar Term Loan, 3 Month LIBOR + 4.500%^ | 6.190 | (c) | 12/08/23 | 583 | 580,237 | |||||||||||
St. George’S University Scholastic Services LLC, New Term Loan, 1 Month LIBOR + 3.750% | 5.400 | (c) | 07/06/22 | 2,348 | 2,362,276 | |||||||||||
Virtus Investment Partners, Inc., Term Loan, 1 Month LIBOR + 2.500%^ | 4.090 | (c) | 06/03/24 | 1,642 | 1,645,854 | |||||||||||
|
| |||||||||||||||
| 13,914,366 | ||||||||||||||||
Packaging 3.0% |
| |||||||||||||||
Anchor Glass Container Corp., July 2017 Additional Term Loan, 1 - 3 Month LIBOR + 2.750% | 4.365 | (c) | 12/07/23 | 613 | 613,452 | |||||||||||
Charter Nex US, Inc., First Lien Initial Term Loan, 1 Month LIBOR + 3.000% | 4.570 | (c) | 05/16/24 | 1,418 | 1,420,238 | |||||||||||
Coveris Holdings SA (Luxembourg), USD Term B-1 Loan, 3 Month LIBOR + 4.250% | 5.940 | (c) | 06/29/22 | 3,504 | 3,508,102 | |||||||||||
Crown Americas LLC, Term Loan | — | (p) | 01/31/25 | 2,675 | 2,697,152 | |||||||||||
Expera Specialty Solutions LLC, Term Loan, 1 Month LIBOR + 4.250% | 5.900 | (c) | 10/31/23 | 1,265 | 1,269,791 | |||||||||||
ICSH Parent, Inc., | ||||||||||||||||
First Lien 2017 Refinancing Term Loan, 1 Month LIBOR + 3.500%^ | 5.080 | (c) | 04/29/24 | 1,693 | 1,695,355 | |||||||||||
First Lien Delayed Draw Term Loan, 3 Month LIBOR + 3.500%^ | 5.260 | (c) | 04/29/24 | 203 | 202,771 | |||||||||||
Pregis Holding I Corp., First Lien Term Loan, 3 Month LIBOR + 3.500% | 5.190 | (c) | 05/20/21 | 1,377 | 1,378,205 | |||||||||||
Pro Mach Group, Inc., First Lien Dollar Term Loan, PRIME + 2.750% | 7.250 | (c) | 10/22/21 | 1,346 | 1,348,592 | |||||||||||
Proampac Pg Borrower LLC, Initial Term Loan (First Lien), 1 Month LIBOR + 3.500% | 5.083 | (c) | 11/20/23 | 1,535 | 1,548,692 | |||||||||||
Spectrum Holdings III Corp., | ||||||||||||||||
Closing Date Term Loan (First Lien), 1 Month LIBOR + 3.250%^ | 4.900 | (c) | 01/31/25 | 796 | 798,241 | |||||||||||
Delayed Draw Term Loan (First Lien), 3 Month LIBOR + 3.250%^ | 5.039 | (c) | 01/31/25 | 79 | 78,947 | |||||||||||
|
| |||||||||||||||
| 16,559,538 | ||||||||||||||||
See Notes to Financial Statements.
| 30 |
| Description | Interest Rate | Maturity Date | Principal Amount (000)# | Value | ||||||||||||
BANK LOANS (Continued) |
| |||||||||||||||
Real Estate 0.4% |
| |||||||||||||||
DTZ US Borrower LLC, First Lien 2015-1 Converted Term Loan, 3 Month LIBOR + 3.250% | 5.063 | %(c) | 11/04/21 | 2,398 | $ | 2,396,528 | ||||||||||
Restaurants 0.5% |
| |||||||||||||||
CEC Entertainment, Inc., First Lien Term B Loan, 1 Month LIBOR + 3.250% | 4.900 | (c) | 02/15/21 | 1,529 | 1,477,464 | |||||||||||
PF Changs China Bistro, Inc., Term Loan, 3 Month LIBOR + 5.000% | 6.510 | (c) | 08/18/22 | 1,397 | 1,374,521 | |||||||||||
|
| |||||||||||||||
| 2,851,985 | ||||||||||||||||
Retail 0.2% |
| |||||||||||||||
Sally Holdings LLC, Term B-2 Loan^ | 4.500 | 07/05/24 | 1,250 | 1,243,750 | ||||||||||||
Retailers 5.4% |
| |||||||||||||||
Academy, Ltd., Initial Term Loan, 1 - 3 Month LIBOR + 4.000% | 5.529 | (c) | 07/01/22 | 3,204 | 2,552,912 | |||||||||||
Ashco LLC, Initial Term Loan, 1 Month LIBOR + 5.000% | 6.650 | (c) | 09/25/24 | 1,920 | 1,919,707 | |||||||||||
At Home Holding III, Inc., Term Loan, 3 Month LIBOR + 3.500%^ | 5.270 | (c) | 06/03/22 | 1,399 | 1,402,765 | |||||||||||
CNT Holdings III Corp., Refinancing Term Loan, 1 Month LIBOR + 3.250% | 4.900 | (c) | 01/23/23 | 1,254 | 1,225,265 | |||||||||||
CVS Holdings I LP, | ||||||||||||||||
First Lien Initial Term Loan, 3 Month LIBOR + 3.000% | 4.790 | (c) | 02/06/25 | 1,275 | 1,271,016 | |||||||||||
Second Lien Effective Date Term Loan, 3 Month LIBOR + 6.750% | 8.540 | (c) | 01/30/26 | 275 | 273,625 | |||||||||||
Euro Garages Ltd. (United Kingdom), Term Loan | — | (p) | 02/01/25 | 925 | 923,458 | |||||||||||
Fullbeauty Brands Holdings Corp., First Lien Term Loan, 1 Month LIBOR + 4.750% | 6.400 | (c) | 10/14/22 | 1,130 | 643,208 | |||||||||||
Harbor Freight Tools USA, Inc., 2018 Initial Term Loan, 1 Month LIBOR + 2.500% | 4.150 | (c) | 08/18/23 | 1,322 | 1,324,166 | |||||||||||
Hudsons Bay Co. (Canada), Initial Term B Loan, 1 Month LIBOR + 3.250% | 4.900 | (c) | 09/30/22 | 838 | 807,117 | |||||||||||
Lands’ End, Inc., Initial Term B Loan, 1 Month LIBOR + 3.250% | 4.820 | (c) | 04/02/21 | 606 | 554,970 | |||||||||||
Leslies Poolmart, Inc., Tranche B-2 Term Loan, 2 Month LIBOR + 3.500% | 5.280 | (c) | 08/16/23 | 1,755 | 1,756,372 | |||||||||||
Lifetime Brands, Inc., Term Loan^ | — | (p) | 03/31/25 | 825 | 829,125 | |||||||||||
Men’s Wearhouse, Inc., (The), Tranche B-1 Term Loan^ | 5.000 | 06/18/21 | 2,600 | 2,574,000 | ||||||||||||
Neiman Marcus Group Ltd. LLC, Other Term Loan, 1 Month LIBOR + 3.250% | 4.830 | (c) | 10/25/20 | 2,440 | 2,061,536 | |||||||||||
See Notes to Financial Statements.
| Prudential Floating Rate Income Fund | 31 |
Schedule of Investments (continued)
as of February 28, 2018
| Description | Interest Rate | Maturity Date | Principal Amount (000)# | Value | ||||||||||||
BANK LOANS (Continued) |
| |||||||||||||||
Retailers (cont’d.) |
| |||||||||||||||
NVA Holdings, Inc., Second Lien Term Loan, 3 Month LIBOR + 7.000%^ | 8.690 | %(c) | 08/14/22 | 1,225 | $ | 1,228,062 | ||||||||||
Petco Animal Supplies, Inc., Second Amendment Term Loan, 3 Month LIBOR + 3.000% | 4.770 | (c) | 01/26/23 | 4,458 | 3,094,171 | |||||||||||
Petsmart, Inc., Tranche B-2 Loan, 1 Month LIBOR + 3.000% | 4.570 | (c) | 03/11/22 | 2,317 | 1,888,361 | |||||||||||
Staples, Inc., Closing Date Term Loan, 3 Month LIBOR + 4.000% | 5.790 | (c) | 09/12/24 | 2,618 | 2,598,799 | |||||||||||
Toys R US-Delaware, Inc., DIP Term Loan, 1 Month LIBOR + 6.750%^ | 8.400 | (c) | 01/18/19 | 1,125 | 1,105,313 | |||||||||||
|
| |||||||||||||||
| 30,033,948 | ||||||||||||||||
Supermarkets 0.5% |
| |||||||||||||||
Albertson’s LLC, | ||||||||||||||||
Replacement 2017-1 Term B-5 Loan, 3 Month LIBOR + 3.000% | 4.670 | (c) | 12/21/22 | 811 | 800,657 | |||||||||||
Replacement 2017-1 Term B-6 Loan, 3 Month LIBOR + 3.000% | 4.960 | (c) | 06/22/23 | 490 | 482,712 | |||||||||||
Supervalu, Inc., | ||||||||||||||||
Delayed Draw Term Loan, 1 Month LIBOR + 3.500% | 5.150 | (c) | 06/10/24 | 530 | 525,329 | |||||||||||
Initial Term Loan, 1 Month LIBOR + 3.500% | 5.150 | (c) | 06/10/24 | 884 | 875,548 | |||||||||||
|
| |||||||||||||||
| 2,684,246 | ||||||||||||||||
Technology 16.8% |
| |||||||||||||||
Almonde, Inc., | ||||||||||||||||
Dollar Term Loan (Second Lien), 3 Month LIBOR + 7.250% | 9.230 | (c) | 06/13/25 | 700 | 694,575 | |||||||||||
First Lien Dollar Term Loan, 3 Month LIBOR + 3.500% | 5.480 | (c) | 06/13/24 | 2,438 | 2,435,380 | |||||||||||
Aptean, Inc., Term Loan B, 3 Month LIBOR + 4.250% | 5.950 | (c) | 12/20/22 | 1,044 | 1,048,895 | |||||||||||
Avaya, Inc., Initial Term Loan, 1 Month LIBOR + 4.750% | 6.340 | (c) | 12/13/24 | 1,600 | 1,605,714 | |||||||||||
BMC Software Finance, Inc., Initial B-2 US Term Loan, 1 Month LIBOR + 3.250% | 4.900 | (c) | 09/12/22 | 6,696 | 6,712,602 | |||||||||||
Brooks Automation, Inc., Initial Term B Loan, 2 Month LIBOR + 2.500% | 4.010 | (c) | 10/04/24 | 1,325 | 1,326,656 | |||||||||||
Canyon Valor Companies, Inc., Initial Dollar Term Loan (First Lien), 3 Month LIBOR + 3.250% | 4.940 | (c) | 06/16/23 | 2,045 | 2,056,058 | |||||||||||
Casa Systems, Inc., Initial Term Loan, 3 Month LIBOR + 4.000%^ | 5.690 | (c) | 12/14/23 | 1,238 | 1,250,501 | |||||||||||
See Notes to Financial Statements.
| 32 |
| Description | Interest Rate | Maturity Date | Principal Amount (000)# | Value | ||||||||||||
BANK LOANS (Continued) |
| |||||||||||||||
Technology (cont’d.) |
| |||||||||||||||
Clover Technologies Group LLC, Initial Term Loan, 1 Month LIBOR + 4.500% | 6.150 | %(c) | 05/08/20 | 1,738 | $ | 1,364,157 | ||||||||||
Cologix Holdings, Inc., First Lien Initial Term Loan, 1 Month LIBOR + 3.000% | 4.600 | (c) | 03/20/24 | 1,441 | 1,441,009 | |||||||||||
Compuware Corp., Tranche B-3 Term Loan, 2 Month LIBOR + 3.500% | 5.150 | (c) | 12/15/21 | 2,018 | 2,042,649 | |||||||||||
Conduent Business Services LLC, Term B Loan, 1 Month LIBOR + 3.000% | 4.650 | (c) | 12/07/23 | 1,288 | 1,293,862 | |||||||||||
Convergeone Holdings Corp., Term Loan, 3 Month LIBOR + 4.750% | 6.450 | (c) | 06/20/24 | 1,642 | 1,643,802 | |||||||||||
CPI Holdco LLC, Closing Date Term Loan (First Lien), 3 Month LIBOR + 3.500% | 5.190 | (c) | 03/21/24 | 1,762 | 1,777,106 | |||||||||||
Dell International LLC, Refinancing Term B Loan, 1 Month LIBOR + 2.000% | 3.650 | (c) | 09/07/23 | 879 | 878,441 | |||||||||||
Eagleview Technology Corp., First Lien Term Loan, 3 Month LIBOR + 3.500% | 5.240 | (c) | 07/15/22 | 1,308 | 1,318,477 | |||||||||||
Equian LLC, Initial Term Loan, 1 Month LIBOR + 3.750% | 5.337 | (c) | 05/20/24 | 1,544 | 1,550,629 | |||||||||||
Evergreen Skills Lux SARL (Luxembourg), | ||||||||||||||||
First Lien Initial Term Loan, 1 Month LIBOR + 4.750% | 6.400 | (c) | 04/28/21 | 1,809 | 1,750,747 | |||||||||||
Second Lien Initial Term Loan, 1 Month LIBOR + 8.250% | 9.900 | (c) | 04/28/22 | 475 | 419,865 | |||||||||||
First Data Corp., 2022D New Dollar Term Loan, 1 Month LIBOR + 2.250% | 3.870 | (c) | 07/08/22 | 1,219 | 1,220,936 | |||||||||||
GHX Ultimate Parent Corp., First Lien Initial Term Loan, 3 Month LIBOR + 3.000% | 4.690 | (c) | 06/28/24 | 920 | 922,676 | |||||||||||
Global Tel Link Corp., Term Loan (First Lien), 3 Month LIBOR + 4.000% | 5.690 | (c) | 05/22/20 | 2,487 | 2,496,551 | |||||||||||
Globallogic Holdings, Inc., Refinancing Term B-1 Loan, 2 Month LIBOR + 3.750%^ | 5.440 | (c) | 06/20/22 | 993 | 997,462 | |||||||||||
Greeneden US Holdings II LLC, Tranche B-2 Dollar Term Loan, 3 Month LIBOR + 3.750% | 5.440 | (c) | 12/01/23 | 2,155 | 2,165,049 | |||||||||||
Informatica LLC, Dollar Term B-1 Loan, 3 Month LIBOR + 3.250% | 4.940 | (c) | 08/05/22 | 2,357 | 2,366,894 | |||||||||||
Information Resources, Inc., First Lien Initial Term Loan, 3 Month LIBOR + 4.250% | 6.190 | (c) | 01/18/24 | 1,863 | 1,875,036 | |||||||||||
Kronos, Inc., | ||||||||||||||||
Refinancing Initial Term Loan, 2 - 3 Month LIBOR + 3.500% | 5.220 | (c) | 11/01/23 | 1,530 | 1,539,305 | |||||||||||
Second Lien Initial Term Loan, 3 Month LIBOR + 8.250% | 10.020 | (c) | 11/01/24 | 400 | 414,400 | |||||||||||
See Notes to Financial Statements.
| Prudential Floating Rate Income Fund | 33 |
Schedule of Investments (continued)
as of February 28, 2018
| Description | Interest Rate | Maturity Date | Principal Amount (000)# | Value | ||||||||||||
BANK LOANS (Continued) |
| |||||||||||||||
Technology (cont’d.) |
| |||||||||||||||
Lattice Semiconductor Corp., Term Loan, 1 Month LIBOR + 4.250%^ | 5.830 | %(c) | 03/10/21 | 2,049 | $ | 2,069,788 | ||||||||||
MA Financeco LLC (United Kingdom), | ||||||||||||||||
Tranche B-2 Term Loan, 1 Month LIBOR + 2.500% | 4.150 | (c) | 11/19/21 | 1,462 | 1,460,485 | |||||||||||
Tranche B-3 Term Loan, 1 Month LIBOR + 2.750% | 4.400 | (c) | 06/21/24 | 316 | 316,392 | |||||||||||
Marketo, Inc., Term Loan, 3 Month LIBOR + 3.250% | 5.040 | (c) | 02/07/25 | 1,600 | 1,596,000 | |||||||||||
Masergy Holdings, Inc., 2017 Replacement Term Loan (First Lien), 3 Month LIBOR + 3.250% | 5.440 | (c) | 12/15/23 | 1,535 | 1,536,418 | |||||||||||
Mcafee, LLC, | ||||||||||||||||
Closing Date USD Term Loan, 1 Month LIBOR + 4.500% | 6.150 | (c) | 09/30/24 | 2,544 | 2,555,814 | |||||||||||
Second Lien Initial Loan, 1 Month LIBOR + 8.500% | 10.150 | (c) | 09/29/25 | 900 | 900,000 | |||||||||||
Micro Holding Corp., Amendment No 2 Initial Term Loan, 3 Month LIBOR + 3.750% | 5.340 | (c) | 09/13/24 | 2,131 | 2,128,896 | |||||||||||
Mitel Us Holdings, Inc. (Canada), Incremental Term Loan, 2 Month LIBOR + 3.750% | 5.400 | (c) | 09/25/23 | 1,897 | 1,915,465 | |||||||||||
Neustar, Inc., | ||||||||||||||||
First Lien Term Loan B2, 2 Month LIBOR + 3.750% | 5.420 | (c) | 08/08/24 | 1,022 | 1,022,864 | |||||||||||
Second Lien Initial Term Loan, 2 Month LIBOR + 8.000% | 9.670 | (c) | 08/08/25 | 350 | 351,859 | |||||||||||
Peak 10 Holding Corp., First Lien Initial Term Loan, 3 Month LIBOR + 3.500% | 5.190 | (c) | 08/01/24 | 2,546 | 2,552,490 | |||||||||||
Ping Identity Corp., Term Loan, 1 Month LIBOR + 3.750%^ | 5.370 | (c) | 01/23/25 | 850 | 854,250 | |||||||||||
Quest Software US Holdings, Inc , First Lien Refinancing Term Loan, 3 Month LIBOR + 5.500% | 7.270 | (c) | 10/31/22 | 1,638 | 1,663,211 | |||||||||||
Rackspace Hosting, Inc., 2017 Term B Loan, 3 Month LIBOR + 3.000% | 4.730 | (c) | 11/03/23 | 3,028 | 3,035,589 | |||||||||||
Sandvine Corp. (Canada), Initial Term Loan, 3 Month LIBOR + 5.750% | 7.320 | (c) | 09/21/22 | 998 | 991,266 | |||||||||||
SCS Holdings I, Inc., | ||||||||||||||||
Initial Term Loan (Second Lien), 1 Month LIBOR + 9.500% | 11.150 | (c) | 10/30/23 | 250 | 251,250 | |||||||||||
New Tranche B Term Loan (First Lien), 1 Month LIBOR + 4.250% | 5.900 | (c) | 10/31/22 | 2,084 | 2,098,593 | |||||||||||
Seattle Escrow Borrower LLC, Term Loan, 1 Month LIBOR + 2.750% | 4.400 | (c) | 06/21/24 | 2,134 | 2,136,671 | |||||||||||
Securus Technologies Holdings, Inc., Initial Term Loan (First Lien), 1 Month LIBOR + 4.500% | 6.150 | (c) | 11/01/24 | 1,950 | 1,970,475 | |||||||||||
SS&C TECH, Inc., Term Loan | — | (p) | 06/30/25 | 1,875 | 1,884,552 | |||||||||||
See Notes to Financial Statements.
| 34 |
| Description | Interest Rate | Maturity Date | Principal Amount (000)# | Value | ||||||||||||
BANK LOANS (Continued) |
| |||||||||||||||
Technology (cont’d.) |
| |||||||||||||||
Syniverse Holdings, Inc., | ||||||||||||||||
Initial Term Loan, 1 Month LIBOR + 3.000% | 4.650 | %(c) | 04/23/19 | 1,025 | $ | 1,026,922 | ||||||||||
Term Loan | — | (p) | 04/30/23 | 1,925 | 1,933,021 | |||||||||||
Tempo Acquisition LLC, Initial Term Loan, 1 Month LIBOR + 3.000% | 4.650 | (c) | 05/01/24 | 2,864 | 2,869,827 | |||||||||||
Tibco Software, Inc., Term B-1 Loan, 1 Month LIBOR + 3.500% | 5.150 | (c) | 12/04/20 | 1,585 | 1,589,415 | |||||||||||
TTM Technology, Inc., Term Loan^ | — | (p) | 09/28/24 | 875 | 878,281 | |||||||||||
Vestcom Parent Holdings, Inc., Term Loan, 1 Month LIBOR + 4.000% / PRIME + 3.000%^ | 6.535 | (c) | 12/19/23 | 1,980 | 1,989,900 | |||||||||||
West Corp., First Lien Term B Loan, 1 Month LIBOR + 4.000% | 5.650 | (c) | 10/10/24 | 2,075 | 2,092,003 | |||||||||||
Western Digital Corp., US Term B-3 Loan, 1 Month LIBOR + 2.000% | 3.600 | (c) | 04/29/23 | 1,604 | 1,610,083 | |||||||||||
|
| |||||||||||||||
| 93,891,214 | ||||||||||||||||
Telecommunications 4.2% | ||||||||||||||||
CenturyLink, Inc., Initial Term B Loan, 1 Month LIBOR + 2.750% | 4.400 | (c) | 01/31/25 | 4,900 | 4,822,825 | |||||||||||
Coral US Co-Borrower LLC, Term B-4 Loan, 3 Month LIBOR + 3.250% | 4.890 | (c) | 02/02/26 | 2,625 | 2,617,206 | |||||||||||
Digicel International Finance Ltd., First Lien Initial Term B Loan, 3 Month LIBOR + 3.250% | 5.020 | (c) | 05/27/24 | 2,819 | 2,823,449 | |||||||||||
Frontier Communications Corp., Term B-1 Loan, 1 Month LIBOR + 3.750% | 5.400 | (c) | 06/15/24 | 3,632 | 3,560,931 | |||||||||||
Global Tel Link Corp., Term Loan (Second Lien), 3 Month LIBOR + 8.250%^ | 9.940 | (c) | 11/23/20 | 600 | 597,000 | |||||||||||
GTT Communications, Inc., Tranche B Term Loan, 1 Month LIBOR + 3.250% | 4.940 | (c) | 01/09/24 | 1,832 | 1,837,797 | |||||||||||
IPC Corp., Term B-1 Loan (First Lien), 3 Month LIBOR + 4.500%^ | 6.280 | (c) | 08/06/21 | 757 | 742,162 | |||||||||||
Ring Container Technologies LLC, First Lien Initial Term Loan, 1 Month LIBOR + 2.750% | 4.400 | (c) | 10/31/24 | 1,100 | 1,104,125 | |||||||||||
Securus Technologies Holdings, Inc., Second Lien Initial Loan, 1 Month LIBOR + 8.250% | 9.900 | (c) | 11/03/25 | 600 | 607,500 | |||||||||||
Sprint Communications, Inc., Initial Term Loan, 1 Month LIBOR + 2.500% | 4.190 | (c) | 02/02/24 | 3,495 | 3,493,228 | |||||||||||
TVC Albany, Inc., Term Loan B, 3 Month LIBOR + 4.000%^ | 5.690 | (c) | 08/31/24 | 698 | 701,741 | |||||||||||
Windstream Services LLC, Tranche B-7 Term Loan, 1 Month LIBOR + 3.250% | 4.840 | (c) | 02/17/24 | 693 | 610,236 | |||||||||||
|
| |||||||||||||||
| 23,518,200 | ||||||||||||||||
See Notes to Financial Statements.
| Prudential Floating Rate Income Fund | 35 |
Schedule of Investments (continued)
as of February 28, 2018
| Description | Interest Rate | Maturity Date | Principal Amount (000)# | Value | ||||||||||||
BANK LOANS (Continued) |
| |||||||||||||||
Transportation 0.9% |
| |||||||||||||||
Apro LLC, Initial Term Loan, 1 Month LIBOR + 4.000% | 5.590 | %(c) | 08/08/24 | 979 | $ | 984,062 | ||||||||||
Daseke Companies, Inc., Replacement Term Loan, 1 Month LIBOR + 5.000% | 6.650 | (c) | 02/27/24 | 1,047 | 1,052,159 | |||||||||||
REP Wwex Acquisition Parent LLC, Term Loan, 3 Month LIBOR + 4.000%^ | 5.480 | (c) | 02/05/24 | 1,738 | 1,733,777 | |||||||||||
Transplace Holdings, Inc., | ||||||||||||||||
First Lien Closing Date Term Loan, 1 Month LIBOR + 4.250% | 5.830 | (c) | 10/07/24 | 850 | 857,438 | |||||||||||
Second Lien Initial Loan, 1 Month LIBOR + 8.750%^ | 10.330 | (c) | 09/29/25 | 225 | 221,625 | |||||||||||
|
| |||||||||||||||
| 4,849,061 | ||||||||||||||||
|
| |||||||||||||||
TOTAL BANK LOANS |
| 503,674,970 | ||||||||||||||
|
| |||||||||||||||
CORPORATE BONDS 4.1% |
| |||||||||||||||
Agriculture 0.1% |
| |||||||||||||||
Vector Group Ltd., Sr. Sec’d. Notes, 144A | 6.125 | 02/01/25 | 700 | 714,875 | ||||||||||||
Computers 0.5% |
| |||||||||||||||
Dell International LLC/EMC Corp., Gtd. Notes, 144A | 5.875 | 06/15/21 | 1,000 | 1,022,500 | ||||||||||||
Exela Intermediate LLC/Exela Finance, Inc., Sr. Sec’d. Notes, 144A | 10.000 | 07/15/23 | 2,000 | 1,992,500 | ||||||||||||
|
| |||||||||||||||
| 3,015,000 | ||||||||||||||||
Cosmetics/Personal Care 0.0% |
| |||||||||||||||
First Quality Finance Co., Inc., Sr. Unsec’d. Notes, 144A | 4.625 | 05/15/21 | 140 | 139,300 | ||||||||||||
Distribution/Wholesale 0.2% |
| |||||||||||||||
Global Partners LP/GLP Finance Corp., Gtd. Notes | 6.250 | 07/15/22 | 1,125 | 1,127,812 | ||||||||||||
Electric 0.1% |
| |||||||||||||||
NRG Energy, Inc., Gtd. Notes | 7.250 | 05/15/26 | 550 | 587,070 | ||||||||||||
Entertainment 0.2% |
| |||||||||||||||
Cinemark USA, Inc., Gtd. Notes | 5.125 | 12/15/22 | 250 | 253,750 | ||||||||||||
Scientific Games International, Inc., Sr. Sec’d. Notes, 144A | 7.000 | 01/01/22 | 625 | 657,813 | ||||||||||||
|
| |||||||||||||||
| 911,563 | ||||||||||||||||
See Notes to Financial Statements.
| 36 |
| Description | Interest Rate | Maturity Date | Principal Amount (000)# | Value | ||||||||||||
CORPORATE BONDS (Continued) |
| |||||||||||||||
Foods 0.2% |
| |||||||||||||||
Pilgrim’s Pride Corp., Gtd. Notes, 144A | 5.750 | % | 03/15/25 | 915 | $ | 910,425 | ||||||||||
Healthcare-Products 0.0% |
| |||||||||||||||
Mallinckrodt International Finance SA, Gtd. Notes(a) | 4.750 | 04/15/23 | 200 | 157,000 | ||||||||||||
Healthcare-Services 0.6% |
| |||||||||||||||
CHS/Community Health Systems, Inc., | ||||||||||||||||
Gtd. Notes(a) | 8.000 | 11/15/19 | 250 | 235,128 | ||||||||||||
Sr. Sec’d. Notes | 6.250 | 03/31/23 | 1,050 | 955,500 | ||||||||||||
Select Medical Corp., Gtd. Notes | 6.375 | 06/01/21 | 500 | 509,950 | ||||||||||||
Tenet Healthcare Corp., | ||||||||||||||||
Sr. Sec’d. Notes | 6.000 | 10/01/20 | 650 | 675,993 | ||||||||||||
Sr. Unsec’d. Notes | 8.125 | 04/01/22 | 700 | 738,500 | ||||||||||||
Universal Health Services, Inc., Sr. Sec’d. Notes, 144A | 4.750 | 08/01/22 | 250 | 253,125 | ||||||||||||
|
| |||||||||||||||
| 3,368,196 | ||||||||||||||||
Lodging 0.1% |
| |||||||||||||||
Jack Ohio Finance LLC/Jack Ohio Finance 1 Corp., Sr. Sec’d. Notes, 144A | 6.750 | 11/15/21 | 750 | 781,478 | ||||||||||||
Media 0.4% |
| |||||||||||||||
Cequel Communications Holdings I LLC/Cequel Capital Corp., Sr. Unsec’d. Notes, 144A | 6.375 | 09/15/20 | 750 | 758,437 | ||||||||||||
DISH DBS Corp., Gtd. Notes | 7.875 | 09/01/19 | 250 | 263,750 | ||||||||||||
Mediacom Broadband LLC/Mediacom Broadband Corp., Sr. Unsec’d. Notes | 6.375 | 04/01/23 | 750 | 768,675 | ||||||||||||
Sinclair Television Group, Inc., Gtd. Notes, 144A | 5.875 | 03/15/26 | 250 | 252,500 | ||||||||||||
|
| |||||||||||||||
| 2,043,362 | ||||||||||||||||
Miscellaneous Manufacturing 0.1% |
| |||||||||||||||
Bombardier, Inc. (Canada), Sr. Unsec’d. Notes, 144A | 8.750 | 12/01/21 | 750 | 822,188 | ||||||||||||
Oil & Gas 0.6% |
| |||||||||||||||
Alta Mesa Holdings LP/Alta Mesa Finance Sevices Corp., Gtd. Notes | 7.875 | 12/15/24 | 450 | 479,250 | ||||||||||||
Citgo Holding, Inc., Sr. Sec’d. Notes, 144A | 10.750 | 02/15/20 | 1,000 | 1,072,500 | ||||||||||||
CNX Resources Corp., Gtd. Notes | 8.000 | 04/01/23 | 1,500 | 1,588,125 | ||||||||||||
|
| |||||||||||||||
| 3,139,875 | ||||||||||||||||
Pharmaceuticals 0.7% |
| |||||||||||||||
Valeant Pharmaceuticals International, Inc., Sr. Sec’d. Notes, 144A | 6.500 | 03/15/22 | 3,500 | 3,640,000 | ||||||||||||
See Notes to Financial Statements.
| Prudential Floating Rate Income Fund | 37 |
Schedule of Investments (continued)
as of February 28, 2018
| Description | Interest Rate | Maturity Date | Principal Amount (000)# | Value | ||||||||||||
CORPORATE BONDS (Continued) |
| |||||||||||||||
Real Estate Investment Trusts (REITs) 0.1% |
| |||||||||||||||
MGM Growth Properties Operating Partnership LP/MGP Finance Co-Issuer, Inc., Gtd. Notes | 4.500 | % | 01/15/28 | 300 | $ | 283,500 | ||||||||||
Retail 0.1% |
| |||||||||||||||
Cumberland Farms, Inc., Sr. Unsec’d. Notes, 144A | 6.750 | 05/01/25 | 325 | 341,250 | ||||||||||||
Rite Aid Corp., Gtd. Notes, 144A | 6.125 | 04/01/23 | 500 | 502,500 | ||||||||||||
|
| |||||||||||||||
| 843,750 | ||||||||||||||||
Software 0.1% |
| |||||||||||||||
First Data Corp., Gtd. Notes, 144A | 7.000 | 12/01/23 | 500 | 525,625 | ||||||||||||
|
| |||||||||||||||
TOTAL CORPORATE BONDS | 23,011,019 | |||||||||||||||
|
| |||||||||||||||
Shares | ||||||||||||||||
COMMON STOCK 0.1% |
| |||||||||||||||
Technology |
| |||||||||||||||
Avaya Holdings Corp. | 32,696 | 686,289 | ||||||||||||||
|
| |||||||||||||||
TOTAL LONG-TERM INVESTMENTS |
| 529,873,965 | ||||||||||||||
|
| |||||||||||||||
SHORT-TERM INVESTMENTS 5.8% |
| |||||||||||||||
AFFILIATED MUTUAL FUNDS |
| |||||||||||||||
Prudential Investment Portfolios 2 - Prudential Core Ultra Short Bond Fund(w) | 31,815,753 | 31,815,753 | ||||||||||||||
Prudential Investment Portfolios 2 - Prudential Institutional Money Market Fund | 406,298 | 406,298 | ||||||||||||||
|
| |||||||||||||||
TOTAL SHORT-TERM INVESTMENTS |
| 32,222,051 | ||||||||||||||
|
| |||||||||||||||
TOTAL INVESTMENTS 100.6% |
| 562,096,016 | ||||||||||||||
Liabilities in excess of other assets(z) (0.6)% |
| (3,078,174 | ) | |||||||||||||
|
| |||||||||||||||
NET ASSETS 100.0% |
| $ | 559,017,842 | |||||||||||||
|
| |||||||||||||||
See Notes to Financial Statements.
| 38 |
The following abbreviations are used in the annual report:
144A—Security was purchased pursuant to Rule 144A under the Securities Act of 1933 and may not be resold subject to that rule except to qualified institutional buyers. Unless otherwise noted, 144A securities are deemed to be liquid.
M—Monthly payment frequency for swaps
Q—Quarterly payment frequency for swaps
S—Semiannual payment frequency for swaps
CLO—Collateralized Loan Obligation
L2—Level 2
L3—Level 3
LIBOR—London Interbank Offered Rate
OTC—Over-the-counter
| ^ | Indicates a Level 3 security. The aggregate value of Level 3 securities is $103,273,618 and 18.5% of net assets. |
| * | Non-income producing security. |
| # | Principal amount shown in U.S. dollars unless otherwise stated. |
| (a) | All or a portion of security is on loan. The aggregate market value of such securities, including those sold and pending settlement, is $391,648; cash collateral of $405,288 (included in liabilities) was received with which the Fund purchased highly liquid short-term investments. Securities on loan are subject to contractual netting arrangements. |
| (b) | Represents security purchased with cash collateral received for securities on loan and includes dividend reinvestment. |
| (c) | Variable rate instrument. The interest rate shown reflects the rate in effect at February 28, 2018. |
| (p) | Interest rate not available as of February 28, 2018. |
| (w) | PGIM Investments LLC, the manager of the Fund, also serves as manager of the Prudential Investment Portfolios 2 - Prudential Core Ultra Short Bond Fund and Prudential Institutional Money Market Fund. |
| (z) | Includes net unrealized appreciation (depreciation) on the following derivative contracts held at reporting period end: |
See Notes to Financial Statements.
| Prudential Floating Rate Income Fund | 39 |
Schedule of Investments (continued)
as of February 28, 2018
Credit default swap agreements outstanding at February 28, 2018:
Reference Entity/ Obligation | Termination Date | Fixed Rate | Notional Amount (000)#(3) | Fair Value(4) | Upfront Premiums Paid (Received) | Unrealized Appreciation (Depreciation) | Counterparty | |||||||||||||||||||
OTC credit default swaps on asset-backed securities—Sell Protection(2)^: | ||||||||||||||||||||||||||
3i Debt Management | 04/13/18 | 1.000%(M) | 907 | $ | 1,046 | $ | — | $ | 1,046 | Goldman Sachs & Co. | ||||||||||||||||
3i Debt Management | 04/13/18 | 1.000%(M) | 667 | 832 | — | 832 | Goldman Sachs & Co. | |||||||||||||||||||
3i Debt Management | 04/13/18 | 1.000%(M) | 231 | 266 | — | 266 | Goldman Sachs & Co. | |||||||||||||||||||
Anchorage Capital CLO Ltd. | 04/13/18 | 1.000%(M) | 1,127 | 1,407 | — | 1,407 | Goldman Sachs & Co. | |||||||||||||||||||
Anchorage Capital CLO Ltd. | 04/13/18 | 1.000%(M) | 796 | 993 | — | 993 | Goldman Sachs & Co. | |||||||||||||||||||
Angelogordon CLO | 04/13/18 | 1.000%(M) | 540 | 623 | — | 623 | Goldman Sachs & Co. | |||||||||||||||||||
Atlas Senior Loan Fund Ltd. | 04/13/18 | 1.000%(M) | 537 | 670 | — | 670 | Goldman Sachs & Co. | |||||||||||||||||||
Cutwater Ltd. | 04/13/18 | 1.000%(M) | 135 | 168 | — | 168 | Goldman Sachs & Co. | |||||||||||||||||||
Ellington CLO I Ltd. | 04/13/18 | 1.000%(M) | 369 | 460 | — | 460 | Goldman Sachs & Co. | |||||||||||||||||||
GoldenTree | 04/13/18 | 1.000%(M) | 92 | 115 | — | 115 | Goldman Sachs & Co. | |||||||||||||||||||
Hildene CLO | 04/13/18 | 1.000%(M) | 129 | 160 | — | 160 | Goldman Sachs & Co. | |||||||||||||||||||
Invesco | 04/13/18 | 1.000%(M) | 470 | 542 | — | 542 | Goldman Sachs & Co. | |||||||||||||||||||
Invesco | 04/13/18 | 1.000%(M) | 356 | 411 | — | 411 | Goldman Sachs & Co. | |||||||||||||||||||
Invesco | 04/13/18 | 1.000%(M) | 208 | 240 | — | 240 | Goldman Sachs & Co. | |||||||||||||||||||
KVK CLO Ltd. | 04/13/18 | 1.000%(M) | 244 | 281 | — | 281 | Goldman Sachs & Co. | |||||||||||||||||||
OCH Ziff Loan Management Funding Ltd. | 04/13/18 | 1.000%(M) | 249 | 311 | — | 311 | Goldman Sachs & Co. | |||||||||||||||||||
Octagon | 04/13/18 | 1.000%(M) | 1,563 | 1,950 | — | 1,950 | Goldman Sachs & Co. | |||||||||||||||||||
Par-Four | 04/13/18 | 1.000%(M) | 329 | 410 | — | 410 | Goldman Sachs & Co. | |||||||||||||||||||
Pretium | 04/13/18 | 1.000%(M) | 261 | 325 | — | 325 | Goldman Sachs & Co. | |||||||||||||||||||
Trimaran | 04/13/18 | 1.000%(M) | 548 | 684 | — | 684 | Goldman Sachs & Co. | |||||||||||||||||||
See Notes to Financial Statements.
| 40 |
Credit default swap agreements outstanding at February 28, 2018 (continued):
Reference Entity/ Obligation | Termination Date | Fixed Rate | Notional Amount (000)#(3) | Fair Value(4) | Upfront Premiums Paid (Received) | Unrealized Appreciation (Depreciation) | Counterparty | |||||||||||||||||||
OTC credit default swaps on asset-backed securities—Sell Protection(2)^ (cont’d.): | ||||||||||||||||||||||||||
Trimaran | 04/13/18 | 1.000%(M) | 165 | $ | 205 | $ | — | $ | 205 | Goldman Sachs & Co. | ||||||||||||||||
Trinitas CLO Ltd. | 04/13/18 | 1.000%(M) | 294 | 366 | — | 366 | Goldman Sachs & Co. | |||||||||||||||||||
WAMCO | 04/13/18 | 1.000%(M) | 372 | 429 | — | 429 | Goldman Sachs & Co. | |||||||||||||||||||
|
|
|
|
|
| |||||||||||||||||||||
| $ | 12,894 | $ | — | $ | 12,894 | |||||||||||||||||||||
|
|
|
|
|
| |||||||||||||||||||||
The Fund entered into credit default swaps (“CDS”) to provide a measure of protection against defaults or to take an active long or short position with respect to the likelihood of a particular issuer’s default or the reference entity’s credit soundness. CDS contracts generally trade based on a spread which represents the cost a protection buyer has to pay the protection seller. The protection buyer is said to be short the credit as the value of the contract rises the more the credit deteriorates. The value of the CDS contract increases for the protection buyer if the spread increases.
| (1) | If the Fund is a buyer of protection, it pays the fixed rate. When a credit event occurs, as defined under the terms of that particular swap agreement, the Fund will either (i) receive from the seller of protection an amount equal to the notional amount of the swap and make delivery of the referenced obligation or underlying securities comprising the referenced index or (ii) receive a net settlement amount in the form of cash or securities equal to the notional amount of the swap less the recovery value of the referenced obligation or underlying securities comprising the referenced index. |
| (2) | If the Fund is a seller of protection, it receives the fixed rate. When a credit event occurs, as defined under the terms of that particular swap agreement, the Fund will either (i) pay to the buyer of protection an amount equal to the notional amount and take delivery of the referenced obligation or underlying securities comprising the referenced index or (ii) pay a net settlement amount in the form of cash or securities equal to the notional amount of the swap less the recovery value of the referenced obligation or underlying securities comprising the referenced index. |
| (3) | Notional amount represents the maximum potential amount the Fund could be required to pay as a seller of credit protection or receive as a buyer of credit protection if a credit event occurs as defined under the terms of that particular swap agreement. |
| (4) | The fair value of credit default swap agreements on credit indices and asset-backed securities serves as an indicator of the current status of the payment/performance risk and represents the likelihood of an expected liability (or profit) for the credit derivative should the notional amount of the swap agreement be closed/sold as of the reporting date. Increasing fair value in absolute terms, when compared to the notional amount of the swap, represents a deterioration of the referenced entity’s credit soundness and a greater likelihood of risk of default or other credit event occurring as defined under the terms of the agreement. |
| (5) | Implied credit spreads, represented in absolute terms, utilized in determining the fair value of credit default swap agreements on corporate issues or sovereign issues of an emerging country as of the reporting date serve as an indicator of the current status of the payment/performance risk and represent the likelihood of risk of default for the credit derivative. The implied credit spread of a particular referenced entity reflects the cost of buying/selling protection and may include up-front payments required to be made to enter into the agreement. Wider credit spreads represent a deterioration of the referenced entity’s credit soundness and a greater likelihood of risk of default or other credit event occurring as defined under the terms of the agreement. |
See Notes to Financial Statements.
| Prudential Floating Rate Income Fund | 41 |
Schedule of Investments (continued)
as of February 28, 2018
Interest rate swap agreements outstanding at February 28, 2018:
Notional | Termination | Fixed Rate | Floating Rate | Value at Trade Date | Value at February 28, 2018 | Unrealized Appreciation (Depreciation) | ||||||||||||||
Centrally cleared swap agreements: | ||||||||||||||||||||
| 4,800 | 02/03/19 | 1.538%(S) | 3 Month LIBOR(1)(Q) | (1,913 | ) | 33,364 | 35,277 | |||||||||||||
| 9,350 | 02/02/22 | 1.994%(S) | 3 Month LIBOR(1)(Q) | (8,646 | ) | 249,642 | 258,288 | |||||||||||||
| 7,200 | 02/03/24 | 2.228%(S) | 3 Month LIBOR(1)(Q) | (53,105 | ) | 216,680 | 269,785 | |||||||||||||
|
|
|
|
|
| |||||||||||||||
| $ | (63,664 | ) | $ | 499,686 | $ | 563,350 | ||||||||||||||
|
|
|
|
|
| |||||||||||||||
Cash of $595,000 has been segregated with Citigroup Global Markets to cover requirements for open centrally cleared swap contracts at February 28, 2018.
| (1) | The Fund pays the fixed rate and receives the floating rate. |
| (2) | The Fund pays the floating rate and receives the fixed rate. |
Balances Reported in the Statement of Assets and Liabilities for OTC Swap Agreements:
| Premiums Paid | Premiums Received | Unrealized Appreciation | Unrealized Depreciation | |||||||||||||
OTC Swap Agreements | $ | — | $ | — | $ | 12,894 | $ | — | ||||||||
Fair Value Measurements:
Various inputs are used in determining the value of the Fund’s investments. These inputs are summarized in the three broad levels listed below.
Level 1—unadjusted quoted prices generally in active markets for identical securities.
Level 2—quoted prices for similar securities, interest rates and yield curves, prepayment speeds, foreign currency exchange rates and other observable inputs.
Level 3—unobservable inputs for securities valued in accordance with Board approved fair valuation procedures.
The following is a summary of the inputs used as of February 28, 2018 in valuing such portfolio securities:
| Level 1 | Level 2 | Level 3 | ||||||||||
Investments in Securities | ||||||||||||
Asset-Backed Security | ||||||||||||
Collateralized Loan Obligation | $ | — | $ | 2,501,687 | $ | — | ||||||
Bank Loans | — | 400,414,246 | 103,260,724 | |||||||||
Corporate Bonds | — | 23,011,019 | — | |||||||||
Common Stock | 686,289 | — | — | |||||||||
Affiliated Mutual Funds | 32,222,051 | — | — | |||||||||
See Notes to Financial Statements.
| 42 |
| Level 1 | Level 2 | Level 3 | ||||||||||
Investments in Securities (continued) | ||||||||||||
Other Financial Instruments* | ||||||||||||
OTC Credit Default Swap Agreements | $ | — | $ | — | $ | 12,894 | ||||||
Centrally Cleared Interest Rate Swap Agreements | — | 563,350 | — | |||||||||
|
|
|
|
|
| |||||||
Total | $ | 32,908,340 | $ | 426,490,302 | $ | 103,273,618 | ||||||
|
|
|
|
|
| |||||||
The following is a reconciliation of assets in which unobservable inputs (Level 3) were used in determining fair value:
| Bank Loans | Common Stock | Credit Default Swap Agreements | ||||||||||
Balance as of 02/28/17 | $ | 56,716,839 | $ | 35,076 | $ | — | ||||||
Realized gain (loss) | 176,783 | 22,980 | — | |||||||||
Change in unrealized appreciation (depreciation)** | 486,956 | (25,400 | ) | 12,894 | ||||||||
Purchases/Exchanges/Issuances | 68,188,130 | — | — | |||||||||
Sales/Paydowns | (34,995,527 | ) | (32,656 | ) | — | |||||||
Accrued discounts/premiums | 142,577 | — | — | |||||||||
Transfers into Level 3 | 20,672,722 | — | — | |||||||||
Transfers out of Level 3 | (8,127,756 | ) | — | — | ||||||||
|
|
|
|
|
| |||||||
Balance as of 02/28/18 | $ | 103,260,724 | $ | — | $ | 12,894 | ||||||
|
|
|
|
|
| |||||||
| * | Other financial instruments are derivative instruments not reflected in the Schedule of Investments, such as futures, forwards and centrally cleared swap contracts, which are recorded at the unrealized appreciation (depreciation) on the instrument, and OTC swap contracts which are recorded at fair value. |
| ** | Of which, $803,458 was relating to securities held at the reporting period end. |
Level 3 securities as presented in the table above are being fair valued using pricing methodologies approved by the Board, which contain unobservable inputs as follows:
Level 3 Securities | Fair Value as of February 28, 2018 | Valuation Methodology | Unobservable Inputs | Range (Weighted Average) | ||||||||||||
Bank Loans | $ | 103,260,724 | Market Approach | Single Broker Indicative Quote | $93.50 - $114.00 ($100.20) | |||||||||||
Credit Default Swap Agreements | 12,894 | Market Approach | Single Broker Indicative Quote | $0.12 | ||||||||||||
|
| |||||||||||||||
| $ | 103,273,618 | |||||||||||||||
|
| |||||||||||||||
See Notes to Financial Statements.
| Prudential Floating Rate Income Fund | 43 |
Schedule of Investments (continued)
as of February 28, 2018
It is the Fund’s policy to recognize transfers in and transfers out at the fair value as of the beginning of period. Securities transferred levels as follows:
Investments in Securities | Amount Transferred | Level Transfer | Logic | |||||||
Bank Loans | $ | 8,127,756 | L3 to L2 | Single Broker Indicative Quote to Multiple Broker Quotes | ||||||
Bank Loans | $ | 20,672,722 | L2 to L3 | Multiple Broker Quotes to Single Broker Indicative Quote | ||||||
Industry Classification:
The industry classification of investments and liabilities in excess of other assets shown as a percentage of net assets as of February 28, 2018 were as follows (unaudited):
Technology | 16.9 | % | ||
Health Care & Pharmaceutical | 10.4 | |||
Capital Goods | 8.5 | |||
Consumer | 6.0 | |||
Affiliated Mutual Funds (including 0.1% of collateral for securities on loan) | 5.8 | |||
Retailers | 5.4 | |||
Media & Entertainment | 4.4 | |||
Telecommunications | 4.2 | |||
Foods | 3.5 | |||
Automotive | 3.2 | |||
Packaging | 3.0 | |||
Electric | 3.0 | |||
Chemicals | 3.0 | |||
Cable | 2.5 | |||
Other Industry | 2.5 | |||
Energy—Other | 2.4 | |||
Gaming | 2.0 | |||
Non-Captive Finance | 1.5 | |||
Aerospace & Defense | 1.4 | |||
Building Materials & Construction | 1.0 | |||
Metals & Mining | 0.9 | |||
Brokerage | 0.9 | |||
Transportation | 0.9 | |||
Insurance | 0.7 | |||
Pharmaceuticals | 0.7 | % | ||
Healthcare-Services | 0.6 | |||
Oil & Gas | 0.6 | |||
Computers | 0.5 | |||
Energy—Refining | 0.5 | |||
Restaurants | 0.5 | |||
Supermarkets | 0.5 | |||
Collateralized Loan Obligation | 0.5 | |||
Real Estate | 0.4 | |||
Media | 0.4 | |||
Retail | 0.3 | |||
Building Products | 0.2 | |||
Distribution/Wholesale | 0.2 | |||
Entertainment | 0.2 | |||
Miscellaneous Manufacturing | 0.1 | |||
Lodging | 0.1 | |||
Agriculture | 0.1 | |||
Software | 0.1 | |||
Real Estate Investment Trusts (REITs) | 0.1 | |||
Healthcare-Products | 0.0 | * | ||
Cosmetics/Personal Care | 0.0 | * | ||
|
| |||
| 100.6 | ||||
Liabilities in excess of other assets | (0.6 | ) | ||
|
| |||
| 100.0 | % | |||
|
|
| * | Less than +/- 0.05% |
Effects of Derivative Instruments on the Financial Statements and Primary Underlying Risk Exposure:
The Fund invested in derivative instruments during the reporting period. The primary types of risk associated with these derivative instruments are credit contracts risk and interest rate contracts risk. The effect of such derivative instruments on the Fund’s financial
See Notes to Financial Statements.
| 44 |
position and financial performance as reflected in the Statement of Assets and Liabilities and statement of Operations is presented in the summary below.
Fair values of derivative instruments as of February 28, 2018 as presented in the Statement of Assets and Liabilities:
Asset Derivatives | Liability Derivatives | |||||||||||
Derivatives not accounted | Balance Sheet | Fair Value | Balance Sheet | Fair Value | ||||||||
| Credit contracts | Unrealized appreciation on OTC swap agreements | $ | 12,894 | $ | — | |||||||
| Interest rate contracts | Due from/to broker—variation margin swaps | 563,350 | * | — | ||||||||
|
|
|
| |||||||||
Total | $ | 576,244 | $ | — | ||||||||
|
|
|
| |||||||||
| * | Includes cumulative appreciation (depreciation) as reported in the schedule of open futures and centrally cleared swap contracts. Only unsettled variation margin receivable (payable) is reported with the Statement of Assets and Liabilities. |
The effects of derivative instruments on the Statement of Operations for the year ended February 28, 2018 are as follows:
Amount of Realized Gain (Loss) on Derivatives Recognized in Income | ||||
Derivatives not accounted for as hedging | Swaps | |||
Credit contracts | $ | 28,537 | ||
Interest rate contracts | (123,456 | ) | ||
|
| |||
| $ | (94,919 | ) | ||
|
| |||
Change in Unrealized Appreciation (Depreciation) on Derivatives Recognized in Income | ||||
Derivatives not accounted for as hedging | Swaps | |||
Credit contracts | $ | 12,894 | ||
Interest rate contracts | 583,101 | |||
|
| |||
| $ | 595,995 | |||
|
| |||
See Notes to Financial Statements.
| Prudential Floating Rate Income Fund | 45 |
Schedule of Investments (continued)
as of February 28, 2018
For the year ended February 28, 2018, the Fund’s average volume of derivative activities is as follows:
| Credit Default Swap Agreements—Sell Protection(1) | Interest Rate Swap Agreements(1) | |||||
| $ | 4,365,600 | $ | 18,650,000 | |||
| (1) | Notional Amount in USD. |
Financial Instruments/Transactions—Summary of Offsetting and Netting Arrangements:
The Fund invested in OTC derivatives and entered into financial instruments/transactions during the reporting period that are either offset in accordance with current requirements or are subject to enforceable master netting arrangements or similar agreements that permit offsetting. The information about offsetting and related netting arrangements for OTC derivatives and financial instruments/transactions, where the legal right to set-off exists, is presented in the summary below.
Offsetting of financial instrument/transaction assets and liabilities:
Description | Gross Market Value of Recognized Assets/(Liabilities) | Collateral Pledged/(Received)(2) | Net Amount | |||||||||
Securities on Loan | $ | 391,648 | $ | (391,648 | ) | $ | — | |||||
|
| |||||||||||
Offsetting of OTC derivative assets and liabilities:
Counterparty | Gross Amounts of Recognized Assets(1) | Gross Amounts of Recognized Liabilities(1) | Net Amounts of Recognized Assets/(Liabilities) | Collateral Pledged/(Received)(2) | Net Amount | |||||||||||||||
Goldman Sachs & Co. | $ | 12,894 | $ | — | $ | 12,894 | $ | — | $ | 12,894 | ||||||||||
|
|
|
|
|
|
|
|
|
| |||||||||||
| (1) | Includes unrealized appreciation/(depreciation) on swaps and forwards, premiums paid/(received) on swap agreements and market value of purchased and written options, as represented on the Statement of Assets and Liabilities. |
| (2) | Collateral amount disclosed by the Fund is limited to the market value of financial instruments/transactions and the Fund’s OTC derivative exposure by counterparty. |
See Notes to Financial Statements.
| 46 |
This Page Intentionally Left Blank
Statement of Assets & Liabilities
as of February 28, 2018
Assets | ||||
Investments at value, including securities on loan of $391,648: | ||||
Unaffiliated investments (cost $529,848,856) | $ | 529,873,965 | ||
Affiliated investments (cost $32,222,051) | 32,222,051 | |||
Cash | 1,882,194 | |||
Foreign currency, at value (cost $8,012) | 8,640 | |||
Deposit with broker for centrally cleared swaps | 595,000 | |||
Receivable for Fund shares sold | 24,879,170 | |||
Receivable for investments sold | 19,537,388 | |||
Interest receivable | 2,386,372 | |||
Unrealized appreciation on OTC swap agreements | 12,894 | |||
Prepaid expenses | 2,716 | |||
|
| |||
Total Assets | 611,400,390 | |||
|
| |||
Liabilities | ||||
Payable for investments purchased | 49,998,725 | |||
Payable for Fund shares reacquired | 1,481,287 | |||
Payable to broker for collateral for securities on loan | 405,288 | |||
Management fee payable | 192,383 | |||
Accrued expenses and other liabilities | 136,821 | |||
Dividends payable | 90,656 | |||
Distribution fee payable | 54,276 | |||
Due to broker—variation margin swaps | 15,917 | |||
Affiliated transfer agent fee payable | 7,195 | |||
|
| |||
Total Liabilities | 52,382,548 | |||
|
| |||
Net Assets | $ | 559,017,842 | ||
|
| |||
Net assets were comprised of: | ||||
Common stock, at par | $ | 562,248 | ||
Paid-in capital in excess of par | 557,857,735 | |||
|
| |||
| 558,419,983 | ||||
Undistributed net investment income | 377,786 | |||
Accumulated net realized loss on investment transactions | (381,908 | ) | ||
Net unrealized appreciation on investments and foreign currencies | 601,981 | |||
|
| |||
Net assets, February 28, 2018 | $ | 559,017,842 | ||
|
| |||
See Notes to Financial Statements.
| 48 |
Class A | ||||
Net asset value and redemption price per share | $ | 9.94 | ||
Maximum sales charge (3.25% of offering price) | 0.33 | |||
|
| |||
Maximum offering price to public | $ | 10.27 | ||
|
| |||
Class C | ||||
Net asset value, offering price and redemption price per share | ||||
($52,919,384 ÷ 5,324,611 shares of common stock issued and outstanding) | $ | 9.94 | ||
|
| |||
Class Q | ||||
Net asset value, offering price and redemption price per share | ||||
($26,457,330 ÷ 2,661,058 shares of common stock issued and outstanding) | $ | 9.94 | ||
|
| |||
Class Z | ||||
Net asset value, offering price and redemption price per share | ||||
($400,179,048 ÷ 40,242,285 shares of common stock issued and outstanding) | $ | 9.94 | ||
|
| |||
See Notes to Financial Statements.
| Prudential Floating Rate Income Fund | 49 |
Statement of Operations
Year Ended February 28, 2018
Net Investment Income (Loss) | ||||
Income | ||||
Interest income | $ | 29,127,036 | ||
Affiliated dividend income | 318,578 | |||
Income from securities lending, net (including affiliated income of $1,290) | 7,035 | |||
|
| |||
Total income | 29,452,649 | |||
|
| |||
Expenses | ||||
Management fee | 3,489,581 | |||
Distribution fee(a) | 729,056 | |||
Transfer agent’s fees and expenses (including affiliated expense of $38,931)(a) | 446,868 | |||
Custodian and accounting fees | 266,842 | |||
Registration fees(a) | 93,732 | |||
Audit fee | 59,870 | |||
Shareholders’ reports | 59,091 | |||
Legal fees and expenses | 25,104 | |||
Directors’ fees | 19,040 | |||
Miscellaneous | 23,172 | |||
|
| |||
Total expenses | 5,212,356 | |||
Less: Fee waiver and/or expense reimbursement(a) | (732,943 | ) | ||
|
| |||
Net expenses | 4,479,413 | |||
|
| |||
Net investment income (loss) | 24,973,236 | |||
|
| |||
Realized And Unrealized Gain (Loss) On Investments And Foreign Currency Transactions | ||||
Net realized gain (loss) on: | ||||
Investment transactions (including affiliated of $(440)) | 737,350 | |||
Swap agreement transactions | (94,919 | ) | ||
|
| |||
| 642,431 | ||||
|
| |||
Net change in unrealized appreciation (depreciation) on: | ||||
Investments (including affiliated of $(336)) | (1,280,160 | ) | ||
Swap agreements | 595,995 | |||
Foreign currencies | 1,138 | |||
|
| |||
| (683,027 | ) | |||
|
| |||
Net gain (loss) on investment and foreign currency transactions | (40,596 | ) | ||
|
| |||
Net Increase (Decrease) In Net Assets Resulting From Operations | $ | 24,932,640 | ||
|
| |||
| (a) | Class specific expenses and waivers were as follows (see Note 1): |
| Class A | Class C | Class Q | Class Z | |||||||||||||
Distribution fee | 188,447 | 540,609 | — | — | ||||||||||||
Transfer agent’s fees and expenses | 65,317 | 45,561 | 18 | 335,972 | ||||||||||||
Registration fees | 16,806 | 13,656 | 3,276 | 59,994 | ||||||||||||
Fee waiver and/or expense reimbursement | (107,904 | ) | (77,930 | ) | (17,291 | ) | (529,818 | ) | ||||||||
See Notes to Financial Statements.
| 50 |
Statements of Changes in Net Assets
| Year Ended February 28, | ||||||||
| 2018 | 2017 | |||||||
Increase (Decrease) in Net Assets | ||||||||
Operations | ||||||||
Net investment income (loss) | $ | 24,973,236 | $ | 13,968,049 | ||||
Net realized gain (loss) on investment and foreign currency transactions | 642,431 | 963,037 | ||||||
Net change in unrealized appreciation (depreciation) on investments and foreign currencies | (683,027 | ) | 14,813,494 | |||||
|
|
|
| |||||
Net increase (decrease) in net assets resulting from operations | 24,932,640 | 29,744,580 | ||||||
|
|
|
| |||||
Dividends and Distributions | ||||||||
Dividends from net investment income | ||||||||
Class A | (3,435,488 | ) | (2,387,961 | ) | ||||
Class C | (2,058,814 | ) | (1,325,883 | ) | ||||
Class Q | (824,817 | ) | (250,104 | ) | ||||
Class Z | (18,837,563 | ) | (9,805,011 | ) | ||||
|
|
|
| |||||
| (25,156,682 | ) | (13,768,959 | ) | |||||
|
|
|
| |||||
Distributions from net realized gains | ||||||||
Class A | (95,396 | ) | — | |||||
Class C | (70,175 | ) | — | |||||
Class Q | (27,895 | ) | — | |||||
Class Z | (517,292 | ) | — | |||||
|
|
|
| |||||
| (710,758 | ) | — | ||||||
|
|
|
| |||||
Fund share transactions (Net of share conversions) | ||||||||
Net proceeds from shares sold | 332,160,936 | 409,278,596 | ||||||
Net asset value of shares issued in reinvestment of dividends and distributions | 24,558,527 | 12,679,633 | ||||||
Cost of shares reacquired | (319,936,592 | ) | (133,057,932 | ) | ||||
|
|
|
| |||||
Net increase (decrease) in net assets from Fund share transactions | 36,782,871 | 288,900,297 | ||||||
|
|
|
| |||||
Total increase (decrease) | 35,848,071 | 304,875,918 | ||||||
Net Assets: | ||||||||
Beginning of year | 523,169,771 | 218,293,853 | ||||||
|
|
|
| |||||
End of year(a) | $ | 559,017,842 | $ | 523,169,771 | ||||
|
|
|
| |||||
(a) Includes undistributed net investment income of: | $ | 377,786 | $ | 323,577 | ||||
|
|
|
| |||||
See Notes to Financial Statements.
| Prudential Floating Rate Income Fund | 51 |
Notes to Financial Statements
Prudential Investment Portfolios, Inc. 14 (the “Company”) is registered under the Investment Company Act of 1940, as amended (“1940 Act”), as a diversified, open-end management investment company. The Company consists of two funds: Prudential Government Income Fund and Prudential Floating Rate Income Fund. These financial statements relate only to the Prudential Floating Rate Income Fund (the “Fund’).
The primary investment objective of the Fund is to maximize current income. The secondary investment objective is to seek capital appreciation when consistent with the Fund’s primary investment objective.
1. Accounting Policies
The Fund follows investment company accounting and reporting guidance of the Financial Accounting Standards Board (“FASB”) Accounting Standard Codification Topic 946 Financial Services—Investment Companies. The following accounting policies conform to U.S. generally accepted accounting principles. The Fund consistently follows such policies in the preparation of its financial statements.
Securities Valuation: The Fund holds securities and other assets and liabilities that are fair valued at the close of each day (generally, 4:00 PM Eastern time) the New York Stock Exchange (“NYSE”) is open for trading. Fair value is the price that would be received to sell an asset or paid to transfer a liability in an orderly transaction between market participants on the measurement date. The Board of Directors (the “Board”) has adopted valuation procedures for security valuation under which fair valuation responsibilities have been delegated to PGIM Investments LLC (“PGIM Investments” or “the Manager”). Under the current valuation procedures, the Valuation Committee is responsible for supervising the valuation of portfolio securities and other assets and liabilities. The valuation procedures permit the Fund to utilize independent pricing vendor services, quotations from market makers, and alternative valuation methods when market quotations are either not readily available or not deemed representative of fair value. A record of the Valuation Committee’s actions is subject to the Board’s review, approval, and ratification at its next regularly scheduled quarterly meeting.
Various inputs determine how the Fund’s investments are valued, all of which are categorized according to the three broad levels (Level 1, 2, or 3) detailed in the Schedule of Investments.
Common stocks and derivative instruments, such as futures or options, that are traded on a national securities exchange are valued at the last sale price as of the close of trading on the applicable exchange where the security principally trades. Securities traded via
| 52 |
NASDAQ are valued at the NASDAQ official closing price. To the extent these securities are valued at the last sale price or NASDAQ official closing price, they are classified as Level 1 in the fair value hierarchy. In the event that no sale or official closing price on valuation date exists, these securities are generally valued at the mean between the last reported bid and ask prices, or at the last bid price in the absence of an ask price. These securities are classified as Level 2 in the fair value hierarchy.
Investments in open-end, non-exchange-traded mutual funds are valued at their net asset values as of the close of the NYSE on the date of valuation. These securities are classified as Level 1 in the fair value hierarchy since they may be purchased or sold at their net asset values on the date of valuation.
Fixed income securities traded in the OTC market are generally classified as Level 2 in the fair value hierarchy. Such fixed income securities are typically valued using the market approach which generally involves obtaining data from an approved independent third-party vendor source. The Fund utilizes the market approach as the primary method to value securities when market prices of identical or comparable instruments are available. The third-party vendors’ valuation techniques used to derive the evaluated bid price are based on evaluating observable inputs, including but not limited to, yield curves, yield spreads, credit ratings, deal terms, tranche level attributes, default rates, cash flows, prepayment speeds, broker/dealer quotations and reported trades. Certain Level 3 securities are also valued using the market approach when obtaining a single broker quote or when utilizing transaction prices for identical securities that have been used in excess of five business days. During the reporting period, there were no changes to report with respect to the valuation approach and/or valuation techniques discussed above.
Bank loans are generally valued at prices provided by approved independent pricing vendors. The pricing vendors utilize broker/dealer quotations and provide prices based on the average of such quotations. Bank loans valued using such vendor prices are generally classified as Level 2 in the fair value hierarchy. Bank loans valued based on a single broker quote or at the original transaction price in excess of five business days are classified as Level 3 in the fair value hierarchy.
OTC derivative instruments are generally classified as Level 2 in the fair value hierarchy. Such derivative instruments are typically valued using the market approach and/or income approach which generally involves obtaining data from an approved independent third-party vendor source. The Fund utilizes the market approach when quoted prices in broker-dealer markets are available but also include consideration of alternative valuation approaches, including the income approach. In the absence of reliable market quotations, the income approach is typically utilized for purposes of valuing OTC derivatives such as interest rate swaps based on a discounted cash flow analysis whereby the value of the instrument is equal to the present value of its future cash inflows or outflows. Such analysis includes projecting future cash flows and determining the discount rate (including the present value factors that affect the discount rate) used to discount the future cash flows. In addition, the third-party vendors’ valuation techniques used to derive the evaluated OTC
| Prudential Floating Rate Income Fund | 53 |
Notes to Financial Statements (continued)
derivative price is based on evaluating observable inputs, including but not limited to, underlying asset prices, indices, spreads, interest rates and exchange rates. Certain OTC derivatives may be classified as Level 3 when valued using the market approach by obtaining a single broker quote or when utilizing unobservable inputs in the income approach. During the reporting period, there were no changes to report with respect to the valuation approach and/or valuation techniques discussed above.
Centrally cleared swaps listed or traded on a multilateral or trade facility platform, such as a registered exchange, are generally valued at the daily settlement price determined by the respective exchange. These securities are classified as Level 2 in the fair value hierarchy, as the daily settlement price is not public.
Securities and other assets that cannot be priced according to the methods described above are valued based on pricing methodologies approved by the Board. In the event that unobservable inputs are used when determining such valuations, the securities will be classified as Level 3 in the fair value hierarchy.
When determining the fair value of securities, some of the factors influencing the valuation include: the nature of any restrictions on disposition of the securities; assessment of the general liquidity of the securities; the issuer’s financial condition and the markets in which it does business; the cost of the investment; the size of the holding and the capitalization of the issuer; the prices of any recent transactions or bids/offers for such securities or any comparable securities; any available analyst media or other reports or information deemed reliable by the Manager regarding the issuer or the markets or industry in which it operates. Using fair value to price securities may result in a value that is different from a security’s most recent closing price and from the price used by other unaffiliated mutual funds to calculate their net asset values.
Restricted and Illiquid Securities: Subject to guidelines adopted by the Board, the Fund may invest up to 15% of its net assets in illiquid securities, including those which are restricted as to disposition under securities law (“restricted securities”). Restricted securities are valued pursuant to the valuation procedures noted above. Illiquid securities are those that, because of the absence of a readily available market or due to legal or contractual restrictions on resale, cannot be sold within seven days in the ordinary course of business at approximately the amount at which the Fund has valued the investment. Therefore, the Fund may find it difficult to sell illiquid securities at the time considered most advantageous by its Subadviser and may incur transaction costs that would not be incurred in the sale of securities that were freely marketable. Certain securities that would otherwise be considered illiquid because of legal restrictions on resale to the general public may be traded among qualified institutional buyers under Rule 144A of the Securities Act of 1933. These Rule 144A securities, as well as commercial paper that is sold in private placements
| 54 |
under Section 4(2) of the Securities Act, may be deemed liquid by the Fund’s Subadviser under the guidelines adopted by the Directors of the Fund. However, the liquidity of the Fund’s investments in Rule 144A securities could be impaired if trading does not develop or declines.
Foreign Currency Translation: The books and records of the Fund are maintained in U.S. dollars. Foreign currency amounts are translated into U.S. dollars on the following basis:
(i) market value of investment securities, other assets and liabilities — at the current rates of exchange;
(ii) purchases and sales of investment securities, income and expenses — at the rates of exchange prevailing on the respective dates of such transactions.
Although the net assets of the Fund are presented at the foreign exchange rates and market values at the close of the period, the Fund does not generally isolate that portion of the results of operations arising as a result of changes in the foreign exchange rates from the fluctuations arising from changes in the market prices of long-term portfolio securities held at the end of the period. Similarly, the Fund does not isolate the effect of changes in foreign exchange rates from the fluctuations arising from changes in the market prices of long-term portfolio securities sold during the period. Accordingly, holding period realized foreign currency gains (losses) are included in the reported net realized gains (losses) on investment transactions. Notwithstanding the above, the Fund does isolate the effect of fluctuations in foreign currency exchange rates when determining the gain (loss) upon the sale or maturity of foreign currency denominated debt obligations; such amounts are included in net realized gains (losses) on foreign currency transactions.
Additionally, net realized gains (losses) on foreign currency transactions represent net foreign exchange gains (losses) from the disposition of holdings of foreign currencies, currency gains (losses) realized between the trade and settlement dates on securities transactions, and the difference between the amounts of interest, dividends and foreign withholding taxes recorded on the Fund’s books and the U.S. dollar equivalent amounts actually received or paid. Net unrealized currency gains (losses) from valuing foreign currency denominated assets and liabilities (other than investments) at period end exchange rates are reflected as a component of net unrealized appreciation (depreciation) on foreign currencies.
Bank Loans: The Fund invests at least 80% of its investable assets in bank loans. Bank loans include fixed and floating rate loans that are privately negotiated between a corporate borrower and one or more financial institutions, including, but not limited to, term loans, revolvers, and other instruments issued in the bank loan market. Most bank loans are senior in rank (“senior loans”) in the event of bankruptcy to most other securities of the issuer, such as common stock or publicly-issued bonds. Bank loans are often secured by specific collateral of the issuer so that holders of the loans will have a priority claim on those assets in the event of default or bankruptcy of the issuer. The Fund may acquire interests in loans directly (by way of assignment from the selling institution) or indirectly (by way of
| Prudential Floating Rate Income Fund | 55 |
Notes to Financial Statements (continued)
the purchase of a participation interest from the selling institution). Under a bank loan assignment, the Fund generally will succeed to all the rights and obligations of an assigning lending institution and becomes a lender under the loan agreement with the relevant borrower in connection with that loan. Under a bank loan participation, the Fund generally will have a contractual relationship only with the lender, not with the relevant borrower. As a result, the Fund generally will have the right to receive payments of principal, interest, and any fees to which it is entitled only from the lender selling the participation and only upon receipt by the lender of the payments from the relevant borrower. The Fund may not directly benefit from the collateral supporting the debt obligation in which it has purchased the participation. As a result, the Fund will assume the credit risk of both the borrower and the institution selling the participation to the Fund. In addition, loans trade in an over-the-counter market, and confirmation and settlement, which are effected through standardized procedures and documentation, may take significantly longer than seven days to complete. Extended trade settlement periods may, in unusual market conditions with a high volume of shareholder redemptions, present a risk to shareholders regarding the Fund’s ability to pay redemption proceeds within the allowable time periods.
Swap Agreements: The Fund may enter into credit default, interest rate and other types of swap agreements. A swap agreement is an agreement to exchange the return generated by one instrument for the return generated by another instrument. Swap agreements are negotiated in the OTC market and may be executed either directly with counterparty (“OTC-traded”) or through a central clearing facility, such as a registered exchange. Swap agreements are valued daily at current market value and any change in value is included in the net unrealized appreciation (depreciation) on swap agreements. Centrally cleared swaps pay or receive an amount known as “variation margin”, based on daily changes in the valuation of the swap contract. Any upfront premiums paid and received are shown as swap premiums paid and swap premiums received in the Statement of Assets and Liabilities. Risk of loss may exceed amounts recognized on the Statement of Assets and Liabilities. Swap agreements outstanding at period end, if any, are listed on the Schedule of Investments.
Interest Rate Swaps: Interest rate swaps represent an agreement between counterparties to exchange cash flows based on the difference between two interest rates, applied to a notional principal amount for a specified period. The Fund is subject to interest rate risk exposure in the normal course of pursuing its investment objective. The Fund used interest rate swaps to maintain its ability to generate steady cash flow by receiving a stream of fixed-rate payments and to increase exposure to prevailing market rates by receiving floating rate payments. The Fund’s maximum risk of loss from counterparty credit risk is the discounted net present value of the cash flows to be received from the counterparty over the contract’s remaining life.
| 56 |
Credit Default Swaps (”CDS“): CDS involve one party (the protection buyer) making a stream of payments to another party (the protection seller) in exchange for the right to receive a specified payment in the event of a default or as a result of a default (collectively a “credit event”) for the referenced entity (typically corporate issues or sovereign issues of an emerging country) on its obligation; or in the event of a write-down, principal shortfall, interest shortfall or default of all or part of the referenced entities comprising a credit index.
The Fund is subject to credit risk in the normal course of pursuing its investment objectives, and as such, has entered into CDS contracts to provide a measure of protection against defaults or to take an active long or short position with respect to the likelihood of a particular issuer’s default or the reference entity’s credit soundness. CDS contracts generally trade based on a spread which represents the cost a protection buyer has to pay the protection seller. The protection buyer is said to be short the credit as the value of the contract rises the more the credit deteriorates. The value of the CDS contract increases for the protection buyer if the spread increases. The Fund’s maximum risk of loss from counterparty credit risk for purchased CDS is the inability of the counterparty to honor the contract up to the notional value due to a credit event.
As a seller of protection on credit default swap agreements, the Fund generally receives an agreed upon payment from the buyer of protection throughout the term of the swap, provided no credit event occurs. As the seller, the Fund effectively increases its investment risk because, in addition to its total net assets, the Fund may be subject to investment exposure on the notional amount of the swap.
The maximum amount of the payment that the Fund, as a seller of protection, could be required to make under a credit default swap agreement would be equal to the notional amount of the underlying security or index contract as a result of a credit event. This potential amount will be partially offset by any recovery values of the respective referenced obligations, or net amounts received from the settlement of buy protection credit default swap agreements which the Fund entered into for the same referenced entity or index. As a buyer of protection, the Fund generally receives an amount up to the notional value of the swap if a credit event occurs.
Implied credit spreads, represented in absolute terms, utilized in determining the market value of credit default swap agreements on corporate or sovereign issues of an emerging country as of period end are disclosed in the footnotes to the Schedule of Investments, if applicable. These spreads serve as indicators of the current status of the payment/performance risk and represent the likelihood of default risk for the credit derivative. The implied credit spread of a particular referenced entity reflects the cost of buying/selling protection and may include upfront payments required to enter into the agreement. For credit default swap agreements on asset-backed securities and credit indices, the quoted market prices and resulting values serve as indicators of the current status of the payment/performance risk. Wider credit spreads and increased market value in absolute terms, when compared to the notional amount of the swap, represent a deterioration of the referenced entity’s credit soundness and a greater likelihood of risk of default or other credit event occurring as defined under the terms of the agreement.
| Prudential Floating Rate Income Fund | 57 |
Notes to Financial Statements (continued)
Master Netting Arrangements: The Company, on behalf of the Fund, is subject to various Master Agreements, or netting arrangements, with select counterparties. These are agreements which a subadviser may have negotiated and entered into on behalf of the Fund. A master netting arrangement between the Fund and the counterparty permits the Fund to offset amounts payable by the Fund to the same counterparty against amounts to be received; and by the receipt of collateral from the counterparty by the Fund to cover the Fund’s exposure to the counterparty. However, there is no assurance that such mitigating factors are easily enforceable. In addition to master netting arrangements, the right to set-off exists when all the conditions are met such that each of the parties owes the other determinable amounts, the reporting party has the right to set-off the amount owed with the amount owed by the other party, the reporting party intends to set-off and the right of set-off is enforceable by law. During the reporting period, there was no intention to settle on a net basis and all amounts are presented on a gross basis on the Statement of Assets and Liabilities.
The Company, on behalf of the Fund, is a party to ISDA (International Swaps and Derivatives Association, Inc.) Master Agreements with certain counterparties that govern OTC derivative and foreign exchange contracts entered into from time to time. The Master Agreements may contain provisions regarding, among other things, the parties’ general obligations, representations, agreements, collateral requirements, events of default and early termination. With respect to certain counterparties, in accordance with the terms of the Master Agreements, collateral posted to the Fund is held in a segregated account by the Fund’s custodian and with respect to those amounts which can be sold or re-pledged, is presented in the Schedule of Investments. Collateral pledged by the Fund is segregated by the Fund’s custodian and identified in the Schedule of Investments. Collateral can be in the form of cash or debt securities issued by the U.S. Government or related agencies or other securities as agreed to by the Fund and the applicable counterparty. Collateral requirements are determined based on the Fund’s net position with each counterparty. Termination events applicable to the Fund may occur upon a decline in the Fund’s net assets below a specified threshold over a certain period of time. Termination events applicable to counterparties may occur upon a decline in the counterparty’s long-term and short-term credit ratings below a specified level. In each case, upon occurrence, the other party may elect to terminate early and cause settlement of all derivative and foreign exchange contracts outstanding, including the payment of any losses and costs resulting from such early termination, as reasonably determined by the terminating party. Any decision by one or more of the Fund’s counterparties to elect early termination could impact the Fund’s future derivative activity.
In addition to each instrument’s primary underlying risk exposure (e.g. interest rate, credit, equity or foreign exchange, etc.), swap agreements involve, to varying degrees, elements of credit, market and documentation risk. Such risks involve the possibility that no liquid
| 58 |
market for these agreements will exist, the counterparty to the agreement may default on its obligation to perform or disagree on the contractual terms of the agreement, and changes in net interest rates will be unfavorable. In connection with these agreements, securities in the portfolio may be identified or received as collateral from the counterparty in accordance with the terms of the respective swap agreements to provide or receive assets of value and to serve as recourse in the event of default or bankruptcy/insolvency of either party. Such OTC derivative agreements include conditions which, when materialized, give the counterparty the right to cause an early termination of the transactions under those agreements. Any election by the counterparty for early termination of the contract(s) may impact the amounts reported on financial statements.
As of February 28, 2018, the Fund has not met conditions under such agreements which give the counterparty the right to call for an early termination.
Forward currency contracts, forward rate agreements, written options, short sales, swaps and financial futures contracts involve elements of both market and credit risk in excess of the amounts reflected on the Statement of Assets and Liabilities. Such risks may be mitigated by engaging in master netting arrangements.
Payment-In-Kind: The Fund may invest in the open market or receive pursuant to debt restructuring, securities that pay-in-kind (PIK) the interest due on such debt instruments. The PIK interest, computed at the contractual rate specified, is added to the existing principal balance of the debt when issued bonds have same terms as the bond or recorded as a separate bond when terms are different from the existing debt, and is recorded as interest income.
Securities Lending: The Fund may lend its portfolio securities to banks and broker-dealers. The loans are secured by collateral at least equal to the market value of the securities loaned. Collateral pledged by each borrower is invested in an affiliated money market fund and is marked to market daily, based on the previous day’s market value, such that the value of the collateral exceeds the value of the loaned securities. In the event of significant appreciation in value of securities on loan on the last business day of the reporting period, the financial statements may reflect a collateral value that is less than the market value of the loaned securities. Such shortfall is remedied as described above. Loans are subject to termination at the option of the borrower or the Fund. Upon termination of the loan, the borrower will return to the Fund securities identical to the loaned securities. Should the borrower of the securities fail financially, the Fund has the right to repurchase the securities in the open market using the collateral.
The Fund recognizes income, net of any rebate and securities lending agent fees, for lending its securities in the form of fees or interest on the investment of any cash received as collateral. The borrower receives all interest and dividends from the securities loaned and such payments are passed back to the lender in amounts equivalent thereto. The Fund also continues to recognize any unrealized gain (loss) in the market price of the securities loaned and on the change in the value of the collateral invested that may occur during the
| Prudential Floating Rate Income Fund | 59 |
Notes to Financial Statements (continued)
term of the loan. In addition, realized gain (loss) is recognized on changes in the value of the collateral invested upon liquidation of the collateral. Net earnings from securities lending are disclosed on the Statement of Operations as “Income from securities lending, net”.
Concentration of Risk: The ability of debt securities issuers (other than those issued or guaranteed by the U.S. Government) held by the Fund to meet their obligations may be affected by the economic or political developments in a specific industry, region or country. Foreign security and currency transactions may involve certain considerations and risks not typically associated with those of domestic origin as a result of, among other factors, the possibility of political or economic instability or the level of governmental supervision and regulation of foreign securities markets.
Securities Transactions and Net Investment Income: Securities transactions are recorded on the trade date. Realized gains (losses) from investment and currency transactions are calculated on the specific identification method. Dividend income is recorded on the ex-date. Expenses are recorded on an accrual basis, which may require the use of certain estimates by management that may differ from actual. Net investment income or loss (other than class specific expenses and waivers, which are allocated as noted below) and unrealized and realized gains (losses) are allocated daily to each class of shares based upon the relative proportion of adjusted net assets of each class at the beginning of the day.
Class specific expenses and waivers, where applicable, are charged to the respective share classes. Class specific expenses include distribution fees and distribution fee waivers, and effective January 1, 2018, transfer agent’s fees and expenses, registration fees and fee waiver and/or expense reimbursement. Prior to January 1, 2018 transfer agent’s fees and expenses, registration fees and fee waiver and/or expense reimbursement were not designated as class specific expenses and were allocated daily to each class of shares based upon the relative proportion of adjusted net assets of each class at the beginning of the day.
Taxes: It is the Fund’s policy to continue to meet the requirements of the Internal Revenue Code applicable to regulated investment companies and to distribute all of its taxable net investment income and capital gains, if any, to its shareholders. Therefore, no federal income tax provision is required. Withholding taxes on foreign dividends, interest and capital gains, if any, are recorded, net of reclaimable amounts, at the time the related income is earned.
Dividends and Distributions: The Fund expects to pay dividends from net investment income monthly and distributions from net realized capital gains, if any, at least annually. Dividends and distributions to shareholders, which are determined in accordance with federal income tax regulations and which may differ from generally accepted accounting
| 60 |
principles, are recorded on the ex-date. Permanent book/tax differences relating to income and gain (loss) are reclassified amongst undistributed net investment income, accumulated net realized gain (loss) and paid-in capital in excess of par, as appropriate.
Estimates: The preparation of financial statements requires management to make estimates and assumptions that affect the reported amounts and disclosures in the financial statements. Actual results could differ from those estimates.
2. Agreements
The Company, on behalf of the Fund, has a management agreement with PGIM Investments. Pursuant to this agreement, PGIM Investments has responsibility for all investment advisory services and supervises the subadviser’s performance of such services. In addition, under the management agreement, PGIM Investments provides all of the administrative functions necessary for the organization, operation and management of the Fund. PGIM Investments administers the corporate affairs of the Fund and, in connection therewith, furnishes the Fund with office facilities, together with those ordinary clerical and bookkeeping services which are not being furnished by, the Fund’s custodian (the Custodian), and the Fund’s transfer agent. PGIM Investments is also responsible for the staffing and management of dedicated groups of legal, marketing, compliance and related personnel necessary for the operation of the Fund. The legal, marketing, compliance and related personnel are also responsible for the management and oversight of the various service providers to the Fund, including, but not limited to, the custodian, transfer agent, and accounting agent.
PGIM Investments has entered into a subadvisory agreement with PGIM, Inc., which provides subadvisory services to the Fund through its PGIM Fixed Income unit. The subadvisory agreement provides that PGIM, Inc. will furnish investment advisory services in connection with the management of the Fund. In connection therewith, PGIM, Inc. is obligated to keep certain books and records of the Fund. PGIM Investments pays for the services of PGIM, Inc., the cost of compensation of officers of the Fund, occupancy and certain clerical and bookkeeping costs of the Fund. The Fund bears all other costs and expenses.
The management fee paid to PGIM Investments is accrued daily and payable monthly, at an annual rate of 0.65% of the Fund’s average daily net assets up to $5 billion and 0.625% of the Fund’s average daily net assets in excess of $5 billion. The effective management fee rate before any waivers and/or expense reimbursement was 0.65% for the year ended February 28, 2018. The effective management fee rate, net of waivers and/or expense reimbursement, was 0.51%.
PGIM Investments has contractually agreed through June 30, 2018 to limit the net annual operating expenses (exclusive of distribution and service (12b-1) fees, taxes (such as income and foreign withholdings taxes, stamp duty and deferred tax expenses), interest, acquired fund fees and expenses, brokerage, extraordinary and certain other expenses such as dividend, broker charges and interest expense on short sales) of each class of
| Prudential Floating Rate Income Fund | 61 |
Notes to Financial Statements (continued)
shares of the Fund to 0.70% of the Fund’s average daily net assets. In addition, PGIM Investments has contractually agreed through June 30, 2018 to limit net annual operating expenses (exclusive of distribution and service (12b-1) fees, transfer agency expenses (including sub-transfer agency and networking fees), taxes (such as income and foreign withholdings taxes, stamp duty and deferred tax expenses), interest, acquired fund fees and expenses, brokerage, extraordinary and certain other expenses such as dividend, broker charges and interest expense on short sales) of each class of shares of the Fund to 0.65% of the Fund’s average daily net assets. Expenses waived/reimbursed by the Manager in accordance with this agreement may be recouped by the Manager within the same fiscal year during which such waiver/reimbursement is made if such recoupment can be realized without exceeding the expense limit in effect at the time of the recoupment for that fiscal year.
The Company, on behalf of the Fund, has a distribution agreement with Prudential Investment Management Services LLC (“PIMS”), which acts as the distributor of the Class A, Class C, Class Q and Class Z shares of the Fund. The Fund compensates PIMS for distributing and servicing the Fund’s Class A and Class C shares pursuant to plans of distribution (the “Class A and C Plans”), regardless of expenses actually incurred by PIMS. The distribution fees are accrued daily and payable monthly. No distribution or service fees are paid to PIMS as distributor of the Class Q and Class Z shares of the Fund.
Pursuant to the Class A and C Plans, the Fund compensates PIMS for distribution related activities at an annual rate of up to 0.25% and 1% of the average daily net assets of the Class A and C shares, respectively.
PIMS has advised the Fund that it has received $174,701 in front-end sales charges resulting from sales of Class A shares, during the year ended February 28, 2018. From these fees, PIMS paid such sales charges to affiliated broker-dealers, which in turn paid commissions to sales persons and incurred other distribution costs.
PIMS has advised the Fund that for the year ended February 28, 2018, it received $10,546 and $18,531 in contingent deferred sales charges imposed upon redemptions by certain Class A and Class C shareholders.
PGIM Investments, PGIM, Inc. and PIMS are indirect, wholly-owned subsidiaries of Prudential Financial, Inc. (“Prudential”).
3. Other Transactions with Affiliates
Prudential Mutual Fund Services LLC (“PMFS”), an affiliate of PGIM Investments and an indirect, wholly-owned subsidiary of Prudential, serves as the Fund’s transfer agent.
| 62 |
Transfer agent’s fees and expenses in the Statement of Operations include certain out-of-pocket expenses paid to non-affiliates, where applicable.
The Fund may enter into certain securities purchase or sale transactions under Board approved Rule 17a-7 procedures. Rule 17a-7 is an exemptive rule under the 1940 Act, that permits purchase and sale transactions among affiliated investment companies, or between an investment company and a person that is affiliated solely by reason of having a common (or affiliated) investment adviser, common directors, and/or common officers. Such transactions are subject to ratification by the Board. For the year ended February 28, 2018 no such transactions were entered into by the Fund.
The Fund may invest its overnight sweep cash in the Prudential Core Ultra Short Bond Fund (the “Core Fund”), and its securities lending cash collateral in the Prudential Institutional Money Market Fund (the “Money Market Fund”), each a series of Prudential Investment Portfolios 2, registered under the 1940 Act and managed by PGIM Investments. For the year ended February 28, 2018, PGIM, Inc. was compensated $1,640 by PGIM Investments for managing the Fund’s securities lending cash collateral as subadviser to the Money Market Fund. Earnings from the Core Fund and Money Market Fund are disclosed on the Statement of Operations as “Affiliated dividend income” and “Income from securities lending, net”, respectively.
4. Portfolio Securities
The aggregate cost of purchases and proceeds from sales of portfolio securities (excluding short-term investments and U.S. Government securities) for the year ended February 28, 2018, were $511,712,442 and $498,547,304, respectively.
5. Distributions and Tax Information
Distributions to shareholders, which are determined in accordance with federal income tax regulations and which may differ from generally accepted accounting principles, are recorded on the ex-date. In order to present undistributed net investment income, accumulated net realized loss on investment transactions and paid-in capital in excess of par on the Statement of Assets and Liabilities that more closely represent their tax character, certain adjustments have been made to undistributed net investment income and accumulated net realized loss on investment transactions. For the year ended February 28, 2018, the adjustments were to increase undistributed net investment income and increase accumulated net realized loss on investment transactions by $237,655 due to differences in the treatment for book and tax purposes of certain transactions involving paydowns, swaps, premium amortization and other book to tax differences. Net investment income, net realized gain (loss) on investment and foreign currency transactions and net assets were not affected by this change.
For the year ended February 28, 2018, the tax character of distributions were $25,729,630 of ordinary income and $137,810 of long-term capital gains. For the year February 28, 2017, the tax character of distributions was $13,768,959 of ordinary income.
| Prudential Floating Rate Income Fund | 63 |
Notes to Financial Statements (continued)
As of February 28, 2018 the accumulated undistributed earnings on a tax basis was $483,158 of ordinary income. This differs from the amount shown on the Statement of Assets and Liabilities primarily due to cumulative timing differences.
The United States federal income tax basis of the Fund’s investments and the net unrealized appreciation as of February 28, 2018 were as follows:
Tax Basis | Gross Unrealized Appreciation | Gross Unrealized Depreciation | Net Appreciation | |||
| $562,282,296 | $4,993,997 | $(4,604,033) | $389,964 |
The difference between book basis and tax basis was primarily attributable to deferred losses on wash sales, differences in the treatment of premium amortization for book and tax purposes and appreciation (depreciation) of swaps and foreign currencies.
The Fund utilized all of its capital loss carryforward to offset net taxable gains realized in the fiscal year ended February 28, 2018.
The Fund elected to treat post-October capital losses of approximately $182,000 as having been incurred in the following fiscal year (February 28, 2019).
Management has analyzed the Fund’s tax positions taken on federal, state and local income tax returns for all open tax years and has concluded that no provision for income tax is required in the Fund’s financial statements for the current reporting period. The Fund’s federal, state and local income and federal excise tax returns for tax years for which the applicable statutes of limitations have not expired are subject to examination by the Internal Revenue Service and state departments of revenue.
6. Capital and Ownership
The Fund offers Class A, Class C, Class Q and Class Z shares. Class A shares are sold with a maximum front-end sales charge of 3.25%. Investors who purchase $1 million or more of Class A shares and sell these shares within 12 months of purchase are subject to a contingent deferred sales charge (“CDSC”) of 1%, although they are not subject to an initial sales charge. The Class A CDSC is waived for certain retirement and/or benefit plans. A special exchange privilege is also available for shareholders who qualified to purchase Class A shares at net asset value. Class C shares are sold with a CDSC of 1% on sales made within 12 months of purchase. Class Q and Class Z shares are not subject to any sales or redemption charge and are offered exclusively for sale to a limited group of investors.
| 64 |
Under certain circumstances, an exchange may be made from specified share classes of the Fund to one or more other share classes of the Fund as presented in the table of transactions in shares of common stock.
There are 900 million shares of common stock authorized, $0.01 par value per share, divided into five classes, designated Class A, Class C, Class Q, Class Z and Class T shares, each of which consists of 150 million, 200 million, 250 million, 250 million, and 50 million shares, respectively. The Fund currently does not have any Class T shares outstanding.
As of February 28, 2018, Prudential, through its affiliate entities, owned 252,869 shares of Class Q of the Fund. At reporting period end, seven shareholders of record held 77% of the Fund’s outstanding shares.
Transactions in shares of common stock were as follows:
Class A | Shares | Amount | ||||||
Year ended February 28, 2018: | ||||||||
Shares sold | 4,084,871 | $ | 40,589,596 | |||||
Shares issued in reinvestment of dividends and distributions | 344,933 | 3,423,614 | ||||||
Shares reacquired | (3,405,846 | ) | (33,792,203 | ) | ||||
|
|
|
| |||||
Net increase (decrease) in shares outstanding before conversion | 1,023,958 | 10,221,007 | ||||||
Shares issued upon conversion from other share class(es) | 204,305 | 2,029,308 | ||||||
Shares reacquired upon conversion into other share class(es) | (238,732 | ) | (2,369,830 | ) | ||||
|
|
|
| |||||
Net increase (decrease) in shares outstanding | 989,531 | $ | 9,880,485 | |||||
|
|
|
| |||||
Year ended February 28, 2017: | ||||||||
Shares sold | 6,349,528 | $ | 62,677,787 | |||||
Shares issued in reinvestment of dividends and distributions | 216,371 | 2,128,544 | ||||||
Shares reacquired | (2,629,073 | ) | (25,878,117 | ) | ||||
|
|
|
| |||||
Net increase (decrease) in shares outstanding before conversion | 3,936,826 | 38,928,214 | ||||||
Shares issued upon conversion from other share class(es) | 108,158 | 1,062,836 | ||||||
Shares reacquired upon conversion into other share class(es) | (2,119,727 | ) | (21,034,150 | ) | ||||
|
|
|
| |||||
Net increase (decrease) in shares outstanding | 1,925,257 | $ | 18,956,900 | |||||
|
|
|
| |||||
Class C | ||||||||
Year ended February 28, 2018: | ||||||||
Shares sold | 1,357,816 | $ | 13,488,705 | |||||
Shares issued in reinvestment of dividends and distributions | 208,270 | 2,067,539 | ||||||
Shares reacquired | (1,448,026 | ) | (14,375,754 | ) | ||||
|
|
|
| |||||
Net increase (decrease) in shares outstanding before conversion | 118,060 | 1,180,490 | ||||||
Shares reacquired upon conversion into other share class(es) | (227,760 | ) | (2,261,714 | ) | ||||
|
|
|
| |||||
Net increase (decrease) in shares outstanding | (109,700 | ) | $ | (1,081,224 | ) | |||
|
|
|
| |||||
Year ended February 28, 2017: | ||||||||
Shares sold | 2,785,996 | $ | 27,473,152 | |||||
Shares issued in reinvestment of dividends and distributions | 131,452 | 1,292,612 | ||||||
Shares reacquired | (1,083,314 | ) | (10,605,347 | ) | ||||
|
|
|
| |||||
Net increase (decrease) in shares outstanding before conversion | 1,834,134 | 18,160,417 | ||||||
Shares reacquired upon conversion into other share class(es) | (132,766 | ) | (1,303,413 | ) | ||||
|
|
|
| |||||
Net increase (decrease) in shares outstanding | 1,701,368 | $ | 16,857,004 | |||||
|
|
|
| |||||
| Prudential Floating Rate Income Fund | 65 |
Notes to Financial Statements (continued)
Class Q | Shares | Amount | ||||||
Year ended February 28, 2018: | ||||||||
Shares sold | 499,647 | $ | 4,967,138 | |||||
Shares issued in reinvestment of dividends and distributions | 84,740 | 841,617 | ||||||
Shares reacquired | (2,565,595 | ) | (25,516,008 | ) | ||||
|
|
|
| |||||
Net increase (decrease) in shares outstanding before conversion | (1,981,208 | ) | (19,707,253 | ) | ||||
Shares issued upon conversion from other share class(es) | 1,422,892 | 14,124,806 | ||||||
|
|
|
| |||||
Net increase (decrease) in shares outstanding | (558,316 | ) | $ | (5,582,447 | ) | |||
|
|
|
| |||||
Year ended February 28, 2017: | ||||||||
Shares sold | 1,617,848 | $ | 16,096,875 | |||||
Shares issued in reinvestment of dividends and distributions | 25,148 | 250,111 | ||||||
Shares reacquired | (17,469 | ) | (173,636 | ) | ||||
|
|
|
| |||||
Net increase (decrease) in shares outstanding before conversion | 1,625,527 | 16,173,350 | ||||||
Shares issued upon conversion from other share class(es) | 1,592,818 | 15,781,164 | ||||||
|
|
|
| |||||
Net increase (decrease) in shares outstanding | 3,218,345 | $ | 31,954,514 | |||||
|
|
|
| |||||
Class Z | ||||||||
Year ended February 28, 2018: | ||||||||
Shares sold | 27,480,406 | $ | 273,115,497 | |||||
Shares issued in reinvestment of dividends and distributions | 1,835,157 | 18,225,757 | ||||||
Shares reacquired | (24,789,549 | ) | (246,252,627 | ) | ||||
|
|
|
| |||||
Net increase (decrease) in shares outstanding before conversion | 4,526,014 | 45,088,627 | ||||||
Shares issued upon conversion from other share class(es) | 460,425 | 4,574,112 | ||||||
Shares reacquired upon conversion into other share class(es) | (1,619,869 | ) | (16,096,682 | ) | ||||
|
|
|
| |||||
Net increase (decrease) in shares outstanding | 3,366,570 | $ | 33,566,057 | |||||
|
|
|
| |||||
Year ended February 28, 2017: | ||||||||
Shares sold | 30,765,672 | $ | 303,030,782 | |||||
Shares issued in reinvestment of dividends and distributions | 913,668 | 9,008,366 | ||||||
Shares reacquired | (9,789,413 | ) | (96,400,832 | ) | ||||
|
|
|
| |||||
Net increase (decrease) in shares outstanding before conversion | 21,889,927 | 215,638,316 | ||||||
Shares issued upon conversion from other shares class(es) | 2,229,646 | 22,118,961 | ||||||
Shares reacquired upon conversion into other share class(es) | (1,674,498 | ) | (16,625,398 | ) | ||||
|
|
|
| |||||
Net increase (decrease) in shares outstanding | 22,445,075 | $ | 221,131,879 | |||||
|
|
|
| |||||
7. Borrowings
The Company, on behalf of the Fund, along with other affiliated registered investment companies (the “Funds”), is a party to a Syndicated Credit Agreement (“SCA”) with a group of banks. The purpose of the SCA is to provide an alternative source of temporary funding for capital share redemptions. The SCA provides for a commitment of $900 million for the period October 5, 2017 through October 4, 2018. The Funds pay an annualized commitment fee of 0.15% of the unused portion of the SCA. The Fund’s portion of the commitment fee for the unused amount, allocated based upon a method approved by the
| 66 |
Board, is accrued daily and paid quarterly. Prior to October 5, 2017, the Funds had another SCA that provided a commitment of $900 million and the Funds paid an annualized commitment fee of 0.15% of the unused portion of the SCA. The interest on borrowings under the SCAs is paid monthly and at a per annum interest rate based upon a contractual spread plus the higher of (1) the effective federal funds rate, (2) the 1-month LIBOR rate or (3) zero percent.
Other affiliated registered investment companies that are parties to the SCA include portfolios that are subject to a predetermined mathematical formula used to manage certain benefit guarantees offered under variable annuity contracts. The formula may result in large scale asset flows into and out of these portfolios. Consequently, these portfolios may be more likely to utilize the SCA for purposes of funding redemptions. It may be possible for those portfolios to fully exhaust the committed amount of the SCA, thereby requiring the Manager to allocate available funding per a Board-approved methodology designed to treat the Funds in the SCA equitably.
The Fund utilized the SCA during the reporting period ended February 28, 2018. The average daily balance for the 2 days that the Fund had loans outstanding during the period was $4,733,500, borrowed at a weighted average interest rate of 2.82%. The maximum loan balance outstanding during the period was $4,866,000. At February 28, 2018, the Fund did not have an outstanding loan balance.
| Prudential Floating Rate Income Fund | 67 |
Financial Highlights
| Class A Shares | ||||||||||||||||||||
| Year Ended February 28/29, | ||||||||||||||||||||
| 2018(d) | 2017(d) | 2016(d) | 2015 | 2014 | ||||||||||||||||
| Per Share Operating Performance: | ||||||||||||||||||||
| Net Asset Value, Beginning Of Year | $9.95 | $9.38 | $9.94 | $10.18 | $10.12 | |||||||||||||||
| Income (loss) from investment operations: | ||||||||||||||||||||
| Net investment income (loss) | 0.45 | 0.41 | 0.36 | 0.40 | 0.37 | |||||||||||||||
| Net realized and unrealized gain (loss) on investment transactions | 0.01 | 0.56 | (0.57 | ) | (0.22 | ) | 0.08 | |||||||||||||
| Total from investment operations | 0.46 | 0.97 | (0.21 | ) | 0.18 | 0.45 | ||||||||||||||
| Less Dividends and Distributions: | ||||||||||||||||||||
| Dividends from net investment income | (0.46 | ) | (0.40 | ) | (0.35 | ) | (0.39 | ) | (0.36 | ) | ||||||||||
| Distributions from net realized gains | (0.01 | ) | - | - | (0.03 | ) | (0.03 | ) | ||||||||||||
| Total dividends and distributions | (0.47 | ) | (0.40 | ) | (0.35 | ) | (0.42 | ) | (0.39 | ) | ||||||||||
| Net asset value, end of year | $9.94 | $9.95 | $9.38 | $9.94 | $10.18 | |||||||||||||||
| Total Return(a): | 4.70% | 10.46% | (2.24)% | 1.80% | 4.53% | |||||||||||||||
| Ratios/Supplemental Data: | ||||||||||||||||||||
| Net assets, end of year (000) | $79,462 | $69,733 | $47,683 | $23,158 | $34,211 | |||||||||||||||
| Average net assets (000) | $75,379 | $58,748 | $40,785 | $28,113 | $31,911 | |||||||||||||||
| Ratios to average net assets(b)(c): | ||||||||||||||||||||
| Expenses after waivers and/or expense reimbursement | 0.95% | 1.00% | 1.05% | 1.10% | 1.20% | |||||||||||||||
| Expenses before waivers and/or expense reimbursement | 1.09% | 1.14% | 1.34% | 1.60% | 1.60% | |||||||||||||||
| Net investment income (loss) | 4.53% | 4.16% | 3.65% | 3.89% | 3.65% | |||||||||||||||
| Portfolio turnover rate | 94% | 67% | 55% | 64% | 82% | |||||||||||||||
| (a) | Total return does not consider the effects of sales loads. Total return is calculated assuming a purchase of a share on the first day and a sale on the last day of each year reported and includes reinvestment of dividends and distributions, if any. Total returns may reflect adjustments to conform to generally accepted accounting principles. |
| (b) | Does not include expenses of the underlying funds in which the Fund invests. |
| (c) | The distributor of the Fund had contractually agreed to limit its distribution and service (12b-1) fees to 0.25% of the average daily net assets through March 8, 2015. Effective March 9, 2015, the contractual distribution and service (12b-1) fees were reduced from 0.30% to 0.25% of the average daily net assets. |
| (d) | Calculated based on average shares outstanding during the year. |
See Notes to Financial Statements.
| 68 |
| Class C Shares | ||||||||||||||||||||
| Year Ended February 28/29, | ||||||||||||||||||||
| 2018(c) | 2017(c) | 2016(c) | 2015 | 2014 | ||||||||||||||||
| Per Share Operating Performance: | ||||||||||||||||||||
| Net Asset Value, Beginning Of Year | $9.95 | $9.38 | $9.95 | $10.19 | $10.13 | |||||||||||||||
| Income (loss) from investment operations: | ||||||||||||||||||||
| Net investment income (loss) | 0.38 | 0.33 | 0.28 | 0.32 | 0.29 | |||||||||||||||
| Net realized and unrealized gain (loss) on investment transactions | - | (d) | 0.57 | (0.58 | ) | (0.22 | ) | 0.08 | ||||||||||||
| Total from investment operations | 0.38 | 0.90 | (0.30 | ) | 0.10 | 0.37 | ||||||||||||||
| Less Dividends and Distributions: | ||||||||||||||||||||
| Dividends from net investment income | (0.38 | ) | (0.33 | ) | (0.27 | ) | (0.31 | ) | (0.28 | ) | ||||||||||
| Distributions from net realized gains | (0.01 | ) | - | - | (0.03 | ) | (0.03 | ) | ||||||||||||
| Total dividends and distributions | (0.39 | ) | (0.33 | ) | (0.27 | ) | (0.34 | ) | (0.31 | ) | ||||||||||
| Net asset value, end of year | $9.94 | $9.95 | $9.38 | $9.95 | $10.19 | |||||||||||||||
| Total Return(a): | 3.92% | 9.64% | (3.07)% | 1.04% | 3.74% | |||||||||||||||
| Ratios/Supplemental Data: | ||||||||||||||||||||
| Net assets, end of year (000) | $52,919 | $54,092 | $35,027 | $28,408 | $32,149 | |||||||||||||||
| Average net assets (000) | $54,061 | $39,905 | $33,571 | $31,363 | $21,337 | |||||||||||||||
| Ratios to average net assets(b): | ||||||||||||||||||||
| Expenses after waivers and/or expense reimbursement | 1.70% | 1.75% | 1.80% | 1.85% | 1.95% | |||||||||||||||
| Expenses before waivers and/or expense reimbursement | 1.84% | 1.89% | 2.11% | 2.30% | 2.35% | |||||||||||||||
| Net investment income (loss) | 3.79% | 3.41% | 2.88% | 3.15% | 2.91% | |||||||||||||||
| Portfolio turnover rate | 94% | 67% | 55% | 64% | 82% | |||||||||||||||
| (a) | Total return does not consider the effects of sales loads. Total return is calculated assuming a purchase of a share on the first day and a sale on the last day of each year reported and includes reinvestment of dividends and distributions, if any. Total returns may reflect adjustments to conform to generally accepted accounting principles. |
| (b) | Does not include expenses of the underlying funds in which the Fund invests. |
| (c) | Calculated based on average shares outstanding during the year. |
| (d) | Less than $0.005. |
See Notes to Financial Statements.
| Prudential Floating Rate Income Fund | 69 |
Financial Highlights (continued)
| Class Q Shares | ||||||||||||||||
| Year Ended February 28, | April 27, 2015(a) through February 29, | |||||||||||||||
2018 | 2017 | 2016 | ||||||||||||||
| Per Share Operating Performance(d): | ||||||||||||||||
| Net Asset Value, Beginning of Period | $9.96 | $9.39 | $10.03 | |||||||||||||
| Income (loss) from investment operations: | ||||||||||||||||
| Net investment income (loss) | 0.48 | 0.45 | 0.32 | |||||||||||||
| Net realized and unrealized gain (loss) on investment and foreign currency transactions | - | (g) | 0.55 | (0.65 | ) | |||||||||||
| Total from investment operations | 0.48 | 1.00 | (0.33 | ) | ||||||||||||
| Less Dividends and Distributions: | ||||||||||||||||
| Dividends from net investment income | (0.49 | ) | (0.43 | ) | (0.31 | ) | ||||||||||
| Distributions from net realized gains on investments | (0.01 | ) | - | - | ||||||||||||
| Total dividends and distributions | (0.50 | ) | (0.43 | ) | (0.31 | ) | ||||||||||
| Net asset value, end of period | | $9.94 | | $9.96 | $9.39 | |||||||||||
| Total Return(b): | 4.91% | 10.79% | (3.35)% | |||||||||||||
| Ratios/Supplemental Data: | ||||||||||||||||
| Net assets, end of period (000) | $26,457 | $32,058 | $10 | |||||||||||||
| Average net assets (000) | $16,803 | $5,484 | $10 | |||||||||||||
| Ratios to average net assets(c): | ||||||||||||||||
| Expenses after waivers and/or expense reimbursement | 0.65% | 0.67% | 0.80% | (e) | ||||||||||||
| Expenses before waivers and/or expense reimbursement | 0.75% | 0.82% | 0.99% | (e) | ||||||||||||
| Net investment income (loss) | 4.83% | 4.60% | 3.87% | (e) | ||||||||||||
| Portfolio turnover rate | 94% | 67% | 55% | (f) | ||||||||||||
| (a) | Commencement of operations. |
| (b) | Total return is calculated assuming a purchase of a share on the first day and a sale on the last day of each period reported and includes reinvestment of dividends and distributions, if any. Total returns may reflect adjustments to conform to generally accepted accounting principles. Total returns for periods of less than one full year are not annualized. |
| (c) | Does not include expenses of the underlying funds in which the Funds invests. |
| (d) | Calculated based on average shares outstanding during the period. |
| (e) | Annualized. |
| (f) | Not annualized. |
| (g) | Less than $0.005. |
See Notes to Financial Statements.
| 70 |
| Class Z Shares | ||||||||||||||||||||
| Year Ended February 28/29, | ||||||||||||||||||||
| 2018(c) | 2017(c) | 2016(c) | 2015 | 2014 | ||||||||||||||||
| Per Share Operating Performance: | ||||||||||||||||||||
| Net Asset Value, Beginning Of Year | $9.96 | $9.39 | $9.95 | $10.19 | $10.14 | |||||||||||||||
| Income (loss) from investment operations: | ||||||||||||||||||||
| Net investment income (loss) | 0.48 | 0.43 | 0.38 | 0.42 | 0.40 | |||||||||||||||
| Net realized and unrealized gain (loss) on investment transactions | (0.01 | ) | 0.57 | (0.57 | ) | (0.22 | ) | 0.06 | ||||||||||||
| Total from investment operations | 0.47 | 1.00 | (0.19 | ) | 0.20 | 0.46 | ||||||||||||||
| Less Dividends and Distributions: | ||||||||||||||||||||
| Dividends from net investment income | (0.48 | ) | (0.43 | ) | (0.37 | ) | (0.41 | ) | (0.38 | ) | ||||||||||
| Distributions from net realized gains | (0.01 | ) | - | - | (0.03 | ) | (0.03 | ) | ||||||||||||
| Total dividends and distributions | (0.49 | ) | (0.43 | ) | (0.37 | ) | (0.44 | ) | (0.41 | ) | ||||||||||
| Net asset value, end of year | $9.94 | $9.96 | $9.39 | $9.95 | $10.19 | |||||||||||||||
| Total Return(a): | 4.86% | 10.76% | (1.98)% | 2.05% | 4.68% | |||||||||||||||
| Ratios/Supplemental Data: | ||||||||||||||||||||
| Net assets, end of year (000) | $400,179 | $367,286 | $135,575 | $57,729 | $47,082 | |||||||||||||||
| Average net assets (000) | $390,617 | $224,436 | $115,125 | $52,159 | $44,076 | |||||||||||||||
| Ratios to average net assets(b): | ||||||||||||||||||||
| Expenses after waivers and/or expense reimbursement | 0.70% | 0.75% | 0.80% | 0.85% | 0.95% | |||||||||||||||
| Expenses before waivers and/or expense reimbursement | 0.84% | 0.89% | 1.09% | 1.30% | 1.31% | |||||||||||||||
| Net investment income (loss) | 4.79% | 4.42% | 3.88% | 4.16% | 3.85% | |||||||||||||||
| Portfolio turnover rate | 94% | 67% | 55% | 64% | 82% | |||||||||||||||
| (a) | Total return is calculated assuming a purchase of a share on the first day and a sale on the last day of each year reported and includes reinvestment of dividends and distributions, if any. Total returns may reflect adjustments to conform to generally accepted accounting principles. |
| (b) | Does not include expenses of the underlying funds in which the Fund invests. |
| (c) | Calculated based on average shares outstanding during the year. |
See Notes to Financial Statements.
| Prudential Floating Rate Income Fund | 71 |
Report of Independent Registered Public
Accounting Firm
To the Shareholders and Board of Directors
Prudential Investment Portfolios, Inc. 14:
Opinion on the Financial Statements
We have audited the accompanying statement of assets and liabilities of Prudential Floating Rate Income Fund (the “Fund”), a series of Prudential Investment Portfolios, Inc. 14, including the schedule of investments, as of February 28, 2018, the related statement of operations for the year then ended, the statements of changes in net assets for each of the years in the two-year period then ended, and the related notes (collectively, the “financial statements”) and the financial highlights for each of the years or periods in the five-year period then ended. In our opinion, the financial statements and financial highlights referred to above present fairly, in all material respects, the financial position of the Fund as of February 28, 2018, the results of its operations for the year then ended, the changes in its net assets for each of the years in the two-year period then ended, and the financial highlights for each of the years or periods in the five-year period then ended, in conformity with U.S. generally accepted accounting principles.
Basis for Opinion
These financial statements and financial highlights are the responsibility of the Fund’s management. Our responsibility is to express an opinion on these financial statements and financial highlights based on our audits. We are a public accounting firm registered with the Public Company Accounting Oversight Board (United States) (“PCAOB”) and are required to be independent with respect to the Fund in accordance with the U.S. federal securities laws and the applicable rules and regulations of the Securities and Exchange Commission and the PCAOB.
We conducted our audits in accordance with the standards of the PCAOB. Those standards require that we plan and perform the audit to obtain reasonable assurance about whether the financial statements and financial highlights are free of material misstatement, whether due to error or fraud. Our audits included performing procedures to assess the risks of material misstatement of the financial statements and financial highlights, whether due to error or fraud, and performing procedures that respond to those risks. Such procedures included examining, on a test basis, evidence supporting the amounts and disclosures in the financial statements and financial highlights. Such procedures also included confirmation of securities owned as of February 28, 2018, by correspondence with the custodian, transfer agent, agent banks and brokers or by other appropriate auditing procedures when replies from brokers were not received. Our audits also included evaluating the accounting principles used and significant estimates made by management, as well as evaluating the overall presentation of the financial statements
| 72 |
and financial highlights. We believe that our audits provide a reasonable basis for our opinion.

We have served as the auditor of one or more Prudential Retail investment companies since 2003.
New York, New York
April 18, 2018
| Prudential Floating Rate Income Fund | 73 |
Federal Income Tax Information (unaudited)
For the year ended February 28, 2018, the Fund reports the maximum amount allowable but not less than 98.77% as interest-related dividends in accordance with Sections 871(k)(1) and 881(e)(1) of the Internal Revenue Code.
In January 2019, you will be advised on IRS Form 1099-DIV or substitute 1099-DIV, as to the federal tax status of the dividends received by you in calendar year 2018.
| 74 |
INFORMATION ABOUT BOARD MEMBERS AND OFFICERS
(Unaudited)
Information about Board Members and Officers of the Funds is set forth below. Board Members who are not deemed to be “interested persons” of the Funds, as defined in the 1940 Act, are referred to as “Independent Board Members.” Board Members who are deemed to be “interested persons” of the Funds are referred to as “Interested Board Members.” The Board Members are responsible for the overall supervision of the operations of the Funds and perform the various duties imposed on the directors of investment companies by the 1940 Act. The Board in turn elects the Officers, who are responsible for administering the day-to-day operations of the Funds.
| Independent Board Members | ||||||
Name, Address, Age Position(s) Portfolios Overseen | Principal Occupation(s) During Past Five Years | Other Directorships Held During Past Five Years | Length of Board Service | |||
Ellen S. Alberding (60) Board Member Portfolios Overseen: 90 | President and Board Member, The Joyce Foundation (charitable foundation) (since 2002); Vice Chair, City Colleges of Chicago (community college system) (2011-2015); Trustee, National Park Foundation (charitable foundation for national park system) (2009-2018); Trustee, Economic Club of Chicago (since 2009); Trustee, Loyola University (since 2018). | None. | Since September 2013 | |||
Kevin J. Bannon (65) Board Member Portfolios Overseen: 90 | Retired; Managing Director (April 2008-May 2015) and Chief Investment Officer (October 2008-November 2013) of Highmount Capital LLC (registered investment adviser); formerly Executive Vice President and Chief Investment Officer (April 1993-August 2007) of Bank of New York Company; President (May 2003-May 2007) of BNY Hamilton Family of Mutual Funds. | Director of Urstadt Biddle Properties (equity real estate investment trust) (since September 2008). | Since July 2008 | |||
Linda W. Bynoe (65) Board Member Portfolios Overseen: 90 | President and Chief Executive Officer (since March 1995) and formerly Chief Operating Officer (December 1989-February 1995) of Telemat Ltd. (management consulting); formerly Vice President (January 1985-June 1989) at Morgan Stanley & Co. (broker-dealer). | Director of Anixter International, Inc. (communication products distributor) (since January 2006); Director of Northern Trust Corporation (financial services) (since April 2006); Trustee of Equity Residential (residential real estate) (since December 2009). | Since March 2005 | |||
Prudential Floating Rate Income Fund
| Independent Board Members | ||||||
Name, Address, Age Position(s) Portfolios Overseen | Principal Occupation(s) During Past Five Years | Other Directorships Held During Past Five Years | Length of Board Service | |||
Barry H. Evans (57)± Board Member Portfolios Overseen: 89 | Retired; Formerly President (2005-2016), Global Chief Operating Officer (2014-2016), Chief Investment Officer-Global Head of Fixed Income (1998-2014), and various portfolio manager roles (1986-2006), Manulife Asset Management U.S. | Director, Manulife Trust Company (since 2011); Director, Manulife Asset Management Limited (2015-2017); Formerly Chairman of the Board of Directors of Manulife Asset Management U.S. (2005-2016); Formerly Chairman of the Board, Declaration Investment Management and Research (2008-2016). | Since September 2017 | |||
Keith F. Hartstein (61) Board Member & Independent Chair Portfolios Overseen: 90 | Retired; Member (since November 2014) of the Governing Council of the Independent Directors Council (organization of independent mutual fund directors); formerly President and Chief Executive Officer (2005-2012), Senior Vice President (2004-2005), Senior Vice President of Sales and Marketing (1997-2004), and various executive management positions (1990-1997), John Hancock Funds, LLC (asset management); Chairman, Investment Company Institute’s Sales Force Marketing Committee (2003-2008). | None. | Since September 2013 | |||
Visit our website at pgiminvestments.com
| Independent Board Members | ||||||
Name, Address, Age Position(s) Portfolios Overseen | Principal Occupation(s) During Past Five Years | Other Directorships Held During Past Five Years | Length of Board Service | |||
Laurie Simon Hodrick (55)± Board Member Portfolios Overseen: 89 | A. Barton Hepburn Professor Emerita of Economics in the Faculty of Business, Columbia Business School (since 2018); Visiting Professor of Law, Stanford Law School (since 2015); Visiting Fellow at the Hoover Institution, Stanford University (since 2015); Sole Member, ReidCourt LLC (since 2008) (a consulting firm); formerly A. Barton Hepburn Professor of Economics in the Faculty of Business, Columbia Business School (1996-2017); formerly Managing Director, Global Head of Alternative Investment Strategies, Deutsche Bank (2006-2008). | Independent Director, Corporate Capital Trust (since April 2017) (a business development company). | Since September 2017 | |||
Michael S. Hyland, CFA (72) Board Member Portfolios Overseen: 90 | Retired (since February 2005); formerly Senior Managing Director (July 2001-February 2005) of Bear Stearns & Co, Inc.; Global Partner, INVESCO (1999-2001); Managing Director and President of Salomon Brothers Asset Management (1989-1999). | None. | Since July 2008 | |||
Richard A. Redeker (74) Board Member Portfolios Overseen: 90 | Retired Mutual Fund Senior Executive (50 years); Management Consultant; Director, Mutual Fund Directors Forum (since 2014); Independent Directors Council (organization of independent mutual fund directors)-Executive Committee, Chair of Policy Steering Committee, Governing Council. | None. | Since October 1993 | |||
Prudential Floating Rate Income Fund
| Independent Board Members | ||||||
Name, Address, Age Position(s) Portfolios Overseen | Principal Occupation(s) During Past Five Years | Other Directorships Held During Past Five Years | Length of Board Service | |||
Brian K. Reid (56)# Board Member Portfolios Overseen: 89 | Retired; formerly Chief Economist for the Investment Company Institute (ICI) (2005-2017); formerly Senior Economist and Director of Industry and Financial Analysis at the ICI (1998-2004); formerly Senior Economist, Industry and Financial Analysis at the ICI (1996-1998); formerly Staff Economist at the Federal Reserve Board (1989-1996); Director, ICI Mutual Insurance Company (2012-2017). | None. | Since March 2018 | |||
Stephen G. Stoneburn (74) Board Member Portfolios Overseen: 90 | Chairman (since July 2011), President and Chief Executive Officer (since June 1996) of Frontline Medical Communications (publishing company); formerly President (June 1995-June 1996) of Argus Integrated Media, Inc.; Senior Vice President and Managing Director (January 1993-1995) of Cowles Business Media; Senior Vice President of Fairchild Publications, Inc. (1975-1989). | None. | Since July 2003 | |||
| ± | Mr. Evans and Ms. Hodrick joined the Board effective as of September 1, 2017. |
| # | Mr. Reid joined the Board effective as of March 1, 2018. |
| Interested Board Members | ||||||
Name, Address, Age Position(s) Portfolios Overseen | Principal Occupation(s) During Past Five Years | Other Directorships Held During Past Five Years | Length of Board Service | |||
Stuart S. Parker (55) Board Member & President Portfolios Overseen: 90 | President of PGIM Investments LLC (formerly known as Prudential Investments LLC) (since January 2012); Executive Vice President of Prudential Investment Management Services LLC (since December 2012); Executive Vice President of Jennison Associates LLC and Head of Retail Distribution of PGIM Investments LLC (June 2005-December 2011). | None. | Since January 2012 | |||
Visit our website at pgiminvestments.com
| Interested Board Members | ||||||
Name, Address, Age Position(s) Portfolios Overseen | Principal Occupation(s) During Past Five Years | Other Directorships Held During Past Five Years | Length of Board Service | |||
Scott E. Benjamin (44) Board Member & Vice President Portfolios Overseen: 90 | Executive Vice President (since June 2009) of PGIM Investments LLC; Executive Vice President (June 2009-June 2012) and Vice President (since June 2012) of Prudential Investment Management Services LLC; Executive Vice President (since September 2009) of AST Investment Services, Inc.; Senior Vice President of Product Development and Marketing, PGIM Investments (since February 2006); Vice President of Product Development and Product Management, PGIM Investments LLC (2003-2006). | None. | Since March 2010 | |||
Grace C. Torres* (58) Board Member Portfolios Overseen: 89 | Retired; formerly Treasurer and Principal Financial and Accounting Officer of the Prudential Funds, Target Funds, Advanced Series Trust, Prudential Variable Contract Accounts and The Prudential Series Fund (1998-June 2014); Assistant Treasurer (March 1999-June 2014) and Senior Vice President (September 1999-June 2014) of PGIM Investments LLC; Assistant Treasurer (May 2003-June 2014) and Vice President (June 2005-June 2014) of AST Investment Services, Inc.; Senior Vice President and Assistant Treasurer (May 2003-June 2014) of Prudential Annuities Advisory Services, Inc. | Director (July 2015-January 2018) of Sun Bancorp, Inc. N.A. and Sun National Bank; Director (since January 2018) of OceanFirst Financial Corp. and OceanFirst Bank. | Since November 2014 | |||
| * | Note: Prior to her retirement in 2014, Ms. Torres was employed by PGIM Investments LLC. Due to her prior employment, she is considered to be an “interested person” under the 1940 Act. Ms. Torres is a Non-Management Interested Board Member. |
Prudential Floating Rate Income Fund
| Fund Officers(a) | ||||
Name, Address and Age Position with Fund | Principal Occupation(s) During Past Five Years | Length of Service as Fund Officer | ||
Raymond A. O’Hara (62) Chief Legal Officer | Vice President and Corporate Counsel (since July 2010) of Prudential Insurance Company of America (Prudential); Vice President (March 2011-Present) of Pruco Life Insurance Company and Pruco Life Insurance Company of New Jersey; Vice President and Corporate Counsel (March 2011-Present) of Prudential Annuities Life Assurance Corporation; Chief Legal Officer of PGIM Investments LLC (since June 2012); Chief Legal Officer of Prudential Mutual Fund Services LLC (since June 2012) and Corporate Counsel of AST Investment Services, Inc. (since June 2012); formerly Assistant Vice President and Corporate Counsel (September 2008-July 2010) of The Hartford Financial Services Group, Inc.; formerly Associate (September 1980-December 1987) and Partner (January 1988-August 2008) of Blazzard & Hasenauer, P.C. (formerly, Blazzard, Grodd & Hasenauer, P.C.). | Since June 2012 | ||
Chad A. Earnst (42) Chief Compliance Officer | Chief Compliance Officer (September 2014-Present) of PGIM Investments LLC; Chief Compliance Officer (September 2014-Present) of the Prudential Funds, Target Funds, Advanced Series Trust, The Prudential Series Fund, Prudential’s Gibraltar Fund, Inc., Prudential Global Short Duration High Yield Income Fund, Inc., Prudential Short Duration High Yield Fund, Inc. and Prudential Jennison MLP Income Fund, Inc.; formerly Assistant Director (March 2010-August 2014) of the Asset Management Unit, Division of Enforcement, US Securities & Exchange Commission; Assistant Regional Director (January 2010-August 2014), Branch Chief (June 2006-December 2009) and Senior Counsel (April 2003-May 2006) of the Miami Regional Office, Division of Enforcement, US Securities & Exchange Commission. | Since September 2014 | ||
Dino Capasso (43) Deputy Chief Compliance Officer | Vice President and Deputy Chief Compliance Officer (June 2017-Present) of PGIM Investments LLC; formerly, Senior Vice President and Senior Counsel (January 2016-June 2017), and Vice President and Counsel (February 2012-December 2015) of Pacific Investment Management Company LLC. | Since March 2018 | ||
Deborah A. Docs (60) Secretary | Vice President and Corporate Counsel (since January 2001) of Prudential; Vice President (since December 1996) and Assistant Secretary (since March 1999) of PGIM Investments LLC; formerly Vice President and Assistant Secretary (May 2003-June 2005) of AST Investment Services, Inc. | Since May 2004 | ||
Visit our website at pgiminvestments.com
| Fund Officers(a) | ||||
Name, Address and Age Position with Fund | Principal Occupation(s) During Past Five Years | Length of Service as Fund Officer | ||
Jonathan D. Shain (59) Assistant Secretary | Vice President and Corporate Counsel (since August 1998) of Prudential; Vice President and Assistant Secretary (since May 2001) of PGIM Investments LLC; Vice President and Assistant Secretary (since February 2001) of Prudential Mutual Fund Services LLC; formerly Vice President and Assistant Secretary (May 2003-June 2005) of AST Investment Services, Inc. | Since May 2005 | ||
| Claudia DiGiacomo (43) Assistant Secretary | Vice President and Corporate Counsel (since January 2005) of Prudential; Vice President and Assistant Secretary of PGIM Investments LLC (since December 2005); Associate at Sidley Austin Brown & Wood LLP (1999-2004). | Since December 2005 | ||
| Andrew R. French (55) Assistant Secretary | Vice President and Corporate Counsel (since February 2010) of Prudential; formerly Director and Corporate Counsel (2006-2010) of Prudential; Vice President and Assistant Secretary (since January 2007) of PGIM Investments LLC; Vice President and Assistant Secretary (since January 2007) of Prudential Mutual Fund Services LLC. | Since October 2006 | ||
| Charles H. Smith (45) Anti-Money Laundering Compliance Officer | Vice President, Corporate Compliance, Anti-Money Laundering Unit (since January 2015) of Prudential; committee member of the American Council of Life Insurers Anti-Money Laundering and Critical Infrastructure Committee (since January 2016); formerly Global Head of Economic Sanctions Compliance at AIG Property Casualty (February 2007-December 2014); Assistant Attorney General at the New York State Attorney General’s Office, Division of Public Advocacy. (August 1998-January 2007). | Since January 2017 | ||
| M. Sadiq Peshimam (54) Treasurer and Principal Financial and Accounting Officer | Vice President (since 2005) of PGIM Investments LLC; formerly Assistant Treasurer of funds in the Prudential Mutual Fund Complex (2006-2014). | Since February 2006 | ||
Peter Parrella (59) Assistant Treasurer | Vice President (since 2007) and Director (2004-2007) within Prudential Mutual Fund Administration; formerly Tax Manager at SSB Citi Fund Management LLC (1997-2004). | Since June 2007 | ||
Lana Lomuti (50) Assistant Treasurer | Vice President (since 2007) and Director (2005-2007), within Prudential Mutual Fund Administration; formerly Assistant Treasurer (December 2007-February 2014) of The Greater China Fund, Inc. | Since April 2014 | ||
| Linda McMullin (56) Assistant Treasurer | Vice President (since 2011) and Director (2008-2011) within Prudential Mutual Fund Administration. | Since April 2014 | ||
| Kelly A. Coyne (49) Assistant Treasurer | Director, Investment Operations of Prudential Mutual Fund Services LLC (since 2010). | Since March 2015 | ||
| (a) | Excludes Mr. Parker and Mr. Benjamin, interested Board Members who also serve as President and Vice President, respectively. |
Prudential Floating Rate Income Fund
Explanatory Notes to Tables:
| • | Board Members are deemed to be “Interested,” as defined in the 1940 Act, by reason of their affiliation with PGIM Investments LLC and/or an affiliate of PGIM Investments LLC. |
| • | Unless otherwise noted, the address of all Board Members and Officers is c/o PGIM Investments LLC, 655 Broad Street, Newark, New Jersey 07102-4410. |
| • | There is no set term of office for Board Members or Officers. The Board Members have adopted a retirement policy, which calls for the retirement of Board Members on December 31 of the year in which they reach the age of 75. |
| • | “Other Directorships Held” includes only directorships of companies required to register or file reports with the SEC under the 1934 Act (that is, “public companies”) or other investment companies registered under the 1940 Act. |
| • | “Portfolios Overseen” includes all investment companies managed by PGIM Investments LLC. The investment companies for which PGIM Investments LLC serves as manager include the Prudential Mutual Funds, The Prudential Variable Contract Accounts, PGIM ETF Trust, Prudential Short Duration High Yield Fund, Inc., Prudential Global Short Duration High Yield Fund, Inc., The Prudential Series Fund, Prudential’s Gibraltar Fund, Inc. and the Advanced Series Trust. |
Visit our website at pgiminvestments.com
| ∎ TELEPHONE | ∎ WEBSITE | |||
655 Broad Street Newark, NJ 07102 | (800) 225-1852 | www.pgiminvestments.com |
| PROXY VOTING |
| The Board of Directors of the Fund has delegated to the Fund’s investment subadviser the responsibility for voting any proxies and maintaining proxy recordkeeping with respect to the Fund. A description of these proxy voting policies and procedures is available without charge, upon request, by calling (800) 225-1852. Information regarding how the Fund voted proxies relating to portfolio securities during the most recent 12-month period ended June 30 is available on the Fund’s website and on the Securities and Exchange Commission’s website. |
| DIRECTORS |
| Ellen S. Alberding • Kevin J. Bannon • Scott E. Benjamin • Linda W. Bynoe • Barry H. Evans • Keith F. Hartstein • Laurie Simon Hodrick • Michael S. Hyland • Stuart S. Parker • Richard A. Redeker • Brian K. Reid • Stephen G. Stoneburn • Grace C. Torres |
| OFFICERS |
| Stuart S. Parker, President • Scott E. Benjamin, Vice President • M. Sadiq Peshimam, Treasurer and Principal Financial and Accounting Officer • Raymond A. O’Hara, Chief Legal Officer • Deborah A. Docs, Secretary • Chad A. Earnst, Chief Compliance Officer • Dino Capasso, Vice President and Deputy Chief Compliance Officer • Charles H. Smith, Anti-Money Laundering Compliance Officer • Jonathan D. Shain, Assistant Secretary • Claudia DiGiacomo, Assistant Secretary • Andrew R. French, Assistant Secretary • Peter Parrella, Assistant Treasurer • Lana Lomuti, Assistant Treasurer • Linda McMullin, Assistant Treasurer • Kelly A. Coyne, Assistant Treasurer |
| MANAGER | PGIM Investments LLC | 655 Broad Street Newark, NJ 07102 | ||
| ||||
| INVESTMENT SUBADVISER | PGIM Fixed Income | 655 Broad Street Newark, NJ 07102 | ||
| ||||
| DISTRIBUTOR | Prudential Investment Management Services LLC | 655 Broad Street Newark, NJ 07102 | ||
| ||||
| CUSTODIAN | The Bank of New York Mellon | 225 Liberty Street New York, NY 10286 | ||
| ||||
| TRANSFER AGENT | Prudential Mutual Fund Services LLC | PO Box 9658 Providence, RI 02940 | ||
| ||||
| INDEPENDENT REGISTERED PUBLIC ACCOUNTING FIRM | KPMG LLP | 345 Park Avenue New York, NY 10154 | ||
| ||||
| FUND COUNSEL | Willkie Farr & Gallagher LLP | 787 Seventh Avenue New York, NY 10019 | ||
| ||||
| An investor should consider the investment objectives, risks, charges, and expenses of the Fund carefully before investing. The prospectus and summary prospectus contain this and other information about the Fund. An investor may obtain a prospectus and summary prospectus by visiting our website at www.pgiminvestments.com or by calling (800) 225-1852. The prospectus and summary prospectus should be read carefully before investing. |
| E-DELIVERY |
| To receive your mutual fund documents online, go to www.pgiminvestments.com/edelivery and enroll. Instead of receiving printed documents by mail, you will receive notification via email when new materials are available. You can cancel your enrollment or change your email address at any time by visiting the website address above. |
| SHAREHOLDER COMMUNICATIONS WITH DIRECTORS |
| Shareholders can communicate directly with the Board of Directors by writing to the Chair of the Board, Prudential Floating Rate Income Fund, PGIM Investments, Attn: Board of Directors, 655 Broad Street, Newark, NJ 07102. Shareholders can communicate directly with an individual Director by writing to the same address. Communications are not screened before being delivered to the addressee. |
| AVAILABILITY OF PORTFOLIO SCHEDULE |
| The Fund files its complete schedule of portfolio holdings with the Securities and Exchange Commission for the first and third quarters of each fiscal year on Form N-Q. The Fund’s Forms N-Q are available on the Commission’s website at www.sec.gov. The Fund’s Forms N-Q may also be reviewed and copied at the Commission’s Public Reference Room in Washington, D.C. Information on the operation and location of the Public Reference Room may be obtained by calling 1-800-SEC-0330. The Fund’s schedule of portfolio holdings is also available on the Fund’s website as of the end of each month no sooner than 15 days after the end of the month. |
| The Fund’s Statement of Additional Information contains additional information about the Fund’s Directors and is available without charge, upon request, by calling (800) 225-1852. |
Mutual Funds:
| ARE NOT INSURED BY THE FDIC OR ANY FEDERAL GOVERNMENT AGENCY | MAY LOSE VALUE | ARE NOT A DEPOSIT OF OR GUARANTEED BY ANY BANK OR ANY BANK AFFILIATE |
PRUDENTIAL FLOATING RATE INCOME FUND
| SHARE CLASS | A | C | Z | Q | ||||
| NASDAQ | FRFAX | FRFCX | FRFZX | PFRIX | ||||
| CUSIP | 74439V602 | 74439V701 | 74439V800 | 74439V883 |
MF211E
Item 2 – Code of Ethics – – See Exhibit (a)
As of the end of the period covered by this report, the registrant has adopted a code of ethics (the “Section 406 Standards for Investment Companies – Ethical Standards for Principal Executive and Financial Officers”) that applies to the registrant’s Principal Executive Officer and Principal Financial Officer; the registrant’s Principal Financial Officer also serves as the Principal Accounting Officer.
The registrant hereby undertakes to provide any person, without charge, upon request, a copy of the code of ethics. To request a copy of the code of ethics, contact the registrant 800-225-1852, and ask for a copy of the Section 406 Standards for Investment Companies - Ethical Standards for Principal Executive and Financial Officers.
Item 3 – Audit Committee Financial Expert –
The registrant’s Board has determined that Mr. Kevin J. Bannon, member of the Board’s Audit Committee is an “audit committee financial expert,” and that he is “independent,” for purposes of this Item.
Item 4 – Principal Accountant Fees and Services –
(a) Audit Fees
For the fiscal years ended February 28, 2018 and February 28, 2017, KPMG LLP (“KPMG”), the Registrant’s principal accountant, billed the Registrant $96,484 and $100,528, respectively, for professional services rendered for the audit of the Registrant’s annual financial statements or services that are normally provided in connection with statutory and regulatory filings.
(b) Audit-Related Fees
For the fiscal years ended February 28, 2018 and February 28, 2017: none.
(c) Tax Fees
For the fiscal years ended February 28, 2018 and February 28, 2017: none.
(d) All Other Fees
For the fiscal years ended February 28, 2018 and February 28, 2017: none.
(e) (1) Audit Committee Pre-Approval Policies and Procedures
THE PRUDENTIAL MUTUAL FUNDS
AUDIT COMMITTEE POLICY
On
Pre-Approval of Services Provided by the Independent Accountants
The Audit Committee of each Prudential Mutual Fund is charged with the responsibility to monitor the independence of the Fund’s independent accountants. As part of this responsibility, the Audit Committee must pre-approve the independent accounting firm’s engagement to render audit and/or permissible non-audit services, as required by law. In evaluating a proposed engagement of the independent accountants, the Audit Committee will assess the effect that the engagement might reasonably be expected to have on the accountant’s independence. The Committee’s evaluation will be based on:
| • | a review of the nature of the professional services expected to be provided, |
| • | a review of the safeguards put into place by the accounting firm to safeguard independence, and |
| • | periodic meetings with the accounting firm. |
Policy for Audit and Non-Audit Services Provided to the Funds
On an annual basis, the scope of audits for each Fund, audit fees and expenses, and audit-related and non-audit services (and fees proposed in respect thereof) proposed to be performed by the Fund’s independent accountants will be presented by the Treasurer and the independent accountants to the Audit Committee for review and, as appropriate, approval prior to the initiation of such services. Such presentation shall be accompanied by confirmation by both the Treasurer and the independent accountants that the proposed non-audit services will not adversely affect the independence of the independent accountants. Such proposed non-audit services shall be described in sufficient detail to enable the Audit Committee to assess the appropriateness of such services and fees, and the compatibility of the provision of such services with the auditor’s independence. The Committee shall receive periodic reports on the progress of the audit and other services which are approved by the Committee or by the Committee Chair pursuant to authority delegated in this Policy.
The categories of services enumerated under “Audit Services”, “Audit-related Services”, and “Tax Services” are intended to provide guidance to the Treasurer and the independent accountants as to those categories of services which the Committee believes are generally consistent with the independence of the independent accountants and which the Committee (or the Committee Chair) would expect upon the presentation of specific proposals to pre-approve. The enumerated categories are not intended as an exclusive list of audit, audit-related or tax services, which the Committee (or the Committee Chair) would consider for pre-approval.
Audit Services
The following categories of audit services are considered to be consistent with the role of the Fund’s independent accountants:
| Ø | Annual Fund financial statement audits |
| Ø | Seed audits (related to new product filings, as required) |
| Ø | SEC and regulatory filings and consents |
Audit-related Services
The following categories of audit-related services are considered to be consistent with the role of the Fund’s independent accountants:
| Ø | Accounting consultations |
| Ø | Fund merger support services |
| Ø | Agreed Upon Procedure Reports |
| Ø | Attestation Reports |
| Ø | Other Internal Control Reports |
Individual audit-related services that fall within one of these categories (except for fund merger support services) and are not presented to the Audit Committee as part of the annual pre-approval process are subject to an authorized pre-approval by the Audit Committee so long as the estimated fee for those services does not exceed $30,000. Any services provided under such pre-approval will be reported to the Audit Committee at its next regular meeting. Should the amount of such services exceed $30,000 any additional fees will be subject to pre-approval by the Committee Chair (or any other Committee member on whom this responsibility has been delegated). Fees related to fund merger support services are subject to a separate authorized pre-approval by the Audit Committee with fees determined on a per occurrence and merger complexity basis.
Tax Services
The following categories of tax services are considered to be consistent with the role of the Fund’s independent accountants:
| Ø | Tax compliance services related to the filing or amendment of the following: |
| ◾ | Federal, state and local income tax compliance; and, |
| ◾ | Sales and use tax compliance |
| Ø | Timely RIC qualification reviews |
| Ø | Tax distribution analysis and planning |
| Ø | Tax authority examination services |
| Ø | Tax appeals support services |
| Ø | Accounting methods studies |
| Ø | Fund merger support services |
| Ø | Tax consulting services and related projects |
Individual tax services that fall within one of these categories and are not presented to the Audit
Committee as part of the annual pre-approval process are subject to an authorized pre-approval by the Audit Committee so long as the estimated fee for those services does not exceed $30,000. Any services provided under such pre-approval will be reported to the Audit Committee at its next regular meeting. Should the amount of such services exceed $30,000 any additional fees will be subject to pre-approval by the Committee Chair (or any other Committee member on whom this responsibility has been delegated).
Other Non-Audit Services
Certain non-audit services that the independent accountants are legally permitted to render will be subject to pre-approval by the Committee or by one or more Committee members to whom the Committee has delegated this authority and who will report to the full Committee any pre-approval decisions made pursuant to this Policy. Non-audit services presented for pre-approval pursuant to this paragraph will be accompanied by a confirmation from both the Treasurer and the independent accountants that the proposed services will not adversely affect the independence of the independent accountants.
Proscribed Services
The Fund’s independent accountants will not render services in the following categories of non-audit services:
| Ø | Bookkeeping or other services related to the accounting records or financial statements of the Fund |
| Ø | Financial information systems design and implementation |
| Ø | Appraisal or valuation services, fairness opinions, or contribution-in-kind reports |
| Ø | Actuarial services |
| Ø | Internal audit outsourcing services |
| Ø | Management functions or human resources |
| Ø | Broker or dealer, investment adviser, or investment banking services |
| Ø | Legal services and expert services unrelated to the audit |
| Ø | Any other service that the Public Company Accounting Oversight Board determines, by regulation, is impermissible. |
Pre-approval of Non-Audit Services Provided to Other Entities Within the Prudential Fund Complex
Certain non-audit services provided to PGIM Investments or any of its affiliates that also provide ongoing services to the Prudential Mutual Funds will be subject to pre-approval by the Audit Committee. The only non-audit services provided to these entities that will require pre-approval are those related directly to the operations and financial reporting of the Funds. Individual projects that are not presented to the Audit Committee as part of the annual pre-approval process will be subject to pre-approval by the Committee Chair (or any other Committee member on whom this responsibility has been delegated) so long as the estimated fee for those services does not exceed $30,000. Services presented for pre-approval pursuant to this paragraph will be accompanied by a confirmation from both the Treasurer and the independent accountants that the proposed services will not adversely affect the independence of the independent accountants.
Although the Audit Committee will not pre-approve all services provided to PGIM Investments and its affiliates, the Committee will receive an annual report from the Fund’s independent accounting firm showing the aggregate fees for all services provided to PGIM Investments and its affiliates.
(e) (2) Percentage of services referred to in 4(b) – 4(d) that were approved by the audit committee –
For the fiscal years ended February 28, 2018 and February 28, 2017: none.
(f) Percentage of hours expended attributable to work performed by other than full time employees of principal accountant if greater than 50%. | ||
The percentage of hours expended on the principal accountant’s engagement to audit the registrant’s financial statements for the most recent fiscal year that were attributed to work performed by persons other than the principal accountant’s full-time, permanent employees was 0%.
(g) Non-Audit Fees
The aggregate non-audit fees billed by KPMG for services rendered to the registrant’s investment adviser and any entity controlling, controlled by, or under common control with the investment adviser that provides ongoing services to the registrant for the fiscal years ended February 28, 2018 and February 28, 2017 was $0 and $0, respectively.
(h) Principal Accountant’s Independence
Not applicable as KPMG has not provided non-audit services to the registrant’s investment adviser and any entity controlling, controlled by, or under common control with the investment adviser that provides ongoing services to the registrant that were not pre-approved pursuant to Rule 2-01(c)(7)(ii) of Regulation S-X.
Item 5 – | Audit Committee of Listed Registrants – Not applicable. | |
Item 6 – | Schedule of Investments – The schedule is included as part of the report to shareholders filed under Item 1 of this Form. | |
Item 7 – | Disclosure of Proxy Voting Policies and Procedures for Closed-End Management Investment Companies – Not applicable. | |
Item 8 – | Portfolio Managers of Closed-End Management Investment Companies – Not applicable. | |
Item 9 – | Purchases of Equity Securities by Closed-End Management Investment Company and Affiliated Purchasers – Not applicable. | |
Item 10 – | Submission of Matters to a Vote of Security Holders – Not applicable. | |
Item 11 – | Controls and Procedures | |
(a) | It is the conclusion of the registrant’s principal executive officer and principal financial officer that the effectiveness of the registrant’s current disclosure controls and procedures (such disclosure controls and procedures having been evaluated within 90 days of the date of this filing) provide reasonable assurance that the information required to be disclosed by the registrant has been recorded, processed, summarized and reported within the time period specified in the Commission’s rules and forms and that the information required to be disclosed by the registrant has been accumulated and communicated to the registrant’s principal executive officer and principal financial officer in order to allow timely decisions regarding required disclosure. | |
(b) | There has been no significant change in the registrant’s internal control over financial reporting that occurred during the registrant’s most recent fiscal quarter of the period covered by this report that has materially affected, or is likely to materially affect, the registrant’s internal control over financial reporting. | |
Item 12 – Exhibits | ||
(a) | (1) Code of Ethics – Attached hereto as Exhibit EX-99.CODE-ETH | |
(2) Certifications pursuant to Section 302 of the Sarbanes-Oxley Act – Attached hereto as Exhibit EX-99.CERT. | ||
(3) Any written solicitation to purchase securities under Rule 23c-1. – Not applicable. | ||
(b) | Certifications pursuant to Section 906 of the Sarbanes-Oxley Act – Attached hereto as Exhibit EX-99.906CERT. | |
SIGNATURES
Pursuant to the requirements of the Securities Exchange Act of 1934 and the Investment Company Act of 1940, the registrant has duly caused this report to be signed on its behalf by the undersigned, thereunto duly authorized.
| Registrant: | Prudential Investment Portfolios, Inc. 14 | |
| By: | /s/ Deborah A. Docs | |
| Deborah A. Docs | ||
| Secretary | ||
| Date: | April 18, 2018 | |
Pursuant to the requirements of the Securities Exchange Act of 1934 and the Investment Company Act of 1940, this report has been signed below by the following persons on behalf of the registrant and in the capacities and on the dates indicated.
| By: | /s/ Stuart S. Parker | |
| Stuart S. Parker | ||
| President and Principal Executive Officer | ||
| Date: | April 18, 2018 | |
| By: | /s/ M. Sadiq Peshimam | |
| M. Sadiq Peshimam | ||
| Treasurer and Principal Financial and Accounting Officer | ||
| Date: | April 18, 2018 | |