UNITEDSTATES
SECURITIESANDEXCHANGECOMMISSION
Washington,D.C.20549
FORM N-CSR
CERTIFIED SHAREHOLDER REPORT OF REGISTERED MANAGEMENT INVESTMENT COMPANIES
Investment Company Act file number: | 811-03712 |
Exact name of registrant as specified in charter: | Prudential Investment Portfolios, Inc. 14 |
Address of principal executive offices: | 655 Broad Street, 17th Floor |
| Newark, New Jersey 07102 |
Name and address of agent for service: | Andrew R. French |
| 655 Broad Street, 17th Floor |
| Newark, New Jersey 07102 |
Registrant's telephone number, including area code: | 800-225-1852 |
Date of fiscal year end: | 2/29/2020 |
Date of reporting period: | 2/29/2020 |
Item 1 – Reports to Stockholders

PGIM GOVERNMENT INCOME FUND
ANNUAL REPORT
FEBRUARY 29, 2020
COMING SOON: PAPERLESS SHAREHOLDER REPORTS
Beginning on January 1, 2021, as permitted by regulations adopted by the Securities and Exchange Commission, paper copies of the Fund’s annual and semiannual shareholder reports will no longer be sent by mail, unless you specifically request paper copies of the reports. Instead, the reports will be made available on the Fund’s website (pgiminvestments.com), and you will be notified by mail each time a report is posted and provided with a website link to access the report.
If you already elected to receive shareholder reports electronically, you will not be affected by this change and you need not take any action. You may elect to receive shareholder reports and other communications from the Fund electronically anytime by contacting your financial intermediary (such as a broker-dealer or bank) or, if you are a direct investor, by calling 1-800-225-1852 or by sending an email request to PGIM Investments at shareholderreports@pgim.com.
You may elect to receive all future reports in paper free of charge. If you invest through a financial intermediary, you can contact your financial intermediary or follow instructions included with this notice to elect to continue to receive paper copies of your shareholder reports. If you invest directly with the Fund, you can call 1-800-225-1852 or send an email request to shareholderreports@pgim.com to let the Fund know you wish to continue receiving paper copies of your shareholder reports. Your election to receive reports in paper will apply to all funds held in your account if you invest through your financial intermediary or all funds held with the fund complex if you invest directly with the Fund.

To enroll in e-delivery, go to pgiminvestments.com/edelivery
| 3 | ||||
| 4 | ||||
| 5 | ||||
| 9 | ||||
| 12 | ||||
| 15 | ||||
This report is not authorized for distribution to prospective investors unless preceded or accompanied by a current prospectus.
The views expressed in this report and information about the Fund’s portfolio holdings are for the period covered by this report and are subject to change thereafter.
Mutual funds are distributed by Prudential Investment Management Services LLC (PIMS), member SIPC. PGIM Fixed Income is a unit of PGIM, Inc. (PGIM), a registered investment adviser. PIMS and PGIM are Prudential Financial companies. © 2020 Prudential Financial, Inc. and its related entities. PGIM and the PGIM logo are service marks of Prudential Financial, Inc. and its related entities, registered in many jurisdictions worldwide.
| 2 | Visit our website at pgiminvestments.com |

Dear Shareholder:
We hope you find the annual report for the PGIM Government Income Fund informative and useful. The report covers performance for the 12-month period that ended February 29, 2020.
The US economy remained healthy throughout the period, with rising corporate profits and strong job growth. The Federal Reserve reduced
interest rates three times in an effort to extend the longest domestic economic expansion on record as growth in many regions outside the US weakened. China in particular showed signs of slowing amid trade tensions with the US. China was also the first country hit hard by the coronavirus outbreak late in the period, which left economists worried that global growth may decline in the near term. In early March 2020, the Fed cut rates again to help maintain growth.
Stocks climbed around the globe for most of the period, fueled by the strong US economy and corporate profits, as well as the Fed’s rate reductions. In late February, however, stocks fell on fears that the coronavirus would disrupt supply chains and reduce overall demand for goods and services. While large-cap US stocks posted a gain for the period overall, the significant volatility late in the period contributed to a decline for small-cap US stocks, as well as for equities in developed foreign and emerging markets.
Bonds rose during the period as investors sought safety in fixed income. A significant rally in interest rates pushed the 10-year US Treasury yield down to a record low by the end of the period. Returns were strong worldwide, with gains in the overall US and global bond markets and also in emerging market debt.
Regarding your investments with PGIM, we believe it is important to maintain a diversified portfolio of funds consistent with your tolerance for risk, time horizon, and financial goals. Your financial advisor can help you create a diversified investment plan that may include funds covering all the basic asset classes and that reflects your personal investor profile and risk tolerance. However, diversification and asset allocation strategies do not assure a profit or protect against loss in declining markets.
At PGIM Investments, we consider it a great privilege and responsibility to help investors participate in opportunities across global markets while meeting their toughest investment challenges. PGIM is a top-10 global investment manager with more than $1 trillion in assets under management. This scale and investment expertise allow us to deliver actively managed funds and strategies to meet the needs of investors around the globe.
Thank you for choosing our family of funds.
Sincerely,

Stuart S. Parker, President
PGIM Government Income Fund
April 15, 2020
| PGIM Government Income Fund | 3 |
Your Fund’s Performance (unaudited)
Performance data quoted represent past performance. Past performance does not guarantee future results. The investment return and principal value of an investment will fluctuate, so that an investor’s shares, when redeemed, may be worth more or less than their original cost. Current performance may be lower or higher than the past performance data quoted. An investor may obtain performance data as of the most recent month-end by visiting our website at pgiminvestments.com or by calling (800) 225-1852.
| Average Annual Total Returns as of 2/29/20 | ||||||||||||||
| One Year (%) | Five Years (%) | Ten Years (%) | Since Inception (%) | |||||||||||
| Class A | ||||||||||||||
| (with sales charges) | 5.92 | 1.77 | 2.71 | — | ||||||||||
| (without sales charges) | 9.48 | 2.45 | 3.05 | — | ||||||||||
| Class B | ||||||||||||||
| (with sales charges) | 3.52 | 1.42 | 2.23 | — | ||||||||||
| (without sales charges) | 8.52 | 1.60 | 2.23 | — | ||||||||||
| Class C | ||||||||||||||
| (with sales charges) | 7.67 | 1.66 | 2.28 | — | ||||||||||
| (without sales charges) | 8.67 | 1.66 | 2.28 | — | ||||||||||
| Class R | ||||||||||||||
| (without sales charges) | 9.26 | 2.18 | 2.78 | — | ||||||||||
| Class Z | ||||||||||||||
| (without sales charges) | 9.93 | 2.75 | 3.34 | — | ||||||||||
| Class R6 | ||||||||||||||
| (without sales charges) | 10.14 | N/A | N/A | 2.85 (8/9/16) | ||||||||||
| Bloomberg Barclays US Government Bond Index |
| |||||||||||||
| 12.04 | — | — | — | |||||||||||
| Bloomberg Barclays US Aggregate ex-Credit Index |
| |||||||||||||
| 10.20 | — | — | — | |||||||||||
| Average Annual Total Returns as of 2/29/20 Since Inception (%) | ||||||||||||||
| Class R6 (8/9/16) | ||||||||||||||
| Bloomberg Barclays US Government Bond Index | 2.91 | |||||||||||||
| Bloomberg Barclays US Aggregate ex-Credit Index |
| 2.89 | ||||||||||||
| 4 | Visit our website at pgiminvestments.com |
Growth of a $10,000 Investment (unaudited)
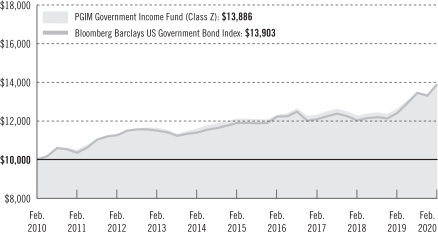
The graph compares a $10,000 investment in the Fund’s Class Z shares with a similar investment in the Bloomberg Barclays US Government Bond Index by portraying the initial account values at the beginning of the 10-year period for Class Z shares (February 28, 2010) and the account values at the end of the current fiscal year (February 29, 2020) as measured on a quarterly basis. For purposes of the graph, and unless otherwise indicated, it has been assumed that (a) all recurring fees (including management fees) were deducted; and (b) all dividends and distributions were reinvested. The line graph provides information for Class Z shares only. As indicated in the tables provided earlier, performance for other share classes will vary due to the differing charges and expenses applicable to each share class (as indicated in the following paragraphs). Without waiver of fees and/or expense reimbursement, if any, the Fund’s returns would have been lower.
Past performance does not predict future performance. Total returns and the ending account values in the graph include changes in share price and reinvestment of dividends and capital gains distributions in a hypothetical investment for the periods shown. The Fund’s total returns do not reflect the deduction of income taxes on an individual’s investment. Taxes may reduce your actual investment returns on income or gains paid by the Fund or any gains you may realize if you sell your shares.
Source: PGIM Investments LLC and Lipper Inc.
Since Inception returns are provided for any share class with less than 10 fiscal years of returns. Since Inception returns for the Indexes are measured from the closest month-end to the class’ inception date.
| PGIM Government Income Fund | 5 |
Your Fund’s Performance (continued)
The returns in the tables do not reflect the deduction of taxes that a shareholder would pay on Fund distributions or following the redemption of Fund shares. The average annual total returns take into account applicable sales charges, which are described for each share class in the table below.
| Class A | Class B* | Class C | Class R | Class Z | Class R6 | |||||||
| Maximum initial sales charge | For purchases prior to July 15, 2019: 4.50% of the public offering price. For purchases on/after July 15, 2019: 3.25% of the public offering price. | None | None | None | None | None | ||||||
| Contingent deferred sales charge (CDSC) (as a percentage of the lower of the original purchase price or the net asset value at redemption) | For purchases prior to July 15, 2019: 1.00% on sales of $1 million or more made within 12 months of purchase. For purchases on/after July 15, 2019: 1.00% on sales of $500,000 or more made within 12 months of purchase. | 5.00% (Yr. 1) 4.00% (Yr. 2) 3.00% (Yr. 3) 2.00% (Yr. 4) 1.00% (Yr. 5) 1.00% (Yr. 6) 0.00% (Yr. 7) | 1.00% on sales made within 12 months of purchase | None | None | None | ||||||
| Annual distribution and service (12b-1) fees (shown as a percentage of average daily net assets) | 0.25% | 1.00% up to $3 billion, 0.80% next $1 billion, and 0.50% over $4 billion | 1.00% | 0.75% (0.50% currently) | None | None | ||||||
*Class B shares are closed to all purchase activity and no additional Class B shares may be purchased or acquired except by exchange from Class B shares of another Fund or through reinvestment of dividends and/or capital gains. Effective on or about June 26, 2020, all issued and outstanding Class B shares will be automatically converted to Class A shares. See the supplement included with this shareholder report for details.
| 6 | Visit our website at pgiminvestments.com |
Benchmark Definitions
Bloomberg Barclays US Government Bond Index—The Bloomberg Barclays US Government Bond Index is an unmanaged index of securities issued or backed by the US government, its agencies, and instrumentalities with between one and 30 years remaining to maturity. It gives a broad look at how US government bonds have performed.
Bloomberg Barclays US Aggregate ex-Credit Index—The Bloomberg Barclays US Aggregate ex-Credit Index is an unmanaged index that represents securities that are SEC registered, taxable, and dollar denominated. The Index covers the US investment-grade fixed rate bond market, with index components for government and corporate securities, mortgage pass-through securities, and asset-backed securities. These major sectors are subdivided into more specific indexes that are calculated and reported on a regular basis.
Investors cannot invest directly in an index. The returns for the Indexes would be lower if they included the effects of sales charges, operating expenses of a mutual fund, or taxes.
| Credit Quality expressed as a percentage of total investments as of 2/29/20 (%) | ||||
| AAA | 98.5 | |||
| AA | 1.7 | |||
| A | 0.1 | |||
| Not Rated | –1.7 | |||
| Cash/Cash Equivalents | 1.4 | |||
| Total Investments | 100.0 | |||
Source: PGIM Fixed Income
Credit ratings reflect the highest rating assigned by a nationally recognized statistical rating organization (NRSRO) such as Moody’s Investors Service, Inc. (Moody’s), S&P Global Ratings (S&P), or Fitch, Inc. (Fitch). Credit ratings reflect the common nomenclature used by both S&P and Fitch. Where applicable, ratings are converted to the comparable S&P/Fitch rating tier nomenclature used by both S&P and Fitch. These ratings agencies are independent and are widely used. The Not Rated category consists of securities that have not been rated by a NRSRO and may include derivative instruments that could have a negative value. Credit ratings are subject to change.
| PGIM Government Income Fund | 7 |
Your Fund’s Performance (continued)
| Distributions and Yields as of 2/29/20 | ||||||
| Total Distributions Paid for 12 Months ($) | SEC 30-Day Subsidized Yield* (%) | SEC 30-Day Unsubsidized Yield** (%) | ||||
| Class A | 0.20 | 1.60 | 1.60 | |||
| Class B | 0.10 | 0.61 | 13.19 | |||
| Class C | 0.12 | 1.28 | 1.28 | |||
| Class R | 0.17 | 1.64 | 1.40 | |||
| Class Z | 0.23 | 2.12 | 1.82 | |||
| Class R6 | 0.24 | 2.13 | 2.06 | |||
*SEC 30-Day Subsidized Yield (%)—A standardized yield calculation created by the Securities and Exchange Commission, it reflects the income earned during a 30-day period, after the deduction of the Fund’s net expenses (net of any expense waivers or reimbursements). The investor experience is represented by the SEC 30-Day Subsidized Yield.
**SEC 30-Day Unsubsidized Yield (%)—A standardized yield calculation created by the Securities and Exchange Commission, it reflects the income earned during a 30-day period, after the deduction of the Fund’s gross expenses. The investor experience is represented by the SEC 30-Day Subsidized Yield.
| 8 | Visit our website at pgiminvestments.com |
Strategy and Performance Overview (unaudited)
How did the Fund perform?
The PGIM Government Income Fund’s Class Z shares returned 9.93% in the 12-month reporting period that ended February 29, 2020, underperforming the 12.04% return of the Bloomberg Barclays US Government Bond Index (the Index).
What were the market conditions?
| • | Interest rates across the G4 tumbled throughout the second quarter of 2019 (Japan: -7 basis points (bps), Germany: -25 bps, United Kingdom: -17 bps, United States: -40 bps), driven by lackluster global economic data, lingering US-China trade tensions, and rising probabilities of easier global monetary policies. The Federal Reserve’s shift toward a more accommodative stance culminated in its June meeting with a drop in the median estimate of the long-run neutral federal funds rate from 2.8% to 2.5%—the top of its target range as the third quarter commenced. Agency mortgage-backed securities (MBS) underperformed rates in the second quarter, with excess returns of -39 bps vs. Treasuries; and option-adjusted spreads widened 6 bps vs. Treasuries and 10 bps vs. LIBOR (London Interbank Offered Rate), putting them at multi-year wide levels. Higher supply, lower primary mortgage rates, faster pre-payment speeds, and worsening characteristics of new production weighed on the sector, as did the lack of MBS purchases by the Fed as pre-payments increased and balance sheet reinvestments went back into US Treasuries. (One basis point equals 0.01%.) |
| • | Developed market rates took another leg down in the third quarter of 2019, as central banks collectively eased policies to counter signs of mounting global economic weakness and uncertainty. It was the second consecutive quarter of double-digit basis-point declines for US and German 10-year yields (down 35 bps and 25 bps to 1.67% and -0.57%, respectively), while the Japanese 10-year yield also fell deeper into negative territory (down 10 bps to -0.22%). In what was a relatively volatile quarter for MBS amid declining Treasury rates and associated pre-payment concerns, option-adjusted spreads ultimately ended the third quarter slightly tighter. |
| • | In 2019, the 40-year bull market proved that it could still put up some big numbers, with all fixed income sectors posting positive total returns for the year as the Fed cut interest rates three times, spreads tightened, and Treasury yields declined throughout the year. For some time, long-term developed market interest rates have been low and range-bound, while credit spreads have been tighter than average. And yet, the effect of rolling down spread and yield curves, combined with some spread compression and a slight decline in yields, has resulted in sizable returns in three out of the last four years. Granted, based on current yield and spread levels, the market may be out of room for similar returns—at least for now. |
| • | In January 2020, 10-year US Treasury yields rallied 41 bps to close at 1.51%, and G4 rates rallied as well. The global driver of the rate decline was the sentiment regarding |
| PGIM Government Income Fund | 9 |
Strategy and Performance Overview (continued)
| escalating coronavirus concerns and the associated economic slowdown. The Fed maintained current policy rates, while acknowledging the potential pitfalls of global economic contraction. The market priced in two cuts to the federal funds rate by the end of the year. The Bloomberg Barclays Agency MBS Index posted -53 bps of excess return in January, as growing coronavirus fears pressured risk appetite, the curve bull flattened, and volatility picked up. Pre-payment speeds were broadly in line with expectations, about unchanged for the month, despite the higher day count due to seasonal effects. Speeds in 4.0% and 4.5% coupon issues remained elevated, while speeds in 3.5% coupon issues peaked below expectations. |
| • | In February 2020, G4 rates rallied strongly for the second consecutive month, closing at local low yields as investors sought developed country government debt as the coronavirus spread globally. The US 10-year Treasury yield rallied strongly as the 35-bps drop left it at 1.16% to end the month. The Bloomberg Barclays Agency MBS Index ended February with -7 bps of excess return, outperforming credit sectors despite the spike in volatility. Mortgages were supported by yield-based demand, fund inflows (particularly aiding higher coupons), and improved dollar rolls. |
What worked?
| • | The duration of the Fund was actively managed and was between 0.2 years short and 0.5 years long for the reporting period. (Duration measures the sensitivity of the price—the value of principal—of a bond to a change in interest rates.) Duration positioning was the largest contributor to performance for the period. The Fund ended the period 0.1 years short duration. |
| • | The Fund maintained a yield curve flattener position, which also added to performance over the period. |
| • | Sector allocation was a strong contributor to performance, highlighted by overweights to commercial mortgage-backed securities (CMBS) and collateralized loan obligations (CLOs). Positioning in agencies was also strong. |
| • | Overall security selection hurt performance; however, positioning in MBS, specifically 30-year issues from the Federal National Mortgage Association (Fannie Mae) and the Federal Home Loan Mortgage Corp. (Freddie Mac), added value. |
What didn’t work?
| • | Security selection hurt performance, with positioning in CMBS and swaps hurting the most. |
| 10 | Visit our website at pgiminvestments.com |
Did the Fund use derivatives?
The Fund held futures contracts on US Treasuries, interest rate swaps, and options to help manage its duration and yield curve exposure, which reduced its sensitivity to changes in the level of interest rates. The use of futures added to performance while the use of options had a modest negative impact on performance. The use of interest rate swaps also hurt performance for the period.
Current outlook
| • | Financial markets witnessed a dramatic turn of events in March 2020, perhaps best exemplified by the steep drop in the US stock market from its February all-time highs and the all-time lows in US Treasury yields. Markets flagged deep uncertainty over the ramifications of and policy responses to the developing COVID-19 pandemic and were additionally wrong-footed by a steep drop in oil prices after escalating tensions between the Organization of the Petroleum Exporting Counties (OPEC) and Russia on oil production cuts. |
| • | Global policy makers began to act, first with significant monetary easing as the Fed and the Bank of England cut their policy rates by 50 bps—the former in its first inter-meeting cut since October 2008—while the Bank of Japan initiated additional exchange-traded fund ETF purchases. The European Central Bank boosted the size of its quantitative easing program and improved the terms of its funding for targeted lending operations. At the same time, regulatory policies on the financial sector were eased—for example, by dropping counter-cyclical capital requirements in Europe—and steps were initiated to improve liquidity and bolster crisis-preparedness. |
| • | Concerns about a global slowdown also led to expectations for about four Fed rate cuts as February concluded. At that time, PGIM Fixed Income shifted to a more neutral stance on US rates and remained in a Treasuries flattener given the elevated risk premium at the back of the curve. |
| PGIM Government Income Fund | 11 |
As a shareholder of the Fund, you incur two types of costs: (1) transaction costs, including sales charges (loads) on purchase payments and redemptions, as applicable, and (2) ongoing costs, including management fees, distribution and/or service (12b-1) fees, and other Fund expenses, as applicable. This example is intended to help you understand your ongoing costs (in dollars) of investing in the Fund and to compare these costs with the ongoing costs of investing in other mutual funds.
The example is based on an investment of $1,000 held through the six-month period ended February 29, 2020. The example is for illustrative purposes only; you should consult the Prospectus for information on initial and subsequent minimum investment requirements.
Actual Expenses
The first line for each share class in the table on the following page provides information about actual account values and actual expenses. You may use the information on this line, together with the amount you invested, to estimate the expenses that you paid over the period. Simply divide your account value by $1,000 (for example, an $8,600 account value ÷ $1,000 = 8.6), then multiply the result by the number on the first line under the heading “Expenses Paid During the Six-Month Period” to estimate the expenses you paid on your account during this period.
Hypothetical Example for Comparison Purposes
The second line for each share class in the table on the following page provides information about hypothetical account values and hypothetical expenses based on the Fund’s actual expense ratio and an assumed rate of return of 5% per year before expenses, which is not the Fund’s actual return. The hypothetical account values and expenses may not be used to estimate the actual ending account balance or expenses you paid for the period. You may use this information to compare the ongoing costs of investing in the Fund and other funds. To do so, compare this 5% hypothetical example with the 5% hypothetical examples that appear in the shareholder reports of the other funds.
The Fund’s transfer agent may charge additional fees to holders of certain accounts that are not included in the expenses shown in the table on the following page. These fees apply to individual retirement accounts (IRAs) and Section 403(b) accounts. As of the close of the six-month period covered by the table, IRA fees included an annual maintenance fee of $15 per account (subject to a maximum annual maintenance fee of $25 for all accounts held by the same shareholder). Section 403(b) accounts are charged an annual $25 fiduciary maintenance fee. Some of the fees may vary in amount, or may be waived, based on your total account balance or the number of PGIM funds, including the Fund, that you own. You should consider the additional fees that were charged to your Fund account
| 12 | Visit our website at pgiminvestments.com |
over the six-month period when you estimate the total ongoing expenses paid over the period and the impact of these fees on your ending account value, as these additional expenses are not reflected in the information provided in the expense table. Additional fees have the effect of reducing investment returns.
Please note that the expenses shown in the table are meant to highlight your ongoing costs only and do not reflect any transactional costs such as sales charges (loads). Therefore, the second line for each share class in the table is useful in comparing ongoing costs only and will not help you determine the relative total costs of owning different funds. In addition, if these transactional costs were included, your costs would have been higher.
| PGIM Government Income Fund | Beginning Account Value September 1, 2019 | Ending Account February 29, 2020 | Annualized Expense Ratio Based on the Six-Month Period | Expenses Paid During the Six-Month Period* | ||||||||||||||
| Class A | Actual | $ | 1,000.00 | $ | 1,026.70 | 1.03 | % | $ | 5.19 | |||||||||
| Hypothetical | $ | 1,000.00 | $ | 1,019.74 | 1.03 | % | $ | 5.17 | ||||||||||
| Class B | Actual | $ | 1,000.00 | $ | 1,022.70 | 2.03 | % | $ | 10.21 | |||||||||
| Hypothetical | $ | 1,000.00 | $ | 1,014.77 | 2.03 | % | $ | 10.17 | ||||||||||
| Class C | Actual | $ | 1,000.00 | $ | 1,023.80 | 1.80 | % | $ | 9.06 | |||||||||
| Hypothetical | $ | 1,000.00 | $ | 1,015.91 | 1.80 | % | $ | 9.02 | ||||||||||
| Class R | Actual | $ | 1,000.00 | $ | 1,026.30 | 1.29 | % | $ | 6.50 | |||||||||
| Hypothetical | $ | 1,000.00 | $ | 1,018.45 | 1.29 | % | $ | 6.47 | ||||||||||
| Class Z | Actual | $ | 1,000.00 | $ | 1,028.80 | 0.60 | % | $ | 3.03 | |||||||||
| Hypothetical | $ | 1,000.00 | $ | 1,021.88 | 0.60 | % | $ | 3.02 | ||||||||||
| Class R6 | Actual | $ | 1,000.00 | $ | 1,030.20 | 0.53 | % | $ | 2.68 | |||||||||
| Hypothetical | $ | 1,000.00 | $ | 1,022.23 | 0.53 | % | $ | 2.66 | ||||||||||
* Fund expenses (net of fee waivers or subsidies, if any) for each share class are equal to the annualized expense ratio for each share class (provided in the table), multiplied by the average account value over the period, multiplied by the 182 days in the six-month period ended February 29, 2020, and divided by the 366 days in the Fund’s fiscal year ended February 29, 2020 (to reflect the six-month period). Expenses presented in the table include the expenses of any underlying portfolios in which the Fund may invest.
| PGIM Government Income Fund | 13 |
Schedule of Investments
as of February 29, 2020
| Description | Interest Rate | Maturity Date | Principal Amount (000)# | Value | ||||||||||||
LONG-TERM INVESTMENTS 99.3% | ||||||||||||||||
ASSET-BACKED SECURITIES 4.0% | ||||||||||||||||
Collateralized Loan Obligations | ||||||||||||||||
AIG CLO Ltd. (Cayman Islands), | 3.230 | %(c) | 10/25/32 | 1,000 | $ | 1,000,400 | ||||||||||
Battalion CLO Ltd. (Cayman Islands), | ||||||||||||||||
Series 2015-08A, Class A1R2, 144A, 3 Month LIBOR + 1.100% (Cap N/A, Floor 1.100%) | 2.756 | (c) | 07/18/30 | 2,250 | 2,247,748 | |||||||||||
Series 2018-12A, Class A1, 144A, 3 Month LIBOR + 1.070% (Cap N/A, Floor 1.070%) | 2.762 | (c) | 05/17/31 | 2,000 | 1,979,669 | |||||||||||
Series 2020-15A, Class A1, 144A, 3 Month LIBOR + 1.350% (Cap N/A, Floor 1.350%) | 3.012 | (c) | 01/17/33 | 2,250 | 2,251,125 | |||||||||||
BlueMountain CLO Ltd. (Cayman Islands), | 3.178 | (c) | 04/13/27 | 597 | 597,287 | |||||||||||
Romark CLO Ltd. (Cayman Islands), | 2.969 | (c) | 07/25/31 | 4,000 | 3,975,768 | |||||||||||
Trimaran Cavu Ltd. (Cayman Islands), | 3.279 | (c) | 07/20/32 | 4,000 | 3,982,382 | |||||||||||
Venture CLO Ltd. (Cayman Islands), | 2.919 | (c) | 07/18/31 | 1,750 | 1,740,815 | |||||||||||
|
| |||||||||||||||
TOTAL ASSET-BACKED SECURITIES | 17,775,194 | |||||||||||||||
|
| |||||||||||||||
COMMERCIAL MORTGAGE-BACKED SECURITIES 20.1% | ||||||||||||||||
BANK, | 3.020 | 06/15/60 | 3,600 | 3,795,624 | ||||||||||||
Barclays Commercial Mortgage Trust, | 2.661 | 08/15/52 | 6,000 | 6,321,342 | ||||||||||||
CD Mortgage Trust, | 2.657 | 08/15/57 | 6,000 | 6,323,296 | ||||||||||||
Fannie Mae-Aces, | ||||||||||||||||
Series 2012-M02, Class A2 | 2.717 | 02/25/22 | 166 | 168,358 | ||||||||||||
Series 2015-M17, Class A2 | 2.930 | (cc) | 11/25/25 | 2,900 | 3,128,830 | |||||||||||
Series 2016-M11, Class A2 | 2.369 | (cc) | 07/25/26 | 2,600 | 2,741,757 | |||||||||||
Series 2016-M13, Class A2 | 2.482 | (cc) | 09/25/26 | 4,400 | 4,676,698 | |||||||||||
Series 2018-M14, Class A1 | 3.578 | (cc) | 08/25/28 | 1,601 | 1,774,304 | |||||||||||
Series 2019-M01, Class A2 | 3.555 | (cc) | 09/25/28 | 2,000 | 2,299,474 | |||||||||||
See Notes to Financial Statements.
| PGIM Government Income Fund | 15 |
Schedule of Investments (continued)
as of February 29, 2020
| Description | Interest Rate | Maturity Date | Principal Amount (000)# | Value | ||||||||||||
COMMERCIAL MORTGAGE-BACKED SECURITIES (Continued) |
| |||||||||||||||
FHLMC Multifamily Structured Pass-Through Certificates, | ||||||||||||||||
Series K0008, Class X1, IO | 1.466 | %(cc) | 06/25/20 | 16,205 | $ | 633 | ||||||||||
Series K0019, Class X1, IO | 1.591 | (cc) | 03/25/22 | 22,788 | 569,599 | |||||||||||
Series K0020, Class X1, IO | 1.370 | (cc) | 05/25/22 | 13,254 | 308,250 | |||||||||||
Series K0021, Class X1, IO | 1.422 | (cc) | 06/25/22 | 14,666 | 371,780 | |||||||||||
Series K0025, Class X1, IO | 0.817 | (cc) | 10/25/22 | 37,191 | 639,330 | |||||||||||
Series K0060, Class AM | 3.300 | (cc) | 10/25/26 | 3,860 | 4,268,940 | |||||||||||
Series K0064, Class AM | 3.327 | (cc) | 03/25/27 | 2,100 | 2,333,489 | |||||||||||
Series K0068, Class AM | 3.315 | 08/25/27 | 3,200 | 3,565,497 | ||||||||||||
Series K0076, Class AM | 3.900 | 04/25/28 | 750 | 870,858 | ||||||||||||
Series K0077, Class A2 | 3.850 | (cc) | 05/25/28 | 1,570 | 1,821,877 | |||||||||||
Series K0077, Class AM | 3.850 | (cc) | 05/25/28 | 310 | 359,214 | |||||||||||
Series K0078, Class AM | 3.920 | 06/25/28 | 925 | 1,077,733 | ||||||||||||
Series K0079, Class AM | 3.930 | 06/25/28 | 1,225 | 1,428,172 | ||||||||||||
Series K0080, Class AM | 3.986 | (cc) | 07/25/28 | 3,300 | 3,865,296 | |||||||||||
Series K0081, Class AM | 3.900 | (cc) | 08/25/28 | 2,600 | 3,031,879 | |||||||||||
Series K0083, Class A2 | 4.050 | (cc) | 09/25/28 | 1,125 | 1,329,835 | |||||||||||
Series K0083, Class AM | 4.030 | (cc) | 10/25/28 | 450 | 529,926 | |||||||||||
Series K0084, Class AM | 3.880 | (cc) | 10/25/28 | 2,200 | 2,567,372 | |||||||||||
Series K0085, Class AM | 4.060 | (cc) | 10/25/28 | 1,100 | 1,298,752 | |||||||||||
Series K0086, Class A2 | 3.859 | (cc) | 11/25/28 | 2,500 | 2,919,162 | |||||||||||
Series K0086, Class AM | 3.919 | (cc) | 12/25/28 | 350 | 409,930 | |||||||||||
Series K0087, Class AM | 3.832 | (cc) | 12/25/28 | 400 | 466,217 | |||||||||||
Series K0088, Class AM | 3.761 | (cc) | 01/25/29 | 880 | 1,021,649 | |||||||||||
Series K0090, Class AM | 3.492 | (cc) | 03/25/29 | 1,450 | 1,654,090 | |||||||||||
Series K0091, Class AM | 3.566 | 03/25/29 | 1,650 | 1,892,701 | ||||||||||||
Series K0151, Class A3 | 3.511 | 04/25/30 | 900 | 1,041,949 | ||||||||||||
Series K0157, Class A2 | 3.990 | (cc) | 05/25/33 | 2,900 | 3,491,590 | |||||||||||
Series K0158, Class A2 | 3.900 | (cc) | 12/25/30 | 1,275 | 1,526,209 | |||||||||||
Series K1514, Class A2 | 2.859 | 10/25/34 | 4,100 | 4,556,692 | ||||||||||||
Series KC03, Class A2 | 3.499 | 01/25/26 | 1,100 | 1,220,654 | ||||||||||||
Series W5FX, Class AFX | 3.336 | (cc) | 04/25/28 | 1,970 | 2,207,408 | |||||||||||
JPMBB Commercial Mortgage Securities Trust, | 3.515 | 03/15/49 | 2,500 | 2,603,628 | ||||||||||||
Morgan Stanley Bank of America Merrill Lynch Trust, | 2.834 | 05/15/46 | 878 | 910,569 | ||||||||||||
Wells Fargo Commercial Mortgage Trust, | 3.572 | 09/15/58 | 2,457 | 2,661,815 | ||||||||||||
|
| |||||||||||||||
TOTAL COMMERCIAL MORTGAGE-BACKED SECURITIES | 90,052,378 | |||||||||||||||
|
| |||||||||||||||
See Notes to Financial Statements.
| 16 |
| Description | Interest Rate | Maturity Date | Principal Amount (000)# | Value | ||||||||||||
CORPORATE BONDS 1.4% | ||||||||||||||||
Diversified Financial Services | ||||||||||||||||
Private Export Funding Corp., | ||||||||||||||||
Sr. Unsec’d. Notes, 144A | 2.650 | % | 02/16/21 | 2,870 | $ | 2,905,596 | ||||||||||
U.S. Gov’t. Gtd. Notes, Series BB | 4.300 | 12/15/21 | 1,210 | 1,276,340 | ||||||||||||
U.S. Gov’t. Gtd. Notes, Series KK | 3.550 | 01/15/24 | 2,085 | 2,265,721 | ||||||||||||
|
| |||||||||||||||
TOTAL CORPORATE BONDS | 6,447,657 | |||||||||||||||
|
| |||||||||||||||
RESIDENTIAL MORTGAGE-BACKED SECURITIES 0.1% | ||||||||||||||||
Merrill Lynch Mortgage Investors Trust, | 2.247 | (c) | 10/25/28 | 43 | 43,388 | |||||||||||
Structured Adjustable Rate Mortgage Loan Trust, | 3.871 | (cc) | 02/25/34 | 195 | 194,779 | |||||||||||
|
| |||||||||||||||
TOTAL RESIDENTIAL MORTGAGE-BACKED SECURITIES | 238,167 | |||||||||||||||
|
| |||||||||||||||
U.S. GOVERNMENT AGENCY OBLIGATIONS 40.7% | ||||||||||||||||
Fannie Mae Strips Principal, MTN | 2.001 | (s) | 10/08/27 | 530 | 478,830 | |||||||||||
Federal Home Loan Bank | 3.250 | 11/16/28 | 1,800 | 2,077,364 | ||||||||||||
Federal Home Loan Mortgage Corp. | 2.000 | 01/01/32 | 432 | 441,403 | ||||||||||||
Federal Home Loan Mortgage Corp. | 2.500 | 05/01/23 | 148 | 151,914 | ||||||||||||
Federal Home Loan Mortgage Corp. | 2.500 | 12/01/23 | 217 | 223,630 | ||||||||||||
Federal Home Loan Mortgage Corp. | 2.500 | 03/01/30 | 968 | 999,555 | ||||||||||||
Federal Home Loan Mortgage Corp. | 2.500 | 09/01/31 | 615 | 633,947 | ||||||||||||
Federal Home Loan Mortgage Corp. | 2.500 | 10/01/32 | 727 | 751,198 | ||||||||||||
Federal Home Loan Mortgage Corp. | 3.000 | 10/01/28 | 174 | 181,292 | ||||||||||||
Federal Home Loan Mortgage Corp. | 3.000 | 06/01/29 | 511 | 532,384 | ||||||||||||
Federal Home Loan Mortgage Corp. | 3.000 | 12/01/30 | 581 | 605,449 | ||||||||||||
Federal Home Loan Mortgage Corp. | 3.000 | 01/01/37 | 1,243 | 1,301,082 | ||||||||||||
Federal Home Loan Mortgage Corp. | 3.000 | 04/01/43 | 1,469 | 1,541,996 | ||||||||||||
Federal Home Loan Mortgage Corp. | 3.000 | 10/01/46 | 961 | 1,003,044 | ||||||||||||
Federal Home Loan Mortgage Corp. | 3.000 | 11/01/46 | 780 | 814,270 | ||||||||||||
Federal Home Loan Mortgage Corp. | 3.000 | 12/01/46 | 770 | 803,929 | ||||||||||||
Federal Home Loan Mortgage Corp. | 3.000 | 01/01/47 | 1,654 | 1,726,703 | ||||||||||||
Federal Home Loan Mortgage Corp. | 3.000 | 12/01/49 | 2,990 | 3,084,554 | ||||||||||||
Federal Home Loan Mortgage Corp. | 3.500 | 08/01/26 | 276 | 289,769 | ||||||||||||
Federal Home Loan Mortgage Corp. | 3.500 | 01/01/27 | 152 | 159,855 | ||||||||||||
Federal Home Loan Mortgage Corp. | 3.500 | 11/01/37 | 603 | 635,382 | ||||||||||||
Federal Home Loan Mortgage Corp. | 3.500 | 06/01/42 | 1,495 | 1,593,076 | ||||||||||||
Federal Home Loan Mortgage Corp. | 3.500 | 06/01/43 | 1,085 | 1,154,794 | ||||||||||||
Federal Home Loan Mortgage Corp. | 3.500 | 08/01/47 | 771 | 810,931 | ||||||||||||
See Notes to Financial Statements.
| PGIM Government Income Fund | 17 |
Schedule of Investments (continued)
as of February 29, 2020
| Description | Interest Rate | Maturity Date | Principal Amount (000)# | Value | ||||||||||||
U.S. GOVERNMENT AGENCY OBLIGATIONS (Continued) | ||||||||||||||||
Federal Home Loan Mortgage Corp. | 3.500 | % | 10/01/47 | 389 | $ | 409,196 | ||||||||||
Federal Home Loan Mortgage Corp. | 3.500 | 10/01/49 | 4,307 | 4,475,293 | ||||||||||||
Federal Home Loan Mortgage Corp. | 4.000 | 06/01/26 | 87 | 91,217 | ||||||||||||
Federal Home Loan Mortgage Corp. | 4.000 | 09/01/26 | 245 | 257,464 | ||||||||||||
Federal Home Loan Mortgage Corp. | 4.000 | 11/01/39 | 991 | 1,078,009 | ||||||||||||
Federal Home Loan Mortgage Corp. | 4.000 | 09/01/40 | 694 | 754,397 | ||||||||||||
Federal Home Loan Mortgage Corp. | 4.000 | 12/01/40 | 374 | 406,424 | ||||||||||||
Federal Home Loan Mortgage Corp. | 4.000 | 12/01/40 | 539 | 585,653 | ||||||||||||
Federal Home Loan Mortgage Corp. | 4.000 | 04/01/42 | 1,331 | 1,450,284 | ||||||||||||
Federal Home Loan Mortgage Corp. | 4.000 | 05/01/46 | 1,606 | 1,718,396 | ||||||||||||
Federal Home Loan Mortgage Corp. | 4.000 | 08/01/46 | 366 | 394,460 | ||||||||||||
Federal Home Loan Mortgage Corp. | 4.000 | 12/01/46 | 344 | 368,369 | ||||||||||||
Federal Home Loan Mortgage Corp. | 4.000 | 08/01/47 | 374 | 399,500 | ||||||||||||
Federal Home Loan Mortgage Corp. | 4.000 | 08/01/47 | 1,110 | 1,184,349 | ||||||||||||
Federal Home Loan Mortgage Corp. | 4.000 | 06/01/48 | 358 | 378,188 | ||||||||||||
Federal Home Loan Mortgage Corp. | 4.000 | 11/01/48 | 737 | 778,585 | ||||||||||||
Federal Home Loan Mortgage Corp. | 4.000 | 12/01/48 | 3,372 | 3,560,813 | ||||||||||||
Federal Home Loan Mortgage Corp. | 4.500 | 09/01/39 | 1,432 | 1,585,857 | ||||||||||||
Federal Home Loan Mortgage Corp. | 4.500 | 07/01/47 | 339 | 367,127 | ||||||||||||
Federal Home Loan Mortgage Corp. | 4.500 | 07/01/47 | 351 | 379,742 | ||||||||||||
Federal Home Loan Mortgage Corp. | 5.000 | 06/01/33 | 673 | 754,184 | ||||||||||||
Federal Home Loan Mortgage Corp. | 5.000 | 03/01/34 | 69 | 78,321 | ||||||||||||
Federal Home Loan Mortgage Corp. | 5.000 | 05/01/34 | 63 | 71,123 | ||||||||||||
Federal Home Loan Mortgage Corp. | 5.000 | 05/01/34 | 796 | 898,409 | ||||||||||||
Federal Home Loan Mortgage Corp. | 5.000 | 02/01/48 | 370 | 400,680 | ||||||||||||
Federal Home Loan Mortgage Corp. | 5.500 | 05/01/37 | 95 | 107,887 | ||||||||||||
Federal Home Loan Mortgage Corp. | 5.500 | 01/01/38 | 83 | 94,376 | ||||||||||||
Federal Home Loan Mortgage Corp. | 6.000 | 12/01/33 | 47 | 55,416 | ||||||||||||
Federal Home Loan Mortgage Corp. | 6.000 | 09/01/34 | 139 | 160,494 | ||||||||||||
Federal Home Loan Mortgage Corp. | 6.250 | 07/15/32 | 40 | 61,378 | ||||||||||||
Federal Home Loan Mortgage Corp. | 6.500 | 09/01/32 | 41 | 47,895 | ||||||||||||
Federal Home Loan Mortgage Corp. | 6.500 | 09/01/32 | 114 | 131,528 | ||||||||||||
Federal Home Loan Mortgage Corp. | 6.750 | 09/15/29 | 100 | 148,027 | ||||||||||||
Federal Home Loan Mortgage Corp. | 7.000 | 09/01/32 | 29 | 33,231 | ||||||||||||
Federal Home Loan Mortgage Corp. | 8.000 | 08/01/22 | 2 | 1,784 | ||||||||||||
Federal National Mortgage Assoc. | 2.000 | 08/01/31 | 518 | 529,021 | ||||||||||||
Federal National Mortgage Assoc. | 2.000 | 10/01/34 | 1,193 | 1,211,374 | ||||||||||||
Federal National Mortgage Assoc. | 2.500 | 08/01/28 | 573 | 589,321 | ||||||||||||
Federal National Mortgage Assoc. | 2.500 | 08/01/29 | 127 | 131,165 | ||||||||||||
Federal National Mortgage Assoc. | 2.500 | 11/01/31 | 352 | 362,516 | ||||||||||||
Federal National Mortgage Assoc. | 2.500 | 01/01/35 | 2,024 | 2,079,119 | ||||||||||||
Federal National Mortgage Assoc. | 2.500 | 02/01/43 | 278 | 287,158 | ||||||||||||
Federal National Mortgage Assoc. | 2.500 | 12/01/46 | 1,295 | 1,336,560 | ||||||||||||
Federal National Mortgage Assoc. | 2.500 | 12/01/49 | 1,983 | 2,022,357 | ||||||||||||
Federal National Mortgage Assoc. | 3.000 | TBA | 1,000 | 1,029,739 | ||||||||||||
See Notes to Financial Statements.
| 18 |
| Description | Interest Rate | Maturity Date | Principal Amount (000)# | Value | ||||||||||||
U.S. GOVERNMENT AGENCY OBLIGATIONS (Continued) | ||||||||||||||||
Federal National Mortgage Assoc. | 3.000 | % | TBA | 3,000 | $ | 3,085,590 | ||||||||||
Federal National Mortgage Assoc. | 3.000 | 01/01/27 | 558 | 578,566 | ||||||||||||
Federal National Mortgage Assoc. | 3.000 | 08/01/28 | 1,030 | 1,069,745 | ||||||||||||
Federal National Mortgage Assoc. | 3.000 | 02/01/31 | 1,053 | 1,095,164 | ||||||||||||
Federal National Mortgage Assoc. | 3.000 | 11/01/36 | 535 | 559,776 | ||||||||||||
Federal National Mortgage Assoc. | 3.000 | 12/01/42 | 1,260 | 1,321,776 | ||||||||||||
Federal National Mortgage Assoc. | 3.000 | 02/01/43 | 718 | 753,206 | ||||||||||||
Federal National Mortgage Assoc. | 3.000 | 03/01/43 | 385 | 404,903 | ||||||||||||
Federal National Mortgage Assoc. | 3.000 | 04/01/43 | 680 | 713,510 | ||||||||||||
Federal National Mortgage Assoc. | 3.000 | 06/01/43 | 369 | 386,950 | ||||||||||||
Federal National Mortgage Assoc. | 3.000 | 06/01/43 | 834 | 874,694 | ||||||||||||
Federal National Mortgage Assoc. | 3.000 | 07/01/43 | 2,284 | 2,396,213 | ||||||||||||
Federal National Mortgage Assoc. | 3.000 | 01/01/47 | 378 | 395,317 | ||||||||||||
Federal National Mortgage Assoc. | 3.000 | 12/01/49 | 1,606 | 1,657,056 | ||||||||||||
Federal National Mortgage Assoc. | 3.500 | 09/01/26 | 165 | 172,777 | ||||||||||||
Federal National Mortgage Assoc. | 3.500 | 03/01/27 | 416 | 436,459 | ||||||||||||
Federal National Mortgage Assoc. | 3.500 | 12/01/30 | 87 | 91,272 | ||||||||||||
Federal National Mortgage Assoc. | 3.500 | 02/01/33 | 186 | 195,558 | ||||||||||||
Federal National Mortgage Assoc. | 3.500 | 05/01/33 | 412 | 431,378 | ||||||||||||
Federal National Mortgage Assoc. | 3.500 | 10/01/41 | 2,232 | 2,380,953 | ||||||||||||
Federal National Mortgage Assoc. | 3.500 | 12/01/41 | 618 | 659,532 | ||||||||||||
Federal National Mortgage Assoc. | 3.500 | 03/01/42 | 610 | 641,813 | ||||||||||||
Federal National Mortgage Assoc. | 3.500 | 05/01/42 | 2,772 | 2,953,412 | ||||||||||||
Federal National Mortgage Assoc. | 3.500 | 07/01/42 | 1,040 | 1,108,519 | ||||||||||||
Federal National Mortgage Assoc. | 3.500 | 12/01/42 | 1,479 | 1,575,877 | ||||||||||||
Federal National Mortgage Assoc. | 3.500 | 03/01/43 | 720 | 766,347 | ||||||||||||
Federal National Mortgage Assoc. | 3.500 | 06/01/45 | 5,302 | 5,608,259 | ||||||||||||
Federal National Mortgage Assoc. | 3.500 | 01/01/46 | 1,594 | 1,686,484 | ||||||||||||
Federal National Mortgage Assoc. | 3.500 | 12/01/46 | 1,946 | 2,049,507 | ||||||||||||
Federal National Mortgage Assoc. | 3.500 | 11/01/47 | 1,955 | 2,056,229 | ||||||||||||
Federal National Mortgage Assoc. | 3.500 | 02/01/49 | 469 | 488,370 | ||||||||||||
Federal National Mortgage Assoc. | 3.500 | 06/01/49 | 1,490 | 1,552,912 | ||||||||||||
Federal National Mortgage Assoc. | 3.500 | 08/01/49 | 1,909 | 1,984,034 | ||||||||||||
Federal National Mortgage Assoc. | 4.000 | 09/01/40 | 1,128 | 1,225,832 | ||||||||||||
Federal National Mortgage Assoc. | 4.000 | 01/01/41 | 1,462 | 1,588,930 | ||||||||||||
Federal National Mortgage Assoc. | 4.000 | 09/01/44 | 1,181 | 1,272,963 | ||||||||||||
Federal National Mortgage Assoc. | 4.000 | 06/01/47 | 389 | 415,095 | ||||||||||||
Federal National Mortgage Assoc. | 4.000 | 10/01/47 | 351 | 374,532 | ||||||||||||
Federal National Mortgage Assoc. | 4.000 | 10/01/47 | 3,140 | 3,349,412 | ||||||||||||
Federal National Mortgage Assoc. | 4.000 | 12/01/47 | 759 | 809,149 | ||||||||||||
Federal National Mortgage Assoc. | 4.000 | 06/01/48 | 520 | 549,171 | ||||||||||||
Federal National Mortgage Assoc. | 4.500 | 04/01/41 | 1,235 | 1,363,968 | ||||||||||||
Federal National Mortgage Assoc. | 4.500 | 05/01/41 | 623 | 688,085 | ||||||||||||
Federal National Mortgage Assoc. | 4.500 | 01/01/45 | 292 | 322,060 | ||||||||||||
Federal National Mortgage Assoc. | 4.500 | 06/01/48 | 808 | 862,969 | ||||||||||||
See Notes to Financial Statements.
| PGIM Government Income Fund | 19 |
Schedule of Investments (continued)
as of February 29, 2020
| Description | Interest Rate | Maturity Date | Principal Amount (000)# | Value | ||||||||||||
U.S. GOVERNMENT AGENCY OBLIGATIONS (Continued) | ||||||||||||||||
Federal National Mortgage Assoc. | 4.500 | % | 01/01/49 | 724 | $ | 775,184 | ||||||||||
Federal National Mortgage Assoc. | 5.000 | 12/01/31 | 64 | 71,970 | ||||||||||||
Federal National Mortgage Assoc. | 5.000 | 03/01/34 | 329 | 368,483 | ||||||||||||
Federal National Mortgage Assoc. | 5.000 | 07/01/35 | 131 | 147,536 | ||||||||||||
Federal National Mortgage Assoc. | 5.000 | 09/01/35 | 70 | 79,434 | ||||||||||||
Federal National Mortgage Assoc. | 5.000 | 11/01/35 | 85 | 95,961 | ||||||||||||
Federal National Mortgage Assoc. | 5.000 | 05/01/36 | 50 | 56,922 | ||||||||||||
Federal National Mortgage Assoc. | 5.500 | 02/01/34 | 345 | 393,833 | ||||||||||||
Federal National Mortgage Assoc. | 5.500 | 09/01/34 | 538 | 613,195 | ||||||||||||
Federal National Mortgage Assoc. | 5.500 | 02/01/35 | 456 | 520,189 | ||||||||||||
Federal National Mortgage Assoc. | 5.500 | 06/01/35 | 58 | 66,265 | ||||||||||||
Federal National Mortgage Assoc. | 5.500 | 06/01/35 | 178 | 203,201 | ||||||||||||
Federal National Mortgage Assoc. | 5.500 | 09/01/35 | 102 | 115,752 | ||||||||||||
Federal National Mortgage Assoc. | 5.500 | 09/01/35 | 250 | 284,447 | ||||||||||||
Federal National Mortgage Assoc. | 5.500 | 10/01/35 | 361 | 411,592 | ||||||||||||
Federal National Mortgage Assoc. | 5.500 | 11/01/35 | 322 | 367,278 | ||||||||||||
Federal National Mortgage Assoc. | 5.500 | 11/01/35 | 796 | 907,761 | ||||||||||||
Federal National Mortgage Assoc. | 5.500 | 11/01/36 | 9 | 9,727 | ||||||||||||
Federal National Mortgage Assoc. | 6.000 | 08/01/21 | 8 | 8,271 | ||||||||||||
Federal National Mortgage Assoc. | 6.000 | 09/01/21 | 5 | 5,339 | ||||||||||||
Federal National Mortgage Assoc. | 6.000 | 07/01/22 | 1 | 893 | ||||||||||||
Federal National Mortgage Assoc. | 6.000 | 09/01/33 | 1 | 596 | ||||||||||||
Federal National Mortgage Assoc. | 6.000 | 11/01/33 | — | (r) | 486 | |||||||||||
Federal National Mortgage Assoc. | 6.000 | 02/01/34 | — | (r) | 295 | |||||||||||
Federal National Mortgage Assoc. | 6.000 | 06/01/34 | — | (r) | 152 | |||||||||||
Federal National Mortgage Assoc. | 6.000 | 09/01/34 | — | (r) | 306 | |||||||||||
Federal National Mortgage Assoc. | 6.000 | 09/01/34 | 19 | 22,815 | ||||||||||||
Federal National Mortgage Assoc. | 6.000 | 09/01/34 | 24 | 26,450 | ||||||||||||
Federal National Mortgage Assoc. | 6.000 | 11/01/34 | 4 | 4,501 | ||||||||||||
Federal National Mortgage Assoc. | 6.000 | 11/01/34 | 29 | 32,761 | ||||||||||||
Federal National Mortgage Assoc. | 6.000 | 02/01/35 | 1 | 933 | ||||||||||||
Federal National Mortgage Assoc. | 6.000 | 03/01/35 | 18 | 20,545 | ||||||||||||
Federal National Mortgage Assoc. | 6.000 | 04/01/35 | 1 | 803 | ||||||||||||
Federal National Mortgage Assoc. | 6.000 | 12/01/35 | 63 | 69,956 | ||||||||||||
Federal National Mortgage Assoc. | 6.000 | 01/01/36 | 168 | 193,070 | ||||||||||||
Federal National Mortgage Assoc. | 6.000 | 05/01/36 | 74 | 86,002 | ||||||||||||
Federal National Mortgage Assoc. | 6.000 | 05/01/36 | 395 | 468,205 | ||||||||||||
Federal National Mortgage Assoc. | 6.250 | 05/15/29 | 100 | 142,429 | ||||||||||||
Federal National Mortgage Assoc. | 6.500 | 07/01/32 | 504 | 594,336 | ||||||||||||
Federal National Mortgage Assoc. | 6.500 | 08/01/32 | 206 | 242,049 | ||||||||||||
Federal National Mortgage Assoc. | 6.500 | 09/01/32 | 81 | 95,592 | ||||||||||||
Federal National Mortgage Assoc. | 6.500 | 10/01/32 | 82 | 96,899 | ||||||||||||
Federal National Mortgage Assoc. | 6.500 | 10/01/32 | 577 | 686,267 | ||||||||||||
Federal National Mortgage Assoc. | 6.500 | 10/01/37 | 278 | 337,213 | ||||||||||||
Federal National Mortgage Assoc. | 6.625 | 11/15/30 | 580 | 874,940 | ||||||||||||
See Notes to Financial Statements.
| 20 |
| Description | Interest Rate | Maturity Date | Principal Amount (000)# | Value | ||||||||||||
U.S. GOVERNMENT AGENCY OBLIGATIONS (Continued) | ||||||||||||||||
Federal National Mortgage Assoc. | 7.000 | % | 05/01/24 | 1 | $ | 512 | ||||||||||
Federal National Mortgage Assoc. | 7.000 | 05/01/24 | 1 | 906 | ||||||||||||
Federal National Mortgage Assoc. | 7.000 | 05/01/24 | 7 | 7,773 | ||||||||||||
Federal National Mortgage Assoc. | 7.000 | 05/01/24 | 12 | 12,988 | ||||||||||||
Federal National Mortgage Assoc. | 7.000 | 05/01/24 | 14 | 14,467 | ||||||||||||
Federal National Mortgage Assoc. | 7.000 | 05/01/24 | 56 | 60,729 | ||||||||||||
Federal National Mortgage Assoc. | 7.000 | 12/01/31 | 1 | 1,268 | ||||||||||||
Federal National Mortgage Assoc. | 7.000 | 12/01/31 | 257 | 309,507 | ||||||||||||
Federal National Mortgage Assoc. | 7.000 | 09/01/33 | 64 | 72,185 | ||||||||||||
Federal National Mortgage Assoc. | 7.000 | 11/01/33 | 67 | 75,762 | ||||||||||||
Federal National Mortgage Assoc. | 9.000 | 04/01/25 | 3 | 3,078 | ||||||||||||
Federal National Mortgage Assoc. | 9.500 | 01/01/25 | 1 | 1,197 | ||||||||||||
Federal National Mortgage Assoc. | 9.500 | 01/01/25 | 2 | 2,056 | ||||||||||||
Federal National Mortgage Assoc. | 9.500 | 01/01/25 | 6 | 6,496 | ||||||||||||
Federal National Mortgage Assoc. | 9.500 | 02/01/25 | 1 | 1,160 | ||||||||||||
Government National Mortgage Assoc. | 2.500 | 12/20/46 | 496 | 511,536 | ||||||||||||
Government National Mortgage Assoc. | 3.000 | 03/15/45 | 1,996 | 2,084,972 | ||||||||||||
Government National Mortgage Assoc. | 3.000 | 07/20/46 | 2,228 | 2,324,038 | ||||||||||||
Government National Mortgage Assoc. | 3.000 | 10/20/46 | 329 | 343,587 | ||||||||||||
Government National Mortgage Assoc. | 3.000 | 02/20/47 | 5,546 | 5,785,830 | ||||||||||||
Government National Mortgage Assoc. | 3.000 | 05/20/47 | 1,097 | 1,141,745 | ||||||||||||
Government National Mortgage Assoc. | 3.000 | 12/20/47 | 456 | 475,008 | ||||||||||||
Government National Mortgage Assoc. | 3.000 | 04/20/49 | 2,084 | 2,155,554 | ||||||||||||
Government National Mortgage Assoc. | 3.500 | 04/20/42 | 340 | 362,456 | ||||||||||||
Government National Mortgage Assoc. | 3.500 | 01/20/43 | 1,917 | 2,042,532 | ||||||||||||
Government National Mortgage Assoc. | 3.500 | 04/20/43 | 880 | 933,738 | ||||||||||||
Government National Mortgage Assoc. | 3.500 | 03/20/45 | 1,566 | 1,651,656 | ||||||||||||
Government National Mortgage Assoc. | 3.500 | 04/20/45 | 874 | 922,065 | ||||||||||||
Government National Mortgage Assoc. | 3.500 | 07/20/46 | 3,345 | 3,514,098 | ||||||||||||
Government National Mortgage Assoc. | 3.500 | 01/20/47 | 716 | 752,391 | ||||||||||||
Government National Mortgage Assoc. | 3.500 | 03/20/47 | 346 | 363,184 | ||||||||||||
Government National Mortgage Assoc. | 3.500 | 07/20/47 | 2,223 | 2,332,034 | ||||||||||||
Government National Mortgage Assoc. | 3.500 | 11/20/48 | 1,341 | 1,399,488 | ||||||||||||
Government National Mortgage Assoc. | 3.500 | 01/20/49 | 1,076 | 1,128,408 | ||||||||||||
Government National Mortgage Assoc. | 3.500 | 04/20/49 | 824 | 857,397 | ||||||||||||
Government National Mortgage Assoc. | 4.000 | 02/20/41 | 444 | 480,668 | ||||||||||||
Government National Mortgage Assoc. | 4.000 | 06/20/44 | 941 | 1,014,782 | ||||||||||||
Government National Mortgage Assoc. | 4.000 | 08/20/44 | 283 | 305,450 | ||||||||||||
Government National Mortgage Assoc. | 4.000 | 11/20/45 | 633 | 679,469 | ||||||||||||
Government National Mortgage Assoc. | 4.000 | 11/20/46 | 613 | 653,747 | ||||||||||||
Government National Mortgage Assoc. | 4.000 | 02/20/47 | 640 | 681,902 | ||||||||||||
Government National Mortgage Assoc. | 4.000 | 10/20/47 | 720 | 762,040 | ||||||||||||
Government National Mortgage Assoc. | 4.000 | 12/20/47 | 528 | 558,525 | ||||||||||||
Government National Mortgage Assoc. | 4.000 | 02/20/49 | 2,536 | 2,666,101 | ||||||||||||
Government National Mortgage Assoc. | 4.500 | 02/20/40 | 265 | 290,075 | ||||||||||||
See Notes to Financial Statements.
| PGIM Government Income Fund | 21 |
Schedule of Investments (continued)
as of February 29, 2020
| Description | Interest Rate | Maturity Date | Principal Amount (000)# | Value | ||||||||||||
U.S. GOVERNMENT AGENCY OBLIGATIONS (Continued) | ||||||||||||||||
Government National Mortgage Assoc. | 4.500 | % | 01/20/41 | 155 | $ | 170,141 | ||||||||||
Government National Mortgage Assoc. | 4.500 | 02/20/41 | 768 | 843,846 | ||||||||||||
Government National Mortgage Assoc. | 4.500 | 03/20/41 | 394 | 432,941 | ||||||||||||
Government National Mortgage Assoc. | 4.500 | 06/20/44 | 566 | 619,035 | ||||||||||||
Government National Mortgage Assoc. | 4.500 | 02/20/46 | 55 | 59,914 | ||||||||||||
Government National Mortgage Assoc. | 4.500 | 03/20/46 | 275 | 300,895 | ||||||||||||
Government National Mortgage Assoc. | 4.500 | 03/20/47 | 1,709 | 1,824,272 | ||||||||||||
Government National Mortgage Assoc. | 4.500 | 08/20/47 | 333 | 353,267 | ||||||||||||
Government National Mortgage Assoc. | 4.500 | 01/20/48 | 277 | 293,782 | ||||||||||||
Government National Mortgage Assoc. | 4.500 | 02/20/48 | 1,786 | 1,892,893 | ||||||||||||
Government National Mortgage Assoc. | 5.000 | 07/15/33 | 449 | 502,854 | ||||||||||||
Government National Mortgage Assoc. | 5.000 | 09/15/33 | 561 | 626,478 | ||||||||||||
Government National Mortgage Assoc. | 5.000 | 04/15/34 | 16 | 17,447 | ||||||||||||
Government National Mortgage Assoc. | 5.500 | 02/15/34 | 452 | 529,424 | ||||||||||||
Government National Mortgage Assoc. | 5.500 | 02/15/36 | 114 | 131,130 | ||||||||||||
Government National Mortgage Assoc. | 7.000 | 12/15/22 | — | (r) | 226 | |||||||||||
Government National Mortgage Assoc. | 7.000 | 12/15/22 | 1 | 616 | ||||||||||||
Government National Mortgage Assoc. | 7.000 | 01/15/23 | — | (r) | 321 | |||||||||||
Government National Mortgage Assoc. | 7.000 | 01/15/23 | 1 | 966 | ||||||||||||
Government National Mortgage Assoc. | 7.000 | 01/15/23 | 1 | 1,120 | ||||||||||||
Government National Mortgage Assoc. | 7.000 | 01/15/23 | 1 | 1,332 | ||||||||||||
Government National Mortgage Assoc. | 7.000 | 01/15/23 | 2 | 2,310 | ||||||||||||
Government National Mortgage Assoc. | 7.000 | 03/15/23 | 1 | 1,347 | ||||||||||||
Government National Mortgage Assoc. | 7.000 | 03/15/23 | 2 | 2,349 | ||||||||||||
Government National Mortgage Assoc. | 7.000 | 04/15/23 | 1 | 812 | ||||||||||||
Government National Mortgage Assoc. | 7.000 | 04/15/23 | 2 | 2,209 | ||||||||||||
Government National Mortgage Assoc. | 7.000 | 05/15/23 | — | (r) | 80 | |||||||||||
Government National Mortgage Assoc. | 7.000 | 05/15/23 | — | (r) | 226 | |||||||||||
Government National Mortgage Assoc. | 7.000 | 05/15/23 | — | (r) | 392 | |||||||||||
Government National Mortgage Assoc. | 7.000 | 05/15/23 | — | (r) | 402 | |||||||||||
Government National Mortgage Assoc. | 7.000 | 05/15/23 | — | (r) | 473 | |||||||||||
Government National Mortgage Assoc. | 7.000 | 05/15/23 | 1 | 563 | ||||||||||||
Government National Mortgage Assoc. | 7.000 | 05/15/23 | 1 | 1,012 | ||||||||||||
Government National Mortgage Assoc. | 7.000 | 05/15/23 | 4 | 4,122 | ||||||||||||
Government National Mortgage Assoc. | 7.000 | 05/15/23 | 6 | 6,005 | ||||||||||||
Government National Mortgage Assoc. | 7.000 | 05/15/23 | 6 | 6,051 | ||||||||||||
Government National Mortgage Assoc. | 7.000 | 06/15/23 | — | (r) | 100 | |||||||||||
Government National Mortgage Assoc. | 7.000 | 06/15/23 | — | (r) | 265 | |||||||||||
Government National Mortgage Assoc. | 7.000 | 06/15/23 | — | (r) | 445 | |||||||||||
Government National Mortgage Assoc. | 7.000 | 06/15/23 | 1 | 770 | ||||||||||||
Government National Mortgage Assoc. | 7.000 | 06/15/23 | 1 | 1,180 | ||||||||||||
Government National Mortgage Assoc. | 7.000 | 06/15/23 | 1 | 1,423 | ||||||||||||
Government National Mortgage Assoc. | 7.000 | 06/15/23 | 3 | 2,644 | ||||||||||||
Government National Mortgage Assoc. | 7.000 | 07/15/23 | — | (r) | 167 | |||||||||||
Government National Mortgage Assoc. | 7.000 | 07/15/23 | — | (r) | 192 | |||||||||||
See Notes to Financial Statements.
| 22 |
| Description | Interest Rate | Maturity Date | Principal Amount (000)# | Value | ||||||||||||
U.S. GOVERNMENT AGENCY OBLIGATIONS (Continued) | ||||||||||||||||
Government National Mortgage Assoc. | 7.000 | % | 07/15/23 | — | (r) | $ | 346 | |||||||||
Government National Mortgage Assoc. | 7.000 | 07/15/23 | — | (r) | 375 | |||||||||||
Government National Mortgage Assoc. | 7.000 | 07/15/23 | — | (r) | 385 | |||||||||||
Government National Mortgage Assoc. | 7.000 | 07/15/23 | 1 | 779 | ||||||||||||
Government National Mortgage Assoc. | 7.000 | 07/15/23 | 1 | 962 | ||||||||||||
Government National Mortgage Assoc. | 7.000 | 07/15/23 | 1 | 989 | ||||||||||||
Government National Mortgage Assoc. | 7.000 | 07/15/23 | 1 | 1,276 | ||||||||||||
Government National Mortgage Assoc. | 7.000 | 07/15/23 | 3 | 2,656 | ||||||||||||
Government National Mortgage Assoc. | 7.000 | 07/15/23 | 11 | 11,737 | ||||||||||||
Government National Mortgage Assoc. | 7.000 | 08/15/23 | — | (r) | 241 | |||||||||||
Government National Mortgage Assoc. | 7.000 | 08/15/23 | — | (r) | 242 | |||||||||||
Government National Mortgage Assoc. | 7.000 | 08/15/23 | — | (r) | 353 | |||||||||||
Government National Mortgage Assoc. | 7.000 | 08/15/23 | — | (r) | 387 | |||||||||||
Government National Mortgage Assoc. | 7.000 | 08/15/23 | — | (r) | 427 | |||||||||||
Government National Mortgage Assoc. | 7.000 | 08/15/23 | 1 | 748 | ||||||||||||
Government National Mortgage Assoc. | 7.000 | 08/15/23 | 1 | 1,083 | ||||||||||||
Government National Mortgage Assoc. | 7.000 | 08/15/23 | 1 | 1,253 | ||||||||||||
Government National Mortgage Assoc. | 7.000 | 08/15/23 | 1 | 1,310 | ||||||||||||
Government National Mortgage Assoc. | 7.000 | 08/15/23 | 2 | 1,767 | ||||||||||||
Government National Mortgage Assoc. | 7.000 | 08/15/23 | 2 | 2,213 | ||||||||||||
Government National Mortgage Assoc. | 7.000 | 08/15/23 | 2 | 2,384 | ||||||||||||
Government National Mortgage Assoc. | 7.000 | 08/15/23 | 3 | 2,661 | ||||||||||||
Government National Mortgage Assoc. | 7.000 | 08/15/23 | 3 | 2,813 | ||||||||||||
Government National Mortgage Assoc. | 7.000 | 08/15/23 | 4 | 3,977 | ||||||||||||
Government National Mortgage Assoc. | 7.000 | 08/15/23 | 4 | 4,382 | ||||||||||||
Government National Mortgage Assoc. | 7.000 | 09/15/23 | — | (r) | 444 | |||||||||||
Government National Mortgage Assoc. | 7.000 | 09/15/23 | — | (r) | 491 | |||||||||||
Government National Mortgage Assoc. | 7.000 | 09/15/23 | 1 | 731 | ||||||||||||
Government National Mortgage Assoc. | 7.000 | 09/15/23 | 1 | 754 | ||||||||||||
Government National Mortgage Assoc. | 7.000 | 09/15/23 | 1 | 904 | ||||||||||||
Government National Mortgage Assoc. | 7.000 | 09/15/23 | 6 | 5,973 | ||||||||||||
Government National Mortgage Assoc. | 7.000 | 09/15/23 | 22 | 22,752 | ||||||||||||
Government National Mortgage Assoc. | 7.000 | 10/15/23 | — | (r) | 133 | |||||||||||
Government National Mortgage Assoc. | 7.000 | 10/15/23 | — | (r) | 171 | |||||||||||
Government National Mortgage Assoc. | 7.000 | 10/15/23 | — | (r) | 428 | |||||||||||
Government National Mortgage Assoc. | 7.000 | 10/15/23 | — | (r) | 461 | |||||||||||
Government National Mortgage Assoc. | 7.000 | 10/15/23 | — | (r) | 461 | |||||||||||
Government National Mortgage Assoc. | 7.000 | 10/15/23 | 1 | 595 | ||||||||||||
Government National Mortgage Assoc. | 7.000 | 10/15/23 | 1 | 895 | ||||||||||||
Government National Mortgage Assoc. | 7.000 | 10/15/23 | 1 | 1,000 | ||||||||||||
Government National Mortgage Assoc. | 7.000 | 10/15/23 | 1 | 1,066 | ||||||||||||
Government National Mortgage Assoc. | 7.000 | 10/15/23 | 1 | 1,107 | ||||||||||||
Government National Mortgage Assoc. | 7.000 | 10/15/23 | 1 | 1,156 | ||||||||||||
Government National Mortgage Assoc. | 7.000 | 10/15/23 | 1 | 1,189 | ||||||||||||
Government National Mortgage Assoc. | 7.000 | 10/15/23 | 1 | 1,265 | ||||||||||||
See Notes to Financial Statements.
| PGIM Government Income Fund | 23 |
Schedule of Investments (continued)
as of February 29, 2020
| Description | Interest Rate | Maturity Date | Principal Amount (000)# | Value | ||||||||||||
U.S. GOVERNMENT AGENCY OBLIGATIONS (Continued) | ||||||||||||||||
Government National Mortgage Assoc. | 7.000 | % | 10/15/23 | 2 | $ | 1,703 | ||||||||||
Government National Mortgage Assoc. | 7.000 | 10/15/23 | 2 | 2,012 | ||||||||||||
Government National Mortgage Assoc. | 7.000 | 10/15/23 | 2 | 2,114 | ||||||||||||
Government National Mortgage Assoc. | 7.000 | 10/15/23 | 3 | 2,675 | ||||||||||||
Government National Mortgage Assoc. | 7.000 | 10/15/23 | 3 | 2,905 | ||||||||||||
Government National Mortgage Assoc. | 7.000 | 10/15/23 | 3 | 3,588 | ||||||||||||
Government National Mortgage Assoc. | 7.000 | 10/15/23 | 5 | 5,056 | ||||||||||||
Government National Mortgage Assoc. | 7.000 | 10/15/23 | 5 | 5,264 | ||||||||||||
Government National Mortgage Assoc. | 7.000 | 10/15/23 | 8 | 8,778 | ||||||||||||
Government National Mortgage Assoc. | 7.000 | 10/15/23 | 10 | 10,341 | ||||||||||||
Government National Mortgage Assoc. | 7.000 | 10/15/23 | 16 | 16,491 | ||||||||||||
Government National Mortgage Assoc. | 7.000 | 10/15/23 | 25 | 26,181 | ||||||||||||
Government National Mortgage Assoc. | 7.000 | 11/15/23 | — | (r) | 388 | |||||||||||
Government National Mortgage Assoc. | 7.000 | 11/15/23 | — | (r) | 392 | |||||||||||
Government National Mortgage Assoc. | 7.000 | 11/15/23 | 1 | 575 | ||||||||||||
Government National Mortgage Assoc. | 7.000 | 11/15/23 | 1 | 770 | ||||||||||||
Government National Mortgage Assoc. | 7.000 | 11/15/23 | 1 | 915 | ||||||||||||
Government National Mortgage Assoc. | 7.000 | 11/15/23 | 1 | 939 | ||||||||||||
Government National Mortgage Assoc. | 7.000 | 11/15/23 | 1 | 946 | ||||||||||||
Government National Mortgage Assoc. | 7.000 | 11/15/23 | 1 | 1,265 | ||||||||||||
Government National Mortgage Assoc. | 7.000 | 11/15/23 | 1 | 1,381 | ||||||||||||
Government National Mortgage Assoc. | 7.000 | 11/15/23 | 2 | 2,314 | ||||||||||||
Government National Mortgage Assoc. | 7.000 | 11/15/23 | 2 | 2,472 | ||||||||||||
Government National Mortgage Assoc. | 7.000 | 11/15/23 | 3 | 3,354 | ||||||||||||
Government National Mortgage Assoc. | 7.000 | 11/15/23 | 3 | 3,385 | ||||||||||||
Government National Mortgage Assoc. | 7.000 | 11/15/23 | 3 | 3,412 | ||||||||||||
Government National Mortgage Assoc. | 7.000 | 11/15/23 | 3 | 3,750 | ||||||||||||
Government National Mortgage Assoc. | 7.000 | 11/15/23 | 5 | 4,817 | ||||||||||||
Government National Mortgage Assoc. | 7.000 | 11/15/23 | 5 | 5,139 | ||||||||||||
Government National Mortgage Assoc. | 7.000 | 11/15/23 | 10 | 10,719 | ||||||||||||
Government National Mortgage Assoc. | 7.000 | 12/15/23 | — | (r) | 311 | |||||||||||
Government National Mortgage Assoc. | 7.000 | 12/15/23 | — | (r) | 373 | |||||||||||
Government National Mortgage Assoc. | 7.000 | 12/15/23 | — | (r) | 375 | |||||||||||
Government National Mortgage Assoc. | 7.000 | 12/15/23 | — | (r) | 377 | |||||||||||
Government National Mortgage Assoc. | 7.000 | 12/15/23 | — | (r) | 511 | |||||||||||
Government National Mortgage Assoc. | 7.000 | 12/15/23 | 1 | 752 | ||||||||||||
Government National Mortgage Assoc. | 7.000 | 12/15/23 | 1 | 826 | ||||||||||||
Government National Mortgage Assoc. | 7.000 | 12/15/23 | 1 | 843 | ||||||||||||
Government National Mortgage Assoc. | 7.000 | 12/15/23 | 1 | 864 | ||||||||||||
Government National Mortgage Assoc. | 7.000 | 12/15/23 | 1 | 901 | ||||||||||||
Government National Mortgage Assoc. | 7.000 | 12/15/23 | 1 | 1,129 | ||||||||||||
Government National Mortgage Assoc. | 7.000 | 12/15/23 | 1 | 1,246 | ||||||||||||
Government National Mortgage Assoc. | 7.000 | 12/15/23 | 1 | 1,328 | ||||||||||||
Government National Mortgage Assoc. | 7.000 | 12/15/23 | 2 | 1,855 | ||||||||||||
Government National Mortgage Assoc. | 7.000 | 12/15/23 | 2 | 1,998 | ||||||||||||
See Notes to Financial Statements.
| 24 |
| Description | Interest Rate | Maturity Date | Principal Amount (000)# | Value | ||||||||||||
U.S. GOVERNMENT AGENCY OBLIGATIONS (Continued) | ||||||||||||||||
Government National Mortgage Assoc. | 7.000 | % | 12/15/23 | 2 | $ | 2,079 | ||||||||||
Government National Mortgage Assoc. | 7.000 | 12/15/23 | 2 | 2,369 | ||||||||||||
Government National Mortgage Assoc. | 7.000 | 12/15/23 | 3 | 2,577 | ||||||||||||
Government National Mortgage Assoc. | 7.000 | 12/15/23 | 3 | 2,964 | ||||||||||||
Government National Mortgage Assoc. | 7.000 | 12/15/23 | 3 | 3,417 | ||||||||||||
Government National Mortgage Assoc. | 7.000 | 12/15/23 | 4 | 3,796 | ||||||||||||
Government National Mortgage Assoc. | 7.000 | 12/15/23 | 4 | 3,884 | ||||||||||||
Government National Mortgage Assoc. | 7.000 | 12/15/23 | 4 | 3,903 | ||||||||||||
Government National Mortgage Assoc. | 7.000 | 12/15/23 | 4 | 4,432 | ||||||||||||
Government National Mortgage Assoc. | 7.000 | 12/15/23 | 5 | 4,889 | ||||||||||||
Government National Mortgage Assoc. | 7.000 | 12/15/23 | 6 | 6,230 | ||||||||||||
Government National Mortgage Assoc. | 7.000 | 12/15/23 | 7 | 7,510 | ||||||||||||
Government National Mortgage Assoc. | 7.000 | 12/15/23 | 9 | 9,252 | ||||||||||||
Government National Mortgage Assoc. | 7.000 | 12/15/23 | 12 | 12,145 | ||||||||||||
Government National Mortgage Assoc. | 7.000 | 12/15/23 | 14 | 14,609 | ||||||||||||
Government National Mortgage Assoc. | 7.000 | 01/15/24 | — | (r) | 299 | |||||||||||
Government National Mortgage Assoc. | 7.000 | 01/15/24 | 1 | 701 | ||||||||||||
Government National Mortgage Assoc. | 7.000 | 01/15/24 | 1 | 733 | ||||||||||||
Government National Mortgage Assoc. | 7.000 | 01/15/24 | 1 | 848 | ||||||||||||
Government National Mortgage Assoc. | 7.000 | 01/15/24 | 1 | 1,103 | ||||||||||||
Government National Mortgage Assoc. | 7.000 | 01/15/24 | 1 | 1,242 | ||||||||||||
Government National Mortgage Assoc. | 7.000 | 01/15/24 | 2 | 1,806 | ||||||||||||
Government National Mortgage Assoc. | 7.000 | 01/15/24 | 2 | 1,844 | ||||||||||||
Government National Mortgage Assoc. | 7.000 | 01/15/24 | 2 | 2,128 | ||||||||||||
Government National Mortgage Assoc. | 7.000 | 01/15/24 | 2 | 2,477 | ||||||||||||
Government National Mortgage Assoc. | 7.000 | 01/15/24 | 3 | 3,318 | ||||||||||||
Government National Mortgage Assoc. | 7.000 | 01/15/24 | 6 | 5,966 | ||||||||||||
Government National Mortgage Assoc. | 7.000 | 02/15/24 | — | (r) | 335 | |||||||||||
Government National Mortgage Assoc. | 7.000 | 02/15/24 | — | (r) | 398 | |||||||||||
Government National Mortgage Assoc. | 7.000 | 02/15/24 | 1 | 601 | ||||||||||||
Government National Mortgage Assoc. | 7.000 | 02/15/24 | 1 | 1,228 | ||||||||||||
Government National Mortgage Assoc. | 7.000 | 02/15/24 | 1 | 1,375 | ||||||||||||
Government National Mortgage Assoc. | 7.000 | 02/15/24 | 2 | 1,755 | ||||||||||||
Government National Mortgage Assoc. | 7.000 | 02/15/24 | 7 | 7,502 | ||||||||||||
Government National Mortgage Assoc. | 7.000 | 03/15/24 | — | (r) | 94 | |||||||||||
Government National Mortgage Assoc. | 7.000 | 03/15/24 | — | (r) | 446 | |||||||||||
Government National Mortgage Assoc. | 7.000 | 03/15/24 | 1 | 933 | ||||||||||||
Government National Mortgage Assoc. | 7.000 | 03/15/24 | 2 | 2,179 | ||||||||||||
Government National Mortgage Assoc. | 7.000 | 04/15/24 | — | (r) | 88 | |||||||||||
Government National Mortgage Assoc. | 7.000 | 04/15/24 | — | (r) | 314 | |||||||||||
Government National Mortgage Assoc. | 7.000 | 04/15/24 | — | (r) | 350 | |||||||||||
Government National Mortgage Assoc. | 7.000 | 04/15/24 | 1 | 640 | ||||||||||||
Government National Mortgage Assoc. | 7.000 | 04/15/24 | 1 | 1,042 | ||||||||||||
Government National Mortgage Assoc. | 7.000 | 04/15/24 | 1 | 1,207 | ||||||||||||
Government National Mortgage Assoc. | 7.000 | 04/15/24 | 1 | 1,320 | ||||||||||||
See Notes to Financial Statements.
| PGIM Government Income Fund | 25 |
Schedule of Investments (continued)
as of February 29, 2020
| Description | Interest Rate | Maturity Date | Principal Amount (000)# | Value | ||||||||||||
U.S. GOVERNMENT AGENCY OBLIGATIONS (Continued) | ||||||||||||||||
Government National Mortgage Assoc. | 7.000 | % | 04/15/24 | 1 | $ | 1,496 | ||||||||||
Government National Mortgage Assoc. | 7.000 | 04/15/24 | 2 | 1,823 | ||||||||||||
Government National Mortgage Assoc. | 7.000 | 04/15/24 | 4 | 3,755 | ||||||||||||
Government National Mortgage Assoc. | 7.000 | 04/15/24 | 5 | 5,578 | ||||||||||||
Government National Mortgage Assoc. | 7.000 | 04/15/24 | 6 | 6,437 | ||||||||||||
Government National Mortgage Assoc. | 7.000 | 05/15/24 | — | (r) | 186 | |||||||||||
Government National Mortgage Assoc. | 7.000 | 05/15/24 | — | (r) | 326 | |||||||||||
Government National Mortgage Assoc. | 7.000 | 05/15/24 | 1 | 597 | ||||||||||||
Government National Mortgage Assoc. | 7.000 | 05/15/24 | 1 | 930 | ||||||||||||
Government National Mortgage Assoc. | 7.000 | 05/15/24 | 1 | 1,335 | ||||||||||||
Government National Mortgage Assoc. | 7.000 | 05/15/24 | 2 | 1,751 | ||||||||||||
Government National Mortgage Assoc. | 7.000 | 05/15/24 | 2 | 2,149 | ||||||||||||
Government National Mortgage Assoc. | 7.000 | 05/15/24 | 2 | 2,535 | ||||||||||||
Government National Mortgage Assoc. | 7.000 | 05/15/24 | 3 | 3,512 | ||||||||||||
Government National Mortgage Assoc. | 7.000 | 05/15/24 | 5 | 5,724 | ||||||||||||
Government National Mortgage Assoc. | 7.000 | 05/15/24 | 8 | 8,001 | ||||||||||||
Government National Mortgage Assoc. | 7.000 | 06/15/24 | — | (r) | 206 | |||||||||||
Government National Mortgage Assoc. | 7.000 | 06/15/24 | — | (r) | 309 | |||||||||||
Government National Mortgage Assoc. | 7.000 | 06/15/24 | — | (r) | 373 | |||||||||||
Government National Mortgage Assoc. | 7.000 | 06/15/24 | 1 | 770 | ||||||||||||
Government National Mortgage Assoc. | 7.000 | 06/15/24 | 1 | 1,095 | ||||||||||||
Government National Mortgage Assoc. | 7.000 | 06/15/24 | 3 | 2,699 | ||||||||||||
Government National Mortgage Assoc. | 7.000 | 06/15/24 | 3 | 2,871 | ||||||||||||
Government National Mortgage Assoc. | 7.000 | 06/15/24 | 3 | 3,208 | ||||||||||||
Government National Mortgage Assoc. | 7.000 | 06/15/24 | 6 | 5,924 | ||||||||||||
Government National Mortgage Assoc. | 7.000 | 06/15/24 | 8 | 7,871 | ||||||||||||
Government National Mortgage Assoc. | 7.000 | 07/15/24 | 1 | 993 | ||||||||||||
Government National Mortgage Assoc. | 7.000 | 07/15/24 | 2 | 2,271 | ||||||||||||
Government National Mortgage Assoc. | 7.000 | 10/15/24 | 2 | 1,580 | ||||||||||||
Government National Mortgage Assoc. | 7.000 | 02/15/29 | 6 | 6,631 | ||||||||||||
Government National Mortgage Assoc. | 7.500 | 01/15/23 | — | (r) | 33 | |||||||||||
Government National Mortgage Assoc. | 7.500 | 01/15/23 | — | (r) | 210 | |||||||||||
Government National Mortgage Assoc. | 7.500 | 03/15/23 | — | (r) | 361 | |||||||||||
Government National Mortgage Assoc. | 7.500 | 05/15/23 | — | (r) | 228 | |||||||||||
Government National Mortgage Assoc. | 7.500 | 05/15/23 | 3 | 3,661 | ||||||||||||
Government National Mortgage Assoc. | 7.500 | 06/15/23 | — | (r) | 204 | |||||||||||
Government National Mortgage Assoc. | 7.500 | 07/15/23 | — | (r) | 89 | |||||||||||
Government National Mortgage Assoc. | 7.500 | 07/15/23 | — | (r) | 162 | |||||||||||
Government National Mortgage Assoc. | 7.500 | 09/15/23 | 2 | 2,136 | ||||||||||||
Government National Mortgage Assoc. | 7.500 | 10/15/23 | 3 | 3,104 | ||||||||||||
Government National Mortgage Assoc. | 7.500 | 10/15/23 | 7 | 7,260 | ||||||||||||
Government National Mortgage Assoc. | 7.500 | 11/15/23 | 1 | 600 | ||||||||||||
Government National Mortgage Assoc. | 7.500 | 11/15/23 | 7 | 7,706 | ||||||||||||
Government National Mortgage Assoc. | 7.500 | 12/15/23 | 1 | 551 | ||||||||||||
Government National Mortgage Assoc. | 7.500 | 12/15/23 | 2 | 2,059 | ||||||||||||
See Notes to Financial Statements.
| 26 |
| Description | Interest Rate | Maturity Date | Principal Amount (000)# | Value | ||||||||||||
U.S. GOVERNMENT AGENCY OBLIGATIONS (Continued) | ||||||||||||||||
Government National Mortgage Assoc. | 7.500 | % | 01/15/24 | 1 | $ | 1,147 | ||||||||||
Government National Mortgage Assoc. | 7.500 | 01/15/24 | 1 | 1,292 | ||||||||||||
Government National Mortgage Assoc. | 7.500 | 01/15/24 | 2 | 1,725 | ||||||||||||
Government National Mortgage Assoc. | 7.500 | 01/15/24 | 8 | 8,629 | ||||||||||||
Government National Mortgage Assoc. | 7.500 | 01/15/24 | 10 | 10,067 | ||||||||||||
Government National Mortgage Assoc. | 7.500 | 02/15/24 | 1 | 760 | ||||||||||||
Government National Mortgage Assoc. | 7.500 | 02/15/24 | 9 | 9,457 | ||||||||||||
Government National Mortgage Assoc. | 7.500 | 03/15/24 | 3 | 2,656 | ||||||||||||
Government National Mortgage Assoc. | 7.500 | 04/15/24 | 2 | 2,208 | ||||||||||||
Government National Mortgage Assoc. | 7.500 | 04/15/24 | 2 | 2,219 | ||||||||||||
Government National Mortgage Assoc. | 7.500 | 04/15/24 | 5 | 5,323 | ||||||||||||
Government National Mortgage Assoc. | 7.500 | 05/15/24 | — | (r) | 329 | |||||||||||
Government National Mortgage Assoc. | 7.500 | 06/15/24 | — | (r) | 499 | |||||||||||
Government National Mortgage Assoc. | 7.500 | 06/15/24 | 1 | 1,118 | ||||||||||||
Government National Mortgage Assoc. | 7.500 | 06/15/24 | 3 | 3,360 | ||||||||||||
Government National Mortgage Assoc. | 7.500 | 06/15/24 | 5 | 4,605 | ||||||||||||
Government National Mortgage Assoc. | 7.500 | 07/15/24 | 4 | 4,062 | ||||||||||||
Government National Mortgage Assoc. | 7.500 | 07/15/24 | 9 | 9,138 | ||||||||||||
Government National Mortgage Assoc. | 8.500 | 04/15/25 | 84 | 94,375 | ||||||||||||
Government National Mortgage Assoc. | 9.500 | 07/20/21 | — | (r) | 12 | |||||||||||
Government National Mortgage Assoc. | 9.500 | 08/20/21 | 2 | 2,321 | ||||||||||||
Israel Government, USAID Bond, Gov’t. Gtd. Notes | 2.923 | (s) | 11/15/25 | 900 | 825,194 | |||||||||||
Israel Government, USAID Bond, Gov’t. Gtd. Notes | 2.961 | (s) | 05/15/26 | 875 | 794,922 | |||||||||||
Israel Government, USAID Bond, Gov’t. Gtd. Notes | 2.997 | (s) | 02/15/26 | 650 | 605,332 | |||||||||||
Israel Government, USAID Bond, Gov’t. Gtd. Notes | 3.040 | (s) | 11/15/26 | 800 | 719,687 | |||||||||||
Israel Government, USAID Bond, Gov’t. Gtd. Notes | 3.329 | (s) | 05/15/25 | 925 | 856,010 | |||||||||||
Israel Government, USAID Bond, Gov’t. Gtd. Notes | 5.500 | 09/18/33 | 500 | 735,794 | ||||||||||||
Residual Funding Corp., Strips Principal, Bonds, PO | 2.737 | (s) | 01/15/30 | 1,540 | 1,320,331 | |||||||||||
Residual Funding Corp., Strips Principal, Bonds, PO | 3.114 | (s) | 04/15/30 | 2,280 | 1,937,520 | |||||||||||
Resolution Funding Corp., Strips Interest, Bonds | 2.197 | (s) | 01/15/30 | 220 | 185,063 | |||||||||||
Resolution Funding Corp., Strips Interest, Bonds | 2.433 | (s) | 04/15/28 | 300 | 259,994 | |||||||||||
Resolution Funding Corp., Strips Interest, Bonds | 2.477 | (s) | 01/15/29 | 500 | 425,027 | |||||||||||
Resolution Funding Corp., Strips Interest, Bonds | 3.657 | (s) | 04/15/30 | 1,000 | 838,617 | |||||||||||
Tennessee Valley Authority, Sr. Unsec’d. Notes | 2.875 | 02/01/27 | 335 | 370,279 | ||||||||||||
Tennessee Valley Authority, Sr. Unsec’d. Notes | 5.880 | 04/01/36 | 170 | 260,706 | ||||||||||||
Tennessee Valley Authority, Sr. Unsec’d. Notes | 6.750 | 11/01/25 | 1,300 | 1,702,540 | ||||||||||||
Tennessee Valley Authority, Sr. Unsec’d. Notes | 7.125 | 05/01/30 | 1,170 | 1,783,514 | ||||||||||||
|
| |||||||||||||||
TOTAL U.S. GOVERNMENT AGENCY OBLIGATIONS | 182,341,806 | |||||||||||||||
|
| |||||||||||||||
U.S. TREASURY OBLIGATIONS 33.0% | ||||||||||||||||
U.S. Treasury Bonds | 2.875 | 05/15/43 | 17,900 | 22,193,203 | ||||||||||||
U.S. Treasury Bonds | 3.125 | 02/15/43 | 2,265 | 2,916,541 | ||||||||||||
U.S. Treasury Bonds | 3.625 | 08/15/43 | (k) | 19,430 | 27,001,628 | |||||||||||
See Notes to Financial Statements.
| PGIM Government Income Fund | 27 |
Schedule of Investments (continued)
as of February 29, 2020
| Description | Interest Rate | Maturity Date | Principal Amount (000)# | Value | ||||||||||||
U.S. TREASURY OBLIGATIONS (Continued) | ||||||||||||||||
U.S. Treasury Bonds | 3.750 | % | 11/15/43 | 21,580 | $ | 30,572,791 | ||||||||||
U.S. Treasury Notes | 1.500 | 01/31/27 | 1,570 | 1,617,345 | ||||||||||||
U.S. Treasury Notes | 1.500 | 02/15/30 | 105 | 108,577 | ||||||||||||
U.S. Treasury Notes | 1.750 | 06/30/24 | 3,085 | 3,193,698 | ||||||||||||
U.S. Treasury Notes | 2.125 | 08/15/21 | 3,115 | 3,166,592 | ||||||||||||
U.S. Treasury Notes | 2.250 | 11/15/25 | 1,310 | 1,401,905 | ||||||||||||
U.S. Treasury Notes | 2.375 | 08/15/24 | 680 | 723,084 | ||||||||||||
U.S. Treasury Notes | 2.875 | 05/15/28 | 11,160 | 12,725,887 | ||||||||||||
U.S. Treasury Strips Coupon | 1.479 | (s) | 05/15/24 | 2,215 | 2,126,746 | |||||||||||
U.S. Treasury Strips Coupon | 1.881 | (s) | 05/15/31 | 1,100 | 944,754 | |||||||||||
U.S. Treasury Strips Coupon | 1.898 | (s) | 08/15/29 | 1,100 | 975,133 | |||||||||||
U.S. Treasury Strips Coupon | 1.982 | (s) | 08/15/39 | 3,635 | 2,652,698 | |||||||||||
U.S. Treasury Strips Coupon | 1.984 | (s) | 02/15/37 | 940 | 719,871 | |||||||||||
U.S. Treasury Strips Coupon | 2.010 | (s) | 08/15/30 | 1,585 | 1,381,488 | |||||||||||
U.S. Treasury Strips Coupon | 2.045 | (s) | 11/15/36 | 500 | 385,352 | |||||||||||
U.S. Treasury Strips Coupon | 2.049 | (s) | 02/15/39 | (k) | 2,755 | 2,022,127 | ||||||||||
U.S. Treasury Strips Coupon | 2.056 | (s) | 11/15/38 | 590 | 437,453 | |||||||||||
U.S. Treasury Strips Coupon | 2.100 | (s) | 11/15/35 | 2,200 | 1,735,766 | |||||||||||
U.S. Treasury Strips Coupon | 2.184 | (s) | 02/15/28 | 695 | 634,242 | |||||||||||
U.S. Treasury Strips Coupon | 2.208 | (s) | 05/15/39 | 2,030 | 1,489,116 | |||||||||||
U.S. Treasury Strips Coupon | 2.241 | (s) | 05/15/28 | 345 | 313,532 | |||||||||||
U.S. Treasury Strips Coupon | 2.264 | (s) | 08/15/40 | 2,200 | 1,567,586 | |||||||||||
U.S. Treasury Strips Coupon | 2.280 | (s) | 02/15/29 | 305 | 273,142 | |||||||||||
U.S. Treasury Strips Coupon | 2.334 | (s) | 08/15/41 | 2,485 | 1,717,271 | |||||||||||
U.S. Treasury Strips Coupon | 2.353 | (s) | 02/15/44 | 620 | 405,495 | |||||||||||
U.S. Treasury Strips Coupon | 2.365 | (s) | 05/15/44 | 2,275 | 1,478,306 | |||||||||||
U.S. Treasury Strips Coupon | 2.365 | (s) | 11/15/44 | 7,750 | 4,975,439 | |||||||||||
U.S. Treasury Strips Coupon | 2.380 | (s) | 05/15/41 | 3,445 | 2,410,693 | |||||||||||
U.S. Treasury Strips Coupon | 2.384 | (s) | 05/15/29 | 710 | 634,341 | |||||||||||
U.S. Treasury Strips Coupon | 2.395 | (s) | 11/15/43 | 13,768 | 9,062,678 | |||||||||||
U.S. Treasury Strips Coupon | 2.418 | (s) | 08/15/35 | 25 | 19,816 | |||||||||||
U.S. Treasury Strips Coupon | 2.434 | (s) | 11/15/45 | 920 | 579,528 | |||||||||||
U.S. Treasury Strips Coupon | 2.436 | (s) | 02/15/46 | 665 | 417,262 | |||||||||||
U.S. Treasury Strips Coupon | 2.499 | (s) | 02/15/22 | (k) | 1,675 | 1,644,313 | ||||||||||
U.S. Treasury Strips Coupon | 3.143 | (s) | 08/15/27 | 920 | 844,136 | |||||||||||
|
| |||||||||||||||
TOTAL U.S. TREASURY OBLIGATIONS | 147,469,535 | |||||||||||||||
|
| |||||||||||||||
TOTAL LONG-TERM INVESTMENTS | 444,324,737 | |||||||||||||||
|
| |||||||||||||||
See Notes to Financial Statements.
| 28 |
| Description | Shares | Value | ||||||||||||||
SHORT-TERM INVESTMENTS 1.8% | ||||||||||||||||
AFFILIATED MUTUAL FUND 1.7% | ||||||||||||||||
PGIM Core Ultra Short Bond Fund | 7,704,655 | $ | 7,704,655 | |||||||||||||
|
| |||||||||||||||
OPTIONS PURCHASED*~ 0.1% | 484,922 | |||||||||||||||
|
| |||||||||||||||
TOTAL SHORT-TERM INVESTMENTS | 8,189,577 | |||||||||||||||
|
| |||||||||||||||
TOTAL INVESTMENTS, BEFORE OPTION WRITTEN 101.1% | 452,514,314 | |||||||||||||||
|
| |||||||||||||||
OPTIONS WRITTEN*~ (0.0)% | (33,688 | ) | ||||||||||||||
|
| |||||||||||||||
TOTAL INVESTMENTS, NET OF OPTION WRITTEN 101.1% | 452,480,626 | |||||||||||||||
Liabilities in excess of other assets(z) (1.1)% | (5,015,390 | ) | ||||||||||||||
|
| |||||||||||||||
NET ASSETS 100.0% | $ | 447,465,236 | ||||||||||||||
|
| |||||||||||||||
See the Glossary for a list of the abbreviation(s) used in the annual report:
144A—Security was purchased pursuant to Rule 144A under the Securities Act of 1933 and, pursuant to the requirements of Rule 144A, may not be resold except to qualified institutional buyers.
A—Annual payment frequency for swaps
Aces—Alternative Credit Enhancements Securities
CLO—Collateralized Loan Obligation
CMS—Constant Maturity Swap
FHLMC—Federal Home Loan Mortgage Corporation
IO—Interest Only (Principal amount represents notional)
LIBOR—London Interbank Offered Rate
MTN—Medium Term Note
OTC—Over-the-counter
PO—Principal Only
Q—Quarterly payment frequency for swaps
S—Semiannual payment frequency for swaps
Strips—Separate Trading of Registered Interest and Principal of Securities
TBA—To Be Announced
USAID—United States Agency for International Development
USOIS—United States Overnight Index Swap
| * | Non-income producing security. |
| # | Principal or notional amount is shown in U.S. dollars unless otherwise stated. |
| ~ | See tables subsequent to the Schedule of Investments for options detail. |
| (c) | Variable rate instrument. The interest rate shown reflects the rate in effect at February 29, 2020. |
| (cc) | Variable rate instrument. The rate shown is based on the latest available information as of February 29, 2020. Certain variable rate securities are not based on a published reference rate and spread but are determined by the issuer or agent and are based on current market conditions. These securities do not indicate a reference rate and spread in their description. |
See Notes to Financial Statements.
| PGIM Government Income Fund | 29 |
Schedule of Investments (continued)
as of February 29, 2020
| (k) | Represents security, or a portion thereof, segregated as collateral for centrally cleared/exchange-traded derivatives. |
| (r) | Principal or notional amount is less than $500 par. |
| (s) | Represents zero coupon bond or principal only security. Rate represents yield to maturity at purchase date. |
| (w) | PGIM Investments LLC, the manager of the Fund, also serves as manager of the PGIM Core Ultra Short Bond Fund. |
| (z) | Includes net unrealized appreciation/(depreciation) and/or market value of the below holdings which are excluded from the Schedule of Investments: |
Options Purchased:
Exchange Traded
| Description | Call/ Put | Expiration Date | Strike | Contracts | Notional Amount (000)# | Value | ||||||||||||||||
| 10 Year U.S. Treasury Notes Futures | Put | 05/22/20 | $ | 126.00 | 82 | 82 | $ | 2,563 | ||||||||||||||
| 10 Year U.S. Treasury Notes Futures | Put | 05/22/20 | $ | 127.00 | 42 | 42 | 1,969 | |||||||||||||||
| 10 Year U.S. Treasury Notes Futures | Put | 05/22/20 | $ | 132.00 | 82 | 82 | 42,281 | |||||||||||||||
| 10 Year U.S. Treasury Notes Futures | Put | 05/22/20 | $ | 133.00 | 42 | 42 | 34,125 | |||||||||||||||
|
| |||||||||||||||||||||
| Total Exchange Traded (cost $122,375) | $ | 80,938 | ||||||||||||||||||||
|
| |||||||||||||||||||||
OTC Traded
| Description | Call/ Put | Counterparty | Expiration Date | Strike | Contracts | Notional Amount (000)# | Value | |||||||||||||||||
| 2-Year 10 CMS Curve CAP | Call | Barclays Bank PLC | 07/12/21 | 0.11 | % | — | 2,178 | $ | 28,055 | |||||||||||||||
| 2-Year 10 CMS Curve CAP | Call | Barclays Bank PLC | 07/13/21 | 0.11 | % | — | 2,118 | 27,233 | ||||||||||||||||
| 2-Year 10 CMS Curve CAP | Call | Bank of America, N.A. | 08/16/21 | 0.15 | % | — | 5,296 | 63,043 | ||||||||||||||||
| 2-Year 10 CMS Curve CAP | Call | Bank of America, N.A. | 08/20/21 | 0.15 | % | — | 10,512 | 126,813 | ||||||||||||||||
| 2-Year 10 CMS Curve CAP | Call | Bank of America, N.A. | 09/13/21 | 0.14 | % | — | 10,660 | 135,248 | ||||||||||||||||
| 2-Year 10 CMS Curve CAP | Call | Barclays Bank PLC | 11/09/21 | 0.21 | % | — | 2,118 | 23,592 | ||||||||||||||||
|
| |||||||||||||||||||||||
| Total OTC Traded (cost $12,443) | $ | 403,984 | ||||||||||||||||||||||
|
| |||||||||||||||||||||||
| Total Options Purchased (cost $134,818) | $ | 484,922 | ||||||||||||||||||||||
|
| |||||||||||||||||||||||
Options Written:
Exchange Traded
| Description | Call/ Put | Expiration Date | Strike | Contracts | Notional Amount (000)# | Value | ||||||||||||||||
| 10 Year U.S. Treasury Notes Futures | Put | 05/22/20 | $ | 129.00 | 164 | 164 | $ | (17,938 | ) | |||||||||||||
| 10 Year U.S. Treasury Notes Futures | Put | 05/22/20 | $ | 130.00 | 84 | 84 | (15,750 | ) | ||||||||||||||
|
| |||||||||||||||||||||
| Total Options Written (premiums received $44,876) | $ | (33,688 | ) | |||||||||||||||||||
|
| |||||||||||||||||||||
See Notes to Financial Statements.
| 30 |
Futures contracts outstanding at February 29, 2020:
| Number of Contracts | Type | Expiration Date | Current Notional Amount | Value / Unrealized Appreciation (Depreciation) | ||||||||||||
| Long Positions: | ||||||||||||||||
| 1,029 | 5 Year U.S. Treasury Notes | Jun. 2020 | $ | 126,309,750 | $ | 2,282,144 | ||||||||||
| 52 | 10 Year U.S. Ultra Treasury Notes | Jun. 2020 | 7,811,375 | 203,425 | ||||||||||||
|
| |||||||||||||||
| 2,485,569 | ||||||||||||||||
|
| |||||||||||||||
| Short Positions: | ||||||||||||||||
| 332 | 2 Year U.S. Treasury Notes | Jun. 2020 | 72,484,938 | (471,744 | ) | |||||||||||
| 103 | 10 Year U.S. Treasury Notes | Jun. 2020 | 13,879,250 | (231,311 | ) | |||||||||||
| 319 | 20 Year U.S. Treasury Bonds | Jun. 2020 | 54,309,750 | (1,599,155 | ) | |||||||||||
| 141 | 30 Year U.S. Ultra Treasury Bonds | Jun. 2020 | 29,257,500 | (758,909 | ) | |||||||||||
|
| |||||||||||||||
| (3,061,119 | ) | |||||||||||||||
|
| |||||||||||||||
| $ | (575,550 | ) | ||||||||||||||
|
| |||||||||||||||
Interest rate swap agreements outstanding at February 29, 2020:
Notional | Termination Date | Fixed Rate | Floating Rate | Value at Trade Date | Value at February 29, 2020 | Unrealized Appreciation (Depreciation) | ||||||||||||||||||
Centrally Cleared Interest Rate Swap Agreements: | ||||||||||||||||||||||||
| 6,243 | 03/31/21 | 2.173%(A) | 1 Day USOIS(2)(A) | $ | (2,294 | ) | $ | 102,747 | $ | 105,041 | ||||||||||||||
| 40,886 | 06/15/21 | 1.830%(S) | 3 Month LIBOR(2)(Q) | — | 385,851 | 385,851 | ||||||||||||||||||
| 34,954 | 09/15/21 | 1.381%(S) | 3 Month LIBOR(2)(Q) | (71,869 | ) | 155,969 | 227,838 | |||||||||||||||||
| 22,925 | 09/15/21 | 1.480%(S) | 3 Month LIBOR(2)(Q) | 21,841 | 141,282 | 119,441 | ||||||||||||||||||
| 43,040 | 09/15/21 | 1.604%(S) | 3 Month LIBOR(2)(Q) | 72,391 | 353,919 | 281,528 | ||||||||||||||||||
| 14,910 | 03/29/24 | 1.949%(A) | 1 Day USOIS(1)(A) | — | (743,431 | ) | (743,431 | ) | ||||||||||||||||
| 20,405 | 08/15/24 | 2.170%(S) | 3 Month LIBOR(1)(Q) | (6,490 | ) | (1,092,176 | ) | (1,085,686 | ) | |||||||||||||||
| 8,110 | 11/15/24 | 2.334%(S) | 3 Month LIBOR(1)(Q) | 21,190 | (565,856 | ) | (587,046 | ) | ||||||||||||||||
| 6,650 | 02/12/25 | 2.408%(A) | 1 Day USOIS(1)(A) | — | (553,399 | ) | (553,399 | ) | ||||||||||||||||
| 590 | 02/28/25 | 2.454%(A) | 1 Day USOIS(1)(A) | — | (53,023 | ) | (53,023 | ) | ||||||||||||||||
| 3,684 | 05/31/25 | 2.998%(S) | 3 Month LIBOR(1)(Q) | (2,549 | ) | (395,254 | ) | (392,705 | ) | |||||||||||||||
| 1,905 | 07/31/25 | 2.802%(A) | 1 Day USOIS(1)(A) | — | (223,150 | ) | (223,150 | ) | ||||||||||||||||
| 1,780 | 07/31/25 | 3.105%(S) | 3 Month LIBOR(1)(Q) | 1,404 | (203,460 | ) | (204,864 | ) | ||||||||||||||||
| 8,016 | 07/31/25 | 3.109%(S) | 3 Month LIBOR(1)(Q) | 501 | (918,167 | ) | (918,668 | ) | ||||||||||||||||
| 4,004 | 01/31/26 | 2.269%(A) | 1 Day USOIS(1)(A) | (11,528 | ) | (360,918 | ) | (349,390 | ) | |||||||||||||||
| 4,745 | 02/15/27 | 1.824%(A) | 1 Day USOIS(1)(A) | 53,761 | (344,318 | ) | (398,079 | ) | ||||||||||||||||
| 1,575 | 02/15/27 | 1.899%(A) | 1 Day USOIS(1)(A) | 1,997 | (122,449 | ) | (124,446 | ) | ||||||||||||||||
| 795 | 02/15/27 | 1.965%(A) | 1 Day USOIS(1)(A) | — | (65,424 | ) | (65,424 | ) | ||||||||||||||||
| 2,625 | 02/15/27 | 2.067%(A) | 1 Day USOIS(1)(A) | (1,635 | ) | (234,680 | ) | (233,045 | ) | |||||||||||||||
| 14,338 | 08/15/28 | 2.579%(A) | 1 Day USOIS(1)(A) | (216,192 | ) | (2,165,457 | ) | (1,949,265 | ) | |||||||||||||||
| 6,394 | 08/15/28 | 2.835%(S) | 3 Month LIBOR(1)(Q) | (28,425 | ) | (936,382 | ) | (907,957 | ) | |||||||||||||||
| 705 | 08/15/29 | 1.611%(A) | 1 Day USOIS(1)(A) | 184 | (49,855 | ) | (50,039 | ) | ||||||||||||||||
| 145 | 11/15/43 | 2.659%(S) | 3 Month LIBOR(1)(Q) | — | (43,575 | ) | (43,575 | ) | ||||||||||||||||
See Notes to Financial Statements.
| PGIM Government Income Fund | 31 |
Schedule of Investments (continued)
as of February 29, 2020
Interest rate swap agreements outstanding at February 29, 2020 (continued):
Notional | Termination Date | Fixed Rate | Floating Rate | Value at Trade Date | Value at February 29, 2020 | Unrealized Appreciation (Depreciation) | ||||||||||||||||||
Centrally Cleared Interest Rate Swap Agreements (cont’d.): | ||||||||||||||||||||||||
| 1,555 | 11/15/45 | 1.253%(A) | 1 Day USOIS(1)(A) | $ | (8,175 | ) | $ | (71,317 | ) | $ | (63,142 | ) | ||||||||||||
| 1,360 | 08/09/49 | 1.508%(A) | 1 Day USOIS(1)(A) | — | (155,990 | ) | (155,990 | ) | ||||||||||||||||
|
|
|
|
|
| |||||||||||||||||||
| $ | (175,888 | ) | $ | (8,158,513 | ) | $ | (7,982,625 | ) | ||||||||||||||||
|
|
|
|
|
| |||||||||||||||||||
| (1) | The Fund pays the fixed rate and receives the floating rate. |
| (2) | The Fund pays the floating rate and receives the fixed rate. |
Summary of Collateral for Centrally Cleared/Exchange-traded Derivatives:
Cash and securities segregated as collateral, including pending settlement for closed positions, to cover requirements for centrally cleared/exchange-traded derivatives are listed by broker as follows:
Broker | Cash and/or Foreign Currency | Securities Market Value | ||||||
Citigroup Global Markets, Inc. | $ | — | $ | 5,227,747 | ||||
|
|
|
| |||||
Fair Value Measurements:
Various inputs are used in determining the value of the Fund’s investments. These inputs are summarized in the three broad levels listed below.
Level 1—unadjusted quoted prices generally in active markets for identical securities.
Level 2—quoted prices for similar securities, interest rates and yield curves, prepayment speeds, foreign currency exchange rates and other observable inputs.
Level 3—unobservable inputs for securities valued in accordance with Board approved fair valuation procedures.
The following is a summary of the inputs used as of February 29, 2020 in valuing such portfolio securities:
| Level 1 | Level 2 | Level 3 | ||||||||||
Investments in Securities | ||||||||||||
Assets | ||||||||||||
Asset-Backed Securities | ||||||||||||
Collateralized Loan Obligations | $ | — | $ | 17,775,194 | $ | — | ||||||
Commercial Mortgage-Backed Securities | — | 90,052,378 | — | |||||||||
Corporate Bonds | — | 6,447,657 | — | |||||||||
Residential Mortgage-Backed Securities | — | 238,167 | — | |||||||||
U.S. Government Agency Obligations | — | 182,341,806 | — | |||||||||
U.S. Treasury Obligations | — | 147,469,535 | — | |||||||||
Affiliated Mutual Fund | 7,704,655 | — | — | |||||||||
Options Purchased | 80,938 | 403,984 | — | |||||||||
|
|
|
|
|
| |||||||
Total | $ | 7,785,593 | $ | 444,728,721 | $ | — | ||||||
|
|
|
|
|
| |||||||
See Notes to Financial Statements.
| 32 |
| Level 1 | Level 2 | Level 3 | ||||||||||
Investments in Securities (continued) | ||||||||||||
Liabilities | ||||||||||||
Options Written | $ | (33,688 | ) | $ | — | $ | — | |||||
|
|
|
|
|
| |||||||
Other Financial Instruments* | ||||||||||||
Assets | ||||||||||||
Futures Contracts | $ | 2,485,569 | $ | — | $ | — | ||||||
Centrally Cleared Interest Rate Swap Agreements | — | 1,119,699 | — | |||||||||
|
|
|
|
|
| |||||||
Total | $ | 2,485,569 | $ | 1,119,699 | $ | — | ||||||
|
|
|
|
|
| |||||||
Liabilities | ||||||||||||
Futures Contracts | $ | (3,061,119 | ) | $ | — | $ | — | |||||
Centrally Cleared Interest Rate Swap Agreements | — | (9,102,324 | ) | — | ||||||||
|
|
|
|
|
| |||||||
Total | $ | (3,061,119 | ) | $ | (9,102,324 | ) | $ | — | ||||
|
|
|
|
|
| |||||||
| * | Other financial instruments are derivative instruments not reflected in the Schedule of Investments, such as futures, forwards and centrally cleared swap contracts, which are recorded at the unrealized appreciation (depreciation) on the instrument, and OTC swap contracts which are recorded at fair value. |
Industry Classification:
The industry classification of investments and liabilities in excess of other assets shown as a percentage of net assets as of February 29, 2020 were as follows (unaudited):
U.S. Government Agency Obligations | 40.7 | % | ||
U.S. Treasury Obligations | 33.0 | |||
Commercial Mortgage-Backed Securities | 20.1 | |||
Collateralized Loan Obligations | 4.0 | |||
Affiliated Mutual Fund | 1.7 | |||
Diversified Financial Services | 1.4 | |||
Options Purchased | 0.1 | |||
Residential Mortgage-Backed Securities | 0.1 | |||
|
| |||
| 101.1 | ||||
Options Written | (0.0 | )* | ||
Liabilities in excess of other assets | (1.1 | ) | ||
|
| |||
| 100.0 | % | |||
|
|
| * | Less than +/- 0.05% |
See Notes to Financial Statements.
| PGIM Government Income Fund | 33 |
Schedule of Investments (continued)
as of February 29, 2020
Effects of Derivative Instruments on the Financial Statements and Primary Underlying Risk Exposure:
The Fund invested in derivative instruments during the reporting period. The primary type of risk associated with these derivative instruments is interest rate contracts risk. See the Notes to Financial Statements for additional detail regarding these derivative instruments and their risks. The effect of such derivative instruments on the Fund’s financial position and financial performance as reflected in the Statement of Assets and Liabilities and Statement of Operations is presented in the summary below.
Fair values of derivative instruments as of February 29, 2020 as presented in the Statement of Assets and Liabilities:
Asset Derivatives | Liability Derivatives | |||||||||||
Derivatives not accounted | Statement of | Fair Value | Statement of | Fair Value | ||||||||
| Interest rate contracts | Due from/to broker—variation margin futures | $ | 2,485,569 | * | Due from/to broker—variation margin futures | $ | 3,061,119 | * | ||||
| Interest rate contracts | Due from/to broker—variation margin swaps | 1,119,699 | * | Due from/to broker—variation margin swaps | 9,102,324 | * | ||||||
| Interest rate contracts | Unaffiliated investments | 484,922 | Options written outstanding, at value | 33,688 | ||||||||
|
|
|
| |||||||||
| $ | 4,090,190 | $ | 12,197,131 | |||||||||
|
|
|
| |||||||||
| * | Includes cumulative appreciation (depreciation) as reported in the schedule of open futures and centrally cleared swap contracts. Only unsettled variation margin receivable (payable) is reported within the Statement of Assets and Liabilities. |
The effects of derivative instruments on the Statement of Operations for the year ended February 29, 2020 are as follows:
Amount of Realized Gain (Loss) on Derivatives Recognized in Income | ||||||||||||||||||||
Derivatives not accounted | Options Purchased(1) | Options Written | Futures | Forward Rate Agreements | Swaps | |||||||||||||||
Interest rate contracts | $ | (367,450 | ) | $ | 159,039 | $ | 3,103,790 | $ | (126,990 | ) | $ | (706,781 | ) | |||||||
|
|
|
|
|
|
|
|
|
| |||||||||||
| (1) | Included in net realized gain (loss) on investment transactions in the Statement of Operations. |
Change in Unrealized Appreciation (Depreciation) on Derivatives Recognized in Income | ||||||||||||||||||||
Derivatives not accounted | Options Purchased(2) | Options Written | Futures | Forward Rate Agreements | Swaps | |||||||||||||||
Interest rate contracts | $ | 110,235 | $ | 11,188 | $ | 7,097 | $ | 71,607 | $ | (8,518,207 | ) | |||||||||
|
|
|
|
|
|
|
|
|
| |||||||||||
| (2) | Included in net change in unrealized appreciation (depreciation) on investments in the Statement of Operations. |
See Notes to Financial Statements.
| 34 |
For the year ended February 29, 2020, the Fund’s average volume of derivative activities is as follows:
Options | Options Written(2) | Futures Contracts— Long Positions(2) | Futures Contracts— Short Positions(2) | |||||||||||
| $ | 64,155 | $ | 313,600 | $ | 156,955,727 | $ | 121,462,962 | |||||||
| Forward Rate Agreements(2) | Interest Rate Swap Agreements(2) | |||||
| $ | 23,500,000 | $ | 198,261,840 | |||
| (1) | Cost. |
| (2) | Notional Amount in USD. |
Financial Instruments/Transactions—Summary of Offsetting and Netting Arrangements:
The Fund invested in OTC derivatives during the reporting period that are either offset in accordance with current requirements or are subject to enforceable master netting arrangements or similar agreements that permit offsetting. The information about offsetting and related netting arrangements for OTC derivatives where the legal right to set-off exists is presented in the summary below.
Offsetting of OTC derivative assets and liabilities:
Counterparty | Gross Amounts of Recognized Assets(1) | Gross Amounts of Recognized Liabilities(1) | Net Amounts of Recognized Assets/ (Liabilities) | Collateral Pledged/ (Received)(2) | Net Amount | |||||||||||||||
Bank of America, N.A. | $ | 325,104 | $ | — | $ | 325,104 | $ | (270,992 | ) | $ | 54,112 | |||||||||
Barclays Bank PLC | 78,880 | — | 78,880 | — | 78,880 | |||||||||||||||
|
|
|
|
|
|
|
|
|
| |||||||||||
| $ | 403,984 | $ | — | $ | 403,984 | $ | (270,992 | ) | $ | 132,992 | ||||||||||
|
|
|
|
|
|
|
|
|
| |||||||||||
| (1) | Includes unrealized appreciation/(depreciation) on swaps and forwards, premiums paid/(received) on swap agreements and market value of purchased and written options, as represented on the Statement of Assets and Liabilities. |
| (2) | Collateral amount disclosed by the Fund is limited to the market value of financial instruments/transactions and the Fund’s OTC derivative exposure by counterparty. |
See Notes to Financial Statements.
| PGIM Government Income Fund | 35 |
Statement of Assets and Liabilities
as of February 29, 2020
Assets | ||||
Investments at value: | ||||
Unaffiliated investments (cost $415,418,236) | $ | 444,809,659 | ||
Affiliated investments (cost $7,704,655) | 7,704,655 | |||
Receivable for Fund shares sold | 5,896,997 | |||
Dividends and interest receivable | 1,493,910 | |||
Receivable for investments sold | 566,827 | |||
Prepaid expenses | 1,648 | |||
|
| |||
Total Assets | 460,473,696 | |||
|
| |||
Liabilities | ||||
Payable for investments purchased | 7,223,665 | |||
Payable for Fund shares reacquired | 3,514,284 | |||
Due to broker—variation margin futures | 883,285 | |||
Due to broker—variation margin swaps | 838,258 | |||
Accrued expenses and other liabilities | 188,487 | |||
Management fee payable | 138,396 | |||
Dividends payable | 81,696 | |||
Distribution fee payable | 60,802 | |||
Affiliated transfer agent fee payable | 45,899 | |||
Options written outstanding, at value (proceeds received $44,876) | 33,688 | |||
|
| |||
Total Liabilities | 13,008,460 | |||
|
| |||
Net Assets | $ | 447,465,236 | ||
|
| |||
Net assets were comprised of: | ||||
Common stock, at par | $ | 447,312 | ||
Paid-in capital in excess of par | 427,760,119 | |||
Total distributable earnings (loss) | 19,257,805 | |||
|
| |||
Net assets, February 29, 2020 | $ | 447,465,236 | ||
|
| |||
See Notes to Financial Statements.
| 36 |
Class A | ||||
Net asset value and redemption price per share, | $ | 10.01 | ||
Maximum sales charge (3.25% of offering price) | 0.34 | |||
|
| |||
Maximum offering price to public | $ | 10.35 | ||
|
| |||
Class B | ||||
Net asset value, offering price and redemption price per share, | ||||
($273,511 ÷ 27,276 shares of common stock issued and outstanding) | $ | 10.03 | ||
|
| |||
Class C | ||||
Net asset value, offering price and redemption price per share, | ||||
($7,768,145 ÷ 774,081 shares of common stock issued and outstanding) | $ | 10.04 | ||
|
| |||
Class R | ||||
Net asset value, offering price and redemption price per share, | ||||
($11,345,580 ÷ 1,131,464 shares of common stock issued and outstanding) | $ | 10.03 | ||
|
| |||
Class Z | ||||
Net asset value, offering price and redemption price per share, | ||||
($98,625,382 ÷ 9,871,664 shares of common stock issued and outstanding) | $ | 9.99 | ||
|
| |||
Class R6 | ||||
Net asset value, offering price and redemption price per share, | ||||
($70,583,805 ÷ 7,069,257 shares of common stock issued and outstanding) | $ | 9.98 | ||
|
| |||
See Notes to Financial Statements.
| PGIM Government Income Fund | 37 |
Statement of Operations
Year Ended February 29, 2020
Net Investment Income (Loss) | ||||
Income | ||||
Interest income | $ | 11,127,130 | ||
Affiliated dividend income | 221,289 | |||
|
| |||
Total income | 11,348,419 | |||
|
| |||
Expenses | ||||
Management fee | 2,056,427 | |||
Distribution fee(a) | 806,378 | |||
Transfer agent’s fees and expenses (including affiliated expense of $ 258,507)(a) | 734,136 | |||
Custodian and accounting fees | 154,271 | |||
Registration fees(a) | 91,104 | |||
Shareholders’ reports | 51,314 | |||
Audit fee | 37,350 | |||
Legal fees and expenses | 21,324 | |||
Directors’ fees | 17,106 | |||
Miscellaneous | 23,037 | |||
|
| |||
Total expenses | 3,992,447 | |||
Less: Fee waiver and/or expense reimbursement(a) | (87,848 | ) | ||
Distribution fee waiver(a) | (28,597 | ) | ||
|
| |||
Net expenses | 3,876,002 | |||
|
| |||
Net investment income (loss) | 7,472,417 | |||
|
| |||
Realized And Unrealized Gain (Loss) On Investments | ||||
Net realized gain (loss) on: | ||||
Investment transactions | 6,189,053 | |||
Futures transactions | 3,103,790 | |||
Forward rate agreement transactions | (126,990 | ) | ||
Options written transactions | 159,039 | |||
Swap agreement transactions | (706,781 | ) | ||
|
| |||
| 8,618,111 | ||||
|
| |||
Net change in unrealized appreciation (depreciation) on: | ||||
Investments | 31,013,214 | |||
Futures | 7,097 | |||
Forward rate agreements | 71,607 | |||
Options written | 11,188 | |||
Swap agreements | (8,518,207 | ) | ||
|
| |||
| 22,584,899 | ||||
|
| |||
Net gain (loss) on investment transactions | 31,203,010 | |||
|
| |||
Net Increase (Decrease) In Net Assets Resulting From Operations | $ | 38,675,427 | ||
|
| |||
See Notes to Financial Statements.
| 38 |
| (a) | Class specific expenses and waivers were as follows: |
| Class A | Class B | Class C | Class R | Class Z | Class R6 | |||||||||||||||||||
Distribution fee | 638,621 | 4,415 | 77,552 | 85,790 | — | — | ||||||||||||||||||
Transfer agent’s fees and expenses | 592,265 | 5,473 | 11,168 | 18,203 | 106,249 | 778 | ||||||||||||||||||
Registration fees | 17,854 | 10,450 | 13,100 | 13,789 | 20,082 | 15,829 | ||||||||||||||||||
Fee waiver and/or expense reimbursement | (2,485 | ) | (13,894 | ) | (78 | ) | (109 | ) | (56,676 | ) | (14,606 | ) | ||||||||||||
Distribution fee waiver | — | — | — | (28,597 | ) | — | — | |||||||||||||||||
See Notes to Financial Statements.
| PGIM Government Income Fund | 39 |
Statements of Changes in Net Assets
| Year Ended February 28/29, | ||||||||
| 2020 | 2019 | |||||||
Increase (Decrease) in Net Assets | ||||||||
Operations | ||||||||
Net investment income (loss) | $ | 7,472,417 | $ | 7,179,445 | ||||
Net realized gain (loss) on investment transactions | 8,618,111 | (1,405,614 | ) | |||||
Net change in unrealized appreciation (depreciation) on investments | 22,584,899 | 4,488,970 | ||||||
|
|
|
| |||||
Net increase (decrease) in net assets resulting from operations | 38,675,427 | 10,262,801 | ||||||
|
|
|
| |||||
Dividends and Distributions | ||||||||
Distributions from distributable earnings | ||||||||
Class A | (5,213,881 | ) | (5,577,617 | ) | ||||
Class B | (4,955 | ) | (9,739 | ) | ||||
Class C | (94,145 | ) | (103,619 | ) | ||||
Class R | (200,302 | ) | (227,122 | ) | ||||
Class Z | (2,004,007 | ) | (1,468,927 | ) | ||||
Class R6 | (1,483,720 | ) | (1,218,966 | ) | ||||
|
|
|
| |||||
| (9,001,010 | ) | (8,605,990 | ) | |||||
|
|
|
| |||||
Fund share transactions (Net of share conversions) | ||||||||
Net proceeds from shares sold | 123,187,816 | 108,079,757 | ||||||
Net asset value of shares issued in reinvestment of dividends and distributions | 8,087,886 | 7,465,588 | ||||||
Cost of shares reacquired | (115,168,912 | ) | (144,980,376 | ) | ||||
|
|
|
| |||||
Net increase (decrease) in net assets from Fund share transactions | 16,106,790 | (29,435,031 | ) | |||||
|
|
|
| |||||
Total increase (decrease) | 45,781,207 | (27,778,220 | ) | |||||
Net Assets: | ||||||||
Beginning of year | 401,684,029 | 429,462,249 | ||||||
|
|
|
| |||||
End of year | $ | 447,465,236 | $ | 401,684,029 | ||||
|
|
|
| |||||
See Notes to Financial Statements.
| 40 |
Notes to Financial Statements
Prudential Investment Portfolios, Inc. 14 (the “Company”) is registered under the Investment Company Act of 1940, as amended (“1940 Act”), as a diversified, open-end management investment company. The Company consists of two funds: PGIM Government Income Fund and PGIM Floating Rate Income Fund. These financial statements relate only to the PGIM Government Income Fund (the “Fund’).
The investment objective of the Fund is to seek high current return.
1. Accounting Policies
The Fund follows the investment company accounting and reporting guidance of the Financial Accounting Standards Board (“FASB”) Accounting Standard Codification (“ASC”) Topic 946 Financial Services—Investment Companies. The following accounting policies conform to U.S. generally accepted accounting principles. The Fund consistently follows such policies in the preparation of its financial statements.
Securities Valuation: The Fund holds securities and other assets and liabilities that are fair valued at the close of each day (generally, 4:00 PM Eastern time) the New York Stock Exchange (“NYSE”) is open for trading. Fair value is the price that would be received to sell an asset or paid to transfer a liability in an orderly transaction between market participants on the measurement date. The Company’s Board of Directors (the “Board”) has adopted valuation procedures for security valuation under which fair valuation responsibilities have been delegated to PGIM Investments LLC (“PGIM Investments” or the “Manager”). Pursuant to the Board’s delegation, the Manager has established a Valuation Committee responsible for supervising the fair valuation of portfolio securities and other assets and liabilities. The valuation procedures permit the Fund to utilize independent pricing vendor services, quotations from market makers, and alternative valuation methods when market quotations are either not readily available or not deemed representative of fair value. A record of the Valuation Committee’s actions is subject to the Board’s review, approval, and ratification at its next regularly scheduled quarterly meeting.
For the fiscal reporting year-end, securities and other assets and liabilities were fair valued at the close of the last U.S. business day. Trading in certain foreign securities may occur when the NYSE is closed (including weekends and holidays). Because such foreign securities trade in markets that are open on weekends and U.S. holidays, the values of some of the Fund’s foreign investments may change on days when investors cannot purchase or redeem Fund shares.
Various inputs determine how the Fund’s investments are valued, all of which are categorized according to the three broad levels (Level 1, 2, or 3) detailed in the Schedule of
| PGIM Government Income Fund | 41 |
Notes to Financial Statements (continued)
Investments and referred to herein as the “fair value hierarchy” in accordance with FASB ASC Topic 820—Fair Value Measurements and Disclosures.
Derivative instruments, such as futures or options, that are traded on a national securities exchange are valued at the last sale price as of the close of trading on the applicable exchange where the security principally trades. Securities traded via NASDAQ are valued at the NASDAQ official closing price. To the extent these securities are valued at the last sale price or NASDAQ official closing price, they are classified as Level 1 in the fair value hierarchy. In the event that no sale or official closing price on valuation date exists, these securities are generally valued at the mean between the last reported bid and ask prices, or at the last bid price in the absence of an ask price. These securities are classified as Level 2 in the fair value hierarchy.
Investments in open-end, non-exchange-traded mutual funds are valued at their net asset values as of the close of the NYSE on the date of valuation. These securities are classified as Level 1 in the fair value hierarchy since they may be purchased or sold at their net asset values on the date of valuation.
Fixed income securities traded in the OTC market are generally classified as Level 2 in the fair value hierarchy. Such fixed income securities are typically valued using the market approach which generally involves obtaining data from an approved independent third-party vendor source. The Fund utilizes the market approach as the primary method to value securities when market prices of identical or comparable instruments are available. The third-party vendors’ valuation techniques used to derive the evaluated bid price are based on evaluating observable inputs, including but not limited to, yield curves, yield spreads, credit ratings, deal terms, tranche level attributes, default rates, cash flows, prepayment speeds, broker/dealer quotations and reported trades. Certain Level 3 securities are also valued using the market approach when obtaining a single broker quote or when utilizing transaction prices for identical securities that have been used in excess of five business days. During the reporting period, there were no changes to report with respect to the valuation approach and/or valuation techniques discussed above.
Securities and other assets that cannot be priced according to the methods described above are valued based on pricing methodologies approved by the Board. In the event that unobservable inputs are used when determining such valuations, the securities will be classified as Level 3 in the fair value hierarchy.
When determining the fair value of securities, some of the factors influencing the valuation include: the nature of any restrictions on disposition of the securities; assessment of the general liquidity of the securities; the issuer’s financial condition and the markets in which it does business; the cost of the investment; the size of the holding and the capitalization of
| 42 |
the issuer; the prices of any recent transactions or bids/offers for such securities or any comparable securities; any available analyst media or other reports or information deemed reliable by the Manager regarding the issuer or the markets or industry in which it operates. Using fair value to price securities may result in a value that is different from a security’s most recent closing price and from the price used by other unaffiliated mutual funds to calculate their net asset values.
Illiquid Securities: Pursuant to Rule 22e-4 under the 1940 Act, the Fund has adopted a Board approved Liquidity Risk Management Program (“LRMP”) that requires, among other things, that the Fund limit its illiquid investments that are assets to no more than 15% of net assets. Illiquid securities are those that, because of the absence of a readily available market or due to legal or contractual restrictions on resale, may not reasonably be expected to be sold or disposed of in current market conditions in seven calendar days or less without the sale or disposition significantly changing the market value of the investment. The Fund may find it difficult to sell illiquid securities at the time considered most advantageous by its subadviser(s) and may incur transaction costs that would not be incurred in the sale of securities that were freely marketable.
Restricted Securities: Securities acquired in unregistered, private sales from the issuing company or from an affiliate of the issuer are considered restricted as to disposition under federal securities law (“restricted securities”). Such restricted securities are valued pursuant to the valuation procedures noted above. Restricted securities that would otherwise be considered illiquid investments pursuant to the Fund’s LRMP because of legal restrictions on resale to the general public may be traded among qualified institutional buyers under Rule 144A of the Securities Act of 1933. Therefore, these Rule 144A securities, as well as commercial paper that is sold in private placements under Section 4(2) of the Securities Act of 1933, may be classified higher than “illiquid” under the LRMP (i.e. “moderately liquid” or “less liquid” investments). However, the liquidity of the Fund’s investments in restricted securities could be impaired if trading does not develop or declines.
Options: The Fund purchased or wrote options in order to hedge against adverse market movements or fluctuations in value caused by changes in prevailing interest rates, value of equities or foreign currency exchange rates with respect to securities or financial instruments which the Fund currently owns or intends to purchase. The Fund may also use options to gain additional market exposure. The Fund’s principal reason for writing options is to realize, through receipt of premiums, a greater current return than would be realized on the underlying security alone. When the Fund purchases an option, it pays a premium and an amount equal to that premium is recorded as an asset. When the Fund writes an option, it receives a premium and an amount equal to that premium is recorded as a liability. The asset or liability is adjusted daily to reflect the current market value of the option. If an option expires unexercised, the Fund realizes a gain (loss) to the extent of the premium received or paid. If an option is exercised, the premium received or paid is recorded as an adjustment to the proceeds from the sale or the cost of the purchase in determining whether the Fund has realized a gain (loss). The difference between the premium and the amount received or paid at the closing of a purchase or sale transaction is also treated as a realized gain (loss). Gain
| PGIM Government Income Fund | 43 |
Notes to Financial Statements (continued)
(loss) on purchased options is included in net realized gain (loss) on investment transactions. Gain (loss) on written options is presented separately as net realized gain (loss) on options written transactions.
The Fund, as writer of an option, may have no control over whether the underlying securities or financial instruments may be sold (called) or purchased (put). As a result, the Fund bears the market risk of an unfavorable change in the price of the security or financial instrument underlying the written option. The Fund, as purchaser of an OTC option, bears the risk of the potential inability of the counterparties to meet the terms of their contracts. With exchange-traded options contracts, there is minimal counterparty credit risk to the Fund since the exchanges’ clearinghouse acts as counterparty to all exchange-traded options and guarantees the options contracts against default.
When the Fund writes an option on a swap, an amount equal to any premium received by the Fund is recorded as a liability and is subsequently adjusted to the current market value of the written option on the swap. If a call option on a swap is exercised, the Fund becomes obligated to pay a fixed interest rate (noted as the strike price) and receive a variable interest rate on a notional amount. If a put option on a swap is exercised, the Fund becomes obligated to pay a variable interest rate and receive a fixed interest rate (noted as the strike price) on a notional amount. Premiums received from writing options on swaps that expire or are exercised are treated as realized gains upon the expiration or exercise of such options on swaps. The risk associated with writing put and call options on swaps is that the Fund will be obligated to be party to a swap agreement if an option on a swap is exercised.
Financial Futures Contracts: A financial futures contract is an agreement to purchase (long) or sell (short) an agreed amount of securities at a set price for delivery on a future date. Upon entering into a financial futures contract, the Fund is required to pledge to the broker an amount of cash and/or other assets equal to a certain percentage of the contract amount. This amount is known as the “initial margin.” Subsequent payments, known as “variation margin,” are made or received by the Fund each day, depending on the daily fluctuations in the value of the underlying security. Such variation margin is recorded for financial statement purposes on a daily basis as unrealized gain (loss). When the contract expires or is closed, the gain (loss) is realized and is presented in the Statement of Operations as net realized gain (loss) on futures transactions.
The Fund invested in financial futures contracts in order to hedge its existing portfolio securities, or securities the Fund intends to purchase, against fluctuations in value caused by changes in prevailing interest rates. Should interest rates move unexpectedly, the Fund may not achieve the anticipated benefits of the financial futures contracts and may realize a loss. The use of futures transactions involves the risk of imperfect correlation in movements in the price of futures contracts, interest rates and the underlying hedged assets. Since
| 44 |
futures contracts are exchange-traded, there is minimal counterparty credit risk to the Fund since the exchanges’ clearinghouse acts as counterparty to all exchange-traded futures and guarantees the futures contracts against default.
Forward Rate Agreements: Forward rate agreements represent an agreement between counterparties to exchange cash flows based on the difference between two interest rates, applied to a notional principal amount on a fixed future date. The Fund entered into forward rate agreements to gain yield exposure based on anticipated market conditions at the specified termination date of the agreement.
Swap Agreements: The Fund entered into certain types of swap agreements detailed in the disclosures below. A swap agreement is an agreement to exchange the return generated by one instrument for the return generated by another instrument. Swap agreements are negotiated in the OTC market and may be executed either directly with a counterparty (“OTC-traded”) or through a central clearing facility, such as a registered exchange. Swap agreements are valued daily at current market value and any change in value is included in the net unrealized appreciation (depreciation) on swap agreements. Centrally cleared swaps pay or receive an amount known as “variation margin”, based on daily changes in the valuation of the swap contract. For OTC-traded, upfront premiums paid and received are shown as swap premiums paid and swap premiums received in the Statement of Assets and Liabilities. Risk of loss may exceed amounts recognized on the Statement of Assets and Liabilities. Swap agreements outstanding at period end, if any, are listed on the Schedule of Investments.
Interest Rate Swaps: Interest rate swaps represent an agreement between counterparties to exchange cash flows based on the difference between two interest rates, applied to a notional principal amount for a specified period. The Fund is subject to interest rate risk exposure in the normal course of pursuing its investment objective. The Fund used interest rate swaps to maintain its ability to generate steady cash flow by receiving a stream of fixed rate payments or to increase exposure to prevailing market rates by receiving floating rate payments. The Fund’s maximum risk of loss from counterparty credit risk is the discounted net present value of the cash flows to be received from the counterparty over the contract’s remaining life.
Master Netting Arrangements: The Fund is subject to various Master Agreements, or netting arrangements, with select counterparties. These are agreements which a subadviser may have negotiated and entered into on behalf of all or a portion of the Fund. A master netting arrangement between the Fund and the counterparty permits the Fund to offset amounts payable by the Fund to the same counterparty against amounts to be received; and by the receipt of collateral from the counterparty by the Fund to cover the Fund’s exposure to the counterparty. However, there is no assurance that such mitigating factors are easily enforceable. In addition to master netting arrangements, the right to set-off exists when all the conditions are met such that each of the parties owes the other determinable amounts, the reporting party has the right to set-off the amount owed with the amount owed by the other party, the reporting party intends to set-off and the right of set-off is enforceable by law.
| PGIM Government Income Fund | 45 |
Notes to Financial Statements (continued)
During the reporting period, there was no intention to settle on a net basis and all amounts are presented on a gross basis on the Statement of Assets and Liabilities.
The Company, on behalf of the Fund, is a party to International Swaps and Derivatives Association, Inc. (“ISDA”) Master Agreements with certain counterparties that govern OTC derivative and foreign exchange contracts entered into from time to time. The Master Agreements may contain provisions regarding, among other things, the parties’ general obligations, representations, agreements, collateral requirements, events of default and early termination. With respect to certain counterparties, in accordance with the terms of the Master Agreements, collateral posted to the Fund is held in a segregated account by the Fund’s custodian and with respect to those amounts which can be sold or re-pledged, is presented in the Schedule of Investments. Collateral pledged by the Fund is segregated by the Fund’s custodian and identified in the Schedule of Investments. Collateral can be in the form of cash or debt securities issued by the U.S. Government or related agencies or other securities as agreed to by the Fund and the applicable counterparty. Collateral requirements are determined based on the Fund’s net position with each counterparty. Termination events applicable to the Fund may occur upon a decline in the Fund’s net assets below a specified threshold over a certain period of time. Termination events applicable to counterparties may occur upon a decline in the counterparty’s long-term and short-term credit ratings below a specified level. In each case, upon occurrence, the other party may elect to terminate early and cause settlement of all derivative and foreign exchange contracts outstanding, including the payment of any losses and costs resulting from such early termination, as reasonably determined by the terminating party. Any decision by one or more of the Fund’s counterparties to elect early termination could impact the Fund’s future derivative activity.
In addition to each instrument’s primary underlying risk exposure (e.g. interest rate, credit, equity or foreign exchange, etc.), swap agreements involve, to varying degrees, elements of credit, market and documentation risk. Such risks involve the possibility that no liquid market for these agreements will exist, the counterparty to the agreement may default on its obligation to perform or disagree on the contractual terms of the agreement, and changes in net interest rates will be unfavorable. In connection with these agreements, securities in the portfolio may be identified or received as collateral from the counterparty in accordance with the terms of the respective swap agreements to provide or receive assets of value and to serve as recourse in the event of default or bankruptcy/insolvency of either party. Such OTC derivative agreements include conditions which, when materialized, give the counterparty the right to cause an early termination of the transactions under those agreements. Any election by the counterparty for early termination of the contract(s) may impact the amounts reported on financial statements.
As of February 29, 2020, the Fund has not met conditions under such agreements which give the counterparty the right to call for an early termination.
| 46 |
Forward currency contracts, forward rate agreements, written options, short sales, swaps and financial futures contracts involve elements of both market and credit risk in excess of the amounts reflected on the Statement of Assets and Liabilities. Such risks may be mitigated by engaging in master netting arrangements.
Delayed-Delivery Transactions: The Fund purchased or sold securities on a when-issued or delayed-delivery and forward commitment basis. These transactions involve a commitment by the Fund to purchase or sell securities for a predetermined price or yield, with payment and delivery taking place beyond the customary settlement period. When delayed-delivery purchases are outstanding, the Fund will set aside and maintain an amount of liquid assets sufficient to meet the purchase price in a segregated account until the settlement date. When purchasing a security on a delayed-delivery basis, the Fund assumes the rights and risks of ownership of the security, including the risk of price and yield fluctuations, and takes such fluctuations into account when determining its net asset value. The Fund may dispose of or renegotiate a delayed-delivery transaction subsequent to establishment, and may sell when-issued securities before they are delivered, which may result in a realized gain (loss). When selling a security on a delayed-delivery basis, the Fund forfeits its eligibility to realize future gains (losses) with respect to the security.
Mortgage Dollar Rolls: The Fund entered into mortgage dollar rolls in which the Fund sells mortgage securities for delivery in the current month, realizing a gain (loss), and simultaneously enter into contracts to repurchase somewhat similar (same type, coupon and maturity) securities on a specified future date. During the roll period, the Fund forgoes principal and interest paid on the securities. The Fund is compensated by the interest earned on the cash proceeds of the initial sale and by the lower repurchase price at the future date. The difference between the sale proceeds and the lower repurchase price is recorded as a realized gain on investment transactions. The Fund maintains a segregated account, the dollar value of which is at least equal to its obligations, with respect to dollar rolls. The Fund is subject to the risk that the market value of the securities the Fund is obligated to repurchase under the agreement may decline below the repurchase price.
Securities Transactions and Net Investment Income: Securities transactions are recorded on the trade date. Realized gains (losses) from investment and currency transactions are calculated on the specific identification method. Dividend income is recorded on the ex-date, or for certain foreign securities, when the Fund becomes aware of such dividends. Interest income, including amortization of premium and accretion of discount on debt securities, as required, is recorded on the accrual basis. Expenses are recorded on an accrual basis, which may require the use of certain estimates by management that may differ from actual. Net investment income or loss (other than class specific expenses and waivers, which are allocated as noted below) and unrealized and realized gains (losses) are allocated daily to each class of shares based upon the relative proportion of adjusted net assets of each class at the beginning of the day. Class specific expenses and waivers, where applicable, are charged to the respective share classes. Class specific expenses include
| PGIM Government Income Fund | 47 |
Notes to Financial Statements (continued)
distribution fees and distribution fee waivers, shareholder servicing fees, transfer agent’s fees and expenses, registration fees and fee waivers and/or expense reimbursements, as applicable.
Taxes: It is the Fund’s policy to continue to meet the requirements of the Internal Revenue Code applicable to regulated investment companies and to distribute all of its taxable net investment income and capital gains, if any, to its shareholders. Therefore, no federal income tax provision is required. Withholding taxes on foreign dividends, interest and capital gains, if any, are recorded, net of reclaimable amounts, at the time the related income is earned.
Dividends and Distributions: The Fund expects to declare dividends of its net investment income daily and pay such dividends monthly. Distributions of net realized capital and currency gains, if any, are declared and paid at least annually. Dividends and distributions to shareholders, which are determined in accordance with federal income tax regulations and which may differ from generally accepted accounting principles, are recorded on the ex-date. Permanent book/tax differences relating to income and gain (loss) are reclassified between total distributable earnings (loss) and paid-in capital in excess of par, as appropriate.
Estimates: The preparation of financial statements requires management to make estimates and assumptions that affect the reported amounts and disclosures in the financial statements. Actual results could differ from those estimates.
2. Agreements
The Fund has a management agreement with the Manager. Pursuant to this agreement, the Manager has responsibility for all investment advisory services and supervises the subadviser’s performance of such services. In addition, under the management agreement, the Manager provides all of the administrative functions necessary for the organization, operation and management of the Fund. The Manager administers the corporate affairs of the Fund and, in connection therewith, furnishes the Fund with office facilities, together with those ordinary clerical and bookkeeping services which are not being furnished by the Fund’s custodian and the Fund’s transfer agent. The Manager is also responsible for the staffing and management of dedicated groups of legal, marketing, compliance and related personnel necessary for the operation of the Fund. The legal, marketing, compliance and related personnel are also responsible for the management and oversight of the various service providers to the Fund, including, but not limited to, the custodian, transfer agent, and accounting agent.
| 48 |
The Manager has entered into a subadvisory agreement with PGIM, Inc., which provides subadvisory services to the Fund through its PGIM Fixed Income unit. The subadvisory agreement provides that PGIM, Inc. will furnish investment advisory services in connection with the management of the Fund. In connection therewith, PGIM, Inc. is obligated to keep certain books and records of the Fund. The Manager pays for the services of PGIM, Inc., the cost of compensation of officers of the Fund, occupancy and certain clerical and bookkeeping costs of the Fund. The Fund bears all other costs and expenses.
Effective December 13, 2019, the management fee paid to the Manager is accrued daily and payable monthly at an annual rate of 0.47% of the Fund’s average daily net assets up to and including $1 billion, 0.42% of the Fund’s average daily net assets of the next $1 billion, 0.32% of the Fund’s average daily net assets of the next $1 billion, and 0.27% of the average daily net assets in excess of $3 billion. Prior to December 13, 2019, the management fee paid to the Manager was accrued daily and payable monthly at an annual rate of 0.50% of the Fund’s average daily net assets up to and including $1 billion, 0.45% of the Fund’s average daily net assets of the next $1 billion, 0.35% of the Fund’s average daily net assets of the next $1 billion, and 0.30% of the average daily net assets in excess of $3 billion. The effective management fee rate before any waivers and/or expense reimbursements was 0.49% for the year ended February 29, 2020.
Effective December 1, 2019, the Manager has contractually agreed, through June 30, 2021, to limit total annual fund operating expenses, after fee waivers and/or expense reimbursements to 2.03% of average daily net assets for Class B shares, 0.48% of average daily net assets for Class Z shares and 0.47% of average daily net assets for Class R6 shares. Prior to December 1, 2019, the Manager had contractually agreed to limit total annual fund operating expenses, after fee waivers and/or expense reimbursements to 2.03% of average daily net assets for Class B shares. This contractual expense limitation excludes interest, brokerage, taxes (such as income and foreign withholding taxes, stamp duty and deferred tax expenses), acquired fund fees and expenses, extraordinary expenses, and certain other Fund expenses such as dividend and interest expense and broker charges on short sales.
Where applicable, the Manager agrees to waive management fees or shared operating expenses on any share class to the same extent that it waives similar expenses on any other share class and, in addition, total annual operating expenses for Class R6 shares will not exceed total annual operating expenses for Class Z shares. Fees and/or expenses waived and/or reimbursed by the Manager may be recouped by PGIM Investments within the same fiscal year during which such waiver and/or reimbursement is made if such recoupment can be realized without exceeding the expense limit in effect at the time of the recoupment for that fiscal year.
The Company, on behalf of the Fund, has a distribution agreement with Prudential Investment Management Services LLC (“PIMS”), which acts as the distributor of the Class A, Class B, Class C, Class R, Class Z and Class R6 shares of the Fund. The Fund compensates PIMS for distributing and servicing the Fund’s Class A, Class B, Class C and Class R shares, pursuant to the plans of distribution (the “Distribution Plans”), regardless of
| PGIM Government Income Fund | 49 |
Notes to Financial Statements (continued)
expenses actually incurred by PIMS. The distribution fees are accrued daily and payable monthly. No distribution or service fees are paid to PIMS as distributor of the Class Z or Class R6 shares of the Fund.
Pursuant to the Distribution Plans, the Fund compensates PIMS for distribution related activities at an annual rate of up to 0.25%, 1% and 0.75% of the average daily net assets of the Class A, Class C and Class R shares, respectively. PIMS has contractually agreed through June 30, 2021 to limit such expenses to 0.50% of the average daily net assets of the Class R shares.
Pursuant to the Class B Plan, the Fund compensates PIMS for distribution related activities at an annual rate of up to 1% of the average daily net assets of the Class B shares up to $3 billion, 0.80% of the next $1 billion of such assets and 0.50% of such assets in excess of $4 billion. The effective distribution fee rate for Class B was 1% for the year ended February 29, 2020.
For the year ended February 29, 2020, PIMS received $126,206 in front-end sales charges resulting from sales of Class A shares. Additionally, for the year ended February 29, 2020, PIMS received $174, $473 and $1,461 in contingent deferred sales charges imposed upon redemptions by certain Class A, Class B and Class C shareholders. From these fees, PIMS paid such sales charges to broker-dealers, who in turn paid commissions to salespersons and incurred other distribution costs.
PGIM Investments, PGIM, Inc. and PIMS are indirect, wholly-owned subsidiaries of Prudential Financial, Inc. (“Prudential”).
3. Other Transactions with Affiliates
Prudential Mutual Fund Services LLC (“PMFS”), an affiliate of PGIM Investments and an indirect, wholly-owned subsidiary of Prudential, serves as the Company’s transfer agent. Transfer agent’s fees and expenses in the Statement of Operations include certain out-of-pocket expenses paid to non-affiliates, where applicable.
The Fund may invest its overnight sweep cash in the PGIM Core Ultra Short Bond Fund (the “Core Fund”), a series of Prudential Investment Portfolios 2, registered under the 1940 Act and managed by PGIM Investments. Through the Fund’s investments in the mentioned underlying funds, PGIM Investments and/or its affiliates are paid fees or reimbursed for providing their services. In addition to the realized and unrealized gains on investments in the Core Fund, earnings from such investments are disclosed on the Statement of Operations as “Affiliated dividend income”.
| 50 |
The Fund may enter into certain securities purchase or sale transactions under Board approved Rule 17a-7 procedures. Rule 17a-7 is an exemptive rule under the 1940 Act, that subject to certain conditions, permits purchase and sale transactions among affiliated investment companies, or between an investment company and a person that is affiliated solely by reason of having a common (or affiliated) investment adviser, common directors, and/or common officers. Pursuant to the Rule 17a-7 procedures and consistent with guidance issued by the Securities and Exchange Commission (“SEC”), the Company’s Chief Compliance Officer (“CCO”) prepares a quarterly summary of all such transactions for submission to the Board, together with the CCO’s written representation that all such 17a-7 transactions were effected in accordance with the Fund’s Rule 17a-7 procedures. For the year ended February 29, 2020, no 17a-7 transactions were entered into by the Fund.
4. Portfolio Securities
The aggregate cost of purchases and proceeds from sales of portfolio securities (excluding short-term investments and U.S. Government securities) for the year ended February 29, 2020, were $222,640,981 and $215,209,987, respectively.
A summary of the cost of purchases and proceeds from sales of shares of an affiliated investment for the year ended February 29, 2020, is presented as follows:
| Value, Beginning of Year | Cost of Purchases | Proceeds from Sales | Change in Unrealized Gain (Loss) | Realized Gain (Loss) | Value, End of Year | Shares, End of Year | Income | |||||||||||||||||||||||
PGIM Core Ultra Short Bond Fund* | ||||||||||||||||||||||||||||||
| $ | 5,030,408 | $ | 173,091,094 | $ | 170,416,847 | $ | — | $ | — | $ | 7,704,655 | 7,704,655 | $ | 221,289 | ||||||||||||||||
|
|
|
|
|
|
|
|
|
|
|
|
|
|
|
| |||||||||||||||
| * | The Fund did not have any capital gain distributions during the reporting period. |
5. Distributions and Tax Information
Distributions to shareholders, which are determined in accordance with federal income tax regulations and which may differ from generally accepted accounting principles, are recorded on the ex-date.
For the year ended February 29, 2020, the tax character of dividends paid by the Fund was $9,001,010 of ordinary income. For the year ended February 28, 2019, the tax character of dividends paid by the Fund was $8,605,990 of ordinary income.
As of February 29, 2020, the accumulated undistributed earnings on a tax basis was $603,281 of ordinary income.
| PGIM Government Income Fund | 51 |
Notes to Financial Statements (continued)
The United States federal income tax basis of the Fund’s investments and the net unrealized appreciation as of February 29, 2020 were as follows:
Tax Basis | Gross | Gross | Net | |||
| $424,075,552 | $28,995,508 | $(9,148,609) | $19,846,899 |
The difference between book basis and tax basis is primarily attributable to the difference in the treatment of amortization of premiums, deferred losses on wash sales, swaps and futures contracts.
For federal income tax purposes, the Fund had a capital loss carryforward as of February 29, 2020 of approximately $1,111,000 which can be carried forward for an unlimited period. The Fund utilized approximately $7,106,000 of its capital loss carryforward to offset net taxable gains realized in the fiscal year ended February 29, 2020. No capital gains distributions are expected to be paid to shareholders until net gains have been realized in excess of such losses.
The Manager has analyzed the Fund’s tax positions taken on federal, state and local income tax returns for all open tax years and has concluded that no provision for income tax is required in the Fund’s financial statements for the current reporting period. Since tax authorities can examine previously filed tax returns, the Fund’s U.S. federal and state tax returns for each of the four fiscal years up to the most recent fiscal year ended February 29, 2020 are subject to such review.
6. Capital and Ownership
The Fund offers Class A, Class B, Class C, Class R, Class Z and Class R6 shares. Class A shares are sold with a maximum front-end sales charge of 3.25%. Investors who purchase $1 million or more (prior to July 15, 2019, $500,000 or more on or after July 15, 2019) of Class A shares and sell those shares within 12 months of purchase are subject to a contingent deferred sales charge (“CDSC”) of 1.00% on sales although these purchases are not subject to a front-end sales charge. The Class A CDSC is waived for certain retirement and/or benefit plans. A special exchange privilege is also available for shareholders who qualified to purchase Class A shares at net asset value. Class B shares are sold with a CDSC which declines from 5% to zero depending on the period of time the shares are held. Class B shares will automatically convert to Class A shares on a monthly basis approximately seven years after purchase. Effective on or about June 26, 2020, all issued and outstanding Class B shares will be automatically converted to Class A shares. Class B shares are closed to new purchases. Class C shares are sold with a CDSC of 1% on sales made within 12 months of purchase. Class C shares will automatically convert to Class A shares on a
| 52 |
monthly basis approximately 10 years after purchase. Class R shares are available to certain retirement plans, clearing and settlement firms. Class R, Class Z and Class R6 shares are not subject to any sales or redemption charges and are available exclusively for sale to a limited group of investors.
Under certain circumstances, an exchange may be made from specified share classes of the Fund to one or more other share classes of the Fund as presented in the table of transactions in shares of common stock.
The Company is authorized to issue 2.5 billion shares of common stock, $0.01 par value per share, designated as shares of the Fund. The shares are further classified and designated as follows:
Class A | 230,000,000 | |||
Class B | 5,000,000 | |||
Class C | 495,000,000 | |||
Class R | 500,000,000 | |||
Class Z | 500,000,000 | |||
Class T | 270,000,000 | |||
Class R6 | 500,000,000 |
The Fund currently does not have any Class T shares outstanding.
As of February 29, 2020, Prudential, through its affiliated entities, including affiliated funds (if applicable), owned shares of the Fund as follows:
| Number of Shares | Percentage of Outstanding Shares | |||||||
Class A | 14,319 | — | %* | |||||
Class R | 836,191 | 74 | % | |||||
Class Z | 2,534 | — | %* | |||||
| * | Amount represents less than 1% of outstanding shares. |
At reporting period end, the number of shareholders holding greater than 5% of the Fund are as follows:
| Affiliated | Unaffiliated | |||||
| Number of Shareholders | Percentage of Outstanding Shares | Number of Shareholders | Percentage of Outstanding Shares | |||
| — | —% | 5 | 52% | |||
| PGIM Government Income Fund | 53 |
Notes to Financial Statements (continued)
Transactions in shares of common stock were as follows:
Class A | Shares | Amount | ||||||
Year ended February 29, 2020: | ||||||||
Shares sold | 3,235,426 | $ | 31,419,676 | |||||
Shares issued in reinvestment of dividends and distributions | 455,748 | 4,414,191 | ||||||
Shares reacquired | (5,517,649 | ) | (53,327,126 | ) | ||||
|
|
|
| |||||
Net increase (decrease) in shares outstanding before conversion | (1,826,475 | ) | (17,493,259 | ) | ||||
Shares issued upon conversion from other share class(es) | 282,544 | 2,681,196 | ||||||
Shares reacquired upon conversion into other share class(es) | (81,855 | ) | (793,566 | ) | ||||
|
|
|
| |||||
Net increase (decrease) in shares outstanding | (1,625,786 | ) | $ | (15,605,629 | ) | |||
|
|
|
| |||||
Year ended February 28, 2019: | ||||||||
Shares sold | 4,108,082 | $ | 38,151,629 | |||||
Shares issued in reinvestment of dividends and distributions | 496,137 | 4,601,225 | ||||||
Shares reacquired | (8,211,919 | ) | (76,161,253 | ) | ||||
|
|
|
| |||||
Net increase (decrease) in shares outstanding before conversion | (3,607,700 | ) | (33,408,399 | ) | ||||
Shares issued upon conversion from other share class(es) | �� | 58,771 | 544,054 | |||||
Shares reacquired upon conversion into other share class(es) | (93,881 | ) | (870,450 | ) | ||||
|
|
|
| |||||
Net increase (decrease) in shares outstanding | (3,642,810 | ) | $ | (33,734,795 | ) | |||
|
|
|
| |||||
Class B | ||||||||
Year ended February 29, 2020: | ||||||||
Shares sold | 6,097 | $ | 59,572 | |||||
Shares issued in reinvestment of dividends and distributions | 470 | 4,536 | ||||||
Shares reacquired | (3,790 | ) | (36,580 | ) | ||||
|
|
|
| |||||
Net increase (decrease) in shares outstanding before conversion | 2,777 | 27,528 | ||||||
Shares reacquired upon conversion into other share class(es) | (54,898 | ) | (526,575 | ) | ||||
|
|
|
| |||||
Net increase (decrease) in shares outstanding | (52,121 | ) | $ | (499,047 | ) | |||
|
|
|
| |||||
Year ended February 28, 2019: | ||||||||
Shares sold | 14,505 | $ | 134,683 | |||||
Shares issued in reinvestment of dividends and distributions | 894 | 8,298 | ||||||
Shares reacquired | (16,981 | ) | (157,705 | ) | ||||
|
|
|
| |||||
Net increase (decrease) in shares outstanding before conversion | (1,582 | ) | (14,724 | ) | ||||
Shares reacquired upon conversion into other share class(es) | (47,283 | ) | (438,477 | ) | ||||
|
|
|
| |||||
Net increase (decrease) in shares outstanding | (48,865 | ) | $ | (453,201 | ) | |||
|
|
|
| |||||
| 54 |
Class C | Shares | Amount | ||||||
Year ended February 29, 2020: | ||||||||
Shares sold | 202,853 | $ | 1,961,582 | |||||
Shares issued in reinvestment of dividends and distributions | 9,428 | 91,520 | ||||||
Shares reacquired | (133,758 | ) | (1,293,981 | ) | ||||
|
|
|
| |||||
Net increase (decrease) in shares outstanding before conversion | 78,523 | 759,121 | ||||||
Shares reacquired upon conversion into other share class(es) | (232,547 | ) | (2,208,495 | ) | ||||
|
|
|
| |||||
Net increase (decrease) in shares outstanding | (154,024 | ) | $ | (1,449,374 | ) | |||
|
|
|
| |||||
Year ended February 28, 2019: | ||||||||
Shares sold | 267,001 | $ | 2,473,008 | |||||
Shares issued in reinvestment of dividends and distributions | 10,860 | 100,955 | ||||||
Shares reacquired | (306,309 | ) | (2,839,042 | ) | ||||
|
|
|
| |||||
Net increase (decrease) in shares outstanding before conversion | (28,448 | ) | (265,079 | ) | ||||
Shares reacquired upon conversion into other share class(es) | (10,554 | ) | (98,070 | ) | ||||
|
|
|
| |||||
Net increase (decrease) in shares outstanding | (39,002 | ) | $ | (363,149 | ) | |||
|
|
|
| |||||
Class R | ||||||||
Year ended February 29, 2020: | ||||||||
Shares sold | 179,411 | $ | 1,742,049 | |||||
Shares issued in reinvestment of dividends and distributions | 17,942 | 174,027 | ||||||
Shares reacquired | (371,562 | ) | (3,572,626 | ) | ||||
|
|
|
| |||||
Net increase (decrease) in shares outstanding | (174,209 | ) | $ | (1,656,550 | ) | |||
|
|
|
| |||||
Year ended February 28, 2019: | ||||||||
Shares sold | 316,852 | $ | 2,932,919 | |||||
Shares issued in reinvestment of dividends and distributions | 19,768 | 183,589 | ||||||
Shares reacquired | (505,798 | ) | (4,697,965 | ) | ||||
|
|
|
| |||||
Net increase (decrease) in shares outstanding | (169,178 | ) | $ | (1,581,457 | ) | |||
|
|
|
| |||||
Class Z | ||||||||
Year ended February 29, 2020: | ||||||||
Shares sold | 5,615,924 | $ | 54,132,059 | |||||
Shares issued in reinvestment of dividends and distributions | 199,558 | 1,931,996 | ||||||
Shares reacquired | (3,583,290 | ) | (34,443,691 | ) | ||||
|
|
|
| |||||
Net increase (decrease) in shares outstanding before conversion | 2,232,192 | 21,620,364 | ||||||
Shares issued upon conversion from other share class(es) | 83,261 | 805,747 | ||||||
Shares reacquired upon conversion into other share class(es) | (21 | ) | (192 | ) | ||||
|
|
|
| |||||
Net increase (decrease) in shares outstanding | 2,315,432 | $ | 22,425,919 | |||||
|
|
|
| |||||
Year ended February 28, 2019: | ||||||||
Shares sold | 4,457,367 | $ | 41,328,292 | |||||
Shares issued in reinvestment of dividends and distributions | 146,078 | 1,352,572 | ||||||
Shares reacquired | (5,147,532 | ) | (47,659,557 | ) | ||||
|
|
|
| |||||
Net increase (decrease) in shares outstanding before conversion | (544,087 | ) | (4,978,693 | ) | ||||
Shares issued upon conversion from other share class(es) | 99,840 | 923,837 | ||||||
Shares reacquired upon conversion into other share class(es) | (12,426 | ) | (114,881 | ) | ||||
|
|
|
| |||||
Net increase (decrease) in shares outstanding | (456,673 | ) | $ | (4,169,737 | ) | |||
|
|
|
| |||||
| PGIM Government Income Fund | 55 |
Notes to Financial Statements (continued)
Class R6 | Shares | Amount | ||||||
Year ended February 29, 2020: | ||||||||
Shares sold | 3,518,298 | $ | 33,872,878 | |||||
Shares issued in reinvestment of dividends and distributions | 152,207 | 1,471,616 | ||||||
Shares reacquired | (2,343,806 | ) | (22,494,908 | ) | ||||
|
|
|
| |||||
Net increase (decrease) in shares outstanding before conversion | 1,326,699 | 12,849,586 | ||||||
Shares issued upon conversion from other share class(es) | 4,324 | 41,885 | ||||||
|
|
|
| |||||
Net increase (decrease) in shares outstanding | 1,331,023 | $ | 12,891,471 | |||||
|
|
|
| |||||
Year ended February 28, 2019: | ||||||||
Shares sold | 2,498,180 | $ | 23,059,226 | |||||
Shares issued in reinvestment of dividends and distributions | 131,813 | 1,218,949 | ||||||
Shares reacquired | (1,458,613 | ) | (13,464,854 | ) | ||||
|
|
|
| |||||
Net increase (decrease) in shares outstanding before conversion | 1,171,380 | 10,813,321 | ||||||
Shares issued upon conversion from other share class(es) | 5,858 | 53,987 | ||||||
|
|
|
| |||||
Net increase (decrease) in shares outstanding | 1,177,238 | $ | 10,867,308 | |||||
|
|
|
| |||||
7. Borrowings
The Company, on behalf of the Fund, along with other affiliated registered investment companies (the “Funds”), is a party to a Syndicated Credit Agreement (“SCA”) with a group of banks. The purpose of the SCA is to provide an alternative source of temporary funding for capital share redemptions. The table below provides details of the current SCA in effect at the reporting period-end as well as the prior SCA.
| Current SCA | Prior SCA | |||
Term of Commitment | 10/3/2019 – 10/1/2020 | 10/4/2018 – 10/2/2019 | ||
Total Commitment | $ 1,222,500,000* | $ 900,000,000 | ||
Annualized Commitment Fee on the Unused Portion of the SCA | 0.15% | 0.15% | ||
Annualized Interest Rate on Borrowings | 1.20% plus the higher of (1) the effective federal funds rate, (2) the one-month LIBOR rate or (3) zero percent | 1.25% plus the higher of (1) the effective federal funds rate, (2) the one-month LIBOR rate or (3) zero percent |
| * | Effective March 31, 2020, the SCA’s total commitment was increased from $900,000,000 to $1,162,500,000 and subsequently, effective April 7, 2020 was increased to $1,222,500,000. |
Certain affiliated registered investment companies that are parties to the SCA include portfolios that are subject to a predetermined mathematical formula used to manage certain benefit guarantees offered under variable annuity contracts. The formula may result in large scale asset flows into and out of these portfolios. Consequently, these portfolios may be more likely to utilize the SCA for purposes of funding redemptions. It may be possible for those portfolios to fully exhaust the committed amount of the SCA, thereby requiring the Manager
| 56 |
to allocate available funding per a Board-approved methodology designed to treat the Funds in the SCA equitably.
The Fund utilized the SCA during the year ended February 29, 2020. The average daily balance for the 4 days that the Fund had loans outstanding during the period was approximately $607,500, borrowed at a weighted average interest rate of 3.54%. The maximum loan outstanding amount during the period was $1,611,000. At February 29, 2020, the Fund did not have an outstanding loan amount.
8. Risks of Investing in the Fund
The Fund’s risks include, but are not limited to, some or all of the risks discussed below:
Bond Obligations Risk: The Fund’s holdings, share price, yield and total return may fluctuate in response to bond market movements. The value of bonds may decline for issuer-related reasons, including management performance, financial leverage and reduced demand for the issuer’s goods and services. Certain types of fixed-income obligations also may be subject to “call and redemption risk,” which is the risk that the issuer may call a bond held by the Fund for redemption before it matures and the Fund may not be able to reinvest at the same level and therefore would earn less income.
Derivatives Risk: Derivatives involve special risks and costs and may result in losses to the Fund. The successful use of derivatives requires sophisticated management, and, to the extent that derivatives are used, the Fund will depend on the subadviser’s ability to analyze and manage derivative transactions. The prices of derivatives may move in unexpected ways, especially in abnormal market conditions. Some derivatives are “leveraged” and therefore may magnify or otherwise increase investment losses to the Fund. Other risks arise from the potential inability to terminate or sell derivatives positions. A liquid secondary market may not always exist for the Fund’s derivatives positions. In fact, many OTC derivative instruments will not have liquidity beyond the counterparty to the instrument. OTC derivative instruments also involve the risk that the other party will not meet its obligations to the Fund.
Interest Rate Risk: The value of an investment may go down when interest rates rise. A rise in rates tends to have a greater impact on the prices of longer term or duration securities. When interest rates fall, the issuers of debt obligations may prepay principal more quickly than expected, and the Fund may be required to reinvest the proceeds at a lower interest rate. This is referred to as “prepayment risk.” When interest rates rise, debt obligations may be repaid more slowly than expected, and the value of the Fund’s holdings may fall sharply. This is referred to as “extension risk”. The Fund may face a heightened level of interest rate risk as a result of the U.S. Federal Reserve Board’s policies. The Fund’s investments may lose value if short-term or long-term interest rates rise sharply or in a manner not anticipated by the subadviser.
| PGIM Government Income Fund | 57 |
Notes to Financial Statements (continued)
Liquidity Risk: The Fund may invest in instruments that trade in lower volumes and are less liquid than other investments. Liquidity risk exists when particular investments made by the Fund are difficult to purchase or sell. Liquidity risk includes the risk that the Fund may make investments that may become less liquid in response to market developments or adverse investor perceptions. Investments that are illiquid or that trade in lower volumes may be more difficult to value. If the Fund is forced to sell these investments to pay redemption proceeds or for other reasons, the Fund may lose money. In addition, when there is no willing buyer and investments may not reasonably be expected to be sold or disposed of in current market conditions in seven calendar days or less without the sale or disposition significantly changing the market value of the investment, the Fund may incur higher transaction costs when executing trade orders of a given size. The reduction in dealer market-making capacity in the fixed-income markets that has occurred in recent years also has the potential to reduce liquidity. An inability to sell a portfolio position can adversely affect the Fund’s value or prevent the Fund from being able to take advantage of other investment opportunities.
Market and Credit Risk: Securities markets may be volatile and the market prices of the Fund’s securities may decline. Securities fluctuate in price based on changes in an issuer’s financial condition and overall market and economic conditions. If the market prices of the securities owned by the Fund fall, the value of an investment in the Fund will decline. Additionally, the Fund may also be exposed to credit risk in the event that an issuer or guarantor fails to perform or that an institution or entity with which the Fund has unsettled or open transactions defaults.
U.S. Government and Agency Securities Risk: U.S. Government and agency securities are subject to market risk, interest rate risk and credit risk. Not all U.S. Government securities are insured or guaranteed by the full faith and credit of the U.S. Government; some are only insured or guaranteed by the issuing agency, which must rely on its own resources to repay the debt. In addition, the value of U.S. Government securities may be affected by changes in the credit rating of the U.S. Government.
9. Recent Accounting Pronouncements and Reporting Updates
In August 2018, the FASB issued Accounting Standards Update (“ASU”) No. 2018-13, which changes certain fair value measurement disclosure requirements. The new ASU, in addition to other modifications and additions, removes the requirement to disclose the amount and reasons for transfers between Level 1 and Level 2 of the fair value hierarchy, and the Fund’s policy for the timing of transfers between levels. The amendments are effective for financial statements issued for fiscal years beginning after December 15, 2019, and interim periods within those fiscal years. The Manager has evaluated the implications of certain provisions of the ASU and has adopted the aspects related to the removal and
| 58 |
modification of certain fair value measurement disclosures under the ASU. The Manager continues to evaluate certain other provisions of the ASU and does not expect a material impact to financial statement disclosures.
10. Subsequent Event
Subsequent to February 29, 2020 the COVID-19 outbreak was declared a pandemic by the World Health Organization. The situation is dynamic with various cities and countries around the world responding in different ways to address the outbreak.
There are meaningful direct and indirect effects developing particularly with companies in which we invest, which have adversely impacted the valuation of these companies. The Manager will continue to monitor the impact of COVID-19.
| PGIM Government Income Fund | 59 |
Financial Highlights
| Class A Shares | ||||||||||||||||||||
| Year Ended February 28/29, | ||||||||||||||||||||
| 2020 | 2019 | 2018 | 2017 | 2016 | ||||||||||||||||
| Per Share Operating Performance(a): | ||||||||||||||||||||
| Net Asset Value, Beginning of Year | $9.33 | $9.29 | $9.55 | $9.72 | $9.79 | |||||||||||||||
| Income (loss) from investment operations: | ||||||||||||||||||||
| Net investment income (loss) | 0.16 | 0.16 | 0.12 | 0.10 | 0.08 | |||||||||||||||
| Net realized and unrealized gain (loss) on investment and foreign currency transactions | 0.72 | 0.07 | (0.17 | ) | (0.12 | ) | 0.06 | |||||||||||||
| Total from investment operations | 0.88 | 0.23 | (0.05 | ) | (0.02 | ) | 0.14 | |||||||||||||
| Less Dividends and Distributions: | ||||||||||||||||||||
| Dividends from net investment income | (0.20 | ) | (0.19 | ) | (0.16 | ) | (0.11 | ) | (0.10 | ) | ||||||||||
| Distributions from net realized gains | - | - | (0.05 | ) | (0.04 | ) | (0.11 | ) | ||||||||||||
| Total dividends and distributions | (0.20 | ) | (0.19 | ) | (0.21 | ) | (0.15 | ) | (0.21 | ) | ||||||||||
| Net asset value, end of year | $10.01 | $9.33 | $9.29 | $9.55 | $9.72 | |||||||||||||||
| Total Return(b): | 9.48% | 2.51% | (0.61)% | (0.24)% | 1.41% | |||||||||||||||
| Ratios/Supplemental Data: |
| |||||||||||||||||||
| Net assets, end of year (000) | $258,869 | $256,351 | $289,049 | $328,835 | $371,571 | |||||||||||||||
| Average net assets (000) | $255,449 | $271,435 | $312,816 | $353,716 | $373,443 | |||||||||||||||
| Ratios to average net assets(c)(d): | ||||||||||||||||||||
| Expenses after waivers and/or expense reimbursement | 1.05% | 1.06% | 1.01% | 1.02% | 0.99% | |||||||||||||||
| Expenses before waivers and/or expense reimbursement(e) | 1.05% | 1.06% | 1.01% | 1.02% | 0.99% | |||||||||||||||
| Net investment income (loss) | 1.67% | 1.70% | 1.30% | 1.05% | 0.79% | |||||||||||||||
| Portfolio turnover rate(f)(g) | 119% | 143% | 428% | 759% | 778% | |||||||||||||||
| (a) | Calculated based on average shares outstanding during the year. |
| (b) | Total return does not consider the effects of sales loads. Total return is calculated assuming a purchase of a share on the first day and a sale on the last day of each year reported and includes reinvestment of dividends and distributions, if any. Total returns may reflect adjustments to conform to generally accepted accounting principles. |
| (c) | Effective January 1, 2018, class specific expenses include transfer agent fees and expenses and registration fees, which are charged to their respective share class. |
| (d) | Does not include expenses of the underlying funds in which the Fund invests. |
| (e) | The distributor of the Fund had contractually agreed to limit its distribution and service (12b-1) fees to 0.25% of the average daily net assets through March 8, 2015. Effective March 9, 2015, the contractual distribution and service (12b-1) fees were reduced from 0.30% to 0.25% of the average daily net assets. |
| (f) | The Fund accounts for mortgage dollar roll transactions as purchases and sales which, as a result, can increase its portfolio turnover rate. |
| (g) | The Fund’s portfolio turnover rate is calculated in accordance with regulatory requirements, without regard to transactions involving short-term investments and certain derivatives. If such transactions were included, the Fund’s portfolio turnover rate may be higher. |
See Notes to Financial Statements.
| 60 |
| Class B Shares | ||||||||||||||||||||
| Year Ended February 28/29, | ||||||||||||||||||||
| 2020 | 2019 | 2018 | 2017 | 2016 | ||||||||||||||||
| Per Share Operating Performance(a): | ||||||||||||||||||||
| Net Asset Value, Beginning of Year | $9.34 | $9.30 | $9.56 | $9.73 | $9.80 | |||||||||||||||
| Income (loss) from investment operations: | ||||||||||||||||||||
| Net investment income (loss) | 0.07 | 0.07 | 0.05 | 0.03 | - | (b) | ||||||||||||||
| Net realized and unrealized gain (loss) on investment and foreign currency transactions | 0.72 | 0.07 | (0.18 | ) | (0.13 | ) | 0.07 | |||||||||||||
| Total from investment operations | 0.79 | 0.14 | (0.13 | ) | (0.10 | ) | 0.07 | |||||||||||||
| Less Dividends and Distributions: | ||||||||||||||||||||
| Dividends from net investment income | (0.10 | ) | (0.10 | ) | (0.08 | ) | (0.03 | ) | (0.03 | ) | ||||||||||
| Distributions from net realized gains | - | - | (0.05 | ) | (0.04 | ) | (0.11 | ) | ||||||||||||
| Total dividends and distributions | (0.10 | ) | (0.10 | ) | (0.13 | ) | (0.07 | ) | (0.14 | ) | ||||||||||
| Net asset value, end of year | $10.03 | $9.34 | $9.30 | $9.56 | $9.73 | |||||||||||||||
| Total Return(c): | 8.52% | 1.52% | (1.40)% | (1.01)% | 0.69% | |||||||||||||||
| Ratios/Supplemental Data: |
| |||||||||||||||||||
| Net assets, end of year (000) | $274 | $742 | $1,193 | $1,973 | $3,085 | |||||||||||||||
| Average net assets (000) | $442 | $917 | $1,497 | $2,802 | $3,151 | |||||||||||||||
| Ratios to average net assets(d)(e): | ||||||||||||||||||||
| Expenses after waivers and/or expense reimbursement | 2.03% | 2.03% | 1.80% | 1.76% | 1.74% | |||||||||||||||
| Expenses before waivers and/or expense reimbursement | 5.18% | 3.79% | 2.25% | 1.76% | 1.74% | |||||||||||||||
| Net investment income (loss) | 0.74% | 0.71% | 0.49% | 0.30% | 0.04% | |||||||||||||||
| Portfolio turnover rate(f)(g) | 119% | 143% | 428% | 759% | 778% | |||||||||||||||
| (a) | Calculated based on average shares outstanding during the year. |
| (b) | Less than $0.005 per share. |
| (c) | Total return does not consider the effects of sales loads. Total return is calculated assuming a purchase of a share on the first day and a sale on the last day of each year reported and includes reinvestment of dividends and distributions, if any. Total returns may reflect adjustments to conform to generally accepted accounting principles. |
| (d) | Effective January 1, 2018, class specific expenses include transfer agent fees and expenses and registration fees, which are charged to their respective share class. |
| (e) | Does not include expenses of the underlying funds in which the Fund invests. |
| (f) | The Fund accounts for mortgage dollar roll transactions as purchases and sales which, as a result, can increase its portfolio turnover rate. |
| (g) | The Fund’s portfolio turnover rate is calculated in accordance with regulatory requirements, without regard to transactions involving short-term investments and certain derivatives. If such transactions were included, the Fund’s portfolio turnover rate may be higher. |
See Notes to Financial Statements.
| PGIM Government Income Fund | 61 |
Financial Highlights (continued)
| Class C Shares | ||||||||||||||||||||
| Year Ended February 28/29, | ||||||||||||||||||||
| 2020 | 2019 | 2018 | 2017 | 2016 | ||||||||||||||||
| Per Share Operating Performance(a): | ||||||||||||||||||||
| Net Asset Value, Beginning of Year | $9.35 | $9.31 | $9.57 | $9.74 | $9.81 | |||||||||||||||
| Income (loss) from investment operations: | ||||||||||||||||||||
| Net investment income (loss) | 0.08 | 0.08 | 0.05 | 0.03 | - | (b) | ||||||||||||||
| Net realized and unrealized gain (loss) on investment and foreign currency transactions | 0.73 | 0.07 | (0.18 | ) | (0.12 | ) | 0.07 | |||||||||||||
| Total from investment operations | 0.81 | 0.15 | (0.13 | ) | (0.09 | ) | 0.07 | |||||||||||||
| Less Dividends and Distributions: | ||||||||||||||||||||
| Dividends from net investment income | (0.12 | ) | (0.11 | ) | (0.08 | ) | (0.04 | ) | (0.03 | ) | ||||||||||
| Distributions from net realized gains | - | - | (0.05 | ) | (0.04 | ) | (0.11 | ) | ||||||||||||
| Total dividends and distributions | (0.12 | ) | (0.11 | ) | (0.13 | ) | (0.08 | ) | (0.14 | ) | ||||||||||
| Net asset value, end of year | $10.04 | $9.35 | $9.31 | $9.57 | $9.74 | |||||||||||||||
| Total Return(c): | 8.67% | 1.65% | (1.38)% | (1.01)% | 0.69% | |||||||||||||||
| Ratios/Supplemental Data: |
| |||||||||||||||||||
| Net assets, end of year (000) | $7,768 | $8,677 | $9,001 | $11,126 | $12,488 | |||||||||||||||
| Average net assets (000) | $7,755 | $8,612 | $10,053 | $12,570 | $10,548 | |||||||||||||||
| Ratios to average net assets(d)(e): | ||||||||||||||||||||
| Expenses after waivers and/or expense reimbursement | 1.88% | 1.91% | 1.79% | 1.77% | 1.74% | |||||||||||||||
| Expenses before waivers and/or expense reimbursement | 1.88% | 1.91% | 1.79% | 1.77% | 1.74% | |||||||||||||||
| Net investment income (loss) | 0.85% | 0.85% | 0.51% | 0.30% | 0.03% | |||||||||||||||
| Portfolio turnover rate(f)(g) | 119% | 143% | 428% | 759% | 778% | |||||||||||||||
| (a) | Calculated based on average shares outstanding during the year. |
| (b) | Less than $0.005 per share. |
| (c) | Total return does not consider the effects of sales loads. Total return is calculated assuming a purchase of a share on the first day and a sale on the last day of each year reported and includes reinvestment of dividends and distributions, if any. Total returns may reflect adjustments to conform to generally accepted accounting principles. |
| (d) | Effective January 1, 2018, class specific expenses include transfer agent fees and expenses and registration fees, which are charged to their respective share class. |
| (e) | Does not include expenses of the underlying funds in which the Fund invests. |
| (f) | The Fund accounts for mortgage dollar roll transactions as purchases and sales which, as a result, can increase its portfolio turnover rate. |
| (g) | The Fund’s portfolio turnover rate is calculated in accordance with regulatory requirements, without regard to transactions involving short-term investments and certain derivatives. If such transactions were included, the Fund’s portfolio turnover rate may be higher. |
See Notes to Financial Statements.
| 62 |
| Class R Shares | ||||||||||||||||||||
| Year Ended February 28/29, | ||||||||||||||||||||
| 2020 | 2019 | 2018 | 2017 | 2016 | ||||||||||||||||
| Per Share Operating Performance(a): | ||||||||||||||||||||
| Net Asset Value, Beginning of Year | $9.34 | $9.30 | $9.56 | $9.73 | $9.80 | |||||||||||||||
| Income (loss) from investment operations: | ||||||||||||||||||||
| Net investment income (loss) | 0.13 | 0.13 | 0.10 | 0.08 | 0.05 | |||||||||||||||
| Net realized and unrealized gain (loss) on investment and foreign currency transactions | 0.73 | 0.07 | (0.18 | ) | (0.12 | ) | 0.06 | |||||||||||||
| Total from investment operations | 0.86 | 0.20 | (0.08 | ) | (0.04 | ) | 0.11 | |||||||||||||
| Less Dividends and Distributions: | ||||||||||||||||||||
| Dividends from net investment income | (0.17 | ) | (0.16 | ) | (0.13 | ) | (0.09 | ) | (0.07 | ) | ||||||||||
| Distributions from net realized gains | - | - | (0.05 | ) | (0.04 | ) | (0.11 | ) | ||||||||||||
| Total dividends and distributions | (0.17 | ) | (0.16 | ) | (0.18 | ) | (0.13 | ) | (0.18 | ) | ||||||||||
| Net asset value, end of year | $10.03 | $9.34 | $9.30 | $9.56 | $9.73 | |||||||||||||||
| Total Return(b): | 9.26% | 2.17% | (0.88)% | (0.49)% | 1.16% | |||||||||||||||
| Ratios/Supplemental Data: |
| |||||||||||||||||||
| Net assets, end of year (000) | $11,346 | $12,198 | $13,718 | $16,243 | $15,242 | |||||||||||||||
| Average net assets (000) | $11,439 | $13,211 | $14,559 | $16,257 | $13,851 | |||||||||||||||
| Ratios to average net assets(c)(d): | ||||||||||||||||||||
| Expenses after waivers and/or expense reimbursement | 1.35% | 1.39% | 1.29% | 1.27% | 1.24% | |||||||||||||||
| Expenses before waivers and/or expense reimbursement | 1.60% | 1.64% | 1.54% | 1.52% | 1.49% | |||||||||||||||
| Net investment income (loss) | 1.38% | 1.37% | 1.02% | 0.81% | 0.53% | |||||||||||||||
| Portfolio turnover rate(e)(f) | 119% | 143% | 428% | 759% | 778% | |||||||||||||||
| (a) | Calculated based on average shares outstanding during the year. |
| (b) | Total return is calculated assuming a purchase of a share on the first day and a sale on the last day of each year reported and includes reinvestment of dividends and distributions, if any. Total returns may reflect adjustments to conform to generally accepted accounting principles. |
| (c) | Effective January 1, 2018, class specific expenses include transfer agent fees and expenses and registration fees, which are charged to their respective share class. |
| (d) | Does not include expenses of the underlying funds in which the Fund invests. |
| (e) | The Fund accounts for mortgage dollar roll transactions as purchases and sales which, as a result, can increase its portfolio turnover rate. |
| (f) | The Fund’s portfolio turnover rate is calculated in accordance with regulatory requirements, without regard to transactions involving short-term investments and certain derivatives. If such transactions were included, the Fund’s portfolio turnover rate may be higher. |
See Notes to Financial Statements.
| PGIM Government Income Fund | 63 |
Financial Highlights (continued)
| Class Z Shares | ||||||||||||||||||||
| Year Ended February 28/29, | ||||||||||||||||||||
| 2020 | 2019 | 2018 | 2017 | 2016 | ||||||||||||||||
| Per Share Operating Performance(a): | ||||||||||||||||||||
| Net Asset Value, Beginning of Year | $9.31 | $9.27 | $9.53 | $9.70 | $9.77 | |||||||||||||||
| Income (loss) from investment operations: | ||||||||||||||||||||
| Net investment income (loss) | 0.20 | 0.19 | 0.15 | 0.13 | 0.10 | |||||||||||||||
| Net realized and unrealized gain (loss) on investment and foreign currency transactions | 0.71 | 0.07 | (0.18 | ) | (0.13 | ) | 0.06 | |||||||||||||
| Total from investment operations | 0.91 | 0.26 | (0.03 | ) | - | 0.16 | ||||||||||||||
| Less Dividends and Distributions: | ||||||||||||||||||||
| Dividends from net investment income | (0.23 | ) | (0.22 | ) | (0.18 | ) | (0.13 | ) | (0.12 | ) | ||||||||||
| Distributions from net realized gains | - | - | (0.05 | ) | (0.04 | ) | (0.11 | ) | ||||||||||||
| Total dividends and distributions | (0.23 | ) | (0.22 | ) | (0.23 | ) | (0.17 | ) | (0.23 | ) | ||||||||||
| Net asset value, end of year | $9.99 | $9.31 | $9.27 | $9.53 | $9.70 | |||||||||||||||
| Total Return(b): | 9.93% | 2.87% | (0.36)% | 0.00% | 1.67% | |||||||||||||||
| Ratios/Supplemental Data: |
| |||||||||||||||||||
| Net assets, end of year (000) | $98,625 | $70,338 | $74,262 | $96,332 | $108,544 | |||||||||||||||
| Average net assets (000) | $82,582 | $61,528 | $93,050 | $106,342 | $98,389 | |||||||||||||||
| Ratios to average net assets(c)(d): | ||||||||||||||||||||
| Expenses after waivers and/or expense reimbursement | 0.65% | 0.72% | 0.76% | 0.77% | 0.74% | |||||||||||||||
| Expenses before waivers and/or expense reimbursement | 0.72% | 0.72% | 0.76% | 0.77% | 0.74% | |||||||||||||||
| Net investment income (loss) | 2.06% | 2.03% | 1.55% | 1.31% | 1.03% | |||||||||||||||
| Portfolio turnover rate(e)(f) | 119% | 143% | 428% | 759% | 778% | |||||||||||||||
| (a) | Calculated based on average shares outstanding during the year. |
| (b) | Total return is calculated assuming a purchase of a share on the first day and a sale on the last day of each year reported and includes reinvestment of dividends and distributions, if any. Total returns may reflect adjustments to conform to generally accepted accounting principles. |
| (c) | Effective January 1, 2018, class specific expenses include transfer agent fees and expenses and registration fees, which are charged to their respective share class. |
| (d) | Does not include expenses of the underlying funds in which the Fund invests. |
| (e) | The Fund accounts for mortgage dollar roll transactions as purchases and sales which, as a result, can increase its portfolio turnover rate. |
| (f) | The Fund’s portfolio turnover rate is calculated in accordance with regulatory requirements, without regard to transactions involving short-term investments and certain derivatives. If such transactions were included, the Fund’s portfolio turnover rate may be higher. |
See Notes to Financial Statements.
| 64 |
| Class R6 Shares | ||||||||||||||||
| Year Ended February 28/29, | August 9, through | |||||||||||||||
| 2020 | 2019 | 2018 | 2017 | |||||||||||||
| Per Share Operating Performance(b): | ||||||||||||||||
| Net Asset Value, Beginning of Period | $9.30 | $9.26 | $9.52 | $9.84 | ||||||||||||
| Income (loss) from investment operations: | ||||||||||||||||
| Net investment income (loss) | 0.21 | 0.20 | 0.17 | 0.08 | ||||||||||||
| Net realized and unrealized gain (loss) on investment and foreign currency transactions | 0.71 | 0.07 | (0.18 | ) | (0.32 | ) | ||||||||||
| Total from investment operations | 0.92 | 0.27 | (0.01 | ) | (0.24 | ) | ||||||||||
| Less Dividends and Distributions: | ||||||||||||||||
| Dividends from net investment income | (0.24 | ) | (0.23 | ) | (0.20 | ) | (0.08 | ) | ||||||||
| Distributions from net realized gains | - | - | (0.05 | ) | - | |||||||||||
| Total dividends and distributions | (0.24 | ) | (0.23 | ) | (0.25 | ) | (0.08 | ) | ||||||||
| Net asset value, end of period | $9.98 | $9.30 | $9.26 | $9.52 | ||||||||||||
| Total Return(c): | 10.14% | 2.98% | (0.19)% | (2.39)% | ||||||||||||
| Ratios/Supplemental Data: |
| |||||||||||||||
| Net assets, end of period (000) | $ | 70,584 | $ | 53,380 | $42,239 | $ | 33,956 | |||||||||
| Average net assets (000) | $ | 59,164 | $ | 48,394 | $38,343 | $17,541 | ||||||||||
| Ratios to average net assets(d)(e): | ||||||||||||||||
| Expenses after waivers and/or expense reimbursement | 0.57% | 0.61% | 0.59% | 0.62% | (f) | |||||||||||
| Expenses before waivers and/or expense reimbursement | 0.59% | 0.61% | 0.59% | 0.62% | (f) | |||||||||||
| Net investment income (loss) | 2.14% | 2.17% | 1.75% | 1.47% | (f) | |||||||||||
| Portfolio turnover rate(g)(h) | 119% | 143% | 428% | 759% | ||||||||||||
| (a) | Commencement of offering. |
| (b) | Calculated based on average shares outstanding during the period. |
| (c) | Total return is calculated assuming a purchase of a share on the first day and a sale on the last day of each period reported and includes reinvestment of dividends and distributions, if any. Total returns may reflect adjustments to conform to generally accepted accounting principles. Total returns for periods less than one full year are not annualized. |
| (d) | Effective January 1, 2018, class specific expenses include transfer agent fees and expenses and registration fees, which are charged to their respective share class. |
| (e) | Does not include expenses of the underlying funds in which the Fund invests. |
| (f) | Annualized. |
| (g) | The Fund accounts for mortgage dollar roll transactions as purchases and sales which, as a result, can increase its portfolio turnover rate. |
| (h) | The Fund’s portfolio turnover rate is calculated in accordance with regulatory requirements, without regard to transactions involving short-term investments and certain derivatives. If such transactions were included, the Fund’s portfolio turnover rate may be higher. |
See Notes to Financial Statements.
| PGIM Government Income Fund | 65 |
Report of Independent Registered Public Accounting Firm
To the Shareholders of PGIM Government Income Fund
and Board of Directors Prudential Investment Portfolios, Inc. 14:
Opinion on the Financial Statements
We have audited the accompanying statement of assets and liabilities of PGIM Government Income Fund (the Fund), a series of Prudential Investment Portfolios, Inc. 14, including the schedule of investments, as of February 29, 2020, the related statement of operations for the year then ended, the statements of changes in net assets for each of the years in the two-year period then ended, and the related notes (collectively, the financial statements) and the financial highlights for each of the years or periods indicated therein. In our opinion, the financial statements and financial highlights present fairly, in all material respects, the financial position of the Fund as of February 29, 2020, the results of its operations for the year then ended, changes in its net assets for each of the years in the two-year period then ended, and the financial highlights for each of the years or periods indicated therein, in conformity with U.S. generally accepted accounting principles.
Basis for Opinion
These financial statements and financial highlights are the responsibility of the Fund’s management. Our responsibility is to express an opinion on these financial statements and financial highlights based on our audits. We are a public accounting firm registered with the Public Company Accounting Oversight Board (United States) (PCAOB) and are required to be independent with respect to the Fund in accordance with the U.S. federal securities laws and the applicable rules and regulations of the Securities and Exchange Commission and the PCAOB.
We conducted our audits in accordance with the standards of the PCAOB. Those standards require that we plan and perform the audit to obtain reasonable assurance about whether the financial statements and financial highlights are free of material misstatement, whether due to error or fraud. Our audits included performing procedures to assess the risks of material misstatement of the financial statements and financial highlights, whether due to error or fraud, and performing procedures that respond to those risks. Such procedures included examining, on a test basis, evidence regarding the amounts and disclosures in the financial statements and financial highlights. Such procedures also included confirmation of securities owned as of February 29, 2020, by correspondence with the custodian, transfer agents, and brokers, or by other appropriate auditing procedures when replies were not received. Our audits also included evaluating the accounting principles used and significant estimates made by management, as well as evaluating the overall presentation of the financial statements and financial highlights. We believe that our audits provide a reasonable basis for our opinion.

We have served as the auditor of one or more PGIM and/or Prudential Retail investment companies since 2003.
New York, New York
April 17, 2020
| 66 |
Tax Information (unaudited)
For the year ended February 29, 2020, the Fund reports the maximum amount allowable but not less than 95.95% as interest-related dividends in accordance with Section 871(k)(1) and 881(e)(1) of the Internal Revenue Code.
In January 2021, you will be advised on IRS Form 1099-DIV or substitute 1099-DIV, as to the Federal tax status of the dividends received by you in calendar year 2020.
We are required by Massachusetts, Missouri and Oregon to inform you that dividends which have been derived from interest on federal obligations are not taxable to shareholders provided that the Fund meets certain requirements mandated by the respective state’s taxing authorities. We are pleased to report that 25.73% of the dividends paid by the Fund qualify for such deduction.
For more detailed information regarding your state and local taxes, you should contact your tax adviser or the state/local taxing authorities.
| PGIM Government Income Fund | 67 |
INFORMATION ABOUT BOARD MEMBERS AND OFFICERS (unaudited)
Information about Board Members and Officers of the Fund is set forth below. Board Members who are not deemed to be “interested persons” of the Fund, as defined in the 1940 Act, are referred to as “Independent Board Members.” Board Members who are deemed to be “interested persons” of the Fund are referred to as “Interested Board Members.” The Board Members are responsible for the overall supervision of the operations of the Fund and perform the various duties imposed on the directors of investment companies by the 1940 Act. The Board in turn elects the Officers, who are responsible for administering the day-to-day operations of the Fund.
| Independent Board Members | ||||||
Name Date of Birth Position(s) Portfolios Overseen | Principal Occupation(s) During Past Five Years | Other Directorships Held During Past Five Years | Length of Board Service | |||
Ellen S. Alberding 3/11/58 Board Member Portfolios Overseen: 96 | President and Board Member, The Joyce Foundation (charitable foundation) (since 2002); Vice Chair, City Colleges of Chicago (community college system) (2011-2015); Trustee, National Park Foundation (charitable foundation for national park system) (2009-2018); Trustee, Economic Club of Chicago (2009-2016); Trustee, Loyola University (since 2018). | None. | Since September 2013 | |||
Kevin J. Bannon 7/13/52 Board Member Portfolios Overseen: 96 | Retired; Managing Director (April 2008-May 2015) and Chief Investment Officer (October 2008-November 2013) of Highmount Capital LLC (registered investment adviser); formerly Executive Vice President and Chief Investment Officer (April 1993-August 2007) of Bank of New York Company; President (May 2003-May 2007) of BNY Hamilton Family of Mutual Funds. | Director of Urstadt Biddle Properties (equity real estate investment trust) (since September 2008). | Since July 2008 | |||
PGIM Government Income Fund
| Independent Board Members | ||||||
Name Date of Birth Position(s) Portfolios Overseen | Principal Occupation(s) During Past Five Years | Other Directorships Held During Past Five Years | Length of Board Service | |||
Linda W. Bynoe 7/9/52 Board Member Portfolios Overseen: 96 | President and Chief Executive Officer (since March 1995) and formerly Chief Operating Officer (December 1989-February 1995) of Telemat Ltd. (management consulting); formerly Vice President (January 1985-June 1989) at Morgan Stanley & Co. (broker-dealer). | Director of Anixter International, Inc. (communication products distributor) (since January 2006); Director of Northern Trust Corporation (financial services) (since April 2006); Trustee of Equity Residential (residential real estate) (since December 2009). | Since March 2005 | |||
Barry H. Evans 11/2/60 Board Member Portfolios Overseen: 95 | Retired; formerly President (2005 – 2016), Global Chief Operating Officer (2014– 2016), Chief Investment Officer – Global Head of Fixed Income (1998-2014), and various portfolio manager roles (1986-2006), Manulife Asset Management U.S. | Formerly Director, Manulife Trust Company (2011-2018); formerly Director, Manulife Asset Management Limited (2015-2017); formerly Chairman of the Board of Directors of Manulife Asset Management U.S. (2005-2016); formerly Chairman of the Board, Declaration Investment Management and Research (2008-2016). | Since September 2017 | |||
Keith F. Hartstein 10/13/56 Board Member & Independent Chair Portfolios Overseen: 96 | Executive Committee of the IDC Board of Governors (since October 2019); Retired; Member (since November 2014) of the Governing Council of the Independent Directors Council (organization of independent mutual fund directors); formerly President and Chief Executive Officer (2005-2012), Senior Vice President (2004-2005), Senior Vice President of Sales and Marketing (1997-2004), and various executive management positions (1990-1997), John Hancock Funds, LLC (asset management); Chairman, Investment Company Institute’s Sales Force Marketing Committee (2003-2008). | None. | Since September 2013 | |||
Visit our website at pgiminvestments.com
| Independent Board Members | ||||||
Name Date of Birth Position(s) Portfolios Overseen | Principal Occupation(s) During Past Five Years | Other Directorships Held During Past Five Years | Length of Board Service | |||
Laurie Simon Hodrick 9/29/62 Board Member Portfolios Overseen: 95 | A. Barton Hepburn Professor Emerita of Economics in the Faculty of Business, Columbia Business School (since 2018); Visiting Professor of Law, Stanford Law School (since 2015); Visiting Fellow at the Hoover Institution, Stanford University (since 2015); Sole Member, ReidCourt LLC (since 2008) (a consulting firm); formerly A. Barton Hepburn Professor of Economics in the Faculty of Business, Columbia Business School (1996-2017); formerly Managing Director, Global Head of Alternative Investment Strategies, Deutsche Bank (2006-2008). | Independent Director, Synnex Corporation (since April 2019) (information technology); Independent Director, Kabbage, Inc. (since July 2018) (financial services); Independent Director, Corporate Capital Trust (2017-2018) (a business development company). | Since September 2017 | |||
Michael S. Hyland, CFA 10/4/45 Board Member Portfolios Overseen: 96 | Retired (since February 2005); formerly Senior Managing Director (July 2001-February 2005) of Bear Stearns & Co, Inc.; Global Partner, INVESCO (1999-2001); Managing Director and President of Salomon Brothers Asset Management (1989-1999). | None. | Since July 2008 | |||
Brian K. Reid 9/22/61 Board Member Portfolios Overseen: 95 | Retired; formerly Chief Economist for the Investment Company Institute (ICI) (2005-2017); formerly Senior Economist and Director of Industry and Financial Analysis at the ICI (1998-2004); formerly Senior Economist, Industry and Financial Analysis at the ICI (1996-1998); formerly Staff Economist at the Federal Reserve Board (1989-1996); Director, ICI Mutual Insurance Company (2012-2017). | None. | Since March 2018 | |||
PGIM Government Income Fund
| Independent Board Members | ||||||
Name Date of Birth Position(s) Portfolios Overseen | Principal Occupation(s) During Past Five Years | Other Directorships Held During Past Five Years | Length of Board Service | |||
Grace C. Torres 6/28/59 Board Member Portfolios Overseen: 95 | Retired; formerly Treasurer and Principal Financial and Accounting Officer of the PGIM Funds, Target Funds, Advanced Series Trust, Prudential Variable Contract Accounts and The Prudential Series Fund (1998-June 2014); Assistant Treasurer (March 1999-June 2014) and Senior Vice President (September 1999-June 2014) of PGIM Investments LLC; Assistant Treasurer (May 2003-June 2014) and Vice President (June 2005-June 2014) of AST Investment Services, Inc.; Senior Vice President and Assistant Treasurer (May 2003-June 2014) of Prudential Annuities Advisory Services, Inc. | Formerly Director (July 2015-January 2018) of Sun Bancorp, Inc. N.A. and Sun National Bank; Director (since January 2018) of OceanFirst Financial Corp. and OceanFirst Bank. | Since November 2014 | |||
| Interested Board Members | ||||||
Name Date of Birth Position(s) Portfolios Overseen | Principal Occupation(s) During Past Five Years | Other Directorships Held During Past Five Years | Length of Board Service | |||
Stuart S. Parker 10/5/62 Board Member & President Portfolios Overseen: 96 | President of PGIM Investments LLC (formerly known as Prudential Investments LLC) (since January 2012); Executive Vice President of Prudential Investment Management Services LLC (since December 2012); formerly Executive Vice President of Jennison Associates LLC and Head of Retail Distribution of PGIM Investments LLC (June 2005-December 2011). | None. | Since January 2012 | |||
Visit our website at pgiminvestments.com
| Interested Board Members | ||||||
Name Date of Birth Position(s) Portfolios | Principal Occupation(s) During Past Five Years | Other Directorships Held During Past Five Years | Length of Board Service | |||
Scott E. Benjamin 5/21/73 Board Member & Vice President Portfolios Overseen:96 | Executive Vice President (since June 2009) of PGIM Investments LLC; Vice President (since June 2012) of Prudential Investment Management Services LLC; Executive Vice President (since September 2009) of AST Investment Services, Inc.; Senior Vice President of Product Development and Marketing, PGIM Investments (since February 2006); formerly Vice President of Product Development and Product Management, PGIM Investments LLC (2003-2006). | None. | Since March 2010 | |||
| Fund Officers(a) | ||||
Name Date of Birth Fund Position | Principal Occupation(s) During Past Five Years | Length of Service as Fund Officer | ||
Raymond A. O’Hara 9/11/55 Chief Legal Officer | Vice President and Corporate Counsel (since July 2010) of Prudential Insurance Company of America (Prudential); Vice President (March 2011-Present) of Pruco Life Insurance Company and Pruco Life Insurance Company of New Jersey; Vice President and Corporate Counsel (March 2011-Present) of Prudential Annuities Life Assurance Corporation; Chief Legal Officer of PGIM Investments LLC (since June 2012); Chief Legal Officer of Prudential Mutual Fund Services LLC (since June 2012) and Corporate Counsel of AST Investment Services, Inc. (since June 2012); formerly Assistant Vice President and Corporate Counsel (September 2008-July 2010) of The Hartford Financial Services Group, Inc.; formerly Associate (September 1980-December 1987) and Partner (January 1988–August 2008) of Blazzard & Hasenauer, P.C. (formerly, Blazzard, Grodd & Hasenauer, P.C.). | Since June 2012 | ||
PGIM Government Income Fund
| Fund Officers(a) | ||||
Name Date of Birth Fund Position | Principal Occupation(s) During Past Five Years | Length of Service as Fund Officer | ||
Dino Capasso 8/19/74 Chief Compliance Officer | Chief Compliance Officer (July 2019-Present) of PGIM Investments LLC; Chief Compliance Officer (July 2019-Present) of the PGIM Funds, Target Funds, Advanced Series Trust, The Prudential Series Fund, Prudential’s Gibraltar Fund, Inc., PGIM Global High Yield Fund, Inc., and PGIM High Yield Bond Fund, Inc.; Vice President and Deputy Chief Compliance Officer (June 2017-2019) of PGIM Investments LLC; formerly, Senior Vice President and Senior Counsel (January 2016-June 2017), and Vice President and Counsel (February 2012-December 2015) of Pacific Investment Management Company LLC. | Since March 2018 | ||
Andrew R. French 12/22/62 Secretary | Vice President within PGIM Investments LLC (since December 2018-present) of PGIM Investments; Formerly, Vice President and Corporate Counsel (2010-2018) of Prudential; formerly Director and Corporate Counsel (2006-2010) of Prudential; Vice President and Assistant Secretary (since January 2007) of PI; Vice President and Assistant Secretary (since January 2007) of PMFS. | Since October 2006 | ||
Jonathan D. Shain 8/9/58 Assistant Secretary | Vice President and Corporate Counsel (since August 1998) of Prudential; Vice President and Assistant Secretary (since May 2001) of PGIM Investments LLC; Vice President and Assistant Secretary (since February 2001) of Prudential Mutual Fund Services LLC; formerly Vice President and Assistant Secretary (May 2003-June 2005) of AST Investment Services, Inc. | Since May 2005 | ||
Claudia DiGiacomo 10/14/74 Assistant Secretary | Vice President and Corporate Counsel (since January 2005) of Prudential; Vice President and Assistant Secretary of PGIM Investments LLC (since December 2005); formerly Associate at Sidley Austin Brown & Wood LLP (1999-2004). | Since December 2005 | ||
Diana N. Huffman 4/14/82 Assistant Secretary | Vice President and Corporate Counsel (since September 2015) of Prudential; formerly Associate at Willkie Farr & Gallagher LLP (2009-2015). | Since March 2019 | ||
Melissa Gonzalez 2/10/80 Assistant Secretary | Vice President and Corporate Counsel (since September 2018) of Prudential; formerly Director and Corporate Counsel (March 2014-September 2018) of Prudential. | Since March 2020 | ||
Kelly A. Coyne 8/8/68 Assistant Secretary | Director, Investment Operations of Prudential Mutual Fund Services LLC (since 2010). | Since March 2015 | ||
Christian J. Kelly 5/5/75 Treasurer and Principal Financial and Accounting Officer | Vice President, Head of Fund Administration of PGIM Investments LLC (since November 2018); formerly, Director of Fund Administration of Lord Abbett & Co. LLC (2009-2018), Treasurer and Principal Accounting Officer of the Lord Abbett Family of Funds (2017-2018); Director of Accounting, Avenue Capital Group (2008-2009); Senior Manager, Investment Management Practice of Deloitte & Touche LLP (1998-2007). | Since January 2019 | ||
Visit our website at pgiminvestments.com
| Fund Officers(a) | ||||
Name Date of Birth Fund Position | Principal Occupation(s) During Past Five Years | Length of Service as Fund Officer | ||
Lana Lomuti 6/7/67 Assistant Treasurer | Vice President (since 2007) and Director (2005-2007), within PGIM Investments Fund Administration; formerly Assistant Treasurer (December 2007-February 2014) of The Greater China Fund, Inc. | Since April 2014 | ||
Russ Shupak 10/08/73 Assistant Treasurer | Vice President (since 2017) and Director (2013-2017), within PGIM Investments Fund Administration. | Since October 2019 | ||
Deborah Conway 3/26/69 Assistant Treasurer | Vice President (since 2017) and Director (2007-2017), within PGIM Investments Fund Administration. | Since October 2019 | ||
Elyse M. McLaughlin 1/20/74 Assistant Treasurer | Vice President (since 2017) and Director (2011-2017), within PGIM Investments Fund Administration. | Since October 2019 | ||
Charles H. Smith 1/11/73 Anti-Money Laundering Compliance Officer | Vice President, Corporate Compliance, Anti-Money Laundering Unit (since January 2015) of Prudential; committee member of the American Council of Life Insurers Anti-Money Laundering and Critical Infrastructure Committee (since January 2016); formerly Global Head of Economic Sanctions Compliance at AIG Property Casualty (February 2007-December 2014); Assistant Attorney General at the New York State Attorney General’s Office, Division of Public Advocacy. (August 1998-January 2007). | Since January 2017 | ||
(a) Excludes Mr. Parker and Mr. Benjamin, interested Board Members who also serve as President and Vice President, respectively.
Explanatory Notes to Tables:
| ∎ | Board Members are deemed to be “Interested,” as defined in the 1940 Act, by reason of their affiliation with PGIM Investments LLC and/or an affiliate of PGIM Investments LLC. |
| ∎ | Unless otherwise noted, the address of all Board Members and Officers is c/o PGIM Investments LLC, 655 Broad Street, Newark, New Jersey 07102-4410. |
| ∎ | There is no set term of office for Board Members or Officers. The Board Members have adopted a retirement policy, which calls for the retirement of Board Members on December 31 of the year in which they reach the age of 75. |
| ∎ | “Other Directorships Held” includes only directorships of companies required to register or file reports with the SEC under the 1934 Act (that is, “public companies”) or other investment companies registered under the 1940 Act. |
| ∎ | “Portfolios Overseen” includes all investment companies managed by PGIM Investments LLC. The investment companies for which PGIM Investments LLC serves as manager include the PGIM Funds, The Prudential Variable Contract Accounts, PGIM ETF Trust, PGIM High Yield Bond Fund, Inc., PGIM Global High Yield Fund, Inc., The Prudential Series Fund, Prudential’s Gibraltar Fund, Inc. and the Advanced Series Trust. |
PGIM Government Income Fund
Supplement dated December 18, 2019
to the Currently Effective Summary Prospectus, Prospectus
and Statement of Additional Information of the Funds Listed Below
This supplement should be read in conjunction with your Summary Prospectus, Statutory Prospectus and Statement of Additional Information, be retained for future reference and is in addition to any existing Fund supplements.
The Board of Directors/Trustees for each Fund listed below has approved the conversion of all issued and outstanding Class B shares of the Funds to Class A shares of the same Fund, effective on or about June 26, 2020.
As a result, effective on or about the close of business on June 26, 2020, all of the issued and outstanding Class B shares of a Fund will be converted into Class A shares of that Fund with the same relative aggregate net asset value as the Class B shares held immediately prior to the conversion. Class A shares currently have lower total expense ratios, and equal or lower distribution fees and shareholder servicing fees payable under the Fund’s 12b-1 plan than Class B shares. No sales load, fee, or other charge will be imposed on the conversion of these shares. Class A shares are not subject to the contingent deferred sales charge (if any) currently charged on the redemption of Class B shares. Please refer to your Fund’s Prospectus for more information regarding Class A shares. The conversion is not expected to be a taxable event for federal income tax purposes and should not result in recognition of gain or loss by converting shareholders.
LR1263
The Prudential Investment Portfolios, Inc.
PGIM Balanced Fund
PGIM Jennison Focused Value Fund
PGIM Jennison Growth Fund
Prudential Investment Portfolios 3
PGIM Jennison Focused Growth Fund
PGIM QMA Large-Cap Value Fund
PGIM Real Assets Fund
Prudential Investment Portfolios 4
PGIM Muni High Income Fund
Prudential Investment Portfolios 5
PGIM Jennison Diversified Growth Fund
Prudential Investment Portfolios 6
PGIM California Muni Income Fund
Prudential Investment Portfolios 7
PGIM Jennison Value Fund
Prudential Investment Portfolios 9
PGIM QMA Large-Cap Core Equity Fund
Prudential Investment Portfolios, Inc. 10
PGIM Jennison Global Equity Income Fund
PGIM QMA Mid-Cap Value Fund
Prudential Investment Portfolios 12
PGIM Global Real Estate Fund
PGIM US Real Estate Fund
Prudential Investment Portfolios, Inc. 14
PGIM Government Income Fund
Prudential Investment Portfolios, Inc. 15
PGIM High Yield Fund
Prudential Investment Portfolios 16
PGIM Income Builder Fund
Prudential Investment Portfolios, Inc. 17
PGIM Total Return Bond Fund
Prudential Investment Portfolios 18
PGIM Jennison 20/20 Focus Fund
Prudential Global Total Return Fund, Inc.
PGIM Global Total Return Fund
Prudential Jennison Blend Fund, Inc.
PGIM Jennison Blend Fund
Prudential Jennison Mid-Cap Growth Fund, Inc.
PGIM Jennison Mid-Cap Growth Fund
Prudential Jennison Natural Resources Fund, Inc.
PGIM Jennison Natural Resources Fund
Prudential Jennison Small Company Fund, Inc.
PGIM Jennison Small Company Fund
Prudential Government Money Market Fund, Inc.
PGIM Government Money Market Fund
Prudential National Muni Fund, Inc.
PGIM National Muni Fund
Prudential Sector Funds, Inc.
PGIM Jennison Financial Services Fund
PGIM Jennison Health Sciences Fund
PGIM Jennison Utility Fund
Prudential Short-Term Corporate Bond Fund, Inc.
PGIM Short-Term Corporate Bond Fund
Prudential World Fund, Inc.
PGIM QMA International Equity Fund
| ∎ TELEPHONE | ∎ WEBSITE | |||
655 Broad Street Newark, NJ 07102 | (800) 225-1852 | pgiminvestments.com | ||
| PROXY VOTING |
| The Board of Directors of the Fund has delegated to the Fund’s subadviser the responsibility for voting any proxies and maintaining proxy recordkeeping with respect to the Fund. A description of these proxy voting policies and procedures is available without charge, upon request, by calling (800) 225-1852. Information regarding how the Fund voted proxies relating to portfolio securities during the most recent 12-month period ended June 30 is available on the Fund’s website and on the Securities and Exchange Commission’s website. |
| DIRECTORS |
| Ellen S. Alberding • Kevin J. Bannon • Scott E. Benjamin • Linda W. Bynoe • Barry H. Evans • Keith F. Hartstein • Laurie Simon Hodrick • Michael S. Hyland • Stuart S. Parker • Brian K. Reid • Grace C. Torres |
| OFFICERS |
| Stuart S. Parker, President • Scott E. Benjamin, Vice President • Christian J. Kelly, Treasurer and Principal Financial and Accounting Officer • Raymond A. O’Hara, Chief Legal Officer • Dino Capasso, Chief Compliance Officer • Charles H. Smith, Anti-Money Laundering Compliance Officer • Andrew R. French, Secretary • Jonathan D. Shain, Assistant Secretary • Claudia DiGiacomo, Assistant Secretary • Melissa Gonzalez, Assistant Secretary • Diana N. Huffman, Assistant Secretary • Kelly A. Coyne, Assistant Secretary • Lana Lomuti, Assistant Treasurer • Russ Shupak, Assistant Treasurer • Elyse McLaughlin, Assistant Treasurer • Deborah Conway, Assistant Treasurer |
| MANAGER | PGIM Investments LLC | 655 Broad Street Newark, NJ 07102 | ||
| ||||
| SUBADVISER | PGIM Fixed Income | 655 Broad Street Newark, NJ 07102 | ||
| ||||
| DISTRIBUTOR | Prudential Investment Management Services LLC | 655 Broad Street Newark, NJ 07102 | ||
| ||||
| CUSTODIAN | The Bank of New York Mellon | 240 Greenwich Street New York, NY 10286 | ||
| ||||
| TRANSFER AGENT | Prudential Mutual Fund Services LLC | PO Box 9658 Providence, RI 02940 | ||
| ||||
| INDEPENDENT REGISTERED PUBLIC ACCOUNTING FIRM | KPMG LLP | 345 Park Avenue New York, NY 10154 | ||
| ||||
| FUND COUNSEL | Willkie Farr & Gallagher LLP | 787 Seventh Avenue New York, NY 10019 | ||
| ||||
| An investor should consider the investment objectives, risks, charges, and expenses of the Fund carefully before investing. The prospectus and summary prospectus contain this and other information about the Fund. An investor may obtain the prospectus and summary prospectus by visiting our website at pgiminvestments.com or by calling (800) 225-1852. The prospectus and summary prospectus should be read carefully before investing. |
| E-DELIVERY |
| To receive your mutual fund documents online, go to pgiminvestments.com/edelivery and enroll. Instead of receiving printed documents by mail, you will receive notification via email when new materials are available. You can cancel your enrollment or change your email address at any time by visiting the website address above. |
| SHAREHOLDER COMMUNICATIONS WITH DIRECTORS |
| Shareholders can communicate directly with the Board of Directors by writing to the Chair of the Board, PGIM Government Income Fund, PGIM Investments, Attn: Board of Directors, 655 Broad Street, Newark, NJ 07102. Shareholders can communicate directly with an individual Director by writing to the same address. Communications are not screened before being delivered to the addressee. |
| AVAILABILITY OF PORTFOLIO SCHEDULE |
| The Fund files its complete schedule of portfolio holdings with the Securities and Exchange Commission for the first and third quarters of each fiscal year as an exhibit to its reports on Form N-PORT. The Fund’s Form N-PORT filings are available on the Commission’s website at sec.gov. |
| The Fund’s Statement of Additional Information contains additional information about the Fund’s Directors and is available without charge, upon request, by calling (800) 225-1852. |
Mutual Funds:
| ARE NOT INSURED BY THE FDIC OR ANY FEDERAL GOVERNMENT AGENCY | MAY LOSE VALUE | ARE NOT A DEPOSIT OF OR GUARANTEED BY ANY BANK OR ANY BANK AFFILIATE |
PGIM GOVERNMENT INCOME FUND
| SHARE CLASS | A | B | C | R | Z | R6 | ||||||
| NASDAQ | PGVAX | PBGPX | PRICX | JDRVX | PGVZX | PGIQX | ||||||
| CUSIP | 74439V107 | 74439V206 | 74439V305 | 74439V503 | 74439V404 | 74439V875 |
MF128E

PGIM FLOATING RATE INCOME FUND
ANNUAL REPORT
FEBRUARY 29, 2020
COMING SOON: PAPERLESS SHAREHOLDER REPORTS
Beginning on January 1, 2021, as permitted by regulations adopted by the Securities and Exchange Commission, paper copies of the Fund’s annual and semiannual shareholder reports will no longer be sent by mail, unless you specifically request paper copies of the reports. Instead, the reports will be made available on the Fund’s website (pgiminvestments.com), and you will be notified by mail each time a report is posted and provided with a website link to access the report.
If you already elected to receive shareholder reports electronically, you will not be affected by this change and you need not take any action. You may elect to receive shareholder reports and other communications from the Fund electronically anytime by contacting your financial intermediary (such as a broker-dealer or bank) or, if you are a direct investor, by calling 1-800-225-1852 or by sending an email request to PGIM Investments at shareholderreports@pgim.com.
You may elect to receive all future reports in paper free of charge. If you invest through a financial intermediary, you can contact your financial intermediary or follow instructions included with this notice to elect to continue to receive paper copies of your shareholder reports. If you invest directly with the Fund, you can call 1-800-225-1852 or send an email request to shareholderreports@pgim.com to let the Fund know you wish to continue receiving paper copies of your shareholder reports. Your election to receive reports in paper will apply to all funds held in your account if you invest through your financial intermediary or all funds held with the fund complex if you invest directly with the Fund.

To enroll in e-delivery, go to pgiminvestments.com/edelivery
| 3 | ||||
| 4 | ||||
| 5 | ||||
| 8 | ||||
| 11 | ||||
| 13 | ||||
This report is not authorized for distribution to prospective investors unless preceded or accompanied by a current prospectus.
The views expressed in this report and information about the Fund’s portfolio holdings are for the period covered by this report and are subject to change thereafter.
Mutual funds are distributed by Prudential Investment Management Services LLC (PIMS), member SIPC. PGIM Fixed Income is a unit of PGIM, Inc. (PGIM), a registered investment adviser. PIMS and PGIM are Prudential Financial companies. © 2020 Prudential Financial, Inc. and its related entities. PGIM and the PGIM logo are service marks of Prudential Financial, Inc. and its related entities, registered in many jurisdictions worldwide.
| 2 | Visit our website at pgiminvestments.com |

Dear Shareholder:
We hope you find the annual report for the PGIM Floating Rate Income Fund informative and useful. The report covers performance for the 12-month period that ended February 29, 2020.
The US economy remained healthy throughout the period, with rising corporate profits and strong job growth. The Federal Reserve reduced interest rates three times in an effort to extend the longest domestic economic expansion on record as growth in many regions outside the US weakened. China in particular showed signs of slowing amid trade tensions with the US. China was also the first country hit hard by the coronavirus outbreak late in the period, which left economists worried that global growth may decline in the near term. In early March 2020, the Fed cut rates again to help maintain growth.
Stocks climbed around the globe for most of the period, fueled by the strong US economy and corporate profits, as well as the Fed’s rate reductions. In late February, however, stocks fell on fears that the coronavirus would disrupt supply chains and reduce overall demand for goods and services. While large-cap US stocks posted a gain for the period overall, the significant volatility late in the period contributed to a decline for small-cap US stocks, as well as for equities in developed foreign and emerging markets.
Bonds rose during the period as investors sought safety in fixed income. A significant rally in interest rates pushed the 10-year US Treasury yield down to a record low by the end of the period. Returns were strong worldwide, with gains in the overall US and global bond markets and also in emerging market debt.
Regarding your investments with PGIM, we believe it is important to maintain a diversified portfolio of funds consistent with your tolerance for risk, time horizon, and financial goals. Your financial advisor can help you create a diversified investment plan that may include funds covering all the basic asset classes and that reflects your personal investor profile and risk tolerance. However, diversification and asset allocation strategies do not assure a profit or protect against loss in declining markets.
At PGIM Investments, we consider it a great privilege and responsibility to help investors participate in opportunities across global markets while meeting their toughest investment challenges. PGIM is a top-10 global investment manager with more than $1 trillion in assets under management. This scale and investment expertise allow us to deliver actively managed funds and strategies to meet the needs of investors around the globe.
Thank you for choosing our family of funds.
Sincerely,

Stuart S. Parker, President
PGIM Floating Rate Income Fund
April 15, 2020
| PGIM Floating Rate Income Fund | 3 |
Your Fund’s Performance (unaudited)
Performance data quoted represent past performance. Past performance does not guarantee future results. The investment return and principal value of an investment will fluctuate, so that an investor’s shares, when redeemed, may be worth more or less than their original cost. Current performance may be lower or higher than the past performance data quoted. An investor may obtain performance data as of the most recent month-end by visiting our website at pgiminvestments.com or by calling (800) 225-1852.
| Average Annual Total Returns as of 2/29/20 | ||||||||||||||
| One Year (%) | Five Years (%) | Since Inception (%) | ||||||||||||
Class A | ||||||||||||||
| (with sales charges) | –0.16 | 2.95 | 3.47 (3/30/11) | |||||||||||
| (without sales charges) | 2.14 | 3.42 | 3.73 (3/30/11) | |||||||||||
Class C | ||||||||||||||
| (with sales charges) | 0.41 | 2.66 | 2.96 (3/30/11) | |||||||||||
| (without sales charges) | 1.38 | 2.66 | 2.96 (3/30/11) | |||||||||||
Class Z | ||||||||||||||
| (without sales charges) | 2.40 | 3.69 | 4.00 (3/30/11) | |||||||||||
| Class R6 | ||||||||||||||
(without sales charges) | 2.45 | N/A | 3.57 (4/27/15) | |||||||||||
| Credit Suisse Leveraged Loan Index |
| |||||||||||||
| 3.25 | — | — | ||||||||||||
| Average Annual Total Returns as of 2/29/20 Since Inception (%) | ||||||||||||||
| Class A (3/30/11) | Class C (3/30/11) | Class Z (3/30/11) | Class R6 (4/27/15) | |||||||||||
| Credit Suisse Leveraged Loan Index |
| |||||||||||||
| 4.30 | 4.30 | 4.30 | 3.88 | |||||||||||
| 4 | Visit our website at pgiminvestments.com |
Growth of a $10,000 Investment (unaudited)
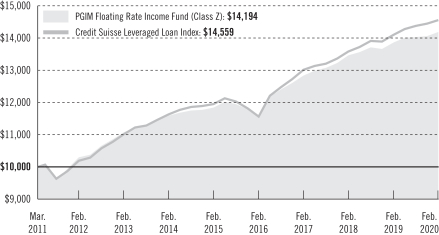
The graph compares a $10,000 investment in the Fund’s Class Z shares with a similar investment in the Credit Suisse Leveraged Loan Index by portraying the initial account values at the commencement of operations of Class Z shares (March 30, 2011) and the account values at the end of the current fiscal year (February 29, 2020) as measured on a quarterly basis. For purposes of the graph, and unless otherwise indicated, it has been assumed that (a) all recurring fees (including management fees) were deducted; and (b) all dividends and distributions were reinvested. The line graph provides information for Class Z shares only. As indicated in the tables provided earlier, performance for other share classes will vary due to the differing charges and expenses applicable to each share class (as indicated in the following paragraphs). Without waiver of fees and/or expense reimbursement, if any, the Fund’s returns would have been lower.
Past performance does not predict future performance. Total returns and the ending account values in the graph include changes in share price and reinvestment of dividends and capital gains distributions in a hypothetical investment for the periods shown. The Fund’s total returns do not reflect the deduction of income taxes on an individual’s investment. Taxes may reduce your actual investment returns on income or gains paid by the Fund or any gains you may realize if you sell your shares.
Source: PGIM Investments LLC, Lipper Inc., and Credit Suisse
Since Inception returns are provided for any share class with less than 10 fiscal years of returns. Since Inception returns for the Index are measured from the closest month-end to the class’ inception date.
| PGIM Floating Rate Income Fund | 5 |
Your Fund’s Performance (continued)
The returns in the tables do not reflect the deduction of taxes that a shareholder would pay on Fund distributions or following the redemption of Fund shares. The average annual total returns take into account applicable sales charges, which are described for each share class in the table below.
| Class A | Class C | Class Z | Class R6 | |||||
| Maximum initial sales charge | For purchases prior to July 15, 2019: 3.25% of the public offering price. For purchases on/after July 15, 2019: 2.25% of the public offering price. | None | None | None | ||||
| Contingent deferred sales charge (CDSC) (as a percentage of the lower of the original purchase price or the net asset value at redemption) | For purchases prior to July 15, 2019: 1.00% on sales of $1 million or more made within 12 months of purchase. For purchases on/after July 15, 2019: 1.00% on sales of $500,000 or more made within 12 months of purchase. | 1.00% on sales made within 12 months of purchase | None | None | ||||
| Annual distribution and service (12b-1) fees (shown as a percentage of average daily net assets) | 0.25% | 1.00% | None | None | ||||
Benchmark Definitions
Credit Suisse Leveraged Loan Index—The Credit Suisse Leveraged Loan Index (the Index) is an unmanaged index that represents the investable universe of the dollar-denominated leveraged loan market.
Investors cannot invest directly in an index. The returns for the Index would be lower if they included the effects of sales charges, operating expenses of a mutual fund, or taxes.
| 6 | Visit our website at pgiminvestments.com |
| Credit Quality expressed as a percentage of total investments as of 2/29/20 (%) | ||||
| AAA | 1.4 | |||
| AA | 6.2 | |||
| BBB | 2.4 | |||
| BB | 30.1 | |||
| B | 51.9 | |||
| CCC | 6.3 | |||
| C | 0.1 | |||
| Not Rated | 0.1 | |||
| Cash/Cash Equivalents | 1.5 | |||
| Total Investments | 100.0 | |||
Source: PGIM Fixed Income
Credit ratings reflect the highest rating assigned by a nationally recognized statistical rating organization (NRSRO) such as Moody’s Investors Service, Inc. (Moody’s), S&P Global Ratings (S&P), or Fitch, Inc. (Fitch). Credit ratings reflect the common nomenclature used by both S&P and Fitch. Where applicable, ratings are converted to the comparable S&P/Fitch rating tier nomenclature. These rating agencies are independent, and are widely used. The Not Rated category consists of securities that have not been rated by an NRSRO. Credit ratings are subject to change.
| Distributions and Yields as of 2/29/20 | ||||||
| Total Distributions Paid for 12 Months ($) | SEC 30-Day Subsidized Yield* (%) | SEC 30-Day Unsubsidized Yield** (%) | ||||
| Class A | 0.54 | 5.32 | 5.35 | |||
| Class C | 0.47 | 4.67 | 4.77 | |||
| Class Z | 0.57 | 5.70 | 5.78 | |||
| Class R6 | 0.57 | 5.75 | 5.84 | |||
*SEC 30-Day Subsidized Yield (%)—A standardized yield calculation created by the Securities and Exchange Commission, it reflects the income earned during a 30-day period, after the deduction of the Fund’s net expenses (net of any expense waivers or reimbursements). The investor experience is represented by the SEC 30-Day Subsidized Yield.
**SEC 30-Day Unsubsidized Yield (%)—A standardized yield calculation created by the Securities and Exchange Commission, it reflects the income earned during a 30-day period, after the deduction of the Fund’s gross expenses. The investor experience is represented by the SEC 30-Day Subsidized Yield.
| PGIM Floating Rate Income Fund | 7 |
Strategy and Performance Overview (unaudited)
How did the Fund perform?
The PGIM Floating Rate Income Fund’s Class Z shares returned 2.40% in the 12-month reporting period that ended February 29, 2020, underperforming the 3.25% return of the Credit Suisse Leveraged Loan Index (the Index).
What were the market conditions?
| • | The bank loan market, as measured by the Index, posted a total return of 3.25% in the reporting period, significantly underperforming high yield bonds, as measured by the Bloomberg Barclays US Corporate High Yield Index, by 285 basis points (bps). (One basis point equals 0.01%.) |
| • | Despite continued retail outflows, support from strong collateralized loan obligation (CLO) creation, interest from separate accounts, and loan paydowns supported the US leveraged loan market. Outflows from loan funds persisted in the second quarter of 2019, as the market reported 31 weeks of outflows over a 32-week span. In aggregate, through half of 2019, $18 billion left the asset class. |
| • | Notwithstanding continued retail outflows, US leveraged loans continued to receive support from strong CLO creation and loan paydowns in the third quarter of 2019. Loan default rates were tracking near 1.5% and are expected to remain low into the second half of 2020. Loan issuance was tracking down more than 40% compared to 2018, and PGIM Fixed Income expects primary supply to trend lower in the fourth quarter. Loan demand will likely moderate on negative net flows amid anticipation of additional Federal Reserve rate cuts and a slowdown in CLO creation due to lower equity arbitrage. |
| • | By the end of the fourth quarter of 2019, loan default rates were tracking near 1.75%, and although they are expected to remain low into the second half of 2020, the threat of idiosyncratic defaults introduces upside risk to the outlook. PGIM Fixed Income expects the increase in loan re-pricings to drive primary loan issuance in the first half of 2020. Retail outflows from the asset class may continue, but PGIM Fixed Income expects some moderation. |
| • | The Index returned 0.53% in January 2020, outperforming the Bloomberg Barclays US Corporate High Yield index by 0.53%. Average loan prices increased $0.13 month over month to $96.63, while the percent of the Index trading above par rose to 35%. Loan new-issue activity in January totaled a monthly record of $122.9 billion. Loan funds reported an inflow of $106 million in January, the first monthly inflow since September 2018. Net US CLO volume was $8.0 billion (excluding refinancings/resets) in January. |
| • | To close out the reporting period, the Index returned -1.35% in February 2020, outperforming high yield bonds by +0.20%. Average loan prices decreased $1.56 month over month to $95.07, while the percent of the Index trading above par decreased to 3% from 35% in January. Loan new-issue activity totaled $71.8 billion in |
| 8 | Visit our website at pgiminvestments.com |
February. The year-to-date gross new issuance stands at $194.7 billion. Loan funds reported an outflow of -$1.6 billion in February, the 17th consecutive monthly outflow. The year-to-date outflows total -$1.6 billion. Net US CLO volumes priced $10.7 billion (excluding refinancings/resets) in February, and 2020 net CLO issuance now totals $38.5 billion. |
What worked?
| • | Overall industry selection added to the Fund’s performance, highlighted by an underweight to metals & mining and overweights to foreign non-corporate and technology sectors. |
| • | Security selection within the building materials & home construction, health care & pharmaceutical, and transportation & environmental services sectors boosted returns. |
| • | From a single-name credit perspective, positioning within Seadrill Ltd. (upstream energy) added value. Overweights to Digicel (telecom) and Brookfield Retail Holdings (building materials & home construction) were also positive. |
| • | The average market risk of the Fund was greater than that of the Index over the period, which was a contributor to returns. |
What didn’t work?
| • | Overall issue selection was the primary detractor from the Fund’s performance during the period, principally due to positioning within the upstream energy, technology, and midstream energy sectors. |
| • | Overweights to Southcross Energy Partners LP (midstream energy), Exela Intermediate LLC (technology), and upstream energy issuers Alta Mesa Holdings LP and Extractions Oil & Gas were largest single-name detractors from performance. |
| • | From an industry allocation perspective, an overweight to the upstream energy sector and an underweight to finance & insurance hurt performance. |
Did the Fund use derivatives?
The Fund held interest rate swaps to help manage the portfolio’s duration and yield curve exposure and to reduce its sensitivity to changes in the levels of interest rates. Overall, this strategy had a negligible impact on performance during the reporting period. The Fund also participated in credit default swaps. This strategy also had a negligible impact on performance.
Current outlook
| • | At the end of the reporting period and into March 2020, markets experienced extreme volatility across rates, credit, and equities. Most fixed income markets saw spreads rapidly gap wider to levels not seen since the last recession in 2008-09. While many |
| PGIM Floating Rate Income Fund | 9 |
Strategy and Performance Overview (continued)
| market participants have been focused on increasing sovereign and corporate debt in the system (rightfully so), the area of stress today has also come from the bubble created by investors chasing returns by giving up more and more liquidity. The dual impact of the COVID-19 along with an oil price war has roiled markets in record time, as nearly every industry is under some degree of duress simultaneously. As some investors are looking to monetize the relative outperformance of fixed income to either sit in cash or buy equities, the markets are being met with few places truly able to raise cash. While CLOs have unfortunately widened meaningfully, PGIM Fixed Income has also seen material widening in assets that can be sold to raise cash. |
| • | Looking specifically at bank loans, the asset class was down over 17% year to date in 2020 at the time of this writing in late March. Liquidity continues to hold up for the higher-rated portion of the market, with BB-rated credits in durable industries (e.g., cable, health care) continuing to see decent two-way flow. After some of the sell-side pressure from retail funds abated, attention has turned to CLO warehouse facilities. After underperforming recently, BB-rated loans appear attractive at current levels, as well as select B-rated loans in industries that are either unaffected by or benefit from the spread of COVID-19. At period-end, the Fund’s largest overweights were in the telecom, retailers, and automotive sectors. The largest underweights were to the consumer, media & entertainment, gaming & lodging & leisure, and financials sectors. |
| 10 | Visit our website at pgiminvestments.com |
As a shareholder of the Fund, you incur two types of costs: (1) transaction costs, including sales charges (loads) on purchase payments and redemptions, as applicable, and (2) ongoing costs, including management fees, distribution and/or service (12b-1) fees, and other Fund expenses, as applicable. This example is intended to help you understand your ongoing costs (in dollars) of investing in the Fund and to compare these costs with the ongoing costs of investing in other mutual funds.
The example is based on an investment of $1,000 held through the six-month period ended February 29, 2020. The example is for illustrative purposes only; you should consult the Prospectus for information on initial and subsequent minimum investment requirements.
Actual Expenses
The first line for each share class in the table on the following page provides information about actual account values and actual expenses. You may use the information on this line, together with the amount you invested, to estimate the expenses that you paid over the period. Simply divide your account value by $1,000 (for example, an $8,600 account value ÷ $1,000 = 8.6), then multiply the result by the number on the first line under the heading “Expenses Paid During the Six-Month Period” to estimate the expenses you paid on your account during this period.
Hypothetical Example for Comparison Purposes
The second line for each share class in the table on the following page provides information about hypothetical account values and hypothetical expenses based on the Fund’s actual expense ratio and an assumed rate of return of 5% per year before expenses, which is not the Fund’s actual return. The hypothetical account values and expenses may not be used to estimate the actual ending account balance or expenses you paid for the period. You may use this information to compare the ongoing costs of investing in the Fund and other funds. To do so, compare this 5% hypothetical example with the 5% hypothetical examples that appear in the shareholder reports of the other funds.
The Fund’s transfer agent may charge additional fees to holders of certain accounts that are not included in the expenses shown in the table on the following page. These fees apply to individual retirement accounts (IRAs) and Section 403(b) accounts. As of the close of the six-month period covered by the table, IRA fees included an annual maintenance fee of $15 per account (subject to a maximum annual maintenance fee of $25 for all accounts held by the same shareholder). Section 403(b) accounts are charged an annual $25 fiduciary maintenance fee. Some of the fees may vary in amount, or may be waived, based on your total account balance or the number of PGIM funds, including the Fund, that you own. You should consider the additional fees that were charged to your Fund account over the six-month period when you estimate the total ongoing expenses paid over the period
| PGIM Floating Rate Income Fund | 11 |
Fees and Expenses (continued)
and the impact of these fees on your ending account value, as these additional expenses are not reflected in the information provided in the expense table. Additional fees have the effect of reducing investment returns.
Please note that the expenses shown in the table are meant to highlight your ongoing costs only and do not reflect any transactional costs such as sales charges (loads). Therefore, the second line for each share class in the table is useful in comparing ongoing costs only and will not help you determine the relative total costs of owning different funds. In addition, if these transactional costs were included, your costs would have been higher.
| PGIM Floating Rate Income Fund | Beginning Account Value | Ending Account Value February 29, 2020 | Annualized Expense Ratio | Expenses Paid During the Six-Month Period* | ||||||||||||||
| Class A | Actual | $ | 1,000.00 | $ | 1,010.30 | 0.97 | % | $ | 4.85 | |||||||||
| Hypothetical | $ | 1,000.00 | $ | 1,020.04 | 0.97 | % | $ | 4.87 | ||||||||||
| Class C | Actual | $ | 1,000.00 | $ | 1,006.60 | 1.72 | % | $ | 8.58 | |||||||||
| Hypothetical | $ | 1,000.00 | $ | 1,016.31 | 1.72 | % | $ | 8.62 | ||||||||||
| Class Z | Actual | $ | 1,000.00 | $ | 1,011.50 | 0.72 | % | $ | 3.60 | |||||||||
| Hypothetical | $ | 1,000.00 | $ | 1,021.28 | 0.72 | % | $ | 3.62 | ||||||||||
| Class R6 | Actual | $ | 1,000.00 | $ | 1,011.80 | 0.67 | % | $ | 3.35 | |||||||||
| Hypothetical | $ | 1,000.00 | $ | 1,021.53 | 0.67 | % | $ | 3.37 | ||||||||||
*Fund expenses (net of fee waivers or subsidies, if any) for each share class are equal to the annualized expense ratio for each share class (provided in the table), multiplied by the average account value over the period, multiplied by the 182 days in the six-month period ended February 29, 2020, and divided by the 366 days in the Fund’s fiscal year ended February 29, 2020 (to reflect the six-month period). Expenses presented in the table include the expenses of any underlying portfolios in which the Fund may invest.
| 12 | Visit our website at pgiminvestments.com |
Schedule of Investments
as of February 29, 2020
| Description | Interest Rate | Maturity Date | Principal Amount (000)# | Value | ||||||||||||
LONG-TERM INVESTMENTS 98.4% | ||||||||||||||||
ASSET-BACKED SECURITIES 7.6% | ||||||||||||||||
Collateralized Loan Obligations | ||||||||||||||||
Anchorage Credit Opportunities CLO Ltd. (Cayman Islands), | 3.691 | %(c) | 01/20/32 | 5,000 | $ | 4,993,523 | ||||||||||
Atlas Senior Loan Fund Ltd. (Cayman Islands), | 4.169 | (c) | 10/23/32 | 5,000 | 4,975,413 | |||||||||||
Cathedral Lake CLO Ltd. (Cayman Islands), | 4.069 | (c) | 10/20/28 | 2,000 | 1,991,756 | |||||||||||
Hayfin Kingsland Ltd. (Cayman Islands), | 3.595 | (c) | 04/28/31 | 3,750 | 3,736,717 | |||||||||||
Jefferson Mill CLO Ltd. (Cayman Islands), | 3.769 | (c) | 10/20/31 | 1,700 | 1,691,765 | |||||||||||
Sound Point CLO Ltd. (Cayman Islands), | 3.806 | (c) | 01/23/29 | 600 | 597,579 | |||||||||||
Trimaran Cavu Ltd. (Cayman Islands), | 4.019 | (c) | 07/20/32 | 10,000 | 9,966,912 | |||||||||||
Trinitas CLO Ltd. (Cayman Islands), | 3.419 | (c) | 10/18/31 | 2,500 | 2,488,480 | |||||||||||
Series 2016-04A, Class BR, 144A, 3 Month LIBOR + | 3.769 | (c) | 10/18/31 | 4,000 | 3,985,307 | |||||||||||
Series 2019-10A, Class B, 144A, 3 Month LIBOR + | 3.931 | (c) | 04/15/32 | 3,000 | 2,988,884 | |||||||||||
Zais CLO Ltd. (Cayman Islands), | 4.021 | (c) | 07/15/31 | 3,000 | 2,938,743 | |||||||||||
|
| |||||||||||||||
TOTAL ASSET-BACKED SECURITIES |
| 40,355,079 | ||||||||||||||
|
| |||||||||||||||
See Notes to Financial Statements.
| PGIM Floating Rate Income Fund | 13 |
Schedule of Investments (continued)
as of February 29, 2020
| Description | Interest Rate | Maturity Date | Principal Amount (000)# | Value | ||||||||||||
BANK LOANS 83.2% | ||||||||||||||||
Advertising 0.3% | ||||||||||||||||
Advantage Sales & Marketing, Inc., | 4.853 | %(c) | 07/23/21 | 189 | $ | 181,667 | ||||||||||
Terrier Media Buyer, Inc., | 6.148 | (c) | 12/17/26 | 1,425 | 1,410,750 | |||||||||||
|
| |||||||||||||||
| 1,592,417 | ||||||||||||||||
Aerospace & Defense 0.1% | ||||||||||||||||
TransDigm, Inc., | 3.853 | (c) | 12/09/25 | 725 | 708,688 | |||||||||||
Airlines 0.1% | ||||||||||||||||
American Airlines, Inc., | 3.353 | (c) | 01/29/27 | 700 | 659,400 | |||||||||||
Apparel 0.5% | ||||||||||||||||
Calceus Acquisition, Inc., | 7.103 | (c) | 02/12/25 | 1,990 | 1,969,540 | |||||||||||
Kontoor Brands, Inc., | 5.889 | (c) | 05/15/26 | 650 | 647,165 | |||||||||||
|
| |||||||||||||||
| 2,616,705 | ||||||||||||||||
Auto Manufacturers 0.8% | ||||||||||||||||
CTOS LLC, | 5.897 | (c) | 04/18/25 | 644 | 641,182 | |||||||||||
Navistar, Inc., | 5.160 | (c) | 11/06/24 | 3,889 | 3,840,484 | |||||||||||
|
| |||||||||||||||
| 4,481,666 | ||||||||||||||||
Auto Parts & Equipment 2.2% | ||||||||||||||||
Adient US LLC, | 6.054 | (c) | 05/06/24 | 1,566 | 1,541,086 | |||||||||||
American Axle & Manufacturing, Inc., | 3.880 | (c) | 04/06/24 | 1,994 | 1,943,887 | |||||||||||
Autokiniton US Holdings, Inc., | 7.353 | (c) | 05/22/25 | 425 | 419,687 | |||||||||||
Closing Date Term B Loan, 1 Month LIBOR + 6.375%^ | 7.978 | (c) | 05/22/25 | 399 | 396,992 | |||||||||||
See Notes to Financial Statements.
| 14 |
| Description | Interest Rate | Maturity Date | Principal Amount (000)# | Value | ||||||||||||
BANK LOANS (Continued) | ||||||||||||||||
Auto Parts & Equipment (cont’d.) | ||||||||||||||||
Dana, Inc., | 3.860 | %(c) | 02/27/26 | 1,000 | $ | 997,500 | ||||||||||
Innovative Xcessories & Services LLC, | 6.360 | (c) | 11/29/22 | 1,322 | 1,309,014 | |||||||||||
IXS Holdings, Inc., | — | (p) | 02/27/27 | 300 | 297,000 | |||||||||||
K & N Parent, Inc., | 6.353 | (c) | 10/20/23 | 1,634 | 1,350,551 | |||||||||||
Superior Industries International, Inc., | 5.603 | (c) | 05/22/24 | 1,641 | 1,596,511 | |||||||||||
Truck Hero, Inc., | 5.353 | (c) | 04/22/24 | 2,057 | 2,020,744 | |||||||||||
|
| |||||||||||||||
| 11,872,972 | ||||||||||||||||
Beverages 0.4% | ||||||||||||||||
Arctic Glacier USA, Inc., | 5.103 | (c) | 03/20/24 | 2,500 | 2,400,000 | |||||||||||
Building Materials 1.3% | ||||||||||||||||
Acproducts, Inc., | — | (p) | 08/14/25 | 900 | 915,750 | |||||||||||
Airxcel, Inc., | 10.353 | (c) | 04/27/26 | 225 | 199,125 | |||||||||||
API Group, Inc., | 4.103 | (c) | 10/01/26 | 1,175 | 1,164,719 | |||||||||||
Ingersoll-Rand Services Co., | — | (p) | 02/28/27 | 2,050 | 2,023,735 | |||||||||||
Ply Gem Midco, Inc., | 5.408 | (c) | 04/12/25 | 2,442 | 2,362,659 | |||||||||||
Quikrete Holdings, Inc., | 4.103 | (c) | 02/01/27 | 450 | 442,125 | |||||||||||
|
| |||||||||||||||
| 7,108,113 | ||||||||||||||||
Chemicals 3.9% | ||||||||||||||||
Albaugh LLC, | 5.103 | (c) | 12/23/24 | 2,043 | 2,015,408 | |||||||||||
Ascend Performance Materials Operations LLC, | 7.195 | (c) | 08/27/26 | 898 | 891,017 | |||||||||||
See Notes to Financial Statements.
| PGIM Floating Rate Income Fund | 15 |
Schedule of Investments (continued)
as of February 29, 2020
| Description | Interest Rate | Maturity Date | Principal Amount (000)# | Value | ||||||||||||
BANK LOANS (Continued) | ||||||||||||||||
Chemicals (cont’d.) | ||||||||||||||||
Chemours Co. (The), | 3.360 | %(c) | 04/03/25 | 2,303 | $ | 2,199,778 | ||||||||||
Colouroz Midco - Colouroz Investment 2 LLC, | 9.051 | (c) | 09/05/22 | 118 | 73,053 | |||||||||||
Hexion, Inc., | 5.410 | (c) | 07/01/26 | 1,587 | 1,567,163 | |||||||||||
Nouryon USA LLC (Netherlands), | 4.671 | (c) | 10/01/25 | 4,509 | 4,419,153 | |||||||||||
Perstorp Holding AB (Sweden), | 6.695 | (c) | 02/26/26 | 1,638 | 1,531,179 | |||||||||||
Plaskolite PPC Intermediate II LLC, | 5.879 | (c) | 12/15/25 | 355 | 338,777 | |||||||||||
Solenis International LP, | 5.610 | (c) | 06/26/25 | 3,022 | 2,959,170 | |||||||||||
Second Lien Initial Term Loan, 3 Month LIBOR + 8.500%^ | 10.113 | (c) | 06/26/26 | 1,635 | 1,545,075 | |||||||||||
Tronox Finance LLC, | 4.524 | (c) | 09/23/24 | 1,524 | 1,481,845 | |||||||||||
Venator Materials LLC, | 4.603 | (c) | 08/08/24 | 1,828 | 1,782,399 | |||||||||||
|
| |||||||||||||||
| 20,804,017 | ||||||||||||||||
Coal 0.2% | ||||||||||||||||
CNX Resources Corp., | 6.110 | (c) | 09/27/24 | 977 | 829,917 | |||||||||||
Murray Energy Corp., | 9.354 | (c) | 10/17/22 | 789 | 133,005 | |||||||||||
|
| |||||||||||||||
| 962,922 | ||||||||||||||||
Commercial Services 3.8% | ||||||||||||||||
Adtalem Global Education, Inc., | 4.603 | (c) | 04/11/25 | 1,798 | 1,794,254 | |||||||||||
EAB Global, Inc., | 5.642 | (c) | 11/17/24 | 806 | 788,740 | |||||||||||
See Notes to Financial Statements.
| 16 |
| Description | Interest Rate | Maturity Date | Principal Amount (000)# | Value | ||||||||||||
BANK LOANS (Continued) | ||||||||||||||||
Commercial Services (cont’d.) | ||||||||||||||||
Financial & Risk Holdings, Inc., | 4.853 | %(c) | 10/01/25 | 4,736 | $ | 4,721,487 | ||||||||||
Inmar, Inc., | 5.945 | (c) | 05/01/24 | 992 | 953,912 | |||||||||||
IRI Holdings, Inc., | 6.224 | (c) | 12/01/25 | 1,325 | 1,270,611 | |||||||||||
PSC Industrial Holdings Corp., | 5.409 | (c) | 10/11/24 | 2,436 | 2,417,686 | |||||||||||
Syniverse Holdings, Inc., | 6.873 | (c) | 03/09/23 | 3,103 | 2,812,954 | |||||||||||
Trugreen, LP, | 5.353 | (c) | 03/19/26 | 1,166 | 1,163,272 | |||||||||||
Tweddle Group, Inc., | 6.103 | (c) | 09/17/23 | 287 | 86,084 | |||||||||||
Univ. Support Services LLC (Canada), | 4.860 | (c) | 07/17/25 | 3,768 | 3,749,348 | |||||||||||
VT Topco, Inc., | 5.445 | (c) | 08/01/25 | 656 | 648,258 | |||||||||||
|
| |||||||||||||||
| 20,406,606 | ||||||||||||||||
Computers 4.5% | ||||||||||||||||
ConvergeOne Holdings Corp., | 6.603 | (c) | 01/05/26 | 1,489 | 1,373,372 | |||||||||||
DynCorp International, Inc., | 7.659 | (c) | 08/18/25 | 1,777 | 1,741,950 | |||||||||||
McAfee LLC, | 10.103 | (c) | 09/29/25 | 2,898 | 2,901,349 | |||||||||||
Term B USD Loan, 1 Month LIBOR + 3.750% | 5.353 | (c) | 09/30/24 | 4,417 | 4,385,288 | |||||||||||
Neustar, Inc., | 5.103 | (c) | 08/08/24 | 2,277 | 2,068,870 | |||||||||||
Second Lien Initial Term Loan, 1 Month LIBOR + 8.000% | 9.603 | (c) | 08/08/25 | 550 | 420,633 | |||||||||||
Peak 10 Holding Corp., | 5.445 | (c) | 08/01/24 | 3,346 | 2,807,752 | |||||||||||
Presidio Holdings, Inc., | 5.280 | (c) | 01/22/27 | 700 | 689,500 | |||||||||||
Procera Networks, Inc. (Canada), | 6.103 | (c) | 10/31/25 | 1,831 | 1,808,606 | |||||||||||
See Notes to Financial Statements.
| PGIM Floating Rate Income Fund | 17 |
Schedule of Investments (continued)
as of February 29, 2020
| Description | Interest Rate | Maturity Date | Principal Amount (000)# | Value | ||||||||||||
BANK LOANS (Continued) | ||||||||||||||||
Computers (cont’d.) | ||||||||||||||||
SonicWall US Holdings, Inc., | 5.195 | %(c) | 05/17/25 | 1,453 | $ | 1,426,197 | ||||||||||
VeriFone Systems, Inc., | 5.695 | (c) | 08/20/25 | 4,360 | 4,207,076 | |||||||||||
|
| |||||||||||||||
| 23,830,593 | ||||||||||||||||
Cosmetics/Personal Care 0.1% | ||||||||||||||||
Revlon Consumer Products Corp., | 5.110 | (c) | 09/07/23 | 1,115 | 766,351 | |||||||||||
Distribution/Wholesale 0.4% | ||||||||||||||||
American Tire Distributors, Inc., | 9.274 | (c) | 09/02/24 | 573 | 498,197 | |||||||||||
Dealer Tire LLC, | 5.853 | (c) | 12/19/25 | 500 | 495,000 | |||||||||||
Fleetpride, Inc., | 6.445 | (c) | 02/04/26 | 945 | 925,855 | |||||||||||
|
| |||||||||||||||
| 1,919,052 | ||||||||||||||||
Diversified Financial Services 3.2% | ||||||||||||||||
Avolon TLB Borrower 1 US LLC (Ireland), | — | (p) | 02/06/27 | 3,150 | 3,079,125 | |||||||||||
GreenSky Holdings LLC, | 4.875 | (c) | 03/31/25 | 1,244 | 1,218,797 | |||||||||||
Hudson River Trading LLC, | 4.662 | (c) | 02/18/27 | 3,713 | 3,685,021 | |||||||||||
LiquidNet Holdings, Inc., | 4.853 | (c) | 07/11/24 | 1,381 | 1,346,951 | |||||||||||
Ocwen Financial Corp., | 7.613 | (c) | 05/16/22 | 718 | 715,259 | |||||||||||
Stepstone Group, LP, | 5.762 | (c) | 03/27/25 | 1,329 | 1,318,877 | |||||||||||
VFH Parent LLC, | 5.171 | (c) | 03/01/26 | 5,674 | 5,635,272 | |||||||||||
|
| |||||||||||||||
| 16,999,302 | ||||||||||||||||
See Notes to Financial Statements.
| 18 |
| Description | Interest Rate | Maturity Date | Principal Amount (000)# | Value | ||||||||||||
BANK LOANS (Continued) | ||||||||||||||||
Electric 0.2% | ||||||||||||||||
Heritage Power LLC, | 7.771 | %(c) | 07/30/26 | 1,247 | $ | 1,182,973 | ||||||||||
Electrical Components & Equipment 0.3% | ||||||||||||||||
Pelican Products, Inc., | 5.159 | (c) | 05/01/25 | 1,639 | 1,582,032 | |||||||||||
Electronics 0.3% | ||||||||||||||||
Celestica, Inc. (Canada), | 3.738 | (c) | 06/27/25 | 1,406 | 1,377,635 | |||||||||||
Engineering & Construction 1.3% | ||||||||||||||||
Dynasty Acquisition Co., Inc., | 5.213 | (c) | 04/06/26 | 2,412 | 2,357,349 | |||||||||||
Rockwood Service Corp., | 5.853 | (c) | 01/23/27 | 775 | 775,969 | |||||||||||
Standard Aero Ltd., | 5.213 | (c) | 04/06/26 | 1,296 | 1,267,392 | |||||||||||
TRC Co., Inc., | 5.103 | (c) | 06/21/24 | 2,339 | 2,286,640 | |||||||||||
|
| |||||||||||||||
| 6,687,350 | ||||||||||||||||
Entertainment 0.9% | ||||||||||||||||
1232743 BC Ltd. (Canada), | — | (p) | 02/07/27 | 650 | 603,959 | |||||||||||
Allen Media LLC, | 7.231 | (c) | 02/10/27 | 1,025 | 1,007,062 | |||||||||||
Playtika Holding Corp., | 7.603 | (c) | 12/10/24 | 3,200 | 3,196,000 | |||||||||||
|
| |||||||||||||||
| 4,807,021 | ||||||||||||||||
Environmental Control 0.4% | ||||||||||||||||
Gopher Resource LLC, | 4.853 | (c) | 03/06/25 | 500 | 483,750 | |||||||||||
Robertshaw US Holding Corp., | 4.875 | (c) | 02/28/25 | 1,903 | 1,702,989 | |||||||||||
|
| |||||||||||||||
| 2,186,739 | ||||||||||||||||
See Notes to Financial Statements.
| PGIM Floating Rate Income Fund | 19 |
Schedule of Investments (continued)
as of February 29, 2020
| Description | Interest Rate | Maturity Date | Principal Amount (000)# | Value | ||||||||||||
BANK LOANS (Continued) | ||||||||||||||||
Foods 2.6% | ||||||||||||||||
Chefs’ Warehouse, Inc., | 5.100 | %(c) | 06/22/22 | 1,681 | $ | 1,668,601 | ||||||||||
CSM Bakery Solutions LLC, | 5.870 | (c) | 07/03/20 | 2,812 | 2,711,185 | |||||||||||
Froneri US, Inc. (United Kingdom), | — | (p) | 01/31/27 | 1,750 | 1,720,468 | |||||||||||
H-Food Holdings LLC, | 5.291 | (c) | 05/23/25 | 1,216 | 1,174,694 | |||||||||||
Milk Specialties Co., | 5.603 | (c) | 08/16/23 | 2,685 | 2,524,067 | |||||||||||
Shearer’s Foods LLC, | 5.853 | (c) | 03/31/22 | 1,430 | 1,421,673 | |||||||||||
United Natural Foods, Inc., | 5.853 | (c) | 10/22/25 | 3,021 | 2,567,847 | |||||||||||
|
| |||||||||||||||
| 13,788,535 | ||||||||||||||||
Forest Products & Paper 0.3% | ||||||||||||||||
Clearwater Paper Corp., | 4.938 | (c) | 07/26/26 | 1,050 | 1,047,375 | |||||||||||
Pixelle Specialty Solutions LLC, | 8.103 | (c) | 10/31/24 | 500 | 489,063 | |||||||||||
|
| |||||||||||||||
| 1,536,438 | ||||||||||||||||
Healthcare-Products 0.3% | ||||||||||||||||
Sotera Health Holdings LLC, | 6.103 | (c) | 12/11/26 | 1,524 | 1,512,664 | |||||||||||
Healthcare-Services 5.9% | ||||||||||||||||
Accelerated Health Systems LLC, | 5.153 | (c) | 10/31/25 | 907 | 900,692 | |||||||||||
Air Medical Group Holdings, Inc., | 5.863 | (c) | 03/14/25 | 2,094 | 1,982,608 | |||||||||||
Air Methods Corp., | 5.445 | (c) | 04/22/24 | 704 | 578,195 | |||||||||||
Alliance Healthcare Services, Inc., | 6.103 | (c) | 10/24/23 | 1,089 | 1,023,526 | |||||||||||
Second Lien Initial Term Loan, 1 Month LIBOR + 10.000%^ | 11.603 | (c) | 04/24/24 | 825 | 734,250 | |||||||||||
See Notes to Financial Statements.
| 20 |
| Description | Interest Rate | Maturity Date | Principal Amount (000)# | Value | ||||||||||||
BANK LOANS (Continued) | ||||||||||||||||
Healthcare-Services (cont’d.) | ||||||||||||||||
ATI Holdings Acquisition, Inc., | 5.103 | %(c) | 05/10/23 | 3,768 | $ | 3,689,114 | ||||||||||
BW NHHC Holdco, Inc., | 6.615 | (c) | 05/15/25 | 1,972 | 1,676,082 | |||||||||||
DentalCorp Perfect Smile ULC (Canada), | 5.353 | (c) | 06/06/25 | 2,067 | 2,031,295 | |||||||||||
Envision Healthcare Corp., | 5.353 | (c) | 10/10/25 | 2,768 | 2,205,957 | |||||||||||
Explorer Holdings, Inc., | 6.231 | (c) | 02/04/27 | 1,025 | 1,030,125 | |||||||||||
Gentiva Health Services, Inc., | 4.875 | (c) | 07/02/25 | 3,020 | 2,989,537 | |||||||||||
LifePoint Health, Inc., | 5.353 | (c) | 11/17/25 | 3,858 | 3,836,892 | |||||||||||
Medical Solutions Holdings, Inc., | 6.103 | (c) | 06/14/24 | 3,346 | 3,312,457 | |||||||||||
MPH Acquisition Holdings LLC, | 4.695 | (c) | 06/07/23 | 1,531 | 1,468,514 | |||||||||||
Radnet Management, Inc., | 5.378 | (c) | 06/30/23 | 838 | 831,219 | |||||||||||
Select Medical Corp., | 4.580 | (c) | 03/06/25 | 1,248 | 1,229,651 | |||||||||||
Surgery Center Holdings, Inc., | 4.860 | (c) | 09/02/24 | 863 | 832,447 | |||||||||||
US Anesthesia Partners, Inc., | 4.603 | (c) | 06/24/24 | 922 | 883,830 | |||||||||||
|
| |||||||||||||||
| 31,236,391 | ||||||||||||||||
Holding Companies-Diversified 0.9% | ||||||||||||||||
Belfor Holdings, Inc., | 5.603 | (c) | 04/03/26 | 1,990 | 1,994,975 | |||||||||||
Travelport Finance SARL (Luxembourg), | 6.945 | (c) | 05/29/26 | 3,367 | 2,575,420 | |||||||||||
|
| |||||||||||||||
| 4,570,395 | ||||||||||||||||
See Notes to Financial Statements.
| PGIM Floating Rate Income Fund | 21 |
Schedule of Investments (continued)
as of February 29, 2020
| Description | Interest Rate | Maturity Date | Principal Amount (000)# | Value | ||||||||||||
BANK LOANS (Continued) | ||||||||||||||||
Home Furnishings 0.3% | ||||||||||||||||
Global Appliance, Inc., | 5.610 | %(c) | 09/29/24 | 1,538 | $ | 1,516,514 | ||||||||||
Insurance 0.6% | ||||||||||||||||
Acrisure LLC, | — | (p) | 01/31/27 | 1,675 | 1,650,398 | |||||||||||
Asurion LLC, | 8.103 | (c) | 08/04/25 | 1,325 | 1,321,687 | |||||||||||
|
| |||||||||||||||
| 2,972,085 | ||||||||||||||||
Investment Companies 0.4% | ||||||||||||||||
EIG Management Co. LLC, | 5.353 | (c) | 02/24/25 | 712 | 710,532 | |||||||||||
Masergy Holdings, Inc., | 5.195 | (c) | 12/15/23 | 1,503 | 1,476,909 | |||||||||||
|
| |||||||||||||||
| 2,187,441 | ||||||||||||||||
Iron/Steel 0.1% | ||||||||||||||||
Helix Acquisition Holdings, Inc., | 5.695 | (c) | 09/30/24 | 697 | 644,717 | |||||||||||
Leisure Time 0.4% | ||||||||||||||||
ClubCorp Holdings, Inc., | 4.695 | (c) | 09/18/24 | 678 | 632,397 | |||||||||||
Recess Holdings, Inc., | 5.353 | (c) | 09/30/24 | 1,617 | 1,596,191 | |||||||||||
|
| |||||||||||||||
| 2,228,588 | ||||||||||||||||
Lodging 0.4% | ||||||||||||||||
Caesars Resort Collection LLC, | 4.353 | (c) | 12/23/24 | 2,061 | 1,982,264 | |||||||||||
See Notes to Financial Statements.
| 22 |
| Description | Interest Rate | Maturity Date | Principal Amount (000)# | Value | ||||||||||||
BANK LOANS (Continued) | ||||||||||||||||
Machinery-Construction & Mining 1.2% | ||||||||||||||||
North American Lifting Holdings, Inc., | 6.445 | %(c) | 11/27/20 | 6,532 | $ | 5,682,917 | ||||||||||
Loan (Second Lien), 3 Month LIBOR + 9.000% | 10.945 | (c) | 11/26/21 | 900 | 522,000 | |||||||||||
Vertiv Group Corp., | 7.750 | (c) | 11/30/23 | 284 | 282,775 | |||||||||||
|
| |||||||||||||||
| 6,487,692 | ||||||||||||||||
Machinery-Diversified 2.3% | ||||||||||||||||
CD&R Hydra Buyer, Inc., | 5.853 | (c) | 12/11/24 | 1,483 | 1,445,990 | |||||||||||
Second Lien Initial Term Loan, 1 Month LIBOR + 8.000% | 9.603 | (c) | 04/30/26 | 300 | 285,000 | |||||||||||
DXP Enterprises, Inc., | 6.353 | (c) | 08/29/23 | 959 | 952,696 | |||||||||||
Engineered Machinery Holdings, Inc., | 4.945 | (c) | 07/19/24 | 2,174 | 2,119,971 | |||||||||||
Hyster Yale Group, Inc., | 4.853 | (c) | 05/30/23 | 826 | 821,125 | |||||||||||
New VAC US LLC (Germany), | 5.945 | (c) | 03/08/25 | 1,621 | 1,337,428 | |||||||||||
Pro Mach Group, Inc., | 4.379 | (c) | 03/07/25 | 4,164 | 3,945,356 | |||||||||||
Thermon Holding Corp., | 5.405 | (c) | 10/30/24 | 898 | 897,600 | |||||||||||
Titan Acquisition Ltd. (Canada), | 4.603 | (c) | 03/28/25 | 711 | 674,461 | |||||||||||
|
| |||||||||||||||
| 12,479,627 | ||||||||||||||||
Media 4.3% | ||||||||||||||||
Beasley Mezzanine Holdings LLC, | 5.627 | (c) | 11/01/23 | 1,943 | 1,923,604 | |||||||||||
Coral-US Co-Borrower LLC (Chile), | 3.853 | (c) | 01/31/28 | 1,600 | 1,578,000 | |||||||||||
CSC Holdings LLC, | 3.909 | (c) | 07/17/25 | 982 | 966,361 | |||||||||||
October 2018 Incremental Term Loan, 1 Month LIBOR + 2.250% | 3.909 | (c) | 01/15/26 | 2,740 | 2,705,453 | |||||||||||
See Notes to Financial Statements.
| PGIM Floating Rate Income Fund | 23 |
Schedule of Investments (continued)
as of February 29, 2020
| Description | Interest Rate | Maturity Date | Principal Amount (000)# | Value | ||||||||||||
BANK LOANS (Continued) | ||||||||||||||||
Media (cont’d.) | ||||||||||||||||
Diamond Sports Group LLC, | 4.880 | %(c) | 08/24/26 | 3,441 | $ | 3,402,660 | ||||||||||
iHeartCommunications, Inc., | 4.655 | (c) | 05/01/26 | 850 | 840,438 | |||||||||||
Mission Broadcasting, Inc., | 3.905 | (c) | 01/17/24 | 259 | 255,838 | |||||||||||
Nexstar Broadcasting, Inc., | 3.853 | (c) | 01/17/24 | 1,156 | 1,143,404 | |||||||||||
Term B-4 Loan, 1 Month LIBOR + 2.750% | 4.405 | (c) | 09/18/26 | 2,195 | 2,178,041 | |||||||||||
Radiate Holdco LLC, | 4.603 | (c) | 02/01/24 | 2,066 | 2,016,591 | |||||||||||
Univision Communications, Inc., | 4.353 | (c) | 03/15/24 | 4,459 | 4,286,607 | |||||||||||
WideOpenWest Finance LLC, | 4.889 | (c) | 08/18/23 | 1,999 | 1,928,745 | |||||||||||
|
| |||||||||||||||
| 23,225,742 | ||||||||||||||||
Metal Fabricate/Hardware 1.1% | ||||||||||||||||
Crosby US Acquisition Corp., | 6.379 | (c) | 06/26/26 | 942 | 928,117 | |||||||||||
Dynacast International LLC, | 5.195 | (c) | 01/28/22 | 2,782 | 2,621,381 | |||||||||||
Tank Holding Corp., | 5.103 | (c) | 03/26/26 | 1,600 | 1,582,000 | |||||||||||
WireCo WorldGroup, Inc. (Cayman Islands), | 6.603 | (c) | 09/29/23 | 849 | 802,398 | |||||||||||
|
| |||||||||||||||
| 5,933,896 | ||||||||||||||||
Mining 0.5% | ||||||||||||||||
Aleris International, Inc., | 6.353 | (c) | 02/27/23 | 1,307 | 1,301,957 | |||||||||||
Arconic Rolled Products Corp., | — | (p) | 02/04/27 | 800 | 796,000 | |||||||||||
Covia Holdings Corp., | 5.874 | (c) | 06/02/25 | 730 | 532,688 | |||||||||||
|
| |||||||||||||||
| 2,630,645 | ||||||||||||||||
See Notes to Financial Statements.
| 24 |
| Description | Interest Rate | Maturity Date | Principal Amount (000)# | Value | ||||||||||||
BANK LOANS (Continued) | ||||||||||||||||
Miscellaneous Manufacturing 0.3% | ||||||||||||||||
International Textile Group, Inc., | 6.655 | %(c) | 05/01/24 | 1,429 | $ | 1,115,056 | ||||||||||
Momentive Performance Materials, Inc., | 4.860 | (c) | 05/15/24 | 597 | 572,993 | |||||||||||
|
| |||||||||||||||
| 1,688,049 | ||||||||||||||||
Oil & Gas 2.2% | ||||||||||||||||
Chesapeake Energy Corp., | 9.928 | (c) | 05/23/24 | 2,500 | 2,256,250 | |||||||||||
Citgo Holding, Inc., | 8.603 | (c) | 08/01/23 | 3,340 | 3,340,255 | |||||||||||
CITGO Petroleum Corp., | 6.945 | (c) | 03/27/24 | 997 | 992,500 | |||||||||||
Term B Loan, 3 Month LIBOR + 4.500%^ | 6.445 | (c) | 07/29/21 | 3,051 | 3,042,994 | |||||||||||
Delek US Holdings, Inc., | 3.853 | (c) | 03/31/25 | 1,000 | 986,875 | |||||||||||
PowerTeam Services LLC, | 5.195 | (c) | 03/06/25 | 1,424 | 1,359,727 | |||||||||||
|
| |||||||||||||||
| 11,978,601 | ||||||||||||||||
Packaging & Containers 0.5% | ||||||||||||||||
Albea Beauty Holdings Sarl (France), | 4.926 | (c) | 04/22/24 | 750 | 742,031 | |||||||||||
Plastipak Holdings, Inc., | — | (p) | 10/14/24 | 500 | 490,833 | |||||||||||
Pregis TopCo Corp., | 5.603 | (c) | 08/03/26 | 900 | 889,875 | |||||||||||
Trident TPI Holdings, Inc., | 4.603 | (c) | 10/17/24 | 718 | 689,560 | |||||||||||
|
| |||||||||||||||
| 2,812,299 | ||||||||||||||||
Pharmaceuticals 2.4% | ||||||||||||||||
Amneal Pharmaceuticals LLC, | 5.125 | (c) | 05/04/25 | 3,545 | 3,170,074 | |||||||||||
Arbor Pharmaceuticals LLC, | 6.945 | (c) | 07/05/23 | 2,157 | 1,908,971 | |||||||||||
See Notes to Financial Statements.
| PGIM Floating Rate Income Fund | 25 |
Schedule of Investments (continued)
as of February 29, 2020
| Description | Interest Rate | Maturity Date | Principal Amount (000)# | Value | ||||||||||||
BANK LOANS (Continued) | ||||||||||||||||
Pharmaceuticals (cont’d.) | ||||||||||||||||
Endo Luxembourg Finance Co., | 5.875 | %(c) | 04/29/24 | 2,457 | $ | 2,350,776 | ||||||||||
Lannett Co., Inc., | 6.978 | (c) | 11/25/22 | 2,268 | 2,234,622 | |||||||||||
Mallinckrodt International Finance SA, | 4.695 | (c) | 09/24/24 | 3,302 | 2,943,358 | |||||||||||
|
| |||||||||||||||
| 12,607,801 | ||||||||||||||||
Pipelines 1.0% | ||||||||||||||||
BCP Renaissance Parent LLC, | 5.445 | (c) | 10/31/24 | 1,222 | 1,008,355 | |||||||||||
Lower Cadence Holdings LLC, | 5.603 | (c) | 05/22/26 | 1,100 | 1,018,875 | |||||||||||
Prairie ECI Acquiror, LP, | 6.695 | (c) | 03/11/26 | 3,266 | 3,124,371 | |||||||||||
|
| |||||||||||||||
| 5,151,601 | ||||||||||||||||
Private Equity 0.3% | ||||||||||||||||
HarbourVest Partners, LP, | 3.927 | (c) | 03/03/25 | 1,444 | 1,435,851 | |||||||||||
Real Estate 3.1% | ||||||||||||||||
ASP MCS Acquisition Corp., | 6.637 | (c) | 05/20/24 | 1,243 | 571,837 | |||||||||||
Brookfield Property REIT, Inc., | 4.103 | (c) | 08/27/25 | 8,500 | 8,170,458 | |||||||||||
Cushman & Wakefield PLC, | 4.353 | (c) | 08/21/25 | 4,347 | 4,267,208 | |||||||||||
Lightstone HoldCo LLC, | 5.353 | (c) | 01/30/24 | 4,031 | 3,552,263 | |||||||||||
2018 Refinancing Term C Facility, 1 Month LIBOR + 3.750% | 5.353 | (c) | 01/30/24 | 227 | 200,354 | |||||||||||
|
| |||||||||||||||
| 16,762,120 | ||||||||||||||||
Real Estate Investment Trusts (REITs) 0.6% | ||||||||||||||||
Blackstone Mortgage Trust, Inc., | 3.853 | (c) | 04/23/26 | 1,468 | 1,463,965 | |||||||||||
See Notes to Financial Statements.
| 26 |
| Description | Interest Rate | Maturity Date | Principal Amount (000)# | Value | ||||||||||||
BANK LOANS (Continued) | ||||||||||||||||
Real Estate Investment Trusts (REITs) (cont’d.) | ||||||||||||||||
iStar, Inc., | 4.403 | %(c) | 06/28/23 | 619 | $ | 614,500 | ||||||||||
StarWood Property Mortgage LLC, | 4.103 | (c) | 07/26/26 | 947 | 947,033 | |||||||||||
|
| |||||||||||||||
| 3,025,498 | ||||||||||||||||
Retail 7.2% | ||||||||||||||||
Academy Ltd., | 5.655 | (c) | 07/01/22 | 2,515 | 2,009,148 | |||||||||||
Ashco LLC, | 6.603 | (c) | 09/25/24 | 5,241 | 5,031,487 | |||||||||||
At Home Holding III, Inc., | 5.277 | (c) | 06/03/22 | 3,339 | 2,704,981 | |||||||||||
CEC Entertainment, Inc., | 8.103 | (c) | 08/31/26 | 1,347 | 1,276,769 | |||||||||||
CWGS Group LLC, | 4.385 | (c) | 11/08/23 | 2,301 | 2,087,733 | |||||||||||
EG America LLC (United Kingdom), | 5.961 | (c) | 02/07/25 | 1,534 | 1,489,643 | |||||||||||
Second Lien Facility (USD), 3 Month LIBOR + 8.000%^ | 9.961 | (c) | 04/20/26 | 908 | 889,534 | |||||||||||
Harbor Freight Tools USA, Inc., | 4.103 | (c) | 08/18/23 | 2,516 | 2,403,215 | |||||||||||
Hoffmaster Group, Inc., | 5.603 | (c) | 11/21/23 | 2,650 | 2,583,846 | |||||||||||
Leslie’s Poolmart, Inc., | 5.262 | (c) | 08/16/23 | 1,948 | 1,868,240 | |||||||||||
Men’s Wearhouse, Inc., | 4.905 | (c) | 04/09/25 | 2,943 | 1,972,058 | |||||||||||
Michaels Stores, Inc., | 4.106 | (c) | 01/30/23 | 4,321 | 3,910,315 | |||||||||||
Petco Animal Supplies, Inc., | 5.027 | (c) | 01/26/23 | 3,372 | 2,675,326 | |||||||||||
Rough Country LLC, | 5.103 | (c) | 05/25/23 | 755 | 743,204 | |||||||||||
Sally Holdings LLC, | 4.500 | 07/05/24 | 4,046 | 4,002,408 | ||||||||||||
See Notes to Financial Statements.
| PGIM Floating Rate Income Fund | 27 |
Schedule of Investments (continued)
as of February 29, 2020
| Description | Interest Rate | Maturity Date | Principal Amount (000)# | Value | ||||||||||||
BANK LOANS (Continued) | ||||||||||||||||
Retail (cont’d.) | ||||||||||||||||
Serta Simmons Bedding LLC, | 5.144 | %(c) | 11/08/23 | 2,110 | $ | 1,211,530 | ||||||||||
Staples, Inc., | 6.655 | (c) | 04/16/26 | 1,861 | 1,809,762 | |||||||||||
|
| |||||||||||||||
| 38,669,199 | ||||||||||||||||
Semiconductors 0.4% | ||||||||||||||||
Bright Bidco BV (Netherlands), | 5.274 | (c) | 06/30/24 | 1,093 | 519,404 | |||||||||||
Natel Engineering Co., Inc., | 6.603 | (c) | 04/30/26 | 1,787 | 1,639,114 | |||||||||||
|
| |||||||||||||||
| 2,158,518 | ||||||||||||||||
Software 9.0% | ||||||||||||||||
Boxer Parent Co., Inc., | 5.853 | (c) | 10/02/25 | 4,773 | 4,583,578 | |||||||||||
Bracket Intermediate Holding Corp., | 6.159 | (c) | 09/05/25 | 1,056 | 1,044,068 | |||||||||||
Castle US Holding Corp., | 5.353 | (c) | 01/29/27 | 3,000 | 2,908,125 | |||||||||||
Dun & Bradstreet Corp. (The), | 5.613 | (c) | 02/06/26 | 3,700 | 3,707,696 | |||||||||||
EagleView Technology Corp., | 5.113 | (c) | 08/14/25 | 2,470 | 2,365,025 | |||||||||||
Evergreen Skills Lux Sarl (Luxembourg), | 6.527 | (c) | 04/28/21 | 1,776 | 1,379,601 | |||||||||||
Exela Intermediate LLC, | 8.382 | (c) | 07/12/23 | 2,895 | 1,109,890 | |||||||||||
Fastball Mergersub LLC, | 5.103 | (c) | 01/29/27 | 825 | 820,875 | |||||||||||
Finastra USA, Inc., | 9.027 | (c) | 06/13/25 | 3,358 | 3,198,679 | |||||||||||
First Lien Dollar Term Loan, 3 Month LIBOR + 3.500% | 5.277 | (c) | 06/13/24 | 3,657 | 3,469,900 | |||||||||||
Informatica LLC, | — | (p) | 02/14/25 | 400 | 391,000 | |||||||||||
Term Loan | — | (p) | 02/14/27 | 2,800 | 2,737,000 | |||||||||||
See Notes to Financial Statements.
| 28 |
| Description | Interest Rate | Maturity Date | Principal Amount (000)# | Value | ||||||||||||
BANK LOANS (Continued) | ||||||||||||||||
Software (cont’d.) | ||||||||||||||||
MA FinanceCo LLC (United Kingdom), | 4.103 | %(c) | 06/21/24 | 229 | $ | 217,944 | ||||||||||
Micro Holding Corp., | 5.353 | (c) | 09/15/24 | 2,069 | 2,013,266 | |||||||||||
Quest Software US Holdings, Inc., | 6.027 | (c) | 05/16/25 | 2,994 | 2,937,304 | |||||||||||
Rackspace Hosting, Inc., | 4.752 | (c) | 11/03/23 | 3,929 | 3,692,763 | |||||||||||
SCS Holdings I, Inc., | 5.103 | (c) | 07/01/26 | 2,502 | 2,483,657 | |||||||||||
Seattle Escrow Borrower LLC, | 4.103 | (c) | 06/21/24 | 1,543 | 1,471,828 | |||||||||||
SS&C Technologies, Inc., | 3.353 | (c) | 04/16/25 | 577 | 565,844 | |||||||||||
Term B-4 Loan, 1 Month LIBOR + 1.750% | 3.353 | (c) | 04/16/25 | 412 | 403,040 | |||||||||||
ThoughtWorks, Inc., | 5.353 | (c) | 10/11/24 | 893 | 890,966 | |||||||||||
TIBCO Software, Inc., | — | (p) | 07/03/26 | 349 | 350,432 | |||||||||||
Term Loan | — | (p) | 02/14/28 | 425 | 432,969 | |||||||||||
Term Loan B-2, 1 Month LIBOR + 4.000%^ | 5.670 | (c) | 06/30/26 | 1,961 | 1,950,666 | |||||||||||
VS Buyer LLC, | — | (p) | 02/19/27 | 1,300 | 1,290,250 | |||||||||||
Zelis Payments Buyer, Inc., | 6.354 | (c) | 09/30/26 | 1,600 | 1,585,000 | |||||||||||
|
| |||||||||||||||
| 48,001,366 | ||||||||||||||||
Telecommunications 8.4% | ||||||||||||||||
Avaya, Inc., | 5.900 | (c) | 12/15/24 | 3,062 | 2,923,838 | |||||||||||
CenturyLink, Inc., | 3.853 | (c) | 03/15/27 | 3,150 | 3,064,688 | |||||||||||
Connect Finco SARL, | 6.110 | (c) | 12/12/26 | 1,800 | 1,785,375 | |||||||||||
Consolidated Communications, Inc., | 4.610 | (c) | 10/05/23 | 1,945 | 1,841,549 | |||||||||||
See Notes to Financial Statements.
| PGIM Floating Rate Income Fund | 29 |
Schedule of Investments (continued)
as of February 29, 2020
| Description | Interest Rate | Maturity Date | Principal Amount (000)# | Value | ||||||||||||
BANK LOANS (Continued) | ||||||||||||||||
Telecommunications (cont’d.) | ||||||||||||||||
Digicel International Finance Ltd. (Saint Lucia), | 4.870 | %(c) | 05/27/24 | 2,491 | $ | 2,267,336 | ||||||||||
Front Range BidCo, Inc., | — | (p) | 02/21/27 | 1,350 | 1,317,375 | |||||||||||
Global Tel Link Corp., | 5.853 | (c) | 11/29/25 | 2,414 | 2,293,108 | |||||||||||
Second Lien Term Loan, 1 Month LIBOR + 8.250% | 9.853 | (c) | 11/27/26 | 825 | 708,469 | |||||||||||
GTT Communications, Inc., | 4.350 | (c)�� | 05/30/25 | 3,771 | 3,143,576 | |||||||||||
Iridium Satellite LLC, | 5.353 | (c) | 11/04/26 | 1,850 | 1,845,375 | |||||||||||
MLN US HoldCo LLC, | 6.155 | (c) | 11/30/25 | 2,352 | 2,222,517 | |||||||||||
Securus Technologies Holdings, Inc., | 9.834 | (c) | 11/01/25 | 750 | 344,375 | |||||||||||
Initial Term Loan (First Lien), 1 Month LIBOR + 4.500% | 6.103 | (c) | 11/01/24 | 2,518 | 1,978,989 | |||||||||||
Sprint Communications, Inc., | 4.125 | (c) | 02/02/24 | 12,097 | 11,991,122 | |||||||||||
West Corp., | 5.103 | (c) | 10/10/24 | 2,982 | 2,323,524 | |||||||||||
Initial Term B Loan, 1 Month LIBOR + 4.000% | 5.603 | (c) | 10/10/24 | 1,982 | 1,574,717 | |||||||||||
Xplornet Communications, Inc. (Canada), | 5.945 | (c) | 09/09/21 | 3,111 | 3,087,738 | |||||||||||
|
| |||||||||||||||
| 44,713,671 | ||||||||||||||||
Textiles 0.3% | ||||||||||||||||
ASP Unifrax Holdings, Inc., | 5.695 | (c) | 12/12/25 | 1,631 | 1,484,662 | |||||||||||
Transportation 0.7% | ||||||||||||||||
Daseke Co., Inc., | 6.603 | (c) | 02/27/24 | 3,359 | 3,224,291 | |||||||||||
See Notes to Financial Statements.
| 30 |
| Description | Interest Rate | Maturity Date | Principal Amount (000)# | Value | ||||||||||||
BANK LOANS (Continued) | ||||||||||||||||
Transportation (cont’d.) | ||||||||||||||||
Transplace Holdings, Inc., | 10.353 | %(c) | 10/06/25 | 204 | $ | 193,784 | ||||||||||
United Road Services, Inc., | 7.353 | (c) | 09/01/24 | 595 | 508,939 | |||||||||||
| 3,927,014 | ||||||||||||||||
|
| |||||||||||||||
TOTAL BANK LOANS | 444,302,438 | |||||||||||||||
|
| |||||||||||||||
CORPORATE BONDS 7.5% |
| |||||||||||||||
Advertising 0.1% | ||||||||||||||||
Terrier Media Buyer, Inc., | 8.875 | 12/15/27 | 300 | 297,765 | ||||||||||||
Aerospace & Defense 0.5% |
| |||||||||||||||
Bombardier, Inc. (Canada), | 7.500 | 12/01/24 | 450 | 455,990 | ||||||||||||
Sr. Unsec’d. Notes, 144A | 7.875 | 04/15/27 | 2,450 | 2,417,814 | ||||||||||||
|
| |||||||||||||||
| 2,873,804 | ||||||||||||||||
Agriculture 0.1% | ||||||||||||||||
Vector Group Ltd., | 6.125 | 02/01/25 | 700 | 676,901 | ||||||||||||
Auto Manufacturers 0.4% |
| |||||||||||||||
Ford Motor Credit Co. LLC, | 4.271 | 01/09/27 | 2,000 | 1,984,100 | ||||||||||||
Auto Parts & Equipment 0.1% | ||||||||||||||||
American Axle & Manufacturing, Inc., | 6.250 | 04/01/25 | 450 | 436,078 | ||||||||||||
Banks 0.3% | ||||||||||||||||
Bank of America Corp., | 4.300 | (ff) | — | (rr) | 1,105 | 1,068,599 | ||||||||||
Citigroup, Inc., | 4.700 | (ff) | — | (rr) | 550 | 543,592 | ||||||||||
|
| |||||||||||||||
| 1,612,191 | ||||||||||||||||
See Notes to Financial Statements.
| PGIM Floating Rate Income Fund | 31 |
Schedule of Investments (continued)
as of February 29, 2020
| Description | Interest Rate | Maturity Date | Principal Amount (000)# | Value | ||||||||||||
CORPORATE BONDS (Continued) | ||||||||||||||||
Chemicals 0.2% | ||||||||||||||||
Chemours Co. (The), | 5.375 | % | 05/15/27 | 1,000 | $ | 858,722 | ||||||||||
Entertainment 0.4% | ||||||||||||||||
AMC Entertainment Holdings, Inc., | 5.875 | 11/15/26 | 3,000 | 2,394,955 | ||||||||||||
Healthcare-Services 0.4% | ||||||||||||||||
Polaris Intermediate Corp., | 8.500 | 12/01/22 | 2,200 | 1,870,029 | ||||||||||||
Home Builders 0.5% | ||||||||||||||||
Ashton Woods USA LLC/Ashton Woods Finance Co., | 9.875 | 04/01/27 | 2,230 | 2,568,470 | ||||||||||||
Iron/Steel 0.2% | ||||||||||||||||
Cleveland-Cliffs, Inc., | 5.875 | 06/01/27 | 1,250 | 1,052,912 | ||||||||||||
Media 0.2% | ||||||||||||||||
Diamond Sports Group LLC/Diamond Sports Finance Co., | 6.625 | 08/15/27 | 1,525 | 1,235,078 | ||||||||||||
Oil & Gas 1.7% | ||||||||||||||||
Alta Mesa Holdings LP/Alta Mesa Finance Services Corp., | 7.875 | 12/15/24 | (d) | 6,725 | 14,408 | |||||||||||
Antero Resources Corp., | 5.125 | 12/01/22 | 1,850 | 1,151,317 | ||||||||||||
Gtd. Notes | 5.625 | 06/01/23 | 1,000 | 542,835 | ||||||||||||
Citgo Holding, Inc., | 9.250 | 08/01/24 | 975 | 1,013,900 | ||||||||||||
CNX Resources Corp., | 5.875 | 04/15/22 | 1,150 | 1,053,437 | ||||||||||||
Gtd. Notes, 144A | 7.250 | 03/14/27 | 1,300 | 963,325 | ||||||||||||
Extraction Oil & Gas, Inc., | 5.625 | 02/01/26 | 3,321 | 1,163,510 | ||||||||||||
Gtd. Notes, 144A | 7.375 | 05/15/24 | 500 | 179,217 | ||||||||||||
See Notes to Financial Statements.
| 32 |
| Description | Interest Rate | Maturity Date | Principal Amount (000)# | Value | ||||||||||||
CORPORATE BONDS (Continued) | ||||||||||||||||
Oil & Gas (cont’d.) | ||||||||||||||||
MEG Energy Corp. (Canada), | 7.125 | % | 02/01/27 | 1,725 | $ | 1,627,393 | ||||||||||
Range Resources Corp., | 4.875 | 05/15/25 | 1,500 | 949,271 | ||||||||||||
Gtd. Notes(a) | 5.000 | 03/15/23 | 675 | 489,274 | ||||||||||||
|
| |||||||||||||||
| 9,147,887 | ||||||||||||||||
Retail 0.4% | ||||||||||||||||
Ferrellgas Partners LP/Ferrellgas Partners Finance Corp., | 8.625 | 06/15/20 | 63 | 24,720 | ||||||||||||
Sr. Unsec’d. Notes | 8.625 | 06/15/20 | 925 | 396,031 | ||||||||||||
Michaels Stores, Inc., | 8.000 | 07/15/27 | 1,775 | 1,480,430 | ||||||||||||
Rite Aid Corp., | 6.125 | 04/01/23 | 470 | 425,720 | ||||||||||||
|
| |||||||||||||||
| 2,326,901 | ||||||||||||||||
Telecommunications 2.0% | ||||||||||||||||
Digicel Ltd. (Jamaica), Gtd. Notes, 144A | 6.750 | 03/01/23 | 2,000 | 1,287,363 | ||||||||||||
Sr. Unsec’d. Notes, 144A(a) | 6.000 | 04/15/21 | 1,375 | 1,092,904 | ||||||||||||
Embarq Corp., | 7.995 | 06/01/36 | 3,600 | 3,835,669 | ||||||||||||
Intelsat Jackson Holdings SA (Luxembourg), | 5.500 | 08/01/23 | 2,975 | 2,561,452 | ||||||||||||
Intrado Corp., | 8.500 | 10/15/25 | 2,675 | 1,803,634 | ||||||||||||
|
| |||||||||||||||
| 10,581,022 | ||||||||||||||||
|
| |||||||||||||||
TOTAL CORPORATE BONDS | 39,916,815 | |||||||||||||||
|
| |||||||||||||||
Shares | ||||||||||||||||
COMMON STOCKS 0.1% | ||||||||||||||||
Commercial Services & Supplies 0.0% | ||||||||||||||||
Tweddle Group, Inc.^ | 2,705 | 27 | ||||||||||||||
See Notes to Financial Statements.
| PGIM Floating Rate Income Fund | 33 |
Schedule of Investments (continued)
as of February 29, 2020
| Description | Shares | Value | ||||||||||||||
COMMON STOCKS (Continued) | ||||||||||||||||
Entertainment 0.0% | ||||||||||||||||
Deluxe Entainment Servicing Group, Inc. | 19,597 | $ | 13,973 | |||||||||||||
Oil, Gas & Consumable Fuels 0.0% | ||||||||||||||||
Ascent Resources - Marcellus LLC (Class A Stock)*^ | 182,358 | 45,590 | ||||||||||||||
Southcross Energy Partners LP^ | 118,773 | 11,877 | ||||||||||||||
|
| |||||||||||||||
| 57,467 | ||||||||||||||||
Software 0.1% | ||||||||||||||||
Avaya Holdings Corp.* | 32,696 | 423,740 | ||||||||||||||
|
| |||||||||||||||
TOTAL COMMON STOCKS | 495,207 | |||||||||||||||
|
| |||||||||||||||
PREFERRED STOCK 0.0% | ||||||||||||||||
Oil, Gas & Consumable Fuels | ||||||||||||||||
Southcross Energy Partners LP^ | 315,747 | 246,282 | ||||||||||||||
|
| |||||||||||||||
Units | ||||||||||||||||
WARRANTS* 0.0% | ||||||||||||||||
Oil, Gas & Consumable Fuels | ||||||||||||||||
Ascent Resources - Marcellus LLC, 1st Lien, expiring 03/30/23^ | 46,500 | 5 | ||||||||||||||
Ascent Resources - Marcellus LLC, 2nd Lien Tranche A, expiring 03/30/23^ | 18,026 | 2 | ||||||||||||||
Ascent Resources - Marcellus LLC, 2nd Lien Tranche B, expiring 03/30/23^ | 14,021 | 1 | ||||||||||||||
|
| |||||||||||||||
TOTAL WARRANTS | 8 | |||||||||||||||
|
| |||||||||||||||
TOTAL LONG-TERM INVESTMENTS | 525,315,829 | |||||||||||||||
|
| |||||||||||||||
Shares | ||||||||||||||||
SHORT-TERM INVESTMENTS 1.9% | ||||||||||||||||
AFFILIATED MUTUAL FUNDS | ||||||||||||||||
PGIM Core Ultra Short Bond Fund(w) | 10,541 | 10,541 | ||||||||||||||
See Notes to Financial Statements.
| 34 |
| Description | Shares | Value | ||||||||||||||
AFFILIATED MUTUAL FUNDS (Continued) | ||||||||||||||||
PGIM Institutional Money Market Fund | 10,071,587 | $ | 10,071,587 | |||||||||||||
|
| |||||||||||||||
TOTAL SHORT-TERM INVESTMENTS | 10,082,128 | |||||||||||||||
|
| |||||||||||||||
TOTAL INVESTMENTS 100.3% | 535,397,957 | |||||||||||||||
Liabilities in excess of other assets(z) (0.3)% | (1,723,190 | ) | ||||||||||||||
|
| |||||||||||||||
NET ASSETS 100.0% | $ | 533,674,767 | ||||||||||||||
|
| |||||||||||||||
Below is a list of the abbreviation(s) used in the annual report:
144A—Security was purchased pursuant to Rule 144A under the Securities Act of 1933 and, pursuant to the requirements of Rule 144A, may not be resold except to qualified institutional buyers.
A—Annual payment frequency for swaps
CLO—Collateralized Loan Obligation
LIBOR—London Interbank Offered Rate
M—Monthly payment frequency for swaps
OTC—Over-the-counter
PIK—Payment-in-Kind
Q—Quarterly payment frequency for swaps
REITs—Real Estate Investment Trust
S—Semiannual payment frequency for swaps
USOIS—United States Overnight Index Swap
| * | Non-income producing security. |
| # | Principal or notional amount is shown in U.S. dollars unless otherwise stated. |
| ^ | Indicates a Level 3 instrument. The aggregate value of Level 3 instruments is $109,053,502 and 20.4% of net assets. |
| (a) | All or a portion of security is on loan. The aggregate market value of such securities, including those sold and pending settlement, is $9,727,730; cash collateral of $10,060,811 (included in liabilities) was received with which the Fund purchased highly liquid short-term investments. |
| (b) | Represents security purchased with cash collateral received for securities on loan and includes dividend reinvestment. |
| (c) | Variable rate instrument. The interest rate shown reflects the rate in effect at February 29, 2020. |
| (d) | Represents issuer in default on interest payments and/or principal repayment. Non-income producing security. Such securities may be post-maturity. |
| (ff) | Variable rate security. Security may be issued at a fixed coupon rate, which converts to a variable rate at a specified date. Rate shown is the rate in effect as of period end. |
| (p) | Interest rate not available as of February 29, 2020. |
| (rr) | Perpetual security with no stated maturity date. |
| (w) | PGIM Investments LLC, the manager of the Fund, also serves as manager of the PGIM Core Ultra Short Bond Fund and PGIM Institutional Money Market Fund. |
| (z) | Includes net unrealized appreciation/(depreciation) and/or market value of the below holdings which are excluded from the Schedule of Investments: |
See Notes to Financial Statements.
| PGIM Floating Rate Income Fund | 35 |
Schedule of Investments (continued)
as of February 29, 2020
Credit default swap agreements outstanding at February 29, 2020:
Reference | Termination Date | Fixed Rate | Notional Amount (000)#(3) | Implied Credit Spread at February 29, 2020(4) | Fair Value | Upfront Premiums Paid (Received) | Unrealized Appreciation (Depreciation) | Counterparty | ||||||||||||||||||||||
| OTC Credit Default Swap Agreements on asset-backed securities - Sell Protection(2)^: | ||||||||||||||||||||||||||||||
Carlyle CLO | 03/26/20 | 0.500%(M) | 1,917 | * | $ | 825 | $ | — | $ | 825 | Goldman Sachs International | |||||||||||||||||||
Carlyle CLO | 03/26/20 | 1.000%(M) | 181 | * | 155 | — | 155 | Goldman Sachs International | ||||||||||||||||||||||
DFG CLO | 03/26/20 | 0.500%(M) | 356 | * | 153 | — | 153 | Goldman Sachs International | ||||||||||||||||||||||
DFG CLO | 03/26/20 | 1.000%(M) | 106 | * | 91 | — | 91 | Goldman Sachs International | ||||||||||||||||||||||
Galaxy CLO Ltd. | 03/26/20 | 1.000%(M) | 45 | * | 38 | — | 38 | Goldman Sachs International | ||||||||||||||||||||||
Guggenheim CLO | 03/26/20 | 1.000%(M) | 119 | 1.000 | % | 103 | — | 103 | Goldman Sachs International | |||||||||||||||||||||
ICG CLO | 03/26/20 | 1.000%(M) | 226 | 1.000 | % | 194 | — | 194 | Goldman Sachs International | |||||||||||||||||||||
LCM CLO | 03/26/20 | 1.000%(M) | 62 | * | 5 | — | 5 | Goldman Sachs International | ||||||||||||||||||||||
MJX CLO | 03/26/20 | 0.500%(M) | 156 | 0.500 | % | 67 | — | 67 | Goldman Sachs International | |||||||||||||||||||||
MJX CLO | 03/26/20 | 1.000%(M) | 113 | * | 97 | — | 97 | Goldman Sachs International | ||||||||||||||||||||||
MJX CLO | 03/26/20 | 1.000%(M) | 57 | * | 49 | — | 49 | Goldman Sachs International | ||||||||||||||||||||||
OCH-ZIFF CLO | 03/26/20 | 1.000%(M) | 388 | 1.000 | % | 334 | — | 334 | Goldman Sachs International | |||||||||||||||||||||
OCH-ZIFF CLO | 03/26/20 | 1.000%(M) | 179 | 1.000 | % | 154 | — | 154 | Goldman Sachs International | |||||||||||||||||||||
Octagon CLO | 03/26/20 | 1.000%(M) | 31 | 1.000 | % | 3 | — | 3 | Goldman Sachs International | |||||||||||||||||||||
See Notes to Financial Statements.
| 36 |
Credit default swap agreements outstanding at February 29, 2020 (continued):
Reference | Termination Date | Fixed Rate | Notional Amount (000)#(3) | Implied Credit Spread at February 29, 2020(4) | Fair Value | Upfront Premiums Paid (Received) | Unrealized Appreciation (Depreciation) | Counterparty | ||||||||||||||||||||||
| OTC Credit Default Swap Agreements on asset-backed securities - Sell Protection(2)^ (cont’d.): | ||||||||||||||||||||||||||||||
Pretium | 03/26/20 | 0.500%(M) | 1,135 | 0.500 | % | $ | 488 | $ | — | $ | 488 | Goldman Sachs International | ||||||||||||||||||
Saratoga CLO | 03/26/20 | 0.500%(M) | 993 | 0.500 | % | 427 | — | 427 | Goldman Sachs International | |||||||||||||||||||||
Steele Creek | 03/26/20 | 0.500%(M) | 1,138 | 0.500 | % | 490 | — | 490 | Goldman Sachs International | |||||||||||||||||||||
Steele Creek | 03/26/20 | 0.500%(M) | 360 | 0.500 | % | 155 | — | 155 | Goldman Sachs International | |||||||||||||||||||||
Voya CLO | 03/26/20 | 1.000%(M) | 317 | * | 272 | — | 272 | Goldman Sachs International | ||||||||||||||||||||||
Wellfleet CLO | 03/26/20 | 1.000%(M) | 189 | * | 162 | — | 162 | Goldman Sachs International | ||||||||||||||||||||||
|
|
|
|
|
| |||||||||||||||||||||||||
| $ | 4,262 | $ | — | $ | 4,262 | |||||||||||||||||||||||||
|
|
|
|
|
| |||||||||||||||||||||||||
The Fund entered into credit default swaps (“CDS”) to provide a measure of protection against defaults or to take an active long or short position with respect to the likelihood of a particular issuer’s default or the reference entity’s credit soundness. CDS contracts generally trade based on a spread which represents the cost a protection buyer has to pay the protection seller. The protection buyer is said to be short the credit as the value of the contract rises the more the credit deteriorates. The value of the CDS contract increases for the protection buyer if the spread increases.
| (1) | If the Fund is a buyer of protection, it pays the fixed rate. When a credit event occurs, as defined under the terms of that particular swap agreement, the Fund will either (i) receive from the seller of protection an amount equal to the notional amount of the swap and make delivery of the referenced obligation or underlying securities comprising the referenced index or (ii) receive a net settlement amount in the form of cash or securities equal to the notional amount of the swap less the recovery value of the referenced obligation or underlying securities comprising the referenced index. |
| (2) | If the Fund is a seller of protection, it receives the fixed rate. When a credit event occurs, as defined under the terms of that particular swap agreement, the Fund will either (i) pay to the buyer of protection an amount equal to the notional amount of the swap and take delivery of the referenced obligation or underlying securities comprising the referenced index or (ii) pay a net settlement amount in the form of cash or securities equal to the notional amount of the swap less the recovery value of the referenced obligation or underlying securities comprising the referenced index. |
See Notes to Financial Statements.
| PGIM Floating Rate Income Fund | 37 |
Schedule of Investments (continued)
as of February 29, 2020
| (3) | Notional amount represents the maximum potential amount the Fund could be required to pay as a seller of credit protection or receive as a buyer of credit protection if a credit event occurs as defined under the terms of that particular swap agreement. |
| (4) | Implied credit spreads, represented in absolute terms, utilized in determining the fair value of credit default swap agreements where the Fund is the seller of protection as of the reporting date serve as an indicator of the current status of the payment/ performance risk and represent the likelihood of risk of default for the credit derivative. The implied credit spread of a particular referenced entity reflects the cost of buying/selling protection and may include up-front payments required to be made to enter into the agreement. Wider credit spreads represent a deterioration of the referenced entity’s credit soundness and a greater likelihood of risk of default or other credit event occurring as defined under the terms of the agreement. |
| * | When an implied credit spread is not available, reference the fair value of credit default swap agreements on credit indices and asset-backed securities. Where the Fund is the seller of protection, it serves as an indicator of the current status of the payment/performance risk and represents the likelihood of an expected liability (or profit) for the credit derivative should the notional amount of the swap agreement be closed/sold as of the reporting date. Increasing fair value in absolute terms, when compared to the notional amount of the swap, represents a deterioration of the referenced entity’s credit soundness and a greater likelihood of risk of default or other credit event occurring as defined under the terms of the agreement. |
Interest rate swap agreements outstanding at February 29, 2020:
Notional | Termination Date | Fixed Rate | Floating Rate | Value at Trade Date | Value at February 29, 2020 | Unrealized Appreciation (Depreciation) | ||||||||||||||||||
Centrally Cleared Interest Rate Swap Agreements: | ||||||||||||||||||||||||
| 4,800 | 05/11/21 | 2.350%(A) | 1 Day USOIS(2)(A) | $ | 62,520 | $ | 111,082 | $ | 48,562 | |||||||||||||||
| 9,350 | 02/02/22 | 1.994%(S) | 3 Month LIBOR(1)(Q) | (8,646 | ) | (176,019 | ) | (167,373 | ) | |||||||||||||||
| 4,890 | 05/11/24 | 2.139%(S) | 3 Month LIBOR(2)(Q) | 96,571 | 267,771 | 171,200 | ||||||||||||||||||
| 16,255 | 05/11/24 | 2.250%(A) | 1 Day USOIS(2)(A) | 714,933 | 1,097,546 | 382,613 | ||||||||||||||||||
| 15,120 | 05/11/25 | 2.300%(A) | 1 Day USOIS(1)(A) | (734,808 | ) | (1,266,789 | ) | (531,981 | ) | |||||||||||||||
| 1,200 | 05/11/29 | 2.000%(S) | 3 Month LIBOR(1)(Q) | 103,312 | (104,676 | ) | (207,988 | ) | ||||||||||||||||
| 1,760 | 05/11/29 | 2.400%(A) | 1 Day USOIS(1)(A) | (190,744 | ) | (245,049 | ) | (54,305 | ) | |||||||||||||||
| 725 | 05/11/40 | 2.500%(A) | 1 Day USOIS(1)(A) | (96,342 | ) | (203,441 | ) | (107,099 | ) | |||||||||||||||
|
|
|
|
|
| |||||||||||||||||||
| $ | (53,204 | ) | $ | (519,575 | ) | $ | (466,371 | ) | ||||||||||||||||
|
|
|
|
|
| |||||||||||||||||||
| (1) | The Fund pays the fixed rate and receives the floating rate. |
| (2) | The Fund pays the floating rate and receives the fixed rate. |
Balances Reported in the Statement of Assets and Liabilities for OTC Swap Agreements:
| Premiums Paid | Premiums Received | Unrealized Appreciation | Unrealized Depreciation | |||||
OTC Swap Agreements | $— | $— | $4,262 | $— | ||||
|
|
|
|
See Notes to Financial Statements.
| 38 |
Summary of Collateral for Centrally Cleared/Exchange-traded Derivatives:
Cash and securities segregated as collateral, including pending settlement for closed positions, to cover requirements for centrally cleared/exchange-traded derivatives are listed by broker as follows:
Broker | Cash and/or Foreign Currency | Securities Market Value | ||
Citigroup Global Markets, Inc. | $363,000 | $— | ||
|
|
Fair Value Measurements:
Various inputs are used in determining the value of the Fund’s investments. These inputs are summarized in the three broad levels listed below.
Level 1—unadjusted quoted prices generally in active markets for identical securities.
Level 2—quoted prices for similar securities, interest rates and yield curves, prepayment speeds, foreign currency exchange rates and other observable inputs.
Level 3—unobservable inputs for securities valued in accordance with Board approved fair valuation procedures.
The following is a summary of the inputs used as of February 29, 2020 in valuing such portfolio securities:
| Level 1 | Level 2 | Level 3 | ||||||||||
Investments in Securities | ||||||||||||
Assets | ||||||||||||
Asset-Backed Securities | ||||||||||||
Collateralized Loan Obligations | $ | — | $ | 40,355,079 | $ | — | ||||||
Bank Loans | — | 335,556,982 | 108,745,456 | |||||||||
Corporate Bonds | — | 39,916,815 | — | |||||||||
Common Stocks | 423,740 | 13,973 | 57,494 | |||||||||
Preferred Stock | — | — | 246,282 | |||||||||
Warrants | — | — | 8 | |||||||||
Affiliated Mutual Funds | 10,082,128 | — | — | |||||||||
|
|
|
|
|
| |||||||
Total | $ | 10,505,868 | $ | 415,842,849 | $ | 109,049,240 | ||||||
|
|
|
|
|
| |||||||
Other Financial Instruments* | ||||||||||||
Assets | ||||||||||||
OTC Credit Default Swap Agreements | $ | — | $ | — | $ | 4,262 | ||||||
Centrally Cleared Interest Rate Swap Agreements | — | 602,375 | — | |||||||||
|
|
|
|
|
| |||||||
Total | $ | — | $ | 602,375 | $ | 4,262 | ||||||
|
|
|
|
|
| |||||||
Liabilities | ||||||||||||
Centrally Cleared Interest Rate Swap Agreements | $ | — | $ | (1,068,746 | ) | $ | — | |||||
|
|
|
|
|
| |||||||
See Notes to Financial Statements.
| PGIM Floating Rate Income Fund | 39 |
Schedule of Investments (continued)
as of February 29, 2020
The following is a reconciliation of assets in which unobservable inputs (Level 3) were used in determining fair value:
| Bank Loans | Common Stocks | Preferred Stocks | Warrants | OTC Credit Default Swap Agreements | ||||||||||||||||
Balance as of 02/28/19 | $ | 235,970,753 | $ | 501,511 | $ | — | $ | 2,969 | $ | 126,583 | ||||||||||
Realized gain (loss) | (4,127,809 | ) | (455,894 | ) | — | — | 121,565 | |||||||||||||
Change in unrealized appreciation (depreciation) | (500,002 | ) | 11,877 | 47,362 | (2,961 | ) | 4,262 | |||||||||||||
Purchases/Exchanges/Issuances | 70,542,700 | — | 198,920 | — | — | |||||||||||||||
Sales/Paydowns | (163,961,072 | ) | — | — | — | (248,148 | ) | |||||||||||||
Accrued discount/premium | 19,632 | — | — | — | — | |||||||||||||||
Transfers into Level 3 | 36,838,520 | — | — | — | — | |||||||||||||||
Transfers out of Level 3 | (66,037,266 | ) | — | — | — | — | ||||||||||||||
|
|
|
|
|
|
|
|
|
| |||||||||||
Balance as of 02/29/20 | $ | 108,745,456 | $ | 57,494 | $ | 246,282 | $ | 8 | $ | 4,262 | ||||||||||
|
|
|
|
|
|
|
|
|
| |||||||||||
Change in unrealized appreciation (depreciation) relating to securities still held at reporting period end | $ | (2,910,615 | ) | $ | (455,894 | ) | $ | 47,362 | $ | (2,961 | ) | $ | 4,262 | |||||||
|
|
|
|
|
|
|
|
|
| |||||||||||
| * | Other financial instruments are derivative instruments not reflected in the Schedule of Investments, such as futures, forwards and centrally cleared swap contracts, which are recorded at the unrealized appreciation (depreciation) on the instrument, and OTC swap contracts which are recorded at fair value. |
Level 3 securities as presented in the table above are being fair valued using pricing methodologies approved by Board, which contain unobservable inputs as follows:
Level 3 Securities | Fair Value as of February 29, 2020 | Valuation Methodology | Unobservable Inputs | Range (Weighted Average) | ||||||||||||
Bank Loans | $ | 108,745,456 | Market Approach | Single Broker Indicative Quote | $ | 30.00-$100.13 ($95.19) | ||||||||||
Common Stocks | 57,467 | Market Approach | Single Broker Indicative Quote | $ | 0.10-$0.25 ($0.19) | |||||||||||
Common Stocks | 27 | Enterprise Value | Estimated EBITDA | $ | 0.01 | |||||||||||
Preferred Stocks | 246,282 | Market Approach | Single Broker Indicative Quote | $ | 0.78 | |||||||||||
Warrants | 8 | Market Approach | Single Broker Indicative Quote | $ | 0.0001 | |||||||||||
Credit Default Swap Agreements | 4,262 | Market Approach | Single Broker Indicative Quote | $ | 0.01-$0.09 ($0.05) | |||||||||||
|
| |||||||||||||||
| $ | 109,053,502 | |||||||||||||||
|
| |||||||||||||||
See Notes to Financial Statements.
| 40 |
It is the Fund’s policy to recognize transfers in and transfers out at the fair value as of the beginning of period. Securities transferred levels as follows:
Investments in Securities | Amount Transferred | Level Transfer | Logic | |||||||
Bank Loans | $ | 66,037,266 | L3 to L2 | Single Broker Indicative Quote to Multiple Broker Quotes | ||||||
Bank Loans | $ | 36,838,520 | L2 to L3 | Multiple Broker Quotes to Single Broker Indicative Quote | ||||||
Industry Classification:
The industry classification of investments and liabilities in excess of other assets shown as a percentage of net assets as of February 29, 2020 were as follows (unaudited):
Telecommunications | 10.4 | % | ||
Software | 9.1 | |||
Retail | 7.6 | |||
Collateralized Loan Obligations | 7.6 | |||
Healthcare-Services | 6.3 | |||
Media | 4.5 | |||
Computers | 4.5 | |||
Chemicals | 4.1 | |||
Oil & Gas | 3.9 | |||
Commercial Services | 3.8 | |||
Diversified Financial Services | 3.2 | |||
Real Estate | 3.1 | |||
Foods | 2.6 | |||
Pharmaceuticals | 2.4 | |||
Machinery-Diversified | 2.3 | |||
Auto Parts & Equipment | 2.3 | |||
Affiliated Mutual Funds (1.9% represents investments purchased with collateral from securities on loan) | 1.9 | |||
Entertainment | 1.3 | |||
Building Materials | 1.3 | |||
Engineering & Construction | 1.3 | |||
Machinery-Construction & Mining | 1.2 | |||
Auto Manufacturers | 1.2 | |||
Metal Fabricate/Hardware | 1.1 | |||
Pipelines | 1.0 | |||
Holding Companies-Diversified | 0.9 | |||
Transportation | 0.7 | |||
Aerospace & Defense | 0.6 | |||
Real Estate Investment Trusts (REITs) | 0.6 | |||
Insurance | 0.6 | |||
Packaging & Containers | 0.5 | |||
Mining | 0.5 | |||
Apparel | 0.5 | |||
| Home Builders | 0.5 | % | ||
| Beverages | 0.4 | |||
| Leisure Time | 0.4 | |||
| Investment Companies | 0.4 | |||
| Environmental Control | 0.4 | |||
| Semiconductors | 0.4 | |||
| Lodging | 0.4 | |||
| Distribution/Wholesale | 0.4 | |||
| Advertising | 0.4 | |||
| Iron/Steel | 0.3 | |||
| Miscellaneous Manufacturing | 0.3 | |||
| Banks | 0.3 | |||
| Electrical Components & Equipment | 0.3 | |||
| Forest Products & Paper | 0.3 | |||
| Home Furnishings | 0.3 | |||
| Healthcare-Products | 0.3 | |||
| Textiles | 0.3 | |||
| Private Equity | 0.3 | |||
| Electronics | 0.3 | |||
| Electric | 0.2 | |||
| Coal | 0.2 | |||
| Cosmetics/Personal Care | 0.1 | |||
| Agriculture | 0.1 | |||
| Airlines | 0.1 | |||
| Oil, Gas & Consumable Fuels | 0.0* | |||
| Commercial Services & Supplies | 0.0* | |||
|
| |||
| 100.3 | ||||
| Liabilities in excess of other assets | (0.3 | ) | ||
|
| |||
| 100.0 | % | |||
|
|
| * | Less than +/- 0.05% |
See Notes to Financial Statements.
| PGIM Floating Rate Income Fund | 41 |
Schedule of Investments (continued)
as of February 29, 2020
Effects of Derivative Instruments on the Financial Statements and Primary Underlying Risk Exposure:
The Fund invested in derivative instruments during the reporting period. The primary types of risk associated with these derivative instruments are credit contracts risk, equity contracts risk and interest rate contracts risk. See the Notes to Financial Statements for additional detail regarding these derivative instruments and their risks. The effect of such derivative instruments on the Fund’s financial position and financial performance as reflected in the Statement of Assets and Liabilities and Statement of Operations is presented in the summary below.
Fair values of derivative instruments as of February 29, 2020 as presented in the Statement of Assets and Liabilities:
Derivatives not accounted | Asset Derivatives | Liability Derivatives | ||||||||||
Statement of | Fair Value | Statement of | Fair Value | |||||||||
| Credit contracts | Unrealized appreciation on OTC swap agreements | $ | 4,262 | — | $ | — | ||||||
| Equity contracts | Unaffiliated investments | 8 | — | — | ||||||||
| Interest rate contracts | Due from/to broker—variation margin swaps | 602,375 | * | Due from/to broker—variation margin swaps | 1,068,746 | * | ||||||
|
|
|
| |||||||||
| $ | 606,645 | $ | 1,068,746 | |||||||||
|
|
|
| |||||||||
| * | Includes cumulative appreciation (depreciation) as reported in the schedule of open futures and centrally cleared swap contracts. Only unsettled variation margin receivable (payable) is reported within the Statement of Assets and Liabilities. |
The effects of derivative instruments on the Statement of Operations for the year ended February 29, 2020 are as follows:
Amount of Realized Gain (Loss) on Derivatives Recognized in Income | ||||
Derivatives not accounted | Swaps | |||
Credit contracts | $ 205,817 | |||
Interest rate contracts | (929,992 | ) | ||
|
| |||
Total | $(724,175 | ) | ||
|
| |||
Change in Unrealized Appreciation (Depreciation) on Derivatives Recognized in Income | ||||||||
Derivatives not accounted for as hedging instruments, carried at fair value | Warrants(1) | Swaps | ||||||
Credit contracts | $ | — | $ | (122,321 | ) | |||
Equity contracts | (2,961 | ) | — | |||||
Interest rate contracts | — | (376,233 | ) | |||||
|
|
|
| |||||
Total | $ | (2,961 | ) | $ | (498,554 | ) | ||
|
|
|
| |||||
| (1) | Included in net change in unrealized appreciation (depreciation) on investments in the Statement of Operations. |
See Notes to Financial Statements.
| 42 |
For the year ended February 29, 2020, the Fund’s average volume of derivative activities is as follows:
| Interest Rate Swap Agreements(1) | ||||||||||
| $ | 41,285,000 | |||||||||
| Credit Default Swap Agreements— Sell Protection(1) | ||||||||||
| $ | 28,157,000 | |||||||||
| (1) | Notional Amount in USD. |
Financial Instruments/Transactions—Summary of Offsetting and Netting Arrangements:
The Fund invested in OTC derivatives and entered into financial instruments/transactions during the reporting period that are either offset in accordance with current requirements or are subject to enforceable master netting arrangements or similar agreements that permit offsetting. The information about offsetting and related netting arrangements for OTC derivatives and financial instruments/transactions where the legal right to set-off exists is presented in the summary below.
Offsetting of financial instrument/transaction assets and liabilities:
Description | Gross Market Value of Recognized Assets/ (Liabilities) | Collateral Pledged/ (Received)(2) | Net Amount | |||||||||||
| Securities on Loan | $ | 9,727,730 | $ | (9,727,730 | ) | $ | — | |||||||
|
| |||||||||||||
Offsetting of OTC derivative assets and liabilities:
Counterparty | Gross Amounts of Recognized Assets(1) | Gross Amounts of Recognized Liabilities(1) | Net Amounts of Recognized Assets/ (Liabilities) | Collateral Pledged/ (Received)(2) | Net Amount | |||||||||||||||||
| Goldman Sachs International | $ | 4,262 | $ | — | $ | 4,262 | $ | — | $ | 4,262 | ||||||||||||
|
|
|
|
|
|
|
|
|
| |||||||||||||
| (1) | Includes unrealized appreciation/(depreciation) on swaps and forwards, premiums paid/(received) on swap agreements and market value of purchased and written options, as represented on the Statement of Assets and Liabilities. |
| (2) | Collateral amount disclosed by the Fund is limited to the market value of financial instruments/transactions and the Fund’s OTC derivative exposure by counterparty. |
See Notes to Financial Statements.
| PGIM Floating Rate Income Fund | 43 |
Statement of Assets and Liabilities
as of February 29, 2020
Assets | ||||
Investments at value, including securities on loan of $9,727,730: | ||||
Unaffiliated investments (cost $557,307,549) | $ | 525,315,829 | ||
Affiliated investments (cost $10,082,745) | 10,082,128 | |||
Cash | 2,808,436 | |||
Foreign currency, at value (cost $8,012) | 7,818 | |||
Receivable for investments sold | 39,871,209 | |||
Receivable for Fund shares sold | 2,691,427 | |||
Dividends and interest receivable | 2,504,546 | |||
Deposit with broker for centrally cleared/exchange-traded derivatives | 363,000 | |||
Unrealized appreciation on OTC swap agreements | 4,262 | |||
Prepaid expenses | 3,282 | |||
|
| |||
Total Assets | 583,651,937 | |||
|
| |||
Liabilities | ||||
Payable for investments purchased | 30,651,345 | |||
Payable to broker for collateral for securities on loan | 10,060,811 | |||
Payable for Fund shares reacquired | 6,632,601 | |||
Loan payable | 1,705,000 | |||
Management fee payable | 324,505 | |||
Accrued expenses and other liabilities | 257,779 | |||
Dividends payable | 250,898 | |||
Due to broker—variation margin swaps | 44,320 | |||
Distribution fee payable | 39,750 | |||
Affiliated transfer agent fee payable | 10,161 | |||
|
| |||
Total Liabilities | 49,977,170 | |||
|
| |||
Net Assets | $ | 533,674,767 | ||
|
| |||
Net assets were comprised of: | ||||
Common stock, at par | $ | 568,554 | ||
Paid-in capital in excess of par | 584,556,062 | |||
Total distributable earnings (loss) | (51,449,849 | ) | ||
|
| |||
Net assets, February 29, 2020 | $ | 533,674,767 | ||
|
| |||
See Notes to Financial Statements.
| 44 |
Class A | ||||
Net asset value and redemption price per share, | $ | 9.38 | ||
Maximum sales charge (2.25% of offering price) | 0.21 | |||
|
| |||
Maximum offering price to public | $ | 9.59 | ||
|
| |||
Class C | ||||
Net asset value, offering price and redemption price per share, | ||||
($32,673,363 ÷ 3,482,529 shares of common stock issued and outstanding) | $ | 9.38 | ||
|
| |||
Class Z | ||||
Net asset value, offering price and redemption price per share, | ||||
($424,819,347 ÷ 45,251,639 shares of common stock issued and outstanding) | $ | 9.39 | ||
|
| |||
Class R6 | ||||
Net asset value, offering price and redemption price per share, | ||||
($14,789,818 ÷ 1,575,416 shares of common stock issued and outstanding) | $ | 9.39 | ||
|
| |||
See Notes to Financial Statements.
| PGIM Floating Rate Income Fund | 45 |
Statement of Operations
Year Ended February 29, 2020
Net Investment Income (Loss) | ||||
Income |
| |||
Interest income | $ | 47,522,794 | ||
Affiliated dividend income | 170,169 | |||
Income from securities lending, net (including affiliated income of $16,814) | 33,607 | |||
|
| |||
Total income | 47,726,570 | |||
|
| |||
Expenses | ||||
Management fee | 4,770,784 | |||
Distribution fee(a) | 640,488 | |||
Transfer agent’s fees and expenses (including affiliated expense of $68,959)(a) | 792,525 | |||
Custodian and accounting fees | 291,791 | |||
Registration fees(a) | 92,766 | |||
Audit fee | 61,074 | |||
Shareholders’ reports | 59,183 | |||
Directors’ fees | 22,150 | |||
Legal fees and expenses | 22,013 | |||
Miscellaneous | 260,231 | |||
|
| |||
Total expenses | 7,013,005 | |||
Less: Fee waiver and/or expense reimbursement(a) | (1,113,089 | ) | ||
|
| |||
Net expenses | 5,899,916 | |||
|
| |||
Net investment income (loss) | 41,826,654 | |||
|
| |||
Realized And Unrealized Gain (Loss) On Investment And Foreign Currency Transactions | ||||
Net realized gain (loss) on: | ||||
Investment transactions (including affiliated of $(314)) | (10,154,138 | ) | ||
Swap agreement transactions | (724,175 | ) | ||
|
| |||
| (10,878,313 | ) | |||
|
| |||
Net change in unrealized appreciation (depreciation) on: | ||||
Investments (including affiliated of $(1,867)) | (12,478,800 | ) | ||
Swap agreements | (498,554 | ) | ||
Foreign currencies | (236 | ) | ||
Unfunded loan commitments | 15,595 | |||
|
| |||
| (12,961,995 | ) | |||
|
| |||
Net gain (loss) on investment and foreign currency transactions | (23,840,308 | ) | ||
|
| |||
Net Increase (Decrease) In Net Assets Resulting From Operations | $ | 17,986,346 | ||
|
| |||
| (a) | Class specific expenses and waivers were as follows: |
| Class A | Class C | Class Z | Class R6 | |||||||||||||
Distribution fee | 199,495 | 440,993 | — | — | ||||||||||||
Transfer agent’s fees and expenses | 67,246 | 39,796 | 684,805 | 678 | ||||||||||||
Registration fees | 19,147 | 15,993 | 42,256 | 15,370 | ||||||||||||
Fee waiver and/or expense reimbursement | (109,557 | ) | (68,611 | ) | (898,402 | ) | (36,519 | ) | ||||||||
See Notes to Financial Statements.
| 46 |
Statements of Changes in Net Assets
| Year Ended February 28/29, | ||||||||
| 2020 | 2019 | |||||||
Increase (Decrease) in Net Assets | ||||||||
Operations | ||||||||
Net investment income (loss) | $ | 41,826,654 | $ | 48,014,394 | ||||
Net realized gain (loss) on investment transactions | (10,878,313 | ) | (6,635,207 | ) | ||||
Net change in unrealized appreciation (depreciation) on investments and foreign currencies | (12,961,995 | ) | (20,094,626 | ) | ||||
|
|
|
| |||||
Net increase (decrease) in net assets resulting from operations | 17,986,346 | 21,284,561 | ||||||
|
|
|
| |||||
Dividends and Distributions | ||||||||
Distributions from distributable earnings | ||||||||
Class A | (4,516,648 | ) | (4,814,691 | ) | ||||
Class C | (2,163,324 | ) | (2,396,926 | ) | ||||
Class Z | (34,450,357 | ) | (39,419,140 | ) | ||||
Class R6 | (1,531,460 | ) | (2,026,069 | ) | ||||
|
|
|
| |||||
| (42,661,789 | ) | (48,656,826 | ) | |||||
|
|
|
| |||||
Fund share transactions (Net of share conversions) | ||||||||
Net proceeds from shares sold | 271,104,830 | 1,103,200,027 | ||||||
Net asset value of shares issued in reinvestment of dividends and distributions | 39,834,672 | 46,324,113 | ||||||
Cost of shares reacquired | (755,201,092 | ) | (678,557,917 | ) | ||||
|
|
|
| |||||
Net increase (decrease) in net assets from Fund share transactions | (444,261,590 | ) | 470,966,223 | |||||
|
|
|
| |||||
Total increase (decrease) | (468,937,033 | ) | 443,593,958 | |||||
Net Assets: | ||||||||
Beginning of year | 1,002,611,800 | 559,017,842 | ||||||
|
|
|
| |||||
End of year | $ | 533,674,767 | $ | 1,002,611,800 | ||||
|
|
|
| |||||
See Notes to Financial Statements.
| PGIM Floating Rate Income Fund | 47 |
Notes to Financial Statements
Prudential Investment Portfolios, Inc. 14 (the “Company”) is registered under the Investment Company Act of 1940, as amended (“1940 Act”), as a diversified, open-end management investment company. The Company consists of two funds: PGIM Government Income Fund and PGIM Floating Rate Income Fund. These financial statements relate only to the PGIM Floating Rate Income Fund (the “Fund’).
The primary investment objective of the Fund is to maximize current income. The secondary investment objective is to seek capital appreciation when consistent with the Fund’s primary investment objective.
1. Accounting Policies
The Fund follows the investment company accounting and reporting guidance of the Financial Accounting Standards Board (“FASB”) Accounting Standard Codification (“ASC”) Topic 946 Financial Services—Investment Companies. The following accounting policies conform to U.S. generally accepted accounting principles. The Fund consistently follows such policies in the preparation of its financial statements.
Securities Valuation: The Fund holds securities and other assets and liabilities that are fair valued at the close of each day (generally, 4:00 PM Eastern time) the New York Stock Exchange (“NYSE”) is open for trading. Fair value is the price that would be received to sell an asset or paid to transfer a liability in an orderly transaction between market participants on the measurement date. The Company’s Board of Directors (the “Board”) has adopted valuation procedures for security valuation under which fair valuation responsibilities have been delegated to PGIM Investments LLC (“PGIM Investments” or the “Manager”). Pursuant to the Board’s delegation, the Manager has established a Valuation Committee responsible for supervising the fair valuation of portfolio securities and other assets and liabilities. The valuation procedures permit the Fund to utilize independent pricing vendor services, quotations from market makers, and alternative valuation methods when market quotations are either not readily available or not deemed representative of fair value. A record of the Valuation Committee’s actions is subject to the Board’s review, approval, and ratification at its next regularly scheduled quarterly meeting.
For the fiscal reporting year-end, securities and other assets and liabilities were fair valued at the close of the last U.S. business day. Trading in certain foreign securities may occur when the NYSE is closed (including weekends and holidays). Because such foreign securities trade in markets that are open on weekends and U.S. holidays, the values of some of the Fund’s foreign investments may change on days when investors cannot purchase or redeem Fund shares.
| PGIM Floating Rate Income Fund | 48 |
Various inputs determine how the Fund’s investments are valued, all of which are categorized according to the three broad levels (Level 1, 2, or 3) detailed in the Schedule of Investments and referred to herein as the “fair value hierarchy” in accordance with FASB ASC Topic 820—Fair Value Measurements and Disclosures.
Investments in open-end, non-exchange-traded mutual funds are valued at their net asset values as of the close of the NYSE on the date of valuation. These securities are classified as Level 1 in the fair value hierarchy since they may be purchased or sold at their net asset values on the date of valuation.
Fixed income securities traded in the OTC market are generally classified as Level 2 in the fair value hierarchy. Such fixed income securities are typically valued using the market approach which generally involves obtaining data from an approved independent third-party vendor source. The Fund utilizes the market approach as the primary method to value securities when market prices of identical or comparable instruments are available. The third-party vendors’ valuation techniques used to derive the evaluated bid price are based on evaluating observable inputs, including but not limited to, yield curves, yield spreads, credit ratings, deal terms, tranche level attributes, default rates, cash flows, prepayment speeds, broker/dealer quotations and reported trades. Certain Level 3 securities are also valued using the market approach when obtaining a single broker quote or when utilizing transaction prices for identical securities that have been used in excess of five business days. During the reporting period, there were no changes to report with respect to the valuation approach and/or valuation techniques discussed above.
Bank loans are generally valued at prices provided by approved independent pricing vendors. The pricing vendors utilize broker/dealer quotations and provide prices based on the average of such quotations. Bank loans valued using such vendor prices are generally classified as Level 2 in the fair value hierarchy. Bank loans valued based on a single broker quote or at the original transaction price in excess of five business days are classified as Level 3 in the fair value hierarchy.
OTC and centrally cleared derivative instruments are generally classified as Level 2 in the fair value hierarchy. Such derivative instruments are typically valued using the market approach and/or income approach which generally involves obtaining data from an approved independent third-party vendor source. The Fund utilizes the market approach when quoted prices in broker-dealer markets are available but also includes consideration of alternative valuation approaches, including the income approach. In the absence of reliable market quotations, the income approach is typically utilized for purposes of valuing derivatives such as interest rate swaps based on a discounted cash flow analysis whereby the value of the instrument is equal to the present value of its future cash inflows or outflows. Such analysis includes projecting future cash flows and determining the discount rate (including the present value factors that affect the discount rate) used to discount the future cash flows. In addition, the third-party vendors’ valuation techniques used to derive the evaluated derivative price is based on evaluating observable inputs, including but not limited to, underlying asset prices, indices, spreads, interest rates and exchange rates. Certain
| PGIM Floating Rate Income Fund | 49 |
Notes to Financial Statements (continued)
derivatives may be classified as Level 3 when valued using the market approach by obtaining a single broker quote or when utilizing unobservable inputs in the income approach. During the reporting period, there were no changes to report with respect to the valuation approach and/or valuation techniques discussed above.
Securities and other assets that cannot be priced according to the methods described above are valued based on pricing methodologies approved by the Board. In the event that unobservable inputs are used when determining such valuations, the securities will be classified as Level 3 in the fair value hierarchy.
When determining the fair value of securities, some of the factors influencing the valuation include: the nature of any restrictions on disposition of the securities; assessment of the general liquidity of the securities; the issuer’s financial condition and the markets in which it does business; the cost of the investment; the size of the holding and the capitalization of the issuer; the prices of any recent transactions or bids/offers for such securities or any comparable securities; any available analyst media or other reports or information deemed reliable by the Manager regarding the issuer or the markets or industry in which it operates. Using fair value to price securities may result in a value that is different from a security’s most recent closing price and from the price used by other unaffiliated mutual funds to calculate their net asset values.
Illiquid Securities: Pursuant to Rule 22e-4 under the 1940 Act, the Fund has adopted a Board approved Liquidity Risk Management Program (“LRMP”) that requires, among other things, that the Fund limit its illiquid investments that are assets to no more than 15% of net assets. Illiquid securities are those that, because of the absence of a readily available market or due to legal or contractual restrictions on resale, may not reasonably be expected to be sold or disposed of in current market conditions in seven calendar days or less without the sale or disposition significantly changing the market value of the investment. The Fund may find it difficult to sell illiquid securities at the time considered most advantageous by its subadviser(s) and may incur transaction costs that would not be incurred in the sale of securities that were freely marketable.
Restricted Securities: Securities acquired in unregistered, private sales from the issuing company or from an affiliate of the issuer are considered restricted as to disposition under federal securities law (“restricted securities”). Such restricted securities are valued pursuant to the valuation procedures noted above. Restricted securities that would otherwise be considered illiquid investments pursuant to the Fund’s LRMP because of legal restrictions on resale to the general public may be traded among qualified institutional buyers under Rule 144A of the Securities Act of 1933. Therefore, these Rule 144A securities, as well as commercial paper that is sold in private placements under Section 4(2) of the Securities Act of 1933, may be classified higher than “illiquid” under the LRMP (i.e. “moderately liquid” or
| 50 |
“less liquid” investments). However, the liquidity of the Fund’s investments in restricted securities could be impaired if trading does not develop or declines.
Foreign Currency Translation: The books and records of the Fund are maintained in U.S. dollars. Foreign currency amounts are translated into U.S. dollars on the following basis:
(i) market value of investment securities, other assets and liabilities—at the current rates of exchange;
(ii) purchases and sales of investment securities, income and expenses—at the rates of exchange prevailing on the respective dates of such transactions.
Although the net assets of the Fund are presented at the foreign exchange rates and market values at the close of the period, the Fund does not generally isolate that portion of the results of operations arising as a result of changes in the foreign exchange rates from the fluctuations arising from changes in the market prices of long-term portfolio securities held at the end of the period. Similarly, the Fund does not isolate the effect of changes in foreign exchange rates from the fluctuations arising from changes in the market prices of long-term portfolio securities sold during the period. Accordingly, holding period realized foreign currency gains (losses) are included in the reported net realized gains (losses) on investment transactions. Notwithstanding the above, the Fund does isolate the effect of fluctuations in foreign currency exchange rates when determining the gain (loss) upon the sale or maturity of foreign currency denominated debt obligations; such amounts are included in net realized gains (losses) on foreign currency transactions.
Additionally, net realized gains (losses) on foreign currency transactions represent net foreign exchange gains (losses) from the disposition of holdings of foreign currencies, currency gains (losses) realized between the trade and settlement dates on investment transactions, and the difference between the amounts of interest, dividends and foreign withholding taxes recorded on the Fund’s books and the U.S. dollar equivalent amounts actually received or paid. Net unrealized currency gains (losses) arise from valuing foreign currency denominated assets and liabilities (other than investments) at period end exchange rates.
Bank Loans: The Fund invests at least 80% of its investable assets in bank loans. Bank loans include fixed and floating rate loans that are privately negotiated between a corporate borrower and one or more financial institutions, including, but not limited to, term loans, revolvers, and other instruments issued in the bank loan market. Most bank loans are senior in rank (“senior loans”) in the event of bankruptcy to most other securities of the issuer, such as common stock or publicly-issued bonds. Bank loans are often secured by specific collateral of the issuer so that holders of the loans will have a priority claim on those assets in the event of default or bankruptcy of the issuer. The Fund acquired interests in loans directly (by way of assignment from the selling institution) or indirectly (by way of the purchase of a participation interest from the selling institution). Under a bank loan assignment, the Fund generally will succeed to all the rights and obligations of an assigning lending institution and
| PGIM Floating Rate Income Fund | 51 |
Notes to Financial Statements (continued)
becomes a lender under the loan agreement with the relevant borrower in connection with that loan. Under a bank loan participation, the Fund generally will have a contractual relationship only with the lender, not with the relevant borrower. As a result, the Fund generally will have the right to receive payments of principal, interest, and any fees to which it is entitled only from the lender selling the participation and only upon receipt by the lender of the payments from the relevant borrower. The Fund may not directly benefit from the collateral supporting the debt obligation in which it has purchased the participation. As a result, the Fund will assume the credit risk of both the borrower and the institution selling the participation to the Fund. In addition, loans trade in an over-the counter market, and confirmation and settlement, which are effected through standardized procedures and documentation, may take significantly longer than seven days to complete. Extended trade settlement periods may, in unusual market conditions with a high volume of shareholder redemptions, present a risk to shareholders regarding the Fund’s ability to pay redemption proceeds within the allowable time periods.
Swap Agreements: The Fund entered into certain types of swap agreements detailed in the disclosures below. A swap agreement is an agreement to exchange the return generated by one instrument for the return generated by another instrument. Swap agreements are negotiated in the OTC market and may be executed either directly with a counterparty (“OTC-traded”) or through a central clearing facility, such as a registered exchange. Swap agreements are valued daily at current market value and any change in value is included in the net unrealized appreciation (depreciation) on swap agreements. Centrally cleared swaps pay or receive an amount known as “variation margin”, based on daily changes in the valuation of the swap contract. For OTC-traded, upfront premiums paid and received are shown as swap premiums paid and swap premiums received in the Statement of Assets and Liabilities. Risk of loss may exceed amounts recognized on the Statement of Assets and Liabilities. Swap agreements outstanding at period end, if any, are listed on the Schedule of Investments.
Interest Rate Swaps: Interest rate swaps represent an agreement between counterparties to exchange cash flows based on the difference between two interest rates, applied to a notional principal amount for a specified period. The Fund is subject to interest rate risk exposure in the normal course of pursuing its investment objective. The Fund used interest rate swaps to maintain its ability to generate steady cash flow by receiving a stream of fixed rate payments or to increase exposure to prevailing market rates by receiving floating rate payments. The Fund’s maximum risk of loss from counterparty credit risk is the discounted net present value of the cash flows to be received from the counterparty over the contract’s remaining life.
Credit Default Swaps (“CDS”): CDS involve one party (the protection buyer) making a stream of payments to another party (the protection seller) in exchange for the right to receive a
| 52 |
specified payment in the event of a default or as a result of a default (collectively a “credit event”) for the referenced entity (typically corporate issues or sovereign issues of an emerging country) on its obligation; or in the event of a write-down, principal shortfall, interest shortfall or default of all or part of the referenced entities comprising a credit index.
The Fund is subject to credit risk in the normal course of pursuing its investment objectives, and as such, has entered into CDS contracts to provide a measure of protection against defaults or to take an active long or short position with respect to the likelihood of a particular issuer’s default or the reference entity’s credit soundness. CDS contracts generally trade based on a spread which represents the cost a protection buyer has to pay the protection seller. The protection buyer is said to be short the credit as the value of the contract rises the more the credit deteriorates. The value of the CDS contract increases for the protection buyer if the spread increases. The Fund’s maximum risk of loss from counterparty credit risk for purchased CDS is the inability of the counterparty to honor the contract up to the notional value due to a credit event.
As a seller of protection on credit default swap agreements, the Fund generally receives an agreed upon payment from the buyer of protection throughout the term of the swap, provided no credit event occurs. As the seller, the Fund effectively increases its investment risk because, in addition to its total net assets, the Fund may be subject to investment exposure on the notional amount of the swap.
The maximum amount of the payment that the Fund, as a seller of protection, could be required to make under a credit default swap agreement would be equal to the notional amount of the underlying security or index contract as a result of a credit event. This potential amount will be partially offset by any recovery values of the respective referenced obligations, or net amounts received from the settlement of buy protection credit default swap agreements which the Fund entered into for the same referenced entity or index. As a buyer of protection, the Fund generally receives an amount up to the notional value of the swap if a credit event occurs.
Implied credit spreads, represented in absolute terms, utilized in determining the market value of credit default swap agreements where the Fund is the seller of protection as of period end are disclosed in the footnotes to the Schedule of Investments, if applicable. These spreads serve as indicators of the current status of the payment/performance risk and represent the likelihood of default risk for the credit derivative. The implied credit spread of a particular referenced entity reflects the cost of buying/selling protection and may include upfront payments required to enter into the agreement. Wider credit spreads and increased market value in absolute terms, when compared to the notional amount of the swap, represent a deterioration of the referenced entity’s credit soundness and a greater likelihood of risk of default or other credit event occurring as defined under the terms of the agreement.
Master Netting Arrangements: The Company, on behalf of the Fund, is subject to various Master Agreements, or netting arrangements, with select counterparties. These are
| PGIM Floating Rate Income Fund | 53 |
Notes to Financial Statements (continued)
agreements which a subadviser may have negotiated and entered into on behalf of all or a portion of the Fund. A master netting arrangement between the Fund and the counterparty permits the Fund to offset amounts payable by the Fund to the same counterparty against amounts to be received; and by the receipt of collateral from the counterparty by the Fund to cover the Fund’s exposure to the counterparty. However, there is no assurance that such mitigating factors are easily enforceable. In addition to master netting arrangements, the right to set-off exists when all the conditions are met such that each of the parties owes the other determinable amounts, the reporting party has the right to set-off the amount owed with the amount owed by the other party, the reporting party intends to set-off and the right of set-off is enforceable by law. During the reporting period, there was no intention to settle on a net basis and all amounts are presented on a gross basis on the Statement of Assets and Liabilities.
The Company, on behalf of the Fund, is a party to International Swaps and Derivatives Association, Inc. (“ISDA”) Master Agreements with certain counterparties that govern OTC derivative and foreign exchange contracts entered into from time to time. The Master Agreements may contain provisions regarding, among other things, the parties’ general obligations, representations, agreements, collateral requirements, events of default and early termination. With respect to certain counterparties, in accordance with the terms of the Master Agreements, collateral posted to the Fund is held in a segregated account by the Fund’s custodian and with respect to those amounts which can be sold or re-pledged, is presented in the Schedule of Investments. Collateral pledged by the Fund is segregated by the Fund’s custodian and identified in the Schedule of Investments. Collateral can be in the form of cash or debt securities issued by the U.S. Government or related agencies or other securities as agreed to by the Fund and the applicable counterparty. Collateral requirements are determined based on the Fund’s net position with each counterparty. Termination events applicable to the Fund may occur upon a decline in the Fund’s net assets below a specified threshold over a certain period of time. Termination events applicable to counterparties may occur upon a decline in the counterparty’s long-term and short-term credit ratings below a specified level. In each case, upon occurrence, the other party may elect to terminate early and cause settlement of all derivative and foreign exchange contracts outstanding, including the payment of any losses and costs resulting from such early termination, as reasonably determined by the terminating party. Any decision by one or more of the Fund’s counterparties to elect early termination could impact the Fund’s future derivative activity.
In addition to each instrument’s primary underlying risk exposure (e.g. interest rate, credit, equity or foreign exchange, etc.), swap agreements involve, to varying degrees, elements of credit, market and documentation risk. Such risks involve the possibility that no liquid market for these agreements will exist, the counterparty to the agreement may default on its obligation to perform or disagree on the contractual terms of the agreement, and changes in net interest rates will be unfavorable. In connection with these agreements, securities in the
| 54 |
portfolio may be identified or received as collateral from the counterparty in accordance with the terms of the respective swap agreements to provide or receive assets of value and to serve as recourse in the event of default or bankruptcy/insolvency of either party. Such OTC derivative agreements include conditions which, when materialized, give the counterparty the right to cause an early termination of the transactions under those agreements. Any election by the counterparty for early termination of the contract(s) may impact the amounts reported on financial statements.
As of February 29, 2020, the Fund has not met conditions under such agreements which give the counterparty the right to call for an early termination.
Forward currency contracts, forward rate agreements, written options, short sales, swaps and financial futures contracts involve elements of both market and credit risk in excess of the amounts reflected on the Statement of Assets and Liabilities. Such risks may be mitigated by engaging in master netting arrangements.
Warrants: The Fund held warrants acquired either through a direct purchase or pursuant to corporate actions. Warrants entitle the holder to buy a proportionate amount of common stock, or such other security that the issuer may specify, at a specific price and time through the expiration dates. Such warrants are held as long positions by the Fund until exercised, sold or expired. Warrants are valued at fair value in accordance with the Board approved fair valuation procedures.
Payment-In-Kind: The Fund invested in the open market or receive pursuant to debt restructuring, securities that pay-in-kind (PIK) the interest due on such debt instruments. The PIK interest, computed at the contractual rate specified, is added to the existing principal balance of the debt when issued bonds have same terms as the bond or recorded as a separate bond when terms are different from the existing debt, and is recorded as interest income.
Securities Lending: The Fund lends its portfolio securities to banks and broker-dealers. The loans are secured by collateral at least equal to the market value of the securities loaned. Collateral pledged by each borrower is invested in an affiliated money market fund and is marked to market daily, based on the previous day’s market value, such that the value of the collateral exceeds the value of the loaned securities. In the event of significant appreciation in value of securities on loan on the last business day of the reporting period, the financial statements may reflect a collateral value that is less than the market value of the loaned securities. Such shortfall is remedied as described above. Loans are subject to termination at the option of the borrower or the Fund. Upon termination of the loan, the borrower will return to the Fund securities identical to the loaned securities. Should the borrower of the securities fail financially, the Fund has the right to repurchase the securities in the open market using the collateral.
The Fund recognizes income, net of any rebate and securities lending agent fees, for lending its securities in the form of fees or interest on the investment of any cash received as
| PGIM Floating Rate Income Fund | 55 |
Notes to Financial Statements (continued)
collateral. The borrower receives all interest and dividends from the securities loaned and such payments are passed back to the lender in amounts equivalent thereto. The Fund also continues to recognize any unrealized gain (loss) in the market price of the securities loaned and on the change in the value of the collateral invested that may occur during the term of the loan. In addition, realized gain (loss) is recognized on changes in the value of the collateral invested upon liquidation of the collateral. Net earnings from securities lending are disclosed in the Statement of Operations.
Securities Transactions and Net Investment Income: Securities transactions are recorded on the trade date. Realized gains (losses) from investment and currency transactions are calculated on the specific identification method. Dividend income is recorded on the ex-date, or for certain foreign securities, when the Fund becomes aware of such dividends. Interest income, including amortization of premium and accretion of discount on debt securities, as required, is recorded on the accrual basis. Expenses are recorded on an accrual basis, which may require the use of certain estimates by management that may differ from actual. Net investment income or loss (other than class specific expenses and waivers, which are allocated as noted below) and unrealized and realized gains (losses) are allocated daily to each class of shares based upon the relative proportion of adjusted net assets of each class at the beginning of the day. Class specific expenses and waivers, where applicable, are charged to the respective share classes. Class specific expenses include distribution fees and distribution fee waivers, shareholder servicing fees, transfer agent’s fees and expenses, registration fees and fee waivers and/or expense reimbursements, as applicable.
Taxes: It is the Fund’s policy to continue to meet the requirements of the Internal Revenue Code applicable to regulated investment companies and to distribute all of its taxable net investment income and capital gains, if any, to its shareholders. Therefore, no federal income tax provision is required. Withholding taxes on foreign dividends, interest and capital gains, if any, are recorded, net of reclaimable amounts, at the time the related income is earned.
Dividends and Distributions: The Fund expects to declare dividends of its net investment income daily and pay such dividends monthly. Distributions of net realized capital and currency gains, if any, are declared and paid at least annually. Dividends and distributions to shareholders, which are determined in accordance with federal income tax regulations and which may differ from generally accepted accounting principles, are recorded on the ex-date. Permanent book/tax differences relating to income and gain (loss) are reclassified between total distributable earnings (loss) and paid-in capital in excess of par, as appropriate.
| 56 |
Estimates: The preparation of financial statements requires management to make estimates and assumptions that affect the reported amounts and disclosures in the financial statements. Actual results could differ from those estimates.
2. Agreements
The Company, on behalf of the Fund, has a management agreement with the Manager. Pursuant to this agreement, the Manager has responsibility for all investment advisory services and supervises the subadviser’s performance of such services. In addition, under the management agreement, the Manager provides all of the administrative functions necessary for the organization, operation and management of the Fund. The Manager administers the corporate affairs of the Fund and, in connection therewith, furnishes the Fund with office facilities, together with those ordinary clerical and bookkeeping services which are not being furnished by the Fund’s custodian and the Fund’s transfer agent. The Manager is also responsible for the staffing and management of dedicated groups of legal, marketing, compliance and related personnel necessary for the operation of the Fund. The legal, marketing, compliance and related personnel are also responsible for the management and oversight of the various service providers to the Fund, including, but not limited to, the custodian, transfer agent, and accounting agent.
The Manager has entered into a subadvisory agreement with PGIM, Inc., which provides subadvisory services to the Fund through PGIM Fixed Income and PGIM Limited, each of which is a business unit of PGIM, Inc. The subadvisory agreement provides that PGIM, Inc. will furnish investment advisory services in connection with the management of the Fund. In connection therewith, PGIM, Inc. is obligated to keep certain books and records of the Fund. The Manager pays for the services of PGIM, Inc., the cost of compensation of officers of the Fund, occupancy and certain clerical and bookkeeping costs of the Fund. The Fund bears all other costs and expenses.
The management fee paid to the Manager is accrued daily and payable monthly at an annual rate of 0.65% of the Fund’s average daily net assets up to $5 billion and 0.625% of the Fund’s average daily net assets in excess of $5 billion. The effective management fee rate before any waivers and/or expense reimbursements was 0.65% for the year ended February 29, 2020.
The Manager has contractually agreed, through June 30, 2021, to limit total annual operating expenses after fee waivers and/or expense reimbursements to 0.95% of average daily net assets for Class A shares, 1.70% of average daily net assets for Class C shares, 0.70% of average daily net assets for Class Z shares, and 0.65% of average daily net assets for Class R6 shares. This contractual waiver excludes interest, brokerage, taxes (such as income and foreign withholding taxes, stamp duty and deferred tax expenses), acquired fund fees and expenses, extraordinary expenses, and certain other Fund expenses such as dividend and interest expense and broker charges on short sales.
| PGIM Floating Rate Income Fund | 57 |
Notes to Financial Statements (continued)
Where applicable, the Manager agrees, to waive management fees or shared operating expenses on any share class to the same extent that it waives similar expenses on any other share class and, in addition, total annual operating expenses for Class R6 shares will not exceed total annual operating expenses for Class Z shares. Fees and/or expenses waived and/or reimbursed by the Manager may be recouped by the Manager within the same fiscal year during which such waiver/reimbursement is made if such recoupment can be realized without exceeding the expense limit in effect at the time of the recoupment for that fiscal year.
The Company, on behalf of the Fund, has a distribution agreement with Prudential Investment Management Services LLC (“PIMS”), which acts as the distributor of the Class A, Class C, Class Z and Class R6 shares of the Fund. The Fund compensates PIMS for distributing and servicing the Fund’s Class A and Class C shares, pursuant to the plans of distribution (the “Distribution Plans”), regardless of expenses actually incurred by PIMS. The distribution fees are accrued daily and payable monthly. No distribution or service fees are paid to PIMS as distributor of the Class Z and Class R6 shares of the Fund.
Pursuant to the Distribution Plans, the Fund compensates PIMS for distribution related activities at an annual rate of up to 0.25% and 1% of the average daily net assets of the Class A and Class C shares, respectively.
For the year ended February 29, 2020, PIMS received $56,409 in front-end sales charges resulting from sales of Class A shares. Additionally, for the year ended February 29, 2020, PIMS received $190 and $8,177 in contingent deferred sales charges imposed upon redemptions by certain Class A and Class C shareholders. From these fees, PIMS paid such sales charges to broker-dealers, who in turn paid commissions to salespersons and incurred other distribution costs.
PGIM Investments, PGIM, Inc., PGIM Limited and PIMS are indirect, wholly-owned subsidiaries of Prudential Financial, Inc. (“Prudential”).
3. Other Transactions with Affiliates
Prudential Mutual Fund Services LLC (“PMFS”), an affiliate of PGIM Investments and an indirect, wholly-owned subsidiary of Prudential, serves as the Fund’s transfer agent. Transfer agent’s fees and expenses in the Statement of Operations include certain out-of-pocket expenses paid to non-affiliates, where applicable.
The Fund may invest its overnight sweep cash in the PGIM Core Ultra Short Bond Fund (the “Core Fund”), and its securities lending cash collateral in the PGIM Institutional Money Market Fund (the “Money Market Fund”), each a series of Prudential Investment Portfolios
| 58 |
2, registered under the 1940 Act and managed by PGIM Investments. Through the Fund’s investments in the mentioned underlying funds, PGIM Investments and/or its affiliates are paid fees or reimbursed for providing their services. In addition to the realized and unrealized gains on investments in the Core Fund and Money Market Fund, earnings from such investments are disclosed on the Statement of Operations as “Affiliated dividend income” and “Income from securities lending, net”, respectively.
The Fund may enter into certain securities purchase or sale transactions under Board approved Rule 17a-7 procedures. Rule 17a-7 is an exemptive rule under the 1940 Act, that subject to certain conditions, permits purchase and sale transactions among affiliated investment companies, or between an investment company and a person that is affiliated solely by reason of having a common (or affiliated) investment adviser, common directors, and/or common officers. Pursuant to the Rule 17a-7 procedures and consistent with guidance issued by the Securities and Exchange Commission, the Company’s Chief Compliance Officer (“CCO”) prepares a quarterly summary of all such transactions for submission to the Board, together with the CCO’s written representation that all such 17a-7 transactions were effected in accordance with the Fund’s Rule 17a-7 procedures. For the year ended February 29, 2020, no 17a-7 transactions were entered into by the Fund.
4. Portfolio Securities
The aggregate cost of purchases and proceeds from sales of portfolio securities (excluding short-term investments and U.S. Government securities) for the year ended February 29, 2020, were $476,917,220 and $929,776,781, respectively.
A summary of the cost of purchases and proceeds from sales of shares of affiliated investments for the year ended February 29, 2020, is presented as follows:
| Value, Beginning of Year | Cost of Purchases | Proceeds from Sales | Change in Unrealized Gain (Loss) | Realized Gain (Loss) | Value, End of Year | Shares, End of Year | Income | |||||||||||||||||||||||
PGIM Core Ultra Short Bond Fund* | ||||||||||||||||||||||||||||||
| $ | 8,888,957 | $ | 327,012,944 | $ | 335,891,360 | $ | — | $ | — | $ | 10,541 | 10,541 | $ | 170,169 | ||||||||||||||||
PGIM Institutional Money Market Fund* | ||||||||||||||||||||||||||||||
| 4,365,422 | 50,570,791 | 44,862,445 | (1,867 | ) | (314 | ) | 10,071,587 | 10,071,587 | 16,814 | ** | ||||||||||||||||||||
|
|
|
|
|
|
|
|
|
|
|
|
|
| |||||||||||||||||
| $ | 13,254,379 | $ | 377,583,735 | $ | 380,753,805 | $ | (1,867 | ) | $ | (314 | ) | $ | 10,082,128 | $ | 186,983 | |||||||||||||||
|
|
|
|
|
|
|
|
|
|
|
|
|
| |||||||||||||||||
| * | The Fund did not have any capital gain distributions during the reporting period. |
| ** | Represents the affiliated amount of securities lending income shown on the Statement of Operations. |
5. Distributions and Tax Information
Distributions to shareholders, which are determined in accordance with federal income tax regulations and which may differ from generally accepted accounting principles, are recorded on the ex-date.
| PGIM Floating Rate Income Fund | 59 |
Notes to Financial Statements (continued)
For the year ended February 29, 2020, the tax character of dividends paid by the Fund was $42,661,789 of ordinary income. For the year ended February 28, 2019, the tax character of dividends paid by the Fund was $48,656,826 of ordinary income.
As of February 29, 2020, the accumulated undistributed earnings on a tax basis was $455,904 of ordinary income.
The United States federal income tax basis of the Fund’s investments and the net unrealized depreciation as of February 29, 2020 were as follows:
Tax Basis | Gross Unrealized | Gross Unrealized | Net Unrealized | |||
| $567,800,424 | $1,366,359 | $(34,230,935) | $(32,864,576) |
The difference between book basis and tax basis was primarily attributable to deferred losses on wash sales, differences in the treatment of premium amortization for book and tax purposes and appreciation (depreciation) of swaps, foreign currencies and defaulted securities.
For federal income tax purposes, the Fund had a capital loss carryforward as of February 29, 2020 of approximately $18,788,000 which can be carried forward for an unlimited period. No future capital gains distributions are expected to be paid to shareholders until net gains have been realized in excess of such losses.
The Manager has analyzed the Fund’s tax positions taken on federal, state and local income tax returns for all open tax years and has concluded that no provision for income tax is required in the Fund’s financial statements for the current reporting period. Since tax authorities can examine previously filed tax returns, the Fund’s U.S. federal and state tax returns for each of the four fiscal years up to the most recent fiscal year ended February 29, 2020 are subject to such review.
6. Capital and Ownership
The Fund offers Class A, Class C, Class Z and Class R6 shares. Class A shares are sold with a maximum front-end sales charge of 2.25%. Investors who purchase $1 million or more (prior to July 15, 2019, $500,000 or more on or after July 15, 2019) of Class A shares and sell those shares within 12 months of purchase are subject to a contingent deferred sales charge (“CDSC”) of 1.00% on sales although these purchases are not subject to a front-end sales charge. The Class A CDSC is waived for certain retirement and/or benefit plans. A special exchange privilege is also available for shareholders who qualified to purchase Class A shares at net asset value. Class C shares are sold with a CDSC of 1% on sales made
| 60 |
within 12 months of purchase. Class C shares will automatically convert to Class A shares on a monthly basis approximately 10 years after purchase. Class Z and Class R6 shares are not subject to any sales or redemption charges and are available exclusively for sale to a limited group of investors.
Under certain circumstances, an exchange may be made from specified share classes of the Fund to one or more other share classes of the Fund as presented in the table of transactions in shares of common stock.
The Company is authorized to issue 900 million shares of common stock, $0.01 par value per share, designated as shares of the Fund. The shares are further classified and designated as follows:
Class A | 150,000,000 | |||
Class C | 200,000,000 | |||
Class Z | 250,000,000 | |||
Class T | 50,000,000 | |||
Class R6 | 250,000,000 |
The Fund currently does not have any Class T shares outstanding.
At reporting period end, the number of shareholders holding greater than 5% of the Fund are as follows:
| Affiliated | Unaffiliated | |||||||||||||
Number of | Percentage of Outstanding Shares | Number of Shareholders | Percentage of Outstanding Shares | |||||||||||
| — | — | % | 5 | 71 | % | |||||||||
Transactions in shares of common stock were as follows:
Class A | Shares | Amount | ||||||
Year ended February 29, 2020: | ||||||||
Shares sold | 1,594,108 | $ | 15,319,908 | |||||
Shares issued in reinvestment of dividends and distributions | 444,296 | 4,257,226 | ||||||
Shares reacquired | (4,694,644 | ) | (44,905,776 | ) | ||||
|
|
|
| |||||
Net increase (decrease) in shares outstanding before conversion | (2,656,240 | ) | (25,328,642 | ) | ||||
Shares issued upon conversion from other share class(es) | 656,664 | 6,313,663 | ||||||
Shares reacquired upon conversion into other share class(es) | (1,110,562 | ) | (10,681,790 | ) | ||||
|
|
|
| |||||
Net increase (decrease) in shares outstanding | (3,110,138 | ) | $ | (29,696,769 | ) | |||
|
|
|
| |||||
Year ended February 28, 2019: | ||||||||
Shares sold | 7,033,481 | $ | 69,200,747 | |||||
Shares issued in reinvestment of dividends and distributions | 469,064 | 4,588,569 | ||||||
Shares reacquired | (5,614,372 | ) | (54,263,491 | ) | ||||
|
|
|
| |||||
Net increase (decrease) in shares outstanding before conversion | 1,888,173 | 19,525,825 | ||||||
Shares issued upon conversion from other share class(es) | 640,728 | 6,238,902 | ||||||
Shares reacquired upon conversion into other share class(es) | (869,839 | ) | (8,451,463 | ) | ||||
|
|
|
| |||||
Net increase (decrease) in shares outstanding | 1,659,062 | $ | 17,313,264 | |||||
|
|
|
| |||||
| PGIM Floating Rate Income Fund | 61 |
Notes to Financial Statements (continued)
Class C | Shares | Amount | ||||||
Year ended February 29, 2020: | ||||||||
Shares sold | 407,917 | $ | 3,927,301 | |||||
Shares issued in reinvestment of dividends and distributions | 222,442 | 2,132,253 | ||||||
Shares reacquired | (2,244,896 | ) | (21,558,579 | ) | ||||
|
|
|
| |||||
Net increase (decrease) in shares outstanding before conversion | (1,614,537 | ) | (15,499,025 | ) | ||||
Shares reacquired upon conversion into other share class(es) | (673,397 | ) | (6,473,765 | ) | ||||
|
|
|
| |||||
Net increase (decrease) in shares outstanding | (2,287,934 | ) | $ | (21,972,790 | ) | |||
|
|
|
| |||||
|
|
|
| |||||
Year ended February 28, 2019: | ||||||||
Shares sold | 2,689,781 | $ | 26,493,742 | |||||
Shares issued in reinvestment of dividends and distributions | 240,701 | 2,354,204 | ||||||
Shares reacquired | (1,969,762 | ) | (19,147,797 | ) | ||||
|
|
|
| |||||
Net increase (decrease) in shares outstanding before conversion | 960,720 | 9,700,149 | ||||||
Shares reacquired upon conversion into other share class(es) | (514,868 | ) | (5,001,989 | ) | ||||
|
|
|
| |||||
Net increase (decrease) in shares outstanding | 445,852 | $ | 4,698,160 | |||||
|
|
|
| |||||
Class Z | ||||||||
Year ended February 29, 2020: | ||||||||
Shares sold | 25,890,429 | $ | 249,067,924 | |||||
Shares issued in reinvestment of dividends and distributions | 3,347,018 | 32,130,665 | ||||||
Shares reacquired | (69,195,525 | ) | (665,422,014 | ) | ||||
|
|
|
| |||||
Net increase (decrease) in shares outstanding before conversion | (39,958,078 | ) | (384,223,425 | ) | ||||
Shares issued upon conversion from other share class(es) | 1,302,150 | 12,528,055 | ||||||
Shares reacquired upon conversion into other share class(es) | (193,960 | ) | (1,872,505 | ) | ||||
|
|
|
| |||||
Net increase (decrease) in shares outstanding | (38,849,888 | ) | $ | (373,567,875 | ) | |||
|
|
|
| |||||
Year ended February 28, 2019: | ||||||||
Shares sold | 98,642,694 | $ | 971,492,706 | |||||
Shares issued in reinvestment of dividends and distributions | 3,844,084 | 37,563,984 | ||||||
Shares reacquired | (58,989,406 | ) | (572,703,155 | ) | ||||
|
|
|
| |||||
Net increase (decrease) in shares outstanding before conversion | 43,497,372 | 436,353,535 | ||||||
Shares issued upon conversion from other share class(es) | 1,360,263 | 13,225,874 | ||||||
Shares reacquired upon conversion into other share class(es) | (998,393 | ) | (9,793,365 | ) | ||||
|
|
|
| |||||
Net increase (decrease) in shares outstanding | 43,859,242 | $ | 439,786,044 | |||||
|
|
|
| |||||
| 62 |
Class R6 | Shares | Amount | ||||||
Year ended February 29, 2020: | ||||||||
Shares sold | 290,543 | $ | 2,789,697 | |||||
Shares issued in reinvestment of dividends and distributions | 136,983 | 1,314,528 | ||||||
Shares reacquired | (2,422,779 | ) | (23,314,723 | ) | ||||
|
|
|
| |||||
Net increase (decrease) in shares outstanding before conversion | (1,995,253 | ) | (19,210,498 | ) | ||||
Shares issued upon conversion from other share class(es) | 19,372 | 186,342 | ||||||
|
|
|
| |||||
Net increase (decrease) in shares outstanding | (1,975,881 | ) | $ | (19,024,156 | ) | |||
|
|
|
| |||||
Year ended February 28, 2019: | ||||||||
Shares sold | 3,642,287 | $ | 36,012,832 | |||||
Shares issued in reinvestment of dividends and distributions | 185,516 | 1,817,356 | ||||||
Shares reacquired | (3,319,423 | ) | (32,443,474 | ) | ||||
|
|
|
| |||||
Net increase (decrease) in shares outstanding before conversion | 508,380 | 5,386,714 | ||||||
Shares issued upon conversion from other share class(es) | 381,859 | 3,782,041 | ||||||
|
|
|
| |||||
Net increase (decrease) in shares outstanding | 890,239 | $ | 9,168,755 | |||||
|
|
|
| |||||
7. Borrowings
The Company, on behalf of the Fund, along with other affiliated registered investment companies (the “Funds”), is a party to a Syndicated Credit Agreement (“SCA”) with a group of banks. The purpose of the SCA is to provide an alternative source of temporary funding for capital share redemptions. The table below provides details of the current SCA in effect at the reporting period-end as well as the prior SCA.
| Current SCA | Prior SCA | |||
Term of Commitment | 10/3/2019 – 10/1/2020 | 10/4/2018 – 10/2/2019 | ||
Total Commitment | $1,222,500,000* | $900,000,000 | ||
Annualized Commitment Fee on the Unused Portion of the SCA | 0.15% | 0.15% | ||
Annualized Interest Rate on Borrowings | 1.20% plus the higher of (1) the effective federal funds rate, (2) the one-month LIBOR rate or (3) zero percent | 1.25% plus the higher of (1) the effective federal funds rate, (2) the one-month LIBOR rate or (3) zero percent | ||
* Effective March 31, 2020, the SCA’s total commitment was increased from $900,000,000 to $1,162,500,000 and subsequently, effective April 7, 2020 was increased to $1,222,500,000. | ||||
Certain affiliated registered investment companies that are parties to the SCA include portfolios that are subject to a predetermined mathematical formula used to manage certain benefit guarantees offered under variable annuity contracts. The formula may result in large scale asset flows into and out of these portfolios. Consequently, these portfolios may be more likely to utilize the SCA for purposes of funding redemptions. It may be possible for those portfolios to fully exhaust the committed amount of the SCA, thereby requiring the Manager to allocate available funding per a Board-approved methodology designed to treat the Funds in the SCA equitably.
The Fund utilized the SCA during the year ended February 29, 2020. The average daily balance for the 144 days that the Fund had loans outstanding during the period was
| PGIM Floating Rate Income Fund | 63 |
Notes to Financial Statements (continued)
approximately $9,761,049, borrowed at a weighted average interest rate of 3.44%. The maximum loan outstanding amount during the period was $34,800,000. At February 29, 2020, the Fund had an outstanding loan balance of $1,705,000.
8. Risks of Investing in the Fund
The Fund’s risks include, but are not limited to, some or all of the risks discussed below:
Bond Obligations Risk: The Fund’s holdings, share price, yield and total return may fluctuate in response to bond market movements. The value of bonds may decline for issuer-related reasons, including management performance, financial leverage and reduced demand for the issuer’s goods and services. Certain types of fixed-income obligations also may be subject to “call and redemption risk,” which is the risk that the issuer may call a bond held by the Fund for redemption before it matures and the Fund may not be able to reinvest at the same level and therefore would earn less income.
Derivatives Risk: Derivatives involve special risks and costs and may result in losses to the Fund. The successful use of derivatives requires sophisticated management, and, to the extent that derivatives are used, the Fund will depend on the subadviser’s ability to analyze and manage derivative transactions. The prices of derivatives may move in unexpected ways, especially in abnormal market conditions. Some derivatives are “leveraged” and therefore may magnify or otherwise increase investment losses to the Fund. Other risks arise from the potential inability to terminate or sell derivatives positions. A liquid secondary market may not always exist for the Fund’s derivatives positions. In fact, many OTC derivative instruments will not have liquidity beyond the counterparty to the instrument. OTC derivative instruments also involve the risk that the other party will not meet its obligations to the Fund.
Foreign Securities Risk: The Fund’s investments in securities of foreign issuers or issuers with significant exposure to foreign markets involve additional risk. Foreign countries in which the Fund may invest may have markets that are less liquid, less regulated and more volatile than US markets. The value of the Fund’s investments may decline because of factors affecting the particular issuer as well as foreign markets and issuers generally, such as unfavorable government actions, and political or financial instability.
Interest Rate Risk: The value of an investment may go down when interest rates rise. A rise in rates tends to have a greater impact on the prices of longer term or duration securities. When interest rates fall, the issuers of debt obligations may prepay principal more quickly than expected, and the Fund may be required to reinvest the proceeds at a lower interest rate. This is referred to as “prepayment risk.” When interest rates rise, debt obligations may be repaid more slowly than expected, and the value of the Fund’s holdings may fall sharply.
| 64 |
This is referred to as “extension risk”. The Fund may face a heightened level of interest rate risk as a result of the U.S. Federal Reserve Board’s policies. The Fund’s investments may lose value if short-term or long-term interest rates rise sharply or in a manner not anticipated by the subadviser.
Junk Bonds Risks: High-yield, high-risk bonds have predominantly speculative characteristics, including particularly high credit risk. Junk bonds tend to be less liquid than higher-rated securities. The liquidity of particular issuers or industries within a particular investment category may shrink or disappear suddenly and without warning. The non-investment grade bond market can experience sudden and sharp price swings and become illiquid due to a variety of factors, including changes in economic forecasts, stock market activity, large sustained sales by major investors, a high profile default or a change in the market’s psychology.
Liquidity Risk: The Fund may invest in instruments that trade in lower volumes and are less liquid than other investments. Liquidity risk exists when particular investments made by the Fund are difficult to purchase or sell. Liquidity risk includes the risk that the Fund may make investments that may become less liquid in response to market developments or adverse investor perceptions. Investments that are illiquid or that trade in lower volumes may be more difficult to value. If the Fund is forced to sell these investments to pay redemption proceeds or for other reasons, the Fund may lose money. In addition, when there is no willing buyer and investments may not reasonably be expected to be sold or disposed of in current market conditions in seven calendar days or less without the sale or disposition significantly changing the market value of the investment, the Fund may incur higher transaction costs when executing trade orders of a given size. The reduction in dealer market-making capacity in the fixed-income markets that has occurred in recent years also has the potential to reduce liquidity. An inability to sell a portfolio position can adversely affect the Fund’s value or prevent the Fund from being able to take advantage of other investment opportunities.
Market and Credit Risk: Securities markets may be volatile and the market prices of the Fund’s securities may decline. Securities fluctuate in price based on changes in an issuer’s financial condition and overall market and economic conditions. If the market prices of the securities owned by the Fund fall, the value of an investment in the Fund will decline. Additionally, the Fund may also be exposed to credit risk in the event that an issuer or guarantor fails to perform or that an institution or entity with which the Fund has unsettled or open transactions defaults.
Risks of Investments in Bank Loans: The Fund’s ability to receive payments of principal and interest and other amounts in connection with loans (whether through participations, assignments or otherwise) will depend primarily on the financial condition of the borrower. The failure by the Fund’s scheduled interest or principal payments on a loan because of a default, bankruptcy or any other reason would adversely affect the income of the Fund and would likely reduce the value of its assets. Even with loans secured by collateral, there is the risk that the value of the collateral may decline, may be insufficient to meet the obligations of
| PGIM Floating Rate Income Fund | 65 |
Notes to Financial Statements (continued)
the borrower, or be difficult to liquidate. In the event of a default, the Fund may have difficulty collecting on any collateral and would not have the ability to collect on any collateral for an uncollateralized loan. Further, the Fund’s access to collateral, if any, may be limited by bankruptcy laws.
9. Recent Accounting Pronouncements and Reporting Updates
In August 2018, the FASB issued Accounting Standards Update (“ASU”) No. 2018-13, which changes certain fair value measurement disclosure requirements. The new ASU, in addition to other modifications and additions, removes the requirement to disclose the amount and reasons for transfers between Level 1 and Level 2 of the fair value hierarchy, and the Fund’s policy for the timing of transfers between levels. The amendments are effective for financial statements issued for fiscal years beginning after December 15, 2019, and interim periods within those fiscal years. The Manager has evaluated the implications of certain provisions of the ASU and has adopted the aspects related to the removal and modification of certain fair value measurement disclosures under the ASU. The Manager continues to evaluate certain other provisions of the ASU and does not expect a material impact to financial statement disclosures.
10. Subsequent Event
Subsequent to February 29, 2020 the COVID-19 outbreak was declared a pandemic by the World Health Organization. The situation is dynamic with various cities and countries around the world responding in different ways to address the outbreak.
There are meaningful direct and indirect effects developing particularly with companies in which we invest, which have adversely impacted the valuation of these companies. The Manager will continue to monitor the impact of COVID-19.
| 66 |
Financial Highlights
| Class A Shares | ||||||||||||||||||||
| Year Ended February 28/29, | ||||||||||||||||||||
| 2020 | 2019 | 2018 | 2017 | 2016 | ||||||||||||||||
| Per Share Operating Performance(a): | ||||||||||||||||||||
| Net Asset Value, Beginning of Year | $9.72 | $9.94 | $9.95 | $9.38 | $9.94 | |||||||||||||||
| Income (loss) from investment operations: | ||||||||||||||||||||
| Net investment income (loss) | 0.53 | 0.47 | 0.45 | 0.41 | 0.36 | |||||||||||||||
| Net realized and unrealized gain (loss) on investment and foreign currency transactions | (0.33 | ) | (0.22 | ) | 0.01 | 0.56 | (0.57 | ) | ||||||||||||
| Total from investment operations | 0.20 | 0.25 | 0.46 | 0.97 | (0.21 | ) | ||||||||||||||
| Less Dividends and Distributions: | ||||||||||||||||||||
| Dividends from net investment income | (0.54 | ) | (0.47 | ) | (0.46 | ) | (0.40 | ) | (0.35 | ) | ||||||||||
| Distributions from net realized gains | - | - | (0.01 | ) | - | - | ||||||||||||||
| Total dividends and distributions | (0.54 | ) | (0.47 | ) | (0.47 | ) | (0.40 | ) | (0.35 | ) | ||||||||||
| Net asset value, end of year | $9.38 | $9.72 | $9.94 | $9.95 | $9.38 | |||||||||||||||
| Total Return(b): | 2.14% | 2.58% | 4.70% | 10.46% | (2.24 | )% | ||||||||||||||
| Ratios/Supplemental Data: | ||||||||||||||||||||
| Net assets, end of year (000) | $61,392 | $93,851 | $79,462 | $69,733 | $47,683 | |||||||||||||||
| Average net assets (000) | $79,796 | $100,319 | $75,379 | $58,748 | $40,785 | |||||||||||||||
| Ratios to average net assets(c)(d)(e): | ||||||||||||||||||||
| Expenses after waivers and/or expense reimbursement | 0.97% | 0.95% | 0.95% | 1.00% | 1.05% | |||||||||||||||
| Expenses before waivers and/or expense reimbursement | 1.11% | 1.09% | 1.09% | 1.14% | 1.34% | |||||||||||||||
| Net investment income (loss) | 5.53% | 4.74% | 4.53% | 4.16% | 3.65% | |||||||||||||||
| Portfolio turnover rate(f) | 66% | 67% | 94% | 67% | 55% | |||||||||||||||
| (a) | Calculated based on average shares outstanding during the year. |
| (b) | Total return does not consider the effects of sales loads. Total return is calculated assuming a purchase of a share on the first day and a sale on the last day of each year reported and includes reinvestment of dividends and distributions, if any. Total returns may reflect adjustments to conform to generally accepted accounting principles. |
| (c) | Effective January 1, 2018, class specific expenses include transfer agent fees and expenses and registration fees, which are charged to their respective share class. |
| (d) | Does not include expenses of the underlying funds in which the Fund invests. |
| (e) | Effective March 9, 2015, the contractual distribution and service (12b-1) fees were reduced from 0.30% to 0.25% of the average daily net assets and the 0.05% contractual 12b-1 fee waiver was terminated. |
| (f) | The Fund’s portfolio turnover rate is calculated in accordance with regulatory requirements, without regard to transactions involving short-term investments and certain derivatives. If such transactions were included, the Fund’s portfolio turnover rate may be higher. |
See Notes to Financial Statements.
| PGIM Floating Rate Income Fund | 67 |
Financial Highlights (continued)
| Class C Shares | ||||||||||||||||||||
| Year Ended February 28/29, | ||||||||||||||||||||
| 2020 | 2019 | 2018 | 2017 | 2016 | ||||||||||||||||
| Per Share Operating Performance(a): | ||||||||||||||||||||
| Net Asset Value, Beginning of Year | $9.72 | $9.94 | $9.95 | $9.38 | $9.95 | |||||||||||||||
| Income (loss) from investment operations: | ||||||||||||||||||||
| Net investment income (loss) | 0.46 | 0.39 | 0.38 | 0.33 | 0.28 | |||||||||||||||
| Net realized and unrealized gain (loss) on investment and foreign currency transactions | (0.33 | ) | (0.21 | ) | - | (b) | 0.57 | (0.58 | ) | |||||||||||
| Total from investment operations | 0.13 | 0.18 | 0.38 | 0.90 | (0.30 | ) | ||||||||||||||
| Less Dividends and Distributions: | ||||||||||||||||||||
| Dividends from net investment income | (0.47 | ) | (0.40 | ) | (0.38 | ) | (0.33 | ) | (0.27 | ) | ||||||||||
| Distributions from net realized gains | - | - | (0.01 | ) | - | - | ||||||||||||||
| Total dividends and distributions | (0.47 | ) | (0.40 | ) | (0.39 | ) | (0.33 | ) | (0.27 | ) | ||||||||||
| Net asset value, end of year | $9.38 | $9.72 | $9.94 | $9.95 | $9.38 | |||||||||||||||
| Total Return(c): | 1.38% | 1.82% | 3.92% | 9.64% | (3.07 | )% | ||||||||||||||
| Ratios/Supplemental Data: | ||||||||||||||||||||
| Net assets, end of year (000) | $32,673 | $56,098 | $52,919 | $54,092 | $35,027 | |||||||||||||||
| Average net assets (000) | $44,099 | $59,266 | $54,061 | $39,905 | $33,571 | |||||||||||||||
| Ratios to average net assets(d)(e): | ||||||||||||||||||||
| Expenses after waivers and/or expense reimbursement | 1.72% | 1.70% | 1.70% | 1.75% | 1.80% | |||||||||||||||
| Expenses before waivers and/or expense reimbursement | 1.88% | 1.83% | 1.84% | 1.89% | 2.11% | |||||||||||||||
| Net investment income (loss) | 4.78% | 3.99% | 3.79% | 3.41% | 2.88% | |||||||||||||||
| Portfolio turnover rate(f) | 66% | 67% | 94% | 67% | 55% | |||||||||||||||
| (a) | Calculated based on average shares outstanding during the year. |
| (b) | Less than $0.005 per share. |
| (c) | Total return does not consider the effects of sales loads. Total return is calculated assuming a purchase of a share on the first day and a sale on the last day of each year reported and includes reinvestment of dividends and distributions, if any. Total returns may reflect adjustments to conform to generally accepted accounting principles. |
| (d) | Effective January 1, 2018, class specific expenses include transfer agent fees and expenses and registration fees, which are charged to their respective share class. |
| (e) | Does not include expenses of the underlying funds in which the Fund invests. |
| (f) | The Fund’s portfolio turnover rate is calculated in accordance with regulatory requirements, without regard to transactions involving short-term investments and certain derivatives. If such transactions were included, the Fund’s portfolio turnover rate may be higher. |
See Notes to Financial Statements.
| 68 |
| Class Z Shares | ||||||||||||||||||||
| Year Ended February 28/29, | ||||||||||||||||||||
| 2020 | 2019 | 2018 | 2017 | 2016 | ||||||||||||||||
| Per Share Operating Performance(a): | ||||||||||||||||||||
| Net Asset Value, Beginning of Year | $9.73 | $9.94 | $9.96 | $9.39 | $9.95 | |||||||||||||||
| Income (loss) from investment operations: | ||||||||||||||||||||
| Net investment income (loss) | 0.56 | 0.49 | 0.48 | 0.43 | 0.38 | |||||||||||||||
| Net realized and unrealized gain (loss) on investment and foreign currency transactions | (0.33 | ) | (0.21 | ) | (0.01 | ) | 0.57 | (0.57 | ) | |||||||||||
| Total from investment operations | 0.23 | 0.28 | 0.47 | 1.00 | (0.19 | ) | ||||||||||||||
| Less Dividends and Distributions: | ||||||||||||||||||||
| Dividends from net investment income | (0.57 | ) | (0.49 | ) | (0.48 | ) | (0.43 | ) | (0.37 | ) | ||||||||||
| Distributions from net realized gains | - | - | (0.01 | ) | - | - | ||||||||||||||
| Total dividends and distributions | (0.57 | ) | (0.49 | ) | (0.49 | ) | (0.43 | ) | (0.37 | ) | ||||||||||
| Net asset value, end of year | $9.39 | $9.73 | $9.94 | $9.96 | $9.39 | |||||||||||||||
| Total Return(b): | 2.40% | 2.94% | 4.86% | 10.76% | (1.98 | )% | ||||||||||||||
| Ratios/Supplemental Data: | ||||||||||||||||||||
| Net assets, end of year (000) | $424,819 | $818,117 | $400,179 | $367,286 | $135,575 | |||||||||||||||
| Average net assets (000) | $584,427 | $772,275 | $390,617 | $224,436 | $115,125 | |||||||||||||||
| Ratios to average net assets(c)(d): | ||||||||||||||||||||
| Expenses after waivers and/or expense reimbursement | 0.72% | 0.70% | 0.70% | 0.75% | 0.80% | |||||||||||||||
| Expenses before waivers and/or expense reimbursement | 0.87% | 0.86% | 0.84% | 0.89% | 1.09% | |||||||||||||||
| Net investment income (loss) | 5.78% | 5.04% | 4.79% | 4.42% | 3.88% | |||||||||||||||
| Portfolio turnover rate(e) | 66% | 67% | 94% | 67% | 55% | |||||||||||||||
| (a) | Calculated based on average shares outstanding during the year. |
| (b) | Total return is calculated assuming a purchase of a share on the first day and a sale on the last day of each year reported and includes reinvestment of dividends and distributions, if any. Total returns may reflect adjustments to conform to generally accepted accounting principles. |
| (c) | Effective January 1, 2018, class specific expenses include transfer agent fees and expenses and registration fees, which are charged to their respective share class. |
| (d) | Does not include expenses of the underlying funds in which the Fund invests. |
| (e) | The Fund’s portfolio turnover rate is calculated in accordance with regulatory requirements, without regard to transactions involving short-term investments and certain derivatives. If such transactions were included, the Fund’s portfolio turnover rate may be higher. |
See Notes to Financial Statements.
| PGIM Floating Rate Income Fund | 69 |
Financial Highlights (continued)
| Class R6 Shares | ||||||||||||||||||||||||
| Year Ended February 28/29, | April 27, through | |||||||||||||||||||||||
| 2020 | 2019 | 2018 | 2017 | 2016 | ||||||||||||||||||||
| Per Share Operating Performance(b): | ||||||||||||||||||||||||
| Net Asset Value, Beginning of Period | $9.73 | $9.94 | $9.96 | $9.39 | $10.03 | |||||||||||||||||||
| Income (loss) from investment operations: | ||||||||||||||||||||||||
| Net investment income (loss) | 0.56 | 0.49 | 0.48 | 0.45 | 0.32 | |||||||||||||||||||
| Net realized and unrealized gain (loss) on investment and foreign currency transactions | (0.33 | ) | (0.20 | ) | - | (c) | 0.55 | (0.65 | ) | |||||||||||||||
| Total from investment operations | 0.23 | 0.29 | 0.48 | 1.00 | (0.33 | ) | ||||||||||||||||||
| Less Dividends and Distributions: | ||||||||||||||||||||||||
| Dividends from net investment income | (0.57 | ) | (0.50 | ) | (0.49 | ) | (0.43 | ) | (0.31 | ) | ||||||||||||||
| Distributions from net realized gains | - | - | (0.01 | ) | - | - | ||||||||||||||||||
| Total dividends and distributions | (0.57 | ) | (0.50 | ) | (0.50 | ) | (0.43 | ) | (0.31 | ) | ||||||||||||||
| Net asset value, end of period | $9.39 | $9.73 | $9.94 | $9.96 | $9.39 | |||||||||||||||||||
| Total Return(d): | 2.45% | 2.99% | 4.91% | 10.79% | (3.35)% | |||||||||||||||||||
| Ratios/Supplemental Data: | ||||||||||||||||||||||||
| Net assets, end of period (000) | $14,790 | $34,545 | $26,457 | $32,058 | $10 | |||||||||||||||||||
| Average net assets (000) | $25,645 | $39,870 | $16,803 | $5,484 | $10 | |||||||||||||||||||
| Ratios to average net assets(e)(f): | ||||||||||||||||||||||||
| Expenses after waivers and/or expense reimbursement | 0.67% | 0.65% | 0.65% | 0.67% | 0.80% | (g) | ||||||||||||||||||
| Expenses before waivers and/or expense reimbursement | 0.81% | 0.76% | 0.75% | 0.82% | 0.99% | (g) | ||||||||||||||||||
| Net investment income (loss) | 5.84% | 5.02% | 4.83% | 4.60% | 3.87% | (g) | ||||||||||||||||||
| Portfolio turnover rate(h) | 66% | 67% | 94% | 67% | 55% | |||||||||||||||||||
| (a) | Commencement of offering. |
| (b) | Calculated based on average shares outstanding during the period. |
| (c) | Less than $0.005 per share. |
| (d) | Total return is calculated assuming a purchase of a share on the first day and a sale on the last day of each period reported and includes reinvestment of dividends and distributions, if any. Total returns may reflect adjustments to conform to generally accepted accounting principles. Total returns for periods less than one full year are not annualized. |
| (e) | Effective January 1, 2018, class specific expenses include transfer agent fees and expenses and registration fees, which are charged to their respective share class. |
| (f) | Does not include expenses of the underlying funds in which the Fund invests. |
| (g) | Annualized. |
| (h) | The Fund’s portfolio turnover rate is calculated in accordance with regulatory requirements, without regard to transactions involving short-term investments and certain derivatives. If such transactions were included, the Fund’s portfolio turnover rate may be higher. |
See Notes to Financial Statements.
| 70 |
Report of Independent Registered Public
Accounting Firm
To the Shareholders of PGIM Floating Rate Income Fund
and Board of Directors Prudential Investment Portfolios, Inc. 14:
Opinion on the Financial Statements
We have audited the accompanying statement of assets and liabilities of PGIM Floating Rate Income Fund (the Fund), a series of Prudential Investment Portfolios, Inc. 14, including the schedule of investments, as of February 29, 2020, the related statement of operations for the year then ended, the statements of changes in net assets for each of the years in the two-year period then ended, and the related notes (collectively, the financial statements) and the financial highlights for each of the years or periods indicated therein. In our opinion, the financial statements and financial highlights present fairly, in all material respects, the financial position of the Fund as of February 29, 2020, the results of its operations for the year then ended, changes in its net assets for each of the years in the two-year period then ended, and the financial highlights for each of the years or periods indicated therein, in conformity with U.S. generally accepted accounting principles.
Basis for Opinion
These financial statements and financial highlights are the responsibility of the Fund’s management. Our responsibility is to express an opinion on these financial statements and financial highlights based on our audits. We are a public accounting firm registered with the Public Company Accounting Oversight Board (United States) (PCAOB) and are required to be independent with respect to the Fund in accordance with the U.S. federal securities laws and the applicable rules and regulations of the Securities and Exchange Commission and the PCAOB.
We conducted our audits in accordance with the standards of the PCAOB. Those standards require that we plan and perform the audit to obtain reasonable assurance about whether the financial statements and financial highlights are free of material misstatement, whether due to error or fraud. Our audits included performing procedures to assess the risks of material misstatement of the financial statements and financial highlights, whether due to error or fraud, and performing procedures that respond to those risks. Such procedures included examining, on a test basis, evidence regarding the amounts and disclosures in the financial statements and financial highlights. Such procedures also included confirmation of securities owned as of February 29, 2020, by correspondence with the custodian, transfer agent, and brokers, or by other appropriate auditing procedures when replies were not received. Our audits also included evaluating the accounting principles used and significant estimates made by management, as well as evaluating the overall presentation of the financial statements and financial highlights. We believe that our audits provide a reasonable basis for our opinion.

We have served as the auditor of one or more PGIM and/or Prudential Retail investment companies since 2003.
New York, New York
April 17, 2020
| PGIM Floating Rate Income Fund | 71 |
Federal Income Tax Information (unaudited)
For the year ended February 29, 2020, the Fund reports the maximum amount allowable but not less than 95.75% as interest-related dividends in accordance with Sections 871(k)(1) and 881(e)(1) of the Internal Revenue Code.
In January 2021, you will be advised on IRS Form 1099-DIV or substitute 1099-DIV, as to the federal tax status of the dividends received by you in calendar year 2020.
| 72 |
INFORMATION ABOUT BOARD MEMBERS AND OFFICERS (unaudited)
Information about Board Members and Officers of the Fund is set forth below. Board Members who are not deemed to be “interested persons” of the Fund, as defined in the 1940 Act, are referred to as “Independent Board Members.” Board Members who are deemed to be “interested persons” of the Fund are referred to as “Interested Board Members.” The Board Members are responsible for the overall supervision of the operations of the Fund and perform the various duties imposed on the directors of investment companies by the 1940 Act. The Board in turn elects the Officers, who are responsible for administering the day-to-day operations of the Fund.
| Independent Board Members | ||||||
Name Date of Birth Position(s) Portfolios Overseen | Principal Occupation(s) During Past Five Years | Other Directorships Held During Past Five Years | Length of Board Service | |||
Ellen S. Alberding 3/11/58 Board Member Portfolios Overseen: 96 | President and Board Member, The Joyce Foundation (charitable foundation) (since 2002); Vice Chair, City Colleges of Chicago (community college system) (2011-2015); Trustee, National Park Foundation (charitable foundation for national park system) (2009-2018); Trustee, Economic Club of Chicago (2009-2016); Trustee, Loyola University (since 2018). | None. | Since September 2013 | |||
Kevin J. Bannon 7/13/52 Board Member Portfolios Overseen: 96 | Retired; Managing Director (April 2008-May 2015) and Chief Investment Officer (October 2008-November 2013) of Highmount Capital LLC (registered investment adviser); formerly Executive Vice President and Chief Investment Officer (April 1993-August 2007) of Bank of New York Company; President (May 2003-May 2007) of BNY Hamilton Family of Mutual Funds. | Director of Urstadt Biddle Properties (equity real estate investment trust) (since September 2008). | Since July 2008 | |||
PGIM Floating Rate Income Fund
Independent Board Members | ||||||
Name Date of Birth Position(s) Portfolios Overseen | Principal Occupation(s) During Past Five Years | Other Directorships Held During Past Five Years | Length of Board Service | |||
Linda W. Bynoe 7/9/52 Board Member Portfolios Overseen: 96 | President and Chief Executive Officer (since March 1995) and formerly Chief Operating Officer (December 1989-February 1995) of Telemat Ltd. (management consulting); formerly Vice President (January 1985-June 1989) at Morgan Stanley & Co. (broker-dealer). | Director of Anixter International, Inc. (communication products distributor) (since January 2006); Director of Northern Trust Corporation (financial services) (since April 2006); Trustee of Equity Residential (residential real estate) (since December 2009). | Since March 2005 | |||
Barry H. Evans 11/2/60 Board Member Portfolios Overseen: 95 | Retired; formerly President (2005 – 2016), Global Chief Operating Officer (2014– 2016), Chief Investment Officer – Global Head of Fixed Income (1998-2014), and various portfolio manager roles (1986-2006), Manulife Asset Management U.S. | Formerly Director, Manulife Trust Company (2011-2018); formerly Director, Manulife Asset Management Limited (2015-2017); formerly Chairman of the Board of Directors of Manulife Asset Management U.S. (2005-2016); formerly Chairman of the Board, Declaration Investment Management and Research (2008-2016). | Since September 2017 | |||
Keith F. Hartstein 10/13/56 Board Member & Independent Chair Portfolios Overseen: 96 | Executive Committee of the IDC Board of Governors (since October 2019); Retired; Member (since November 2014) of the Governing Council of the Independent Directors Council (organization of independent mutual fund directors); formerly President and Chief Executive Officer (2005-2012), Senior Vice President (2004-2005), Senior Vice President of Sales and Marketing (1997-2004), and various executive management positions (1990-1997), John Hancock Funds, LLC (asset management); Chairman, Investment Company Institute’s Sales Force Marketing Committee (2003-2008). | None. | Since September 2013 | |||
Visit our website at pgiminvestments.com
Independent Board Members | ||||||
Name Date of Birth Position(s) Portfolios Overseen | Principal Occupation(s) During Past Five Years | Other Directorships Held During Past Five Years | Length of Board Service | |||
Laurie Simon Hodrick 9/29/62 Board Member Portfolios Overseen: 95 | A. Barton Hepburn Professor Emerita of Economics in the Faculty of Business, Columbia Business School (since 2018); Visiting Professor of Law, Stanford Law School (since 2015); Visiting Fellow at the Hoover Institution, Stanford University (since 2015); Sole Member, ReidCourt LLC (since 2008) (a consulting firm); formerly A. Barton Hepburn Professor of Economics in the Faculty of Business, Columbia Business School (1996-2017); formerly Managing Director, Global Head of Alternative Investment Strategies, Deutsche Bank (2006-2008). | Independent Director, Synnex Corporation (since April 2019) (information technology); Independent Director, Kabbage, Inc. (since July 2018) (financial services); Independent Director, Corporate Capital Trust (2017-2018) (a business development company). | Since September 2017 | |||
Michael S. Hyland, CFA 10/4/45 Board Member Portfolios Overseen: 96 | Retired (since February 2005); formerly Senior Managing Director (July 2001-February 2005) of Bear Stearns & Co, Inc.; Global Partner, INVESCO (1999-2001); Managing Director and President of Salomon Brothers Asset Management (1989-1999). | None. | Since July 2008 | |||
Brian K. Reid 9/22/61 Board Member Portfolios Overseen: 95 | Retired; formerly Chief Economist for the Investment Company Institute (ICI) (2005-2017); formerly Senior Economist and Director of Industry and Financial Analysis at the ICI (1998-2004); formerly Senior Economist, Industry and Financial Analysis at the ICI (1996-1998); formerly Staff Economist at the Federal Reserve Board (1989-1996); Director, ICI Mutual Insurance Company (2012-2017). | None. | Since March 2018 | |||
PGIM Floating Rate Income Fund
| Independent Board Members | ||||||
Name Date of Birth Position(s) Portfolios Overseen | Principal Occupation(s) During Past Five Years | Other Directorships Held During Past Five Years | Length of Board Service | |||
Grace C. Torres 6/28/59 Board Member Portfolios Overseen: 95 | Retired; formerly Treasurer and Principal Financial and Accounting Officer of the PGIM Funds, Target Funds, Advanced Series Trust, Prudential Variable Contract Accounts and The Prudential Series Fund (1998-June 2014); Assistant Treasurer (March 1999-June 2014) and Senior Vice President (September 1999-June 2014) of PGIM Investments LLC; Assistant Treasurer (May 2003-June 2014) and Vice President (June 2005-June 2014) of AST Investment Services, Inc.; Senior Vice President and Assistant Treasurer (May 2003-June 2014) of Prudential Annuities Advisory Services, Inc. | Formerly Director (July 2015-January 2018) of Sun Bancorp, Inc. N.A. and Sun National Bank; Director (since January 2018) of OceanFirst Financial Corp. and OceanFirst Bank. | Since November 2014 | |||
| Interested Board Members | ||||||
Name Date of Birth Position(s) Portfolios Overseen | Principal Occupation(s) During Past Five Years | Other Directorships Held During Past Five Years | Length of Board Service | |||
Stuart S. Parker 10/5/62 Board Member & Portfolios Overseen: 96 | President of PGIM Investments LLC (formerly known as Prudential Investments LLC) (since January 2012); Executive Vice President of Prudential Investment Management Services LLC (since December 2012); formerly Executive Vice President of Jennison Associates LLC and Head of Retail Distribution of PGIM Investments LLC (June 2005-December 2011). | None. | Since January 2012 | |||
Visit our website at pgiminvestments.com
| Interested Board Members | ||||||
Name Date of Birth Position(s) Portfolios Overseen | Principal Occupation(s) During Past Five Years | Other Directorships Held During Past Five Years | Length of Board Service | |||
Scott E. Benjamin 5/21/73 Board Member & Vice Portfolios Overseen:96 | Executive Vice President (since June 2009) of PGIM Investments LLC; Vice President (since June 2012) of Prudential Investment Management Services LLC; Executive Vice President (since September 2009) of AST Investment Services, Inc.; Senior Vice President of Product Development and Marketing, PGIM Investments (since February 2006); formerly Vice President of Product Development and Product Management, PGIM Investments LLC (2003-2006). | None. | Since March 2010 | |||
| Fund Officers(a) | ||||
Name Date of Birth Fund Position | Principal Occupation(s) During Past Five Years | Length of Service as Fund Officer | ||
Raymond A. O’Hara 9/11/55 Chief Legal Officer | Vice President and Corporate Counsel (since July 2010) of Prudential Insurance Company of America (Prudential); Vice President (March 2011-Present) of Pruco Life Insurance Company and Pruco Life Insurance Company of New Jersey; Vice President and Corporate Counsel (March 2011-Present) of Prudential Annuities Life Assurance Corporation; Chief Legal Officer of PGIM Investments LLC (since June 2012); Chief Legal Officer of Prudential Mutual Fund Services LLC (since June 2012) and Corporate Counsel of AST Investment Services, Inc. (since June 2012); formerly Assistant Vice President and Corporate Counsel (September 2008-July 2010) of The Hartford Financial Services Group, Inc.; formerly Associate (September 1980-December 1987) and Partner (January 1988–August 2008) of Blazzard & Hasenauer, P.C. (formerly, Blazzard, Grodd & Hasenauer, P.C.). | Since June 2012 | ||
PGIM Floating Rate Income Fund
| Fund Officers(a) | ||||
Name Date of Birth Fund Position | Principal Occupation(s) During Past Five Years | Length of Service as Fund Officer | ||
Dino Capasso 8/19/74 Chief Compliance Officer | Chief Compliance Officer (July 2019-Present) of PGIM Investments LLC; Chief Compliance Officer (July 2019-Present) of the PGIM Funds, Target Funds, Advanced Series Trust, The Prudential Series Fund, Prudential’s Gibraltar Fund, Inc., PGIM Global High Yield Fund, Inc., and PGIM High Yield Bond Fund, Inc.; Vice President and Deputy Chief Compliance Officer (June 2017-2019) of PGIM Investments LLC; formerly, Senior Vice President and Senior Counsel (January 2016-June 2017), and Vice President and Counsel (February 2012-December 2015) of Pacific Investment Management Company LLC. | Since March 2018 | ||
Andrew R. French 12/22/62 Secretary | Vice President within PGIM Investments LLC (since December 2018 - present) of PGIM Investments; Formerly, Vice President and Corporate Counsel (2010-2018) of Prudential; formerly Director and Corporate Counsel (2006-2010) of Prudential; Vice President and Assistant Secretary (since January 2007) of PI; Vice President and Assistant Secretary (since January 2007) of PMFS. | Since October 2006 | ||
Jonathan D. Shain 8/9/58 Assistant Secretary | Vice President and Corporate Counsel (since August 1998) of Prudential; Vice President and Assistant Secretary (since May 2001) of PGIM Investments LLC; Vice President and Assistant Secretary (since February 2001) of Prudential Mutual Fund Services LLC; formerly Vice President and Assistant Secretary (May 2003-June 2005) of AST Investment Services, Inc. | Since May 2005 | ||
Claudia DiGiacomo 10/14/74 Assistant Secretary | Vice President and Corporate Counsel (since January 2005) of Prudential; Vice President and Assistant Secretary of PGIM Investments LLC (since December 2005); formerly Associate at Sidley Austin Brown & Wood LLP (1999-2004). | Since December 2005 | ||
Diana N. Huffman 4/14/82 Assistant Secretary | Vice President and Corporate Counsel (since September 2015) of Prudential; formerly Associate at Willkie Farr & Gallagher LLP (2009-2015). | Since March 2019 | ||
Melissa Gonzalez 2/10/80 Assistant Secretary | Vice President and Corporate Counsel (since September 2018) of Prudential; formerly Director and Corporate Counsel (March 2014-September 2018) of Prudential. | Since March 2020 | ||
Kelly A. Coyne 8/8/68 Assistant Secretary | Director, Investment Operations of Prudential Mutual Fund Services LLC (since 2010). | Since March 2015 | ||
Christian J. Kelly 5/5/75 Treasurer and Principal | Vice President, Head of Fund Administration of PGIM Investments LLC (since November 2018); formerly, Director of Fund Administration of Lord Abbett & Co. LLC (2009-2018), Treasurer and Principal Accounting Officer of the Lord Abbett Family of Funds (2017-2018); Director of Accounting, Avenue Capital Group (2008-2009); Senior Manager, Investment Management Practice of Deloitte & Touche LLP (1998-2007). | Since January 2019 | ||
Visit our website at pgiminvestments.com
| Fund Officers(a) | ||||
Name Date of Birth Fund Position | Principal Occupation(s) During Past Five Years | Length of Service as Fund Officer | ||
Lana Lomuti 6/7/67 Assistant Treasurer | Vice President (since 2007) and Director (2005-2007), within PGIM Investments Fund Administration; formerly Assistant Treasurer (December 2007-February 2014) of The Greater China Fund, Inc. | Since April 2014 | ||
Russ Shupak 10/08/73 Assistant Treasurer | Vice President (since 2017) and Director (2013-2017), within PGIM Investments Fund Administration. | Since October 2019 | ||
Deborah Conway 3/26/69 Assistant Treasurer | Vice President (since 2017) and Director (2007-2017), within PGIM Investments Fund Administration. | Since October 2019 | ||
Elyse M. McLaughlin 1/20/74 Assistant Treasurer | Vice President (since 2017) and Director (2011-2017), within PGIM Investments Fund Administration. | Since October 2019 | ||
Charles H. Smith 1/11/73 Anti-Money Laundering Compliance Officer | Vice President, Corporate Compliance, Anti-Money Laundering Unit (since January 2015) of Prudential; committee member of the American Council of Life Insurers Anti-Money Laundering and Critical Infrastructure Committee (since January 2016); formerly Global Head of Economic Sanctions Compliance at AIG Property Casualty (February 2007-December 2014); Assistant Attorney General at the New York State Attorney General’s Office, Division of Public Advocacy. (August 1998-January 2007). | Since January 2017 | ||
(a) Excludes Mr. Parker and Mr. Benjamin, interested Board Members who also serve as President and Vice President, respectively.
Explanatory Notes to Tables:
| ∎ | Board Members are deemed to be “Interested,” as defined in the 1940 Act, by reason of their affiliation with PGIM Investments LLC and/or an affiliate of PGIM Investments LLC. |
| ∎ | Unless otherwise noted, the address of all Board Members and Officers is c/o PGIM Investments LLC, 655 Broad Street, Newark, New Jersey 07102-4410. |
| ∎ | There is no set term of office for Board Members or Officers. The Board Members have adopted a retirement policy, which calls for the retirement of Board Members on December 31 of the year in which they reach the age of 75. |
| ∎ | “Other Directorships Held” includes only directorships of companies required to register or file reports with the SEC under the 1934 Act (that is, “public companies”) or other investment companies registered under the 1940 Act. |
| ∎ | “Portfolios Overseen” includes all investment companies managed by PGIM Investments LLC. The investment companies for which PGIM Investments LLC serves as manager include the PGIM Funds, The Prudential Variable Contract Accounts, PGIM ETF Trust, PGIM High Yield Bond Fund, Inc., PGIM Global High Yield Fund, Inc., The Prudential Series Fund, Prudential’s Gibraltar Fund, Inc. and the Advanced Series Trust. |
PGIM Floating Rate Income Fund
| ∎ TELEPHONE | ∎ WEBSITE | |||
655 Broad Street Newark, NJ 07102 | (800) 225-1852 | pgiminvestments.com | ||
| PROXY VOTING |
| The Board of Directors of the Fund has delegated to the Fund’s subadviser the responsibility for voting any proxies and maintaining proxy recordkeeping with respect to the Fund. A description of these proxy voting policies and procedures is available without charge, upon request, by calling (800) 225-1852. Information regarding how the Fund voted proxies relating to portfolio securities during the most recent 12-month period ended June 30 is available on the Fund’s website and on the Securities and Exchange Commission’s website. |
| DIRECTORS |
| Ellen S. Alberding • Kevin J. Bannon • Scott E. Benjamin • Linda W. Bynoe • Barry H. Evans • Keith F. Hartstein • Laurie Simon Hodrick • Michael S. Hyland • Stuart S. Parker • Brian K. Reid • Grace C. Torres |
| OFFICERS |
Stuart S. Parker, President • Scott E. Benjamin, Vice President • Christian J. Kelly, Treasurer and Principal Financial and Accounting Officer • Raymond A. O’Hara, Chief Legal Officer • Dino Capasso, Chief Compliance Officer • Charles H. Smith, Anti-Money Laundering Compliance Officer • Andrew R. French, Secretary • Jonathan D. Shain, Assistant Secretary • Claudia DiGiacomo, Assistant Secretary • Melissa Gonzalez, Assistant Secretary • Diana N. Huffman, Assistant Secretary • Kelly A. Coyne, Assistant Secretary • Lana Lomuti, Assistant Treasurer • Russ Shupak, Assistant Treasurer • Elyse McLaughlin, Assistant Treasurer • Deborah Conway, Assistant Treasurer |
| MANAGER | PGIM Investments LLC | 655 Broad Street Newark, NJ 07102 | ||
| ||||
| SUBADVISER | PGIM Fixed Income PGIM Limited | 655 Broad Street Newark, NJ 07102 | ||
| ||||
| DISTRIBUTOR | Prudential Investment Management Services LLC | 655 Broad Street Newark, NJ 07102 | ||
| ||||
| CUSTODIAN | The Bank of New York Mellon | 240 Greenwich Street New York, NY 10286 | ||
| ||||
| TRANSFER AGENT | Prudential Mutual Fund Services LLC | PO Box 9658 Providence, RI 02940 | ||
| ||||
| INDEPENDENT REGISTERED PUBLIC ACCOUNTING FIRM | KPMG LLP | 345 Park Avenue New York, NY 10154 | ||
| ||||
| FUND COUNSEL | Willkie Farr & Gallagher LLP | 787 Seventh Avenue New York, NY 10019 | ||
| ||||
| An investor should consider the investment objectives, risks, charges, and expenses of the Fund carefully before investing. The prospectus and summary prospectus contain this and other information about the Fund. An investor may obtain the prospectus and summary prospectus by visiting our website at pgiminvestments.com or by calling (800) 225-1852. The prospectus and summary prospectus should be read carefully before investing. |
| E-DELIVERY |
| To receive your mutual fund documents online, go to pgiminvestments.com/edelivery and enroll. Instead of receiving printed documents by mail, you will receive notification via email when new materials are available. You can cancel your enrollment or change your email address at any time by visiting the website address above. |
| SHAREHOLDER COMMUNICATIONS WITH DIRECTORS |
| Shareholders can communicate directly with the Board of Directors by writing to the Chair of the Board, PGIM Floating Rate Income Fund, PGIM Investments, Attn: Board of Directors, 655 Broad Street, Newark, NJ 07102. Shareholders can communicate directly with an individual Director by writing to the same address. Communications are not screened before being delivered to the addressee. |
| AVAILABILITY OF PORTFOLIO SCHEDULE |
| The Fund files its complete schedule of portfolio holdings with the Securities and Exchange Commission for the first and third quarters of each fiscal year as an exhibit to its reports on Form N-PORT. The Fund’s Form N-PORT filings are available on the Commission’s website at sec.gov. |
| The Fund’s Statement of Additional Information contains additional information about the Fund’s Directors and is available without charge, upon request, by calling (800) 225-1852. |
Mutual Funds:
| ARE NOT INSURED BY THE FDIC OR ANY FEDERAL GOVERNMENT AGENCY | MAY LOSE VALUE | ARE NOT A DEPOSIT OF OR GUARANTEED BY ANY BANK OR ANY BANK AFFILIATE |
PGIM FLOATING RATE INCOME FUND
| SHARE CLASS | A | C | Z | R6 | ||||
| NASDAQ | FRFAX | FRFCX | FRFZX | PFRIX | ||||
| CUSIP | 74439V602 | 74439V701 | 74439V800 | 74439V883 |
MF211E
Item 2 – Code of Ethics — See Exhibit (a)
As of the end of the period covered by this report, the registrant has adopted a code of ethics (the "Section 406 Standards for Investment Companies – Ethical Standards for Principal Executive and Financial Officers") that applies to the registrant's Principal Executive Officer and Principal Financial Officer; the registrant's Principal Financial Officer also serves as the Principal Accounting Officer.
The registrant hereby undertakes to provide any person, without charge, upon request, a copy of the code of ethics. To request a copy of the code of ethics, contact the registrant 800-225-1852, and ask for a copy of the Section 406 Standards for Investment Companies - Ethical Standards for Principal Executive and Financial Officers.
Item 3 – Audit Committee Financial Expert –
The registrant's Board has determined that Ms. Grace C. Torres, member of the Board's Audit Committee is an "audit committee financial expert," and that she is "independent," for purposes of this item.
Item 4 – Principal Accountant Fees and Services –
(a) Audit Fees
For the fiscal years ended February 29, 2020 and February 28, 2019, KPMG LLP ("KPMG"), the Registrant's principal accountant, billed the Registrant $98,424 and $97,449, respectively, for professional services rendered for the audit of the Registrant's annual financial statements or services that are normally provided in connection with statutory and regulatory filings.
(b)Audit-Related Fees
For the fiscal year ended February 29, 2020, fees of $2,836 were billed to the Registrant for services rendered by KPMG in connection with an accounting system conversion and were paid by The Bank of New York Mellon. For the fiscal year ended February 28, 2019, there are no fees to report.
(c)Tax Fees
For the fiscal years ended February 29, 2020 and February 28, 2019:none.
(d)All Other Fees
For the fiscal years ended February 29, 2020 and February 28, 2019: none.
(e)(1) Audit Committee Pre-Approval Policies and Procedures
THE PGIM MUTUAL FUNDS
AUDIT COMMITTEE POLICY
on
Pre-Approval of Services Provided by the Independent
Accountants
The Audit Committee of each PGIM Mutual Fund is charged with the responsibility to monitor the independence of the Fund's independent accountants. As part of this responsibility, the Audit Committee must pre-approve the independent accounting firm's engagement to render audit and/or permissible non-audit services, as required by law. In evaluating a proposed engagement of the independent accountants, the Audit Committee will assess the effect that the engagement might reasonably be expected to have on the accountant's independence. The Committee's evaluation will be based on:
•a review of the nature of the professional services expected to be provided,
•a review of the safeguards put into place by the accounting firm to safeguard independence, and
•periodic meetings with the accounting firm.
Policy for Audit and Non-Audit Services Provided to the Funds
On an annual basis, the scope of audits for each Fund, audit fees and expenses, and audit-related and non-audit services (and fees proposed in respect thereof) proposed to be performed by the Fund's independent accountants will be presented by the Treasurer and the independent accountants to the Audit Committee for review and, as appropriate, approval prior to
the initiation of such services.
Such presentation shall be accompanied by confirmation by both the Treasurer and the independent accountants that the proposed
non-audit services will not adversely affect the independence of the independent accountants. Such proposed non-audit services shall be described in sufficient detail to enable the Audit Committee to assess the appropriateness of such services and fees, andthe compatibility of the provision of such services with the auditor's independence. The Committee shall receive periodic reports on the progress of the audit and other services which are approved by the Committee or by the Committee Chair pursuant toauthority delegated in this Policy.
The categories of services enumerated under "Audit Services", "Audit-related Services", and "Tax Services" are intended to provide guidance to the Treasurer and the independent accountants as to those categories of services which the Committee believes are generally consistent with the independence of the independent accountants and which the Committee (or the Committee Chair) would expect upon the presentation of specific proposals to pre-approve. The enumerated categories are not intended as an exclusive list of audit, audit-related or tax services, which the Committee (or the Committee Chair) would consider for pre-approval.
Audit Services
The following categories of audit services are considered to be consistent with the role of the Fund's independent accountants:
•Annual Fund financial statement audits
•Seed audits (related to new product filings, as required)
•SEC and regulatory filings and consents
Audit-related Services
The following categories of audit-related services are considered to be consistent with the role of the Fund's independent accountants:
•Accounting consultations
•Fund merger support services
•Agreed Upon Procedure Reports
•Attestation Reports
•Other Internal Control Reports
Individual audit-related services that fall within one of these categories (except for fund merger support services) and are not presented to the Audit Committee as part of the annual pre-approval process are subject to an authorized pre-approval by the Audit Committee so long as the estimated fee for those services does not exceed $30,000. Any services provided under such pre-approval will be reported to the Audit Committee at its next regular meeting. Should the amount of such services exceed $30,000 any additional fees will be subject to pre-approval by the Committee Chair (or any other Committee member on whom this responsibility has been delegated). Fees related to fund merger support services are subject to a separate authorized pre-approval by the Audit Committee with fees determined on a per occurrence and merger complexity basis.
Tax Services
The following categories of tax services are considered to be consistent with the role of the Fund's independent accountants:
•Tax compliance services related to the filing or amendment of the following:
•Federal, state and local income tax compliance; and,
•Sales and use tax compliance
•Timely RIC qualification reviews
•Tax distribution analysis and planning
•Tax authority examination services
•Tax appeals support services
•Accounting methods studies
•Fund merger support services
•Tax consulting services and related projects
Individual tax services that fall within one of these categories and are not presented to the Audit Committee as part of the annual pre-approval process are subject to an authorized pre-approval by the Audit Committee so long as the estimated fee for those services does not exceed $30,000. Any services provided under such pre-approval will be reported to the Audit Committee at its next regular meeting. Should the amount of such services exceed $30,000 any additional fees will be subject to pre-approval by the Committee Chair (or any other Committee member on whom this responsibility has been delegated).
Other Non-Audit Services
Certain non-audit services that the independent accountants are legally permitted to render will be subject to pre-approval by the Committee or by one or more Committee members to whom the Committee has delegated this authority and who will report to the full Committee any pre-approval decisions made pursuant to this Policy. Non-audit services presented for pre-approval pursuant to this paragraph will be accompanied by a confirmation from both the Treasurer and the independent accountants that the proposed services will not adversely affect the independence of the independent accountants.
Proscribed Services
The Fund's independent accountants will not render services in the following categories of non-audit services:
•Bookkeeping or other services related to the accounting records or financial statements of the Fund
•Financial information systems design and implementation
•Appraisal or valuation services, fairness opinions, or contribution-in-kind reports
•Actuarial services
•Internal audit outsourcing services
•Management functions or human resources
•Broker or dealer, investment adviser, or investment banking services
•Legal services and expert services unrelated to the audit
•Any other service that the Public Company Accounting Oversight Board determines, by regulation, is impermissible.
Pre-approval of Non-Audit Services Provided to Other Entities Within the PGIM FundComplex
Certain non-audit services provided to PGIM Investments LLC or any of its affiliates that also provide ongoing services to the PGIM Mutual Funds will be subject to pre-approval by the Audit Committee. The only non-audit services provided to these entities that will require pre-approval are those related directly to the operations and financial reporting of the Funds. Individual projects that are not presented to the Audit Committee as part of the annual pre-approval process will be subject
to pre-approval by the Committee Chair (or any other Committee member on whom this responsibility has been delegated) so long as the estimated fee for those services does not exceed $30,000. Services presented for pre-approval pursuant to this paragraph will be accompanied by a confirmation from both the Treasurer and the independent accountants that the proposed services will not adversely affect the independence of the independent accountants.
Although the Audit Committee will not pre-approve all services provided to PGIM Investments LLC and its affiliates, the Committee will receive an annual report from the Fund's independent accounting firm showing the aggregate fees for all services provided to PGIM Investments and its affiliates.
(e)(2) Percentage of services referred to in 4(b) – 4(d) that were approved by the audit committee –
For the fiscal year ended February 29, 2020, 100% of the services referred to in Item 4(b) was approved by the audit committee. For the fiscal year ended February 28, 2019: none.
(f)Percentage of hours expended attributable to work performed by other than full time employees of principal accountant if greater than 50%.
The percentage of hours expended on the principal accountant's engagement to audit the registrant's financial statements for the most recent fiscal year that were attributed to work performed by persons other than the principal accountant's full-time, permanent employees was 0%.
(g)Non-Audit Fees
The aggregate non-audit fees billed by KPMG for services rendered to the registrant's investment adviser and any entity controlling, controlled by, or under common control with the investment adviser that provides ongoing services to the registrant for the fiscal years ended February 29, 2020 and February 28, 2019 was $0 and $0, respectively.
(h)Principal Accountant's Independence
Not applicable as KPMG has not provided non-audit services to the registrant's investment adviser and any entity controlling, controlled by, or under common control with the investment adviser that provides ongoing services to the registrant that were not pre-approved pursuant to Rule 2-01(c)(7)(ii) of Regulation S-X.
Item 5 – Audit Committee of Listed Registrants – Not applicable
Item 6 – Schedule of Investments – The schedule is included as part of the report to shareholders filed under Item 1 of this Form.
Item 7 – Disclosure of Proxy Voting Policies and Procedures for Closed-End Management Investment Companies – Not applicable.
Item 8 – Portfolio Managers of Closed-End Management Investment Companies – Not applicable.
Item 9 – Purchases of Equity Securities by Closed-End Management Investment Company and Affiliated Purchasers – Not applicable.
Item 10 – Submission of Matters to a Vote of Security Holders – There have been no material changes to these procedures.
Item 11 – Controls and Procedures
(a)It is the conclusion of the registrant's principal executive officer and principal financial officer that the effectiveness of the registrant's current disclosure controls and procedures (such disclosure controls and procedures having been evaluated within 90 days of the date of this filing) provide reasonable assurance that the information required to be disclosed by the registrant has been recorded, processed, summarized and reported within the time period specified in the Commission's rules and forms and that the information required to be disclosed by the registrant has been accumulated and communicated to the registrant's principal
executive officer and principal financial officer in order to allow timely decisions regarding required disclosure.
(b)There has been no significant change in the registrant's internal control over financial reporting that occurred during the registrant's most recent fiscal quarter of the period covered by this report that has materially affected, or is likely to materially affect, the registrant's internal control over financial reporting.
Item 12 – Controls and Procedures - Disclosure of Securities Lending Activities for Closed-End Management Investment Companies – Not applicable.
Item 13 – Exhibits
(a)(1) Code of Ethics – Attached hereto as Exhibit EX-99.CODE-ETH
(2)Certifications pursuant to Section 302 of the Sarbanes-Oxley Act – Attached hereto as Exhibit EX-99.CERT.
(3)Any written solicitation to purchase securities under Rule 23c-1. – Not applicable.
(4)Registrant's Independent Public Accountant, attached as Exhibit 99.ACCT.
(b)Certifications pursuant to Section 906 of the Sarbanes-Oxley Act – Attached hereto as Exhibit EX-99.906CERT.
SIGNATURES
Pursuant to the requirements of the Securities Exchange Act of 1934 and the Investment Company Act of 1940, the registrant has duly caused this report to be signed on its behalf by the undersigned, thereunto duly authorized.
Registrant: | Prudential Investment Portfolios, Inc. 14 |
By: | /s/ Andrew R. French |
| Andrew R. French |
| Secretary |
Date: | April 17, 2020 |
Pursuant to the requirements of the Securities Exchange Act of 1934 and the Investment Company Act of 1940, this report has been signed below by the following persons on behalf of the registrant and in the capacities and on the dates indicated.
By: | /s/ Stuart S. Parker |
| Stuart S. Parker |
| President and Principal Executive Officer |
Date: | April 17, 2020 |
By: | /s/ Christian J. Kelly |
| Christian J. Kelly |
| Treasurer and Principal Financial and Accounting Officer |
Date: | April 17, 2020 |