| | UNITED STATES | | |
| | SECURITIES AND EXCHANGE COMMISSION |
| | Washington, D.C. 20549 | | |
| | | | |
| | FORM N-CSR | | |
| | | | |
| CERTIFIED SHAREHOLDER REPORT OF REGISTERED MANAGEMENT |
| | INVESTMENT COMPANIES | | |
| | | | |
| Investment Company Act file number 811-3721 | | |
| | | | |
| DREYFUS INTERMEDIATE MUNICIPAL BOND FUND, INC. |
| | (Exact name of Registrant as specified in charter) |
| | | | |
| | c/o The Dreyfus Corporation | | |
| | 200 Park Avenue | | |
| | New York, New York 10166 | | |
| | (Address of principal executive offices) | | (Zip code) |
| | | | |
| | Mark N. Jacobs, Esq. | | |
| | 200 Park Avenue | | |
| | New York, New York 10166 | | |
| | (Name and address of agent for service) |
| | | | |
| Registrant's telephone number, including area code: | | (212) 922-6000 |
| | | | |
| Date of fiscal year end: | 5/31 | | |
| | | | |
| Date of reporting period: | 5/31/04 | | |
SSL-DOCS2 70128344v10
| | | FORM N-CSR |
| | | |
| Item 1. | Reports to Stockholders. | |
| Dreyfus |
| Intermediate Municipal |
| Bond Fund, Inc. |
ANNUAL REPORT May 31, 2004

The views expressed in this report reflect those of the portfolio manager only through the end of the period covered and do not necessarily represent the views of Dreyfus or any other person in the Dreyfus organization. Any such views are subject to change at any time based upon market or other conditions and Dreyfus disclaims any responsibility to update such views.These views may not be relied on as investment advice and, because investment decisions for a Dreyfus fund are based on numerous factors, may not be relied on as an indication of trading intent on behalf of any Dreyfus fund.
Not FDIC-Insured • Not Bank-Guaranteed • May Lose Value
Contents
THE FUND
2
| Letter from the Chairman
|
3
| Discussion of Fund Performance
|
6
| Fund Performance
|
7
| Statement of Investments
|
21
| Statement of Assets and Liabilities
|
22
| Statement of Operations
|
23
| Statement of Changes in Net Assets
|
24
| Financial Highlights
|
25
| Notes to Financial Statements
|
30
| Report of Independent Registered Public Accounting Firm
|
31
| Important Tax Information
|
32
| Board Members Information
|
34
| Officers of the Fund
|
FOR MORE INFORMATION
|
Back Cover
|
| Dreyfus Intermediate Municipal |
| Bond Fund, Inc. |
The Fund

LETTER FROM THE CHAIRMAN
Dear Shareholder:
This annual report for Dreyfus Intermediate Municipal Bond Fund, Inc. covers the 12-month period from June 1, 2003, through May 31, 2004. Inside, you’ll find valuable information about how the fund was managed during the reporting period, including a discussion with the fund’s portfolio manager, Monica Wieboldt.
Positive economic data continued to accumulate during the reporting period, as consumers, flush with extra cash from their 2003 federal tax refunds and mortgage refinancings, continued to spend. Corporations have become more willing to hire new workers and invest in new projects and equipment. In addition, many states and municipalities have reported an increase in tax revenues, helping to relieve some of the fiscal pressures that arose during the economic downturn.As the economy has gained strength, fixed-income investors apparently have grown more concerned that long-dormant inflationary pressures could resurface, and municipal bond prices recently have become more volatile.
Despite fixed-income investors’ current concerns, we believe that history confirms that bonds represent an important component of most investors’ long-term investment portfolios. As always, we encourage you to speak regularly with your financial advisor, who may be in the best position to suggest ways to position your portfolio for the opportunities and challenges of today’s financial markets.
Thank you for your continued confidence and support.
Sincerely,

| Stephen E. Canter |
| Chairman and Chief Executive Officer |
| The Dreyfus Corporation |
| June 15, 2004 |
2

DISCUSSION OF FUND PERFORMANCE
Monica Wieboldt, Senior Portfolio Manager
How did Dreyfus Intermediate Municipal Bond Fund, Inc. perform during the reporting period?
For the 12-month period ended May 31, 2004, the fund achieved a total return of –0.81%.1 The Lehman Brothers 7-Year Municipal Bond Index (the “Index”), the fund’s benchmark, achieved a total return of –0.32% for the same period.2 In addition, the average total return for all funds reported in the Lipper Intermediate Municipal Debt Funds category was –0.70%.3
After gaining value early in the reporting period, municipal bonds were hurt during the spring of 2004, when investors’ concerns regarding potential inflationary pressures and higher interest rates intensified.The fund produced returns that were generally in line with the Lipper category average, primarily due to income contributions from its core holdings, favorable yield curve positioning and successful yield enhancement strategies. However, the fund underperformed the Index, which does not reflect fund fees and expenses.
What is the fund’s investment approach?
The fund seeks the maximum amount of current income exempt from federal income tax as is consistent with the preservation of capital.To pursue this goal, the fund normally invests substantially all of its assets in municipal bonds that provide income exempt from federal personal income tax.
The fund will invest at least 80% of its assets in municipal bonds rated A or higher, or the unrated equivalent as determined by Dreyfus.The fund may invest up to 20% of its assets in municipal bonds rated below A, including bonds rated below investment grade (“high yield” or “junk” bonds) or the unrated equivalent as determined by Dreyfus. The dollar-weighted average maturity of the fund’s portfolio ranges between three and 10 years.
The Fund
3
DISCUSSION OF FUND PERFORMANCE (continued)
The portfolio manager may buy and sell bonds based on credit quality, market outlook and yield potential. In selecting municipal bonds for investment, the portfolio manager may assess the current interest-rate environment and the municipal bond’s potential volatility in different rate environments. The portfolio manager focuses on bonds with the potential to offer attractive current income, typically looking for bonds that can provide consistently attractive current yields or that are trading at competitive market prices.A portion of the fund’s assets may be allocated to “discount” bonds, which are bonds that sell at a price below their face value, or to “premium” bonds, which are bonds that sell at a price above their face value.The fund’s allocation to either discount bonds or to premium bonds will change along with our changing views of the current interest-rate and market environment. The portfolio manager also may look to select bonds that are most likely to obtain attractive prices when sold.
What other factors influenced the fund’s performance?
The fund was affected during the reporting period by heightened market volatility, including a sharp decline in intermediate-term bond prices during the summer of 2003.Although evidence of a sustained economic recovery continued in the fall of 2003 and the winter of 2004, municipal bond prices gradually recovered, supported by robust demand from individual and institutional investors and a moderating supply of newly-issued bonds compared to the same period one year earlier.
In April and May 2004, however, reports of an unexpectedly strong U.S. labor market and higher energy prices rekindled fears that renewed inflationary pressures might prompt the Federal Reserve Board (the “Fed”) to raise short-term interest rates earlier than most investors previously had believed. As a result, selling pressure intensified, and municipal bond prices generally ended the reporting period modestly lower than where they began.
In this volatile environment, we attempted to manage risk by diversifying the fund’s investment more broadly among municipal bonds of various maturities, complementing core intermediate-term holdings with
4
new investments in the five- to seven-year range as well as bonds with maturities within 20 years. We also diversified more broadly among issuers, adding to the fund’s holdings of bonds from “specialty states” such as California, New York and Florida. Because many of these new positions were added during periods of relative market weakness, the fund’s performance benefited as their prices recovered.When adding new securities, we attempted to complement the fund’s high-coupon, seasoned holdings with bonds from well-known issuers selling at par, which we believe are likely to attract retail interest when we deem it time to sell.
Finally, while the fund received positive contributions to its performance from yield enhancement strategies, we began to sell many of those positions later in the reporting period, when it became clearer to us that interest rates were likely to rise.
What is the fund’s current strategy?
We have continued to maintain the fund’s investment posture, which includes a diversified portfolio, a focus on issues that are rated A or better by one or more of the major rating agencies, and an average duration — a measure of sensitivity to changing interest rates — in the neutral range. In our view, these are reasonable strategies as investors and, potentially, the Fed adjust to a stronger economic environment.
June 15, 2004
1
| Total return includes reinvestment of dividends and any capital gains paid. Past performance is no guarantee of future results. Share price, yield and investment return fluctuate such that upon redemption, fund shares may be worth more or less than their original cost. Income may be subject to state and local taxes, and some income may be subject to the federal alternative minimum tax (AMT) for certain investors. Capital gains, if any, are fully taxable. Return figure provided reflects the absorption of fund expenses by The Dreyfus Corporation pursuant to an undertaking in effect that may be extended, terminated or modified at any time. Had these expenses not been absorbed, the fund’s return would have been lower.
|
2
| SOURCE: LIPPER INC. — Reflects reinvestment of dividends and, where applicable, capital gain distributions.The Lehman Brothers 7-Year Municipal Bond Index is an unmanaged total return performance benchmark for the investment-grade, geographically unrestricted 7-year tax-exempt bond market, consisting of municipal bonds with maturities of 6-8 years. Index returns do not reflect fees and expenses associated with operating a mutual fund.
|
3
| Source: Lipper Inc.
|
The Fund
5
FUND PERFORMANCE
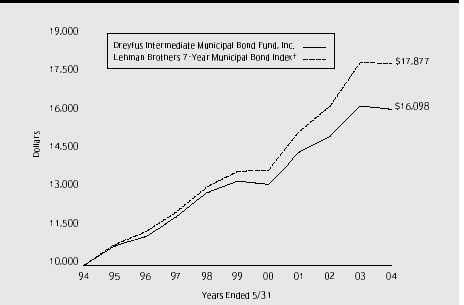
Comparison of change in value of $10,000 investment in Dreyfus Intermediate Municipal Bond Fund, Inc. and the Lehman Brothers 7-Year Municipal Bond Index
Average Annual Total Returns as of 5/31/04
| | 1 Year | | 5 Years | | 10 Years | |
|
| |
| |
| |
| Fund | (0.81)% | | 3.91% | | 4.88% | |
† Source: Lipper Inc.
Past performance is not predictive of future performance.The fund’s performance shown in the graph and table does not reflect the deduction of taxes that a shareholder would pay on fund distributions or the redemption of fund shares. The above graph compares a $10,000 investment made in Dreyfus Intermediate Municipal Bond Fund, Inc. on 5/31/94 to a $10,000 investment made in the Lehman Brothers 7-Year Municipal Bond Index (the “Index”) on that date.All dividends and capital gain distributions are reinvested.
The fund invests primarily in municipal securities and maintains a portfolio with a weighted average maturity ranging between 3 and 10 years.The fund’s performance shown in the line graph above takes into account fees and expenses.The Index, unlike the fund, is an unmanaged total return performance benchmark for the investment-grade, geographically unrestricted 7-year tax-exempt bond market, consisting of municipal bonds with maturities of 6-8 years.The Index does not take into account charges, fees and other expenses.These factors can contribute to the Index potentially outperforming or underperforming the fund. Further information relating to fund performance, including expense reimbursements, if applicable, is contained in the Financial Highlights section of the prospectus and elsewhere in this report.
6
| STATEMENT OF INVESTMENTS | | | | |
| May 31, 2004 | | | | |
|
|
|
| |
| | | | | |
| | | | | |
| | | | | |
| | | | | |
| | Principal | | | |
| Long-Term Municipal Investments—98.0% | Amount ($) | Value ($) | |
|
|
| |
| Alabama—.3% | | | | |
| McIntosh Industrial Development Board, EIR | | | | |
| 4.65%, 6/1/2008 | 2,800,000 | | 2,932,355 | |
| Alaska—4.8% | | | | |
| Alaska International Airports, Revenue: | | | | |
| 5.50%, 10/1/2011 (Insured; AMBAC) | 2,560,000 | | 2,850,610 | |
| 5.50%, 10/1/2012 (Insured; AMBAC) | 1,620,000 | | 1,804,436 | |
| Alaska Student Loan Corp., Student Loan Revenue: | | | | |
| 5.60%, 7/1/2011 (Insured; AMBAC) | 4,700,000 | | 4,901,065 | |
| 5.70%, 7/1/2013 (Insured; AMBAC) | 5,990,000 | | 6,214,624 | |
| 6%, 7/1/2016 (Insured; AMBAC) | 6,380,000 | | 6,807,650 | |
| Anchorage: | | | | |
| 5.875%, 12/1/2015 (Insured; FGIC) | 2,365,000 | | 2,629,761 | |
| 5.875%, 12/1/2016 (Insured; FGIC) | 1,500,000 | | 1,667,924 | |
| Electric Utility Revenue: | | | | |
| 6.50%, 12/1/2008 (Insured; MBIA) | 2,755,000 | | 3,147,642 | |
| 6.50%, 12/1/2009 (Insured; MBIA) | 2,910,000 | | 3,359,827 | |
| 5.875%, 2/1/2012 (Insured; FSA) | 3,175,000 | | 3,542,919 | |
| Northern Tobacco Securitization Corp., | | | | |
| Tobacco Settlement Revenue: | | | | |
| 6%, 6/1/2013 | 4,745,000 | | 4,533,800 | |
| 6.20%, 6/1/2022 | 2,400,000 | | 2,235,264 | |
| Arizona—.6% | | | | |
| Glendale Municipal Property Corp., Excise Tax Revenue | | | | |
| 5%, 7/1/2017 (Insured; AMBAC) | 2,160,000 | | 2,253,701 | |
| Maricopa County Industrial Development Authority, | | | | |
| Hospital Systems Revenue (Baptist Hospital) | | | | |
| 5.20%, 9/1/2005 (Insured; MBIA) | 3,125,000 | | 3,266,156 | |
| Arkansas—.5% | | | | |
| Arkansas Student Loan Authority, Student Loan Revenue | | | | |
| 5.35%, 6/1/2009 | 4,465,000 | | 4,644,493 | |
| California—9.3% | | | | |
| California (Veterans) 9.263%, 12/1/2013 | 5,000,000 | a,b | 5,342,550 | |
| California Department of Water Resources, | | | | |
| Water Revenue (Central Valley Project) | | | | |
| 5.25%, 12/1/2012 (Insured; FGIC) | 10,000,000 | | 11,080,200 | |
| California Economic Recovery | | | | |
| 5%, 7/1/2015 (Insured; MBIA) | 8,000,000 | | 8,538,720 | |
| California Educational Facilities Authority, Revenue | | | | |
| (Stanford University) 5.25%, 12/1/2013 | 2,000,000 | | 2,233,840 | |
The Fund
7
S T A T E M E N T O F I N V E S T M E N T S (continued)
| | Principal | | | |
| Long-Term Municipal Investments (continued) | Amount ($) | Value ($) | |
|
|
| |
| California (continued) | | | | |
| California Infrastructure & Economic Development, | | | | |
| Bank Revenue (Bay Area Toll Bridges—1st Lien) | | | | |
| 5.25%, 7/1/2017 (Insured; FSA) | 3,300,000 | | 3,517,107 | |
| California Pollution Control Financing Authority, PCR | | | | |
| (Southern California Edison Co.) 2%, 3/1/2006 | 5,500,000 | | 5,412,605 | |
| California Public Works Board, LR | | | | |
| (Department of Mental Health—Coalinga) | | | | |
| 5.50%, 6/1/2018 | 3,000,000 | | 3,168,990 | |
| California Statewide Community Development Authority: | | | | |
| MFHR (Equity Residential) 5.20%, 6/15/2009 | 3,000,000 | | 3,166,650 | |
| Revenue 3.075%, 5/1/2006 | 2,500,000 | a,b | 2,378,650 | |
| Elsinore Valley Municipal Water District, COP | | | | |
| 5.375%, 7/1/2016 (Insured; FGIC) | 3,295,000 | | 3,601,732 | |
| Foothill/Eastern Transportation Corridor Agency, | | | | |
| Toll Road Revenue | | | | |
| 0%/7%, 1/1/2008 | 5,000,000 | c | 5,487,000 | |
| Golden State Tobacco Securitization Corporation, | | | | |
| Tobacco Settlement Revenue: | | | | |
| 5.75%, 6/1/2021 | 6,950,000 | | 7,100,537 | |
| 5.75%, 6/1/2023 | 1,735,000 | | 1,766,299 | |
| Los Angeles County Public Works Financing Authority, | | | | |
| Revenue (Regional Park & Open Space District) | | | | |
| 5%, 10/1/2019 | 6,000,000 | | 6,090,840 | |
| San Francisco City & County Public Utilities Commission, | | | | |
| Water Revenue 5%, 11/1/2015 (Insured; MBIA) | 2,000,000 | | 2,116,120 | |
| University of California, Revenues | | | | |
| 5.25%, 5/15/2016 (Insured; AMBAC) | 11,765,000 | | 12,629,610 | |
| Colorado—2.1% | | | | |
| Denver City & County, Airport Revenue | | | | |
| 5%, 11/15/2008 | 5,000,000 | | 5,339,350 | |
| Denver City & County Board of Water Commissioners, | | | | |
| Water Revenue 5%, 12/1/2009 (Insured; FSA) | 2,830,000 | | 3,066,192 | |
| El Paso County School District | | | | |
| (Number 11 Colorado Springs): | | | | |
| 6.25%, 12/1/2009 | 1,000,000 | | 1,147,470 | |
| 6.50%, 12/1/2010 | 2,000,000 | | 2,348,680 | |
| 6.50%, 12/1/2011 | 2,040,000 | | 2,415,727 | |
| Interlocken Metropolitan District: | | | | |
| Zero Coupon, 12/15/2007 | 2,835,000 | | 2,497,011 | |
| Zero Coupon, 12/15/2008 | 2,835,000 | | 2,361,442 | |
| | | | | |
| | | | | |
| 8 | | | | |
| | Principal | | | |
| Long-Term Municipal Investments (continued) | Amount ($) | Value ($) | |
|
|
| |
| Connecticut—.7% | | | | |
| Connecticut, Revenue | | | | |
| (Mashantucket Western Pequot Tribe): | | | | |
| 6.50%, 9/1/2006 | 2,475,000 | b | 2,713,739 | |
| 6.50%, 9/1/2006 | 2,525,000 | b | 2,715,284 | |
| 5.60%, 9/1/2009 | 1,000,000 | b | 1,080,490 | |
| District of Columbia—.4% | | | | |
| District of Columbia | | | | |
| 6%, 6/1/2012 (Insured; MBIA) | 3,280,000 | | 3,761,766 | |
| Florida—3.3% | | | | |
| Capital Projects Finance Authority, Student Housing | | | | |
| Revenue (Capital Projects Loan Program) | | | | |
| 5.50%, 10/1/2015 (Insured; MBIA) | 4,060,000 | | 4,307,295 | |
| Collier County, Gas Tax Revenue | | | | |
| 5.25%, 6/1/2019 (Insured; AMBAC) | 2,190,000 | | 2,311,370 | |
| FSU Financial Assistance Inc., Educational & Athletic | | | | |
| Facilities Improvement Revenue: | | | | |
| 5%, 10/1/2017 (Insured; AMBAC) | 1,630,000 | | 1,703,529 | |
| 5%, 10/1/2018 (Insured; AMBAC) | 1,705,000 | | 1,771,307 | |
| 5%, 10/1/2019 (Insured; AMBAC) | 1,785,000 | | 1,843,405 | |
| Orlando Utilities Commission, Water & Electric Revenue | | | | |
| 5%, 10/1/2014 | 5,455,000 | | 5,839,959 | |
| Palm Beach County School Board, COP | | | | |
| 5.375%, 8/1/2014 (Insured; AMBAC) | 4,000,000 | | 4,455,440 | |
| Palm Beach County Solid Waste Authority, Revenue | | | | |
| 4%, 1/1/2011 (Insured; AMBAC) | 5,000,000 | | 5,098,700 | |
| Polk County, Utility System Revenue | | | | |
| 5.25%, 10/1/2018 (Insured; FGIC) | 2,000,000 | | 2,125,020 | |
| Georgia—1.7% | | | | |
| Athens Housing Authority, Student Housing LR | | | | |
| (Ugaref East Campus Housing): | | | | |
| 5.25%, 12/1/2015 (Insured; AMBAC) | 2,560,000 | | 2,756,326 | |
| 5.25%, 12/1/2016 (Insured; AMBAC) | 2,700,000 | | 2,893,482 | |
| Atlanta, Airport Facilities Revenue | | | | |
| 6%, 1/1/2007 (Insured; AMBAC) | 5,780,000 | | 6,273,092 | |
| Municipal Electric Authority (Combustion Turbine Project) | | | | |
| 5.25%, 11/1/2012 (Insured; MBIA) | 2,735,000 | | 3,019,167 | |
| Hawaii—.3% | | | | |
| Kuakini Health System, Special Purpose Revenue | | | | |
| 5.50%, 7/1/2012 | 2,575,000 | | 2,616,020 | |
The Fund
9
S T A T E M E N T O F I N V E S T M E N T S (continued)
| | Principal | | | |
| Long-Term Municipal Investments (continued) | Amount ($) | Value ($) | |
|
|
| |
| Illinois—2.2% | | | | |
| Chicago (Neighborhoods Alive 21 Program) | | | | |
| 5.50%, 1/1/2014 (Insured; FGIC) | 3,230,000 | | 3,541,081 | |
| Chicago Housing Authority, Revenue (Capital Program): | | | | |
| 5%, 7/1/2009 | 2,500,000 | | 2,665,625 | |
| 5.25%, 7/1/2010 | 2,420,000 | | 2,613,237 | |
| Chicago O’Hare International Airport, Revenue | | | | |
| (Third Lien) 5.50%, 1/1/2015 | 6,450,000 | | 7,060,815 | |
| Illinois Health Facilities Authority, Revenue | | | | |
| (Evangelical Hospital) 6.75%, 4/15/2007 | 150,000 | | 161,499 | |
| Illinois Student Assistance Commission, | | | | |
| Student Loan Revenue 5.55%, 9/1/2006 | 4,000,000 | | 4,261,480 | |
| Indiana—3.1% | | | | |
| Central High School Building Corp., First Mortgage | | | | |
| 5.50%, 8/1/2009 (Insured; AMBAC) | 3,960,000 | | 4,339,606 | |
| Indiana Health Facility Financing Authority, HR | | | | |
| (Clarian Health Partners, Inc.): | | | | |
| 5.50%, 2/15/2010 | 3,000,000 | | 3,183,840 | |
| 5.50%, 2/15/2011 | 5,000,000 | | 5,280,000 | |
| Indianapolis Local Public Improvement Bond Bank | | | | |
| 6.50%, 1/1/2011 (Insured; FSA) | 6,415,000 | | 7,499,777 | |
| North Montgomery Elementary School Building Corp., | | | | |
| First Mortgage Revenue 6.50%, 7/1/2006 | 3,710,000 | | 3,895,834 | |
| Plymouth, Multi-School Building Corp. | | | | |
| (First Mortgage-Plymouth Community School) | | | | |
| 5.50%, 7/1/2005 (Insured; MBIA) | 2,445,000 | | 2,504,291 | |
| Westfield High School Building Corp., | | | | |
| First Mortgage Revenue | | | | |
| 5.25%, 7/5/2013 (Insured; AMBAC) | 1,500,000 | | 1,613,625 | |
| Kentucky—1.3% | | | | |
| Ashland, PCR (Ashland, Inc.) 5.70%, 11/1/2009 | 4,000,000 | | 4,249,360 | |
| Carrolton and Henderson Public Energy Authority, | | | | |
| Gas Revenue (Kentucky Trust) | | | | |
| 5%, 1/1/2006 (Insured; FSA) | 3,500,000 | | 3,661,105 | |
| Kenton County Airport Board, Airport Revenue | | | | |
| (Cincinnati/Northern Kentucky International) | | | | |
| 5.75%, 3/1/2009 (Insured; MBIA) | 3,710,000 | | 3,967,437 | |
| Massachusetts—2.0% | | | | |
| Massachusetts Consolidated Loan: | | | | |
| 5%, 12/1/2010 | 3,000,000 | | 3,237,420 | |
| 5.75%, 10/1/2020 (Prerefunded 10/1/2010) | 3,000,000 | d | 3,370,770 | |
| | | | | |
| | | | | |
| 10 | | | | |
| | Principal | | | |
| Long-Term Municipal Investments (continued) | Amount ($) | Value ($) | |
|
|
| |
| Massachusetts (continued) | | | | |
| Massachusetts Housing Finance Agency | | | | |
| Housing Revenue: | | | | |
| 6.30%, 7/1/2007 (Insured; AMBAC) | 2,795,000 | | 2,856,043 | |
| 6.35%, 7/1/2008 (Insured; AMBAC) | 3,005,000 | | 3,069,668 | |
| 6.40%, 7/1/2009 (Insured; AMBAC) | 3,275,000 | | 3,344,365 | |
| Plymouth County, COP (Correctional Facilities Project) | | | | |
| 5%, 4/1/2015 (Insured; AMBAC) | 2,025,000 | | 2,110,577 | |
| Michigan—7.9% | | | | |
| Detroit Local Development Finance Authority | | | | |
| 5.20%, 5/1/2010 | 5,745,000 | | 5,978,534 | |
| Greater Detroit Resource Recovery Authority, Revenue: | | | | |
| 6.25%, Series A, 12/13/2008 (Insured; AMBAC) | 11,000,000 | | 12,419,990 | |
| 6.25%, Series B, 12/13/2008 (Insured; AMBAC) | 7,755,000 | | 8,756,093 | |
| Michigan Building Authority, Revenue | | | | |
| (State Police Communications System) | | | | |
| 5.25%, 10/1/2013 | 1,945,000 | | 2,133,646 | |
| Michigan Hospital Finance Authority, Revenue: | | | | |
| 9.431%, 11/15/2007 | 5,750,000 | a,b | 6,627,163 | |
| (Genesys Health System) | | | | |
| 8.10%, 10/1/2013 (Prerefunded 10/1/2005) | 7,000,000 | d | 7,734,650 | |
| (Oakwood Obligation Group): | | | | |
| 5%, 11/1/2007 | 3,000,000 | | 3,213,540 | |
| 5.50%, 11/1/2011 | 5,000,000 | | 5,429,050 | |
| (Sparrow Obligation Group): | | | | |
| 5.25%, 11/15/2011 | 2,500,000 | | 2,655,800 | |
| 5.75%, 11/15/2016 | 3,250,000 | | 3,442,920 | |
| Michigan Municipal Bond Authority, Revenue | | | | |
| 5%, 5/1/2009 (LOC; Government Loan Progam) | 3,000,000 | | 3,240,630 | |
| (Drinking Water Revolving Fund) | | | | |
| 5.25%, 10/1/2016 (Prerefunded; 10/1/2009) | 2,370,000 | d | 2,607,332 | |
| Michigan Strategic Fund: | | | | |
| Exempt Facilities Revenue, | | | | |
| (Waste Management Inc. Project) 4.20%, 8/1/2004 | 3,000,000 | | 3,008,220 | |
| SWDR (Waste Management) 3%, 2/1/2007 | 4,000,000 | | 3,922,200 | |
| Minnesota—1.4% | | | | |
| Minnesota Public Facilities Authority, | | | | |
| Water Pollution Control Revenue 5%, 3/1/2013 | 6,755,000 | | 7,181,308 | |
| Western Minnesota Municipal Power Agency, | | | | |
| Power Supply Revenue | | | | |
| 5%, 1/1/2014 (Insured; MBIA) | 5,165,000 | | 5,566,527 | |
The Fund
11
S T A T E M E N T O F I N V E S T M E N T S (continued)
| | Principal | | | |
| Long-Term Municipal Investments (continued) | Amount ($) | Value ($) | |
|
|
| |
| Mississippi—1.3% | | | | |
| Mississippi Development Bank, Special Obligation | | | | |
| (Adams County HR Project) | | | | |
| 5.75%, 7/1/2010 (Insured; FSA) | 3,445,000 | | 3,715,433 | |
| Mississippi Higher Education Assistance Corp. | | | | |
| Student Loan Revenue 5.30%, 9/1/2008 | 2,390,000 | | 2,517,291 | |
| Walnut Grove Correctional Authority, COP: | | | | |
| 5.25%, 11/1/2005 (Insured; AMBAC) | 1,670,000 | | 1,754,402 | |
| 5.50%, 11/1/2006 (Insured; AMBAC) | 1,760,000 | | 1,896,875 | |
| 5.50%, 11/1/2007 (Insured; AMBAC) | 1,855,000 | | 2,026,847 | |
| Missouri—1.9% | | | | |
| Independence School District | | | | |
| (Missouri School District Direct Deposit | | | | |
| Program) 4.50%, 3/1/2018 (Insured; FSA) | 1,000,000 | | 990,330 | |
| Joplin Industrial Development Authority, Revenue | | | | |
| (Catholic Health Initiatives): | | | | |
| 5.50%, 12/1/2009 | 3,185,000 | | 3,407,727 | |
| 5.625%, 12/1/2010 | 3,340,000 | | 3,566,786 | |
| Missouri Health & Educational | | | | |
| Facilities Authority, Revenue | | | | |
| (SSM Health Care) 5%, 6/1/2007 | 2,940,000 | | 3,123,427 | |
| Saint Louis, Airport Revenue | | | | |
| (Airport Development Program): | | | | |
| 5.50%, 7/1/2010 (Insured; MBIA) | 3,000,000 | | 3,302,310 | |
| 5.625%, 7/1/2015 (Insured; MBIA) | 2,500,000 | | 2,715,625 | |
| Nevada—.6% | | | | |
| Washoe County, Water Facility Revenue | | | | |
| (Sierra Pacific Power Company) 5%, 7/1/2009 | 5,000,000 | | 4,997,550 | |
| New Jersey—4.0% | | | | |
| New Jersey Economic Development Authority, Revenue: | | | | |
| 9.221%, 6/15/2008 | 5,000,000 | a,b | 6,009,700 | |
| School Facilities | | | | |
| (Construction 2001) 5.25%, 6/15/2010 | 30,000 | | 33,029 | |
| Waste Paper Recycling (Marcal Paper Mills, Inc.) | | | | |
| 8.50%, 2/1/2010 (Insured; MBIA) | 2,005,000 | | 1,770,776 | |
| New Jersey Educational Facilities Authority, Revenue | | | | |
| (Rider University): | | | | |
| 5%, 7/1/2010 | 1,880,000 | | 2,002,125 | |
| 5%, 7/1/2011 | 1,970,000 | | 2,094,898 | |
| New Jersey Health Care Facilities | | | | |
| Financing Authority, Revenue | | | | |
| (South Jersey Hospital) 6%, 7/1/2012 | 3,425,000 | | 3,800,688 | |
| | | | | |
| | | | | |
| 12 | | | | |
| | Principal | | | |
| Long-Term Municipal Investments (continued) | Amount ($) | Value ($) | |
|
|
| |
| New Jersey (continued) | | | | |
| New Jersey Transportation Trust Fund Authority | | | | |
| (Transportation System): | | | | |
| 5.50%, 12/15/2013 (Insured: AMBAC) | 10,000,000 | | 11,204,900 | |
| 6%, 6/15/2016 (Prerefunded 6/15/2010) | 4,000,000 | d | 4,575,840 | |
| New Jersey Turnpike Authority, Revenue | | | | |
| 5.625%, 1/1/2015 | | | | |
| (Insured MBIA, Prerefunded; 1/1/2010) | 3,910,000 | d | 4,371,654 | |
| New Mexico—1.3% | | | | |
| Jicarilla, Apache Nation Revenue: | | | | |
| 5%, 9/1/2011 | 1,500,000 | | 1,577,955 | |
| 5%, 9/1/2013 | 2,905,000 | | 3,024,512 | |
| Las Cruces, Joint Utility Improvement Revenue | | | | |
| 5.50%, 7/1/2016 (Insured; MBIA) | 7,000,000 | | 7,536,690 | |
| New York—10.9% | | | | |
| Battery Park City Authority, Revenue | | | | |
| 5.25%, 11/1/2017 | 5,405,000 | | 5,762,595 | |
| City University of New York, COP (John Jay College) | | | | |
| 5.75%, 8/15/2004 | 5,970,000 | | 6,024,805 | |
| New York City: | | | | |
| 5.25%, 8/1/2008 | 5,000,000 | | 5,376,100 | |
| 6.25%, 8/1/2009 (Prerefunded 8/1/2006) | 2,000,000 | d | 2,204,060 | |
| 6.375%, 8/15/2009 (Prerefunded 8/15/2005) | 5,760,000 | d | 6,151,162 | |
| 5%, 8/1/2014 | 5,000,000 | | 5,251,600 | |
| New York City Transitional Finance Authority, Revenue | | | | |
| (Future Tax Secured) 5.375%, 2/1/2015 | 3,000,000 | | 3,236,220 | |
| New York State 5%, 4/15/2009 | 2,800,000 | | 3,022,012 | |
| New York State Dormitory Authority, Revenues: | | | | |
| (Department of Health): | | | | |
| 5.50%, 7/1/2010 (Prerefunded 7/1/2006) | 2,000,000 | d | 2,176,900 | |
| 5.625%, 7/1/2011 (Prerefunded 7/1/2006) | 3,240,000 | d | 3,534,840 | |
| (Personal Income Tax) 5.375%, 3/15/2017 | 5,500,000 | | 5,885,220 | |
| New York State Local Government | | | | |
| Assistance Corporation: | | | | |
| 5.25%, 4/1/2016 | 3,425,000 | | 3,689,616 | |
| 5.25%, 4/1/2016 (Insured; FSA) | 2,200,000 | | 2,380,532 | |
| New York State Thruway Authority, Service Contract | | | | |
| Revenue (Local Highway & Bridge): | | | | |
| 6%, 4/1/2011 | 2,040,000 | | 2,257,117 | |
| 5.50%, 4/1/2012 | 3,950,000 | | 4,364,237 | |
| 5.50%, 4/1/2013 | 5,000,000 | | 5,509,100 | |
The Fund
13
S T A T E M E N T O F I N V E S T M E N T S (continued)
| | Principal | | | |
| Long-Term Municipal Investments (continued) | Amount ($) | | Value ($) | |
|
| |
| |
| New York (continued) | | | | |
| New York State Urban Development Corp.: | | | | |
| Corporate Purpose 5.125%, 7/1/2019 | 2,000,000 | | 2,033,000 | |
| Correctional Capital Facilities 5.25%, 1/1/2010 | 4,520,000 | | 4,797,392 | |
| Correctional & Youth Facilities Service Contract | | | | |
| Revenue: | | | | |
| 5%, 1/1/2008 | 3,400,000 | | 3,633,988 | |
| (Empire State Development Corp.): | | | | |
| 5%, 1/1/2009 | 3,000,000 | | 3,189,270 | |
| 5.25%, 1/1/2009 | 5,000,000 | | 5,368,000 | |
| Personal Income Tax 5.25%, 3/15/2011 | 1,565,000 | | 1,712,971 | |
| Tobacco Settlement Financing Corp., Revenue | | | | |
| 5.50%, 6/1/2018 | 4,000,000 | | 4,243,000 | |
| Triborough Bridge and Tunnel Authority, Revenue | | | | |
| 6.75%, 1/1/2009 | 5,100,000 | | 5,725,260 | |
| North Carolina—2.7% | | | | |
| North Carolina Eastern Municipal Power Agency, | | | | |
| Power System Revenue: | | | | |
| 5.50%, 1/1/2012 | 3,000,000 | | 3,211,890 | |
| 5.125%, 1/1/2014 | 3,000,000 | | 3,116,010 | |
| North Carolina Medical Care Commission, | | | | |
| Retirement Facilities Revenue | | | | |
| (Givens Estates Project): | | | | |
| 4.75%, 7/1/2010 | 1,000,000 | | 1,001,530 | |
| 5%, 7/1/2011 | 500,000 | | 500,865 | |
| 5.25%, 7/1/2012 | 750,000 | | 756,353 | |
| North Carolina Municipal Power Agency | | | | |
| Electric Revenue (Number 1 Catawba): | | | | |
| 5.25%, 1/1/2016 (Insured; FSA) | 2,540,000 | | 2,705,125 | |
| 5.25%, 1/1/2017 (Insured; FSA) | 10,000,000 | | 10,576,600 | |
| Raleigh Durham Airport Authority, Airport Revenue | | | | |
| 5.25%, 11/1/2012 (Insured; FGIC) | 2,365,000 | | 2,586,151 | |
| Ohio—1.2% | | | | |
| Cuyahoga County, HR | | | | |
| (Cleveland Clinic Health System) 6%, 1/1/2017 | 4,000,000 | | 4,330,160 | |
| Knox County, Hospital Facilities Revenue | | | | |
| (Knox Community Hospital Asset Guaranty) | | | | |
| 5%, 6/1/2012 | 1,500,000 | | 1,589,790 | |
| Lorain, HR (Catholic Healthcare) | | | | |
| 5.25%, 10/1/2009 | 5,000,000 | | 5,368,500 | |
| Oklahoma—1.1% | | | | |
| Norman Regional Hospital Authority, HR | | | | |
| 5.625%, 9/1/2016 (Insured; MBIA) | 4,510,000 | | 4,807,570 | |
| | | | | |
| 14 | | | | |
| | Principal | | | | | |
| Long-Term Municipal Investments (continued) | Amount ($) | | Value ($) | |
|
|
|
| |
| Oklahoma (continued) | | | | | | |
| Oklahoma Development Finance Authority, LR | | | | | | |
| (Oklahoma State System Higher Education): | | | | | | |
| 4%, 6/1/2007 | 1,020,000 | | 1,058,699 | | | |
| 4%, 6/1/2008 | 1,060,000 | | 1,097,397 | | | |
| Washington County Medical Authority, Revenue | | | | | | |
| (Jane Phillips Medical Center) | | | | | | |
| 5.50%, 11/1/2010 (Insured; Connie Lee) | 3,175,000 | | 3,414,014 | | | |
| Oregon—1.3% | | | | | | |
| Oregon Department of Administrative Services | | | | | | |
| 5%, 91//2009 (Insured; FSA) | 5,000,000 | | 5,421,600 | | | |
| Washington County Unified Sewer Agency, | | | | | | |
| Sewer Revenue 5.75%, 10/1/2012 (Insured; FGIC) | 5,670,000 | | 6,458,981 | | | |
| Pennsylvania—7.6% | | | | | | |
| Allegheny County Industrial Development Authority, | | | | | | |
| PCR 4.05%, 9/1/2011 (Insured; AMBAC) | 4,000,000 | | 4,060,680 | | | |
| Carbon County Industrial Development Authority, RRR | | | | | | |
| (Panther Creek Partners Project) 6.65%, 5/1/2010 | 10,040,000 | | 10,762,077 | | | |
| Delaware County Industrial Development Authority: | | | | | | |
| PCR (Peco Energy Co.) 5.20%, 10/1/2004 | 4,000,000 | | 4,039,760 | | | |
| (Resource Recovery Facility) 6.10%, 7/1/2013 | 10,000,000 | | 10,512,700 | | | |
| Delaware River Joint Toll Bridge Commission | | | | | | |
| Bridge Revenue 5.25%, 7/1/2013 | 2,500,000 | | 2,713,300 | | | |
| Delaware Valley Regional Finance Autority, | | | | | | |
| Local Government Revenue 5.75%, 7/1/2017 | 6,830,000 | | 7,663,806 | | | |
| Erie County Hospital Authority, Revenue | | | | | | |
| (Hamot Health Foundation) | | | | | | |
| 5.375%, 5/15/2010 (Insured; AMBAC) | 2,340,000 | | 2,507,310 | | | |
| Erie County Industrial Development Authority, | | | | | | |
| EIR (International Paper Company Project) | | | | | | |
| 5.25%, 9/1/2010 | 2,100,000 | | 2,203,614 | | | |
| Montgomery County Higher Education & Health | | | | | | |
| Authority, HR (Abington Memorial) | | | | | | |
| 6.10%, 6/1/2012 (Insured; AMBAC) | 5,000,000 | | 5,707,900 | | | |
| Pennsylvania Higher Educational Facilities Authority, | | | | | | |
| Health Services Revenue (University of Pennsylvania): | | | | | | |
| 5.60%, Series A, 1/1/2010 | 4,750,000 | | 4,921,665 | | | |
| 5.60%, Series B, 1/1/2010 | 4,350,000 | | 4,510,298 | | | |
| 5.70%, 1/1/2011 | 3,250,000 | | 3,374,995 | | | |
| (UPMC Health System) 6.25%, 1/15/2015 | 3,660,000 | | 4,012,092 | | | |
| Sayre Health Care Facilities Authority, Revenue | | | | | | |
| (Guthrie Health) 6%, 12/1/2012 | 2,000,000 | | 2,180,700 | | | |
| | | | | | | |
| | | The Fund | | | 15 | |
S T A T E M E N T O F I N V E S T M E N T S (continued)
| | Principal | | | |
| Long-Term Municipal Investments (continued) | Amount ($) | Value ($) | |
|
|
| |
| Rhode Island—1.8% | | | | |
| Rhode Island Health and Educational Building Corp.: | | | | |
| Health Facilities Revenue (San Antoine) | | | | |
| 5.50%, 11/15/2009 | 3,320,000 | | 3,584,172 | |
| Hospital Financing Revenue | | | | |
| (Lifespan Obligation Group): | | | | |
| 5.75%, 5/15/2007 (Insured; MBIA) | 4,805,000 | | 5,218,422 | |
| 5.75%, 5/15/2008 (Insured; MBIA) | 5,560,000 | | 6,076,413 | |
| Revenue (Roger Williams University | | | | |
| Radianassurance ) 5%, 11/15/2021 | 1,360,000 | | 1,337,424 | |
| South Carolina—1.9% | | | | |
| Anderson County, IDR (Federal Paper Board) | | | | |
| 4.75%, 8/1/2010 | 4,520,000 | | 4,620,163 | |
| Berkeley County School District, Installment | | | | |
| Purchase Revenue (Securing Assets for Education) | | | | |
| 5.25%, 12/1/2021 | 9,395,000 | | 9,426,379 | |
| Charleston, COP (Public Facilities Corp.) | | | | |
| 5%, 9/1/2015 | 2,145,000 | | 2,266,943 | |
| Hilton Head Island Public Facilities Corp., COP | | | | |
| 5%, 3/1/2013 (Insured; AMBAC) | 1,065,000 | | 1,145,578 | |
| Tennessee—1.3% | | | | |
| Johnson City Health and Educational Facility Board, HR | | | | |
| (Medical Center Hospital Improvement) | | | | |
| 5.125%, 7/1/2011 (Insured; MBIA) | 6,720,000 | | 7,169,030 | |
| Tennessee Housing Development Agency | | | | |
| (Homeownership Program): | | | | |
| 5.20%, 7/1/2010 | 1,815,000 | | 1,917,094 | |
| 5.30% 7/1/2011 | 2,140,000 | | 2,254,362 | |
| Texas—9.3% | | | | |
| Austin Independent School District | | | | |
| 5.60% 8/1/2009 | 2,025,000 | | 2,159,582 | |
| Bexar County, Revenue (Venue) | | | | |
| 5.75%, 8/15/2013 (Insured; MBIA) | 5,000,000 | | 5,562,300 | |
| Cypress—Fairbanks Independent School District | | | | |
| (Schoolhouse) 6.75%, 2/15/2012 | | | | |
| (Prerefunded 2/15/2010) | 1,700,000 | d | 1,997,228 | |
| Gulf Coast Waste Disposal Authority: | | | | |
| Revenue (Bayport Area System) | | | | |
| 5%, 10/1/2014 (Insured; AMBAC) | 2,065,000 | | 2,201,786 | |
| SWDR (Quaker Oats Co. Project) 5.70%, 5/1/2006 | 3,210,000 | | 3,390,948 | |
| Harris County (Permanent Improvement) | | | | |
| 5.25%, 10/1/2016 | 3,435,000 | | 3,659,031 | |
| | | | | |
| 16 | | | | |
| | Principal | | | |
| Long-Term Municipal Investments (continued) | Amount ($) | Value ($) | |
|
|
| |
| Texas (continued) | | | | |
| Harris County Health Facilities Development Corp., HR: | | | | |
| (Memorial Hermann Hospital System) | | | | |
| 5.50%, 6/1/2012 (Insured; FSA) | 8,295,000 | | 9,197,330 | |
| (Memorial Hospital System) | | | | |
| 6%, 6/1/2008 (Insured; MBIA) | 9,080,000 | | 10,066,088 | |
| Houston, Utility System Revenue | | | | |
| (First Lien) 5.25%, 5/15/2015 (Insured; MBIA) | 7,500,000 | | 8,138,850 | |
| Port Corpus Christi Industrial Development Corp., | | | | |
| Revenue (Valero): | | | | |
| 5.125%, 4/1/2009 | 2,250,000 | | 2,359,283 | |
| 5.40%, 4/1/2018 | 1,500,000 | | 1,518,450 | |
| Tarrant County Health Facilities Development Corp., | | | | |
| Health Systems Revenue: | | | | |
| (Harris Methodist Health Systems) 6%, 9/1/2010 | 7,725,000 | | 8,672,317 | |
| (Health Resources Systems) | | | | |
| 5.75%, 2/15/2014 (Insured; MBIA) | 5,000,000 | | 5,614,300 | |
| Texas Municipal Power Agency, Revenue: | | | | |
| (Subordinated Lien) 4.40%, 9/1/2011 (Insured; FGIC) | 5,000,000 | | 5,112,750 | |
| Zero Coupon, 9/1/2009 (Insured; AMBAC) | | | | |
| (Escrowed to Maturity) | 105,000 | | 87,065 | |
| Zero Coupon, 9/1/2009 (Insured; AMBAC) | 9,265,000 | | 7,623,149 | |
| University of Texas University Revenues Financing | | | | |
| System 5.25%, 8/15/2018 | 6,000,000 | | 6,352,200 | |
| Utah—1.5% | | | | |
| Carbon County, SWDR | | | | |
| (Sunnyside Cogeneration-A) 6.375%, 8/15/2011 | 8,450,000 | | 7,774,254 | |
| Jordanelle Special Service District | | | | |
| (Special Assessment Improvement District) | | | | |
| 8%, 10/1/2011 | 5,565,000 | | 5,863,395 | |
| Virginia—1.0% | | | | |
| Arlington County Industrial Development Authority, RRR | | | | |
| (Ogden Martin System of Alexandria/Arlington | | | | |
| Inc. Project) 5.375%, 1/1/2012 (Insured; FSA) | 2,530,000 | | 2,687,923 | |
| Big Stone Gap Redevelopment and Housing Authority, | | | | |
| Correctional Facility LR | | | | |
| (Wallens Ridge Development Project) 6%, 9/1/2007 | | | | |
| (Prerefunded 9/1/2005) | 4,000,000 | d | 4,298,840 | |
| Greater Richmond Convention Center Authority, | | | | |
| Hotel Tax Revenue (Convention Center | | | | |
| Expansion Project) 6%, 6/15/2011 | 2,000,000 | | 2,249,880 | |
The Fund
17
S T A T E M E N T O F I N V E S T M E N T S (continued)
| | Principal | | | |
| Long-Term Municipal Investments (continued) | Amount ($) | Value ($) | |
|
|
| |
| Washington—3.1% | | | | |
| Energy Northwest | | | | |
| Revenue (Wind Project): | | | | |
| 4.55%, 7/1/2006 | 1,600,000 | | 1,644,960 | |
| 5.60%, 7/1/2015 | 2,530,000 | | 2,603,117 | |
| Seattle Municipal Light & Power, Revenue: | | | | |
| 5.25%, 3/1/2010 (Insured; FSA) | 50,000 | | 54,645 | |
| 9.31%, 3/1/2010 | 6,500,000 | a,b | 7,707,635 | |
| Washington: | | | | |
| 5.75%, 10/1/2012 | 20,000 | | 22,467 | |
| 5.75%, 10/1/2012 | 2,305,000 | | 2,593,448 | |
| Washington Health Care Facilities Authority, Revenue | | | | |
| (Sisters of Providence) | | | | |
| 5.40%, 10/1/2010 (Insured; AMBAC) | 3,000,000 | | 3,187,380 | |
| Washington, Public Power Supply Systems Revenue | | | | |
| (Nuclear Project Number 1) | | | | |
| 6%, 7/1/2007 (Insured; AMBAC) | 9,720,000 | | 10,554,754 | |
| Wisconsin—.9% | | | | |
| Racine, SWDR (Republic Services Project) | | | | |
| 3.25%, 4/1/2009 | 4,000,000 | | 3,791,680 | |
| Wisconsin Health and Educational Facilities Authority, | | | | |
| Revenue (Aurora Medical Group, Inc.) | | | | |
| 6%, 11/15/2011 (Insured; FSA) | 3,500,000 | | 3,996,020 | |
| U. S. Related—1.4% | | | | |
| Children’s Trust of Puerto Rico, Tobacco Settlement | | | | |
| Revenue, Asset Backed Bonds: | | | | |
| 5.75%, 7/1/2010 | 2,500,000 | | 2,825,850 | |
| 5.75%, 7/1/2012 (Prerefunded 7/1/2010) | 5,000,000 | d | 5,651,700 | |
| 5.75%, 7/1/2013 (Prerefunded 7/1/2010) | 3,300,000 | d | 3,730,122 | |
| Total Long-Term Municipal Investments | | | | |
| (cost $864,388,617) | | | 885,975,204 | |
18
| | | | Principal | | | |
| Short-Term Municipal Investments—.9% | Amount ($) | Value ($) | |
|
|
| |
| California—.0% | | | | | |
| California, VRDN 1.07% (LOC; West LB AG; | | | | |
| JP Morgan Chase Bank) | | 500,000 | e | 500,000 | |
| Florida—.4% | | | | | |
| Collier County Health Facilities Authority, | | | | |
| Revenue, VRDN (Cleveland Clinic | | | | |
| Health) 1.08% (LOC; UBS AG) | 3,650,000 | e | 3,650,000 | |
| Tennessee—.2% | | | | | |
| Blount County Public Building Authority, Local | | | | |
| Government Public Improvement, VRDN 1.09% | 1,500,000 | e | 1,500,000 | |
| Texas—.3% | | | | | |
| North Central Texas Health Facility | | | | |
| Development Corp., Revenue, VRDN | | | | |
| (Methodist Hospitals) 1.11% | 2,600,000 | e | 2,600,000 | |
| Total Short-Term Municipal Investments | | | | |
| (cost $ | 8,250,000) | | | | 8,250,000 | |
|
|
|
|
|
| |
| | | | | | | |
| Total Investments (cost $ | 872,638,617) | 98.9% | | 894,225,204 | |
| Cash and Receivables (Net) | 1.1% | | 9,991,535 | |
| Net Assets | | 100.0% | | 904,216,739 | |
The Fund
19
S T A T E M E N T O F I N V E S T M E N T S (continued)
Summary of Abbreviations
| ACA | American Capital Access | IDC | Industrial Development Corporation |
| AMBAC | American Municipal Bond Assurance | IDR | Industrial Development Revenue |
| | Corporation | LOC | Letter of Credit |
| COP | Certificate of Participation | LR | Lease Revenue |
| EIR | Environment Improvement Revenue | MBIA | Municipal Bond Investors Assurance |
| FGIC | Financial Guaranty Insurance | | Insurance Corporation |
| | Company | MFHR | Multi-Family Housing Revenue |
| FNMA | Federal National Mortgage | PCR | Pollution Control Revenue |
| | Association | RRR | Resources Recovery Revenue |
| FSA | Financial Security Assurance | SWDR | Solid Waste Disposal Revenue |
| HR | Hospital Revenue | VRDN | Variable Rate Demand Notes |
| Summary of Combined Ratings (Unaudited) | | |
| | | | | | | |
| Fitch | or | Moody’s | or | Standard & Poor’s | Value (%) | |
|
|
|
|
|
| |
| AAA | | Aaa | | AAA | 55.3 | |
| AA | | Aa | | AA | 19.5 | |
| A | | A | | A | 12.6 | |
| BBB | | Baa | | BBB | 9.2 | |
| F1 | | MIG1/P1 | | SP1/A1 | .6 | |
| Not Rated f | | Not Rated f | | Not Rated f | 2.8 | |
| | | | | | 100.0 | |
a Inverse floater security—-the interest rate is subject to change periodically.
b
| Securities exempt from registration under Rule 144A of the Securities Act of 1933.These securities may be resold in transactions exempt from registration normally to qualified institutional buyers.At May 31, 2004, these securities amounted to $34,575,211 or 3.8% of net assets.
|
c
| Zero coupon until a specified date, at which time the stated coupon rate becomes effective until maturity.
|
d
| Bonds which are prerefunded are collateralized by U.S. Government securities which are held in escrow and are used to pay principal and interest on the municipal issue and to retire the bonds in full at the earliest refunding date.
|
e
| Securities payable on demand.Variable interest rate—subject to periodic change.
|
f
| Securities which, while not rated by Fitch, Moody’s and Standard & Poors, have been determined by the Manager to be of comparable quality to those rated securities in which the fund may invest.
|
See notes to financial statements.
20
STATEMENT OF ASSETS AND LIABILITIES
| May 31, 2004 | | | | |
|
|
|
| |
| | | | | |
| | | | | |
| | | | | |
| | | | | |
| | | | | |
| | | Cost | Value | |
|
|
|
| |
| Assets ($): | | | | |
| Investments in securities—See Statement of Investments | 872,638,617 | 894,225,204 | |
| Cash | | | 6,594,863 | |
| Interest receivable | | 14,810,056 | |
| Receivable for investment securities sold | | 3,011,478 | |
| Receivable for shares of Common Stock subscribed | | 1,565 | |
| Prepaid expenses and other assets | | 420,765 | |
| | | | 919,063,931 | |
|
|
|
| |
| Liabilities ($): | | | |
| Due to The Dreyfus Corporation and affiliates—Note 3(a) | | 556,770 | |
| Payable for investment securities purchased | | 13,746,593 | |
| Payable for shares of Common Stock redeemed | | 403,189 | |
| Accrued expenses | | 140,640 | |
| | | | 14,847,192 | |
|
|
|
| |
| Net Assets ( | $) | | 904,216,739 | |
|
|
|
| |
| Composition of Net Assets ($): | | | |
| Paid-in capital | | | 896,643,858 | |
| Accumulated undistributed investment income—net | | 280,714 | |
| Accumulated net realized gain (loss) on investments | | (14,294,420) | |
| Accumulated net unrealized appreciation | | | |
| (depreciation) on investments | | 21,586,587 | |
|
|
| |
| Net Assets ( | $) | | 904,216,739 | |
|
|
|
| |
| Shares Outstanding | | | |
| (300 million shares of $.001 par value Common Stock authorized) | | 68,063,179 | |
| Net Asset Value, offering and redemption price per share—Note 3(d) ($) | 13.28 | |
| | | | | |
| See notes to financial statements. | | | |
The Fund
21
| STATEMENT OF OPERATIONS | | |
| Year Ended May 31, 2004 | | |
|
| |
| | | |
| | | |
| | | |
| | | |
| | | |
| | | |
| Investment Income ($): | | |
| Interest Income | 44,753,758 | |
| Expenses: | | |
| Management fee—Note 3(a) | 5,834,676 | |
| Shareholder servicing costs—Note 3(b) | 1,051,887 | |
| Custodian fees | 79,798 | |
| Directors’ fees and expenses—Note 3(c) | 56,965 | |
| Professional fees | 49,134 | |
| Registration fees | 34,930 | |
| Prospectus and shareholders’ reports | 20,305 | |
| Loan commitment fees—Note 2 | 9,057 | |
| Miscellaneous | 58,881 | |
| Total Expenses | 7,195,633 | |
| Investment Income—Net | 37,558,125 | |
|
| |
| Realized and Unrealized Gain (Loss) on Investments—Note 4 ($): | | |
| Net realized gain (loss) on investments | 10,267,229 | |
| Net unrealized appreciation (depreciation) on investments | (55,517,040) | |
| Net Realized and Unrealized Gain (Loss) on Investments | (45,249,811) | |
| Net (Decrease) in Net Assets Resulting from Operations | (7,691,686) | |
| | | |
| See notes to financial statements. | | |
22
STATEMENT OF CHANGES IN NET ASSETS
| | | | Year Ended May 31, | |
| | | |
| |
| | 2004 | | 2003 | |
|
| |
| |
| Operations ($): | | | | |
| Investment income—net | 37,558,125 | | 44,604,987 | |
| Net realized gain (loss) on investments | 10,267,229 | | 3,053,294 | |
| Net unrealized appreciation | | | | |
| (depreciation) on investments | (55,517,040) | | 34,146,641 | |
| Net Increase (Decrease) in Net Assets | | | | |
| Resulting from Operations | (7,691,686) | | 81,804,922 | |
|
| |
| |
| Dividends to Shareholders from ($): | | | | |
| Investment income—net | (37,207,071) | | (44,357,527) | |
|
| |
| |
| Capital Stock Transactions ($): | | | | |
| Net proceeds from shares sold | 70,360,162 | | 195,712,715 | |
| Dividends reinvested | 27,275,524 | | 32,502,166 | |
| Cost of shares redeemed | (196,272,299) | | (275,909,166) | |
| Increase (Decrease) in Net Assets | | | | |
| from Capital Stock Transactions | (98,636,613) | | (47,694,285) | |
| Total Increase (Decrease) in Net Assets | (143,535,370) | | (10,246,890) | |
|
| |
| |
| Net Assets ($): | | | | |
| Beginning of Period | 1,047,752,109 | | 1,057,998,999 | |
| End of Period | 904,216,739 | | 1,047,752,109 | |
| Undistributed investment income—net | 280,714 | | 112,012 | |
|
| |
| |
| Capital Share Transactions (Shares): | | | | |
| Shares sold | 5,171,532 | | 14,420,826 | |
| Shares issued for dividends reinvested | 2,014,036 | | 2,386,133 | |
| Shares redeemed | (14,462,858) | | (20,302,480) | |
| Net Increase (Decrease) in Shares Outstanding | (7,277,290) | | (3,495,521) | |
| | | | | |
| See notes to financial statements. | | | | |
The Fund
23
FINANCIAL HIGHLIGHTS
The following table describes the performance for the fiscal periods indicated. Total return shows how much your investment in the fund would have increased (or decreased) during each period, assuming you had reinvested all dividends and distributions.These figures have been derived from the fund’s financial statements.
| | | | | | Year Ended May 31, | | | |
| | | | | |
| | | |
| | 2004 | | 2003 | | 2002a | | 2001 | | 2000 | |
|
| |
| |
| |
| |
| |
| Per Share Data ($): | | | | | | | | | | |
| Net asset value, beginning of period | 13.91 | | 13.42 | | 13.51 | | 12.94 | | 13.83 | |
| Investment Operations: | | | | | | | | | | |
| Investment income—net | .52b | | .57b | | .64b | | .65 | | .66 | |
| Net realized and unrealized | | | | | | | | | | |
| gain (loss) on investments | (.63) | | .49 | | (.09) | | .57 | | (.79) | |
| Total from Investment Operations | (.11) | | 1.06 | | .55 | | 1.22 | | (.13) | |
| Distributions: | | | | | | | | | | |
| Dividends from | | | | | | | | | | |
| investment income—net | (.52) | | (.57) | | (.64) | | (.65) | | (.67) | |
| Dividends from net realized | | | | | | | | | | |
| gain on investments | — | | — | | — | | — | | (.09) | |
| Total Distributions | (.52) | | (.57) | | (.64) | | (.65) | | (.76) | |
| Net asset value, end of period | 13.28 | | 13.91 | | 13.42 | | 13.51 | | 12.94 | |
|
| |
| |
| |
| |
| |
| Total Return (%) | (.81) | | 8.09 | | 4.14 | | 9.54 | | (.97) | |
|
| |
| |
| |
| |
| |
| Ratios/Supplemental Data (%): | | | | | | | | | | |
| Ratio of expenses | | | | | | | | | | |
| to average net assets | .74 | | .74 | | .74 | | .74 | | .75 | |
| Ratio of net investment income | | | | | | | | | | |
| to average net assets | 3.86 | | 4.23 | | 4.74 | | 4.82 | | 4.97 | |
| Decrease reflected in above expense | | | | | | | | | | |
| ratios due to undertakings by | | | | | | | | | | |
| The Dreyfus Corporation | — | | — | | — | | .00c | | .02 | |
| Portfolio Turnover Rate | 35.07 | | 41.30 | | 27.32 | | 24.32 | | 20.86 | |
|
| |
| |
| |
| |
| |
| Net Assets, end of period | | | | | | | | | | |
| ($ x 1,000) | 904,217 | | 1,047,752 | | 1,057,999 | | 1,065,775 | | 1,066,938 | |
a As required, effective June 1, 2001, the fund has adopted the provisions of the AICPA Audit and Accounting Guide for Investment Companies and began amortizing discount or permium on a scientific basis for debt securities on a daily basis.The effect of this change for the period ended May 31, 2002 was to increase net investment income per share and decrease net realized and unrealized gain (loss) on investments by less than $.01 and increase the ratio of net investment income to average net assets by less than .01%. Per share data and ratios/supplemental data for periods prior to June 1, 2001 have not been restated to reflect this change in presentation.
b
| Based on average shares outstanding at each month end.
|
c
| Amount represents less than .01%.
|
See notes to financial statements.
24
NOTES TO FINANCIAL STATEMENTS
NOTE 1—Significant Accounting Policies:
Dreyfus Intermediate Municipal Bond Fund, Inc. (the “fund”) is registered under the Investment Company Act of 1940, as amended (the “Act”), as a non-diversified open-end management investment company. The fund’s investment objective is to provide the maximum amount of current income exempt from federal income tax as is consistent with the preservation of capital. The Dreyfus Corporation (the “Manager”or “Dreyfus”) serves as the fund’s investment adviser. The Manager is a wholly-owned subsidiary of Mellon Financial Corporation (“Mellon Financial”). Dreyfus Service Corporation (the “Distributor”), a wholly-owned subsidiary of the Manager, is the distributor of the fund’s shares, which are sold to the public without a sales charge.
The fund’s financial statements are prepared in accordance with U.S. generally accepted accounting principles, which may require the use of management estimates and assumptions. Actual results could differ from those estimates.
The fund enters into contracts that contain a variety of indemnifications. The fund’s maximum exposure under these arrangements is unknown.The fund does not anticipate recognizing any loss related to these arrangements.
(a) Portfolio valuation: Investments in securities are valued each business day by an independent pricing service (the “Service”) approved by the Board of Directors. Investments for which quoted bid prices are readily available and are representative of the bid side of the market in the judgment of the Service are valued at the mean between the quoted bid prices (as obtained by the Service from dealers in such securities) and asked prices (as calculated by the Service based upon its evaluation of the market for such securities). Other investments (which constitute a majority of the portfolio securities) are carried at fair value as determined by the Service, based on methods which include consideration of: yields or prices of municipal securities of comparable quality, coupon, maturity and type; indications as to values from dealers; and general market conditions.
The Fund
25
NOTES TO FINANCIAL STATEMENTS (continued)
(b) Securities transactions and investment income: Securities transactions are recorded on a trade date basis. Realized gain and loss from securities transactions are recorded on the identified cost basis. Interest income, adjusted for amortization of discount and premium on investments, is earned from settlement date and recognized on the accrual basis. Securities purchased or sold on a when-issued or delayed-delivery basis may be settled a month or more after the trade date. Under the terms of the custody agreement, the fund received net earnings credits of $33,521 during the period ended May 31, 2004 based on available cash balances left on deposit. Income earned under this arrangement is included in interest income.
(c) Dividends to shareholders: It is the policy of the fund to declare dividends daily from investment income-net. Such dividends are paid monthly. Dividends from net realized capital gain, if any, are normally declared and paid annually, but the fund may make distributions on a more frequent basis to comply with the distribution requirements of the Internal Revenue Code of 1986, as amended (the “Code”).To the extent that net realized capital gain can be offset by capital loss carryovers, it is the policy of the fund not to distribute such gain. Income and capital gain distributions are determined in accordance with income tax regulations, which may differ from U.S. generally accepted accounting principles.
(d) Federal income taxes: It is the policy of the fund to continue to qualify as a regulated investment company, which can distribute tax exempt dividends, by complying with the applicable provisions of the Code, and to make distributions of income and net realized capital gain sufficient to relieve it from substantially all federal income and excise taxes.
At May 31, 2004, the components of accumulated earnings on a tax basis were as follows:undistributed tax exempt income $280,714,accumulated capital losses $14,294,420 and unrealized appreciation $21,699,181.
The accumulated capital loss carryover is available to be applied against future net securities profits, if any, realized subsequent to May 31, 2004. If not applied, the carryover expires in fiscal 2011.
26
The tax character of distributions paid to shareholders during the fiscal periods ended May 31, 2004 and May 31, 2003, were as follows: tax exempt income $37,207,071 and $44,357,527, respectively.
During the period ended May 31, 2004, as a result of permanent book to tax differences primarily due to amortization adjustments, the fund decreased accumulated undistributed investment income-net by $182,352, increased accumulated net realized gain (loss) on investments by $151,338 and increased paid-in capital by $31,014. Net assets were not affected by this reclassification
NOTE 2—Bank Line of Credit:
The fund participates with other Dreyfus-managed funds in a $350 million redemption credit facility (the “Facility”) to be utilized for temporary or emergency purposes, including the financing of redemptions. In connection therewith, the fund has agreed to pay commitment fees on its pro rata portion of the Facility. Interest is charged to the fund based on prevailing market rates in effect at the time of borrowings. During the period ended May 31, 2004, the fund did not borrow under the Facility.
NOTE 3—Management Fee and Other Transactions With Affiliates:
(a) Pursuant to a management agreement (“Agreement”) with the Manager, the management fee is computed at the annual rate of .60 of 1% of the value of the fund’s average daily net assets and is payable monthly.
The components of Due to The Dreyfus Corporation and affiliates in the Statement of Assets and Liabilities consists of: management fees $458,770, shareholder services plan fees $44,000 and transfer agency per account fees $54,000.
(b) Under the Shareholder Services Plan, the fund reimburses the Distributor an amount not to exceed an annual rate of .25 of 1% of the value of the fund’s average daily net assets for certain allocated expenses of providing personal services and/or maintaining sharehold-
The Fund
27
NOTES TO FINANCIAL STATEMENTS (continued)
ers accounts. The services provided may include personal services relating to shareholder accounts, such as answering shareholder inquires regarding the fund and providing reports and other information, and services related to the maintenance of shareholder accounts. During the period ended May 31, 2004, the fund was charged $545,673 pursuant to the Shareholder Services Plan.
The fund compensates Dreyfus Transfer,Inc.,a wholly-owned subsidiary of the Manager, under a transfer agency agreement for providing personnel and facilities to perform transfer agency services for the fund. During the period ended May 31, 2004, the fund was charged $327,997 pursuant to the transfer agency agreement.
(c) Each Board member also serves as a Board member of other funds within the Dreyfus complex. Effective October 15, 2003, annual retainer fees and attendance fees are allocated to each fund based on net assets. Prior to October 15, 2003, each trustee who is not an “affiliated person” as defined in the Act, received from the fund an annual fee of $4,500 and an attendance fee of $500 per meeting for services to the fund. The Chairman of the Board received an additional 25% of such compensation and continues to do so under the new compensation structure.
(d) A .10% redemption fee is charged and retained by the fund on shares redeemed within thirty days following the date of issuance, including redemptions made through the use of the fund’s exchange privilege. During the period ended May 31, 2004, redemption fees charged and retained by the fund amounted to $6,205.
NOTE 4—Securities Transactions:
The aggregate amount of purchases and sales of investment securities, excluding short-term securities, during the period ended May 31, 2004, amounted to $334,557,386 and $436,966,988, respectively.
At May 31,2004,the cost of investments for federal income tax purposes was $872,526,023; accordingly, accumulated net unrealized appreciation on investments was $21,699,181, consisting of $29,169,853 gross unrealized appreciation and $7,470,672 gross unrealized depreciation.
28
NOTE 5—Legal Matters:
Two class actions (which have been consolidated) have been filed against Mellon Financial and Mellon Bank, N.A., and Dreyfus and Founders Asset Management LLC (the “Investment Advisers”), and the directors of all or substantially all of the Dreyfus funds, alleging that the Investment Advisers improperly used assets of the Dreyfus funds, in the form of directed brokerage commissions and 12b-1 fees, to pay brokers to promote sales of Dreyfus funds,and that the use of fund assets to make these payments was not properly disclosed to investors.The complaints further allege that the directors breached their fiduciary duties to fund shareholders under the Investment Company Act of 1940 and at common law. The complaints seek unspecified compensatory and punitive damages, rescission of the funds’ contracts with the Investment Advisers, an accounting of all fees paid, and an award of attorneys’ fees and litigation expenses. Dreyfus and the Dreyfus funds believe the allegations to be totally without merit and will defend the actions vigorously.
Additional lawsuits arising out of these circumstances and presenting similar allegations and requests for relief may be filed against the defendants in the future. Neither Dreyfus nor the Dreyfus funds believe that any of the pending actions will have a material adverse effect on the Dreyfus funds or Dreyfus’ ability to perform its contracts with the Dreyfus funds.
The Fund
29
REPORT OF INDEPENDENT REGISTERED
PUBLIC ACCOUNTING FIRM
Shareholders and Board of Directors
Dreyfus Intermediate Municipal Bond Fund, Inc.
We have audited the accompanying statement of assets and liabilities, including the statement of investments, of Dreyfus Intermediate Municipal Bond Fund, Inc., as of May 31, 2004, and the related statement of operations for the year then ended, the statement of changes in net assets for each of the two years in the period then ended, and financial highlights for each of the years indicated therein.These financial statements and financial highlights are the responsibility of the fund’s management. Our responsibility is to express an opinion on these financial statements and financial highlights based on our audits.
We conducted our audits in accordance with the standards of the Public Company Accounting Oversight Board (United States).Those standards require that we plan and perform the audit to obtain reasonable assurance about whether the financial statements and financial highlights are free of material misstatement. An audit includes examining, on a test basis, evidence supporting the amounts and disclosures in the financial statements. Our procedures included confirmation of securities owned as of May 31, 2004 by correspondence with the custodian and others. An audit also includes assessing the accounting principles used and significant estimates made by management, as well as evaluating the overall financial statement presentation. We believe that our audits provide a reasonable basis for our opinion.
In our opinion, the financial statements and financial highlights referred to above present fairly, in all material respects, the financial position of the Dreyfus Intermediate Municipal Bond Fund, Inc at May 31, 2004, the results of its operations for the year then ended, the changes in its net assets for each of the two years in the period then ended, and the financial highlights for each of the indicated years, in conformity with U.S. generally accepted accounting principles.

| New York, New York |
| July 12, 2004 |
30
IMPORTANT TAX INFORMATION (Unaudited)
In accordance with federal tax law, the fund hereby designates all the dividends paid from investment income-net during its fiscal year ended May 31, 2004 as “exempt-interest dividends” (not generally subject to regular federal income tax).
As required by federal tax law rules, shareholders will receive notification of their portion of the fund’s taxable ordinary dividends (if any) and capital gains distributions (if any) paid for the 2004 calendar year on Form 1099 DIV which will be mailed by January 31, 2005.
The Fund
31
BOARD MEMBERS INFORMATION (Unaudited)
| Joseph S. DiMartino (60) |
| Chairman of the Board (1995) |
Principal Occupation During Past 5 Years:
• Corporate Director and Trustee
Other Board Memberships and Affiliations:
- The Muscular Dystrophy Association, Director
- Levcor International, Inc., an apparel fabric processor, Director
- Century Business Services, Inc., a provider of outsourcing functions for small and medium size companies, Director
- The Newark Group, a provider of a national market of paper recovery facilities, paperboard mills and paperboard converting plants, Director
No. of Portfolios for which Board Member Serves: 186
| David W. Burke (68) |
| Board Member (1994) |
Principal Occupation During Past 5 Years:
• Corporate Director and Trustee
Other Board Memberships and Affiliations:
- John F. Kennedy Library Foundation, Director
- U.S.S. Constitution Museum, Director
No. of Portfolios for which Board Member Serves: 83
———————
| Samuel Chase (72) |
| Board Member (1985) |
Principal Occupation During Past 5 Years:
• Corporate Director and Trustee
No. of Portfolios for which Board Member Serves: 15
———————
| Gordon J. Davis (62) |
| Board Member (1995) |
Principal Occupation During Past 5 Years:
- Partner in the law firm of LeBoeuf, Lamb, Greene & MacRae LLP
- President, Lincoln Center for Performing Arts, Inc. (2001)
Other Board Memberships and Affiliations:
- Consolidated Edison, Inc., a utility company, Director
- Phoenix Companies, Inc., a life insurance company, Director
- Board Member/Trustee for several not-for-profit groups
No. of Portfolios for which Board Member Serves: 25
32
| Joni Evans (62) |
| Board Member (1983) |
Principal Occupation During Past 5 Years:
• Senior Vice President of the William Morris Agency
No. of Portfolios for which Board Member Serves: 15
———————
| Arnold S. Hiatt (77) |
| Board Member (1983) |
Principal Occupation During Past 5 Years:
• Chairman of The Stride Rite Charitable Foundation
Other Board Memberships and Affiliations:
- Isabella Stewart Gardner Museum,Trustee
- John Merck Fund, a charitable trust,Trustee
- Business for Social Responsibility, Chairman
No. of Portfolios for which Board Member Serves: 15
———————
| Burton N. Wallack (53) |
| Board Member (1991) |
Principal Occupation During Past 5 Years:
• President and co-owner of Wallack Management Company, a real estate management company
No. of Portfolios for which Board Member Serves: 15
———————
Once elected all Board Members serve for an indefinite term.The address of the Board Members and Officers is in c/o The Dreyfus Corporation, 200 Park Avenue, New York, New York 10166.Additional information about the Board Members is available in the fund’s Statement of Additional Information which can be obtained from Dreyfus free of charge by calling this toll free number: 1-800-554-4611.
The Fund
33
| OFFICERS OF THE FUND (Unaudited) |
| |
| |
| STEPHEN E. CANTER, President since |
| March 2000. |
| Chairman of the Board, Chief Executive |
| Officer and Chief Operating Officer of the |
| Manager, and an officer of 97 investment |
| companies (comprised of 190 portfolios) |
| managed by the Manager. Mr. Canter also is a |
| Board member and, where applicable, an |
| Executive Committee Member of the other |
| investment management subsidiaries of Mellon |
| Financial Corporation, each of which is an |
| affiliate of the Manager. He is 58 years old and |
| has been an employee of the Manager since |
| May 1995. |
| STEPHEN R. BYERS, Executive Vice |
| President since November 2002. |
| Chief Investment Officer,Vice Chairman and a |
| Director of the Manager, and an officer of 97 |
| investment companies (comprised of 190 |
| portfolios) managed by the Manager. Mr. Byers |
| also is an officer, director or an Executive |
| Committee Member of certain other |
| investment management subsidiaries of Mellon |
| Financial Corporation, each of which is an |
| affiliate of the Manager. He is 50 years old and |
| has been an employee of the Manager since |
| January 2000. Prior to joining the Manager, he |
| served as an Executive Vice President-Capital |
| Markets, Chief Financial Officer and Treasurer |
| at Gruntal & Co., L.L.C. |
| MARK N. JACOBS, Vice President since |
| March 2000. |
| Executive Vice President, Secretary and |
| General Counsel of the Manager, and an |
| officer of 98 investment companies (comprised |
| of 206 portfolios) managed by the Manager. |
| He is 58 years old and has been an employee |
| of the Manager since June 1977. |
34
| JOHN B. HAMMALIAN, Secretary since |
| March 2000. |
| Associate General Counsel of the Manager, |
| and an officer of 37 investment companies |
| (comprised of 46 portfolios) managed by the |
| Manager. He is 40 years old and has been an |
| employee of the Manager since February 1991. |
| STEVEN F. NEWMAN, Assistant Secretary |
| since March 2000. |
| Associate General Counsel and Assistant |
| Secretary of the Manager, and an officer of 98 |
| investment companies (comprised of 206 |
| portfolios) managed by the Manager. He is 54 |
| years old and has been an employee of the |
| Manager since July 1980. |
| MICHAEL A. ROSENBERG, Assistant |
| Secretary since March 2000. |
| Associate General Counsel of the Manager, |
| and an officer of 95 investment companies |
| (comprised of 199 portfolios) managed by the |
| Manager. He is 44 years old and has been an |
| employee of the Manager since October 1991. |
| JAMES WINDELS, Treasurer since |
| November 2001. |
| Director – Mutual Fund Accounting of the |
| Manager, and an officer of 98 investment |
| companies (comprised of 206 portfolios) |
| managed by the Manager. He is 45 years old |
| and has been an employee of the Manager |
| since April 1985. |
| GREGORY S. GRUBER, Assistant |
| Treasurer since March 2000. |
| Senior Accounting Manager – Municipal Bond |
| Funds of the Manager, and an officer of 30 |
| investment companies (comprised of 59 |
| portfolios) managed by the Manager. He is 45 |
| years old and has been an employee of the |
| Manager since August 1981. |
| KENNETH J. SANDGREN, Assistant |
| Treasurer since November 2001. |
| Mutual Funds Tax Director of the Manager, |
| and an officer of 98 investment companies |
| (comprised of 206 portfolios) managed by the |
| Manager. He is 49 years old and has been an |
| employee of the Manager since June 1993. |
| WILLIAM GERMENIS, Anti-Money |
| Laundering Compliance Officer since |
| October 2002. |
| Vice President and Anti-Money Laundering |
| Compliance Officer of the Distributor, and the |
| Anti-Money Laundering Compliance Officer |
| of 93 investment companies (comprised of 201 |
| portfolios) managed by the Manager. He is 33 |
| years old and has been an employee of the |
| Distributor since October 1998. |
The Fund
35
NOTES
| Dreyfus Intermediate |
| Muncipal Bond Fund, Inc. |
| 200 Park Avenue |
| New York, NY 10166 |
| |
| Manager |
| The Dreyfus Corporation |
| 200 Park Avenue |
| New York, NY 10166 |
| |
| Custodian |
| The Bank of New York |
|
| One Wall Street |
| New York, NY 10286 |
| |
| Transfer Agent & |
| Dividend Disbursing Agent |
| Dreyfus Transfer, Inc. |
| 200 Park Avenue |
| New York, NY 10166 |
| |
| Distributor |
| Dreyfus Service Corporation |
| 200 Park Avenue |
| New York, NY 10166 |
| To obtain information: |
|
| |
| By telephone |
| Call 1-800-645-6561 |
| By mail Write to: |
| The Dreyfus Family of Funds |
| 144 Glenn Curtiss Boulevard |
| Uniondale, NY 11556-0144 |
| By E-mail Send your request |
| to info@dreyfus.com |
| On the Internet Information |
| can be viewed online or |
| downloaded from: |
| http://www.dreyfus.com |
© 2004 Dreyfus Service Corporation
0947AR0504
Item 2. Code of Ethics.
The Registrant has adopted a code of ethics that applies to the Registrant's principal executive officer, principal financial officer, principal accounting officer or controller, or persons performing similar functions.
Item 3. Audit Committee Financial Expert.
The Registrant's Board has determined that Joseph S. DiMartino, a member of the Audit Committee of the Board, is an audit committee financial expert as defined by the Securities and Exchange Commission (the "SEC"). Mr. DiMartino is "independent" as defined by the SEC for purposes of audit committee financial expert determinations.
Item 4. Principal Accountant Fees and Services
(a) Audit Fees. The aggregate fees billed for each of the last two fiscal years (the "Reporting Periods") for professional services rendered by the Registrant's principal accountant (the "Auditor") for the audit of the Registrant's annual financial statements, or services that are normally provided by the Auditor in connection with the statutory and regulatory filings or engagements for the Reporting Periods, were $35,700 in 2003 and $37,485 in 2004.
(b) Audit-Related Fees. The aggregate fees billed in the Reporting Periods for assurance and related services by the Auditor that are reasonably related to the performance of the audit of the Registrant's financial statements and are not reported under paragraph (a) of this Item 4 were $-0- in 2003 and $-0- in 2004.
The aggregate fees billed in the Reporting Periods for non-audit assurance and related services by the Auditor to the Registrant's investment adviser (not including any sub-investment adviser whose role is primarily portfolio management and is subcontracted with or overseen by another investment adviser), and any entity controlling, controlled by or under common control with the investment adviser that provides ongoing services to the Registrant ("Service Affiliates"), that were reasonably related to the performance of the annual audit of the Service Affiliate, which required pre-approval by the Audit Committee were $30,000 in 2003 and $273,500 in 2004.
Note: For the second paragraph in each of (b) through (d) of this Item 4, certain of such services were not pre-approved prior to May 6, 2003, when such services were required to be pre-approved. On and after May 6, 2003, 100% of all services provided by the Auditor were pre-approved as required. For comparative purposes, the fees shown assume that all such services were pre-approved, including services that were not pre-approved prior to the compliance date of the pre-approval requirement.
(c) Tax Fees. The aggregate fees billed in the Reporting Periods for professional services rendered by the Auditor for tax compliance, tax advice and tax planning ("Tax Services") were $2,207 in 2003 and $3,498 in 2004. These services consisted of (i) review or preparation of U.S. federal, state, local and excise tax returns; (ii) U.S. federal, state and local tax planning, advice and assistance regarding statutory, regulatory or administrative developments, (iii) tax advice regarding tax qualification matters and/or treatment of various
-2-
SSL-DOCS2 70128344v10
financial instruments held or proposed to be acquired or held, and (iv) determination of Passive Foreign Investment Companies.
The aggregate fees billed in the Reporting Periods for Tax Services by the Auditor to Service Affiliates which required pre-approval by the Audit Committee were $-0- in 2003 and $-0- in 2004.
(d) All Other Fees. The aggregate fees billed in the Reporting Periods for products and services provided by the Auditor, other than the services reported in paragraphs (a) through (c) of this Item, were $-0- in 2003 and $773 in 2004. These services consisted of a review of the Registrant's anti-money laundering program.
The aggregate fees billed in the Reporting Periods for Non-Audit Services by the Auditor to Service Affiliates, other than the services reported in paragraphs (b) and (c) of this Item, which required pre-approval by the Audit Committee were $-0- in 2003 and $-0- in 2004.
Audit Committee Pre-Approval Policies and Procedures. The Registrant's Audit Committee has established policies and procedures (the "Policy") for pre-approval (within specified fee limits) of the Auditor's engagements for non-audit services to the Registrant and Service Affiliates without specific case-by-case consideration. Pre-approval considerations include whether the proposed services are compatible with maintaining the Auditor's independence. Pre-approvals pursuant to the Policy are considered annually.
Non-Audit Fees. The aggregate non-audit fees billed by the Auditor for services rendered to the Registrant, and rendered to Service Affiliates, for the Reporting Periods were $275,773 in 2003 and $611,435 in 2004.
Auditor Independence. The Registrant's Audit Committee has considered whether the provision of non-audit services that were rendered to Service Affiliates which were not pre-approved (not requiring pre-approval) is compatible with maintaining the Auditor's independence.
| Item 5. | Audit Committee of Listed Registrants. |
| | Not applicable. |
| | |
| Item 6. | [Reserved] |
| | |
| Item 7. | Disclosure of Proxy Voting Policies and Procedures for Closed-End Management |
| | Investment Companies. |
| | Not applicable. |
| | |
| Item 8. | Purchases of Equity Securities by Closed-End Management Investment Companies and |
| | Affiliated Purchasers. |
| | Not applicable. |
| | |
| Item 9. | Submission of Matters to a Vote of Security Holders. |
The Fund has a Nominating Committee, which is responsible for selecting and nominating persons for election or appointment by the Fund’s Board as Board members. The Committee has adopted a Nominating Committee Charter (“Charter”). Pursuant to the Charter, the Committee will consider recommendations for nominees from shareholders submitted to the Secretary of the Fund, c/o The Dreyfus Corporation Legal Department, 200 Park Avenue, 8th Floor West, New York, New York 10166. A nomination submission must include information regarding the recommended nominee as specified in the Charter. This information includes all information relating to a
-3-
SSL-DOCS2 70128344v10
recommended nominee that is required to be disclosed in solicitations or proxy statements for the election of Board members, as well as information sufficient to evaluate the factors to be considered by the Committee, including character and integrity, business and professional experience, and whether the person has the ability to apply sound and independent business judgment and would act in the interests of the Fund and its shareholders. Nomination submissions are required to be accompanied by a written consent of the individual to stand for election if nominated by the Board and to serve if elected by the shareholders, and such additional information must be provided regarding the recommended nominee as reasonably requested by the Committee.
Item 10. Controls and Procedures.
(a) The Registrant's principal executive and principal financial officers have concluded, based on their evaluation of the Registrant's disclosure controls and procedures as of a date within 90 days of the filing date of this report, that the Registrant's disclosure controls and procedures are reasonably designed to ensure that information required to be disclosed by the Registrant on Form N-CSR is recorded, processed, summarized and reported within the required time periods and that information required to be disclosed by the Registrant in the reports that it files or submits on Form N-CSR is accumulated and communicated to the Registrant's management, including its principal executive and principal financial officers, as appropriate to allow timely decisions regarding required disclosure.
(b) There were no changes to the Registrant's internal control over financial reporting that occurred during the Registrant's most recently ended fiscal half-year that have materially affected, or are reasonably likely to materially affect, the Registrant's internal control over financial reporting.
Item 11. Exhibits.
(a)(1) Code of ethics referred to in Item 2.
(a)(2) Certifications of principal executive and principal financial officers as required by Rule 30a-2(a) under the Investment Company Act of 1940.
(a)(3) Not applicable.
(b) Certification of principal executive and principal financial officers as required by Rule 30a-2(b) under the Investment Company Act of 1940.
-4-
SSL-DOCS2 70128344v10
SIGNATURES
Pursuant to the requirements of the Securities Exchange Act of 1934 and the Investment Company Act of 1940, the Registrant has duly caused this Report to be signed on its behalf by the undersigned, thereunto duly authorized.
DREYFUS INTERMEDIATE MUNICIPAL BOND FUND, INC.
| By: | /s/ Stephen E. Canter |
| |
|
| | Stephen E. Canter |
| | President |
| | |
| Date: | July 28, 2004 |
Pursuant to the requirements of the Securities Exchange Act of 1934 and the Investment Company Act of 1940, this Report has been signed below by the following persons on behalf of the Registrant and in the capacities and on the dates indicated.
| By: | /s/ Stephen E. Canter |
| |
|
| | Stephen E. Canter |
| | Chief Executive Officer |
| | |
| Date: | July 28, 2004 |
| | |
| By: | /s/ James Windels |
| |
|
| | James Windels |
| | Chief Financial Officer |
| | |
| Date: | July 28, 2004 |
EXHIBIT INDEX
(a)(1) Code of ethics referred to in Item 2.
(a)(2) Certifications of principal executive and principal financial officers as required by Rule 30a-2(a) under the Investment Company Act of 1940. (EX-99.CERT)
(b) Certification of principal executive and principal financial officers as required by Rule 30a-2(b) under the Investment Company Act of 1940. (EX-99.906CERT)
-5-
SSL-DOCS2 70128344v10