| UNITED STATES |
| SECURITIES AND EXCHANGE COMMISSION |
| Washington, D.C. 20549 |
| FORM N-CSR |
| CERTIFIED SHAREHOLDER REPORT OF REGISTERED MANAGEMENT |
| INVESTMENT COMPANIES |
| Investment Company Act file number 811-3721 |
| DREYFUS INTERMEDIATE MUNICIPAL BOND FUND, INC. |
| (Exact name of Registrant as specified in charter) |
| c/o The Dreyfus Corporation |
| 200 Park Avenue |
| New York, New York 10166 |
| (Address of principal executive offices) (Zip code) |
| |
| Mark N. Jacobs, Esq. |
| 200 Park Avenue |
| New York, New York 10166 |
| (Name and address of agent for service) |
| |
| Registrant's telephone number, including area code: (212) 922-6000 |
| Date of fiscal year end: | | 5/31 |
| Date of reporting period: | | 11/30/05 |
| | | | | FORM N-CSR |
| Item 1. | | Reports to Stockholders. | | |
Save time. Save paper. View your next shareholder report online as soon as it’s available. Log into www.dreyfus.com and sign up for Dreyfus eCommunications. It’s simple and only takes a few minutes.
The views expressed in this report reflect those of the portfolio manager only through the end of the period covered and do not necessarily represent the views of Dreyfus or any other person in the Dreyfus organization. Any such views are subject to change at any time based upon market or other conditions and Dreyfus disclaims any responsibility to update such views.These views may not be relied on as investment advice and, because investment decisions for a Dreyfus fund are based on numerous factors, may not be relied on as an indication of trading intent on behalf of any Dreyfus fund.
Not FDIC-Insured • Not Bank-Guaranteed • May Lose Value
| Contents |
| |
| | | THE FUND |
| |
|
| 2 | | Letter from the Chairman |
| 3 | | Discussion of Fund Performance |
| 6 | | Understanding Your Fund’s Expenses |
| 6 | | Comparing Your Fund’s Expenses |
| With Those of Other Funds |
| 7 | | Statement of Investments |
| 22 | | Statement of Assets and Liabilities |
| 23 | | Statement of Operations |
| 24 | | Statement of Changes in Net Assets |
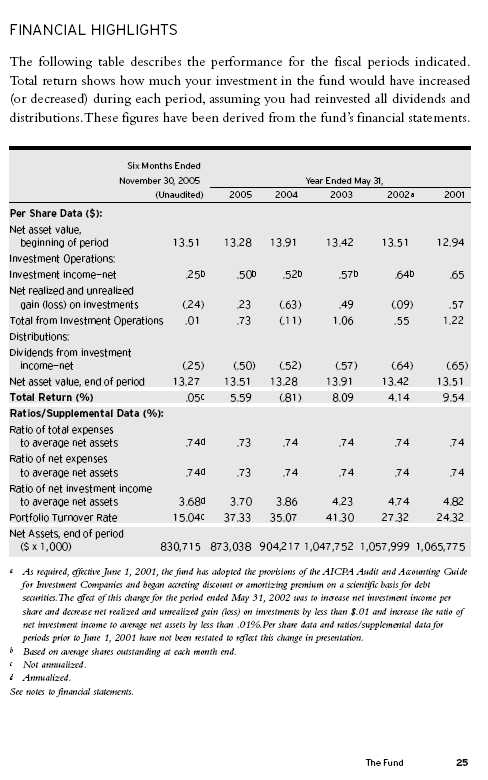
| 25 | | Financial Highlights |
| 26 | | Notes to Financial Statements |
| FOR MORE INFORMATION |
|
| | | Back Cover |
Dreyfus Intermediate Municipal
Bond Fund, Inc.
The Fund

LETTER FROM THE CHAIRMAN
Dear Shareholder:
We are pleased to present this semiannual report for Dreyfus Intermediate Municipal Bond Fund, Inc., covering the six-month period from June 1, 2005, through November 30, 2005. Inside, you’ll find valuable information about how the fund was managed during the reporting period, including a discussion with the fund’s portfolio manager, Monica S.Wieboldt.
The U.S. economy demonstrated remarkable resiliency over the past six months, expanding at a steady pace despite the headwinds of soaring energy prices, higher interest rates and the dislocations caused by the Gulf Coast hurricanes. Although yields of longer-term municipal bonds recently have begun to creep upward, low inflation expectations among U.S. investors, improving fiscal conditions and robust investor demand have helped them withstand the potentially eroding effects of rising short-term interest rates.
As the end of 2005 approaches, the U.S. economy and financial markets may be reaching an inflection point. Investors’ reactions to a change in leadership at the Federal Reserve Board and the effects of higher fuel prices on the rate of inflation may set the tone for the U.S. fixed-income markets in 2006.As always, we encourage you to discuss these and other market forces with your financial advisor.
Thank you for your continued confidence and support.

The Dreyfus Corporation December 15, 2005

DISCUSSION OF FUND PERFORMANCE
Monica S. Wieboldt, Senior Portfolio Manager
| How did Dreyfus Intermediate Municipal Bond Fund, Inc. |
| perform relative to its benchmark? |
For the six-month period ended November 30, 2005, the fund achieved a total return of 0.05% .1 The Lehman Brothers 7-Year Municipal Bond Index (the “Index”), the fund’s benchmark, achieved a total return of –0.09% for the same period.2 In addition, the average total return for all funds reported in the Lipper Intermediate Municipal Debt Funds category was –0.02% .3
Short-term interest rates rose, and yield differences between shorter-and longer-term municipal bonds narrowed over the reporting period, mildly eroding prices of intermediate-term municipal bonds.The fund produced slightly higher returns than its Lipper category average and the Index, which we attribute to our yield-curve strategy and relatively strong contributions from higher-yielding holdings.
What is the fund’s investment approach?
The fund seeks the maximum amount of current income exempt from federal income tax as is consistent with the preservation of capital. To pursue this goal, the fund normally invests substantially all of its assets in municipal bonds that provide income exempt from federal personal income tax.
The fund invests at least 80% of its assets in municipal bonds rated A or higher, or the unrated equivalent as determined by Dreyfus. The fund may invest up to 20% of its assets in municipal bonds rated below A, including bonds rated below investment grade (“high yield” or “junk” bonds) or the unrated equivalent as determined by Dreyfus. The dollar-weighted average maturity of the fund’s portfolio ranges between three and 10 years.
We may buy and sell bonds based on credit quality, market outlook and yield potential. In selecting municipal bonds for investment, we may
The Fund 3
DISCUSSION OF FUND PERFORMANCE (continued)
assess the current interest-rate environment and the municipal bond’s potential volatility in different rate environments. We focus on bonds with the potential to offer attractive current income, typically looking for bonds that can provide consistently attractive current yields or that are trading at competitive market prices. A portion of the fund’s assets may be allocated to “discount” bonds, which are bonds that sell at a price below their face value, or to “premium” bonds, which are bonds that sell at a price above their face value.The fund’s allocation to either discount bonds or to premium bonds will change along with our changing views of the current interest-rate and market environment.We also may look to select bonds that are most likely to obtain attractive prices when sold.
What other factors influenced the fund’s performance?
The fund was affected by rising short-term interest rates in an environment of stronger-than-expected economic growth. In fact, the Federal Reserve Board (the “Fed”) continued to raise short-term interest rates at each of four meetings of its Federal Open Market Committee (“FOMC”) during the reporting period, driving the overnight federal funds rate from 3% to 4% by the reporting period’s end.
Unlike most previous periods of Fed tightening, however, longer-term bond yields remained remarkably stable. Despite soaring energy prices, investors’ inflation expectations remained persistently low due to signs that many manufacturers were unable to pass along higher commodities prices to their customers.As a result, the difference between short-and longer-term yields narrowed, benefiting bonds toward the longer end of the maturity spectrum.
The fund also was influenced by an improving credit environment for most states and municipalities, which enjoyed higher levels of private-sector employment and personal income, helping to support tax revenues during the reporting period. Although the national supply of newly issued bonds remained high as issuers took advantage of relatively low borrowing costs, investor demand was strong in the growing economy.
Because rising short-term interest rates hurt prices of shorter-term municipal bonds, new purchases focused on the longer end of the
intermediate-term range. In addition, the fund benefited from relative strength among higher-yielding securities, such as bonds issued to finance health care facilities, as well as tobacco bonds and corporate-related issues, as investors searched for additional income. Some of the fund’s holdings also were “pre-refunded” during the reporting period by issuers seeking to reduce their borrowing costs, further bolstering the fund’s performance.
What is the fund’s current strategy?
Although the Fed may be approaching the end of the current credit-tightening cycle, we believe that additional rate hikes are likely at upcoming FOMC meetings, and we have maintained the fund’s focus on securities toward the longer end of the intermediate-term range. However, because yield differences between higher- and lower-rated credits recently have narrowed beyond historical norms, we have begun to shift away from lower-rated securities toward higher-quality bonds, including those backed by bond insurers or revenues from essential services facilities.4
December 15, 2005
| 1 | | Total return includes reinvestment of dividends and any capital gains paid. Past performance is no |
| | | guarantee of future results. Share price, yield and investment return fluctuate such that upon |
| | | redemption, fund shares may be worth more or less than their original cost. Income may be subject |
| | | to state and local taxes, and some income may be subject to the federal alternative minimum tax |
| | | (AMT) for certain investors. Capital gains, if any, are fully taxable. Return figure provided reflects |
| | | the absorption of certain fund expenses by The Dreyfus Corporation pursuant to an undertaking |
| | | in effect that may be modified, extended or terminated at any time. Had these expenses not been |
| | | absorbed, the fund’s return would have been lower. |
| 2 | | SOURCE: LIPPER INC. — Reflects reinvestment of dividends and, where applicable, capital |
| | | gain distributions.The Lehman Brothers 7-Year Municipal Bond Index is an unmanaged total |
| | | return performance benchmark for the investment-grade, geographically unrestricted 7-year tax- |
| | | exempt bond market, consisting of municipal bonds with maturities of 6-8 years. Index returns do |
| | | not reflect fees and expenses associated with operating a mutual fund. |
| 3 | | Source: Lipper Inc. |
| 4 | | Portfolio insurance extends to the repayment of principal and payment of interest in the event |
| | | of default. It does not extend to the market value of the portfolio securities or the value of the |
| | | fund’s shares. |
The Fund 5
UNDERSTANDING YOUR FUND’S EXPENSES (Unaudited)
As a mutual fund investor, you pay ongoing expenses, such as management fees and other expenses. Using the information below, you can estimate how these expenses affect your investment and compare them with the expenses of other funds.You also may pay one-time transaction expenses, including sales charges (loads) and redemption fees, which are not shown in this section and would have resulted in higher total expenses. For more information, see your fund’s prospectus or talk to your financial adviser.
Review your fund’s expenses
The table below shows the expenses you would have paid on a $1,000 investment in Dreyfus Intermediate Municipal Bond Fund, Inc. from June 1, 2005 to November 30, 2005. It also shows how much a $1,000 investment would be worth at the close of the period, assuming actual returns and expenses.
Expenses and Value of a $1,000 Investment assuming actual returns for the six months ended November 30, 2005
| Expenses paid per $1,000 † | | $ 3.71 |
| Ending value (after expenses) | | $1000.50 |
| COMPARING YOUR FUND’S EXPENSES |
| WITH THOSE OF OTHER FUNDS (Unaudited) |
Using the SEC’s method to compare expenses
The Securities and Exchange Commission (SEC) has established guidelines to help investors assess fund expenses. Per these guidelines, the table below shows your fund’s expenses based on a $1,000 investment, assuming a hypothetical 5% annualized return. You can use this information to compare the ongoing expenses (but not transaction expenses or total cost) of investing in the fund with those of other funds.All mutual fund shareholder reports will provide this information to help you make this comparison. Please note that you cannot use this information to estimate your actual ending account balance and expenses paid during the period.
Expenses and Value of a $1,000 Investment assuming a hypothetical 5% annualized return for the six months ended November 30, 2005
| Expenses paid per $1,000 † | | $ 3.75 |
| Ending value (after expenses) | | $1021.36 |
† Expenses are equal to the fund’s annualized expense ratio of .74%; multiplied by the average account value over the period, multiplied by 183/365 (to reflect the one-half year period).
| STATEMENT OF INVESTMENTS |
| November 30, 2005 (Unaudited) |
| | | Principal | | | | |
| Long-Term Municipal Investments—97.8% | | Amount ($) | | Value ($) |
| |
| |
|
| Alabama—1.8% | | | | | | |
| Jefferson County, Limited Obligation School Warrants: | | | | |
| 5.50%, 1/1/2021 | | 7,500,000 | | | | 8,066,475 |
| 5.25%, 1/1/2023 | | 5,500,000 | | | | 5,780,610 |
| McIntosh Industrial Development Board, EIR | | | | | | |
| 4.65%, 6/1/2008 | | 1,075,000 | | | | 1,092,813 |
| Alaska—5.2% | | | | | | |
| Alaska International Airports, Revenue: | | | | | | |
| 5.50%, 10/1/2011 (Insured; AMBAC) | | 2,560,000 | | | | 2,796,954 |
| 5.50%, 10/1/2012 (Insured; AMBAC) | | 1,620,000 | | | | 1,782,292 |
| Alaska Student Loan Corp., Student Loan Revenue: | | | | | | |
| 5.60%, 7/1/2011 (Insured; AMBAC) | | 4,700,000 | | | | 4,839,449 |
| 5.70%, 7/1/2013 (Insured; AMBAC) | | 5,990,000 | | | | 6,176,349 |
| 6%, 7/1/2016 (Insured; AMBAC) | | 6,380,000 | | | | 6,829,535 |
| Anchorage: | | | | | | |
| 5.875%, 12/1/2010 (Insured; FGIC) | | 2,365,000 | | a | | 2,616,967 |
| 5.875%, 12/1/2010 (Insured; FGIC) | | 1,500,000 | | a | | 1,659,810 |
| Electric Utility Revenue: | | | | | | |
| 6.50%, 12/1/2008 (Insured; MBIA) | | 2,755,000 | | | | 2,992,591 |
| 6.50%, 12/1/2009 (Insured; MBIA) | | 2,910,000 | | | | 3,228,616 |
| 5.875%, 2/1/2010 (Insured; FSA) | | 3,175,000 | | a | | 3,466,687 |
| Northern Tobacco Securitization Corp., | | | | | | |
| Tobacco Settlement Revenue: | | | | | | |
| 6%, 6/1/2013 | | 4,745,000 | | | | 4,960,423 |
| 6.20%, 6/1/2022 | | 2,060,000 | | | | 2,138,836 |
| Arizona—.3% | | | | | | |
| Glendale Municipal Property Corp., Excise Tax Revenue | | | | |
| 5%, 7/1/2017 (Insured; AMBAC) | | 2,160,000 | | | | 2,294,244 |
| Arkansas—.2% | | | | | | |
| Springdale, Sales and Use Tax Revenue | | | | | | |
| 4%, 7/1/2016 (Insured; MBIA) | | 1,725,000 | | | | 1,714,650 |
| California—8.8% | | | | | | |
| ABAG Finance Authority for Nonprofit Corp., | | | | | | |
| Revenue (San Diego Hospital Association) | | | | | | |
| 5.125%, 3/1/2018 | | 1,000,000 | | | | 1,037,870 |
| Alameda County Unified School District | | | | | | |
| Zero Coupon, 8/1/2018 (Insured; FSA) | | 3,785,000 | | | | 2,135,232 |
| California, GO | | | | | | |
| Various Purpose: | | | | | | |
| 5%, 3/1/2014 (Insured; FGIC) | | 10,000,000 | | | | 10,792,700 |
| 5%, 6/1/2016 | | 5,000,000 | | | | 5,341,050 |
| 5%, 8/1/2022 | | 5,000,000 | | | | 5,231,900 |
The Fund 7
STATEMENT OF INVESTMENTS (Unaudited) (continued)
| | | Principal | | |
| Long-Term Municipal Investments (continued) | | Amount ($) | | Value ($) |
| |
| |
|
| California (continued) | | | | |
| California Health Facilities Financing Authority, | | | | |
| Revenue (Cedars Sinai Medical Center) | | | | |
| 5%, 11/15/2019 | | 1,500,000 | | 1,561,470 |
| California Infrastructure and Economic Development, | | | | |
| Bank Revenue (Bay Area Toll Bridges—1st Lien) | | | | |
| 5.25%, 7/1/2017 (Insured; FSA) | | 3,300,000 | | 3,574,230 |
| California Pollution Control Financing Authority, | | | | |
| PCR (San Diego Gas and Electric Co.) | | | | |
| 5.90%, 6/1/2014 (Insured; MBIA) | | 2,100,000 | | 2,394,462 |
| California Public Works Board, LR | | | | |
| (Department of Mental Health—Coalinga) | | | | |
| 5.50%, 6/1/2018 | | 3,000,000 | | 3,246,360 |
| California Statewide Community Development Authority: | | | | |
| MFHR (Equity Residential) 5.20%, 6/15/2009 | | 3,000,000 | | 3,124,170 |
| Revenue (Huntington Memorial Hospital) 5%, 7/1/2017 | | 2,895,000 | | 3,037,637 |
| Elsinore Valley Municipal Water District, COP | | | | |
| 5.375%, 7/1/2016 (Insured; FGIC) | | 3,295,000 | | 3,648,257 |
| Foothill/Eastern Transportation Corridor Agency, | | | | |
| Toll Road Revenue | | | | |
| 0/7%, 1/1/2008 | | 5,000,000 b | | 5,382,900 |
| Golden State Tobacco Securitization Corp., | | | | |
| Tobacco Settlement Revenue: | | | | |
| 5.75%, 6/1/2008 | | 6,950,000 a | | 7,346,914 |
| 5.75%, 6/1/2008 | | 1,735,000 a | | 1,834,086 |
| 5%, 6/1/2019 | | 2,000,000 | | 2,083,680 |
| Los Angeles County Public Works Financing Authority, | | | | |
| Revenue (Regional Park and Open Space District): | | | | |
| 5%, 10/1/2007 | | 3,635,000 a | | 3,787,234 |
| 5%, 10/1/2019 | | 1,915,000 | | 1,987,808 |
| Palomar Pomerado Health, GO | | | | |
| 5%, 8/1/2020 (Insured; AMBAC) | | 2,130,000 | | 2,256,330 |
| San Francisco Bay Area Rapid Transit District, Sales | | | | |
| Tax Revenue 5%, 7/1/2018 (Insured; MBIA) | | 3,000,000 | | 3,213,360 |
| Colorado—1.3% | | | | |
| Denver City and County, Airport Revenue | | | | |
| 5%, 11/15/2008 (Insured; XLCA) | | 5,000,000 | | 5,180,500 |
| El Paso County School District | | | | |
| (Number 11 Colorado Springs): | | | | |
| 6.25%, 12/1/2009 | | 1,000,000 | | 1,103,770 |
| 6.50%, 12/1/2010 | | 2,000,000 | | 2,270,320 |
| 6.50%, 12/1/2011 | | 2,040,000 | | 2,353,385 |
8
| | | Principal | | |
| Long-Term Municipal Investments (continued) | | Amount ($) | | Value ($) |
| |
| |
|
| Connecticut—.1% | | | | |
| Mashantucket Western Pequot Tribe, | | | | |
| Special Revenue 5.60%, 9/1/2009 | | 1,000,000 c | | 1,051,580 |
| District of Columbia—.4% | | | | |
| District of Columbia 6%, 6/1/2012 (Insured; MBIA) | | 3,280,000 | | 3,700,365 |
| Florida—3.1% | | | | |
| Broward County, Airport System Revenue | | | | |
| (Convertible Lien) 5.25% | | | | |
| 10/1/2011 (Insured; AMBAC) | | 1,525,000 | | 1,593,976 |
| Capital Projects Finance Authority, Student Housing | | | | |
| Revenue (Capital Projects Loan Program) | | | | |
| 5.50%, 10/1/2015 (Insured; MBIA) | | 4,060,000 | | 4,347,245 |
| Collier County, Gas Tax Revenue | | | | |
| 5.25%, 6/1/2019 (Insured; AMBAC) | | 2,190,000 | | 2,360,053 |
| Hillsborough County Industrial Development Authority, | | | | |
| PCR (Tampa Electric Co. Project) | | | | |
| 5.10%, 10/1/2013 | | 5,000,000 | | 5,187,050 |
| Miami-Dade County School Board, COP | | | | |
| 5.25%, 10/1/2017 (Insured; FGIC) | | 5,000,000 | | 5,412,700 |
| Palm Beach County School Board, COP | | | | |
| 5.375%, 8/1/2014 (Insured; AMBAC) | | 4,000,000 | | 4,427,760 |
| Polk County, Utility System Revenue | | | | |
| 5.25%, 10/1/2018 (Insured; FGIC) | | 2,000,000 | | 2,162,440 |
| Georgia—2.1% | | | | |
| Athens Housing Authority, Student Housing LR | | | | |
| (Ugaref East Campus Housing): | | | | |
| 5.25%, 12/1/2015 (Insured; AMBAC) | | 2,560,000 | | 2,745,190 |
| 5.25%, 12/1/2016 (Insured; AMBAC) | | 2,700,000 | | 2,888,190 |
| Milledgeville-Baldwin County Development | | | | |
| Authority, Revenue (Georgia College | | | | |
| and State University Foundation): | | | | |
| 6%, 9/1/2010 | | 1,275,000 | | 1,376,617 |
| 5.25%, 9/1/2019 | | 1,710,000 | | 1,779,751 |
| Municipal Electric Authority of Georgia | | | | |
| (Combustion Turbine Project): | | | | |
| 5.25%, 11/1/2012 (Insured; MBIA) | | 2,735,000 | | 2,983,776 |
| 5.25%, 11/1/2016 (Insured; MBIA) | | 5,000,000 | | 5,409,850 |
| Hawaii—.3% | | | | |
| Kuakini Health System, Special Purpose Revenue | | | | |
| 5.50%, 7/1/2012 | | 2,575,000 | | 2,690,411 |
The Fund 9
STATEMENT OF INVESTMENTS (Unaudited) (continued)
| | | Principal | | |
| Long-Term Municipal Investments (continued) | | Amount ($) | | Value ($) |
| |
| |
|
| Illinois—3.4% | | | | |
| Chicago Housing Authority, Revenue (Capital Program): | | | | |
| 5%, 7/1/2009 | | 2,500,000 | | 2,600,875 |
| 5.25%, 7/1/2010 | | 2,420,000 | | 2,559,537 |
| Chicago O’Hare International Airport, Revenue: | | | | |
| (Second Lien) 5.25%, 1/1/2010 (Insured; AMBAC) | | 3,095,000 | | 3,256,683 |
| (Third Lien) 5.50%, 1/1/2015 (Insured; CIFG) | | 6,450,000 | | 7,082,229 |
| Chicago Park District, GO Limited Tax Park | | | | |
| 5.50%, 1/1/2020 (Insured; FGIC) | | 5,305,000 | | 5,731,310 |
| Illinois Health Facilities Authority, Revenue | | | | |
| (Passavant Memorial Area Hospital Association) | | | | |
| 5.65%, 10/1/2016 | | 4,850,000 | | 5,168,839 |
| Metropolitan Pier and Exposition Authority, | | | | |
| Dedicated State Tax Revenue (McCormick | | | | |
| Place) 0/5.55%, 6/15/2021 (Insured; MBIA) | | 2,500,000 b | | 1,932,750 |
| Indiana—1.9% | | | | |
| Indiana Health Facility Financing Authority, | | | | |
| HR (Clarian Health Partners, Inc.): | | | | |
| 5.50%, 2/15/2007 | | 3,000,000 a | | 3,134,520 |
| 5.50%, 2/15/2007 | | 5,000,000 a | | 5,224,200 |
| Indianapolis Local Public Improvement Bond Bank | | | | |
| 6.50%, 1/1/2011 (Insured; FSA) | | 6,415,000 | | 7,254,852 |
| Kansas—1.7% | | | | |
| Wyandotte County/Kansas City Unified Government: | | | | |
| Tax-Exempt Sales Tax Special Obligation | | | | |
| Revenue (Redevelopment Project Area B) | | | | |
| 4.75%, 12/1/2016 | | 3,800,000 | | 3,883,524 |
| Utility System Revenue | | | | |
| 5.65%, 9/1/2018 (Insured; AMBAC) | | 9,130,000 | | 10,410,117 |
| Kentucky—.5% | | | | |
| Ashland, PCR (Ashland, Inc.) 5.70%, 11/1/2009 | | 4,000,000 | | 4,308,160 |
| Maine—.5% | | | | |
| Maine Finance Authority, SWDR | | | | |
| (Waste Management, Inc. Project) 4.65%, 2/1/2016 | | 3,980,000 | | 3,898,609 |
| Massachusetts—5.2% | | | | |
| Boston Water and Sewer Commission, Revenue | | | | |
| 5%, 11/1/2020 | | 5,760,000 | | 6,110,669 |
| Massachusetts, Consolidated Loan | | | | |
| 5%, 12/1/2010 | | 3,000,000 | | 3,193,530 |
| Massachusetts Bay Transportation Authority, | | | | |
| Sales Tax Revenue 5.50%, 7/1/2017 | | 5,000,000 | | 5,642,750 |
10
| | | Principal | | |
| Long-Term Municipal Investments (continued) | | Amount ($) | | Value ($) |
| |
| |
|
| Massachusetts (continued) | | | | |
| Massachusetts Municipal Wholesale Electric Co., | | | | |
| Power Supply System Revenue | | | | |
| (Project Number 6) 5.25%, 7/1/2015 (Insured; MBIA) | | 4,000,000 | | 4,296,120 |
| Massachusetts Water Resource Authority: | | | | |
| 5.25%, 8/1/2019 (Insured; MBIA) | | 8,420,000 | | 9,289,870 |
| 5%, 8/1/2022 (Insured; MBIA) | | 9,875,000 | | 10,498,804 |
| University of Massachusetts Building | | | | |
| Authority, Project Revenue 5.25%, | | | | |
| 11/1/2013 (Insured; AMBAC) | | 3,500,000 a | | 3,847,165 |
| Michigan—4.2% | | | | |
| Detroit Local Development Finance Authority | | | | |
| 5.20%, 5/1/2010 | | 5,745,000 | | 5,906,664 |
| Greater Detroit Resource Recovery Authority, Revenue | | | | |
| 6.25%, 12/13/2008 (Insured; AMBAC) | | 7,755,000 | | 8,350,662 |
| Michigan Building Authority, Revenue | | | | |
| (State Police Communications System) | | | | |
| 5.25%, 10/1/2013 | | 1,945,000 | | 2,135,182 |
| Michigan Hospital Finance Authority, Revenue: | | | | |
| 7.495%, 11/15/2007 | | 5,750,000 c,d | | 6,134,215 |
| (Oakwood Obligation Group) | | | | |
| 5.50%, 11/1/2011 | | 3,500,000 | | 3,786,230 |
| (Sparrow Obligation Group): | | | | |
| 5.25%, 11/15/2011 | | 2,500,000 | | 2,677,850 |
| 5.75%, 11/15/2016 | | 3,250,000 | | 3,517,865 |
| Michigan Municipal Bond Authority, Revenue | | | | |
| (Drinking Water Revolving Fund) | | | | |
| 5.25%, 10/1/2009 | | 2,370,000 a | | 2,523,268 |
| Minnesota—1.1% | | | | |
| Lakeville Independent School District Number 194, GO | | | | |
| 5%, 2/1/2018 (Insured; FSA) | | 5,000,000 | | 5,295,950 |
| Saint Paul Housing and Redevelopment Authority, | | | | |
| Hospital Facility Revenue (HealthEast Project): | | | | |
| 5%, 11/15/2017 | | 3,000,000 | | 2,970,420 |
| 5.75%, 11/15/2021 | | 1,000,000 | | 1,061,870 |
| Mississippi—.5% | | | | |
| Mississippi Higher Education Assistance Corp., | | | | |
| Student Loan Revenue 5.30%, 9/1/2008 | | 2,390,000 | | 2,440,477 |
| Walnut Grove Correctional Authority, COP | | | | |
| 5.50%, 11/1/2007 (Insured; AMBAC) | | 1,855,000 | | 1,927,512 |
The Fund 11
STATEMENT OF INVESTMENTS (Unaudited) (continued)
| | | Principal | | | | |
| Long-Term Municipal Investments (continued) | | Amount ($) | | Value ($) |
| |
| |
|
| Missouri—2.3% | | | | | | |
| Joplin Industrial Development Authority, Revenue | | | | | | |
| (Catholic Health Initiatives): | | | | | | |
| 5.50%, 12/1/2009 | | 3,185,000 | | | | 3,323,834 |
| 5.625%, 12/1/2010 | | 3,340,000 | | | | 3,491,937 |
| Missouri Development Finance Board, | | | | | | |
| Infrastructure Facilities Revenue (Branson | | | | | | |
| Landing Project) 6%, 6/1/2020 | | 3,160,000 | | | | 3,601,010 |
| Missouri Health and Educational | | | | | | |
| Facilities Authority, Revenue | | | | | | |
| (SSM Health Care) 5%, 6/1/2007 | | 2,940,000 | | | | 3,002,622 |
| Saint Louis, Airport Revenue | | | | | | |
| (Airport Development Program): | | | | | | |
| 5.50%, 7/1/2010 (Insured; MBIA) | | 1,565,000 | | | | 1,692,031 |
| 5.50%, 7/1/2010 (Insured; MBIA) | | 1,435,000 | | | | 1,556,530 |
| 5.625%, 7/1/2011 (Insured; MBIA) | | 2,500,000 | | a | | 2,750,700 |
| Nevada—1.3% | | | | | | |
| Director of the State of Nevada Department of Business | | | | | | |
| and Industry, SWDR (Republic Services, Inc. Project) | | | | | | |
| 5.625%, 6/1/2018 | | 5,000,000 | | | | 5,416,350 |
| Washoe County, Water Facility Revenue | | | | | | |
| (Sierra Pacific Power Co.) | | | | | | |
| 5%, 7/1/2009 | | 5,000,000 | | | | 5,058,950 |
| New Jersey—4.7% | | | | | | |
| Casino Reinvestment Development Authority, | | | | | | |
| Revenue 5.25%, 6/1/2019 (Insured; MBIA) | | 5,000,000 | | | | 5,373,400 |
| New Jersey Economic Development Authority: | | | | | | |
| Cigarette Tax Revenue: | | | | | | |
| 5.375%, 6/15/2015 | | 3,300,000 | | | | 3,525,885 |
| 5.50%, 6/15/2016 | | 1,000,000 | | | | 1,075,790 |
| School Facilities Revenue (Construction 2001) | | | | | | |
| 5.25%, 6/15/2010 (Insured; AMBAC) | | 10,030,000 | | | | 10,742,230 |
| New Jersey Educational Facilities Authority, Revenue: | | | | | | |
| (Rider University): | | | | | | |
| 5%, 7/1/2010 (Insured; Radian) | | 1,880,000 | | | | 1,964,807 |
| 5%, 7/1/2011 (Insured; Radian) | | 1,970,000 | | | | 2,068,185 |
| (Rowan University) 5.25%, 7/1/2016 (Insured; MBIA) | | 2,000,000 | | | | 2,175,540 |
| New Jersey Health Care Facilities | | | | | | |
| Financing Authority, Revenue | | | | | | |
| (South Jersey Hospital) 6%, 7/1/2012 | | 3,425,000 | | | | 3,782,570 |
| New Jersey Turnpike Authority, Revenue | | | | | | |
| 5.625%, 1/1/2010 (Insured MBIA) | | 3,910,000 | | a | | 4,230,620 |
12
| | | Principal | | |
| Long-Term Municipal Investments (continued) | | Amount ($) | | Value ($) |
| |
| |
|
| New Jersey (continued) | | | | |
| Union County Utilities Authority, Solid Waste Revenue | | | | |
| (Ogden Martin) 5.50%, 6/1/2008 (Insured; AMBAC) | | 4,000,000 | | 4,175,960 |
| New Mexico—1.4% | | | | |
| Jicarilla, Apache Nation Revenue: | | | | |
| 5%, 9/1/2011 | | 1,500,000 | | 1,573,800 |
| 5%, 9/1/2013 | | 2,905,000 | | 3,040,605 |
| Las Cruces, Joint Utility Improvement Revenue | | | | |
| 5.50%, 7/1/2016 (Insured; MBIA) | | 7,000,000 | | 7,357,630 |
| New York—7.0% | | | | |
| New York City: | | | | |
| 6.25%, 8/1/2006 | | 530,000 a | | 548,619 |
| 6.25%, 8/1/2009 | | 1,470,000 | | 1,518,657 |
| 5%, 6/1/2016 (Insured; FSA) | | 3,395,000 | | 3,645,924 |
| 5%, 4/1/2020 | | 2,500,000 | | 2,604,925 |
| 5%, 4/1/2022 | | 5,110,000 | | 5,296,771 |
| New York City Industrial Development Agency, | | | | |
| Special Facility Revenue (American Airlines, Inc. | | | | |
| John F. Kennedy International Airport Project): | | | | |
| 7.125%, 8/1/2011 | | 1,000,000 | | 986,180 |
| 7.50%, 8/1/2016 | | 1,500,000 | | 1,460,505 |
| New York State Dormitory Authority, Revenues | | | | |
| (Lenox Hill Hospital Obligation Group) | | | | |
| 5.50%, 7/1/2011 | | 1,000,000 | | 1,033,400 |
| New York State Local Government | | | | |
| Assistance Corporation: | | | | |
| 5.25%, 4/1/2016 | | 3,425,000 | | 3,725,646 |
| 5.25%, 4/1/2016 (Insured; FSA) | | 2,200,000 | | 2,408,384 |
| New York State Thruway Authority: | | | | |
| Highway and Bridge Trust Fund | | | | |
| 6.666%, 4/1/2018 (Insured; AMBAC) | | 2,500,000 c,d | | 2,854,725 |
| Service Contract Revenue (Local Highway and Bridge): | | |
| 5.50%, 4/1/2012 | | 3,950,000 | | 4,343,420 |
| 5.50%, 4/1/2013 (Insured; XLCA) | | 5,000,000 | | 5,450,850 |
| New York State Urban Development Corp.: | | | | |
| Corporate Purpose 5.125%, 7/1/2019 | | 2,000,000 | | 2,113,660 |
| Correctional and Youth Facilities Service Contract | | | | |
| Revenue (Empire State Development Corp.) | | | | |
| 5.25%, 1/1/2009 | | 8,575,000 | | 8,970,993 |
| Personal Income Tax 5.25%, 3/15/2011 | | 1,565,000 | | 1,683,095 |
| Tobacco Settlement Financing Corp. of New York, | | | | |
| Revenue 5.50%, 6/1/2018 | | 4,000,000 | | 4,325,120 |
The Fund 13
STATEMENT OF INVESTMENTS (Unaudited) (continued)
| | | Principal | | |
| Long-Term Municipal Investments (continued) | | Amount ($) | | Value ($) |
| |
| |
|
| New York (continued) | | | | |
| Triborough Bridge and Tunnel Authority, Revenue | | | | |
| 6.75%, 1/1/2009 | | 5,100,000 | | 5,406,612 |
| North Carolina—3.4% | | | | |
| North Carolina Eastern Municipal Power Agency, | | | | |
| Power System Revenue: | | | | |
| 5.125%, 1/1/2014 | | 3,000,000 | | 3,167,520 |
| 5%, 1/1/2021 | | 1,200,000 | | 1,295,400 |
| North Carolina Medical Care Commission, Revenue: | | | | |
| (FHA Insured Mortgage—Morehead Memorial Hospital) | | | | |
| 5%, 11/1/2020 (Insured FSA) | | 5,000,000 | | 5,256,700 |
| Retirement Facilities | | | | |
| (The United Methodist Retirement Homes Project): | | | | |
| 4.75%, 10/1/2013 | | 1,000,000 | | 1,007,230 |
| 5.125%, 10/1/2019 | | 1,250,000 | | 1,273,612 |
| North Carolina Municipal Power Agency, | | | | |
| Electric Revenue (Number 1 Catawba): | | | | |
| 5.25%, 1/1/2016 (Insured; FSA) | | 2,540,000 | | 2,722,804 |
| 5.25%, 1/1/2017 (Insured; FSA) | | 10,000,000 | | 10,707,000 |
| Raleigh Durham Airport Authority, Airport Revenue | | | | |
| 5.25%, 11/1/2012 (Insured; FGIC) | | 2,365,000 | | 2,557,393 |
| Ohio—2.0% | | | | |
| Cuyahoga County, Revenue | | | | |
| (Cleveland Clinic Health System): | | | | |
| 5.50%, 1/1/2014 | | 4,000,000 | | 4,318,480 |
| 6%, 1/1/2017 | | 5,000,000 | | 5,517,800 |
| Knox County, Hospital Facilities Revenue | | | | |
| (Knox Community Hospital) | | | | |
| 5%, 6/1/2012 (Insured; Radian) | | 1,500,000 | | 1,582,335 |
| Ohio, GO (Common Schools Capital Facilities) | | | | |
| 5.75%, 6/15/2009 | | 5,000,000 a | | 5,383,500 |
| Oklahoma—.3% | | | | |
| Oklahoma Development Finance Authority, LR | | | | |
| (Oklahoma State System Higher Education): | | | | |
| 4%, 6/1/2007 | | 1,020,000 | | 1,028,548 |
| 4%, 6/1/2008 | | 1,060,000 | | 1,072,264 |
| Oregon—1.2% | | | | |
| Gilliam County, SWDR | | | | |
| 4.15%, 5/1/2009 | | 3,400,000 | | 3,405,610 |
| | | Principal | | |
| Long-Term Municipal Investments (continued) | | Amount ($) | | Value ($) |
| |
| |
|
| Oregon (continued) | | | | |
| Washington County Unified Sewer Agency, | | | | |
| Sewer Revenue 5.75%, 10/1/2012 (Insured; FGIC) | | 5,670,000 | | 6,366,106 |
| Pennsylvania—8.2% | | | | |
| Allegheny County, Airport Revenue (Pittsburgh | | | | |
| International Airport) 5.75%, 1/1/2011 | | 5,000,000 | | 5,354,950 |
| Allegheny County Industrial Development Authority, | | | | |
| PCR 4.05%, 9/1/2011 (Insured; AMBAC) | | 4,000,000 | | 4,084,240 |
| Carbon County Industrial Development Authority, RRR | | | | |
| (Panther Creek Partners Project) 6.65%, 5/1/2010 | | 8,925,000 | | 9,562,602 |
| Delaware County Industrial Development Authority | | | | |
| (Resource Recovery Facility) 6.10%, 7/1/2013 | | 8,000,000 | | 8,428,480 |
| Delaware River Joint Toll Bridge Commission, | | | | |
| Bridge Revenue 5.25%, 7/1/2013 | | 2,500,000 | | 2,712,875 |
| Delaware Valley Regional Finance Authority, | | | | |
| Local Government Revenue 5.75%, 7/1/2017 | | 6,830,000 | | 7,676,169 |
| Erie County Hospital Authority, Revenue | | | | |
| (Hamot Health Foundation) | | | | |
| 5.375%, 5/15/2010 (Insured; AMBAC) | | 2,340,000 | | 2,434,606 |
| Erie County Industrial Development Authority, | | | | |
| EIR (International Paper Co. Project) | | | | |
| 5.25%, 9/1/2010 | | 2,100,000 | | 2,190,300 |
| Montgomery County Higher Education and Health | | | | |
| Authority, HR (Abington Memorial) | | | | |
| 6.10%, 6/1/2012 (Insured; AMBAC) | | 5,000,000 | | 5,636,550 |
| Montgomery County Industrial Development | | | | |
| Authority, Mortgage Revenue (Whitemarsh | | | | |
| Continuing Care) 6%, 2/1/2021 | | 5,000,000 | | 5,210,600 |
| Pennsylvania Higher Educational Facilities Authority | | | | |
| (UPMC Health System) 6.25%, 1/15/2015 | | 3,660,000 | | 4,049,058 |
| Rose Tree Media School District | | | | |
| 5.25%, 2/1/2018 (Insured; FSA) | | 5,900,000 | | 6,401,736 |
| Sayre Health Care Facilities Authority, Revenue | | | | |
| (Guthrie Health) 6%, 12/1/2012 | | 2,000,000 | | 2,210,120 |
| State Public School Building Authority, School | | | | |
| LR (Colonial Intermediate | | | | |
| Unit) 5.25%, 5/15/2019 (Insured; FGIC) | | 2,175,000 | | 2,361,441 |
The Fund 15
STATEMENT OF INVESTMENTS (Unaudited) (continued)
| | | Principal | | |
| Long-Term Municipal Investments (continued) | | Amount ($) | | Value ($) |
| |
| |
|
| Rhode Island—1.2% | | | | |
| Rhode Island Health and Educational Building Corp.: | | | | |
| Health Facilities Revenue (San Antoine) | | | | |
| 5.50%, 11/15/2009 | | 2,725,000 | | 2,850,977 |
| Hospital Financing Revenue | | | | |
| (Lifespan Obligation Group) | | | | |
| 5.75%, 5/15/2008 (Insured; MBIA) | | 5,560,000 | | 5,843,616 |
| Revenue (Roger Williams University) | | | | |
| 5%, 11/15/2021 (Insured; Radian) | | 1,360,000 | | 1,394,054 |
| South Carolina—2.8% | | | | |
| Anderson County, IDR (Federal Paper Board) | | | | |
| 4.75%, 8/1/2010 | | 4,520,000 | | 4,574,330 |
| Berkeley County School District, Installment | | | | |
| Purchase Revenue (Securing Assets for Education) | | | | |
| 5.25%, 12/1/2021 | | 9,395,000 | | 9,780,853 |
| Charleston, COP (Public Facilities Corp.) | | | | |
| 5%, 9/1/2015 | | 2,145,000 | | 2,290,238 |
| Dorchester County School District Number 002, | | | | |
| Installment Purpose Revenue (Growth Remedy | | | | |
| Opportunity Tax Hike) 5.25%, 12/1/2021 | | 5,000,000 | | 5,244,900 |
| Hilton Head Island Public Facilities Corp., COP | | | | |
| 5%, 3/1/2013 (Insured; AMBAC) | | 1,065,000 | | 1,139,848 |
| Tennessee—2.2% | | | | |
| Chattanooga Health Educational and Housing Facility | | | | |
| Board, Revenue (CDFI Phase I LLC Project) | | | | |
| 5%, 10/1/2015 | | 1,490,000 | | 1,523,018 |
| Johnson City Health and Educational Facility Board, HR | | | | |
| (Medical Center Hospital Improvement) | | | | |
| 5.125%, 7/1/2011 (Insured; MBIA) | | 6,720,000 | | 7,047,264 |
| The Health, Educational and Housing Facility | | | | |
| Board of Shelby County, Revenue (Baptist | | | | |
| Memorial Health Care) 5%, 10/1/2008 | | 5,000,000 | | 5,163,700 |
| Tennessee Housing Development Agency, | | | | |
| (Homeownership Program): | | | | |
| 5.20%, 7/1/2010 | | 1,815,000 | | 1,893,426 |
| 5.30%, 7/1/2011 | | 2,140,000 | | 2,231,678 |
| Texas—7.2% | | | | |
| Bexar County, Revenue (Venue) | | | | |
| 5.75%, 8/15/2013 (Insured; MBIA) | | 5,000,000 | | 5,446,100 |
| Cypress—Fairbanks Independent School District, | | | | |
| Schoolhouse (Permanent School Fund Guaranteed) | | | | |
| 6.75%, 2/15/2010 | | 1,700,000 a | | 1,911,854 |
16
| | | Principal | | |
| Long-Term Municipal Investments (continued) | | Amount ($) | | Value ($) |
| |
| |
|
| Texas (continued) | | | | |
| Dallas—Fort Worth International Airport, Revenue | | | | |
| Facility Improvement Corp. | | | | |
| (Bombardier Inc.) 6.15%, 1/1/2016 | | 4,000,000 | | 4,071,440 |
| Gulf Coast Waste Disposal Authority, | | | | |
| Revenue (Bayport Area System) | | | | |
| 5%, 10/1/2014 (Insured; AMBAC) | | 2,065,000 | | 2,216,530 |
| Harris County Health Facilities Development Corp., HR | | | | |
| (Memorial Hermann Hospital System) | | | | |
| 5.50%, 6/1/2012 (Insured; FSA) | | 8,295,000 | | 9,047,356 |
| Houston, Combined Utility System, First Lien Revenue: | | | | |
| 5.25%, 5/15/2012 (Insured; MBIA) | | 2,750,000 | | 2,981,825 |
| 5.25%, 11/15/2017 (Insured; FSA) | | 5,000,000 | | 5,506,800 |
| Lewisville, | | | | |
| Combination Tax and Revenue Certificates of | | | | |
| Obligation 5.25%, 2/15/2020 (Insured; MBIA) | | 1,230,000 | | 1,321,906 |
| Lower Colorado River Authority, | | | | |
| Transmission Contract Revenue | | | | |
| (LCRA Transmission Services Corp. Project) | | | | |
| 5%, 5/15/2010 (Insured; FGIC) | | 4,200,000 | | 4,352,964 |
| Port Corpus Christi Industrial Development Corp., | | | | |
| Revenue (Valero): | | | | |
| 5.125%, 4/1/2009 | | 2,250,000 | | 2,365,515 |
| 5.40%, 4/1/2018 | | 1,500,000 | | 1,567,515 |
| San Antonio, Electric and Gas Revenue | | | | |
| 5%, 2/1/2018 | | 5,000,000 | | 5,216,800 |
| Tarrant County Health Facilities Development Corp., | | | | |
| Health Systems Revenue: | | | | |
| (Harris Methodist Health Systems) 6%, 9/1/2010 | | 7,725,000 | | 8,405,650 |
| (Health Resources Systems) | | | | |
| 5.75%, 2/15/2014 (Insured; MBIA) | | 5,000,000 | | 5,575,300 |
| Texas Municipal Power Agency, Revenue | | | | |
| Zero Coupon, 9/1/2009 (Insured; AMBAC) | | 170,000 | | 148,165 |
| Utah—2.9% | | | | |
| Carbon County, SWDR | | | | |
| (Sunnyside Cogeneration-A) 6.375%, 8/15/2011 | | 8,450,000 | | 8,415,101 |
| Jordanelle Special Service District | | | | |
| (Special Assessment Improvement District) | | | | |
| 8%, 10/1/2011 | | 4,475,000 | | 4,693,246 |
| Orem, Sales Tax Revenue 5%, 4/15/2015 | | | | |
| (Insured; AMBAC) | | 3,325,000 | | 3,511,865 |
The Fund 17
STATEMENT OF INVESTMENTS (Unaudited) (continued)
| | | Principal | | |
| Long-Term Municipal Investments (continued) | | Amount ($) | | Value ($) |
| |
| |
|
| Utah (continued) | | | | |
| Utah Building Ownership Authority, LR | | | | |
| (State Facilities Master Lease Program) | | | | |
| 5%, 5/15/2017 | | 2,950,000 | | 3,121,896 |
| Utah County, EIR (USX Corporation Project) | | | | |
| 5.05%, 11/1/2011 | | 4,480,000 | | 4,707,226 |
| Virginia—2.8% | | | | |
| Arlington County Industrial Development Authority, RRR | | | | |
| (Ogden Martin System of Alexandria/Arlington | | | | |
| Inc. Project) 5.375%, 1/1/2012 (Insured; FSA) | | 2,530,000 | | 2,640,890 |
| Greater Richmond Convention Center Authority, | | | | |
| Hotel Tax Revenue (Convention Center | | | | |
| Expansion Project) 6%, 6/15/2010 | | 2,000,000 a | | 2,218,480 |
| Peninsula Ports Authority, Revenue | | | | |
| (Port Facility—CSX Transportation Project) | | | | |
| 6%, 12/15/2012 | | 4,150,000 | | 4,615,879 |
| Tobacco Settlement Financing Corp. of Virginia: | | | | |
| 4%, 6/1/2013 | | 6,590,000 | | 6,558,302 |
| 5.25%, 6/1/2019 | | 3,000,000 | | 3,032,430 |
| Virginia College Building Authority, Educational | | | | |
| Facilities Revenue (Hampden—Sydney College | | | | |
| Project) 5%, 9/1/2016 | | 1,000,000 | | 1,028,400 |
| York County Industrial Development Authority, | | | | |
| PCR (Virginia Electric and Power Co.) | | | | |
| 5.50%, 7/1/2009 | | 2,750,000 | | 2,827,192 |
| Washington—1.9% | | | | |
| Energy Northwest, Revenue (Wind Project) | | | | |
| 5.60%, 1/1/2007 | | 2,530,000 a | | 2,664,900 |
| Goat Hill Properties, LR (Government | | | | |
| Office Building Project) 5.25%, 12/1/2020 | | | | |
| (Insured; MBIA) | | 2,710,000 | | 2,909,917 |
| Seattle Municipal Light and Power, Revenue: | | | | |
| 5.25%, 3/1/2010 (Insured; FSA) | | 50,000 | | 53,300 |
| 7.336%, 3/1/2010 (Insured; FSA) | | 6,500,000 c,d | | 7,358,130 |
| Washington: | | | | |
| 5.75%, 10/1/2012 | | 20,000 | | 21,958 |
| 5.75%, 10/1/2012 | | 2,305,000 | | 2,534,347 |
| West Virginia—.4% | | | | |
| West Virginia Economic Development Authority, LR | | | | |
| (Department of Environmental Protection) | | | | |
| 5.50%, 11/1/2022 | | 2,895,000 | | 3,165,046 |
18
| | | Principal | | | | |
| Long-Term Municipal Investments (continued) | | Amount ($) | | Value ($) |
| |
| |
|
| Wisconsin—.6% | | | | | | |
| Racine, SWDR (Republic Services Project) | | | | | | |
| 3.25%, 4/1/2009 | | 1,000,000 | | | | 973,100 |
| Wisconsin Health and Educational Facilities Authority, | | | | | | |
| Revenue (Aurora Medical Group, Inc.) | | | | | | |
| 6%, 11/15/2011 (Insured; FSA) | | 3,500,000 | | | | 3,908,625 |
| U.S. Related—1.4% | | | | | | |
| The Childrens Trust Fund of Puerto Rico, | | | | | | |
| Tobacco Settlement Revenue: | | | | | | |
| 5.75%, 7/1/2010 | | 2,500,000 | | | | 2,734,675 |
| 5.75%, 7/1/2010 | | 5,000,000 | | a | | 5,469,350 |
| 5.75%, 7/1/2010 | | 3,300,000 | | a | | 3,609,771 |
| Total Long-Term Municipal Investments | | | | | | |
| (cost $799,321,602) | | | | | | 812,755,307 |
| |
| |
| |
|
| | | Principal | | | | |
| Short-Term Municipal Investments—1.3% | | Amount ($) | | Value ($) |
| |
| |
|
| Florida—.1% | | | | | | |
| Putnam County Development Authority, PCR | | | | | | |
| (Florida Power and Light Co. Project) 3% | | 500,000 | | e | | 500,000 |
| Maryland—.2% | | | | | | |
| Maryland Economic Development Corp., | | | | | | |
| Multi-Modal Revenue (United States | | | | | | |
| Pharmacopeial Project) 2.98% (Insured; | | | | | | |
| AMBAC and Liquidity Facility; Bank of America) | | 1,500,000 | | e | | 1,500,000 |
| Michigan—.3% | | | | | | |
| Detroit, Water Supply System Revenue | | | | | | |
| 3.09% (Insured; MBIA and Liquidity Facility; Bank One) | | 2,725,000 | | e | | 2,725,000 |
| Texas—.7% | | | | | | |
| Harris County Health Facilities Development Corp., | | | | | | |
| Revenue (The Methodist Hospital System) 3% | | 6,000,000 | | e | | 6,000,000 |
| Total Short-Term Municipal Investments | | | | | | |
| (cost $10,725,000) | | | | | | 10,725,000 |
| |
| |
| |
|
| |
| Total Investments (cost $810,046,602) | | 99.1% | | | | 823,480,307 |
| Cash and Receivables (Net) | | .9% | | | | 7,234,620 |
| Net Assets | | 100.0% | | | | 830,714,927 |
The Fund 19
STATEMENT OF INVESTMENTS (Unaudited) (continued)
| Summary of Abbreviations | | | | |
| |
| ACA | | American Capital Access | | GIC | | Guaranteed Investment Contract |
| AGC | | ACE Guaranty Corporation | | GNMA | | Government National Mortgage |
| AGIC | | Asset Guaranty Insurance Company | | | | Association |
| AMBAC | | American Municipal Bond | | GO | | General Obligation |
| | | Assurance Corporation | | HR | | Hospital Revenue |
| ARRN | | Adjustable Rate Receipt Notes | | IDB | | Industrial Development Board |
| BAN | | Bond Anticipation Notes | | IDC | | Industrial Development Corporation |
| BIGI | | Bond Investors Guaranty Insurance | | IDR | | Industrial Development Revenue |
| BPA | | Bond Purchase Agreement | | LOC | | Letter of Credit |
| CGIC | | Capital Guaranty Insurance | | LOR | | Limited Obligation Revenue |
| | | Company | | LR | | Lease Revenue |
| CIC | | Continental Insurance Company | | MBIA | | Municipal Bond Investors Assurance |
| CIFG | | CDC Ixis Financial Guaranty | | | | Insurance Corporation |
| CMAC | | Capital Market Assurance | | MFHR | | Multi-Family Housing Revenue |
| | | Corporation | | MFMR | | Multi-Family Mortgage Revenue |
| COP | | Certificate of Participation | | PCR | | Pollution Control Revenue |
| CP | | Commercial Paper | | RAC | | Revenue Anticipation Certificates |
| EDR | | Economic Development Revenue | | RAN | | Revenue Anticipation Notes |
| EIR | | Environmental Improvement | | RAW | | Revenue Anticipation Warrants |
| | | Revenue | | RRR | | Resources Recovery Revenue |
| FGIC | | Financial Guaranty Insurance | | SAAN | | State Aid Anticipation Notes |
| | | Company | | SBPA | | Standby Bond Purchase Agreement |
| FHA | | Federal Housing Administration | | SFHR | | Single Family Housing Revenue |
| FHLB | | Federal Home Loan Bank | | SFMR | | Single Family Mortgage Revenue |
| FHLMC | | Federal Home Loan Mortgage | | SONYMA | | State of New York Mortgage Agency |
| | | Corporation | | SWDR | | Solid Waste Disposal Revenue |
| FNMA | | Federal National Mortgage | | TAN | | Tax Anticipation Notes |
| | | Association | | TAW | | Tax Anticipation Warrants |
| FSA | | Financial Security Assurance | | TRAN | | Tax and Revenue Anticipation Notes |
| GAN | | Grant Anticipation Notes | | XLCA | | XL Capital Assurance |
| Summary of Combined Ratings (Unaudited) | | |
| |
| Fitch or | | Moody’s | | or Standard & Poor’s | | Value (%)† |
| |
| |
| |
|
| AAA | | Aaa | | AAA | | 51.3 |
| AA | | Aa | | AA | | 15.0 |
| A | | | | A | | A | | 13.8 |
| BBB | | Baa | | BBB | | 12.9 |
| BB | | | | Ba | | BB | | 1.6 |
| B | | | | B | | B | | .3 |
| F1 | | | | MIG1/P1 | | SP1/A1 | | 1.1 |
| Not Rated f | | Not Rated f | | Not Rated f | | 4.0 |
| | | | | | | | | 100.0 |
| |
| † | | Based on total investments. | | | | |
| a | | These securities are prerefunded; the date shown represents the prerefunded date. Bonds which are prerefunded are |
| | | collateralized by U.S. Government securities which are held in escrow and are used to pay principal and interest on |
| | | the municipal issue and to retire the bonds in full at the earliest refunding date. | | |
| b | | Zero coupon until a specified date, at which time the stated coupon rate becomes effective until maturity. |
| c | | Securities exempt from registration under Rule 144A of the Securities Act of 1933.These securities may be resold in |
| | | transactions exempt from registration, normally to qualified institutional buyers. At November 30, 2005, these |
| | | securities amounted to $17,398,650 or 2.1% of net assets. | | |
| d | | Inverse floater security—the interest rate is subject to change periodically. | | |
| e | | Securities payable on demand.Variable interest rate—subject to periodic change. | | |
| f | | Securities which, while not rated by Fitch, Moody’s and Standard & Poor’s have been determined by the Manager to |
| | | be of comparable quality to those rated securities in which the fund may invest. | | |
| See notes to financial statements. | | | | |
The Fund 21
| STATEMENT OF ASSETS AND LIABILITIES |
| November 30, 2005 (Unaudited) |
| | | Cost | | Value |
| |
| |
|
| Assets ($): | | | | |
| Investments in securities—See Statement of Investments | | 810,046,602 | | 823,480,307 |
| Interest receivable | | | | 13,703,188 |
| Receivable for shares of Common Stock subscribed | | | | 3,863 |
| Prepaid expenses | | | | 14,665 |
| | | | | 837,202,023 |
| |
| |
|
| Liabilities ($): | | | | |
| Due to The Dreyfus Corporation and affiliates | | | | 459,309 |
| Cash overdraft due to Custodian | | | | 287,095 |
| Payable for investment securities purchased | | | | 5,464,604 |
| Payable for shares of Common Stock redeemed | | | | 198,878 |
| Accrued expenses | | | | 77,210 |
| | | | | 6,487,096 |
| |
| |
|
| Net Assets ($) | | | | 830,714,927 |
| |
| |
|
| Composition of Net Assets ($): | | | | |
| Paid-in capital | | | | 823,100,740 |
| Accumulated undistributed investment income—net | | | | 149,604 |
| Accumulated net realized gain (loss) on investments | | | | (5,969,122) |
| Accumulated net unrealized appreciation | | | | |
| (depreciation) on investments | | | | 13,433,705 |
| |
| |
|
| Net Assets ($) | | | | 830,714,927 |
| |
| |
|
| Shares Outstanding | | | | |
| (300 million shares of $.001 par value Common Stock authorized) | | 62,602,428 |
| Net Asset Value, offering and redemption price per share—Note 3(d) ($) | | 13.27 |
See notes to financial statements.
|
| STATEMENT OF OPERATIONS |
| Six Months Ended November 30, 2005 (Unaudited) |
| Investment Income ($): | | |
| Interest Income | | 18,867,363 |
| Expenses: | | |
| Management fee—Note 3(a) | | 2,564,296 |
| Shareholder servicing costs—Note 3(b) | | 450,093 |
| Custodian fees | | 36,569 |
| Professional fees | | 30,952 |
| Directors’ fees and expenses—Note 3(c) | | 21,405 |
| Prospectus and shareholders’ reports | | 14,885 |
| Registration fees | | 12,579 |
| Loan commitment fees—Note 2 | | 2,635 |
| Miscellaneous | | 28,410 |
| Total Expenses | | 3,161,824 |
| Less—reduction in custody fees due to | | |
| earnings credits—Note 1(b) | | (20,415) |
| Net Expenses | | 3,141,409 |
| Investment Income—Net | | 15,725,954 |
| |
|
| Realized and Unrealized Gain (Loss) on Investments—Note 4 ($): |
| Net realized gain (loss) on investments | | 2,305,410 |
| Net unrealized appreciation (depreciation) on investments | | (17,268,690) |
| Net Realized and Unrealized Gain (Loss) on Investments | | (14,963,280) |
| Net Increase in Net Assets Resulting from Operations | | 762,674 |
See notes to financial statements.
|
The Fund 23
STATEMENT OF CHANGES IN NET ASSETS
| | | Six Months Ended | | |
| | | November 30, 2005 | | Year Ended |
| | | (Unaudited) | | May 31, 2005 |
| |
| |
|
| Operations ($): | | | | |
| Investment income—net | | 15,725,954 | | 33,122,188 |
| Net realized gain (loss) on investments | | 2,305,410 | | 6,019,863 |
| Net unrealized appreciation | | | | |
| (depreciation) on investments | | (17,268,690) | | 9,115,808 |
| Net Increase (Decrease) in Net Assets | | | | |
| Resulting from Operations | | 762,674 | | 48,257,859 |
| |
| |
|
| Dividends to Shareholders from ($): | | | | |
| Investment income—net | | (15,722,097) | | (33,363,442) |
| |
| |
|
| Capital Stock Transactions ($): | | | | |
| Net proceeds from shares sold | | 15,283,679 | | 51,829,030 |
| Dividends reinvested | | 11,679,366 | | 24,633,027 |
| Cost of shares redeemed | | (54,326,812) | | (122,535,096) |
| Increase (Decrease) in Net Assets | | | | |
| from Capital Stock Transactions | | (27,363,767) | | (46,073,039) |
| Total Increase (Decrease) in Net Assets | | (42,323,190) | | (31,178,622) |
| |
| |
|
| Net Assets ($): | | | | |
| Beginning of Period | | 873,038,117 | | 904,216,739 |
| End of Period | | 830,714,927 | | 873,038,117 |
| Undistributed investment income—net | | 149,604 | | — |
| |
| |
|
| Capital Share Transactions (Shares): | | | | |
| Shares sold | | 1,139,549 | | 3,840,582 |
| Shares issued for dividends reinvested | | 871,515 | | 1,826,980 |
| Shares redeemed | | (4,052,351) | | (9,087,026) |
| Net Increase (Decrease) in Shares Outstanding | | (2,041,287) | | (3,419,464) |
See notes to financial statements.
|
NOTES TO FINANCIAL STATEMENTS (Unaudited)
NOTE 1—Significant Accounting Policies:
Dreyfus Intermediate Municipal Bond Fund, Inc. (the “fund”) is registered under the Investment Company Act of 1940, as amended (the “Act”), as a diversified open-end management investment company. The fund’s investment objective is to provide the maximum amount of current income exempt from federal income tax as is consistent with the preservation of capital. The Dreyfus Corporation (the “Manager”) serves as the fund’s investment adviser.The Manager is a wholly-owned subsidiary of Mellon Financial Corporation (“Mellon Financial”). Dreyfus Service Corporation (the “Distributor”), a wholly-owned subsidiary of the Manager, is the distributor of the fund’s shares, which are sold to the public without a sales charge.
The fund’s financial statements are prepared in accordance with U.S. generally accepted accounting principles, which may require the use of management estimates and assumptions. Actual results could differ from those estimates.
The fund enters into contracts that contain a variety of indemnifications. The fund’s maximum exposure under these arrangements is unknown.The fund does not anticipate recognizing any loss related to these arrangements.
(a) Portfolio valuation: Investments in securities are valued each business day by an independent pricing service (the “Service”) approved by the Board of Directors. Investments for which quoted bid prices are readily available and are representative of the bid side of the market in the judgment of the Service are valued at the mean between the quoted bid prices (as obtained by the Service from dealers in such securities) and asked prices (as calculated by the Service based upon its evaluation of the market for such securities). Other investments (which constitute a majority of the portfolio securities) are carried at fair value as determined by the Service, based on methods which include consideration of: yields or prices of municipal securities of comparable quality, coupon, maturity and type; indications as to values from dealers; and general market conditions. Options and financial
futures on municipal and U.S.Treasury securities are valued at the last sales price on the securities exchange on which such securities are primarily traded or at the last sales price on the national securities market on each business day.
(b) Securities transactions and investment income: Securities transactions are recorded on a trade date basis. Realized gain and loss from securities transactions are recorded on the identified cost basis. Interest income, adjusted for accretion of discount and amortization of premium on investments, is earned from settlement date and recognized on the accrual basis. Securities purchased or sold on a when-issued or delayed-delivery basis may be settled a month or more after the trade date.
The fund has an arrangement with the custodian bank whereby the fund receives earnings credits from the custodian when positive cash balances are maintained, which are used to offset custody fees. For financial reporting purposes, the fund includes net earnings credits as an expense offset in the Statement of Operations.
(c) Dividends to shareholders: It is the policy of the fund to declare dividends daily from investment income-net. Such dividends are paid monthly. Dividends from net realized capital gain, if any, are normally declared and paid annually, but the fund may make distributions on a more frequent basis to comply with the distribution requirements of the Internal Revenue Code of 1986, as amended (the “Code”).To the extent that net realized capital gain can be offset by capital loss carryovers, it is the policy of the fund not to distribute such gain. Income and capital gain distributions are determined in accordance with income tax regulations, which may differ from U.S. generally accepted accounting principles.
(d) Federal income taxes: It is the policy of the fund to continue to qualify as a regulated investment company, which can distribute tax exempt dividends, by complying with the applicable provisions of the Code, and to make distributions of income and net realized capital gain sufficient to relieve it from substantially all federal income and excise taxes.
The Fund 27
NOTES TO FINANCIAL STATEMENTS (Unaudited) (continued)
The fund has an unused capital loss carryover of $8,274,532 available for federal income taxes to be applied against future net securities profits, if any, realized subsequent to May 31, 2005. If not applied, the carryover expires in fiscal 2011.
The tax character of all distributions paid to shareholders during the fiscal year ended May 31, 2005 was as follows: tax exempt income $33,363,442. The tax character of current year distributions will be determined at the end of the current fiscal year.
NOTE 2—Bank Line of Credit:
|
The fund participates with other Dreyfus-managed funds in a $350 million redemption credit facility (the “Facility”) to be utilized for temporary or emergency purposes, including the financing of redemptions. In connection therewith, the fund has agreed to pay commitment fees on its pro rata portion of the Facility. Interest is charged to the fund based on prevailing market rates in effect at the time of borrowing. During the period ended November 30, 2005, the fund did not borrow under the Facility.
NOTE 3—Management Fee and Other Transactions With Affiliates:
(a) Pursuant to a management agreement (“Agreement”) with the Manager, the management fee is computed at the annual rate of .60% of the value of the fund’s average daily net assets and is payable monthly.
(b) Under the Shareholder Services Plan, the fund reimburses the Distributor an amount not to exceed an annual rate of .25% of the value of the fund’s average daily net assets for certain allocated expenses of providing personal services and/or maintaining shareholder accounts.The services provided may include personal services relating to shareholder accounts, such as answering shareholder inquires regarding the fund and providing reports and other information, and services related to the maintenance of shareholder accounts. During the period ended November 30, 2005, the fund was charged $237,057 pursuant to the Shareholder Services Plan.
The fund compensates Dreyfus Transfer, Inc., a wholly-owned subsidiary of the Manager, under a transfer agency agreement for providing personnel and facilities to perform transfer agency services for the fund. During the period ended November 30, 2005, the fund was charged $143,653 pursuant to the transfer agency agreement.
During the period ended November 30, 2005, the fund was charged $1,854 for services performed by the Chief Compliance Officer.
The components of Due to The Dreyfus Corporation and affiliates in the Statement of Assets and Liabilities consist of: management fees $409,761, chief compliance officer fees $1,548 and transfer agency per account fees $48,000.
(c) Each Board member also serves as a Board member of other funds within the Dreyfus complex. Annual retainer fees and attendance fees are allocated to each fund based on net assets.
(d) A .10% redemption fee is charged and retained by the fund on certain shares redeemed within thirty days following the date of issuance, including redemptions made through the use of the fund’s exchange privilege.
NOTE 4—Securities Transactions:
The aggregate amount of purchases and sales of investment securities, excluding short-term securities, during the period ended November 30, 2005, amounted to $126,191,747 and $160,269,623, respectively.
At November 30, 2005, accumulated net unrealized appreciation on investments was $13,433,705, consisting of $16,972,923 gross unrealized appreciation and $3,539,218 gross unrealized depreciation.
At November 30, 2005, the cost of investments for federal income tax purposes was substantially the same as the cost for financial reporting purposes (see the Statement of Investments).
| For More | | Information |
| |
|
| |
| Dreyfus Intermediate | | Transfer Agent & |
| Muncipal Bond Fund, Inc. | | Dividend Disbursing Agent |
| 200 Park Avenue | | Dreyfus Transfer, Inc. |
| New York, NY 10166 | | 200 Park Avenue |
| Manager | | New York, NY 10166 |
| The Dreyfus Corporation | | Distributor |
| 200 Park Avenue | | Dreyfus Service Corporation |
| New York, NY 10166 | | 200 Park Avenue |
| Custodian | | New York, NY 10166 |
| The Bank of New York | | |
| One Wall Street | | |
| New York, NY 10286 | | |
| |
|
| |
| |
| Telephone 1-800-645-6561 | | |
| Mail The Dreyfus Family of Funds, 144 Glenn Curtiss Boulevard, Uniondale, NY 11556-0144 |
| E-mail Send your request to info@dreyfus.com |
| Internet Information can be viewed online or downloaded at: http://www.dreyfus.com |
The fund files its complete schedule of portfolio holdings with the Securities and Exchange Commission (“SEC”) for the first and third quarters of each fiscal year on Form N-Q. The fund's Forms N-Q are available on the SEC’s website at http://www.sec.gov and may be reviewed and copied at the SEC’s Public Reference Room in Washington, DC. Information on the operation of the Public Reference Room may be obtained by calling 1-800-SEC-0330.
Information regarding how the fund voted proxies relating to portfolio securities for the 12-month period ended June 30, 2005, is available on the SEC’s website at http://www.sec.gov and without charge, upon request, by calling 1-800-645-6561.

| Item 2. | | Code of Ethics. |
| | | Not applicable. |
| Item 3. | | Audit Committee Financial Expert. |
| | | Not applicable. |
| Item 4. | | Principal Accountant Fees and Services. |
| | | Not applicable. |
| Item 5. | | Audit Committee of Listed Registrants. |
| | | Not applicable. |
| Item 6. | | Schedule of Investments. |
| | | Not applicable. |
| Item 7. | | Disclosure of Proxy Voting Policies and Procedures for Closed-End Management |
| | | Investment Companies. |
| | | Not applicable. |
| Item 8. | | Portfolio Managers of Closed-End Management Investment Companies. |
| | | Not applicable. |
| Item 9. | | Purchases of Equity Securities by Closed-End Management Investment Companies and |
| | | Affiliated Purchasers. |
| | | Not applicable. [CLOSED-END FUNDS ONLY] |
| Item 10. | | Submission of Matters to a Vote of Security Holders. |
The Registrant has a Nominating Committee (the "Committee"), which is responsible for selecting and nominating persons for election or appointment by the Registrant's Board as Board members. The Committee has adopted a Nominating Committee Charter (the "Charter"). Pursuant to the Charter, the Committee will consider recommendations for nominees from shareholders submitted to the Secretary of the Registrant, c/o The Dreyfus Corporation Legal Department, 200 Park Avenue, 8th Floor East, New York, New York 10166. A nomination submission must include information regarding the recommended nominee as specified in the Charter. This information includes all information relating to a recommended nominee that is required to be disclosed in solicitations or proxy statements for the election of Board members, as well as information sufficient to evaluate the factors to be considered by the Committee, including character and integrity, business and professional experience, and whether the person has the ability to apply sound and independent business judgment and would act in the interests of the Registrant and its shareholders.
Nomination submissions are required to be accompanied by a written consent of the individual to stand for election if nominated by the Board and to serve if elected by the shareholders, and such additional information must be provided regarding the recommended nominee as reasonably requested by the Committee.
Item 11. Controls and Procedures.
(a) The Registrant's principal executive and principal financial officers have concluded, based on their evaluation of the Registrant's disclosure controls and procedures as of a date within 90 days of the filing date of this report, that the Registrant's disclosure controls and procedures are reasonably designed to ensure that information required to be disclosed by the Registrant on Form N-CSR is recorded, processed, summarized and reported within the required time periods and that information required to be disclosed by the Registrant in the reports that it files or submits on Form N-CSR is accumulated and communicated to the Registrant's management, including its principal executive and principal financial officers, as appropriate to allow timely decisions regarding required disclosure.
(b) There were no changes to the Registrant's internal control over financial reporting that occurred during the second fiscal quarter of the period covered by this report that have materially affected, or are reasonably likely to materially affect, the Registrant's internal control over financial reporting.
Item 12. Exhibits.
| (a)(1) | | Not applicable. |
| (a)(2) | | Certifications of principal executive and principal financial officers as required by Rule 30a-2(a) |
| under the Investment Company Act of 1940. |
| (a)(3) | | Not applicable. |
| (b) | | Certification of principal executive and principal financial officers as required by Rule 30a-2(b) |
| under the Investment Company Act of 1940. |
Pursuant to the requirements of the Securities Exchange Act of 1934 and the Investment Company Act of 1940, the Registrant has duly caused this Report to be signed on its behalf by the undersigned, thereunto duly authorized.
DREYFUS INTERMEDIATE MUNICIPAL BOND FUND, INC.
| By: | | /s/ Stephen E. Canter |
| | | Stephen E. Canter |
| | | President |
| |
| Date: | | January 27, 2006 |
| |
| Pursuant to the requirements of the Securities Exchange Act of 1934 and the Investment Company Act of |
| 1940, this Report has been signed below by the following persons on behalf of the Registrant and in the |
| capacities and on the dates indicated. |
| |
| By: | | /s/ Stephen E. Canter |
| | | Stephen E. Canter |
| | | Chief Executive Officer |
| |
| Date: | | January 27, 2006 |
| |
| By: | | /s/ James Windels |
| | | James Windels |
| | | Chief Financial Officer |
| |
| Date: | | January 27, 2006 |
| |
| EXHIBIT INDEX |
| |
| | | (a)(2) Certifications of principal executive and principal financial officers as required by Rule 30a- |
| | | 2(a) under the Investment Company Act of 1940. (EX-99.CERT) |
| |
| | | (b) Certification of principal executive and principal financial officers as required by Rule 30a- |
| | | 2(b) under the Investment Company Act of 1940. (EX-99.906CERT) |