| UNITED STATES |
| SECURITIES AND EXCHANGE COMMISSION |
| Washington, D.C. 20549 |
| FORM N-CSR |
| CERTIFIED SHAREHOLDER REPORT OF REGISTERED MANAGEMENT |
| INVESTMENT COMPANIES |
| Investment Company Act file number 811-3721 |
| Dreyfus Intermediate Municipal Bond Fund, Inc. |
| (Exact name of Registrant as specified in charter) |
| c/o The Dreyfus Corporation |
| 200 Park Avenue |
| New York, New York 10166 |
| (Address of principal executive offices) (Zip code) |
| |
| Mark N. Jacobs, Esq. |
| 200 Park Avenue |
| New York, New York 10166 |
| (Name and address of agent for service) |
| |
| Registrant's telephone number, including area code: (212) 922-6000 |
| Date of fiscal year end: | | 5/31 |
| Date of reporting period: | | 5/31/06 |
FORM N-CSR
Item 1. Reports to Stockholders.
Save time. Save paper. View your next shareholder report online as soon as it’s available. Log into www.dreyfus.com and sign up for Dreyfus eCommunications. It’s simple and only takes a few minutes.
The views expressed in this report reflect those of the portfolio manager only through the end of the period covered and do not necessarily represent the views of Dreyfus or any other person in the Dreyfus organization. Any such views are subject to change at any time based upon market or other conditions and Dreyfus disclaims any responsibility to update such views.These views may not be relied on as investment advice and, because investment decisions for a Dreyfus fund are based on numerous factors, may not be relied on as an indication of trading intent on behalf of any Dreyfus fund.
Not FDIC-Insured • Not Bank-Guaranteed • May Lose Value
| Contents |
| |
| | | THE FUND |
| |
|
| 2 | | Letter from the Chairman |
| 3 | | Discussion of Fund Performance |
| 6 | | Fund Performance |
| 7 | | Understanding Your Fund’s Expenses |
| 7 | | Comparing Your Fund’s Expenses |
| With Those of Other Funds |
| 8 | | Statement of Investments |
| 28 | | Statement of Assets and Liabilities |
| 29 | | Statement of Operations |
| 30 | | Statement of Changes in Net Assets |
| 31 | | Financial Highlights |
| 32 | | Notes to Financial Statements |
| 37 | | Report of Independent Registered |
| | | Public Accounting Firm |
| 38 | | Important Tax Information |
| 39 | | Information About the Review |
| and Approval of the Fund’s |
| | | Investment Management Agreement |
| 44 | | Board Members Information |
| 46 | | Officers of the Fund |
| |
| FOR MORE INFORMATION |
|
| | | Back Cover |
Dreyfus Intermediate Municipal
Bond Fund, Inc.
The Fund

LETTER FROM THE CHAIRMAN
Dear Shareholder:
We are pleased to present this annual report for Dreyfus Intermediate Municipal Bond Fund, Inc., covering the 12-month period from June 1, 2005, through May 31, 2006.
Since June 2004, the Federal Reserve Board (the “Fed”) has attempted to manage U.S. economic growth and forestall potential inflation by gradually raising short-term interest rates. In our view, the Fed’s shift from a stimulative monetary policy to a neutral one has so far been successful: the economy has grown at a moderate pace, the unemployment rate has dropped, corporate profits have risen, and inflation has generally remained in check despite recent cost pressures stemming from higher energy and import prices.
As we near the second half of the year, the financial markets appear more likely to be influenced not by what the Fed already has accomplished, but by investors’ expectations of what is to come, including the Fed’s decision to increase rates further, maintain them at current levels or reduce them to stimulate future growth. We believe that this decision will depend largely on the outlook for core inflation in 2007.The Fed probably can stand pat as long as it expects inflation to remain subdued. But if inflationary pressures continue to build, the Fed may choose to tighten monetary policy further.As always, we urge you to discuss with your financial advisor the potential implications of these possibilities on your investments.
For information about how the fund performed during the reporting period, as well as market perspectives, we have provided a Discussion of Fund Performance given by the fund’s portfolio manager.
Thank you for your continued confidence and support.

DISCUSSION OF FUND PERFORMANCE
Monica S. Wieboldt, Portfolio Manager
How did Dreyfus Intermediate Municipal Bond Fund perform relative to its benchmark?
For the 12-month period ended May 31, 2006, the fund achieved a total return of 1.23% .1 The Lehman Brothers 7-Year Municipal Bond Index (the “Index”), the fund’s benchmark, achieved a total return of 1.05% for the same period.2 In addition, the average total return for all funds reported in the Lipper Intermediate Municipal Debt Funds category was 1.03% .3
Municipal bonds held up relatively well amid rising interest rates as a result of supply-and-demand factors. The fund produced a higher return than the Index and its Lipper category average, due in part to strong income contributions from its core holdings and investments in higher-yielding corporate-backed bonds.
What is the fund’s investment approach?
The fund seeks the maximum amount of current income exempt from federal income tax as is consistent with the preservation of capital.To pursue this goal, the fund normally invests substantially all of its assets in municipal bonds that provide income exempt from federal personal income tax.
The fund invests at least 80% of its assets in municipal bonds rated A or higher, or the unrated equivalent as determined by Dreyfus. The fund may invest up to 20% of its assets in municipal bonds rated below A, including bonds rated below investment grade (“high yield” or “junk” bonds) or the unrated equivalent as determined by Dreyfus. The dollar-weighted average maturity of the fund’s portfolio ranges between three and 10 years.
We may buy and sell bonds based on credit quality, market outlook and yield potential. In selecting municipal bonds for investment, we may assess the current interest-rate environment and the municipal bond’s
DISCUSSION OF FUND PERFORMANCE (continued)
|
potential volatility in different rate environments. We focus on bonds with the potential to offer attractive current income, typically looking for bonds that can provide consistently attractive current yields or that are trading at competitive market prices. A portion of the fund’s assets may be allocated to “discount” bonds, which are bonds that sell at a price below their face value, or to “premium” bonds, which are bonds that sell at a price above their face value.The fund’s allocation to either discount bonds or to premium bonds will change along with our changing views of the current interest-rate and market environment.We also may look to select bonds that are most likely to obtain attractive prices when sold.
What other factors influenced the fund’s performance?
The Federal Reserve Board (the “Fed”) raised short-term interest rates eight times during the reporting period, driving the overnight federal funds rate to 5%. Short-term municipal bond yields climbed along with interest rates, but intermediate-term bonds rose less steeply, contributing to a further narrowing of yield differences (known as “spreads”) across the maturity range.The spread between two-year and 30-year bonds flattened from 160 basis points at the start of the reporting period to less than 65 basis points at the end.When intermediate-and longer-term bond yields began to rise more steeply, and prices fell, in the spring, it was not enough to erase the market’s positive absolute returns for the reporting period overall.
The fund’s results also were positively influenced by supply-and-demand factors. The steadily growing U.S. economy helped to boost corporate and personal income tax receipts for most states and municipalities. A correspondingly reduced supply of newly issued securities was met with robust investor demand, supporting prices.
The fund received strong contributions from its core holdings of “seasoned” bonds.These are bonds that were purchased at higher yields than are available today, and typically retain more of their value.The fund also benefited from its corporate-backed securities — bonds back by corporations or other institutions that are eligible for federal tax-exempt status — including those backed by airlines, health care facilities and the
states’ settlement of litigation with U.S. tobacco companies.While high-yield municipal bonds represented one of the better performing sectors over the past year, credit spreads have tightened significantly, making these issues’ current risk-reward characteristics less attractive.
During the first half of the reporting period, we generally focused on bonds with maturities toward the longer end of the intermediate range, while de-emphasizing the two- to five-year area.This strategy enabled the fund to participate more fully in strength among longer-term bonds. We began to shift our focus toward shorter maturities in the spring as the yield curve continued to flatten, providing opportunities to “roll down” the yield curve without significantly hampering current income.
What is the fund’s current strategy?
Recent economic data suggests that more rate hikes from the Fed are likely. If so, we anticipate a greater degree of volatility than the market has experienced over the past year. As we move further into the year and if it appears that Fed tightening is coming to an end, we would expect the yield curve to steepen, which may benefit short- to intermediate-term bonds and potentially offer opportunities to reduce the fund’s weighted average maturity without significantly affecting its current income profile.However,we are watching the economy carefully, and we are prepared to adjust our strategies as circumstances change.
June 15, 2006
| 1 | | Total return includes reinvestment of dividends and any capital gains paid. Past performance is no |
| | | guarantee of future results. Share price, yield and investment return fluctuate such that upon |
| | | redemption, fund shares may be worth more or less than their original cost. Income may be subject |
| | | to state and local taxes, and some income may be subject to the federal alternative minimum tax |
| | | (AMT) for certain investors. Capital gains, if any, are taxable. Return figure provided reflects the |
| | | absorption of certain fund expenses by The Dreyfus Corporation pursuant to an undertaking in |
| | | effect that may be modified, extended or terminated at any time. Had these expenses not been |
| | | absorbed, the fund’s return would have been lower. |
| 2 | | SOURCE: LIPPER INC. — Reflects reinvestment of dividends and, where applicable, capital |
| | | gain distributions.The Lehman Brothers 7-Year Municipal Bond Index is an unmanaged total |
| | | return performance benchmark for the investment-grade, geographically unrestricted 7-year tax- |
| | | exempt bond market, consisting of municipal bonds with maturities of 6-8 years. Index returns do |
| | | not reflect fees and expenses associated with operating a mutual fund. |
| 3 | | Source: Lipper Inc. |
The Fund 5
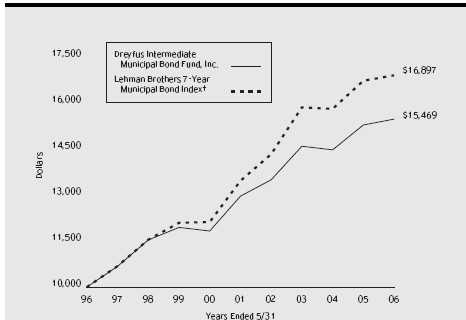
Comparison of change in value of $10,000 investment in Dreyfus Intermediate Municipal Bond Fund, Inc. and the Lehman Brothers 7-Year Municipal Bond Index
| Average Annual Total Returns | | as of 5/31/06 | | | | | | |
| | | | | 1 Year | | 5 Years | | 10 Years |
| |
| |
| |
| |
|
| Fund | | | | 1.23% | | 3.60% | | 4.46% |
| † Source: Lipper Inc. |
| Past performance is not predictive of future performance.The fund’s performance shown in the graph and table does not |
| reflect the deduction of taxes that a shareholder would pay on fund distributions or the redemption of fund shares. |
| The above graph compares a $10,000 investment made in Dreyfus Intermediate Municipal Bond Fund, Inc. on |
| 5/31/96 to a $10,000 investment made in the Lehman Brothers 7-Year Municipal Bond Index (the “Index”) on that |
| date. All dividends and capital gain distributions are reinvested. |
| The fund invests primarily in municipal securities and maintains a portfolio with a weighted average maturity ranging |
| between 3 and 10 years.The fund’s performance shown in the line graph above takes into account fees and expenses.The |
| Index, unlike the fund, is an unmanaged total return performance benchmark for the investment-grade, geographically |
| unrestricted 7-year tax-exempt bond market, consisting of municipal bonds with maturities of 6-8 years.The Index does |
| not take into account charges, fees and other expenses.These factors can contribute to the Index potentially outperforming |
| or underperforming the fund. Further information relating to fund performance, including expense reimbursements, if |
| applicable, is contained in the Financial Highlights section of the prospectus and elsewhere in this report. |
U N D E R S TA N D I N G YO U R F U N D ’ S E X P E N S E S ( U n a u d i t e d )
As a mutual fund investor, you pay ongoing expenses, such as management fees and other expenses. Using the information below, you can estimate how these expenses affect your investment and compare them with the expenses of other funds.You also may pay one-time transaction expenses, including sales charges (loads) and redemption fees, which are not shown in this section and would have resulted in higher total expenses. For more information, see your fund’s prospectus or talk to your financial adviser.
Review your fund’s expenses
The table below shows the expenses you would have paid on a $1,000 investment in Dreyfus Intermediate Municipal Bond Fund, Inc. from December 1, 2005 to May 31, 2006. It also shows how much a $1,000 investment would be worth at the close of the period, assuming actual returns and expenses.
Expenses and Value of a $1,000 Investment assuming actual returns for the six months ended May 31, 2006
| Expenses paid per $1,000 † | | $ 3.71 |
| Ending value (after expenses) | | $1,011.80 |
| COMPARING YOUR FUND’S EXPENSES |
| WITH THOSE OF OTHER FUNDS (Unaudited) |
Using the SEC’s method to compare expenses
The Securities and Exchange Commission (SEC) has established guidelines to help investors assess fund expenses. Per these guidelines, the table below shows your fund’s expenses based on a $1,000 investment, assuming a hypothetical 5% annualized return. You can use this information to compare the ongoing expenses (but not transaction expenses or total cost) of investing in the fund with those of other funds.All mutual fund shareholder reports will provide this information to help you make this comparison. Please note that you cannot use this information to estimate your actual ending account balance and expenses paid during the period.
Expenses and Value of a $1,000 Investment assuming a hypothetical 5% annualized return for the six months ended May 31, 2006
| Expenses paid per $1,000 † | | $ 3.73 |
| Ending value (after expenses) | | $1,021.24 |
† Expenses are equal to the fund’s annualized expense ratio of .74%, multiplied by the average account value over the period, multiplied by 182/365 (to reflect the one-half year period).
| STATEMENT OF INVESTMENTS |
| May 31, 2006 |
| Long-Term Municipal | | Coupon | | Maturity | | Principal | | |
| Investments—98.1% | | Rate (%) | | Date | | Amount ($) | | Value ($) |
| |
| |
| |
| |
|
| Alabama—1.8% | | | | | | | | |
| Jefferson County, | | | | | | | | |
| Limited Obligation | | | | | | | | |
| School Warrants | | 5.50 | | 1/1/21 | | 7,500,000 | | 8,021,775 |
| Jefferson County, | | | | | | | | |
| Limited Obligation | | | | | | | | |
| School Warrants | | 5.25 | | 1/1/23 | | 5,500,000 | | 5,758,720 |
| McIntosh Industrial Development | | | | | | | | |
| Board, EIR | | 4.65 | | 6/1/08 | | 375,000 | | 378,765 |
| Alaska—4.3% | | | | | | | | |
| Alaska International Airports, | | | | | | | | |
| Revenue (Insured; AMBAC) | | 5.50 | | 10/1/11 | | 2,560,000 | | 2,757,274 |
| Alaska International Airports, | | | | | | | | |
| Revenue (Insured; AMBAC) | | 5.50 | | 10/1/12 | | 1,620,000 | | 1,756,566 |
| Alaska Student Loan Corp., | | | | | | | | |
| Student Loan Revenue | | | | | | | | |
| (Insured; AMBAC) | | 6.00 | | 7/1/16 | | 6,380,000 | | 6,727,008 |
| Anchorage | | | | | | | | |
| (Insured; FGIC) | | 5.88 | | 12/1/10 | | 2,365,000 a | | 2,572,647 |
| Anchorage | | | | | | | | |
| (Insured; FGIC) | | 5.88 | | 12/1/10 | | 1,500,000 a | | 1,631,700 |
| Anchorage, | | | | | | | | |
| Electric Utility Revenue | | | | | | | | |
| (Insured; FSA) | | 5.88 | | 2/1/10 | | 3,175,000 a | | 3,408,458 |
| Anchorage, | | | | | | | | |
| Electric Utility Revenue | | | | | | | | |
| (Insured; MBIA) | | 6.50 | | 12/1/08 | | 2,755,000 | | 2,935,425 |
| Anchorage, | | | | | | | | |
| Electric Utility Revenue | | | | | | | | |
| (Insured; MBIA) | | 6.50 | | 12/1/09 | | 2,910,000 | | 3,167,710 |
| Anchorage, | | | | | | | | |
| GO (Schools) (Insured; FGIC) | | 5.25 | | 9/1/18 | | 2,000,000 | | 2,140,920 |
| Northern Tobacco Securitization | | | | | | | | |
| Corp., Tobacco Settlement | | | | | | | | |
| Asset-Backed Bonds | | 6.00 | | 6/1/13 | | 4,745,000 | | 4,956,153 |
| Northern Tobacco Securitization | | | | | | | | |
| Corp., Tobacco Settlement | | | | | | | | |
| Asset-Backed Bonds | | 6.20 | | 6/1/22 | | 2,030,000 | | 2,111,748 |
| California—9.2% | | | | | | | | |
| ABAG Finance Authority for | | | | | | | | |
| Nonprofit Corp., Revenue | | | | | | | | |
| (San Diego Hospital Association) | | 5.13 | | 3/1/18 | | 1,000,000 | | 1,027,270 |
8
| Long-Term Municipal | | Coupon | | Maturity | | Principal | | |
| Investments (continued) | | Rate (%) | | Date | | Amount ($) | | Value ($) |
| |
| |
| |
| |
|
| California (continued) | | | | | | | | |
| California, | | | | | | | | |
| GO | | 5.00 | | 8/1/22 | | 5,000,000 | | 5,191,500 |
| California, | | | | | | | | |
| GO (Various Purpose) | | 5.00 | | 6/1/16 | | 5,000,000 | | 5,292,200 |
| California, | | | | | | | | |
| GO (Various Purpose) | | 5.00 | | 6/1/16 | | 9,875,000 | | 10,425,432 |
| California Health Facilities | | | | | | | | |
| Financing Authority, Revenue | | | | | | | | |
| (Cedars-Sinai Medical Center) | | 5.00 | | 11/15/19 | | 1,500,000 | | 1,552,305 |
| California Infrastructure and | | | | | | | | |
| Economic Development Bank, Bay | | | | | | |
| Area Toll Bridges Seismic | | | | | | | | |
| Retrofit Revenue (First Lien) | | | | | | | | |
| (Insured; FSA) | | 5.25 | | 7/1/13 | | 3,300,000 a | | 3,595,680 |
| California Pollution Control | | | | | | | | |
| Financing Authority, PCR (San | | | | | | | | |
| Diego Gas and Electric Co.) | | | | | | | | |
| (Insured; MBIA) | | 5.90 | | 6/1/14 | | 2,100,000 | | 2,369,346 |
| California Public Works Board, | | | | | | | | |
| LR (Department of Mental | | | | | | | | |
| Health-Coalinga) | | 5.50 | | 6/1/18 | | 3,000,000 | | 3,259,500 |
| California Statewide Communities | | | | | | | | |
| Development Authority, MFHR | | | | | | | | |
| (Equity Residential/Skylark | | | | | | | | |
| Apartments) | | 5.20 | | 6/15/09 | | 3,000,000 | | 3,076,530 |
| California Statewide Communities | | | | | | | | |
| Development Authority, Revenue | | | | | | |
| (Huntington Memorial Hospital) | | 5.00 | | 7/1/17 | | 2,895,000 | | 3,002,926 |
| Elsinore Valley Municipal Water | | | | | | | | |
| District, COP (Insured; FGIC) | | 5.38 | | 7/1/16 | | 3,295,000 | | 3,610,463 |
| Foothill/Eastern Transportation | | | | | | | | |
| Corridor Agency, Toll | | | | | | | | |
| Road Revenue | | 7.00 | | 1/1/08 | | 5,000,000 | | 5,262,700 |
| Golden State Tobacco | | | | | | | | |
| Securitization Corp., Enhanced | | | | | | | | |
| Tobacco Settlement | | | | | | | | |
| Asset-Backed Bonds | | 5.75 | | 6/1/08 | | 6,950,000 a | | 7,236,548 |
| Golden State Tobacco | | | | | | | | |
| Securitization Corp., Enhanced | | | | | | | | |
| Tobacco Settlement | | | | | | | | |
| Asset-Backed Bonds | | 5.00 | | 6/1/19 | | 2,000,000 | | 2,041,560 |
The Fund 9
| | STATEMENT OF INVESTMENTS (continued)
|
| Long-Term Municipal | | Coupon | | Maturity | | Principal | | |
| Investments (continued) | | Rate (%) | | Date | | Amount ($) | | Value ($) |
| |
| |
| |
| |
|
| California (continued) | | | | | | | | |
| Los Angeles County Public Works | | | | | | | | |
| Financing Authority, Revenue | | | | | | | | |
| (Regional Park and Open | | | | | | | | |
| Space District) | | 5.00 | | 10/1/07 | | 3,635,000 a | | 3,738,270 |
| Los Angeles County Public Works | | | | | | | | |
| Financing Authority, Revenue | | | | | | | | |
| (Regional Park and Open | | | | | | | | |
| Space District) | | 5.00 | | 10/1/19 | | 1,915,000 | | 1,961,592 |
| Palomar Pomerado Health, | | | | | | | | |
| GO (Insured; AMBAC) | | 5.00 | | 8/1/20 | | 2,130,000 | | 2,236,095 |
| San Francisco Bay Area Rapid | | | | | | | | |
| Transit District, Sales Tax | | | | | | | | |
| Revenue (Insured; MBIA) | | 5.00 | | 7/1/18 | | 3,000,000 | | 3,173,790 |
| San Francisco City and County | | | | | | | | |
| Public Utilities Commission, | | | | | | | | |
| San Francisco Water | | | | | | | | |
| Revenue (Insured; FSA) | | 5.00 | | 11/1/18 | | 5,000,000 | | 5,311,100 |
| Colorado—.7% | | | | | | | | |
| El Paso County School District | | | | | | | | |
| (Number 11 Colorado Springs) | | 6.25 | | 12/1/09 | | 1,000,000 | | 1,083,000 |
| El Paso County School District | | | | | | | | |
| (Number 11 Colorado Springs) | | 6.50 | | 12/1/10 | | 2,000,000 | | 2,228,440 |
| El Paso County School District | | | | | | | | |
| (Number 11 Colorado Springs) | | 6.50 | | 12/1/11 | | 2,040,000 | | 2,314,523 |
| Connecticut—.1% | | | | | | | | |
| Mashantucket Western Pequot Tribe, | | | | | | |
| Special Revenue | | 5.60 | | 9/1/09 | | 1,000,000 b | | 1,036,950 |
| District of Columbia—.5% | | | | | | | | |
| District of Columbia | | | | | | | | |
| (Insured; MBIA) | | 6.00 | | 6/1/12 | | 3,280,000 | | 3,640,144 |
| Florida—3.2% | | | | | | | | |
| Broward County, | | | | | | | | |
| Airport System Revenue | | | | | | | | |
| (Convertible Lien) | | | | | | | | |
| (Insured; AMBAC) | | 5.25 | | 10/1/11 | | 1,525,000 | | 1,576,225 |
| Capital Projects Finance | | | | | | | | |
| Authority, Student Housing | | | | | | | | |
| Revenue (Capital Projects Loan | | | | | | |
| Program) (Insured; MBIA) | | 5.50 | | 10/1/15 | | 4,060,000 | | 4,294,627 |
10
| Long-Term Municipal | | Coupon | | Maturity | | Principal | | |
| Investments (continued) | | Rate (%) | | Date | | Amount ($) | | Value ($) |
| |
| |
| |
| |
|
| Florida (continued) | | | | | | | | |
| Collier County, | | | | | | | | |
| Gas Tax Revenue (Insured; AMBAC) | | 5.25 | | 6/1/19 | | 2,190,000 | | 2,342,599 |
| Hillsborough County Industrial | | | | | | | | |
| Development Authority, PCR | | | | | | | | |
| (Tampa Electric Co. Project) | | 5.10 | | 10/1/13 | | 5,000,000 | | 5,187,700 |
| Miami-Dade County School Board, | | | | | | | | |
| COP (Insured; FGIC) | | 5.25 | | 10/1/17 | | 5,000,000 | | 5,354,000 |
| Palm Beach County School Board, | | | | | | | | |
| COP (Insured; AMBAC) | | 5.38 | | 8/1/14 | | 4,000,000 | | 4,359,960 |
| Polk County, | | | | | | | | |
| Utility System Revenue | | | | | | | | |
| (Insured; FGIC) | | 5.25 | | 10/1/18 | | 2,000,000 | | 2,144,940 |
| Georgia—2.8% | | | | | | | | |
| Athens Housing Authority, | | | | | | | | |
| Student Housing LR (Ugaref | | | | | | | | |
| East Campus Housing) | | | | | | | | |
| (Insured; AMBAC) | | 5.25 | | 12/1/15 | | 2,560,000 | | 2,715,699 |
| Athens Housing Authority, | | | | | | | | |
| Student Housing LR (Ugaref | | | | | | | | |
| East Campus Housing) | | | | | | | | |
| (Insured; AMBAC) | | 5.25 | | 12/1/16 | | 2,700,000 | | 2,856,195 |
| Atlanta, | | | | | | | | |
| Water and Wastewater | | | | | | | | |
| Revenue (Insured; FSA) | | 5.25 | | 11/1/15 | | 5,000,000 | | 5,391,600 |
| Milledgeville and Baldwin County | | | | | | | | |
| Development Authority, Revenue | | | | | | | | |
| (Georgia College and State | | | | | | | | |
| University Foundation Property | | | | | | | | |
| III, LLC Student Housing | | | | | | | | |
| System Project) | | 6.00 | | 9/1/10 | | 1,275,000 | | 1,356,498 |
| Milledgeville and Baldwin County | | | | | | | | |
| Development Authority, Revenue | | | | | | | | |
| (Georgia College and State | | | | | | | | |
| University Foundation Property | | | | | | | | |
| III, LLC Student Housing | | | | | | | | |
| System Project) | | 5.25 | | 9/1/19 | | 1,710,000 | | 1,750,989 |
| Municipal Electric Authority of | | | | | | | | |
| Georgia (Combustion Turbine | | | | | | | | |
| Project) (Insured; MBIA) | | 5.25 | | 11/1/12 | | 2,735,000 | | 2,943,544 |
| | STATEMENT OF INVESTMENTS (continued)
|
| Long-Term Municipal | | Coupon | | Maturity | | Principal | | |
| Investments (continued) | | Rate (%) | | Date | | Amount ($) | | Value ($) |
| |
| |
| |
| |
|
| Georgia (continued) | | | | | | | | |
| Municipal Electric Authority of | | | | | | | | |
| Georgia (Combustion Turbine | | | | | | |
| Project) (Insured; MBIA) | | 5.25 | | 11/1/16 | | 5,000,000 | | 5,349,000 |
| Hawaii—.3% | | | | | | | | |
| Kuakini Health System, | | | | | | | | |
| Special Purpose Revenue | | 5.50 | | 7/1/12 | | 2,575,000 | | 2,719,715 |
| Illinois—3.6% | | | | | | | | |
| Chicago Housing Authority, | | | | | | | | |
| Revenue (Capital Program) | | 5.00 | | 7/1/09 | | 2,500,000 | | 2,578,725 |
| Chicago Housing Authority, | | | | | | | | |
| Revenue (Capital Program) | | 5.25 | | 7/1/10 | | 2,420,000 | | 2,539,814 |
| Chicago O’Hare International | | | | | | | | |
| Airport, Revenue (Second Lien) | | | | | | |
| (Insured; AMBAC) | | 5.25 | | 1/1/10 | | 3,095,000 | | 3,222,328 |
| Chicago O’Hare International | | | | | | | | |
| Airport, Revenue (Third Lien) | | | | | | |
| (Insured; CIFG) | | 5.50 | | 1/1/15 | | 6,450,000 | | 7,000,379 |
| Chicago Park District, | | | | | | | | |
| GO Limited Tax Park | | | | | | | | |
| (Insured; FGIC) | | 5.50 | | 7/1/11 | | 4,005,000 a | | 4,325,560 |
| Chicago Park District, | | | | | | | | |
| GO Limited Tax Park | | | | | | | | |
| (Insured; FGIC) | | 5.50 | | 1/1/20 | | 1,300,000 | | 1,387,919 |
| Illinois Health Facilities | | | | | | | | |
| Authority, Revenue | | | | | | | | |
| (Passavant Memorial | | | | | | | | |
| Area Hospital Association) | | 5.65 | | 10/1/16 | | 4,850,000 | | 5,106,468 |
| Metropolitan Pier and | | | | | | | | |
| Exposition Authority, | | | | | | | | |
| Dedicated State Tax | | | | | | | | |
| Revenue (McCormick Place) | | | | | | | | |
| (Insured; MBIA) | | 0/5.55 | | 6/15/21 | | 2,500,000 c | | 1,966,125 |
| Indiana—2.0% | | | | | | | | |
| Indiana Health Facility Financing | | | | | | |
| Authority, HR (Clarian | | | | | | | | |
| Health Partners, Inc.) | | 5.50 | | 2/15/07 | | 3,000,000 a | | 3,096,930 |
| Indiana Health Facility Financing | | | | | | |
| Authority, HR (Clarian | | | | | | | | |
| Health Partners, Inc.) | | 5.50 | | 2/15/07 | | 5,000,000 a | | 5,161,550 |
| Indianapolis Local Public | | | | | | | | |
| Improvement Bond Bank | | | | | | | | |
| (Insured; FSA) | | 6.50 | | 1/1/11 | | 6,415,000 | | 7,135,597 |
12
| Long-Term Municipal | | Coupon | | Maturity | | Principal | | |
| Investments (continued) | | Rate (%) | | Date | | Amount ($) | | Value ($) |
| |
| |
| |
| |
|
| Kansas—1.8% | | | | | | | | |
| Wyandotte County/Kansas City | | | | | | | | |
| Unified Government, Tax-Exempt | | | | | | | | |
| Sales Tax Special Obligation | | | | | | | | |
| Revenue (Redevelopment | | | | | | | | |
| Project Area B) | | 4.75 | | 12/1/16 | | 3,800,000 | | 3,856,620 |
| Wyandotte County/Kansas City | | | | | | | | |
| Unified Government, Utility | | | | | | | | |
| System Revenue (Insured; AMBAC) | | 5.65 | | 9/1/18 | | 9,130,000 | | 10,338,538 |
| Kentucky—.5% | | | | | | | | |
| Ashland, | | | | | | | | |
| PCR (Ashland, Inc.) | | 5.70 | | 11/1/09 | | 4,000,000 | | 4,245,840 |
| Louisiana—.4% | | | | | | | | |
| Morehouse Parish, | | | | | | | | |
| PCR (International | | | | | | | | |
| Paper Co. Project) | | 5.25 | | 11/15/13 | | 2,000,000 | | 2,081,860 |
| Plaquemines Parish Law Enforcement | | | | | | |
| District, Certificates of | | | | | | | | |
| Indebtedness (Insured; FGIC) | | 4.50 | | 3/1/12 | | 1,175,000 | | 1,209,839 |
| Maryland—.7% | | | | | | | | |
| Maryland Department of | | | | | | | | |
| Transportation, Consolidated | | | | | | | | |
| Transportation | | 5.00 | | 5/1/16 | | 5,000,000 | | 5,309,750 |
| Massachusetts—4.1% | | | | | | | | |
| Boston Water and Sewer | | | | | | | | |
| Commission, Revenue | | 5.00 | | 11/1/20 | | 5,760,000 | | 6,044,083 |
| Massachusetts, | | | | | | | | |
| Consolidated Loan | | 5.00 | | 12/1/10 | | 3,000,000 | | 3,151,050 |
| Massachusetts Bay Transportation | | | | | | | | |
| Authority, Sales Tax Revenue | | 5.50 | | 7/1/17 | | 5,000,000 | | 5,571,100 |
| Massachusetts Municipal Wholesale | | | | | | | | |
| Electric Co., Power Supply | | | | | | | | |
| System Revenue (Project | | | | | | | | |
| Number 6) (Insured; MBIA) | | 5.25 | | 7/1/15 | | 4,000,000 | | 4,250,360 |
| Massachusetts Water Resource | | | | | | | | |
| Authority (Insured; MBIA) | | 5.25 | | 8/1/19 | | 8,420,000 | | 9,150,182 |
| University of Massachusetts | | | | | | | | |
| Building Authority, Project | | | | | | | | |
| Revenue (Insured; AMBAC) | | 5.25 | | 11/1/13 | | 3,500,000 a | | 3,809,190 |
| Michigan—5.1% | | | | | | | | |
| Detroit Local Development | | | | | | | | |
| Finance Authority | | 5.20 | | 5/1/10 | | 5,745,000 | | 5,869,207 |
| | STATEMENT OF INVESTMENTS (continued)
|
| Long-Term Municipal | | Coupon | | Maturity | | Principal | | |
| Investments (continued) | | Rate (%) | | Date | | Amount ($) | | Value ($) |
| |
| |
| |
| |
|
| Michigan (continued) | | | | | | | | |
| Greater Detroit Resource Recovery | | | | | | | | |
| Authority, Revenue | | | | | | | | |
| (Insured; AMBAC) | | 6.25 | | 12/13/08 | | 7,755,000 | | 8,219,680 |
| Michigan Building Authority, | | | | | | | | |
| Revenue (State Police | | | | | | | | |
| Communications System) | | 5.25 | | 10/1/13 | | 1,945,000 | | 2,110,325 |
| Michigan Hospital Finance | | | | | | | | |
| Authority, Revenue (Ascension | | | | | | | | |
| Health Credit Group) | | 5.38 | | 11/15/07 | | 11,500,000 | | 11,761,165 |
| Michigan Hospital Finance | | | | | | | | |
| Authority, Revenue (Oakwood | | | | | | | | |
| Obligation Group) | | 5.50 | | 11/1/11 | | 3,500,000 | | 3,733,975 |
| Michigan Hospital Finance | | | | | | | | |
| Authority, Revenue (Sparrow | | | | | | | | |
| Obligation Group) | | 5.25 | | 11/15/11 | | 2,500,000 | | 2,631,475 |
| Michigan Hospital Finance | | | | | | | | |
| Authority, Revenue (Sparrow | | | | | | | | |
| Obligation Group) | | 5.75 | | 11/15/16 | | 3,250,000 | | 3,463,200 |
| Michigan Municipal Bond Authority, | | | | | | | | |
| Revenue (Drinking Water | | | | | | | | |
| Revolving Fund) | | 5.25 | | 10/1/09 | | 2,370,000 a | | 2,486,746 |
| Minnesota—1.2% | | | | | | | | |
| Lakeville Independent School | | | | | | | | |
| District Number 194, GO | | | | | | | | |
| (Insured; FSA) | | 5.00 | | 2/1/18 | | 5,000,000 | | 5,245,900 |
| Saint Paul Housing and | | | | | | | | |
| Redevelopment Authority, | | | | | | | | |
| Hospital Facility Revenue | | | | | | | | |
| (HealthEast Project) | | 5.00 | | 11/15/17 | | 3,000,000 | | 2,979,270 |
| Saint Paul Housing and | | | | | | | | |
| Redevelopment Authority, | | | | | | | | |
| Hospital Facility Revenue | | | | | | | | |
| (HealthEast Project) | | 5.75 | | 11/15/21 | | 1,000,000 | | 1,061,970 |
| Mississippi—.2% | | | | | | | | |
| Walnut Grove Correctional | | | | | | | | |
| Authority, COP (Insured; AMBAC) | | 5.50 | | 11/1/07 | | 1,855,000 | | 1,902,469 |
| Missouri—1.6% | | | | | | | | |
| Missouri Development Finance | | | | | | | | |
| Board, Infrastructure | | | | | | | | |
| Facilities Revenue (Branson | | | | | | | | |
| Landing Project) | | 6.00 | | 6/1/20 | | 3,160,000 | | 3,549,186 |
14
| Long-Term Municipal | | Coupon | | Maturity | | Principal | | |
| Investments (continued) | | Rate (%) | | Date | | Amount ($) | | Value ($) |
| |
| |
| |
| |
|
| Missouri (continued) | | | | | | | | |
| Missouri Health and Educational | | | | | | |
| Facilities Authority, Revenue | | | | | | | | |
| (SSM Health Care) | | 5.00 | | 6/1/07 | | 2,940,000 | | 2,975,398 |
| Saint Louis, | | | | | | | | |
| Airport Revenue (Airport | | | | | | | | |
| Development Program) | | | | | | | | |
| (Insured; MBIA) | | 5.50 | | 7/1/10 | | 1,435,000 | | 1,531,174 |
| Saint Louis, | | | | | | | | |
| Airport Revenue (Airport | | | | | | | | |
| Development Program) | | | | | | | | |
| (Insured; MBIA) | | 5.50 | | 7/1/10 | | 1,565,000 | | 1,668,055 |
| Saint Louis, | | | | | | | | |
| Airport Revenue (Airport | | | | | | | | |
| Development Program) | | | | | | | | |
| (Insured; MBIA) | | 5.63 | | 7/1/11 | | 2,500,000 a | | 2,714,425 |
| Nevada—1.3% | | | | | | | | |
| Director of the State of Nevada | | | | | | |
| Department of Business and | | | | | | | | |
| Industry, SWDR (Republic | | | | | | | | |
| Services, Inc. Project) | | 5.63 | | 6/1/18 | | 5,000,000 | | 5,425,400 |
| Washoe County, | | | | | | | | |
| Water Facility Revenue | | | | | | | | |
| (Sierra Pacific Power Co.) | | 5.00 | | 7/1/09 | | 5,000,000 | | 5,031,650 |
| New Hampshire—.5% | | | | | | | | |
| New Hampshire Higher Educational | | | | | | |
| and Health Facilities | | | | | | | | |
| Authority, HR (The Cheshire | | | | | | | | |
| Medical Center Issue) | | 5.13 | | 7/1/18 | | 4,125,000 | | 4,177,800 |
| New Jersey—3.7% | | | | | | | | |
| Bayonne, | | | | | | | | |
| TAN | | 5.00 | | 10/13/06 | | 1,000,000 | | 1,002,450 |
| Bayonne, | | | | | | | | |
| TAN | | 5.00 | | 12/11/06 | | 1,500,000 | | 1,503,030 |
| Bayonne, | | | | | | | | |
| Temporary Notes | | 5.00 | | 10/27/06 | | 2,000,000 | | 2,005,400 |
| Camden County Improvement | | | | | | | | |
| Authority, Health Care | | | | | | | | |
| Redevelopment Project Revenue | | | | | | |
| (The Cooper Health System | | | | | | | | |
| Obligated Group Issue) | | 5.25 | | 2/15/20 | | 3,000,000 | | 3,095,130 |
STATEMENT OF INVESTMENTS (continued)
|
| Long-Term Municipal | | Coupon | | Maturity | | Principal | | |
| Investments (continued) | | Rate (%) | | Date | | Amount ($) | | Value ($) |
| |
| |
| |
| |
|
| New Jersey (continued) | | | | | | | | |
| Casino Reinvestment Development | | | | | | | | |
| Authority, Revenue | | | | | | | | |
| (Insured; MBIA) | | 5.25 | | 6/1/19 | | 5,000,000 | | 5,330,250 |
| New Jersey Economic Development | | | | | | | | |
| Authority, Cigarette Tax Revenue | | 5.38 | | 6/15/15 | | 3,300,000 | | 3,521,265 |
| New Jersey Economic Development | | | | | | | | |
| Authority, Cigarette Tax Revenue | | 5.50 | | 6/15/16 | | 1,000,000 | | 1,073,770 |
| New Jersey Educational Facilities | | | | | | | | |
| Authority, Revenue (Rider | | | | | | | | |
| University) (Insured; Radian) | | 5.00 | | 7/1/10 | | 1,880,000 | | 1,941,890 |
| New Jersey Educational Facilities | | | | | | | | |
| Authority, Revenue (Rider | | | | | | | | |
| University) (Insured; Radian) | | 5.00 | | 7/1/11 | | 1,970,000 | | 2,045,510 |
| New Jersey Health Care Facilities | | | | | | | | |
| Financing Authority, Revenue | | | | | | | | |
| (South Jersey Hospital) | | 6.00 | | 7/1/12 | | 3,425,000 | | 3,666,462 |
| New Jersey Turnpike Authority, | | | | | | | | |
| Revenue (Insured; MBIA) | | 5.63 | | 1/1/10 | | 3,910,000 a | | 4,162,312 |
| New Mexico—.6% | | | | | | | | |
| Jicarilla, | | | | | | | | |
| Apache Nation Revenue | | 5.00 | | 9/1/11 | | 1,500,000 | | 1,552,485 |
| Jicarilla, | | | | | | | | |
| Apache Nation Revenue | | 5.00 | | 9/1/13 | | 2,905,000 | | 3,000,691 |
| New York—6.4% | | | | | | | | |
| Dutchess County Industrial | | | | | | | | |
| Development Agency, IDR | | | | | | | | |
| (IBM Project) | | 5.45 | | 12/1/09 | | 2,000,000 | | 2,092,980 |
| New York City | | 6.25 | | 8/1/06 | | 640,000 a | | 652,384 |
| New York City | | 5.00 | | 4/1/20 | | 2,500,000 | | 2,591,050 |
| New York City | | 5.00 | | 4/1/22 | | 5,110,000 | | 5,273,520 |
| New York City | | | | | | | | |
| (Insured; FSA) | | 5.00 | | 6/1/16 | | 3,395,000 | | 3,602,808 |
| New York City Industrial | | | | | | | | |
| Development Agency, Special | | | | | | | | |
| Facility Revenue (American | | | | | | | | |
| Airlines, Inc. John F. Kennedy | | | | | | | | |
| International Airport Project) | | 7.13 | | 8/1/11 | | 2,000,000 | | 2,087,660 |
| Long-Term Municipal | | Coupon | | Maturity | | Principal | | |
| Investments (continued) | | Rate (%) | | Date | | Amount ($) | | Value ($) |
| |
| |
| |
| |
|
| New York (continued) | | | | | | | | |
| New York City Industrial | | | | | | | | |
| Development Agency, Special | | | | | | | | |
| Facility Revenue (American | | | | | | | | |
| Airlines, Inc. John F. Kennedy | | | | | | | | |
| International Airport Project) | | 7.50 | | 8/1/16 | | 3,500,000 | | 3,852,835 |
| New York State Dormitory | | | | | | | | |
| Authority, Revenue, State | | | | | | | | |
| University Educational Facilities | | 5.50 | | 5/15/10 | | 2,000,000 | | 2,123,600 |
| New York State Local Government | | | | | | | | |
| Assistance Corporation | | 5.25 | | 4/1/16 | | 3,425,000 | | 3,694,308 |
| New York State Local Government | | | | | | | | |
| Assistance Corporation | | | | | | | | |
| (Insured; FSA) | | 5.25 | | 4/1/16 | | 2,200,000 | | 2,380,334 |
| New York State Power Authority, | | | | | | | | |
| Revenue (Insured; FGIC) | | 5.00 | | 11/15/18 | | 1,225,000 | | 1,298,353 |
| New York State Thruway Authority | | | | | | |
| (Highway and Bridge Trust | | | | | | | | |
| Fund) (Insured; AMBAC) | | 5.67 | | 4/1/18 | | 2,500,000 b,d | | 2,796,050 |
| New York State Thruway Authority, | | | | | | |
| Service Contract Revenue | | | | | | | | |
| (Local Highway and Bridge) | | 5.50 | | 4/1/12 | | 3,950,000 | | 4,284,170 |
| New York State Thruway Authority, | | | | | | |
| Service Contract Revenue | | | | | | | | |
| (Local Highway and Bridge) | | | | | | | | |
| (Insured; XLCA) | | 5.50 | | 4/1/13 | | 5,000,000 | | 5,408,900 |
| New York State Urban Development | | | | | | |
| Corp., Corporate Purpose | | 5.13 | | 7/1/19 | | 2,000,000 | | 2,101,140 |
| New York State Urban Development | | | | | | |
| Corp., Personal Income Tax | | 5.25 | | 3/15/11 | | 1,565,000 | | 1,661,091 |
| Tobacco Settlement Financing Corp. | | | | | | |
| of New York, Asset-Backed | | | | | | | | |
| Revenue Bonds (State | | | | | | | | |
| Contingency Contract Secured) | | 5.50 | | 6/1/18 | | 4,000,000 | | 4,294,120 |
| North Carolina—4.9% | | | | | | | | |
| North Carolina Eastern Municipal | | | | | | | | |
| Power Agency, Power | | | | | | | | |
| System Revenue | | 5.13 | | 1/1/14 | | 3,000,000 | | 3,139,620 |
| | STATEMENT OF INVESTMENTS (continued)
|
| Long-Term Municipal | | Coupon | | Maturity | | Principal | | |
| Investments (continued) | | Rate (%) | | Date | | Amount ($) | | Value ($) |
| |
| |
| |
| |
|
| North Carolina (continued) | | | | | | | | |
| North Carolina Eastern Municipal | | | | | | | | |
| Power Agency, Power | | | | | | | | |
| System Revenue | | 5.00 | | 1/1/21 | | 1,200,000 | | 1,282,728 |
| North Carolina Eastern Municipal | | | | | | | | |
| Power Agency, Power System | | | | | | | | |
| Revenue (Insured; AMBAC) | | 5.00 | | 1/1/20 | | 5,000,000 | | 5,234,350 |
| North Carolina Eastern Municipal | | | | | | | | |
| Power Agency, Power System | | | | | | | | |
| Revenue (Insured; AMBAC) | | 5.25 | | 1/1/20 | | 5,000,000 | | 5,351,400 |
| North Carolina Medical Care | | | | | | | | |
| Commission, Retirement | | | | | | | | |
| Facilities First Mortgage | | | | | | | | |
| Revenue (The United Methodist | | | | | | | | |
| Retirement Homes Project) | | 4.75 | | 10/1/13 | | 1,000,000 | | 1,003,810 |
| North Carolina Medical Care | | | | | | | | |
| Commission, Retirement | | | | | | | | |
| Facilities First Mortgage | | | | | | | | |
| Revenue (The United Methodist | | | | | | | | |
| Retirement Homes Project) | | 5.13 | | 10/1/19 | | 1,250,000 | | 1,273,600 |
| North Carolina Medical Care | | | | | | | | |
| Commission, Revenue (FHA | | | | | | | | |
| Insured Mortgage-Morehead | | | | | | | | |
| Memorial Hospital) | | | | | | | | |
| (Insured FSA) | | 5.00 | | 11/1/20 | | 5,000,000 | | 5,222,850 |
| North Carolina Municipal Power | | | | | | | | |
| Agency, Electric Revenue | | | | | | | | |
| (Number 1 Catawba) | | | | | | | | |
| (Insured; FSA) | | 5.25 | | 1/1/16 | | 2,540,000 | | 2,716,022 |
| North Carolina Municipal Power | | | | | | | | |
| Agency, Electric Revenue | | | | | | | | |
| (Number 1 Catawba) | | | | | | | | |
| (Insured; FSA) | | 5.25 | | 1/1/17 | | 10,000,000 | | 10,624,700 |
| Raleigh Durham Airport Authority, | | | | | | |
| Airport Revenue (Insured; FGIC) | | 5.25 | | 11/1/12 | | 2,365,000 | | 2,526,624 |
| Ohio—1.9% | | | | | | | | |
| Cuyahoga County, | | | | | | | | |
| Revenue (Cleveland Clinic | | | | | | | | |
| Health System) | | 5.50 | | 1/1/14 | | 4,000,000 | | 4,308,000 |
| Cuyahoga County, | | | | | | | | |
| Revenue (Cleveland Clinic | | | | | | | | |
| Health System) | | 6.00 | | 1/1/17 | | 5,000,000 | | 5,567,350 |
18
| Long-Term Municipal | | Coupon | | Maturity | | Principal | | |
| Investments (continued) | | Rate (%) | | Date | | Amount ($) | | Value ($) |
| |
| |
| |
| |
|
| Ohio (continued) | | | | | | | | |
| Knox County, | | | | | | | | |
| Hospital Facilities Revenue | | | | | | | | |
| (Knox Community Hospital) | | | | | | | | |
| (Insured; Radian) | | 5.00 | | 6/1/12 | | 1,500,000 | | 1,555,170 |
| Ohio Higher Educational Facility | | | | | | | | |
| Commission, Higher Educational | | | | | | |
| Facility Revenue (Xavier University | | | | | | |
| Project) (Insured; CIFG) | | 5.25 | | 5/1/20 | | 3,230,000 | | 3,471,443 |
| Oklahoma—.3% | | | | | | | | |
| Oklahoma Development Finance | | | | | | | | |
| Authority, LR (Oklahoma State | | | | | | | | |
| System Higher Education) | | 4.00 | | 6/1/07 | | 1,020,000 | | 1,023,407 |
| Oklahoma Development Finance | | | | | | | | |
| Authority, LR (Oklahoma State | | | | | | | | |
| System Higher Education) | | 4.00 | | 6/1/08 | | 1,060,000 | | 1,065,671 |
| Oregon—1.2% | | | | | | | | |
| Gilliam County, | | | | | | | | |
| SWDR | | 4.15 | | 5/1/09 | | 3,400,000 | | 3,390,956 |
| Washington County Unified Sewer | | | | | | |
| Agency, Sewer Revenue | | | | | | | | |
| (Insured; FGIC) | | 5.75 | | 10/1/12 | | 5,670,000 | | 6,270,056 |
| Pennsylvania—7.4% | | | | | | | | |
| Allegheny County, | | | | | | | | |
| Airport Revenue (Pittsburgh | | | | | | | | |
| International Airport) | | | | | | | | |
| (Insured; MBIA) | | 5.75 | | 1/1/11 | | 5,000,000 | | 5,342,400 |
| Allegheny County Industrial | | | | | | | | |
| Development Authority, PCR | | | | | | | | |
| (Insured; AMBAC) | | 4.05 | | 9/1/11 | | 4,000,000 | | 4,045,680 |
| Delaware County Industrial | | | | | | | | |
| Development Authority | | | | | | | | |
| (Resource Recovery Facility) | | 6.10 | | 7/1/13 | | 8,000,000 | | 8,341,760 |
| Delaware River Joint Toll Bridge | | | | | | | | |
| Commission, Bridge Revenue | | 5.25 | | 7/1/13 | | 2,500,000 | | 2,683,050 |
| Delaware Valley Regional | | | | | | | | |
| Finance Authority, Local | | | | | | | | |
| Government Revenue | | 5.75 | | 7/1/17 | | 6,830,000 | | 7,587,310 |
| Erie County Hospital Authority, | | | | | | | | |
| Revenue (Hamot Health | | | | | | | | |
| Foundation) (Insured; AMBAC) | | 5.38 | | 5/15/10 | | 2,340,000 | | 2,402,993 |
| | STATEMENT OF INVESTMENTS (continued)
|
| Long-Term Municipal | | Coupon | | Maturity | | Principal | | |
| Investments (continued) | | Rate (%) | | Date | | Amount ($) | | Value ($) |
| |
| |
| |
| |
|
| Pennsylvania (continued) | | | | | | | | |
| Erie County Industrial Development | | | | | | |
| Authority, EIR (International | | | | | | | | |
| Paper Co. Project) | | 5.25 | | 9/1/10 | | 2,100,000 | | 2,169,594 |
| Montgomery County Higher Education | | | | | | |
| and Health Authority, HR | | | | | | | | |
| (Abington Memorial) | | | | | | | | |
| (Insured; AMBAC) | | 6.10 | | 6/1/12 | | 5,000,000 | | 5,554,350 |
| Montgomery County Industrial | | | | | | | | |
| Development Authority, | | | | | | | | |
| Mortgage Revenue (Whitemarsh | | | | | | |
| Continuing Care) | | 6.00 | | 2/1/21 | | 5,000,000 | | 5,254,450 |
| Pennsylvania Higher Educational | | | | | | |
| Facilities Authority | | | | | | | | |
| (UPMC Health System) | | 6.25 | | 1/15/15 | | 3,660,000 | | 4,011,140 |
| Rose Tree Media School District | | | | | | |
| (Insured; FSA) | | 5.25 | | 2/1/18 | | 5,900,000 | | 6,332,647 |
| Sayre Health Care Facilities | | | | | | | | |
| Authority, Revenue | | | | | | | | |
| (Guthrie Health) | | 6.00 | | 12/1/12 | | 2,000,000 | | 2,181,620 |
| State Public School Building | | | | | | | | |
| Authority, School LR (Colonial | | | | | | |
| Intermediate Unit) | | | | | | | | |
| (Insured; FGIC) | | 5.25 | | 5/15/19 | | 2,175,000 | | 2,333,036 |
| Rhode Island—1.3% | | | | | | | | |
| Rhode Island Health and | | | | | | | | |
| Educational Building Corp., | | | | | | | | |
| Health Facilities Revenue | | | | | | | | |
| (San Antoine) | | 5.50 | | 11/15/09 | | 2,725,000 | | 2,812,827 |
| Rhode Island Health and | | | | | | | | |
| Educational Building Corp., | | | | | | | | |
| Hospital Financing Revenue | | | | | | | | |
| (Lifespan Obligation Group | | | | | | | | |
| Issue) (Insured; MBIA) | | 5.75 | | 5/15/07 | | 5,000,000 a | | 5,196,400 |
| Rhode Island Health and | | | | | | | | |
| Educational Building Corp., | | | | | | | | |
| Hospital Financing Revenue | | | | | | | | |
| (Lifespan Obligation Group | | | | | | | | |
| Issue) (Insured; MBIA) | | 5.75 | | 5/15/08 | | 560,000 | | 581,347 |
| Rhode Island Health and | | | | | | | | |
| Educational Building Corp., | | | | | | | | |
| Revenue (Roger Williams | | | | | | | | |
| University) (Insured; Radian) | | 5.00 | | 11/15/21 | | 1,360,000 | | 1,392,259 |
20
| Long-Term Municipal | | Coupon | | Maturity | | Principal | | |
| Investments (continued) | | Rate (%) | | Date | | Amount ($) | | Value ($) |
| |
| |
| |
| |
|
| South Carolina—3.3% | | | | | | | | |
| Anderson County, | | | | | | | | |
| IDR (Federal Paper Board) | | 4.75 | | 8/1/10 | | 4,520,000 | | 4,550,736 |
| Berkeley County School District, | | | | | | | | |
| Installment Purchase Revenue | | | | | | | | |
| (Securing Assets for Education) | | 5.25 | | 12/1/21 | | 9,395,000 | | 9,718,470 |
| Charleston Educational Excellence | | | | | | | | |
| Financing Corp., Installment | | | | | | | | |
| Purchase Revenue (Charleston | | | | | | | | |
| County School District, South | | | | | | | | |
| Carolina Project) | | 5.25 | | 12/1/21 | | 5,000,000 | | 5,271,500 |
| Dorchester County School District | | | | | | | | |
| Number 002, Installment | | | | | | | | |
| Purpose Revenue (Growth Remedy | | | | | | | | |
| Opportunity Tax Hike) | | 5.25 | | 12/1/21 | | 5,000,000 | | 5,203,700 |
| Hilton Head Island Public | | | | | | | | |
| Facilities Corp., COP | | | | | | | | |
| (Insured; AMBAC) | | 5.00 | | 3/1/13 | | 1,065,000 | | 1,127,068 |
| Tennessee—2.1% | | | | | | | | |
| Johnson City Health and | | | | | | | | |
| Educational Facility Board, HR | | | | | | | | |
| (Medical Center Hospital | | | | | | | | |
| Improvement) (Insured; MBIA) | | 5.13 | | 7/1/11 | | 6,720,000 | | 7,004,659 |
| Tennessee Housing Development | | | | | | | | |
| Agency (Homeownership Program) | | 5.20 | | 7/1/10 | | 1,815,000 | | 1,871,882 |
| Tennessee Housing Development | | | | | | | | |
| Agency (Homeownership Program) | | 5.30 | | 7/1/11 | | 2,140,000 | | 2,208,287 |
| The Health, Educational and | | | | | | | | |
| Housing Facility Board of | | | | | | | | |
| Shelby County, Revenue | | | | | | | | |
| (Baptist Memorial Health Care) | | 5.00 | | 10/1/08 | | 5,000,000 | | 5,112,850 |
| Texas—7.6% | | | | | | | | |
| Alliance Airport Authority Inc., | | | | | | | | |
| Special Facilities Revenue | | | | | | | | |
| (Federal Express Corp. Project) | | 4.85 | | 4/1/21 | | 6,375,000 | | 6,314,119 |
| Bexar County, | | | | | | | | |
| Revenue (Venue) (Insured; MBIA) | | 5.75 | | 8/15/13 | | 5,000,000 | | 5,359,300 |
| Cities of Dallas and Fort Worth, | | | | | | | | |
| Dallas/Fort Worth | | | | | | | | |
| International Airport, | | | | | | | | |
| Facility Improvement Corp. | | | | | | | | |
| Revenue (Bombardier Inc.) | | 6.15 | | 1/1/16 | | 4,000,000 | | 4,039,400 |
STATEMENT OF INVESTMENTS (continued)
|
| Long-Term Municipal | | Coupon | | Maturity | | Principal | | |
| Investments (continued) | | Rate (%) | | Date | | Amount ($) | | Value ($) |
| |
| |
| |
| |
|
| Texas (continued) | | | | | | | | |
| Cypress-Fairbanks Independent | | | | | | | | |
| School District, Schoolhouse | | | | | | | | |
| (Permanent School | | | | | | | | |
| Fund Guaranteed) | | 6.75 | | 2/15/10 | | 1,700,000 a | | 1,875,712 |
| Gulf Coast Waste Disposal | | | | | | | | |
| Authority, Revenue (Bayport | | | | | | | | |
| Area System) (Insured; AMBAC) | | 5.00 | | 10/1/14 | | 2,065,000 | | 2,192,720 |
| Harris County Health Facilities | | | | | | | | |
| Development Corp., HR | | | | | | | | |
| (Memorial Hermann Hospital | | | | | | | | |
| System) (Insured; FSA) | | 5.50 | | 6/1/12 | | 8,295,000 | | 8,933,217 |
| Houston, | | | | | | | | |
| Combined Utility System, First | | | | | | | | |
| Lien Revenue (Insured; FSA) | | 5.25 | | 11/15/17 | | 5,000,000 | | 5,443,050 |
| Houston, | | | | | | | | |
| Combined Utility System, First | | | | | | | | |
| Lien Revenue (Insured; MBIA) | | 5.25 | | 5/15/12 | | 2,750,000 | | 2,947,807 |
| Lewisville, | | | | | | | | |
| Combination Tax and Revenue | | | | | | | | |
| Certificates of Obligation | | | | | | | | |
| (Insured; MBIA) | | 5.25 | | 2/15/20 | | 1,230,000 | | 1,307,527 |
| Lower Colorado River Authority, | | | | | | | | |
| Transmission Contract Revenue | | | | | | | | |
| (LCRA Transmission Services | | | | | | | | |
| Corp. Project) (Insured; FGIC) | | 5.00 | | 5/15/20 | | 4,200,000 | | 4,319,490 |
| Port Corpus Christi Industrial | | | | | | | | |
| Development Corp., | | | | | | | | |
| Revenue (Valero) | | 5.13 | | 4/1/09 | | 2,250,000 | | 2,337,345 |
| Port Corpus Christi Industrial | | | | | | | | |
| Development Corp., | | | | | | | | |
| Revenue (Valero) | | 5.40 | | 4/1/18 | | 1,500,000 | | 1,560,150 |
| Tarrant County Health Facilities | | | | | | | | |
| Development Corp., Health | | | | | | | | |
| Resources System Revenue | | | | | | | | |
| (Insured; MBIA) | | 5.75 | | 2/15/14 | | 5,000,000 | | 5,507,050 |
| Tarrant County Health Facilities | | | | | | | | |
| Development Corp., Health | | | | | | | | |
| System Revenue (Harris | | | | | | | | |
| Methodist Health System) | | 6.00 | | 9/1/10 | | 7,725,000 | | 8,262,969 |
| Texas Municipal Power Agency, | | | | | | | | |
| Revenue (Insured; AMBAC) | | 0.00 | | 9/1/09 | | 170,000 | | 150,185 |
| Long-Term Municipal | | Coupon | | Maturity | | Principal | | |
| Investments (continued) | | Rate (%) | | Date | | Amount ($) | | Value ($) |
| |
| |
| |
| |
|
| Utah—3.1% | | | | | | | | |
| Carbon County, | | | | | | | | |
| Solid Waste Disposal Facility | | | | | | | | |
| Revenue (Sunnyside Cogeneration | | | | | | |
| Associates Project) | | 6.38 | | 8/15/11 | | 8,450,000 | | 8,575,736 |
| Jordanelle Special Service | | | | | | | | |
| District (Special Assessment | | | | | | | | |
| Improvement District) | | 8.00 | | 10/1/11 | | 4,475,000 | | 4,645,587 |
| Orem, | | | | | | | | |
| Sales Tax Revenue | | | | | | | | |
| (Insured; AMBAC) | | 5.00 | | 4/15/18 | | 3,325,000 | | 3,480,510 |
| Utah Building Ownershiip | | | | | | | | |
| Authority, LR (State Facilities | | | | | | | | |
| Master Lease Program) | | 5.00 | | 5/15/17 | | 2,950,000 | | 3,081,364 |
| Utah County, | | | | | | | | |
| EIR (USX Corp. Project) | | 5.05 | | 11/1/11 | | 4,480,000 | | 4,702,925 |
| Virginia—3.3% | | | | | | | | |
| Arlington County Industrial | | | | | | | | |
| Development Authority, RRR | | | | | | | | |
| (Ogden Martin System of | | | | | | | | |
| Alexandria/Arlington Inc. | | | | | | | | |
| Project) (Insured; FSA) | | 5.38 | | 1/1/12 | | 2,530,000 | | 2,610,277 |
| Greater Richmond Convention | | | | | | | | |
| Center Authority, Hotel Tax | | | | | | | | |
| Revenue (Convention Center | | | | | | | | |
| Expansion Project) | | 6.00 | | 6/15/10 | | 2,000,000 a | | 2,185,560 |
| Newport News, | | | | | | | | |
| GO General Improvement Water | | 5.25 | | 2/1/16 | | 5,575,000 | | 6,078,869 |
| Peninsula Ports Authority, | | | | | | | | |
| Revenue (Port Facility-CSX | | | | | | | | |
| Transportation Project) | | 6.00 | | 12/15/12 | | 4,150,000 | | 4,524,911 |
| Tobacco Settlement Financing Corp. | | | | | | |
| of Virginia, Tobacco | | | | | | | | |
| Settlement Asset-Backed Bonds | | 4.00 | | 6/1/13 | | 6,590,000 | | 6,575,634 |
| Tobacco Settlement Financing Corp. | | | | | | |
| of Virginia, Tobacco | | | | | | | | |
| Settlement Asset-Backed Bonds | | 5.25 | | 6/1/19 | | 3,000,000 | | 3,044,040 |
| Virginia College Building | | | | | | | | |
| Authority, Educational Facilities | | | | | | | | |
| Revenue (Hampden-Sydney | | | | | | | | |
| College Project) | | 5.00 | | 9/1/16 | | 1,000,000 | | 1,023,730 |
STATEMENT OF INVESTMENTS (continued)
|
| Long-Term Municipal | | Coupon | | Maturity | | Principal | | |
| Investments (continued) | | Rate (%) | | Date | | Amount ($) | | Value ($) |
| |
| |
| |
| |
|
| Washington—2.6% | | | | | | | | |
| Energy Northwest, | | | | | | | | |
| Columbia Generating Station | | | | | | | | |
| Electric Revenue | | 5.00 | | 7/1/23 | | 5,000,000 | | 5,210,950 |
| Energy Northwest, | | | | | | | | |
| Wind Project Revenue | | 5.60 | | 1/1/07 | | 2,530,000 a | | 2,632,819 |
| Goat Hill Properties, | | | | | | | | |
| LR (Government Office Building | | | | | | | | |
| Project) (Insured; MBIA) | | 5.25 | | 12/1/20 | | 2,710,000 | | 2,868,941 |
| Seattle Municipal Light and Power, | | | | | | | | |
| Revenue (Insured; FSA) | | 5.25 | | 3/1/10 | | 50,000 | | 52,571 |
| Seattle Municipal Light and Power, | | | | | | | | |
| Revenue (Insured; FSA) | | 6.91 | | 3/1/10 | | 6,500,000 b,d | | 7,168,525 |
| Washington | | 5.75 | | 10/1/12 | | 20,000 | | 21,642 |
| Washington | | 5.75 | | 10/1/12 | | 2,305,000 | | 2,476,676 |
| West Virginia—.4% | | | | | | | | |
| West Virginia Economic Development | | | | | | |
| Authority, LR (Department of | | | | | | | | |
| Environmental Protection) | | 5.50 | | 11/1/22 | | 2,895,000 | | 3,141,336 |
| Wisconsin—.6% | | | | | | | | |
| Racine, | | | | | | | | |
| SWDR (Republic Services Project) | | 3.25 | | 4/1/09 | | 1,000,000 | | 965,250 |
| Wisconsin Health and Educational | | | | | | | | |
| Facilities Authority, Revenue | | | | | | | | |
| (Aurora Medical Group, Inc.) | | | | | | | | |
| (Insured; FSA) | | 6.00 | | 11/15/11 | | 3,500,000 | | 3,849,860 |
| U.S. Related—1.5% | | | | | | | | |
| Children’s Trust Fund of Puerto | | | | | | | | |
| Rico, Tobacco Settlement | | | | | | | | |
| Asset-Backed Bonds | | 5.75 | | 7/1/10 | | 5,000,000 a | | 5,385,950 |
| Children’s Trust Fund of Puerto | | | | | | | | |
| Rico, Tobacco Settlement | | | | | | | | |
| Asset-Backed Bonds | | 5.75 | | 7/1/10 | | 3,300,000 a | | 3,554,727 |
| Children’s Trust Fund of Puerto | | | | | | | | |
| Rico, Tobacco Settlement | | | | | | | | |
| Asset-Backed Bonds | | 5.75 | | 7/1/10 | | 2,500,000 | | 2,692,975 |
| Total Long-Term Municipal Investments | | | | | | |
| (cost $766,501,927) | | | | | | | | 773,931,427 |
| Short-Term Municipal | | Coupon | | Maturity | | Principal | | |
| Investments—.5% | | Rate (%) | | Date | | Amount ($) | | Value ($) |
| |
| |
| |
| |
|
| Pennsylvania—.1% | | | | | | | | |
| Schuylkill County Industrial | | | | | | | | |
| Development Authority, RRR | | | | | | |
| (Northeastern Power Co. Project) | | | | | | |
| (LOC; Dexia Credit Locale) | | 3.55 | | 6/1/06 | | 1,000,000 e | | 1,000,000 |
| U.S. Related—.4% | | | | | | | | |
| Government Development Bank of | | | | | | |
| Puerto Rico, CP | | 4.65 | | 6/1/06 | | 3,000,000 | | 3,000,030 |
| Total Short-Term Municipal Investments | | | | | | |
| (cost $4,000,000) | | | | | | | | 4,000,030 |
| |
| |
| |
| |
|
| |
| Total Investments (cost $770,501,927) | | | | 98.6% | | 777,931,457 |
| Cash and Receivables (Net) | | | | | | 1.4% | | 11,445,579 |
| Net Assets | | | | | | 100.0% | | 789,377,036 |
| a These securities are prerefunded; the date shown represents the prerefunded date. Bonds which are prerefunded are |
| collateralized by U.S. Government securities which are held in escrow and are used to pay principal and interest on |
| the municipal issue and to retire the bonds in full at the earliest refunding date. |
| b Securities exempt from registration under Rule 144A of the Securities Act of 1933.These securities may be resold in |
| transactions exempt from registration, normally to qualified institutional buyers. At May 31, 2006, these securities |
| amounted to $11,001,525 or 1.4% of net assets. |
| c Zero coupon until a specified date at which time the stated coupon rate becomes effective until maturity. |
| d Inverse floater security—the interest rate is subject to change periodically. |
| e Securities payable on demand.Variable interest rate—subject to periodic change. |
STATEMENT OF INVESTMENTS (continued)
|
| Summary of Abbreviations | | | | |
| |
| ACA | | American Capital Access | | AGC | | ACE Guaranty Corporation |
| AGIC | | Asset Guaranty Insurance | | AMBAC | | American Municipal Bond |
| | | Company | | | | Assurance Corporation |
| ARRN | | Adjustable Rate Receipt Notes | | BAN | | Bond Anticipation Notes |
| BIGI | | Bond Investors Guaranty Insurance | | BPA | | Bond Purchase Agreement |
| CGIC | | Capital Guaranty Insurance | | CIC | | Continental Insurance |
| | | Company | | | | Company |
| CIFG | | CDC Ixis Financial Guaranty | | CMAC | | Capital Market Assurance |
| | | | | | | Corporation |
| COP | | Certificate of Participation | | CP | | Commercial Paper |
| EDR | | Economic Development Revenue | | EIR | | Environmental Improvement |
| | | | | | | Revenue |
| FGIC | | Financial Guaranty Insurance | | | | |
| | | Company | | FHA | | Federal Housing Administration |
| FHLB | | Federal Home Loan Bank | | FHLMC | | Federal Home Loan Mortgage |
| | | | | | | Corporation |
| FNMA | | Federal National | | | | |
| | | Mortgage Association | | FSA | | Financial Security Assurance |
| GAN | | Grant Anticipation Notes | | GIC | | Guaranteed Investment Contract |
| GNMA | | Government National | | | | |
| | | Mortgage Association | | GO | | General Obligation |
| HR | | Hospital Revenue | | IDB | | Industrial Development Board |
| IDC | | Industrial Development Corporation | | IDR | | Industrial Development Revenue |
| LOC | | Letter of Credit | | LOR | | Limited Obligation Revenue |
| LR | | Lease Revenue | | MBIA | | Municipal Bond Investors |
| | | | | | | Assurance Insurance |
| | | | | | | Corporation |
| MFHR | | Multi-Family Housing Revenue | | MFMR | | Multi-Family Mortgage Revenue |
| PCR | | Pollution Control Revenue | | RAC | | Revenue Anticipation |
| | | | | | | Certificates |
| RAN | | Revenue Anticipation Notes | | RAW | | Revenue Anticipation Warrants |
| RRR | | Resources Recovery Revenue | | SAAN | | State Aid Anticipation Notes |
| SBPA | | Standby Bond Purchase Agreement | | SFHR | | Single Family Housing Revenue |
| SFMR | | Single Family Mortgage Revenue | | SONYMA | | State of New York Mortgage |
| | | | | | | Agency |
| SWDR | | Solid Waste Disposal Revenue | | TAN | | Tax Anticipation Notes |
| TAW | | Tax Anticipation Warrants | | TRAN | | Tax and Revenue |
| | | | | | | Anticipation Notes |
| XLCA | | XL Capital Assurance | | | | |
| Summary of Combined Ratings (Unaudited) | | |
| |
| Fitch | | or Moody’s | | or | | Standard & Poor’s | | Value (%) † |
| |
| |
| |
| |
|
| AAA | | Aaa | | | | AAA | | 49.1 |
| AA | | Aa | | | | AA | | 16.8 |
| A | | | | A | | | | A | | 13.7 |
| BBB | | Baa | | | | BBB | | 12.0 |
| BB | | Ba | | | | BB | | 2.3 |
| B | | | | B | | | | B | | .8 |
| F1 | | MIG1/P1 | | | | SP1/A1 | | .1 |
| Not Rated f | | Not Rated f | | | | Not Rated f | | 5.2 |
| | | | | | | | | | | 100.0 |
| |
| † | | Based on total investments. | | | | | | |
| f | | Securities which, while not rated by Fitch, Moody’s and Standard & Poor’s, have been determined by the Manager to |
| | | be of comparable quality to those rated securities in which the fund may invest. | | |
| See notes to financial statements. | | | | | | |
| STATEMENT OF ASSETS AND LIABILITIES |
| May 31, 2006 |
| | | Cost | | Value |
| |
| |
|
| Assets ($): | | | | |
| Investments in securities—See Statement of Investments | | 770,501,927 | | 777,931,457 |
| Interest receivable | | | | 12,721,287 |
| Receivable for shares of Common Stock subscribed | | | | 3,708 |
| Prepaid expenses | | | | 24,221 |
| | | | | 790,680,673 |
| |
| |
|
| Liabilities ($): | | | | |
| Due to The Dreyfus Corporation and affiliates—Note 3(b) | | | | 447,331 |
| Cash overdraft due to Custodian | | | | 34,898 |
| Payable for shares of Common Stock redeemed | | | | 726,247 |
| Accrued expenses | | | | 95,161 |
| | | | | 1,303,637 |
| |
| |
|
| Net Assets ($) | | | | 789,377,036 |
| |
| |
|
| Composition of Net Assets ($): | | | | |
| Paid-in capital | | | | 787,388,207 |
| Accumulated net realized gain (loss) on investments | | | | (5,440,701) |
| Accumulated net unrealized appreciation | | | | |
| (depreciation) on investments | | | | 7,429,530 |
| |
| |
|
| Net Assets ($) | | | | 789,377,036 |
| |
| |
|
| Shares Outstanding | | | | |
| (300 million shares of $.001 par value Common Stock authorized) | | 59,903,877 |
| Net Asset Value, offering and redemption price per share—Note 3(d) ($) | | 13.18 |
See notes to financial statements.
|
| STATEMENT OF OPERATIONS |
| Year Ended May 31, 2006 |
| Investment Income ($): | | |
| Interest Income | | 36,980,776 |
| Expenses: | | |
| Management fee—Note 3(a) | | 4,997,739 |
| Shareholder servicing costs—Note 3(b) | | 869,919 |
| Custodian fees | | 70,847 |
| Professional fees | | 69,223 |
| Directors’ fees and expenses—Note 3(c) | | 48,281 |
| Prospectus and shareholders’ reports | | 26,962 |
| Registration fees | | 25,244 |
| Loan commitment fees—Note 2 | | 6,684 |
| Miscellaneous | | 57,295 |
| Total Expenses | | 6,172,194 |
| Less—reduction in management fee | | |
| due to undertaking—Note 3(a) | | (6,924) |
| Less—reduction in custody fees | | |
| due to earnings credits—Note 1(b) | | (31,985) |
| Net Expenses | | 6,133,285 |
| Investment Income—Net | | 30,847,491 |
| |
|
| Realized and Unrealized Gain (Loss) on Investments—Note 4 ($): |
| Net realized gain (loss) on investments | | 2,705,421 |
| Net unrealized appreciation (depreciation) on investments | | (23,272,865) |
| Net Realized and Unrealized Gain (Loss) on Investments | | (20,567,444) |
| Net Increase in Net Assets Resulting from Operations | | 10,280,047 |
See notes to financial statements.
|
STATEMENT OF CHANGES IN NET ASSETS
| | | | | Year Ended May 31, |
| |
| |
|
| | | 2006 | | 2005 |
| |
| |
|
| Operations ($): | | | | |
| Investment income—net | | 30,847,491 | | 33,122,188 |
| Net realized gain (loss) on investments | | 2,705,421 | | 6,019,863 |
| Net unrealized appreciation | | | | |
| (depreciation) on investments | | (23,272,865) | | 9,115,808 |
| Net Increase (Decrease) in Net Assets | | | | |
| Resulting from Operations | | 10,280,047 | | 48,257,859 |
| |
| |
|
| Dividends to Shareholders from ($): | | | | |
| Investment income—net | | (30,843,247) | | (33,363,442) |
| |
| |
|
| Capital Stock Transactions ($): | | | | |
| Net proceeds from shares sold | | 32,995,777 | | 51,829,030 |
| Dividends reinvested | | 22,893,560 | | 24,633,027 |
| Cost of shares redeemed | | (118,987,218) | | (122,535,096) |
| Increase (Decrease) in Net Assets | | | | |
| from Capital Stock Transactions | | (63,097,881) | | (46,073,039) |
| Total Increase (Decrease) in Net Assets | | (83,661,081) | | (31,178,622) |
| |
| |
|
| Net Assets ($): | | | | |
| Beginning of Period | | 873,038,117 | | 904,216,739 |
| End of Period | | 789,377,036 | | 873,038,117 |
| |
| |
|
| Capital Share Transactions (Shares): | | | | |
| Shares sold | | 2,475,627 | | 3,840,582 |
| Shares issued for dividends reinvested | | 1,717,414 | | 1,826,980 |
| Shares redeemed | | (8,932,879) | | (9,087,026) |
| Net Increase (Decrease) in Shares Outstanding | | (4,739,838) | | (3,419,464) |
See notes to financial statements.
|
FINANCIAL HIGHLIGHTS
The following table describes the performance for the fiscal periods indicated. Total return shows how much your investment in the fund would have increased (or decreased) during each period, assuming you had reinvested all dividends and distributions.These figures have been derived from the fund’s financial statements.
| | | | | Year Ended May 31, | | |
| |
| |
| |
|
| | | 2006 | | 2005 | | 2004 | | 2003 | | 2002 |
| |
| |
| |
| |
| |
|
| Per Share Data ($): | | | | | | | | | | |
| Net asset value, beginning of period | | 13.51 | | 13.28 | | 13.91 | | 13.42 | | 13.51 |
| Investment Operations: | | | | | | | | | | |
| Investment income—net a | | .49 | | .50 | | .52 | | .57 | | .64 |
| Net realized and unrealized | | | | | | | | | | |
| gain (loss) on investments | | (.33) | | .23 | | (.63) | | .49 | | (.09) |
| Total from Investment Operations | | .16 | | .73 | | (.11) | | 1.06 | | .55 |
| Distributions: | | | | | | | | | | |
| Dividends from investment income—net | | (.49) | | (.50) | | (.52) | | (.57) | | (.64) |
| Net asset value, end of period | | 13.18 | | 13.51 | | 13.28 | | 13.91 | | 13.42 |
| |
| |
| |
| |
| |
|
| Total Return (%) | | 1.23 | | 5.59 | | (.81) | | 8.09 | | 4.14 |
| |
| |
| |
| |
| |
|
| Ratios/Supplemental Data (%): | | | | | | | | | | |
| Ratio of total expenses | | | | | | | | | | |
| to average net assets | | .74 | | .73 | | .74 | | .74 | | .74 |
| Ratio of net expenses | | | | | | | | | | |
| to average net assets | | .74 | | .73 | | .74 | | .74 | | .74 |
| Ratio of net investment income | | | | | | | | | | |
| to average net assets | | 3.70 | | 3.70 | | 3.86 | | 4.23 | | 4.74 |
| Portfolio Turnover Rate | | 28.51 | | 37.33 | | 35.07 | | 41.30 | | 27.32 |
| |
| |
| |
| |
| |
|
| Net Assets, end of period ($ x 1,000) | | 789,377 | | 873,038 | | 904,217 1,047,7521,057,999 |
| a Based on average shares outstanding at each month end. |
| See notes to financial statements. |
NOTES TO FINANCIAL STATEMENTS
NOTE 1—Significant Accounting Policies:
Dreyfus Intermediate Municipal Bond Fund, Inc. (the “fund”) is registered under the Investment Company Act of 1940, as amended (the “Act”), as a diversified open-end management investment company. The fund’s investment objective is to provide the maximum amount of current income exempt from federal income tax as is consistent with the preservation of capital.The Dreyfus Corporation (the “Manager” or “Dreyfus”) serves as the fund’s investment adviser. The Manager is a wholly-owned subsidiary of Mellon Financial Corporation (“Mellon Financial”). Dreyfus Service Corporation (the “Distributor”), a wholly-owned subsidiary of the Manager, is the distributor of the fund’s shares, which are sold to the public without a sales charge.
The fund’s financial statements are prepared in accordance with U.S. generally accepted accounting principles, which may require the use of management estimates and assumptions. Actual results could differ from those estimates.
The fund enters into contracts that contain a variety of indemnifications. The fund’s maximum exposure under these arrangements is unknown.The fund does not anticipate recognizing any loss related to these arrangements.
(a) Portfolio valuation: Investments in securities are valued each business day by an independent pricing service (the “Service”) approved by the Board of Directors. Investments for which quoted bid prices are readily available and are representative of the bid side of the market in the judgment of the Service are valued at the mean between the quoted bid prices (as obtained by the Service from dealers in such securities) and asked prices (as calculated by the Service based upon its evaluation of the market for such securities). Other investments (which constitute a majority of the portfolio securities) are carried at fair value as determined by the Service, based on methods which include consideration of: yields or prices of municipal securities of comparable quality, coupon, maturity and type; indications as to values from dealers; and general market conditions. Options and financial futures on municipal
and U.S.Treasury securities are valued at the last sales price on the securities exchange on which such securities are primarily traded or at the last sales price on the national securities market on each business day.
(b) Securities transactions and investment income: Securities transactions are recorded on a trade date basis. Realized gain and loss from securities transactions are recorded on the identified cost basis. Interest income, adjusted for accretion of discount and amortization of premium on investments, is earned from settlement date and recognized on the accrual basis. Securities purchased or sold on a when-issued or delayed-delivery basis may be settled a month or more after the trade date.
The fund has an arrangement with the custodian bank whereby the fund receives earnings credits from the custodian when positive cash balances are maintained, which are used to offset custody fees. For financial reporting purposes, the fund includes net earnings credits as an expense offset in the Statement of Operations.
(c) Dividends to shareholders: It is the policy of the fund to declare dividends daily from investment income-net. Such dividends are paid monthly. Dividends from net realized capital gain, if any, are normally declared and paid annually, but the fund may make distributions on a more frequent basis to comply with the distribution requirements of the Internal Revenue Code of 1986, as amended (the “Code”).To the extent that net realized capital gain can be offset by capital loss carryovers, it is the policy of the fund not to distribute such gain. Income and capital gain distributions are determined in accordance with income tax regulations, which may differ from U.S. generally accepted accounting principles.
(d) Federal income taxes: It is the policy of the fund to continue to qualify as a regulated investment company, which can distribute tax exempt dividends, by complying with the applicable provisions of the Code, and to make distributions of income and net realized capital gain sufficient to relieve it from substantially all federal income and excise taxes.
NOTES TO FINANCIAL STATEMENTS (continued)
|
At May 31,2006,the components of accumulated earnings on a tax basis were as follows: undistributed tax exempt income $431,712, undistributed ordinary income $126,742, accumulated capital losses $5,569,111 and unrealized appreciation $7,431,198.
The accumulated capital loss carryover is available to be applied against future net securities profits, if any, realized subsequent to May 31, 2006. If not applied, the carryover expires in fiscal 2011.
The tax character of distributions paid to shareholders during the fiscal year ended May 31, 2006 and May 31, 2005 were as follows: tax exempt income $30,843,247 and $33,363,442 respectively.
During the period ended May 31, 2006, as a result of permanent book to tax differences, primarily due to the tax treatment for amortization adjustments, the fund decreased accumulated undistributed investment income-net by $4,244, increased accumulated net realized gain (loss) on investments by $128,410 and decreased paid-in capital by $124,166. Net assets were not affected by this reclassification.
NOTE 2—Bank Line of Credit:
The fund participates with other Dreyfus-managed funds in a $350 million redemption credit facility (the “Facility”) to be utilized for temporary or emergency purposes, including the financing of redemptions. In connection therewith, the fund has agreed to pay commitment fees on its pro rata portion of the Facility. Interest is charged to the fund based on prevailing market rates in effect at the time of borrowing. During the period ended May 31, 2006, the fund did not borrow under the Facility.
NOTE 3—Management Fee and Other Transactions With Affiliates:
(a) Pursuant to a management agreement (“Agreement”) with the Manager, the management fee is computed at the annual rate of .60% of the value of the fund’s average daily net assets and is payable monthly. The Manager has undertaken from June 1, 2005 through May 31, 2006
to reduce the management fee paid by the fund, to the extent that the fund’s aggregate annual expenses, exclusive of taxes, brokerage fees, interest on borrowings, commitment fees and extraordinary expenses, exceed an annual rate of .75% of the value of the fund’s average daily net assets.The reduction in management fee, pursuant to the undertaking, amounted to $6,924 during the period ended May 31, 2006.
(b) Under the Shareholder Services Plan, the fund reimburses the Distributor an amount not to exceed an annual rate of .25% of the value of the fund’s average daily net assets for certain allocated expenses of providing personal services and/or maintaining shareholder accounts.The services provided may include personal services relating to shareholder accounts, such as answering shareholder inquires regarding the fund and providing reports and other information, and services related to the maintenance of shareholder accounts. During the period ended May 31, 2006, the fund was charged $476,686 pursuant to the Shareholder Services Plan.
The fund compensates Dreyfus Transfer, Inc., a wholly-owned subsidiary of the Manager, under a transfer agency agreement for providing personnel and facilities to perform transfer agency services for the fund. During the period ended May 31, 2006, the fund was charged $277,868 pursuant to the transfer agency agreement.
During the period ended May 31, 2006, the fund was charged $3,829 for services performed by the Chief Compliance Officer.
The components of Due to The Dreyfus Corporation and affiliates in the Statement of Assets and Liabilities consist of: management fees $402,761, chief compliance officer fees $1,605 and transfer agency per account fees $44,600, which are offset against an expense reimbursement currently in effect in the amount of $1,635.
(c) Each Board member also serves as a Board member of other funds within the Dreyfus complex. Annual retainer fees and attendance fees are allocated to each fund based on net assets.
NOTES TO FINANCIAL STATEMENTS (continued)
|
(d) A .10% redemption fee is charged and retained by the fund on certain shares redeemed within thirty days following the date of their issuance, including redemptions made through the use of the fund’s exchange privilege. During the period ended May 31, 2006, redemption fees charged and retained by the fund amounted to $5.
NOTE 4—Securities Transactions:
The aggregate amount of purchases and sales of investment securities, excluding short-term securities, during the period ended May 31, 2006, amounted to $233,459,484 and $298,365,596, respectively.
At May 31, 2006, the cost if investments for federal income tax purposes was $770,500,259; accordingly, accumulated net unrealized appreciation on investments was $7,431,198, consisting of $12,177,378 gross unrealized appreciation and $4,746,180 gross unrealized depreciation.
| REPORT OF INDEPENDENT REGISTERED |
| PUBLIC ACCOUNTING FIRM |
| Shareholders and Board of Directors |
| Dreyfus Intermediate Municipal Bond Fund, Inc. |
We have audited the accompanying statement of assets and liabilities of Dreyfus Intermediate Municipal Bond Fund, Inc., including the statement of investments, as of May 31, 2006, and the related statement of operations for the year then ended, the statement of changes in net assets for each of the two years in the period then ended, and financial highlights for each of the years indicated therein.These financial statements and financial highlights are the responsibility of the fund’s management. Our responsibility is to express an opinion on these financial statements and financial highlights based on our audits.
We conducted our audits in accordance with the standards of the Public Company Accounting Oversight Board (United States).Those standards require that we plan and perform the audit to obtain reasonable assurance about whether the financial statements and financial highlights are free of material misstatement.We were not engaged to perform an audit of the Fund’s internal control over financial reporting. Our audits included consideration of internal control over financial reporting as a basis for designing audit procedures that are appropriate in the circumstances,but not for the purpose of expressing an opinion on the effectiveness of the Fund’s internal control over financial reporting.Accordingly, we express no such opinion.An audit also includes examining, on a test basis, evidence supporting the amounts and disclosures in the financial statements and financial highlights, assessing the accounting principles used and significant estimates made by management, and evaluating the overall financial statement presentation. Our procedures included confirmation of securities owned as of May 31, 2006 by correspondence with the custodian. We believe that our audits provide a reasonable basis for our opinion.
In our opinion, the financial statements and financial highlights referred to above present fairly, in all material respects, the financial position of the Dreyfus Intermediate Municipal Bond Fund, Inc. at May 31, 2006, the results of its operations for the year then ended, the changes in its net assets for each of the two years in the period then ended, and the financial highlights for each of the indicated years, in conformity with U.S. generally accepted accounting principles.
IMPORTANT TAX INFORMATION (Unaudited)
In accordance with federal tax law, the fund hereby designates all the dividends paid from investment income-net during its fiscal year ended May 31, 2006 as “exempt-interest dividends” (not generally subject to regular Federal income tax).As required by Federal tax law rules, shareholders will receive notification of their portion of the fund’s taxable ordinary dividends (if any) and capital gains distributions (if any) paid for the 2006 calendar year on Form 1099-DIV which will be mailed by January 31, 2007.
| INFORMATION ABOUT THE REVIEW AND APPROVAL OF THE |
| FUND’S INVESTMENT MANAGEMENT AGREEMENT (Unaudited) |
At a meeting of the fund’s Board of Directors held on April 18, 2006, the Board considered the re-approval for an annual period of the fund’s Management Agreement, pursuant to which the Manager provides the fund with investment advisory and administrative services. The Board members, none of whom are “interested persons” (as defined in the Investment Company Act of 1940, as amended) of the fund, were assisted in their review by independent legal counsel and met with counsel in executive session separate from representatives of the Manager.
Analysis of Nature, Extent, and Quality of Services Provided to the Fund. The Board members received a presentation from representatives of the Manager regarding services provided to the fund and other funds in the Dreyfus fund complex, and discussed the nature, extent, and quality of the services provided to the fund pursuant to its Management Agreement.The Manager’s representatives reviewed the fund’s distribution of accounts and the relationships the Manager has with various intermediaries and the different needs of each. The Manager’s representatives noted the diversity of distribution of the fund as well as among the funds in the Dreyfus fund complex, and the Manager’s corresponding need for broad, deep, and diverse resources to be able to provide ongoing shareholder services to each of the fund’s distribution channels. The Board also reviewed the number of shareholder accounts in the fund, as well as the fund’s asset size.
The Board members also considered the Manager’s research and portfolio management capabilities.The Board members also considered that the Manager also provides oversight of day-to-day fund operations, including fund accounting and administration and assistance in meeting legal and regulatory requirements, and the Manager’s extensive administrative, accounting and compliance infrastructure.
Comparative Analysis of the Fund’s Management Fee, Expense Ratio, and Performance. The Board members reviewed reports prepared by Lipper, Inc., an independent provider of investment company data, which included information comparing the fund’s management fee and expense ratio with a group of comparable funds (the “Expense Group”)
| INFORMATION ABOUT THE REVIEW AND APPROVAL OF THE FUND’S |
| INVESTMENT MANAGEMENT AGREEMENT (Unaudited) (continued) |
and with a broader group of funds (the “Expense Universe”) that were selected by Lipper. Included in these reports were comparisons of contractual and actual management fee rates, total operating expenses, and yield and total return performance. The Manager furnished these reports to the Board along with a description of the methodology Lipper used to select the Expense Group and Expense Universe.
The Board reviewed the results of the Expense Group and Expense Universe comparisons for various periods ended February 28, 2006. The Board reviewed the range of management fees and expense ratios of the funds in the Expense Group and Expense Universe, and noted that the fund’s contractual and actual management fees were above the Expense Group and Expense Universe medians.The Board also noted that the fund’s total expense ratio was lower than the medians of the Expense Group and Expense Universe.
The Board members also reviewed the reports prepared by Lipper that presented the fund’s performance for various periods ended February 28, 2006, and placed significant emphasis on comparisons of yield and total return performance among the same group of funds as the Expense Group (the “Performance Group”) and to a group of funds that was broader than the Expense Universe (the “Performance Universe”) that also was selected by Lipper. The Board noted that the fund achieved first and second quintile total return rankings (the first quintile reflecting the highest performance group ranking) among its Performance Group and Performance Universe for the 1-, 2-, and 3-year time periods, noting in particular the fund’s improved performance over the past three years compared with the fund’s lower quintile, longer-term rank-ings.The Board also noted that the fund outperformed its Performance Group median on a total return basis for the 1-, 2-, 3-, and 4-year periods. On a yield performance basis, the Board noted that the fund’s one-year yield performance generally ranked in the first or second quintile among its Performance Group and Performance Universe for past 10 annual reported periods.
Representatives of the Manager reviewed with the Board members the fees paid to the Manager or its affiliates by mutual funds managed by the Manager or its affiliates reported in the same Lipper category as the fund (the “Similar Funds”), and explained the nature of the Similar Funds and any differences, from the Manager’s perspective, in providing services to the Similar Funds as compared to the fund.The Manager’s representatives also reviewed the costs associated with distribution through intermediaries. The Board analyzed differences in fees paid to the Manager and discussed the relationship of the management fees paid in light of the Manager’s performance, and the services provided. The Board members considered the relevance of the fee information provided for the Similar Funds, to evaluate the appropriateness and reasonableness of the fund’s management fee.
Representatives of the Manager noted that there were no similarly managed institutional separate accounts or wrap fee accounts managed by the Manager or its affiliates with similar investment objectives, policies, and strategies as the fund.
Analysis of Profitability and Economies of Scale. The Manager’s representatives reviewed the dollar amount of expenses allocated and profit received by the Manager and the method used to determine such expenses and profit. The Board considered information, previously provided and discussed, prepared by an independent consulting firm regarding the Manager’s approach to allocating costs to, and determining the profitability of, individual funds and the entire Dreyfus mutual fund complex. The Board members also considered that the methodology had also been reviewed by an independent registered public accounting firm which, like the consultant, found the methodology to be reasonable. The consulting firm also analyzed where any economies of scale might emerge in connection with the management of the fund. The Board members evaluated the profitability analysis in light of the relevant circumstances for the fund,
| INFORMATION ABOUT THE REVIEW AND APPROVAL OF THE FUND’S |
| INVESTMENT MANAGEMENT AGREEMENT (Unaudited) (continued) |
including the decline in fund assets from the prior year, and the extent to which economies of scale would be realized if the fund grows and whether fee levels reflect these economies of scale for the benefit of fund shareholders.The Board members also considered potential benefits to the Manager from acting as investment adviser to the fund and noted that there were no soft dollar arrangements in effect with respect to trading the fund’s portfolio.
It was noted that the Board members should consider the Manager’s profitability with respect to the fund as part of their evaluation of whether the fees under the Management Agreement bear a reasonable relationship to the mix of services provided by the Manager, including the nature, extent, and quality of such services and that a discussion of economies of scale is predicated on increasing assets and that, if a fund’s assets had been decreasing, the possibility that the Manager may have realized any economies of scale would be less. It was noted that the profitability percentage for managing the fund was within ranges determined by appropriate court cases to be reasonable given the services rendered and that the profitability percentage for managing the fund was reasonable given the fund’s overall performance and generally superior service levels provided.
At the conclusion of these discussions, the Board agreed that it had been furnished with sufficient information to make an informed business decision with respect to continuation of the fund’s Management Agreement. Based on the discussions and considerations as described above, the Board made the following conclusions and determinations.
| • | | The Board concluded that the nature, extent, and quality of the ser- |
| | | vices provided by the Manager are adequate and appropriate. |
| • | | The Board was satisfied with the fund’s performance. |
| • | | The Board concluded that the fee paid to the Manager by the fund |
| | | was reasonable in light of the services provided, comparative perfor- |
| | | mance and expense and advisory fee information, costs of the services |
| | | provided, and profits to be realized and benefits derived or to be |
| | | derived by the Manager from its relationship with the fund. |
| • | | The Board determined that the economies of scale which may accrue |
| | | to the Manager and its affiliates in connection with the management |
| | | of the fund had been adequately considered by the Manager in con- |
| | | nection with the management fee rate charged to the fund, and that, |
| | | to the extent in the future it were to be determined that material |
| | | economies of scale had not been shared with the fund, the Board |
| | | would seek to have those economies of scale shared with the fund. |
The Board members considered these conclusions and determinations, along with the information received on a routine and regular basis throughout the year, and, without any one factor being dispositive, the Board determined that re-approval of the fund’s Management Agreement was in the best interests of the fund and its shareholders.
BOARD MEMBERS INFORMATION (Unaudited)
| Joseph S. DiMartino (62) |
| Chairman of the Board (1995) |
| Principal Occupation During Past 5 Years: |
| • Corporate Director and Trustee |
Other Board Memberships and Affiliations:
| • The Muscular Dystrophy Association, Director |
| • Levcor International, Inc., an apparel fabric processor, Director |
| • Century Business Services, Inc., a provider of outsourcing functions for small and medium size |
| companies, Director |
| • The Newark Group, a provider of a national market of paper recovery facilities, paperboard |
| mills and paperboard converting plants, Director |
| • Sunair Services Corporation, engaging in the design, manufacture and sale of high frequency |
| systems for long-range voice and data communications, as well as providing certain outdoor- |
| related services to homes and businesses, Director |
No. of Portfolios for which Board Member Serves: 186
| David W. Burke (70) |
| Board Member (1994) |
| Principal Occupation During Past 5 Years: |
| • Corporate Director and Trustee |
Other Board Memberships and Affiliations:
| • John F. Kennedy Library Foundation, Director |
| • U.S.S. Constitution Museum, Director |
| No. of Portfolios for which Board Member Serves: 79 |
| ——————— |
| Gordon J. Davis (64) |
| Board Member (1995) |
Principal Occupation During Past 5 Years:
| • Partner in the law firm of LeBoeuf, Lamb, Greene & MacRae, LLP |
| • President, Lincoln Center for the Performing Arts, Inc. (2001) |
Other Board Memberships and Affiliations:
| • Consolidated Edison, Inc., a utility company, Director |
| • Phoenix Companies, Inc., a life insurance company, Director |
| • Board Member/Trustee for several not-for-profit groups |
No. of Portfolios for which Board Member Serves: 24
| Joni Evans (64) |
| Board Member (1983) |
Principal Occupation During Past 5 Years:
| • Principal, Joni Evans Ltd. |
| Senior Vice President of the William Morris Agency (2005) |
No. of Portfolios for which Board Member Serves: 15
| Arnold S. Hiatt (79) |
| Board Member (1983) |
| Principal Occupation During Past 5 Years: |
| • Chairman of The Stride Rite Charitable Foundation |
Other Board Memberships and Affiliations:
| • Isabella Stewart Gardner Museum,Trustee |
| • John Merck Fund, a charitable trust,Trustee |
| • Business for Social Responsibility, Director |
| • The A.M. Fund,Trustee |
No. of Portfolios for which Board Member Serves: 15
| Burton N. Wallack (55) |
| Board Member (1991) |
| Principal Occupation During Past 5 Years: |
| • President and co-owner of Wallack Management Company, a real estate management company |
No. of Portfolios for which Board Member Serves: 15
Once elected all Board Members serve for an indefinite term.The address of the Board Members and Officers is in c/o The Dreyfus Corporation, 200 Park Avenue, New York, New York 10166. Additional information about the Board Members is available in the fund’s Statement of Additional Information which can be obtained from Dreyfus free of charge by calling this toll free number: 1-800-554-4611.
Samuel Chase, Emeritus Board Member
OFFICERS OF THE FUND (Unaudited)
| STEPHEN E. CANTER, President since |
| March 2000. |
Chairman of the Board and Chief Executive Officer of the Manager, and an officer of 90 investment companies (comprised of 186 portfolios) managed by the Manager. Mr. Canter also is a Board member and, where applicable, an Executive Committee Member of the other investment management subsidiaries of Mellon Financial Corporation, each of which is an affiliate of the Manager. He is 60 years old and has been an employee of the Manager since May 1995.
| STEPHEN R. BYERS, Executive Vice |
| President since November 2002. |
Chief Investment Officer,Vice Chairman and a director of the Manager, and an officer of 90 investment companies (comprised of 186 portfolios) managed by the Manager. Mr. Byers also is an officer, director or an Executive Committee Member of certain other investment management subsidiaries of Mellon Financial Corporation, each of which is an affiliate of the Manager. He is 52 years old and has been an employee of the Manager since January 2000.
| MARK N. JACOBS, Vice President since |
| March 2000. |
Executive Vice President, Secretary and General Counsel of the Manager, and an officer of 91 investment companies (comprised of 202 portfolios) managed by the Manager. He is 60 years old and has been an employee of the Manager since June 1977.
| MICHAEL A. ROSENBERG, Vice President |
| and Secretary since August 2005. |
Associate General Counsel of the Manager, and an officer of 91 investment companies (comprised of 202 portfolios) managed by the Manager. He is 46 years old and has been an employee of the Manager since October 1991.
| JAMES BITETTO, Vice President and |
| Assistant Secretary since August 2005. |
Assistant General Counsel and Assistant Secretary of the Manager, and an officer of 91 investment companies (comprised of 202 portfolios) managed by the Manager. He is 39 years old and has been an employee of the Manager since December 1996.
| JONI LACKS CHARATAN, Vice President |
| and Assistant Secretary since |
| August 2005. |
Associate General Counsel of the Manager, and an officer of 91 investment companies (comprised of 202 portfolios) managed by the Manager. She is 50 years old and has been an employee of the Manager since October 1988.
| JOSEPH M. CHIOFFI, Vice President and |
| Assistant Secretary since August 2005. |
Assistant General Counsel of the Manager, and an officer of 91 investment companies (comprised of 202 portfolios) managed by the Manager. He is 44 years old and has been an employee of the Manager since June 2000.
| JANETTE E. FARRAGHER, Vice President |
| and Assistant Secretary since |
| August 2005. |
Associate General Counsel of the Manager, and an officer of 91 investment companies (comprised of 202 portfolios) managed by the Manager. She is 43 years old and has been an employee of the Manager since February 1984.
| JOHN B. HAMMALIAN, Vice President and |
| Assistant Secretary since August 2005. |
Associate General Counsel of the Manager, and an officer of 91 investment companies (comprised of 202 portfolios) managed by the Manager. He is 42 years old and has been an employee of the Manager since February 1991.
| ROBERT R. MULLERY, Vice President and |
| Assistant Secretary since August 2005. |
Associate General Counsel of the Manager, and an officer of 91 investment companies (comprised of 202 portfolios) managed by the Manager. He is 54 years old and has been an employee of the Manager since May 1986.
| JEFF PRUSNOFSKY, Vice President and |
| Assistant Secretary since August 2005. |
Associate General Counsel of the Manager, and an officer of 91 investment companies (comprised of 202 portfolios) managed by the Manager. He is 41 years old and has been an employee of the Manager since October 1990.
| JAMES WINDELS, Treasurer since |
| November 2001. |
Director – Mutual Fund Accounting of the Manager, and an officer of 91 investment companies (comprised of 202 portfolios) managed by the Manager. He is 47 years old and has been an employee of the Manager since April 1985.
| ERIK D. NAVILOFF, Assistant Treasurer |
| since August 2005. |
Senior Accounting Manager – Taxable Fixed Income Funds of the Manager, and an officer of 91 investment companies (comprised of 202 portfolios) managed by the Manager. He is 37 years old and has been an employee of the Manager since November 1992.
| ROBERT ROBOL, Assistant Treasurer |
| since August 2005. |
Senior Accounting Manager – Money Market and Municipal Bond Funds of the Manager, and an officer of 91 investment companies (comprised of 202 portfolios) managed by the Manager. He is 42 years old and has been an employee of the Manager since October 1988.
| ROBERT SVAGNA, Assistant Treasurer |
| since August 2005. |
Senior Accounting Manager – Equity Funds of the Manager, and an officer of 91 investment companies (comprised of 201 portfolios) managed by the Manager. He is 39 years old and has been an employee of the Manager since November 1990.
| GAVIN C. REILLY, Assistant Treasurer |
| since December 2005. |
Tax Manager of the Investment Accounting and Support Department of the Manager, and an officer of 91 investment companies (comprised of 202 portfolios) managed by the Manager. He is 37 years old and has been an employee of the Manager since April 1991.
| JOSEPH W. CONNOLLY, Chief Compliance |
| Officer since October 2004. |
Chief Compliance Officer of the Manager and The Dreyfus Family of Funds (91 investment companies, comprised of 202 portfolios). From November 2001 through March 2004, Mr. Connolly was first Vice-President, Mutual Fund Servicing for Mellon Global Securities Services. In that capacity, Mr. Connolly was responsible for managing Mellon’s Custody, Fund Accounting and Fund Administration services to third-party mutual fund clients. He is 49 years old and has served in various capacities with the Manager since 1980, including manager of the firm’s Fund Accounting Department from 1997 through October 2001.
| WILLIAM GERMENIS, Anti-Money |
| Laundering Compliance Officer since |
| October 2002. |
Vice President and Anti-Money Laundering Compliance Officer of the Distributor, and the Anti-Money Laundering Compliance Officer of 87 investment companies (comprised of 198 portfolios) managed by the Manager. He is 35 years old and has been an employee of the Distributor since October 1998.
NOTES
| For More | | Information |
| |
|
| |
| Dreyfus Intermediate | | Transfer Agent & |
| Municipal Bond Fund, Inc. | | Dividend Disbursing Agent |
| 200 Park Avenue | | Dreyfus Transfer, Inc. |
| New York, NY 10166 | | 200 Park Avenue |
| Manager | | New York, NY 10166 |
| The Dreyfus Corporation | | Distributor |
| 200 Park Avenue | | Dreyfus Service Corporation |
| New York, NY 10166 | | 200 Park Avenue |
| Custodian | | New York, NY 10166 |
| The Bank of New York | | |
| One Wall Street | | |
| New York, NY 10286 | | |
| |
|
| |
| |
| Telephone 1-800-645-6561 | | |
| Mail The Dreyfus Family of Funds, 144 Glenn Curtiss Boulevard, Uniondale, NY 11556-0144 |
| E-mail Send your request to info@dreyfus.com |
| Internet Information can be viewed online or downloaded at: http://www.dreyfus.com |
The fund files its complete schedule of portfolio holdings with the Securities and Exchange Commission (“SEC”) for the first and third quarters of each fiscal year on Form N-Q. The fund's Forms N-Q are available on the SEC’s website at http://www.sec.gov and may be reviewed and copied at the SEC’s Public Reference Room in Washington, DC. Information on the operation of the Public Reference Room may be obtained by calling 1-800-SEC-0330.
Information regarding how the fund voted proxies relating to portfolio securities for the 12-month period ended June 30, 2005, is available on the SEC’s website at http://www.sec.gov and without charge, upon request, by calling 1-800-645-6561.

Item 2. Code of Ethics.
The Registrant has adopted a code of ethics that applies to the Registrant's principal executive officer, principal financial officer, principal accounting officer or controller, or persons performing similar functions There have been no amendments to, or waivers in connection with, the Code of Ethics during the period covered by this Report.
Item 3. Audit Committee Financial Expert.
The Registrant's Board has determined that Joseph S. DiMartino, a member of the Audit Committee of the Board, is an audit committee financial expert as defined by the Securities and Exchange Commission (the "SEC"). Joseph S. DiMartino is "independent" as defined by the SEC for purposes of audit committee financial expert determinations.
Item 4. Principal Accountant Fees and Services
(a) Audit Fees. The aggregate fees billed for each of the last two fiscal years (the "Reporting Periods") for professional services rendered by the Registrant's principal accountant (the "Auditor") for the audit of the Registrant's annual financial statements, or services that are normally provided by the Auditor in connection with the statutory and regulatory filings or engagements for the Reporting Periods, were $40,634 in 2005 and $42,565 in 2006.
(b) Audit-Related Fees. The aggregate fees billed in the Reporting Periods for assurance and related services by the Auditor that are reasonably related to the performance of the audit of the Registrant's financial statements and are not reported under paragraph (a) of this Item 4 were $0 in 2005 and $0 in 2006.
The aggregate fees billed in the Reporting Periods for non-audit assurance and related services by the Auditor to the Registrant's investment adviser (not including any sub-investment adviser whose role is primarily portfolio management and is subcontracted with or overseen by another investment adviser), and any entity controlling, controlled by or under common control with the investment adviser that provides ongoing services to the Registrant ("Service Affiliates"), that were reasonably related to the performance of the annual audit of the Service Affiliate, which required pre-approval by the Audit Committee were $0 in 2005 and $0 in 2006.
Note: For the second paragraph in each of (b) through (d) of this Item 4, certain of such services were not pre-approved prior to May 6, 2003, when such services were required to be pre-approved. On and after May 6, 2003, 100% of all services provided by the Auditor were pre-approved as required. For comparative purposes, the fees shown assume that all such services were pre-approved, including services that were not pre-approved prior to the compliance date of the pre-approval requirement.
(c) Tax Fees. The aggregate fees billed in the Reporting Periods for professional services rendered by the Auditor for tax compliance, tax advice and tax planning ("Tax Services") were $3,425 in 2005 and $3,007 in 2006. These services consisted of (i) review or preparation of U.S. federal, state, local and excise tax returns; (ii) U.S. federal, state and local tax planning, advice and assistance regarding statutory, regulatory or administrative developments, and (iii) tax advice regarding tax qualification matters and/or treatment of various financial instruments held or proposed to be acquired or held.
The aggregate fees billed in the Reporting Periods for Tax Services by the Auditor to Service Affiliates which required pre-approval by the Audit Committee were $0 in 2005 and $0 in 2006.
(d) All Other Fees. The aggregate fees billed in the Reporting Periods for products and services provided by the Auditor, other than the services reported in paragraphs (a) through (c) of this Item, were $651 in 2005 and $645 in 2006. These services consisted of a review of the Registrant's anti-money laundering program.
The aggregate fees billed in the Reporting Periods for Non-Audit Services by the Auditor to Service Affiliates, other than the services reported in paragraphs (b) through (c) of this Item, which required pre-approval by the Audit Committee were $0 in 2005 and $0 in 2006.
Audit Committee Pre-Approval Policies and Procedures. The Registrant's Audit Committee has established policies and procedures (the "Policy") for pre-approval (within specified fee limits) of the Auditor's engagements for non-audit services to the Registrant and Service Affiliates without specific case-by-case consideration. Pre-approval considerations include whether the proposed services are compatible with maintaining the Auditor's independence. Pre-approvals pursuant to the Policy are considered annually.
Non-Audit Fees. The aggregate non-audit fees billed by the Auditor for services rendered to the Registrant, and rendered to Service Affiliates, for the Reporting Periods were $811,636 in 2005 and $586,749 in 2006.
Auditor Independence. The Registrant's Audit Committee has considered whether the provision of non-audit services that were rendered to Service Affiliates which were not pre-approved (not requiring pre-approval) is compatible with maintaining the Auditor's independence.
| Item 5. | | Audit Committee of Listed Registrants. |
| | | Not applicable. |
| Item 6. | | Schedule of Investments. |
| | | Not applicable. |
| Item 7. | | Disclosure of Proxy Voting Policies and Procedures for Closed-End Management |
| | | Investment Companies. |
| | | Not applicable. |
| Item 8. | | Portfolio Managers of Closed-End Management Investment Companies. |
| | | Not applicable. |
| Item 9. | | Purchases of Equity Securities by Closed-End Management Investment Companies and |
| | | Affiliated Purchasers. |
| | | Not applicable. |
| Item 10. | | Submission of Matters to a Vote of Security Holders. |
The Registrant has a Nominating Committee (the "Committee"), which is responsible for selecting and nominating persons for election or appointment by the Registrant's Board as Board members. The Committee has adopted a Nominating Committee Charter (the "Charter"). Pursuant to the Charter, the
Committee will consider recommendations for nominees from shareholders submitted to the Secretary of the Registrant, c/o The Dreyfus Corporation Legal Department, 200 Park Avenue, 8th Floor East, New York, New York 10166. A nomination submission must include information regarding the recommended nominee as specified in the Charter. This information includes all information relating to a recommended nominee that is required to be disclosed in solicitations or proxy statements for the election of Board members, as well as information sufficient to evaluate the factors to be considered by the Committee, including character and integrity, business and professional experience, and whether the person has the ability to apply sound and independent business judgment and would act in the interests of the Registrant and its shareholders.
Nomination submissions are required to be accompanied by a written consent of the individual to stand for election if nominated by the Board and to serve if elected by the shareholders, and such additional information must be provided regarding the recommended nominee as reasonably requested by the Committee.
Item 11. Controls and Procedures.
(a) The Registrant's principal executive and principal financial officers have concluded, based on their evaluation of the Registrant's disclosure controls and procedures as of a date within 90 days of the filing date of this report, that the Registrant's disclosure controls and procedures are reasonably designed to ensure that information required to be disclosed by the Registrant on Form N-CSR is recorded, processed, summarized and reported within the required time periods and that information required to be disclosed by the Registrant in the reports that it files or submits on Form N-CSR is accumulated and communicated to the Registrant's management, including its principal executive and principal financial officers, as appropriate to allow timely decisions regarding required disclosure.
(b) There were no changes to the Registrant's internal control over financial reporting that occurred during the second fiscal quarter of the period covered by this report that have materially affected, or are reasonably likely to materially affect, the Registrant's internal control over financial reporting.
Item 12. Exhibits.
| (a)(1) | | Code of ethics referred to in Item 2. |
| (a)(2) | | Certifications of principal executive and principal financial officers as required by Rule 30a-2(a) |
| under the Investment Company Act of 1940. |
| (a)(3) | | Not applicable. |
| (b) | | Certification of principal executive and principal financial officers as required by Rule 30a-2(b) |
Pursuant to the requirements of the Securities Exchange Act of 1934 and the Investment Company Act of 1940, the Registrant has duly caused this Report to be signed on its behalf by the undersigned, thereunto duly authorized.
Dreyfus Intermediate Municipal Bond Fund, Inc.
| By: | | /s/ Stephen E. Canter |
| | | Stephen E. Canter |
| | | President |
| |
| Date: | | July 31, 2006 |
| |
| Pursuant to the requirements of the Securities Exchange Act of 1934 and the Investment Company Act of |
| 1940, this Report has been signed below by the following persons on behalf of the Registrant and in the |
| capacities and on the dates indicated. |
| |
| By: | | /s/ Stephen E. Canter |
| | | Stephen E. Canter |
| | | Chief Executive Officer |
| |
| Date: | | July 31, 2006 |
| |
| By: | | /s/ James Windels |
| | | James Windels |
| | | Chief Financial Officer |
| |
| Date: | | July 31, 2006 |
| |
| EXHIBIT INDEX |
| |
| | | (a)(1) | | Code of ethics referred to in Item 2. |
| |
| | | (a)(2) | | Certifications of principal executive and principal financial officers as required by Rule 30a- |
| | | 2(a) under the Investment Company Act of 1940. (EX-99.CERT) |
| |
| | | (b) | | Certification of principal executive and principal financial officers as required by Rule 30a- |
| | | 2(b) under the Investment Company Act of 1940. (EX-99.906CERT) |