UNITED STATES
SECURITIES AND EXCHANGE COMMISSION
Washington, D.C. 20549
FORM N-CSR
CERTIFIED SHAREHOLDER REPORT OF
REGISTERED MANAGEMENT INVESTMENT COMPANIES
Investment Company Act file number 811-3732
MFS VARIABLE INSURANCE TRUST II
(Exact name of registrant as specified in charter)
500 Boylston Street, Boston, Massachusetts 02116
(Address of principal executive offices) (Zip code)
Susan S. Newton
Massachusetts Financial Services Company
500 Boylston Street
Boston, Massachusetts 02116
(Name and address of agents for service)
Registrant’s telephone number, including area code: (617) 954-5000
Date of fiscal year end: December 31*
Date of reporting period: December 31, 2007
| * | The Strategic Growth Series was reorganized into the MFS Massachusetts Investors Growth Stock Portfolio, and Capital Opportunities Series was reorganized into MFS Core Equity Portfolio, all series of the Registrant, as of June 22, 2007. |
| ITEM 1. | REPORTS TO STOCKHOLDERS. |
Reports for the Capital Opportunities Series and the Strategic Growth Series are not included because the Funds did not have any shareholders at period end. Please see note above.


MFS® Variable Insurance Trust IISM
Annual report
MFS® Value Portfolio
(formerly Value Series)
12/31/07
EIS-ANN
MFS® VALUE PORTFOLIO
(formerly Value Series)
The report is prepared for the general information of contract owners. It is authorized for distribution to prospective investors only when preceded or accompanied by a current prospectus.
NOT FDIC INSURED MAY LOSE VALUE NO BANK OR CREDIT UNION GUARANTEE NOT A DEPOSIT NOT INSURED BY ANY FEDERAL GOVERNMENT AGENCY OR NCUA/NCUSIF
LETTER FROM THE CEO

Dear Contract Owners:
The past year has been a great example of why investors should keep their eyes on the long term.
In 2006 the Dow Jones Industrial Average returned 19% and was fairly stable. This year we have seen a greater level of volatility than has been experienced in recent years. The Dow hit several new highs but also experienced swift drops as a global credit crisis swept through markets, spurred by defaults on U.S. subprime loans and a liquidity crunch. Still, even with this volatility, the Dow ended the first three quarters of 2007 with a return near 13%.
U.S. Treasury bonds gained ground, especially in the third quarter as investors sought less risky asset classes. The spreads of many lower-quality debt investments widened.
In 2007 the U.S. dollar fell against the euro, oil prices hit their highest levels yet, and gold spiked to its steepest price in 28 years. Around the globe, stocks sold off as risk aversion mounted. As we have said before, markets can be volatile, and investors should make sure they have an investment plan that can carry them through the peaks and troughs.
If you are focused on a long-term investment strategy, the short-term ups and downs of the markets should not necessarily dictate portfolio action on your part. In our view, investors who remain committed to a long-term plan are more likely to achieve their financial goals.
In any market environment, we believe individual investors are best served by following a three-pronged investment strategy of allocating their holdings across the major asset classes, diversifying within each class, and regularly rebalancing their portfolios to maintain their desired allocations. Of course, these strategies cannot guarantee a profit or protect against a loss. Investing and planning for the long term require diligence and patience, two traits that in our experience are essential to capitalizing on the many opportunities the financial markets can offer — through both up and down economic cycles.
Respectfully,

Robert J. Manning
Chief Executive Officer and Chief Investment Officer
MFS Investment Management®
February 15, 2008
The opinions expressed in this letter are subject to change, may not be relied upon for investment advice, and no forecasts can be guaranteed.
1
PORTFOLIO COMPOSITION
Portfolio structure

| | |
| Top Ten holdings | | |
| Lockheed Martin Corp. | | 4.2% |
| Altria Group, Inc. | | 3.8% |
| Allstate Corp. | | 3.1% |
| Exxon Mobil Corp. | | 2.9% |
| TOTAL S.A., ADR | | 2.7% |
| Johnson & Johnson | | 2.6% |
| MetLife, Inc. | | 2.5% |
| Bank of America Corp. | | 2.3% |
| Bank of New York Mellon Corp. | | 2.1% |
| Procter & Gamble Co. | | 2.0% |
| | |
| Equity sectors | | |
| Financial Services | | 25.7% |
| Energy | | 14.1% |
| Consumer Staples | | 10.5% |
| Industrial Goods & Services | | 10.0% |
| Health Care | | 9.7% |
| Utilities & Communications | | 8.3% |
| Technology | | 5.3% |
| Retailing | | 4.5% |
| Basic Materials | | 3.6% |
| Leisure | | 3.3% |
| Autos & Housing | | 2.9% |
| Special Products & Services | | 1.2% |
| Transportation | | 0.9% |
Percentages are based on net assets as of 12/31/07.
The portfolio is actively managed and current holdings may be different.
2
MANAGEMENT REVIEW
Summary of Results
For the twelve months ended December 31, 2007, Initial Class shares of the MFS Value Portfolio (the “fund”) provided a total return of 7.92%, while Service Class shares provided a total return of 7.67%. These compare with a return of -0.17% for the fund’s benchmark, the Russell 1000 Value Index.
Market Environment
Despite seemingly robust growth rates during the second and third quarters of 2007, underlying economic activity in the U.S. remained muted relative to other major economies. Overall, global economies witnessed moderate to strong growth during the reporting period as domestic demand improved and world trade accelerated.
With the strong global growth, however, concerns emerged about rising global inflation, especially as capacity became more constrained, wages rose, and energy and food prices advanced. During the reporting period, global central banks (with the exception of the U.S. Federal Reserve Board) tightened monetary conditions, which in turn pushed global bond yields to their highest levels during this economic expansion.
However, financial markets – particularly in the mortgage and structured-products areas – experienced substantial volatility in recent months. Beginning in late July, heightened uncertainty and distress concerning the subprime mortgage market caused several global credit markets to tighten up, forcing central banks to inject liquidity and to reassess their tightening biases as sovereign bond yields declined and credit spreads widened. While credit conditions improved somewhat by late October as the Federal Reserve Board cut interest rates, the level of market turbulence remained significant through year end. Increased market turmoil was also exacerbated by U.S. home foreclosures and uncertainties surrounding falling housing prices. Despite increased volatility across all asset classes and the widening in credit spreads, U.S. labor markets were resilient and wages rose modestly. More broadly, global equity markets rebounded following summer losses and generally held those gains through the end of the reporting period.
Contributors to performance
The combination of strong stock selection and an underweighted position in the financial services sector boosted performance relative to the Russell 1000 Value Index. Not holding poor-performing financial services firm Wachovia and consumer and commercial banking firm Washington Mutual had a positive impact on results.
Stock selection and, to a lesser extent, an overweighted position in the industrial goods and services sector contributed to relative returns. Defense contractor Lockheed Martin(aa) and agricultural equipment manufacturer Deere & Co. were among the fund’s top contributors. Deere’s stock price gain was driven by strong capital management and better-than-expected results throughout the period which pushed its shares up in excess of the market.
Aided by stock selection, the technology sector was another positive area of relative performance. The fund’s holdings of enterprise software company Oracle(aa) and semiconductor chips maker Intel(aa) helped results.
Stock selection and overweighting in the consumer staples sector bolstered relative returns. Tobacco company Altria Group was one of the fund’s top relative performers over the reporting period.
Top contributors in other sectors included integrated oil and gas company Hess, integrated oil company TOTAL(aa) (France), and athletic shoes and apparel manufacturer NIKE(aa). Shares of Hess surged in recent months due largely to hopes that an oil field discovery off the coast of Brazil could nearly double the company’s reserves.
Detractors from performance
The fund’s underweighted positions in strong-performing integrated oil companies, Exxon Mobil and Chevron, held back relative results. Our positioning in telecommunications company AT&T also hurt as the stock turned in strong performance over the reporting period. Holdings of insurance company Allstate, department stores operator Macy’s, financial services firm UBS(aa), and home improvement products maker Masco also dampened results. Shares of Allstate were negatively affected by investor concerns regarding potential subprime mortgage market exposure in its investment portfolio and slowing trends in its core insurance operations.
Respectfully,
| | |
| Nevin Chitkara | | Steven Gorham |
| Portfolio Manager | | Portfolio Manager |
| (aa) | Security is not a benchmark constituent. |
The views expressed in this report are those of the portfolio managers only through the end of the period of the report as stated on the cover and do not necessarily reflect the views of MFS or any other person in the MFS organization. These views are subject to change at any time based on market and other conditions, and MFS disclaims any responsibility to update such views. These views may not be relied upon as investment advice or an indication of trading intent on behalf of any MFS portfolio. References to specific securities are not recommendations of such securities, and may not be representative of any MFS portfolio’s current or future investments.
3
PERFORMANCE SUMMARY THROUGH 12/31/07
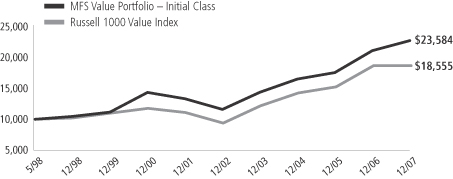
The following chart illustrates the historical performance of the fund in comparison to its benchmark index. Index comparisons are unmanaged; do not reflect any fees or expenses; and cannot be invested in directly. The performance of other share classes will be greater than or less than that of the class depicted below. (See Notes to Performance Summary.)
Performance data shown represents past performance and is no guarantee of future results. Investment return and principal value fluctuate so your units, when sold, may be worth more or less than the original cost; current performance may be lower or higher than quoted. The performance shown does not reflect the deduction of taxes, if any, that a contract holder would pay on fund distributions or the redemption of contract units. The returns for the fund shown also do not reflect the deduction of expenses associated with variable products, such as mortality and expense risk charges, separate account charges, and sales charges imposed by the insurance company separate accounts. Such expenses would reduce the overall returns shown.
Growth of a hypothetical $10,000 investment (t)
Total rates of return through 12/31/07
Average Annual Total Returns
| | | | | | | | | | | | |
| | | Share class | | Class inception date | | 1-yr | | 5-yr | | Life (t) | | |
| | | Initial Class | | 5/06/98 | | 7.92% | | 15.04% | | 9.29% | | |
| | | Service Class | | 8/24/01 | | 7.67% | | 14.76% | | 9.12% | | |
Comparative Index
| | | | | | | | | | | | |
| | | Russell 1000 Value Index (f) | | (0.17)% | | 14.63% | | 6.59% | | |
| (f) | Source: FactSet Research Systems Inc. |
| (t) | For the period from the commencement of the fund’s investment operations, May 6, 1998, through the stated period end. |
Index Definition
Russell 1000 Value Index – constructed to provide a comprehensive barometer for the value securities in the large-cap segment of the U.S. equity universe. Companies in this index generally have lower price-to-book ratios and lower forecasted growth values.
It is not possible to invest directly in an index.
Notes to Performance Summary
Service Class share performance includes the performance of Initial Class shares for periods prior to the inception of Service Class shares (blended performance). This blended performance figure has not been adjusted to take into account differences in the class-specific operating expenses (such as Rule 12b-1 fees). Because operating expenses of Service Class shares are generally higher than those of Initial Class shares, the blended Service Class shares performance shown is higher than it would have been had Service Class shares been offered for the entire period.
Performance results reflect any applicable expense subsidies and waivers in effect during the periods shown. Without such subsidies and waivers the fund’s performance results would be less favorable. Please see the prospectus and financial statements for complete details.
From time to time the fund may receive proceeds from litigation settlements, without which performance would be lower.
4
EXPENSE TABLE
Fund Expenses Borne by the Contract Holders During the Period,
July 1, 2007 through December 31, 2007
As a contract holder of the fund, you incur ongoing costs, including management fees; distribution (12b-1) fees; and other fund expenses. This example is intended to help you understand your ongoing costs (in dollars) of investing in the fund and to compare these costs with the ongoing costs of investing in other mutual funds.
The example is based on an investment of $1,000 invested at the beginning of the period and held for the entire period July 1, 2007 through December 31, 2007.
Actual expenses
The first line for each share class in the following table provides information about actual account values and actual expenses. You may use the information in this line, together with the amount you invested, to estimate the expenses that you paid over the period. Simply divide your account value by $1,000 (for example, an $8,600 account value divided by $1,000 = 8.6), then multiply the result by the number in the first line under the heading entitled “Expenses Paid During Period” to estimate the expenses you paid on your account during this period.
Hypothetical example for comparison purposes
The second line for each share class in the following table provides information about hypothetical account values and hypothetical expenses based on the fund’s actual expense ratio and an assumed rate of return of 5% per year before expenses, which is not the fund’s actual return. The hypothetical account values and expenses may not be used to estimate the actual ending account balance or expenses you paid for the period. You may use this information to compare the ongoing costs of investing in the fund and other funds. To do so, compare this 5% hypothetical example with the 5% hypothetical examples that appear in the shareholder reports of the other funds.
Please note that the expenses shown in the table are meant to highlight the fund’s ongoing costs only and do not take into account the fees and expenses imposed under the variable contracts through which your investment in the fund is made. Therefore, the second line for each share class in the table is useful in comparing ongoing costs associated with an investment in vehicles (such as the fund) which fund benefits under variable annuity and variable life insurance contracts and to qualified pension and retirement plans only, and will not help you determine the relative total costs of investing in the fund through variable annuity and variable life insurance contracts. If the fees and expenses imposed under the variable contracts were included, your costs would have been higher.
| | | | | | | | | | |
Share Class | | | | Annualized
Expense Ratio | | Beginning
Account Value
7/01/07 | | Ending
Account Value
12/31/07 | | Expenses Paid
During Period (p)
7/01/07-12/31/07 |
| Initial Class | | Actual | | 0.82% | | $1,000.00 | | $997.30 | | $4.13 |
| | Hypothetical (h) | | 0.82% | | $1,000.00 | | $1,021.07 | | $4.18 |
| Service Class | | Actual | | 1.07% | | $1,000.00 | | $996.30 | | $5.38 |
| | Hypothetical (h) | | 1.07% | | $1,000.00 | | $1,019.81 | | $5.45 |
| (h) | 5% class return per year before expenses. |
| (p) | Expenses paid is equal to each class’ annualized expense ratio, as shown above, multiplied by the average account value over the period, multiplied by the number of days in the period, divided by the number of days in the year. |
5
PORTFOLIO OF INVESTMENTS – 12/31/07
The Portfolio of Investments is a complete list of all securities owned by your fund.
It is categorized by broad-based asset classes.
| | | | | |
| Issuer | | Shares/Par | | Value ($) |
| COMMON STOCKS – 100.0% | | | | | |
| Aerospace – 7.9% | | | | | |
| Lockheed Martin Corp. | | 163,140 | | $ | 17,172,116 |
| Northrop Grumman Corp. | | 87,550 | | | 6,884,932 |
| Raytheon Co. | | 16,750 | | | 1,016,725 |
| United Technologies Corp. | | 93,260 | | | 7,138,120 |
| | | | | |
| | | | $ | 32,211,893 |
| | | | | |
| Alcoholic Beverages – 1.1% | | | | | |
| Diageo PLC | | 211,009 | | $ | 4,516,745 |
| | | | | |
| Apparel Manufacturers – 1.5% | | | | | |
| NIKE, Inc., “B” | | 96,260 | | $ | 6,183,742 |
| | | | | |
| Automotive – 0.5% | | | | | |
| Johnson Controls, Inc. | | 54,790 | | $ | 1,974,632 |
| | | | | |
| Broadcasting – 2.0% | | | | | |
| Citadel Broadcasting Corp. (l) | | 4,905 | | $ | 10,104 |
| E.W. Scripps Co., “A” (l) | | 24,880 | | | 1,119,849 |
| Omnicom Group, Inc. | | 42,940 | | | 2,040,938 |
| Walt Disney Co. | | 96,940 | | | 3,129,223 |
| WPP Group PLC | | 134,160 | | | 1,717,611 |
| | | | | |
| | | | $ | 8,017,725 |
| | | | | |
| Brokerage & Asset Managers – 4.0% | | | | | |
| Franklin Resources, Inc. | | 31,480 | | $ | 3,602,256 |
| Goldman Sachs Group, Inc. | | 34,270 | | | 7,369,764 |
| Lehman Brothers Holdings, Inc. (l) | | 38,470 | | | 2,517,477 |
| Merrill Lynch & Co., Inc. | | 56,470 | | | 3,031,310 |
| | | | | |
| | | | $ | 16,520,807 |
| | | | | |
| Business Services – 1.2% | | | | | |
| Accenture Ltd., “A” | | 132,980 | | $ | 4,791,269 |
| | | | | |
| Chemicals – 2.1% | | | | | |
| Dow Chemical Co. | | 35,350 | | $ | 1,393,497 |
| PPG Industries, Inc. | | 87,530 | | | 6,147,232 |
| Syngenta AG | | 4,680 | | | 1,187,435 |
| | | | | |
| | | | $ | 8,728,164 |
| | | | | |
| Computer Software – 1.7% | | | | | |
| Oracle Corp. (a) | | 310,330 | | $ | 7,007,251 |
| | | | | |
| Computer Software – Systems – 2.0% | | | | | |
| Hewlett - Packard Co. | | 73,570 | | $ | 3,713,814 |
| International Business Machines Corp. | | 42,740 | | | 4,620,194 |
| | | | | |
| | | | $ | 8,334,008 |
| | | | | |
| Construction – 2.4% | | | | | |
| Masco Corp. (l) | | 230,940 | | $ | 4,990,613 |
| Sherwin - Williams Co. (l) | | 31,130 | | | 1,806,785 |
| Toll Brothers, Inc. (a)(l) | | 141,380 | | | 2,836,083 |
| | | | | |
| | | | $ | 9,633,481 |
| | | | | |
| Consumer Goods & Services – 2.0% | | | | | |
| Procter & Gamble Co. | | 111,870 | | $ | 8,213,495 |
| | | | | |
| Containers – 0.2% | | | | | |
| Smurfit - Stone Container Corp. (a)(l) | | 65,550 | | $ | 692,208 |
| | | | | |
| | | | | |
| Issuer | | Shares/Par | | Value ($) |
| COMMON STOCKS – continued | | | | | |
| Electrical Equipment – 1.4% | | | | | |
| Rockwell Automation, Inc. | | 39,410 | | $ | 2,717,714 |
| W.W. Grainger, Inc. (l) | | 36,220 | | | 3,169,974 |
| | | | | |
| | | | $ | 5,887,688 |
| | | | | |
| Electronics – 1.6% | | | | | |
| Intel Corp. | | 243,270 | | $ | 6,485,578 |
| | | | | |
| Energy – Independent – 3.2% | | | | | |
| Apache Corp. | | 41,950 | | $ | 4,511,303 |
| Devon Energy Corp. | | 60,310 | | | 5,362,162 |
| EOG Resources, Inc. | | 36,240 | | | 3,234,420 |
| | | | | |
| | | | $ | 13,107,885 |
| | | | | |
| Energy – Integrated – 10.9% | | | | | |
| Chevron Corp. | | 38,135 | | $ | 3,559,140 |
| ConocoPhillips | | 65,190 | | | 5,756,277 |
| Exxon Mobil Corp. | | 128,232 | | | 12,014,056 |
| Hess Corp. | | 74,300 | | | 7,493,898 |
| Marathon Oil Corp. | | 42,120 | | | 2,563,423 |
| Royal Dutch Shell PLC, ADR | | 27,300 | | | 2,298,660 |
| TOTAL S.A., ADR | | 133,690 | | | 11,042,794 |
| | | | | |
| | | | $ | 44,728,248 |
| | | | | |
| Food & Beverages – 3.6% | | | | | |
| General Mills, Inc. | | 42,230 | | $ | 2,407,110 |
| Kellogg Co. | | 85,950 | | | 4,506,359 |
| Nestle S.A. | | 10,805 | | | 4,950,998 |
| PepsiCo, Inc. | | 38,638 | | | 2,932,624 |
| | | | | |
| | | | $ | 14,797,091 |
| | | | | |
| Food & Drug Stores – 0.9% | | | | | |
| CVS Caremark Corp. | | 90,308 | | $ | 3,589,743 |
| | | | | |
| Gaming & Lodging – 1.3% | | | | | |
| Royal Caribbean Cruises Ltd. (l) | | 124,610 | | $ | 5,288,448 |
| | | | | |
| General Merchandise – 1.2% | | | | | |
| Macy’s, Inc. | | 188,970 | | $ | 4,888,654 |
| | | | | |
| Health Maintenance Organizations – 2.2% | | | | | |
| UnitedHealth Group, Inc. | | 52,820 | | $ | 3,074,124 |
| WellPoint, Inc. (a) | | 68,680 | | | 6,025,296 |
| | | | | |
| | | | $ | 9,099,420 |
| | | | | |
| Insurance – 8.7% | | | | | |
| Allstate Corp. | | 244,330 | | $ | 12,761,356 |
| Chubb Corp. | | 46,850 | | | 2,557,073 |
| Genworth Financial, Inc., “A” | | 128,530 | | | 3,271,088 |
| Hartford Financial Services Group, Inc. | | 45,200 | | | 3,940,988 |
| MetLife, Inc. | | 165,100 | | | 10,173,462 |
| Prudential Financial, Inc. | | 32,820 | | | 3,053,573 |
| | | | | |
| | | | $ | 35,757,540 |
| | | | | |
| Machinery & Tools – 0.7% | | | | | |
| Deere & Co. | | 7,380 | | $ | 687,226 |
| Eaton Corp. | | 14,200 | | | 1,376,690 |
| Timken Co. | | 29,520 | | | 969,732 |
| | | | | |
| | | | $ | 3,033,648 |
| | | | | |
6
Portfolio of Investments – continued
| | | | | |
| Issuer | | Shares/Par | | Value ($) |
| COMMON STOCKS – continued | | | | | |
| Major Banks – 7.4% | | | | | |
| Bank of America Corp. | | 224,184 | | $ | 9,249,832 |
| Bank of New York Mellon Corp. | | 173,075 | | | 8,439,137 |
| PNC Financial Services Group, Inc. | | 60,900 | | | 3,998,085 |
| State Street Corp. | | 47,040 | | | 3,819,648 |
| SunTrust Banks, Inc. | | 75,660 | | | 4,727,993 |
| | | | | |
| | | | $ | 30,234,695 |
| | | | | |
| Other Banks & Diversified Financials – 5.6% | | | | | |
| American Express Co. | | 50,070 | | $ | 2,604,641 |
| Citigroup, Inc. | | 218,380 | | | 6,429,107 |
| Fannie Mae | | 149,070 | | | 5,959,819 |
| Freddie Mac | | 34,380 | | | 1,171,327 |
| UBS AG | | 142,120 | | | 6,599,969 |
| | | | | |
| | | | $ | 22,764,863 |
| | | | | |
| Pharmaceuticals – 7.5% | | | | | |
| Abbott Laboratories | | 46,160 | | $ | 2,591,884 |
| GlaxoSmithKline PLC | | 82,970 | | | 2,105,516 |
| Johnson & Johnson | | 156,580 | | | 10,443,886 |
| Merck & Co., Inc. | | 120,940 | | | 7,027,823 |
| Pfizer, Inc. | | 84,850 | | | 1,928,641 |
| Wyeth | | 152,280 | | | 6,729,253 |
| | | | | |
| | | | $ | 30,827,003 |
| | | | | |
| Railroad & Shipping – 0.9% | | | | | |
| Burlington Northern Santa Fe Corp. | | 38,460 | | $ | 3,201,026 |
| Norfolk Southern Corp. | | 9,410 | | | 474,640 |
| | | | | |
| | | | $ | 3,675,666 |
| | | | | |
| Specialty Chemicals – 1.3% | | | | | |
| Air Products & Chemicals, Inc. | | 29,477 | | $ | 2,907,317 |
| Praxair, Inc. | | 24,570 | | | 2,179,605 |
| | | | | |
| | | | $ | 5,086,922 |
| | | | | |
| Specialty Stores – 0.9% | | | | | |
| Advance Auto Parts, Inc. | | 22,530 | | $ | 855,915 |
| Lowe’s Cos., Inc. | | 26,110 | | | 590,608 |
| Staples, Inc. | | 98,500 | | | 2,272,395 |
| | | | | |
| | | | $ | 3,718,918 |
| | | | | |
| Telecommunications – Wireless – 1.7% | | | | | |
| Sprint Nextel Corp. | | 192,810 | | $ | 2,531,595 |
| Vodafone Group PLC | | 1,178,567 | | | 4,392,535 |
| | | | | |
| | | | $ | 6,924,130 |
| | | | | |
| Telephone Services – 2.5% | | | | | |
| AT&T, Inc. | | 109,400 | | $ | 4,546,664 |
| Embarq Corp. | | 58,594 | | | 2,902,161 |
| TELUS Corp. (non - voting shares) | | 16,274 | | | 791,646 |
| Verizon Communications, Inc. | | 47,980 | | | 2,096,246 |
| | | | | |
| | | | $ | 10,336,717 |
| | | | | |
| Tobacco – 3.8% | | | | | |
| Altria Group, Inc. | | 206,890 | | $ | 15,636,746 |
| | | | | |
| | | | | | | |
| Issuer | | Shares/Par | | Value ($) | |
| COMMON STOCKS – continued | | | | | | | |
| Utilities – Electric Power – 4.1% | | | | | | | |
| Dominion Resources, Inc. (l) | | | 110,958 | | $ | 5,264,957 | |
| Entergy Corp. | | | 27,740 | | | 3,315,485 | |
| FPL Group, Inc. | | | 57,770 | | | 3,915,651 | |
| PG&E Corp. | | | 31,210 | | | 1,344,839 | |
| PPL Corp. | | | 26,920 | | | 1,402,263 | |
| Public Service Enterprise Group, Inc. | | | 16,410 | | $ | 1,612,118 | |
| | | | | | | |
| | | | | $ | 16,855,313 | |
| | | | | | | |
Total Common Stocks
(Identified Cost, $307,890,314) | | | | | $ | 409,550,336 | |
| | | | | | | |
| | |
| SHORT-TERM OBLIGATIONS – 0.1% | | | | | | | |
| American Express Credit Corp., 4.12%, due 1/02/08, at Amortized Cost and Value (y) | | $ | 219,000 | | $ | 218,975 | |
| | | | | | | |
| |
| COLLATERAL FOR SECURITIES LOANED – 4.6% | | | | |
| Navigator Securities Lending Prime Portfolio, at Cost and Net Asset Value | | | 18,904,997 | | $ | 18,904,997 | |
| | | | | | | |
Total Investments
(Identified Cost, $327,014,286) | | | | | $ | 428,674,308 | |
| | | | | | | |
OTHER ASSETS, LESS
LIABILITIES – (4.7)% | | | (19,122,777 | ) |
| | | | | | | |
| Net Assets – 100.0% | | | | | $ | 409,551,531 | |
| | | | | | | |
| (a) | Non-income producing security. |
| (l) | All or a portion of this security is on loan. |
| (y) | The rate shown represents an annualized yield at time of purchase. |
The following abbreviations are used in this report and are defined:
| ADR | American Depository Receipt |
See Notes to Financial Statements
7
FINANCIAL STATEMENTS | STATEMENT OF ASSETS AND LIABILITIES
This statement represents your fund’s’ balance sheet, which details the assets and liabilities comprising the total value of the fund.
| | | | |
| At 12/31/07 | | | | |
| Assets: | | | | |
| Investments, at value including $18,435,674 of securities on loan (identified cost $327,014,286) | | $428,674,308 | | |
| Receivable for investments sold | | 719,454 | | |
| Receivable for fund shares sold | | 391 | | |
| Interest and dividends receivable | | 640,696 | | |
| Other assets | | 13,551 | | |
| Total assets | | | | $430,048,400 |
| Liabilities: | | | | |
| Payable to custodian | | $2,168 | | |
| Payable for investments purchased | | 703,723 | | |
| Payable for fund shares reacquired | | 709,317 | | |
| Collateral for securities loaned, at value | | 18,904,997 | | |
| Payable to affiliates | | | | |
Management fee | | 33,933 | | |
Distribution fees | | 3,907 | | |
Administrative services fee | | 1,064 | | |
| Payable for independent trustees’ compensation | | 1,395 | | |
| Accrued expenses and other liabilities | | 136,365 | | |
| Total liabilities | | | | $20,496,869 |
| Net assets | | | | $409,551,531 |
| Net assets consist of: | | | | |
| Paid-in capital | | $249,898,334 | | |
| Unrealized appreciation (depreciation) on investments and translation of assets and liabilities in foreign currencies | | 101,657,103 | | |
| Accumulated net realized gain (loss) on investments and foreign currency transactions | | 52,006,102 | | |
| Undistributed net investment income | | 5,989,992 | | |
Net assets | | | | $409,551,531 |
| Shares of beneficial interest outstanding | | | | 21,857,822 |
| Initial Class shares | | | | |
Net Assets | | $267,967,441 | | |
Shares outstanding | | 14,268,722 | | |
Net asset value per share | | | | $18.78 |
| Service Class shares | | | | |
Net Assets | | $141,584,090 | | |
Shares outstanding | | 7,589,100 | | |
Net asset value per share | | | | $18.66 |
See Notes to Financial Statements
8
FINANCIAL STATEMENTS | STATEMENT OF OPERATIONS
This statement describes how much your fund earned in investment income and accrued in expenses. It also describes any gains and/or losses generated by fund operations.
| | | | | | |
| Year ended 12/31/07 | | | | | | |
| Net Investment income | | | | | | |
| Income | | | | | | |
Dividends | | $10,073,688 | | | | |
Interest | | 193,663 | | | | |
Foreign taxes withheld | | (133,224 | ) | | | |
| Total investment income | | | | | $10,134,127 | |
| Expenses | | | | | | |
Management fee | | $3,401,119 | | | | |
Distribution fees | | 363,590 | | | | |
Administrative services fee | | 118,991 | | | | |
Independent trustees’ compensation | | 43,260 | | | | |
Custodian fee | | 101,035 | | | | |
Shareholder communications | | 25,833 | | | | |
Auditing fees | | 41,993 | | | | |
Legal fees | | 5,949 | | | | |
Miscellaneous | | 38,901 | | | | |
| Total expenses | | | | | $4,140,671 | |
Fees paid indirectly | | (1,527 | ) | | | |
| Net expenses | | | | | $4,139,144 | |
| Net investment income | | | | | $5,994,983 | |
| Realized and unrealized gain (loss) on investments and foreign currency transactions | | | | | | |
| Realized gain (loss) (identified cost basis) | | | | | | |
Investment transactions | | $53,104,359 | | | | |
Foreign currency transactions | | 27 | | | | |
| Net realized gain (loss) on investments and foreign currency transactions | | | | | $53,104,386 | |
| Change in unrealized appreciation (depreciation) | | | | | | |
Investments | | $(23,649,280 | ) | | | |
Translation of assets and liabilities in foreign currencies | | (4,690 | ) | | | |
| Net unrealized gain (loss) on investments and foreign currency translation | | | | | $(23,653,970 | ) |
| Net realized and unrealized gain (loss) on investments and foreign currency | | | | | $29,450,416 | |
| Change in net assets from operations | | | | | $35,445,399 | |
See Notes to Financial Statements
9
FINANCIAL STATEMENTS | STATEMENTS OF CHANGES IN NET ASSETS
These statements describe the increases and/or decreases in net assets resulting from operations, any distributions, and any shareholder transactions.
| | | | | | |
| For years ended 12/31 | | 2007 | | | 2006 | |
| Change in net assets | | | | | | |
| From operations | | | | | | |
| Net investment income | | $5,994,983 | | | $6,900,070 | |
| Net realized gain (loss) on investments and foreign currency transactions | | 53,104,386 | | | 25,849,450 | |
| Net unrealized gain (loss) on investments and foreign currency translation | | (23,653,970 | ) | | 52,348,771 | |
| Change in net assets from operations | | $35,445,399 | | | $85,098,291 | |
| Distributions declared to shareholders | | | | | | |
| From net investment income | | | | | | |
| Initial Class | | $(4,956,730 | ) | | $(4,852,928 | ) |
| Service Class | | (1,958,742 | ) | | (1,683,628 | ) |
| From net realized gain on investments | | | | | | |
| Initial Class | | (18,004,251 | ) | | (11,895,426 | ) |
| Service Class | | (8,308,499 | ) | | (4,878,814 | ) |
| Total distributions declared to shareholders | | $(33,228,222 | ) | | $(23,310,796 | ) |
| Change in net assets from fund share transactions | | $(57,093,670 | ) | | $(44,120,463 | ) |
| Total change in net assets | | $(54,876,493 | ) | | $17,667,032 | |
| Net assets | | | | | | |
| At beginning of period | | 464,428,024 | | | 446,760,992 | |
| At the end of period (including undistributed net investment income of $5,989,992 and $6,910,454, respectively) | | $409,551,531 | | | $464,428,024 | |
See Notes to Financial Statements
10
FINANCIAL STATEMENTS | FINANCIAL HIGHLIGHTS
The financial highlights table is intended to help you understand the fund’s financial performance for the past 5 years. Certain information reflects financial results for a single fund share. The total returns in the table represent the rate by which an investor would have earned (or lost) on an investment in the fund share class (assuming reinvestment of all distributions) held for the entire period.
Initial Class
| | | | | | | | | | | | | | | |
| | | Years ended 12/31 | |
| | | 2007 | | | 2006 | | | 2005 | | | 2004 | | | 2003 | |
| Net asset value, beginning of period | | $18.70 | | | $16.30 | | | $15.51 | | | $13.61 | | | $11.05 | |
| Income (loss) from investment operations | | | | | | | | | | | | | | | |
| Net investment income (d) | | $0.27 | | | $0.28 | | | $0.24 | | | $0.21 | | | $0.19 | |
Net realized and unrealized gain (loss) on investments and
foreign currency | | 1.22 | | | 3.04 | | | 0.77 | | | 1.87 | | | 2.56 | |
| Total from investment operations | | $1.49 | | | $3.32 | | | $1.01 | | | $2.08 | | | $2.75 | |
| Less distributions declared to shareholders | | | | | | | | | | | | | | | |
| From net investment income | | $(0.30 | ) | | $(0.27 | ) | | $(0.22 | ) | | $(0.18 | ) | | $(0.19 | ) |
| From net realized gain on investments | | (1.11 | ) | | (0.65 | ) | | — | | | — | | | — | |
| Total distributions declared to shareholders | | $(1.41 | ) | | $(0.92 | ) | | $(0.22 | ) | | $(0.18 | ) | | $(0.19 | ) |
| Net asset value, end of period | | $18.78 | | | $18.70 | | | $16.30 | | | $15.51 | | | $13.61 | |
| Total return (%) (k)(s) | | 7.92 | | | 20.96 | | | 6.60 | | | 15.52 | (b) | | 25.31 | |
Ratios (%) (to average net assets)
and Supplemental data: | | | | | | | | | | | | | | | |
| Expenses (f) | | 0.83 | | | 0.86 | | | 0.85 | | | 0.83 | | | 0.84 | |
| Net investment income | | 1.40 | | | 1.62 | | | 1.51 | | | 1.53 | | | 1.65 | |
| Portfolio turnover | | 25 | | | 26 | | | 22 | | | 36 | | | 57 | |
| Net assets at end of period (000 Omitted) | | $267,967 | | | $323,094 | | | $319,952 | | | $339,705 | | | $310,818 | |
See Notes to Financial Statements
11
Financial Highlights – continued
Service Class
| | | | | | | | | | | | | | | |
| | | Years ended 12/31 | |
| | | 2007 | | | 2006 | | | 2005 | | | 2004 | | | 2003 | |
| Net asset value, beginning of period | | $18.59 | | | $16.21 | | | $15.43 | | | $13.56 | | | $11.01 | |
| Income (loss) from investment operations | | | | | | | | | | | | | | | |
| Net investment income (d) | | $0.22 | | | $0.23 | | | $0.20 | | | $0.18 | | | $0.16 | |
| Net realized and unrealized gain (loss) on investments and foreign currency | | 1.22 | | | 3.02 | | | 0.77 | | | 1.85 | | | 2.56 | |
| Total from investment operations | | $1.44 | | | $3.25 | | | $0.97 | | | $2.03 | | | $2.72 | |
| Less distributions declared to shareholders | | | | | | | | | | | | | | | |
| From net investment income | | $(0.26 | ) | | $(0.22 | ) | | $(0.19 | ) | | $(0.16 | ) | | $(0.17 | ) |
| From net realized gain on investments | | (1.11 | ) | | (0.65 | ) | | — | | | — | | | — | |
| Total distributions declared to shareholders | | $(1.37 | ) | | $(0.87 | ) | | $(0.19 | ) | | $(0.16 | ) | | $(0.17 | ) |
| Net asset value, end of period | | $18.66 | | | $18.59 | | | $16.21 | | | $15.43 | | | $13.56 | |
| Total return (%) (k)(s) | | 7.67 | | | 20.66 | | | 6.34 | | | 15.18 | (b) | | 25.09 | |
Ratios (%) (to average net assets)
and Supplemental data: | | | | | | | | | | | | | | | |
| Expenses (f) | | 1.08 | | | 1.11 | | | 1.10 | | | 1.08 | | | 1.09 | |
| Net investment income | | 1.16 | | | 1.37 | | | 1.27 | | | 1.28 | | | 1.39 | |
| Portfolio turnover | | 25 | | | 26 | | | 22 | | | 36 | | | 57 | |
| Net assets at end of period (000 Omitted) | | $141,584 | | | $141,334 | | | $126,809 | | | $119,496 | | | $83,780 | |
| (b) | The fund’s net asset value and total return calculation include a non-recurring accrual recorded as a result of an administrative proceeding regarding disclosure of brokerage allocation practices in connection with fund sales. The non-recurring accrual did not have a material impact on the net asset value per share based on the shares outstanding on the day the proceeds were recorded. |
| (d) | Per share data are based on average shares outstanding. |
| (f) | Ratios do not reflect reductions from fees paid indirectly, if applicable. |
| (k) | The total return does not reflect expenses that apply to separate accounts. Inclusion of these charges would reduce the total return figures for all periods shown. |
| (s) | From time to time the fund may receive proceeds from litigation settlements, without which performance would be lower. |
See Notes to Financial Statements
12
NOTES TO FINANCIAL STATEMENTS
| (1) | | Business and Organization |
MFS Value Portfolio (formerly Value Series) (the fund) is a series of MFS Variable Insurance Trust II (formerly known as MFS/Sun Life Series Trust) (the trust). The trust is organized as a Massachusetts business trust and is registered under the Investment Company Act of 1940, as amended, as an open-end management investment company. The shares of the fund are sold to variable accounts established by insurance companies to fund benefits under variable contracts issued by such companies, and qualified retirement and pension plans.
| (2) | | Significant Accounting Policies |
General – The preparation of financial statements in conformity with U.S. generally accepted accounting principles requires management to make estimates and assumptions that affect the reported amounts of assets and liabilities, and disclosure of contingent assets and liabilities at the date of the financial statements and the reported amounts of revenues and expenses during the reporting period. Actual results could differ from those estimates. The fund can invest in foreign securities. Investments in foreign securities are vulnerable to the effects of changes in the relative values of the local currency and the U.S. dollar and to the effects of changes in each country’s legal, political, and economic environment.
Investment Valuations – Equity securities, including restricted equity securities, are generally valued at the last sale or official closing price as reported by an independent pricing service on the market or exchange on which they are primarily traded. For securities for which there were no sales reported that day, equity securities are generally valued at the last quoted daily bid quotation as reported by an independent pricing service on the market or exchange on which they are primarily traded. For securities held short for which there were no sales reported for the day, the position is generally valued at the last quoted daily ask quotation as reported by an independent pricing service on the market or exchange on which such securities are primarily traded. Short-term instruments with a maturity at issuance of 60 days or less may be valued at amortized cost, which approximates market value. Open-end investment companies are generally valued at their net asset value per share. Securities and other assets generally valued on the basis of information from an independent pricing service may also be valued at a broker-dealer bid quotation. The values of foreign securities and other assets and liabilities expressed in foreign currencies are converted to U.S. dollars using the mean of bid and asked prices for rates reported by an independent pricing service.
The Board of Trustees has delegated primary responsibility for determining or causing to be determined the value of the fund’s investments (including any fair valuation) to the adviser pursuant to valuation policies and procedures approved by the Board. If the adviser determines that reliable market quotations are not readily available, investments are valued at fair value as determined in good faith by the adviser in accordance with such procedures under the oversight of the Board of Trustees. Under the fund’s valuation policies and procedures, market quotations are not considered to be readily available for many types of debt instruments and certain types of derivatives. These investments are generally valued at fair value based on information from independent pricing services. In addition, investments may be valued at fair value if the adviser determines that an investment’s value has been materially affected by events occurring after the close of the exchange or market on which the investment is principally traded (such as foreign exchange or market) and prior to the determination of the fund’s net asset value, or after the halting of trading of a specific security where trading does not resume prior to the close of the exchange or market on which the security is principally traded. Events that occur on a frequent basis after foreign markets close (such as developments in foreign markets and significant movements in the U.S. markets) and prior to the determination of the fund’s net asset value may be deemed to have a material affect on the value of securities traded in foreign markets. Accordingly, the fund’s foreign equity securities may often be valued at fair value. The adviser may rely on independent pricing services or other information (such as the correlation with price movements of similar securities in the same or other markets; the type, cost and investment characteristics of the security; the business and financial condition of the issuer; and trading and other market data) to assist in determining whether to fair value and at what value to fair value an investment. The value of an investment for purposes of calculating the fund’s net asset value can differ depending on the source and method used to determine value. When fair valuation is used, the value of investments used to determine the fund’s net asset value may differ from quoted or published prices for the same investments.
In September 2006, FASB Statement No. 157, Fair Value Measurements (the “Statement”) was issued, and is effective for fiscal years beginning after November 15, 2007 and for all interim periods within those fiscal years. This Statement provides a single definition of fair value, a hierarchy for measuring fair value and expanded disclosures about fair value measurements. Management is evaluating the application of the Statement to the fund, and believes the impact will be limited to expanded disclosures resulting from the adoption of this Statement in the fund’s financial statements.
Foreign Currency Translation – Purchases and sales of foreign investments, income, and expenses are converted into U.S. dollars based upon currency exchange rates prevailing on the respective dates of such transactions. Gains and losses attributable to foreign currency exchange rates on sales of securities are recorded for financial statement purposes as net realized gains and losses on investments. Gains and losses attributable to foreign exchange rate movements on income and
13
Notes to Financial Statements – continued
expenses are recorded for financial statement purposes as foreign currency transaction gains and losses. That portion of both realized and unrealized gains and losses on investments that results from fluctuations in foreign currency exchange rates is not separately disclosed.
Security Loans – State Street Bank and Trust Company (“State Street”), as lending agent, may loan the securities of the fund to certain qualified institutions (the “Borrowers”) approved by the fund. The loans are collateralized at all times by cash and/or U.S. Treasury securities in an amount at least equal to the market value of the securities loaned. State Street provides the fund with indemnification against Borrower default. The fund bears the risk of loss with respect to the investment of cash collateral. On loans collateralized by cash, the cash collateral is invested in a money market fund or short-term securities. A portion of the income generated upon investment of the collateral is remitted to the Borrowers, and the remainder is allocated between the fund and the lending agent. On loans collateralized by U.S. Treasury securities, a fee is received from the Borrower, and is allocated between the fund and the lending agent. Net income from securities lending is included in interest income on the Statement of Operations. The dividend and interest income earned on the securities loaned is accounted for in the same manner as other dividend and interest income.
Indemnifications – Under the fund’s organizational documents, its officers and trustees may be indemnified against certain liabilities and expenses arising out of the performance of their duties to the fund. Additionally, in the normal course of business, the fund enters into agreements with service providers that may contain indemnification clauses. The fund’s maximum exposure under these agreements is unknown as this would involve future claims that may be made against the fund that have not yet occurred.
Investment Transactions and Income – Investment transactions are recorded on the trade date. Interest income is recorded on the accrual basis. All premium and discount is amortized or accreted for financial statement purposes in accordance with U.S. generally accepted accounting principles. All discount is accreted for tax reporting purposes as required by federal income tax regulations. Dividends received in cash are recorded on the ex-dividend date. Certain dividends from foreign securities will be recorded when the fund is informed of the dividend if such information is obtained subsequent to the ex-dividend date. Dividend and interest payments received in additional securities are recorded on the ex-dividend or ex-interest date in an amount equal to the value of the security on such date.
The fund may receive proceeds from litigation settlements. Any proceeds received from litigation involving portfolio holdings are reflected in the Statement of Operations in realized gain/loss if the security has been disposed of by the fund or in unrealized gain/loss if the security is still held by the fund. Any other proceeds from litigation not related to portfolio holdings are reflected as other income in the Statement of Operations.
Fees Paid Indirectly – The fund’s custody fee may be reduced according to an arrangement that measures the value of cash deposited with the custodian by the fund. This amount, for the year ended December 31, 2007, is shown as a reduction of total expenses on the Statement of Operations.
Tax Matters and Distributions – The fund intends to qualify as a regulated investment company, as defined under Subchapter M of the Internal Revenue Code, and to distribute all of its taxable income, including realized capital gains. As a result, no provision for federal income tax is required. The fund adopted the provisions of FASB Interpretation No. 48, Accounting for Uncertainty in Income Taxes (“the Interpretation”) on January 1, 2007. The Interpretation prescribes a minimum threshold for financial statement recognition of the benefit of a tax position taken or expected to be taken in a tax return. There was no impact resulting from the adoption of this Interpretation on the fund’s financial statements. Each of the fund’s federal tax returns for the prior three fiscal years remains subject to examination by the Internal Revenue Service. It is the fund’s policy to record interest and penalty charges on underpaid taxes associated with its tax positions as interest expense and other expense, respectively. No such charges were recorded in the current financial statements. Foreign taxes, if any, have been accrued by the fund in the accompanying financial statements.
Distributions to shareholders are recorded on the ex-dividend date. Income and capital gain distributions are determined in accordance with income tax regulations, which may differ from U.S. generally accepted accounting principles. Certain capital accounts in the financial statements are periodically adjusted for permanent differences in order to reflect their tax character. These adjustments have no impact on net assets or net asset value per share. Temporary differences which arise from recognizing certain items of income, expense, gain or loss in different periods for financial statement and tax purposes will reverse at some time in the future. Distributions in excess of net investment income or net realized gains are temporary overdistributions for financial statement purposes resulting from differences in the recognition or classification of income or distributions for financial statement and tax purposes.
Book/tax differences primarily relate to wash sale loss deferrals.
14
Notes to Financial Statements – continued
The tax character of distributions declared to shareholders is as follows:
| | | | |
| | | 12/31/07 | | 12/31/06 |
| Ordinary income (including any short-term capital gains) | | $7,811,648 | | $6,536,556 |
| Long-term capital gain | | 25,416,574 | | 16,774,240 |
| Total distributions | | $33,228,222 | | $23,310,796 |
The federal tax cost and the tax basis components of distributable earnings were as follows:
| | | |
| As of 12/31/07 | | | |
| Cost of investments | | $328,266,156 | |
| Gross appreciation | | 115,562,583 | |
| Gross depreciation | | (15,154,431 | ) |
| Net unrealized appreciation (depreciation) | | $100,408,152 | |
| Undistributed ordinary income | | 8,683,703 | |
| Undistributed long-term capital gain | | 50,591,730 | |
| Other temporary differences | | (30,388 | ) |
Multiple Classes of Shares of Beneficial Interest – The fund offers multiple classes of shares, which differ in their respective distribution fees. All shareholders bear the common expenses of the fund based on daily net assets of each class, without distinction between share classes. Dividends are declared separately for each class. Differences in per share dividend rates are generally due to differences in separate class expenses.
| (3) | | Transactions with Affiliates |
Investment Adviser – The fund has an investment advisory agreement with Massachusetts Financial Services Company (MFS) to provide overall investment management and related administrative services and facilities to the fund. The management fee is computed daily and paid monthly at the following annual rates:
| | |
| First $1 billion of average daily net assets | | 0.75% |
| Average daily net assets in excess of $1 billion | | 0.65% |
The management fee incurred for the year ended December 31, 2007 was equivalent to an annual effective rate of 0.75% of the fund’s average daily net assets.
The investment adviser has agreed to pay a portion of the fund’s operating expenses, exclusive of certain other fees and expenses, such that the operating expenses of the fund do not exceed 0.90% for the Initial Class shares and 1.15% for the Service Class shares, based on the average daily net assets of the fund. This written agreement will continue through August 31, 2008 unless changed or rescinded by the fund’s Board of Trustees. For the year ended December 31, 2007, the fund’s actual operating expenses did not exceed the limit and therefore, the investment adviser did not pay any portion of the fund’s expenses.
Distributor – MFS Fund Distributors, Inc. (MFD), a wholly-owned subsidiary of MFS, is the distributor of shares of the fund. The Trustees have adopted a distribution plan for the Service Class shares pursuant to Rule 12b-1 under the Investment Company Act of 1940.
The fund’s distribution plan provides that the fund will pay MFD distribution fees equal to 0.25% per annum of its average daily net assets attributable to Service Class shares as partial consideration for services performed and expenses incurred by MFD and financial intermediaries in connection with the sale and distribution of the fund’s Service Class shares and the sale and distribution of the variable annuity or variable life insurance contracts investing indirectly in Service Class shares. MFD may subsequently pay all, or a portion, of the distribution fees to financial intermediaries.
Shareholder Servicing Agent – MFS Service Center, Inc. (MFSC), a wholly-owned subsidiary of MFS, has contracted to provide transfer agent and recordkeeping functions in connection with the issuance, transfer, and redemption of each class of shares of the fund under a Shareholder Servicing Agent Agreement. During the year ended December 31, 2007, MFSC did not receive a fee for this service.
Administrator – MFS provides certain financial, legal, shareholder communications, compliance, and other administrative services to the fund. Under an administrative services agreement, the fund partially reimburses MFS the costs incurred to provide these services. The fund is charged an annual fixed amount of $10,000 plus a fee based on average daily net assets.
The administrative services fee incurred for the year ended December 31, 2007 was equivalent to an annual effective rate of 0.0263% of the fund’s average daily net assets.
15
Notes to Financial Statements – continued
Trustees’ and Officers’ Compensation – The fund pays compensation to trustees in the form of a retainer, attendance fees, and additional compensation to the Board chairperson. The fund does not pay compensation directly to officers of the fund who are also officers of the investment adviser, all of whom receive remuneration for their services to the fund from MFS. Certain officers of the fund are officers or directors of MFS, MFD, and MFSC.
Other – This fund and certain other MFS funds (the funds) have entered into a services agreement (the Agreement) which provides for payment of fees by the funds to Tarantino LLC in return for the provision of services of an Independent Chief Compliance Officer (ICCO) for the funds. The ICCO is an officer of the funds and the sole member of Tarantino LLC. The funds can terminate the Agreement with Tarantino LLC at any time under the terms of the Agreement. MFS has agreed to bear all expenses associated with office space, other administrative support, and supplies provided to the ICCO. For the year ended December 31, 2007, the fee paid to Tarantino LLC was $2,217.
Purchases and sales of investments, other than U.S. government securities, purchased option transactions, and short-term obligations, aggregated $110,841,270 and $192,579,893, respectively.
| (5) | | Shares of Beneficial Interest |
The fund’s Declaration of Trust permits the Trustees to issue an unlimited number of full and fractional shares of beneficial interest. Transactions in fund shares were as follows:
| | | | | | | | | | | | |
| | | Year ended 12/31/07 | | | Year ended 12/31/06 | |
| | | Shares | | | Amount | | | Shares | | | Amount | |
| Shares sold | | | | | | | | | | | | |
Initial Class | | 230,880 | | | $4,385,870 | | | 353,749 | | | $6,188,916 | |
Service Class | | 441,487 | | | 8,316,726 | | | 474,451 | | | 8,113,573 | |
| | 672,367 | | | $12,702,596 | | | 828,200 | | | $14,302,489 | |
| Shares issued to shareholders in reinvestment of distributions | | | | | | | | | | | | |
Initial Class | | 1,215,510 | | | $22,960,981 | | | 992,201 | | | $16,748,354 | |
Service Class | | 546,130 | | | 10,267,241 | | | 390,389 | | | 6,562,442 | |
| | 1,761,640 | | | $33,228,222 | | | 1,382,590 | | | $23,310,796 | |
| Shares reacquired | | | | | | | | | | | | |
Initial Class | | (4,454,852 | ) | | $(84,197,974 | ) | | (3,701,196 | ) | | $(63,174,279 | ) |
Service Class | | (1,001,443 | ) | | (18,826,514 | ) | | (1,086,414 | ) | | (18,559,469 | ) |
| | (5,456,295 | ) | | $(103,024,488 | ) | | (4,787,610 | ) | | $(81,733,748 | ) |
| Net change | | | | | | | | | | | | |
Initial Class | | (3,008,462 | ) | | $(56,851,123 | ) | | (2,355,246 | ) | | $(40,237,009 | ) |
Service Class | | (13,826 | ) | | (242,547 | ) | | (221,574 | ) | | (3,883,454 | ) |
| | (3,022,288 | ) | | $(57,093,670 | ) | | (2,576,820 | ) | | $(44,120,463 | ) |
The fund and other funds managed by MFS participate in a $1 billion unsecured committed line of credit provided by a syndication of banks under a credit agreement. In addition, the fund and other funds managed by MFS have established uncommitted borrowing arrangements with certain banks. Borrowings may be made for temporary financing needs. Interest is charged to each fund, based on its borrowings, generally at a rate equal to the Federal Reserve funds rate plus 0.30%. In addition, a commitment fee, based on the average daily, unused portion of the committed line of credit, is allocated among the participating funds at the end of each calendar quarter. For the year ended December 31, 2007, the fund’s commitment fee and interest expense were $2,162 and $255, respectively, and are included in miscellaneous expense on the Statement of Operations.
16
REPORT OF INDEPENDENT REGISTERED PUBLIC ACCOUNTING FIRM
To the Board of Trustees of MFS Variable Insurance Trust II, (formerly known as MFS/Sun Life Series Trust) and the Shareholders of MFS Value Portfolio (formerly known as Value Series):
We have audited the accompanying statement of assets and liabilities, including the portfolio of investments, of MFS Value Portfolio (one of the portfolios comprising MFS Variable Insurance Trust II) (the “Trust”) as of December 31, 2007, and the related statement of operations for the year then ended, the statements of changes in net assets for each of the two years in the period then ended, and the financial highlights for each of the five years in the period then ended. These financial statements and financial highlights are the responsibility of the Trust’s management. Our responsibility is to express an opinion on these financial statements and financial highlights based on our audits.
We conducted our audits in accordance with the standards of the Public Company Accounting Oversight Board (United States). Those standards require that we plan and perform the audit to obtain reasonable assurance about whether the financial statements and financial highlights are free of material misstatement. The Trust is not required to have, nor were we engaged to perform, an audit of its internal control over financial reporting. Our audits included consideration of internal control over financial reporting as a basis for designing audit procedures that are appropriate in the circumstances, but not for the purpose of expressing an opinion on the effectiveness of the Trust’s internal control over financial reporting. Accordingly, we express no such opinion. An audit also includes examining, on a test basis, evidence supporting the amounts and disclosures in the financial statements, assessing the accounting principles used and significant estimates made by management, as well as evaluating the overall financial statement presentation. Our procedures included confirmation of securities owned as of December 31, 2007, by correspondence with the custodian and brokers; where replies were not received from brokers, we performed other auditing procedures. We believe that our audits provide a reasonable basis for our opinion.
In our opinion, such financial statements and financial highlights present fairly, in all material respects, the financial position of MFS Value Portfolio as of December 31, 2007, the results of its operations for the year then ended, the changes in its net assets for each of the two years in the period then ended, and its financial highlights for each of the five years in the period then ended, in conformity with accounting principles generally accepted in the United States of America.
DELOITTE & TOUCHE LLP
Boston, Massachusetts
February 15, 2008
17
TRUSTEES AND OFFICERS – IDENTIFICATION AND BACKGROUND
The Trustees and officers of the Trust, as of February 1, 2008, are listed below, together with their principal occupations during the past five years. (Their titles may have varied during that period.) The address of each Trustee and officer is 500 Boylston Street, Boston, Massachusetts 02116.
| | | | | | |
Name, Date of Birth | | Position(s) Held
with Fund | | Trustee/Officer
Since(1) | | Principal Occupations During the Past Five Years &
Other Directorships(2) |
| INTERESTED TRUSTEE | | | | | | |
David D. Horn(3) (born 06/07/41) | | Trustee | | April 1986 | | Private investor; Retired; Sun Life Assurance Company of Canada, Former Senior Vice President and General Manager for the United States (until 1997); Retired: Sun Life Assurance Company of Canada, Director (until March 2004) |
| | |
| INDEPENDENT TRUSTEES | | | | |
J. Kermit Birchfield (born 01/08/40) | | Chairman | | May 1997 | | Consultant; Century Partners, Inc. (investments), Director (1988 to present); Displaytech, Inc. (technology), Director (1995 to present); Dessin Fournir LLC (furniture manufacturer), Director (2005 to present); Intermountain Gas Company, Inc. & Intermountain Industries, Inc. (oil & gas exploration and production) (1988 to present); Site Watch LLC (software to monitor oil tanks) Managing Director (2006 to present); Juridica Investments (fund investing in judicial matters) Director (2007 to present); Dairy Mart Convenience Stores, Inc. (convenience stores), Chairman (1997 to 2003) |
| | | |
Robert C. Bishop (born 01/13/43) | | Trustee | | May 2001 | | Autolmmune Inc. (pharmaceutical product licensing), Chairman, President and Chief Executive Officer (1992 to present); Caliper Life Sciences Corp. (laboratory analytical instruments), Director (2002 to present); Millipore Corporation (biopharmaceutical/research laboratory products), Director (1997 to present); Optobionics Corporation (ophthalmic devices), Director (2002 to 2007); Quintiles Transnational Corp. (contract research services), Director (until 2003) |
| | | |
Frederick H. Dulles (born 03/12/42) | | Trustee | | May 2001 | | Ten State International Law PLLC (law firm), Of Counsel (since 2006); Prudential Carolina Real Estate, (real estate), Broker (since 2006); Free Enterprise Foundation, Inc. (research institute), Director & Secretary (until 2008); Disher, Hamrick & Myers Residential, Inc. (real estate) Broker (until 2006); Frederick H. Dulles law practice (until 2006); Ten State Street LLP (law firm), Member (until 2005); McFadden, Pilkington & Ward LLP (solicitors and registered foreign lawyers), Member & Of Counsel (until 2003) |
| | | |
Marcia A. Kean (born 06/30/48) | | Trustee | | April 2005 | | Feinstein Kean Healthcare (consulting), Chief Executive Officer (since December 2002), Managing Director (prior to May 2001); Ardais Corporation (biotech products), Senior Vice President – Commercialization (February 2002 until November 2002) |
| | | |
Ronald G. Steinhart (born 06/15/40) | | Trustee | | May 2001 | | Private investor; Penske Automotive Group (automotive retailer), Director (2001 to present); Penson Worldwide, Inc. (securities clearance), Director (2006 to present); Animal Health International, Inc. (animal health products), Director (2007 to present); Texas Industries (concrete/aggregates/cement), Director (2007 to present); Carreker Corporation (technology consulting) Director (until 2005); Prentiss Properties Trust (real estate investment trust), Director (until 2006) |
| | | |
Haviland Wright (born 07/21/48) | | Trustee | | May 2001 | | Elixir Technologies Corporation (software) Director (2005 to present); Nano Loa Inc. (liquid crystal displays), Director (2003 to present); Silk Displays, Inc. (smart polymers) Director (2007 to present); Displaytech, Inc. (technology) Chairman and CEO (1995 – 2002) |
| | | |
| TRUSTEE EMERITUS | | | | | | |
Samuel Adams (born 10/19/25) | | Trustee Emeritus | | | | Retired; Kirkpatrick & Lockhart Preston Gates Ellis LLP (law firm), Of Counsel |
| | | |
| OFFICERS | | | | | | |
Maria F. Dwyer(4) (born 12/01/58) | | President | | November 2005 | | Massachusetts Financial Services Company, Executive Vice President and Chief Regulatory Officer (since March 2004); Fidelity Management & Research Company, Vice President (prior to March 2004); Fidelity Group of Funds, President and Treasurer (prior to March 2004) |
| | | |
Tracy Atkinson(4) (born 12/30/64) | | Treasurer | | September 2005 | | Massachusetts Financial Services Company, Senior Vice President (since September 2004); PricewaterhouseCoopers LLP, Partner (prior to September 2004) |
| | | |
Christopher R. Bohane(4) (born 01/18/74) | | Assistant Secretary and Assistant Clerk | | July 2005 | | Massachusetts Financial Services Company, Vice President and Senior Counsel (since April 2003); Kirkpatrick & Lockhart LLP (law firm), Associate (prior to April 2003) |
18
Trustees and Officers – continued
| | | | | | |
Name, Date of Birth | | Position(s) Held
with Fund | | Trustee/Officer
Since(1) | | Principal Occupations During the Past Five Years &
Other Directorships(2) |
Ethan D. Corey(4) (born 11/21/63) | | Assistant Secretary and Assistant Clerk | | July 2005 | | Massachusetts Financial Services Company, Senior Vice President and Associate General Counsel (since April 2006); Special Counsel (prior to April 2006); Dechert LLP (law firm), Counsel (prior to December 2004) |
| | | |
David L. DiLorenzo(4) (born 08/10/68) | | Assistant Treasurer | | July 2005 | | Massachusetts Financial Services Company, Vice President (since June 2005); JP Morgan Investor Services, Vice President (January 2001 to June 2005) |
| | | |
Timothy M. Fagan(4) (born 07/10/68) | | Assistant Secretary and Assistant Clerk | | September 2005 | | Massachusetts Financial Services Company, Vice President and Senior Counsel (since September 2005); John Hancock Advisers, LLC, Vice President and Chief Compliance Officer (September 2004 to August 2005) Senior Attorney (prior to September 2004); John Hancock Group of Funds, Vice President and Chief Compliance Officer (September 2004 to December 2004) |
| | | |
Mark D. Fischer(4) (born 10/27/70) | | Assistant Treasurer | | July 2005 | | Massachusetts Financial Services Company, Vice President (since May 2005); JP Morgan Investment Management Company, Vice President (prior to May 2005) |
| | | |
Brian E. Langenfeld(4) (born 03/07/73) | | Assistant Secretary and Assistant Clerk | | May 2006 | | Massachusetts Financial Services Company, Assistant Vice President and Counsel (since May 2006); John Hancock Advisers, LLC, Assistant Vice President and Counsel (May 2005 to April 2006); John Hancock Advisers, LLC, Attorney and Assistant Secretary (prior to May 2005) |
| | | |
Ellen Moynihan(4) (born 11/13/57) | | Assistant Treasurer | | May 1997 | | Massachusetts Financial Services Company, Senior Vice President |
| | | |
Susan S. Newton(4) (born 03/07/50) | | Assistant Secretary and Assistant Clerk | | May 2005 | | Massachusetts Financial Services Company, Senior Vice President and Assistant General Counsel (since April 2005); John Hancock Advisers, LLC, Senior Vice President, Secretary and Chief Legal Officer (prior to April 2005); John Hancock Group of Funds, Senior Vice President, Secretary and Chief Legal Officer (prior to April 2005) |
| | | |
Susan A. Pereira(4) (born 11/05/70) | | Assistant Secretary and Assistant Clerk | | July 2005 | | Massachusetts Financial Services Company, Vice President and Senior Counsel (since June 2004); Bingham McCutchen LLP (law firm), Associate (January 2001 to June 2004) |
| | | |
Mark N. Polebaum(4) (born 05/01/52) | | Secretary and Assistant Clerk | | February 2006 | | Massachusetts Financial Services Company, Executive Vice President, General Counsel and Secretary (since January 2006); Wilmer Cutler Pickering Hale and Dorr LLP (law firm), Partner (prior to January 2006) |
| | | |
Frank L. Tarantino (born 03/07/44) | | Independent Chief Compliance Officer | | September 2004 | | Tarantino LLC (provider of compliance services), Principal (since June 2004); CRA Business Strategies Group (consulting services), Executive Vice President (April 2003 to June 2004); David L. Babson & Co. (investment adviser), Managing Director, Chief Administrative Officer and Director (February 1997 to March 2003) |
| | | |
Richard S. Weitzel(4) (born 7/16/70) | | Assistant Secretary and Assistant Clerk | | October 2007 | | Massachusetts Financial Services Company, Vice President and Assistant General Counsel (since 2007); Vice President and Senior Counsel (since May 2004); Massachusetts Department of Business and Technology, General Counsel (February 2003 to April 2004); Massachusetts Office of the Attorney General, Assistant Attorney General ( April 2001 to February 2003); Ropes and Gray, Associate (prior to April 2001) |
| | | |
James O. Yost(4) (born 06/12/60) | | Assistant Treasurer | | April 1992 | | Massachusetts Financial Services Company, Senior Vice President |
| (1) | Date first appointed to serve as Trustee/Officer of an MFS fund or a Compass variable account. Each Trustee has served continuously since appointment. |
| (2) | Directorships or trusteeships of companies required to report to the Securities and Exchange Commission (i.e., “public companies”). |
| (3) | “Interested person” of the Sun Life of Canada (U.S.), within the meaning of the Investment Company Act of 1940 (referred to as the 1940 Act), which is the principal federal law governing investment companies like the Series. The address of Sun Life of Canada (U.S.) is One Sun Life Executive Park, Wellesley Hills, Massachusetts 02481. |
| (4) | “Interested person” of MFS within the meaning of the 1940 Act. The address of MFS is 500 Boylston Street, Boston, Massachusetts 02116. |
The Trust does not hold annual meetings for the purpose of electing Trustees, and Trustees are not elected for fixed terms. Each Trustee and officer holds office until his or her successor is chosen and qualified, or until his or her earlier death, resignation, retirement or removal.
All Trustees currently serve as Trustees of the Trust and have served in that capacity since originally elected or appointed. All of the Trustees are also Managers of the Compass Variable Accounts. The executive officers of the Trust hold similar offices for the Compass Variable Accounts and other funds in the MFS fund complex. As of January 1, 2008, each Trustee serves as a Trustee or Manager of 35 Accounts/Funds.
19
Trustees and Officers – continued
The Statement of Additional Information contains further information about the Trustees and is available without charge upon request by calling 1-800-225-2606.
| | |
Investment Adviser
Massachusetts Financial Services Company 500 Boylston Street, Boston, MA 02116-3741 | | Custodian State Street Bank and Trust Company 225 Franklin Street, Boston, MA 02110 |
Distributor
MFS Fund Distributors, Inc. 500 Boylston Street, Boston, MA 02116-3741 | | Independent Registered Public Accounting Firm Deloitte & Touche LLP 200 Berkeley Street, Boston, MA 02116 |
Portfolio Managers Nevin Chitkara Steven Gorham | | |
20
BOARD REVIEW OF INVESTMENT ADVISORY AGREEMENT
The Investment Company Act of 1940 requires that both the full Board of Trustees and a majority of the non-interested (“independent”) Trustees, voting separately, annually approve the continuation of the investment advisory agreement between MFS Variable Insurance Trust II (the “Trust”) and Massachusetts Financial Services Company (MFS) on behalf of the Fund. The Trustees consider matters bearing on the Fund and the advisory arrangements at their meetings throughout the year, including a review of performance data at each regular meeting. In addition, the independent Trustees met several times over the course of three months beginning in May and ending in July 2007 (“contract review meetings”) for the specific purpose of considering whether to approve the continuation of the investment advisory agreement for the Fund. The independent Trustees were assisted in their evaluation of the investment advisory agreement by independent legal counsel, from whom they received separate legal advice and with whom they met separately from MFS management during various contract review meetings. The independent Trustees were also assisted in this process by the Fund’s Independent Chief Compliance Officer, a full-time senior officer appointed by and reporting to the independent Trustees.
In connection with their deliberations, the Trustees, including the independent Trustees, considered such information and factors as they believed, in light of the legal advice furnished to them and their own business judgment, to be relevant. The investment advisory agreement was considered separately for the Fund, although the Trustees also took into account the common interests of all Funds in the Trust in their review. As described below, the Trustees considered the nature, quality, and extent of the various investment advisory, administrative, and shareholder services performed by MFS under the existing investment advisory agreement and other arrangements with the Trust.
In connection with their contract review meetings, the Trustees received and relied upon materials which included, among other items: (i) information provided by Lipper Inc. on the investment performance of the Fund for various time periods ended December 31, 2006, compared to the investment performance of a group of funds with substantially similar investment classifications/objectives (the “Lipper performance universe”), as well as the investment performance of a group of funds identified by objective criteria suggested by MFS (“peer funds”), (ii) information provided by Lipper Inc. on the Fund’s advisory fees and other expenses compared to the advisory fees and other expenses of comparable funds identified by Lipper (the “Lipper expense group”), as well as the advisory fees and other expenses of peer funds identified by objective criteria suggested by MFS, (iii) information provided by MFS on the advisory fees of comparable portfolios of its other clients, including institutional separate account and other clients, (iv) information as to whether, and to what extent applicable, expense waivers, reimbursements or fee “breakpoints” are observed for the Fund, (v) information regarding MFS’ financial results and financial condition, including MFS’ and certain of its affiliates’ estimated profitability from services performed for the Fund, (vi) MFS’ views regarding the outlook for the mutual fund industry and its strategic business plans, (vii) descriptions of various functions performed by MFS for the Trust, such as compliance monitoring and portfolio trading practices, and (viii) information regarding the overall organization of MFS, including information about MFS’ senior management and other personnel providing investment advisory, administrative and other services to the Fund. The comparative performance, fee and expense information prepared and provided by Lipper Inc. was not independently verified, and the independent Trustees did not independently verify any information provided to them by MFS.
The Trustees’ conclusion as to the continuation of the investment advisory agreement was based on comprehensive consideration of all information provided to the Trustees and not the result of any single factor. Some of the factors that figured particularly in the Trustees’ deliberations are described below for the Fund, while individual Trustees may have given different weight to various factors and evaluated the information presented as a whole differently than another Trustee. The Trustees recognized that the fee arrangements for the Fund reflect years of review and discussion between the independent Trustees and MFS, that certain aspects of such arrangements may receive greater scrutiny in some years than others, and that the Trustees’ conclusions may be based, in part, on their consideration of these same arrangements during the course of the year and in prior years.
Based on information provided by Lipper Inc. and MFS, the Trustees compared the Fund’s total return investment performance to the performance of a peer group of funds over various time periods. The Trustees placed particular emphasis on the total return performance of the Fund’s Initial Class shares in comparison to the performance of funds in its Lipper performance universe over the one-, three- and five-year periods. The Trustees did not rely on performance results for more recent periods, including those shown elsewhere in this report.
The Trustees noted the performance of the Fund’s Initial Class shares was in the 1st quintile relative to the other funds in the Lipper Classification Index for the one-year period (the 1st quintile being the best performers and the 5th quintile being the worst performers). The total return performance of the Fund was also in the 1st quintile for both the three-year period and the five-year period ended December 31, 2006, relative to the Lipper performance universe. Based on the nature and quality of services provided by MFS, the Board of Trustees concluded that the Fund’s performance was satisfactory.
21
Board Review of Investment Advisory Agreement – continued
In the course of their deliberations, the Trustees took into account information provided by MFS during contract review meetings, as well as during investment review meetings conducted with portfolio management personnel during the course of the year.
In assessing the reasonableness of the Fund’s advisory fee, the Trustees considered, among other information, the Fund’s advisory fee and the total expense ratio of the Fund’s Initial Class shares as a percentage of average daily net assets, compared to the advisory fee and total expense ratios of its peer group of funds based on information provided by Lipper Inc. and MFS. The Trustees also considered the advisory fees charged by MFS to institutional accounts. In comparing these fees, the Trustees considered the generally broader scope of services provided by MFS to the Trust than those provided to institutional accounts. The Trustees also considered the higher demands placed on MFS’ investment personnel and trading infrastructure as a result of the daily cash in-flows and out-flows of the Fund, and the impact on MFS and related expenses due to the more extensive regulatory regime to which the Fund is subject, compared to institutional accounts.
In considering the fees, the Trustees noted from the Lipper data that the Fund’s effective advisory fee was approximately at the median and total expense ratio was above the median of such fees and expenses of funds in the Lipper expense group. In addition, the Trustees accepted MFS’ offer to continue the expense limitation for the Fund for the next year. The Trustees further concluded that the existing breakpoints were sufficient to allow the Fund to benefit from economies of scale as its assets grow.
The Trustees also considered information prepared by MFS relating to its costs and profits with respect to the Fund and other investment companies and accounts advised by MFS, as well as MFS’ methodologies used to determine and allocate its costs to the Fund and other accounts and products for purposes of estimating profitability.
After reviewing these and other factors described below, the Trustees concluded that the advisory fee charged to the Fund represents reasonable compensation in light of the nature and quality of the services being provided by MFS.
In addition, the Trustees considered MFS’ resources and related efforts to continue to retain, attract and motivate capable personnel to serve the Fund. The Trustees also considered the financial resources of MFS and its parent, Sun Life Financial Inc. The Trustees further considered any advantages and possible disadvantages of having an adviser which also serves other investment companies as well as institutional accounts.
The Trustees also considered the nature, quality, cost, and extent of administrative, transfer agency, and distribution services provided to the Fund by MFS and its affiliates under agreements and plans other than the investment advisory agreement, including the 12b-1 fees the Fund pays to MFS Fund Distributors, Inc., an affiliate of MFS. The Trustees also considered the nature, extent and quality of certain other services MFS performs or arranges on the Fund’s behalf, which may include securities lending programs, directed expense payment programs, class action recovery programs, and MFS’ interaction with third-party service providers, principally custodians and sub-custodians. The Trustees concluded that the various non-advisory services provided by MFS and its affiliates on behalf of the Fund were satisfactory. The Trustees also considered the benefits to MFS from the use of the Fund’s portfolio brokerage commissions to pay for research and other similar services (including MFS’ policy not to use “soft dollars” generated by Fund portfolio transactions to pay for third-party research), and various other factors. Additionally, the Trustees considered so-called “fall-out benefits” to MFS such as reputational value derived from serving as investment manager to the Trust, and determined that any such benefits derived by MFS were reasonable and fair.
Based on their evaluation of factors that they deemed to be material, including those factors described above, the Board of Trustees, including a majority of the independent Trustees, concluded that the investment advisory agreement should be continued for an additional one-year period, commencing September 1, 2007.
A discussion regarding the Board’s most recent review and renewal of the Fund’s investment advisory agreement is available by clicking on the Fund’s name under “Variable Insurance Portfolios” on the “Products & Performance” page on the MFS Web site (mfs.com).
22
PROXY VOTING POLICIES AND INFORMATION
A general description of the MFS funds’ proxy voting policies and procedures is available without charge, upon request, by calling 1-800-225-2606, by visiting the About MFS section of mfs.com or by visiting the SEC’s Web site at http://www.sec.gov.
Information regarding how the fund voted proxies relating to portfolio securities during the most recent twelve-month period ended June 30 is available without charge by visiting the Proxy Voting section of mfs.com or by visiting the SEC’s Web site at http://www.sec.gov.
QUARTERLY PORTFOLIO DISCLOSURE
The fund will file a complete schedule of portfolio holdings with the Securities and Exchange Commission (the Commission) for the first and third quarters of each fiscal year on Form N-Q. The fund’s Form N-Q may be reviewed and copied at the:
Public Reference Room
Securities and Exchange Commission
100 F Street, NE, Room 1580
Washington, D.C. 20549
Information on the operation of the Public Reference Room may be obtained by calling the Commission at 1-800-SEC-0330. The fund’s Form N-Q is available on the EDGAR database on the Commission’s Internet Web site at http://www.sec.gov, and copies of this information may be obtained, upon payment of a duplicating fee, by electronic request at the following e-mail address: publicinfo@sec.gov or by writing the Public Reference Section at the above address.
A shareholder can also obtain the quarterly portfolio holdings report at mfs.com.
FEDERAL TAX INFORMATION (unaudited)
The following information is provided pursuant to provisions of the Internal Revenue Code.
The fund designates $25,416,574 as capital gain dividends paid during the fiscal year.
For corporate shareholders, 100% of the ordinary income dividends paid during the fiscal year qualify for the corporate dividends received deduction.
23
MFS® PRIVACY NOTICE
Privacy is a concern for every investor today. At MFS Investment Management® and the MFS funds, we take this concern very seriously. We want you to understand our policies about the investment products and services that we offer, and how we protect the nonpublic personal information of investors who have a direct relationship with us and our wholly owned subsidiaries.
Throughout our business relationship, you provide us with personal information. We maintain information and records about you, your investments, and the services you use. Examples of the nonpublic personal information we maintain include
| | Ÿ | | data from investment applications and other forms |
| | Ÿ | | share balances and transactional history with us, our affiliates, or others |
| | Ÿ | | facts from a consumer reporting agency |
We do not disclose any nonpublic personal information about our customers or former customers to anyone, except as permitted by law. We may share nonpublic personal information with third parties or certain of our affiliates in connection with servicing your account or processing your transactions. We may share information with companies or financial institutions that perform marketing services on our behalf or with other financial institutions with which we have joint marketing arrangements, subject to any legal requirements.
Authorization to access your nonpublic personal information is limited to appropriate personnel who provide products, services, or information to you. We maintain physical, electronic, and procedural safeguards to help protect the personal information we collect about you.
If you have any questions about the MFS privacy policy, please call 1-800-225-2606 any business day between 8 a.m. and 8 p.m. Eastern time.
Note: If you own MFS products or receive MFS services in the name of a third party such as a bank or broker-dealer, their privacy policy may apply to you instead of ours.
24
CONTACT US
Web site
mfs.com
Account service and
literature
Shareholders
1-877-411-3325
9 a.m. to 5 p.m. ET
Investment professionals
1-800-637-8630
8 a.m. to 5 p.m. ET
Mailing address
MFS Service Center, Inc.
Attn: Institutional Alliance Services (IAS)
P.O. Box 55824
Boston, MA
02205-5824
Overnight mail
MFS Service Center, Inc.
Attn: Institutional Alliance Services (IAS)
500 Boylston Street
Boston, MA 02116-3741


MFS® Variable Insurance Trust IISM
Annual report
MFS® International Value Portfolio
(formerly International Value Series)
12/31/07
FCG-ANN
MFS® INTERNATIONAL VALUE PORTFOLIO
(formerly International Value Series)
The report is prepared for the general information of contract owners. It is authorized for distribution to prospective investors only when preceded or accompanied by a current prospectus.
NOT FDIC INSURED MAY LOSE VALUE NO BANK OR CREDIT UNION GUARANTEE NOT A DEPOSIT NOT INSURED BY ANY FEDERAL GOVERNMENT AGENCY OR NCUA/NCUSIF
LETTER FROM THE CEO

Dear Contract Owners:
The past year has been a great example of why investors should keep their eyes on the long term.
In 2006 the Dow Jones Industrial Average returned 19% and was fairly stable. This year we have seen a greater level of volatility than has been experienced in recent years. The Dow hit several new highs but also experienced swift drops as a global credit crisis swept through markets, spurred by defaults on U.S. subprime loans and a liquidity crunch. Still, even with this volatility, the Dow ended the first three quarters of 2007 with a return near 13%.
U.S. Treasury bonds gained ground, especially in the third quarter as investors sought less risky asset classes. The spreads of many lower-quality debt investments widened.
In 2007 the U.S. dollar fell against the euro, oil prices hit their highest levels yet, and gold spiked to its steepest price in 28 years. Around the globe, stocks sold off as risk aversion mounted. As we have said before, markets can be volatile, and investors should make sure they have an investment plan that can carry them through the peaks and troughs.
If you are focused on a long-term investment strategy, the short-term ups and downs of the markets should not necessarily dictate portfolio action on your part. In our view, investors who remain committed to a long-term plan are more likely to achieve their financial goals.
In any market environment, we believe individual investors are best served by following a three-pronged investment strategy of allocating their holdings across the major asset classes, diversifying within each class, and regularly rebalancing their portfolios to maintain their desired allocations. Of course, these strategies cannot guarantee a profit or protect against a loss. Investing and planning for the long term require diligence and patience, two traits that in our experience are essential to capitalizing on the many opportunities the financial markets can offer — through both up and down economic cycles.
Respectfully,

Robert J. Manning
Chief Executive Officer and Chief Investment Officer
MFS Investment Management®
February 15, 2008
The opinions expressed in this letter are subject to change, may not be relied upon for investment advice, and no forecasts can be guaranteed.
1
PORTFOLIO COMPOSITION
Portfolio structure
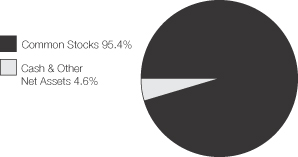
| | |
| Top ten holdings | | |
| Nestle S.A. | | 4.2% |
| TOTAL S.A., ADR | | 3.5% |
| Novartis AG | | 3.1% |
| GlaxoSmithKline PLC | | 3.1% |
| Royal Dutch Shell PLC, “A’’ | | 2.8% |
| Vodafone Group PLC | | 2.5% |
| ING Groep N.V. | | 2.5% |
| Credit Agricole S.A. | | 2.4% |
| Royal Bank of Scotland Group PLC | | 2.0% |
| E.ON AG | | 2.0% |
| | |
| Equity sectors | | |
| Financial Services | | 20.2% |
| Utilities & Communications | | 12.2% |
| Health Care | | 11.2% |
| Energy | | 10.6% |
| Consumer Staples | | 10.1% |
| Technology | | 5.7% |
| Leisure | | 5.5% |
| Industrial Goods & Services | | 4.9% |
| Autos & Housing | | 4.8% |
| Transportation | | 3.6% |
| Basic Materials | | 3.0% |
| Special Products & Services | | 1.9% |
| Retailing | | 1.7% |
| | |
| Country weightings | | |
| Japan | | 20.3% |
| United Kingdom | | 18.9% |
| Switzerland | | 10.2% |
| France | | 8.7% |
| Netherlands | | 8.3% |
| Germany | | 7.9% |
| Norway | | 3.1% |
| South Korea | | 3.1% |
| Sweden | | 2.1% |
| Other Countries | | 17.4% |
Percentages are based on net assets as of 12/31/07.
The portfolio is actively managed and current holdings may be different.
2
MANAGEMENT REVIEW
Summary of Results
For the twelve months ended December 31, 2007, Initial Class shares of the MFS International Value Portfolio (the “fund”) provided a total return of 7.35%, while Service Class shares provided a total return of 7.04%. These compare with a return of 6.49% for the fund’s benchmark, the MSCI EAFE Value Index. The fund’s other benchmark, the MSCI EAFE Index, generated a return of 11.63%.
Market Environment
Despite seemingly robust growth rates during the second and third quarters of 2007, underlying economic activity in the U.S. remained muted relative to other major economies. Overall, global economies witnessed moderate to strong growth during the reporting period as domestic demand improved and world trade accelerated.
With the strong global growth, however, concerns emerged about rising global inflation, especially as capacity became more constrained, wages rose, and energy and food prices advanced. During the reporting period, global central banks (with the exception of the U.S. Federal Reserve Board) tightened monetary conditions, which in turn pushed global bond yields to their highest levels during this economic expansion.
However, financial markets – particularly in the mortgage and structured-products areas – experienced substantial volatility in recent months. Beginning in late July, heightened uncertainty and distress concerning the subprime mortgage market caused several global credit markets to tighten up, forcing central banks to inject liquidity and to reassess their tightening biases as sovereign bond yields declined and credit spreads widened. While credit conditions improved somewhat by late October as the Federal Reserve Board cut interest rates, the level of market turbulence remained significant through year end. Increased market turmoil was also exacerbated by U.S. home foreclosures and uncertainties surrounding falling housing prices. Despite increased volatility across all asset classes and the widening in credit spreads, U.S. labor markets were resilient and wages rose modestly. More broadly, global equity markets rebounded following summer losses and generally held those gains through the end of the reporting period.
Contributors to performance
Our underweighted position in the financial services sector helped performance relative to the MSCI EAFE Value Index. Our decision to avoid several stocks that underperformed the benchmark, including financial services firms HBOS PLC (U.K.), Barclays (U.K.), Mitsubishi UFJ Financial (Japan), and investment management and banking firm UBS (Switzerland) aided relative results. Our relative positioning in banking firm HSBC(g) (U.K.) was also a positive factor.
Overweighting the consumer staples sector added value in comparison to benchmark. The fund’s positioning in tobacco distributor British American Tobacco(aa) (g) (U.K.) bolstered results as the stock turned in superior results.
Stock selection within the utilities and communications sector helped performance. Our positioning in telecommunications company Telefonica(aa) (Spain) was a top contributor.
Stocks in other sectors that benefited performance included oil and gas exploration and production company PTT Public Co. Ltd. (Thailand) and oil and gas refiner Statoil (Norway). Our avoidance of poor-performing car maker Toyota (Japan) also helped.
Detractors from performance
The health care, special products and services, and transportation sectors were the top detractors from performance relative to the fund’s benchmark. Within health care, overweighting the sector hurt results. Pharmaceutical company Novartis(aa) (Switzerland) was a key detractor as the company underperformed the benchmark. Although special products and services and transportation were top detracting sectors, no individual positions within either sector were among the fund’s top detractors.
Several stocks in other sectors dampened performance, including banking firm Credit Agricole (France), Japanese consumer credit firms, Aiful and Takefuji, television network operator Fuji Television (Japan), food products manufacturer Nong Shim(aa) (Korea), and real estate developer Deutsche Wohnen(aa) (Germany).
Not holding several strong-performing benchmark constituents also hurt performance. These included automotive manufacturer Daimler Chrysler (Germany) and banking firms ABN Amro (Netherlands) and Commonwealth Bank of Australia (Australia).
3
Management review – continued
During the reporting period, currency exposure was a detractor from the fund’s relative performance. All of MFS’ investment decisions are driven by the fundamentals of each individual opportunity and, as such, it is common for our Portfolios to have different currency exposure than the benchmark.
Respectfully,
Barnaby Wiener
Portfolio Manager
| (aa) | Security is not a benchmark constituent. |
| (g) | Security was not held in the portfolio at period end. |
The views expressed in this report are those of the portfolio manager only through the end of the period of the report as stated on the cover and do not necessarily reflect the views of MFS or any other person in the MFS organization. These views are subject to change at any time based on market or other conditions, and MFS disclaims any responsibility to update such views. These views may not be relied upon as investment advice or an indication of trading intent on behalf of any MFS portfolio. References to specific securities are not recommendations of such securities, and may not be representative of any MFS portfolio’s current or future investments.
4
PERFORMANCE SUMMARY THROUGH 12/31/07
The following chart illustrates the historical performance of the fund in comparison to its benchmark index. Index comparisons are unmanaged; do not reflect any fees or expenses, and cannot be invested in directly. The performance of other share classes will be greater than or less than that of the class depicted below. (See Notes to Performance Summary.)
Performance data shown represents past performance and is no guarantee of future results. Investment return and principal value fluctuate so your units, when sold, may be worth more or less than the original cost; current performance may be lower or higher than quoted. The performance shown does not reflect the deduction of taxes, if any, that a contract holder would pay on fund distributions or the redemption of contract units. The returns for the fund shown also do not reflect the deduction of expenses associated with variable products, such as mortality and expense risk charges, separate account charges, and sales charges imposed by the insurance company separate accounts. Such expenses would reduce the overall returns shown.
Growth of a hypothetical $10,000 investment
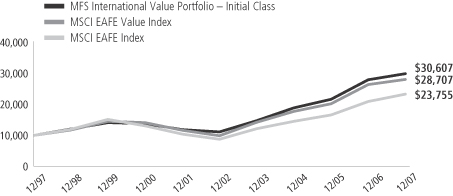
Total returns through 12/31/07
Average Annual Total Returns
| | | | | | | | | | | | |
| | | Share class | | Class inception date | | 1-yr | | 5-yr | | 10-yr | | |
| | | Initial Class | | 10/02/95 | | 7.35% | | 22.28% | | 11.84% | | |
| | | Service Class | | 8/24/01 | | 7.04% | | 21.97% | | 11.68% | | |
Comparative Index
| | | | | | | | | | | | |
| | | MSCI EAFE Value Index (f) | | 6.49% | | 23.82% | | 11.12% | | |
| | | MSCI EAFE Index (f) | | 11.63% | | 22.08% | | 9.04% | | |
| (f) | Source: FactSet Research Systems Inc. |
Index Definitions
Morgan Stanley Capital International (MSCI) EAFE (Europe, Australasia, Far East) Index – a market capitalization-weighted index that is designed to measure equity market performance in the developed markets, excluding the U.S. and Canada.
Morgan Stanley Capital International (MSCI) EAFE (Europe, Australasia, Far East) Value Index – a market capitalization-weighted index that is designed to measure equity market performance for value securities in the developed markets, excluding the U.S. and Canada.
It is not possible to invest directly in an index.
Notes to Performance Summary
Service Class share performance includes the performance of the fund’s Initial Class shares for periods prior to the inception of Service Class shares (blended performance). This blended performance figure has not been adjusted to take into account differences in the class-specific operating expenses (such as Rule 12b-1 fees). Because operating expenses of Service Class shares are generally higher than those of Initial Class shares, the blended Service Class shares performance shown is higher than it would have been had Service Class shares been offered for the entire period.
5
Performance summary – continued
Performance results reflect any applicable expense subsidies and waivers in effect during the periods shown. Without such subsidies and waivers the fund’s performance results would be less favorable. Please see the prospectus for complete details. All results are historical and assume the reinvestment of any dividends and capital gains distributions.
From time to time the fund may receive proceeds from litigation settlements, without which performance would be lower.
6
EXPENSE TABLE
Fund Expenses Borne by the Contract Holders During the Period,
July 1, 2007 through December 31, 2007
As a contract holder of the fund, you incur ongoing costs, including management fees; distribution (12b-1) fees; and other fund expenses. This example is intended to help you understand your ongoing costs (in dollars) of investing in the fund and to compare these costs with the ongoing costs of investing in other mutual funds.
The example is based on an investment of $1,000 invested at the beginning of the period and held for the entire period, July 1, 2007 through December 31, 2007.
Actual expenses
The first line for each share class in the following table provides information about actual account values and actual expenses. You may use the information in this line, together with the amount you invested, to estimate the expenses that you paid over the period. Simply divide your account value by $1,000 (for example, an $8,600 account value divided by $1,000 = 8.6), then multiply the result by the number in the first line under the heading entitled “Expenses Paid During Period” to estimate the expenses you paid on your account during this period.
Hypothetical example for comparison purposes
The second line for each share class in the following table provides information about hypothetical account values and hypothetical expenses based on the fund’s actual expense ratio and an assumed rate of return of 5% per year before expenses, which is not the fund’s actual return. The hypothetical account values and expenses may not be used to estimate the actual ending account balance or expenses you paid for the period. You may use this information to compare the ongoing costs of investing in the fund and other funds. To do so, compare this 5% hypothetical example with the 5% hypothetical examples that appear in the shareholder reports of the other funds.
Please note that the expenses shown in the table are meant to highlight the fund’s ongoing costs only and do not take into account the fees and expenses imposed under the variable contracts through which your investment in the fund is made. Therefore, the second line for each share class in the table is useful in comparing ongoing costs associated with an investment in vehicles (such as the fund) which fund benefits under variable annuity and variable life insurance contracts and to qualified pension and retirement plans only, and will not help you determine the relative total costs of investing in the fund through variable annuity and variable life insurance contracts. If the fees and expenses imposed under the variable contracts were included, your costs would have been higher.
| | | | | | | | | | |
| Share Class | | | | Annualized
Expense Ratio | | Beginning
Account Value
7/01/07 | | Ending
Account Value
12/31/07 | | Expenses Paid
During Period (p)
7/01/07 - 12/31/07 |
Initial Class | | Actual | | 1.04% | | $1,000.00 | | $991.50 | | $5.22 |
| | Hypothetical (h) | | 1.04% | | $1,000.00 | | $1,019.96 | | $5.30 |
| Service Class | | Actual | | 1.30% | | $1,000.00 | | $989.90 | | $6.52 |
| | Hypothetical (h) | | 1.30% | | $1,000.00 | | $1,018.65 | | $6.61 |
| (h) | 5% class return per year before expenses. |
| (p) | Expenses paid is equal to each class’ annualized expense ratio, as shown above, multiplied by the average account value over the period, multiplied by the number of days in the period, divided by the number of days in the year. |
7
PORTFOLIO OF INVESTMENTS – 12/31/07
The Portfolio of Investments is a complete list of all securities owned by your fund.
It is categorized by broad-based asset classes.
| | | | | |
| Issuer | | Shares/Par | | Value ($) |
| | | | | |
| COMMON STOCKS – 95.4% | | | | | |
| Alcoholic Beverages – 1.1% | | | | | |
| Heineken N.V. | | 57,360 | | $ | 3,694,261 |
| | | | | |
| Apparel Manufacturers – 0.3% | | | | | |
| Sanyo Shokai Ltd. (l) | | 165,400 | | $ | 894,254 |
| | | | | |
| Automotive – 1.5% | | | | | |
| Bayerische Motoren Werke AG | | 72,740 | | $ | 4,491,774 |
| Kongsberg Automotive A.S.A. | | 91,820 | | | 674,635 |
| | | | | |
| | | | $ | 5,166,409 |
| | | | | |
| Broadcasting – 3.1% | | | | | |
| Fuji Television Network, Inc. | | 1,440 | | $ | 2,384,639 |
| Nippon Television Network Corp. | | 12,030 | | | 1,614,194 |
| Vivendi S.A. | | 80,870 | | | 3,685,031 |
| WPP Group PLC | | 225,090 | | | 2,881,761 |
| | | | | |
| | | | $ | 10,565,625 |
| | | | | |
| Brokerage & Asset Managers – 0.4% | | | | | |
| Van Lanschot N.V. (l) | | 13,440 | | $ | 1,444,272 |
| | | | | |
| Business Services – 1.9% | | | | | |
| Bunzl PLC | | 160,250 | | $ | 2,246,669 |
| Intertek Group PLC | | 73,690 | | | 1,444,761 |
| USS Co. Ltd. | | 43,750 | | | 2,714,342 |
| | | | | |
| | | | $ | 6,405,772 |
| | | | | |
| Cable TV – 0.4% | | | | | |
| Premiere AG (a)(l) | | 71,175 | | $ | 1,336,944 |
| | | | | |
| Chemicals – 0.5% | | | | | |
| Syngenta AG | | 6,067 | | $ | 1,539,352 |
| | | | | |
| Computer Software – Systems – 0.8% | | | | | |
| Fujitsu Ltd. | | 399,000 | | $ | 2,670,083 |
| | | | | |
| Construction – 3.3% | | | | | |
| CRH PLC | | 104,080 | | $ | 3,613,726 |
| Fletcher Building Ltd. (l) | | 179,148 | | | 1,582,696 |
| Geberit AG | | 17,652 | | | 2,406,570 |
| Nexity International | | 30,480 | | | 1,384,885 |
| Sekisui Chemical Co. Ltd. | | 348,000 | | | 2,345,647 |
| | | | | |
| | | | $ | 11,333,524 |
| | | | | |
| Consumer Goods & Services – 4.2% | | | | | |
| Henkel KGaA, IPS | | 111,930 | | $ | 6,274,268 |
| Kao Corp. | | 166,000 | | | 4,992,705 |
| Uni-Charm Corp. | | 48,600 | | | 3,060,034 |
| | | | | |
| | | | $ | 14,327,007 |
| | | | | |
| Electrical Equipment – 3.2% | | | | | |
| Legrand S.A. | | 128,110 | | $ | 4,351,419 |
| OMRON Corp. | | 123,400 | | | 2,920,809 |
| Spectris PLC | | 259,180 | | | 3,493,347 |
| | | | | |
| | | | $ | 10,765,575 |
| | | | | |
| Electronics – 4.9% | | | | | |
| Hirose Electric Co. Ltd. | | 9,300 | | $ | 1,075,558 |
| Konica Minolta Holdings, Inc. | | 120,500 | | | 2,120,913 |
| Ricoh Co. Ltd. | | 123,000 | | | 2,262,214 |
| Samsung Electronics Co. Ltd. | | 7,501 | | | 4,408,795 |
| | | | | |
| Issuer | | Shares/Par | | Value ($) |
| | | | | |
| COMMON STOCKS – continued | | | | | |
| Electronics – continued | | | | | |
Taiwan Semiconductor Manufacturing Co.
Ltd., ADR | | 518,059 | | $ | 5,159,868 |
| Venture Corp. Ltd. | | 204,000 | | | 1,786,357 |
| | | | | |
| | | | $ | 16,813,705 |
| | | | | |
| Energy – Independent – 1.9% | | | | | |
| Apache Corp. | | 16,350 | | $ | 1,758,279 |
| INPEX Holdings, Inc. | | 259 | | | 2,786,019 |
| PTT Public Co. Ltd. | | 185,000 | | | 2,065,014 |
| | | | | |
| | | | $ | 6,609,312 |
| | | | | |
| Energy – Integrated – 8.1% | | | | | |
| Royal Dutch Shell PLC, “A” | | 230,600 | | $ | 9,714,691 |
| Statoil A.S.A. | | 196,630 | | | 6,079,643 |
| TOTAL S.A., ADR | | 144,940 | | | 11,972,044 |
| | | | | |
| | | | $ | 27,766,378 |
| | | | | |
| Food & Beverages – 4.8% | | | | | |
| Binggrae Co. Ltd. (a) | | 12,520 | | $ | 504,251 |
| Nestle S.A. | | 31,158 | | | 14,277,020 |
| Nong Shim Co. Ltd. (a) | | 8,259 | | | 1,709,777 |
| | | | | |
| | | | $ | 16,491,048 |
| | | | | |
| Food & Drug Stores – 0.9% | | | | | |
| Lawson, Inc. | | 86,200 | | $ | 3,055,561 |
| | | | | |
| Forest & Paper Products – 1.1% | | | | | |
| M-Real Oyj, “B” (l) | | 249,630 | | $ | 1,177,373 |
| UPM-Kymmene Corp. | | 126,340 | | | 2,531,293 |
| | | | | |
| | | | $ | 3,708,666 |
| | | | | |
| General Merchandise – 0.1% | | | | | |
| Daiei, Inc. (a)(l) | | 58,000 | | $ | 309,523 |
| | | | | |
| Insurance – 2.9% | | | | | |
| Aviva PLC | | 228,110 | | $ | 3,029,796 |
| Benfield Group PLC | | 347,280 | | | 1,945,307 |
| Catlin Group Ltd. | | 115,440 | | | 877,419 |
| Hiscox Ltd. | | 279,862 | | | 1,585,985 |
| Jardine Lloyd Thompson Group PLC | | 383,330 | | | 2,519,815 |
| | | | | |
| | | | $ | 9,958,322 |
| | | | | |
| Leisure & Toys – 1.2% | | | | | |
| Heiwa Corp. (l) | | 105,600 | | $ | 933,919 |
| NAMCO BANDAI Holdings, Inc. (l) | | 93,400 | | | 1,479,179 |
| Sankyo Co. Ltd. | | 35,600 | | | 1,653,887 |
| | | | | |
| | | | $ | 4,066,985 |
| | | | | |
| Machinery & Tools – 1.7% | | | | | |
| Assa Abloy AB, “B” | | 191,670 | | $ | 3,813,267 |
| GEA Group AG (a) | | 60,660 | | | 2,095,091 |
| | | | | |
| | | | $ | 5,908,358 |
| | | | | |
| Major Banks – 6.9% | | | | | |
| Credit Agricole S.A. (l) | | 243,546 | | $ | 8,169,931 |
| First Financial Holding Co. Ltd. | | 2,434,000 | | | 1,787,852 |
| Royal Bank of Scotland Group PLC | | 758,816 | | | 6,821,858 |
| Svenska Handelsbanken AB, “A” | | 101,200 | | | 3,209,939 |
| UniCredito Italiano S.p.A. | | 431,530 | | | 3,590,754 |
| | | | | |
| | | | $ | 23,580,334 |
| | | | | |
8
Portfolio of Investments – continued
| | | | | |
| Issuer | | Shares/Par | | Value ($) |
| | | | | |
| COMMON STOCKS – continued | | | | | |
| Metals & Mining – 1.4% | | | | | |
| Anglo American PLC | | 47,002 | | $ | 2,848,504 |
| Nyrstar (a) | | 83,207 | | | 2,001,189 |
| | | | | |
| | | | $ | 4,849,693 |
| | | | | |
| Natural Gas – Distribution – 1.1% | | | | | |
| Tokyo Gas Co. Ltd. | | 794,000 | | $ | 3,707,082 |
| | | | | |
| Oil Services – 0.6% | | | | | |
| Fugro N.V. | | 24,772 | | $ | 1,898,803 |
| | | | | |
| Other Banks & Diversified Financials – 9.5% | | | |
| Aiful Corp. (l) | | 51,850 | | $ | 912,734 |
| Bangkok Bank Public Co. Ltd. | | 450,500 | | | 1,592,519 |
| Dah Sing Financial Holdings Ltd. | | 148,000 | | | 1,458,134 |
| DNB Holding A.S.A. | | 252,960 | | | 3,836,396 |
| Hachijuni Bank Ltd. (l) | | 288,000 | | | 1,936,607 |
| ING Groep N.V. | | 218,610 | | | 8,532,909 |
| Joyo Bank Ltd. | | 296,000 | | | 1,650,318 |
| Krungthai Card PLC | | 712,600 | | | 655,799 |
| Sapporo Hokuyo Holdings, Inc. | | 165 | | | 1,482,051 |
| Shinhan Financial Group Co. Ltd. (a) | | 68,910 | | | 3,953,857 |
| Siam City Bank Public Co. Ltd. | | 2,138,800 | | | 952,412 |
| SNS REAAL Groep N.V. | | 61,110 | | | 1,366,353 |
| Takefuji Corp. | | 65,800 | | | 1,579,789 |
| Unione di Banche Italiane Scpa | | 92,047 | | | 2,533,739 |
| | | | | |
| | | | $ | 32,443,617 |
| | | | | |
| Pharmaceuticals – 11.2% | | | | | |
| Astellas Pharma, Inc. | | 99,200 | | $ | 4,324,433 |
| GlaxoSmithKline PLC | | 420,800 | | | 10,678,570 |
| Hisamitsu Pharmaceutical Co., Inc. | | 84,600 | | | 2,574,766 |
| Merck KGaA | | 22,610 | | | 2,904,463 |
| Novartis AG | | 196,220 | | | 10,689,719 |
| Roche Holding AG | | 34,600 | | | 5,959,897 |
| Tanabe Seiyaku Co. Ltd. | | 115,000 | | | 1,083,472 |
| | | | | |
| | | | $ | 38,215,320 |
| | | | | |
| Printing & Publishing – 0.8% | | | | | |
| Reed Elsevier PLC | | 202,390 | | $ | 2,723,121 |
| | | | | |
| Railroad & Shipping – 0.4% | | | | | |
| SMRT Corp. Ltd. | | 1,321,820 | | $ | 1,533,620 |
| | | | | |
| Real Estate – 0.5% | | | | | |
| Deutsche Wohnen AG | | 55,960 | | $ | 1,721,070 |
| | | | | |
| Specialty Stores – 0.4% | | | | | |
| Praktiker Bau-und Heimwerkermaerkte Holding AG | | 45,390 | | $ | 1,342,581 |
| | | | | |
| Telecommunications – Wireless – 4.4% | | | | | |
| KDDI Corp. | | 785 | | $ | 5,828,836 |
| SmarTone Telecommunications Holdings Ltd. | | 690,500 | | | 647,338 |
| Vodafone Group PLC | | 2,311,840 | | | 8,616,258 |
| | | | | |
| | | | $ | 15,092,432 |
| | | | | |
| Telephone Services – 3.9% | | | | | |
| Royal KPN N.V. | | 283,200 | | $ | 5,121,790 |
| Telefonica S.A. | | 153,330 | | | 4,955,198 |
| Telekom Austria AG | | 115,260 | | | 3,194,165 |
| | | | | |
| | | | $ | 13,271,153 |
| | | | | |
| | | | | | | |
| Issuer | | Shares/Par | | Value ($) | |
| | | | | | | |
| COMMON STOCKS – continued | | | | | | | |
| Trucking – 3.2% | | | | | | | |
| Seino Holdings Co. Ltd. (l) | | | 155,000 | | $ | 1,051,199 | |
| TNT N.V. | | | 147,150 | | | 6,123,289 | |
| Yamato Holdings Co. Ltd. | | | 258,000 | | | 3,720,521 | |
| | | | | | | |
| | | | | $ | 10,895,009 | |
| | | | | | | |
| Utilities – Electric Power – 2.8% | | | | | | | |
| British Energy Group PLC | | | 79,530 | | $ | 863,203 | |
| E.ON AG | | | 31,450 | | | 6,677,648 | |
| United Utilities PLC | | | 136,110 | | | 2,037,924 | |
| | | | | | | |
| | | | | $ | 9,578,775 | |
| | | | | | | |
Total Common Stocks
(Identified Cost, $305,811,800) | | | | | $ | 325,683,546 | |
| | | | | | | |
| | |
| REPURCHASE AGREEMENTS – 4.3% | | | | | | | |
| Merrill Lynch, 4.5%, dated 12/31/07, due 1/02/08, total to be received $14,730,682 (secured by various U.S. Treasury and Federal Agency obligations and Mortgage Backed securities in a jointly traded account), at Cost | | $ | 14,727,000 | | $ | 14,727,000 | |
| | | | | | | |
| |
| COLLATERAL FOR SECURITIES LOANED – 2.0% | | | | |
| Navigator Securities Lending Prime Portfolio, at Cost and Net Asset Value | | | 6,895,245 | | $ | 6,895,245 | |
| | | | | | | |
Total Investments
(Identified Cost, $327,434,045) (k) | | | | | $ | 347,305,791 | |
| | | | | | | |
OTHER ASSETS, LESS
LIABILITIES – (1.7)% | | | | | | (5,866,365 | ) |
| | | | | | | |
| Net Assets – 100.0% | | | | | $ | 341,439,426 | |
| | | | | | | |
| (a) | Non-income producing security. |
| (k) | As of December 31, 2007, the fund had 17 securities that were fair valued, aggregating $39,965,906 and 11.51% of market value, in accordance with the policies adopted by the Board of Trustees. |
| (l) | All or a portion of this security is on loan. |
The following abbreviations are used in this report and are defined:
| ADR | American Depository Receipt |
| IPS | International Preference Stock |
See Notes to Financial Statements
9
FINANCIAL STATEMENTS | STATEMENT OF ASSETS AND LIABILITIES
This statement represents your fund’s balance sheet, which details the assets and liabilities comprising the total value of the fund.
| | | | |
| At 12/31/07 | | | | |
| Assets | | | | |
| Investments, at value, including $6,554,389 of securities on loan (identified cost $327,434,045) | | $347,305,791 | | |
| Foreign currency, at value (identified cost, $779) | | 790 | | |
| Receivable for investments sold | | 249,380 | | |
| Receivable for fund shares sold | | 740,905 | | |
| Interest and dividends receivable | | 368,579 | | |
| Other assets | | 11,809 | | |
| Total assets | | | | $348,677,254 |
| Liabilities | | | | |
| Payable to custodian | | $10,349 | | |
| Payable for fund shares reacquired | | 49,422 | | |
| Collateral for securities loaned, at value | | 6,895,245 | | |
| Payable to affiliates | | | | |
Management fee | | 33,409 | | |
Distribution fees | | 6,061 | | |
Administrative services fee | | 869 | | |
| Accrued expenses and other liabilities | | 242,473 | | |
| Total liabilities | | | | $7,237,828 |
| Net assets | | | | $341,439,426 |
| Net assets consist of | | | | |
| Paid-in capital | | $300,194,398 | | |
Unrealized appreciation (depreciation) on investments and translation of assets and liabilities
in foreign currencies (net of $130,627 deferred country tax) | | 19,734,440 | | |
| Accumulated net realized gain (loss) on investments and foreign currency transactions | | 18,534,776 | | |
| Undistributed net investment income | | 2,975,812 | | |
| Net assets | | | | $341,439,426 |
| Shares of beneficial interest outstanding | | | | 18,374,159 |
| Initial Class shares | | | | |
Net assets | | $117,100,090 | | |
Shares outstanding | | 6,269,340 | | |
Net asset value per share | | | | $18.68 |
| Service Class shares | | | | |
Net assets | | $224,339,336 | | |
Shares outstanding | | 12,104,819 | | |
Net asset value per share | | | | $18.53 |
See Notes to Financial Statements
10
FINANCIAL STATEMENTS | STATEMENT OF OPERATIONS
This statement describes how much your fund earned in investment income and accrued in expenses. It also describes any gains and/or losses generated by fund operations.
| | | | | | |
| Year ended 12/31/07 | | | | | | |
| Net investment income | | | | | | |
| Income | | | | | | |
Dividends | | $5,322,151 | | | | |
Interest | | 863,766 | | | | |
Foreign taxes withheld | | (466,838 | ) | | | |
| Total investment income | | | | | $5,719,079 | |
| Expenses | | | | | | |
Management fee | | $2,066,023 | | | | |
Distribution fees | | 246,491 | | | | |
Administrative services fee | | 58,965 | | | | |
Independent trustees’ compensation | | 14,174 | | | | |
Custodian fee | | 184,145 | | | | |
Shareholder communications | | 16,533 | | | | |
Auditing fees | | 51,094 | | | | |
Legal fees | | 5,949 | | | | |
Miscellaneous | | 23,290 | | | | |
| Total expenses | | | | | $2,666,664 | |
Fees paid indirectly | | (648 | ) | | | |
| Net expenses | | | | | $2,666,016 | |
| Net investment income | | | | | $3,053,063 | |
| Realized and unrealized gain (loss) on investments | | | | | | |
| Realized gain (loss) (identified cost basis) | | | | | | |
Investment transactions (net of $662 country tax) | | $18,989,963 | | | | |
Foreign currency transactions | | (53,296 | ) | | | |
| Net realized gain (loss) on investments and foreign currency transactions | | | | | $18,936,667 | |
| Change in unrealized appreciation (depreciation) | | | | | | |
Investments (net of $124,021 increase in deferred country tax) | | $(10,508,675 | ) | | | |
Translation of assets and liabilities in foreign currencies | | 8,871 | | | | |
| Net unrealized gain (loss) on investments and foreign currency translation | | | | | $(10,499,804 | ) |
| Net realized and unrealized gain (loss) on investments and foreign currency | | | | | $8,436,863 | |
| Change in net assets from operations | | | | | $11,489,926 | |
See Notes to Financial Statements
11
FINANCIAL STATEMENTS | STATEMENTS OF CHANGES IN NET ASSETS
These statements describe the increases and/or decreases in net assets resulting from operations, any distributions, and any shareholder transactions.
| | | | | | |
| For years ended 12/31 | | 2007 | | | 2006 | |
| Change in net assets | | | | | | |
| From operations | | | | | | |
| Net investment income | | $3,053,063 | | | $2,798,054 | |
| Net realized gain (loss) on investments and foreign currency transactions | | 18,936,667 | | | 22,016,646 | |
| Net unrealized gain (loss) on investments and foreign currency translation | | (10,499,804 | ) | | 9,601,215 | |
| Change in net assets from operations | | $11,489,926 | | | $34,415,915 | |
| Distributions declared to shareholders | | | | | | |
| From net investment income | | | | | | |
Initial Class | | $(2,144,403 | ) | | $(1,509,642 | ) |
Service Class | | (767,328 | ) | | (142,578 | ) |
| From net realized gain on investments | | | | | | |
Initial Class | | (15,977,807 | ) | | (12,870,222 | ) |
Service Class | | (5,965,795 | ) | | (1,405,739 | ) |
| Total distributions declared to shareholders | | $(24,855,333 | ) | | $(15,928,181 | ) |
| Change in net assets from fund share transactions | | $205,823,373 | | | $11,081,685 | |
| Total change in net assets | | $192,457,966 | | | $29,569,419 | |
| Net assets | | | | | | |
| At beginning of period | | 148,981,460 | | | 119,412,041 | |
At end of period (including undistributed net investment income of $2,975,812 and
$2,759,861, respectively) | | $341,439,426 | | | $148,981,460 | |
See Notes to Financial Statements
12
FINANCIAL STATEMENTS | FINANCIAL HIGHLIGHTS
The financial highlights table is intended to help you understand the fund’s financial performance for the past 5 years. Certain information reflects financial results for a single fund share. The total returns in the table represent the rate by which an investor would have earned (or lost) on an investment in the fund share class (assuming reinvestment of all distributions) held for the entire period.
Initial Class
| | | | | | | | | | | | | | | |
| | | Years ended 12/31 | |
| | | 2007 | | | 2006 | | | 2005 | | | 2004 | | | 2003 | |
| Net asset value, beginning of period | | $20.02 | | | $17.39 | | | $15.58 | | | $12.27 | | | $9.28 | |
| Income (loss) from investment operations | | | | | | | | | | | | | | | |
| Net investment income (d) | | $0.33 | | | $0.39 | | | $0.27 | | | $0.20 | | | $0.11 | |
Net realized and unrealized gain (loss) on investments and
foreign currency | | 1.13 | | | 4.54 | | | 2.03 | | | 3.21 | | | 2.98 | |
| Total from investment operations | | $1.46 | | | $4.93 | | | $2.30 | | | $3.41 | | | $3.09 | |
| Less distributions declared to shareholders | | | | | | | | | | | | | | | |
| From net investment income | | $(0.33 | ) | | $(0.24 | ) | | $(0.18 | ) | | $(0.10 | ) | | $(0.10 | ) |
| From net realized gain on investments | | (2.47 | ) | | (2.06 | ) | | (0.31 | ) | | — | | | — | |
| Total distributions declared to shareholders | | $(2.80 | ) | | $(2.30 | ) | | $(0.49 | ) | | $(0.10 | ) | | $(0.10 | ) |
| Net asset value, end of period | | $18.68 | | | $20.02 | | | $17.39 | | | $15.58 | | | $12.27 | |
| Total return (%) (k)(s) | | 7.35 | | | 29.23 | | | 15.22 | | | 28.02 | (v) | | 33.63 | |
Ratios (%) (to average net assets)
and Supplemental data: | | | | | | | | | | | | | | | |
| Expenses (f) | | 1.05 | | | 1.11 | | | 1.13 | | | 1.15 | | | 1.28 | |
| Net investment income | | 1.67 | | | 2.09 | | | 1.67 | | | 1.52 | | | 1.06 | |
| Portfolio turnover | | 44 | | | 55 | | | 46 | | | 65 | | | 84 | |
| Net assets at end of period (000 Omitted) | | $117,100 | | | $134,008 | | | $108,418 | | | $84,996 | | | $61,108 | |
See Notes to Financial Statements
13
Financial Highlights – continued
Service Class
| | | | | | | | | | | | | | | |
| | | Years ended 12/31 | |
| | | 2007 | | | 2006 | | | 2005 | | | 2004 | | | 2003 | |
| Net asset value, beginning of period | | $19.92 | | | $17.32 | | | $15.54 | | | $12.24 | | | $9.27 | |
| Income (loss) from investment operations | | | | | | | | | | | | | | | |
| Net investment income (d) | | $0.16 | | | $0.34 | | | $0.22 | | | $0.18 | | | $0.07 | |
Net realized and unrealized gain (loss) on investments and
foreign currency | | 1.24 | | | 4.53 | | | 2.02 | | | 3.20 | | | 2.98 | |
| Total from investment operations | | $1.40 | | | $4.87 | | | $2.24 | | | $3.38 | | | $3.05 | |
| Less distributions declared to shareholders | | | | | | | | | | | | | | | |
| From net investment income | | $(0.32 | ) | | $(0.21 | ) | | $(0.15 | ) | | $(0.08 | ) | | $(0.08 | ) |
| From net realized gain on investments | | (2.47 | ) | | (2.06 | ) | | (0.31 | ) | | — | | | — | |
| Total distributions declared to shareholders | | $(2.79 | ) | | $(2.27 | ) | | $(0.46 | ) | | $(0.08 | ) | | $(0.08 | ) |
| Net asset value, end of period | | $18.53 | | | $19.92 | | | $17.32 | | | $15.54 | | | $12.24 | |
| Total return (%) (k)(s) | | 7.04 | | | 28.95 | | | 14.86 | | | 27.82 | (v) | | 33.20 | |
Ratios (%) (to average net assets)
and Supplemental data: | | | | | | | | | | | | | | | |
| Expenses (f) | | 1.30 | | | 1.36 | | | 1.39 | | | 1.40 | | | 1.53 | |
| Net investment income | | 0.87 | | | 1.84 | | | 1.37 | | | 1.31 | | | 0.67 | |
| Portfolio turnover | | 44 | | | 55 | | | 46 | | | 65 | | | 84 | |
| Net assets at end of period (000 Omitted) | | $224,339 | | | $14,973 | | | $10,994 | | | $6,805 | | | $4,646 | |
| (d) | Per share data are based on average shares outstanding. |
| (f) | Ratios do not reflect reductions from fees paid indirectly, if applicable. |
| (k) | The total return does not reflect expenses that apply to separate accounts. Inclusion of these charges would reduce the total return figures for all periods shown. |
| (s) | From time to time the fund may receive proceeds from litigation settlements, without which performance would be lower. |
| (v) | During the year ended December 31, 2004, the fund received a payment from the investment adviser to reimburse the fund for losses on investments not meeting the investment guidelines of the fund. If this loss had been incurred, the total returns would have been approximately 28.01% and 27.81% for the Initial Class and Service Class, respectively. |
See Notes to Financial Statements
14
NOTES TO FINANCIAL STATEMENTS
| (1) | | Business and Organization |
MFS International Value Portfolio (formerly International Value Series) (the fund) is a series of MFS Variable Insurance Trust II (formerly known as MFS/Sun Life Series Trust) (the trust). The trust is organized as a Massachusetts business trust and is registered under the Investment Company Act of 1940, as amended, as an open-end management investment company. The shares of the fund are sold to variable accounts established by insurance companies to fund benefits under variable contracts issued by such companies and qualified retirement and pension plans.
| (2) | | Significant Accounting Policies |
General – The preparation of financial statements in conformity with U.S. generally accepted accounting principles requires management to make estimates and assumptions that affect the reported amounts of assets and liabilities, and disclosure of contingent assets and liabilities at the date of the financial statements and the reported amounts of revenues and expenses during the reporting period. Actual results could differ from those estimates. The fund can invest in foreign securities, including securities of emerging market issuers. Investments in foreign securities are vulnerable to the effects of changes in the relative values of the local currency and the U.S. dollar and to the effects of changes in each country’s legal, political, and economic environment. The markets of emerging markets countries are generally more volatile than the markets of developed countries with more mature economies. All of the risks of investing in foreign securities previously described are heightened when investing in emerging markets countries.
Investment Valuations – Equity securities, including restricted equity securities, are generally valued at the last sale or official closing price as reported by an independent pricing service on the market or exchange on which they are primarily traded. For securities for which there were no sales reported that day, equity securities are generally valued at the last quoted daily bid quotation as reported by an independent pricing service on the market or exchange on which they are primarily traded. For securities held short for which there were no sales reported for the day, the position is generally valued at the last quoted daily ask quotation as reported by an independent pricing service on the market or exchange on which such securities are primarily traded. Short-term instruments with a maturity at issuance of 60 days or less may be valued at amortized cost, which approximates market value. Open-end investment companies are generally valued at their net asset value per share. Securities and other assets generally valued on the basis of information from an independent pricing service may also be valued at a broker-dealer bid quotation. The values of foreign securities and other assets and liabilities expressed in foreign currencies are converted to U.S. dollars using the mean of bid and asked prices for rates reported by an independent pricing service.
The Board of Trustees has delegated primary responsibility for determining or causing to be determined the value of the fund’s investments (including any fair valuation) to the adviser pursuant to valuation policies and procedures approved by the Board. If the adviser determines that reliable market quotations are not readily available, investments are valued at fair value as determined in good faith by the adviser in accordance with such procedures under the oversight of the Board of Trustees. Under the fund’s valuation policies and procedures, market quotations are not considered to be readily available for many types of debt instruments and certain types of derivatives. These investments are generally valued at fair value based on information from independent pricing services. In addition, investments may be valued at fair value if the adviser determines that an investment’s value has been materially affected by events occurring after the close of the exchange or market on which the investment is principally traded (such as foreign exchange or market) and prior to the determination of the fund’s net asset value, or after the halting of trading of a specific security where trading does not resume prior to the close of the exchange or market on which the security is principally traded. Events that occur on a frequent basis after foreign markets close (such as developments in foreign markets and significant movements in the U.S. markets) and prior to the determination of the fund’s net asset value may be deemed to have a material affect on the value of securities traded in foreign markets. Accordingly, the fund’s foreign equity securities may often be valued at fair value. The adviser may rely on independent pricing services or other information (such as the correlation with price movements of similar securities in the same or other markets; the type, cost and investment characteristics of the security; the business and financial condition of the issuer; and trading and other market data) to assist in determining whether to fair value and at what value to fair value an investment. The value of an investment for purposes of calculating the fund’s net asset value can differ depending on the source and method used to determine value. When fair valuation is used, the value of investments used to determine the fund’s net asset value may differ from quoted or published prices for the same investments.
In September 2006, FASB Statement No. 157, Fair Value Measurements (the “Statement”) was issued, and is effective for fiscal years beginning after November 15, 2007 and for all interim periods within those fiscal years. This Statement provides a single definition of fair value, a hierarchy for measuring fair value and expanded disclosures about fair value measurements. Management is evaluating the application of the Statement to the fund, and believes the impact will be limited to expanded disclosures resulting from the adoption of this Statement in the fund’s financial statements.
15
Notes to Financial Statements – continued
Repurchase Agreements – The fund may enter into repurchase agreements with institutions that the fund’s investment adviser has determined are creditworthy. Each repurchase agreement is recorded at cost. The fund requires that the securities collateral in a repurchase transaction be transferred to the custodian in a manner sufficient to enable the fund to obtain those securities in the event of a default under the repurchase agreement. The fund monitors, on a daily basis, the value of the collateral to ensure that its value, including accrued interest, is greater than amounts owed to the fund under each such repurchase agreement. The fund and other funds managed by Massachusetts Financial Services Company (MFS), may utilize a joint trading account for the purpose of entering into one or more repurchase agreements.
Foreign Currency Translation – Purchases and sales of foreign investments, income, and expenses are converted into U.S. dollars based upon currency exchange rates prevailing on the respective dates of such transactions. Gains and losses attributable to foreign currency exchange rates on sales of securities are recorded for financial statement purposes as net realized gains and losses on investments. Gains and losses attributable to foreign exchange rate movements on income and expenses are recorded for financial statement purposes as foreign currency transaction gains and losses. That portion of both realized and unrealized gains and losses on investments that results from fluctuations in foreign currency exchange rates is not separately disclosed.
Security Loans – State Street Bank and Trust Company (“State Street”), as lending agent, may loan the securities of the fund to certain qualified institutions (the “Borrowers”) approved by the fund. The loans are collateralized at all times by cash and/or U.S. Treasury securities in an amount at least equal to the market value of the securities loaned. State Street provides the fund with indemnification against Borrower default. The fund bears the risk of loss with respect to the investment of cash collateral. On loans collateralized by cash, the cash collateral is invested in a money market fund or short-term securities. A portion of the income generated upon investment of the collateral is remitted to the Borrowers, and the remainder is allocated between the fund and the lending agent. On loans collateralized by U.S. Treasury securities, a fee is received from the Borrower, and is allocated between the fund and the lending agent. Net income from securities lending is included in interest income on the Statement of Operations. The dividend and interest income earned on the securities loaned is accounted for in the same manner as other dividend and interest income.
Indemnifications – Under the fund’s organizational documents, its officers and trustees may be indemnified against certain liabilities and expenses arising out of the performance of their duties to the fund. Additionally, in the normal course of business, the fund enters into agreements with service providers that may contain indemnification clauses. The fund’s maximum exposure under these agreements is unknown as this would involve future claims that may be made against the fund that have not yet occurred.
Investment Transactions and Income – Investment transactions are recorded on the trade date. Interest income is recorded on the accrual basis. All premium and discount is amortized or accreted for financial statement purposes in accordance with U.S. generally accepted accounting principles. All discount is accreted for tax reporting purposes as required by federal income tax regulations. Dividends received in cash are recorded on the ex-dividend date. Certain dividends from foreign securities will be recorded when the fund is informed of the dividend if such information is obtained subsequent to the ex-dividend date. Dividend and interest payments received in additional securities are recorded on the ex-dividend or ex-interest date in an amount equal to the value of the security on such date.
The fund may receive proceeds from litigation settlements. Any proceeds received from litigation involving portfolio holdings are reflected in the Statement of Operations in realized gain/loss if the security has been disposed of by the fund or in unrealized gain/loss if the security is still held by the fund. Any other proceeds from litigation not related to portfolio holdings are reflected as other income in the Statement of Operations.
Fees Paid Indirectly – The fund’s custody fee may be reduced according to an arrangement that measures the value of cash deposited with the custodian by the fund. This amount, for the year ended December 31, 2007, is shown as a reduction of total expenses on the Statement of Operations.
Tax Matters and Distributions – The fund intends to qualify as a regulated investment company, as defined under Subchapter M of the Internal Revenue Code, and to distribute all of its taxable income, including realized capital gains. As a result, no provision for federal income taxes is required. The fund adopted the provisions of FASB Interpretation No. 48, Accounting for Uncertainty in Income Taxes (“the Interpretation”) on January 1, 2007. The Interpretation prescribes a minimum threshold for financial statement recognition of the benefit of a tax position taken or expected to be taken in a tax return. There was no impact resulting from the adoption of this Interpretation on the fund’s financial statements. Each of the fund’s federal tax returns for the prior three fiscal years remains subject to examination by the Internal Revenue Service. It is the fund’s policy to record interest and penalty charges on underpaid taxes associated with its tax positions as interest expense and other expense, respectively. No such charges were recorded in the current financial statements. Foreign taxes, if any, have been accrued by the fund in the accompanying financial statements.
16
Notes to Financial Statements – continued
Distributions to shareholders are recorded on the ex-dividend date. Income and capital gain distributions are determined in accordance with income tax regulations, which may differ from U.S. generally accepted accounting principles. Certain capital accounts in the financial statements are periodically adjusted for permanent differences in order to reflect their tax character. These adjustments have no impact on net assets or net asset value per share. Temporary differences which arise from recognizing certain items of income, expense, gain or loss in different periods for financial statement and tax purposes will reverse at some time in the future. Distributions in excess of net investment income or net realized gains are temporary overdistributions for financial statement purposes resulting from differences in the recognition or classification of income or distributions for financial statement and tax purposes.
Book/tax differences primarily relate to passive foreign investment companies, wash sale loss deferrals, foreign currency transactions and foreign taxes.
The tax character of distributions declared to shareholders is as follows:
| | | | |
| | | 12/31/07 | | 12/31/06 |
| Ordinary income (including any short-term capital gains) | | $7,195,412 | | $6,463,756 |
| Long-term capital gain | | 17,659,921 | | 9,464,425 |
| Total distributions | | $24,855,333 | | $15,928,181 |
The federal tax cost and the tax basis components of distributable earnings were as follows:
| | | |
| As of 12/31/07 | | | |
| Cost of investments | | $328,233,692 | |
| Gross appreciation | | 31,202,206 | |
| Gross depreciation | | (12,130,107 | ) |
| Net unrealized appreciation (depreciation) | | $19,072,099 | |
| Undistributed ordinary income | | 7,379,074 | |
| Undistributed long-term capital gain | | 14,943,942 | |
| Other temporary differences | | (150,087 | ) |
Multiple Classes of Shares of Beneficial Interest – The fund offers multiple classes of shares, which differ in their respective distribution fees. All shareholders bear the common expenses of the fund based on daily net assets of each class, without distinction between share classes. Dividends are declared separately for each class. Differences in per share dividend rates are generally due to differences in separate class expenses.
| (3) | | Transactions with Affiliates |
Investment Adviser – The fund has an investment advisory agreement with MFS to provide overall investment management and related administrative services and facilities to the fund. The management fee is computed daily and paid monthly at the following annual rates:
| | |
| First $1 billion of average daily net assets | | 0.90% |
| Next $1 billion of average daily net assets | | 0.80% |
| Average daily net assets in excess of $2 billion | | 0.70% |
The management fee incurred for the year ended December 31, 2007 was equivalent to an annual effective rate of 0.90% of the fund’s average daily net assets.
Distributor – MFS Fund Distributors, Inc. (MFD), a wholly-owned subsidiary of MFS, is the distributor of shares of the fund. The Trustees have adopted a distribution plan for the Service Class shares pursuant to Rule 12b-1 under the Investment Company Act of 1940.
The fund’s distribution plan provides that the fund will pay MFD distribution fees equal to 0.25% per annum of its average daily net assets attributable to Service Class shares as partial consideration for services performed and expenses incurred by MFD and financial intermediaries in connection with the sale and distribution of the fund’s Service Class shares and the sale and distribution of the variable annuity or variable life insurance contracts investing indirectly in Service Class shares. MFD may subsequently pay all, or a portion, of the distribution fees to financial intermediaries.
Shareholder Servicing Agent – MFS Service Center, Inc. (MFSC), a wholly-owned subsidiary of MFS, has contracted to provide transfer agent and recordkeeping functions in connection with the issuance, transfer, and redemption of each class of shares of the fund under a Shareholder Servicing Agent Agreement. During the year ended December 31, 2007, MFSC did not receive a fee for this service.
17
Notes to Financial Statements – continued
Administrator – MFS provides certain financial, legal, shareholder communications, compliance, and other administrative services to the fund. Under an administrative services agreement, the fund partially reimburses MFS the costs incurred to provide these services. The fund is charged an annual fixed amount of $10,000 plus a fee based on average daily net assets.
The administrative services fee incurred for the year ended December 31, 2007 was equivalent to an annual effective rate of 0.0256% of the fund’s average daily net assets.
Trustees’ and Officers’ Compensation – The fund pays compensation to trustees in the form of a retainer, attendance fees, and additional compensation to the Board chairperson. The fund does not pay compensation directly to officers of the fund who are also officers of the investment adviser, all of whom receive remuneration for their services to the fund from MFS. Certain officers of the fund are officers or directors of MFS, MFD, and MFSC.
Other – This fund and certain other MFS funds (the funds) have entered into a services agreement (the Agreement) which provides for payment of fees by the funds to Tarantino LLC in return for the provision of services of an Independent Chief Compliance Officer (ICCO) for the funds. The ICCO is an officer of the funds and the sole member of Tarantino LLC. The funds can terminate the Agreement with Tarantino LLC at any time under the terms of the Agreement. MFS has agreed to bear all expenses associated with office space, other administrative support, and supplies provided to the ICCO. For the year ended December 31, 2007, the fee paid to Tarantino LLC was $1,153.
Purchases and sales of investments, other than U.S. government securities, purchased option transactions, and short-term obligations, aggregated $267,378,511 and $96,568,574, respectively.
| (5) | | Shares of Beneficial Interest |
The fund’s Declaration of Trust permits the Trustees to issue an unlimited number of full and fractional shares of beneficial interest. Transactions in fund shares were as follows:
| | | | | | | | | | | | |
| | | Year ended 12/31/07 | | | Year ended 12/31/06 | |
| | | Shares | | | Amount | | | Shares | | | Amount | |
| Shares sold | | | | | | | | | | | | |
Initial Class | | 225,865 | | | $4,442,766 | | | 665,273 | | | $12,343,355 | |
Service Class | | 11,033,820 | | | 208,319,338 | | | 230,239 | | | 4,243,515 | |
| | 11,259,685 | | | $212,762,104 | | | 895,512 | | | $16,586,870 | |
| Shares issued to shareholders in reinvestment of distributions | | | | | | | | | | | | |
Initial Class | | 972,743 | | | $18,122,210 | | | 764,074 | | | $14,379,864 | |
Service Class | | 363,560 | | | 6,733,123 | | | 82,577 | | | 1,548,317 | |
| | 1,336,303 | | | $24,855,333 | | | 846,651 | | | $15,928,181 | |
| Shares reacquired | | | | | | | | | | | | |
Initial Class | | (1,621,370 | ) | | $(30,942,121 | ) | | (972,963 | ) | | $(17,817,104 | ) |
Service Class | | (44,135 | ) | | (851,943 | ) | | (195,932 | ) | | (3,616,262 | ) |
| | (1,665,505 | ) | | $(31,794,064 | ) | | (1,168,895 | ) | | $(21,433,366 | ) |
| Net change | | | | | | | | | | | | |
Initial Class | | (422,762 | ) | | $(8,377,145 | ) | | 456,384 | | | $8,906,115 | |
Service Class | | 11,353,245 | | | 214,200,518 | | | 116,884 | | | 2,175,570 | |
| | 10,930,483 | | | $205,823,373 | | | 573,268 | | | $11,081,685 | |
The fund and other funds managed by MFS participate in a $1 billion unsecured committed line of credit provided by a syndication of banks under a credit agreement. In addition, the fund and other funds managed by MFS have established uncommitted borrowing arrangements with certain banks. Borrowings may be made for temporary financing needs. Interest is charged to each fund, based on its borrowings, generally at a rate equal to the Federal Reserve funds rate plus 0.30%. In addition, a commitment fee, based on the average daily, unused portion of the committed line of credit, is allocated among the participating funds at the end of each calendar quarter. For the year ended December 31, 2007, the fund’s commitment fee and interest expense were $816 and $0, respectively, and are included in miscellaneous expense on the Statement of Operations.
18
REPORT OF INDEPENDENT REGISTERED PUBLIC ACCOUNTING FIRM
To the Board of Trustees of MFS Variable Insurance Trust II (formerly known as MFS/Sun Life Series Trust) and the Shareholders of MFS International Value Portfolio (formerly known as International Value Series):
We have audited the accompanying statement of assets and liabilities, including the portfolio of investments, of MFS International Value Portfolio (one of the portfolios comprising MFS Variable Insurance Trust II) (the “Trust”) as of December 31, 2007, and the related statement of operations for the year then ended, the statements of changes in net assets for each of the two years in the period then ended, and the financial highlights for each of the five years in the period then ended. These financial statements and financial highlights are the responsibility of the Trust’s management. Our responsibility is to express an opinion on these financial statements and financial highlights based on our audits.
We conducted our audits in accordance with the standards of the Public Company Accounting Oversight Board (United States). Those standards require that we plan and perform the audit to obtain reasonable assurance about whether the financial statements and financial highlights are free of material misstatement. The Trust is not required to have, nor were we engaged to perform, an audit of its internal control over financial reporting. Our audits included consideration of internal control over financial reporting as a basis for designing audit procedures that are appropriate in the circumstances, but not for the purpose of expressing an opinion on the effectiveness of the Trust’s internal control over financial reporting. Accordingly, we express no such opinion. An audit also includes examining, on a test basis, evidence supporting the amounts and disclosures in the financial statements, assessing the accounting principles used and significant estimates made by management, as well as evaluating the overall financial statement presentation. Our procedures included confirmation of securities owned as of December 31, 2007, by correspondence with the custodian and brokers; where replies were not received from brokers, we performed other auditing procedures. We believe that our audits provide a reasonable basis for our opinion.
In our opinion, such financial statements and financial highlights present fairly, in all material respects, the financial position of MFS International Value Portfolio as of December 31, 2007, the results of its operations for the year then ended, the changes in its net assets for each of the two years in the period then ended, and its financial highlights for each of the five years in the period then ended, in conformity with accounting principles generally accepted in the United States of America.
DELOITTE & TOUCHE LLP
Boston, Massachusetts
February 15, 2008
19
TRUSTEES AND OFFICERS – IDENTIFICATION AND BACKGROUND
The Trustees and officers of the Trust, as of February 1, 2008, are listed below, together with their principal occupations during the past five years. (Their titles may have varied during that period.) The address of each Trustee and officer is 500 Boylston Street, Boston, Massachusetts 02116.
| | | | | | |
Name, Date of Birth | | Position(s) Held
with Fund | | Trustee/Officer
Since(1) | | Principal Occupations During the Past Five Years &
Other Directorships(2) |
| INTERESTED TRUSTEE | | | | | | |
David D. Horn(3) (born 06/07/41) | | Trustee | | April 1986 | | Private investor; Retired; Sun Life Assurance Company of Canada, Former Senior Vice President and General Manager for the United States (until 1997); Retired: Sun Life Assurance Company of Canada, Director (until March 2004) |
| | |
| INDEPENDENT TRUSTEES | | | | |
J. Kermit Birchfield (born 01/08/40) | | Chairman | | May 1997 | | Consultant; Century Partners, Inc. (investments), Director (1988 to present); Displaytech, Inc. (technology), Director (1995 to present); Dessin Fournir LLC (furniture manufacturer), Director (2005 to present); Intermountain Gas Company, Inc. & Intermountain Industries, Inc. (oil & gas exploration and production) (1988 to present); Site Watch LLC (software to monitor oil tanks) Managing Director (2006 to present); Juridica Investments (fund investing in judicial matters) Director (2007 to present); Dairy Mart Convenience Stores, Inc. (convenience stores), Chairman (1997 to 2003) |
| | | |
Robert C. Bishop (born 01/13/43) | | Trustee | | May 2001 | | Autolmmune Inc. (pharmaceutical product licensing), Chairman, President and Chief Executive Officer (1992 to present); Caliper Life Sciences Corp. (laboratory analytical instruments), Director (2002 to present); Millipore Corporation (biopharmaceutical/research laboratory products), Director (1997 to present); Optobionics Corporation (ophthalmic devices), Director (2002 to 2007); Quintiles Transnational Corp. (contract research services), Director (until 2003) |
| | | |
Frederick H. Dulles (born 03/12/42) | | Trustee | | May 2001 | | Ten State International Law PLLC (law firm), Of Counsel (since 2006); Prudential Carolina Real Estate, (real estate), Broker (since 2006); Free Enterprise Foundation, Inc. (research institute), Director & Secretary (until 2008); Disher, Hamrick & Myers Residential, Inc. (real estate) Broker (until 2006); Frederick H. Dulles law practice (until 2006); Ten State Street LLP (law firm), Member (until 2005); McFadden, Pilkington & Ward LLP (solicitors and registered foreign lawyers), Member & Of Counsel (until 2003) |
| | | |
Marcia A. Kean (born 06/30/48) | | Trustee | | April 2005 | | Feinstein Kean Healthcare (consulting), Chief Executive Officer (since December 2002), Managing Director (prior to May 2001); Ardais Corporation (biotech products), Senior Vice President – Commercialization (February 2002 until November 2002) |
| | | |
Ronald G. Steinhart (born 06/15/40) | | Trustee | | May 2001 | | Private investor; Penske Automotive Group (automotive retailer), Director (2001 to present); Penson Worldwide, Inc. (securities clearance), Director (2006 to present); Animal Health International, Inc. (animal health products), Director (2007 to present); Texas Industries (concrete/aggregates/cement), Director (2007 to present); Carreker Corporation (technology consulting) Director (until 2005); Prentiss Properties Trust (real estate investment trust), Director (until 2006) |
| | | |
Haviland Wright (born 07/21/48) | | Trustee | | May 2001 | | Elixir Technologies Corporation (software) Director (2005 to present); Nano Loa Inc. (liquid crystal displays), Director (2003 to present); Silk Displays, Inc. (smart polymers) Director (2007 to present); Displaytech, Inc. (technology) Chairman and CEO (1995 – 2002) |
| | | |
| TRUSTEE EMERITUS | | | | | | |
Samuel Adams (born 10/19/25) | | Trustee Emeritus | | | | Retired; Kirkpatrick & Lockhart Preston Gates Ellis LLP (law firm), Of Counsel |
| | | |
| OFFICERS | | | | | | |
Maria F. Dwyer(4) (born 12/01/58) | | President | | November 2005 | | Massachusetts Financial Services Company, Executive Vice President and Chief Regulatory Officer (since March 2004); Fidelity Management & Research Company, Vice President (prior to March 2004); Fidelity Group of Funds, President and Treasurer (prior to March 2004) |
| | | |
Tracy Atkinson(4) (born 12/30/64) | | Treasurer | | September 2005 | | Massachusetts Financial Services Company, Senior Vice President (since September 2004); PricewaterhouseCoopers LLP, Partner (prior to September 2004) |
| | | |
Christopher R. Bohane(4) (born 01/18/74) | | Assistant Secretary and Assistant Clerk | | July 2005 | | Massachusetts Financial Services Company, Vice President and Senior Counsel (since April 2003); Kirkpatrick & Lockhart LLP (law firm), Associate (prior to April 2003) |
20
Trustees and Officers – continued
| | | | | | |
Name, Date of Birth | | Position(s) Held
with Fund | | Trustee/Officer
Since(1) | | Principal Occupations During the Past Five Years &
Other Directorships(2) |
| | | |
Ethan D. Corey(4) (born 11/21/63) | | Assistant Secretary and Assistant Clerk | | July 2005 | | Massachusetts Financial Services Company, Senior Vice President and Associate General Counsel (since April 2006); Special Counsel (prior to April 2006); Dechert LLP (law firm), Counsel (prior to December 2004) |
| | | |
David L. DiLorenzo(4) (born 08/10/68) | | Assistant Treasurer | | July 2005 | | Massachusetts Financial Services Company, Vice President (since June 2005); JP Morgan Investor Services, Vice President (January 2001 to June 2005) |
| | | |
Timothy M. Fagan(4) (born 07/10/68) | | Assistant Secretary and Assistant Clerk | | September 2005 | | Massachusetts Financial Services Company, Vice President and Senior Counsel (since September 2005); John Hancock Advisers, LLC, Vice President and Chief Compliance Officer (September 2004 to August 2005) Senior Attorney (prior to September 2004); John Hancock Group of Funds, Vice President and Chief Compliance Officer (September 2004 to December 2004) |
| | | |
Mark D. Fischer(4) (born 10/27/70) | | Assistant Treasurer | | July 2005 | | Massachusetts Financial Services Company, Vice President (since May 2005); JP Morgan Investment Management Company, Vice President (prior to May 2005) |
| | | |
Brian E. Langenfeld(4) (born 03/07/73) | | Assistant Secretary and Assistant Clerk | | May 2006 | | Massachusetts Financial Services Company, Assistant Vice President and Counsel (since May 2006); John Hancock Advisers, LLC, Assistant Vice President and Counsel (May 2005 to April 2006); John Hancock Advisers, LLC, Attorney and Assistant Secretary (prior to May 2005) |
| | | |
Ellen Moynihan(4) (born 11/13/57) | | Assistant Treasurer | | May 1997 | | Massachusetts Financial Services Company, Senior Vice President |
| | | |
Susan S. Newton(4) (born 03/07/50) | | Assistant Secretary and Assistant Clerk | | May 2005 | | Massachusetts Financial Services Company, Senior Vice President and Assistant General Counsel (since April 2005); John Hancock Advisers, LLC, Senior Vice President, Secretary and Chief Legal Officer (prior to April 2005); John Hancock Group of Funds, Senior Vice President, Secretary and Chief Legal Officer (prior to April 2005) |
| | | |
Susan A. Pereira(4) (born 11/05/70) | | Assistant Secretary and Assistant Clerk | | July 2005 | | Massachusetts Financial Services Company, Vice President and Senior Counsel (since June 2004); Bingham McCutchen LLP (law firm), Associate (January 2001 to June 2004) |
| | | |
Mark N. Polebaum(4) (born 05/01/52) | | Secretary and Assistant Clerk | | February 2006 | | Massachusetts Financial Services Company, Executive Vice President, General Counsel and Secretary (since January 2006); Wilmer Cutler Pickering Hale and Dorr LLP (law firm), Partner (prior to January 2006) |
| | | |
Frank L. Tarantino (born 03/07/44) | | Independent Chief Compliance Officer | | September 2004 | | Tarantino LLC (provider of compliance services), Principal (since June 2004); CRA Business Strategies Group (consulting services), Executive Vice President (April 2003 to June 2004); David L. Babson & Co. (investment adviser), Managing Director, Chief Administrative Officer and Director (February 1997 to March 2003) |
| | | |
Richard S. Weitzel(4) (born 7/16/70) | | Assistant Secretary and Assistant Clerk | | October 2007 | | Massachusetts Financial Services Company, Vice President and Assistant General Counsel (since 2007); Vice President and Senior Counsel (since May 2004); Massachusetts Department of Business and Technology, General Counsel (February 2003 to April 2004); Massachusetts Office of the Attorney General, Assistant Attorney General ( April 2001 to February 2003); Ropes and Gray, Associate (prior to April 2001) |
| | | |
James O. Yost(4) (born 06/12/60) | | Assistant Treasurer | | April 1992 | | Massachusetts Financial Services Company, Senior Vice President |
| (1) | Date first appointed to serve as Trustee/Officer of an MFS fund or a Compass variable account. Each Trustee has served continuously since appointment. |
| (2) | Directorships or trusteeships of companies required to report to the Securities and Exchange Commission (i.e., “public companies”). |
| (3) | “Interested person” of the Sun Life of Canada (U.S.), within the meaning of the Investment Company Act of 1940 (referred to as the 1940 Act), which is the principal federal law governing investment companies like the Series. The address of Sun Life of Canada (U.S.) is One Sun Life Executive Park, Wellesley Hills, Massachusetts 02481. |
| (4) | “Interested person” of MFS within the meaning of the 1940 Act. The address of MFS is 500 Boylston Street, Boston, Massachusetts 02116. |
The Trust does not hold annual meetings for the purpose of electing Trustees, and Trustees are not elected for fixed terms. Each Trustee and officer holds office until his or her successor is chosen and qualified, or until his or her earlier death, resignation, retirement or removal.
All Trustees currently serve as Trustees of the Trust and have served in that capacity since originally elected or appointed. All of the Trustees are also Managers of the Compass Variable Accounts. The executive officers of the Trust hold similar offices for the Compass Variable Accounts and other funds in the MFS fund complex. As of January 1, 2008, each Trustee serves as a Trustee or Manager of 35 Accounts/Funds.
21
Trustees and Officers – continued
The Statement of Additional Information contains further information about the Trustees and is available without charge upon request by calling 1-800-225-2606.
| | |
Investment Adviser
Massachusetts Financial Services Company 500 Boylston Street, Boston, MA 02116-3741 | | Custodian State Street Bank and Trust Company 225 Franklin Street, Boston, MA 02110 |
Distributor
MFS Fund Distributors, Inc. 500 Boylston Street, Boston, MA 02116-3741 | | Independent Registered Public Accounting Firm Deloitte & Touche LLP 200 Berkeley Street, Boston, MA 02116 |
Portfolio Manager Barnaby Wiener | | |
22
BOARD REVIEW OF INVESTMENT ADVISORY AGREEMENT
The Investment Company Act of 1940 requires that both the full Board of Trustees and a majority of the non-interested (“independent”) Trustees, voting separately, annually approve the continuation of the investment advisory agreement between MFS Variable Insurance Trust II (the “Trust”) and Massachusetts Financial Services Company (MFS) on behalf of the Fund. The Trustees consider matters bearing on the Fund and the advisory arrangements at their meetings throughout the year, including a review of performance data at each regular meeting. In addition, the independent Trustees met several times over the course of three months beginning in May and ending in July 2007 (“contract review meetings”) for the specific purpose of considering whether to approve the continuation of the investment advisory agreement for the Fund. The independent Trustees were assisted in their evaluation of the investment advisory agreement by independent legal counsel, from whom they received separate legal advice and with whom they met separately from MFS management during various contract review meetings. The independent Trustees were also assisted in this process by the Fund’s Independent Chief Compliance Officer, a full-time senior officer appointed by and reporting to the independent Trustees.
In connection with their deliberations, the Trustees, including the independent Trustees, considered such information and factors as they believed, in light of the legal advice furnished to them and their own business judgment, to be relevant. The investment advisory agreement was considered separately for the Fund, although the Trustees also took into account the common interests of all Funds in the Trust in their review. As described below, the Trustees considered the nature, quality, and extent of the various investment advisory, administrative, and shareholder services performed by MFS under the existing investment advisory agreement and other arrangements with the Trust.
In connection with their contract review meetings, the Trustees received and relied upon materials which included, among other items: (i) information provided by Lipper Inc. on the investment performance of the Fund for various time periods ended December 31, 2006, compared to the investment performance of a group of funds with substantially similar investment classifications/objectives (the “Lipper performance universe”), as well as the investment performance of a group of funds identified by objective criteria suggested by MFS (“peer funds”), (ii) information provided by Lipper Inc. on the Fund’s advisory fees and other expenses compared to the advisory fees and other expenses of comparable funds identified by Lipper (the “Lipper expense group”), as well as the advisory fees and other expenses of peer funds identified by objective criteria suggested by MFS, (iii) information provided by MFS on the advisory fees of comparable portfolios of its other clients, including institutional separate account and other clients, (iv) information as to whether, and to what extent applicable, expense waivers, reimbursements or fee “breakpoints” are observed for the Fund, (v) information regarding MFS’ financial results and financial condition, including MFS’ and certain of its affiliates’ estimated profitability from services performed for the Fund, (vi) MFS’ views regarding the outlook for the mutual fund industry and its strategic business plans, (vii) descriptions of various functions performed by MFS for the Trust, such as compliance monitoring and portfolio trading practices, and (viii) information regarding the overall organization of MFS, including information about MFS’ senior management and other personnel providing investment advisory, administrative and other services to the Fund. The comparative performance, fee and expense information prepared and provided by Lipper Inc. was not independently verified, and the independent Trustees did not independently verify any information provided to them by MFS.
The Trustees’ conclusion as to the continuation of the investment advisory agreement was based on comprehensive consideration of all information provided to the Trustees and not the result of any single factor. Some of the factors that figured particularly in the Trustees’ deliberations are described below for the Fund, while individual Trustees may have given different weight to various factors and evaluated the information presented as a whole differently than another Trustee. The Trustees recognized that the fee arrangements for the Fund reflect years of review and discussion between the independent Trustees and MFS, that certain aspects of such arrangements may receive greater scrutiny in some years than others, and that the Trustees’ conclusions may be based, in part, on their consideration of these same arrangements during the course of the year and in prior years.
Based on information provided by Lipper Inc. and MFS, the Trustees compared the Fund’s total return investment performance to the performance of a peer group of funds over various time periods. The Trustees placed particular emphasis on the total return performance of the Fund’s Initial Class shares in comparison to the performance of funds in its Lipper performance universe over the one-, three- and five-year periods. The Trustees did not rely on performance results for more recent periods, including those shown elsewhere in this report.
The Trustees noted the performance of the Fund’s Initial Class shares was in the 1st quintile relative to the other funds in the Lipper Classification Index for the one-year period (the 1st quintile being the best performers and the 5th quintile being the worst performers). The total return performance of the Fund was also in the 1st quintile for the three-year period and the five-year period ended December 31, 2006, relative to the Lipper performance universe. Based on the nature and quality of services provided by MFS, the Board of Trustees concluded that the Fund’s performance was satisfactory.
23
Board Review of Investment Advisory Agreement – continued
In the course of their deliberations, the Trustees took into account information provided by MFS during contract review meetings, as well as during investment review meetings conducted with portfolio management personnel during the course of the year.
In assessing the reasonableness of the Fund’s advisory fee, the Trustees considered, among other information, the Fund’s advisory fee and the total expense ratio of the Fund’s Initial Class shares as a percentage of average daily net assets, compared to the advisory fee and total expense ratios of its peer group of funds based on information provided by Lipper Inc. and MFS. The Trustees also considered the advisory fees charged by MFS to institutional accounts. In comparing these fees, the Trustees considered the generally broader scope of services provided by MFS to the Trust than those provided to institutional accounts. The Trustees also considered the higher demands placed on MFS’ investment personnel and trading infrastructure as a result of the daily cash in-flows and out-flows of the Fund, and the impact on MFS and related expenses due to the more extensive regulatory regime to which the Fund is subject, compared to institutional accounts.
In considering the fees, the Trustees noted from the Lipper data that the Fund’s effective advisory fee rate and total expense ratio were each approximately at the median of such fees and expenses of funds in the Lipper expense group. The Trustees further concluded that the existing breakpoints were sufficient to allow the Fund to benefit from economies of scale as its assets grow.
The Trustees also considered information prepared by MFS relating to its costs and profits with respect to the Fund and other investment companies and accounts advised by MFS, as well as MFS’ methodologies used to determine and allocate its costs to the Fund and other accounts and products for purposes of estimating profitability.
After reviewing these and other factors described below, the Trustees concluded that the advisory fee charged to the Fund represents reasonable compensation in light of the nature and quality of the services being provided by MFS.
In addition, the Trustees considered MFS’ resources and related efforts to continue to retain, attract and motivate capable personnel to serve the Fund. The Trustees also considered the financial resources of MFS and its parent, Sun Life Financial Inc. The Trustees further considered any advantages and possible disadvantages of having an adviser which also serves other investment companies as well as institutional accounts.
The Trustees also considered the nature, quality, cost, and extent of administrative, transfer agency, and distribution services provided to the Fund by MFS and its affiliates under agreements and plans other than the investment advisory agreement, including the 12b-1 fees the Fund pays to MFS Fund Distributors, Inc., an affiliate of MFS. The Trustees also considered the nature, extent and quality of certain other services MFS performs or arranges on the Fund’s behalf, which may include securities lending programs, directed expense payment programs, class action recovery programs, and MFS’ interaction with third-party service providers, principally custodians and sub-custodians. The Trustees concluded that the various non-advisory services provided by MFS and its affiliates on behalf of the Fund were satisfactory. The Trustees also considered the benefits to MFS from the use of the Fund’s portfolio brokerage commissions to pay for research and other similar services (including MFS’ policy not to use “soft dollars” generated by Fund portfolio transactions to pay for third-party research), and various other factors. Additionally, the Trustees considered so-called “fall-out benefits” to MFS such as reputational value derived from serving as investment manager to the Trust, and determined that any such benefits derived by MFS were reasonable and fair.
Based on their evaluation of factors that they deemed to be material, including those factors described above, the Board of Trustees, including a majority of the independent Trustees, concluded that the investment advisory agreement should be continued for an additional one-year period, commencing September 1, 2007.
A discussion regarding the Board’s most recent review and renewal of the Fund’s investment advisory agreement is available by clicking on the Fund’s name under “Variable Insurance Portfolios” on the “Products & Performance” page on the MFS Web site (mfs.com).
24
PROXY VOTING POLICIES AND INFORMATION
A general description of the MFS funds’ proxy voting policies and procedures is available without charge, upon request, by calling 1-800-225-2606, by visiting the About MFS section of mfs.com or by visiting the SEC’s Web site at http://www.sec.gov.
Information regarding how the fund voted proxies relating to portfolio securities during the most recent twelve-month period ended June 30 is available without charge by visiting the Proxy Voting section of mfs.com or by visiting the SEC’s Web site at http://www.sec.gov.
QUARTERLY PORTFOLIO DISCLOSURE
The fund will file a complete schedule of portfolio holdings with the Securities and Exchange Commission (the Commission) for the first and third quarters of each fiscal year on Form N-Q. The fund’s Form N-Q may be reviewed and copied at the:
Public Reference Room
Securities and Exchange Commission
100 F Street, NE, Room 1580
Washington, D.C. 20549
Information on the operation of the Public Reference Room may be obtained by calling the Commission at 1-800-SEC-0330. The fund’s Form N-Q is available on the EDGAR database on the Commission’s Internet Web site at http://www.sec.gov, and copies of this information may be obtained, upon payment of a duplicating fee, by electronic request at the following e-mail address: publicinfo@sec.gov or by writing the Public Reference Section at the above address.
A shareholder can also obtain the quarterly portfolio holdings report at mfs.com.
FEDERAL TAX INFORMATION (unaudited)
The following information is provided pursuant to provisions of the Internal Revenue Code.
The fund designates $17,659,921 as capital gain dividends paid during the fiscal year.
Income derived from foreign sources was $3,069,696. The fund intends to pass through foreign tax credits of $158,294 for the fiscal year.
25
MFS® PRIVACY NOTICE
Privacy is a concern for every investor today. At MFS Investment Management® and the MFS funds, we take this concern very seriously. We want you to understand our policies about the investment products and services that we offer, and how we protect the nonpublic personal information of investors who have a direct relationship with us and our wholly owned subsidiaries.
Throughout our business relationship, you provide us with personal information. We maintain information and records about you, your investments, and the services you use. Examples of the nonpublic personal information we maintain include
| | Ÿ | | data from investment applications and other forms |
| | Ÿ | | share balances and transactional history with us, our affiliates, or others |
| | Ÿ | | facts from a consumer reporting agency |
We do not disclose any nonpublic personal information about our customers or former customers to anyone, except as permitted by law. We may share nonpublic personal information with third parties or certain of our affiliates in connection with servicing your account or processing your transactions. We may share information with companies or financial institutions that perform marketing services on our behalf or with other financial institutions with which we have joint marketing arrangements, subject to any legal requirements.
Authorization to access your nonpublic personal information is limited to appropriate personnel who provide products, services, or information to you. We maintain physical, electronic, and procedural safeguards to help protect the personal information we collect about you.
If you have any questions about the MFS privacy policy, please call 1-800-225-2606 any business day between 8 a.m. and 8 p.m. Eastern time.
Note: If you own MFS products or receive MFS services in the name of a third party such as a bank or broker-dealer, their privacy policy may apply to you instead of ours.
26
CONTACT US
Web site
mfs.com
Account service and
literature
Shareholders
1-877-411-3325
9 a.m. to 5 p.m. ET
Investment professionals
1-800-637-8630
8 a.m. to 5 p.m. ET
Mailing address
MFS Service Center, Inc.
Attn: Institutional Alliance Services (IAS)
P.O. Box 55824
Boston, MA
02205-5824
Overnight mail
MFS Service Center, Inc.
Attn: Institutional Alliance Services (IAS)
500 Boylston Street
Boston, MA 02116-3741


MFS® Variable Insurance Trust IISM
Annual report
MFS® Emerging Markets Equity Portfolio
(formerly Emerging Markets Equity Series)
12/31/07
FCE-ANN
MFS® EMERGING MARKETS EQUITY PORTFOLIO
(formerly Emerging Markets Equity Series)
The report is prepared for the general information of contract owners. It is authorized for distribution to prospective investors only when preceded or accompanied by a current prospectus.
NOT FDIC INSURED MAY LOSE VALUE NO BANK OR CREDIT UNION GUARANTEE NOT A DEPOSIT NOT INSURED BY ANY FEDERAL GOVERNMENT AGENCY OR NCUA/NCUSIF
LETTER FROM THE CEO

Dear Contract Owners:
The past year has been a great example of why investors should keep their eyes on the long term.
In 2006 the Dow Jones Industrial Average returned 19% and was fairly stable. This year we have seen a greater level of volatility than has been experienced in recent years. The Dow hit several new highs but also experienced swift drops as a global credit crisis swept through markets, spurred by defaults on U.S. subprime loans and a liquidity crunch. Still, even with this volatility, the Dow ended the first three quarters of 2007 with a return near 13%.
U.S. Treasury bonds gained ground, especially in the third quarter as investors sought less risky asset classes. The spreads of many lower-quality debt investments widened.
In 2007 the U.S. dollar fell against the euro, oil prices hit their highest levels yet, and gold spiked to its steepest price in 28 years. Around the globe, stocks sold off as risk aversion mounted. As we have said before, markets can be volatile, and investors should make sure they have an investment plan that can carry them through the peaks and troughs.
If you are focused on a long-term investment strategy, the short-term ups and downs of the markets should not necessarily dictate portfolio action on your part. In our view, investors who remain committed to a long-term plan are more likely to achieve their financial goals.
In any market environment, we believe individual investors are best served by following a three-pronged investment strategy of allocating their holdings across the major asset classes, diversifying within each class, and regularly rebalancing their portfolios to maintain their desired allocations. Of course, these strategies cannot guarantee a profit or protect against a loss. Investing and planning for the long term require diligence and patience, two traits that in our experience are essential to capitalizing on the many opportunities the financial markets can offer — through both up and down economic cycles.
Respectfully,

Robert J. Manning
Chief Executive Officer and Chief Investment Officer
MFS Investment Management®
February 15, 2008
The opinions expressed in this letter are subject to change, may not be relied upon for investment advice, and no forecasts can be guaranteed.
1
PORTFOLIO COMPOSITION
Portfolio structure
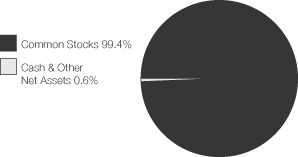
| | |
| Top ten holdings | | |
| Petroleo Brasileiro S.A., ADR | | 7.8% |
| OAO Gazprom, ADR | | 7.7% |
| Companhia Vale do Rio Doce, ADR | | 4.9% |
| China Mobile Ltd. | | 3.3% |
| America Movil S.A.B. de C.V., “L”, ADR | | 3.2% |
| Reliance Industries Ltd. | | 2.4% |
| Taiwan Semiconductor Manufacturing Co. Ltd. | | 2.2% |
| POSCO, ADR | | 2.0% |
| China Life Insurance | | 2.0% |
| Sberbank | | 1.9% |
| | |
| Equity sectors | | |
| Financial Services | | 20.6% |
| Utilities & Communications | | 19.9% |
| Energy | | 19.7% |
| Basic Materials | | 16.2% |
| Technology | | 5.2% |
| Consumer Staples | | 3.6% |
| Industrial Goods & Services | | 3.2% |
| Special Products & Services | | 3.1% |
| Autos & Housing | | 2.8% |
| Retailing | | 1.5% |
| Transportation | | 1.4% |
| Leisure | | 1.2% |
| Health Care | | 1.0% |
| | |
| Country weightings | | |
| Brazil | | 18.8% |
| Russia | | 14.0% |
| China | | 9.3% |
| Mexico | | 8.6% |
| South Africa | | 8.1% |
| India | | 6.9% |
| Taiwan | | 6.4% |
| South Korea | | 5.5% |
| Israel | | 3.2% |
| Other Countries | | 19.2% |
Percentages are based on net assets as of 12/31/07.
The portfolio is actively managed and current holdings may be different.
2
MANAGEMENT REVIEW
Summary of Results
For the twelve months ended December 31, 2007, Initial Class shares of the MFS Emerging Markets Equity Portfolio (the “fund”) provided a total return of 35.71%, while Service Class shares provided a total return of 35.38%. These compare with a return of 39.78% for the fund’s benchmark, the MSCI Emerging Markets Index.
Market Environment
Despite seemingly robust growth rates during the second and third quarters of 2007, underlying economic activity in the U.S. remained muted relative to other major economies. Overall, global economies witnessed moderate to strong growth during the reporting period as domestic demand improved and world trade accelerated.
With the strong global growth, however, concerns emerged about rising global inflation, especially as capacity became more constrained, wages rose, and energy and food prices advanced. During the reporting period, global central banks (with the exception of the U.S. Federal Reserve Board) tightened monetary conditions, which in turn pushed global bond yields to their highest levels during this economic expansion.
However, financial markets – particularly in the mortgage and structured-products areas – experienced substantial volatility in recent months. Beginning in late July, heightened uncertainty and distress concerning the subprime mortgage market caused several global credit markets to tighten up, forcing central banks to inject liquidity and to reassess their tightening biases as sovereign bond yields declined and credit spreads widened. While credit conditions improved somewhat by late October as the Federal Reserve Board cut interest rates, the level of market turbulence remained significant through year end. Increased market turmoil was also exacerbated by U.S. home foreclosures and uncertainties surrounding falling housing prices. Despite increased volatility across all asset classes and the widening in credit spreads, U.S. labor markets were resilient and wages rose modestly. More broadly, global equity markets rebounded following summer losses and generally held those gains through the end of the reporting period.
Detractors from performance
Security selection in the financial services sector was the primary detractor from performance relative to the MSCI Emerging Markets Index. Holdings in banking firm Kookmin Bank(g) (South Korea) and banking services firm ABSA Group Ltd. (South Africa) held back performance.
An underweighted position in the industrial goods and services sector also hindered performance over the reporting period, although no holdings in this sector were among the fund’s top detractors.
The fund’s technology sector positions contained many of the most notable disappointments. In particular, our holdings of electronics manufacturer Samsung Electronics(g) (South Korea) hurt results. Shares of Samsung declined due, in part, to pricing pressure on LCD and memory components. Holdings of global software services firm HCL Technologies(g) (India) also hindered performance.
Stock selection and, to a lesser extent, an overweighted position in the health care sector also dampened results. The fund’s positions in generic drug manufacturer Teva Pharmaceutical (Israel) and pharmaceutical company Gedeon Richter(g) (Hungary) had an adverse impact on relative performance.
Securities in other sectors that held back relative returns included home builder Sare Holding(aa) (Mexico), electric power company Tenaga Nasional (Malaysia), and our positioning in wireless communications company America Movil (Mexico). America Movil’s shares rose as the company reported strong earnings which exceeded investors’ expectations as well as continued strength in subscriber growth and stable average revenue per user. We failed to participate in all of the stock’s resulting upside. Not owning energy provider SK Energy (South Korea) also held back relative performance as this stock outperformed the benchmark.
Contributors to performance
A combination of stock selection and an overweighted position in the basic materials sector was the primary contributor to performance relative to the fund’s benchmark. Mining companies, Companhia Vale do Rio Doce (Brazil) and Grupo Mexico (Mexico), and steel products manufacturer Steel Authority of India(aa) (India) were among the top contributors.
Stock selection in the energy sector boosted relative performance. Strong performers within this sector included oil and gas exploration and production company Petroleo Brasileiro SA (Brazil) and petrochemical firm Reliance Industries (India). Both firms benefited from higher energy prices. Avoiding gas and oil exploration firm Surgutneftegaz (Russia) also helped relative performance as this firm underperformed the benchmark over the reporting period.
3
Management review – continued
Individual stocks in other sectors that aided relative returns included mobile phone services provider Vimpel Communications (Russia), technology consulting firm Infosys (India), and water supply company Manila Water(aa) (Philippines). Not owning poor-performing cement producer Cemex (Mexico) also enhanced relative returns.
During the reporting period, currency exposure was a contributor to relative performance. All of MFS’ investment decisions are driven by the fundamentals of each individual opportunity and, as such, it is common for our portfolios to have different currency exposure than the benchmark.
Respectfully,
Nicholas Smithie
Portfolio Manager
| (aa) | Security is not a benchmark constituent. |
| (g) | Security was not held in the portfolio at period end. |
The views expressed in this report are those of the portfolio manager only through the end of the period of the report as stated on the cover and do not necessarily reflect the views of MFS or any other person in the MFS organization. These views are subject to change at any time based on market or other conditions, and MFS disclaims any responsibility to update such views. These views may not be relied upon as investment advice or an indication of trading intent on behalf of any MFS portfolio. References to specific securities are not recommendations of such securities, and may not be representative of any MFS portfolio’s current or future investments.
4
PERFORMANCE SUMMARY THROUGH 12/31/07
The following chart illustrates the historical performance of the fund in comparison to its benchmark index. Index comparisons are unmanaged; do not reflect any fees or expenses, and cannot be invested in directly. The performance of other share classes will be greater than or less than that of the class depicted below. (See Notes to Performance Summary.)
Performance data shown represents past performance and is no guarantee of future results. Investment return and principal value fluctuate so your units, when sold, may be worth more or less than the original cost; current performance may be lower or higher than quoted. The performance shown does not reflect the deduction of taxes, if any, that a contract holder would pay on fund distributions or the redemption of contract units. The returns for the fund shown do not reflect the deduction of expenses associated with variable products, such as mortality and expense risk charges, separate account charges, and sales charges imposed by the insurance company separate accounts. Such expenses would reduce the overall returns shown.
Growth of a hypothetical $10,000 investment
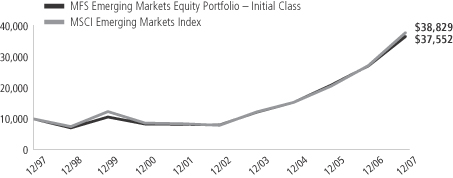
Total returns through 12/31/07
Average Annual Total Returns
| | | | | | | | | | | | |
| | | Share Class | | Class inception date | | 1-yr | | 5-yr | | 10-yr | | |
| | | Initial Class | | 6/05/96 | | 35.71% | | 36.21% | | 14.15% | | |
| | | Service Class | | 8/24/01 | | 35.38% | | 35.88% | | 13.97% | | |
Comparative index
| | | | | | | | | | | | |
| | | MSCI Emerging Markets Index (f) | | 39.78% | | 37.46% | | 14.53% | | |
| (f) | Source: FactSet Research Systems Inc. |
Index Definition
Morgan Stanley Capital International (MSCI) Emerging Markets Index – a market capitalization-weighted index that is designed to measure equity market performance in the global emerging markets.
It is not possible to invest directly in an index.
Notes to Performance Summary
Service Class share performance includes the performance of the fund’s Initial Class shares for periods prior to the inception of Service Class shares (blended performance). This blended performance figure has not been adjusted to take into account differences in the class-specific operating expenses (such as Rule 12b-1 fees). Because operating expenses of Service Class shares are generally higher than those of Initial Class shares, the blended Service Class share performance shown is higher than it would have been had Service Class shares been offered for the entire period.
Performance results reflect any applicable expense subsidies and waivers in effect during the periods shown. Without such subsidies and waivers the fund’s performance results would be less favorable. Please see the prospectus for complete details. All results are historical and assume the reinvestment of any dividends and capital gains distributions.
From time to time the fund may receive proceeds from litigation settlements, without which performance would be lower.
5
EXPENSE TABLE
Fund Expenses Borne by the Contract Holders During the Period,
July 1, 2007 through December 31, 2007
As a contract holder of the fund, you incur ongoing costs, including management fees; distribution (12b-1) fees; and other fund expenses. This example is intended to help you understand your ongoing costs (in dollars) of investing in the fund and to compare these costs with the ongoing costs of investing in other mutual funds.
The example is based on an investment of $1,000 invested at the beginning of the period and held for the entire period, July 1, 2007 through December 31, 2007.
Actual expenses
The first line for each share class in the following table provides information about actual account values and actual expenses. You may use the information in this line, together with the amount you invested, to estimate the expenses that you paid over the period. Simply divide your account value by $1,000 (for example, an $8,600 account value divided by $1,000 = 8.6), then multiply the result by the number in the first line under the heading entitled “Expenses Paid During Period” to estimate the expenses you paid on your account during this period.
Hypothetical example for comparison purposes
The second line for each share class in the following table provides information about hypothetical account values and hypothetical expenses based on the fund’s actual expense ratio and an assumed rate of return of 5% per year before expenses, which is not the fund’s actual return. The hypothetical account values and expenses may not be used to estimate the actual ending account balance or expenses you paid for the period. You may use this information to compare the ongoing costs of investing in the fund and other funds. To do so, compare this 5% hypothetical example with the 5% hypothetical examples that appear in the shareholder reports of the other funds.
Please note that the expenses shown in the table are meant to highlight the fund’s ongoing costs only and do not take into account the fees and expenses imposed under the variable contracts through which your investment in the fund is made. Therefore, the second line for each share class in the table is useful in comparing ongoing costs associated with an investment in vehicles (such as the fund) which fund benefits under variable annuity and variable life insurance contracts and to qualified pension and retirement plans only, and will not help you determine the relative total costs of investing in the fund through variable annuity and variable life insurance contracts. If the fees and expenses imposed under the variable contracts were included, your costs would have been higher.
| | | | | | | | | | |
Share Class | | | | Annualized
Expense Ratio | | Beginning
Account Value
7/01/07 | | Ending
Account Value
12/31/07 | | Expenses Paid
During Period (p)
7/01/07-12/31/07 |
| Initial Class | | Actual | | 1.60% | | $1,000.00 | | $1,184.90 | | $8.81 |
| | Hypothetical (h) | | 1.60% | | $1,000.00 | | $1,017.14 | | $8.13 |
| Service Class | | Actual | | 1.85% | | $1,000.00 | | $1,183.40 | | $10.18 |
| | Hypothetical (h) | | 1.85% | | $1,000.00 | | $1,015.88 | | $9.40 |
| (h) | 5% class return per year before expenses. |
| (p) | Expenses paid is equal to each class’ annualized expense ratio, as shown above, multiplied by the average account value over the period, multiplied by the number of days in the period, divided by the number of days in the year. |
6
PORTFOLIO OF INVESTMENTS – 12/31/07
The Portfolio of Investments is a complete list of all securities owned by your fund.
It is categorized by broad-based asset classes.
| | | | | |
| Issuer | | Shares/Par | | Value ($) |
| | | | | |
| COMMON STOCKS – 99.4% | | | | | |
| Airlines – 0.5% | | | | | |
| Copa Holdings S.A. (l) | | 16,270 | | $ | 611,264 |
| | | | | |
| Alcoholic Beverages – 0.4% | | | | | |
| Grupo Modelo S.A. de C.V., “C” | | 111,700 | | $ | 527,065 |
| | | | | |
| Automotive – 1.1% | | | | | |
| PT Astra International Tbk. | | 224,000 | | $ | 644,864 |
| Tofas Turk Otomobil Fabrikasi AS | | 129,574 | | | 679,787 |
| | | | | |
| | | | $ | 1,324,651 |
| | | | | |
| Broadcasting – 0.7% | | | | | |
| Grupo Televisa S.A., ADR (l) | | 33,240 | | $ | 790,115 |
| | | | | |
| Business Services – 2.6% | | | | | |
| Infosys Technologies Ltd., ADR (l) | | 28,520 | | $ | 1,293,667 |
| LPS Brasil – Consultoria de Imoveis S.A. (a) | | 36,100 | | | 709,831 |
| Satyam Computer Services Ltd. | | 42,050 | | | 479,587 |
| Sime Darby Berhad (a) | | 153,100 | | | 550,919 |
| | | | | |
| | | | $ | 3,034,004 |
| | | | | |
| Chemicals – 2.1% | | | | | |
| Formosa Chemicals & Fibre Corp. | | 175,000 | | $ | 445,962 |
| Israel Chemicals Ltd. | | 108,878 | | | 1,386,363 |
| Makhteshim-Agan Industries Ltd. (a) | | 71,551 | | | 654,185 |
| | | | | |
| | | | $ | 2,486,510 |
| | | | | |
| Computer Software – 0.4% | | | | | |
| Check Point Software Technologies Ltd. (a) | | 24,240 | | $ | 532,310 |
| | | | | |
| Computer Software – Systems – 0.4% | | | | | |
| High Tech Computer Corp. | | 27,020 | | $ | 494,260 |
| | | | | |
| Conglomerates – 0.5% | | | | | |
| CITIC Pacific Ltd. | | 105,000 | | $ | 581,151 |
| | | | | |
| Construction – 1.7% | | | | | |
| Corporacion Moctezuma S.A. de C.V. | | 147,100 | | $ | 360,664 |
| SARE Holding S.A. de C.V., “B” (a) | | 625,300 | | | 823,856 |
| Siam Cement Public Co. Ltd. | | 123,600 | | | 854,150 |
| | | | | |
| | | | $ | 2,038,670 |
| | | | | |
| Consumer Goods & Services – 0.6% | | | | | |
| Kimberly-Clark de Mexico S.A. de C.V., “A” | | 171,568 | | $ | 752,181 |
| | | | | |
| Electrical Equipment – 0.5% | | | | | |
| Bharat Heavy Electricals Ltd. | | 8,420 | | $ | 549,905 |
| | | | | |
| Electronics – 2.9% | | | | | |
| MediaTek, Inc. | | 59,000 | | $ | 759,243 |
| Taiwan Semiconductor Manufacturing Co. Ltd. | | 1,370,000 | | | 2,605,565 |
| United Microelectronics Corp. | | 2,000 | | | 1,235 |
| | | | | |
| | | | $ | 3,366,043 |
| | | | | |
| Energy – Independent – 4.2% | | | | | |
| CNOOC Ltd. | | 979,000 | | $ | 1,643,371 |
| Oil & Natural Gas Corp. Ltd. | | 15,926 | | | 496,706 |
| Reliance Industries Ltd. | | 39,031 | | | 2,854,615 |
| | | | | |
| | | | $ | 4,994,692 |
| | | | | |
| | | | | |
| Issuer | | Shares/Par | | Value ($) |
| | | | | |
| COMMON STOCKS – continued | | | | | |
| Energy – Integrated – 15.5% | | | | | |
| OAO Gazprom, ADR | | 160,299 | | $ | 9,026,730 |
| Petroleo Brasileiro S.A., ADR | | 79,786 | | | 9,194,539 |
| | | | | |
| | | | $ | 18,221,269 |
| | | | | |
| Engineering – Construction – 1.0% | | | | | |
| Murray & Roberts Holdings LTD. | | 40,102 | | $ | 598,507 |
| Orascom Construction Industries | | 5,107 | | | 530,497 |
| | | | | |
| | | | $ | 1,129,004 |
| | | | | |
| Food & Beverages – 1.3% | | | | | |
| Coca-Cola Hellenic Bottling Co. S.A. | | 13,930 | | $ | 600,958 |
| Grupo Continental S.A. | | 231,193 | | | 547,358 |
| Tiger Brands Ltd. | | 17,705 | | | 435,219 |
| | | | | |
| | | | $ | 1,583,535 |
| | | | | |
| Forest & Paper Products – 0.7% | | | | | |
| Aracruz Celulose S.A., ADR (l) | | 11,298 | | $ | 840,006 |
| | | | | |
| Gaming & Lodging – 0.5% | | | | | |
| Resorts World Berhad | | 503,800 | | $ | 588,637 |
| | | | | |
| General Merchandise – 1.5% | | | | | |
| Lotte Shopping Co., Ltd. (a) | | 1,245 | | $ | 545,081 |
| Massmart Holdings Ltd. | | 45,356 | | | 476,035 |
| Wal-Mart de Mexico S.A.B. de C.V. | | 209,400 | | | 723,114 |
| | | | | |
| | | | $ | 1,744,230 |
| | | | | |
| Insurance – 3.4% | | | | | |
| Cathay Financial Holding Co. Ltd. | | 318,894 | | $ | 659,620 |
| China Life Insurance | | 453,000 | | | 2,305,501 |
| Sanlam Ltd. | | 309,131 | | | 1,033,523 |
| | | | | |
| | | | $ | 3,998,644 |
| | | | | |
| Internet – 0.9% | | | | | |
| NHN Corp. (a) | | 2,018 | | $ | 478,417 |
| Universo Online S.A., IPS (a) | | 91,400 | | | 610,100 |
| | | | | |
| | | | $ | 1,088,517 |
| | | | | |
| Machinery & Tools – 1.7% | | | | | |
| Hyundai Heavy Industries Co. Ltd. (a) | | 2,546 | | $ | 1,184,835 |
| Larsen & Toubro Infotech Ltd. | | 7,845 | | | 825,452 |
| | | | | |
| | | | $ | 2,010,287 |
| | | | | |
| Major Banks – 4.9% | | | | | |
| Banco Santander Chile, ADR | | 10,593 | | $ | 540,137 |
| Bank of China Ltd. | | 1,550,000 | | | 738,490 |
| Industrial & Commercial Bank of China, “H” | | 1,945,000 | | | 1,380,047 |
| Malayan Banking Berhad | | 141,800 | | | 490,274 |
| Nedbank Group Ltd. | | 22,482 | | | 447,380 |
| Standard Bank Group Ltd. | | 78,798 | | | 1,153,892 |
| Unibanco – Uniao de Bancos Brasileiros S.A., ADR | | 7,106 | | | 992,282 |
| | | | | |
| | | | $ | 5,742,502 |
| | | | | |
| Metals & Mining – 11.4% | | | | | |
| China Steel Corp. | | 437,000 | | $ | 582,007 |
| Companhia Vale do Rio Doce, ADR | | 175,354 | | | 5,728,815 |
7
Portfolio of Investments – continued
| | | | | |
| Issuer | | Shares/Par | | Value ($) |
| | | | | |
| COMMON STOCKS – continued | | | | | |
| Metals & Mining – continued | | | | | |
| Grupo Mexico S.A.B. de C.V. | | 203,600 | | $ | 1,278,574 |
| Mining & Metallurgical Co. Norilsk Nickel, ADR | | 4,264 | | | 1,146,005 |
| POSCO, ADR (l) | | 15,450 | | | 2,323,835 |
| Southern Copper Corp. (l) | | 6,622 | | | 696,171 |
| Steel Authority of India Ltd. | | 151,327 | | | 1,085,930 |
| Usinas Siderurgicas de Minas Gerais S.A., IPS | | 12,150 | | | 549,248 |
| | | | | |
| | | | $ | 13,390,585 |
| | | | | |
| Other Banks & Diversified Financials – 11.0% | | | |
| ABSA Group Ltd. | | 46,573 | | $ | 755,081 |
| African Bank Investments Ltd. | | 194,938 | | | 941,268 |
| AMMB Holdings Berhad | | 420,200 | | | 481,004 |
| Asya Katilim Bankasi A.S. (a) | | 50,578 | | | 473,726 |
| Banco Bradesco S.A., ADR | | 62,780 | | | 2,008,960 |
| Banco Macro S.A., ADR (l) | | 18,320 | | | 453,237 |
| Bank Rakyat Indonesia | | 592,000 | | | 461,933 |
| Bumiputra-Commerce Holdings Berhad | | 130,800 | | | 430,955 |
| CSU Cardsystem S.A. (a) | | 156,550 | | | 503,110 |
| FirstRand Ltd. | | 291,566 | | | 848,568 |
| Grupo Financiero Banorte S.A. de C.V. | | 127,100 | | | 524,969 |
| Hana Financial Group, Inc. | | 12,230 | | | 662,043 |
| OTP Bank Ltd., GDR | | 7,071 | | | 718,927 |
| PT Bank Central Asia Tbk. | | 609,500 | | | 468,974 |
| Sberbank | | 527,700 | | | 2,201,877 |
| Turkiye Garanti Bankasi A.S. | | 116,048 | | | 1,035,291 |
| | | | | |
| | | | $ | 12,969,923 |
| | | | | |
| Personal Computers & Peripherals – 0.6% | | | |
| Innolux Display Corp. | | 208,960 | | $ | 700,786 |
| | | | | |
| Pharmaceuticals – 1.0% | | | | | |
| Teva Pharmaceutical Industries Ltd., ADR | | 25,425 | | $ | 1,181,754 |
| | | | | |
| Precious Metals & Minerals – 0.9% | | | | | |
| Impala Platinum Holdings Ltd. | | 30,134 | | $ | 1,039,578 |
| | | | | |
| Railroad & Shipping – 0.9% | | | | | |
| DP World Ltd. (a) | | 441,962 | | $ | 525,935 |
| Mercator Lines (a) | | 1,233,000 | | | 539,644 |
| | | | | |
| | | | $ | 1,065,579 |
| | | | | |
| Real Estate – 1.3% | | | | | |
| Capitaland Ltd. | | 115,000 | | $ | 494,454 |
| Hopson Development | | 160,000 | | | 439,244 |
| Yanlord Land Group LTD. | | 240,000 | | | 549,993 |
| | | | | |
| | | | $ | 1,483,691 |
| | | | | |
| Specialty Chemicals – 1.1% | | | | | |
| Formosa Plastics Corp. | | 195,000 | | $ | 544,519 |
| LG Chemical Ltd. (a) | | 8,180 | | | 779,668 |
| | | | | |
| | | | $ | 1,324,187 |
| | | | | |
| Telecommunications – Wireless – 13.5% | | | |
| America Movil S.A.B. de C.V., “L”, ADR | | 61,640 | | $ | 3,784,080 |
| China Mobile Ltd. | | 223,500 | | | 3,873,123 |
| Egyptian Co. for Mobil Services (MobiNil) | | 15,747 | | | 586,797 |
| Mobile TeleSystems OJSC, ADR | | 16,342 | | | 1,663,452 |
| MTN Group Ltd. | | 95,700 | | | 1,793,198 |
| Orascom Telecom Holding (S.A.E.) | | 65,690 | | | 1,087,956 |
| | | | | |
| Issuer | | Shares/Par | | Value ($) |
| | | | | |
| COMMON STOCKS – continued | | | | | |
| Telecommunications – Wireless – continued | | | |
| Philippine Long Distance Telephone Co. | | 15,593 | | $ | 1,193,842 |
| Vimpel-Communications, ADR | | 45,430 | | | 1,889,888 |
| | | | | |
| | | | $ | 15,872,336 |
| | | | | |
| Telephone Services – 2.4% | | | | | |
| Chunghwa Telecom Co. Ltd. | | 357,090 | | $ | 725,421 |
| PT Telekomunikasi Indonesia Tbk. | | 832,000 | | | 899,100 |
| Sistema JSFC, GDR | | 15,850 | | | 661,738 |
| Telecom Argentina S.A., ADR (a)(l) | | 22,870 | | | 508,858 |
| | | | | |
| | | | $ | 2,795,117 |
| | | | | |
| Tobacco – 1.3% | | | | | |
| ITC Ltd. | | 115,580 | | $ | 614,188 |
| KT&G Corp. (a) | | 5,837 | | | 496,992 |
| PT Hanjaya Mandala Sampoerna Tbk. | | 271,500 | | | 413,356 |
| | | | | |
| | | | $ | 1,524,536 |
| | | | | |
| Utilities – Electric Power – 4.0% | | | | | |
| CEZ AS | | 19,527 | | $ | 1,462,423 |
| Eletropaulo Metropolitana S.A., IPS | | 12,900,000 | | | 1,045,074 |
| Manila Water Co., Inc. | | 3,238,000 | | | 1,437,086 |
| Tenaga Nasional Berhad | | 256,000 | | | 740,652 |
| | | | | |
| | | | $ | 4,685,235 |
| | | | | |
Total Common Stocks
(Identified Cost, $81,899,514) | | | | $ | 117,062,759 |
| | | | | |
| | | | | | | | | |
| WARRANTS – 0.5% | | | | | | | | | |
| | | Strike
Price | | First
Exercise | | | | |
| Real Estate – 0.5% | | | | | | | | | |
Merrill Lynch
International & Co.
(Emaar Properties – Zero
Strike Warrant (1 share for 1 warrant))
(Identified Cost, |
| $560,140) (a)(n) | | 0 | | 01/12/2010 | | 149,141 | | $ | 614,014 |
| | | | | | | | | |
| RIGHTS – 0.0% BRL | | 27.1 | | 12/07/2007 | | | | | |
| Business Services – 0.0% | | | | | | | |
LPS Brasil – Consultoria de Imoveis S.A.
(1 share for 1 right) (Identified Cost, $15,717) (a) | | 1,019 | | $ | 15,514 |
| | | | | | | | | |
| COLLATERAL FOR SECURITIES LOANED – 5.4% | | | |
| Navigator Securities Lending Prime Portfolio, at Cost and Net Asset Value | | | | | | 6,318,169 | | $ | 6,318,169 |
| | | | | | | | | |
| | | | | | | | | | |
Total Investments
(Identified Cost, $88,793,540) (k) | | | | | | | | $ | 124,010,456 | |
| | | | | | | | | | |
OTHER ASSETS, LESS
LIABILITIES – (5.3)% | | | | | | | | | (6,203,293 | ) |
| | | | | | | | | | |
| Net Assets – 100.0% | | | | | | | | $ | 117,807,163 | |
| | | | | | | | | | |
8
Portfolio of Investments – continued
| (a) | Non-income producing security. |
| (k) | As of December 31, 2007, the fund had 31 securities that were fair valued, aggregating $27,017,473 and 21.79% of market value, in accordance with the policies adopted by the Board of Trustees. |
| (l) | All or a portion of this security is on loan. |
| (n) | Securities exempt from registration under Rule 144A of the Securities Act of 1933. These securities may be sold in the ordinary course of business in transactions exempt from registration, normally to qualified institutional buyers. At period end, the aggregate value of these securities was $614,014, representing 0.5% of net assets. |
Abbreviations indicate amounts shown in currencies other than the U.S. Dollar. All amounts are stated in U.S. dollars unless otherwise indicated. A list of abbreviations is shown below:
The following abbreviations are used in this report and are defined:
| ADR | American Depository Receipt |
| GDR | Global Depository Receipt |
| IPS | International Preference Stock |
See Notes to Financial Statements
9
FINANCIAL STATEMENTS | STATEMENT OF ASSETS AND LIABILITIES
This statement represents your fund’s balance sheet, which details the assets and liabilities comprising the total value of the fund.
| | | | |
| At 12/31/07 | | | | |
| Assets | | | | |
| Investments, at value, including $6,183,643 of securities on loan (identified cost, $88,793,540) | | $124,010,456 | | |
| Foreign currency, at value (identified cost, $113,441) | | 113,303 | | |
| Receivable for investments sold | | 1,129,993 | | |
| Receivable for fund shares sold | | 140 | | |
| Interest and dividends receivable | | 204,236 | | |
| Other assets | | 5,109 | | |
| Total assets | | | | $125,463,237 |
| Liabilities | | | | |
| Payable to custodian | | $714,200 | | |
| Payable for investments purchased | | 15,858 | | |
| Payable for fund shares reacquired | | 186,818 | | |
| Collateral for securities loaned, at value | | 6,318,169 | | |
| Payable to affiliates | | | | |
Management fee | | 13,663 | | |
Distribution fees | | 651 | | |
Administrative services fee | | 290 | | |
| Payable for independent trustees’ compensation | | 252 | | |
| Accrued expenses and other liabilities | | 406,173 | | |
| Total liabilities | | | | $7,656,074 |
| Net assets | | | | $117,807,163 |
| Net assets consist of | | | | |
| Paid-in capital | | $57,025,267 | | |
Unrealized appreciation (depreciation) on investments and translation of assets and liabilities in
foreign currencies (net of $243,318 deferred country tax) | | 34,973,492 | | |
| Accumulated net realized gain (loss) on investments and foreign currency transactions | | 24,759,485 | | |
| Undistributed net investment income | | 1,048,919 | | |
| Net assets | | | | $117,807,163 |
| Shares of beneficial interest outstanding | | | | 4,514,647 |
| Initial Class shares | | | | |
Net assets | | $94,193,353 | | |
Shares outstanding | | 3,602,070 | | |
Net asset value per share | | | | $26.15 |
| Service Class shares | | | | |
Net assets | | $23,613,810 | | |
Shares outstanding | | 912,577 | | |
Net asset value per share | | | | $25.88 |
See Notes to Financial Statements
10
FINANCIAL STATEMENTS | STATEMENT OF OPERATIONS
This statement describes how much your fund earned in investment income and accrued in expenses. It also describes any gains and/or losses generated by fund operations.
| | | | | |
| Year ended 12/31/07 | | | | | |
| Net investment income | | | | | |
| Income | | | | | |
Dividends | | $3,395,700 | | | |
Interest | | 34,903 | | | |
Foreign taxes withheld | | (275,145 | ) | | |
| Total investment income | | | | | $3,155,458 |
| Expenses | | | | | |
Management fee | | $1,199,030 | | | |
Distribution fees | | 54,738 | | | |
Administrative services fee | | 29,492 | | | |
Independent trustees’ compensation | | 10,055 | | | |
Custodian fee | | 423,017 | | | |
Shareholder communications | | 11,651 | | | |
Auditing fees | | 53,116 | | | |
Legal fees | | 5,950 | | | |
Miscellaneous | | 42,592 | | | |
| Total expenses | | | | | $1,829,641 |
Fees paid indirectly | | (5,185 | ) | | |
| Net expenses | | | | | $1,824,456 |
| Net investment income | | | | | $1,331,002 |
| Realized and unrealized gain (loss) on investments | | | | | |
| Realized gain (loss) (identified cost basis) | | | | | |
Investment transactions (net of $12,237 country tax) | | $25,089,050 | | | |
Foreign currency transactions | | (155,511 | ) | | |
| Net realized gain (loss) on investments and foreign currency transactions | | | | | $24,933,539 |
| Change in unrealized appreciation (depreciation) | | | | | |
Investments (net of $193,164 increase in deferred country tax) | | $8,445,104 | | | |
Translation of assets and liabilities in foreign currencies | | (3,386 | ) | | |
| Net unrealized gain (loss) on investments and foreign currency translation | | | | | $8,441,718 |
| Net realized and unrealized gain (loss) on investments and foreign currency | | | | | $33,375,257 |
| Change in net assets from operations | | | | | $34,706,259 |
See Notes to Financial Statements
11
FINANCIAL STATEMENTS | STATEMENTS OF CHANGES IN NET ASSETS
These statements describe the increases and/or decreases in net assets resulting from operations, any distributions, and any shareholder transactions.
| | | | | | |
| For years ended 12/31 | | 2007 | | | 2006 | |
| Change in net assets | | | | | | |
| From operations | | | | | | |
| Net investment income | | $1,331,002 | | | $2,107,396 | |
| Net realized gain (loss) on investments and foreign currency transactions | | 24,933,539 | | | 21,938,254 | |
| Net unrealized gain (loss) on investments and foreign currency translation | | 8,441,718 | | | 2,078,016 | |
| Change in net assets from operations | | $34,706,259 | | | $26,123,666 | |
| Distributions declared to shareholders | | | | | | |
| From net investment income | | | | | | |
Initial Class | | $(1,854,835 | ) | | $(978,689 | ) |
Service Class | | (404,084 | ) | | (135,060 | ) |
| From net realized gain on investments | | | | | | |
Initial Class | | (17,838,286 | ) | | (13,285,025 | ) |
Service Class | | (4,249,384 | ) | | (2,097,870 | ) |
| Total distributions declared to shareholders | | $(24,346,589 | ) | | $(16,496,644 | ) |
| Change in net assets from fund share transactions | | $(1,147,671 | ) | | $5,670,696 | |
| Total change in net assets | | $9,211,999 | | | $15,297,718 | |
| Net assets | | | | | | |
| At beginning of period | | 108,595,164 | | | 93,297,446 | |
| At end of period (including undistributed net investment income of $1,048,919 and $1,998,983, respectively) | | $117,807,163 | | | $108,595,164 | |
See Notes to Financial Statements
12
FINANCIAL STATEMENTS | FINANCIAL HIGHLIGHTS
The financial highlights table is intended to help you understand the fund’s financial performance for the past 5 years. Certain information reflects financial results for a single fund share. The total returns in the table represent the rate by which an investor would have earned (or lost) on an investment in the fund share class (assuming reinvestment of all distributions) held for the entire period.
Initial Class
| | | | | | | | | | | | | | | |
| | | Years ended 12/31 | |
| | | 2007 | | | 2006 | | | 2005 | | | 2004 | | | 2003 | |
| Net asset value, beginning of period | | $24.52 | | | $21.84 | | | $16.16 | | | $12.85 | | | $8.48 | |
| Income (loss) from investment operations | | | | | | | | | | | | | | | |
| Net investment income (d) | | $0.30 | | | $0.47 | | | $0.29 | | | $0.18 | | | $0.20 | |
Net realized and unrealized gain (loss) on investments and
foreign currency | | 7.13 | | | 5.92 | | | 5.59 | | | 3.27 | | | 4.23 | |
| Total from investment operations | | $7.43 | | | $6.39 | | | $5.88 | | | $3.45 | | | $4.43 | |
| Less distributions declared to shareholders | | | | | | | | | | | | | | | |
| From net investment income | | $(0.55 | ) | | $(0.25 | ) | | $(0.13 | ) | | $(0.14 | ) | | $(0.06 | ) |
| From net realized gain on investments | | (5.25 | ) | | (3.46 | ) | | (0.07 | ) | | — | | | — | |
| Total distributions declared to shareholders | | $(5.80 | ) | | $(3.71 | ) | | $(0.20 | ) | | $(0.14 | ) | | $(0.06 | ) |
| Net asset value, end of period | | $26.15 | | | $24.52 | | | $21.84 | | | $16.16 | | | $12.85 | |
| Total return (%) (k)(s) | | 35.71 | | | 30.16 | | | 36.76 | | | 27.18 | | | 52.60 | |
Ratios (%) (to average net assets)
and Supplemental data: | | | | | | | | | | | | | | | |
| Expenses (f) | | 1.55 | | | 1.53 | | | 1.31 | | | 1.35 | | | 1.65 | |
| Net investment income | | 1.22 | | | 2.08 | | | 1.62 | | | 1.33 | | | 1.99 | |
| Portfolio turnover | | 96 | | | 110 | | | 95 | | | 109 | | | 125 | |
| Net assets at end of period (000 Omitted) | | $94,193 | | | $89,419 | | | $82,804 | | | $57,799 | | | $46,769 | |
See Notes to Financial Statements
13
Financial Highlights – continued
Service Class
| | | | | | | | | | | | | | | |
| | | Years ended 12/31 | |
| | | 2007 | | | 2006 | | | 2005 | | | 2004 | | | 2003 | |
| Net asset value, beginning of period | | $24.33 | | | $21.71 | | | $16.08 | | | $12.80 | | | $8.45 | |
| Income (loss) from investment operations | | | | | | | | | | | | | | | |
| Net investment income (d) | | $0.23 | | | $0.41 | | | $0.25 | | | $0.15 | | | $0.17 | |
Net realized and unrealized gain (loss) on investments and
foreign currency | | 7.07 | | | 5.89 | | | 5.54 | | | 3.25 | | | 4.22 | |
| Total from investment operations | | $7.30 | | | $6.30 | | | $5.79 | | | $3.40 | | | $4.39 | |
| Less distributions declared to shareholders | | | | | | | | | | | | | | | |
| From net investment income | | $(0.50 | ) | | $(0.22 | ) | | $(0.09 | ) | | $(0.12 | ) | | $(0.04 | ) |
| From net realized gain on investments | | (5.25 | ) | | (3.46 | ) | | (0.07 | ) | | — | | | — | |
| Total distributions declared to shareholders | | $(5.75 | ) | | $(3.68 | ) | | $(0.16 | ) | | $(0.12 | ) | | $(0.04 | ) |
| Net asset value, end of period | | $25.88 | | | $24.33 | | | $21.71 | | | $16.08 | | | $12.80 | |
| Total return (%) (k)(s) | | 35.38 | | | 29.90 | | | 36.36 | | | 26.96 | | | 52.12 | |
Ratios (%) (to average net assets)
and Supplemental data: | | | | | | | | | | | | | | | |
| Expenses (f) | | 1.81 | | | 1.78 | | | 1.56 | | | 1.60 | | | 1.89 | |
| Net investment income | | 0.96 | | | 1.84 | | | 1.38 | | | 1.08 | | | 1.71 | |
| Portfolio turnover | | 96 | | | 110 | | | 95 | | | 109 | | | 125 | |
| Net assets at end of period (000 Omitted) | | $23,614 | | | $19,176 | | | $10,494 | | | $6,397 | | | $5,049 | |
| (d) | Per share data are based on average shares outstanding. |
| (f) | Ratios do not reflect reductions from fees paid indirectly, if applicable. |
| (k) | The total return does not reflect expenses that apply to separate accounts. Inclusion of these charges would reduce the total return figures for all periods shown. |
| (s) | From time to time the fund may receive proceeds from litigation settlements, without which performance would be lower. |
See Notes to Financial Statements
14
NOTES TO FINANCIAL STATEMENTS
| (1) | | Business and Organization |
MFS Emerging Markets Equity Portfolio (the fund) (formerly Emerging Markets Equity Series) is a series of MFS Variable Insurance Trust II (the trust) (formerly known as MFS/Sun Life Series Trust). The trust is organized as a Massachusetts business trust and is registered under the Investment Company Act of 1940, as amended, as an open-end management investment company. The shares of the fund are sold only to variable accounts established by insurance companies to fund benefits under variable contracts issued by such companies.
| (2) | | Significant Accounting Policies |
General – The preparation of financial statements in conformity with U.S. generally accepted accounting principles requires management to make estimates and assumptions that affect the reported amounts of assets and liabilities, and disclosure of contingent assets and liabilities at the date of the financial statements and the reported amounts of revenues and expenses during the reporting period. Actual results could differ from those estimates. The fund can invest in foreign securities, including securities of emerging market issuers. Investments in foreign securities are vulnerable to the effects of changes in the relative values of the local currency and the U.S. dollar and to the effects of changes in each country’s legal, political, and economic environment. The markets of emerging markets countries are generally more volatile than the markets of developed countries with more mature economies. All of the risks of investing in foreign securities previously described are heightened when investing in emerging markets countries.
Investment Valuations – Equity securities, including restricted equity securities, are generally valued at the last sale or official closing price as reported by an independent pricing service on the market or exchange on which they are primarily traded. For securities for which there were no sales reported that day, equity securities are generally valued at the last quoted daily bid quotation as reported by an independent pricing service on the market or exchange on which they are primarily traded. For securities held short for which there were no sales reported for the day, the position is generally valued at the last quoted daily ask quotation as reported by an independent pricing service on the market or exchange on which such securities are primarily traded. Short-term instruments with a maturity at issuance of 60 days or less may be valued at amortized cost, which approximates market value. Open-end investment companies are generally valued at their net asset value per share. Securities and other assets generally valued on the basis of information from an independent pricing service may also be valued at a broker-dealer bid quotation. The values of foreign securities and other assets and liabilities expressed in foreign currencies are converted to U.S. dollars using the mean of bid and asked prices for rates reported by an independent pricing service.
The Board of Trustees has delegated primary responsibility for determining or causing to be determined the value of the fund’s investments (including any fair valuation) to the adviser pursuant to valuation policies and procedures approved by the Board. If the adviser determines that reliable market quotations are not readily available, investments are valued at fair value as determined in good faith by the adviser in accordance with such procedures under the oversight of the Board of Trustees. Under the fund’s valuation policies and procedures, market quotations are not considered to be readily available for many types of debt instruments and certain types of derivatives. These investments are generally valued at fair value based on information from independent pricing services. In addition, investments may be valued at fair value if the adviser determines that an investment’s value has been materially affected by events occurring after the close of the exchange or market on which the investment is principally traded (such as foreign exchange or market) and prior to the determination of the fund’s net asset value, or after the halting of trading of a specific security where trading does not resume prior to the close of the exchange or market on which the security is principally traded. Events that occur on a frequent basis after foreign markets close (such as developments in foreign markets and significant movements in the U.S. markets) and prior to the determination of the fund’s net asset value may be deemed to have a material affect on the value of securities traded in foreign markets. Accordingly, the fund’s foreign equity securities may often be valued at fair value. The adviser may rely on independent pricing services or other information (such as the correlation with price movements of similar securities in the same or other markets; the type, cost and investment characteristics of the security; the business and financial condition of the issuer; and trading and other market data) to assist in determining whether to fair value and at what value to fair value an investment. The value of an investment for purposes of calculating the fund’s net asset value can differ depending on the source and method used to determine value. When fair valuation is used, the value of investments used to determine the fund’s net asset value may differ from quoted or published prices for the same investments.
In September 2006, FASB Statement No. 157, Fair Value Measurements (the “Statement”) was issued, and is effective for fiscal years beginning after November 15, 2007 and for all interim periods within those fiscal years. This Statement provides a single definition of fair value, a hierarchy for measuring fair value and expanded disclosures about fair value measurements. Management is evaluating the application of the Statement to the fund, and believes the impact will be limited to expanded disclosures resulting from the adoption of this Statement in the fund’s financial statements.
15
Notes to Financial Statements – continued
Foreign Currency Translation – Purchases and sales of foreign investments, income, and expenses are converted into U.S. dollars based upon currency exchange rates prevailing on the respective dates of such transactions. Gains and losses attributable to foreign currency exchange rates on sales of securities are recorded for financial statement purposes as net realized gains and losses on investments. Gains and losses attributable to foreign exchange rate movements on income and expenses are recorded for financial statement purposes as foreign currency transaction gains and losses. That portion of both realized and unrealized gains and losses on investments that results from fluctuations in foreign currency exchange rates is not separately disclosed.
Security Loans – State Street Bank and Trust Company (“State Street”), as lending agent, may loan the securities of the fund to certain qualified institutions (the “Borrowers”) approved by the fund. The loans are collateralized at all times by cash and/or U.S. Treasury securities in an amount at least equal to the market value of the securities loaned. State Street provides the fund with indemnification against Borrower default. The fund bears the risk of loss with respect to the investment of cash collateral. On loans collateralized by cash, the cash collateral is invested in a money market fund or short-term securities. A portion of the income generated upon investment of the collateral is remitted to the Borrowers, and the remainder is allocated between the fund and the lending agent. On loans collateralized by U.S. Treasury securities, a fee is received from the Borrower, and is allocated between the fund and the lending agent. Net income from securities lending is included in interest income on the Statement of Operations. The dividend and interest income earned on the securities loaned is accounted for in the same manner as other dividend and interest income.
Indemnifications – Under the fund’s organizational documents, its officers and trustees may be indemnified against certain liabilities and expenses arising out of the performance of their duties to the fund. Additionally, in the normal course of business, the fund enters into agreements with service providers that may contain indemnification clauses. The fund’s maximum exposure under these agreements is unknown as this would involve future claims that may be made against the fund that have not yet occurred.
Investment Transactions and Income – Investment transactions are recorded on the trade date. Interest income is recorded on the accrual basis. All premium and discount is amortized or accreted for financial statement purposes in accordance with U.S. generally accepted accounting principles. All discount is accreted for tax reporting purposes as required by federal income tax regulations. Dividends received in cash are recorded on the ex-dividend date. Certain dividends from foreign securities will be recorded when the fund is informed of the dividend if such information is obtained subsequent to the ex-dividend date. Dividend and interest payments received in additional securities are recorded on the ex-dividend or ex-interest date in an amount equal to the value of the security on such date.
The fund may receive proceeds from litigation settlements. Any proceeds received from litigation involving portfolio holdings are reflected in the Statement of Operations in realized gain/loss if the security has been disposed of by the fund or in unrealized gain/loss if the security is still held by the fund. Any other proceeds from litigation not related to portfolio holdings are reflected as other income in the Statement of Operations.
Fees Paid Indirectly – The fund’s custody fee may be reduced according to an arrangement that measures the value of cash deposited with the custodian by the fund. This amount, for the year ended December 31, 2007, is shown as a reduction of total expenses on the Statement of Operations.
Tax Matters and Distributions – The fund intends to qualify as a regulated investment company, as defined under Subchapter M of the Internal Revenue Code, and to distribute all of its taxable income, including realized capital gains. As a result, no provision for federal income taxes is required. The fund adopted the provisions of FASB Interpretation No. 48, Accounting for Uncertainty in Income Taxes (“the Interpretation”) on January 1, 2007. The Interpretation prescribes a minimum threshold for financial statement recognition of the benefit of a tax position taken or expected to be taken in a tax return. There was no impact resulting from the adoption of this Interpretation on the fund’s financial statements. Each of the fund’s federal tax returns for the prior three fiscal years remains subject to examination by the Internal Revenue Service. It is the fund’s policy to record interest and penalty charges on underpaid taxes associated with its tax positions as interest expense and other expense, respectively. No such charges were recorded in the current financial statements. Foreign taxes, if any, have been accrued by the fund in the accompanying financial statements.
Distributions to shareholders are recorded on the ex-dividend date. Income and capital gain distributions are determined in accordance with income tax regulations, which may differ from U.S. generally accepted accounting principles. Certain capital accounts in the financial statements are periodically adjusted for permanent differences in order to reflect their tax character. These adjustments have no impact on net assets or net asset value per share. Temporary differences which arise from recognizing certain items of income, expense, gain or loss in different periods for financial statement and tax purposes will reverse at some time in the future. Distributions in excess of net investment income or net realized gains are temporary overdistributions for financial statement purposes resulting from differences in the recognition or classification of income or distributions for financial statement and tax purposes.
16
Notes to Financial Statements – continued
Book/tax differences primarily relate to wash sale loss deferrals, foreign currency transactions, foreign taxes, and passive foreign investment companies.
The tax character of distributions declared to shareholders is as follows:
| | | | |
| | | 12/31/07 | | 12/31/06 |
| Ordinary income (including any short-term capital gains) | | $5,681,971 | | $6,817,904 |
| Long-term capital gain | | 18,664,618 | | 9,678,740 |
| Total distributions | | $24,346,589 | | $16,496,644 |
The federal tax cost and the tax basis components of distributable earnings were as follows:
| | | |
| As of 12/31/07 | | | |
| Cost of investments | | $88,981,551 | |
| Gross appreciation | | 37,439,097 | |
| Gross depreciation | | (2,410,192 | ) |
| Net unrealized appreciation (depreciation) | | $35,028,905 | |
| Undistributed ordinary income | | 6,943,066 | |
| Undistributed long-term capital gain | | 19,062,355 | |
| Other temporary differences | | (252,430 | ) |
Multiple Classes of Shares of Beneficial Interest – The fund offers multiple classes of shares, which differ in their respective distribution fees. All shareholders bear the common expenses of the fund based on daily net assets of each class, without distinction between share classes. Dividends are declared separately for each class. Differences in per share dividend rates are generally due to differences in separate class expenses.
| (3) | | Transactions with Affiliates |
Investment Adviser – The fund has an investment advisory agreement with Massachusetts Financial Services Company (MFS) to provide overall investment management and related administrative services and facilities to the fund.
The management fee is computed daily and paid monthly at the following annual rates:
| | |
| First $500 million of average daily net assets | | 1.05% |
| Average daily net assets in excess of $500 million | | 1.00% |
The management fee incurred for the year ended December 31, 2007 was equivalent to an annual effective rate of 1.05% of the fund’s average daily net assets.
Distributor – MFS Fund Distributors, Inc. (MFD), a wholly-owned subsidiary of MFS, is the distributor of shares of the fund. The Trustees have adopted a distribution plan for the Service Class shares pursuant to Rule 12b-1 under the Investment Company Act of 1940.
The fund’s distribution plan provides that the fund will pay MFD distribution fees equal to 0.25% per annum of its average daily net assets attributable to Service Class shares as partial consideration for services performed and expenses incurred by MFD and financial intermediaries in connection with the sale and distribution of the fund’s Service Class shares and the sale and distribution of the variable annuity or variable life insurance contracts investing indirectly in Service Class shares. MFD may subsequently pay all, or a portion, of the distribution fees to financial intermediaries.
Shareholder Servicing Agent – MFS Service Center, Inc. (MFSC), a wholly-owned subsidiary of MFS, has contracted to provide transfer agent and recordkeeping functions in connection with the issuance, transfer, and redemption of each class of shares of each fund under a Shareholder Servicing Agent Agreement. During the year ended December 31, 2007, MFSC did not receive a fee for this service.
Administrator – MFS provides certain financial, legal, shareholder communications, compliance, and other administrative services to the fund. Under an administrative services agreement, the fund partially reimburses MFS the costs incurred to provide these services. The fund is charged an annual fixed amount of $10,000 plus a fee based on average daily net assets.
The administrative services fee incurred for the year ended December 31, 2007 was equivalent to an annual effective rate of 0.0258% of the fund’s average daily net assets.
Trustees’ and Officers’ Compensation – The fund pays compensation to trustees in the form of a retainer, attendance fees, and additional compensation to the Board chairperson. The fund does not pay compensation directly to officers of the fund who are also officers of the investment adviser, all of whom receive remuneration for their services to the fund from MFS. Certain officers of the fund are officers or directors of MFS, MFD, and MFSC.
17
Notes to Financial Statements – continued
Other – This fund and certain other MFS funds (the funds) have entered into a services agreement (the Agreement) which provides for payment of fees by the funds to Tarantino LLC in return for the provision of services of an Independent Chief Compliance Officer (ICCO) for the funds. The ICCO is an officer of the funds and the sole member of Tarantino LLC. The funds can terminate the Agreement with Tarantino LLC at any time under the terms of the Agreement. MFS has agreed to bear all expenses associated with office space, other administrative support, and supplies provided to the ICCO. For the year ended December 31, 2007, the fee paid to Tarantino LLC was $575 and is included in miscellaneous expense.
Purchases and sales of investments, other than U.S. government securities, purchased option transactions, and short-term obligations, aggregated $108,840,057 and $132,498,693, respectively.
| (5) | | Shares of Beneficial Interest |
The fund’s Declaration of Trust permits the Trustees to issue an unlimited number of full and fractional shares of beneficial interest. Transactions in fund shares were as follows:
| | | | | | | | | | | | |
| | | Year ended 12/31/07 | | | Year ended 12/31/06 | |
| | | Shares | | | Amount | | | Shares | | | Amount | |
| Shares sold | | | | | | | | | | | | |
Initial Class | | 160,162 | | | $3,974,259 | | | 461,878 | | | $10,944,669 | |
Service Class | | 152,282 | | | 3,659,943 | | | 373,697 | | | 8,407,231 | |
| | 312,444 | | | $7,634,202 | | | 835,575 | | | $19,351,900 | |
| Shares issued to shareholders in reinvestment of distributions | | | | | | | | | | | | |
Initial Class | | 926,735 | | | $19,693,121 | | | 612,703 | | | $14,263,714 | |
Service Class | | 220,962 | | | 4,653,468 | | | 96,580 | | | 2,232,930 | |
| | 1,147,697 | | | $24,346,589 | | | 709,283 | | | $16,496,644 | |
| Shares reacquired | | | | | | | | | | | | |
Initial Class | | (1,130,873 | ) | | $(27,255,257 | ) | | (1,220,180 | ) | | $(26,542,036 | ) |
Service Class | | (248,851 | ) | | (5,873,205 | ) | | (165,472 | ) | | (3,635,812 | ) |
| | (1,379,724 | ) | | $(33,128,462 | ) | | (1,385,652 | ) | | $(30,177,848 | ) |
| Net change | | | | | | | | | | | | |
Initial Class | | (43,976 | ) | | $(3,587,877 | ) | | (145,599 | ) | | $(1,333,653 | ) |
Service Class | | 124,393 | | | 2,440,206 | | | 304,805 | | | 7,004,349 | |
| | 80,417 | | | $(1,147,671 | ) | | 159,206 | | | $5,670,696 | |
The fund and other funds managed by MFS participate in a $1 billion unsecured committed line of credit provided by a syndication of banks under a credit agreement. In addition, the fund and other funds managed by MFS have established uncommitted borrowing arrangements with certain banks. Borrowings may be made for temporary financing needs. Interest is charged to each fund, based on its borrowings, generally at a rate equal to the Federal Reserve funds rate plus 0.30%. In addition, a commitment fee, based on the average daily, unused portion of the committed line of credit, is allocated among the participating funds at the end of each calendar quarter. For the year ended December 31, 2007, the fund’s commitment fee and interest expense were $513 and $8,733, respectively, and are included in miscellaneous expense on the Statement of Operations.
18
REPORT OF INDEPENDENT REGISTERED PUBLIC ACCOUNTING FIRM
To the Board of Trustees of MFS Variable Insurance Trust II (formerly known as MFS/Sun Life Series Trust) and the Shareholders of MFS Emerging Markets Equity Portfolio (formerly known as Emerging Markets Equity Series):
We have audited the accompanying statement of assets and liabilities, including the portfolio of investments, of MFS Emerging Markets Equity Portfolio (one of the portfolios comprising MFS Variable Insurance Trust II) (the “Trust”) as of December 31, 2007, and the related statement of operations for the year then ended, the statements of changes in net assets for each of the two years in the period then ended, and the financial highlights for each of the five years in the period then ended. These financial statements and financial highlights are the responsibility of the Trust’s management. Our responsibility is to express an opinion on these financial statements and financial highlights based on our audits.
We conducted our audits in accordance with the standards of the Public Company Accounting Oversight Board (United States). Those standards require that we plan and perform the audit to obtain reasonable assurance about whether the financial statements and financial highlights are free of material misstatement. The Trust is not required to have, nor were we engaged to perform, an audit of its internal control over financial reporting. Our audits included consideration of internal control over financial reporting as a basis for designing audit procedures that are appropriate in the circumstances, but not for the purpose of expressing an opinion on the effectiveness of the Trust’s internal control over financial reporting. Accordingly, we express no such opinion. An audit also includes examining, on a test basis, evidence supporting the amounts and disclosures in the financial statements, assessing the accounting principles used and significant estimates made by management, as well as evaluating the overall financial statement presentation. Our procedures included confirmation of securities owned as of December 31, 2007, by correspondence with the custodian and brokers; where replies were not received from brokers, we performed other auditing procedures. We believe that our audits provide a reasonable basis for our opinion.
In our opinion, such financial statements and financial highlights present fairly, in all material respects, the financial position of MFS Emerging Markets Equity Portfolio as of December 31, 2007, the results of its operations for the year then ended, the changes in its net assets for each of the two years in the period then ended, and its financial highlights for each of the five years in the period then ended, in conformity with accounting principles generally accepted in the United States of America.
DELOITTE & TOUCHE LLP
Boston, Massachusetts
February 15, 2008
19
TRUSTEES AND OFFICERS – IDENTIFICATION AND BACKGROUND
The Trustees and officers of the Trust, as of February 1, 2008, are listed below, together with their principal occupations during the past five years. (Their titles may have varied during that period.) The address of each Trustee and officer is 500 Boylston Street, Boston, Massachusetts 02116.
| | | | | | |
Name, Date of Birth | | Position(s) Held
with Fund | | Trustee/Officer
Since(1) | | Principal Occupations During the Past Five Years &
Other Directorships(2) |
| INTERESTED TRUSTEE | | | | | | |
David D. Horn(3) (born 06/07/41) | | Trustee | | April 1986 | | Private investor; Retired; Sun Life Assurance Company of Canada, Former Senior Vice President and General Manager for the United States (until 1997); Retired: Sun Life Assurance Company of Canada, Director (until March 2004) |
| | |
| INDEPENDENT TRUSTEES | | | | |
J. Kermit Birchfield (born 01/08/40) | | Chairman | | May 1997 | | Consultant; Century Partners, Inc. (investments), Director (1988 to present); Displaytech, Inc. (technology), Director (1995 to present); Dessin Fournir LLC (furniture manufacturer), Director (2005 to present); Intermountain Gas Company, Inc. & Intermountain Industries, Inc. (oil & gas exploration and production) (1988 to present); Site Watch LLC (software to monitor oil tanks) Managing Director (2006 to present); Juridica Investments (fund investing in judicial matters) Director (2007 to present); Dairy Mart Convenience Stores, Inc. (convenience stores), Chairman (1997 to 2003) |
| | | |
Robert C. Bishop (born 01/13/43) | | Trustee | | May 2001 | | Autolmmune Inc. (pharmaceutical product licensing), Chairman, President and Chief Executive Officer (1992 to present); Caliper Life Sciences Corp. (laboratory analytical instruments), Director (2002 to present); Millipore Corporation (biopharmaceutical/research laboratory products), Director (1997 to present); Optobionics Corporation (ophthalmic devices), Director (2002 to 2007); Quintiles Transnational Corp. (contract research services), Director (until 2003) |
| | | |
Frederick H. Dulles (born 03/12/42) | | Trustee | | May 2001 | | Ten State International Law PLLC (law firm), Of Counsel (since 2006); Prudential Carolina Real Estate, (real estate), Broker (since 2006); Free Enterprise Foundation, Inc. (research institute), Director & Secretary (until 2008); Disher, Hamrick & Myers Residential, Inc. (real estate) Broker (until 2006); Frederick H. Dulles law practice (until 2006); Ten State Street LLP (law firm), Member (until 2005); McFadden, Pilkington & Ward LLP (solicitors and registered foreign lawyers), Member & Of Counsel (until 2003) |
| | | |
Marcia A. Kean (born 06/30/48) | | Trustee | | April 2005 | | Feinstein Kean Healthcare (consulting), Chief Executive Officer (since December 2002), Managing Director (prior to May 2001); Ardais Corporation (biotech products), Senior Vice President – Commercialization (February 2002 until November 2002) |
| | | |
Ronald G. Steinhart (born 06/15/40) | | Trustee | | May 2001 | | Private investor; Penske Automotive Group (automotive retailer), Director (2001 to present); Penson Worldwide, Inc. (securities clearance), Director (2006 to present); Animal Health International, Inc. (animal health products), Director (2007 to present); Texas Industries (concrete/aggregates/cement), Director (2007 to present); Carreker Corporation (technology consulting) Director (until 2005); Prentiss Properties Trust (real estate investment trust), Director (until 2006) |
| | | |
Haviland Wright (born 07/21/48) | | Trustee | | May 2001 | | Elixir Technologies Corporation (software) Director (2005 to present); Nano Loa Inc. (liquid crystal displays), Director (2003 to present); Silk Displays, Inc. (smart polymers) Director (2007 to present); Displaytech, Inc. (technology) Chairman and CEO (1995 – 2002) |
| | | |
| TRUSTEE EMERITUS | | | | | | |
Samuel Adams (born 10/19/25) | | Trustee Emeritus | | | | Retired; Kirkpatrick & Lockhart Preston Gates Ellis LLP (law firm), Of Counsel |
| | | |
| OFFICERS | | | | | | |
Maria F. Dwyer(4) (born 12/01/58) | | President | | November 2005 | | Massachusetts Financial Services Company, Executive Vice President and Chief Regulatory Officer (since March 2004); Fidelity Management & Research Company, Vice President (prior to March 2004); Fidelity Group of Funds, President and Treasurer (prior to March 2004) |
| | | |
Tracy Atkinson(4) (born 12/30/64) | | Treasurer | | September 2005 | | Massachusetts Financial Services Company, Senior Vice President (since September 2004); PricewaterhouseCoopers LLP, Partner (prior to September 2004) |
| | | |
Christopher R. Bohane(4) (born 01/18/74) | | Assistant Secretary and Assistant Clerk | | July 2005 | | Massachusetts Financial Services Company, Vice President and Senior Counsel (since April 2003); Kirkpatrick & Lockhart LLP (law firm), Associate (prior to April 2003) |
20
Trustees and Officers – continued
| | | | | | |
Name, Date of Birth | | Position(s) Held
with Fund | | Trustee/Officer
Since(1) | | Principal Occupations During the Past Five Years &
Other Directorships(2) |
| | | |
Ethan D. Corey(4) (born 11/21/63) | | Assistant Secretary and Assistant Clerk | | July 2005 | | Massachusetts Financial Services Company, Senior Vice President and Associate General Counsel (since April 2006); Special Counsel (prior to April 2006); Dechert LLP (law firm), Counsel (prior to December 2004) |
| | | |
David L. DiLorenzo(4) (born 08/10/68) | | Assistant Treasurer | | July 2005 | | Massachusetts Financial Services Company, Vice President (since June 2005); JP Morgan Investor Services, Vice President (January 2001 to June 2005) |
| | | |
Timothy M. Fagan(4) (born 07/10/68) | | Assistant Secretary and Assistant Clerk | | September 2005 | | Massachusetts Financial Services Company, Vice President and Senior Counsel (since September 2005); John Hancock Advisers, LLC, Vice President and Chief Compliance Officer (September 2004 to August 2005) Senior Attorney (prior to September 2004); John Hancock Group of Funds, Vice President and Chief Compliance Officer (September 2004 to December 2004) |
| | | |
Mark D. Fischer(4) (born 10/27/70) | | Assistant Treasurer | | July 2005 | | Massachusetts Financial Services Company, Vice President (since May 2005); JP Morgan Investment Management Company, Vice President (prior to May 2005) |
| | | |
Brian E. Langenfeld(4) (born 03/07/73) | | Assistant Secretary and Assistant Clerk | | May 2006 | | Massachusetts Financial Services Company, Assistant Vice President and Counsel (since May 2006); John Hancock Advisers, LLC, Assistant Vice President and Counsel (May 2005 to April 2006); John Hancock Advisers, LLC, Attorney and Assistant Secretary (prior to May 2005) |
| | | |
Ellen Moynihan(4) (born 11/13/57) | | Assistant Treasurer | | May 1997 | | Massachusetts Financial Services Company, Senior Vice President |
| | | |
Susan S. Newton(4) (born 03/07/50) | | Assistant Secretary and Assistant Clerk | | May 2005 | | Massachusetts Financial Services Company, Senior Vice President and Assistant General Counsel (since April 2005); John Hancock Advisers, LLC, Senior Vice President, Secretary and Chief Legal Officer (prior to April 2005); John Hancock Group of Funds, Senior Vice President, Secretary and Chief Legal Officer (prior to April 2005) |
| | | |
Susan A. Pereira(4) (born 11/05/70) | | Assistant Secretary and Assistant Clerk | | July 2005 | | Massachusetts Financial Services Company, Vice President and Senior Counsel (since June 2004); Bingham McCutchen LLP (law firm), Associate (January 2001 to June 2004) |
| | | |
Mark N. Polebaum(4) (born 05/01/52) | | Secretary and Assistant Clerk | | February 2006 | | Massachusetts Financial Services Company, Executive Vice President, General Counsel and Secretary (since January 2006); Wilmer Cutler Pickering Hale and Dorr LLP (law firm), Partner (prior to January 2006) |
| | | |
Frank L. Tarantino (born 03/07/44) | | Independent Chief Compliance Officer | | September 2004 | | Tarantino LLC (provider of compliance services), Principal (since June 2004); CRA Business Strategies Group (consulting services), Executive Vice President (April 2003 to June 2004); David L. Babson & Co. (investment adviser), Managing Director, Chief Administrative Officer and Director (February 1997 to March 2003) |
| | | |
Richard S. Weitzel(4) (born 7/16/70) | | Assistant Secretary and Assistant Clerk | | October 2007 | | Massachusetts Financial Services Company, Vice President and Assistant General Counsel (since 2007); Vice President and Senior Counsel (since May 2004); Massachusetts Department of Business and Technology, General Counsel (February 2003 to April 2004); Massachusetts Office of the Attorney General, Assistant Attorney General ( April 2001 to February 2003); Ropes and Gray, Associate (prior to April 2001) |
| | | |
James O. Yost(4) (born 06/12/60) | | Assistant Treasurer | | April 1992 | | Massachusetts Financial Services Company, Senior Vice President |
| (1) | Date first appointed to serve as Trustee/Officer of an MFS fund or a Compass variable account. Each Trustee has served continuously since appointment. |
| (2) | Directorships or trusteeships of companies required to report to the Securities and Exchange Commission (i.e., “public companies”). |
| (3) | “Interested person” of the Sun Life of Canada (U.S.), within the meaning of the Investment Company Act of 1940 (referred to as the 1940 Act), which is the principal federal law governing investment companies like the Series. The address of Sun Life of Canada (U.S.) is One Sun Life Executive Park, Wellesley Hills, Massachusetts 02481. |
| (4) | “Interested person” of MFS within the meaning of the 1940 Act. The address of MFS is 500 Boylston Street, Boston, Massachusetts 02116. |
The Trust does not hold annual meetings for the purpose of electing Trustees, and Trustees are not elected for fixed terms. Each Trustee and officer holds office until his or her successor is chosen and qualified, or until his or her earlier death, resignation, retirement or removal.
All Trustees currently serve as Trustees of the Trust and have served in that capacity since originally elected or appointed. All of the Trustees are also Managers of the Compass Variable Accounts. The executive officers of the Trust hold similar offices for the Compass Variable Accounts and other funds in the MFS fund complex. As of January 1, 2008, each Trustee serves as a Trustee or Manager of 35 Accounts/Funds.
21
Trustees and Officers – continued
The Statement of Additional Information contains further information about the Trustees and is available without charge upon request by calling 1-800-225-2606.
| | |
Investment Adviser Massachusetts Financial Services Company 500 Boylston Street, Boston, MA 02116-3741 | | Custodian State Street Bank and Trust Company 225 Franklin Street, Boston, MA 02110 |
Distributor MFS Fund Distributors, Inc. 500 Boylston Street, Boston, MA 02116-3741 | | Independent Registered Public Accounting Firm Deloitte & Touche LLP 200 Berkeley Street, Boston, MA 02116 |
Portfolio Manager Nicholas Smithie | | |
22
BOARD REVIEW OF INVESTMENT ADVISORY AGREEMENT
The Investment Company Act of 1940 requires that both the full Board of Trustees and a majority of the non-interested (“independent”) Trustees, voting separately, annually approve the continuation of the investment advisory agreement between MFS Variable Insurance Trust II (the “Trust”) and Massachusetts Financial Services Company (MFS) on behalf of the Fund. The Trustees consider matters bearing on the Fund and the advisory arrangements at their meetings throughout the year, including a review of performance data at each regular meeting. In addition, the independent Trustees met several times over the course of three months beginning in May and ending in July 2007 (“contract review meetings”) for the specific purpose of considering whether to approve the continuation of the investment advisory agreement for the Fund. The independent Trustees were assisted in their evaluation of the investment advisory agreement by independent legal counsel, from whom they received separate legal advice and with whom they met separately from MFS management during various contract review meetings. The independent Trustees were also assisted in this process by the Fund’s Independent Chief Compliance Officer, a full-time senior officer appointed by and reporting to the independent Trustees.
In connection with their deliberations, the Trustees, including the independent Trustees, considered such information and factors as they believed, in light of the legal advice furnished to them and their own business judgment, to be relevant. The investment advisory agreement was considered separately for the Fund, although the Trustees also took into account the common interests of all Funds in the Trust in their review. As described below, the Trustees considered the nature, quality, and extent of the various investment advisory, administrative, and shareholder services performed by MFS under the existing investment advisory agreement and other arrangements with the Trust.
In connection with their contract review meetings, the Trustees received and relied upon materials which included, among other items: (i) information provided by Lipper Inc. on the investment performance of the Fund for various time periods ended December 31, 2006, compared to the investment performance of a group of funds with substantially similar investment classifications/objectives (the “Lipper performance universe”), as well as the investment performance of a group of funds identified by objective criteria suggested by MFS (“peer funds”), (ii) information provided by Lipper Inc. on the Fund’s advisory fees and other expenses compared to the advisory fees and other expenses of comparable funds identified by Lipper (the “Lipper expense group”), as well as the advisory fees and other expenses of peer funds identified by objective criteria suggested by MFS, (iii) information provided by MFS on the advisory fees of comparable portfolios of its other clients, including institutional separate account and other clients, (iv) information as to whether, and to what extent applicable, expense waivers, reimbursements or fee “breakpoints” are observed for the Fund, (v) information regarding MFS’ financial results and financial condition, including MFS’ and certain of its affiliates’ estimated profitability from services performed for the Fund, (vi) MFS’ views regarding the outlook for the mutual fund industry and its strategic business plans, (vii) descriptions of various functions performed by MFS for the Trust, such as compliance monitoring and portfolio trading practices, and (viii) information regarding the overall organization of MFS, including information about MFS’ senior management and other personnel providing investment advisory, administrative and other services to the Fund. The comparative performance, fee and expense information prepared and provided by Lipper Inc. was not independently verified, and the independent Trustees did not independently verify any information provided to them by MFS.
The Trustees’ conclusion as to the continuation of the investment advisory agreement was based on comprehensive consideration of all information provided to the Trustees and not the result of any single factor. Some of the factors that figured particularly in the Trustees’ deliberations are described below for the Fund, while individual Trustees may have given different weight to various factors and evaluated the information presented as a whole differently than another Trustee. The Trustees recognized that the fee arrangements for the Fund reflect years of review and discussion between the independent Trustees and MFS, that certain aspects of such arrangements may receive greater scrutiny in some years than others, and that the Trustees’ conclusions may be based, in part, on their consideration of these same arrangements during the course of the year and in prior years.
Based on information provided by Lipper Inc. and MFS, the Trustees compared the Fund’s total return investment performance to the performance of a peer group of funds over various time periods. The Trustees placed particular emphasis on the total return performance of the Fund’s Initial Class shares in comparison to the performance of funds in its Lipper performance universe over the one-, three- and five-year periods. The Trustees did not rely on performance results for more recent periods, including those shown elsewhere in this report.
The Trustees noted the performance of the Fund’s Initial Class shares was in the 4th quintile relative to the other funds in the Lipper Classification Index for the one-year period (the 1st quintile being the best performers and the 5th quintile being the worst performers). The total return performance of the Fund was in the 1st quintile for the three-year period and the 2nd quintile for the five-year period ended December 31, 2006, relative to the Lipper performance universe. Based on the nature and quality of services provided by MFS, the Board of Trustees concluded that the Fund’s performance was satisfactory.
23
Board Review of Investment Advisory Agreement – continued
In the course of their deliberations, the Trustees took into account information provided by MFS during contract review meetings, as well as during investment review meetings conducted with portfolio management personnel during the course of the year.
In assessing the reasonableness of the Fund’s advisory fee, the Trustees considered, among other information, the Fund’s advisory fee and the total expense ratio of the Fund’s Initial Class shares as a percentage of average daily net assets, compared to the advisory fee and total expense ratios of its peer group of funds based on information provided by Lipper Inc. and MFS. The Trustees also considered the advisory fees charged by MFS to institutional accounts. In comparing these fees, the Trustees considered the generally broader scope of services provided by MFS to the Trust than those provided to institutional accounts. The Trustees also considered the higher demands placed on MFS’ investment personnel and trading infrastructure as a result of the daily cash in-flows and out-flows of the Fund, and the impact on MFS and related expenses due to the more extensive regulatory regime to which the Fund is subject, compared to institutional accounts.
In considering the fees, the Trustees noted from the Lipper data that the Fund’s effective advisory fee rate was below the median and total expense ratio was above the median of such fees and expenses of funds in the Lipper expense group. The Trustees further concluded that the existing breakpoints were sufficient to allow the Fund to benefit from economies of scale as its assets grow.
The Trustees also considered information prepared by MFS relating to its costs and profits with respect to the Fund and other investment companies and accounts advised by MFS, as well as MFS’ methodologies used to determine and allocate its costs to the Fund and other accounts and products for purposes of estimating profitability.
After reviewing these and other factors described below, the Trustees concluded that the advisory fee charged to the Fund represents reasonable compensation in light of the nature and quality of the services being provided by MFS.
In addition, the Trustees considered MFS’ resources and related efforts to continue to retain, attract and motivate capable personnel to serve the Fund. The Trustees also considered the financial resources of MFS and its parent, Sun Life Financial Inc. The Trustees further considered any advantages and possible disadvantages of having an adviser which also serves other investment companies as well as institutional accounts.
The Trustees also considered the nature, quality, cost, and extent of administrative, transfer agency, and distribution services provided to the Fund by MFS and its affiliates under agreements and plans other than the investment advisory agreement, including the 12b-1 fees the Fund pays to MFS Fund Distributors, Inc., an affiliate of MFS. The Trustees also considered the nature, extent and quality of certain other services MFS performs or arranges on the Fund’s behalf, which may include securities lending programs, directed expense payment programs, class action recovery programs, and MFS’ interaction with third-party service providers, principally custodians and sub-custodians. The Trustees concluded that the various non-advisory services provided by MFS and its affiliates on behalf of the Fund were satisfactory. The Trustees also considered the benefits to MFS from the use of the Fund’s portfolio brokerage commissions to pay for research and other similar services (including MFS’ policy not to use “soft dollars” generated by Fund portfolio transactions to pay for third-party research), and various other factors. Additionally, the Trustees considered so-called “fall-out benefits” to MFS such as reputational value derived from serving as investment manager to the Trust, and determined that any such benefits derived by MFS were reasonable and fair.
Based on their evaluation of factors that they deemed to be material, including those factors described above, the Board of Trustees, including a majority of the independent Trustees, concluded that the investment advisory agreement should be continued for an additional one-year period, commencing September 1, 2007.
A discussion regarding the Board’s most recent review and renewal of the Fund’s investment advisory agreement is available by clicking on the Fund’s name under “Variable Insurance Portfolios” on the “Products & Performance” page on the MFS Web site (mfs.com).
24
PROXY VOTING POLICIES AND INFORMATION
A general description of the MFS funds’ proxy voting policies and procedures is available without charge, upon request, by calling 1-800-225-2606, by visiting the About MFS section of mfs.com or by visiting the SEC’s Web site at http://www.sec.gov.
Information regarding how the fund voted proxies relating to portfolio securities during the most recent twelve-month period ended June 30 is available without charge by visiting the Proxy Voting section of mfs.com or by visiting the SEC’s Web site at http://www.sec.gov.
QUARTERLY PORTFOLIO DISCLOSURE
The fund will file a complete schedule of portfolio holdings with the Securities and Exchange Commission (the Commission) for the first and third quarters of each fiscal year on Form N-Q. The fund’s Form N-Q may be reviewed and copied at the:
Public Reference Room
Securities and Exchange Commission
100 F Street, NE, Room 1580
Washington, D.C. 20549
Information on the operation of the Public Reference Room may be obtained by calling the Commission at 1-800-SEC-0330. The fund’s Form N-Q is available on the EDGAR database on the Commission’s Internet Web site at http://www.sec.gov, and copies of this information may be obtained, upon payment of a duplicating fee, by electronic request at the following e-mail address: publicinfo@sec.gov or by writing the Public Reference Section at the above address.
A shareholder can also obtain the quarterly portfolio holdings report at mfs.com.
FEDERAL TAX INFORMATION (unaudited)
The following information is provided pursuant to provisions of the Internal Revenue Code.
The fund designates $18,664,618 as capital gain dividends paid during the fiscal year.
Income derived from foreign sources was $2,942,671. The fund intends to pass through foreign tax credits of $260,609 for the fiscal year.
25
MFS® PRIVACY NOTICE
Privacy is a concern for every investor today. At MFS Investment Management® and the MFS funds, we take this concern very seriously. We want you to understand our policies about the investment products and services that we offer, and how we protect the nonpublic personal information of investors who have a direct relationship with us and our wholly owned subsidiaries.
Throughout our business relationship, you provide us with personal information. We maintain information and records about you, your investments, and the services you use. Examples of the nonpublic personal information we maintain include
| | Ÿ | | data from investment applications and other forms |
| | Ÿ | | share balances and transactional history with us, our affiliates, or others |
| | Ÿ | | facts from a consumer reporting agency |
We do not disclose any nonpublic personal information about our customers or former customers to anyone, except as permitted by law. We may share nonpublic personal information with third parties or certain of our affiliates in connection with servicing your account or processing your transactions. We may share information with companies or financial institutions that perform marketing services on our behalf or with other financial institutions with which we have joint marketing arrangements, subject to any legal requirements.
Authorization to access your nonpublic personal information is limited to appropriate personnel who provide products, services, or information to you. We maintain physical, electronic, and procedural safeguards to help protect the personal information we collect about you.
If you have any questions about the MFS privacy policy, please call 1-800-225-2606 any business day between 8 a.m. and 8 p.m. Eastern time.
Note: If you own MFS products or receive MFS services in the name of a third party such as a bank or broker-dealer, their privacy policy may apply to you instead of ours.
26
CONTACT US
Web site
mfs.com
Account service and
literature
Shareholders
1-877-411-3325
9 a.m. to 5 p.m. ET
Investment professionals
1-800-637-8630
8 a.m. to 5 p.m. ET
Mailing address
MFS Service Center, Inc.
Attn: Institutional Alliance Services (IAS)
P.O. Box 55824
Boston, MA
02205-5824
Overnight mail
MFS Service Center, Inc.
Attn: Institutional Alliance Services (IAS)
500 Boylston Street
Boston, MA 02116-3741


MFS® Variable Insurance Trust IISM
Annual report
MFS® Blended ResearchSM Growth Portfolio
12/31/07
BRG-ANN
MFS® BLENDED RESEARCHSM GROWTH PORTFOLIO
The report is prepared for the general information of contract owners. It is authorized for distribution to prospective investors only when preceded or accompanied by a current prospectus.
NOT FDIC INSURED MAY LOSE VALUE NO BANK OR CREDIT UNION GUARANTEE NOT A DEPOSIT NOT INSURED BY ANY FEDERAL GOVERNMENT AGENCY OR NCUA/NCUSIF
LETTER FROM THE CEO

Dear Contract Owners:
The past year has been a great example of why investors should keep their eyes on the long term.
In 2006 the Dow Jones Industrial Average returned 19% and was fairly stable. This year we have seen a greater level of volatility than has been experienced in recent years. The Dow hit several new highs but also experienced swift drops as a global credit crisis swept through markets, spurred by defaults on U.S. subprime loans and a liquidity crunch. Still, even with this volatility, the Dow ended the first three quarters of 2007 with a return near 13%.
U.S. Treasury bonds gained ground, especially in the third quarter as investors sought less risky asset classes. The spreads of many lower-quality debt investments widened.
In 2007 the U.S. dollar fell against the euro, oil prices hit their highest levels yet, and gold spiked to its steepest price in 28 years. Around the globe, stocks sold off as risk aversion mounted. As we have said before, markets can be volatile, and investors should make sure they have an investment plan that can carry them through the peaks and troughs.
If you are focused on a long-term investment strategy, the short-term ups and downs of the markets should not necessarily dictate portfolio action on your part. In our view, investors who remain committed to a long-term plan are more likely to achieve their financial goals.
In any market environment, we believe individual investors are best served by following a three-pronged investment strategy of allocating their holdings across the major asset classes, diversifying within each class, and regularly rebalancing their portfolios to maintain their desired allocations. Of course, these strategies cannot guarantee a profit or protect against a loss. Investing and planning for the long term require diligence and patience, two traits that in our experience are essential to capitalizing on the many opportunities the financial markets can offer — through both up and down economic cycles.
Respectfully,

Robert J. Manning
Chief Executive Officer and Chief Investment Officer
MFS Investment Management®
February 15, 2008
The opinions expressed in this letter are subject to change, may not be relied upon for investment advice, and no forecasts can be guaranteed.
1
PORTFOLIO COMPOSITION
Portfolio structure

| | |
| Top ten holdings | | |
| Microsoft Corp. | | 4.8% |
| Intel Corp. | | 3.0% |
| Google, Inc., “A” | | 2.6% |
| International Business Machines Corp. | | 2.5% |
| Apple Computer, Inc. | | 2.5% |
| Cisco Systems, Inc. | | 2.4% |
| Exxon Mobil Corp. | | 2.2% |
| Altria Group, Inc. | | 2.1% |
| Boeing Co. | | 1.9% |
| PepsiCo, Inc. | | 1.8% |
| | |
| Equity sectors | | |
| Technology | | 27.0% |
| Health Care | | 16.6% |
| Retailing | | 7.9% |
| Consumer Staples | | 7.3% |
| Industrial Goods & Services | | 7.3% |
| Energy | | 6.5% |
| Financial Services | | 6.2% |
| Leisure | | 5.8% |
| Utilities & Communications | | 4.3% |
| Special Products & Services | | 3.7% |
| Basic Materials | | 3.4% |
| Transportation | | 1.8% |
| Autos & Housing | | 1.6% |
Percentages are based on net assets as of 12/31/07.
The portfolio is actively managed and current holdings may be different.
2
EXPENSE TABLE
Fund Expenses Borne by the Contract Holders During the Period, December 18, 2007 through December 31, 2007
As a contract holder of the fund, you incur ongoing costs, including management fees; distribution (12b-1) fees; and other fund expenses. This example is intended to help you understand your ongoing costs (in dollars) of investing in the fund and to compare these costs with the ongoing costs of investing in other mutual funds.
The example is based on an investment of $1,000 invested at the beginning of the period and held for the entire period December 18, 2007 through December 31, 2007. The hypothetical example assumes the share classes were in existence for the entire six months ended December 31, 2007.
Actual expenses
The first line for each share class in the following table provides information about actual account values and actual expenses. You may use the information in this line, together with the amount you invested, to estimate the expenses that you paid over the period. Simply divide your account value by $1,000 (for example, an $8,600 account value divided by $1,000 = 8.6), then multiply the result by the number in the first line under the heading entitled “Expenses Paid During Period” to estimate the expenses you paid on your account during this period.
Hypothetical example for comparison purposes
The second line for each share class in the following table provides information about hypothetical account values and hypothetical expenses based on the fund’s actual expense ratio and an assumed rate of return of 5% per year before expenses, which is not the fund’s actual return. The hypothetical account values and expenses may not be used to estimate the actual ending account balance or expenses you paid for the period. You may use this information to compare the ongoing costs of investing in the fund and other funds. To do so, compare this 5% hypothetical example with the 5% hypothetical examples that appear in the shareholder reports of the other funds.
Please note that the expenses shown in the table are meant to highlight the fund’s ongoing costs only and do not take into account the fees and expenses imposed under the variable contracts through which your investment in the fund is made. Therefore, the second line for each share class in the table is useful in comparing ongoing costs associated with an investment in vehicles (such as the fund) which fund benefits under variable annuity and variable life insurance contracts and to qualified pension and retirement plans only, and will not help you determine the relative total costs of investing in the fund through variable annuity and variable life insurance contracts. If the fees and expenses imposed under the variable contracts were included, your costs would have been higher.
| | | | | | | | | | |
Share Class | | | | Annualized
Expense Ratio | | Beginning
Account Value
12/18/07 | | Ending
Account Value
12/31/07 | | Expenses Paid
During Period (p)
12/18/07-12/31/07 |
| Initial Class | | Actual | | 0.60% | | $1,000.00 | | $1,011.30 | | $0.21 |
| | Hypothetical (h) | | 0.60% | | $1,000.00 | | $1,022.18 | | $3.06 |
| Service Class | | Actual | | 0.85% | | $1,000.00 | | $1,011.30 | | $0.30 |
| | Hypothetical (h) | | 0.85% | | $1,000.00 | | $1,020.92 | | $4.33 |
| (h) | 5% class return per year before expenses. |
| (p) | Expenses paid is equal to each class’ annualized expense ratio, as shown above, multiplied by the average account value over the period, multiplied by the number of days in the period, divided by the number of days in the year. For the hypothetical expenses paid it is assumed that the fund was in existence for the entire six month period ended December 31, 2007. |
3
PORTFOLIO OF INVESTMENTS – 12/31/07
The Portfolio of Investments is a complete list of all securities owned by your fund.
It is categorized by broad-based asset classes.
| | | | | |
| Issuer | | Shares/Par | | Value ($) |
| COMMON STOCKS – 99.4% | | | | | |
| Aerospace – 1.9% | | | | | |
| Boeing Co. | | 1,079 | | $ | 94,369 |
| | | | | |
| Airlines – 0.4% | | | | | |
| Southwest Airlines Co. | | 1,796 | | $ | 21,911 |
| | | | | |
| Apparel Manufacturers – 1.6% | | | | | |
| Coach, Inc. (a) | | 1,034 | | $ | 31,620 |
| NIKE, Inc., “B” | | 774 | | | 49,722 |
| | | | | |
| | | | $ | 81,342 |
| | | | | |
| Automotive – 0.8% | | | | | |
| Goodyear Tire & Rubber Co. (a) | | 1,372 | | $ | 38,718 |
| | | | | |
| Biotechnology – 2.7% | | | | | |
| Amgen, Inc. (a) | | 1,360 | | $ | 63,158 |
| Biogen Idec, Inc. | | 481 | | | 27,379 |
| Invitrogen Corp. (a) | | 482 | | | 45,024 |
| | | | | |
| | | | $ | 135,561 |
| | | | | |
| Broadcasting – 1.1% | | | | | |
| Omnicom Group, Inc. | | 613 | | $ | 29,136 |
| Walt Disney Co. | | 848 | | | 27,373 |
| | | | | |
| | | | $ | 56,509 |
| | | | | |
| Brokerage & Asset Managers – 2.0% | | | | | |
| Affiliated Managers Group, Inc. (a) | | 338 | | $ | 39,701 |
| Charles Schwab Corp. | | 1,235 | | | 31,554 |
| TD AMERITRADE Holding Corp. (a) | | 1,363 | | | 27,342 |
| | | | | |
| | | | $ | 98,597 |
| | | | | |
| Business Services – 2.6% | | | | | |
| Corporate Executive Board Co. | | 550 | | $ | 33,055 |
| Global Payments, Inc. | | 977 | | | 45,450 |
| Western Union Co. | | 2,221 | | | 53,926 |
| | | | | |
| | | | $ | 132,431 |
| | | | | |
| Cable TV – 1.0% | | | | | |
| DIRECTV Group, Inc. | | 993 | | $ | 22,958 |
| EchoStar Communications Corp., “A” (a) | | 736 | | | 27,762 |
| | | | | |
| | | | $ | 50,720 |
| | | | | |
| Chemicals – 1.5% | | | | | |
| 3M Co. | | 583 | | $ | 49,159 |
| Monsanto Co. | | 251 | | | 28,034 |
| | | | | |
| | | | $ | 77,193 |
| | | | | |
| Computer Software – 8.1% | | | | | |
| BEA Systems, Inc. | | 2,075 | | $ | 32,743 |
| McAfee, Inc. (a) | | 672 | | | 25,200 |
| Microsoft Corp. | | 6,781 | | | 241,404 |
| Oracle Corp. (a) | | 2,725 | | | 61,531 |
| VeriSign, Inc. (a) | | 1,272 | | | 47,840 |
| | | | | |
| | | | $ | 408,718 |
| | | | | |
| Computer Software – Systems – 8.1% | | | | | |
| Apple Computer, Inc. (a) | | 639 | | $ | 126,573 |
| Arrow Electronics, Inc. | | 618 | | | 24,275 |
| | | | | |
| Issuer | | Shares/Par | | Value ($) |
| COMMON STOCKS – continued | | | | | |
| Computer Software – Systems – continued | | | | | |
| EMC Corp. (a) | | 2,219 | | $ | 41,118 |
| Hewlett-Packard Co. | | 1,274 | | | 64,312 |
| International Business Machines Corp. | | 1,181 | | | 127,666 |
| Network Appliance, Inc. (a) | | 1,056 | | | 26,358 |
| | | | | |
| | | | $ | 410,302 |
| | | | | |
| Construction – 0.8% | | | | | |
| Sherwin-Williams Co. | | 725 | | $ | 42,079 |
| | | | | |
| Consumer Goods & Services – 2.8% | | | | | |
| Apollo Group, Inc., “A” (a) | | 303 | | $ | 21,255 |
| ITT Educational Services, Inc. (a) | | 396 | | | 33,767 |
| Procter & Gamble Co. | | 1,191 | | | 87,443 |
| | | | | |
| | | | $ | 142,465 |
| | | | | |
| Electrical Equipment – 1.9% | | | | | |
| Rockwell Automation, Inc. | | 817 | | $ | 56,340 |
| WESCO International, Inc. (a) | | 935 | | | 37,063 |
| | | | | |
| | | | $ | 93,403 |
| | | | | |
| Electronics – 3.7% | | | | | |
| Intel Corp. | | 5,706 | | $ | 152,122 |
| MEMC Electronic Materials, Inc. (a) | | 396 | | | 35,042 |
| | | | | |
| | | | $ | 187,164 |
| | | | | |
| Energy – Integrated – 2.2% | | | | | |
| Exxon Mobil Corp. | | 1,191 | | $ | 111,585 |
| | | | | |
| Engineering – Construction – 0.6% | | | | | |
| Shaw Group, Inc. (a) | | 471 | | $ | 28,467 |
| | | | | |
| Food & Beverages – 3.5% | | | | | |
| Coca-Cola Co. | | 986 | | $ | 60,511 |
| PepsiCo, Inc. | | 1,176 | | | 89,258 |
| SYSCO Corp. | | 850 | | | 26,529 |
| | | | | |
| | | | $ | 176,298 |
| | | | | |
| Gaming & Lodging – 1.6% | | | | | |
| International Game Technology | | 496 | | $ | 21,789 |
| MGM Mirage (a) | | 670 | | | 56,293 |
| | | | | |
| | | | $ | 78,082 |
| | | | | |
| General Merchandise – 1.4% | | | | | |
| Wal-Mart Stores, Inc. | | 1,436 | | $ | 68,253 |
| | | | | |
| Health Maintenance Organizations – 3.2% | | | | | |
| Aetna, Inc. | | 901 | | $ | 52,015 |
| Coventry Health Care, Inc. (a) | | 703 | | | 41,653 |
| Humana, Inc. (a) | | 303 | | | 22,819 |
| WellPoint, Inc. (a) | | 539 | | | 47,286 |
| | | | | |
| | | | $ | 163,773 |
| | | | | |
| Insurance – 1.1% | | | | | |
| Prudential Financial, Inc. | | 607 | | $ | 56,475 |
| | | | | |
| Internet – 2.6% | | | | | |
| Google, Inc., “A” (a) | | 188 | | $ | 129,998 |
| | | | | |
4
Portfolio of Investments – continued
| | | | | |
| Issuer | | Shares/Par | | Value ($) |
| COMMON STOCKS – continued | | | | | |
| Leisure & Toys – 0.5% | | | | | |
| Scientific Games Corp. | | 808 | | $ | 26,866 |
| | | | | |
| Machinery & Tools – 2.9% | | | | | |
| Caterpillar, Inc. | | 666 | | $ | 48,325 |
| Eaton Corp. | | 570 | | | 55,262 |
| Kennametal, Inc. | | 1,096 | | | 41,495 |
| | | | | |
| | | | $ | 145,082 |
| | | | | |
| Major Banks – 1.1% | | | | | |
| State Street Corp. | | 674 | | $ | 54,729 |
| | | | | |
| Medical & Health Technology & Services – 1.4% | | | |
| AmerisourceBergen Corp. | | 942 | | $ | 42,268 |
| McKesson Corp. | | 429 | | | 28,104 |
| | | | | |
| | | | $ | 70,372 |
| | | | | |
| Medical Equipment – 3.4% | | | | | |
| Advanced Medical Optics, Inc. (a) | | 1,206 | | $ | 29,583 |
| C.R. Bard, Inc. | | 276 | | | 26,165 |
| Medtronic, Inc. | | 1,731 | | | 87,017 |
| Zimmer Holdings, Inc. (a) | | 452 | | | 29,900 |
| | | | | |
| | | | $ | 172,665 |
| | | | | |
| Metals & Mining – 1.0% | | | | | |
| Freeport-McMoRan Copper & Gold, Inc. | | 499 | | $ | 51,118 |
| | | | | |
| Natural Gas – Distribution – 1.0% | | | | | |
| Questar Corp. | | 963 | | $ | 52,098 |
| | | | | |
| Natural Gas – Pipeline – 1.2% | | | | | |
| Williams Cos., Inc. | | 1,756 | | $ | 62,830 |
| | | | | |
| Network & Telecom – 4.5% | | | | | |
| Cisco Systems, Inc. (a) | | 4,411 | | $ | 119,406 |
| Corning, Inc. | | 1,368 | | | 32,818 |
| Garmin Ltd. | | 297 | | | 28,809 |
| Juniper Networks, Inc. (a) | | 694 | | | 23,041 |
| QLogic Corp. (a) | | 1,725 | | | 24,495 |
| | | | | |
| | | | $ | 228,569 |
| | | | | |
| Oil Services – 4.3% | | | | | |
| Halliburton Co. | | 1,760 | | $ | 66,722 |
| National Oilwell Varco, Inc. (a) | | 729 | | | 53,552 |
| Noble Corp. | | 544 | | | 30,741 |
| Schlumberger Ltd. | | 218 | | | 21,445 |
| Transocean, Inc. (a) | | 297 | | | 42,516 |
| | | | | |
| | | | $ | 214,976 |
| | | | | |
| Other Banks & Diversified Financials – 1.6% | | | | | |
| American Express Co. | | 659 | | $ | 34,281 |
| Northern Trust Corp. | | 611 | | | 46,790 |
| | | | | |
| | | | $ | 81,071 |
| | | | | |
| Pharmaceuticals – 5.9% | | | | | |
| Abbott Laboratories | | 1,040 | | $ | 58,396 |
| Allergan, Inc. | | 670 | | | 43,041 |
| Bristol-Myers Squibb Co. | | 2,477 | | | 65,690 |
| Merck & Co., Inc. | | 1,209 | | | 70,255 |
| Schering-Plough Corp. | | 2,206 | | | 58,768 |
| | | | | |
| | | | $ | 296,150 |
| | | | | |
| | | | | | |
| Issuer | | Shares/Par | | Value ($) |
| COMMON STOCKS – continued | | | | | | |
| Railroad & Shipping – 0.8% | | | | | | |
| Union Pacific Corp. | | | 317 | | $ | 39,822 |
| | | | | | |
| Real Estate – 0.4% | | | | | | |
| Jones Lang LaSalle, Inc. | | | 308 | | $ | 21,917 |
| | | | | | |
| Restaurants – 1.6% | | | | | | |
| Darden Restaurants, Inc. | | | 1,471 | | $ | 40,761 |
| YUM! Brands, Inc. | | | 1,097 | | | 41,982 |
| | | | | | |
| | | | | $ | 82,743 |
| | | | | | |
| Specialty Chemicals – 0.9% | | | | | | |
| Praxair, Inc. | | | 522 | | $ | 46,307 |
| | | | | | |
| Specialty Stores – 4.9% | | | | | | |
| Advance Auto Parts, Inc. | | | 1,375 | | $ | 52,236 |
| Amazon.com, Inc. (a) | | | 399 | | | 36,963 |
| GameStop Corp., “A” (a) | | | 895 | | | 55,588 |
| Staples, Inc. | | | 1,276 | | | 29,437 |
| TJX Cos., Inc. | | | 1,068 | | | 30,684 |
| Urban Outfitters, Inc. (a) | | | 1,516 | | | 41,326 |
| | | | | | |
| | | | | $ | 246,234 |
| | | | | | |
| Telephone Services – 0.5% | | | | | | |
| Level 3 Communications, Inc. | | | 7,620 | | $ | 23,165 |
| | | | | | |
| Tobacco – 2.1% | | | | | | |
| Altria Group, Inc. | | | 1,432 | | $ | 108,231 |
| | | | | | |
| Trucking – 0.6% | | | | | | |
| United Parcel Service, Inc., “B” | | | 460 | | $ | 32,531 |
| | | | | | |
| Utilities – Electric Power – 1.6% | | | | | | |
| NRG Energy, Inc. (a) | | | 723 | | $ | 31,335 |
| PPL Corp. | | | 983 | | | 51,204 |
| | | | | | |
| | | | | $ | 82,539 |
| | | | | | |
Total Common Stocks
(Identified Cost, $4,970,099) | | | | | $ | 5,024,428 |
| | | | | | |
| | |
| SHORT-TERM OBLIGATIONS – 0.6% | | | | | | |
American Express Credit Corp.,
4.12%, due 1/02/08, at
Amortized Cost and Value (y) | | $ | 29,000 | | $ | 28,997 |
| | | | | | |
Total Investments
(Identified Cost, $4,999,096) | | | | | $ | 5,053,425 |
| | | | | | |
OTHER ASSETS, LESS
LIABILITIES – 0% | | | | | | 2,150 |
| | | | | | |
| Net Assets – 100.0% | | | | | $ | 5,055,575 |
| | | | | | |
| (a) | Non-income producing security. |
| (y) | The rate shown represents an annualized yield at time of purchase. |
See Notes to Financial Statements
5
FINANCIAL STATEMENTS | STATEMENT OF ASSETS AND LIABILITIES
This statement represents your fund’s balance sheet, which details the assets and liabilities comprising the total value of the fund.
| | | | |
| At 12/31/07 | | | | |
| Assets: | | | | |
| Investments, at value (identified cost, $4,999,096) | | $5,053,425 | | |
| Cash | | 918 | | |
| Dividends receivable | | 1,381 | | |
| Receivable from investment adviser | | 18,425 | | |
| Total assets | | | | $5,074,149 |
| Liabilities: | | | | |
| Payable to affiliates | | | | |
Management fee | | 335 | | |
Distribution fees | | 69 | | |
Administrative services fee | | 110 | | |
| Accrued expenses and other liabilities | | 18,060 | | |
| Total liabilities | | | | $18,574 |
| Net assets | | | | $5,055,575 |
| Net assets consist of: | | | | |
| Paid-in capital | | $5,001,246 | | |
| Unrealized appreciation (depreciation) on investments | | 54,329 | | |
Net assets | | | | $5,055,575 |
| Shares of beneficial interest outstanding | | | | 500,148 |
| Initial Class shares | | | | |
Net assets | | $2,527,900 | | |
Shares outstanding | | 250,085 | | |
Net asset value per share | | | | $10.11 |
| Service Class shares | | | | |
Net assets | | $2,527,675 | | |
Shares outstanding | | 250,063 | | |
Net asset value per share | | | | $10.11 |
See Notes to Financial Statements
6
FINANCIAL STATEMENTS | STATEMENT OF OPERATIONS
This statement describes how much your fund earned in investment income and accrued in expenses. It also describes any gains and/or losses generated by fund operations.
| | | | | |
| Period ended 12/31/07 (c) | | | | | |
| Net investment income | | | | | |
| Income | | | | | |
Dividends | | $1,381 | | | |
Interest | | 1,171 | | | |
| Total investment income | | | | | $2,552 |
| Expenses | | | | | |
Management fee | | $1,089 | | | |
Distribution fees | | 226 | | | |
Administrative services fee | | 356 | | | |
Custodian fee | | 463 | | | |
Shareholder communications | | 333 | | | |
Auditing fees | | 16,700 | | | |
Legal fees | | 215 | | | |
Miscellaneous | | 358 | | | |
| Total expenses | | | | | $19,740 |
Fees paid indirectly | | (9 | ) | | |
Reduction of expenses by investment adviser | | (18,425 | ) | | |
| Net expenses | | | | | $1,306 |
| Net investment income | | | | | $1,246 |
| Realized and unrealized gain (loss) on investments | | | | | |
| Realized gain (loss) (identified cost basis) | | | | | |
Investment transactions | | $— | | | |
| Change in unrealized appreciation (depreciation) | | | | | |
Investments | | $54,329 | | | |
| Net realized and unrealized gain (loss) on investments | | | | | $54,329 |
| Change in net assets from operations | | | | | $55,575 |
| (c) | For the period from the commencement of the fund’s investment operations, December 18, 2007, through stated period end. |
See Notes to Financial Statements
7
FINANCIAL STATEMENTS | STATEMENT OF CHANGES IN NET ASSETS
This statement describes the increases and/or decreases in net assets resulting from operations, any distributions, and any shareholder transactions.
| | | |
| For the period ended 12/31 | | 2007 (c | ) |
| Change in net assets | | | |
| From operations | | | |
| Net investment income | | $1,246 | |
| Net realized gain (loss) on investments | | — | |
| Net unrealized gain (loss) on investments | | 54,329 | |
| Change in net assets from operations | | $55,575 | |
| Distributions declared to shareholders | | | |
| From net investment income | | | |
Initial Class | | $(716 | ) |
Service Class | | (530 | ) |
| From tax return of capital | | | |
Initial Class | | (146 | ) |
Service Class | | (108 | ) |
| Total distributions declared to shareholders | | $(1,500 | ) |
| Change in net assets from fund share transactions | | $5,001,500 | |
| Total change in net assets | | $5,055,575 | |
| Net assets | | | |
| At beginning of period | | $— | |
| At end of period | | $5,055,575 | |
| (c) | For the period from the commencement of the fund’s investment operations, December 18, 2007, through stated period end. |
See Notes to Financial Statements
8
FINANCIAL STATEMENTS | FINANCIAL HIGHLIGHTS
The financial highlights table is intended to help you understand the fund’s financial performance for the past 5 years (or life of a particular share class, if shorter). Certain information reflects financial results for a single fund share. The total returns in the table represent the rate by which an investor would have earned (or lost) on an investment in the fund share class (assuming reinvestment of all distributions) held for the entire period.
Initial Class
| | | |
| | | Period Ended
12/31/07 (c) | |
| Net asset value, beginning of period | | $10.00 | |
| Income (loss) from investment operations | | | |
| Net investment income (d) | | $0.00 | (w) |
| Net realized and unrealized gain (loss) on investments | | 0.11 | |
| Total from investment operations | | $0.11 | |
| Less distributions declared to shareholders | | | |
| From net investment income | | $(0.00 | )(w) |
| From tax return of capital | | (0.00 | )(w) |
| Total distributions declared to shareholders | | $(0.00 | )(w) |
| Net asset value, end of period | | $10.11 | |
| Total return (%) (k)(r)(s) | | 1.13 | (n) |
Ratios (%) (to average net assets)
and Supplemental data: | | | |
| Expenses before expense reductions (f) | | 10.74 | (a) |
| Expenses after expense reductions (f) | | 0.60 | (a) |
| Net investment income | | 0.81 | (a) |
| Portfolio turnover | | 0 | |
| Net assets at end of period (000 Omitted) | | $2,528 | |
See Notes to Financial Statements
9
Financial Highlights – continued
Service Class
| | | |
| | | Period ended
12/31/07 (c) | |
| Net asset value, beginning of period | | $10.00 | |
| Income (loss) from investment operations | | | |
| Net investment income (d) | | $0.00 | (w) |
| Net realized and unrealized gain (loss) on investments | | 0.11 | |
| Total from investment operations | | $0.11 | |
| Less distributions declared to shareholders | | | |
| From net investment income | | $(0.00 | )(w) |
| From tax return of capital | | (0.00 | )(w) |
| Total distributions declared to shareholders | | $(0.00 | )(w) |
| Net asset value, end of period | | $10.11 | |
| Total return (%) (k)(r)(s) | | 1.13 | (n) |
Ratios (%) (to average net assets)
and Supplemental data: | | | |
| Expenses before expense reductions (f) | | 10.99 | (a) |
| Expenses after expense reductions (f) | | 0.85 | (a) |
| Net investment income | | 0.56 | (a) |
| Portfolio turnover | | 0 | |
| Net assets at end of period (000 Omitted) | | $2,528 | |
| (c) | For the period from the commencement of the fund’s investment operations, December 18, 2007, through the stated period end. |
| (d) | Per share data are based on average shares outstanding. |
| (f) | Ratios do not reflect reductions from fees paid indirectly. |
| (k) | The total return does not reflect expenses that apply to separate accounts. Inclusion of these charges would reduce the total return figures for all periods shown. |
| (r) | Certain expenses have been reduced without which performance would have been lower. |
| (s) | From time to time the fund may receive proceeds from litigation settlements, without which performance would be lower. |
| (w) | Per share amount was less than $0.01. |
See Notes to Financial Statements
10
NOTES TO FINANCIAL STATEMENTS
| (1) | | Business and Organization |
MFS Blended Research Growth Portfolio (the fund) is a series of MFS Variable Insurance Trust II (formerly known as MFS/Sun Life Series Trust) (the trust). The trust is organized as a Massachusetts business trust and is registered under the Investment Company Act of 1940, as amended, as an open-end management investment company. The shares of the fund are sold to variable accounts established by insurance companies to fund benefits under variable contracts issued by such companies, and qualified retirement pension plans.
| (2) | | Significant Accounting Policies |
General – The preparation of financial statements in conformity with U.S. generally accepted accounting principles requires management to make estimates and assumptions that affect the reported amounts of assets and liabilities, and disclosure of contingent assets and liabilities at the date of the financial statements and the reported amounts of revenues and expenses during the reporting period. Actual results could differ from those estimates. The fund can invest in foreign securities. Investments in foreign securities are vulnerable to the effects of changes in the relative values of the local currency and the U.S. dollar and to the effects of changes in each country’s legal, political, and economic environment.
Investment Valuations – Equity securities, including restricted equity securities, are generally valued at the last sale or official closing price as reported by an independent pricing service on the market or exchange on which they are primarily traded. For securities for which there were no sales reported that day, equity securities are generally valued at the last quoted daily bid quotation as reported by an independent pricing service on the market or exchange on which they are primarily traded. For securities held short for which there were no sales reported for the day, the position is generally valued at the last quoted daily ask quotation as reported by an independent pricing service on the market or exchange on which such securities are primarily traded. Short-term instruments with a maturity at issuance of 60 days or less may be valued at amortized cost, which approximates market value. Securities and other assets generally valued on the basis of information from an independent pricing service may also be valued at a broker-dealer bid quotation. The values of foreign securities and other assets and liabilities expressed in foreign currencies are converted to U.S. dollars using the mean of bid and asked prices for rates reported by an independent pricing service.
The Board of Trustees has delegated primary responsibility for determining or causing to be determined the value of the fund’s investments (including any fair valuation) to the adviser pursuant to valuation policies and procedures approved by the Board. If the adviser determines that reliable market quotations are not readily available, investments are valued at fair value as determined in good faith by the adviser in accordance with such procedures under the oversight of the Board of Trustees. Under the fund’s valuation policies and procedures, market quotations are not considered to be readily available for many types of debt instruments and certain types of derivatives. These investments are generally valued at fair value based on information from independent pricing services. In addition, investments may be valued at fair value if the adviser determines that an investment’s value has been materially affected by events occurring after the close of the exchange or market on which the investment is principally traded (such as foreign exchange or market) and prior to the determination of the fund’s net asset value, or after the halting of trading of a specific security where trading does not resume prior to the close of the exchange or market on which the security is principally traded. Events that occur on a frequent basis after foreign markets close (such as developments in foreign markets and significant movements in the U.S. markets) and prior to the determination of the fund’s net asset value may be deemed to have a material affect on the value of securities traded in foreign markets. Accordingly, the fund’s foreign equity securities may often be valued at fair value. The adviser may rely on independent pricing services or other information (such as the correlation with price movements of similar securities in the same or other markets; the type, cost and investment characteristics of the security; the business and financial condition of the issuer; and trading and other market data) to assist in determining whether to fair value and at what value to fair value an investment. The value of an investment for purposes of calculating the fund’s net asset value can differ depending on the source and method used to determine value. When fair valuation is used, the value of investments used to determine the fund’s net asset value may differ from quoted or published prices for the same investments.
In September 2006, FASB Statement No. 157, Fair Value Measurements (the “Statement”) was issued, and is effective for fiscal years beginning after November 15, 2007 and for all interim periods within those fiscal years. This Statement provides a single definition of fair value, a hierarchy for measuring fair value and expanded disclosures about fair value measurements. Management is evaluating the application of the Statement to the fund, and believes the impact will be limited to expanded disclosures resulting from the adoption of this Statement in the fund’s financial statements.
Indemnifications – Under the fund’s organizational documents, its officers and trustees may be indemnified against certain liabilities and expenses arising out of the performance of their duties to the fund. Additionally, in the normal course of business, the fund enters into agreements with service providers that may contain indemnification clauses. The fund’s
11
Notes to Financial Statements – continued
maximum exposure under these agreements is unknown as this would involve future claims that may be made against the fund that have not yet occurred.
Foreign Currency Translation – Purchases and sales of foreign investments, income, and expenses are converted into U.S. dollars based upon currency exchange rates prevailing on the respective dates of such transactions. Gains and losses attributable to foreign currency exchange rates on sales of securities are recorded for financial statement purposes as net realized gains and losses on investments. Gains and losses attributable to foreign exchange rate movements on income and expenses are recorded for financial statement purposes as foreign currency transaction gains and losses. That portion of both realized and unrealized gains and losses on investments that results from fluctuations in foreign currency exchange rates is not separately disclosed.
Investment Transactions and Income – Investment transactions are recorded on the trade date. Interest income is recorded on the accrual basis. All premium and discount is amortized or accreted for financial statement purposes in accordance with U.S. generally accepted accounting principles. All discount is accreted for tax reporting purposes as required by federal income tax regulations. Dividends received in cash are recorded on the ex-dividend date. Certain dividends from foreign securities will be recorded when the fund is informed of the dividend if such information is obtained subsequent to the ex-dividend date. Dividend and interest payments received in additional securities are recorded on the ex-dividend or ex-interest date in an amount equal to the value of the security on such date.
The fund may receive proceeds from litigation settlements. Any proceeds received from litigation involving portfolio holdings are reflected in the Statement of Operations in realized gain/loss if the security has been disposed of by the fund or in unrealized gain/loss if the security is still held by the fund. Any other proceeds from litigation not related to portfolio holdings are reflected as other income in the Statement of Operations.
Fees Paid Indirectly – The fund’s custody fee may be reduced according to an arrangement that measures the value of cash deposited with the custodian by the fund. This amount, for the period ended December 31, 2007, is shown as a reduction of total expenses on the Statement of Operations.
Tax Matters and Distributions – The fund intends to qualify as a regulated investment company, as defined under Subchapter M of the Internal Revenue Code, and to distribute all of its taxable income, including realized capital gains. As a result, no provision for federal income taxes is required. The fund adopted the provisions of FASB Interpretation No. 48, Accounting for Uncertainty in Income Taxes (“the Interpretation”) on December 18, 2007 (the commencement of operations of the fund). The Interpretation prescribes a minimum threshold for financial statement recognition of the benefit of a tax position taken or expected to be taken in a tax return. There was no impact resulting from the adoption of this Interpretation on the fund’s financial statements. Each of the fund’s federal tax returns since the inception of the fund remain subject to examination by the Internal Revenue Service. It is the fund’s policy to record interest and penalty charges on underpaid taxes associated with its tax positions as interest expense and other expense, respectively. No such charges were recorded in the current financial statements. Foreign taxes, if any, have been accrued by the fund in the accompanying financial statements.
Distributions to shareholders are recorded on the ex-dividend date. Income and capital gain distributions are determined in accordance with income tax regulations, which may differ from U.S. generally accepted accounting principles. Certain capital accounts in the financial statements are periodically adjusted for permanent differences in order to reflect their tax character. These adjustments have no impact on net assets or net asset value per share. Temporary differences which arise from recognizing certain items of income, expense, gain or loss in different periods for financial statement and tax purposes will reverse at some time in the future. Distributions in excess of net investment income or net realized gains are temporary overdistributions for financial statement purposes resulting from differences in the recognition or classification of income or distributions for financial statement and tax purposes.
During the period ended December 31, 2007, there were no significant adjustments due to differences between book and tax accounting.
The tax character of distributions declared to shareholders is as follows:
| | |
| | | 12/31/07 |
| Ordinary income (including any short-term capital gains) | | $1,246 |
| Tax return of capital (b) | | 254 |
| Total distributions | | $1,500 |
| | (b) | Distributions in excess of tax basis earnings and profits are reported in the financial statements as a tax return of capital. | |
12
Notes to Financial Statements – continued
The federal tax cost and the tax basis components of distributable earnings were as follows:
| | | |
| As of 12/31/07 | | | |
| Cost of investments | | $4,999,096 | |
| Gross appreciation | | 102,697 | |
| Gross depreciation | | (48,368 | ) |
| Net unrealized appreciation (depreciation) | | $54,329 | |
Multiple Classes of Shares of Beneficial Interest – The fund offers multiple classes of shares, which differ in their respective distribution fees. All shareholders bear the common expenses of the fund based on daily net assets of each class, without distinction between share classes. Dividends are declared separately for each class. Differences in per share dividend rates are generally due to differences in separate class expenses.
| (3) | | Transactions with Affiliates |
Investment Adviser – The fund has an investment advisory agreement with Massachusetts Financial Services Company (MFS) to provide overall investment management and related administrative services and facilities to the fund. The management fee is computed daily and paid monthly at an annual rate of 0.60% of the average daily net assets.
The investment adviser has agreed in writing to pay a portion of the fund’s total operating expenses, exclusive of certain other fees and expenses, such that the total operating expenses of the fund do not exceed 0.60% for the Initial Class shares and 0.85% for the Service Class shares, based on the average daily net assets of each share class. This written agreement will continue through April 30, 2009 unless changed or rescinded by the fund’s Board of Trustees. For the period ended December 31, 2007, this reduction amounted to $18,425 and is reflected as a reduction of total expenses in the Statements of Operations.
Distributor – MFS Fund Distributors, Inc. (MFD), a wholly-owned subsidiary of MFS, is the distributor of shares of the fund. The Trustees have adopted a distribution plan for the Service Class shares pursuant to Rule 12b-1 under the Investment Company Act of 1940.
The fund’s distribution plan provides that each fund will pay MFD distribution fees equal to 0.25% per annum of its average daily net assets attributable to Service Class shares as partial consideration for services performed and expenses incurred by MFD and financial intermediaries in connection with the sale and distribution of the fund’s’ Service Class shares and the sale and distribution of the variable annuity or variable life insurance contracts investing indirectly in Service Class shares. MFD may subsequently pay all, or a portion, of the distribution fees to financial intermediaries.
Shareholder Servicing Agent – MFS Service Center, Inc. (MFSC), a wholly-owned subsidiary of MFS, has contracted to provide transfer agent and recordkeeping functions in connection with the issuance, transfer, and redemption of each class of shares of the fund under a Shareholder Servicing Agent Agreement. During the year ended December 31, 2007, MFSC did not receive a fee for this service.
Administrator – MFS provides certain financial, legal, shareholder communications, compliance, and other administrative services to the fund. Under an administrative services agreement, the fund partially reimburses MFS the costs incurred to provide these services. The fund is charged a fixed amount plus a fee based on average daily net assets. The fund’s annual fixed amount is $10,000.
The administrative services fee incurred for the period ended December 18, 2007, through December 31, 2007 was equivalent to an annual effective rate of 0.1961% of the fund’s average daily net assets.
Trustees’ and Officers’ Compensation – The fund pays compensation to trustees in the form of a retainer, attendance fees, and additional compensation to Board and Committee chairpersons. The fund does not pay compensation directly to officers of the fund who are also officers of the investment adviser, all of whom receive remuneration for their services to the fund from MFS. Certain officers of the fund are officers or directors of MFS, MFD, and MFSC. For the period ended December 31, 2007, the fund did not incur any expenses for independent trustees compensation.
Other – This fund and certain other MFS funds (the funds) have entered into a services agreement (the Agreement) which provides for payment of fees by the funds to Tarantino LLC in return for the provision of services of an Independent Chief Compliance Officer (ICCO) for the funds. The ICCO is an officer of the funds and the sole member of Tarantino LLC. The funds can terminate the Agreement with Tarantino LLC at any time under the terms of the Agreement. MFS has agreed to bear all expenses associated with office space, other administrative support, and supplies provided to the ICCO. For the period ended December 31, 2007, the fee paid to Tarantino LLC was $1.
13
Notes to Financial Statements – continued
MFS purchased 250,000 shares of both the Initial Class and Service Class shares for an aggregate amount of $5,000,000. At December 31, 2007, MFS was the sole shareholder of both classes of shares.
Purchases and sales of investments, other than U.S. government securities, purchased option transactions, and short-term obligations, aggregated $4,970,099 and $0, respectively.
| (5) | | Shares of Beneficial Interest |
The fund’s Declaration of Trust permits the Trustees to issue an unlimited number of full and fractional shares of beneficial interest. Transactions in fund shares were as follows:
| | | | |
| | | Period ended 12/31/07 (c) |
| | | Shares | | Amount |
| Shares sold | | | | |
Initial Class | | 250,000 | | $2,500,000 |
Service Class | | 250,000 | | 2,500,000 |
| | 500,000 | | $5,000,000 |
| Shares issued to shareholders in reinvestment of distributions | | | | |
Initial Class | | 85 | | $862 |
Service Class | | 63 | | 638 |
| | 148 | | $1,500 |
| Net change | | | | |
Initial Class | | 250,085 | | $2,500,862 |
Service Class | | 250,063 | | 2,500,638 |
| | 500,148 | | $5,001,500 |
| (c) | For the period from the commencement of the fund’s investment operations, December 18, 2007, through the stated period end. |
The fund is permitted to have bank borrowings for temporary or emergency purposes to fund shareholder redemptions. The fund has established borrowing arrangements with certain banks. The interest rate on the borrowings is equal to the Federal Reserve funds rate plus 0.30%. The fund had no significant borrowings during the period ended December 31, 2007.
14
REPORT OF INDEPENDENT REGISTERED PUBLIC ACCOUNTING FIRM
To the Board of Trustees of MFS Variable Insurance Trust II (formerly known as MFS/Sun Life Series Trust) and the Shareholders of MFS Blended Research Growth Portfolio:
We have audited the accompanying statement of assets and liabilities, including the portfolio of investments, of MFS Blended Research Growth Portfolio (one of the portfolios comprising MFS Variable Insurance Trust II) (the “Trust”) as of December 31, 2007, and the related statement of operations, the statement of changes in net assets and the financial highlights for the period from December 18, 2007 (commencement of operations) through December 31, 2007. These financial statements and financial highlights are the responsibility of the Trust’s management. Our responsibility is to express an opinion on these financial statements and financial highlights based on our audit.
We conducted our audit in accordance with the standards of the Public Company Accounting Oversight Board (United States). Those standards require that we plan and perform the audit to obtain reasonable assurance about whether the financial statements and financial highlights are free of material misstatement. The Trust is not required to have, nor were we engaged to perform, an audit of its internal control over financial reporting. Our audit included consideration of internal control over financial reporting as a basis for designing audit procedures that are appropriate in the circumstances, but not for the purpose of expressing an opinion on the effectiveness of the Trust’s internal control over financial reporting. Accordingly, we express no such opinion. An audit also includes examining, on a test basis, evidence supporting the amounts and disclosures in the financial statements, assessing the accounting principles used and significant estimates made by management, as well as evaluating the overall financial statement presentation. Our procedures included confirmation of securities owned as of December 31, 2007, by correspondence with the custodian. We believe that our audit provides a reasonable basis for our opinion.
In our opinion, such financial statements and financial highlights present fairly, in all material respects, the financial position of MFS Blended Research Growth Portfolio as of December 31, 2007, the results of its operations, the changes in its net assets and its financial highlights for the period from December 18, 2007 (commencement of operations) through December 31, 2007, in conformity with accounting principles generally accepted in the United States of America.
DELOITTE & TOUCHE LLP
Boston, Massachusetts
February 15, 2008
15
TRUSTEES AND OFFICERS – IDENTIFICATION AND BACKGROUND
The Trustees and officers of the Trust, as of February 1, 2008, are listed below, together with their principal occupations during the past five years. (Their titles may have varied during that period.) The address of each Trustee and officer is 500 Boylston Street, Boston, Massachusetts 02116.
| | | | | | |
Name, Date of Birth | | Position(s) Held
with Fund | | Trustee/Officer
Since(1) | | Principal Occupations During the Past Five Years &
Other Directorships(2) |
| INTERESTED TRUSTEE | | | | | | |
David D. Horn(3) (born 06/07/41) | | Trustee | | April 1986 | | Private investor; Retired; Sun Life Assurance Company of Canada, Former Senior Vice President and General Manager for the United States (until 1997); Retired: Sun Life Assurance Company of Canada, Director (until March 2004) |
| | |
| INDEPENDENT TRUSTEES | | | | |
J. Kermit Birchfield (born 01/08/40) | | Chairman | | May 1997 | | Consultant; Century Partners, Inc. (investments), Director (1988 to present); Displaytech, Inc. (technology), Director (1995 to present); Dessin Fournir LLC (furniture manufacturer), Director (2005 to present); Intermountain Gas Company, Inc. & Intermountain Industries, Inc. (oil & gas exploration and production) (1988 to present); Site Watch LLC (software to monitor oil tanks) Managing Director (2006 to present); Juridica Investments (fund investing in judicial matters) Director (2007 to present); Dairy Mart Convenience Stores, Inc. (convenience stores), Chairman (1997 to 2003) |
| | | |
Robert C. Bishop (born 01/13/43) | | Trustee | | May 2001 | | Autolmmune Inc. (pharmaceutical product licensing), Chairman, President and Chief Executive Officer (1992 to present); Caliper Life Sciences Corp. (laboratory analytical instruments), Director (2002 to present); Millipore Corporation (biopharmaceutical/research laboratory products), Director (1997 to present); Optobionics Corporation (ophthalmic devices), Director (2002 to 2007); Quintiles Transnational Corp. (contract research services), Director (until 2003) |
| | | |
Frederick H. Dulles (born 03/12/42) | | Trustee | | May 2001 | | Ten State International Law PLLC (law firm), Of Counsel (since 2006); Prudential Carolina Real Estate, (real estate), Broker (since 2006); Free Enterprise Foundation, Inc. (research institute), Director & Secretary (until 2008); Disher, Hamrick & Myers Residential, Inc. (real estate) Broker (until 2006); Frederick H. Dulles law practice (until 2006); Ten State Street LLP (law firm), Member (until 2005); McFadden, Pilkington & Ward LLP (solicitors and registered foreign lawyers), Member & Of Counsel (until 2003) |
| | | |
Marcia A. Kean (born 06/30/48) | | Trustee | | April 2005 | | Feinstein Kean Healthcare (consulting), Chief Executive Officer (since December 2002), Managing Director (prior to May 2001); Ardais Corporation (biotech products), Senior Vice President – Commercialization (February 2002 until November 2002) |
| | | |
Ronald G. Steinhart (born 06/15/40) | | Trustee | | May 2001 | | Private investor; Penske Automotive Group (automotive retailer), Director (2001 to present); Penson Worldwide, Inc. (securities clearance), Director (2006 to present); Animal Health International, Inc. (animal health products), Director (2007 to present); Texas Industries (concrete/aggregates/cement), Director (2007 to present); Carreker Corporation (technology consulting) Director (until 2005); Prentiss Properties Trust (real estate investment trust), Director (until 2006) |
| | | |
Haviland Wright (born 07/21/48) | | Trustee | | May 2001 | | Elixir Technologies Corporation (software) Director (2005 to present); Nano Loa Inc. (liquid crystal displays), Director (2003 to present); Silk Displays, Inc. (smart polymers) Director (2007 to present); Displaytech, Inc. (technology) Chairman and CEO (1995 – 2002) |
| | | |
| TRUSTEE EMERITUS | | | | | | |
Samuel Adams (born 10/19/25) | | Trustee Emeritus | | | | Retired; Kirkpatrick & Lockhart Preston Gates Ellis LLP (law firm), Of Counsel |
| | | |
| OFFICERS | | | | | | |
Maria F. Dwyer(4) (born 12/01/58) | | President | | November 2005 | | Massachusetts Financial Services Company, Executive Vice President and Chief Regulatory Officer (since March 2004); Fidelity Management & Research Company, Vice President (prior to March 2004); Fidelity Group of Funds, President and Treasurer (prior to March 2004) |
| | | |
Tracy Atkinson(4) (born 12/30/64) | | Treasurer | | September 2005 | | Massachusetts Financial Services Company, Senior Vice President (since September 2004); PricewaterhouseCoopers LLP, Partner (prior to September 2004) |
| | | |
Christopher R. Bohane(4) (born 01/18/74) | | Assistant Secretary and Assistant Clerk | | July 2005 | | Massachusetts Financial Services Company, Vice President and Senior Counsel (since April 2003); Kirkpatrick & Lockhart LLP (law firm), Associate (prior to April 2003) |
| | | |
Ethan D. Corey(4) (born 11/21/63) | | Assistant Secretary and Assistant Clerk | | July 2005 | | Massachusetts Financial Services Company, Senior Vice President and Associate General Counsel (since April 2006); Special Counsel (prior to April 2006); Dechert LLP (law firm), Counsel (prior to December 2004) |
16
Trustees and Officers – continued
| | | | | | |
Name, Date of Birth | | Position(s) Held
with Fund | | Trustee/Officer
Since(1) | | Principal Occupations During the Past Five Years &
Other Directorships(2) |
David L. DiLorenzo(4) (born 08/10/68) | | Assistant Treasurer | | July 2005 | | Massachusetts Financial Services Company, Vice President (since June 2005); JP Morgan Investor Services, Vice President (January 2001 to June 2005) |
| | | |
Timothy M. Fagan(4) (born 07/10/68) | | Assistant Secretary and Assistant Clerk | | September 2005 | | Massachusetts Financial Services Company, Vice President and Senior Counsel (since September 2005); John Hancock Advisers, LLC, Vice President and Chief Compliance Officer (September 2004 to August 2005) Senior Attorney (prior to September 2004); John Hancock Group of Funds, Vice President and Chief Compliance Officer (September 2004 to December 2004) |
| | | |
Mark D. Fischer(4) (born 10/27/70) | | Assistant Treasurer | | July 2005 | | Massachusetts Financial Services Company, Vice President (since May 2005); JP Morgan Investment Management Company, Vice President (prior to May 2005) |
| | | |
Brian E. Langenfeld(4) (born 03/07/73) | | Assistant Secretary and Assistant Clerk | | May 2006 | | Massachusetts Financial Services Company, Assistant Vice President and Counsel (since May 2006); John Hancock Advisers, LLC, Assistant Vice President and Counsel (May 2005 to April 2006); John Hancock Advisers, LLC, Attorney and Assistant Secretary (prior to May 2005) |
| | | |
Ellen Moynihan(4) (born 11/13/57) | | Assistant Treasurer | | May 1997 | | Massachusetts Financial Services Company, Senior Vice President |
| | | |
Susan S. Newton(4) (born 03/07/50) | | Assistant Secretary and Assistant Clerk | | May 2005 | | Massachusetts Financial Services Company, Senior Vice President and Assistant General Counsel (since April 2005); John Hancock Advisers, LLC, Senior Vice President, Secretary and Chief Legal Officer (prior to April 2005); John Hancock Group of Funds, Senior Vice President, Secretary and Chief Legal Officer (prior to April 2005) |
| | | |
Susan A. Pereira(4) (born 11/05/70) | | Assistant Secretary and Assistant Clerk | | July 2005 | | Massachusetts Financial Services Company, Vice President and Senior Counsel (since June 2004); Bingham McCutchen LLP (law firm), Associate (January 2001 to June 2004) |
| | | |
Mark N. Polebaum(4) (born 05/01/52) | | Secretary and Assistant Clerk | | February 2006 | | Massachusetts Financial Services Company, Executive Vice President, General Counsel and Secretary (since January 2006); Wilmer Cutler Pickering Hale and Dorr LLP (law firm), Partner (prior to January 2006) |
| | | |
Frank L. Tarantino (born 03/07/44) | | Independent Chief Compliance Officer | | September 2004 | | Tarantino LLC (provider of compliance services), Principal (since June 2004); CRA Business Strategies Group (consulting services), Executive Vice President (April 2003 to June 2004); David L. Babson & Co. (investment adviser), Managing Director, Chief Administrative Officer and Director (February 1997 to March 2003) |
| | | |
Richard S. Weitzel(4) (born 7/16/70) | | Assistant Secretary and Assistant Clerk | | October 2007 | | Massachusetts Financial Services Company, Vice President and Assistant General Counsel (since 2007); Vice President and Senior Counsel (since May 2004); Massachusetts Department of Business and Technology, General Counsel (February 2003 to April 2004); Massachusetts Office of the Attorney General, Assistant Attorney General ( April 2001 to February 2003); Ropes and Gray, Associate (prior to April 2001) |
| | | |
James O. Yost(4) (born 06/12/60) | | Assistant Treasurer | | April 1992 | | Massachusetts Financial Services Company, Senior Vice President |
| (1) | Date first appointed to serve as Trustee/Officer of an MFS fund or a Compass variable account. Each Trustee has served continuously since appointment. |
| (2) | Directorships or trusteeships of companies required to report to the Securities and Exchange Commission (i.e., “public companies”). |
| (3) | “Interested person” of the Sun Life of Canada (U.S.), within the meaning of the Investment Company Act of 1940 (referred to as the 1940 Act), which is the principal federal law governing investment companies like the Series. The address of Sun Life of Canada (U.S.) is One Sun Life Executive Park, Wellesley Hills, Massachusetts 02481. |
| (4) | “Interested person” of MFS within the meaning of the 1940 Act. The address of MFS is 500 Boylston Street, Boston, Massachusetts 02116. |
The Trust does not hold annual meetings for the purpose of electing Trustees, and Trustees are not elected for fixed terms. Each Trustee and officer holds office until his or her successor is chosen and qualified, or until his or her earlier death, resignation, retirement or removal.
All Trustees currently serve as Trustees of the Trust and have served in that capacity since originally elected or appointed. All of the Trustees are also Managers of the Compass Variable Accounts. The executive officers of the Trust hold similar offices for the Compass Variable Accounts and other funds in the MFS fund complex. As of January 1, 2008, each Trustee serves as a Trustee or Manager of 35 Accounts/Funds.
17
Trustees and Officers – continued
The Statement of Additional Information contains further information about the Trustees and is available without charge upon request by calling 1-800-225-2606.
| | |
Investment Adviser
Massachusetts Financial Services Company 500 Boylston Street, Boston, MA 02116-3741 | | Custodian State Street Bank and Trust Company 225 Franklin Street, Boston, MA 02110 |
Distributor
MFS Fund Distributors, Inc. 500 Boylston Street, Boston, MA 02116-3741 | | Independent Registered Public Accounting Firm Deloitte & Touche LLP 200 Berkeley Street, Boston, MA 02116 |
Portfolio Manager Eric Weigel | | |
18
BOARD REVIEW OF INVESTMENT ADVISORY AGREEMENT
The Investment Company Act of 1940 requires that both the full Board of Trustees and a majority of the non-interested (“independent”) Trustees, voting separately, initially approve the investment advisory agreement between Massachusetts Financial Services Company (MFS) and MFS Variable Insurance Trust II (the Trust) on behalf of the Fund and, beginning on the second anniversary of the initial effective date of the Agreement, annually approve the continuation of the Agreement. In September 2007, the Board met to consider the initial approval of the Agreement. The independent Trustees were assisted in their evaluation of the Agreement by independent legal counsel, from whom they received separate legal advice and with whom they met separately from MFS management. The independent Trustees were also assisted in this process by the Fund’s Independent Chief Compliance Officer, a full-time senior officer appointed by and reporting to the independent Trustees.
In connection with their deliberations regarding the initial approval of the Agreement, the Trustees, including the independent Trustees, considered such information and factors as they believed, in light of the legal advice furnished to them and their own business judgment, to be relevant. As described below, the Trustees considered the nature, quality, and extent of the various investment advisory, administrative, and/or shareholder services to be performed by MFS under the Agreement and other arrangements with the Trust.
In connection with their initial review meeting, the Trustees received and relied upon materials that included, among other items: (i) information provided by Lipper Inc. on the Fund’s proposed advisory fees and other expenses compared to the advisory fees and other expenses of comparable funds identified by Lipper (the “Lipper expense group”), (ii) information regarding expense caps that will be observed by MFS for the Fund, (iii) information regarding the overall organization of MFS, including information about MFS personnel who would provide investment advisory services to the Fund, and (iv) descriptions of various functions to be performed by MFS for the Fund, such as compliance monitoring and trading, back office, transfer agent, portfolio composition monitoring, and administrative functions. In addition, in connection with the independent Trustees’ meetings in May and July, 2007 (the “contract review meetings”) for the purpose of considering whether to approve the continuation of the investment advisory agreement for the other funds of the Trust that the Board oversees, the independent Trustees received: (i) information regarding MFS’ financial results and financial condition, including MFS’ and certain of its affiliates’ estimated profitability from services performed for the Trust as a whole, (ii) MFS’ views regarding the outlook for the mutual fund industry and the strategic business plans of MFS, and (iii) information regarding the overall organization of MFS, including information about MFS’ senior management and other personnel that would provide investment advisory, administrative and other services to the Fund and the Trust as a whole. The comparative fee and expense information prepared and provided by Lipper Inc. was not independently verified and the independent Trustees did not independently verify any information provided to them by MFS.
The Trustees’ conclusion as to the initial approval of the Agreement was based on a comprehensive consideration of all information provided to the Trustees and not the result of any single factor. Some of the factors that figured particularly in the Trustees’ deliberations are described below, although individual Trustees may have evaluated the information presented differently from one another, giving different weights to various factors. Because the Fund is newly organized and had not begun investment operations at the time of the initial review meeting, the Fund had no investment performance for the Trustees to review. In addition, MFS had no performance information of similarly managed accounts because it has no institutional accounts managed in a similar style as the Fund.
In assessing the reasonableness of the Fund’s advisory fee, the Trustees considered, among other information, the Fund’s advisory fee and the estimated total expense ratio of the Fund’s Initial Class shares as a percentage of average daily net assets and the advisory fees and total expense ratios of peer groups of funds based on information provided by Lipper Inc. The Trustees considered that MFS has agreed in writing to observe an expense limitation for the Fund until, at least, May 1, 2009. The Trustees also considered that, according to the Lipper data (which takes into account the expense limitation), the Fund’s effective advisory fee rate and estimated total expense ratio were each lower than their Lipper expense group median.
The Trustees also considered whether the Fund is likely to benefit from any economies of scale in the management of the Fund in the event of growth in assets of the Fund. They noted that the Fund’s advisory fee rate schedule is not currently proposed to be subject to breakpoints, but they noted that MFS has agreed to implement breakpoints with regard to certain other funds of the Trust.
The Trustees did not consider MFS’ costs and profits with respect to the Fund because the Fund has no operating history with MFS as its adviser. The Trustees considered information prepared by MFS relating to MFS’ costs and profits with respect to the Trust considered as a group, and other investment companies and accounts advised by MFS, as well as MFS’ methodologies used to determine and allocate its costs to the Trust and other accounts and products for purposes of estimating profitability.
After reviewing these and other factors described herein, the Trustees concluded, within the context of their overall conclusions regarding the Agreement, that the advisory fee to be charged to the Fund represents reasonable compensation in light of the services to be provided by MFS to the Fund.
19
Board Review of Investment Advisory Agreement – continued
In addition, the Trustees considered MFS’ resources and related efforts to continue to retain, attract and motivate capable personnel to serve the Fund. The Trustees also considered current and developing conditions in the financial services industry, including the entry into the industry of large and well-capitalized companies which are spending, and appear to be prepared to continue to spend, substantial sums to engage personnel and to provide services to competing investment companies. In this regard, the Trustees also considered the financial resources of MFS and MFS’ ultimate parent, Sun Life Financial Inc. The Trustees also considered the advantages and possible disadvantages to the Fund of having an adviser that also serves other investment companies as well as other accounts.
The Trustees also considered the nature, quality, cost, and extent of administrative, transfer agency, and distribution services to be provided to the Fund by MFS and its affiliates under agreements and plans other than the investment advisory agreement, including any 12b-1 fees the Fund will pay to MFS Fund Distributors, Inc., an affiliate of MFS. The Trustees also considered the nature, extent and quality of certain other services MFS may perform or arrange for on the Fund’s behalf, which may include securities lending programs, directed expense payment programs, class action recovery programs, and MFS’ interaction with third-party service providers, principally custodians and sub-custodians. The Trustees concluded that the various non-advisory services to be provided by MFS and its affiliates on behalf of the Fund were satisfactory.
The Trustees also considered benefits to MFS from the use of the Fund’s portfolio brokerage commissions, if applicable, to pay for investment research (excluding third-party research, for which MFS pays directly) and various other factors. Additionally, the Trustees considered so-called “fall-out benefits” to MFS such as reputational value derived from serving as an investment manager to the Trust and the Fund, and determined that any such benefits derived by MFS were reasonable and fair.
Based on their evaluation of factors that they deemed to be material, including those factors described above, the Board of Trustees, including a majority of the independent Trustees, concluded that the Fund’s investment advisory agreement with MFS should be approved for an initial two-year period, commencing upon its effective date, as set forth in the Agreement.
A discussion regarding the Board’s most recent review and renewal of the Fund’s investment advisory agreement is available by clicking on the Fund’s name under “Variable Insurance Portfolios” on the “Products & Performance” page on the MFS Web site (mfs.com).
20
PROXY VOTING POLICIES AND INFORMATION
A general description of the MFS funds’ proxy voting policies and procedures is available without charge, upon request, by calling 1-800-225-2606, by visiting the About MFS section of mfs.com or by visiting the SEC’s Web site at http://www.sec.gov.
Information regarding how the fund voted proxies relating to portfolio securities during the twelve-month period ended June 30, 2008, will be available without charge by visiting the Proxy Voting section of mfs.com or by visiting the SEC’s Web site at http://www.sec.gov.
QUARTERLY PORTFOLIO DISCLOSURE
The fund will file a complete schedule of portfolio holdings with the Securities and Exchange Commission (the Commission) for the first and third quarters of each fiscal year on Form N-Q. The fund’s Form N-Q may be reviewed and copied at the:
Public Reference Room
Securities and Exchange Commission
100 F Street, NE, Room 1580
Washington, D.C. 20549
Information on the operation of the Public Reference Room may be obtained by calling the Commission at 1-800-SEC-0330. The fund’s Form N-Q is available on the EDGAR database on the Commission’s Internet Web site at http://www.sec.gov, and copies of this information may be obtained, upon payment of a duplicating fee, by electronic request at the following e-mail address: publicinfo@sec.gov or by writing the Public Reference Section at the above address.
A shareholder can also obtain the quarterly portfolio holdings report at mfs.com.
21
MFS® PRIVACY NOTICE
Privacy is a concern for every investor today. At MFS Investment Management® and the MFS funds, we take this concern very seriously. We want you to understand our policies about the investment products and services that we offer, and how we protect the nonpublic personal information of investors who have a direct relationship with us and our wholly owned subsidiaries.
Throughout our business relationship, you provide us with personal information. We maintain information and records about you, your investments, and the services you use. Examples of the nonpublic personal information we maintain include
| | Ÿ | | data from investment applications and other forms |
| | Ÿ | | share balances and transactional history with us, our affiliates, or others |
| | Ÿ | | facts from a consumer reporting agency |
We do not disclose any nonpublic personal information about our customers or former customers to anyone, except as permitted by law. We may share nonpublic personal information with third parties or certain of our affiliates in connection with servicing your account or processing your transactions. We may share information with companies or financial institutions that perform marketing services on our behalf or with other financial institutions with which we have joint marketing arrangements, subject to any legal requirements.
Authorization to access your nonpublic personal information is limited to appropriate personnel who provide products, services, or information to you. We maintain physical, electronic, and procedural safeguards to help protect the personal information we collect about you.
If you have any questions about the MFS privacy policy, please call 1-800-225-2606 any business day between 8 a.m. and 8 p.m. Eastern time.
Note: If you own MFS products or receive MFS services in the name of a third party such as a bank or broker-dealer, their privacy policy may apply to you instead of ours.
22
CONTACT US
Web site
mfs.com
Account service and
literature
Shareholders
1-877-411-3325
9 a.m. to 5 p.m. ET
Investment professionals
1-800-637-8630
8 a.m. to 5 p.m. ET
Mailing address
MFS Service Center, Inc.
Attn: Institutional Alliance Services (IAS)
P.O. Box 55824
Boston, MA
02205-5824
Overnight mail
MFS Service Center, Inc.
Attn: Institutional Alliance Services (IAS)
500 Boylston Street
Boston, MA 02116-3741


MFS® Variable Insurance Trust IISM
Annual report
MFS® International Growth Portfolio
(formerly International Growth Series)
12/31/07
FCI-ANN
MFS® INTERNATIONAL GROWTH PORTFOLIO
(formerly International Growth Series)
The report is prepared for the general information of contract owners. It is authorized for distribution to prospective investors only when preceded or accompanied by a current prospectus.
NOT FDIC INSURED MAY LOSE VALUE NO BANK OR CREDIT UNION GUARANTEE NOT A DEPOSIT NOT INSURED BY ANY FEDERAL GOVERNMENT AGENCY OR NCUA/NCUSIF
LETTER FROM THE CEO

Dear Contract Owners:
The past year has been a great example of why investors should keep their eyes on the long term.
In 2006 the Dow Jones Industrial Average returned 19% and was fairly stable. This year we have seen a greater level of volatility than has been experienced in recent years. The Dow hit several new highs but also experienced swift drops as a global credit crisis swept through markets, spurred by defaults on U.S. subprime loans and a liquidity crunch. Still, even with this volatility, the Dow ended the first three quarters of 2007 with a return near 13%.
U.S. Treasury bonds gained ground, especially in the third quarter as investors sought less risky asset classes. The spreads of many lower-quality debt investments widened.
In 2007 the U.S. dollar fell against the euro, oil prices hit their highest levels yet, and gold spiked to its steepest price in 28 years. Around the globe, stocks sold off as risk aversion mounted. As we have said before, markets can be volatile, and investors should make sure they have an investment plan that can carry them through the peaks and troughs.
If you are focused on a long-term investment strategy, the short-term ups and downs of the markets should not necessarily dictate portfolio action on your part. In our view, investors who remain committed to a long-term plan are more likely to achieve their financial goals.
In any market environment, we believe individual investors are best served by following a three-pronged investment strategy of allocating their holdings across the major asset classes, diversifying within each class, and regularly rebalancing their portfolios to maintain their desired allocations. Of course, these strategies cannot guarantee a profit or protect against a loss. Investing and planning for the long term require diligence and patience, two traits that in our experience are essential to capitalizing on the many opportunities the financial markets can offer — through both up and down economic cycles.
Respectfully,

Robert J. Manning
Chief Executive Officer and Chief Investment Officer
MFS Investment Management®
February 15, 2008
The opinions expressed in this letter are subject to change, may not be relied upon for investment advice, and no forecasts can be guaranteed.
1
PORTFOLIO COMPOSITION
Portfolio structure
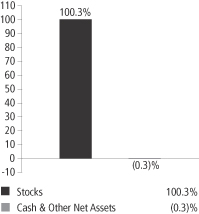
| | |
| Top ten holdings | | |
| TOTAL S.A. | | 2.7% |
| LVMH Moet Hennessy Louis Vuitton S.A. | | 2.6% |
| Nestle S.A. | | 2.6% |
| Roche Holding AG | | 2.5% |
| BHP Billiton PLC | | 2.2% |
| Reckitt Benckiser Group PLC | | 2.1% |
| WPP Group PLC | | 2.1% |
| Telefonica S.A. | | 2.1% |
| Housing Development Finance Corp. Ltd. | | 2.1% |
| Royal Philips Electronics N.V. | | 1.6% |
| | |
| Equity sectors | | |
| Financial Services | | 18.3% |
| Technology | | 14.7% |
| Consumer Staples | | 11.1% |
| Health Care | | 9.4% |
| Basic Materials | | 9.4% |
| Retailing | | 7.7% |
| Utilities & Communications | | 7.3% |
| Energy | | 7.1% |
| Industrial Goods & Services | | 5.0% |
| Leisure | | 3.8% |
| Special Products & Services | | 3.4% |
| Autos & Housing | | 3.1% |
| | |
| Country weightings | | |
| Japan | | 15.9% |
| United Kingdom | | 14.6% |
| France | | 11.9% |
| Switzerland | | 11.0% |
| Germany | | 8.0% |
| Brazil | | 3.7% |
| India | | 3.0% |
| Mexico | | 3.0% |
| Austria | | 3.0% |
| Other Countries | | 25.9% |
From time to time “Cash & Other Net Assets” may be negative due to timing of cash receipts and/or equivalent exposure from any derivative holdings.
Percentages are based on net assets as of 12/31/07.
The portfolio is actively managed and current holdings may be different.
2
MANAGEMENT REVIEW
Summary of Results
For the twelve months ended December 31, 2007, Initial Class shares of the MFS International Growth Portfolio (the “fund”) provided a total return of 16.58%, while Service Class shares provided a total return of 16.26%. These compare with a return of 21.40% for the fund’s benchmark, the MSCI All Country World (ex-U.S.) Growth Index. The MSCI All Country World (ex-U.S.) Growth Index became the fund’s benchmark effective March 30, 2007. For the period December 31, 2006 to March 29, 2007, the fund’s benchmark was the MSCI EAFE Growth Index. The MSCI EAFE Growth Index generated a return of 16.84% for the twelve months ended December 31, 2007.
Market Environment
Despite seemingly robust growth rates during the second and third quarters of 2007, underlying economic activity in the U.S. remained muted relative to other major economies. Overall, global economies witnessed moderate to strong growth during the reporting period as domestic demand improved and world trade accelerated.
With the strong global growth, however, concerns emerged about rising global inflation, especially as capacity became more constrained, wages rose, and energy and food prices advanced. During the reporting period, global central banks (with the exception of the U.S. Federal Reserve Board) tightened monetary conditions, which in turn pushed global bond yields to their highest levels during this economic expansion.
However, financial markets – particularly in the mortgage and structured-products areas – experienced substantial volatility in recent months. Beginning in late July, heightened uncertainty and distress concerning the subprime mortgage market caused several global credit markets to tighten up, forcing central banks to inject liquidity and to reassess their tightening biases as sovereign bond yields declined and credit spreads widened. While credit conditions improved somewhat by late October as the Federal Reserve Board cut interest rates, the level of market turbulence remained significant through year end. Increased market turmoil was also exacerbated by U.S. home foreclosures and uncertainties surrounding falling housing prices. Despite increased volatility across all asset classes and the widening in credit spreads, U.S. labor markets were resilient and wages rose modestly. More broadly, global equity markets rebounded following summer losses and generally held those gains through the end of the reporting period.
Detractors from performance
Stock selection in the technology sector was the most significant factor detracting from performance relative to the MSCI All Country World (ex-U.S.) Growth Index. Not owning mobile phone maker Nokia (Finland) and wireless communications provider Research In Motion (Canada) for most of the reporting period weighed on results as these stocks appreciated significantly.
Stock selection in the industrial goods and services sector also detracted from relative performance, although no individual stocks within this sector were among the fund’s top detractors. Our modest underweight position hurt as this sector performed better than the benchmark over the reporting period. While our relative weights are the residual of our bottom-up selection process, a number of companies in this sector are capital-intensive and cyclical businesses, which generally we find less appealing than sustainable, low-capital employed businesses.
In the autos and housing sector, security selection was a key negative led by the fund’s holdings of car and machinery manufacturer Toyota Industries(aa).
The fund’s underweighted position in the basic materials sector had a negative impact on relative performance. In particular, not owning mining companies Rio Tinto (Australia), for the entire period, or Companhia Vale do Rio Doce (Brazil), for most of the reporting period, weighed on returns as both companies benefited from rising commodity prices and potential merger speculation.
Our holdings of investment management and banking firm UBS (Switzerland) hindered performance as problems relating to mortgage-backed securities hurt the stock price. Our investment in consumer finance firm Aeon Credit Services (Japan) also suffered as a result of regulatory changes that limited the interest rate credit card companies could charge customers and changed reserve requirements. Other positions that weighed on results included banking firm HSBC(aa) (UK), brokerage firm Daiwa Securities, and advertising and marketing firm WPP Group (UK).
During the reporting period, currency exposure was a detractor from relative performance. All of MFS’ investment decisions are driven by the fundamentals of each individual opportunity and, as such, it is common for our portfolios to have different currency exposure than the benchmark.
3
Management review – continued
Contributors to performance
Boosted by stock selection, the energy sector was a positive factor in relative returns for the reporting period. Shares of oil and gas exploration and production company Petroleo Brasileiro (Brazil) were among the top contributors as the company’s stock price rose on higher oil prices, record oil production, and the continued discovery of offshore oil fields. The fund’s positioning in oil and natural gas provider OAO Gazprom (Russia) also helped.
Stock selection within the health care sector also contributed. Most significantly, not owning pharmaceutical firm AstraZeneca (UK) enhanced relative returns as the company’s shares underperformed the benchmark over the reporting period.
Another sector where positive stock selection benefited relative performance was utilities and communications. Specifically, our investment in CEZ (Czech Republic), Central Europe’s largest power producer, aided performance as management announced strong earnings results, an increased dividend, and plans to expand production at nuclear plants to meet growing demand for electricity.
Although strong stock selection in the retailing sector also bolstered the fund’s return, no holdings within this sector were among the top contributors.
Other significant stock contributors to relative performance during the reporting period included silicon wafer manufacturer Wacker Chemie AG (Germany) and mining giant BHP Billiton (U.K.). BHP Billiton reported strong earnings results and company fundamentals throughout the reporting period. Specifically, the company cited robust demand from Asia and surging commodities prices as key drivers of earnings growth.
Elsewhere, mortgage lender Housing Development Finance (India), wealth management firm Julius Baer (Switzerland), and global food company Nestle (Switzerland) delivered strong relative returns. Not owning poor-performing financial services firm Mizuho Financial (Japan) also helped relative performance as this benchmark constituent depreciated significantly over the reporting period.
Respectfully,
Barry Dargan
Portfolio Manager
| (aa) | Security is not a benchmark constituent. |
The views expressed in this report are those of the portfolio manager only through the end of the period of the report as stated on the cover and do not necessarily reflect the views of MFS or any other person in the MFS organization. These views are subject to change at any time based on market or other conditions, and MFS disclaims any responsibility to update such views. These views may not be relied upon as investment advice or an indication of trading intent on behalf of any MFS portfolio. References to specific securities are not recommendations of such securities, and may not be representative of any MFS portfolio’s current or future investments.
4
PERFORMANCE SUMMARY THROUGH 12/31/07
The following chart illustrates the historical performance of the fund in comparison to its indices. Index comparisons are unmanaged; do not reflect any fees or expenses; and cannot be invested in directly. The performance of other share classes will be greater than or less than that of the class depicted below. (See Notes to Performance Summary.)
Performance data shown represents past performance and is no guarantee of future results. Investment return and principal value fluctuate so your units, when sold, may be worth more or less than the original cost; current performance may be lower or higher than quoted. The performance shown does not reflect the deduction of taxes, if any, that a contract holder would pay on fund distributions or the redemption of contract units. The returns for the fund shown also do not reflect the deduction of expenses associated with variable products, such as mortality and expense risk charges, separate account charges, and sales charges imposed by the insurance company separate accounts. Such expenses would reduce the overall returns shown.
Growth of a hypothetical $10,000 investment
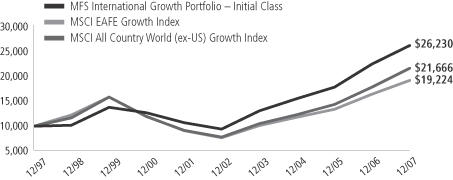
Total returns through 12/31/07
Average Annual Total Returns
| | | | | | | | | | | | |
| | | Share class | | Class inception date | | 1-yr | | 5-yr | | 10-yr | | |
| | | Initial Class | | 6/03/96 | | 16.58% | | 22.73% | | 10.12% | | |
| | | Service Class | | 8/24/01 | | 16.26% | | 22.42% | | 9.96% | | |
Comparative Index
| | | | | | | | | | | | |
| | | MSCI EAFE Growth Index (e)(f) | | 16.84% | | 20.25% | | 6.75% | | |
| | | MSCI All Country World (ex-US) Growth Index (f) | | 21.40% | | 22.71% | | 8.04% | | |
| (e) | Effective March 30, 2007, the fund changed its benchmark from MSCI EAFE Growth Index to the MSCI All Country World (ex-US) Growth Index because it is believed that it more closely corresponds to the investment objective and policies of the fund. |
| (f) | Source: FactSet Research Systems Inc. |
Index Definitions
Morgan Stanley Capital International (MSCI) All Country World (ex-US) Growth Index – a market capitalization-weighted index that is designed to measure equity market performance for growth securities in the global developed and emerging markets, excluding the U.S.
Morgan Stanley Capital International (MSCI) EAFE (Europe, Australasia, Far East) Growth Index – a market capitalization-weighted index that is designed to measure equity market performance for growth securities in the developed markets, excluding the U.S. and Canada.
It is not possible to invest directly in an index.
Notes to Performance Summary
Service Class share performance includes the performance of Initial Class shares for periods prior to the inception of Service Class shares (blended performance). This blended performance figure has not been adjusted to take into account differences in the class-specific operating expenses (such as Rule 12b-1 fees). Because operating expenses of Service Class shares are generally higher than those of Initial Class shares, the blended Service Class shares performance shown is higher than it would have been had Service Class shares been offered for the entire period.
5
Performance summary – continued
Performance results reflect any applicable expense subsidies and waivers in effect during the periods shown. Without such subsidies and waivers the fund’s performance results would be less favorable. Please see the prospectus for complete details. All results are historical and assume the reinvestment of any dividends and capital gains distributions.
From time to time the fund may receive proceeds from litigation settlements, without which performance would be lower.
6
EXPENSE TABLE
Fund Expenses Borne by the Contract Holders During the Period,
July 1, 2007 through December 31, 2007
As a contract holder of the fund, you incur ongoing costs, including management fees; distribution (12b-1) fees; and other fund expenses. This example is intended to help you understand your ongoing costs (in dollars) of investing in the fund and to compare these costs with the ongoing costs of investing in other mutual funds.
The example is based on an investment of $1,000 invested at the beginning of the period and held for the entire period July 1, 2007 through December 31, 2007.
Actual expenses
The first line for each share class in the following table provides information about actual account values and actual expenses. You may use the information in this line, together with the amount you invested, to estimate the expenses that you paid over the period. Simply divide your account value by $1,000 (for example, an $8,600 account value divided by $1,000 = 8.6), then multiply the result by the number in the first line under the heading entitled “Expenses Paid During Period” to estimate the expenses you paid on your account during this period.
Hypothetical example for comparison purposes
The second line for each share class in the following table provides information about hypothetical account values and hypothetical expenses based on the fund’s actual expense ratio and an assumed rate of return of 5% per year before expenses, which is not the fund’s actual return. The hypothetical account values and expenses may not be used to estimate the actual ending account balance or expenses you paid for the period. You may use this information to compare the ongoing costs of investing in the fund and other funds. To do so, compare this 5% hypothetical example with the 5% hypothetical examples that appear in the shareholder reports of the other funds.
Please note that the expenses shown in the table are meant to highlight the fund’s ongoing costs only and do not take into account the fees and expenses imposed under the variable contracts through which your investment in the fund is made. Therefore, the second line for each share class in the table is useful in comparing ongoing costs associated with an investment in vehicles (such as the fund) which fund benefits under variable annuity and variable life insurance contracts and to qualified pension and retirement plans only, and will not help you determine the relative total costs of investing in the fund through variable annuity and variable life insurance contracts. If the fees and expenses imposed under the variable contracts were included, your costs would have been higher.
| | | | | | | | | | |
Share Class | | | | Annualized
Expense Ratio | | Beginning
Account Value
7/01/07 | | Ending
Account Value
12/31/07 | | Expenses Paid
During Period (p)
7/01/07-12/31/07 |
| Initial Class | | Actual | | 1.12% | | $1,000.00 | | $1,040.10 | | $5.76 |
| | Hypothetical (h) | | 1.12% | | $1,000.00 | | $1,019.56 | | $5.70 |
| Service Class | | Actual | | 1.38% | | $1,000.00 | | $1,039.10 | | $7.09 |
| | Hypothetical (h) | | 1.38% | | $1,000.00 | | $1,018.25 | | $7.02 |
| (h) | 5% class return per year before expenses. |
| (p) | Expenses paid is equal to each class’ annualized expense ratio, as shown above, multiplied by the average account value over the period, multiplied by the number of days in the period, divided by the number of days in the year. |
7
PORTFOLIO OF INVESTMENTS – 12/31/07
The Portfolio of Investments is a complete list of all securities owned by your fund.
It is categorized by broad-based asset classes.
| | | | | |
| Issuer | | Shares/Par | | Value ($) |
| | | | | |
| COMMON STOCKS – 100.3% | | | | | |
| Alcoholic Beverages – 1.2% | | | | | |
| Pernod Ricard S.A. (l) | | 8,760 | | $ | 2,017,561 |
| | | | | |
| Apparel Manufacturers – 4.8% | | | | | |
| Adidas AG | | 14,750 | | $ | 1,098,237 |
| Billabong International Ltd. (l) | | 75,348 | | | 979,078 |
| Li & Fung Ltd. | | 434,600 | | | 1,736,692 |
| LVMH Moet Hennessy Louis Vuitton S.A. | | 36,210 | | | 4,352,094 |
| | | | | |
| | | | $ | 8,166,101 |
| | | | | |
| Automotive – 2.3% | | | | | |
| Continental AG | | 9,236 | | $ | 1,197,708 |
| Toyota Industries Corp. | | 47,600 | | | 1,941,139 |
| Yamaha Motor Co. Ltd. (l) | | 32,500 | | | 786,936 |
| | | | | |
| | | | $ | 3,925,783 |
| | | | | |
| Biotechnology – 0.5% | | | | | |
| Actelion Ltd. (a)(l) | | 20,112 | | $ | 916,506 |
| | | | | |
| Broadcasting – 3.8% | | | | | |
| Grupo Televisa S.A., ADR (l) | | 71,860 | | $ | 1,708,112 |
| Societe Television Francaise 1 (l) | | 41,108 | | | 1,094,890 |
| WPP Group PLC | | 279,380 | | | 3,576,820 |
| | | | | |
| | | | $ | 6,379,822 |
| | | | | |
| Brokerage & Asset Managers – 4.5% | | | | | |
| Bolsa de Mercadorias & Futuros (a) | | 79,500 | | $ | 1,116,573 |
| Daiwa Securities Group, Inc. | | 182,000 | | | 1,676,895 |
| ICAP PLC | | 72,360 | | | 1,041,474 |
| IG Group Holdings PLC | | 143,390 | | | 1,150,203 |
| Julius Baer Holding Ltd. | | 31,898 | | | 2,592,786 |
| | | | | |
| | | | $ | 7,577,931 |
| | | | | |
| Business Services – 1.8% | | | | | |
| Accenture Ltd., “A” (l) | | 28,810 | | $ | 1,038,024 |
| Capita Group PLC | | 56,823 | | | 794,572 |
| Intertek Group PLC | | 60,810 | | | 1,192,236 |
| | | | | |
| | | | $ | 3,024,832 |
| | | | | |
| Chemicals – 1.5% | | | | | |
| Makhteshim-Agan Industries Ltd. (a) | | 139,640 | | $ | 1,276,718 |
| Wacker Chemie AG | | 4,370 | | | 1,253,403 |
| | | | | |
| | | | $ | 2,530,121 |
| | | | | |
| Computer Software – 1.2% | | | | | |
| SAP AG (l) | | 25,110 | | $ | 1,297,352 |
| Trend Micro, Inc. (a) | | 21,000 | | | 751,913 |
| | | | | |
| | | | $ | 2,049,265 |
| | | | | |
| Computer Software – Systems – 1.7% | | | | | |
| Fujitsu Ltd. (l) | | 213,000 | | $ | 1,425,382 |
| HCL Technologies Ltd. | | 175,770 | | | 1,470,064 |
| | | | | |
| | | | $ | 2,895,446 |
| | | | | |
| Conglomerates – 1.6% | | | | | |
| Siemens AG | | 11,930 | | $ | 1,872,882 |
| Smiths Group PLC | | 43,840 | | | 878,815 |
| | | | | |
| | | | $ | 2,751,697 |
| | | | | |
| | | | | |
| Issuer | | Shares/Par | | Value ($) |
| | | | | |
| COMMON STOCKS – continued | | | | | |
| Construction – 0.8% | | | | | |
| Wienerberger AG | | 24,734 | | $ | 1,366,306 |
| | | | | |
| Consumer Goods & Services – 6.6% | | | | | |
| AmorePacific Corp. (a) | | 912 | | $ | 687,088 |
| Kao Corp. | | 58,000 | | | 1,744,439 |
| Kimberly-Clark de Mexico S.A. de C.V., “A” | | 337,980 | | | 1,481,757 |
| Kose Corp. (l) | | 36,400 | | | 969,342 |
| L’Oreal S.A. | | 9,900 | | | 1,413,227 |
| Reckitt Benckiser Group PLC | | 62,470 | | | 3,608,824 |
| Uni-Charm Corp. | | 20,100 | | | 1,265,570 |
| | | | | |
| | | | $ | 11,170,247 |
| | | | | |
| Electrical Equipment – 2.7% | | | | | |
| Keyence Corp. | | 4,900 | | $ | 1,200,406 |
| OMRON Corp. | | 50,800 | | | 1,202,408 |
| Schneider Electric S.A. | | 15,610 | | | 2,087,242 |
| | | | | |
| | | | $ | 4,490,056 |
| | | | | |
| Electronics – 9.2% | | | | | |
| ARM Holdings PLC | | 293,840 | | $ | 720,349 |
| Canon, Inc. (l) | | 29,400 | | | 1,343,295 |
| Hirose Electric Co. Ltd. | | 17,500 | | | 2,023,900 |
| Nippon Electric Glass Co. Ltd. | | 58,000 | | | 942,029 |
| Ricoh Co. Ltd. | | 46,000 | | | 846,031 |
| Royal Philips Electronics N.V. | | 62,640 | | | 2,714,683 |
| Samsung Electronics Co. Ltd. | | 3,750 | | | 2,204,104 |
| SUMCO Corp. | | 42,900 | | | 1,228,237 |
| Taiwan Semiconductor Manufacturing Co. Ltd., ADR | | 172,562 | | | 1,718,718 |
| USHIO, Inc. (l) | | 47,200 | | | 1,035,946 |
| Venture Corp. Ltd. | | 89,600 | | | 784,596 |
| | | | | |
| | | | $ | 15,561,888 |
| | | | | |
| Energy – Independent – 1.1% | | | | | |
| INPEX Holdings, Inc. | | 171 | | $ | 1,839,418 |
| | | | | |
| Energy – Integrated – 5.2% | | | | | |
| OAO Gazprom, ADR | | 38,880 | | $ | 2,189,404 |
| Petroleo Brasileiro S.A., ADR | | 17,990 | | | 2,073,168 |
| TOTAL S.A. | | 53,980 | | | 4,479,779 |
| | | | | |
| | | | $ | 8,742,351 |
| | | | | |
| Food & Beverages – 3.3% | | | | | |
| Groupe Danone | | 13,400 | | $ | 1,197,186 |
| Nestle S.A. | | 9,469 | | | 4,338,825 |
| | | | | |
| | | | $ | 5,536,011 |
| | | | | |
| Food & Drug Stores – 1.7% | | | | | |
| Dairy Farm International Holdings Ltd. | | 241,200 | | $ | 1,051,632 |
| Tesco PLC | | 185,498 | | | 1,751,601 |
| | | | | |
| | | | $ | 2,803,233 |
| | | | | |
| General Merchandise – 0.6% | | | | | |
| Massmart Holdings Ltd. | | 89,590 | | $ | 940,295 |
| | | | | |
8
Portfolio of Investments – continued
| | | | | |
| Issuer | | Shares/Par | | Value ($) |
| | | | | |
| COMMON STOCKS – continued | | | | | |
| Machinery & Tools – 2.3% | | | | | |
| Bucyrus International, Inc., “A” (l) | | 18,650 | | $ | 1,853,623 |
| Fanuc Ltd. | | 7,900 | | | 769,386 |
| GEA Group AG (a) | | 36,180 | | | 1,249,594 |
| | | | | |
| | | | $ | 3,872,603 |
| | | | | |
| Major Banks – 7.2% | | | | | |
| Erste Bank der Oesterreichischen Sparkassen AG | | 34,280 | | $ | 2,436,447 |
| HSBC Holdings PLC | | 102,676 | | | 1,720,938 |
| Raiffeisen International Bank Holding AG | | 7,730 | | | 1,164,638 |
| Societe Generale | | 9,991 | | | 1,427,863 |
| Standard Chartered PLC | | 61,260 | | | 2,224,763 |
| Unibanco – Uniao de Bancos Brasileiros S.A., ADR | | 8,650 | | | 1,207,886 |
| UniCredito Italiano S.p.A. | | 232,260 | | | 1,932,632 |
| | | | | |
| | | | $ | 12,115,167 |
| | | | | |
| Medical Equipment – 1.0% | | | | | |
| Synthes, Inc. | | 13,200 | | $ | 1,631,590 |
| | | | | |
| Metals & Mining – 4.6% | | | | | |
| Anglo American PLC | | 36,922 | | $ | 2,237,617 |
| BHP Billiton PLC | | 122,130 | | | 3,758,512 |
| Companhia Vale do Rio Doce, ADR | | 54,680 | | | 1,786,396 |
| | | | | |
| | | | $ | 7,782,525 |
| | | | | |
| Network & Telecom – 2.6% | | | | | |
| Ericsson, Inc., “B” | | 306,750 | | $ | 717,168 |
| NICE Systems Ltd., ADR (a)(l) | | 26,220 | | | 899,870 |
| Nokia Oyj | | 44,920 | | | 1,729,620 |
| Research In Motion Ltd. (a) | | 9,300 | | | 1,054,620 |
| | | | | |
| | | | $ | 4,401,278 |
| | | | | |
| Oil Services – 0.8% | | | | | |
| Acergy S.A. (l) | | 57,910 | | $ | 1,275,806 |
| | | | | |
| Other Banks & Diversified Financials – 6.6% | | | |
| ABSA Group Ltd. | | 97,800 | | $ | 1,585,617 |
| Aeon Credit Service Co. Ltd. | | 87,800 | | | 1,297,988 |
| Akbank T.A.S. | | 151,783 | | | 1,122,313 |
| Bank of Cyprus Public Co. Ltd. | | 72,255 | | | 1,326,012 |
| Housing Development Finance Corp. Ltd. | | 48,659 | | | 3,520,506 |
| UBS AG | | 46,861 | | | 2,176,197 |
| | | | | |
| | | | $ | 11,028,633 |
| | | | | |
| Pharmaceuticals – 7.9% | | | | | |
| Astellas Pharma, Inc. | | 35,100 | | $ | 1,530,117 |
| Bayer AG | | 20,550 | | | 1,873,636 |
| Hisamitsu Pharmaceutical Co., Inc. | | 28,800 | | | 876,516 |
| Novartis AG | | 48,990 | | | 2,668,889 |
| Novo Nordisk A/S, “B” | | 32,090 | | | 2,094,741 |
| Roche Holding AG | | 24,820 | | | 4,275,279 |
| | | | | |
| | | | $ | 13,319,178 |
| | | | | |
| Specialty Chemicals – 3.3% | | | | | |
| L’Air Liquide S.A. | | 13,354 | | $ | 1,978,628 |
| Linde AG | | 14,120 | | | 1,859,686 |
| Symrise AG (a) | | 60,914 | | | 1,698,908 |
| | | | | |
| | | | $ | 5,537,222 |
| | | | | |
| | | | | | |
| Issuer | | Shares/Par | | Value ($) | |
| | | | | | |
| COMMON STOCKS – continued | | | | | | |
| Specialty Stores – 0.6% | | | | | | |
| KappAhl Holding AB | | 75,070 | | $ | 976,170 | |
| | | | | | |
| Telecommunications – Wireless – 2.2% | | | | | | |
| America Movil S.A.B. de C.V., “L”, ADR | | 29,170 | | $ | 1,790,746 | |
| Orascom Telecom Holding SAE, GDR | | 23,200 | | | 1,921,343 | |
| | | | | | |
| | | | $ | 3,712,089 | |
| | | | | | |
| Telephone Services – 4.1% | | | | | | |
| Sistema JSFC, GDR | | 40,690 | | $ | 1,698,807 | |
| Telefonica S.A. | | 110,440 | | | 3,569,113 | |
| Telenor A.S.A. | | 67,140 | | | 1,587,124 | |
| | | | | | |
| | | | $ | 6,855,044 | |
| | | | | | |
| Utilities – Electric Power – 1.0% | | | | | | |
| CEZ AS | | 22,640 | | $ | 1,695,563 | |
| | | | | | |
Total Common Stocks (Identified Cost, $132,833,022) | | | | $ | 168,887,738 | |
| | | | | | |
| |
| COLLATERAL FOR SECURITIES LOANED – 8.5% | | | | |
Navigator Securities Lending Prime
Portfolio, at Cost and Net Asset Value | | 14,286,843 | | $ | 14,286,843 | |
| | | | | | |
Total Investments (Identified Cost, $147,119,865) (k) | | | | $ | 183,174,581 | |
| | | | | | |
OTHER ASSETS, LESS
LIABILITIES – (8.8)% | | | | | (14,852,385 | ) |
| | | | | | |
| Net Assets – 100.0% | | | | $ | 168,322,196 | |
| | | | | | |
| (a) | Non-income producing security. |
| (k) | As of December 31, 2007, the fund had 18 securities that were fair valued, aggregating $24,046,174 and 13.13% of market value, in accordance with the policies adopted by the Board of Trustees. |
| (l) | All or a portion of this security is on loan. |
The following abbreviations are used in this report and are defined:
| ADR | American Depository Receipt |
| GDR | Global Depository Receipt |
See Notes to Financial Statements
9
FINANCIAL STATEMENTS | STATEMENT OF ASSETS AND LIABILITIES
This statement represents your fund’s’ balance sheet, which details the assets and liabilities comprising the total value of the fund.
| | | | |
| At 12/31/07 | | | | |
| Assets | | | | |
| Investments, at value, including $13,984,108, of securities on loan (identified cost, $147,119,865) | | $183,174,581 | | |
| Foreign currency, at value (identified cost, $25,418) | | 28,141 | | |
| Receivable for fund shares sold | | 610 | | |
| Interest and dividends receivable | | 101,087 | | |
| Other assets | | 6,628 | | |
| Total assets | | | | $183,311,047 |
| Liabilities | | | | |
| Payable to custodian | | $426,015 | | |
| Payable for investments purchased | | 74,007 | | |
| Payable for fund shares reacquired | | 43,818 | | |
| Collateral for securities loaned, at value (c) | | 14,286,843 | | |
| Payable to affiliates | | | | |
Management fee | | 16,669 | | |
Distribution fees | | 788 | | |
Administrative services fee | | 423 | | |
| Payable for independent trustees’ compensation | | 417 | | |
| Accrued expenses and other liabilities | | 139,871 | | |
| Total liabilities | | | | $14,988,851 |
| Net assets | | | | $168,322,196 |
| Net assets consist of | | | | |
| Paid-in capital | | $107,216,129 | | |
| Unrealized appreciation (depreciation) on investments and translation of assets and liabilities in foreign currencies (net of $29,910, deferred country tax) | | 36,028,536 | | |
| Accumulated net realized gain (loss) on investments and foreign currency transactions | | 23,552,427 | | |
| Undistributed net investment income | | 1,525,104 | | |
Net assets | | | | $168,322,196 |
| Shares of beneficial interest outstanding | | | | 9,556,997 |
| Initial Class shares | | | | |
Net assets | | $139,632,820 | | |
Shares outstanding | | 7,920,526 | | |
Net asset value per share | | | | $17.63 |
| Service Class shares | | | | |
Net assets | | $28,689,376 | | |
Shares outstanding | | 1,636,471 | | |
Net asset value per share | | | | $17.53 |
| (c) | Non-cash collateral not included. |
See Notes to Financial Statements
10
FINANCIAL STATEMENTS | STATEMENT OF OPERATIONS
This statement describes how much your fund earned in investment income and accrued in expenses. It also describes any gains and/or losses generated by fund operations.
| | | | | |
| Year ended 12/31/07 | | | | | |
| Net investment income | | | | | |
| Income | | | | | |
Dividends | | $3,923,163 | | | |
Interest | | 218,451 | | | |
Foreign taxes withheld | | (271,525 | ) | | |
| Total investment income | | | | | $3,870,089 |
| Expenses | | | | | |
Management fee | | $1,530,638 | | | |
Distribution fees | | 62,792 | | | |
Administrative services fee | | 44,435 | | | |
Independent trustees’ compensation | | 15,192 | | | |
Custodian fee | | 203,270 | | | |
Shareholder communications | | 15,841 | | | |
Auditing fees | | 58,058 | | | |
Legal fees | | 5,949 | | | |
Miscellaneous | | 22,051 | | | |
| Total expenses | | | | | $1,958,226 |
Fees paid indirectly | | (2,243 | ) | | |
| Net expenses | | | | | $1,955,983 |
| Net investment income | | | | | $1,914,106 |
| Realized and unrealized gain (loss) on investments and foreign currency transactions | | | | | |
| Realized gain (loss) (identified cost basis) | | | | | |
Investment transactions (net of $12,340 country tax) | | $23,690,572 | | | |
Foreign currency transactions | | (10,893 | ) | | |
| Net realized gain (loss) on investments and foreign currency transactions | | | | | $23,679,679 |
| Change in unrealized appreciation (depreciation) | | | | | |
Investments (net of $6,579 decrease in deferred country tax) | | $88,103 | | | |
Translation of assets and liabilities in foreign currencies | | 1,767 | | | |
| Net unrealized gain (loss) on investments and foreign currency translation | | | | | $89,870 |
| Net realized and unrealized gain (loss) on investments and foreign currency | | | | | $23,769,549 |
| Change in net assets from operations | | | | | $25,683,655 |
See Notes to Financial Statements
11
FINANCIAL STATEMENTS | STATEMENTS OF CHANGES IN NET ASSETS
These statements describe the increases and/or decreases in net assets resulting from operations, any distributions, and any shareholder transactions.
| | | | | | |
| | | Years ended 12/31 | |
| | | 2007 | | | 2006 | |
| Change in net assets | | | | | | |
| From operations | | | | | | |
| Net investment income | | $1,914,106 | | | $2,063,356 | |
| Net realized gain (loss) on investments and foreign currency transactions | | 23,679,679 | | | 24,875,737 | |
| Net unrealized gain (loss) on investments and foreign currency translation | | 89,870 | | | 8,393,888 | |
| Change in net assets from operations | | $25,683,655 | | | $35,332,981 | |
| Distributions declared to shareholders | | | | | | |
| From net investment income | | | | | | |
Initial Class | | $(2,038,840 | ) | | $(860,676 | ) |
Service Class | | (278,166 | ) | | (96,429 | ) |
| From net realized gain on investments | | | | | | |
Initial Class | | (21,494,679 | ) | | (9,955,492 | ) |
Service Class | | (3,494,601 | ) | | (1,637,251 | ) |
| Total distributions declared to shareholders | | $(27,306,286 | ) | | $(12,549,848 | ) |
| Change in net assets from fund share transactions | | $6,723,672 | | | $1,986 | |
| Total change in net assets | | $5,101,041 | | | $22,785,119 | |
| Net assets | | | | | | |
| At beginning of period | | 163,221,155 | | | 140,436,036 | |
At end of period (including undistributed net investment income of $1,525,104 and
$1,928,293, respectively) | | $168,322,196 | | | $163,221,155 | |
See Notes to Financial Statements
12
FINANCIAL STATEMENTS | FINANCIAL HIGHLIGHTS
The financial highlights table is intended to help you understand the fund’s financial performance for the past 5 years. Certain information reflects financial results for a single fund share. The total returns in the table represent the rate by which an investor would have earned (or lost) on an investment in the fund share class (assuming reinvestment of all distributions) held for the entire period.
Initial Class
| | | | | | | | | | | | | | | |
| | | Years ended 12/31 | |
| | | 2007 | | | 2006 | | | 2005 | | | 2004 | | | 2003 | |
| Net asset value, beginning of period | | $17.93 | | | $15.42 | | | $13.55 | | | $11.46 | | | $8.33 | |
| Income (loss) from investment operations | | | | | | | | | | | | | | | |
| Net investment income (d) | | $0.21 | | | $0.23 | | | $0.12 | | | $0.13 | | | $0.06 | |
Net realized and unrealized gain (loss) on investments and foreign currency | | 2.57 | | | 3.70 | | | 1.88 | | | 2.03 | | | 3.14 | |
| Total from investment operations | | $2.78 | | | $3.93 | | | $2.00 | | | $2.16 | | | $3.20 | |
| Less distributions declared to shareholders | | | | | | | | | | | | | | | |
| From net investment income | | $(0.27 | ) | | $(0.11 | ) | | $(0.13 | ) | | $(0.07 | ) | | $(0.07 | ) |
| From net realized gain on investments | | (2.81 | ) | | (1.31 | ) | | — | | | — | | | — | |
| Total distributions declared to shareholders | | $(3.08 | ) | | $(1.42 | ) | | $(0.13 | ) | | $(0.07 | ) | | $(0.07 | ) |
| Net asset value, end of period | | $17.63 | | | $17.93 | | | $15.42 | | | $13.55 | | | $11.46 | |
| Total return (%) (k)(s) | | 16.58 | | | 26.04 | | | 14.91 | | | 18.94 | | | 38.67 | |
Ratios (%) (to average net assets)
and Supplemental data: | | | | | | | | | | | | | | | |
| Expenses (f) | | 1.11 | | | 1.12 | | | 1.14 | | | 1.11 | | | 1.24 | |
| Net investment income | | 1.16 | | | 1.40 | | | 0.85 | | | 1.09 | | | 0.67 | |
| Portfolio turnover | | 56 | | | 86 | | | 80 | | | 93 | | | 89 | |
| Net assets at end of period (000 Omitted) | | $139,633 | | | $140,242 | | | $121,147 | | | $120,913 | | | $108,114 | |
See Notes to Financial Statements
13
Financial Highlights — continued
Service Class
| | | | | | | | | | | | | | | |
| | | Years ended 12/31 | |
| | | 2007 | | | 2006 | | | 2005 | | | 2004 | | | 2003 | |
| Net asset value, beginning of period | | $17.85 | | | $15.36 | | | $13.50 | | | $11.43 | | | $8.31 | |
| Net investment income (d) | | $0.15 | | | $0.19 | | | $0.08 | | | $0.10 | | | $0.04 | |
Net realized and unrealized gain (loss) on investments
and foreign currency | | 2.56 | | | 3.69 | | | 1.88 | | | 2.01 | | | 3.13 | |
| Total from investment operations | | $2.71 | | | $3.88 | | | $1.96 | | | $2.11 | | | $3.17 | |
| Less distributions declared to shareholders | | | | | | | | | | | | | | | |
| From net investment income | | $(0.22 | ) | | $(0.08 | ) | | $(0.10 | ) | | $(0.04 | ) | | $(0.05 | ) |
| From net realized gain on investments | | (2.81 | ) | | (1.31 | ) | | — | | | — | | | — | |
| Total distributions declared to shareholders | | $(3.03 | ) | | $(1.39 | ) | | $(0.10 | ) | | $(0.04 | ) | | $(0.05 | ) |
| Net asset value, end of period | | $17.53 | | | $17.85 | | | $15.36 | | | $13.50 | | | $11.43 | |
| Total return (%) (k)(s) | | 16.26 | | | 25.75 | | | 14.62 | | | 18.58 | | | 38.35 | |
Ratios (%) (to average net assets)
and Supplemental data: | | | | | | | | | | | | | | | |
| Expenses (f) | | 1.37 | | | 1.37 | | | 1.39 | | | 1.36 | | | 1.49 | |
| Net investment income | | 0.85 | | | 1.15 | | | 0.59 | | | 0.86 | | | 0.39 | |
| Portfolio turnover | | 56 | | | 86 | | | 80 | | | 93 | | | 89 | |
| Net assets at end of period (000 Omitted) | | $28,689 | | | $22,979 | | | $19,289 | | | $18,282 | | | $15,171 | |
| (d) | Per share data are based on average shares outstanding. |
| (f) | Ratios do not reflect reductions from fees paid indirectly, if applicable. |
| (k) | The total return does not reflect expenses that apply to separate accounts. Inclusion of these charges would reduce the total return figures for all periods shown. |
| (s) | From time to time the fund may receive proceeds from litigation settlements, without which performance would be lower. |
See Notes to Financial Statements
14
NOTES TO FINANCIAL STATEMENTS
| (1) | | Business and Organization |
MFS International Growth Portfolio (formerly International Growth Series) (the fund) is a fund of MFS Variable Insurance Trust II (formerly known as MFS/Sun Life Series Trust) (the trust). The trust is organized as a Massachusetts business trust and is registered under the Investment Company Act of 1940, as amended, as an open-end management investment company. The shares of the fund are sold to variable accounts established by insurance companies to fund benefits under variable contracts issued by such companies, and qualified retirement and pension plan.
| (2) | | Significant Accounting Policies |
General – The preparation of financial statements in conformity with U.S. generally accepted accounting principles requires management to make estimates and assumptions that affect the reported amounts of assets and liabilities, and disclosure of contingent assets and liabilities at the date of the financial statements and the reported amounts of revenues and expenses during the reporting period. Actual results could differ from those estimates. The fund can invest in foreign securities, including securities of emerging market issuers. Investments in foreign securities are vulnerable to the effects of changes in the relative values of the local currency and the U.S. dollar and to the effects of changes in each country’s legal, political, and economic environment. The markets of emerging markets countries are generally more volatile than the markets of developed countries with more mature economies. All of the risks of investing in foreign securities previously described are heightened when investing in emerging markets countries.
Investment Valuations – Equity securities, including restricted equity securities, are generally valued at the last sale or official closing price as reported by an independent pricing service on the market or exchange on which they are primarily traded. For securities for which there were no sales reported that day, equity securities are generally valued at the last quoted daily bid quotation as reported by an independent pricing service on the market or exchange on which they are primarily traded. For securities held short for which there were no sales reported for the day, the position is generally valued at the last quoted daily ask quotation as reported by an independent pricing service on the market or exchange on which such securities are primarily traded. Short-term instruments with a maturity at issuance of 60 days or less may be valued at amortized cost, which approximates market value. Open-end investment companies are generally valued at their net asset value per share. Securities and other assets generally valued on the basis of information from an independent pricing service may also be valued at a broker-dealer bid quotation. The values of foreign securities and other assets and liabilities expressed in foreign currencies are converted to U.S. dollars using the mean of bid and asked prices for rates reported by an independent pricing service.
The Board of Trustees has delegated primary responsibility for determining or causing to be determined the value of the fund’s investments (including any fair valuation) to the adviser pursuant to valuation policies and procedures approved by the Board. If the adviser determines that reliable market quotations are not readily available, investments are valued at fair value as determined in good faith by the adviser in accordance with such procedures under the oversight of the Board of Trustees. Under the fund’s valuation policies and procedures, market quotations are not considered to be readily available for many types of debt instruments and certain types of derivatives. These investments are generally valued at fair value based on information from independent pricing services. In addition, investments may be valued at fair value if the adviser determines that an investment’s value has been materially affected by events occurring after the close of the exchange or market on which the investment is principally traded (such as foreign exchange or market) and prior to the determination of the fund’s net asset value, or after the halting of trading of a specific security where trading does not resume prior to the close of the exchange or market on which the security is principally traded. Events that occur on a frequent basis after foreign markets close (such as developments in foreign markets and significant movements in the U.S. markets) and prior to the determination of the fund’s net asset value may be deemed to have a material affect on the value of securities traded in foreign markets. Accordingly, the fund’s foreign equity securities may often be valued at fair value. The adviser may rely on independent pricing services or other information (such as the correlation with price movements of similar securities in the same or other markets; the type, cost and investment characteristics of the security; the business and financial condition of the issuer; and trading and other market data) to assist in determining whether to fair value and at what value to fair value an investment. The value of an investment for purposes of calculating the fund’s net asset value can differ depending on the source and method used to determine value. When fair valuation is used, the value of investments used to determine the fund’s net asset value may differ from quoted or published prices for the same investments.
In September 2006, FASB Statement No. 157, Fair Value Measurements (the “Statement”) was issued, and is effective for fiscal years beginning after November 15, 2007 and for all interim periods within those fiscal years. This Statement provides a single definition of fair value, a hierarchy for measuring fair value and expanded disclosures about fair value measurements. Management is evaluating the application of the Statement to the fund, and believes the impact will be limited to expanded disclosures resulting from the adoption of this Statement in the fund’s financial statements.
15
Notes to Financial Statements – continued
Repurchase Agreements – The fund may enter into repurchase agreements with institutions that the fund’s investment adviser has determined are creditworthy. Each repurchase agreement is recorded at cost. The fund requires that the securities collateral in a repurchase transaction be transferred to the custodian in a manner sufficient to enable the fund to obtain those securities in the event of a default under the repurchase agreement. The fund monitors, on a daily basis, the value of the collateral to ensure that its value, including accrued interest, is greater than amounts owed to the fund under each such repurchase agreement. The fund and other funds managed by Massachusetts Financial Services Company (MFS), may utilize a joint trading account for the purpose of entering into one or more repurchase agreements.
Foreign Currency Translation – Purchases and sales of foreign investments, income, and expenses are converted into U.S. dollars based upon currency exchange rates prevailing on the respective dates of such transactions. Gains and losses attributable to foreign currency exchange rates on sales of securities are recorded for financial statement purposes as net realized gains and losses on investments. Gains and losses attributable to foreign exchange rate movements on income and expenses are recorded for financial statement purposes as foreign currency transaction gains and losses. That portion of both realized and unrealized gains and losses on investments that results from fluctuations in foreign currency exchange rates is not separately disclosed.
Security Loans – State Street Bank and Trust Company (“State Street”), as lending agent, may loan the securities of the fund to certain qualified institutions (the “Borrowers”) approved by the fund. The loans are collateralized at all times by cash and/or U.S. Treasury securities in an amount at least equal to the market value of the securities loaned. State Street provides the fund with indemnification against Borrower default. The fund bears the risk of loss with respect to the investment of cash collateral. On loans collateralized by cash, the cash collateral is invested in a money market fund or short-term securities. A portion of the income generated upon investment of the collateral is remitted to the Borrowers, and the remainder is allocated between the fund and the lending agent. On loans collateralized by U.S. Treasury securities, a fee is received from the Borrower, and is allocated between the fund and the lending agent. Net income from securities lending is included in interest income on the Statement of Operations. The dividend and interest income earned on the securities loaned is accounted for in the same manner as other dividend and interest income.
At December 31, 2007, the value of securities loaned was $13,984,108. These loans were collateralized by cash of $14,286,843 and U.S. Treasury obligations of $259,064.
Indemnifications – Under the fund’s organizational documents, its officers and trustees may be indemnified against certain liabilities and expenses arising out of the performance of their duties to the fund. Additionally, in the normal course of business, the fund enters into agreements with service providers that may contain indemnification clauses. The fund’s maximum exposure under these agreements is unknown as this would involve future claims that may be made against the fund that have not yet occurred.
Investment Transactions and Income – Investment transactions are recorded on the trade date. Interest income is recorded on the accrual basis. All premium and discount is amortized or accreted for financial statement purposes in accordance with U.S. generally accepted accounting principles. All discount is accreted for tax reporting purposes as required by federal income tax regulations. Dividends received in cash are recorded on the ex-dividend date. Certain dividends from foreign securities will be recorded when the fund is informed of the dividend if such information is obtained subsequent to the ex-dividend date. Dividend and interest payments received in additional securities are recorded on the ex-dividend or ex-interest date in an amount equal to the value of the security on such date.
The fund may receive proceeds from litigation settlements. Any proceeds received from litigation involving portfolio holdings are reflected in the Statement of Operations in realized gain/loss if the security has been disposed of by the fund or in unrealized gain/loss if the security is still held by the fund. Any other proceeds from litigation not related to portfolio holdings are reflected as other income in the Statement of Operations.
Fees Paid Indirectly – The fund’s custody fee may be reduced according to an arrangement that measures the value of cash deposited with the custodian by the fund. This amount, for the year ended December 31, 2007, is shown as a reduction of total expenses on the Statement of Operations.
Tax Matters and Distributions – The fund intends to qualify as a regulated investment company, as defined under Subchapter M of the Internal Revenue Code, and to distribute all of its taxable income, including realized capital gains. As a result, no provision for federal income tax is required. The fund adopted the provisions of FASB Interpretation No. 48, Accounting for Uncertainty in Income Taxes (“the Interpretation”) on January 1, 2007. The Interpretation prescribes a minimum threshold for financial statement recognition of the benefit of a tax position taken or expected to be taken in a tax return. There was no impact resulting from the adoption of this Interpretation on the fund’s financial statements. Each of the fund’s federal tax returns for the prior three fiscal years, remains subject to examination by the Internal Revenue Service. It is the fund’s policy
16
Notes to Financial Statements – continued
to record interest and penalty charges on underpaid taxes associated with its tax positions as interest expense and other expense, respectively. No such charges were recorded in the current financial statements. Foreign taxes, if any, have been accrued by the fund in the accompanying financial statements.
Distributions to shareholders are recorded on the ex-dividend date. Income and capital gain distributions are determined in accordance with income tax regulations, which may differ from U.S. generally accepted accounting principles. Certain capital accounts in the financial statements are periodically adjusted for permanent differences in order to reflect their tax character. These adjustments have no impact on net assets or net asset value per share. Temporary differences which arise from recognizing certain items of income, expense, gain or loss in different periods for financial statement and tax purposes will reverse at some time in the future. Distributions in excess of net investment income or net realized gains are temporary overdistributions for financial statement purposes resulting from differences in the recognition or classification of income or distributions for financial statement and tax purposes.
Book/tax differences primarily relate to passive foreign investment companies, wash sale loss deferrals, and foreign taxes.
The tax character of distributions declared to shareholders is as follows:
| | | | |
| | | 12/31/07 | | 12/31/06 |
| Ordinary income (including any short-term capital gains) | | $10,103,836 | | $957,105 |
| Long-term capital gain | | 17,202,450 | | 11,592,743 |
| Total distributions | | $27,306,286 | | $12,549,848 |
The federal tax cost and the tax basis components of distributable earnings were as follows:
| | | |
| As of 12/31/07 | | | |
| Cost of investments | | $147,504,405 | |
| Gross appreciation | | $40,459,615 | |
| Gross depreciation | | (4,789,439 | ) |
| Net unrealized appreciation (depreciation) | | $35,670,176 | |
| Undistributed ordinary income | | 6,066,559 | |
| Undistributed long-term capital gain | | 19,398,285 | |
| Other temporary differences | | (28,953 | ) |
Multiple Classes of Shares of Beneficial Interest – The fund offers multiple classes of shares, which differ in their respective distribution fees. All shareholders bear the common expenses of the fund based on daily net assets of each class, without distinction between share classes. Dividends are declared separately for each class. Differences in per share dividend rates are generally due to differences in separate class expenses.
| (3) | | Transactions with Affiliates |
Investment Adviser – The fund has an investment advisory agreement with MFS to provide overall investment management and related administrative services and facilities to the fund. The management fee is computed daily and paid monthly at the following annual rates:
| | |
| First $1 billion of average daily net assets | | 0.90% |
| Next $1 billion of average daily net assets | | 0.80% |
| Average daily net assets in excess of $2 billion | | 0.70% |
The management fee incurred for the year ended December 31, 2007 was equivalent to an annual effective rate of 0.90% of the fund’s average daily net assets.
Distributor – MFS Fund Distributors, Inc. (MFD), a wholly-owned subsidiary of MFS, is the distributor of shares of the fund. The Trustees have adopted a distribution plan for the Service Class shares pursuant to Rule 12b-1 under the Investment Company Act of 1940.
The fund’s distribution plan provides that each fund will pay MFD distribution fees equal to 0.25% per annum of its average daily net assets attributable to Service Class shares as partial consideration for services performed and expenses incurred by MFD and financial intermediaries in connection with the sale and distribution of the fund’s Service Class shares and the sale and distribution of the variable annuity or variable life insurance contracts investing indirectly in Service Class shares. MFD may subsequently pay all, or a portion, of the distribution fees to financial intermediaries.
Shareholder Servicing Agent – MFS Service Center, Inc. (MFSC), a wholly-owned subsidiary of MFS, has contracted to provide transfer agent and recordkeeping functions in connection with the issuance, transfer, and redemption of each class of shares of the fund under a Shareholder Servicing Agent Agreement. During the year ended December 31, 2007, MFSC did not receive a fee for this service.
17
Notes to Financial Statements – continued
Administrator – MFS provides certain financial, legal, shareholder communications, compliance, and other administrative services to the fund. Under an administrative services agreement, the fund partially reimburses MFS the costs incurred to provide these services. The fund is charged an annual fixed amount of $10,000 plus a fee based on average daily net assets.
The administrative services fee incurred for the year ended December 31, 2007 was equivalent to an annual effective rate of 0.0261% of the fund’s average daily net assets.
Trustees’ and Officers’ Compensation – The fund pays compensation to trustees in the form of a retainer, attendance fees, and additional compensation to the Board chairperson. The fund does not pay compensation directly to officers of the fund who are also officers of the investment adviser, all of whom receive remuneration for their services to the fund from MFS. Certain officers of the fund are officers or directors of MFS, MFD, and MFSC.
Other – This fund and certain other MFS funds (the funds) have entered into a services agreement (the Agreement) which provides for payment of fees by the funds to Tarantino LLC in return for the provision of services of an Independent Chief Compliance Officer (ICCO) for the funds. The ICCO is an officer of the funds and the sole member of Tarantino LLC. The funds can terminate the Agreement with Tarantino LLC at any time under the terms of the Agreement. MFS has agreed to bear all expenses associated with office space, other administrative support, and supplies provided to the ICCO. For the year ended December 31, 2007, the fee paid to Tarantino LLC was $843.
Purchases and sales of investments, other than U.S. government securities, purchased option transactions, and short-term obligations, aggregated $94,942,987 and $111,133,571, respectively.
| (5) | | Shares of Beneficial Interest |
The fund’s Declaration of Trust permits the Trustees to issue an unlimited number of full and fractional shares of beneficial interest. Transactions in fund shares were as follows:
| | | | | | | | | | | | |
| | | Year ended 12/31/07 | | | Year ended 12/31/06 | |
| | | Shares | | | Amount | | | Shares | | | Amount | |
| Shares sold | | | | | | | | | | | | |
Initial Class | | 592,082 | | | $10,559,446 | | | 732,337 | | | $11,504,709 | |
Service Class | | 372,212 | | | 6,445,439 | | | 234,667 | | | 3,791,904 | |
| | 964,294 | | | $17,004,885 | | | 967,004 | | | $15,296,613 | |
| Shares issued to shareholders in reinvestment of distributions | | | | | | | | | | | | |
Initial Class | | 1,418,537 | | | $23,533,519 | | | 639,253 | | | $10,816,168 | |
Service Class | | 228,376 | | | 3,772,767 | | | 102,828 | | | 1,733,680 | |
| | 1,646,913 | | | $27,306,286 | | | 742,081 | | | $12,549,848 | |
| Shares reacquired | | | | | | | | | | | | |
Initial Class | | (1,911,799 | ) | | $(33,219,473 | ) | | (1,405,942 | ) | | $(22,836,046 | ) |
Service Class | | (251,778 | ) | | (4,368,026 | ) | | (305,530 | ) | | (5,008,429 | ) |
| | (2,163,577 | ) | | $(37,587,499 | ) | | (1,711,472 | ) | | $(27,844,475 | ) |
| Net change | | | | | | | | | | | | |
Initial Class | | 98,820 | | | $873,492 | | | (34,352 | ) | | $(515,169 | ) |
Service Class | | 348,810 | | | 5,850,180 | | | 31,965 | | | 517,155 | |
| | 447,630 | | | $6,723,672 | | | (2,387 | ) | | $1,986 | |
The fund and other funds managed by MFS participate in a $1 billion unsecured committed line of credit provided by a syndication of banks under a credit agreement. In addition, the fund and other funds managed by MFS have established uncommitted borrowing arrangements with certain banks. Borrowings may be made for temporary financing needs. Interest is charged to each fund, based on its borrowings, generally at a rate equal to the Federal Reserve funds rate plus 0.30%. In addition, a commitment fee, based on the average daily, unused portion of the committed line of credit, is allocated among the participating funds at the end of each calendar quarter. For the year ended December 31, 2007, the fund’s commitment fee and interest expense were $796 and $531, respectively, and are included in miscellaneous expense on the Statement of Operations.
18
REPORT OF INDEPENDENT REGISTERED PUBLIC ACCOUNTING FIRM
To the Board of Trustees of MFS Variable Insurance Trust II (formerly known as MFS/Sun Life Series Trust) and the Shareholders of MFS International Growth Portfolio (formerly known as International Growth Series):
We have audited the accompanying statement of assets and liabilities, including the portfolio of investments, of MFS International Growth Portfolio (one of the portfolios comprising MFS Variable Insurance Trust II) (the “Trust”) as of December 31, 2007, and the related statement of operations for the year then ended, the statements of changes in net assets for each of the two years in the period then ended, and the financial highlights for each of the five years in the period then ended. These financial statements and financial highlights are the responsibility of the Trust’s management. Our responsibility is to express an opinion on these financial statements and financial highlights based on our audits.
We conducted our audits in accordance with the standards of the Public Company Accounting Oversight Board (United States). Those standards require that we plan and perform the audit to obtain reasonable assurance about whether the financial statements and financial highlights are free of material misstatement. The Trust is not required to have, nor were we engaged to perform, an audit of its internal control over financial reporting. Our audits included consideration of internal control over financial reporting as a basis for designing audit procedures that are appropriate in the circumstances, but not for the purpose of expressing an opinion on the effectiveness of the Trust’s internal control over financial reporting. Accordingly, we express no such opinion. An audit also includes examining, on a test basis, evidence supporting the amounts and disclosures in the financial statements, assessing the accounting principles used and significant estimates made by management, as well as evaluating the overall financial statement presentation. Our procedures included confirmation of securities owned as of December 31, 2007, by correspondence with the custodian and brokers; where replies were not received from brokers, we performed other auditing procedures. We believe that our audits provide a reasonable basis for our opinion.
In our opinion, such financial statements and financial highlights present fairly, in all material respects, the financial position of MFS International Growth Portfolio as of December 31, 2007, the results of its operations for the year then ended, the changes in its net assets for each of the two years in the period then ended, and its financial highlights for each of the five years in the period then ended, in conformity with accounting principles generally accepted in the United States of America.
DELOITTE & TOUCHE LLP
Boston, Massachusetts
February 15, 2008
19
TRUSTEES AND OFFICERS – IDENTIFICATION AND BACKGROUND
The Trustees and officers of the Trust, as of February 1, 2008, are listed below, together with their principal occupations during the past five years. (Their titles may have varied during that period.) The address of each Trustee and officer is 500 Boylston Street, Boston, Massachusetts 02116.
| | | | | | |
Name, Date of Birth | | Position(s) Held
with Fund | | Trustee/Officer
Since(1) | | Principal Occupations During the Past Five Years &
Other Directorships(2) |
| INTERESTED TRUSTEE | | | | |
David D. Horn(3) (born 06/07/41) | | Trustee | | April 1986 | | Private investor; Retired; Sun Life Assurance Company of Canada, Former Senior Vice President and General Manager for the United States (until 1997); Retired: Sun Life Assurance Company of Canada, Director (until March 2004) |
| | |
| INDEPENDENT TRUSTEES | | | | |
J. Kermit Birchfield (born 01/08/40) | | Chairman | | May 1997 | | Consultant; Century Partners, Inc. (investments), Director (1988 to present); Displaytech, Inc. (technology), Director (1995 to present); Dessin Fournir LLC (furniture manufacturer), Director (2005 to present); Intermountain Gas Company, Inc. & Intermountain Industries, Inc. (oil & gas exploration and production) (1988 to present); Site Watch LLC (software to monitor oil tanks) Managing Director (2006 to present); Juridica Investments (fund investing in judicial matters) Director (2007 to present); Dairy Mart Convenience Stores, Inc. (convenience stores), Chairman (1997 to 2003) |
| | | |
Robert C. Bishop (born 01/13/43) | | Trustee | | May 2001 | | Autolmmune Inc. (pharmaceutical product licensing), Chairman, President and Chief Executive Officer (1992 to present); Caliper Life Sciences Corp. (laboratory analytical instruments), Director (2002 to present); Millipore Corporation (biopharmaceutical/research laboratory products), Director (1997 to present); Optobionics Corporation (ophthalmic devices), Director (2002 to 2007); Quintiles Transnational Corp. (contract research services), Director (until 2003) |
| | | |
Frederick H. Dulles (born 03/12/42) | | Trustee | | May 2001 | | Ten State International Law PLLC (law firm), Of Counsel (since 2006); Prudential Carolina Real Estate, (real estate), Broker (since 2006); Free Enterprise Foundation, Inc. (research institute), Director & Secretary (until 2008); Disher, Hamrick & Myers Residential, Inc. (real estate) Broker (until 2006); Frederick H. Dulles law practice (until 2006); Ten State Street LLP (law firm), Member (until 2005); McFadden, Pilkington & Ward LLP (solicitors and registered foreign lawyers), Member & Of Counsel (until 2003) |
| | | |
Marcia A. Kean (born 06/30/48) | | Trustee | | April 2005 | | Feinstein Kean Healthcare (consulting), Chief Executive Officer (since December 2002), Managing Director (prior to May 2001); Ardais Corporation (biotech products), Senior Vice President – Commercialization (February 2002 until November 2002) |
| | | |
Ronald G. Steinhart (born 06/15/40) | | Trustee | | May 2001 | | Private investor; Penske Automotive Group (automotive retailer), Director (2001 to present); Penson Worldwide, Inc. (securities clearance), Director (2006 to present); Animal Health International, Inc. (animal health products), Director (2007 to present); Texas Industries (concrete/aggregates/cement), Director (2007 to present); Carreker Corporation (technology consulting) Director (until 2005); Prentiss Properties Trust (real estate investment trust), Director (until 2006) |
| | | |
Haviland Wright (born 07/21/48) | | Trustee | | May 2001 | | Elixir Technologies Corporation (software) Director (2005 to present); Nano Loa Inc. (liquid crystal displays), Director (2003 to present); Silk Displays, Inc. (smart polymers) Director (2007 to present); Displaytech, Inc. (technology) Chairman and CEO (1995 – 2002) |
| | | |
| TRUSTEE EMERITUS | | | | | | |
Samuel Adams (born 10/19/25) | | Trustee Emeritus | | | | Retired; Kirkpatrick & Lockhart Preston Gates Ellis LLP (law firm), Of Counsel |
| | | |
| OFFICERS | | | | | | |
Maria F. Dwyer(4) (born 12/01/58) | | President | | November 2005 | | Massachusetts Financial Services Company, Executive Vice President and Chief Regulatory Officer (since March 2004); Fidelity Management & Research Company, Vice President (prior to March 2004); Fidelity Group of Funds, President and Treasurer (prior to March 2004) |
| | | |
Tracy Atkinson(4) (born 12/30/64) | | Treasurer | | September 2005 | | Massachusetts Financial Services Company, Senior Vice President (since September 2004); PricewaterhouseCoopers LLP, Partner (prior to September 2004) |
| | | |
Christopher R. Bohane(4) (born 01/18/74) | | Assistant Secretary and Assistant Clerk | | July 2005 | | Massachusetts Financial Services Company, Vice President and Senior Counsel (since April 2003); Kirkpatrick & Lockhart LLP (law firm), Associate (prior to April 2003) |
| | | |
Ethan D. Corey(4) (born 11/21/63) | | Assistant Secretary and Assistant Clerk | | July 2005 | | Massachusetts Financial Services Company, Senior Vice President and Associate General Counsel (since April 2006); Special Counsel (prior to April 2006); Dechert LLP (law firm), Counsel (prior to December 2004) |
20
Trustees and Officers – continued
| | | | | | |
Name, Date of Birth | | Position(s) Held
with Fund | | Trustee/Officer
Since(1) | | Principal Occupations During the Past Five Years &
Other Directorships(2) |
David L. DiLorenzo(4) (born 08/10/68) | | Assistant Treasurer | | July 2005 | | Massachusetts Financial Services Company, Vice President (since June 2005); JP Morgan Investor Services, Vice President (January 2001 to June 2005) |
| | | |
Timothy M. Fagan(4) (born 07/10/68) | | Assistant Secretary and Assistant Clerk | | September 2005 | | Massachusetts Financial Services Company, Vice President and Senior Counsel (since September 2005); John Hancock Advisers, LLC, Vice President and Chief Compliance Officer (September 2004 to August 2005) Senior Attorney (prior to September 2004); John Hancock Group of Funds, Vice President and Chief Compliance Officer (September 2004 to December 2004) |
| | | |
Mark D. Fischer(4) (born 10/27/70) | | Assistant Treasurer | | July 2005 | | Massachusetts Financial Services Company, Vice President (since May 2005); JP Morgan Investment Management Company, Vice President (prior to May 2005) |
| | | |
Brian E. Langenfeld(4) (born 03/07/73) | | Assistant Secretary and Assistant Clerk | | May 2006 | | Massachusetts Financial Services Company, Assistant Vice President and Counsel (since May 2006); John Hancock Advisers, LLC, Assistant Vice President and Counsel (May 2005 to April 2006); John Hancock Advisers, LLC, Attorney and Assistant Secretary (prior to May 2005) |
| | | |
Ellen Moynihan(4) (born 11/13/57) | | Assistant Treasurer | | May 1997 | | Massachusetts Financial Services Company, Senior Vice President |
| | | |
Susan S. Newton(4) (born 03/07/50) | | Assistant Secretary and Assistant Clerk | | May 2005 | | Massachusetts Financial Services Company, Senior Vice President and Assistant General Counsel (since April 2005); John Hancock Advisers, LLC, Senior Vice President, Secretary and Chief Legal Officer (prior to April 2005); John Hancock Group of Funds, Senior Vice President, Secretary and Chief Legal Officer (prior to April 2005) |
| | | |
Susan A. Pereira(4) (born 11/05/70) | | Assistant Secretary and Assistant Clerk | | July 2005 | | Massachusetts Financial Services Company, Vice President and Senior Counsel (since June 2004); Bingham McCutchen LLP (law firm), Associate (January 2001 to June 2004) |
| | | |
Mark N. Polebaum(4) (born 05/01/52) | | Secretary and Assistant Clerk | | February 2006 | | Massachusetts Financial Services Company, Executive Vice President, General Counsel and Secretary (since January 2006); Wilmer Cutler Pickering Hale and Dorr LLP (law firm), Partner (prior to January 2006) |
| | | |
Frank L. Tarantino (born 03/07/44) | | Independent Chief Compliance Officer | | September 2004 | | Tarantino LLC (provider of compliance services), Principal (since June 2004); CRA Business Strategies Group (consulting services), Executive Vice President (April 2003 to June 2004); David L. Babson & Co. (investment adviser), Managing Director, Chief Administrative Officer and Director (February 1997 to March 2003) |
| | | |
Richard S. Weitzel(4) (born 7/16/70) | | Assistant Secretary and Assistant Clerk | | October 2007 | | Massachusetts Financial Services Company, Vice President and Assistant General Counsel (since 2007); Vice President and Senior Counsel (since May 2004); Massachusetts Department of Business and Technology, General Counsel (February 2003 to April 2004); Massachusetts Office of the Attorney General, Assistant Attorney General ( April 2001 to February 2003); Ropes and Gray, Associate (prior to April 2001) |
| | | |
James O. Yost(4) (born 06/12/60) | | Assistant Treasurer | | April 1992 | | Massachusetts Financial Services Company, Senior Vice President |
| (1) | Date first appointed to serve as Trustee/Officer of an MFS fund or a Compass variable account. Each Trustee has served continuously since appointment. |
| (2) | Directorships or trusteeships of companies required to report to the Securities and Exchange Commission (i.e., “public companies”). |
| (3) | “Interested person” of the Sun Life of Canada (U.S.), within the meaning of the Investment Company Act of 1940 (referred to as the 1940 Act), which is the principal federal law governing investment companies like the Series. The address of Sun Life of Canada (U.S.) is One Sun Life Executive Park, Wellesley Hills, Massachusetts 02481. |
| (4) | “Interested person” of MFS within the meaning of the 1940 Act. The address of MFS is 500 Boylston Street, Boston, Massachusetts 02116. |
The Trust does not hold annual meetings for the purpose of electing Trustees, and Trustees are not elected for fixed terms. Each Trustee and officer holds office until his or her successor is chosen and qualified, or until his or her earlier death, resignation, retirement or removal.
All Trustees currently serve as Trustees of the Trust and have served in that capacity since originally elected or appointed. All of the Trustees are also Managers of the Compass Variable Accounts. The executive officers of the Trust hold similar offices for the Compass Variable Accounts and other funds in the MFS fund complex. As of January 1, 2008, each Trustee serves as a Trustee or Manager of 35 Accounts/Funds.
21
Trustees and Officers – continued
The Statement of Additional Information contains further information about the Trustees and is available without charge upon request by calling 1-800-225-2606.
| | |
Investment Adviser
Massachusetts Financial Services Company 500 Boylston Street, Boston, MA 02116-3741 | | Custodian State Street Bank and Trust Company 225 Franklin Street, Boston, MA 02110 |
Distributor
MFS Fund Distributors, Inc. 500 Boylston Street, Boston, MA 02116-3741 | | Independent Registered Public Accounting Firm Deloitte & Touche LLP 200 Berkeley Street, Boston, MA 02116 |
Portfolio Manager Barry Dargan | | |
22
BOARD REVIEW OF INVESTMENT ADVISORY AGREEMENT
The Investment Company Act of 1940 requires that both the full Board of Trustees and a majority of the non-interested (“independent”) Trustees, voting separately, annually approve the continuation of the investment advisory agreement between MFS Variable Insurance Trust II (the “Trust”) and Massachusetts Financial Services Company (MFS) on behalf of the Fund. The Trustees consider matters bearing on the Fund and the advisory arrangements at their meetings throughout the year, including a review of performance data at each regular meeting. In addition, the independent Trustees met several times over the course of three months beginning in May and ending in July 2007 (“contract review meetings”) for the specific purpose of considering whether to approve the continuation of the investment advisory agreement for the Fund. The independent Trustees were assisted in their evaluation of the investment advisory agreement by independent legal counsel, from whom they received separate legal advice and with whom they met separately from MFS management during various contract review meetings. The independent Trustees were also assisted in this process by the Fund’s Independent Chief Compliance Officer, a full-time senior officer appointed by and reporting to the independent Trustees.
In connection with their deliberations, the Trustees, including the independent Trustees, considered such information and factors as they believed, in light of the legal advice furnished to them and their own business judgment, to be relevant. The investment advisory agreement was considered separately for the Fund, although the Trustees also took into account the common interests of all Funds in the Trust in their review. As described below, the Trustees considered the nature, quality, and extent of the various investment advisory, administrative, and shareholder services performed by MFS under the existing investment advisory agreement and other arrangements with the Trust.
In connection with their contract review meetings, the Trustees received and relied upon materials which included, among other items: (i) information provided by Lipper Inc. on the investment performance of the Fund for various time periods ended December 31, 2006, compared to the investment performance of a group of funds with substantially similar investment classifications/objectives (the “Lipper performance universe”), as well as the investment performance of a group of funds identified by objective criteria suggested by MFS (“peer funds”), (ii) information provided by Lipper Inc. on the Fund’s advisory fees and other expenses compared to the advisory fees and other expenses of comparable funds identified by Lipper (the “Lipper expense group”), as well as the advisory fees and other expenses of peer funds identified by objective criteria suggested by MFS, (iii) information provided by MFS on the advisory fees of comparable portfolios of its other clients, including institutional separate account and other clients, (iv) information as to whether, and to what extent applicable, expense waivers, reimbursements or fee “breakpoints” are observed for the Fund, (v) information regarding MFS’ financial results and financial condition, including MFS’ and certain of its affiliates’ estimated profitability from services performed for the Fund, (vi) MFS’ views regarding the outlook for the mutual fund industry and its strategic business plans, (vii) descriptions of various functions performed by MFS for the Trust, such as compliance monitoring and portfolio trading practices, and (viii) information regarding the overall organization of MFS, including information about MFS’ senior management and other personnel providing investment advisory, administrative and other services to the Fund. The comparative performance, fee and expense information prepared and provided by Lipper Inc. was not independently verified, and the independent Trustees did not independently verify any information provided to them by MFS.
The Trustees’ conclusion as to the continuation of the investment advisory agreement was based on comprehensive consideration of all information provided to the Trustees and not the result of any single factor. Some of the factors that figured particularly in the Trustees’ deliberations are described below for the Fund, while individual Trustees may have given different weight to various factors and evaluated the information presented as a whole differently than another Trustee. The Trustees recognized that the fee arrangements for the Fund reflect years of review and discussion between the independent Trustees and MFS, that certain aspects of such arrangements may receive greater scrutiny in some years than others, and that the Trustees’ conclusions may be based, in part, on their consideration of these same arrangements during the course of the year and in prior years.
Based on information provided by Lipper Inc. and MFS, the Trustees compared the Fund’s total return investment performance to the performance of a peer group of funds over various time periods. The Trustees placed particular emphasis on the total return performance of the Fund’s Initial Class shares in comparison to the performance of funds in its Lipper performance universe over the one-, three- and five-year periods. The Trustees did not rely on performance results for more recent periods, including those shown elsewhere in this report.
The Trustees noted the performance of the Fund’s Initial Class shares was in the 2nd quintile relative to the other funds in the Lipper Classification Index for the one-year period (the 1st quintile being the best performers and the 5th quintile being the worst performers). The total return performance of the Fund was in the 2nd quintile for the three-year period and the five-year period ended December 31, 2006, relative to the Lipper performance universe. Based on the nature and quality of services provided by MFS, the Board of Trustees concluded that the Fund’s performance was satisfactory.
23
Board Review of Investment Advisory Agreement – continued
In the course of their deliberations, the Trustees took into account information provided by MFS during contract review meetings, as well as during investment review meetings conducted with portfolio management personnel during the course of the year.
In assessing the reasonableness of the Fund’s advisory fee, the Trustees considered, among other information, the Fund’s advisory fee and the total expense ratio of the Fund’s Initial Class shares as a percentage of average daily net assets, compared to the advisory fee and total expense ratios of its peer group of funds based on information provided by Lipper Inc. and MFS. The Trustees also considered the advisory fees charged by MFS to institutional accounts. In comparing these fees, the Trustees considered the generally broader scope of services provided by MFS to the Trust than those provided to institutional accounts. The Trustees also considered the higher demands placed on MFS’ investment personnel and trading infrastructure as a result of the daily cash in-flows and out-flows of the Fund, and the impact on MFS and related expenses due to the more extensive regulatory regime to which the Fund is subject, compared to institutional accounts.
In considering the fees, the Trustees noted from the Lipper data that the Fund’s effective advisory fee rate was above the median and total expense ratio was approximately at the median of such fees and expenses of funds in the Lipper expense group. The Trustees further concluded that the existing breakpoints were sufficient to allow the Fund to benefit from economies of scale as its assets grow.
The Trustees also considered information prepared by MFS relating to its costs and profits with respect to the Fund and other investment companies and accounts advised by MFS, as well as MFS’ methodologies used to determine and allocate its costs to the Fund and other accounts and products for purposes of estimating profitability.
After reviewing these and other factors described below, the Trustees concluded that the advisory fee charged to the Fund represents reasonable compensation in light of the nature and quality of the services being provided by MFS.
In addition, the Trustees considered MFS’ resources and related efforts to continue to retain, attract and motivate capable personnel to serve the Fund. The Trustees also considered the financial resources of MFS and its parent, Sun Life Financial Inc. The Trustees further considered any advantages and possible disadvantages of having an adviser which also serves other investment companies as well as institutional accounts.
The Trustees also considered the nature, quality, cost, and extent of administrative, transfer agency, and distribution services provided to the Fund by MFS and its affiliates under agreements and plans other than the investment advisory agreement, including the 12b-1 fees the Fund pays to MFS Fund Distributors, Inc., an affiliate of MFS. The Trustees also considered the nature, extent and quality of certain other services MFS performs or arranges on the Fund’s behalf, which may include securities lending programs, directed expense payment programs, class action recovery programs, and MFS’ interaction with third-party service providers, principally custodians and sub-custodians. The Trustees concluded that the various non-advisory services provided by MFS and its affiliates on behalf of the Fund were satisfactory. The Trustees also considered the benefits to MFS from the use of the Fund’s portfolio brokerage commissions to pay for research and other similar services (including MFS’ policy not to use “soft dollars” generated by Fund portfolio transactions to pay for third-party research), and various other factors. Additionally, the Trustees considered so-called “fall-out benefits” to MFS such as reputational value derived from serving as investment manager to the Trust, and determined that any such benefits derived by MFS were reasonable and fair.
Based on their evaluation of factors that they deemed to be material, including those factors described above, the Board of Trustees, including a majority of the independent Trustees, concluded that the investment advisory agreement should be continued for an additional one-year period, commencing September 1, 2007.
A discussion regarding the Board’s most recent review and renewal of the Fund’s investment advisory agreement is available by clicking on the Fund’s name under “Variable Insurance Portfolios” on the “Products & Performance” page on the MFS Web site (mfs.com).
24
PROXY VOTING POLICIES AND INFORMATION
A general description of the MFS funds’ proxy voting policies and procedures is available without charge, upon request, by calling 1-800-225-2606, by visiting the About MFS section of mfs.com or by visiting the SEC’s Web site at http://www.sec.gov.
Information regarding how the fund voted proxies relating to portfolio securities during the most recent twelve-month period ended June 30 is available without charge by visiting the Proxy Voting section of mfs.com or by visiting the SEC’s Web site at http://www.sec.gov.
QUARTERLY PORTFOLIO DISCLOSURE
The fund will file a complete schedule of portfolio holdings with the Securities and Exchange Commission (the Commission) for the first and third quarters of each fiscal year on Form N-Q. The fund’s Form N-Q may be reviewed and copied at the:
Public Reference Room
Securities and Exchange Commission
100 F Street, NE, Room 1580
Washington, D.C. 20549
Information on the operation of the Public Reference Room may be obtained by calling the Commission at 1-800-SEC-0330. The fund’s Form N-Q is available on the EDGAR database on the Commission’s Internet Web site at http://www.sec.gov, and copies of this information may be obtained, upon payment of a duplicating fee, by electronic request at the following e-mail address: publicinfo@sec.gov or by writing the Public Reference Section at the above address.
A shareholder can also obtain the quarterly portfolio holdings report at mfs.com.
FEDERAL TAX INFORMATION (unaudited)
The following information is provided pursuant to provisions of the Internal Revenue Code.
The fund designates $17,202,450 as capital gain dividends paid during the fiscal year.
Income derived from foreign sources was $2,563,581. The fund intends to pass through foreign tax credits of $127,338 for the fiscal year.
25
MFS® PRIVACY NOTICE
Privacy is a concern for every investor today. At MFS Investment Management® and the MFS funds, we take this concern very seriously. We want you to understand our policies about the investment products and services that we offer, and how we protect the nonpublic personal information of investors who have a direct relationship with us and our wholly owned subsidiaries.
Throughout our business relationship, you provide us with personal information. We maintain information and records about you, your investments, and the services you use. Examples of the nonpublic personal information we maintain include
| | Ÿ | | data from investment applications and other forms |
| | Ÿ | | share balances and transactional history with us, our affiliates, or others |
| | Ÿ | | facts from a consumer reporting agency |
We do not disclose any nonpublic personal information about our customers or former customers to anyone, except as permitted by law. We may share nonpublic personal information with third parties or certain of our affiliates in connection with servicing your account or processing your transactions. We may share information with companies or financial institutions that perform marketing services on our behalf or with other financial institutions with which we have joint marketing arrangements, subject to any legal requirements.
Authorization to access your nonpublic personal information is limited to appropriate personnel who provide products, services, or information to you. We maintain physical, electronic, and procedural safeguards to help protect the personal information we collect about you.
If you have any questions about the MFS privacy policy, please call 1-800-225-2606 any business day between 8 a.m. and 8 p.m. Eastern time.
Note: If you own MFS products or receive MFS services in the name of a third party such as a bank or broker-dealer, their privacy policy may apply to you instead of ours.
26
CONTACT US
Web site
mfs.com
Account service and
literature
Shareholders
1-877-411-3325
9 a.m. to 5 p.m. ET
Investment professionals
1-800-637-8630
8 a.m. to 5 p.m. ET
Mailing address
MFS Service Center, Inc.
Attn: Institutional Alliance Services (IAS)
P.O. Box 55824
Boston, MA
02205-5824
Overnight mail
MFS Service Center, Inc.
Attn: Institutional Alliance Services (IAS)
500 Boylston Street
Boston, MA 02116-3741


MFS® Variable Insurance TrustSM II
Annual report
MFS® Utilities Portfolio
(formerly Utilities Series)
12/31/07
UTS-ANN
MFS® UTILITIES PORTFOLIO
(formerly Utilities Series)
The report is prepared for the general information of contract owners. It is authorized for distribution to prospective investors only when preceded or accompanied by a current prospectus.
NOT FDIC INSURED MAY LOSE VALUE NO BANK OR CREDIT UNION GUARANTEE NOT A DEPOSIT NOT INSURED BY ANY FEDERAL GOVERNMENT AGENCY OR NCUA/NCUSIF
LETTER FROM THE CEO

Dear Contract Owners:
The past year has been a great example of why investors should keep their eyes on the long term.
In 2006 the Dow Jones Industrial Average returned 19% and was fairly stable. This year we have seen a greater level of volatility than has been experienced in recent years. The Dow hit several new highs but also experienced swift drops as a global credit crisis swept through markets, spurred by defaults on U.S. subprime loans and a liquidity crunch. Still, even with this volatility, the Dow ended the first three quarters of 2007 with a return near 13%.
U.S. Treasury bonds gained ground, especially in the third quarter as investors sought less risky asset classes. The spreads of many lower-quality debt investments widened.
In 2007 the U.S. dollar fell against the euro, oil prices hit their highest levels yet, and gold spiked to its steepest price in 28 years. Around the globe, stocks sold off as risk aversion mounted. As we have said before, markets can be volatile, and investors should make sure they have an investment plan that can carry them through the peaks and troughs.
If you are focused on a long-term investment strategy, the short-term ups and downs of the markets should not necessarily dictate portfolio action on your part. In our view, investors who remain committed to a long-term plan are more likely to achieve their financial goals.
In any market environment, we believe individual investors are best served by following a three-pronged investment strategy of allocating their holdings across the major asset classes, diversifying within each class, and regularly rebalancing their portfolios to maintain their desired allocations. Of course, these strategies cannot guarantee a profit or protect against a loss. Investing and planning for the long term require diligence and patience, two traits that in our experience are essential to capitalizing on the many opportunities the financial markets can offer — through both up and down economic cycles.
Respectfully,

Robert J. Manning
Chief Executive Officer and Chief Investment Officer
MFS Investment Management®
February 15, 2008
The opinions expressed in this letter are subject to change, may not be relied upon for investment advice, and no forecasts can be guaranteed.
1
PORTFOLIO COMPOSITION
Portfolio structure (i)
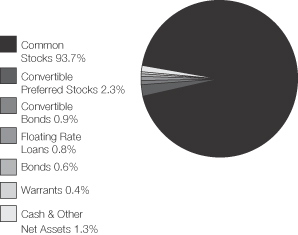
| | |
| Top ten holdings (i) | | |
| NRG Energy, Inc. | | 3.6% |
| AT&T, Inc. | | 3.5% |
| Equitable Resources, Inc. | | 2.8% |
| Public Service Enterprise Group, Inc. | | 2.5% |
| E.ON AG | | 2.3% |
| Rogers Communications, Inc., “B” | | 2.1% |
| American Electric Power Co., Inc. | | 2.1% |
| FPL Group, Inc. | | 2.0% |
| Sempra Energy | | 2.0% |
| Williams Cos., Inc. | | 1.9% |
| | |
| Top five industries (i) | | |
| Utilities – Electric Power | | 46.9% |
| Telephone Services | | 16.2% |
Telecommunications – Wireless | | 12.5% |
| Natural Gas – Distribution | | 7.9% |
| Natural Gas – Pipeline | | 5.3% |
| | |
| Country weightings (i) | | |
| United States | | 61.6% |
| Spain | | 6.2% |
| Canada | | 4.0% |
| United Kingdom | | 3.6% |
| Brazil | | 3.0% |
| Germany | | 2.9% |
| Mexico | | 2.8% |
| France | | 2.5% |
| Israel | | 1.9% |
| Other Countries | | 11.5% |
| (i) | For purposes of this presentation, the bond component includes accrued interest amounts and may be positively or negatively impacted by the equivalent exposure from any derivative holdings, if applicable. |
Percentages are based on net assets as of 12/31/07.
The portfolio is actively managed and current holdings may be different.
2
MANAGEMENT REVIEW
Summary of Results
For the twelve months ended December 31, 2007, Initial Class shares of the MFS Utilities Portfolio (the “fund”) provided a total return of 28.53%, while Service Class shares provided a total return of 28.24%. These compare with returns of 19.38% and 5.49%, respectively, for the fund’s benchmarks, the Standard & Poor’s 500 Utilities Index and the Standard & Poor’s 500 Stock Index.
Market Environment
Despite seemingly robust growth rates during the second and third quarters of 2007, underlying economic activity in the U.S. remained muted relative to other major economies. Overall, global economies witnessed moderate to strong growth during the reporting period as domestic demand improved and world trade accelerated.
With the strong global growth, however, concerns emerged about rising global inflation, especially as capacity became more constrained, wages rose, and energy and food prices advanced. During the reporting period, global central banks (with the exception of the U.S. Federal Reserve Board) tightened monetary conditions, which in turn pushed global bond yields to their highest levels during this economic expansion.
However, financial markets – particularly in the mortgage and structured-products areas – experienced substantial volatility in recent months. Beginning in late July, heightened uncertainty and distress concerning the subprime mortgage market caused several global credit markets to tighten up, forcing central banks to inject liquidity and to reassess their tightening biases as sovereign bond yields declined and credit spreads widened. While credit conditions improved somewhat by late October as the Federal Reserve Board cut interest rates, the level of market turbulence remained significant through year end. Increased market turmoil was also exacerbated by U.S. home foreclosures and uncertainties surrounding falling housing prices. Despite increased volatility across all asset classes and the widening in credit spreads, U.S. labor markets were resilient and wages rose modestly. More broadly, global equity markets rebounded following summer losses and generally held those gains through the end of the reporting period.
Contributors to performance
Strong stock selection in the electric power industry contributed to the fund’s performance relative to the Standard & Poor’s 500 Utilities Index over the reporting period. Our holdings of power generation company NRG Energy(aa), power and gas company E.ON(aa) (Germany), and electric utility company CEZ(aa) (Czech Republic) were among the fund’s top contributors. Positioning in utility holding company PG&E and power and natural gas distributor Duke Energy(g) also helped as we were on average underweight both securities relative to the benchmark, and held these stocks for only portions of the reporting period. Underweighting independent power producer AES and not owning power distributor Southern Power Company aided relative performance as both stocks lagged overall benchmark returns.
Holdings within the wireless communications industry, which is not represented in the benchmark, boosted relative performance over the reporting period. In particular, wireless telecommunications services provider Cellcom Israel(aa) (Israel) delivered strong appreciation. Shares rose as Cellcom Israel reported higher-than-expected profit growth as the firm focused on cost controls to increase earnings in the highly competitive Israeli wireless market.
Elsewhere, the fund’s position in telecommunications company Telefonica(aa) (Spain) provided strong relative performance, while not owning poor-performing benchmark constituent NiSource, a natural gas distributor, also helped.
The fund’s currency exposure was a contributor to relative performance. All of MFS’ investment decisions are driven by the fundamentals of each individual opportunity and as such, it is common for our portfolios to have different currency exposure than the benchmark.
Detractors from performance
Although overall stock selection in the electric power industry contributed to relative returns, our positioning in several strong-performing benchmark constituents detracted from results over the reporting period. These included Exelon(g), PPL(g), and TXU(g). Underweighting Public Service Enterprise Group also hurt.
In the cable TV industry, cable services provider Comcast(aa) and media firm Time Warner(aa) weighed on performance. Although no securities were among the top detractors, our positions in the broadcasting industry also held back performance.
Respectfully,
| | |
| Robert Persons | | Maura Shaughnessy |
| Portfolio Manager | | Portfolio Manager |
| (aa) | Security is not a benchmark constituent. |
| (g) | Security was not held in the portfolio at period end. |
The views expressed in this report are those of the portfolio managers only through the end of the period of the report as stated on the cover and do not necessarily reflect the views of MFS or any other person in the MFS organization. These views are subject to change at any time based on market and other conditions, and MFS disclaims any responsibility to update such views. These views may not be relied upon as investment advice or an indication of trading intent on behalf of any MFS portfolio. References to specific securities are not recommendations of such securities, and may not be representative of any MFS portfolio’s current or future investments.
3
PERFORMANCE SUMMARY THROUGH 12/31/07
The following chart illustrates the historical performance of the fund in comparison to its benchmark index. Index comparisons are unmanaged; do not reflect any fees or expenses; and cannot be invested in directly. The performance of other share classes will be greater than or less than that of the class depicted below. (See Notes to Performance Summary.)
Performance data shown represents past performance and is no guarantee of future results. Investment return and principal value fluctuate so your units, when sold, may be worth more or less than the original cost; current performance may be lower or higher than quoted. The performance shown does not reflect the deduction of taxes, if any, that a contract holder would pay on fund distributions or the redemption of contract units. The returns for the fund shown also do not reflect the deduction of expenses associated with variable products, such as mortality and expense risk charges, separate account charges, and sales charges imposed by the insurance company separate accounts. Such expenses would reduce the overall returns shown.
Growth of a hypothetical $10,000 investment
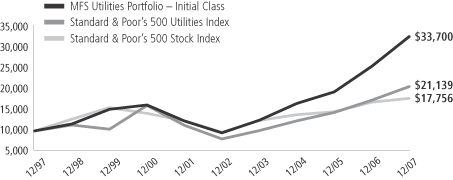
Total returns through 12/31/07
Average Annual Total Returns
| | | | | | | | | | | | |
| | | Share class | | Class inception date | | 1-yr | | 5-yr | | 10-yr | | |
| | | Initial Class | | 11/16/93 | | 28.53% | | 28.79% | | 12.92% | | |
| | | Service Class | | 8/24/01 | | 28.24% | | 28.48% | | 12.73% | | |
Comparative Index
| | | | | | | | | | | | |
| | | Standard & Poor’s 500 Utilities Index (f) | | 19.38% | | 21.50% | | 7.77% | | |
| | | Standard & Poor’s 500 Stock Index (b)(f) | | 5.49% | | 12.83% | | 5.91% | | |
| (b) | MFS has added the S&P 500 Stock Index to compare the fund’s performance to in order to show a broader based benchmark than the S&P 500 Utilities Index. |
| (f) | Source: FactSet Research Systems Inc. |
Index Definition
Standard & Poor’s 500 Stock Index – a market capitalization-weighted index of 500 widely held equity securities, designed to measure broad U.S. equity performance.
Standard & Poor’s 500 Utilities Index – a market capitalization-weighted index designed to measure the utilities sector, including those companies considered electric, gas or water utilities, or companies that operate as independent producers and/or distributors of power.
It is not possible to invest directly in an index.
Notes to Performance Summary
Service Class share performance includes the performance of Initial Class shares for periods prior to the inception of Service Class shares (blended performance). This blended performance figure has not been adjusted to take into account differences in the class-specific operating expenses (such as Rule 12b-1 fees). Because operating expenses of Service Class shares are generally higher than those of Initial Class shares, the blended Service Class shares performance shown is higher than it would have been had Service Class shares been offered for the entire period.
Performance results reflect any applicable expense subsidies and waivers in effect during the periods shown. Without such subsidies and waivers the fund’s performance results would be less favorable. Please see the prospectus for complete details. All results are historical and assume the reinvestment of any dividends and capital gains distributions.
From time to time the fund may receive proceeds from litigation settlements, without which performance would be lower.
4
EXPENSE TABLE
Fund Expenses Borne by the Contract Holders During the Period,
July 1, 2007 through December 31, 2007
As a contract holder of the fund, you incur ongoing costs, including management fees; distribution (12b-1) fees; and other fund expenses. This example is intended to help you understand your ongoing costs (in dollars) of investing in the fund and to compare these costs with the ongoing costs of investing in other mutual funds.
The example is based on an investment of $1,000 invested at the beginning of the period and held for the entire period July 1, 2007 through December 31, 2007.
Actual expenses
The first line for each share class in the following table provides information about actual account values and actual expenses. You may use the information in this line, together with the amount you invested, to estimate the expenses that you paid over the period. Simply divide your account value by $1,000 (for example, an $8,600 account value divided by $1,000 = 8.6), then multiply the result by the number in the first line under the heading entitled “Expenses Paid During Period” to estimate the expenses you paid on your account during this period.
Hypothetical example for comparison purposes
The second line for each share class in the following table provides information about hypothetical account values and hypothetical expenses based on the fund’s actual expense ratio and an assumed rate of return of 5% per year before expenses, which is not the fund’s actual return. The hypothetical account values and expenses may not be used to estimate the actual ending account balance or expenses you paid for the period. You may use this information to compare the ongoing costs of investing in the fund and other funds. To do so, compare this 5% hypothetical example with the 5% hypothetical examples that appear in the shareholder reports of the other funds.
Please note that the expenses shown in the table are meant to highlight the fund’s ongoing costs only and do not take into account the fees and expenses imposed under the variable contracts through which your investment in the fund is made. Therefore, the second line for each share class in the table is useful in comparing ongoing costs associated with an investment in vehicles (such as the fund) which fund benefits under variable annuity and variable life insurance contracts and to qualified pension and retirement plans only, and will not help you determine the relative total costs of investing in the fund through variable annuity and variable life insurance contracts. If the fees and expenses imposed under the variable contracts were included, your costs would have been higher.
| | | | | | | | | | |
Share Class | | | | Annualized
Expense Ratio | | Beginning
Account Value
7/01/07 | | Ending Account Value 12/31/07 | | Expenses Paid
During Period (p)
7/01/07-12/31/07 |
| Initial Class | | Actual | | 0.84% | | $1,000.00 | | $1,077.80 | | $4.40 |
| | Hypothetical (h) | | 0.84% | | $1,000.00 | | $1,020.97 | | $4.28 |
| Service Class | | Actual | | 1.09% | | $1,000.00 | | $1,076.90 | | $5.71 |
| | Hypothetical (h) | | 1.09% | | $1,000.00 | | $1,019.71 | | $5.55 |
| (h) | 5% class return per year before expenses. |
| (p) | Expenses paid is equal to each class’ annualized expense ratio, as shown above, multiplied by the average account value over the period, multiplied by the number of days in the period, divided by the number of days in the year. |
5
PORTFOLIO OF INVESTMENTS – 12/31/07
The Portfolio of Investments is a complete list of all securities owned by your fund.
It is categorized by broad-based asset classes.
| | | | | |
| Issuer | | Shares/Par | | Value ($) |
| | | | | |
| COMMON STOCKS – 93.7% | | | | | |
| Broadcasting – 0.8% | | | | | |
| Grupo Televisa S.A., ADR | | 168,500 | | $ | 4,005,245 |
| | | | | |
| Cable TV – 3.3% | | | | | |
| Comcast Corp., “Special A” (a) | | 411,850 | | $ | 7,462,722 |
| Net Servicos de Comuicacao S.A., IPS (a) | | 130,900 | | | 1,568,903 |
| Time Warner Cable, Inc. (a) | | 281,900 | | | 7,780,440 |
| | | | | |
| | | | $ | 16,812,065 |
| | | | | |
| Energy – Independent – 1.4% | | | | | |
| Talisman Energy, Inc. | | 140,100 | | $ | 2,610,506 |
| Ultra Petroleum Corp. (a) | | 44,000 | | | 3,146,000 |
| XTO Energy, Inc. | | 24,750 | | | 1,271,160 |
| | | | | |
| | | | $ | 7,027,666 |
| | | | | |
| Energy – Integrated – 1.3% | | | | | |
| OAO Gazprom, ADR | | 53,800 | | $ | 3,029,577 |
| TOTAL S.A. | | 44,200 | | | 3,668,141 |
| | | | | |
| | | | $ | 6,697,718 |
| | | | | |
| Engineering – Construction – 0.8% | | | | | |
| Acciona S.A. | | 9,800 | | $ | 3,080,239 |
| Bouygues S.A. | | 9,200 | | | 762,794 |
| | | | | |
| | | | $ | 3,843,033 |
| | | | | |
| Internet – 0.5% | | | | | |
| Iliad S.A. (l) | | 23,344 | | $ | 2,493,950 |
| | | | | |
| Natural Gas – Distribution – 7.9% | | | | | |
| AGL Resources, Inc. | | 96,660 | | $ | 3,638,282 |
| Equitable Resources, Inc. | | 271,100 | | | 14,444,208 |
| MDU Resources Group, Inc. | | 223,100 | | | 6,159,791 |
| Questar Corp. | | 99,700 | | | 5,393,770 |
| Sempra Energy | | 166,100 | | | 10,278,268 |
| | | | | |
| | | | $ | 39,914,319 |
| | | | | |
| Natural Gas – Pipeline – 4.6% | | | | | |
| El Paso Corp. | | 475,300 | | $ | 8,194,172 |
| Enagas S.A. | | 180,774 | | | 5,249,716 |
| Williams Cos., Inc. | | 272,317 | | | 9,743,502 |
| | | | | |
| | | | $ | 23,187,390 |
| | | | | |
| Network & Telecom – 0.1% | | | | | |
| Hrvatske Telekomunikacije dd, GDR (a)(z) | | 7,290 | | $ | 503,010 |
| | | | | |
| Oil Services – 1.2% | | | | | |
| Halliburton Co. | | 119,300 | | $ | 4,522,663 |
| Noble Corp. | | 32,900 | | | 1,859,179 |
| | | | | |
| | | | $ | 6,381,842 |
| | | | | |
| Telecommunications – Wireless – 12.2% | | | |
| America Movil S.A.B. de C.V., “L”, ADR | | 147,500 | | $ | 9,055,025 |
| Cellcom Israel Ltd. | | 248,320 | | | 7,886,645 |
Hutchison Telecommunications
International Ltd. | | 2,318,000 | | | 3,484,105 |
| Mobile TeleSystems OJSC, ADR | | 29,800 | | | 3,033,342 |
| MTN Group Ltd. | | 167,900 | | | 3,146,060 |
| NII Holdings, Inc. “B” (a) | | 178,100 | | | 8,605,792 |
| Partner Communication Co. Ltd., ADR (l) | | 91,000 | | | 2,009,280 |
| | | | | |
| Issuer | | Shares/Par | | Value ($) |
| | | | | |
| COMMON STOCKS – continued | | | | | |
| Telecommunications – Wireless – continued | | | |
| Philippine Long Distance Telephone Co. | | 30,400 | | $ | 2,327,506 |
Philippine Long Distance Telephone
Co., ADR | | 36,500 | | | 2,763,780 |
| Rogers Communications, Inc., “B” | | 231,400 | | | 10,548,342 |
| Tim Participacoes S.A., ADR (l) | | 87,300 | | | 3,051,135 |
| Vodafone Group PLC | | 1,640,100 | | | 6,112,674 |
| | | | | |
| | | | $ | 62,023,686 |
| | | | | |
| Telephone Services – 16.2% | | | | | |
| AT&T, Inc. | | 429,600 | | $ | 17,854,176 |
| Bharti Tele-Ventures Ltd. (a) | | 64,100 | | | 1,611,124 |
| Embarq Corp. | | 176,700 | | | 8,751,951 |
| Megacable Holdings (a) | | 404,410 | | | 1,373,192 |
| Qwest Communications International, Inc. (l) | | 1,068,600 | | | 7,490,886 |
| Royal KPN N.V. | | 433,200 | | | 7,834,603 |
| Singapore Telecommunications Ltd. | | 1,036,550 | | | 2,844,504 |
| Telecom Argentina S.A., ADR (a)(l) | | 184,100 | | | 4,096,225 |
| Telefonica S.A. | | 274,300 | | | 8,864,610 |
| Telenor A.S.A. | | 307,700 | | | 7,273,727 |
| Telkom SA Ltd. | | 63,900 | | | 1,290,275 |
| TELUS Corp. (non-voting shares) | | 150,080 | | | 7,300,613 |
| Verizon Communications, Inc. | | 17,200 | | | 751,467 |
| Windstream Corp. | | 386,355 | | | 5,030,341 |
| | | | | |
| | | | $ | 82,367,694 |
| | | | | |
| Utilities – Electric Power – 43.4% | | | | | |
| AES Corp. (a) | | 418,000 | | $ | 8,941,020 |
| AES Tiete S.A., IPS | | 101,313,500 | | | 3,785,027 |
| Ameren Corp. | | 18,900 | | | 1,024,569 |
| American Electric Power Co., Inc. | | 226,500 | | | 10,545,840 |
| CEZ AS | | 90,100 | | | 6,747,802 |
| CMS Energy Corp. | | 538,700 | | | 9,362,606 |
| Consolidated Edison, Inc. | | 50,940 | | | 2,488,419 |
| Constellation Energy Group, Inc. | | 44,000 | | | 4,511,320 |
| Covanta Holding Corp. (a) | | 70,690 | | | 1,955,286 |
| Dominion Resources, Inc. | | 132,600 | | | 6,291,871 |
| DPL, Inc. (l) | | 226,700 | | | 6,721,655 |
| DTE Energy Co. | | 79,300 | | | 3,486,028 |
| Dynegy, Inc. (a) | | 416,598 | | | 2,974,510 |
| E.ON AG | | 53,900 | | | 11,444,363 |
| Edison International | | 181,700 | | | 9,697,329 |
| Electricite de France | | 14,800 | | | 1,753,870 |
| Eletropaulo Metropolitana S.A., IPS | | 80,980,000 | | | 6,560,472 |
| Enersis S.A., ADR | | 254,800 | | | 4,084,444 |
| Entergy Corp. | | 6,400 | | | 764,928 |
| Entergy Corp., “A”, IEU | | 94,260 | | | 6,763,155 |
| FirstEnergy Corp. | | 54,600 | | | 3,949,764 |
| FPL Group, Inc. | | 152,100 | | | 10,309,338 |
| Iberdrola S.A. (a) | | 331,170 | | | 2,735,658 |
| Iberdrola S.A. (l) | | 331,936 | | | 5,024,875 |
| International Power PLC | | 808,100 | | | 7,254,087 |
| Northeast Utilities | | 149,600 | | | 4,683,976 |
| NRG Energy, Inc. (a)(l) | | 419,700 | | | 18,189,798 |
6
Portfolio of Investments – continued
| | | | | | |
| Issuer | | Shares/Par | | Value ($) |
| | | | | | |
| COMMON STOCKS – continued | | | | | | |
| Utilities – Electric Power – continued | | | |
| Oesterreichische Elektrizitaetswirtschafts AG (Verbund), “A” | | | 26,300 | | $ | 1,831,639 |
| Pepco Holdings, Inc. | | | 240,000 | | | 7,039,200 |
| PG&E Corp. | | | 190,800 | | | 8,221,572 |
| Portland General Electric Co. | | | 56,110 | | | 1,558,736 |
| Public Service Enterprise Group, Inc. | | | 129,800 | | | 12,751,552 |
| Red Electrica de Espana | | | 106,200 | | | 6,674,238 |
| Reliant Energy, Inc. (a) | | | 100,800 | | | 2,644,992 |
| RWE AG | | | 22,300 | | | 3,124,884 |
| Scottish & Southern Energy PLC | | | 91,300 | | | 2,965,672 |
| SUEZ S.A. (a) | | | 19,100 | | | 1,294,697 |
| United Utilities PLC | | | 132,000 | | | 1,976,387 |
| Veolia Environnement S.A. | | | 28,404 | | | 2,579,618 |
| Wisconsin Energy Corp. | | | 17,500 | | | 852,425 |
| Xcel Energy, Inc. (l) | | | 210,900 | | | 4,760,013 |
| | | | | | |
| | | | | $ | 220,327,635 |
| | | | | | |
Total Common Stocks
(Identified Cost, $400,834,890) | | | | | $ | 475,585,253 |
| | | | | | |
| | |
| BONDS – 0.6% | | | | | | |
| Asset Backed & Securitized – 0.0% | | | | | | |
Falcon Franchise Loan LLC, FRN,
3.085%, 2023 (i)(n) | | $ | 818,168 | | $ | 72,121 |
| | | | | | |
| Utilities – Electric Power – 0.6% | | | | | | |
| AES Corp., 8%, 2017 (z) | | $ | 2,800,000 | | $ | 2,863,000 |
| TXU Eastern Funding Co., 6.75%, 2009 (d) | | | 191,000 | | | 12,415 |
| | | | | | |
| | | | | $ | 2,875,415 |
| | | | | | |
Total Bonds
(Identified Cost, $3,026,011) | | | | | $ | 2,947,536 |
| | | | | | |
| |
| CONVERTIBLE PREFERRED STOCKS – 2.3% | | | |
| Natural Gas – Pipeline – 0.7% | | | | | | |
| El Paso Corp., 4.99% | | | 2,670 | | $ | 3,753,686 |
| | | | | | |
| Utilities – Electric Power – 1.6% | | | | | | |
| NRG Energy, Inc., 5.75% | | | 21,150 | | $ | 7,946,055 |
| | | | | | |
Total Convertible Preferred Stocks
(Identified Cost, $8,455,281) | | | | | $ | 11,699,741 |
| | | | | | |
| | | | | | | | | | |
| Issuer | | Strike
Price | | First
Exercise | | Shares/Par | | Value ($) |
| WARRANTS – 0.4% | | | | | | | |
| Utilities – Electric Power – 0.4% | | | | | |
| Merrill Lynch International & Co. (RAO Unified Energy System – zero Strike Warrant (1 share for 1 warrant)) (Identified Cost, $2,080,451) (a)(z) | | $ | 0 | | 7/04/2017 | | 1,630,000 | | $ | 2,231,470 |
| | | | | | | | | | |
| | | | | | | |
| CONVERTIBLE BONDS – 0.9% | | | | | | | |
| Energy – Independent – 0.5% | | | | |
| Peabody Energy Corp., 4.75%, 2041 | | $ | 2,000,000 | | $ | 2,535,000 | |
| | | | | | | |
| Telecommunications – Wireless – 0.3% | | | | |
| NII Holding, 3.125%, 2012 | | $ | 1,760,000 | | $ | 1,509,200 | |
| | | | | | | |
| Utilities – Electric Power – 0.1% | | | | |
| Covanta Holding Corp., 1%, 2027 | | $ | 499,000 | | $ | 556,385 | |
| | | | | | | |
Total Convertible Bonds
(Identified Cost, $4,171,230) | | | | | $ | 4,600,585 | |
| | | | | | | |
| |
| FLOATING RATE LOANS (g)(r) – 0.8% | | | | |
| Utilities – Electric Power – 0.8% | | | | |
| TXU Corp. Term Loan B2, 8.4%, 2014 (Identified Cost, $3,937,506) | | $ | 3,947,375 | | $ | 3,872,133 | |
| | | | | | | |
| |
| COLLATERAL FOR SECURITIES LOANED – 8.2% | | | | |
| Navigator Securities Lending Prime Portfolio, at Cost and Net Asset Value | | | 41,848,812 | | $ | 41,848,812 | |
| | | | | | | |
Total Investments
(Identified Cost, $464,354,181) (k) | | | | | $ | 542,785,530 | |
| | | | | | | |
OTHER ASSETS, LESS
LIABILITIES – (6.9)% | | | | | | (35,000,053 | ) |
| | | | | | | |
| Net Assets – 100.0% | | | | | $ | 507,785,477 | |
| | | | | | | |
Forward Foreign Currency Exchange Contracts at 12/31/07
Appreciation and Depreciation in the table below are reported by currency.
| | | | | | | | | | | | | | | | | | |
| Type | | Currency | | Contracts to
Deliver/Receive | | Settlement Date
Range | | In Exchange For | | Contracts at
Value | | Net Unrealized
Appreciation
(Depreciation) | |
| Appreciation | | | | | | | | | | | | | | | | |
| BUY | | EUR | | 1,025,968 | | 1/16/08-2/13/08 | | $ | 1,478,740 | | $ | 1,500,840 | | $ | 22,100 | |
| SELL | | EUR | | 25,714,229 | | 1/16/08-2/13/08 | | | 37,724,191 | | | 37,608,581 | | | 115,610 | |
| SELL | | GBP | | 6,783,724 | | 2/05/08-2/14/08 | | | 13,642,361 | | | 13,486,898 | | | 155,463 | |
| | | | | | | | | | | | | | | | $ | 293,173 | |
| | | | | | |
| Depreciation | | | | | | | | | | | | | | | | |
| BUY | | EUR | | 507,195 | | 2/05/08-2/13/08 | | $ | 746,397 | | $ | 741,993 | | $ | (4,404 | ) |
| SELL | | EUR | | 3,303,220 | | 1/16/08-2/13/08 | | | 4,766,467 | | | 4,832,552 | | | (66,085 | ) |
| BUY | | GBP | | 1,491,601 | | 2/05/08-2/14/08 | | | 3,039,546 | | | 2,965,559 | | | (73,987 | ) |
| | | | | | | | | | | | | | | | $ | (144,476 | ) |
At December 31, 2007, the fund had sufficient cash and/or securities to cover any commitments under these derivative contracts.
7
Portfolio of Investments – continued
| (a) | Non-income producing security. |
| (d) | Non-income producing security – in default. |
| (g) | The rate shown represents a weighted average coupon rate on settled positions at period end. |
| (i) | Interest only security for which the fund receives interest on notional principal (Par amount). Par amount shown is the notional principal and does not reflect the cost of the security. |
| (k) | As of December 31, 2007, the fund held securities fair valued in accordance with the policies adopted by the Board of Trustees, aggregating $27,218,822 and 5.01% of market value. An independent pricing service provided an evaluated bid for 3.53% of the market value. |
| (l) | All or a portion of this security is on loan. |
| (n) | Securities exempt from registration under Rule 144A of the Securities Act of 1933. These securities may be sold in the ordinary course of business in transactions exempt from registration, normally to qualified institutional buyers. At period end, the aggregate value of these securities was $72,121, representing less than 0.1% of net assets. |
| (r) | Remaining maturities of floating rate loans may be less than stated maturities shown as a result of contractual or optional prepayments by the borrower. Such prepayments cannot be predicted with certainty. These loans may be subject to restrictions on resale. Floating rate loans generally have rates of interest which are determined periodically by reference to a base lending rate plus a premium. |
| (z) | Restricted securities are not registered under the Securities Act of 1933 and are subject to legal restrictions on resale. These securities generally may be resold in transactions exempt from registration or to the public if the securities are subsequently registered. Disposal of these securities may involve time-consuming negotiations and prompt sale at an acceptable price may be difficult. The fund holds the following restricted securities: |
| | | | | | |
| Restricted Securities | | Acquisition
Date | | Acquisition
Cost | | Current
Market Value |
| AES Corp., 8%, 2017 | | 10/09/2007 | | $2,800,000 | | $2,863,000 |
| Hrvatske Telekomunikacije dd, GDR | | 10/02/2007 | | 377,330 | | 503,010 |
| Merrill Lynch International & Co. (Covered Call – RAO Unified Energy System) | | 8/21/2007 | | 2,080,451 | | 2,231,470 |
| Total Restricted Securities | | | | | | $5,597,480 |
| % of Net Assets | | | | | | 1.1% |
The following abbreviations are used in this report and are defined:
| ADR | American Depository Receipt |
| FRN | Floating Rate Note. Interest rate resets periodically and may not be the rate reported at period end. |
| GDR | Global Depository Receipt |
| IEU | International Equity Unit |
| IPS | International Preference Stock |
Abbreviations indicate amounts shown in currencies other than the U.S. dollar. All amounts are stated in U.S. dollars unless otherwise indicated. A list of abbreviations is shown below:
See Notes to Financial Statements
8
FINANCIAL STATEMENTS | STATEMENT OF ASSETS AND LIABILITIES
This statement represents your fund’s’ balance sheet, which details the assets and liabilities comprising the total value of the fund.
| | | | |
| At 12/31/07 | | | | |
| Assets | | | | |
| Investments, at value, including $43,995,044 of securities on loan (identified cost, $464,354,181) | | $542,785,530 | | |
| Foreign currency, at value (identified cost, $10,617) | | 10,558 | | |
| Receivable for forward foreign currency exchange contracts | | 293,173 | | |
| Receivable for investments sold | | 8,740,707 | | |
| Receivable for fund shares sold | | 416,390 | | |
| Interest and dividends receivable | | 903,663 | | |
| Other assets | | 17,091 | | |
| Total assets | | | | $553,167,112 |
| Liabilities | | | | |
| Payable to custodian | | $448,157 | | |
| Payable for forward foreign currency exchange contracts | | 144,476 | | |
| Payable for investments purchased | | 2,333,409 | | |
| Payable for fund shares reacquired | | 418,860 | | |
| Collateral for securities loaned, at value (c) | | 41,848,812 | | |
| Payable to affiliates | | | | |
Management fee | | 40,182 | | |
Distribution fees | | 3,458 | | |
Administrative services fee | | 1,319 | | |
| Payable for independent trustees’ compensation | | 1,100 | | |
| Accrued expenses and other liabilities | | 141,862 | | |
| Total liabilities | | | | $45,381,635 |
| Net assets | | | | $507,785,477 |
| Net assets consist of | | | | |
| Paid-in capital | | $351,909,655 | | |
Unrealized appreciation (depreciation) on investments and translation of assets and liabilities in foreign currencies
(net of $18,316 deferred country tax) | | 78,561,546 | | |
| Accumulated net realized gain (loss) on investments and foreign currency transactions | | 70,161,512 | | |
| Undistributed net investment income | | 7,152,764 | | |
| Net assets | | | | $507,785,477 |
| Shares of beneficial interest outstanding | | | | 17,240,265 |
| Initial Class shares | | | | |
Net assets | | $381,497,531 | | |
Shares outstanding | | 12,926,788 | | |
Net asset value per share | | | | $29.51 |
| Service Class shares | | | | |
Net assets | | $126,287,946 | | |
Shares outstanding | | 4,313,477 | | |
Net asset value per share | | | | $29.28 |
| (c) | Non-cash collateral not included |
See Notes to Financial Statements
9
FINANCIAL STATEMENTS | STATEMENT OF OPERATIONS
This statement describes how much your fund earned in investment income and accrued in expenses. It also describes any gains and/or losses generated by fund operations.
| | | | | | |
| Year ended 12/31/07 | | | | | | |
| Net investment income | | | | | | |
| Income | | | | | | |
Dividends | | $14,522,155 | | | | |
Interest | | 984,330 | | | | |
Foreign taxes withheld | | (546,895 | ) | | | |
| Total investment income | | | | | $14,959,590 | |
| Expenses | | | | | | |
Management fee | | $3,570,515 | | | | |
Distribution fees | | 257,527 | | | | |
Administrative services fee | | 129,495 | | | | |
Independent trustees’ compensation | | 42,744 | | | | |
Custodian fee | | 282,954 | | | | |
Shareholder communications | | 20,633 | | | | |
Auditing fees | | 43,726 | | | | |
Legal fees | | 7,823 | | | | |
Miscellaneous | | 44,478 | | | | |
| Total expenses | | | | | $4,399,895 | |
Fees paid indirectly | | (4,919 | ) | | | |
| Net expenses | | | | | $4,394,976 | |
| Net investment income | | | | | $10,564,614 | |
| Realized and unrealized gain (loss) on investments and foreign currency transactions | | | | | | |
| Realized gain (loss) (identified cost basis) | | | | | | |
Investment transactions | | $118,936,274 | | | | |
Foreign currency transactions | | (3,464,537 | ) | | | |
| Net realized gain (loss) on investments and foreign currency transactions | | | | | $115,471,737 | |
| Change in unrealized appreciation (depreciation) | | | | | | |
Investments (net of $18,316 in deferred country tax) | | $(3,867,955 | ) | | | |
Translation of assets and liabilities in foreign currencies | | 253,129 | | | | |
| Net unrealized gain (loss) on investments and foreign currency translation | | | | | $(3,614,826 | ) |
| Net realized and unrealized gain (loss) on investments and foreign currency | | | | | $111,856,911 | |
| Change in net assets from operations | | | | | $122,421,525 | |
See Notes to Financial Statements
10
FINANCIAL STATEMENTS | STATEMENTS OF CHANGES IN NET ASSETS
These statements describe the increases and/or decreases in net assets resulting from operations, any distributions, and any shareholder transactions.
| | | | | | |
For years ended 12/31 | | 2007 | | | 2006 | |
| Change in net assets | | | | | | |
| From operations | | | | | | |
| Net investment income | | $10,564,614 | | | $9,686,057 | |
| Net realized gain (loss) on investments and foreign currency transactions | | 115,471,737 | | | 67,789,791 | |
| Net unrealized gain (loss) on investments and foreign currency translation | | (3,614,826 | ) | | 39,098,546 | |
| Change in net assets from operations | | $122,421,525 | | | $116,574,394 | |
| Distributions declared to shareholders | | | | | | |
| From net investment income | | | | | | |
Initial Class | | $(5,212,212 | ) | | $(10,415,468 | ) |
Service class | | (1,129,740 | ) | | (1,570,947 | ) |
| Total distributions declared to shareholders | | $(6,341,952 | ) | | $(11,986,415 | ) |
| Change in net assets from fund share transactions | | $(64,307,493 | ) | | $(40,531,588 | ) |
| Total change in net assets | | $51,772,080 | | | $64,056,391 | |
| Net assets | | | | | | |
| At beginning of period | | 456,013,397 | | | 391,957,006 | |
At end of period (including undistributed net investment income of $7,152,764
and $6,377,530) | | | | | | |
| | $507,785,477 | | | $456,013,397 | |
See Notes to Financial Statements
11
FINANCIAL STATEMENTS | FINANCIAL HIGHLIGHTS
The financial highlights table is intended to help you understand the fund’s financial performance for the past 5 years. Certain information reflects financial results for a single fund share. The total returns in the table represent the rate by which an investor would have earned (or lost) on an investment in the fund share class (assuming reinvestment of all distributions) held for the entire period.
Initial Class
| | | | | | | | | | | | | | | |
| | | Years ended 12/31 | |
| | | 2007 | | | 2006 | | | 2005 | | | 2004 | | | 2003 | |
| Net asset value, beginning of period | | $23.25 | | | $18.11 | | | $15.61 | | | $12.23 | | | $9.28 | |
| Income (loss) from investment operations | | | | | | | | | | | | | | | |
| Net investment income (d) | | $0.58 | | | $0.48 | | | $0.31 | | | $0.30 | | | $0.24 | |
Net realized and unrealized gain (loss) on investments
and foreign currency | | 6.02 | | | 5.25 | | | 2.35 | | | 3.34 | | | 3.05 | |
| Total from investment operations | | $6.60 | | | $5.73 | | | $2.66 | | | $3.64 | | | $3.29 | |
| Less distributions declared to shareholders | | | | | | | | | | | | | | | |
| From net investment income | | $(0.34 | ) | | $(0.59 | ) | | $(0.16 | ) | | $(0.26 | ) | | $(0.34 | ) |
| Net asset value, end of period | | $29.51 | | | $23.25 | | | $18.11 | | | $15.61 | | | $12.23 | |
| Total return (%) (k)(s) | | 28.53 | | | 32.35 | | | 17.23 | | | 30.37 | (b)(v) | | 36.26 | |
Ratios (%) (to average net assets)
and Supplemental data: | | | | | | | | | | | | | | | |
| Expenses (f) | | 0.84 | | | 0.84 | | | 0.86 | | | 0.84 | | | 0.84 | |
| Net investment income | | 2.18 | | | 2.41 | | | 1.87 | | | 2.25 | | | 2.28 | |
| Portfolio turnover | | 90 | | | 93 | | | 96 | | | 103 | | | 134 | |
| Net assets at end of period (000 Omitted) | | $381,498 | | | $377,354 | | | $344,717 | | | $328,541 | | | $287,648 | |
See Notes to Financial Statements
12
Financial Highlights – continued
Service Class
| | | | | | | | | | | | | | | |
| | | Years ended 12/31 | |
| | | 2007 | | | 2006 | | | 2005 | | | 2004 | | | 2003 | |
| Net asset value, beginning of period | | $23.09 | | | $18.01 | | | $15.53 | | | $12.18 | | | $9.24 | |
| Income (loss) from investment operations | | | | | | | | | | | | | | | |
| Net investment income (d) | | $0.52 | | | $0.42 | | | $0.27 | | | $0.26 | | | $0.20 | |
Net realized and unrealized gain (loss) on investments
and foreign currency | | 5.97 | | | 5.22 | | | 2.35 | | | 3.32 | | | 3.06 | |
| Total from investment operations | | $6.49 | | | $5.64 | | | $2.62 | | | $3.58 | | | $3.26 | |
| Less distributions declared to shareholders | | | | | | | | | | | | | | | |
| From net investment income | | $(0.30 | ) | | $(0.56 | ) | | $(0.14 | ) | | $(0.23 | ) | | $(0.32 | ) |
| Net asset value, end of period | | $29.28 | | | $23.09 | | | $18.01 | | | $15.53 | | | $12.18 | |
| Total return (%) (k)(s) | | 28.24 | | | 31.96 | | | 16.97 | | �� | 30.01 | (b)(v) | | 36.03 | |
Ratios (%) (to average net assets)
and Supplemental data: | | | | | | | | | | | | | | | |
| Expenses (f) | | 1.08 | | | 1.09 | | | 1.11 | | | 1.09 | | | 1.09 | |
| Net investment income | | 1.93 | | | 2.12 | | | 1.62 | | | 2.01 | | | 1.95 | |
| Portfolio turnover | | 90 | | | 93 | | | 96 | | | 103 | | | 134 | |
| Net assets at end of period (000 Omitted) | | $126,288 | | | $78,660 | | | $47,240 | | | $32,599 | | | $22,555 | |
| (b) | The fund’s net asset value and total return calculation include a non-recurring accrual recorded as a result of an administrative proceeding regarding disclosure of brokerage allocation practices in connection with fund sales. The non-recurring accrual did not have a material impact on the net asset value per share based on the shares outstanding on the day the proceeds were recorded. |
| (d) | Per share data are based on average shares outstanding. |
| (f) | Ratios do not reflect reductions from fees paid indirectly, if applicable. |
| (k) | The total return does not reflect expenses that apply to separate accounts. Inclusion of these charges would reduce the total return figures for all periods shown. |
| (s) | From time to time the fund may receive proceeds from litigation settlements, without which performance would be lower. |
| (v) | The fund’s total return calculation includes a net increase from gains realized on the disposal of investments in violation of the fund’s investment restrictions. The gains resulted in an increase in net asset value of $0.00278 per share based on shares outstanding on the day the gains were realized. Excluding the offset of these gains from the fund’s ending net asset value per share, the total returns for the year ended December 31, 2004 would have been approximately 30.35% and 29.99% for the Initial Class and the Service Class shares, respectively. |
See Notes to Financial Statements
13
NOTES TO FINANCIAL STATEMENTS
| (1) | | Business and Organization |
MFS Utilities Portfolio (formerly Utilities Series) (the fund) is a series of MFS Variable Insurance Trust II (formerly known as MFS/Sun Life Series Trust) (the trust). The trust is organized as a Massachusetts business trust and is registered under the Investment Company Act of 1940, as amended, as an open-end management investment company. The shares of the fund are sold to variable accounts established by insurance companies to fund benefits under variable contracts issued by such companies and qualified retirement and pension plans.
| (2) | | Significant Accounting Policies |
General – The preparation of financial statements in conformity with U.S. generally accepted accounting principles requires management to make estimates and assumptions that affect the reported amounts of assets and liabilities, and disclosure of contingent assets and liabilities at the date of the financial statements and the reported amounts of revenues and expenses during the reporting period. Actual results could differ from those estimates. The fund can invest in foreign securities, including securities of emerging market issuers. Investments in foreign securities are vulnerable to the effects of changes in the relative values of the local currency and the U.S. dollar and to the effects of changes in each country’s legal, political, and economic environment. The markets of emerging markets countries are generally more volatile than the markets of developed countries with more mature economies. All of the risks of investing in foreign securities previously described are heightened when investing in emerging markets countries.
Investment Valuations – Equity securities, including restricted equity securities, are generally valued at the last sale or official closing price as reported by an independent pricing service on the market or exchange on which they are primarily traded. For securities for which there were no sales reported that day, equity securities are generally valued at the last quoted daily bid quotation as reported by an independent pricing service on the market or exchange on which they are primarily traded. For securities held short for which there were no sales reported for the day, the position is generally valued at the last quoted daily ask quotation as reported by an independent pricing service on the market or exchange on which such securities are primarily traded. Debt instruments (other than short-term instruments), including restricted debt instruments, are generally valued at an evaluated or composite bid as reported by an independent pricing service. Short-term instruments with a maturity at issuance of 60 days or less may be valued at amortized cost, which approximates market value. Forward foreign currency contracts are generally valued at the mean of bid and asked prices for the time period interpolated from rates reported by an independent pricing service for proximate time periods. Open-end investment companies are generally valued at their net asset value per share. Securities and other assets generally valued on the basis of information from an independent pricing service may also be valued at a broker-dealer bid quotation. Values obtained from pricing services can utilize both dealer-supplied valuations and electronic data processing techniques, which take into account factors such as institutional-size trading in similar groups of securities, yield, quality, coupon rate, maturity, type of issue, trading characteristics, and other market data. The values of foreign securities and other assets and liabilities expressed in foreign currencies are converted to U.S. dollars using the mean of bid and asked prices for rates reported by an independent pricing service.
The Board of Trustees has delegated primary responsibility for determining or causing to be determined the value of the fund’s investments (including any fair valuation) to the adviser pursuant to valuation policies and procedures approved by the Board. If the adviser determines that reliable market quotations are not readily available, investments are valued at fair value as determined in good faith by the adviser in accordance with such procedures under the oversight of the Board of Trustees. Under the fund’s valuation policies and procedures, market quotations are not considered to be readily available for many types of debt instruments and certain types of derivatives. These investments are generally valued at fair value based on information from independent pricing services. In addition, investments may be valued at fair value if the adviser determines that an investment’s value has been materially affected by events occurring after the close of the exchange or market on which the investment is principally traded (such as foreign exchange or market) and prior to the determination of the fund’s net asset value, or after the halting of trading of a specific security where trading does not resume prior to the close of the exchange or market on which the security is principally traded. Events that occur on a frequent basis after foreign markets close (such as developments in foreign markets and significant movements in the U.S. markets) and prior to the determination of the fund’s net asset value may be deemed to have a material affect on the value of securities traded in foreign markets. Accordingly, the fund’s foreign equity securities may often be valued at fair value. The adviser may rely on independent pricing services or other information (such as the correlation with price movements of similar securities in the same or other markets; the type, cost and investment characteristics of the security; the business and financial condition of the issuer; and trading and other market data) to assist in determining whether to fair value and at what value to fair value an investment. The value of an investment for purposes of calculating the fund’s net asset value can differ depending on the source and method used to determine value. When fair valuation is used, the value of investments used to determine the fund’s net asset value may differ from quoted or published prices for the same investments.
In September 2006, FASB Statement No. 157, Fair Value Measurements (the “Statement”) was issued, and is effective for fiscal years beginning after November 15, 2007 and for all interim periods within those fiscal years. This Statement provides a single
14
Notes to Financial Statements – continued
definition of fair value, a hierarchy for measuring fair value and expanded disclosures about fair value measurements. Management is evaluating the application of the Statement to the fund, and believes the impact will be limited to expanded disclosures resulting from the adoption of this Statement in the fund’s financial statements.
Repurchase Agreements – The fund may enter into repurchase agreements with institutions that the fund’s investment adviser has determined are creditworthy. Each repurchase agreement is recorded at cost. The fund requires that the securities collateral in a repurchase transaction be transferred to the custodian in a manner sufficient to enable the fund to obtain those securities in the event of a default under the repurchase agreement. The fund monitors, on a daily basis, the value of the collateral to ensure that its value, including accrued interest, is greater than amounts owed to the fund under each such repurchase agreement. The fund and other funds managed by Massachusetts Financial Services Company (MFS), may utilize a joint trading account for the purpose of entering into one or more repurchase agreements.
Foreign Currency Translation – Purchases and sales of foreign investments, income, and expenses are converted into U.S. dollars based upon currency exchange rates prevailing on the respective dates of such transactions. Gains and losses attributable to foreign currency exchange rates on sales of securities are recorded for financial statement purposes as net realized gains and losses on investments. Gains and losses attributable to foreign exchange rate movements on income and expenses are recorded for financial statement purposes as foreign currency transaction gains and losses. That portion of both realized and unrealized gains and losses on investments that results from fluctuations in foreign currency exchange rates is not separately disclosed.
Derivative Risk – The fund may invest in derivatives for hedging or non-hedging purposes. While hedging can reduce or eliminate losses, it can also reduce or eliminate gains. When the fund uses derivatives as an investment to gain market exposure, or for hedging purposes, gains and losses from derivative instruments may be substantially greater than the derivative’s original cost. Derivative instruments include forward foreign currency exchange contracts.
Forward Foreign Currency Exchange Contracts – The fund may enter into forward foreign currency exchange contracts for the purchase or sale of a specific foreign currency at a fixed price on a future date. Risks may arise upon entering into these contracts from the potential inability of counterparties to meet the terms of their contracts and from unanticipated movements in the value of the contract. The fund may enter into forward foreign currency exchange contracts for hedging purposes as well as for non-hedging purposes. For hedging purposes, the fund may enter into contracts to deliver or receive foreign currency it will receive from or require for its normal investment activities. The fund may also use contracts in a manner intended to protect foreign currency denominated securities from declines in value due to unfavorable exchange rate movements. For non-hedging purposes, the fund may enter into contracts with the intent of changing the relative exposure of the fund’s portfolio of securities to different currencies to take advantage of anticipated changes. The forward foreign currency exchange contracts are adjusted by the daily exchange rate of the underlying currency and any gains or losses are recorded as unrealized until the contract settlement date. On contract settlement date, the gains or losses are recorded as realized gains or losses on foreign currency transactions.
Security Loans – State Street Bank and Trust Company (“State Street”), as lending agent, may loan the securities of the fund to certain qualified institutions (the “Borrowers”) approved by the fund. The loans are collateralized at all times by cash and/or U.S. Treasury securities in an amount at least equal to the market value of the securities loaned. State Street provides the fund with indemnification against Borrower default. The fund bears the risk of loss with respect to the investment of cash collateral. On loans collateralized by cash, the cash collateral is invested in a money market fund or short-term securities. A portion of the income generated upon investment of the collateral is remitted to the Borrowers, and the remainder is allocated between the fund and the lending agent. On loans collateralized by U.S. Treasury securities, a fee is received from the Borrower, and is allocated between the fund and the lending agent. Net income from securities lending is included in interest income on the Statement of Operations. The dividend and interest income earned on the securities loaned is accounted for in the same manner as other dividend and interest income.
At December 31, 2007, the value of securities loaned was $43,995,044. These loans were collateralized by cash of $41,848,812 and U.S. Treasury obligations of $3,289,001.
Loans and Other Direct Debt Instruments – The fund may invest in loans and loan participations or other receivables. These investments may include standby financing commitments, including revolving credit facilities, which obligate the fund to supply additional cash to the borrower on demand. Loan participations involve a risk of insolvency of the lending bank or other financial intermediary.
Indemnifications – Under the fund’s organizational documents, its officers and trustees may be indemnified against certain liabilities and expenses arising out of the performance of their duties to the fund. Additionally, in the normal course of business, the fund enters into agreements with service providers that may contain indemnification clauses. The fund’s maximum exposure under these agreements is unknown as this would involve future claims that may be made against the fund that have not yet occurred.
15
Notes to Financial Statements – continued
Investment Transactions and Income – Investment transactions are recorded on the trade date. Interest income is recorded on the accrual basis. All premium and discount is amortized or accreted for financial statement purposes in accordance with U.S. generally accepted accounting principles. All discount is accreted for tax reporting purposes as required by federal income tax regulations. The fund earns certain fees in connection with its floating rate loan purchasing activities. These fees are in addition to interest payments earned and may include amendment fees, commitment fees, facility fees, consent fees, and prepayment fees. Commitment fees are recorded on an accrual basis as income in the accompanying financial statements. Dividends received in cash are recorded on the ex-dividend date. Certain dividends from foreign securities will be recorded when the fund is informed of the dividend if such information is obtained subsequent to the ex-dividend date. Dividend and interest payments received in additional securities are recorded on the ex-dividend or ex-interest date in an amount equal to the value of the security on such date.
The fund may receive proceeds from litigation settlements. Any proceeds received from litigation involving portfolio holdings are reflected in the Statement of Operations in realized gain/loss if the security has been disposed of by the fund or in unrealized gain/loss if the security is still held by the fund. Any other proceeds from litigation not related to portfolio holdings are reflected as other income in the Statement of Operations.
Fees Paid Indirectly – The fund’s custody fee may be reduced according to an arrangement that measures the value of cash deposited with the custodian by the fund. This amount, for the year ended December 31, 2007, is shown as a reduction of total expenses on the Statement of Operations.
Tax Matters and Distributions – The fund intends to qualify as a regulated investment company, as defined under Subchapter M of the Internal Revenue Code, and to distribute all of its taxable income, including realized capital gains. As a result, no provision for federal income taxes is required. The fund adopted the provisions of FASB Interpretation No. 48, Accounting for Uncertainty in Income Taxes (“the Interpretation”) on January 1, 2007. The Interpretation prescribes a minimum threshold for financial statement recognition of the benefit of a tax position taken or expected to be taken in a tax return. There was no impact resulting from the adoption of this Interpretation on the fund’s financial statements. Each of the fund’s federal tax returns for the prior three fiscal years remains subject to examination by the Internal Revenue Service. It is the fund’s policy to record interest and penalty charges on underpaid taxes associated with its tax positions as interest expense and other expense, respectively. No such charges were recorded in the current financial statements. Foreign taxes, if any, have been accrued by the fund in the accompanying financial statements.
Distributions to shareholders are recorded on the ex-dividend date. Income and capital gain distributions are determined in accordance with income tax regulations, which may differ from U.S. generally accepted accounting principles. Certain capital accounts in the financial statements are periodically adjusted for permanent differences in order to reflect their tax character. These adjustments have no impact on net assets or net asset value per share. Temporary differences which arise from recognizing certain items of income, expense, gain or loss in different periods for financial statement and tax purposes will reverse at some time in the future. Distributions in excess of net investment income or net realized gains are temporary overdistributions for financial statement purposes resulting from differences in the recognition or classification of income or distributions for financial statement and tax purposes.
Book/tax differences primarily relate to amortization and accretion of debt securities, wash sale loss deferrals, foreign currency transactions, and derivative transactions.
The tax character of distributions declared to shareholders is as follows:
| | | | |
| | | 12/31/07 | | 12/31/06 |
| Ordinary income (including any short-term capital gains) | | $6,341,952 | | $11,986,415 |
The federal tax cost and the tax basis components of distributable earnings were as follows:
| | | |
| As of 12/31/07 | | | |
| Cost of investments | | $464,402,926 | |
| Gross appreciation | | 89,728,704 | |
| Gross depreciation | | (11,346,100 | ) |
| Net unrealized appreciation (depreciation) | | $78,382,604 | |
| Undistributed ordinary income | | 7,374,019 | |
| Undistributed long-term capital gain | | 70,210,257 | |
| Other temporary differences | | (91,058 | ) |
Multiple Classes of Shares of Beneficial Interest – The fund offers multiple classes of shares, which differ in their respective distribution fees. All shareholders bear the common expenses of the fund based on daily net assets of each class, without distinction between share classes. Dividends are declared separately for each class. Differences in per share dividend rates are generally due to differences in separate class expenses.
16
Notes to Financial Statements – continued
| (3) | | Transactions with Affiliates |
Investment Adviser – The fund has an investment advisory agreement with MFS to provide overall investment management and related administrative services and facilities to the fund.
The management fee is computed daily and paid monthly at the following annual rates:
| | |
| First $300 million of average daily net assets | | 0.75% |
| Average daily net assets in excess of $300 million | | 0.675% |
The management fee incurred for the year ended December 31, 2007 was equivalent to an annual effective rate of 0.72% of the fund’s average daily net assets.
Distributor – MFS Fund Distributors, Inc. (MFD), a wholly-owned subsidiary of MFS, is the distributor of shares of the fund. The Trustees have adopted a distribution plan for the Service Class shares pursuant to Rule 12b-1 under the Investment Company Act of 1940.
The fund’s distribution plan provides that the fund will pay MFD distribution fees equal to 0.25% per annum of its average daily net assets attributable to Service Class shares as partial consideration for services performed and expenses incurred by MFD and financial intermediaries in connection with the sale and distribution of the fund’s Service Class shares and the sale and distribution of the variable annuity or variable life insurance contracts investing indirectly in Service Class shares. MFD may subsequently pay all, or a portion, of the distribution fees to financial intermediaries.
Shareholder Servicing Agent – MFS Service Center, Inc. (MFSC), a wholly-owned subsidiary of MFS, has contracted to provide transfer agent and recordkeeping functions in connection with the issuance, transfer, and redemption of each class of shares of the fund under a Shareholder Servicing Agent Agreement. During the year ended December 31, 2007, MFSC did not receive a fee for this service.
Administrator – MFS provides certain financial, legal, shareholder communications, compliance, and other administrative services to the fund. Under an administrative services agreement, the fund partially reimburses MFS the costs incurred to provide these services. The fund is charged an annual fixed amount of $10,000 plus a fee based on average daily net assets.
The administrative services fee incurred for the year ended December 31, 2007 was equivalent to an annual effective rate of 0.0261% of the fund’s average daily net assets.
Trustees’ and Officers’ Compensation – The fund pays compensation to trustees in the form of a retainer, attendance fees, and additional compensation to the Board chairperson. The fund does not pay compensation directly to officers of the fund who are also officers of the investment adviser, all of whom receive remuneration for their services to the fund from MFS. Certain officers of the fund are officers or directors of MFS, MFD, and MFSC.
Other – The fund and certain other MFS funds (the funds) have entered into a services agreement (the Agreement) which provides for payment of fees by the funds to Tarantino LLC in return for the provision of services of an Independent Chief Compliance Officer (ICCO) for the funds. The ICCO is an officer of the funds and the sole member of Tarantino LLC. The funds can terminate the Agreement with Tarantino LLC at any time under the terms of the Agreement. MFS has agreed to bear all expenses associated with office space, other administrative support, and supplies provided to the ICCO. For the year ended December 31, 2007, the fee paid to Tarantino LLC was $2,461.
Purchases and sales of investments, other than U.S. government securities, purchased option transactions, and short-term obligations, aggregated $441,434,956 and $498,117,657, respectively.
17
Notes to Financial Statements – continued
| (5) | | Shares of Beneficial Interest |
The fund’s Declaration of Trust permits the Trustees to issue an unlimited number of full and fractional shares of beneficial interest. Transactions in fund shares were as follows:
| | | | | | | | | | | | |
| | | Year ended 12/31/07 | | | Year ended 12/31/06 | |
| | | Shares | | | Amount | | | Shares | | | Amount | |
| Shares sold | | | | | | | | | | | | |
Initial Class | | 283,911 | | | $7,603,251 | | | 400,673 | | | $8,128,199 | |
Service Class | | 1,314,137 | | | 35,226,799 | | | 1,107,172 | | | 22,007,063 | |
| | 1,598,048 | | | $42,830,050 | | | 1,507,845 | | | $30,135,262 | |
| Shares issued to shareholders in reinvestment of distributions | | | | | | | | | | | | |
Initial Class | | 193,045 | | | $5,212,212 | | | 545,312 | | | $10,415,468 | |
Service Class | | 42,123 | | | 1,129,740 | | | 82,681 | | | 1,570,947 | |
| | 235,168 | | | $6,341,952 | | | 627,993 | | | $11,986,415 | |
| Shares reacquired | | | | | | | | | | | | |
Initial Class | | (3,782,213 | ) | | $(101,515,803 | ) | | (3,743,545 | ) | | $(74,496,882 | ) |
Service Class | | (449,929 | ) | | (11,963,692 | ) | | (406,360 | ) | | (8,156,383 | ) |
| | (4,232,142 | ) | | $(113,479,495 | ) | | (4,149,905 | ) | | $(82,653,265 | ) |
| Net change | | | | | | | | | | | | |
Initial Class | | (3,305,257 | ) | | $(88,700,340 | ) | | (2,797,560 | ) | | $(55,953,215 | ) |
Service Class | | 906,331 | | | 24,392,847 | | | 783,493 | | | 15,421,627 | |
| | (2,398,926 | ) | | $(64,307,493 | ) | | (2,014,067 | ) | | $(40,531,588 | ) |
The fund and other funds managed by MFS participate in a $1 billion unsecured committed line of credit provided by a syndication of banks under a credit agreement. In addition, the fund and other funds managed by MFS have established uncommitted borrowing arrangements with certain banks. Borrowings may be made for temporary financing needs. Interest is charged to each fund, based on its borrowings, generally at a rate equal to the Federal Reserve funds rate plus 0.30%. In addition, a commitment fee, based on the average daily, unused portion of the committed line of credit, is allocated among the participating funds at the end of each calendar quarter. For the year ended December 31, 2007, the fund’s commitment fee and interest expense were $2,383 and $4,949, respectively, and are included in miscellaneous expense on the Statement of Operations.
18
REPORT OF INDEPENDENT REGISTERED PUBLIC ACCOUNTING FIRM
To the Board of Trustees of MFS Variable Insurance Trust II (formerly known as MFS/Sun Life Series Trust) and the Shareholders of MFS Utilities Portfolio (formerly known as Utilities Series):
We have audited the accompanying statement of assets and liabilities, including the portfolio of investments, of MFS Utilities Portfolio (one of the portfolios comprising MFS Variable Insurance Trust II) (the “Trust”) as of December 31, 2007, and the related statement of operations for the year then ended, the statements of changes in net assets for each of the two years in the period then ended, and the financial highlights for each of the five years in the period then ended. These financial statements and financial highlights are the responsibility of the Trust’s management. Our responsibility is to express an opinion on these financial statements and financial highlights based on our audits.
We conducted our audits in accordance with the standards of the Public Company Accounting Oversight Board (United States). Those standards require that we plan and perform the audit to obtain reasonable assurance about whether the financial statements and financial highlights are free of material misstatement. The Trust is not required to have, nor were we engaged to perform, an audit of its internal control over financial reporting. Our audits included consideration of internal control over financial reporting as a basis for designing audit procedures that are appropriate in the circumstances, but not for the purpose of expressing an opinion on the effectiveness of the Trust’s internal control over financial reporting. Accordingly, we express no such opinion. An audit also includes examining, on a test basis, evidence supporting the amounts and disclosures in the financial statements, assessing the accounting principles used and significant estimates made by management, as well as evaluating the overall financial statement presentation. Our procedures included confirmation of securities owned as of December 31, 2007, by correspondence with the custodian and brokers; where replies were not received from brokers, we performed other auditing procedures. We believe that our audits provide a reasonable basis for our opinion.
In our opinion, such financial statements and financial highlights present fairly, in all material respects, the financial position of MFS Utilities Portfolio as of December 31, 2007, the results of its operations for the year then ended, the changes in its net assets for each of the two years in the period then ended, and its financial highlights for each of the five years in the period then ended, in conformity with accounting principles generally accepted in the United States of America.
DELOITTE & TOUCHE LLP
Boston, Massachusetts
February 15, 2008
19
TRUSTEES AND OFFICERS – IDENTIFICATION AND BACKGROUND
The Trustees and officers of the Trust, as of February 1, 2008, are listed below, together with their principal occupations during the past five years. (Their titles may have varied during that period.) The address of each Trustee and officer is 500 Boylston Street, Boston, Massachusetts 02116.
| | | | | | |
Name, Date of Birth | | Position(s) Held
with Fund | | Trustee/Officer
Since(1) | | Principal Occupations During the Past Five Years &
Other Directorships(2) |
| INTERESTED TRUSTEE | | | | | | |
David D. Horn(3) (born 06/07/41) | | Trustee | | April 1986 | | Private investor; Retired; Sun Life Assurance Company of Canada, Former Senior Vice President and General Manager for the United States (until 1997); Retired: Sun Life Assurance Company of Canada, Director (until March 2004) |
| | |
| INDEPENDENT TRUSTEES | | | | |
J. Kermit Birchfield (born 01/08/40) | | Chairman | | May 1997 | | Consultant; Century Partners, Inc. (investments), Director (1988 to present); Displaytech, Inc. (technology), Director (1995 to present); Dessin Fournir LLC (furniture manufacturer), Director (2005 to present); Intermountain Gas Company, Inc. & Intermountain Industries, Inc. (oil & gas exploration and production) (1988 to present); Site Watch LLC (software to monitor oil tanks) Managing Director (2006 to present); Juridica Investments (fund investing in judicial matters) Director (2007 to present); Dairy Mart Convenience Stores, Inc. (convenience stores), Chairman (1997 to 2003) |
| | | |
Robert C. Bishop (born 01/13/43) | | Trustee | | May 2001 | | Autolmmune Inc. (pharmaceutical product licensing), Chairman, President and Chief Executive Officer (1992 to present); Caliper Life Sciences Corp. (laboratory analytical instruments), Director (2002 to present); Millipore Corporation (biopharmaceutical/research laboratory products), Director (1997 to present); Optobionics Corporation (ophthalmic devices), Director (2002 to 2007); Quintiles Transnational Corp. (contract research services), Director (until 2003) |
| | | |
Frederick H. Dulles (born 03/12/42) | | Trustee | | May 2001 | | Ten State International Law PLLC (law firm), Of Counsel (since 2006); Prudential Carolina Real Estate, (real estate), Broker (since 2006); Free Enterprise Foundation, Inc. (research institute), Director & Secretary (until 2008); Disher, Hamrick & Myers Residential, Inc. (real estate) Broker (until 2006); Frederick H. Dulles law practice (until 2006); Ten State Street LLP (law firm), Member (until 2005); McFadden, Pilkington & Ward LLP (solicitors and registered foreign lawyers), Member & Of Counsel (until 2003) |
| | | |
Marcia A. Kean (born 06/30/48) | | Trustee | | April 2005 | | Feinstein Kean Healthcare (consulting), Chief Executive Officer (since December 2002), Managing Director (prior to May 2001); Ardais Corporation (biotech products), Senior Vice President – Commercialization (February 2002 until November 2002) |
| | | |
Ronald G. Steinhart (born 06/15/40) | | Trustee | | May 2001 | | Private investor; Penske Automotive Group (automotive retailer), Director (2001 to present); Penson Worldwide, Inc. (securities clearance), Director (2006 to present); Animal Health International, Inc. (animal health products), Director (2007 to present); Texas Industries (concrete/aggregates/cement), Director (2007 to present); Carreker Corporation (technology consulting) Director (until 2005); Prentiss Properties Trust (real estate investment trust), Director (until 2006) |
| | | |
Haviland Wright (born 07/21/48) | | Trustee | | May 2001 | | Elixir Technologies Corporation (software) Director (2005 to present); Nano Loa Inc. (liquid crystal displays), Director (2003 to present); Silk Displays, Inc. (smart polymers) Director (2007 to present); Displaytech, Inc. (technology) Chairman and CEO (1995 – 2002) |
| | | |
| TRUSTEE EMERITUS | | | | | | |
Samuel Adams (born 10/19/25) | | Trustee Emeritus | | | | Retired; Kirkpatrick & Lockhart Preston Gates Ellis LLP (law firm), Of Counsel |
| | | |
| OFFICERS | | | | | | |
Maria F. Dwyer(4) (born 12/01/58) | | President | | November 2005 | | Massachusetts Financial Services Company, Executive Vice President and Chief Regulatory Officer (since March 2004); Fidelity Management & Research Company, Vice President (prior to March 2004); Fidelity Group of Funds, President and Treasurer (prior to March 2004) |
| | | |
Tracy Atkinson(4) (born 12/30/64) | | Treasurer | | September 2005 | | Massachusetts Financial Services Company, Senior Vice President (since September 2004); PricewaterhouseCoopers LLP, Partner (prior to September 2004) |
| | | |
Christopher R. Bohane(4) (born 01/18/74) | | Assistant Secretary and Assistant Clerk | | July 2005 | | Massachusetts Financial Services Company, Vice President and Senior Counsel (since April 2003); Kirkpatrick & Lockhart LLP (law firm), Associate (prior to April 2003) |
20
Trustees and Officers – continued
| | | | | | |
Name, Date of Birth | | Position(s) Held
with Fund | | Trustee/Officer
Since(1) | | Principal Occupations During the Past Five Years &
Other Directorships(2) |
| | | |
Ethan D. Corey(4) (born 11/21/63) | | Assistant Secretary and Assistant Clerk | | July 2005 | | Massachusetts Financial Services Company, Senior Vice President and Associate General Counsel (since April 2006); Special Counsel (prior to April 2006); Dechert LLP (law firm), Counsel (prior to December 2004) |
| | | |
David L. DiLorenzo(4) (born 08/10/68) | | Assistant Treasurer | | July 2005 | | Massachusetts Financial Services Company, Vice President (since June 2005); JP Morgan Investor Services, Vice President (January 2001 to June 2005) |
| | | |
Timothy M. Fagan(4) (born 07/10/68) | | Assistant Secretary and Assistant Clerk | | September 2005 | | Massachusetts Financial Services Company, Vice President and Senior Counsel (since September 2005); John Hancock Advisers, LLC, Vice President and Chief Compliance Officer (September 2004 to August 2005) Senior Attorney (prior to September 2004); John Hancock Group of Funds, Vice President and Chief Compliance Officer (September 2004 to December 2004) |
| | | |
Mark D. Fischer(4) (born 10/27/70) | | Assistant Treasurer | | July 2005 | | Massachusetts Financial Services Company, Vice President (since May 2005); JP Morgan Investment Management Company, Vice President (prior to May 2005) |
| | | |
Brian E. Langenfeld(4) (born 03/07/73) | | Assistant Secretary and Assistant Clerk | | May 2006 | | Massachusetts Financial Services Company, Assistant Vice President and Counsel (since May 2006); John Hancock Advisers, LLC, Assistant Vice President and Counsel (May 2005 to April 2006); John Hancock Advisers, LLC, Attorney and Assistant Secretary (prior to May 2005) |
| | | |
Ellen Moynihan(4) (born 11/13/57) | | Assistant Treasurer | | May 1997 | | Massachusetts Financial Services Company, Senior Vice President |
| | | |
Susan S. Newton(4) (born 03/07/50) | | Assistant Secretary and Assistant Clerk | | May 2005 | | Massachusetts Financial Services Company, Senior Vice President and Assistant General Counsel (since April 2005); John Hancock Advisers, LLC, Senior Vice President, Secretary and Chief Legal Officer (prior to April 2005); John Hancock Group of Funds, Senior Vice President, Secretary and Chief Legal Officer (prior to April 2005) |
| | | |
Susan A. Pereira(4) (born 11/05/70) | | Assistant Secretary and Assistant Clerk | | July 2005 | | Massachusetts Financial Services Company, Vice President and Senior Counsel (since June 2004); Bingham McCutchen LLP (law firm), Associate (January 2001 to June 2004) |
| | | |
Mark N. Polebaum(4) (born 05/01/52) | | Secretary and Assistant Clerk | | February 2006 | | Massachusetts Financial Services Company, Executive Vice President, General Counsel and Secretary (since January 2006); Wilmer Cutler Pickering Hale and Dorr LLP (law firm), Partner (prior to January 2006) |
| | | |
Frank L. Tarantino (born 03/07/44) | | Independent Chief Compliance Officer | | September 2004 | | Tarantino LLC (provider of compliance services), Principal (since June 2004); CRA Business Strategies Group (consulting services), Executive Vice President (April 2003 to June 2004); David L. Babson & Co. (investment adviser), Managing Director, Chief Administrative Officer and Director (February 1997 to March 2003) |
| | | |
Richard S. Weitzel(4) (born 7/16/70) | | Assistant Secretary and Assistant Clerk | | October 2007 | | Massachusetts Financial Services Company, Vice President and Assistant General Counsel (since 2007); Vice President and Senior Counsel (since May 2004); Massachusetts Department of Business and Technology, General Counsel (February 2003 to April 2004); Massachusetts Office of the Attorney General, Assistant Attorney General ( April 2001 to February 2003); Ropes and Gray, Associate (prior to April 2001) |
| | | |
James O. Yost(4) (born 06/12/60) | | Assistant Treasurer | | April 1992 | | Massachusetts Financial Services Company, Senior Vice President |
| (1) | Date first appointed to serve as Trustee/Officer of an MFS fund or a Compass variable account. Each Trustee has served continuously since appointment. |
| (2) | Directorships or trusteeships of companies required to report to the Securities and Exchange Commission (i.e., “public companies”). |
| (3) | “Interested person” of the Sun Life of Canada (U.S.), within the meaning of the Investment Company Act of 1940 (referred to as the 1940 Act), which is the principal federal law governing investment companies like the Series. The address of Sun Life of Canada (U.S.) is One Sun Life Executive Park, Wellesley Hills, Massachusetts 02481. |
| (4) | “Interested person” of MFS within the meaning of the 1940 Act. The address of MFS is 500 Boylston Street, Boston, Massachusetts 02116. |
The Trust does not hold annual meetings for the purpose of electing Trustees, and Trustees are not elected for fixed terms. Each Trustee and officer holds office until his or her successor is chosen and qualified, or until his or her earlier death, resignation, retirement or removal.
All Trustees currently serve as Trustees of the Trust and have served in that capacity since originally elected or appointed. All of the Trustees are also Managers of the Compass Variable Accounts. The executive officers of the Trust hold similar offices for the Compass Variable Accounts and other funds in the MFS fund complex. As of January 1, 2008, each Trustee serves as a Trustee or Manager of 35 Accounts/Funds.
21
Trustees and Officers – continued
The Statement of Additional Information contains further information about the Trustees and is available without charge upon request by calling 1-800-225-2606.
| | |
Investment Adviser
Massachusetts Financial Services Company 500 Boylston Street, Boston, MA 02116-3741 | | Custodian State Street Bank and Trust Company 225 Franklin Street, Boston, MA 02110 |
Distributor
MFS Fund Distributors, Inc. 500 Boylston Street, Boston, MA 02116-3741 | | Independent Registered Public Accounting Firm Deloitte & Touche LLP 200 Berkeley Street, Boston, MA 02116 |
Portfolio Managers Robert Persons Maura Shaughnessy | | |
22
BOARD REVIEW OF INVESTMENT ADVISORY AGREEMENT
The Investment Company Act of 1940 requires that both the full Board of Trustees and a majority of the non-interested (“independent”) Trustees, voting separately, annually approve the continuation of the investment advisory agreement between MFS Variable Insurance Trust II (the “Trust”) and Massachusetts Financial Services Company (MFS) on behalf of the Fund. The Trustees consider matters bearing on the Fund and the advisory arrangements at their meetings throughout the year, including a review of performance data at each regular meeting. In addition, the independent Trustees met several times over the course of three months beginning in May and ending in July 2007 (“contract review meetings”) for the specific purpose of considering whether to approve the continuation of the investment advisory agreement for the Fund. The independent Trustees were assisted in their evaluation of the investment advisory agreement by independent legal counsel, from whom they received separate legal advice and with whom they met separately from MFS management during various contract review meetings. The independent Trustees were also assisted in this process by the Fund’s Independent Chief Compliance Officer, a full-time senior officer appointed by and reporting to the independent Trustees.
In connection with their deliberations, the Trustees, including the independent Trustees, considered such information and factors as they believed, in light of the legal advice furnished to them and their own business judgment, to be relevant. The investment advisory agreement was considered separately for the Fund, although the Trustees also took into account the common interests of all Funds in the Trust in their review. As described below, the Trustees considered the nature, quality, and extent of the various investment advisory, administrative, and shareholder services performed by MFS under the existing investment advisory agreement and other arrangements with the Trust.
In connection with their contract review meetings, the Trustees received and relied upon materials which included, among other items: (i) information provided by Lipper Inc. on the investment performance of the Fund for various time periods ended December 31, 2006, compared to the investment performance of a group of funds with substantially similar investment classifications/objectives (the “Lipper performance universe”), as well as the investment performance of a group of funds identified by objective criteria suggested by MFS (“peer funds”), (ii) information provided by Lipper Inc. on the Fund’s advisory fees and other expenses compared to the advisory fees and other expenses of comparable funds identified by Lipper (the “Lipper expense group”), as well as the advisory fees and other expenses of peer funds identified by objective criteria suggested by MFS, (iii) information provided by MFS on the advisory fees of comparable portfolios of its other clients, including institutional separate account and other clients, (iv) information as to whether, and to what extent applicable, expense waivers, reimbursements or fee “breakpoints” are observed for the Fund, (v) information regarding MFS’ financial results and financial condition, including MFS’ and certain of its affiliates’ estimated profitability from services performed for the Fund, (vi) MFS’ views regarding the outlook for the mutual fund industry and its strategic business plans, (vii) descriptions of various functions performed by MFS for the Trust, such as compliance monitoring and portfolio trading practices, and (viii) information regarding the overall organization of MFS, including information about MFS’ senior management and other personnel providing investment advisory, administrative and other services to the Fund. The comparative performance, fee and expense information prepared and provided by Lipper Inc. was not independently verified, and the independent Trustees did not independently verify any information provided to them by MFS.
The Trustees’ conclusion as to the continuation of the investment advisory agreement was based on comprehensive consideration of all information provided to the Trustees and not the result of any single factor. Some of the factors that figured particularly in the Trustees’ deliberations are described below for the Fund, while individual Trustees may have given different weight to various factors and evaluated the information presented as a whole differently than another Trustee. The Trustees recognized that the fee arrangements for the Fund reflect years of review and discussion between the independent Trustees and MFS, that certain aspects of such arrangements may receive greater scrutiny in some years than others, and that the Trustees’ conclusions may be based, in part, on their consideration of these same arrangements during the course of the year and in prior years.
Based on information provided by Lipper Inc. and MFS, the Trustees compared the Fund’s total return investment performance to the performance of a peer group of funds over various time periods. The Trustees placed particular emphasis on the total return performance of the Fund’s Initial Class shares in comparison to the performance of funds in its Lipper performance universe over the one-, three- and five-year periods. The Trustees did not rely on performance results for more recent periods, including those shown elsewhere in this report.
The Trustees noted the performance of the Fund’s Initial Class shares was in the 1st quintile relative to the other funds in the Lipper Classification Index for the one-year period (the 1st quintile being the best performers and the 5th quintile being the worst performers). The total return performance of the Fund was also in the 1st quintile for both the three-year period and the five-year period ended December 31, 2006, relative to the Lipper performance universe. Based on the nature and quality of services provided by MFS, the Board of Trustees concluded that the Fund’s performance was satisfactory.
23
Board Review of Investment Advisory Agreement – continued
In the course of their deliberations, the Trustees took into account information provided by MFS during contract review meetings, as well as during investment review meetings conducted with portfolio management personnel during the course of the year.
In assessing the reasonableness of the Fund’s advisory fee, the Trustees considered, among other information, the Fund’s advisory fee and the total expense ratio of the Fund’s Initial Class shares as a percentage of average daily net assets, compared to the advisory fee and total expense ratios of its peer group of funds based on information provided by Lipper Inc. and MFS. The Trustees also considered the advisory fees charged by MFS to institutional accounts. In comparing these fees, the Trustees considered the generally broader scope of services provided by MFS to the Trust than those provided to institutional accounts. The Trustees also considered the higher demands placed on MFS’ investment personnel and trading infrastructure as a result of the daily cash in-flows and out-flows of the Fund, and the impact on MFS and related expenses due to the more extensive regulatory regime to which the Fund is subject, compared to institutional accounts.
In considering the fees, the Trustees noted from the Lipper data that the Fund’s effective advisory fee rate was above the median and total expense ratio was approximately at the median of such fees and expenses of funds in the Lipper expense group. The Trustees further concluded that the existing breakpoints were sufficient to allow the Fund to benefit from economies of scale as its assets grow.
The Trustees also considered information prepared by MFS relating to its costs and profits with respect to the Fund and other investment companies and accounts advised by MFS, as well as MFS’ methodologies used to determine and allocate its costs to the Fund and other accounts and products for purposes of estimating profitability.
After reviewing these and other factors described below, the Trustees concluded that the advisory fee charged to the Fund represents reasonable compensation in light of the nature and quality of the services being provided by MFS.
In addition, the Trustees considered MFS’ resources and related efforts to continue to retain, attract and motivate capable personnel to serve the Fund. The Trustees also considered the financial resources of MFS and its parent, Sun Life Financial Inc. The Trustees further considered any advantages and possible disadvantages of having an adviser which also serves other investment companies as well as institutional accounts.
The Trustees also considered the nature, quality, cost, and extent of administrative, transfer agency, and distribution services provided to the Fund by MFS and its affiliates under agreements and plans other than the investment advisory agreement, including the 12b-1 fees the Fund pays to MFS Fund Distributors, Inc., an affiliate of MFS. The Trustees also considered the nature, extent and quality of certain other services MFS performs or arranges on the Fund’s behalf, which may include securities lending programs, directed expense payment programs, class action recovery programs, and MFS’ interaction with third-party service providers, principally custodians and sub-custodians. The Trustees concluded that the various non-advisory services provided by MFS and its affiliates on behalf of the Fund were satisfactory. The Trustees also considered the benefits to MFS from the use of the Fund’s portfolio brokerage commissions to pay for research and other similar services (including MFS’ policy not to use “soft dollars” generated by Fund portfolio transactions to pay for third-party research), and various other factors. Additionally, the Trustees considered so-called “fall-out benefits” to MFS such as reputational value derived from serving as investment manager to the Trust, and determined that any such benefits derived by MFS were reasonable and fair.
Based on their evaluation of factors that they deemed to be material, including those factors described above, the Board of Trustees, including a majority of the independent Trustees, concluded that the investment advisory agreement should be continued for an additional one-year period, commencing September 1, 2007.
A discussion regarding the Board’s most recent review and renewal of the Fund’s investment advisory agreement is available by clicking on the Fund’s name under ‘‘Variable Insurance Portfolios’’ on the “Products & Performance” page on the MFS Web site (mfs.com).
24
PROXY VOTING POLICIES AND INFORMATION
A general description of the MFS funds’ proxy voting policies and procedures is available without charge, upon request, by calling 1-800-225-2606, by visiting the About MFS section of mfs.com or by visiting the SEC’s Web site at http://www.sec.gov.
Information regarding how the fund voted proxies relating to portfolio securities during the most recent twelve-month period ended June 30 is available without charge by visiting the Proxy Voting section of mfs.com or by visiting the SEC’s Web site at http://www.sec.gov.
QUARTERLY PORTFOLIO DISCLOSURE
The fund will file a complete schedule of portfolio holdings with the Securities and Exchange Commission (the Commission) for the first and third quarters of each fiscal year on Form N-Q. The fund’s Form N-Q may be reviewed and copied at the:
Public Reference Room
Securities and Exchange Commission
100 F Street, NE, Room 1580
Washington, D.C. 20549
Information on the operation of the Public Reference Room may be obtained by calling the Commission at 1-800-SEC-0330. The fund’s Form N-Q is available on the EDGAR database on the Commission’s Internet Web site at http://www.sec.gov, and copies of this information may be obtained, upon payment of a duplicating fee, by electronic request at the following e-mail address: publicinfo@sec.gov or by writing the Public Reference Section at the above address.
A shareholder can also obtain the quarterly portfolio holdings report at mfs.com.
FEDERAL TAX INFORMATION (unaudited)
The following information is provided pursuant to provisions of the Internal Revenue Code.
For corporate shareholders, 83.06% of the ordinary income dividends paid during the fiscal year qualify for the corporate dividends received deduction.
25
MFS® PRIVACY NOTICE
Privacy is a concern for every investor today. At MFS Investment Management® and the MFS funds, we take this concern very seriously. We want you to understand our policies about the investment products and services that we offer, and how we protect the nonpublic personal information of investors who have a direct relationship with us and our wholly owned subsidiaries.
Throughout our business relationship, you provide us with personal information. We maintain information and records about you, your investments, and the services you use. Examples of the nonpublic personal information we maintain include
| | Ÿ | | data from investment applications and other forms |
| | Ÿ | | share balances and transactional history with us, our affiliates, or others |
| | Ÿ | | facts from a consumer reporting agency |
We do not disclose any nonpublic personal information about our customers or former customers to anyone, except as permitted by law. We may share nonpublic personal information with third parties or certain of our affiliates in connection with servicing your account or processing your transactions. We may share information with companies or financial institutions that perform marketing services on our behalf or with other financial institutions with which we have joint marketing arrangements, subject to any legal requirements.
Authorization to access your nonpublic personal information is limited to appropriate personnel who provide products, services, or information to you. We maintain physical, electronic, and procedural safeguards to help protect the personal information we collect about you.
If you have any questions about the MFS privacy policy, please call 1-800-225-2606 any business day between 8 a.m. and 8 p.m. Eastern time.
Note: If you own MFS products or receive MFS services in the name of a third party such as a bank or broker-dealer, their privacy policy may apply to you instead of ours.
26
CONTACT US
Web site
mfs.com
Account service and
literature
Shareholders
1-877-411-3325
9 a.m. to 5 p.m. ET
Investment professionals
1-800-637-8630
8 a.m. to 5 p.m. ET
Mailing address
MFS Service Center, Inc.
Attn: Institutional Alliance Services (IAS)
P.O. Box 55824
Boston, MA
02205-5824
Overnight mail
MFS Service Center, Inc.
Attn: Institutional Alliance Services (IAS)
500 Boylston Street
Boston, MA 02116-3741


MFS® Variable Insurance Trust IISM
Annual report
MFS® Global Growth Portfolio
(formerly Global Growth Series)
12/31/07
WGO-ANN
MFS® GLOBAL GROWTH PORTFOLIO
(formerly Global Growth Series)
The report is prepared for the general information of contract owners. It is authorized for distribution to prospective investors only when preceded or accompanied by a current prospectus.
NOT FDIC INSURED MAY LOSE VALUE NO BANK OR CREDIT UNION GUARANTEE NOT A DEPOSIT NOT INSURED BY ANY FEDERAL GOVERNMENT AGENCY OR NCUA/NCUSIF
LETTER FROM THE CEO

Dear Contract Owners:
The past year has been a great example of why investors should keep their eyes on the long term.
In 2006 the Dow Jones Industrial Average returned 19% and was fairly stable. This year we have seen a greater level of volatility than has been experienced in recent years. The Dow hit several new highs but also experienced swift drops as a global credit crisis swept through markets, spurred by defaults on U.S. subprime loans and a liquidity crunch. Still, even with this volatility, the Dow ended the first three quarters of 2007 with a return near 13%.
U.S. Treasury bonds gained ground, especially in the third quarter as investors sought less risky asset classes. The spreads of many lower-quality debt investments widened.
In 2007 the U.S. dollar fell against the euro, oil prices hit their highest levels yet, and gold spiked to its steepest price in 28 years. Around the globe, stocks sold off as risk aversion mounted. As we have said before, markets can be volatile, and investors should make sure they have an investment plan that can carry them through the peaks and troughs.
If you are focused on a long-term investment strategy, the short-term ups and downs of the markets should not necessarily dictate portfolio action on your part. In our view, investors who remain committed to a long-term plan are more likely to achieve their financial goals.
In any market environment, we believe individual investors are best served by following a three-pronged investment strategy of allocating their holdings across the major asset classes, diversifying within each class, and regularly rebalancing their portfolios to maintain their desired allocations. Of course, these strategies cannot guarantee a profit or protect against a loss. Investing and planning for the long term require diligence and patience, two traits that in our experience are essential to capitalizing on the many opportunities the financial markets can offer – through both up and down economic cycles.
Respectfully,

[PHOTO]
Robert J. Manning
Chief Executive Officer and Chief Investment Officer
MFS Investment Management®
February 15, 2008
The opinions expressed in this letter are subject to change, may not be relied upon for investment advice, and no forecasts can be guaranteed.
1
PORTFOLIO COMPOSITION
Portfolio structure
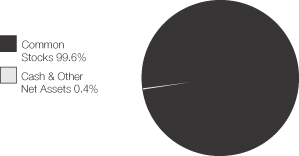
| | |
| Top ten holdings | | |
| Telefonica S.A. | | 2.0% |
| BHP Billiton PLC | | 2.0% |
| WPP Group PLC | | 2.0% |
| TOTAL S.A. | | 1.8% |
| Nestle S.A. | | 1.8% |
| LVMH Moet Hennessy Louis Vuitton S.A. | | 1.8% |
| Intel Corp. | | 1.5% |
| Roche Holding AG | | 1.4% |
| Housing Development Finance Corp. Ltd. | | 1.4% |
| Erste Bank der Oesterreichischen Sparkassen AG | | 1.3% |
| | |
| Equity sectors | | |
| Technology | | 17.2% |
| Financial Services | | 16.7% |
| Health Care | | 10.6% |
| Basic Materials | | 10.5% |
| Consumer Staples | | 8.4% |
| Utilities & Communications | | 7.1% |
| Energy | | 6.2% |
| Leisure | | 6.0% |
| Retailing | | 5.8% |
| Industrial Goods & Services | | 4.9% |
| Special Products & Services | | 3.9% |
| Autos & Housing | | 2.3% |
| | |
| Country weightings | | |
| United States | | 29.6% |
| United Kingdom | | 11.2% |
| Japan | | 9.7% |
| France | | 8.3% |
| Switzerland | | 7.8% |
| Germany | | 6.4% |
| Brazil | | 2.7% |
| Russia | | 2.3% |
| India | | 2.1% |
| Other Countries | | 19.9% |
Percentages are based on net assets as of 12/31/07.
The portfolio is actively managed and current holdings may be different.
2
MANAGEMENT REVIEW
For the twelve months ended December 31, 2007, Initial Class shares of the MFS Global Growth Portfolio (the “fund”) provided a total return of 13.27%, while Service Class shares provided a total return of 13.04%. These compare with a return of 17.06% for the fund’s benchmark, the MSCI All Country World Growth Index. The fund’s other benchmark, the MSCI World Growth Index, generated a return of 15.12%.
Market Environment
Despite seemingly robust growth rates during the second and third quarters of 2007, underlying economic activity in the U.S. remained muted relative to other major economies. Overall, global economies witnessed moderate to strong growth during the reporting period as domestic demand improved and world trade accelerated.
With the strong global growth, however, concerns emerged about rising global inflation, especially as capacity became more constrained, wages rose, and energy and food prices advanced. During the reporting period, global central banks (with the exception of the U.S. Federal Reserve Board) tightened monetary conditions, which in turn pushed global bond yields to their highest levels during this economic expansion.
However, financial markets – particularly in the mortgage and structured-products areas – experienced substantial volatility in recent months. Beginning in late July, heightened uncertainty and distress concerning the subprime mortgage market caused several global credit markets to tighten up, forcing central banks to inject liquidity and to reassess their tightening biases as sovereign bond yields declined and credit spreads widened. While credit conditions improved somewhat by late October as the Federal Reserve Board cut interest rates, the level of market turbulence remained significant through year end. Increased market turmoil was also exacerbated by U.S. home foreclosures and uncertainties surrounding falling housing prices. Despite increased volatility across all asset classes and the widening in credit spreads, U.S. labor markets were resilient and wages rose modestly. More broadly, global equity markets rebounded following summer losses and generally held those gains through the end of the reporting period.
Detractors from performance
Stock selection in the technology sector was the primary factor that detracted from performance relative to the MSCI All Country World Growth Index. The fund’s decision not to own mobile phone maker Nokia (Finland) for most of the period and computer and personal electronics maker Apple for any of this period weighed on results as we failed to capture these stocks’ spectacular run-ups. In addition, the fund’s investment in Sumco (Japan), a manufacturer of silicon semiconductor wafers used in the production of semiconductors, hurt performance.
The fund’s overweight position and stock selection in the financial services sector also detracted from relative returns. Holdings of investment management and banking firm UBS (Switzerland) hindered performance as problems relating to mortgage-backed securities hurt the stock price. Our investment in consumer finance firm Aeon Credit Services (Japan) also suffered as a result of regulatory changes that limited the interest rate credit card companies could charge customers and changed reserve requirements. Other positions that weighed on results included banking firm HSBC(aa) (U.K.) and investment banker Morgan Stanley(aa)(g).
Stock selection and an underweight position in the industrial goods and services sector detracted from relative performance. While no individual stocks within this sector were among the fund’s top detractors, our underweight position was driven largely by our bias against more cyclical capital-intensive stocks in this sector.
Factors in other sectors that dampened results included not owning mining operator Rio Tinto (Australia). Shares of this benchmark constituent soared during the reporting period on news of possible acquisition offers. The fund’s holdings of medical devices maker Boston Scientific and car and machinery manufacturer Toyota Industries(aa) also held back relative results.
Contributors to performance
Boosted by stock selection, the utilities and communications sector was a positive factor in relative returns for the reporting period. Holdings of electric utility company CEZ (Czech Republic), telecommunications company Telefonica (Spain), and conglomerate AFK Sistema (Russia) contributed to the strong relative performance.
Stock selection and, to a lesser extent, our underweight position in the retailing sector was another positive factor in the fund’s relative performance. However, no holdings in this sector were among the top contributors.
3
Management review – continued
Silicon wafer manufacturer Wacker Chemie AG (Germany) and mining giant BHP Billiton (UK) were standout performers in the basic materials sector. Wacker Chemie reported earnings that exceeded consensus estimates and raised earnings guidance, citing higher silicon consumption in emerging markets driven by demand for phones, MP3 players, and televisions. BHP Billiton reported strong earnings results and company fundamentals throughout the reporting period. Specifically, the company cited robust demand from Asia and surging commodities prices as key drivers of earnings growth.
Within the energy sector, the fund’s shares of oil and gas exploration and production company Petroleo Brasileiro (Brazil) were among the top contributors as the company’s stock price rose on higher energy prices, record oil production, and the continued discovery of offshore oil fields. Positioning in oil and natural gas provider OAO Gazprom (Russia) also helped relative performance.
Top relative contributors in other sectors included the fund’s holdings of automaker Astra International(aa) (Indonesia) and wealth management firm Julius Baer (Switzerland). Not owning poor-performing cable services provider Comcast also benefited relative returns.
Respectfully,
| | |
| Barry Dargan | | Nicholas Smithie |
| Portfolio Manager | | Portfolio Manager |
| (aa) | Security is not a benchmark constituent. |
| (g) | Security was not held in the portfolio at period end. |
The views expressed in this report are those of the portfolio managers only through the end of the period of the report as stated on the cover and do not necessarily reflect the views of MFS or any other person in the MFS organization. These views are subject to change at any time based on market or other conditions, and MFS disclaims any responsibility to update such views. These views may not be relied upon as investment advice or an indication of trading intent on behalf of any MFS portfolio. References to specific securities are not recommendations of such securities, and may not be representative of any MFS portfolio’s current or future investments.
4
PERFORMANCE SUMMARY THROUGH 12/31/07
The following chart illustrates the historical performance of the fund in comparison to its benchmark index. Index comparisons are unmanaged; do not reflect any fees or expenses; and cannot be invested in directly. The performance of other share classes will be greater than or less than that of the class depicted below. (See Notes to Performance Summary.)
Performance data shown represents past performance and is no guarantee of future results. Investment return and principal value fluctuate so your units, when sold, may be worth more or less than the original cost; current performance may be lower or higher than quoted. The performance shown does not reflect the deduction of taxes, if any, that a contract holder would pay on fund distributions or the redemption of contract units. The returns for the fund shown also do not reflect the deduction of expenses associated with variable products, such as mortality and expense risk charges, separate account charges, and sales charges imposed by the insurance company separate accounts. Such expenses would reduce the overall returns shown.
Growth of a hypothetical $10,000 investment
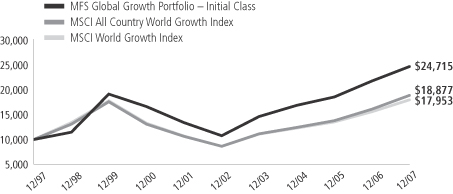
Total returns through 12/31/07
Average Annual Total Returns
| | | | | | | | | | | | |
| | | Share class | | Class inception date | | 1-yr | | 5-yr | | 10-yr | | |
| | | Initial Class | | 11/16/93 | | 13.27% | | 18.03% | | 9.47% | | |
| | | Service Class | | 8/24/01 | | 13.04% | | 17.75% | | 9.28% | | |
Comparative Index
| | | | | | | | | | | | |
| | | MSCI All Country World Growth Index (f) | | 17.06% | | 17.02% | | 6.56% | | |
| | | MSCI World Growth Index (f) | | 15.12% | | 15.83% | | 6.03% | | |
| (f) | Source: FactSet Research Systems Inc. |
Index Definitions
Morgan Stanley Capital International (MSCI) World Growth Index – a market capitalization-weighted index that is designed to measure equity market performance for growth securities in the global developed markets.
Morgan Stanley Capital International (MSCI) All Country World Growth Index – a market capitalization-weighted index that is designed to measure equity market performance for growth securities in the global developed and emerging markets.
It is not possible to invest directly in an index.
Notes to Performance Summary
Service Class share performance includes the performance of Initial Class shares for periods prior to the inception of Service Class shares (blended performance). This blended performance figure has not been adjusted to take into account differences in the class-specific operating expenses (such as Rule 12b-1 fees). Because operating expenses of Service Class shares are generally higher than those of Initial Class shares, the blended Service Class shares performance shown is higher than it would have been had Service Class shares been offered for the entire period.
Performance results reflect any applicable expense subsidies and waivers in effect during the periods shown. Without such subsidies and waivers the fund’s performance results would be less favorable. Please see the prospectus for complete details. All results are historical and assume the reinvestment of any dividends and capital gains distributions.
From time to time the fund may receive proceeds from litigation settlements, without which performance would be lower.
5
EXPENSE TABLE
Fund expenses borne by the contract holders during the period,
July 1, 2007 through December 31, 2007
As a contract holder of the fund, you incur ongoing costs, including management fees; distribution (12b-1) fees; and other fund expenses. This example is intended to help you understand your ongoing costs (in dollars) of investing in the fund and to compare these costs with the ongoing costs of investing in other mutual funds.
The example is based on an investment of $1,000 invested at the beginning of the period and held for the entire period July 1, 2007 through December 31, 2007.
Actual expenses
The first line for each share class in the following table provides information about actual account values and actual expenses. You may use the information in this line, together with the amount you invested, to estimate the expenses that you paid over the period. Simply divide your account value by $1,000 (for example, an $8,600 account value divided by $1,000 = 8.6), then multiply the result by the number in the first line under the heading entitled “Expenses Paid During Period” to estimate the expenses you paid on your account during this period.
Hypothetical example for comparison purposes
The second line for each share class in the following table provides information about hypothetical account values and hypothetical expenses based on the fund’s actual expense ratio and an assumed rate of return of 5% per year before expenses, which is not the fund’s actual return. The hypothetical account values and expenses may not be used to estimate the actual ending account balance or expenses you paid for the period. You may use this information to compare the ongoing costs of investing in the fund and other funds. To do so, compare this 5% hypothetical example with the 5% hypothetical examples that appear in the shareholder reports of the other funds.
Please note that the expenses shown in the table are meant to highlight the fund’s ongoing costs only and do not take into account the fees and expenses imposed under the variable contracts through which your investment in the fund is made. Therefore, the second line for each share class in the table is useful in comparing ongoing costs associated with an investment in vehicles (such as the fund) which fund benefits under variable annuity and variable life insurance contracts and to qualified pension and retirement plans only, and will not help you determine the relative total costs of investing in the fund through variable annuity and variable life insurance contracts. If the fees and expenses imposed under the variable contracts were included, your costs would have been higher.
| | | | | | | | | | |
| Share Class | | | | Annualized
Expense Ratio | | Beginning
Account Value
7/01/07 | | Ending Account Value
12/31/07 | | Expenses Paid
During Period (p)
7/01/07-12/31/07 |
| Initial Class | | Actual | | 1.10% | | $1,000.00 | | $1,033.60 | | $5.64 |
| | Hypothetical (h) | | 1.10% | | $1,000.00 | | $1,019.66 | | $5.60 |
| Service Class | | Actual | | 1.35% | | $1,000.00 | | $1,032.00 | | $6.91 |
| | Hypothetical (h) | | 1.35% | | $1,000.00 | | $1,018.40 | | $6.87 |
| (h) | 5% class return per year before expenses. |
| (p) | Expenses paid is equal to each class’ annualized expense ratio, as shown above, multiplied by the average account value over the period, multiplied by the number of days in the period, divided by the number of days in the year. |
6
PORTFOLIO OF INVESTMENTS – 12/31/07
The Portfolio of Investments is a complete list of all securities owned by your fund.
It is categorized by broad-based asset classes.
| | | | | |
| Issuer | | Shares/Par | | Value ($) |
| | | | | |
| COMMON STOCKS – 99.6% | | | | | |
| Aerospace – 0.9% | | | | | |
| United Technologies Corp. | | 16,120 | | $ | 1,233,825 |
| | | | | |
| Alcoholic Beverages – 0.6% | | | | | |
| Pernod Ricard S.A. (l) | | 3,854 | | $ | 887,635 |
| | | | | |
| Apparel Manufacturers – 4.0% | | | | | |
| Billabong International Ltd. (l) | | 55,912 | | $ | 726,525 |
| Li & Fung Ltd. | | 329,800 | | | 1,317,904 |
| LVMH Moet Hennessy Louis Vuitton S.A. | | 20,810 | | | 2,501,162 |
| NIKE, Inc., “B” | | 17,610 | | | 1,131,266 |
| | | | | |
| | | | $ | 5,676,857 |
| | | | | |
| Automotive – 2.3% | | | | | |
| Continental AG | | 6,208 | | $ | 805,043 |
| PT Astra International Tbk. | | 466,500 | | | 1,342,987 |
| Toyota Industries Corp. | | 27,300 | | | 1,113,301 |
| | | | | |
| | | | $ | 3,261,331 |
| | | | | |
| Biotechnology – 1.3% | | | | | |
| Genzyme Corp. (a) | | 16,440 | | $ | 1,223,794 |
| Millipore Corp. (a)(l) | | 7,870 | | | 575,927 |
| | | | | |
| | | | $ | 1,799,721 |
| | | | | |
| Broadcasting – 4.5% | | | | | |
| Grupo Televisa S.A., ADR | | 58,340 | | $ | 1,386,742 |
| Societe Television Francaise 1 (l) | | 26,787 | | | 713,458 |
| Walt Disney Co. | | 44,590 | | | 1,439,365 |
| WPP Group PLC | | 216,130 | | | 2,767,049 |
| | | | | |
| | | | $ | 6,306,614 |
| | | | | |
| Brokerage & Asset Managers – 4.8% | | | | | |
| Bolsa de Mercadorias & Futuros (a) | | 43,900 | | $ | 616,573 |
| Daiwa Securities Group, Inc. | | 137,000 | | | 1,262,278 |
| Goldman Sachs Group, Inc. | | 6,300 | | | 1,354,815 |
| ICAP PLC | | 55,510 | | | 798,952 |
| Invesco Ltd. (l) | | 37,360 | | | 1,172,357 |
| Julius Baer Holding Ltd. | | 18,342 | | | 1,490,905 |
| | | | | |
| | | | $ | 6,695,880 |
| | | | | |
| Business Services – 2.6% | | | | | |
| Accenture Ltd., “A” | | 23,890 | | $ | 860,757 |
| Amdocs Ltd. (a) | | 17,460 | | | 601,846 |
| Capita Group PLC | | 39,118 | | | 546,998 |
| Fidelity National Information Services, Inc. (l) | | 21,200 | | | 881,708 |
| Intertek Group PLC | | 41,730 | | | 818,155 |
| | | | | |
| | | | $ | 3,709,464 |
| | | | | |
| Chemicals – 2.2% | | | | | |
| 3M Co. | | 14,680 | | $ | 1,237,818 |
| Makhteshim-Agan Industries Ltd. (a) | | 98,840 | | | 903,687 |
| Wacker Chemie AG | | 3,290 | | | 943,638 |
| | | | | |
| | | | $ | 3,085,143 |
| | | | | |
| Computer Software – 1.3% | | | | | |
| SAP AG | | 18,950 | | $ | 979,085 |
| VeriSign, Inc. (a) | | 24,050 | | | 904,521 |
| | | | | |
| | | | $ | 1,883,606 |
| | | | | |
| | | | | |
| Issuer | | Shares/Par | | Value ($) |
| | | | | |
| COMMON STOCKS – continued | | | | | |
| Computer Software – Systems – 2.5% | | | | | |
| EMC Corp. (a) | | 33,670 | | $ | 623,905 |
| Fujitsu Ltd. | | 141,000 | | | 943,563 |
| HCL Technologies Ltd. | | 124,570 | | | 1,041,850 |
| Network Appliance, Inc. (a) | | 36,210 | | | 903,802 |
| | | | | |
| | | | $ | 3,513,120 |
| | | | | |
| Conglomerates – 1.3% | | | | | |
| Siemens AG | | 7,720 | | $ | 1,211,957 |
| Smiths Group PLC | | 30,807 | | | 617,556 |
| | | | | |
| | | | $ | 1,829,513 |
| | | | | |
| Consumer Goods & Services – 5.3% | | | | | |
| Alberto-Culver Co. (l) | | 36,130 | | $ | 886,630 |
| Colgate-Palmolive Co. | | 12,900 | | | 1,005,684 |
| Kao Corp. | | 34,000 | | | 1,022,602 |
| L’Oreal S.A. (l) | | 7,230 | | | 1,032,084 |
| Procter & Gamble Co. | | 23,820 | | | 1,748,864 |
| Reckitt Benckiser Group PLC | | 29,850 | | | 1,724,402 |
| | | | | |
| | | | $ | 7,420,266 |
| | | | | |
| Electrical Equipment – 2.3% | | | | | |
| Keyence Corp. | | 3,600 | | $ | 881,931 |
| OMRON Corp. | | 34,300 | | | 811,862 |
| Schneider Electric S.A. | | 11,793 | | | 1,576,864 |
| | | | | |
| | | | $ | 3,270,657 |
| | | | | |
| Electronics – 8.8% | | | | | |
| ARM Holdings PLC | | 223,990 | | $ | 549,112 |
| Canon, Inc. (l) | | 21,400 | | | 977,773 |
| Hirose Electric Co. Ltd. (l) | | 12,800 | | | 1,480,338 |
| Intel Corp. | | 79,700 | | | 2,124,802 |
| Marvell Technology Group Ltd. (a) | | 44,470 | | | 621,691 |
| National Semiconductor Corp. | | 44,800 | | | 1,014,272 |
| Nippon Electric Glass Co. Ltd. | | 40,000 | | | 649,675 |
| Ricoh Co. Ltd. | | 38,000 | | | 698,895 |
| Royal Philips Electronics N.V. | | 39,040 | | | 1,691,909 |
| SUMCO Corp. | | 41,800 | | | 1,196,744 |
| Taiwan Semiconductor Manufacturing Co. Ltd., ADR | | 135,860 | | | 1,353,166 |
| | | | | |
| | | | $ | 12,358,377 |
| | | | | |
| Energy – Independent – 1.2% | | | | | |
| INPEX Holdings, Inc. | | 161 | | $ | 1,731,850 |
| | | | | |
| Energy – Integrated – 4.1% | | | | | |
| OAO Gazprom, ADR | | 28,750 | | $ | 1,618,965 |
| Petroleo Brasileiro S.A., ADR | | 14,010 | | | 1,614,512 |
| TOTAL S.A. | | 31,080 | | | 2,579,317 |
| | | | | |
| | | | $ | 5,812,794 |
| | | | | |
| Food & Beverages – 2.5% | | | | | |
| Nestle S.A. | | 5,543 | | $ | 2,539,878 |
| PepsiCo, Inc. | | 13,180 | | | 1,000,362 |
| | | | | |
| | | | $ | 3,540,240 |
| | | | | |
7
Portfolio of Investments – continued
| | | | | |
| Issuer | | Shares/Par | | Value ($) |
| | | | | |
| COMMON STOCKS – continued | | | | | |
| Food & Drug Stores – 0.8% | | | | | |
| Tesco PLC | | 124,249 | | $ | 1,173,245 |
| | | | | |
| Gaming & Lodging – 0.5% | | | | | |
| International Game Technology | | 14,890 | | $ | 654,118 |
| | | | | |
| Internet – 1.1% | | | | | |
| Google, Inc., “A” (a) | | 1,190 | | $ | 822,861 |
| Yahoo!, Inc. (a) | | 29,300 | | | 681,518 |
| | | | | |
| | | | $ | 1,504,379 |
| | | | | |
| Machinery & Tools – 1.7% | | | | | |
| Bucyrus International, Inc., “A” (l) | | 14,270 | | $ | 1,418,295 |
| GEA Group AG (a) | | 29,440 | | | 1,016,806 |
| | | | | |
| | | | $ | 2,435,101 |
| | | | | |
| Major Banks – 6.2% | | | | | |
| Bank of New York Mellon Corp. | | 24,420 | | $ | 1,190,719 |
| Erste Bank der Oesterreichischen Sparkassen AG | | 26,420 | | | 1,877,798 |
| HSBC Holdings PLC | | 79,913 | | | 1,339,410 |
| Societe Generale | | 7,250 | | | 1,036,133 |
| Standard Chartered PLC | | 34,770 | | | 1,262,733 |
| State Street Corp. (l) | | 10,740 | | | 872,088 |
| UniCredito Italiano S.p.A. | | 129,720 | | | 1,079,398 |
| | | | | |
| | | | $ | 8,658,279 |
| | | | | |
| Medical Equipment – 3.5% | | | | | |
| Boston Scientific Corp. (a) | | 46,660 | | $ | 542,656 |
| Medtronic, Inc. | | 24,750 | | | 1,244,182 |
| ResMed, Inc. (a)(l) | | 21,010 | | | 1,103,655 |
| Synthes, Inc. | | 10,790 | | | 1,333,701 |
| Zimmer Holdings, Inc. (a) | | 9,970 | | | 659,515 |
| | | | | |
| | | | $ | 4,883,709 |
| | | | | |
| Metals & Mining – 4.5% | | | | | |
| Anglo American PLC | | 21,630 | | $ | 1,310,862 |
| BHP Billiton PLC | | 91,040 | | | 2,801,727 |
| Companhia Vale do Rio Doce, ADR | | 48,950 | | | 1,599,196 |
| POSCO, ADR | | 4,090 | | | 615,177 |
| | | | | |
| | | | $ | 6,326,962 |
| | | | | |
| Network & Telecom – 3.5% | | | | | |
| Cisco Systems, Inc. (a) | | 60,860 | | $ | 1,647,480 |
| Ericsson, Inc., “B” | | 235,640 | | | 550,916 |
| NICE Systems Ltd., ADR (a) | | 16,260 | | | 558,043 |
| Nokia Oyj | | 34,400 | | | 1,324,553 |
| Research In Motion Ltd. (a) | | 7,030 | | | 797,202 |
| | | | | |
| | | | $ | 4,878,194 |
| | | | | |
| Oil Services – 0.9% | | | | | |
| Halliburton Co. | | 33,520 | | $ | 1,270,743 |
| | | | | |
| Other Banks & Diversified Financials – 5.7% | | | |
| ABSA Group Ltd. | | 76,650 | | $ | 1,242,715 |
| Aeon Credit Service Co. Ltd. | | 58,200 | | | 860,397 |
| American Express Co. | | 26,940 | | | 1,401,419 |
| Bank of Cyprus Public Co. Ltd. | | 42,313 | | | 776,521 |
| | | | | | | |
| Issuer | | Shares/Par | | Value ($) | |
| | | | | | | |
| COMMON STOCKS – continued | | | | | | | |
| Other Banks & Diversified Financials – continued | | | | |
| Housing Development Finance Corp. Ltd. | | | 26,613 | | $ | 1,925,466 | |
| UBS AG | | | 38,201 | | | 1,774,032 | |
| | | | | | | |
| | | | | $ | 7,980,550 | |
| | | | | | | |
| Pharmaceuticals – 5.8% | | | | | | | |
| Bayer AG (l) | | | 15,700 | | $ | 1,431,440 | |
| Merck & Co., Inc. | | | 23,580 | | | 1,370,234 | |
| Novartis AG | | | 34,360 | | | 1,871,872 | |
| Novo Nordisk A/S, “B” | | | 23,570 | | | 1,538,580 | |
| Roche Holding AG | | | 11,600 | | | 1,998,116 | |
| | | | | | | |
| | | | | $ | 8,210,242 | |
| | | | | | | |
| Restaurants – 1.0% | | | | | | | |
| YUM! Brands, Inc. (l) | | | 35,480 | | $ | 1,357,820 | |
| | | | | | | |
| Specialty Chemicals – 3.8% | | | | | | | |
| L’Air Liquide S.A. | | | 8,722 | | $ | 1,292,316 | |
| Linde AG | | | 9,850 | | | 1,297,302 | |
| Praxair, Inc. | | | 15,990 | | | 1,418,473 | |
| Symrise AG (a) | | | 45,120 | | | 1,258,409 | |
| | | | | | | |
| | | | | $ | 5,266,500 | |
| | | | | | | |
| Specialty Stores – 1.0% | | | | | | | |
| PetSmart, Inc. (l) | | | 26,070 | | $ | 613,427 | |
| Staples, Inc. | | | 36,780 | | | 848,515 | |
| | | | | | | |
| | | | | $ | 1,461,942 | |
| | | | | | | |
| Telecommunications – Wireless – 2.0% | | | | | | | |
| America Movil S.A.B. de C.V., “L”, ADR | | | 22,110 | | $ | 1,357,333 | |
| Orascom Telecom Holding (S.A.E.) | | | 88,618 | | | 1,467,689 | |
| | | | | | | |
| | | | | $ | 2,825,022 | |
| | | | | | | |
| Telephone Services – 4.1% | | | | | | | |
| Sistema JSFC, GDR | | | 40,440 | | $ | 1,688,370 | |
| Telefonica S.A. | | | 88,660 | | | 2,865,244 | |
| Telenor A.S.A. | | | 50,960 | | | 1,204,645 | |
| | | | | | | |
| | | | | $ | 5,758,259 | |
| | | | | | | |
| Utilities – Electric Power – 1.0% | | | | | | | |
| CEZ AS | | | 17,660 | | $ | 1,322,599 | |
| | | | | | | |
Total Common Stocks
(Identified Cost, $124,089,118) | | | | | $ | 139,984,557 | |
| | | | | | | |
| | |
| SHORT-TERM OBLIGATIONS – 0.5% | | | | | | | |
American Express Credit Corp.,
4.12%, due 1/02/08, at
Amortized Cost and Value (y) | | $ | 778,000 | | $ | 777,911 | |
| | | | | | | |
| |
| COLLATERAL FOR SECURITIES LOANED – 9.3% | | | | |
| Navigator Securities Lending Prime Portfolio, at Cost and Net Asset Value | | | 13,065,470 | | $ | 13,065,470 | |
| | | | | | | |
Total Investments
(Identified Cost, $137,932,499) (k) | | | | | $ | 153,827,938 | |
| | | | | | | |
OTHER ASSETS, LESS
LIABILITIES – (9.4)% | | | | | | (13,241,350 | ) |
| | | | | | | |
| Net Assets – 100.0% | | | | | $ | 140,586,588 | |
| | | | | | | |
8
Portfolio of Investments – continued
| (a) | Non-income producing security. |
| (k) | As of December 31, 2007, the fund had 13 securities that were fair valued, aggregating $13,776,804 and 8.96% of market value, in accordance with the policies adopted by the Board of Trustees. |
| (l) | All or a portion of this security is on loan. |
| (y) | The rate shown represents an annualized yield at time of purchase. |
The following abbreviations are used in this report and are defined:
| ADR | American Depository Receipt |
| GDR | Global Depository Receipt |
See Notes to Financial Statements
9
FINANCIAL STATEMENTS | STATEMENT OF ASSETS AND LIABILITIES
This statement represents your fund’s balance sheet, which details the assets and liabilities comprising the total value of the fund.
| | | | | |
| At 12/31/07 | | | | | |
| Assets | | | | | |
| Investments, at value including $12,626,280 of securities on loan (identified cost, $137,932,499) | | $153,827,938 | | | |
| Foreign currency, at value (identified cost, $249) | | 369 | | | |
| Receivable for investments sold | | 132,910 | | | |
| Receivable for fund shares sold | | 1,394 | | | |
| Interest and dividends receivable | | 102,123 | | | |
| Other assets | | 5,350 | | | |
| Total assets | | | | | $154,070,084 |
| Liabilities | | | | | |
| Payable to custodian | | $31,423 | | | |
| Payable for investments purchased | | 86,324 | | | |
| Payable for fund shares reacquired | | 167,002 | | | |
| Collateral for securities loaned, at value | | 13,065,470 | | | |
| Payable to affiliates | | | | | |
Management fee | | 13,931 | | | |
Distribution fees | | 241 | | | |
Administrative services fee | | 350 | | | |
| Payable for independent trustees’ compensation | | 465 | | | |
| Accrued expenses and other liabilities | | 118,290 | | | |
| Total liabilities | | | | | $13,483,496 |
| Net assets | | | | | $140,586,588 |
| Net assets consist of | | | | | |
| Paid-in capital | | $157,073,142 | | | |
| Unrealized appreciation (depreciation) on investments and translation of assets and liabilities in foreign currencies | | 15,895,833 | | | |
| Accumulated net realized gain (loss) on investments and foreign currency transactions | | (33,380,003 | ) | | |
| Undistributed net investment income | | 997,616 | | | |
Net Assets | | | | | $140,586,588 |
| Shares of beneficial interest outstanding | | | | | 8,017,702 |
| Initial Class shares | | | | | |
Net assets | | $131,870,265 | | | |
Shares outstanding | | 7,517,443 | | | |
Net asset value per share | | | | | $17.54 |
| Service Class shares | | | | | |
Net assets | | $8,716,323 | | | |
Shares outstanding | | 500,259 | | | |
Net asset value per share | | | | | $17.42 |
See Notes to Financial Statements
10
FINANCIAL STATEMENTS | STATEMENT OF OPERATIONS
This statement describes how much your fund earned in investment income and accrued in expenses. It also describes any gains and/or losses generated by fund operations.
| | | | | | |
| Year ended 12/31/07 | | | | | | |
| Net investment income | | | | | | |
| Income | | | | | | |
Dividends | | $2,956,278 | | | | |
Interest | | 139,085 | | | | |
Foreign taxes withheld | | (181,447 | ) | | | |
| Total investment income | | | | | $2,913,916 | |
| Expenses | | | | | | |
Management fee | | $1,365,829 | | | | |
Distribution fees | | 21,686 | | | | |
Administrative services fee | | 39,685 | | | | |
Independent trustees’ compensation | | 14,598 | | | | |
Custodian fee | | 154,208 | | | | |
Shareholder communications | | 10,502 | | | | |
Auditing fees | | 57,084 | | | | |
Legal fees | | 5,950 | | | | |
Miscellaneous | | 14,455 | | | | |
| Total expenses | | | | | $1,683,997 | |
Fees paid indirectly | | (290 | ) | | | |
| Net expenses | | | | | $1,683,707 | |
| Net investment income | | | | | $1,230,209 | |
| Realized and unrealized gain (loss) on investments and foreign currency transactions | | | | | | |
| Realized gain (loss) (identified cost basis) | | | | | | |
Investment transactions | | $27,700,987 | | | | |
Foreign currency transactions | | (15,988 | ) | | | |
| Net realized gain (loss) on investments and foreign currency transactions | | | | | $27,684,999 | |
| Change in unrealized appreciation (depreciation) | | | | | | |
Investments | | $(9,801,360 | ) | | | |
Translation of assets and liabilities in foreign currencies | | (207 | ) | | | |
| Net unrealized gain (loss) on investments and foreign currency translation | | | | | $(9,801,567 | ) |
| Net realized and unrealized gain (loss) on investments and foreign currency | | | | | $17,883,432 | |
| Change in net assets from operations | | | | | $19,113,641 | |
See Notes to Financial Statements
11
FINANCIAL STATEMENTS | STATEMENTS OF CHANGES IN NET ASSETS
These statements describe the increases and/or decreases in net assets resulting from operations, any distributions, and any shareholder transactions.
| | | | | | |
| For years ended 12/31 | | 2007 | | | 2006 | |
| Change in net assets | | | | | | |
| From operations | | | | | | |
| Net investment income | | $1,230,209 | | | $2,196,080 | |
| Net realized gain (loss) on investments and foreign currency transactions | | 27,684,999 | | | 19,179,579 | |
| Net unrealized gain (loss) on investments and foreign currency translation | | (9,801,567 | ) | | 3,927,655 | |
| Change in net assets from operations | | $19,113,641 | | | $25,303,314 | |
| Distributions declared to shareholders | | | | | | |
| From net investment income | | | | | | |
Initial Class | | $(2,413,626 | ) | | $(845,334 | ) |
Service Class | | (124,151 | ) | | (26,908 | ) |
| Total distributions declared to shareholders | | $(2,537,777 | ) | | $(872,242 | ) |
| Change in net assets from fund share transactions | | $(33,505,791 | ) | | $(29,888,578 | ) |
| Total change in net assets | | $(16,929,927 | ) | | $(5,457,506 | ) |
| Net assets | | | | | | |
| At beginning of period | | 157,516,515 | | | 162,974,021 | |
At end of period (Including undistributed net investment income of $997,616 and
$2,219,304, respectively) | | $140,586,588 | | | $157,516,515 | |
See Notes to Financial Statements
12
FINANCIAL STATEMENTS | FINANCIAL HIGHLIGHTS
The financial highlights table is intended to help you understand the fund’s financial performance for the past 5 years. Certain information reflects financial results for a single fund share. The total returns in the table represent the rate by which an investor would have earned (or lost) on an investment in the fund share class (assuming reinvestment of all distributions) held for the entire period.
Initial Class
| | | | | | | | | | | | | | | |
| | | Years ended 12/31 | |
| | | 2007 | | | 2006 | | | 2005 | | | 2004 | | | 2003 | |
| Net asset value, beginning of period | | $15.74 | | | $13.48 | | | $12.31 | | | $10.70 | | | $7.94 | |
| Income (loss) from investment operations | | | | | | | | | | | | | | | |
| Net investment income (d) | | $0.14 | | | $0.20 | | | $0.07 | | | $0.05 | | | $0.07 | |
Net realized and unrealized gain (loss) on investments
and foreign currency | | 1.94 | | | 2.14 | | | 1.16 | | | 1.61 | | | 2.73 | |
| Total from investment operations | | $2.08 | | | $2.34 | | | $1.23 | | | $1.66 | | | $2.80 | |
| Less distributions declared to shareholders | | | | | | | | | | | | | | | |
| From net investment income | | $(0.28 | ) | | $(0.08 | ) | | $(0.06 | ) | | $(0.05 | ) | | $(0.04 | ) |
| Net asset value, end of period | | $17.54 | | | $15.74 | | | $13.48 | | | $12.31 | | | $10.70 | |
| Total return (%) (k)(s) | | 13.27 | | | 17.37 | | | 10.03 | | | 15.61 | (b) | | 35.44 | (j) |
Ratios (%) (to average net assets)
and Supplemental data: | | | | | | | | | | | | | | | |
| Expenses (f) | | 1.10 | | | 1.14 | | | 1.08 | | | 1.07 | | | 1.11 | |
| Net investment income | | 0.83 | | | 1.39 | | | 0.59 | | | 0.48 | | | 0.76 | |
| Portfolio turnover | | 76 | | | 92 | | | 87 | | | 115 | | | 147 | |
| Net assets at end of period (000 Omitted) | | $131,870 | | | $148,793 | | | $155,375 | | | $175,146 | | | $185,500 | |
See Notes to Financial Statements
13
Financial Highlights – continued
Service Class
| | | | | | | | | | | | | | | |
| | | Years ended 12/31 | |
| | | 2007 | | | 2006 | | | 2005 | | | 2004 | | | 2003 | |
| Net asset value, beginning of period | | $15.63 | | | $13.39 | | | $12.24 | | | $10.64 | | | $7.90 | |
| Income (loss) from investment operations | | | | | | | | | | | | | | | |
| Net investment income (d) | | $0.09 | | | $0.17 | | | $0.04 | | | $0.02 | | | $0.04 | |
Net realized and unrealized gain (loss) on investments
and foreign currency | | 1.94 | | | 2.12 | | | 1.14 | | | 1.61 | | | 2.73 | |
| Total from investment operations | | $2.03 | | | $2.29 | | | $1.18 | | | $1.63 | | | $2.77 | |
| Less distributions declared to shareholders | | | | | | | | | | | | | | | |
| From net investment income | | $(0.24 | ) | | $(0.05 | ) | | $(0.03 | ) | | $(0.03 | ) | | $(0.03 | ) |
| Net asset value, end of period | | $17.42 | | | $15.63 | | | $13.39 | | | $12.24 | | | $10.64 | |
| Total return (%) (k)(s) | | 13.04 | | | 17.09 | | | 9.65 | | | 15.41 | (b) | | 35.13 | (j) |
Ratios (%) (to average net assets)
and Supplemental data: | | | | | | | | | | | | | | | |
| Expenses (f) | | 1.35 | | | 1.39 | | | 1.33 | | | 1.32 | | | 1.36 | |
| Net investment income | | 0.56 | | | 1.16 | | | 0.34 | | | 0.23 | | | 0.41 | |
| Portfolio turnover | | 76 | | | 92 | | | 87 | | | 115 | | | 147 | |
| Net assets at end of period (000 Omitted) | | $8,716 | | | $8,723 | | | $7,599 | | | $7,785 | | | $6,792 | |
| (b) | The fund’s net asset value and total return calculation include a non-recurring accrual recorded as a result of an administrative proceeding regarding disclosure of brokerage allocation practices in connection with fund sales. The non-recurring accrual did not have a material impact on the net asset value per share based on the shares outstanding on the day the proceeds were recorded. |
| (d) | Per share data are based on average shares outstanding. |
| (f) | Ratios do not reflect reductions from fees paid indirectly, if applicable. |
| (j) | The fund’s net asset value and total return calculation include proceeds received on March 26, 2003 for the partial payment of a non-recurring litigation settlement from Cendant Corporation, recorded as a realized gain on investment transactions. The proceeds resulted in an increase in the net asset value of $0.06 per share based on shares outstanding on the day the proceeds were received. Excluding the effect of this payment from the ending net asset value per share, the Initial Class and Service Class total returns for the year ended December 31, 2003 would have been lower by approximately 0.79% and 0.80%, respectively. |
| (k) | The total return does not reflect expenses that apply to separate accounts. Inclusion of these charges would reduce the total return figures for all periods shown. |
| (s) | From time to time the fund may receive proceeds from litigation settlements, without which performance would be lower. |
See Notes to Financial Statements
14
NOTES TO FINANCIAL STATEMENTS
| (1) | | Business and Organization |
MFS Global Growth Portfolio (formerly Global Growth Series) (the fund) is a series of MFS Variable Insurance Trust II (formerly known as MFS/Sun Life Series Trust) (the trust). The trust is organized as a Massachusetts business trust and is registered under the Investment Company Act of 1940, as amended, as an open-end management investment company. The shares of the fund are sold to variable accounts established by insurance companies to fund benefits under variable contracts issued by such companies and qualified retirement and pension plans.
| (2) | | Significant Accounting Policies |
General – The preparation of financial statements in conformity with U.S. generally accepted accounting principles requires management to make estimates and assumptions that affect the reported amounts of assets and liabilities, and disclosure of contingent assets and liabilities at the date of the financial statements and the reported amounts of revenues and expenses during the reporting period. Actual results could differ from those estimates. The fund can invest in foreign securities, including securities of emerging market issuers. Investments in foreign securities are vulnerable to the effects of changes in the relative values of the local currency and the U.S. dollar and to the effects of changes in each country’s legal, political, and economic environment. The markets of emerging markets countries are generally more volatile than the markets of developed countries with more mature economies. All of the risks of investing in foreign securities previously described are heightened when investing in emerging markets countries.
Investment Valuations – Equity securities, including restricted equity securities, are generally valued at the last sale or official closing price as reported by an independent pricing service on the market or exchange on which they are primarily traded. For securities for which there were no sales reported that day, equity securities are generally valued at the last quoted daily bid quotation as reported by an independent pricing service on the market or exchange on which they are primarily traded. For securities held short for which there were no sales reported for the day, the position is generally valued at the last quoted daily ask quotation as reported by an independent pricing service on the market or exchange on which such securities are primarily traded. Short-term instruments with a maturity at issuance of 60 days or less may be valued at amortized cost, which approximates market value. Open-end investment companies are generally valued at their net asset value per share. Securities and other assets generally valued on the basis of information from an independent pricing service may also be valued at a broker-dealer bid quotation. The values of foreign securities and other assets and liabilities expressed in foreign currencies are converted to U.S. dollars using the mean of bid and asked prices for rates reported by an independent pricing service.
The Board of Trustees has delegated primary responsibility for determining or causing to be determined the value of the fund’s investments (including any fair valuation) to the adviser pursuant to valuation policies and procedures approved by the Board. If the adviser determines that reliable market quotations are not readily available, investments are valued at fair value as determined in good faith by the adviser in accordance with such procedures under the oversight of the Board of Trustees. Under the fund’s valuation policies and procedures, market quotations are not considered to be readily available for many types of debt instruments and certain types of derivatives. These investments are generally valued at fair value based on information from independent pricing services. In addition, investments may be valued at fair value if the adviser determines that an investment’s value has been materially affected by events occurring after the close of the exchange or market on which the investment is principally traded (such as foreign exchange or market) and prior to the determination of the fund’s net asset value, or after the halting of trading of a specific security where trading does not resume prior to the close of the exchange or market on which the security is principally traded. Events that occur on a frequent basis after foreign markets close (such as developments in foreign markets and significant movements in the U.S. markets) and prior to the determination of the fund’s net asset value may be deemed to have a material affect on the value of securities traded in foreign markets. Accordingly, the fund’s foreign equity securities may often be valued at fair value. The adviser may rely on independent pricing services or other information (such as the correlation with price movements of similar securities in the same or other markets; the type, cost and investment characteristics of the security; the business and financial condition of the issuer; and trading and other market data) to assist in determining whether to fair value and at what value to fair value an investment. The value of an investment for purposes of calculating the fund’s net asset value can differ depending on the source and method used to determine value. When fair valuation is used, the value of investments used to determine the fund’s net asset value may differ from quoted or published prices for the same investments.
In September 2006, FASB Statement No. 157, Fair Value Measurements (the “Statement”) was issued, and is effective for fiscal years beginning after November 15, 2007 and for all interim periods within those fiscal years. This Statement provides a single definition of fair value, a hierarchy for measuring fair value and expanded disclosures about fair value measurements. Management is evaluating the application of the Statement to the fund, and believes the impact will be limited to expanded disclosures resulting from the adoption of this Statement in the fund’s financial statements.
15
Notes to Financial Statements – continued
Repurchase Agreements – The fund may enter into repurchase agreements with institutions that the fund’s investment adviser has determined are creditworthy. Each repurchase agreement is recorded at cost. The fund requires that the securities collateral in a repurchase transaction be transferred to the custodian in a manner sufficient to enable the fund to obtain those securities in the event of a default under the repurchase agreement. The fund monitors, on a daily basis, the value of the collateral to ensure that its value, including accrued interest, is greater than amounts owed to the fund under each such repurchase agreement. The fund and other funds managed by Massachusetts Financial Services Company (MFS), may utilize a joint trading account for the purpose of entering into one or more repurchase agreements.
Foreign Currency Translation – Purchases and sales of foreign investments, income, and expenses are converted into U.S. dollars based upon currency exchange rates prevailing on the respective dates of such transactions. Gains and losses attributable to foreign currency exchange rates on sales of securities are recorded for financial statement purposes as net realized gains and losses on investments. Gains and losses attributable to foreign exchange rate movements on income and expenses are recorded for financial statement purposes as foreign currency transaction gains and losses. That portion of both realized and unrealized gains and losses on investments that results from fluctuations in foreign currency exchange rates is not separately disclosed.
Security Loans – State Street Bank and Trust Company (“State Street”), as lending agent, may loan the securities of the fund to certain qualified institutions (the “Borrowers”) approved by the fund. The loans are collateralized at all times by cash and/or U.S. Treasury securities in an amount at least equal to the market value of the securities loaned. State Street provides the fund with indemnification against Borrower default. The fund bears the risk of loss with respect to the investment of cash collateral. On loans collateralized by cash, the cash collateral is invested in a money market fund or short-term securities. A portion of the income generated upon investment of the collateral is remitted to the Borrowers, and the remainder is allocated between the fund and the lending agent. On loans collateralized by U.S. Treasury securities, a fee is received from the Borrower, and is allocated between the fund and the lending agent. Net income from securities lending is included in interest income on the Statement of Operations. The dividend and interest income earned on the securities loaned is accounted for in the same manner as other dividend and interest income.
Indemnifications – Under the fund’s organizational documents, its officers and trustees may be indemnified against certain liabilities and expenses arising out of the performance of their duties to the fund. Additionally, in the normal course of business, the fund enters into agreements with service providers that may contain indemnification clauses. The fund’s maximum exposure under these agreements is unknown as this would involve future claims that may be made against the fund that have not yet occurred.
Investment Transactions and Income – Investment transactions are recorded on the trade date. Interest income is recorded on the accrual basis. All premium and discount is amortized or accreted for financial statement purposes in accordance with U.S. generally accepted accounting principles. All discount is accreted for tax reporting purposes as required by federal income tax regulations. Dividends received in cash are recorded on the ex-dividend date. Certain dividends from foreign securities will be recorded when the fund is informed of the dividend if such information is obtained subsequent to the ex-dividend date. Dividend and interest payments received in additional securities are recorded on the ex-dividend or ex-interest date in an amount equal to the value of the security on such date. The fund may receive proceeds from litigation settlements. Any proceeds received from litigation involving portfolio holdings are reflected in the Statement of Operations in realized gain/loss if the security has been disposed of by the fund or in unrealized gain/loss if the security is still held by the fund. Any other proceeds from litigation not related to portfolio holdings are reflected as other income in the Statement of Operations.
Fees Paid Indirectly – The fund’s custody fee may be reduced according to an arrangement that measures the value of cash deposited with the custodian by the fund. This amount, for the year ended December 31, 2007, is shown as a reduction of total expenses on the Statement of Operations.
Tax Matters and Distributions – The fund intends to qualify as a regulated investment company, as defined under Subchapter M of the Internal Revenue Code, and to distribute all of its taxable income, including realized capital gains. As a result, no provision for federal income taxes is required. The fund adopted the provisions of FASB Interpretation No. 48, Accounting for Uncertainty in Income Taxes (“the Interpretation”) on January 1, 2007. The Interpretation prescribes a minimum threshold for financial statement recognition of the benefit of a tax position taken or expected to be taken in a tax return. There was no impact resulting from the adoption of this Interpretation on the fund’s financial statements. Each of the fund’s federal tax returns for the prior three fiscal years remains subject to examination by the Internal Revenue Service. It is the fund’s policy to record interest and penalty charges on underpaid taxes associated with its tax positions as interest expense and other expense, respectively. No such charges were recorded in the current financial statements. Foreign taxes, if any, have been accrued by the fund in the accompanying financial statements.
16
Notes to Financial Statements – continued
Distributions to shareholders are recorded on the ex-dividend date. Income and capital gain distributions are determined in accordance with income tax regulations, which may differ from U.S. generally accepted accounting principles. Certain capital accounts in the financial statements are periodically adjusted for permanent differences in order to reflect their tax character. These adjustments have no impact on net assets or net asset value per share. Temporary differences which arise from recognizing certain items of income, expense, gain or loss in different periods for financial statement and tax purposes will reverse at some time in the future. Distributions in excess of net investment income or net realized gains are temporary overdistributions for financial statement purposes resulting from differences in the recognition or classification of income or distributions for financial statement and tax purposes.
Book/tax differences primarily relate to passive foreign investment companies, wash sale loss deferrals, and foreign taxes.
The tax character of distributions declared to shareholders is as follows:
| | | | |
| | | 12/31/07 | | 12/31/06 |
| Ordinary income (including any short-term capital gains) | | $2,537,777 | | $872,242 |
The federal tax cost and the tax basis components of distributable earnings were as follows:
| | | |
| As of 12/31/07 | | | |
| Cost of investments | | $138,090,161 | |
| Gross appreciation | | 21,770,554 | |
| Gross depreciation | | (6,032,777 | ) |
| Net unrealized appreciation (depreciation) | | $15,737,777 | |
| Undistributed ordinary income | | 1,061,623 | |
| Capital loss carryforwards | | (33,257,724 | ) |
| Other temporary differences | | (28,230 | ) |
As of December 31, 2007, the fund had capital loss carryforwards available to offset future realized gains. Such losses expire as follows:
Multiple Classes of Shares of Beneficial Interest – The fund offers multiple classes of shares, which differ in their respective distribution fees. All shareholders bear the common expenses of the fund based on daily net assets of each class, without distinction between share classes. Dividends are declared separately for each class. Differences in per share dividend rates are generally due to differences in separate class expenses.
| (3) | | Transactions with Affiliates |
Investment Adviser – The fund has an investment advisory agreement with Massachusetts Financial Services Company (MFS) to provide overall investment management and related administrative services and facilities to the fund.
The management fee is computed daily and paid monthly at the following annual rates:
| | |
| First $1 billion of average daily net assets | | 0.90% |
| Next $1 billion of average daily net assets | | 0.75% |
| Average daily net assets in excess of $2 billion | | 0.65% |
The management fee incurred for the year ended December 31, 2007 was equivalent to an annual effective rate of 0.90% of the fund’s average daily net assets.
Distributor – MFS Fund Distributors, Inc. (MFD), a wholly-owned subsidiary of MFS, is the distributor of shares of the fund. The Trustees have adopted a distribution plan for the Service Class shares pursuant to Rule 12b-1 under the Investment Company Act of 1940.
The fund’s distribution plan provides that the fund will pay MFD distribution fees equal to 0.25% per annum of its average daily net assets attributable to Service Class shares as partial consideration for services performed and expenses incurred by MFD and financial intermediaries in connection with the sale and distribution of the fund’s Service Class shares and the sale and distribution of the variable annuity or variable life insurance contracts investing indirectly in Service Class shares. MFD may subsequently pay all, or a portion, of the distribution fees to financial intermediaries.
Shareholder Servicing Agent – MFS Service Center, Inc. (MFSC), a wholly-owned subsidiary of MFS, has contracted to provide transfer agent and recordkeeping functions in connection with the issuance, transfer, and redemption of each class of shares of the fund under a Shareholder Servicing Agent Agreement. During the year ended December 31, 2007, MFSC did not receive a fee for this service.
17
Notes to Financial Statements – continued
Administrator – MFS provides certain financial, legal, shareholder communications, compliance, and other administrative services to the fund. Under an administrative services agreement, the fund partially reimburses MFS the costs incurred to provide these services. The fund is charged an annual fixed amount of $10,000 plus a fee based on average daily net assets.
The administrative services fee incurred for the year ended December 31, 2007 was equivalent to an annual effective rate of 0.0262% of the fund’s average daily net assets.
Trustees’ and Officers’ Compensation – The fund pays compensation to trustees in the form of a retainer, attendance fees, and additional compensation to the Board chairperson. The fund does not pay compensation directly to officers of the fund who are also officers of the investment adviser, all of whom receive remuneration for their services to the fund from MFS. Certain officers of the fund are officers or directors of MFS, MFD, and MFSC.
Other – This fund and certain other MFS funds (the funds) have entered into a services agreement (the Agreement) which provides for payment of fees by the funds to Tarantino LLC in return for the provision of services of an Independent Chief Compliance Officer (ICCO) for the funds. The ICCO is an officer of the funds and the sole member of Tarantino LLC. The funds can terminate the Agreement with Tarantino LLC at any time under the terms of the Agreement. MFS has agreed to bear all expenses associated with office space, other administrative support, and supplies provided to the ICCO. For the year ended December 31, 2007, the fee paid to Tarantino LLC was $743.
Purchases and sales of investments, other than U.S. government securities, purchased option transactions, and short-term obligations, aggregated $114,949,054 and $149,865,872, respectively.
| (5) | | Shares of Beneficial Interest |
The fund’s Declaration of Trust permits the Trustees to issue an unlimited number of full and fractional shares of beneficial interest. Transactions in fund shares were as follows:
| | | | | | | | | | | | |
| | | Year ended 12/31/07 | | | Year ended 12/31/06 | |
| | | Shares | | | Amount | | | Shares | | | Amount | |
| Shares sold | | | | | | | | | | | | |
Initial Class | | 118,766 | | | $2,002,516 | | | 244,457 | | | $3,542,071 | |
Service Class | | 38,253 | | | 655,319 | | | 119,680 | | | 1,700,954 | |
| | 157,019 | | | $2,657,835 | | | 364,137 | | | $5,243,025 | |
| Shares issued to shareholders in reinvestment of distributions | | | | | | | | | | | | |
Initial Class | | 144,269 | | | $2,413,626 | | | 56,469 | | | $845,334 | |
Service Class | | 7,461 | | | 124,151 | | | 1,807 | | | 26,908 | |
| | 151,730 | | | $2,537,777 | | | 58,276 | | | $872,242 | |
| Shares reacquired | | | | | | | | | | | | |
Initial Class | | (2,201,427 | ) | | $(36,985,222 | ) | | (2,372,943 | ) | | $(34,120,787 | ) |
Service Class | | (103,436 | ) | | (1,716,181 | ) | | (130,814 | ) | | (1,883,058 | ) |
| | (2,304,863 | ) | | $(38,701,403 | ) | | (2,503,757 | ) | | $(36,003,845 | ) |
| Net change | | | | | | | | | | | | |
Initial Class | | (1,938,392 | ) | | $(32,569,080 | ) | | (2,072,017 | ) | | $(29,733,382 | ) |
Service Class | | (57,722 | ) | | (936,711 | ) | | (9,327 | ) | | (155,196 | ) |
| | (1,996,114 | ) | | $(33,505,791 | ) | | (2,081,344 | ) | | $(29,888,578 | ) |
The fund and other funds managed by MFS participate in a $1 billion unsecured committed line of credit provided by a syndication of banks under a credit agreement. In addition, the fund and other funds managed by MFS have established uncommitted borrowing arrangements with certain banks. Borrowings may be made for temporary financing needs. Interest is charged to each fund, based on its borrowings, generally at a rate equal to the Federal Reserve funds rate plus 0.30%. In addition, a commitment fee, based on the average daily, unused portion of the committed line of credit, is allocated among the participating funds at the end of each calendar quarter. For the year ended December 31, 2007, the fund’s commitment fee and interest expense were $703 and $146, respectively, and are included in miscellaneous expense on the Statement of Operations.
18
REPORT OF INDEPENDENT REGISTERED PUBLIC ACCOUNTING FIRM
To the Board of Trustees of MFS Variable Insurance Trust II (formerly known as MFS/Sun Life Series Trust) and the Shareholders of MFS Global Growth Portfolio (formerly known as Global Growth Series):
We have audited the accompanying statement of assets and liabilities, including the portfolio of investments, of MFS Global Growth Portfolio (one of the portfolios comprising MFS Variable Insurance Trust II) (the “Trust”) as of December 31, 2007, and the related statement of operations for the year then ended, the statements of changes in net assets for each of the two years in the period then ended, and the financial highlights for each of the five years in the period then ended. These financial statements and financial highlights are the responsibility of the Trust’s management. Our responsibility is to express an opinion on these financial statements and financial highlights based on our audits.
We conducted our audits in accordance with the standards of the Public Company Accounting Oversight Board (United States). Those standards require that we plan and perform the audit to obtain reasonable assurance about whether the financial statements and financial highlights are free of material misstatement. The Trust is not required to have, nor were we engaged to perform, an audit of its internal control over financial reporting. Our audits included consideration of internal control over financial reporting as a basis for designing audit procedures that are appropriate in the circumstances, but not for the purpose of expressing an opinion on the effectiveness of the Trust’s internal control over financial reporting. Accordingly, we express no such opinion. An audit also includes examining, on a test basis, evidence supporting the amounts and disclosures in the financial statements, assessing the accounting principles used and significant estimates made by management, as well as evaluating the overall financial statement presentation. Our procedures included confirmation of securities owned as of December 31, 2007, by correspondence with the custodian and brokers; where replies were not received from brokers, we performed other auditing procedures. We believe that our audits provide a reasonable basis for our opinion.
In our opinion, such financial statements and financial highlights present fairly, in all material respects, the financial position of MFS Global Growth Portfolio as of December 31, 2007, the results of its operations for the year then ended, the changes in its net assets for each of the two years in the period then ended, and its financial highlights for each of the five years in the period then ended, in conformity with accounting principles generally accepted in the United States of America.
DELOITTE & TOUCHE LLP
Boston, Massachusetts
February 15, 2008
19
TRUSTEES AND OFFICERS – IDENTIFICATION AND BACKGROUND
The Trustees and officers of the Trust, as of February 1, 2008, are listed below, together with their principal occupations during the past five years. (Their titles may have varied during that period.) The address of each Trustee and officer is 500 Boylston Street, Boston, Massachusetts 02116.
| | | | | | |
Name, Date of Birth | | Position(s) Held
with Fund | | Trustee/Officer
Since(1) | | Principal Occupations During the Past Five Years &
Other Directorships(2) |
| INTERESTED TRUSTEE | | | | | | |
David D. Horn(3) (born 06/07/41) | | Trustee | | April 1986 | | Private investor; Retired; Sun Life Assurance Company of Canada, Former Senior Vice President and General Manager for the United States (until 1997); Retired: Sun Life Assurance Company of Canada, Director (until March 2004) |
| | |
| INDEPENDENT TRUSTEES | | | | |
J. Kermit Birchfield (born 01/08/40) | | Chairman | | May 1997 | | Consultant; Century Partners, Inc. (investments), Director (1988 to present); Displaytech, Inc. (technology), Director (1995 to present); Dessin Fournir LLC (furniture manufacturer), Director (2005 to present); Intermountain Gas Company, Inc. & Intermountain Industries, Inc. (oil & gas exploration and production) (1988 to present); Site Watch LLC (software to monitor oil tanks) Managing Director (2006 to present); Juridica Investments (fund investing in judicial matters) Director (2007 to present); Dairy Mart Convenience Stores, Inc. (convenience stores), Chairman (1997 to 2003) |
| | | |
Robert C. Bishop (born 01/13/43) | | Trustee | | May 2001 | | Autolmmune Inc. (pharmaceutical product licensing), Chairman, President and Chief Executive Officer (1992 to present); Caliper Life Sciences Corp. (laboratory analytical instruments), Director (2002 to present); Millipore Corporation (biopharmaceutical/research laboratory products), Director (1997 to present); Optobionics Corporation (ophthalmic devices), Director (2002 to 2007); Quintiles Transnational Corp. (contract research services), Director (until 2003) |
| | | |
Frederick H. Dulles (born 03/12/42) | | Trustee | | May 2001 | | Ten State International Law PLLC (law firm), Of Counsel (since 2006); Prudential Carolina Real Estate, (real estate), Broker (since 2006); Free Enterprise Foundation, Inc. (research institute), Director & Secretary (until 2008); Disher, Hamrick & Myers Residential, Inc. (real estate) Broker (until 2006); Frederick H. Dulles law practice (until 2006); Ten State Street LLP (law firm), Member (until 2005); McFadden, Pilkington & Ward LLP (solicitors and registered foreign lawyers), Member & Of Counsel (until 2003) |
| | | |
Marcia A. Kean (born 06/30/48) | | Trustee | | April 2005 | | Feinstein Kean Healthcare (consulting), Chief Executive Officer (since December 2002), Managing Director (prior to May 2001); Ardais Corporation (biotech products), Senior Vice President – Commercialization (February 2002 until November 2002) |
| | | |
Ronald G. Steinhart (born 06/15/40) | | Trustee | | May 2001 | | Private investor; Penske Automotive Group (automotive retailer), Director (2001 to present); Penson Worldwide, Inc. (securities clearance), Director (2006 to present); Animal Health International, Inc. (animal health products), Director (2007 to present); Texas Industries (concrete/aggregates/cement), Director (2007 to present); Carreker Corporation (technology consulting) Director (until 2005); Prentiss Properties Trust (real estate investment trust), Director (until 2006) |
| | | |
Haviland Wright (born 07/21/48) | | Trustee | | May 2001 | | Elixir Technologies Corporation (software) Director (2005 to present); Nano Loa Inc. (liquid crystal displays), Director (2003 to present); Silk Displays, Inc. (smart polymers) Director (2007 to present); Displaytech, Inc. (technology) Chairman and CEO (1995 – 2002) |
| | | |
| TRUSTEE EMERITUS | | | | | | |
Samuel Adams (born 10/19/25) | | Trustee Emeritus | | | | Retired; Kirkpatrick & Lockhart Preston Gates Ellis LLP (law firm), Of Counsel |
| | | |
| OFFICERS | | | | | | |
Maria F. Dwyer(4) (born 12/01/58) | | President | | November 2005 | | Massachusetts Financial Services Company, Executive Vice President and Chief Regulatory Officer (since March 2004); Fidelity Management & Research Company, Vice President (prior to March 2004); Fidelity Group of Funds, President and Treasurer (prior to March 2004) |
| | | |
Tracy Atkinson(4) (born 12/30/64) | | Treasurer | | September 2005 | | Massachusetts Financial Services Company, Senior Vice President (since September 2004); PricewaterhouseCoopers LLP, Partner (prior to September 2004) |
| | | |
Christopher R. Bohane(4) (born 01/18/74) | | Assistant Secretary and Assistant Clerk | | July 2005 | | Massachusetts Financial Services Company, Vice President and Senior Counsel (since April 2003); Kirkpatrick & Lockhart LLP (law firm), Associate (prior to April 2003) |
| | | |
Ethan D. Corey(4) (born 11/21/63) | | Assistant Secretary and Assistant Clerk | | July 2005 | | Massachusetts Financial Services Company, Senior Vice President and Associate General Counsel (since April 2006); Special Counsel (prior to April 2006); Dechert LLP (law firm), Counsel (prior to December 2004) |
| | | |
David L. DiLorenzo(4) (born 08/10/68) | | Assistant Treasurer | | July 2005 | | Massachusetts Financial Services Company, Vice President (since June 2005); JP Morgan Investor Services, Vice President (January 2001 to June 2005) |
20
Trustees and Officers – continued
| | | | | | |
Name, Date of Birth | | Position(s) Held
with Fund | | Trustee/Officer
Since(1) | | Principal Occupations During the Past Five Years &
Other Directorships(2) |
Timothy M. Fagan(4) (born 07/10/68) | | Assistant Secretary and Assistant Clerk | | September 2005 | | Massachusetts Financial Services Company, Vice President and Senior Counsel (since September 2005); John Hancock Advisers, LLC, Vice President and Chief Compliance Officer (September 2004 to August 2005) Senior Attorney (prior to September 2004); John Hancock Group of Funds, Vice President and Chief Compliance Officer (September 2004 to December 2004) |
| | | |
Mark D. Fischer(4) (born 10/27/70) | | Assistant Treasurer | | July 2005 | | Massachusetts Financial Services Company, Vice President (since May 2005); JP Morgan Investment Management Company, Vice President (prior to May 2005) |
| | | |
Brian E. Langenfeld(4) (born 03/07/73) | | Assistant Secretary and Assistant Clerk | | May 2006 | | Massachusetts Financial Services Company, Assistant Vice President and Counsel (since May 2006); John Hancock Advisers, LLC, Assistant Vice President and Counsel (May 2005 to April 2006); John Hancock Advisers, LLC, Attorney and Assistant Secretary (prior to May 2005) |
| | | |
Ellen Moynihan(4) (born 11/13/57) | | Assistant Treasurer | | May 1997 | | Massachusetts Financial Services Company, Senior Vice President |
| | | |
Susan S. Newton(4) (born 03/07/50) | | Assistant Secretary and Assistant Clerk | | May 2005 | | Massachusetts Financial Services Company, Senior Vice President and Assistant General Counsel (since April 2005); John Hancock Advisers, LLC, Senior Vice President, Secretary and Chief Legal Officer (prior to April 2005); John Hancock Group of Funds, Senior Vice President, Secretary and Chief Legal Officer (prior to April 2005) |
| | | |
Susan A. Pereira(4) (born 11/05/70) | | Assistant Secretary and Assistant Clerk | | July 2005 | | Massachusetts Financial Services Company, Vice President and Senior Counsel (since June 2004); Bingham McCutchen LLP (law firm), Associate (January 2001 to June 2004) |
| | | |
Mark N. Polebaum(4) (born 05/01/52) | | Secretary and Assistant Clerk | | February 2006 | | Massachusetts Financial Services Company, Executive Vice President, General Counsel and Secretary (since January 2006); Wilmer Cutler Pickering Hale and Dorr LLP (law firm), Partner (prior to January 2006) |
| | | |
Frank L. Tarantino (born 03/07/44) | | Independent Chief Compliance Officer | | September 2004 | | Tarantino LLC (provider of compliance services), Principal (since June 2004); CRA Business Strategies Group (consulting services), Executive Vice President (April 2003 to June 2004); David L. Babson & Co. (investment adviser), Managing Director, Chief Administrative Officer and Director (February 1997 to March 2003) |
| | | |
Richard S. Weitzel(4) (born 7/16/70) | | Assistant Secretary and Assistant Clerk | | October 2007 | | Massachusetts Financial Services Company, Vice President and Assistant General Counsel (since 2007); Vice President and Senior Counsel (since May 2004); Massachusetts Department of Business and Technology, General Counsel (February 2003 to April 2004); Massachusetts Office of the Attorney General, Assistant Attorney General ( April 2001 to February 2003); Ropes and Gray, Associate (prior to April 2001) |
| | | |
James O. Yost(4) (born 06/12/60) | | Assistant Treasurer | | April 1992 | | Massachusetts Financial Services Company, Senior Vice President |
| (1) | Date first appointed to serve as Trustee/Officer of an MFS fund or a Compass variable account. Each Trustee has served continuously since appointment. |
| (2) | Directorships or trusteeships of companies required to report to the Securities and Exchange Commission (i.e., “public companies”). |
| (3) | “Interested person” of the Sun Life of Canada (U.S.), within the meaning of the Investment Company Act of 1940 (referred to as the 1940 Act), which is the principal federal law governing investment companies like the Series. The address of Sun Life of Canada (U.S.) is One Sun Life Executive Park, Wellesley Hills, Massachusetts 02481. |
| (4) | “Interested person” of MFS within the meaning of the 1940 Act. The address of MFS is 500 Boylston Street, Boston, Massachusetts 02116. |
The Trust does not hold annual meetings for the purpose of electing Trustees, and Trustees are not elected for fixed terms. Each Trustee and officer holds office until his or her successor is chosen and qualified, or until his or her earlier death, resignation, retirement or removal.
All Trustees currently serve as Trustees of the Trust and have served in that capacity since originally elected or appointed. All of the Trustees are also Managers of the Compass Variable Accounts. The executive officers of the Trust hold similar offices for the Compass Variable Accounts and other funds in the MFS fund complex. As of January 1, 2008, each Trustee serves as a Trustee or Manager of 35 Accounts/Funds.
21
Trustees and Officers – continued
The Statement of Additional Information contains further information about the Trustees and is available without charge upon request by calling 1-800-225-2606.
| | |
Investment Adviser
Massachusetts Financial Services Company 500 Boylston Street, Boston, MA 02116-3741 | | Custodian State Street Bank and Trust Company 225 Franklin Street, Boston, MA 02110 |
Distributor
MFS Fund Distributors, Inc. 500 Boylston Street, Boston, MA 02116-3741 | | Independent Registered Public Accounting Firm Deloitte & Touche LLP 200 Berkeley Street, Boston, MA 02116 |
Portfolio Managers Barry Dargan Nicholas Smithie | | |
22
BOARD REVIEW OF INVESTMENT ADVISORY AGREEMENT
The Investment Company Act of 1940 requires that both the full Board of Trustees and a majority of the non-interested (“independent”) Trustees, voting separately, annually approve the continuation of the investment advisory agreement between MFS Variable Insurance Trust II (the “Trust”) and Massachusetts Financial Services Company (MFS) on behalf of the Fund. The Trustees consider matters bearing on the Fund and the advisory arrangements at their meetings throughout the year, including a review of performance data at each regular meeting. In addition, the independent Trustees met several times over the course of three months beginning in May and ending in July 2007 (“contract review meetings”) for the specific purpose of considering whether to approve the continuation of the investment advisory agreement for the Fund. The independent Trustees were assisted in their evaluation of the investment advisory agreement by independent legal counsel, from whom they received separate legal advice and with whom they met separately from MFS management during various contract review meetings. The independent Trustees were also assisted in this process by the Fund’s Independent Chief Compliance Officer, a full-time senior officer appointed by and reporting to the independent Trustees.
In connection with their deliberations, the Trustees, including the independent Trustees, considered such information and factors as they believed, in light of the legal advice furnished to them and their own business judgment, to be relevant. The investment advisory agreement was considered separately for the Fund, although the Trustees also took into account the common interests of all Funds in the Trust in their review. As described below, the Trustees considered the nature, quality, and extent of the various investment advisory, administrative, and shareholder services performed by MFS under the existing investment advisory agreement and other arrangements with the Trust.
In connection with their contract review meetings, the Trustees received and relied upon materials which included, among other items: (i) information provided by Lipper Inc. on the investment performance of the Fund for various time periods ended December 31, 2006, compared to the investment performance of a group of funds with substantially similar investment classifications/objectives (the “Lipper performance universe”), as well as the investment performance of a group of funds identified by objective criteria suggested by MFS (“peer funds”), (ii) information provided by Lipper Inc. on the Fund’s advisory fees and other expenses compared to the advisory fees and other expenses of comparable funds identified by Lipper (the “Lipper expense group”), as well as the advisory fees and other expenses of peer funds identified by objective criteria suggested by MFS, (iii) information provided by MFS on the advisory fees of comparable portfolios of its other clients, including institutional separate account and other clients, (iv) information as to whether, and to what extent applicable, expense waivers, reimbursements or fee “breakpoints” are observed for the Fund, (v) information regarding MFS’ financial results and financial condition, including MFS’ and certain of its affiliates’ estimated profitability from services performed for the Fund, (vi) MFS’ views regarding the outlook for the mutual fund industry and its strategic business plans, (vii) descriptions of various functions performed by MFS for the Trust, such as compliance monitoring and portfolio trading practices, and (viii) information regarding the overall organization of MFS, including information about MFS’ senior management and other personnel providing investment advisory, administrative and other services to the Fund. The comparative performance, fee and expense information prepared and provided by Lipper Inc. was not independently verified, and the independent Trustees did not independently verify any information provided to them by MFS.
The Trustees’ conclusion as to the continuation of the investment advisory agreement was based on comprehensive consideration of all information provided to the Trustees and not the result of any single factor. Some of the factors that figured particularly in the Trustees’ deliberations are described below for the Fund, while individual Trustees may have given different weight to various factors and evaluated the information presented as a whole differently than another Trustee. The Trustees recognized that the fee arrangements for the Fund reflect years of review and discussion between the independent Trustees and MFS, that certain aspects of such arrangements may receive greater scrutiny in some years than others, and that the Trustees’ conclusions may be based, in part, on their consideration of these same arrangements during the course of the year and in prior years.
Based on information provided by Lipper Inc. and MFS, the Trustees compared the Fund’s total return investment performance to the performance of a peer group of funds over various time periods. The Trustees placed particular emphasis on the total return performance of the Fund’s Initial Class shares in comparison to the performance of funds in its Lipper performance universe over the one-, three- and five-year periods. The Trustees did not rely on performance results for more recent periods, including those shown elsewhere in this report.
The Trustees noted the performance of the Fund’s Initial Class shares was in the 4th quintile relative to the other funds in the Lipper Classification Index for the one-year period (the 1st quintile being the best performers and the 5th quintile being the worst performers). The total return performance of the Fund was in the 4th quintile for the three-year period and the 3rd quintile for the five-year period ended December 31, 2006, relative to the Lipper performance universe. Based on the nature and quality of services provided by MFS and MFS’ explanation of recent steps taken to improve performance, the Board of Trustees concluded that the Fund’s performance was adequate.
23
Board Review of Investment Advisory Agreement – continued
In the course of their deliberations, the Trustees took into account information provided by MFS during contract review meetings, as well as during investment review meetings conducted with portfolio management personnel during the course of the year.
In assessing the reasonableness of the Fund’s advisory fee, the Trustees considered, among other information, the Fund’s advisory fee and the total expense ratio of the Fund’s Initial Class shares as a percentage of average daily net assets, compared to the advisory fee and total expense ratios of its peer group of funds based on information provided by Lipper Inc. and MFS. The Trustees also considered the advisory fees charged by MFS to institutional accounts. In comparing these fees, the Trustees considered the generally broader scope of services provided by MFS to the Trust than those provided to institutional accounts. The Trustees also considered the higher demands placed on MFS’ investment personnel and trading infrastructure as a result of the daily cash in-flows and out-flows of the Fund, and the impact on MFS and related expenses due to the more extensive regulatory regime to which the Fund is subject, compared to institutional accounts.
In considering the fees, the Trustees noted from the Lipper data that the Fund’s effective advisory fee rate was approximately at the median and total expense ratio was above the median of such fees and expenses of funds in the Lipper expense group. The Trustees further concluded that the existing breakpoints were sufficient to allow the Fund to benefit from economies of scale as its assets grow.
The Trustees also considered information prepared by MFS relating to its costs and profits with respect to the Fund and other investment companies and accounts advised by MFS, as well as MFS’ methodologies used to determine and allocate its costs to the Fund and other accounts and products for purposes of estimating profitability.
After reviewing these and other factors described below, the Trustees concluded that the advisory fee charged to the Fund represents reasonable compensation in light of the nature and quality of the services being provided by MFS.
In addition, the Trustees considered MFS’ resources and related efforts to continue to retain, attract and motivate capable personnel to serve the Fund. The Trustees also considered the financial resources of MFS and its parent, Sun Life Financial Inc. The Trustees further considered any advantages and possible disadvantages of having an adviser which also serves other investment companies as well as institutional accounts.
The Trustees also considered the nature, quality, cost, and extent of administrative, transfer agency, and distribution services provided to the Fund by MFS and its affiliates under agreements and plans other than the investment advisory agreement, including the 12b-1 fees the Fund pays to MFS Fund Distributors, Inc., an affiliate of MFS. The Trustees also considered the nature, extent and quality of certain other services MFS performs or arranges on the Fund’s behalf, which may include securities lending programs, directed expense payment programs, class action recovery programs, and MFS’ interaction with third-party service providers, principally custodians and sub-custodians. The Trustees concluded that the various non-advisory services provided by MFS and its affiliates on behalf of the Fund were satisfactory. The Trustees also considered the benefits to MFS from the use of the Fund’s portfolio brokerage commissions to pay for research and other similar services (including MFS’ policy not to use “soft dollars” generated by Fund portfolio transactions to pay for third-party research), and various other factors. Additionally, the Trustees considered so-called “fall-out benefits” to MFS such as reputational value derived from serving as investment manager to the Trust, and determined that any such benefits derived by MFS were reasonable and fair.
Based on their evaluation of factors that they deemed to be material, including those factors described above, the Board of Trustees, including a majority of the independent Trustees, concluded that the investment advisory agreement should be continued for an additional one-year period, commencing September 1, 2007.
A discussion regarding the Board’s most recent review and renewal of the Fund’s investment advisory agreement is available by clicking on the Fund’s name under “Variable Insurance Portfolios” on the “Products & Performance” page on the MFS Web site (mfs.com).
24
PROXY VOTING POLICIES AND INFORMATION
A general description of the MFS funds’ proxy voting policies and procedures is available without charge, upon request, by calling 1-800-225-2606, by visiting the About MFS section of mfs.com or by visiting the SEC’s Web site at http://www.sec.gov.
Information regarding how the fund voted proxies relating to portfolio securities during the most recent twelve-month period ended June 30 is available without charge by visiting the Proxy Voting section of mfs.com or by visiting the SEC’s Web site at http://www.sec.gov.
QUARTERLY PORTFOLIO DISCLOSURE
The fund will file a complete schedule of portfolio holdings with the Securities and Exchange Commission (the Commission) for the first and third quarters of each fiscal year on Form N-Q. The fund’s Form N-Q may be reviewed and copied at the:
Public Reference Room
Securities and Exchange Commission
100 F Street, NE, Room 1580
Washington, D.C. 20549
Information on the operation of the Public Reference Room may be obtained by calling the Commission at 1-800-SEC-0330. The fund’s Form N-Q is available on the EDGAR database on the Commission’s Internet Web site at http://www.sec.gov, and copies of this information may be obtained, upon payment of a duplicating fee, by electronic request at the following e-mail address: publicinfo@sec.gov or by writing the Public Reference Section at the above address.
A shareholder can also obtain the quarterly portfolio holdings report at mfs.com.
FEDERAL TAX INFORMATION (unaudited)
The following information is provided pursuant to provisions of the Internal Revenue Code.
For corporate shareholders, 43.08% of the ordinary income dividends paid during the fiscal year qualify for the corporate dividends received deduction.
Income derived from foreign sources was $1,529,973. The fund intends to pass through foreign tax credits of $61,825 for the fiscal year.
25
MFS® PRIVACY NOTICE
Privacy is a concern for every investor today. At MFS Investment Management® and the MFS funds, we take this concern very seriously. We want you to understand our policies about the investment products and services that we offer, and how we protect the nonpublic personal information of investors who have a direct relationship with us and our wholly owned subsidiaries.
Throughout our business relationship, you provide us with personal information. We maintain information and records about you, your investments, and the services you use. Examples of the nonpublic personal information we maintain include
| | Ÿ | | data from investment applications and other forms |
| | Ÿ | | share balances and transactional history with us, our affiliates, or others |
| | Ÿ | | facts from a consumer reporting agency |
We do not disclose any nonpublic personal information about our customers or former customers to anyone, except as permitted by law. We may share nonpublic personal information with third parties or certain of our affiliates in connection with servicing your account or processing your transactions. We may share information with companies or financial institutions that perform marketing services on our behalf or with other financial institutions with which we have joint marketing arrangements, subject to any legal requirements.
Authorization to access your nonpublic personal information is limited to appropriate personnel who provide products, services, or information to you. We maintain physical, electronic, and procedural safeguards to help protect the personal information we collect about you.
If you have any questions about the MFS privacy policy, please call 1-800-225-2606 any business day between 8 a.m. and 8 p.m. Eastern time.
Note: If you own MFS products or receive MFS services in the name of a third party such as a bank or broker-dealer, their privacy policy may apply to you instead of ours.
26
CONTACT US
Web site
mfs.com
Account service and
literature
Shareholders
1-877-411-3325
9 a.m. to 5 p.m. ET
Investment professionals
1-800-637-8630
8 a.m. to 5 p.m. ET
Mailing address
MFS Service Center, Inc.
Attn: Institutional Alliance Services (IAS)
P.O. Box 55824
Boston, MA
02205-5824
Overnight mail
MFS Service Center, Inc.
Attn: Institutional Alliance Services (IAS)
500 Boylston Street
Boston, MA 02116-3741


MFS® Variable Insurance Trust IISM
Annual report
MFS® Blended ResearchSM Value Portfolio
12/31/07
BRV-ANN
MFS® BLENDED RESEARCHSM VALUE PORTFOLIO
The report is prepared for the general information of contract owners. It is authorized for distribution to prospective investors only when preceded or accompanied by a current prospectus.
NOT FDIC INSURED MAY LOSE VALUE NO BANK OR CREDIT UNION GUARANTEE NOT A DEPOSIT NOT INSURED BY ANY FEDERAL GOVERNMENT AGENCY OR NCUA/NCUSIF
LETTER FROM THE CEO

Dear Contract Owners:
The past year has been a great example of why investors should keep their eyes on the long term.
In 2006 the Dow Jones Industrial Average returned 19% and was fairly stable. This year we have seen a greater level of volatility than has been experienced in recent years. The Dow hit several new highs but also experienced swift drops as a global credit crisis swept through markets, spurred by defaults on U.S. subprime loans and a liquidity crunch. Still, even with this volatility, the Dow ended the first three quarters of 2007 with a return near 13%.
U.S. Treasury bonds gained ground, especially in the third quarter as investors sought less risky asset classes. The spreads of many lower-quality debt investments widened.
In 2007 the U.S. dollar fell against the euro, oil prices hit their highest levels yet, and gold spiked to its steepest price in 28 years. Around the globe, stocks sold off as risk aversion mounted. As we have said before, markets can be volatile, and investors should make sure they have an investment plan that can carry them through the peaks and troughs.
If you are focused on a long-term investment strategy, the short-term ups and downs of the markets should not necessarily dictate portfolio action on your part. In our view, investors who remain committed to a long-term plan are more likely to achieve their financial goals.
In any market environment, we believe individual investors are best served by following a three-pronged investment strategy of allocating their holdings across the major asset classes, diversifying within each class, and regularly rebalancing their portfolios to maintain their desired allocations. Of course, these strategies cannot guarantee a profit or protect against a loss. Investing and planning for the long term require diligence and patience, two traits that in our experience are essential to capitalizing on the many opportunities the financial markets can offer — through both up and down economic cycles.
Respectfully,

Robert J. Manning
Chief Executive Officer and Chief Investment Officer
MFS Investment Management®
February 15, 2008
The opinions expressed in this letter are subject to change, may not be relied upon for investment advice, and no forecasts can be guaranteed.
1
PORTFOLIO COMPOSITION
Portfolio structure
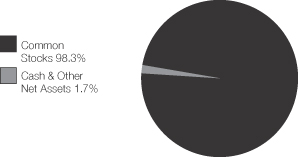
| | |
| Top ten holdings | | |
| Exxon Mobil Corp. | | 6.9% |
| General Electric Co. | | 3.8% |
| Chevron Corp. | | 3.6% |
| Bank of America Corp. | | 3.5% |
| JPMorgan Chase & Co. | | 3.0% |
| American International Group, Inc. | | 2.7% |
| AT&T, Inc. | | 2.6% |
| Pfizer, Inc. | | 2.3% |
| Procter & Gamble Co. | | 2.2% |
| Citigroup, Inc. | | 2.0% |
| | |
| Equity sectors | | |
| Financial Services | | 27.3% |
| Utilities & Communications | | 15.6% |
| Energy | | 14.9% |
| Industrial Goods & Services | | 9.4% |
| Health Care | | 8.5% |
| Consumer Staples | | 6.6% |
| Leisure | | 3.9% |
| Basic Materials | | 3.5% |
| Technology | | 3.4% |
| Retailing | | 2.8% |
| Special Products & Services | | 1.0% |
| Autos & Housing | | 0.9% |
| Transportation | | 0.5% |
Percentages are based on net assets as of 12/31/07.
The portfolio is actively managed and current holdings may be different.
2
EXPENSE TABLE
Fund Expenses Borne by the Contract Holders During the Period, December 18, 2007 through December 31, 2007
As a contract holder of the fund, you incur ongoing costs, including management fees; distribution (12b-1) fees; and other fund expenses. This example is intended to help you understand your ongoing costs (in dollars) of investing in the fund and to compare these costs with the ongoing costs of investing in other mutual funds.
The example is based on an investment of $1,000 invested at the beginning of the period and held for the entire period December 18, 2007 through December 31, 2007. The hypothetical example assumes the Share Classes were in existence for the entire six months ended December 31, 2007.
Actual expenses
The first line for each share class in the following table provides information about actual account values and actual expenses. You may use the information in this line, together with the amount you invested, to estimate the expenses that you paid over the period. Simply divide your account value by $1,000 (for example, an $8,600 account value divided by $1,000 = 8.6), then multiply the result by the number in the first line under the heading entitled “Expenses Paid During Period” to estimate the expenses you paid on your account during this period.
Hypothetical example for comparison purposes
The second line for each share class in the following table provides information about hypothetical account values and hypothetical expenses based on the fund’s actual expense ratio and an assumed rate of return of 5% per year before expenses, which is not the fund’s actual return. The hypothetical account values and expenses may not be used to estimate the actual ending account balance or expenses you paid for the period. You may use this information to compare the ongoing costs of investing in the fund and other funds. To do so, compare this 5% hypothetical example with the 5% hypothetical examples that appear in the shareholder reports of the other funds.
Please note that the expenses shown in the table are meant to highlight the fund’s ongoing costs only and do not take into account the fees and expenses imposed under the variable contracts through which your investment in the fund is made. Therefore, the second line for each share class in the table is useful in comparing ongoing costs associated with an investment in vehicles (such as the fund) which fund benefits under variable annuity and variable life insurance contracts and to qualified pension and retirement plans only, and will not help you determine the relative total costs of investing in the fund through variable annuity and variable life insurance contracts. If the fees and expenses imposed under the variable contracts were included, your costs would have been higher.
| | | | | | | | | | |
Share Class | | | | Annualized
Expense Ratio | | Beginning
Account Value
12/18/07 | | Ending
Account Value
12/31/07 | | Expenses Paid
During Period (p)
12/18/07-12/31/07 |
| Initial Class | | Actual | | 0.60% | | $1,000.00 | | $1,008.00 | | $0.21 |
| | Hypothetical (h) | | 0.60% | | $1,000.00 | | $1,022.18 | | $3.06 |
| Service Class | | Actual | | 0.85% | | $1,000.00 | | $1,008.00 | | $0.30 |
| | Hypothetical (h) | | 0.85% | | $1,000.00 | | $1,020.92 | | $4.33 |
| (h) | 5% class return per year before expenses. |
| (p) | Expenses paid is equal to each class’ annualized expense ratio, as shown above, multiplied by the average account value over the period, multiplied by the number of days in the period, divided by the number of days in the year. For the hypothetical expenses paid it is assumed that the fund was in existence for the entire six month period ended December 31, 2007. |
3
PORTFOLIO OF INVESTMENTS – 12/31/07
The Portfolio of Investments is a complete list of all securities owned by your fund.
It is categorized by broad-based asset classes.
| | | | | |
| Issuer | | Shares/Par | | Value ($) |
| | | | | |
| COMMON STOCKS – 98.3% | | | | | |
| Aerospace – 0.6% | | | | | |
| Boeing Co. | | 210 | | $ | 18,367 |
| Raytheon Co. | | 160 | | | 9,712 |
| | | | | |
| | | | $ | 28,079 |
| | | | | |
| Airlines – 0.3% | | | | | |
| Southwest Airlines Co. | | 1,080 | | $ | 13,176 |
| | | | | |
| Apparel Manufacturers – 0.8% | | | | | |
| Coach, Inc. (a) | | 1,370 | | $ | 41,895 |
| | | | | |
| Automotive – 0.4% | | | | | |
| Goodyear Tire & Rubber Co. (a) | | 790 | | $ | 22,294 |
| | | | | |
| Biotechnology – 1.1% | | | | | |
| Amgen, Inc. (a) | | 1,220 | | $ | 56,657 |
| | | | | |
| Broadcasting – 0.7% | | | | | |
| Walt Disney Co. | | 1,160 | | $ | 37,445 |
| | | | | |
| Brokerage & Asset Managers – 3.1% | | | | | |
| Bear Stearns Cos., Inc. | | 340 | | $ | 30,005 |
| Lehman Brothers Holdings, Inc. | | 390 | | | 25,522 |
| Morgan Stanley | | 950 | | | 50,454 |
| TD AMERITRADE Holding Corp. (a) | | 2,550 | | | 51,153 |
| | | | | |
| | | | $ | 157,134 |
| | | | | |
| Business Services – 1.0% | | | | | |
| Western Union Co. | | 2,160 | | $ | 52,445 |
| | | | | |
| Cable TV – 1.0% | | | | | |
| EchoStar Communications Corp., “A” (a) | | 590 | | $ | 22,255 |
| Liberty Global, Inc., “A” (a) | | 750 | | | 29,392 |
| | | | | |
| | | | $ | 51,647 |
| | | | | |
| Chemicals – 1.5% | | | | | |
| 3M Co. | | 220 | | $ | 18,550 |
| PPG Industries, Inc. | | 840 | | | 58,993 |
| | | | | |
| | | | $ | 77,543 |
| | | | | |
| Computer Software – 0.7% | | | | | |
| Oracle Corp. (a) | | 1,510 | | $ | 34,096 |
| | | | | |
| Computer Software – Systems – 1.4% | | | | | |
| International Business Machines Corp. | | 670 | | $ | 72,427 |
| | | | | |
| Construction – 0.5% | | | | | |
| Sherwin-Williams Co. | | 410 | | $ | 23,796 |
| | | | | |
| Consumer Goods & Services – 2.2% | | | | | |
| Procter & Gamble Co. | | 1,510 | | $ | 110,864 |
| | | | | |
| Containers – 0.8% | | | | | |
| Sonoco Products Co. | | 1,220 | | $ | 39,870 |
| | | | | |
| Electrical Equipment – 5.5% | | | | | |
| General Electric Co. | | 5,130 | | $ | 190,169 |
| Tyco International Ltd. | | 940 | | | 37,271 |
| WESCO International, Inc. (a) | | 1,230 | | | 48,757 |
| | | | | |
| | | | $ | 276,197 |
| | | | | |
| | | | | |
| Issuer | | Shares/Par | | Value ($) |
| | | | | |
| COMMON STOCKS – continued | | | | | |
| Electronics – 0.2% | | | | | |
| Agilent Technologies, Inc. (a) | | 280 | | $ | 10,287 |
| | | | | |
| Energy – Independent – 1.0% | | | | | |
| Apache Corp. | | 480 | | $ | 51,619 |
| | | | | |
| Energy – Integrated – 13.1% | | | | | |
| Chevron Corp. | | 1,930 | | $ | 180,127 |
| ConocoPhillips | | 560 | | | 49,448 |
| Exxon Mobil Corp. | | 3,720 | | | 348,527 |
| Marathon Oil Corp. | | 1,370 | | | 83,378 |
| | | | | |
| | | | $ | 661,480 |
| | | | | |
| Food & Beverages – 2.5% | | | | | |
| Coca-Cola Co. | | 1,180 | | $ | 72,417 |
| General Mills, Inc. | | 910 | | | 51,870 |
| | | | | |
| | | | $ | 124,287 |
| | | | | |
| Gaming & Lodging – 1.1% | | | | | |
| Royal Caribbean Cruises Ltd. | | 1,290 | | $ | 54,748 |
| | | | | |
| General Merchandise – 0.7% | | | | | |
| Macy’s, Inc. | | 1,270 | | $ | 32,855 |
| | | | | |
| Health Maintenance Organizations – 1.1% | | | | | |
| Aetna, Inc. | | 930 | | $ | 53,689 |
| | | | | |
| Insurance – 8.8% | | | | | |
| Allied World Assurance Co. Holdings Ltd. | | 1,040 | | $ | 52,177 |
| American International Group, Inc. | | 2,360 | | | 137,588 |
| Axis Capital Holdings Ltd. | | 300 | | | 11,691 |
| Chubb Corp. | | 440 | | | 24,015 |
| Genworth Financial, Inc., “A” | | 2,350 | | | 59,808 |
| MetLife, Inc. | | 200 | | | 12,324 |
| Prudential Financial, Inc. | | 780 | | | 72,571 |
| Travelers Cos., Inc. | | 1,400 | | | 75,320 |
| | | | | |
| | | | $ | 445,494 |
| | | | | |
| Machinery & Tools – 2.5% | | | | | |
| Eaton Corp. | | 650 | | $ | 63,017 |
| PACCAR, Inc. | | 190 | | | 10,351 |
| Timken Co. | | 1,630 | | | 53,546 |
| | | | | |
| | | | $ | 126,914 |
| | | | | |
| Major Banks – 10.9% | | | | | |
| Bank of America Corp. | | 4,320 | | $ | 178,243 |
| Bank of New York Mellon Corp. | | 210 | | | 10,239 |
| JPMorgan Chase & Co. | | 3,520 | | | 153,648 |
| PNC Financial Services Group, Inc. | | 1,000 | | | 65,650 |
| Regions Financial Corp. | | 1,520 | | | 35,948 |
| State Street Corp. | | 690 | | | 56,028 |
| SunTrust Banks, Inc. | | 790 | | | 49,367 |
| | | | | |
| | | | $ | 549,123 |
| | | | | |
| Medical & Health Technology & Services – 0.8% | | | |
| AmerisourceBergen Corp. | | 910 | | $ | 40,832 |
| | | | | |
4
Portfolio of Investments – continued
| | | | | |
| Issuer | | Shares/Par | | Value ($) |
| | | | | |
| COMMON STOCKS – continued | | | | | |
| Medical Equipment – 0.4% | | | | | |
| Cooper Cos., Inc. | | 270 | | $ | 10,260 |
| Zimmer Holdings, Inc. (a) | | 150 | | | 9,922 |
| | | | | |
| | | | $ | 20,182 |
| | | | | |
| Metals & Mining – 1.2% | | | | | |
| Freeport-McMoRan Copper & Gold, Inc. | | 440 | | $ | 45,074 |
| Southern Copper Corp. | | 130 | | | 13,667 |
| | | | | |
| | | | $ | 58,741 |
| | | | | |
| Natural Gas – Distribution – 1.1% | | | | | |
| Energen Corp. | | 830 | | $ | 53,311 |
| | | | | |
| Natural Gas – Pipeline – 1.1% | | | | | |
| Williams Cos., Inc. | | 1,480 | | $ | 52,954 |
| | | | | |
| Network & Telecom – 0.9% | | | | | |
| Cisco Systems, Inc. (a) | | 1,750 | | $ | 47,372 |
| | | | | |
| Oil Services – 0.8% | | | | | |
| Halliburton Co. | | 270 | | $ | 10,236 |
| National Oilwell Varco, Inc. (a) | | 410 | | | 30,119 |
| | | | | |
| | | | $ | 40,355 |
| | | | | |
| Other Banks & Diversified Financials – 2.6% | | | | | |
| American Express Co. | | 490 | | $ | 25,490 |
| Citigroup, Inc. | | 3,500 | | | 103,040 |
| | | | | |
| | | | $ | 128,530 |
| | | | | |
| Personal Computers & Peripherals – 0.2% | | | | | |
| Seagate Technology LLC | | 480 | | $ | 12,240 |
| | | | | |
| Pharmaceuticals – 5.1% | | | | | |
| Bristol-Myers Squibb Co. | | 1,760 | | $ | 46,675 |
| Johnson & Johnson | | 560 | | | 37,352 |
| Merck & Co., Inc. | | 180 | | | 10,460 |
| Pfizer, Inc. | | 5,010 | | | 113,877 |
| Schering-Plough Corp. | | 1,820 | | | 48,485 |
| | | | | |
| | | | $ | 256,849 |
| | | | | |
| Pollution Control – 0.8% | | | | | |
| Allied Waste Industries, Inc. (a) | | 3,410 | | $ | 37,578 |
| | | | | |
| Railroad & Shipping – 0.2% | | | | | |
| Union Pacific Corp. | | 80 | | $ | 10,050 |
| | | | | |
| Real Estate – 1.9% | | | | | |
| Equity Residential, REIT | | 1,620 | | $ | 59,081 |
| Jones Lang LaSalle, Inc. | | 230 | | | 16,367 |
| Mack-Cali Realty Corp., REIT | | 560 | | | 19,040 |
| | | | | |
| | | | $ | 94,488 |
| | | | | |
| Restaurants – 1.1% | | | | | |
| Darden Restaurants, Inc. | | 1,370 | | $ | 37,963 |
| McDonald’s Corp. | | 250 | | | 14,727 |
| | | | | |
| | | | $ | 52,690 |
| | | | | |
| Specialty Stores – 1.3% | | | | | |
| Advance Auto Parts, Inc. | | 1,300 | | $ | 49,387 |
| TJX Cos., Inc. | | 620 | | | 17,813 |
| | | | | |
| | | | $ | 67,200 |
| | | | | |
| | | | | | |
| Issuer | | Shares/Par | | Value ($) |
| | | | | | |
| COMMON STOCKS – continued | | | | | | |
| Telecommunications – Wireless – 2.1% | | | | | | |
| NII Holdings, Inc. “B” (a) | | | 1,080 | | $ | 52,186 |
| Sprint Nextel Corp. | | | 3,950 | | $ | 51,863 |
| | | | | | |
| | | | | $ | 104,049 |
| | | | | | |
| Telephone Services – 4.9% | | | | | | |
| AT&T, Inc. | | | 3,150 | | $ | 130,914 |
| Embarq Corp. | | | 1,140 | | | 56,464 |
| Qwest Communications International, Inc. | | | 2,970 | | | 20,820 |
| Verizon Communications, Inc. | | | 920 | | | 40,195 |
| | | | | | |
| | | | | $ | 248,393 |
| | | | | | |
| Tobacco – 1.9% | | | | | | |
| Altria Group, Inc. | | | 1,250 | | $ | 94,475 |
| | | | | | |
| Utilities – Electric Power – 6.4% | | | | | | |
| American Electric Power Co., Inc. | | | 1,340 | | $ | 62,390 |
| Dominion Resources, Inc. | | | 1,450 | | | 68,802 |
| Edison International | | | 530 | | | 28,286 |
| NRG Energy, Inc. (a) | | | 1,220 | | | 52,875 |
| PG&E Corp. | | | 1,330 | | | 57,310 |
| Public Service Enterprise Group, Inc. | | | 560 | | | 55,014 |
| | | | | | |
| | | | | $ | 324,677 |
| | | | | | |
Total Common Stocks
(Identified Cost, $4,917,616) | | | | | $ | 4,951,027 |
| | | | | | |
| | |
| SHORT-TERM OBLIGATIONS – 1.6% | | | | | | |
American Express Credit Corp.,
4.12%, due 1/02/08, at
Amortized Cost and Value (y) | | $ | 82,000 | | $ | 81,991 |
| | | | | | |
Total Investments
(Identified Cost, $4,999,607) | | | | | $ | 5,033,018 |
| | | | | | |
OTHER ASSETS, LESS
LIABILITIES – 0.1% | | | | | | 4,952 |
| | | | | | |
| Net Assets – 100.0% | | | | | $ | 5,037,970 |
| | | | | | |
| (a) | Non-income producing security. |
| (y) | The rate shown represents an annualized yield at time of purchase. |
The following abbreviations are used in this report and are defined:
| REIT | Real Estate Investment Trust |
See Notes to Financial Statements
5
FINANCIAL STATEMENTS | STATEMENT OF ASSETS AND LIABILITIES
This statement represents your fund’s balance sheet, which details the assets and liabilities comprising the total value of the fund.
| | | | |
| At 12/31/07 | | | | |
| Assets | | | | |
| Investments, at value (identified cost $4,999,607) | | $5,033,018 | | |
| Cash | | 477 | | |
| Dividends receivable | | 4,617 | | |
| Receivable from investment adviser | | 18,426 | | |
| Total assets | | | | $5,056,538 |
| Liabilities | | | | |
| Payable to affiliates | | | | |
Management fee | | 329 | | |
Distribution fees | | 69 | | |
Administrative services fee | | 110 | | |
| Accrued expenses and other liabilities | | 18,060 | | |
| Total liabilities | | | | $18,568 |
| Net assets | | | | $5,037,970 |
| Net assets consist of | | | | |
| Paid-in capital | | $5,004,559 | | |
| Unrealized appreciation (depreciation) on investments | | 33,411 | | |
Net assets | | | | $5,037,970 |
| Shares of beneficial interest outstanding | | | | 500,496 |
| Initial Class shares | | | | |
Net assets | | $2,519,097 | | |
Shares outstanding | | 250,259 | | |
Net asset value per share | | | | $10.07 |
| Service Class shares | | | | |
Net assets | | $2,518,873 | | |
Shares outstanding | | 250,237 | | |
Net asset value per share | | | | $10.07 |
See Notes to Financial Statements
6
FINANCIAL STATEMENTS | STATEMENT OF OPERATIONS
This statement describes how much your fund earned in investment income and accrued in expenses. It also describes any gains and/or losses generated by fund operations.
| | | | | |
| Period ended 12/31/07 (c) | | | | | |
| Net investment income | | | | | |
| Income | | | | | |
Dividends | | $3,835 | | | |
Interest | | 1,237 | | | |
| Total investment income | | | | | $5,072 |
| Expenses | | | | | |
Management fee | | $1,079 | | | |
Distribution fees | | 225 | | | |
Administrative services fee | | 356 | | | |
Custodian fee | | 463 | | | |
Shareholder communications | | 333 | | | |
Auditing fees | | 16,700 | | | |
Legal fees | | 215 | | | |
Miscellaneous | | 359 | | | |
| Total expenses | | | | | $19,730 |
Fees paid indirectly | | (9 | ) | | |
Reduction of expenses by investment adviser | | (18,426 | ) | | |
| Net expenses | | | | | $1,295 |
| Net investment income | | | | | $3,777 |
| Realized and unrealized gain (loss) on investments | | | | | |
| Net realized gain (loss) on investments (identified cost basis) | | | | | $782 |
| Net unrealized gain (loss) on investments | | | | | $33,411 |
| Net realized and unrealized gain (loss) on investments | | | | | $34,193 |
| Change in net assets from operations | | | | | $37,970 |
| (c) | For the period from the commencement of the fund’s investment operations, December 18, 2007, through the stated period end. |
See Notes to Financial Statements
7
FINANCIAL STATEMENTS | STATEMENT OF CHANGES IN NET ASSETS
This statement describes the increases and/or decreases in net assets resulting from operations, any distributions, and any shareholder transactions.
| | | |
| For the period ended 12/31 | | 2007 (c | ) |
| Change in net assets | | | |
| From operations | | | |
| Net investment income | | $3,777 | |
| Net realized gain (loss) on investments | | 782 | |
| Net unrealized gain (loss) on investments | | 33,411 | |
| Change in net assets from operations | | $37,970 | |
| Distributions declared to shareholders | | | |
| From net investment income | | | |
Initial Class | | $(1,973 | ) |
Service Class | | (1,804 | ) |
| From net realized gain on investments | | | |
Initial Class | | (409 | ) |
Service Class | | (373 | ) |
| From tax return of capital | | | |
Initial Class | | (230 | ) |
Service Class | | (211 | ) |
| Total distributions declared to shareholders | | $(5,000 | ) |
| Change in net assets from fund share transactions | | $5,005,000 | |
| Total change in net assets | | $5,037,970 | |
| Net assets | | | |
| At beginning of period | | $— | |
| At end of period | | $5,037,970 | |
| (c) | For the period from the commencement of the fund’s investment operations, December 18, 2007, through the stated period end. |
See Notes to Financial Statements
8
FINANCIAL STATEMENTS | FINANCIAL HIGHLIGHTS
The financial highlights table is intended to help you understand the fund’s financial performance for the past 5 years (or life of a particular share class, if shorter). Certain information reflects financial results for a single fund share. The total returns in the table represent the rate by which an investor would have earned (or lost) on an investment in the fund share class (assuming reinvestment of all distributions) held for the entire period.
Initial Class
| | | |
| | | Period ended 12/31/07 (c) | |
| Net asset value, beginning of period | | $10.00 | |
| Income (loss) from investment operations | | | |
| Net investment income (d) | | $0.01 | |
| Net realized and unrealized gain (loss) on investments | | 0.07 | |
| Total from investment operations | | $0.08 | |
| Less distributions declared to shareholders | | | |
| From net investment income | | $(0.01 | ) |
| From net realized gain on investments | | (0.00 | )(w) |
| From tax return of capital | | (0.00 | )(w) |
| Total distributions declared to shareholders | | $(0.01 | ) |
| Net asset value, end of period | | $10.07 | |
| Total return (%) (k)(r)(s) | | 0.80 | (n) |
Ratios (%) (to average net assets)
and Supplemental data: | | | |
| Expenses before expense reductions (f) | | 10.80 | (a) |
| Expenses after expense reductions (f) | | 0.60 | (a) |
| Net investment income | | 2.22 | (a) |
| Portfolio turnover | | 0 | |
| Net assets at end of period (000 Omitted) | | $2,519 | |
See Notes to Financial Statements
9
Financial Highlights – continued
Service Class
| | | |
| | | Period ended 12/31/07 (c) | |
| Net asset value, beginning of period | | $10.00 | |
| Income (loss) from investment operations | | | |
| Net investment income (d) | | $0.01 | |
| Net realized and unrealized gain (loss) on investments | | 0.07 | |
| Total from investment operations | | $0.08 | |
| Less distributions declared to shareholders | | | |
| From net investment income | | $(0.01 | ) |
| From net realized gain on investments | | (0.00 | )(w) |
| From tax return of capital | | (0.00 | )(w) |
| Total distributions declared to shareholders | | $(0.01 | ) |
| Net asset value, end of period | | $10.07 | |
| Total return (%) (k)(r)(s) | | 0.80 | (n) |
Ratios (%) (to average net assets)
and Supplemental data: | | | |
| Expenses before expense reductions (f) | | 11.05 | (a) |
| Expenses after expense reductions (f) | | 0.85 | (a) |
| Net investment income (a) | | 1.97 | (a) |
| Portfolio turnover | | 0 | |
| Net assets at end of period (000 Omitted) | | $2,519 | |
| (c) | For the period from the commencement of the fund’s investment operations, December 18, 2007, through the stated period end. |
| (d) | Per share data are based on average shares outstanding. |
| (f) | Ratios do not reflect reductions from fees paid indirectly, if applicable. |
| (k) | The total return does not reflect expenses that apply to separate accounts. Inclusion of these charges would reduce the total return figures for all periods shown. |
| (r) | Certain expenses have been reduced without which performance would have been lower. |
| (s) | From time to time the fund may receive proceeds from litigation settlements, without which performance would be lower. |
| (w) | Per share amount was less than $0.01. |
See Notes to Financial Statements
10
NOTES TO FINANCIAL STATEMENTS
| (1) | | Business and Organization |
MFS Blended Research Value Portfolio (the fund) is a series of MFS Variable Insurance Trust II (the trust). The trust is organized as a Massachusetts business trust and is registered under the Investment Company Act of 1940, as amended, as an open-end management investment company. The shares of the fund are sold only to variable accounts established by insurance companies to fund benefits under variable contracts issued by such companies and qualified retirement and pension plans.
| (2) | | Significant Accounting Policies |
General – The preparation of financial statements in conformity with U.S. generally accepted accounting principles requires management to make estimates and assumptions that affect the reported amounts of assets and liabilities, and disclosure of contingent assets and liabilities at the date of the financial statements and the reported amounts of revenues and expenses during the reporting period. Actual results could differ from those estimates.
Investment Valuations – Equity securities, including restricted equity securities, are generally valued at the last sale or official closing price as reported by an independent pricing service on the market or exchange on which they are primarily traded. For securities for which there were no sales reported that day, equity securities are generally valued at the last quoted daily bid quotation as reported by an independent pricing service on the market or exchange on which they are primarily traded. For securities held short for which there were no sales reported for the day, the position is generally valued at the last quoted daily ask quotation as reported by an independent pricing service on the market or exchange on which such securities are primarily traded. Short-term instruments with a maturity at issuance of 60 days or less may be valued at amortized cost, which approximates market value. Securities and other assets generally valued on the basis of information from an independent pricing service may also be valued at a broker-dealer bid quotation.
The Board of Trustees has delegated primary responsibility for determining or causing to be determined the value of the fund’s investments (including any fair valuation) to the adviser pursuant to valuation policies and procedures approved by the Board. If the adviser determines that reliable market quotations are not readily available, investments are valued at fair value as determined in good faith by the adviser in accordance with such procedures under the oversight of the Board of Trustees. Under the fund’s valuation policies and procedures, market quotations are not considered to be readily available for many types of debt instruments and certain types of derivatives. These investments are generally valued at fair value based on information from independent pricing services. In addition, investments may be valued at fair value if the adviser determines that an investment’s value has been materially affected by events occurring after the close of the exchange or market on which the investment is principally traded (such as foreign exchange or market) and prior to the determination of the fund’s net asset value, or after the halting of trading of a specific security where trading does not resume prior to the close of the exchange or market on which the security is principally traded. The adviser may rely on independent pricing services or other information (such as the correlation with price movements of similar securities in the same or other markets; the type, cost and investment characteristics of the security; the business and financial condition of the issuer; and trading and other market data) to assist in determining whether to fair value and at what value to fair value an investment. The value of an investment for purposes of calculating the fund’s net asset value can differ depending on the source and method used to determine value. When fair valuation is used, the value of investments used to determine the fund’s net asset value may differ from quoted or published prices for the same investments.
In September 2006, FASB Statement No. 157, Fair Value Measurements (the “Statement”) was issued, and is effective for fiscal years beginning after November 15, 2007 and for all interim periods within those fiscal years. This Statement provides a single definition of fair value, a hierarchy for measuring fair value and expanded disclosures about fair value measurements. Management is evaluating the application of the Statement to the fund, and believes the impact will be limited to expanded disclosures resulting from the adoption of this Statement in the fund’s financial statements.
Indemnifications – Under the fund’s organizational documents, its officers and trustees may be indemnified against certain liabilities and expenses arising out of the performance of their duties to the fund. Additionally, in the normal course of business, the fund enters into agreements with service providers that may contain indemnification clauses. The fund’s maximum exposure under these agreements is unknown as this would involve future claims that may be made against the fund that have not yet occurred.
Investment Transactions and Income – Investment transactions are recorded on the trade date. Interest income is recorded on the accrual basis. All premium and discount is amortized or accreted for financial statement purposes in accordance with U.S. generally accepted accounting principles. All discount is accreted for tax reporting purposes as required by federal income tax regulations. Dividends received in cash are recorded on the ex-dividend date. Certain dividends from foreign securities will be recorded when the fund is informed of the dividend if such information is obtained subsequent to the ex-dividend date. Dividend and interest payments received in additional securities are recorded on the ex-dividend or ex-interest date in an amount equal to the value of the security on such date.
11
Notes to Financial Statements – continued
The fund may receive proceeds from litigation settlements. Any proceeds received from litigation involving portfolio holdings are reflected in the Statement of Operations in realized gain/loss if the security has been disposed of by the fund or in unrealized gain/loss if the security is still held by the fund. Any other proceeds from litigation not related to portfolio holdings are reflected as other income in the Statement of Operations.
Fees Paid Indirectly – The fund’s custody fee may be reduced according to an arrangement that measures the value of cash deposited with the custodian by the fund. This amount, for the period ended December 31, 2007, is shown as a reduction of total expenses on the Statement of Operations.
Tax Matters and Distributions – The fund intends to qualify as a regulated investment company, as defined under Subchapter M of the Internal Revenue Code, and to distribute all of its taxable income, including realized capital gains. As a result, no provision for federal income taxes is required. The fund adopted the provisions of FASB Interpretation No. 48, Accounting for Uncertainty in Income Taxes (“the Interpretation”) on December 18, 2007 (the commencement of operations of the fund). The Interpretation prescribes a minimum threshold for financial statement recognition of the benefit of a tax position taken or expected to be taken in a tax return. There was no impact resulting from the adoption of this Interpretation on the fund’s financial statements. Each of the fund’s federal tax returns since the inception of the fund remains subject to examination by the Internal Revenue Service. It is the fund’s policy to record interest and penalty charges on underpaid taxes associated with its tax positions as interest expense and other expense, respectively. No such charges were recorded in the current financial statements. Foreign taxes, if any, have been accrued by the fund in the accompanying financial statements.
Distributions to shareholders are recorded on the ex-dividend date. Income and capital gain distributions are determined in accordance with income tax regulations, which may differ from U.S. generally accepted accounting principles. Certain capital accounts in the financial statements are periodically adjusted for permanent differences in order to reflect their tax character. These adjustments have no impact on net assets or net asset value per share. Temporary differences which arise from recognizing certain items of income, expense, gain or loss in different periods for financial statement and tax purposes will reverse at some time in the future. Distributions in excess of net investment income or net realized gains are temporary overdistributions for financial statement purposes resulting from differences in the recognition or classification of income or distributions for financial statement and tax purposes.
During the period ended December 31, 2007, there were no significant adjustments due to differences between book and tax accounting.
The tax character of distributions declared to shareholders is as follows:
| | |
| | | Period ended
12/31/07(c) |
| Ordinary income (including any short-term capital gains) | | $3,777 |
| Long-term capital gain | | 782 |
| | $4,559 |
| Tax return of capital (b) | | 441 |
| Total distributions | | $5,000 |
| | (b) | Distributions in excess of tax basis earnings and profits are reported in the financial statements as a tax return of capital. |
| | (c) | For the period from the commencement of the fund’s investment operations, December 18, 2007, through the stated period end. |
The federal tax cost and the tax basis components of distributable earnings were as follows:
| | | |
| As of 12/31/07 | | | |
| Cost of investments | | $4,999,607 | |
| Gross appreciation | | 86,964 | |
| Gross depreciation | | (53,553 | ) |
| Net unrealized appreciation (depreciation) | | $33,411 | |
Multiple Classes of Shares of Beneficial Interest – The fund offers multiple classes of shares, which differ in their respective distribution fees. All shareholders bear the common expenses of the fund based on daily net assets of each class, without distinction between share classes. Dividends are declared separately for each class. Differences in per share dividend rates are generally due to differences in separate class expenses.
| (3) | | Transactions with Affiliates |
Investment Adviser – The fund has an investment advisory agreement with Massachusetts Financial Services Company (MFS) to provide overall investment management and related administrative services and facilities to the fund. The management fee is computed daily and paid monthly at an annual rate of 0.60% of the fund’s average daily net assets. The investment adviser
12
Notes to Financial Statements – continued
has agreed in writing to pay a portion of the fund’s total operating expenses, exclusive of certain other fees and expenses, such that the total annual fund operating expenses do not exceed 0.60% for the Initial Class shares and 0.85% for the Service Class shares, based on average daily net assets of each share class. This written agreement will continue through April 30, 2009 unless changed or rescinded by the fund’s Board of Trustees. For the period ended December 31, 2007, this reduction amounted to $18,426 and is reflected as a reduction of total expenses in the Statement of Operations.
Distributor – MFS Fund Distributors, Inc. (MFD), a wholly-owned subsidiary of MFS, is the distributor of shares of the fund. The Trustees have adopted a distribution plan for the Service Class shares pursuant to Rule 12b-1 under the Investment Company Act of 1940.
The fund’s distribution plan provides that the fund will pay MFD distribution fees equal to 0.25% per annum of its average daily net assets attributable to Service Class shares as partial consideration for services performed and expenses incurred by MFD and financial intermediaries in connection with the sale and distribution of the fund’s Service Class shares and the sale and distribution of the variable annuity or variable life insurance contracts investing indirectly in Service Class shares. MFD may subsequently pay all, or a portion, of the distribution fees to financial intermediaries.
Shareholder Servicing Agent – MFS Service Center, Inc. (MFSC), a wholly-owned subsidiary of MFS, has contracted to provide transfer agent and recordkeeping functions in connection with the issuance, transfer, and redemption of each class of shares of the fund under a Shareholder Servicing Agent Agreement. During the year ended December 31, 2007, MFSC did not receive a fee for this service.
Administrator – MFS provides certain financial, legal, shareholder communications, compliance, and other administrative services to the fund. Under an administrative services agreement, the fund partially reimburses MFS the costs incurred to provide these services. The fund is charged an annual fixed amount of $10,000 plus a fee based on average daily net assets.
The administrative services fee incurred for the period ended December 31, 2007 was equivalent to an annual effective rate of 0.1972% of the fund average daily net assets.
Trustees’ and Officers’ Compensation – The fund pays compensation to trustees in the form of a retainer, attendance fees, and additional compensation to the Board chairperson. The fund does not pay compensation directly to officers of the fund who are also officers of the investment adviser, all of whom receive remuneration for their services to the fund from MFS. Certain officers of the fund are officers or directors of MFS, MFD, and MFSC. For the period ended December 31, 2007 the fund did not incur any expenses for independent trustees’ compensation.
Other – This fund and certain other MFS funds (the funds) have entered into a services agreement (the Agreement) which provides for payment of fees by the funds to Tarantino LLC in return for the provision of services of an Independent Chief Compliance Officer (ICCO) for the funds. The ICCO is an officer of the funds and the sole member of Tarantino LLC. The funds can terminate the Agreement with Tarantino LLC at any time under the terms of the Agreement. MFS has agreed to bear all expenses associated with office space, other administrative support, and supplies provided to the ICCO. For the period ended December 31, 2007, the fee paid to Tarantino LLC was $1.
MFS purchased 250,000 shares of both the Initial and Service Class shares for an aggregate amount of $5,000,000. At December 31, 2007, MFS was the sole shareholder of both classes.
Purchases and sales of investments, other than U.S. government securities, purchased option transactions, and short-term obligations, aggregated $4,917,616 and $0, respectively.
13
Notes to Financial Statements – continued
| (5) | | Shares of Beneficial Interest |
The fund’s Declaration of Trust permits the Trustees to issue an unlimited number of full and fractional shares of beneficial interest. Transactions in fund shares were as follows:
| | | | |
| | | Period ended 12/31/07 (c) |
| | | Shares | | Amount |
| Shares sold | | | | |
Initial Class | | 250,000 | | $2,500,000 |
Service Class | | 250,000 | | 2,500,000 |
| | 500,000 | | $5,000,000 |
| Shares issued to shareholders in reinvestment of distributions | | | | |
Initial Class | | 259 | | $2,612 |
Service Class | | 237 | | 2,388 |
| | 496 | | $5,000 |
| Net change | | | | |
Initial Class | | 250,259 | | $2,502,612 |
Service Class | | 250,237 | | 2,502,388 |
| | 500,496 | | $5,005,000 |
| (c) | For the period from the commencement of the fund’s investment operations, December 18, 2007, through the stated period end. |
The fund is permitted to have bank borrowings for temporary or emergency purposes to fund shareholder redemptions. The fund has established borrowing arrangements with certain banks. The interest rate on the borrowings is equal to the Federal Reserve funds rate plus 0.30%. The fund had no significant borrowings during the period ended December 31, 2007.
14
REPORT OF INDEPENDENT REGISTERED PUBLIC ACCOUNTING FIRM
To the Board of Trustees of MFS Variable Insurance Trust II (formerly known as MFS/Sun Life Series Trust) and the Shareholders of MFS Blended Research Value Portfolio:
We have audited the accompanying statement of assets and liabilities, including the portfolio of investments, of MFS Blended Research Value Portfolio (one of the portfolios comprising MFS Variable Insurance Trust II) (the “Trust”) as of December 31, 2007, and the related statement of operations, the statement of changes in net assets and the financial highlights for the period from December 18, 2007 (commencement of operations) through December 31, 2007. These financial statements and financial highlights are the responsibility of the Trust’s management. Our responsibility is to express an opinion on these financial statements and financial highlights based on our audit.
We conducted our audit in accordance with the standards of the Public Company Accounting Oversight Board (United States). Those standards require that we plan and perform the audit to obtain reasonable assurance about whether the financial statements and financial highlights are free of material misstatement. The Trust is not required to have, nor were we engaged to perform, an audit of its internal control over financial reporting. Our audit included consideration of internal control over financial reporting as a basis for designing audit procedures that are appropriate in the circumstances, but not for the purpose of expressing an opinion on the effectiveness of the Trust’s internal control over financial reporting. Accordingly, we express no such opinion. An audit also includes examining, on a test basis, evidence supporting the amounts and disclosures in the financial statements, assessing the accounting principles used and significant estimates made by management, as well as evaluating the overall financial statement presentation. Our procedures included confirmation of securities owned as of December 31, 2007, by correspondence with the custodian. We believe that our audit provides a reasonable basis for our opinion.
In our opinion, such financial statements and financial highlights present fairly, in all material respects, the financial position of MFS Blended Research Value Portfolio as of December 31, 2007, the results of its operations, the changes in its net assets and its financial highlights for the period from December 18, 2007 (commencement of operations) through December 31, 2007, in conformity with accounting principles generally accepted in the United States of America.
DELOITTE & TOUCHE LLP
Boston, Massachusetts
February 15, 2008
15
TRUSTEES AND OFFICERS – IDENTIFICATION AND BACKGROUND
The Trustees and officers of the Trust, as of February 1, 2008, are listed below, together with their principal occupations during the past five years. (Their titles may have varied during that period.) The address of each Trustee and officer is 500 Boylston Street, Boston, Massachusetts 02116.
| | | | | | |
Name, Date of Birth | | Position(s) Held
with Fund | | Trustee/Officer
Since(1) | | Principal Occupations During the Past Five Years &
Other Directorships(2) |
| INTERESTED TRUSTEE | | | | | | |
David D. Horn(3) (born 06/07/41) | | Trustee | | April 1986 | | Private investor; Retired; Sun Life Assurance Company of Canada, Former Senior Vice President and General Manager for the United States (until 1997); Retired: Sun Life Assurance Company of Canada, Director (until March 2004) |
| | |
| INDEPENDENT TRUSTEES | | | | |
J. Kermit Birchfield (born 01/08/40) | | Chairman | | May 1997 | | Consultant; Century Partners, Inc. (investments), Director (1988 to present); Displaytech, Inc. (technology), Director (1995 to present); Dessin Fournir LLC (furniture manufacturer), Director (2005 to present); Intermountain Gas Company, Inc. & Intermountain Industries, Inc. (oil & gas exploration and production) (1988 to present); Site Watch LLC (software to monitor oil tanks) Managing Director (2006 to present); Juridica Investments (fund investing in judicial matters) Director (2007 to present); Dairy Mart Convenience Stores, Inc. (convenience stores), Chairman (1997 to 2003) |
| | | |
Robert C. Bishop (born 01/13/43) | | Trustee | | May 2001 | | Autolmmune Inc. (pharmaceutical product licensing), Chairman, President and Chief Executive Officer (1992 to present); Caliper Life Sciences Corp. (laboratory analytical instruments), Director (2002 to present); Millipore Corporation (biopharmaceutical/research laboratory products), Director (1997 to present); Optobionics Corporation (ophthalmic devices), Director (2002 to 2007); Quintiles Transnational Corp. (contract research services), Director (until 2003) |
| | | |
Frederick H. Dulles (born 03/12/42) | | Trustee | | May 2001 | | Ten State International Law PLLC (law firm), Of Counsel (since 2006); Prudential Carolina Real Estate, (real estate), Broker (since 2006); Free Enterprise Foundation, Inc. (research institute), Director & Secretary (until 2008); Disher, Hamrick & Myers Residential, Inc. (real estate) Broker (until 2006); Frederick H. Dulles law practice (until 2006); Ten State Street LLP (law firm), Member (until 2005); McFadden, Pilkington & Ward LLP (solicitors and registered foreign lawyers), Member & Of Counsel (until 2003) |
| | | |
Marcia A. Kean (born 06/30/48) | | Trustee | | April 2005 | | Feinstein Kean Healthcare (consulting), Chief Executive Officer (since December 2002), Managing Director (prior to May 2001); Ardais Corporation (biotech products), Senior Vice President – Commercialization (February 2002 until November 2002) |
| | | |
Ronald G. Steinhart (born 06/15/40) | | Trustee | | May 2001 | | Private investor; Penske Automotive Group (automotive retailer), Director (2001 to present); Penson Worldwide, Inc. (securities clearance), Director (2006 to present); Animal Health International, Inc. (animal health products), Director (2007 to present); Texas Industries (concrete/aggregates/cement), Director (2007 to present); Carreker Corporation (technology consulting) Director (until 2005); Prentiss Properties Trust (real estate investment trust), Director (until 2006) |
| | | |
Haviland Wright (born 07/21/48) | | Trustee | | May 2001 | | Elixir Technologies Corporation (software) Director (2005 to present); Nano Loa Inc. (liquid crystal displays), Director (2003 to present); Silk Displays, Inc. (smart polymers) Director (2007 to present); Displaytech, Inc. (technology) Chairman and CEO
(1995 – 2002) |
| | | |
| TRUSTEE EMERITUS | | | | | | |
Samuel Adams (born 10/19/25) | | Trustee Emeritus | | | | Retired; Kirkpatrick & Lockhart Preston Gates Ellis LLP (law firm), Of Counsel |
| | | |
| OFFICERS | | | | | | |
Maria F. Dwyer(4) (born 12/01/58) | | President | | November 2005 | | Massachusetts Financial Services Company, Executive Vice President and Chief Regulatory Officer (since March 2004); Fidelity Management & Research Company, Vice President (prior to March 2004); Fidelity Group of Funds, President and Treasurer (prior to March 2004) |
| | | |
Tracy Atkinson(4) (born 12/30/64) | | Treasurer | | September 2005 | | Massachusetts Financial Services Company, Senior Vice President (since September 2004); PricewaterhouseCoopers LLP, Partner (prior to September 2004) |
| | | |
Christopher R. Bohane(4) (born 01/18/74) | | Assistant Secretary and Assistant Clerk | | July 2005 | | Massachusetts Financial Services Company, Vice President and Senior Counsel (since April 2003); Kirkpatrick & Lockhart LLP (law firm), Associate (prior to April 2003) |
| | | |
Ethan D. Corey(4) (born 11/21/63) | | Assistant Secretary and Assistant Clerk | | July 2005 | | Massachusetts Financial Services Company, Senior Vice President and Associate General Counsel (since April 2006); Special Counsel (prior to April 2006); Dechert LLP (law firm), Counsel (prior to December 2004) |
16
Trustees and Officers – continued
| | | | | | |
Name, Date of Birth | | Position(s) Held
with Fund | | Trustee/Officer
Since(1) | | Principal Occupations During the Past Five Years &
Other Directorships(2) |
David L. DiLorenzo(4) (born 08/10/68) | | Assistant Treasurer | | July 2005 | | Massachusetts Financial Services Company, Vice President (since June 2005); JP Morgan Investor Services, Vice President (January 2001 to June 2005) |
| | | |
Timothy M. Fagan(4) (born 07/10/68) | | Assistant Secretary and Assistant Clerk | | September 2005 | | Massachusetts Financial Services Company, Vice President and Senior Counsel (since September 2005); John Hancock Advisers, LLC, Vice President and Chief Compliance Officer (September 2004 to August 2005) Senior Attorney (prior to September 2004); John Hancock Group of Funds, Vice President and Chief Compliance Officer (September 2004 to December 2004) |
| | | |
Mark D. Fischer(4) (born 10/27/70) | | Assistant Treasurer | | July 2005 | | Massachusetts Financial Services Company, Vice President (since May 2005); JP Morgan Investment Management Company, Vice President (prior to May 2005) |
| | | |
Brian E. Langenfeld(4) (born 03/07/73) | | Assistant Secretary and Assistant Clerk | | May 2006 | | Massachusetts Financial Services Company, Assistant Vice President and Counsel (since May 2006); John Hancock Advisers, LLC, Assistant Vice President and Counsel (May 2005 to April 2006); John Hancock Advisers, LLC, Attorney and Assistant Secretary (prior to May 2005) |
| | | |
Ellen Moynihan(4) (born 11/13/57) | | Assistant Treasurer | | May 1997 | | Massachusetts Financial Services Company, Senior Vice President |
| | | |
Susan S. Newton(4) (born 03/07/50) | | Assistant Secretary and Assistant Clerk | | May 2005 | | Massachusetts Financial Services Company, Senior Vice President and Assistant General Counsel (since April 2005); John Hancock Advisers, LLC, Senior Vice President, Secretary and Chief Legal Officer (prior to April 2005); John Hancock Group of Funds, Senior Vice President, Secretary and Chief Legal Officer (prior to April 2005) |
| | | |
Susan A. Pereira(4) (born 11/05/70) | | Assistant Secretary and Assistant Clerk | | July 2005 | | Massachusetts Financial Services Company, Vice President and Senior Counsel (since June 2004); Bingham McCutchen LLP (law firm), Associate (January 2001 to June 2004) |
| | | |
Mark N. Polebaum(4) (born 05/01/52) | | Secretary and Assistant Clerk | | February 2006 | | Massachusetts Financial Services Company, Executive Vice President, General Counsel and Secretary (since January 2006); Wilmer Cutler Pickering Hale and Dorr LLP (law firm), Partner (prior to January 2006) |
| | | |
Frank L. Tarantino (born 03/07/44) | | Independent Chief Compliance Officer | | September 2004 | | Tarantino LLC (provider of compliance services), Principal (since June 2004); CRA Business Strategies Group (consulting services), Executive Vice President (April 2003 to June 2004); David L. Babson & Co. (investment adviser), Managing Director, Chief Administrative Officer and Director (February 1997 to March 2003) |
| | | |
Richard S. Weitzel(4) (born 7/16/70) | | Assistant Secretary and Assistant Clerk | | October 2007 | | Massachusetts Financial Services Company, Vice President and Assistant General Counsel (since 2007); Vice President and Senior Counsel (since May 2004); Massachusetts Department of Business and Technology, General Counsel (February 2003 to April 2004); Massachusetts Office of the Attorney General, Assistant Attorney General ( April 2001 to February 2003); Ropes and Gray, Associate (prior to April 2001) |
| | | |
James O. Yost(4) (born 06/12/60) | | Assistant Treasurer | | April 1992 | | Massachusetts Financial Services Company, Senior Vice President |
| (1) | Date first appointed to serve as Trustee/Officer of an MFS fund or a Compass variable account. Each Trustee has served continuously since appointment. |
| (2) | Directorships or trusteeships of companies required to report to the Securities and Exchange Commission (i.e., “public companies”). |
| (3) | “Interested person” of the Sun Life of Canada (U.S.), within the meaning of the Investment Company Act of 1940 (referred to as the 1940 Act), which is the principal federal law governing investment companies like the Series. The address of Sun Life of Canada (U.S.) is One Sun Life Executive Park, Wellesley Hills, Massachusetts 02481. |
| (4) | “Interested person” of MFS within the meaning of the 1940 Act. The address of MFS is 500 Boylston Street, Boston, Massachusetts 02116. |
The Trust does not hold annual meetings for the purpose of electing Trustees, and Trustees are not elected for fixed terms. Each Trustee and officer holds office until his or her successor is chosen and qualified, or until his or her earlier death, resignation, retirement or removal.
All Trustees currently serve as Trustees of the Trust and have served in that capacity since originally elected or appointed. All of the Trustees are also Managers of the Compass Variable Accounts. The executive officers of the Trust hold similar offices for the Compass Variable Accounts and other funds in the MFS fund complex. As of January 1, 2008, each Trustee serves as a Trustee or Manager of 35 Accounts/Funds.
17
Trustees and Officers – continued
The Statement of Additional Information contains further information about the Trustees and is available without charge upon request by calling 1-800-225-2606.
| | |
Investment Adviser
Massachusetts Financial Services Company 500 Boylston Street, Boston, MA 02116-3741 | | Custodian State Street Bank and Trust Company 225 Franklin Street, Boston, MA 02110 |
Distributor
MFS Fund Distributors, Inc. 500 Boylston Street, Boston, MA 02116-3741 | | Independent Registered Public Accounting Firm Deloitte & Touche LLP 200 Berkeley Street, Boston, MA 02116 |
Portfolio Manager Jonathan Sage | | |
18
BOARD REVIEW OF INVESTMENT ADVISORY AGREEMENT
The Investment Company Act of 1940 requires that both the full Board of Trustees and a majority of the non-interested (“independent”) Trustees, voting separately, initially approve the investment advisory agreement between Massachusetts Financial Services Company (MFS) and MFS Variable Insurance Trust II (the Trust) on behalf of the Fund and, beginning on the second anniversary of the initial effective date of the Agreement, annually approve the continuation of the Agreement. In September 2007, the Board met to consider the initial approval of the Agreement. The independent Trustees were assisted in their evaluation of the Agreement by independent legal counsel, from whom they received separate legal advice and with whom they met separately from MFS management. The independent Trustees were also assisted in this process by the Fund’s Independent Chief Compliance Officer, a full-time senior officer appointed by and reporting to the independent Trustees.
In connection with their deliberations regarding the initial approval of the Agreement, the Trustees, including the independent Trustees, considered such information and factors as they believed, in light of the legal advice furnished to them and their own business judgment, to be relevant. As described below, the Trustees considered the nature, quality, and extent of the various investment advisory, administrative, and/or shareholder services to be performed by MFS under the Agreement and other arrangements with the Trust.
In connection with their initial review meeting, the Trustees received and relied upon materials that included, among other items: (i) information provided by Lipper Inc. on the Fund’s proposed advisory fees and other expenses compared to the advisory fees and other expenses of comparable funds identified by Lipper (the “Lipper expense group”), (ii) information regarding expense caps that will be observed by MFS for the Fund, (iii) information regarding the overall organization of MFS, including information about MFS personnel who would provide investment advisory services to the Fund, and (iv) descriptions of various functions to be performed by MFS for the Fund, such as compliance monitoring and trading, back office, transfer agent, portfolio composition monitoring, and administrative functions. In addition, in connection with the independent Trustees’ meetings in May and July, 2007 (the “contract review meetings”) for the purpose of considering whether to approve the continuation of the investment advisory agreement for the other funds of the Trust that the Board oversees, the independent Trustees received: (i) information regarding MFS’ financial results and financial condition, including MFS’ and certain of its affiliates’ estimated profitability from services performed for the Trust as a whole, (ii) MFS’ views regarding the outlook for the mutual fund industry and the strategic business plans of MFS, and (iii) information regarding the overall organization of MFS, including information about MFS’ senior management and other personnel that would provide investment advisory, administrative and other services to the Fund and the Trust as a whole. The comparative fee and expense information prepared and provided by Lipper Inc. was not independently verified and the independent Trustees did not independently verify any information provided to them by MFS.
The Trustees’ conclusion as to the initial approval of the Agreement was based on a comprehensive consideration of all information provided to the Trustees and not the result of any single factor. Some of the factors that figured particularly in the Trustees’ deliberations are described below, although individual Trustees may have evaluated the information presented differently from one another, giving different weights to various factors. Because the Fund is newly organized and had not begun investment operations at the time of the initial review meeting, the Fund had no investment performance for the Trustees to review. In addition, MFS had no performance information of similarly managed accounts because it has no institutional accounts managed in a similar style as the Fund.
In assessing the reasonableness of the Fund’s advisory fee, the Trustees considered, among other information, the Fund’s advisory fee and the estimated total expense ratio of the Fund’s Initial Class shares as a percentage of average daily net assets and the advisory fees and total expense ratios of peer groups of funds based on information provided by Lipper Inc. The Trustees considered that MFS has agreed in writing to observe an expense limitation for the Fund until, at least, May 1, 2009. The Trustees also considered that, according to the Lipper data (which takes into account the expense limitation), the Fund’s effective advisory fee rate and estimated total expense ratio were each lower than their Lipper expense group median.
The Trustees also considered whether the Fund is likely to benefit from any economies of scale in the management of the Fund in the event of growth in assets of the Fund. They noted that the Fund’s advisory fee rate schedule is not currently proposed to be subject to breakpoints, but they noted that MFS has agreed to implement breakpoints with regard to certain other funds of the Trust.
The Trustees did not consider MFS’ costs and profits with respect to the Fund because the Fund has no operating history with MFS as its adviser. The Trustees considered information prepared by MFS relating to MFS’ costs and profits with respect to the Trust considered as a group, and other investment companies and accounts advised by MFS, as well as MFS’ methodologies used to determine and allocate its costs to the Trust and other accounts and products for purposes of estimating profitability.
After reviewing these and other factors described herein, the Trustees concluded, within the context of their overall conclusions regarding the Agreement, that the advisory fee to be charged to the Fund represents reasonable compensation in light of the services to be provided by MFS to the Fund.
19
Board Review of Investment Advisory Agreement – continued
In addition, the Trustees considered MFS’ resources and related efforts to continue to retain, attract and motivate capable personnel to serve the Fund. The Trustees also considered current and developing conditions in the financial services industry, including the entry into the industry of large and well-capitalized companies which are spending, and appear to be prepared to continue to spend, substantial sums to engage personnel and to provide services to competing investment companies. In this regard, the Trustees also considered the financial resources of MFS and MFS’ ultimate parent, Sun Life Financial Inc. The Trustees also considered the advantages and possible disadvantages to the Fund of having an adviser that also serves other investment companies as well as other accounts.
The Trustees also considered the nature, quality, cost, and extent of administrative, transfer agency, and distribution services to be provided to the Fund by MFS and its affiliates under agreements and plans other than the investment advisory agreement, including any 12b-1 fees the Fund will pay to MFS Fund Distributors, Inc., an affiliate of MFS. The Trustees also considered the nature, extent and quality of certain other services MFS may perform or arrange for on the Fund’s behalf, which may include securities lending programs, directed expense payment programs, class action recovery programs, and MFS’ interaction with third-party service providers, principally custodians and sub-custodians. The Trustees concluded that the various non-advisory services to be provided by MFS and its affiliates on behalf of the Fund were satisfactory.
The Trustees also considered benefits to MFS from the use of the Fund’s portfolio brokerage commissions, if applicable, to pay for investment research (excluding third-party research, for which MFS pays directly) and various other factors. Additionally, the Trustees considered so-called “fall-out benefits” to MFS such as reputational value derived from serving as an investment manager to the Trust and the Fund, and determined that any such benefits derived by MFS were reasonable and fair.
Based on their evaluation of factors that they deemed to be material, including those factors described above, the Board of Trustees, including a majority of the independent Trustees, concluded that the Fund’s investment advisory agreement with MFS should be approved for an initial two-year period, commencing upon its effective date, as set forth in the Agreement.
A discussion regarding the Board’s most recent review and renewal of the Fund’s investment advisory agreement is available by clicking on the Fund’s name under “Variable Insurance Portfolios” on the “Products & Performance” page on the MFS Web site (mfs.com).
20
PROXY VOTING POLICIES AND INFORMATION
A general description of the MFS funds’ proxy voting policies and procedures is available without charge, upon request, by calling 1-800-225-2606, by visiting the About MFS section of mfs.com or by visiting the SEC’s Web site at http://www.sec.gov.
Information regarding how the fund voted proxies relating to portfolio securities during the twelve-month period ended June 30, 2008 will be available without charge by visiting the Proxy Voting section of mfs.com or by visiting the SEC’s Web site at http://www.sec.gov.
QUARTERLY PORTFOLIO DISCLOSURE
The fund will file a complete schedule of portfolio holdings with the Securities and Exchange Commission (the Commission) for the first and third quarters of each fiscal year on Form N-Q. The fund’s Form N-Q may be reviewed and copied at the:
Public Reference Room
Securities and Exchange Commission
100 F Street, NE, Room 1580
Washington, D.C. 20549
Information on the operation of the Public Reference Room may be obtained by calling the Commission at 1-800-SEC-0330. The fund’s Form N-Q is available on the EDGAR database on the Commission’s Internet Web site at http://www.sec.gov, and copies of this information may be obtained, upon payment of a duplicating fee, by electronic request at the following e-mail address: publicinfo@sec.gov or by writing the Public Reference Section at the above address.
A shareholder can also obtain the quarterly portfolio holdings report at mfs.com.
FEDERAL TAX INFORMATION (unaudited)
The following information is provided pursuant to provisions of the Internal Revenue Code.
The fund designates $782 as capital gain dividends paid during the fiscal year.
21
MFS® PRIVACY NOTICE
Privacy is a concern for every investor today. At MFS Investment Management® and the MFS funds, we take this concern very seriously. We want you to understand our policies about the investment products and services that we offer, and how we protect the nonpublic personal information of investors who have a direct relationship with us and our wholly owned subsidiaries.
Throughout our business relationship, you provide us with personal information. We maintain information and records about you, your investments, and the services you use. Examples of the nonpublic personal information we maintain include
| | Ÿ | | data from investment applications and other forms |
| | Ÿ | | share balances and transactional history with us, our affiliates, or others |
| | Ÿ | | facts from a consumer reporting agency |
We do not disclose any nonpublic personal information about our customers or former customers to anyone, except as permitted by law. We may share nonpublic personal information with third parties or certain of our affiliates in connection with servicing your account or processing your transactions. We may share information with companies or financial institutions that perform marketing services on our behalf or with other financial institutions with which we have joint marketing arrangements, subject to any legal requirements.
Authorization to access your nonpublic personal information is limited to appropriate personnel who provide products, services, or information to you. We maintain physical, electronic, and procedural safeguards to help protect the personal information we collect about you.
If you have any questions about the MFS privacy policy, please call 1-800-225-2606 any business day between 8 a.m. and 8 p.m. Eastern time.
Note: If you own MFS products or receive MFS services in the name of a third party such as a bank or broker-dealer, their privacy policy may apply to you instead of ours.
22
CONTACT US
Web site
mfs.com
Account service and
literature
Shareholders
1-877-411-3325
9 a.m. to 5 p.m. ET
Investment professionals
1-800-637-8630
8 a.m. to 5 p.m. ET
Mailing address
MFS Service Center, Inc.
Attn: Institutional Alliance Services (IAS)
P.O. Box 55824
Boston, MA
02205-5824
Overnight mail
MFS Service Center, Inc.
Attn: Institutional Alliance Services (IAS)
500 Boylston Street
Boston, MA 02116-3741


MFS® Variable Insurance Trust IISM
Annual report
MFS® Government Securities Portfolio
(formerly Government Securities Series)
12/31/07
GSS-ANN
MFS® GOVERNMENT SECURITIES PORTFOLIO
(formerly Government Securities Series)
The report is prepared for the general information of contract owners. It is authorized for distribution to prospective investors only when preceded or accompanied by a current prospectus.
NOT FDIC INSURED MAY LOSE VALUE NO BANK OR CREDIT UNION GUARANTEE NOT A DEPOSIT NOT INSURED BY ANY FEDERAL GOVERNMENT AGENCY OR NCUA/NCUSIF
LETTER FROM THE CEO

Dear Contract Owners:
The past year has been a great example of why investors should keep their eyes on the long term.
In 2006 the Dow Jones Industrial Average returned 19% and was fairly stable. This year we have seen a greater level of volatility than has been experienced in recent years. The Dow hit several new highs but also experienced swift drops as a global credit crisis swept through markets, spurred by defaults on U.S. subprime loans and a liquidity crunch. Still, even with this volatility, the Dow ended the first three quarters of 2007 with a return near 13%.
U.S. Treasury bonds gained ground, especially in the third quarter as investors sought less risky asset classes. The spreads of many lower-quality debt investments widened.
In 2007 the U.S. dollar fell against the euro, oil prices hit their highest levels yet, and gold spiked to its steepest price in 28 years. Around the globe, stocks sold off as risk aversion mounted. As we have said before, markets can be volatile, and investors should make sure they have an investment plan that can carry them through the peaks and troughs.
If you are focused on a long-term investment strategy, the short-term ups and downs of the markets should not necessarily dictate portfolio action on your part. In our view, investors who remain committed to a long-term plan are more likely to achieve their financial goals.
In any market environment, we believe individual investors are best served by following a three-pronged investment strategy of allocating their holdings across the major asset classes, diversifying within each class, and regularly rebalancing their portfolios to maintain their desired allocations. Of course, these strategies cannot guarantee a profit or protect against a loss. Investing and planning for the long term require diligence and patience, two traits that in our experience are essential to capitalizing on the many opportunities the financial markets can offer — through both up and down economic cycles.
Respectfully,

Robert J. Manning
Chief Executive Officer and Chief Investment Officer
MFS Investment Management®
February 15, 2008
The opinions expressed in this letter are subject to change, may not be relied upon for investment advice, and no forecasts can be guaranteed.
1
PORTFOLIO COMPOSITION
Portfolio structure (i)
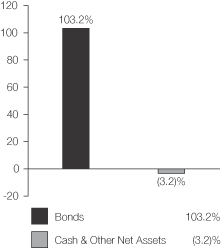
| | |
| Fixed income sectors (i) | | |
| Mortgage-Backed Securities | | 55.6% |
| U.S. Treasury Securities | | 23.7% |
| U.S. Government Agencies | | 21.9% |
| Municipal Bonds | | 2.0% |
| | |
| Credit quality of bonds (r) | | |
| AAA | | 99.2% |
| AA | | 0.8% |
| | |
| Portfolio facts | | |
| Average Duration (d)(i) | | 4.2 |
| Average Life (i)(m) | | 6.1 yrs. |
| Average Maturity (i)(m) | | 14.4 yrs. |
| Average Credit Quality of Rated Securities (long-term) (a) | | AAA |
| Average Credit Quality of Rated Securities (short-term) (a) | | A-1 |
| (a) | The average credit quality of rated securities is based upon a market weighted average of portfolio holdings that are rated by public rating agencies. |
| (d) | Duration is a measure of how much a bond’s price is likely to fluctuate with general changes in interest rates, e.g., if rates rise 1.00%, a bond with a 5-year duration is likely to lose about 5.00% of its value. |
| (i) | For purposes of this presentation, the bond component includes accrued interest amounts and may be positively or negatively impacted by the equivalent exposure from any derivative holdings, if applicable. |
| (m) | The average maturity shown is calculated using the final stated maturity on the portfolio’s holdings without taking into account any holdings which have been pre-refunded or pre-paid to an earlier date or which have a mandatory put date prior to the stated maturity. The average life shown takes into account these earlier dates. |
| (r) | Each security is assigned a rating from Moody’s Investors Service. If not rated by Moody’s, the rating will be that assigned by Standard & Poor’s. Likewise, if not assigned a rating by Standard & Poor’s, it will be based on the rating assigned by Fitch, Inc. For those portfolios that hold a security which is not rated by any of the three agencies, the security is considered Not Rated. Holdings in U.S. Treasuries and government agency mortgage-backed securities, if any, are included in the “AAA”-rating category. Percentages are based on the total market value of investments as of 12/31/07. |
Percentages are based on net assets as of 12/31/07, unless otherwise noted.
The portfolio is actively managed and current holdings may be different.
2
MANAGEMENT REVIEW
Summary of Results
For the twelve months ended December 31, 2007, Initial Class shares of the MFS Government Securities Portfolio (the “fund”) provided a total return of 7.18%, while Service Class shares provided a total return of 6.91%. These compare with a return of 7.72% for the fund’s benchmark, the Lehman Brothers U.S. Government/Mortgage Bond Index.
Market Environment
Despite seemingly robust growth rates during the second and third quarters of 2007, underlying economic activity in the U.S. remained muted relative to other major economies. Overall, global economies witnessed moderate to strong growth during the reporting period as domestic demand improved and world trade accelerated.
With the strong global growth, however, concerns emerged about rising global inflation, especially as capacity became more constrained, wages rose, and energy and food prices advanced. During the reporting period, global central banks (with the exception of the U.S. Federal Reserve Board) tightened monetary conditions, which in turn pushed global bond yields to their highest levels during this economic expansion.
However, financial markets – particularly in the mortgage and structured-products areas – experienced substantial volatility in recent months. Beginning in late July, heightened uncertainty and distress concerning the subprime mortgage market caused several global credit markets to tighten up, forcing central banks to inject liquidity and to reassess their tightening biases as sovereign bond yields declined and credit spreads widened. While credit conditions improved somewhat by late October as the Federal Reserve Board cut interest rates, the level of market turbulence remained significant through year end. Increased market turmoil was also exacerbated by U.S. home foreclosures and uncertainties surrounding falling housing prices. Despite increased volatility across all asset classes and the widening in credit spreads, U.S. labor markets were resilient and wages rose modestly. More broadly, global equity markets rebounded following summer losses and generally held those gains through the end of the reporting period.
Detractors from performance
Relative to the Lehman Brothers U.S. Government/Mortgage Bond Index, the fund’s duration(d) positioning held back performance as interest rates generally declined over the reporting period.
Our greater relative exposure to government agency debt also dampened investment results as the sector lagged the returns of the benchmark.
Contributors to performance
The fund’s lower relative exposure to mortgage-backed securities added to positive performance as credit spreads widened during the recent subprime market crisis.
The fund’s exposure to U.S. Treasury securities, which outperformed the benchmark over the investment period, also helped relative results.
Respectfully,
| | |
Geoffrey Schechter |
| Portfolio Manager | | |
| (d) | Duration is a measure of how much a bond’s price is likely to fluctuate with general changes in interest rates, e.g., if rates rise 1.00%, a bond with a 5-year duration is likely to lose about 5.00% of its value. |
The views expressed in this report are those of the portfolio manager only through the end of the period of the report as stated on the cover and do not necessarily reflect the views of MFS or any other person in the MFS organization. These views are subject to change at any time based on market or other conditions, and MFS disclaims any responsibility to update such views. These views may not be relied upon as investment advice or an indication of trading intent on behalf of any MFS portfolio. References to specific securities are not recommendations of such securities, and may not be representative of any MFS portfolio’s current or future investments.
3
PERFORMANCE SUMMARY THROUGH 12/31/07
The following chart illustrates the historical performance of the fund in comparison to its benchmark index. Index comparisons are unmanaged; do not reflect any fees or expenses; and cannot be invested in directly. The performance of other share classes will be greater than or less than that of the class depicted below. (See Notes to Performance Summary.)
Performance data shown represents past performance and is no guarantee of future results. Investment return and principal value fluctuate so your units, when sold, may be worth more or less than the original cost; current performance may be lower or higher than quoted. The performance shown does not reflect the deduction of taxes, if any, that a contract holder would pay on fund distributions or the redemption of contract units. The returns for the fund shown also do not reflect the deduction of expenses associated with variable products, such as mortality and expense risk charges, separate account charges, and sales charges imposed by the insurance company separate accounts. Such expenses would reduce the overall returns shown.
Growth of a hypothetical $10,000 investment
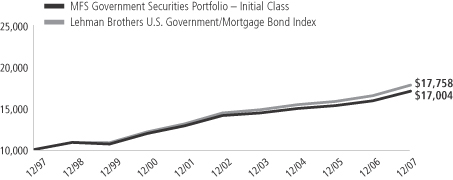
Total returns through 12/31/07
Average Annual Total Returns
| | | | | | | | | | | | |
| | | Share class | | Class inception date | | 1-yr | | 5-yr | | 10-yr | | |
| | | Initial Class | | 6/12/85 | | 7.18% | | 3.80% | | 5.45% | | |
| | | Service Class | | 8/24/01 | | 6.91% | | 3.55% | | 5.29% | | |
Comparative Index
| | | | | | | | | | | | |
| | | Lehman Brothers U.S. Government/Mortgage Bond Index (f) | | 7.72% | | 4.28% | | 5.91% | | |
| (f) | Source: FactSet Research Systems Inc. |
Index Definitions
Lehman Brothers U.S. Government/Mortgage Bond Index – measures debt issued by the U.S. Government, and its agencies, as well as mortgage-backed pass-through securities of Ginnie Mae (GNMA), Fannie Mae (FNMA), and Freddie Mac (FHLMC).
It is not possible to invest directly in an index.
Notes to Performance Summary
Service Class share performance includes the performance of Initial Class shares for periods prior to the inception of Service Class shares (blended performance). This blended performance figure has not been adjusted to take into account differences in the class-specific operating expenses (such as Rule 12b-1 fees). Because operating expenses of Service Class shares are generally higher than those of Initial Class shares, the blended Service Class shares performance shown is higher than it would have been had Service Class shares been offered for the entire period.
Performance results reflect any applicable expense subsidies and waivers in effect during the periods shown. Without such subsidies and waivers the fund’s performance results would be less favorable. Please see the prospectus for complete details. All results are historical and assume the reinvestment of any dividends and capital gains distributions.
From time to time the fund may receive proceeds from litigation settlements, without which performance would be lower.
4
EXPENSE TABLE
Fund expenses borne by the contract holders during the period, July 1, 2007 through December 31, 2007
As a contract holder of the fund, you incur ongoing costs, including management fees; distribution (12b-1) fees; and other fund expenses. This example is intended to help you understand your ongoing costs (in dollars) of investing in the fund and to compare these costs with the ongoing costs of investing in other mutual funds.
The example is based on an investment of $1,000 invested at the beginning of the period and held for the entire period July 1, 2007 through December 31, 2007.
Actual expenses
The first line for each share class in the following table provides information about actual account values and actual expenses. You may use the information in this line, together with the amount you invested, to estimate the expenses that you paid over the period. Simply divide your account value by $1,000 (for example, an $8,600 account value divided by $1,000 = 8.6), then multiply the result by the number in the first line under the heading entitled "Expenses Paid During Period" to estimate the expenses you paid on your account during this period.
Hypothetical example for comparison purposes
The second line for each share class in the following table provides information about hypothetical account values and hypothetical expenses based on the fund's actual expense ratio and an assumed rate of return of 5% per year before expenses, which is not the fund's actual return. The hypothetical account values and expenses may not be used to estimate the actual ending account balance or expenses you paid for the period. You may use this information to compare the ongoing costs of investing in the fund and other funds. To do so, compare this 5% hypothetical example with the 5% hypothetical examples that appear in the shareholder reports of the other funds.
Please note that the expenses shown in the table are meant to highlight the fund's ongoing costs only and do not take into account the fees and expenses imposed under the variable contracts through which your investment in the fund is made. Therefore, the second line for each share class in the table is useful in comparing ongoing costs associated with an investment in vehicles (such as the fund) which fund benefits under variable annuity and variable life insurance contracts and to qualified pension and retirement plans only, and will not help you determine the relative total costs of investing in the fund through variable annuity and variable life insurance contracts. If the fees and expenses imposed under the variable contracts were included, your costs would have been higher.
| | | | | | | | | | |
| Share Class | | | | Annualized
Expense Ratio | | Beginning
Account Value
7/01/07 | | Ending
Account Value
12/31/07 | | Expenses Paid During Period (p)
7/1/07-12/31/07 |
| Initial Class | | Actual | | 0.64% | | $1,000.00 | | $1,061.80 | | $3.33 |
| | Hypothetical (h) | | 0.64% | | $1,000.00 | | $1,021.98 | | $3.26 |
| Service Class | | Actual | | 0.89% | | $1,000.00 | | $1,060.40 | | $4.62 |
| | Hypothetical (h) | | 0.89% | | $1,000.00 | | $1,020.72 | | $4.53 |
| (h) | 5% class return per year before expenses. |
| (p) | Expenses paid is equal to each class' annualized expense ratio, as shown above, multiplied by the average account value over the period, multiplied by the number of days in the period, divided by the number of days in the year. |
5
PORTFOLIO OF INVESTMENTS – 12/31/07
The Portfolio of Investments is a complete list of all securities owned by your fund.
It is categorized by broad-based asset classes.
| | | | | |
| Issuer | | Shares/Par | | Value ($) |
| | | | | |
| BONDS – 98.5% | | | | | |
| Agency – Other – 5.6% | | | | | |
| Financing Corp., 9.4%, 2018 | | 5,475,000 | | $ | 7,605,225 |
| Financing Corp., 9.8%, 2018 | | 7,760,000 | | | 11,056,665 |
| Financing Corp., 10.35%, 2018 | | 7,065,000 | | | 10,439,618 |
| Financing Corp., STRIPS, 0%, 2017 | | 8,940,000 | | | 5,703,550 |
| | | | | |
| | | | $ | 34,805,058 |
| | | | | |
| Mortgage Backed – 55.6% | | | | | |
| Fannie Mae, 5.78%, 2008 | | 1,576,975 | | $ | 1,576,751 |
| Fannie Mae, 4.73%, 2012 | | 917,618 | | | 922,833 |
| Fannie Mae, 4.79%, 2012-2015 | | 7,255,941 | | | 7,315,414 |
| Fannie Mae, 4.543%, 2013 | | 930,719 | | | 928,396 |
| Fannie Mae, 4.845%, 2013 | | 1,758,208 | | | 1,774,408 |
| Fannie Mae, 5%, 2013-2027 | | 24,230,434 | | | 24,302,384 |
| Fannie Mae, 5.06%, 2013-2017 | | 1,565,080 | | | 1,583,107 |
| Fannie Mae, 5.37%, 2013 | | 1,578,841 | | | 1,626,625 |
| Fannie Mae, 4.547%, 2014 | | 1,514,854 | | | 1,504,309 |
| Fannie Mae, 4.6%, 2014 | | 849,235 | | | 844,898 |
| Fannie Mae, 4.621%, 2014 | | 3,563,782 | | | 3,552,742 |
| Fannie Mae, 4.77%, 2014 | | 729,357 | | | 730,533 |
| Fannie Mae, 4.82%, 2014-2015 | | 3,073,823 | | | 3,077,054 |
| Fannie Mae, 4.83%, 2014 | | 480,743 | | | 481,901 |
| Fannie Mae, 4.839%, 2014 | | 5,493,610 | | | 5,530,008 |
| Fannie Mae, 4.871%, 2014 | | 3,169,468 | | | 3,196,985 |
| Fannie Mae, 4.88%, 2014-2020 | | 990,755 | | | 995,579 |
| Fannie Mae, 5.1%, 2014 | | 912,178 | | | 927,670 |
| Fannie Mae, 4.56%, 2015 | | 1,097,424 | | | 1,082,626 |
| Fannie Mae, 4.62%, 2015 | | 1,533,164 | | | 1,519,254 |
| Fannie Mae, 4.665%, 2015 | | 741,158 | | | 735,465 |
| Fannie Mae, 4.69%, 2015 | | 604,768 | | | 601,276 |
| Fannie Mae, 4.7%, 2015 | | 1,097,290 | | | 1,090,991 |
| Fannie Mae, 4.74%, 2015 | | 693,283 | | | 690,560 |
| Fannie Mae, 4.78%, 2015 | | 964,524 | | | 961,183 |
| Fannie Mae, 4.81%, 2015 | | 967,424 | | | 965,666 |
| Fannie Mae, 4.815%, 2015 | | 824,000 | | | 823,264 |
| Fannie Mae, 4.85%, 2015 | | 605,190 | | | 606,822 |
| Fannie Mae, 4.87%, 2015 | | 637,831 | | | 639,455 |
| Fannie Mae, 4.89%, 2015 | | 720,399 | | | 723,613 |
| Fannie Mae, 4.925%, 2015 | | 2,515,482 | | | 2,534,621 |
| Fannie Mae, 5.034%, 2015 | | 109,059 | | | 110,396 |
| Fannie Mae, 5.471%, 2015 | | 1,464,027 | | | 1,517,556 |
| Fannie Mae, 5.09%, 2016 | | 600,000 | | | 605,834 |
| Fannie Mae, 5.423%, 2016 | | 1,414,276 | | | 1,461,583 |
| Fannie Mae, 6.5%, 2016-2036 | | 11,353,696 | | | 11,753,476 |
| Fannie Mae, 4.994%, 2017 | | 2,328,739 | | | 2,353,783 |
| Fannie Mae, 5.05%, 2017 | | 936,000 | | | 942,504 |
| Fannie Mae, 5.5%, 2017-2035 | | 76,450,846 | | | 76,606,517 |
| Fannie Mae, 6%, 2017-2037 | | 16,536,186 | | | 16,840,539 |
| Fannie Mae, 4.5%, 2019 | | 22,736,631 | | | 22,362,204 |
| Fannie Mae, 5.19%, 2020 | | 669,177 | | | 673,959 |
| Fannie Mae, 7.5%, 2022-2031 | | 1,190,612 | | | 1,273,008 |
| Freddie Mac, 4.5%, 2013-2021 | | 3,347,083 | | | 3,346,336 |
| Freddie Mac, 4.375%, 2015 | | 3,045,343 | | | 3,030,533 |
| Freddie Mac, 5%, 2016-2027 | | 27,243,810 | | | 27,298,134 |
| Freddie Mac, 6%, 2021-2037 | | 30,253,449 | | | 30,771,603 |
| | | | | |
| Issuer | | Shares/Par | | Value ($) |
| | | | | |
| BONDS – continued | | | | | |
| Mortgage Backed – continued | | | | | |
| Freddie Mac, 5.5%, 2022-2035 | | 49,149,294 | | $ | 49,245,463 |
| Freddie Mac, 4%, 2024 | | 1,505,070 | | | 1,493,726 |
| Freddie Mac, 6.5%, 2032-2037 | | 7,185,021 | | | 7,410,084 |
| Ginnie Mae, 5.5%, 2033-2034 | | 11,874,357 | | | 11,966,856 |
| | | | | |
| | | | $ | 344,910,487 |
| | | | | |
| Municipals – 2.0% | | | | | |
| California Educational Facilities Authority Rev. (Stanford University), “T-1”, 5%, 2039 | | 6,165,000 | | $ | 6,879,215 |
| Clark County Nevada School District, 5%, 2017 | | 4,290,000 | | | 4,698,880 |
| Minnesota Public Facilities Authority, Water Pollution Control Rev., “B”, 5%, 2018 | | 795,000 | | | 882,522 |
| | | | | |
| | | | $ | 12,460,617 |
| | | | | |
| U.S. Government Agencies – 15.9% | | | | | |
| Aid-Egypt, 4.45%, 2015 | | 3,299,000 | | $ | 3,281,812 |
| Aid-Lebanon, 7.62%, 2009 | | 2,326,157 | | | 2,428,904 |
| Aid-Peru, 9.98%, 2008 | | 546,243 | | | 548,598 |
| Empresa Energetica Cornito Ltd., 6.07%, 2010 | | 3,918,000 | | | 4,078,403 |
| Farmer Mac, 5.5%, 2011 (n) | | 5,370,000 | | | 5,687,201 |
| Federal Home Loan Bank, 4.625%, 2008 | | 7,000,000 | | | 6,999,811 |
| Federal Home Loan Bank, 5.5%, 2008 | | 3,965,000 | | | 3,967,347 |
| Federal Home Loan Bank, 5.25%, 2009 | | 7,235,000 | | | 7,351,078 |
| Freddie Mac, 5.4%, 2009 | | 26,122,000 | | | 26,340,458 |
| Small Business Administration, 8.7%, 2009 | | 44,700 | | | 45,458 |
| Small Business Administration, 9.05%, 2009 | | 3,668 | | | 3,711 |
| Small Business Administration, 10.05%, 2009 | | 2,409 | | | 2,448 |
| Small Business Administration, 6.34%, 2021 | | 1,793,140 | | | 1,873,812 |
| Small Business Administration, 6.35%, 2021 | | 2,006,457 | | | 2,096,086 |
| Small Business Administration, 6.44%, 2021 | | 2,203,716 | | | 2,308,980 |
| Small Business Administration, 6.625%, 2021 | | 2,728,154 | | | 2,901,917 |
| Small Business Administration, 6.07%, 2022 | | 2,195,950 | | | 2,315,797 |
| Small Business Administration, 4.98%, 2023 | | 1,459,716 | | | 1,468,137 |
| Small Business Administration, 4.77%, 2024 | | 2,663,014 | | | 2,649,984 |
| Small Business Administration, 4.86%, 2024 | | 1,868,635 | | | 1,866,428 |
| Small Business Administration, 4.88%, 2024 | | 1,653,307 | | | 1,652,254 |
| Small Business Administration, 4.99%, 2024 | | 2,508,666 | | | 2,522,059 |
| Small Business Administration, 5.52%, 2024 | | 2,094,210 | | | 2,152,206 |
| Small Business Administration, 5.11%, 2025 | | 2,062,598 | | | 2,071,027 |
| U.S. Department of Housing & Urban Development, 6.36%, 2016 | | 6,000,000 | | | 6,388,014 |
| U.S. Department of Housing & Urban Development, 6.59%, 2016 | | 5,744,000 | | | 5,825,324 |
| | | | | |
| | | | $ | 98,827,254 |
| | | | | |
| U.S. Treasury Obligations – 19.4% | | | | | |
| U.S. Treasury Bonds, 9.25%, 2016 | | 4,302,000 | | $ | 5,873,237 |
| U.S. Treasury Bonds, 7.875%, 2021 | | 114,000 | | | 153,330 |
| U.S. Treasury Bonds, 6.25%, 2023 | | 2,318,000 | | | 2,775,263 |
| U.S. Treasury Bonds, 6.875%, 2025 | | 504,000 | | | 648,034 |
| U.S. Treasury Bonds, 6%, 2026 | | 12,439,000 | | | 14,720,785 |
| U.S. Treasury Bonds, 6.75%, 2026 | | 11,921,000 | | | 15,258,880 |
6
Portfolio of Investments – continued
| | | | | |
| Issuer | | Shares/Par | | Value ($) |
| | | | | |
| BONDS – continued | | | | | |
| U.S. Treasury Obligations – continued | | | | | |
| U.S. Treasury Bonds, 6.25%, 2030 | | 579,000 | | $ | 722,574 |
| U.S. Treasury Bonds, 5%, 2037 | | 3,493,000 | | | 3,807,098 |
| U.S. Treasury Notes, 5.5%, 2008 | | 3,250,000 | | | 3,258,379 |
| U.S. Treasury Notes, 6.5%, 2010 (f) | | 36,536,000 | | | 39,067,835 |
| U.S. Treasury Notes, 5.125%, 2011 | | 10,000,000 | | | 10,624,220 |
| U.S. Treasury Notes, 4.125%, 2012 | | 8,916,000 | | | 9,179,994 |
| U.S. Treasury Notes, 4.25%, 2013 | | 1,852,000 | | | 1,920,148 |
| U.S. Treasury Notes, 4%, 2014 | | 11,999,000 | | | 12,258,670 |
| | | | | |
| | | | $ | 120,268,447 |
| | | | | |
Total Bonds
(Identified Cost, $603,571,750) | | | | $ | 611,271,863 |
| | | | | |
| | |
| REPURCHASE AGREEMENTS – 0.5% | | | | | |
| Merrill Lynch, 4.5%, dated 12/31/07, due 1/02/08, total to be received $3,186,797 (secured by U.S. Treasury and Federal Agency obligations and Mortgage Backed securities in a jointly traded account), at Cost | | 3,186,000 | | $ | 3,186,000 |
| | | | | |
Total Investments
(Identified Cost, $606,757,750) (k) | | | | $ | 614,457,863 |
| | | | | |
OTHER ASSETS, LESS
LIABILITIES – 1.0% | | | | | 6,107,903 |
| | | | | |
| Net Assets – 100.0% | | | | $ | 620,565,766 |
| | | | | |
| (f) | All or a portion of the security has been segregated as collateral for an open futures contract. |
| (k) | As of December 31,2007, the fund held securities fair valued in accordance with the policies adopted by the Board of Trustees, aggregating $611,271,863 and 99.48% of market value. All of these security values were provided by an independent pricing service using an evaluated bid. |
| (n) | Securities exempt from registration under Rule 144A of the Securities Act of 1933. These securities may be sold in the ordinary course of business in transactions exempt from registration, normally to qualified institutional buyers. At period end, the aggregate value of these securities was $5,687,201, representing 0.9% of net assets. |
Derivative Contracts at 12/31/07
Futures Contracts Outstanding at 12/31/07
| | | | | | | | |
| Description | | Contracts | | Value | | Expiration
Date | | Unrealized
Appreciation
(Depreciation) |
| U.S. Treasury Note 5 yr (Long) | | 281 | | $ 30,989,031 | | Mar-08 | | $ 124,532 |
| U.S. Treasury Bond 30 yr (Short) | | 56 | | 6,517,000 | | Mar-08 | | 33,492 |
| | | | | | | | $ 158,024 |
At December 31, 2007, the fund had sufficient cash and/or other liquid securities to cover any commitments under these derivative contracts.
The following abbreviations are used in this report and are defined:
| STRIPS | Separate Trading of Registered Interest and Principal of Securities |
See Notes to Financial Statements
7
FINANCIAL STATEMENTS | STATEMENT OF ASSETS AND LIABILITIES
This statement represents your fund’s balance sheet, which details the assets and liabilities comprising the total value of the fund.
| | | | | |
| At 12/31/07 | | | | | |
| Assets: | | | | | |
| Investments, at value (identified cost, $606,757,750) | | $614,457,863 | | | |
| Cash | | 3,444 | | | |
| Receivable for daily variation margin on open futures contracts | | 53,703 | | | |
| Receivable for fund shares sold | | 13,142 | | | |
| Interest receivable | | 6,515,048 | | | |
| Other assets | | 18,654 | | | |
| Total assets | | | | | $621,061,854 |
| Liabilities: | | | | | |
| Payable for fund shares reacquired | | $346,443 | | | |
| Payable to affiliates | | | | | |
Management fee | | 37,226 | | | |
Distribution fees | | 8,741 | | | |
Administrative services fee | | 1,603 | | | |
| Payable for independent trustees’ compensation | | 1,923 | | | |
| Accrued expenses and other liabilities | | 100,152 | | | |
| Total liabilities | | | | | $496,088 |
| Net assets | | | | | $620,565,766 |
| Net assets consist of: | | | | | |
| Paid-in capital | | $600,132,581 | | | |
| Unrealized appreciation (depreciation) on investments | | 7,858,137 | | | |
| Accumulated net realized gain (loss) on investments | | (18,421,333 | ) | | |
| Undistributed net investment income | | 30,996,381 | | | |
Net assets | | | | | $620,565,766 |
| Shares of beneficial interest outstanding | | | | | 48,296,720 |
| Initial Class Shares | | | | | |
Net assets | | $299,871,050 | | | |
Shares outstanding | | 23,261,956 | | | |
Net asset value per share | | | | | $12.89 |
| Service Class shares | | | | | |
Net assets | | $320,694,716 | | | |
Shares outstanding | | 25,034,764 | | | |
Net asset value per share | | | | | $12.81 |
See Notes to Financial Statements
8
FINANCIAL STATEMENTS | STATEMENT OF OPERATIONS
This statement describes how much your fund earned in investment income and accrued in expenses. It also describes any gains and/or losses generated by fund operations.
| | | | | |
| Year ended 12/31/07 | | | | | |
| Net investment income | | | | | |
| Interest | | | | | $33,202,395 |
| Expenses | | | | | |
Management fee | | $3,575,405 | | | |
Distribution fees | | 808,961 | | | |
Administrative services fee | | 168,176 | | | |
Independent trustees’ compensation | | 61,565 | | | |
Custodian fee | | 139,870 | | | |
Shareholder communications | | 64,744 | | | |
Auditing fees | | 46,978 | | | |
Legal fees | | 5,949 | | | |
Miscellaneous | | 37,740 | | | |
| Total expenses | | | | | $4,909,388 |
Fees paid indirectly | | (6,787 | ) | | |
| Net expenses | | | | | $4,902,601 |
| Net investment income | | | | | $28,299,794 |
| Realized and unrealized gain (loss) on investments | | | | | |
| Realized gain (loss) (identified cost basis) | | | | | |
Investment transactions | | $3,308,177 | | | |
Futures contracts | | 794,868 | | | |
| Net realized gain (loss) on investments | | | | | $4,103,045 |
| Change in unrealized appreciation (depreciation) | | | | | |
Investments | | $11,807,086 | | | |
Futures contracts | | (203,983 | ) | | |
| Net unrealized gain (loss) on investments | | | | | $11,603,103 |
| Net realized and unrealized gain (loss) on investments | | | | | $15,706,148 |
| Change in net assets from operations | | | | | $44,005,942 |
See Notes to Financial Statements
9
FINANCIAL STATEMENTS | STATEMENTS OF CHANGES IN NET ASSETS
These statements describe the increases and/or decreases in net assets resulting from operations, any distributions, and any shareholder transactions.
| | | | | | |
| For years ended 12/31 | | 2007 | | | 2006 | |
| Change in net assets | | | | | | |
| From operations | | | | | | |
| Net investment income | | $28,299,794 | | | $28,677,281 | |
| Net realized gain (loss) on investments | | 4,103,045 | | | (1,752,352 | ) |
| Net unrealized gain (loss) on investments | | 11,603,103 | | | (3,907,632 | ) |
| Change in net assets from operations | | $44,005,942 | | | $23,017,297 | |
| Distributions declared to shareholders | | | | | | |
| From net investment income | | | | | | |
Initial Class | | $(16,335,537 | ) | | $(19,538,803 | ) |
Service Class | | (15,330,764 | ) | | (12,425,972 | ) |
| Total distributions declared to shareholders | | $(31,666,301 | ) | | $(31,964,775 | ) |
| Change in net assets from fund share transactions | | $(52,841,844 | ) | | $3,147,375 | |
| Total change in net assets | | $(40,502,203 | ) | | $(5,800,103 | ) |
| Net assets | | | | | | |
| At beginning of period | | 661,067,969 | | | 666,868,072 | |
At end of period (including undistributed net investment income of $30,996,381 and
$31,661,266, respectively) | | $620,565,766 | | | $661,067,969 | |
See Notes to Financial Statements
10
FINANCIAL STATEMENTS | FINANCIAL HIGHLIGHTS
The financial highlights table is intended to help you understand the fund’s financial performance for the past 5 years. Certain information reflects financial results for a single fund share. The total returns in the table represent the rate by which an investor would have earned (or lost) on an investment in the fund share class (assuming reinvestment of all distributions) held for the entire period.
Initial Class
| | | | | | | | | | | | | | | |
| | | Years ended 12/31 | |
| | | 2007 | | | 2006 | | | 2005 | | | 2004 | | | 2003 | |
| Net asset value, beginning of period | | $12.65 | | | $12.84 | | | $13.16 | | | $13.44 | | | $13.85 | |
| Income (loss) from investment operations | | | | | | | | | | | | | | | |
| Net investment income (d) | | $0.56 | | | $0.56 | | | $0.56 | | | $0.54 | | | $0.44 | |
Net realized and unrealized gain (loss) on investments
and foreign currency | | 0.31 | | | (0.12 | ) | | (0.26 | ) | | (0.07 | ) | | (0.14 | ) |
| Total from investment operations | | $0.87 | | | $0.44 | | | $0.30 | | | $0.47 | | | $0.30 | |
| Less distributions declared to shareholders | | | | | | | | | | | | | | | |
| From net investment income | | $(0.63 | ) | | $(0.63 | ) | | $(0.62 | ) | | $(0.75 | ) | | $(0.59 | ) |
| From net realized gain on investments | | — | | | — | | | — | | | — | | | (0.12 | ) |
| Total distributions declared to shareholders | | $(0.63 | ) | | $(0.63 | ) | | $(0.62 | ) | | $(0.75 | ) | | $(0.71 | ) |
| Net asset value, end of period | | $12.89 | | | $12.65 | | | $12.84 | | | $13.16 | | | $13.44 | |
| Total return (%) (k)(s) | | 7.18 | | | 3.68 | | | 2.30 | | | 3.76 | | | 2.15 | |
Ratios (%) (to average net assets)
and Supplemental data: | | | | | | | | | | | | | | | |
| Expenses (f) | | 0.63 | | | 0.63 | | | 0.63 | | | 0.62 | | | 0.62 | |
| Net investment income | | 4.48 | | | 4.47 | | | 4.32 | | | 4.12 | | | 3.22 | |
| Portfolio turnover | | 39 | | | 29 | | | 75 | | | 85 | | | 144 | |
| Net assets at end of period (000 Omitted) | | $299,871 | | | $351,906 | | | $425,740 | | | $493,616 | | | $629,265 | |
See Notes to Financial Statements
11
Financial Highlights – continued
Service Class
| | | | | | | | | | | | | | | |
| | | Years ended 12/31 | |
| | | 2007 | | | 2006 | | | 2005 | | | 2004 | | | 2003 | |
| Net asset value, beginning of period | | $12.58 | | | $12.77 | | | $13.10 | | | $13.38 | | | $13.81 | |
| Income (loss) from investment operations | | | | | | | | | | | | | | | |
| Net investment income (d) | | $0.53 | | | $0.53 | | | $0.53 | | | $0.51 | | | $0.36 | |
Net realized and unrealized gain (loss) on investments
and foreign currency | | 0.31 | | | (0.12 | ) | | (0.27 | ) | | (0.07 | ) | | (0.10 | ) |
| Total from investment operations | | $0.84 | | | $0.41 | | | $0.26 | | | $0.44 | | | $0.26 | |
| Less distributions declared to shareholders | | | | | | | | | | | | | | | |
| From net investment income | | $(0.61 | ) | | $(0.60 | ) | | $(0.59 | ) | | $(0.72 | ) | | $(0.57 | ) |
| From net realized gain on investments | | — | | | — | | | — | | | — | | | (0.12 | ) |
| Total distributions declared to shareholders | | $(0.61 | ) | | $(0.60 | ) | | $(0.59 | ) | | $(0.72 | ) | | $(0.69 | ) |
| Net asset value, end of period | | $12.81 | | | $12.58 | | | $12.77 | | | $13.10 | | | $13.38 | |
| Total return (%) (k)(s) | | 6.91 | | | 3.47 | | | 2.01 | | | 3.55 | | | 1.87 | |
Ratios (%) (to average net assets)
and Supplemental data: | | | | | | | | | | | | | | | |
| Expenses (f) | | 0.88 | | | 0.88 | | | 0.88 | | | 0.87 | | | 0.87 | |
| Net investment income | | 4.23 | | | 4.22 | | | 4.10 | | | 3.90 | | | 2.64 | |
| Portfolio turnover | | 39 | | | 29 | | | 75 | | | 85 | | | 144 | |
| Net assets at end of period (000 Omitted) | | $320,695 | | | $309,162 | | | $241,128 | | | $204,488 | | | $172,578 | |
| (d) | Per share data are based on average shares outstanding. |
| (f) | Ratios do not reflect reductions from fees paid indirectly, if applicable. |
| (k) | The total return does not reflect expenses that apply to separate accounts. Inclusion of these charges would reduce the total return figures for all periods shown. |
| (s) | From time to time the fund may receive proceeds from litigation settlements, without which performance would be lower. |
See Notes to Financial Statements
12
NOTES TO FINANCIAL STATEMENTS
| (1) | | Business and Organization |
MFS Government Securities Portfolio (formerly Government Securities Series) (the fund) is a series of MFS Variable Insurance Trust II (formerly known as MFS/Sun Life Series Trust) (the trust). The trust is organized as a Massachusetts business trust and is registered under the Investment Company Act of 1940, as amended, as an open-end management investment company. The shares of the fund are sold only to variable accounts established by insurance companies to fund benefits under variable contracts issued by such companies and qualified retirement and pension plans.
| (2) | | Significant Accounting Policies |
General – The preparation of financial statements in conformity with U.S. generally accepted accounting principles requires management to make estimates and assumptions that affect the reported amounts of assets and liabilities, and disclosure of contingent assets and liabilities at the date of the financial statements and the reported amounts of revenues and expenses during the reporting period. Actual results could differ from those estimates.
Investment Valuations – Debt instruments (other than short-term instruments), including restricted debt instruments, are generally valued at an evaluated or composite bid as reported by an independent pricing service. Short-term instruments with a maturity at issuance of 60 days or less may be valued at amortized cost, which approximates market value. Futures contracts are generally valued at last posted settlement price as reported by an independent pricing service on the market on which they are primarily traded. Futures contracts for which there were no trades that day for a particular position are generally valued at the closing bid quotation as reported by an independent pricing service on the market on which such futures contracts are primarily traded. Securities and other assets generally valued on the basis of information from an independent pricing service may also be valued at a broker-dealer bid quotation. Values obtained from pricing services can utilize both dealer-supplied valuations and electronic data processing techniques, which take into account factors such as institutional-size trading in similar groups of securities, yield, quality, coupon rate, maturity, type of issue, trading characteristics, and other market data.
The Board of Trustees has delegated primary responsibility for determining or causing to be determined the value of the fund’s investments (including any fair valuation) to the adviser pursuant to valuation policies and procedures approved by the Board. If the adviser determines that reliable market quotations are not readily available, investments are valued at fair value as determined in good faith by the adviser in accordance with such procedures under the oversight of the Board of Trustees. Under the fund’s valuation policies and procedures, market quotations are not considered to be readily available for many types of debt instruments and certain types of derivatives. These investments are generally valued at fair value based on information from independent pricing services. In addition, investments may be valued at fair value if the adviser determines that an investment’s value has been materially affected by events occurring after the close of the exchange or market on which the investment is principally traded (such as foreign exchange or market) and prior to the determination of the fund’s net asset value, or after the halting of trading of a specific security where trading does not resume prior to the close of the exchange or market on which the security is principally traded. The adviser may rely on independent pricing services or other information (such as the correlation with price movements of similar securities in the same or other markets; the type, cost and investment characteristics of the security; the business and financial condition of the issuer; and trading and other market data) to assist in determining whether to fair value and at what value to fair value an investment. The value of an investment for purposes of calculating the fund’s net asset value can differ depending on the source and method used to determine value. When fair valuation is used, the value of investments used to determine the fund’s net asset value may differ from quoted or published prices for the same investments.
In September 2006, FASB Statement No. 157, Fair Value Measurements (the “Statement”) was issued, and is effective for fiscal years beginning after November 15, 2007 and for all interim periods within those fiscal years. This Statement provides a single definition of fair value, a hierarchy for measuring fair value and expanded disclosures about fair value measurements. Management is evaluating the application of the Statement to the fund, and believes the impact will be limited to expanded disclosures resulting from the adoption of this Statement in the fund’s financial statements.
Repurchase Agreements – The fund may enter into repurchase agreements with institutions that the fund’s investment adviser has determined are creditworthy. Each repurchase agreement is recorded at cost. The fund requires that the securities collateral in a repurchase transaction be transferred to the custodian in a manner sufficient to enable the fund to obtain those securities in the event of a default under the repurchase agreement. The fund monitors, on a daily basis, the value of the collateral to ensure that its value, including accrued interest, is greater than amounts owed to the fund under each such repurchase agreement. The fund and other funds managed by Massachusetts Financial Services Company (MFS), may utilize a joint trading account for the purpose of entering into one or more repurchase agreements.
Inflation-Adjusted Debt Securities – The fund may invest in inflation-adjusted debt securities issued by the U.S. Treasury. The fund may also invest in inflation-adjusted debt securities issued by U.S. Government agencies and instrumentalities other than the U.S. Treasury and by other entities such as U.S. and foreign corporations and foreign governments. The principal value of
13
Notes to Financial Statements – continued
these debt securities is adjusted through income according to changes in the Consumer Price Index or another general price or wage index. These debt securities typically pay a fixed rate of interest, but this fixed rate is applied to the inflation-adjusted principal amount. The principal paid at maturity of the debt security is typically equal to the inflation-adjusted principal amount, or the security’s original par value, whichever is greater. Other types of inflation-adjusted securities may use other methods to adjust for other measures of inflation.
Derivative Risk – The fund may invest in derivatives for hedging or non-hedging purposes. While hedging can reduce or eliminate losses, it can also reduce or eliminate gains. When the fund uses derivatives as an investment to gain market exposure, or for hedging purposes, gains and losses from derivative instruments may be substantially greater than the derivative’s original cost. Derivative instruments include futures contracts.
Futures Contracts – The fund may enter into futures contracts for the delayed delivery of securities or currency, or contracts based on financial indices at a fixed price on a future date. In entering such contracts, the fund is required to deposit with the broker either in cash or securities an amount equal to a certain percentage of the contract amount. Subsequent payments are made or received by the fund each day, depending on the daily fluctuations in the value of the contract, and are recorded for financial statement purposes as unrealized gains or losses by the fund. Upon entering into such contracts, the fund bears the risk of interest or exchange rates or securities prices moving unexpectedly, in which case, the fund may not achieve the anticipated benefits of the futures contracts and may realize a loss.
Indemnifications – Under the fund’s organizational documents, its officers and trustees may be indemnified against certain liabilities and expenses arising out of the performance of their duties to the fund. Additionally, in the normal course of business, the fund enters into agreements with service providers that may contain indemnification clauses. The fund’s maximum exposure under these agreements is unknown as this would involve future claims that may be made against the fund that have not yet occurred.
Investment Transactions and Income – Investment transactions are recorded on the trade date. Interest income is recorded on the accrual basis. All premium and discount is amortized or accreted for financial statement purposes in accordance with U.S. generally accepted accounting principles. All discount is accreted for tax reporting purposes as required by federal income tax regulations. The fund may receive proceeds from litigation settlements. Any proceeds received from litigation involving portfolio holdings are reflected in the Statement of Operations in realized gain/loss if the security has been disposed of by the fund or in unrealized gain/loss if the security is still held by the fund. Any other proceeds from litigation not related to portfolio holdings are reflected as other income in the Statement of Operations.
The fund may enter into “TBA” (to be announced) purchase commitments to purchase securities for a fixed unit price at a future date. Although the unit price has been established, the principal value has not been finalized. However, the principal amount of the commitments will not fluctuate more than 0.01%. The fund holds, and maintains until settlement date, cash or high-grade debt obligations in an amount sufficient to meet the purchase price, or the fund may enter into offsetting contracts for the forward sale of other securities it owns. Income on the securities will not be earned until settlement date. TBA purchase commitments may be considered securities in themselves, and involve a risk of loss if the value of the security to be purchased declines prior to settlement date, which is in addition to the risk of decline in the value of the fund’s other assets. Unsettled TBA purchase commitments are valued at the current market value of the underlying securities.
The fund may enter into “TBA” (to be announced) sale commitments to hedge its portfolio positions or to sell mortgage-backed securities it owns under delayed delivery arrangements. Proceeds of TBA sale commitments are not received until the contractual settlement date. During the time a TBA sale commitment is outstanding, equivalent deliverable securities, or an offsetting TBA purchase commitment deliverable on or before the sale commitment date, are held as “cover” for the transaction.
Fees Paid Indirectly – The fund’s custody fee may be reduced according to an arrangement that measures the value of cash deposited with the custodian by the fund. This amount, for the year ended December 31, 2007, is shown as a reduction of total expenses on the Statement of Operations.
Tax Matters and Distributions – The fund intends to qualify as a regulated investment company, as defined under Subchapter M of the Internal Revenue Code, and to distribute all of its taxable income, including realized capital gains. As a result, no provision for federal income taxes is required. The fund adopted the provisions of FASB Interpretation No. 48, Accounting for Uncertainty in Income Taxes (“the Interpretation”) on January 1, 2007. The Interpretation prescribes a minimum threshold for financial statement recognition of the benefit of a tax position taken or expected to be taken in a tax return. There was no impact resulting from the adoption of this Interpretation on the fund’s financial statements. Each of the fund’s federal tax returns for the prior three fiscal years remains subject to examination by the Internal Revenue Service. It is the fund’s policy to record interest and penalty charges on underpaid taxes associated with its tax positions as interest expense and other expense, respectively. No such charges were recorded in the current financial statements. Foreign taxes, if any, have been accrued by the fund in the accompanying financial statements.
14
Notes to Financial Statements – continued
Distributions to shareholders are recorded on the ex-dividend date. Income and capital gain distributions are determined in accordance with income tax regulations, which may differ from U.S. generally accepted accounting principles. Certain capital accounts in the financial statements are periodically adjusted for permanent differences in order to reflect their tax character. These adjustments have no impact on net assets or net asset value per share. Temporary differences which arise from recognizing certain items of income, expense, gain or loss in different periods for financial statement and tax purposes will reverse at some time in the future. Distributions in excess of net investment income or net realized gains are temporary overdistributions for financial statement purposes resulting from differences in the recognition or classification of income or distributions for financial statement and tax purposes.
Book/tax differences primarily relate to amortization and accretion of debt securities and straddle loss deferrals.
The tax character of distributions declared to shareholders is as follows:
| | | | |
| | | 12/31/07 | | 12/31/06 |
| Ordinary income (including any short-term capital gains) | | $31,666,301 | | $31,964,775 |
The federal tax cost and the tax basis components of distributable earnings were as follows:
| | | |
| As of 12/31/07 | | | |
| Cost of investments | | $612,061,833 | |
| Gross appreciation | | 7,668,826 | |
| Gross depreciation | | (5,272,796 | ) |
| Net unrealized appreciation (depreciation) | | $2,396,030 | |
| Undistributed ordinary income | | 30,996,381 | |
| Capital loss carryforwards | | (12,402,349 | ) |
| Other temporary differences | | (556,877 | ) |
As of December 31, 2007, the fund had capital loss carryforwards available to offset future realized gains. Such losses expire as follows:
| | | |
| 12/31/11 | | $(2,603,049 | ) |
| 12/31/12 | | (3,805,608 | ) |
| 12/31/13 | | (4,142,507 | ) |
| 12/31/14 | | (1,851,185 | ) |
| | $(12,402,349 | ) |
Multiple Classes of Shares of Beneficial Interest – The fund offers multiple classes of shares, which differ in their respective distribution fees. All shareholders bear the common expenses of the fund based on daily net assets of each class, without distinction between share classes. Dividends are declared separately for each class. Differences in per share dividend rates are generally due to differences in separate class expenses.
| (3) | | Transactions with Affiliates |
Investment Adviser – The fund has an investment advisory agreement with MFS to provide overall investment management and related administrative services and facilities to the fund.
The management fee is computed daily and paid monthly at the following annual rates:
| | |
| First $1 billion of average daily net assets | | 0.55% |
| Average daily net assets in excess of $1 billion | | 0.50% |
The management fee incurred for the year ended December 31, 2007 was equivalent to an annual effective rate of 0.55% of the fund’s average daily net assets.
The investment adviser has agreed in writing to pay a portion of the fund’s operating expenses, exclusive of certain other fees and expenses, such that total annual fund operating expenses do not exceed 1.25% of the fund’s average daily net assets. MFS’ agreement to limit the fund’s operating expenses is contained in the investment advisory agreement between MFS and the fund and may not be rescinded without shareholder approval. In addition, the investment adviser has voluntarily agreed to pay a portion of the fund’s operating expenses, exclusive of certain other fees and expenses, such that total annual operating expenses do not exceed 1.00% of the fund’s average daily net assets attributable to Initial Class shares. This voluntary agreement may be changed or rescinded at any time by MFS. For the year ended December 31, 2007, the fund’s actual operating expenses did not exceed the limit and therefore, the investment adviser did not pay a portion of the fund’s expenses.
Distributor – MFS Fund Distributors, Inc. (MFD), a wholly-owned subsidiary of MFS, is the distributor of shares of the fund. The Trustees have adopted a distribution plan for the Service Class shares pursuant to Rule 12b-1 under the Investment Company Act of 1940.
15
Notes to Financial Statements – continued
The fund’s distribution plan provides that the fund will pay MFD distribution fees equal to 0.25% per annum of its average daily net assets attributable to Service Class shares as partial consideration for services performed and expenses incurred by MFD and financial intermediaries in connection with the sale and distribution of the fund’s Service Class shares and the sale and distribution of the variable annuity or variable life insurance contracts investing indirectly in Service Class shares. MFD may subsequently pay all, or a portion, of the distribution fees to financial intermediaries.
Shareholder Servicing Agent – MFS Service Center, Inc. (MFSC), a wholly-owned subsidiary of MFS, has contracted to provide transfer agent and recordkeeping functions in connection with the issuance, transfer, and redemption of each class of shares of the fund under a Shareholder Servicing Agent Agreement. During the year ended December 31, 2007, MFSC did not receive a fee for this service.
Administrator – MFS provides certain financial, legal, shareholder communications, compliance, and other administrative services to the fund. Under an administrative services agreement, the fund partially reimburses MFS the costs incurred to provide these services. The fund is charged an annual fixed amount of $10,000 plus a fee based on average daily net assets.
The administrative services fee incurred for the year ended December 31, 2007 was equivalent to an annual effective rate of 0.0259% of the fund’s average daily net assets.
Trustees’ and Officers’ Compensation – The fund pays compensation to trustees in the form of a retainer, attendance fees, and additional compensation to the Board chairperson. The fund does not pay compensation directly to officers of the fund who are also officers of the investment adviser, all of whom receive remuneration for their services to the fund from MFS. Certain officers of the fund are officers or directors of MFS, MFD, and MFSC.
Other – This fund and certain other MFS funds (the funds) have entered into a services agreement (the Agreement) which provides for payment of fees by the funds to Tarantino LLC in return for the provision of services of an Independent Chief Compliance Officer (ICCO) for the funds. The ICCO is an officer of the funds and the sole member of Tarantino LLC. The funds can terminate the Agreement with Tarantino LLC at any time under the terms of the Agreement. MFS has agreed to bear all expenses associated with office space, other administrative support, and supplies provided to the ICCO. For the year ended December 31, 2007, the fee paid to Tarantino LLC was $3,135.
Purchases and sales of investments, other than purchased option transactions and short-term obligations, were as follows:
| | | | |
| | | Purchases | | Sales |
| U.S. government securities | | $231,418,340 | | $275,852,678 |
| Investments (non-U.S. government securities) | | $17,971,590 | | $23,708,160 |
| (5) | | Shares of Beneficial Interest |
The fund’s Declaration of Trust permits the Trustees to issue an unlimited number of full and fractional shares of beneficial interest. Transactions in fund shares were as follows:
| | | | | | | | | | | | |
| | | Year ended 12/31/07 | | | Year ended 12/31/06 | |
| | | Shares | | | Amount | | | Shares | | | Amount | |
| Shares sold | | | | | | | | | | | | |
Initial Class | | 1,325,989 | | | $16,419,478 | | | 1,901,707 | | | $23,886,222 | |
Service Class | | 2,759,668 | | | 34,066,245 | | | 5,845,549 | | | 73,153,904 | |
| | 4,085,657 | | | $50,485,723 | | | 7,747,256 | | | $97,040,126 | |
| Shares issued to shareholders in reinvestment of distributions | | | | | | | | | | | | |
Initial Class | | 1,333,513 | | | $16,335,537 | | | 1,620,133 | | | $19,538,803 | |
Service Class | | 1,257,651 | | | 15,330,764 | | | 1,034,635 | | | 12,425,972 | |
| | 2,591,164 | | | $31,666,301 | | | 2,654,768 | | | $31,964,775 | |
| Shares reacquired | | | | | | | | | | | | |
Initial Class | | (7,206,116 | ) | | $(90,653,401 | ) | | (8,870,465 | ) | | $(111,053,317 | ) |
Service Class | | (3,552,033 | ) | | (44,340,467 | ) | | (1,186,471 | ) | | (14,804,209 | ) |
| | (10,758,149 | ) | | $(134,993,868 | ) | | (10,056,936 | ) | | $(125,857,526 | ) |
| Net change | | | | | | | | | | | | |
Initial Class | | (4,546,614 | ) | | $(57,898,386 | ) | | (5,348,625 | ) | | $(67,628,292 | ) |
Service Class | | 465,286 | | | 5,056,542 | | | 5,693,713 | | | 70,775,667 | |
| | (4,081,328 | ) | | $(52,841,844 | ) | | 345,088 | | | $3,147,375 | |
16
Notes to Financial Statements – continued
The fund and other funds managed by MFS participate in a $1 billion unsecured committed line of credit provided by a syndication of banks under a credit agreement. In addition, the fund and other funds managed by MFS have established uncommitted borrowing arrangements with certain banks. Borrowings may be made for temporary financing needs. Interest is charged to each fund, based on its borrowings, generally at a rate equal to the Federal Reserve funds rate plus 0.30%. In addition, a commitment fee, based on the average daily, unused portion of the committed line of credit, is allocated among the participating funds at the end of each calendar quarter. For the year ended December 31, 2007, the fund’s commitment fee and interest expense were $2,952 and $252, respectively, and are included in miscellaneous expense on the Statement of Operations.
17
REPORT OF INDEPENDENT REGISTERED PUBLIC ACCOUNTING FIRM
To the Board of Trustees of MFS Variable Insurance Trust II (formerly known as MFS/Sun Life Series Trust) and the Shareholders of MFS Government Securities Portfolio (formerly known as Government Securities Series):
We have audited the accompanying statement of assets and liabilities, including the portfolio of investments, of MFS Government Securities Portfolio (one of the portfolios comprising MFS Variable Insurance Trust II) (the “Trust”) as of December 31, 2007, and the related statement of operations for the year then ended, the statements of changes in net assets for each of the two years in the period then ended, and the financial highlights for each of the five years in the period then ended. These financial statements and financial highlights are the responsibility of the Trust’s management. Our responsibility is to express an opinion on these financial statements and financial highlights based on our audits.
We conducted our audits in accordance with the standards of the Public Company Accounting Oversight Board (United States). Those standards require that we plan and perform the audit to obtain reasonable assurance about whether the financial statements and financial highlights are free of material misstatement. The Trust is not required to have, nor were we engaged to perform, an audit of its internal control over financial reporting. Our audits included consideration of internal control over financial reporting as a basis for designing audit procedures that are appropriate in the circumstances, but not for the purpose of expressing an opinion on the effectiveness of the Trust’s internal control over financial reporting. Accordingly, we express no such opinion. An audit also includes examining, on a test basis, evidence supporting the amounts and disclosures in the financial statements, assessing the accounting principles used and significant estimates made by management, as well as evaluating the overall financial statement presentation. Our procedures included confirmation of securities owned as of December 31, 2007, by correspondence with the custodian and brokers; where replies were not received from brokers, we performed other auditing procedures. We believe that our audits provide a reasonable basis for our opinion.
In our opinion, such financial statements and financial highlights present fairly, in all material respects, the financial position of MFS Government Securities Portfolio as of December 31, 2007, the results of its operations for the year then ended, the changes in its net assets for each of the two years in the period then ended, and its financial highlights for each of the five years in the period then ended, in conformity with accounting principles generally accepted in the United States of America.
DELOITTE & TOUCHE LLP
Boston, Massachusetts
February 15, 2008
18
TRUSTEES AND OFFICERS – IDENTIFICATION AND BACKGROUND
The Trustees and officers of the Trust, as of February 1, 2008, are listed below, together with their principal occupations during the past five years. (Their titles may have varied during that period.) The address of each Trustee and officer is 500 Boylston Street, Boston, Massachusetts 02116.
| | | | | | |
Name, Date of Birth | | Position(s) Held
with Fund | | Trustee/Officer
Since(1) | | Principal Occupations During the Past Five Years &
Other Directorships(2) |
| INTERESTED TRUSTEE | | | | | | |
David D. Horn(3) (born 06/07/41) | | Trustee | | April 1986 | | Private investor; Retired; Sun Life Assurance Company of Canada, Former Senior Vice President and General Manager for the United States (until 1997); Retired: Sun Life Assurance Company of Canada, Director (until March 2004) |
| | |
| INDEPENDENT TRUSTEES | | | | |
J. Kermit Birchfield (born 01/08/40) | | Chairman | | May 1997 | | Consultant; Century Partners, Inc. (investments), Director (1988 to present); Displaytech, Inc. (technology), Director (1995 to present); Dessin Fournir LLC (furniture manufacturer), Director (2005 to present); Intermountain Gas Company, Inc. & Intermountain Industries, Inc. (oil & gas exploration and production) (1988 to present); Site Watch LLC (software to monitor oil tanks) Managing Director (2006 to present); Juridica Investments (fund investing in judicial matters) Director (2007 to present); Dairy Mart Convenience Stores, Inc. (convenience stores), Chairman (1997 to 2003) |
| | | |
Robert C. Bishop (born 01/13/43) | | Trustee | | May 2001 | | Autolmmune Inc. (pharmaceutical product licensing), Chairman, President and Chief Executive Officer (1992 to present); Caliper Life Sciences Corp. (laboratory analytical instruments), Director (2002 to present); Millipore Corporation (biopharmaceutical/research laboratory products), Director (1997 to present); Optobionics Corporation (ophthalmic devices), Director (2002 to 2007); Quintiles Transnational Corp. (contract research services), Director (until 2003) |
| | | |
Frederick H. Dulles (born 03/12/42) | | Trustee | | May 2001 | | Ten State International Law PLLC (law firm), Of Counsel (since 2006); Prudential Carolina Real Estate, (real estate), Broker (since 2006); Free Enterprise Foundation, Inc. (research institute), Director & Secretary (until 2008); Disher, Hamrick & Myers Residential, Inc. (real estate) Broker (until 2006); Frederick H. Dulles law practice (until 2006); Ten State Street LLP (law firm), Member (until 2005); McFadden, Pilkington & Ward LLP (solicitors and registered foreign lawyers), Member & Of Counsel (until 2003) |
| | | |
Marcia A. Kean (born 06/30/48) | | Trustee | | April 2005 | | Feinstein Kean Healthcare (consulting), Chief Executive Officer (since December 2002), Managing Director (prior to May 2001); Ardais Corporation (biotech products), Senior Vice President – Commercialization (February 2002 until November 2002) |
| | | |
Ronald G. Steinhart (born 06/15/40) | | Trustee | | May 2001 | | Private investor; Penske Automotive Group (automotive retailer), Director (2001 to present); Penson Worldwide, Inc. (securities clearance), Director (2006 to present); Animal Health International, Inc. (animal health products), Director (2007 to present); Texas Industries (concrete/aggregates/cement), Director (2007 to present); Carreker Corporation (technology consulting) Director (until 2005); Prentiss Properties Trust (real estate investment trust), Director (until 2006) |
| | | |
Haviland Wright (born 07/21/48) | | Trustee | | May 2001 | | Elixir Technologies Corporation (software) Director (2005 to present); Nano Loa Inc. (liquid crystal displays), Director (2003 to present); Silk Displays, Inc. (smart polymers) Director (2007 to present); Displaytech, Inc. (technology) Chairman and CEO (1995 – 2002) |
| | | |
| TRUSTEE EMERITUS | | | | | | |
Samuel Adams (born 10/19/25) | | Trustee Emeritus | | | | Retired; Kirkpatrick & Lockhart Preston Gates Ellis LLP (law firm), Of Counsel |
| | | |
| OFFICERS | | | | | | |
Maria F. Dwyer(4) (born 12/01/58) | | President | | November 2005 | | Massachusetts Financial Services Company, Executive Vice President and Chief Regulatory Officer (since March 2004); Fidelity Management & Research Company, Vice President (prior to March 2004); Fidelity Group of Funds, President and Treasurer (prior to March 2004) |
| | | |
Tracy Atkinson(4) (born 12/30/64) | | Treasurer | | September 2005 | | Massachusetts Financial Services Company, Senior Vice President (since September 2004); PricewaterhouseCoopers LLP, Partner (prior to September 2004) |
| | | |
Christopher R. Bohane(4) (born 01/18/74) | | Assistant Secretary and Assistant Clerk | | July 2005 | | Massachusetts Financial Services Company, Vice President and Senior Counsel (since April 2003); Kirkpatrick & Lockhart LLP (law firm), Associate (prior to April 2003) |
| | | |
Ethan D. Corey(4) (born 11/21/63) | | Assistant Secretary and Assistant Clerk | | July 2005 | | Massachusetts Financial Services Company, Senior Vice President and Associate General Counsel (since April 2006); Special Counsel (prior to April 2006); Dechert LLP (law firm), Counsel (prior to December 2004) |
| | | |
David L. DiLorenzo(4) (born 08/10/68) | | Assistant Treasurer | | July 2005 | | Massachusetts Financial Services Company, Vice President (since June 2005); JP Morgan Investor Services, Vice President (January 2001 to June 2005) |
19
Trustees and Officers – continued
| | | | | | |
Name, Date of Birth | | Position(s) Held
with Fund | | Trustee/Officer
Since(1) | | Principal Occupations During the Past Five Years &
Other Directorships(2) |
Timothy M. Fagan(4) (born 07/10/68) | | Assistant Secretary and Assistant Clerk | | September 2005 | | Massachusetts Financial Services Company, Vice President and Senior Counsel (since September 2005); John Hancock Advisers, LLC, Vice President and Chief Compliance Officer (September 2004 to August 2005) Senior Attorney (prior to September 2004); John Hancock Group of Funds, Vice President and Chief Compliance Officer (September 2004 to December 2004) |
| | | |
Mark D. Fischer(4) (born 10/27/70) | | Assistant Treasurer | | July 2005 | | Massachusetts Financial Services Company, Vice President (since May 2005); JP Morgan Investment Management Company, Vice President (prior to May 2005) |
| | | |
Brian E. Langenfeld(4) (born 03/07/73) | | Assistant Secretary and Assistant Clerk | | May 2006 | | Massachusetts Financial Services Company, Assistant Vice President and Counsel (since May 2006); John Hancock Advisers, LLC, Assistant Vice President and Counsel (May 2005 to April 2006); John Hancock Advisers, LLC, Attorney and Assistant Secretary (prior to May 2005) |
| | | |
Ellen Moynihan(4) (born 11/13/57) | | Assistant Treasurer | | May 1997 | | Massachusetts Financial Services Company, Senior Vice President |
| | | |
Susan S. Newton(4) (born 03/07/50) | | Assistant Secretary and Assistant Clerk | | May 2005 | | Massachusetts Financial Services Company, Senior Vice President and Assistant General Counsel (since April 2005); John Hancock Advisers, LLC, Senior Vice President, Secretary and Chief Legal Officer (prior to April 2005); John Hancock Group of Funds, Senior Vice President, Secretary and Chief Legal Officer (prior to April 2005) |
| | | |
Susan A. Pereira(4) (born 11/05/70) | | Assistant Secretary and Assistant Clerk | | July 2005 | | Massachusetts Financial Services Company, Vice President and Senior Counsel (since June 2004); Bingham McCutchen LLP (law firm), Associate (January 2001 to June 2004) |
| | | |
Mark N. Polebaum(4) (born 05/01/52) | | Secretary and Assistant Clerk | | February 2006 | | Massachusetts Financial Services Company, Executive Vice President, General Counsel and Secretary (since January 2006); Wilmer Cutler Pickering Hale and Dorr LLP (law firm), Partner (prior to January 2006) |
| | | |
Frank L. Tarantino (born 03/07/44) | | Independent Chief Compliance Officer | | September 2004 | | Tarantino LLC (provider of compliance services), Principal (since June 2004); CRA Business Strategies Group (consulting services), Executive Vice President (April 2003 to June 2004); David L. Babson & Co. (investment adviser), Managing Director, Chief Administrative Officer and Director (February 1997 to March 2003) |
| | | |
Richard S. Weitzel(4) (born 7/16/70) | | Assistant Secretary and Assistant Clerk | | October 2007 | | Massachusetts Financial Services Company, Vice President and Assistant General Counsel (since 2007); Vice President and Senior Counsel (since May 2004); Massachusetts Department of Business and Technology, General Counsel (February 2003 to April 2004); Massachusetts Office of the Attorney General, Assistant Attorney General ( April 2001 to February 2003); Ropes and Gray, Associate (prior to April 2001) |
| | | |
James O. Yost(4) (born 06/12/60) | | Assistant Treasurer | | April 1992 | | Massachusetts Financial Services Company, Senior Vice President |
| (1) | Date first appointed to serve as Trustee/Officer of an MFS fund or a Compass variable account. Each Trustee has served continuously since appointment. |
| (2) | Directorships or trusteeships of companies required to report to the Securities and Exchange Commission (i.e., “public companies”). |
| (3) | “Interested person” of the Sun Life of Canada (U.S.), within the meaning of the Investment Company Act of 1940 (referred to as the 1940 Act), which is the principal federal law governing investment companies like the Series. The address of Sun Life of Canada (U.S.) is One Sun Life Executive Park, Wellesley Hills, Massachusetts 02481. |
| (4) | “Interested person” of MFS within the meaning of the 1940 Act. The address of MFS is 500 Boylston Street, Boston, Massachusetts 02116. |
The Trust does not hold annual meetings for the purpose of electing Trustees, and Trustees are not elected for fixed terms. Each Trustee and officer holds office until his or her successor is chosen and qualified, or until his or her earlier death, resignation, retirement or removal.
All Trustees currently serve as Trustees of the Trust and have served in that capacity since originally elected or appointed. All of the Trustees are also Managers of the Compass Variable Accounts. The executive officers of the Trust hold similar offices for the Compass Variable Accounts and other funds in the MFS fund complex. As of January 1, 2008, each Trustee serves as a Trustee or Manager of 35 Accounts/Funds.
20
Trustees and Officers – continued
The Statement of Additional Information contains further information about the Trustees and is available without charge upon request by calling 1-800-225-2606.
| | |
Investment Adviser
Massachusetts Financial Services Company 500 Boylston Street, Boston, MA 02116-3741 | | Custodian State Street Bank and Trust Company 225 Franklin Street, Boston, MA 02110 |
Distributor
MFS Fund Distributors, Inc. 500 Boylston Street, Boston, MA 02116-3741 | | Independent Registered Public Accounting Firm Deloitte & Touche LLP 200 Berkeley Street, Boston, MA 02116 |
Portfolio Manager Geoffrey Schechter | | |
21
BOARD REVIEW OF INVESTMENT ADVISORY AGREEMENT
The Investment Company Act of 1940 requires that both the full Board of Trustees and a majority of the non-interested (“independent”) Trustees, voting separately, annually approve the continuation of the investment advisory agreement between MFS Variable Insurance Trust II (the “Trust”) and Massachusetts Financial Services Company (MFS) on behalf of the Fund. The Trustees consider matters bearing on the Fund and the advisory arrangements at their meetings throughout the year, including a review of performance data at each regular meeting. In addition, the independent Trustees met several times over the course of three months beginning in May and ending in July 2007 (“contract review meetings”) for the specific purpose of considering whether to approve the continuation of the investment advisory agreement for the Fund. The independent Trustees were assisted in their evaluation of the investment advisory agreement by independent legal counsel, from whom they received separate legal advice and with whom they met separately from MFS management during various contract review meetings. The independent Trustees were also assisted in this process by the Fund’s Independent Chief Compliance Officer, a full-time senior officer appointed by and reporting to the independent Trustees.
In connection with their deliberations, the Trustees, including the independent Trustees, considered such information and factors as they believed, in light of the legal advice furnished to them and their own business judgment, to be relevant. The investment advisory agreement was considered separately for the Fund, although the Trustees also took into account the common interests of all Funds in the Trust in their review. As described below, the Trustees considered the nature, quality, and extent of the various investment advisory, administrative, and shareholder services performed by MFS under the existing investment advisory agreement and other arrangements with the Trust.
In connection with their contract review meetings, the Trustees received and relied upon materials which included, among other items: (i) information provided by Lipper Inc. on the investment performance of the Fund for various time periods ended December 31, 2006, compared to the investment performance of a group of funds with substantially similar investment classifications/objectives (the “Lipper performance universe”), as well as the investment performance of a group of funds identified by objective criteria suggested by MFS (“peer funds”), (ii) information provided by Lipper Inc. on the Fund’s advisory fees and other expenses compared to the advisory fees and other expenses of comparable funds identified by Lipper (the “Lipper expense group”), as well as the advisory fees and other expenses of peer funds identified by objective criteria suggested by MFS, (iii) information provided by MFS on the advisory fees of comparable portfolios of its other clients, including institutional separate account and other clients, (iv) information as to whether, and to what extent applicable, expense waivers, reimbursements or fee “breakpoints” are observed for the Fund, (v) information regarding MFS’ financial results and financial condition, including MFS’ and certain of its affiliates’ estimated profitability from services performed for the Fund, (vi) MFS’ views regarding the outlook for the mutual fund industry and its strategic business plans, (vii) descriptions of various functions performed by MFS for the Trust, such as compliance monitoring and portfolio trading practices, and (viii) information regarding the overall organization of MFS, including information about MFS’ senior management and other personnel providing investment advisory, administrative and other services to the Fund. The comparative performance, fee and expense information prepared and provided by Lipper Inc. was not independently verified, and the independent Trustees did not independently verify any information provided to them by MFS.
The Trustees’ conclusion as to the continuation of the investment advisory agreement was based on comprehensive consideration of all information provided to the Trustees and not the result of any single factor. Some of the factors that figured particularly in the Trustees’ deliberations are described below for the Fund, while individual Trustees may have given different weight to various factors and evaluated the information presented as a whole differently than another Trustee. The Trustees recognized that the fee arrangements for the Fund reflect years of review and discussion between the independent Trustees and MFS, that certain aspects of such arrangements may receive greater scrutiny in some years than others, and that the Trustees’ conclusions may be based, in part, on their consideration of these same arrangements during the course of the year and in prior years.
Based on information provided by Lipper Inc. and MFS, the Trustees compared the Fund’s total return investment performance to the performance of a peer group of funds over various time periods. The Trustees placed particular emphasis on the total return performance of the Fund’s Initial Class shares in comparison to the performance of funds in its Lipper performance universe over the one-, three- and five-year periods. The Trustees did not rely on performance results for more recent periods, including those shown elsewhere in this report.
The Trustees noted the performance of the Fund’s Initial Class shares was in the 2nd quintile relative to the other funds in the Lipper Classification Index for the one-year period (the 1st quintile being the best performers and the 5th quintile being the worst performers). The total return performance of the Fund was in the 3rd quintile for the three-year and the five-year periods ended December 31, 2006, relative to the Lipper performance universe. Based on the nature and quality of services provided by MFS, the Board of Trustees concluded that the Fund’s performance was satisfactory.
22
Board Review of Investment Advisory Agreement – continued
In the course of their deliberations, the Trustees took into account information provided by MFS during contract review meetings, as well as during investment review meetings conducted with portfolio management personnel during the course of the year.
In assessing the reasonableness of the Fund’s advisory fee, the Trustees considered, among other information, the Fund’s advisory fee and the total expense ratio of the Fund’s Initial Class shares as a percentage of average daily net assets, compared to the advisory fee and total expense ratios of its peer group of funds based on information provided by Lipper Inc. and MFS. The Trustees also considered the advisory fees charged by MFS to institutional accounts. In comparing these fees, the Trustees considered the generally broader scope of services provided by MFS to the Trust than those provided to institutional accounts. The Trustees also considered the higher demands placed on MFS’ investment personnel and trading infrastructure as a result of the daily cash in-flows and out-flows of the Fund, and the impact on MFS and related expenses due to the more extensive regulatory regime to which the Fund is subject, compared to institutional accounts.
In considering the fees, the Trustees noted from the Lipper data that the Fund’s effective advisory fee rate was above the median and total expense ratio was approximately at the median of such fees and expenses of funds in the Lipper expense group. In addition, the Trustees accepted MFS’ offer to continue the expense limitation for the Fund. The Trustees further concluded that the existing breakpoints were sufficient to allow the Fund to benefit from economies of scale as its assets grow.
The Trustees also considered information prepared by MFS relating to its costs and profits with respect to the Fund and other investment companies and accounts advised by MFS, as well as MFS’ methodologies used to determine and allocate its costs to the Fund and other accounts and products for purposes of estimating profitability.
After reviewing these and other factors described below, the Trustees concluded that the advisory fee charged to the Fund represents reasonable compensation in light of the nature and quality of the services being provided by MFS.
In addition, the Trustees considered MFS’ resources and related efforts to continue to retain, attract and motivate capable personnel to serve the Fund. The Trustees also considered the financial resources of MFS and its parent, Sun Life Financial Inc. The Trustees further considered any advantages and possible disadvantages of having an adviser which also serves other investment companies as well as institutional accounts.
The Trustees also considered the nature, quality, cost, and extent of administrative, transfer agency, and distribution services provided to the Fund by MFS and its affiliates under agreements and plans other than the investment advisory agreement, including the 12b-1 fees the Fund pays to MFS Fund Distributors, Inc., an affiliate of MFS. The Trustees also considered the nature, extent and quality of certain other services MFS performs or arranges on the Fund’s behalf, which may include securities lending programs, directed expense payment programs, class action recovery programs, and MFS’ interaction with third-party service providers, principally custodians and sub-custodians. The Trustees concluded that the various non-advisory services provided by MFS and its affiliates on behalf of the Fund were satisfactory. The Trustees also considered the benefits to MFS from the use of the Fund’s portfolio brokerage commissions to pay for research and other similar services (including MFS’ policy not to use “soft dollars” generated by Fund portfolio transactions to pay for third-party research), and various other factors. Additionally, the Trustees considered so-called “fall-out benefits” to MFS such as reputational value derived from serving as investment manager to the Trust, and determined that any such benefits derived by MFS were reasonable and fair.
Based on their evaluation of factors that they deemed to be material, including those factors described above, the Board of Trustees, including a majority of the independent Trustees, concluded that the investment advisory agreement should be continued for an additional one-year period, commencing September 1, 2007.
A discussion regarding the Board’s most recent review and renewal of the Fund’s investment advisory agreement is available by clicking on the Fund’s name under “Variable Insurance Portfolios” on the “Products & Performance” page on the MFS Web site (mfs.com).
23
PROXY VOTING POLICIES AND INFORMATION
A general description of the MFS funds’ proxy voting policies and procedures is available without charge, upon request, by calling 1-800-225-2606, by visiting the About MFS section of mfs.com or by visiting the SEC’s Web site at http://www.sec.gov.
Information regarding how the fund voted proxies relating to portfolio securities during the most recent twelve-month period ended June 30 is available without charge by visiting the Proxy Voting section of mfs.com or by visiting the SEC’s Web site at http://www.sec.gov.
QUARTERLY PORTFOLIO DISCLOSURE
The fund will file a complete schedule of portfolio holdings with the Securities and Exchange Commission (the Commission) for the first and third quarters of each fiscal year on Form N-Q. The fund’s Form N-Q may be reviewed and copied at the:
Public Reference Room
Securities and Exchange Commission
100 F Street, NE, Room 1580
Washington, D.C. 20549
Information on the operation of the Public Reference Room may be obtained by calling the Commission at 1-800-SEC-0330. The fund’s Form N-Q is available on the EDGAR database on the Commission’s Internet Web site at http://www.sec.gov, and copies of this information may be obtained, upon payment of a duplicating fee, by electronic request at the following e-mail address: publicinfo@sec.gov or by writing the Public Reference Section at the above address.
A shareholder can also obtain the quarterly portfolio holdings report at mfs.com.
24
MFS® PRIVACY NOTICE
Privacy is a concern for every investor today. At MFS Investment Management® and the MFS funds, we take this concern very seriously. We want you to understand our policies about the investment products and services that we offer, and how we protect the nonpublic personal information of investors who have a direct relationship with us and our wholly owned subsidiaries.
Throughout our business relationship, you provide us with personal information. We maintain information and records about you, your investments, and the services you use. Examples of the nonpublic personal information we maintain include
| | Ÿ | | data from investment applications and other forms |
| | Ÿ | | share balances and transactional history with us, our affiliates, or others |
| | Ÿ | | facts from a consumer reporting agency |
We do not disclose any nonpublic personal information about our customers or former customers to anyone, except as permitted by law. We may share nonpublic personal information with third parties or certain of our affiliates in connection with servicing your account or processing your transactions. We may share information with companies or financial institutions that perform marketing services on our behalf or with other financial institutions with which we have joint marketing arrangements, subject to any legal requirements.
Authorization to access your nonpublic personal information is limited to appropriate personnel who provide products, services, or information to you. We maintain physical, electronic, and procedural safeguards to help protect the personal information we collect about you.
If you have any questions about the MFS privacy policy, please call 1-800-225-2606 any business day between 8 a.m. and 8 p.m. Eastern time.
Note: If you own MFS products or receive MFS services in the name of a third party such as a bank or broker-dealer, their privacy policy may apply to you instead of ours.
25
CONTACT US
Web site
mfs.com
Account service and
literature
Shareholders
1-877-411-3325
9 a.m. to 5 p.m. ET
Investment professionals
1-800-637-8630
8 a.m. to 5 p.m. ET
Mailing address
MFS Service Center, Inc.
Attn: Institutional Alliance Services (IAS)
P.O. Box 55824
Boston, MA
02205-5824
Overnight mail
MFS Service Center, Inc.
Attn: Institutional Alliance Services (IAS)
500 Boylston Street
Boston, MA 02116-3741


MFS® Variable Insurance Trust IISM
Annual report
MFS® Core Equity Portfolio
(formerly Core Equity Series)
12/31/07
RGS-ANN
MFS® CORE EQUITY PORTFOLIO
(formerly Core Equity Series)
The report is prepared for the general information of contract owners. It is authorized for distribution to prospective investors only when preceded or accompanied by a current prospectus.
NOT FDIC INSURED MAY LOSE VALUE NO BANK OR CREDIT UNION GUARANTEE NOT A DEPOSIT NOT INSURED BY ANY FEDERAL GOVERNMENT AGENCY OR NCUA/NCUSIF
LETTER FROM THE CEO

Dear Contract Owners:
The past year has been a great example of why investors should keep their eyes on the long term.
In 2006 the Dow Jones Industrial Average returned 19% and was fairly stable. This year we have seen a greater level of volatility than has been experienced in recent years. The Dow hit several new highs but also experienced swift drops as a global credit crisis swept through markets, spurred by defaults on U.S. subprime loans and a liquidity crunch. Still, even with this volatility, the Dow ended the first three quarters of 2007 with a return near 13%.
U.S. Treasury bonds gained ground, especially in the third quarter as investors sought less risky asset classes. The spreads of many lower-quality debt investments widened.
In 2007 the U.S. dollar fell against the euro, oil prices hit their highest levels yet, and gold spiked to its steepest price in 28 years. Around the globe, stocks sold off as risk aversion mounted. As we have said before, markets can be volatile, and investors should make sure they have an investment plan that can carry them through the peaks and troughs.
If you are focused on a long-term investment strategy, the short-term ups and downs of the markets should not necessarily dictate portfolio action on your part. In our view, investors who remain committed to a long-term plan are more likely to achieve their financial goals.
In any market environment, we believe individual investors are best served by following a three-pronged investment strategy of allocating their holdings across the major asset classes, diversifying within each class, and regularly rebalancing their portfolios to maintain their desired allocations. Of course, these strategies cannot guarantee a profit or protect against a loss. Investing and planning for the long term require diligence and patience, two traits that in our experience are essential to capitalizing on the many opportunities the financial markets can offer — through both up and down economic cycles.
Respectfully,

Robert J. Manning
Chief Executive Officer and Chief Investment Officer
MFS Investment Management®
February 15, 2008
The opinions expressed in this letter are subject to change, may not be relied upon for investment advice, and no forecasts can be guaranteed.
1
PORTFOLIO COMPOSITION
Portfolio structure
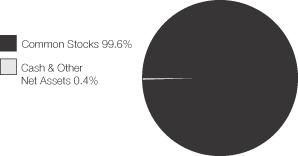
| | |
| Top ten holdings | | |
| Exxon Mobil Corp. | | 4.1% |
| Merck & Co., Inc. | | 2.5% |
| Danaher Corp. | | 2.5% |
| AT&T, Inc. | | 2.2% |
| Abbott Laboratories | | 1.8% |
| Google, Inc., “A” | | 1.6% |
| Altria Group, Inc. | | 1.6% |
| PepsiCo, Inc. | | 1.5% |
| Marathon Oil Corp. | | 1.5% |
| Hess Corp. | | 1.5% |
| | |
| Equity sectors | | |
| Financial Services | | 18.0% |
| Technology | | 15.1% |
| Health Care | | 12.0% |
| Energy | | 11.0% |
| Industrial Goods & Services | | 9.0% |
| Utilities & Communications | | 8.5% |
| Consumer Staples | | 7.2% |
| Leisure | | 5.8% |
| Retailing | | 5.3% |
| Basic Materials | | 4.0% |
| Special Products & Services | | 1.7% |
| Transportation | | 1.4% |
| Autos & Housing | | 0.6% |
Percentages are based on net assets as of 12/31/07.
The portfolio is actively managed and current holdings may be different.
2
MANAGEMENT REVIEW
Summary of Results
For the twelve months ended December 31, 2007, Initial Class shares of the MFS Core Equity Portfolio (the “fund”) provided a total return of 8.71%, while Service Class shares provided a total return of 8.40%. These compare with a return of 5.14% for the fund’s benchmark, the Russell 3000 Index (Russell Index).
Market Environment
Despite seemingly robust growth rates during the second and third quarters of 2007, underlying economic activity in the U.S. remained muted relative to other major economies. Overall, global economies witnessed moderate to strong growth during the reporting period as domestic demand improved and world trade accelerated.
With the strong global growth, however, concerns emerged about rising global inflation, especially as capacity became more constrained, wages rose, and energy and food prices advanced. During the reporting period, global central banks (with the exception of the U.S. Federal Reserve Board) tightened monetary conditions, which in turn pushed global bond yields to their highest levels during this economic expansion.
However, financial markets – particularly in the mortgage and structured-products areas – experienced substantial volatility in recent months. Beginning in late July, heightened uncertainty and distress concerning the subprime mortgage market caused several global credit markets to tighten up, forcing central banks to inject liquidity and to reassess their tightening biases as sovereign bond yields declined and credit spreads widened. While credit conditions improved somewhat by late October as the Federal Reserve Board cut interest rates, the level of market turbulence remained significant through year end. Increased market turmoil was also exacerbated by U.S. home foreclosures and uncertainties surrounding falling housing prices. Despite increased volatility across all asset classes and the widening in credit spreads, U.S. labor markets were resilient and wages rose modestly. More broadly, global equity markets rebounded following summer losses and generally held those gains through the end of the reporting period.
Contributors to performance
The financial services, utilities and communications, and retailing sectors were the top contributors to performance relative to the Russell Index during the reporting period. Strong stock selection played the major role in each case.
Within the financial services sector, financial exchange Deutsche Boerse(aa) (Germany) was a strong contributor to relative performance. Deutsche Boerse shares rose significantly after the company announced plans to acquire International Securities Exchange Holdings. This acquisition was expected to position the company as a key player in the U.S. options market and to create the world’s largest derivatives exchange. Avoiding poor-performing financial services firm Citigroup also boosted relative results.
In the utilities and communications sector, diversified communications company Rogers Communications(aa) was a top contributor. Shares of Rogers gained on strong quarterly revenue growth driven by its wireless business.
Although strong stock selection in the retailing sector benefited relative returns, no stocks within this sector were among the fund’s top contributors during the period.
Standout performers in other sectors included global integrated energy company Hess, video game maker Ubisoft Entertainment(aa) (France), mining giant BHP Billiton(aa ) (U.K), package manufacturer Owens-Ilinois, and aerospace metal parts manufacturer Precision Cast Parts. Our holdings of manufacturing conglomerate Danaher and pharmaceutical giant Merck also aided relative performance.
Detractors from performance
Stock selection in the technology sector was the greatest detractor from relative performance over the reporting period. In particular, our positioning in strong-performing computer and personal electronics maker Apple(g) hindered results. Network storage company Network Appliance was also a negative contributor in this sector.
Security selection in the health care sector dampened relative returns. Medical devices maker Boston Scientific and pharmaceutical company Wyeth Pharmaceuticals(g) were among the fund’s top relative detractors.
Several financial stocks also held back investment results, including mortgage lending firms, Countrywide Financial(g) and Fannie Mae(g), mortgage insurer MGIC Investment(g), financial services holding company Fremont General(g), and real estate investment trust firm Mack-Cali Realty. Shares of Countrywide Financial plummeted near the end of the reporting period due to industry-wide problems of falling mortgage demand, excess lending capacity, rising costs, and challenges in selling off loan
3
Management review – continued
portfolios in all segments (prime, subprime, and home equity) of the market. The fund’s positioning in integrated oil company Chevron(g) also hurt relative returns.
Respectfully,
Katrina Mead
Portfolio Manager
| (aa) | Security is not a benchmark constituent. |
| (g) | Security was not held in the portfolio at period end. |
The views expressed in this report are those of the portfolio manager only through the end of the period of the report as stated on the cover and do not necessarily reflect the views of MFS or any other person in the MFS organization. These views are subject to change at any time based on market and other conditions, and MFS disclaims any responsibility to update such views. These views may not be relied upon as investment advice or an indication of trading intent on behalf of any MFS portfolio. References to specific securities are not recommendations of such securities, and may not be representative of any MFS portfolio’s current or future investments.
4
PERFORMANCE SUMMARY THROUGH 12/31/07
The following chart illustrates the historical performance of the fund in comparison to its benchmark index. Index comparisons are unmanaged; do not reflect any fees or expenses; and cannot be invested in directly. The performance of other share classes will be greater than or less than that of the class depicted below. (See Notes to Performance Summary.)
Performance data shown represents past performance and is no guarantee of future results. Investment return and principal value fluctuate so your units, when sold, may be worth more or less than the original cost; current performance may be lower or higher than quoted. The performance shown does not reflect the deduction of taxes, if any, that a contract holder would pay on fund distributions or the redemption of contract units. The returns for the fund shown also do not reflect the deduction of expenses associated with variable products, such as mortality and expense risk charges, separate account charges, and sales charges imposed by the insurance company separate accounts. Such expenses would reduce the overall returns shown.
Growth of a hypothetical $10,000 investment
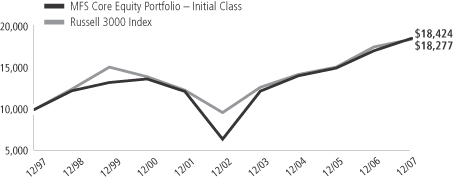
Total returns through 12/31/07
Average Annual Total Returns
| | | | | | | | | | | | |
| | | Share class | | Class inception date | | 1-yr | | 5-yr | | 10-yr | | |
| | | Initial Class | | 5/12/97 | | 8.71% | | 14.07% | | 6.30% | | |
| | | Service Class | | 8/24/01 | | 8.40% | | 13.77% | | 6.13% | | |
Comparative Index
| | | | | | | | | | | | |
| | | Russell 3000 Index (f) | | 5.14% | | 13.63% | | 6.22% | | |
| (f) | Source: FactSet Research Systems Inc. |
Index Definition
Russell 3000 Index – constructed to provide a comprehensive barometer for the 3,000 largest U.S. companies based on total market capitalization, which represents approximately 98% of the investable U.S. equity market.
It is not possible to invest directly in an index.
Notes to Performance Summary
Service Class share performance includes the performance of Initial Class shares for periods prior to the inception of Service Class shares (blended performance). This blended performance figure has not been adjusted to take into account differences in the class-specific operating expenses (such as Rule 12b-1 fees). Because operating expenses of Service Class shares are generally higher than those of Initial Class shares, the blended Service Class shares performance shown is higher than it would have been had Service Class shares been offered for the entire period.
Performance results reflect any applicable expense subsidies and waivers in effect during the periods shown. Without such subsidies and waivers the fund’s performance results would be less favorable. Please see the prospectus for complete details. All results are historical and assume the reinvestment of any dividends and capital gains distributions.
From time to time the fund may receive proceeds from litigation settlements, without which performance would be lower.
5
EXPENSE TABLE
Fund Expenses Borne by the Contract Holders During the Period,
July 1, 2007 through December 31, 2007
As a contract holder of the fund, you incur ongoing costs, including management fees; distribution (12b-1) fees; and other fund expenses. This example is intended to help you understand your ongoing costs (in dollars) of investing in the fund and to compare these costs with the ongoing costs of investing in other mutual funds.
The example is based on an investment of $1,000 invested at the beginning of the period and held for the entire period July 1, 2007 through December 31, 2007.
Actual expenses
The first line for each share class in the following table provides information about actual account values and actual expenses. You may use the information in this line, together with the amount you invested, to estimate the expenses that you paid over the period. Simply divide your account value by $1,000 (for example, an $8,600 account value divided by $1,000 = 8.6), then multiply the result by the number in the first line under the heading entitled “Expenses Paid During Period” to estimate the expenses you paid on your account during this period.
Hypothetical example for comparison purposes
The second line for each share class in the following table provides information about hypothetical account values and hypothetical expenses based on the fund’s actual expense ratio and an assumed rate of return of 5% per year before expenses, which is not the fund’s actual return. The hypothetical account values and expenses may not be used to estimate the actual ending account balance or expenses you paid for the period. You may use this information to compare the ongoing costs of investing in the fund and other funds. To do so, compare this 5% hypothetical example with the 5% hypothetical examples that appear in the shareholder reports of the other funds.
Please note that the expenses shown in the table are meant to highlight the fund’s ongoing costs only and do not take into account the fees and expenses imposed under the variable contracts through which your investment in the fund is made. Therefore, the second line for each share class in the table is useful in comparing ongoing costs associated with an investment in vehicles (such as the fund) which fund benefits under variable annuity and variable life insurance contracts and to qualified pension and retirement plans only, and will not help you determine the relative total costs of investing in the fund through variable annuity and variable life insurance contracts. If the fees and expenses imposed under the variable contracts were included, your costs would have been higher.
| | | | | | | | | | |
| Share Class | | | | Annualized
Expense Ratio | | Beginning
Account Value
7/01/07 | | Ending
Account Value
12/31/07 | | Expenses Paid
During Period (p)
7/01/07-12/31/07 |
| Initial Class | | Actual | | 0.84% | | $1,000.00 | | $994.60 | | $4.22 |
| | Hypothetical (h) | | 0.84% | | $1,000.00 | | $1,020.97 | | $4.28 |
| Service Class | | Actual | | 1.09% | | $1,000.00 | | $993.30 | | $5.48 |
| | Hypothetical (h) | | 1.09% | | $1,000.00 | | $1,019.71 | | $5.55 |
| (h) | 5% class return per year before expenses. |
| (p) | Expenses paid is equal to each class’ annualized expense ratio, as shown above, multiplied by the average account value over the period, multiplied by the number of days in the period, divided by the number of days in the year. |
6
PORTFOLIO OF INVESTMENTS – 12/31/07
The Portfolio of Investments is a complete list of all securities owned by your fund.
It is categorized by broad-based asset classes.
| | | | | |
| Issuer | | Shares/Par | | Value ($) |
| | | | | |
| COMMON STOCKS – 99.6% | | | | | |
| Aerospace – 2.8% | | | | | |
| Lockheed Martin Corp. | | 19,930 | | $ | 2,097,832 |
| Precision Castparts Corp. | | 12,030 | | | 1,668,561 |
| United Technologies Corp. | | 40,030 | | | 3,063,896 |
| | | | | |
| | | | $ | 6,830,289 |
| | | | | |
| Airlines – 0.2% | | | | | |
| Southwest Airlines Co. | | 50,410 | | $ | 615,002 |
| | | | | |
| Apparel Manufacturers – 0.7% | | | | | |
| NIKE, Inc., “B” | | 19,350 | | $ | 1,243,044 |
| Quiksilver, Inc. (a)(l) | | 46,050 | | | 395,109 |
| | | | | |
| | | | $ | 1,638,153 |
| | | | | |
| Biotechnology – 2.1% | | | | | |
| Amgen, Inc. (a) | | 22,960 | | $ | 1,066,262 |
| Celgene Corp. (a)(l) | | 14,130 | | | 652,947 |
| Genzyme Corp. (a) | | 45,141 | | | 3,360,296 |
| | | | | |
| | | | $ | 5,079,505 |
| | | | | |
| Broadcasting – 1.9% | | | | | |
| News Corp., “A” | | 122,670 | | $ | 2,513,508 |
| Walt Disney Co. | | 67,080 | | | 2,165,342 |
| | | | | |
| | | | $ | 4,678,850 |
| | | | | |
| Brokerage & Asset Managers – 4.0% | | | | | |
| Affiliated Managers Group, Inc. (a)(l) | | 4,990 | | $ | 586,125 |
| Charles Schwab Corp. | | 105,280 | | | 2,689,904 |
| Deutsche Boerse AG | | 9,170 | | | 1,809,983 |
| Goldman Sachs Group, Inc. | | 9,040 | | | 1,944,052 |
| ICAP PLC | | 17,800 | | | 256,194 |
| Invesco Ltd. (l) | | 18,650 | | | 585,237 |
| TD AMERITRADE Holding Corp. (a) | | 98,530 | | | 1,976,512 |
| | | | | |
| | | | $ | 9,848,007 |
| | | | | |
| Business Services – 1.1% | | | | | |
| Corporate Executive Board Co. | | 13,690 | | $ | 822,769 |
| Fidelity National Information Services, Inc. | | 22,930 | | | 953,659 |
| Satyam Computer Services Ltd., ADR | | 31,400 | | | 839,008 |
| | | | | |
| | | | $ | 2,615,436 |
| | | | | |
| Cable TV – 0.6% | | | | | |
| Cablevision Systems Corp., “A” (a) | | 24,030 | | $ | 588,735 |
| Comcast Corp., “Special A” (a) | | 45,290 | | | 820,655 |
| | | | | |
| | | | $ | 1,409,390 |
| | | | | |
| Chemicals – 1.1% | | | | | |
| 3M Co. | | 11,110 | | $ | 936,795 |
| PPG Industries, Inc. | | 25,440 | | | 1,786,651 |
| | | | | |
| | | | $ | 2,723,446 |
| | | | | |
| Computer Software – 3.8% | | | | | |
| ACI Worldwide, Inc. (a)(l) | | 36,760 | | $ | 699,910 |
| CommVault Systems, Inc. (a) | | 36,870 | | | 780,907 |
| Microsoft Corp. | | 92,980 | | | 3,310,088 |
| MSC Software Corp. (a) | | 259,175 | | | 3,366,683 |
| VeriSign, Inc. (a) | | 35,400 | | | 1,331,394 |
| | | | | |
| | | | $ | 9,488,982 |
| | | | | |
| | | | | |
| Issuer | | Shares/Par | | Value ($) |
| | | | | |
| COMMON STOCKS – continued | | | | | |
| Computer Software – Systems – 3.6% | | | | | |
| Cray, Inc. (a)(l) | | 187,160 | | $ | 1,121,088 |
| EMC Corp. (a) | | 130,010 | | | 2,409,085 |
| International Business Machines Corp. | | 30,640 | | | 3,312,184 |
| Network Appliance, Inc. (a) | | 87,246 | | | 2,177,660 |
| | | | | |
| | | | $ | 9,020,017 |
| | | | | |
| Construction – 0.6% | | | | | |
| Masco Corp. (l) | | 49,240 | | $ | 1,064,076 |
| NVR, Inc. (a)(l) | | 790 | | | 413,960 |
| | | | | |
| | | | $ | 1,478,036 |
| | | | | |
| Consumer Goods & Services – 2.9% | | | | | |
| Bright Horizons Family Solutions, Inc. (a) | | 45,840 | | $ | 1,583,314 |
| Colgate-Palmolive Co. | | 27,860 | | | 2,171,966 |
| Procter & Gamble Co. | | 45,430 | | | 3,335,471 |
| | | | | |
| | | | $ | 7,090,751 |
| | | | | |
| Containers – 0.6% | | | | | |
| Owens-Illinois, Inc. (a) | | 29,640 | | $ | 1,467,180 |
| | | | | |
| Electrical Equipment – 3.9% | | | | | |
| Danaher Corp. | | 69,440 | | $ | 6,092,666 |
| Rockwell Automation, Inc. | | 40,480 | | | 2,791,501 |
| WESCO International, Inc. (a)(l) | | 16,270 | | | 644,943 |
| | | | | |
| | | | $ | 9,529,110 |
| | | | | |
| Electronics – 3.7% | | | | | |
| Applied Materials, Inc. | | 79,450 | | $ | 1,411,032 |
| Flextronics International Ltd. (a) | | 61,809 | | | 745,417 |
| Hittite Microwave Corp. (a)(l) | | 19,020 | | | 908,395 |
| Intel Corp. | | 124,960 | | | 3,331,434 |
| Marvell Technology Group Ltd. (a) | | 64,760 | | | 905,345 |
| National Semiconductor Corp. (l) | | 18,440 | | | 417,482 |
| PLX Technology, Inc. (a)(l) | | 66,000 | | | 613,800 |
| SanDisk Corp. (a)(l) | | 25,670 | | | 851,474 |
| | | | | |
| | | | $ | 9,184,379 |
| | | | | |
| Energy – Independent – 1.2% | | | | | |
| Apache Corp. | | 18,610 | | $ | 2,001,319 |
| CONSOL Energy, Inc. | | 11,930 | | | 853,234 |
| | | | | |
| | | | $ | 2,854,553 |
| | | | | |
| Energy – Integrated – 7.0% | | | | | |
| Exxon Mobil Corp. | | 107,656 | | $ | 10,086,291 |
| Hess Corp. | | 36,120 | | | 3,643,063 |
| Marathon Oil Corp. | | 59,980 | | | 3,650,383 |
| | | | | |
| | | | $ | 17,379,737 |
| | | | | |
| Engineering – Construction – 0.7% | | | | | |
| Fluor Corp. | | 6,840 | | $ | 996,725 |
| North American Energy Partners, Inc. (a) | | 58,420 | | | 791,591 |
| | | | | |
| | | | $ | 1,788,316 |
| | | | | |
| Food & Beverages – 3.3% | | | | | |
| Dean Foods Co. (l) | | 36,490 | | $ | 943,631 |
| Diamond Foods, Inc. | | 25,540 | | | 547,322 |
7
Portfolio of Investments – continued
| | | | | |
| Issuer | | Shares/Par | | Value ($) |
| | | | | |
| COMMON STOCKS – continued | | | |
| Food & Beverages – continued | | | |
| General Mills, Inc. | | 35,030 | | $ | 1,996,710 |
| Hain Celestial Group, Inc. (a)(l) | | 28,180 | | | 901,760 |
| PepsiCo, Inc. | | 49,767 | | | 3,777,315 |
| | | | | |
| | | | $ | 8,166,738 |
| | | | | |
| Food & Drug Stores – 1.0% | | | | | |
| CVS Caremark Corp. | | 62,840 | | $ | 2,497,890 |
| | | | | |
| Gaming & Lodging – 1.2% | | | | | |
| International Game Technology | | 17,060 | | $ | 749,446 |
| Marriott International, Inc., “A” | | 16,930 | | | 578,667 |
Melco PBL Entertainment (Macau) Ltd.,
ADR (a)(l) | | 20,640 | | | 238,598 |
| MGM Mirage (a)(l) | | 2,600 | | | 218,452 |
| Penn National Gaming, Inc. (a) | | 5,310 | | | 316,211 |
| Royal Caribbean Cruises Ltd. (l) | | 17,900 | | | 759,676 |
| | | | | |
| | | | $ | 2,861,050 |
| | | | | |
| General Merchandise – 0.8% | | | | | |
| 99 Cents Only Stores (a)(l) | | 62,910 | | $ | 500,764 |
| Macy’s, Inc. | | 35,720 | | | 924,076 |
| Stage Stores, Inc. (l) | | 37,050 | | | 548,340 |
| | | | | |
| | | | $ | 1,973,180 |
| | | | | |
| Health Maintenance Organizations – 1.3% | | | |
| UnitedHealth Group, Inc. | | 29,290 | | $ | 1,704,678 |
| WellPoint, Inc. (a) | | 17,280 | | | 1,515,974 |
| | | | | |
| | | | $ | 3,220,652 |
| | | | | |
| Insurance – 4.4% | | | | | |
| Allied World Assurance Co. Holdings Ltd. | | 32,390 | | $ | 1,625,006 |
| Chubb Corp. | | 49,000 | | | 2,674,420 |
| Genworth Financial, Inc., “A” | | 28,960 | | | 737,032 |
| Hartford Financial Services Group, Inc. | | 40,230 | | | 3,507,654 |
| MetLife, Inc. (l) | | 22,780 | | | 1,403,704 |
| Prudential Financial, Inc. | | 10,590 | | | 985,294 |
| | | | | |
| | | | $ | 10,933,110 |
| | | | | |
| Internet – 1.6% | | | | | |
| Google, Inc., “A” (a) | | 5,850 | | $ | 4,045,158 |
| | | | | |
| Leisure & Toys – 1.2% | | | | | |
| Ubisoft Entertainment S.A. (a) | | 28,544 | | $ | 2,877,002 |
| | | | | |
| Machinery & Tools – 1.6% | | | | | |
| Bucyrus International, Inc., “A” | | 10,440 | | $ | 1,037,632 |
| Eaton Corp. | | 19,920 | | | 1,931,244 |
| Timken Co. | | 27,730 | | | 910,931 |
| | | | | |
| | | | $ | 3,879,807 |
| | | | | |
| Major Banks – 5.2% | | | | | |
| Bank of America Corp. | | 82,206 | | $ | 3,391,820 |
| Bank of New York Mellon Corp. | | 57,725 | | | 2,814,671 |
| JPMorgan Chase & Co. | | 75,140 | | | 3,279,861 |
| State Street Corp. | | 41,570 | | | 3,375,484 |
| | | | | |
| | | | $ | 12,861,836 |
| | | | | |
| Medical & Health Technology & Services – 0.5% | | | |
| MWI Veterinary Supply, Inc. (a) | | 29,180 | | $ | 1,167,200 |
| | | | | |
| | | | | |
| Issuer | | Shares/Par | | Value ($) |
| | | | | |
| COMMON STOCKS – continued | | | |
| Medical Equipment – 2.6% | | | | | |
| Advanced Medical Optics, Inc. (a)(l) | | 44,010 | | $ | 1,079,565 |
| Aspect Medical Systems, Inc. (a) | | 81,840 | | | 1,145,760 |
| Boston Scientific Corp. (a) | | 188,200 | | | 2,188,766 |
| Cooper Cos., Inc. (l) | | 23,590 | | | 896,420 |
| Cyberonics, Inc. (a)(l) | | 42,790 | | | 563,116 |
| NxStage Medical, Inc. (a)(l) | | 36,990 | | | 561,138 |
| | | | | |
| | | | $ | 6,434,765 |
| | | | | |
| Metals & Mining – 1.3% | | | | | |
| BHP Billiton PLC | | 105,470 | | $ | 3,245,806 |
| | | | | |
| Natural Gas – Distribution – 1.1% | | | | | |
| Questar Corp. | | 25,480 | | $ | 1,378,468 |
| Sempra Energy | | 22,770 | | | 1,409,008 |
| | | | | |
| | | | $ | 2,787,476 |
| | | | | |
| Natural Gas – Pipeline – 0.6% | | | | | |
| Williams Cos., Inc. | | 44,190 | | $ | 1,581,118 |
| | | | | |
| Network & Telecom – 2.4% | | | | | |
| Cisco Systems, Inc. (a) | | 90,930 | | $ | 2,461,475 |
| NICE Systems Ltd., ADR (a) | | 33,810 | | | 1,160,359 |
| Polycom, Inc. (a) | | 36,870 | | | 1,024,249 |
| Sonus Networks, Inc. (a)(l) | | 212,450 | | | 1,238,584 |
| | | | | |
| | | | $ | 5,884,667 |
| | | | | |
| Oil Services – 2.8% | | | | | |
| Exterran Holdings, Inc. (a)(l) | | 8,880 | | $ | 726,384 |
| Halliburton Co. | | 45,900 | | | 1,740,069 |
| National Oilwell Varco, Inc. (a) | | 8,990 | | | 660,405 |
| Natural Gas Services Group, Inc. (a) | | 14,950 | | | 293,170 |
| Noble Corp. | | 24,110 | | | 1,362,456 |
| Schlumberger Ltd. | | 19,270 | | | 1,895,590 |
| TETRA Technologies, Inc. (a)(l) | | 15,980 | | | 248,809 |
| | | | | |
| | | | $ | 6,926,883 |
| | | | | |
| Other Banks & Diversified Financials – 2.7% | | | |
| American Express Co. | | 66,320 | | $ | 3,449,966 |
| East West Bancorp, Inc. (l) | | 30,170 | | | 731,019 |
| Euro Dekania Ltd. (a)(z) | | 100,530 | | | 1,388,960 |
| Oaktree Capital Management LLC, “A” (a)(z) | | 31,600 | | | 1,027,000 |
| | | | | |
| | | | $ | 6,596,945 |
| | | | | |
| Pharmaceuticals – 5.5% | | | | | |
| Abbott Laboratories | | 80,030 | | $ | 4,493,684 |
| Bristol-Myers Squibb Co. | | 38,620 | | | 1,024,202 |
| Medicis Pharmaceutical Corp., “A” (l) | | 28,540 | | | 741,184 |
| Merck & Co., Inc. | | 106,130 | | | 6,167,214 |
| Schering-Plough Corp. | | 46,670 | | | 1,243,289 |
| | | | | |
| | | | $ | 13,669,573 |
| | | | | |
| Railroad & Shipping – 0.4% | | | | | |
| Burlington Northern Santa Fe Corp. | | 11,530 | | $ | 959,642 |
| | | | | |
| Real Estate – 1.7% | | | | | |
| Mack-Cali Realty Corp., REIT (l) | | 76,510 | | $ | 2,601,340 |
| Maguire Properties, Inc., REIT (l) | | 51,630 | | | 1,521,536 |
| | | | | |
| | | | $ | 4,122,876 |
| | | | | |
8
Portfolio of Investments – continued
| | | | | |
| Issuer | | Shares/Par | | Value ($) |
| | | | | |
| COMMON STOCKS – continued | | | |
| Restaurants – 0.9% | | | | | |
| Panera Bread Co., “A” (a)(l) | | 22,160 | | $ | 793,771 |
| Red Robin Gourmet Burgers, Inc. (a)(l) | | 29,500 | | | 943,705 |
| Texas Roadhouse, Inc., “A” (a)(l) | | 35,750 | | | 395,395 |
| | | | | |
| | | | $ | 2,132,871 |
| | | | | |
| Specialty Chemicals – 1.0% | | | | | |
| Air Products & Chemicals, Inc. | | 12,290 | | $ | 1,212,163 |
| Praxair, Inc. | | 15,500 | | | 1,375,005 |
| | | | | |
| | | | $ | 2,587,168 |
| | | | | |
| Specialty Stores – 2.8% | | | | | |
| CarMax, Inc. (a)(l) | | 31,310 | | $ | 618,372 |
| Dick’s Sporting Goods, Inc. (a)(l) | | 23,210 | | | 644,310 |
| Ethan Allen Interiors, Inc. (l) | | 26,790 | | | 763,515 |
| GameStop Corp., “A” (a) | | 15,040 | | | 934,134 |
| Lowe’s Cos., Inc. | | 66,890 | | | 1,513,052 |
| Nordstrom, Inc. (l) | | 23,110 | | | 848,830 |
| Staples, Inc. | �� | 34,140 | | | 787,610 |
| Urban Outfitters, Inc. (a)(l) | | 31,760 | | | 865,778 |
| | | | | |
| | | | $ | 6,975,601 |
| | | | | |
| Telecommunications – Wireless – 0.6% | | | | | |
| Rogers Communications, Inc., “B” | | 31,460 | | $ | 1,434,100 |
| | | | | |
| Telephone Services – 2.8% | | | | | |
| AT&T, Inc. | | 129,400 | | $ | 5,377,864 |
| Embarq Corp. | | 14,070 | | | 696,887 |
| Qwest Communications International, Inc. (l) | | 128,710 | | | 902,257 |
| | | | | |
| | | | $ | 6,977,008 |
| | | | | |
| Tobacco – 1.6% | | | | | |
| Altria Group, Inc. | | 52,890 | | $ | 3,997,426 |
| | | | | |
| | | | | | | |
| Issuer | | Shares/Par | | Value ($) | |
| | | | | | | |
| COMMON STOCKS – continued | | | | | | | |
| Trucking – 0.8% | | | | | | | |
| FedEx Corp. | | | 17,940 | | $ | 1,599,710 | |
| Landstar System, Inc. | | | 11,690 | | | 492,734 | |
| | | | | | | |
| | | | | $ | 2,092,444 | |
| | | | | | | |
| Utilities – Electric Power – 3.4% | | | | | | | |
| American Electric Power Co., Inc. | | | 33,460 | | $ | 1,557,898 | |
| DPL, Inc. (l) | | | 43,210 | | $ | 1,281,176 | |
| Entergy Corp. | | | 10,500 | | | 1,254,960 | |
| NRG Energy, Inc. (a)(l) | | | 37,890 | | | 1,642,153 | |
| Public Service Enterprise Group, Inc. | | | 14,800 | | | 1,453,952 | |
| Westar Energy, Inc. (l) | | | 49,270 | | | 1,278,064 | |
| | | | | | | |
| | | | | $ | 8,468,203 | |
| | | | | | | |
Total Common Stocks
(Identified Cost, $233,255,455) | | | | | $ | 246,077,334 | |
| | | | | | | |
| | |
| REPURCHASE AGREEMENTS – 0.4% | | | | | | | |
| Merrill Lynch, 4.5%, dated 12/31/07, due 1/02/08, total to be received $819,205 (secured by various U.S. Treasury and Federal Agency obligations and Mortgage Backed securities in a jointly traded account), at Cost | | $ | 819,000 | | $ | 819,000 | |
| | | | | | | |
| |
| COLLATERAL FOR SECURITIES LOANED – 11.8% | | | | |
| Navigator Securities Lending Prime Portfolio, at Cost and Net Asset Value | | | 29,197,715 | | $ | 29,197,715 | |
| | | | | | | |
Total Investments
(Identified Cost, $263,272,170) (k) | | | | | $ | 276,094,049 | |
| | | | | | | |
OTHER ASSETS, LESS
LIABILITIES – (11.8)% | | | | | | (29,099,405 | ) |
| | | | | | | |
| Net Assets – 100.0% | | | | | $ | 246,994,644 | |
| | | | | | | |
| (a) | Non-income producing security. |
| (k) | As of December 31, 2007, the fund had 2 securities that were fair valued, aggregating $2,415,960 and 0.88% of market value, in accordance with the policies adopted by the Board of Trustees. |
| (l) | All or a portion of this security is on loan. |
| (z) | Restricted securities are not registered under the Securities Act of 1933 and are subject to legal restrictions on resale. These securities generally may be resold in transactions exempt from registration or to the public if the securities are subsequently registered. Disposal of these securities may involve time-consuming negotiations and prompt sale at an acceptable price may be difficult. The fund holds the following restricted securities: |
See Notes to Financial Statements
| | | | | | |
| Restricted Securities | | Acquisition Date | | Acquisition Cost | | Current Market Value |
| Euro Dekania Ltd. | | 3/08/07-6/25/07 | | $1,412,164 | | $1,388,960 |
| Oaktree Capital Management LLC, “A” | | 5/21/07-6/25/07 | | 1,386,074 | | 1,027,000 |
| Total Restricted Securities | | | | | | $2,415,960 |
| % of Net Assets | | | | | | 1.0% |
The following abbreviations are used in this report and are defined:
| ADR | American Depository Receipt |
| REIT | Real Estate Investment Trust |
9
FINANCIAL STATEMENTS | STATEMENT OF ASSETS AND LIABILITIES
This statement represents your fund’s’ balance sheet, which details the assets and liabilities compromising the total value of the fund.
| | | | | |
| At 12/31/07 | | | | | |
| Assets | | | | | |
| Investments, at value including $31,343,662, of securities on loan (identified cost, $263,272,170) | | $276,094,049 | | | |
| Cash | | 840 | | | |
| Receivable for investments sold | | 2,221 | | | |
| Receivable for fund shares sold | | 36,665 | | | |
| Interest and dividends receivable | | 324,440 | | | |
| Other assets | | 245,572 | | | |
| Total assets | | | | | $276,703,787 |
| Liabilities | | | | | |
| Payable for fund shares reacquired | | $399,648 | | | |
| Collateral for securities loaned, at value (c) | | 29,197,715 | | | |
| Payable to affiliates | | | | | |
Management fee | | 20,421 | | | |
Distribution fees | | 959 | | | |
Administrative services fee | | 631 | | | |
| Payable for independent trustees’ compensation | | 831 | | | |
| Accrued expenses and other liabilities | | 88,938 | | | |
| Total liabilities | | | | | $29,709,143 |
| Net assets | | | | | $246,994,644 |
| Net assets consist of | | | | | |
| Paid-in capital | | $473,854,790 | | | |
| Unrealized appreciation (depreciation) on investments and translation of assets and liabilities in foreign currencies | | 12,822,400 | | | |
| Accumulated net realized gain (loss) on investments and foreign currency transactions | | (240,819,872 | ) | | |
| Undistributed net investment income | | 1,137,326 | | | |
| Net Assets | | | | | $246,994,644 |
| Shares of beneficial interest outstanding | | | | | 14,961,816 |
| Initial Class shares | | | | | |
Net assets | | $212,062,576 | | | |
Shares outstanding | | 12,834,616 | | | |
Net asset value per share | | | | | $16.52 |
| Service Class shares | | | | | |
Net assets | | $34,932,068 | | | |
Shares outstanding | | 2,127,200 | | | |
Net asset value per share | | | | | $16.42 |
| (c) | Non-cash collateral not included. |
See Notes to Financial Statements
10
FINANCIAL STATEMENTS | STATEMENT OF OPERATIONS
This statement describes how much your fund earned in investment income and accrued in expenses. It also describes any gains and/or losses generated by fund operations.
| | | | | | |
| Year ended 12/31/07 | | | | | | |
| Net Investment income | | | | | | |
| Income | | | | | | |
Dividends | | $2,644,733 | | | | |
Interest | | 139,888 | | | | |
Foreign taxes withheld | | (5,628 | ) | | | |
| Total investment income | | | | | $2,778,993 | |
| Expenses | | | | | | |
Management fee | | $1,387,895 | | | | |
Distribution fees | | 61,077 | | | | |
Administrative services fee | | 46,938 | | | | |
Independent trustees’ compensation | | 20,130 | | | | |
Custodian fee | | 40,411 | | | | |
Shareholder communications | | 13,757 | | | | |
Auditing fees | | 41,993 | | | | |
Legal fees | | 6,330 | | | | |
Miscellaneous | | 25,276 | | | | |
| Total expenses | | | | | $1,643,807 | |
Fees paid indirectly | | (2,763 | ) | | | |
| Net expenses | | | | | $1,641,044 | |
| Net investment income | | | | | $1,137,949 | |
| Realized and unrealized gain (loss) on investments and foreign currency transactions | | | | | | |
| Realized gain (loss) (identified cost basis) | | | | | | |
Investment transactions | | $21,841,492 | | | | |
Foreign currency transactions | | 5,346 | | | | |
| Net realized gain (loss) on investments and foreign currency transactions | | | | | $21,846,838 | |
| Change in unrealized appreciation (depreciation) | | | | | | |
Investments | | $(15,615,033 | ) | | | |
Translation of assets and liabilities in foreign currencies | | 602 | | | | |
| Net unrealized gain (loss) on investments and foreign currency translation | | | | | $(15,614,431 | ) |
| Net realized and unrealized gain (loss) on investments and foreign currency | | | | | $6,232,407 | |
| Change in net assets from operations | | | | | $7,370,356 | |
See Notes to Financial Statements
11
FINANCIAL STATEMENTS | STATEMENTS OF CHANGES IN NET ASSETS
These statements describe the increases and/or decreases in net assets resulting from operations, any distributions, and any shareholder transactions.
| | | | | | |
| For years ended 12/31 | | 2007 | | | 2006 | |
| Change in net assets | | | | | | |
| From operations | | | | | | |
| Net investment income | | $1,137,949 | | | $448,442 | |
| Net realized gain (loss) on investments and foreign currency transactions | | 21,846,838 | | | 13,310,173 | |
| Net unrealized gain (loss) on investments and foreign currency translation | | (15,614,431 | ) | | (2,381,267 | ) |
| Change in net assets from operations | | $7,370,356 | | | $11,377,348 | |
| Distributions declared to shareholders | | | | | | |
| From net investment income | | | | | | |
Initial Class | | $(379,068 | ) | | $(475,009 | ) |
Service Class | | (40,124 | ) | | (48,229 | ) |
| From net realized gain on investments | | | | | | |
Initial Class | | (9,027,459 | ) | | — | |
Service Class | | (1,660,780 | ) | | — | |
| Total distributions declared to shareholders | | $(11,107,431 | ) | | $(523,238 | ) |
| Change in net assets from fund share transactions | | $158,033,591 | | | $(8,856,099 | ) |
| Total change in net assets | | $154,296,516 | | | $1,998,011 | |
| Net assets | | | | | | |
| At beginning of period | | 92,698,128 | | | 90,700,117 | |
At end of period (including undistributed net investment income of $1,137,326 and
$418,206, respectively) | | $246,994,644 | | | $92,698,128 | |
See Notes to Financial Statements
12
FINANCIAL STATEMENTS | FINANCIAL HIGHLIGHTS
The financial highlights table is intended to help you understand the fund’s financial performance for the past 5 years. Certain information reflects financial results for a single fund share. The total returns in the table represent the rate by which an investor would have earned (or lost) on an investment in the fund share class (assuming reinvestment of all distributions) held for the entire period.
Initial Class
| | | | | | | | | | | | | | | |
| | | Years Ended 12/31 | |
| | | 2007 | | | 2006 | | | 2005 | | | 2004 | | | 2003 | |
| Net asset value, beginning of period | | $17.13 | | | $15.15 | | | $14.32 | | | $12.58 | | | $9.92 | |
| Income (loss) from investment operations | | | | | | | | | | | | | | | |
| Net investment income (d) | | $0.11 | | | $0.08 | | | $0.09 | | | $0.09 | | | $0.08 | |
Net realized and unrealized gain (loss) on investments
and foreign currency | | 1.41 | | | 1.99 | | | 0.84 | | | 1.74 | | | 2.67 | |
| Total from investment operations | | $1.52 | | | $2.07 | | | $0.93 | | | $1.83 | | | $2.75 | |
| Less distributions declared to shareholders | | | | | | | | | | | | | | | |
| From net investment income | | $(0.09 | ) | | $(0.09 | ) | | $(0.10 | ) | | $(0.09 | ) | | $(0.09 | ) |
| From net realized gain on investments | | (2.04 | ) | | — | | | — | | | — | | | — | |
| Total distributions declared to shareholders | | $(2.13 | ) | | $(0.09 | ) | | $(0.10 | ) | | $(0.09 | ) | | $(0.09 | ) |
| Net asset value, end of period | | $16.52 | | | $17.13 | | | $15.15 | | | $14.32 | | | $12.58 | |
| Total return (%) (k)(r)(s) | | 8.71 | | | 13.74 | | | 6.56 | | | 14.63 | (b) | | 27.86 | |
Ratios (%) (to average net assets)
and Supplemental data: | | | | | | | | | | | | | | | |
| Expenses before expense reductions (f) | | 0.86 | | | 0.91 | | | 0.90 | | | 0.88 | | | 0.90 | |
| Expenses after expense reductions (f) | | N/A | | | 0.91 | | | N/A | | | N/A | | | N/A | |
| Net investment income | | 0.65 | | | 0.53 | | | 0.64 | | | 0.70 | | | 0.78 | |
| Portfolio turnover | | 156 | | | 122 | | | 92 | | | 97 | | | 147 | |
| Net assets at end of period (000 Omitted) | | $212,063 | | | $80,024 | | | $80,710 | | | $83,219 | | | $80,059 | |
See Notes to Financial Statements
13
Financial Highlights – continued
Service Class
| | | | | | | | | | | | | | | |
| | | Years Ended 12/31 | |
| | | 2007 | | | 2006 | | | 2005 | | | 2004 | | | 2003 | |
| Net asset value, beginning of period | | $17.05 | | | $15.09 | | | $14.25 | | | $12.53 | | | $9.89 | |
| Net investment income (d) | | $0.07 | | | $0.04 | | | $0.06 | | | $0.06 | | | $0.06 | |
Net realized and unrealized gain (loss) on investments
and foreign currency | | 1.39 | | | 1.98 | | | 0.84 | | | 1.72 | | | 2.65 | |
| Total from investment operations | | $1.46 | | | $2.02 | | | $0.90 | | | $1.78 | | | $2.71 | |
| Less distributions declared to shareholders | | | | | | | | | | | | | | | |
| From net investment income | | $(0.05 | ) | | $(0.06 | ) | | $(0.06 | ) | | $(0.06 | ) | | $(0.07 | ) |
| From net realized gain on investments | | (2.04 | ) | | — | | | — | | | — | | | — | |
| Total distributions declared to shareholders | | $(2.09 | ) | | $(0.06 | ) | | $(0.06 | ) | | $(0.06 | ) | | $(0.07 | ) |
| Net asset value, end of period | | $16.42 | | | $17.05 | | | $15.09 | | | $14.25 | | | $12.53 | |
| Total return (%) (k)(r)(s) | | 8.40 | | | 13.44 | | | 6.39 | | | 14.29 | (b) | | 27.49 | |
Ratios (%) (to average net assets)
and Supplemental data: | | | | | | | | | | | | | | | |
| Expenses before expense reductions (f) | | 1.11 | | | 1.16 | | | 1.15 | | | 1.13 | | | 1.15 | |
| Expenses after expense reductions (f) | | N/A | | | 1.16 | | | N/A | | | N/A | | | N/A | |
| Net investment income | | 0.41 | | | 0.29 | | | 0.39 | | | 0.45 | | | 0.53 | |
| Portfolio turnover | | 156 | | | 122 | | | 92 | | | 97 | | | 147 | |
| Net assets at end of period (000 Omitted) | | $34,932 | | | $12,675 | | | $9,990 | | | $9,916 | | | $8,920 | |
| (b) | The fund’s net asset value and total return calculation include a non-recurring accrual recorded as a result of an administrative proceeding regarding disclosure of brokerage allocation practices in connection with fund sales. The non-recurring accrual did not have a material impact on the net asset value per share based on the shares outstanding on the day the proceeds were recorded. |
| (d) | Per share data are based on average shares outstanding. |
| (f) | Ratios do not reflect reductions from fees paid indirectly, if applicable. |
| (k) | The total return does not reflect expenses that apply to separate accounts. Inclusion of these charges would reduce the total return figures for all periods shown. |
| (r) | Certain expenses have been reduced without which performance would have been lower. |
| (s) | From time to time the fund may receive proceeds from litigation settlements, without which performance would be lower. |
See Notes to Financial Statements
14
NOTES TO FINANCIAL STATEMENTS
(1) Business and Organization
MFS Core Equity Portfolio (formerly Core Equity Series) (the fund) is a fund of MFS Variable Insurance Trust II (formerly known as MFS/Sun Life Series Trust) (the trust). The trust is organized as a Massachusetts business trust and is registered under the Investment Company Act of 1940, as amended, as an open-end management investment company. The shares of the fund are sold to variable accounts established by insurance companies to fund benefits under variable contracts issued by such companies, and qualified retirement and pension plans.
(2) Significant Accounting Policies
General – The preparation of financial statements in conformity with U.S. generally accepted accounting principles requires management to make estimates and assumptions that affect the reported amounts of assets and liabilities, and disclosure of contingent assets and liabilities at the date of the financial statements and the reported amounts of revenues and expenses during the reporting period. Actual results could differ from those estimates. The fund can invest in foreign securities, including securities of emerging market issuers. Investments in foreign securities are vulnerable to the effects of changes in the relative values of the local currency and the U.S. dollar and to the effects of changes in each country’s legal, political, and economic environment. The markets of emerging markets countries are generally more volatile than the markets of developed countries with more mature economies. All of the risks of investing in foreign securities previously described are heightened when investing in emerging markets countries.
Investment Valuations – Equity securities, including restricted equity securities, are generally valued at the last sale or official closing price as reported by an independent pricing service on the market or exchange on which they are primarily traded. For securities for which there were no sales reported that day, equity securities are generally valued at the last quoted daily bid quotation as reported by an independent pricing service on the market or exchange on which they are primarily traded. For securities held short for which there were no sales reported for the day, the position is generally valued at the last quoted daily ask quotation as reported by an independent pricing service on the market or exchange on which such securities are primarily traded. Short-term instruments with a maturity at issuance of 60 days or less may be valued at amortized cost, which approximates market value. Open-end investment companies are generally valued at their net asset value per share. Securities and other assets generally valued on the basis of information from an independent pricing service may also be valued at a broker-dealer bid quotation. The values of foreign securities and other assets and liabilities expressed in foreign currencies are converted to U.S. dollars using the mean of bid and asked prices for rates reported by an independent pricing service.
The Board of Trustees has delegated primary responsibility for determining or causing to be determined the value of the fund’s investments (including any fair valuation) to the adviser pursuant to valuation policies and procedures approved by the Board. If the adviser determines that reliable market quotations are not readily available, investments are valued at fair value as determined in good faith by the adviser in accordance with such procedures under the oversight of the Board of Trustees. Under the fund’s valuation policies and procedures, market quotations are not considered to be readily available for many types of debt instruments and certain types of derivatives. These investments are generally valued at fair value based on information from independent pricing services. In addition, investments may be valued at fair value if the adviser determines that an investment’s value has been materially affected by events occurring after the close of the exchange or market on which the investment is principally traded (such as foreign exchange or market) and prior to the determination of the fund’s net asset value, or after the halting of trading of a specific security where trading does not resume prior to the close of the exchange or market on which the security is principally traded. Events that occur on a frequent basis after foreign markets close (such as developments in foreign markets and significant movements in the U.S. markets) and prior to the determination of the fund’s net asset value may be deemed to have a material affect on the value of securities traded in foreign markets. Accordingly, the fund’s foreign equity securities may often be valued at fair value. The adviser may rely on independent pricing services or other information (such as the correlation with price movements of similar securities in the same or other markets; the type, cost and investment characteristics of the security; the business and financial condition of the issuer; and trading and other market data) to assist in determining whether to fair value and at what value to fair value an investment. The value of an investment for purposes of calculating the fund’s net asset value can differ depending on the source and method used to determine value. When fair valuation is used, the value of investments used to determine the fund’s net asset value may differ from quoted or published prices for the same investments.
In September 2006, FASB Statement No. 157, Fair Value Measurements (the “Statement”) was issued, and is effective for fiscal years beginning after November 15, 2007 and for all interim periods within those fiscal years. This Statement provides a single definition of fair value, a hierarchy for measuring fair value and expanded disclosures about fair value measurements. Management is evaluating the application of the Statement to the fund, and believes the impact will be limited to expanded disclosures resulting from the adoption of this Statement in the fund’s financial statements.
15
Notes to Financial Statements – continued
Repurchase Agreements – The fund may enter into repurchase agreements with institutions that the fund’s investment adviser has determined are creditworthy. Each repurchase agreement is recorded at cost. The fund requires that the securities collateral in a repurchase transaction be transferred to the custodian in a manner sufficient to enable the fund to obtain those securities in the event of a default under the repurchase agreement. The fund monitors, on a daily basis, the value of the collateral to ensure that its value, including accrued interest, is greater than amounts owed to the fund under each such repurchase agreement. The fund and other funds managed by Massachusetts Financial Services Company (MFS), may utilize a joint trading account for the purpose of entering into one or more repurchase agreements.
Foreign Currency Translation – Purchases and sales of foreign investments, income, and expenses are converted into U.S. dollars based upon currency exchange rates prevailing on the respective dates of such transactions. Gains and losses attributable to foreign currency exchange rates on sales of securities are recorded for financial statement purposes as net realized gains and losses on investments. Gains and losses attributable to foreign exchange rate movements on income and expenses are recorded for financial statement purposes as foreign currency transaction gains and losses. That portion of both realized and unrealized gains and losses on investments that results from fluctuations in foreign currency exchange rates is not separately disclosed.
Security Loans – State Street Bank and Trust Company (“State Street”), as lending agent, may loan the securities of the fund to certain qualified institutions (the “Borrowers”) approved by the fund. The loans are collateralized at all times by cash and/or U.S. Treasury securities in an amount at least equal to the market value of the securities loaned. State Street provides the fund with indemnification against Borrower default. The fund bears the risk of loss with respect to the investment of cash collateral. On loans collateralized by cash, the cash collateral is invested in a money market fund or short-term securities. A portion of the income generated upon investment of the collateral is remitted to the Borrowers, and the remainder is allocated between the fund and the lending agent. On loans collateralized by U.S. Treasury securities, a fee is received from the Borrower, and is allocated between the fund and the lending agent. Net income from securities lending is included in interest income on the Statement of Operations. The dividend and interest income earned on the securities loaned is accounted for in the same manner as other dividend and interest income.
At December 31, 2007, the value of securities loaned was $31,343,662. These loans were collateralized by cash of $29,197,715 and U.S. Treasury obligations of $2,934,576.
Indemnifications – Under the fund’s organizational documents, its officers and trustees may be indemnified against certain liabilities and expenses arising out of the performance of their duties to the fund. Additionally, in the normal course of business, the fund enters into agreements with service providers that may contain indemnification clauses. The fund’s maximum exposure under these agreements is unknown as this would involve future claims that may be made against the fund that have not yet occurred.
Investment Transactions and Income – Investment transactions are recorded on the trade date. Interest income is recorded on the accrual basis. All premium and discount is amortized or accreted for financial statement purposes in accordance with U.S. generally accepted accounting principles. All discount is accreted for tax reporting purposes as required by federal income tax regulations. Dividends received in cash are recorded on the ex-dividend date. Certain dividends from foreign securities will be recorded when the fund is informed of the dividend if such information is obtained subsequent to the ex-dividend date. Dividend and interest payments received in additional securities are recorded on the ex-dividend or ex-interest date in an amount equal to the value of the security on such date.
The fund may receive proceeds from litigation settlements. Any proceeds received from litigation involving portfolio holdings are reflected in the Statement of Operations in realized gain/loss if the security has been disposed of by the fund or in unrealized gain/loss if the security is still held by the fund. Any other proceeds from litigation not related to portfolio holdings are reflected as other income in the Statement of Operations.
Fees Paid Indirectly – The fund’s custody fee may be reduced according to an arrangement that measures the value of cash deposited with the custodian by the fund. This amount, for the year ended December 31, 2007, is shown as a reduction of total expenses on the Statement of Operations.
Tax Matters and Distributions – The fund intends to qualify as a regulated investment company, as defined under Subchapter M of the Internal Revenue Code, and to distribute all of its taxable income, including realized capital gains. As a result, no provision for federal income tax is required. The fund adopted the provisions of FASB Interpretation No. 48, Accounting for Uncertainty in Income Taxes (“the Interpretation”) on January 1, 2007. The Interpretation prescribes a minimum threshold for financial statement recognition of the benefit of a tax position taken or expected to be taken in a tax return. There was no impact resulting from the adoption of this Interpretation on the fund’s financial statements. Each of the fund’s federal tax returns for the prior three fiscal years remains subject to examination by the Internal Revenue Service. It is the fund’s policy to record interest and penalty charges on underpaid taxes associated with its tax positions as interest expense and other expense,
16
Notes to Financial Statements – continued
respectively. No such charges were recorded in the current financial statements. Foreign taxes, if any, have been accrued by the fund in the accompanying financial statements.
Distributions to shareholders are recorded on the ex-dividend date. Income and capital gain distributions are determined in accordance with income tax regulations, which may differ from U.S. generally accepted accounting principles. Certain capital accounts in the financial statements are periodically adjusted for permanent differences in order to reflect their tax character. These adjustments have no impact on net assets or net asset value per share. Temporary differences which arise from recognizing certain items of income, expense, gain or loss in different periods for financial statement and tax purposes will reverse at some time in the future. Distributions in excess of net investment income or net realized gains are temporary overdistributions for financial statement purposes resulting from differences in the recognition or classification of income or distributions for financial statement and tax purposes.
Book/tax differences primarily relate to wash sale loss deferrals.
The tax character of distributions declared to shareholders is as follows:
| | | | |
| | | 12/31/07 | | 12/31/06 |
| Ordinary income (including any short-term capital gains) | | $2,802,701 | | $523,238 |
| Long-term capital gain | | 8,304,730 | | — |
| Total distributions | | $11,107,431 | | $523,238 |
The federal tax cost and the tax basis components of distributable earnings were as follows:
| | | |
| As of 12/31/07 | | | |
| Cost of investments | | $263,994,202 | |
| Gross appreciation | | 26,016,805 | |
| Gross depreciation | | (13,916,958 | ) |
| Net unrealized appreciation (depreciation) | | $12,099,847 | |
| Undistributed ordinary income | | 1,137,326 | |
| Undistributed long-term capital gain | | 14,360,850 | |
| Capital loss carryforwards | | (250,413,447 | ) |
| Post-October capital loss deferral | | (3,972,447 | ) |
| Other temporary differences | | (72,275 | ) |
As of December 31, 2007, the fund had capital loss carryforwards available to offset future realized gains. Such losses expire as follows:
| | | |
| 12/31/08 | | $(104,052,895 | ) |
| 12/31/09 | | (146,360,552 | ) |
| Total | | $(250,413,447 | ) |
The availability of a portion of the capital loss carryforwards, which were acquired on June 22, 2007 in connection with the MFS/Sun Life Capital Opportunities Series merger, may be limited in a given year.
Multiple Classes of Shares of Beneficial Interest – The fund offers multiple classes of shares, which differ in their respective distribution fees. All shareholders bear the common expenses of the fund based on daily net assets of each class, without distinction between share classes. Dividends are declared separately for each class. Differences in per share dividend rates are generally due to differences in separate class expenses.
(3) Transactions with Affiliates
Investment Adviser – The fund has an investment advisory agreement with MFS to provide overall investment management and related administrative services and facilities to the fund.
The management fee is computed daily and paid monthly at the following annual rates:
| | |
| First $1 billion of average daily net assets | | 0.75% |
| Average daily net assets in excess of $1 billion | | 0.65% |
The investment adviser has agreed in writing to reduce its management fee to 0.60% of average daily net assets in excess of $2.5 billion. This written agreement will continue through August 31, 2008 unless changed or rescinded by the fund’s Board of Trustees. For the year ended December 31, 2007, the fund’s average daily net assets did not exceed $2.5 billion and therefore, the management fee was not reduced. The management fee incurred for the year ended December 31, 2007 was equivalent to an annual effective rate of 0.75% of the fund’s average daily net assets.
At the commencement of the period and until June 22, 2007, the investment adviser had agreed in writing to pay a portion of the fund’s operating expenses, exclusive of certain other fees and expenses, such that total annual fund operating expenses did
17
Notes to Financial Statements – continued
not exceed 0.95% for the Initial Class shares and 1.20% for the Service Class shares based on the average daily net assets of each respective class. Effective June 23, 2007, the investment adviser has agreed in writing to pay a portion of the fund’s operating expenses, exclusive of certain other fees and expenses, such that the total annual fund operating expenses does not exceed 0.85% for the Initial Class shares and 1.10% for the Service Class shares based on the average daily net assets of each respective class. This written agreement will continue through June 30, 2010 unless changed or rescinded by the fund’s Board of Trustees. For the year ended December 31, 2007, the fund’s actual operating expenses did not exceed the limit and therefore, the investment adviser did not pay any portion of the fund’s expenses.
Distributor – MFS Fund Distributors, Inc. (MFD), a wholly-owned subsidiary of MFS, is the distributor of shares of the fund. The Trustees have adopted a distribution plan for the Service Class shares pursuant to Rule 12b-1 under the Investment Company Act of 1940.
The fund’s distribution plan provides that the fund will pay MFD distribution fees equal to 0.25% per annum of its average daily net assets attributable to Service Class shares as partial consideration for services performed and expenses incurred by MFD and financial intermediaries in connection with the sale and distribution of the fund’s Service Class shares and the sale and distribution of the variable annuity or variable life insurance contracts investing indirectly in Service Class shares. MFD may subsequently pay all, or a portion, of the distribution fees to financial intermediaries.
Shareholder Servicing Agent – MFS Service Center, Inc. (MFSC), a wholly-owned subsidiary of MFS, has contracted to provide transfer agent and recordkeeping functions in connection with the issuance, transfer, and redemption of each class of shares of each fund under a Shareholder Servicing Agent Agreement. During the year ended December 31, 2007, MFSC did not receive a fee for this service.
Administrator – MFS provides certain financial, legal, shareholder communications, compliance, and other administrative services to the fund. Under an administrative services agreement, the fund partially reimburses MFS the costs incurred to provide these services. The fund is charged an annual fixed amount of $10,000 plus a fee based on average daily net assets.
The administrative services fee incurred for the year ended December 31, 2007 was equivalent to an annual effective rate of 0.0254% of the fund’s average daily net assets.
Trustees’ and Officers’ Compensation – The fund pays compensation to trustees in the form of a retainer, attendance fees, and additional compensation to the Board chairperson. The fund does not pay compensation directly to officers of the fund who are also officers of the investment adviser, all of whom receive remuneration for their services to the fund from MFS. Certain officers of the fund are officers or directors of MFS, MFD, and MFSC.
Other – This fund and certain other MFS funds (the funds) have entered into a services agreement (the Agreement) which provides for payment of fees by the funds to Tarantino LLC in return for the provision of services of an Independent Chief Compliance Officer (ICCO) for the funds. The ICCO is an officer of the funds and the sole member of Tarantino LLC. The funds can terminate the Agreement with Tarantino LLC at any time under the terms of the Agreement. MFS has agreed to bear all expenses associated with office space, other administrative support, and supplies provided to the ICCO. For the year ended December 31, 2007, the fee paid to Tarantino LLC was $960.
(4) Portfolio Securities
Purchases and sales of investments, other than U.S. government securities, purchased option transactions, and short-term obligations, aggregated $265,920,895 and $300,862,006, respectively.
18
Notes to Financial Statements – continued
(5) Shares of Beneficial Interest
The fund’s Declaration of Trust permits the Trustees to issue an unlimited number of full and fractional shares of beneficial interest. Transactions in fund shares were as follows:
| | | | | | | | | | | | |
| | | Year ended 12/31/07 | | | Year ended 12/31/06 | |
| | | Shares | | | Amount | | | Shares | | | Amount | |
| Shares sold | | | | | | | | | | | | |
Initial Class | | 135,706 | | | $2,321,182 | | | 312,826 | | | $5,003,198 | |
Service Class | | 444,330 | | | 7,505,564 | | | 247,615 | | | 3,851,420 | |
| | 580,036 | | | $9,826,746 | | | 560,441 | | | $8,854,618 | |
| Shares issued in connection with acquisition of Capital Opportunities Portfolio | | | | | | | | | | | | |
Initial Class | | 10,188,505 | | | $168,851,898 | | | | | | | |
Service Class | | 1,066,978 | | | 17,592,510 | | | | | | | |
| | 11,255,483 | | | $186,444,408 | | | | | | | |
| Shares issued to shareholders in reinvestment of distributions | | | | | | | | | | | | |
Initial Class | | 564,617 | | | $9,406,527 | | | 30,391 | | | $475,009 | |
Service Class | | 102,526 | | | 1,700,904 | | | 3,096 | | | 48,229 | |
| | 667,143 | | | $11,107,431 | | | 33,487 | | | $523,238 | |
| Shares reacquired | | | | | | | | | | | | |
Initial Class | | (2,725,655 | ) | | $(45,522,176 | ) | | (998,630 | ) | | $(15,593,079 | ) |
Service Class | | (230,166 | ) | | (3,822,818 | ) | | (169,419 | ) | | (2,640,876 | ) |
| | (2,955,821 | ) | | $(49,344,994 | ) | | (1,168,049 | ) | | $(18,233,955 | ) |
| Net change | | | | | | | | | | | | |
Initial Class | | 8,163,173 | | | $135,057,431 | | | (655,413 | ) | | $(10,114,872 | ) |
Service Class | | 1,383,668 | | | 22,976,160 | | | 81,292 | | | 1,258,773 | |
| | 9,546,841 | | | $158,033,591 | | | (574,121 | ) | | $(8,856,099 | ) |
(6) Line of Credit
The fund and other funds managed by MFS participate in a $1 billion unsecured committed line of credit provided by a syndication of banks under a credit agreement. In addition, the fund and other funds managed by MFS have established uncommitted borrowing arrangements with certain banks. Borrowings may be made for temporary financing needs. Interest is charged to each fund, based on its borrowings, generally at a rate equal to the Federal Reserve funds rate plus 0.30%. In addition, a commitment fee, based on the average daily, unused portion of the committed line of credit, is allocated among the participating funds at the end of each calendar quarter. For the year ended December 31, 2007, the fund’s commitment fee and interest expense were $866 and $1,365, respectively, and are included in miscellaneous expense on the Statement of Operations.
(7) Acquisitions
At close of business on June 22, 2007, the fund acquired all of the assets and liabilities of Capital Opportunities Series. The acquisition was accomplished by a tax-free exchange of 11,255,483 shares of the fund (valued at $186,444,408) for all of the assets and liabilities of Capital Opportunities Series. Capital Opportunities Series then distributed the shares of the fund that the Capital Opportunities Series received from the fund to its shareholders. Capital Opportunities Series net assets on that date were $186,444,408, including $19,738,552 of unrealized appreciation, $6,367 of accumulated net investment loss, and $262,544,692 of accumulated net realized loss on investments and foreign currency transactions. The aggregate net assets of the fund after the acquisition were $281,997,884.
19
REPORT OF INDEPENDENT REGISTERED PUBLIC ACCOUNTING FIRM
To the Board of Trustees of MFS Variable Insurance Trust II (formerly known as MFS/Sun Life Series Trust) and the Shareholders of MFS Core Equity Portfolio (formerly known as Core Equity Series):
We have audited the accompanying statement of assets and liabilities, including the portfolio of investments, of MFS Core Equity Portfolio (one of the portfolios comprising MFS Variable Insurance Trust II) (the “Trust”) as of December 31, 2007, and the related statement of operations for the year then ended, the statements of changes in net assets for each of the two years in the period then ended, and the financial highlights for each of the five years in the period then ended. These financial statements and financial highlights are the responsibility of the Trust’s management. Our responsibility is to express an opinion on these financial statements and financial highlights based on our audits.
We conducted our audits in accordance with the standards of the Public Company Accounting Oversight Board (United States). Those standards require that we plan and perform the audit to obtain reasonable assurance about whether the financial statements and financial highlights are free of material misstatement. The Trust is not required to have, nor were we engaged to perform, an audit of its internal control over financial reporting. Our audits included consideration of internal control over financial reporting as a basis for designing audit procedures that are appropriate in the circumstances, but not for the purpose of expressing an opinion on the effectiveness of the Trust’s internal control over financial reporting. Accordingly, we express no such opinion. An audit also includes examining, on a test basis, evidence supporting the amounts and disclosures in the financial statements, assessing the accounting principles used and significant estimates made by management, as well as evaluating the overall financial statement presentation. Our procedures included confirmation of securities owned as of December 31, 2007, by correspondence with the custodian and brokers; where replies were not received from brokers, we performed other auditing procedures. We believe that our audits provide a reasonable basis for our opinion.
In our opinion, such financial statements and financial highlights present fairly, in all material respects, the financial position of MFS Core Equity Portfolio as of December 31, 2007, the results of its operations for the year then ended, the changes in its net assets for each of the two years in the period then ended, and its financial highlights for each of the five years in the period then ended, in conformity with accounting principles generally accepted in the United States of America.
DELOITTE & TOUCHE LLP
Boston, Massachusetts
February 15, 2008
20
TRUSTEES AND OFFICERS – IDENTIFICATION AND BACKGROUND
The Trustees and officers of the Trust, as of February 1, 2008, are listed below, together with their principal occupations during the past five years. (Their titles may have varied during that period.) The address of each Trustee and officer is 500 Boylston Street, Boston, Massachusetts 02116.
| | | | | | |
Name, Date of Birth | | Position(s) Held
with Fund | | Trustee/Officer
Since(1) | | Principal Occupations During the Past Five Years &
Other Directorships(2) |
| INTERESTED TRUSTEE | | | | | | |
David D. Horn(3) (born 06/07/41) | | Trustee | | April 1986 | | Private investor; Retired; Sun Life Assurance Company of Canada, Former Senior Vice President and General Manager for the United States (until 1997); Retired: Sun Life Assurance Company of Canada, Director (until March 2004) |
| | |
| INDEPENDENT TRUSTEES | | | | |
J. Kermit Birchfield (born 01/08/40) | | Chairman | | May 1997 | | Consultant; Century Partners, Inc. (investments), Director (1988 to present); Displaytech, Inc. (technology), Director (1995 to present); Dessin Fournir LLC (furniture manufacturer), Director (2005 to present); Intermountain Gas Company, Inc. & Intermountain Industries, Inc. (oil & gas exploration and production) (1988 to present); Site Watch LLC (software to monitor oil tanks) Managing Director (2006 to present); Juridica Investments (fund investing in judicial matters) Director (2007 to present); Dairy Mart Convenience Stores, Inc. (convenience stores), Chairman (1997 to 2003) |
| | | |
Robert C. Bishop (born 01/13/43) | | Trustee | | May 2001 | | Autolmmune Inc. (pharmaceutical product licensing), Chairman, President and Chief Executive Officer (1992 to present); Caliper Life Sciences Corp. (laboratory analytical instruments), Director (2002 to present); Millipore Corporation (biopharmaceutical/research laboratory products), Director (1997 to present); Optobionics Corporation (ophthalmic devices), Director (2002 to 2007); Quintiles Transnational Corp. (contract research services), Director (until 2003) |
| | | |
Frederick H. Dulles (born 03/12/42) | | Trustee | | May 2001 | | Ten State International Law PLLC (law firm), Of Counsel (since 2006); Prudential Carolina Real Estate, (real estate), Broker (since 2006); Free Enterprise Foundation, Inc. (research institute), Director & Secretary (until 2008); Disher, Hamrick & Myers Residential, Inc. (real estate) Broker (until 2006); Frederick H. Dulles law practice (until 2006); Ten State Street LLP (law firm), Member (until 2005); McFadden, Pilkington & Ward LLP (solicitors and registered foreign lawyers), Member & Of Counsel (until 2003) |
| | | |
Marcia A. Kean (born 06/30/48) | | Trustee | | April 2005 | | Feinstein Kean Healthcare (consulting), Chief Executive Officer (since December 2002), Managing Director (prior to May 2001); Ardais Corporation (biotech products), Senior Vice President – Commercialization (February 2002 until November 2002) |
| | | |
Ronald G. Steinhart (born 06/15/40) | | Trustee | | May 2001 | | Private investor; Penske Automotive Group (automotive retailer), Director (2001 to present); Penson Worldwide, Inc. (securities clearance), Director (2006 to present); Animal Health International, Inc. (animal health products), Director (2007 to present); Texas Industries (concrete/aggregates/cement), Director (2007 to present); Carreker Corporation (technology consulting) Director (until 2005); Prentiss Properties Trust (real estate investment trust), Director (until 2006) |
| | | |
Haviland Wright (born 07/21/48) | | Trustee | | May 2001 | | Elixir Technologies Corporation (software) Director (2005 to present); Nano Loa Inc. (liquid crystal displays), Director (2003 to present); Silk Displays, Inc. (smart polymers) Director (2007 to present); Displaytech, Inc. (technology) Chairman and CEO (1995 – 2002) |
| | | |
| TRUSTEE EMERITUS | | | | | | |
Samuel Adams (born 10/19/25) | | Trustee Emeritus | | | | Retired; Kirkpatrick & Lockhart Preston Gates Ellis LLP (law firm), Of Counsel |
| | | |
| OFFICERS | | | | | | |
Maria F. Dwyer(4) (born 12/01/58) | | President | | November 2005 | | Massachusetts Financial Services Company, Executive Vice President and Chief Regulatory Officer (since March 2004); Fidelity Management & Research Company, Vice President (prior to March 2004); Fidelity Group of Funds, President and Treasurer (prior to March 2004) |
| | | |
Tracy Atkinson(4) (born 12/30/64) | | Treasurer | | September 2005 | | Massachusetts Financial Services Company, Senior Vice President (since September 2004); PricewaterhouseCoopers LLP, Partner (prior to September 2004) |
| | | |
Christopher R. Bohane(4) (born 01/18/74) | | Assistant Secretary and Assistant Clerk | | July 2005 | | Massachusetts Financial Services Company, Vice President and Senior Counsel (since April 2003); Kirkpatrick & Lockhart LLP (law firm), Associate (prior to April 2003) |
21
Trustees and Officers – continued
| | | | | | |
Name, Date of Birth | | Position(s) Held
with Fund | | Trustee/Officer
Since(1) | | Principal Occupations During the Past Five Years &
Other Directorships(2) |
| | | |
Ethan D. Corey(4) (born 11/21/63) | | Assistant Secretary and Assistant Clerk | | July 2005 | | Massachusetts Financial Services Company, Senior Vice President and Associate General Counsel (since April 2006); Special Counsel (prior to April 2006); Dechert LLP (law firm), Counsel (prior to December 2004) |
| | | |
David L. DiLorenzo(4) (born 08/10/68) | | Assistant Treasurer | | July 2005 | | Massachusetts Financial Services Company, Vice President (since June 2005); JP Morgan Investor Services, Vice President (January 2001 to June 2005) |
| | | |
Timothy M. Fagan(4) (born 07/10/68) | | Assistant Secretary and Assistant Clerk | | September 2005 | | Massachusetts Financial Services Company, Vice President and Senior Counsel (since September 2005); John Hancock Advisers, LLC, Vice President and Chief Compliance Officer (September 2004 to August 2005) Senior Attorney (prior to September 2004); John Hancock Group of Funds, Vice President and Chief Compliance Officer (September 2004 to December 2004) |
| | | |
Mark D. Fischer(4) (born 10/27/70) | | Assistant Treasurer | | July 2005 | | Massachusetts Financial Services Company, Vice President (since May 2005); JP Morgan Investment Management Company, Vice President (prior to May 2005) |
| | | |
Brian E. Langenfeld(4) (born 03/07/73) | | Assistant Secretary and Assistant Clerk | | May 2006 | | Massachusetts Financial Services Company, Assistant Vice President and Counsel (since May 2006); John Hancock Advisers, LLC, Assistant Vice President and Counsel (May 2005 to April 2006); John Hancock Advisers, LLC, Attorney and Assistant Secretary (prior to May 2005) |
| | | |
Ellen Moynihan(4) (born 11/13/57) | | Assistant Treasurer | | May 1997 | | Massachusetts Financial Services Company, Senior Vice President |
| | | |
Susan S. Newton(4) (born 03/07/50) | | Assistant Secretary and Assistant Clerk | | May 2005 | | Massachusetts Financial Services Company, Senior Vice President and Assistant General Counsel (since April 2005); John Hancock Advisers, LLC, Senior Vice President, Secretary and Chief Legal Officer (prior to April 2005); John Hancock Group of Funds, Senior Vice President, Secretary and Chief Legal Officer (prior to April 2005) |
| | | |
Susan A. Pereira(4) (born 11/05/70) | | Assistant Secretary and Assistant Clerk | | July 2005 | | Massachusetts Financial Services Company, Vice President and Senior Counsel (since June 2004); Bingham McCutchen LLP (law firm), Associate (January 2001 to June 2004) |
| | | |
Mark N. Polebaum(4) (born 05/01/52) | | Secretary and Assistant Clerk | | February 2006 | | Massachusetts Financial Services Company, Executive Vice President, General Counsel and Secretary (since January 2006); Wilmer Cutler Pickering Hale and Dorr LLP (law firm), Partner (prior to January 2006) |
| | | |
Frank L. Tarantino (born 03/07/44) | | Independent Chief Compliance Officer | | September 2004 | | Tarantino LLC (provider of compliance services), Principal (since June 2004); CRA Business Strategies Group (consulting services), Executive Vice President (April 2003 to June 2004); David L. Babson & Co. (investment adviser), Managing Director, Chief Administrative Officer and Director (February 1997 to March 2003) |
| | | |
Richard S. Weitzel(4) (born 7/16/70) | | Assistant Secretary and Assistant Clerk | | October 2007 | | Massachusetts Financial Services Company, Vice President and Assistant General Counsel (since 2007); Vice President and Senior Counsel (since May 2004); Massachusetts Department of Business and Technology, General Counsel (February 2003 to April 2004); Massachusetts Office of the Attorney General, Assistant Attorney General ( April 2001 to February 2003); Ropes and Gray, Associate (prior to April 2001) |
| | | |
James O. Yost(4) (born 06/12/60) | | Assistant Treasurer | | April 1992 | | Massachusetts Financial Services Company, Senior Vice President |
| (1) | Date first appointed to serve as Trustee/Officer of an MFS fund or a Compass variable account. Each Trustee has served continuously since appointment. |
| (2) | Directorships or trusteeships of companies required to report to the Securities and Exchange Commission (i.e., “public companies”). |
| (3) | “Interested person” of the Sun Life of Canada (U.S.), within the meaning of the Investment Company Act of 1940 (referred to as the 1940 Act), which is the principal federal law governing investment companies like the Series. The address of Sun Life of Canada (U.S.) is One Sun Life Executive Park, Wellesley Hills, Massachusetts 02481. |
| (4) | “Interested person” of MFS within the meaning of the 1940 Act. The address of MFS is 500 Boylston Street, Boston, Massachusetts 02116. |
The Trust does not hold annual meetings for the purpose of electing Trustees, and Trustees are not elected for fixed terms. Each Trustee and officer holds office until his or her successor is chosen and qualified, or until his or her earlier death, resignation, retirement or removal.
All Trustees currently serve as Trustees of the Trust and have served in that capacity since originally elected or appointed. All of the Trustees are also Managers of the Compass Variable Accounts. The executive officers of the Trust hold similar offices for the Compass Variable Accounts and other funds in the MFS fund complex. As of January 1, 2008, each Trustee serves as a Trustee or Manager of 35 Accounts/Funds.
22
Trustees and Officers – continued
The Statement of Additional Information contains further information about the Trustees and is available without charge upon request by calling 1-800-225-2606.
| | |
Investment Adviser
Massachusetts Financial Services Company 500 Boylston Street, Boston, MA 02116-3741 | | Custodian State Street Bank and Trust Company 225 Franklin Street, Boston, MA 02110 |
Distributor
MFS Fund Distributors, Inc. 500 Boylston Street, Boston, MA 02116-3741 | | Independent Registered Public Accounting Firm Deloitte & Touche LLP 200 Berkeley Street, Boston, MA 02116 |
Portfolio Manager Katrina Mead | | |
23
BOARD REVIEW OF INVESTMENT ADVISORY AGREEMENT
The Investment Company Act of 1940 requires that both the full Board of Trustees and a majority of the non-interested (“independent”) Trustees, voting separately, annually approve the continuation of the investment advisory agreement between MFS Variable Insurance Trust II (the “Trust”) and Massachusetts Financial Services Company (MFS) on behalf of the Fund. The Trustees consider matters bearing on the Fund and the advisory arrangements at their meetings throughout the year, including a review of performance data at each regular meeting. In addition, the independent Trustees met several times over the course of three months beginning in May and ending in July 2007 (“contract review meetings”) for the specific purpose of considering whether to approve the continuation of the investment advisory agreement for the Fund. The independent Trustees were assisted in their evaluation of the investment advisory agreement by independent legal counsel, from whom they received separate legal advice and with whom they met separately from MFS management during various contract review meetings. The independent Trustees were also assisted in this process by the Fund’s Independent Chief Compliance Officer, a full-time senior officer appointed by and reporting to the independent Trustees.
In connection with their deliberations, the Trustees, including the independent Trustees, considered such information and factors as they believed, in light of the legal advice furnished to them and their own business judgment, to be relevant. The investment advisory agreement was considered separately for the Fund, although the Trustees also took into account the common interests of all Funds in the Trust in their review. As described below, the Trustees considered the nature, quality, and extent of the various investment advisory, administrative, and shareholder services performed by MFS under the existing investment advisory agreement and other arrangements with the Trust.
In connection with their contract review meetings, the Trustees received and relied upon materials which included, among other items: (i) information provided by Lipper Inc. on the investment performance of the Fund for various time periods ended December 31, 2006, compared to the investment performance of a group of funds with substantially similar investment classifications/objectives (the “Lipper performance universe”), as well as the investment performance of a group of funds identified by objective criteria suggested by MFS (“peer funds”), (ii) information provided by Lipper Inc. on the Fund’s advisory fees and other expenses compared to the advisory fees and other expenses of comparable funds identified by Lipper (the “Lipper expense group”), as well as the advisory fees and other expenses of peer funds identified by objective criteria suggested by MFS, (iii) information provided by MFS on the advisory fees of comparable portfolios of its other clients, including institutional separate account and other clients, (iv) information as to whether, and to what extent applicable, expense waivers, reimbursements or fee “breakpoints” are observed for the Fund, (v) information regarding MFS’ financial results and financial condition, including MFS’ and certain of its affiliates’ estimated profitability from services performed for the Fund, (vi) MFS’ views regarding the outlook for the mutual fund industry and its strategic business plans, (vii) descriptions of various functions performed by MFS for the Trust, such as compliance monitoring and portfolio trading practices, and (viii) information regarding the overall organization of MFS, including information about MFS’ senior management and other personnel providing investment advisory, administrative and other services to the Fund. The comparative performance, fee and expense information prepared and provided by Lipper Inc. was not independently verified, and the independent Trustees did not independently verify any information provided to them by MFS.
The Trustees’ conclusion as to the continuation of the investment advisory agreement was based on comprehensive consideration of all information provided to the Trustees and not the result of any single factor. Some of the factors that figured particularly in the Trustees’ deliberations are described below for the Fund, while individual Trustees may have given different weight to various factors and evaluated the information presented as a whole differently than another Trustee. The Trustees recognized that the fee arrangements for the Fund reflect years of review and discussion between the independent Trustees and MFS, that certain aspects of such arrangements may receive greater scrutiny in some years than others, and that the Trustees’ conclusions may be based, in part, on their consideration of these same arrangements during the course of the year and in prior years.
Based on information provided by Lipper Inc. and MFS, the Trustees compared the Fund’s total return investment performance to the performance of a peer group of funds over various time periods. The Trustees placed particular emphasis on the total return performance of the Fund’s Initial Class shares in comparison to the performance of funds in its Lipper performance universe over the one-, three- and five-year periods. The Trustees did not rely on performance results for more recent periods, including those shown elsewhere in this report.
The Trustees noted the performance of the Fund’s Initial Class shares was in the 3rd quintile relative to the other funds in the Lipper Classification Index for the one-year period (the 1st quintile being the best performers and the 5th quintile being the worst performers). The total return performance of the Fund was in the 2nd quintile for the three-year period and the 3rd quintile for the five-year period ended December 31, 2006, relative to the Lipper performance universe. Based on the nature and quality of services provided by MFS, the Board of Trustees concluded that the Fund’s performance was satisfactory.
24
Board Review of Investment Advisory Agreement – continued
In the course of their deliberations, the Trustees took into account information provided by MFS during contract review meetings, as well as during investment review meetings conducted with portfolio management personnel during the course of the year.
In assessing the reasonableness of the Fund’s advisory fee, the Trustees considered, among other information, the Fund’s advisory fee and the total expense ratio of the Fund’s Initial Class shares as a percentage of average daily net assets, compared to the advisory fee and total expense ratios of its peer group of funds based on information provided by Lipper Inc. and MFS. The Trustees also considered the advisory fees charged by MFS to institutional accounts. In comparing these fees, the Trustees considered the generally broader scope of services provided by MFS to the Trust than those provided to institutional accounts. The Trustees also considered the higher demands placed on MFS’ investment personnel and trading infrastructure as a result of the daily cash in-flows and out-flows of the Fund, and the impact on MFS and related expenses due to the more extensive regulatory regime to which the Fund is subject, compared to institutional accounts.
In considering the fees, the Trustees noted from the Lipper data that the Fund’s effective advisory fee rate and total expense ratio were each approximately at the median of such fees and expenses of funds in the Lipper expense group. In addition, the Trustees accepted MFS’ offer to continue the management fee waiver and expense limitation for the Fund. The Trustees further concluded that the existing breakpoints were sufficient to allow the Fund to benefit from economies of scale as its assets grow.
The Trustees also considered information prepared by MFS relating to its costs and profits with respect to the Fund and other investment companies and accounts advised by MFS, as well as MFS’ methodologies used to determine and allocate its costs to the Fund and other accounts and products for purposes of estimating profitability.
After reviewing these and other factors described below, the Trustees concluded that the advisory fee charged to the Fund represents reasonable compensation in light of the nature and quality of the services being provided by MFS.
In addition, the Trustees considered MFS’ resources and related efforts to continue to retain, attract and motivate capable personnel to serve the Fund. The Trustees also considered the financial resources of MFS and its parent, Sun Life Financial Inc. The Trustees further considered any advantages and possible disadvantages of having an adviser which also serves other investment companies as well as institutional accounts.
The Trustees also considered the nature, quality, cost, and extent of administrative, transfer agency, and distribution services provided to the Fund by MFS and its affiliates under agreements and plans other than the investment advisory agreement, including the 12b-1 fees the Fund pays to MFS Fund Distributors, Inc., an affiliate of MFS. The Trustees also considered the nature, extent and quality of certain other services MFS performs or arranges on the Fund’s behalf, which may include securities lending programs, directed expense payment programs, class action recovery programs, and MFS’ interaction with third-party service providers, principally custodians and sub-custodians. The Trustees concluded that the various non-advisory services provided by MFS and its affiliates on behalf of the Fund were satisfactory. The Trustees also considered the benefits to MFS from the use of the Fund’s portfolio brokerage commissions to pay for research and other similar services (including MFS’ policy not to use “soft dollars” generated by Fund portfolio transactions to pay for third-party research), and various other factors. Additionally, the Trustees considered so-called “fall-out benefits” to MFS such as reputational value derived from serving as investment manager to the Trust, and determined that any such benefits derived by MFS were reasonable and fair.
Based on their evaluation of factors that they deemed to be material, including those factors described above, the Board of Trustees, including a majority of the independent Trustees, concluded that the investment advisory agreement should be continued for an additional one-year period, commencing September 1, 2007.
A discussion regarding the Board’s most recent review and renewal of the Fund’s investment advisory agreement is available by clicking on the Fund’s name under “Variable Insurance Portfolios” on the “Products & Performance” page on the MFS Web site (mfs.com).
25
PROXY VOTING POLICIES AND INFORMATION
A general description of the MFS funds’ proxy voting policies and procedures is available without charge, upon request, by calling 1-800-225-2606, by visiting the About MFS section of mfs.com or by visiting the SEC’s Web site at http://www.sec.gov.
Information regarding how the fund voted proxies relating to portfolio securities during the most recent twelve-month period ended June 30 is available without charge by visiting the Proxy Voting section of mfs.com or by visiting the SEC’s Web site at http://www.sec.gov.
QUARTERLY PORTFOLIO DISCLOSURE
The fund will file a complete schedule of portfolio holdings with the Securities and Exchange Commission (the Commission) for the first and third quarters of each fiscal year on Form N-Q. The fund’s Form N-Q may be reviewed and copied at the:
Public Reference Room
Securities and Exchange Commission
100 F Street, NE, Room 1580
Washington, D.C. 20549
Information on the operation of the Public Reference Room may be obtained by calling the Commission at 1-800-SEC-0330. The fund’s Form N-Q is available on the EDGAR database on the Commission’s Internet Web site at http://www.sec.gov, and copies of this information may be obtained, upon payment of a duplicating fee, by electronic request at the following e-mail address: publicinfo@sec.gov or by writing the Public Reference Section at the above address.
A shareholder can also obtain the quarterly portfolio holdings report at mfs.com.
FEDERAL TAX INFORMATION (unaudited)
The following information is provided pursuant to provisions of the Internal Revenue Code.
The fund designates $8,304,730 as capital gain dividends paid during the fiscal year.
For corporate shareholders, 36.05% of the ordinary income dividends paid during the fiscal year qualify for the corporate dividends received deduction.
26
MFS® PRIVACY NOTICE
Privacy is a concern for every investor today. At MFS Investment Management® and the MFS funds, we take this concern very seriously. We want you to understand our policies about the investment products and services that we offer, and how we protect the nonpublic personal information of investors who have a direct relationship with us and our wholly owned subsidiaries.
Throughout our business relationship, you provide us with personal information. We maintain information and records about you, your investments, and the services you use. Examples of the nonpublic personal information we maintain include
| | Ÿ | | data from investment applications and other forms |
| | Ÿ | | share balances and transactional history with us, our affiliates, or others |
| | Ÿ | | facts from a consumer reporting agency |
We do not disclose any nonpublic personal information about our customers or former customers to anyone, except as permitted by law. We may share nonpublic personal information with third parties or certain of our affiliates in connection with servicing your account or processing your transactions. We may share information with companies or financial institutions that perform marketing services on our behalf or with other financial institutions with which we have joint marketing arrangements, subject to any legal requirements.
Authorization to access your nonpublic personal information is limited to appropriate personnel who provide products, services, or information to you. We maintain physical, electronic, and procedural safeguards to help protect the personal information we collect about you.
If you have any questions about the MFS privacy policy, please call 1-800-225-2606 any business day between 8 a.m. and 8 p.m. Eastern time.
Note: If you own MFS products or receive MFS services in the name of a third party such as a bank or broker-dealer, their privacy policy may apply to you instead of ours.
27
CONTACT US
Web site
mfs.com
Account service and
literature
Shareholders
1-877-411-3325
9 a.m. to 5 p.m. ET
Investment professionals
1-800-637-8630
8 a.m. to 5 p.m. ET
Mailing address
MFS Service Center, Inc.
Attn: Institutional Alliance Services (IAS)
P.O. Box 55824
Boston, MA
02205-5824
Overnight mail
MFS Service Center, Inc.
Attn: Institutional Alliance Services (IAS)
500 Boylston Street
Boston, MA 02116-3741


MFS® Variable Insurance Trust IISM
Annual report
MFS® Research International Portfolio
(formerly Research International Series)
12/31/07
RSS-ANN
MFS® RESEARCH INTERNATIONAL PORTFOLIO
(formerly Research International Series)
The report is prepared for the general information of contract owners. It is authorized for distribution to prospective investors only when preceded or accompanied by a current prospectus.
NOT FDIC INSURED MAY LOSE VALUE NO BANK OR CREDIT UNION GUARANTEE NOT A DEPOSIT NOT INSURED BY ANY FEDERAL GOVERNMENT AGENCY OR NCUA/NCUSIF
LETTER FROM THE CEO

Dear Contract Owners:
The past year has been a great example of why investors should keep their eyes on the long term.
In 2006 the Dow Jones Industrial Average returned 19% and was fairly stable. This year we have seen a greater level of volatility than has been experienced in recent years. The Dow hit several new highs but also experienced swift drops as a global credit crisis swept through markets, spurred by defaults on U.S. subprime loans and a liquidity crunch. Still, even with this volatility, the Dow ended the first three quarters of 2007 with a return near 13%.
U.S. Treasury bonds gained ground, especially in the third quarter as investors sought less risky asset classes. The spreads of many lower-quality debt investments widened.
In 2007 the U.S. dollar fell against the euro, oil prices hit their highest levels yet, and gold spiked to its steepest price in 28 years. Around the globe, stocks sold off as risk aversion mounted. As we have said before, markets can be volatile, and investors should make sure they have an investment plan that can carry them through the peaks and troughs.
If you are focused on a long-term investment strategy, the short-term ups and downs of the markets should not necessarily dictate portfolio action on your part. In our view, investors who remain committed to a long-term plan are more likely to achieve their financial goals.
In any market environment, we believe individual investors are best served by following a three-pronged investment strategy of allocating their holdings across the major asset classes, diversifying within each class, and regularly rebalancing their portfolios to maintain their desired allocations. Of course, these strategies cannot guarantee a profit or protect against a loss. Investing and planning for the long term require diligence and patience, two traits that in our experience are essential to capitalizing on the many opportunities the financial markets can offer — through both up and down economic cycles.
Respectfully,

Robert J. Manning
Chief Executive Officer and Chief Investment Officer
MFS Investment Management®
February 15, 2008
The opinions expressed in this letter are subject to change, may not be relied upon for investment advice, and no forecasts can be guaranteed.
1
PORTFOLIO COMPOSITION
Portfolio structure
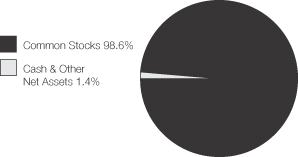
| | |
| Top ten holdings | | |
| E.ON AG | | 3.0% |
| TOTAL S.A. | | 2.5% |
| Royal Dutch Shell PLC, “A’’ | | 2.5% |
| Nestle S.A. | | 2.5% |
| Linde AG | | 2.3% |
| BHP Billiton PLC | | 2.2% |
| Bucyrus International, Inc., “A” | | 2.1% |
| Vodafone Group PLC | | 2.0% |
| Adidas AG | | 1.9% |
| Siemens AG | | 1.9% |
| | |
| Equity sectors | | |
| Financial Services | | 26.2% |
| Utilities & Communications | | 10.9% |
| Energy | | 9.6% |
| Basic Materials | | 8.1% |
| Consumer Staples | | 6.8% |
| Health Care | | 6.8% |
| Technology | | 6.0% |
| Industrial Goods & Services | | 5.7% |
| Autos & Housing | | 4.9% |
| Retailing | | 4.8% |
| Special Products & Services | | 4.3% |
| Leisure | | 3.0% |
| Transportation | | 1.5% |
| | |
| Country weightings | | |
| United Kingdom | | 16.1% |
| Germany | | 15.5% |
| Japan | | 13.2% |
| France | | 11.5% |
| Switzerland | | 8.4% |
| Italy | | 3.9% |
| Netherlands | | 3.3% |
| Australia | | 2.4% |
| Spain | | 2.3% |
| Other Countries | | 23.4% |
Percentages are based on net assets as of 12/31/07.
The portfolio is actively managed and current holdings may be different.
2
MANAGEMENT REVIEW
Summary of Results
For the twelve months ended December 31, 2007, Initial Class shares of the MFS Research International Portfolio (the “fund”) provided a total return of 13.15%, while Service Class shares provided a total return of 12.81%. These compare with a return of 11.63% for the fund’s benchmark, the MSCI EAFE Index. The fund’s other benchmark, the MSCI AC World Index ex U.S., generated a return of 17.12%.
Market Environment
Despite seemingly robust growth rates during the second and third quarters of 2007, underlying economic activity in the U.S. remained muted relative to other major economies. Overall, global economies witnessed moderate to strong growth during the reporting period as domestic demand improved and world trade accelerated.
With the strong global growth, however, concerns emerged about rising global inflation, especially as capacity became more constrained, wages rose, and energy and food prices advanced. During the reporting period, global central banks (with the exception of the U.S. Federal Reserve Board) tightened monetary conditions, which in turn pushed global bond yields to their highest levels during this economic expansion.
However, financial markets – particularly in the mortgage and structured-products areas – experienced substantial volatility in recent months. Beginning in late July, heightened uncertainty and distress concerning the subprime mortgage market caused several global credit markets to tighten up, forcing central banks to inject liquidity and to reassess their tightening biases as sovereign bond yields declined and credit spreads widened. While credit conditions improved somewhat by late October as the Federal Reserve Board cut interest rates, the level of market turbulence remained significant through year end. Increased market turmoil was also exacerbated by U.S. home foreclosures and uncertainties surrounding falling housing prices. Despite increased volatility across all asset classes and the widening in credit spreads, U.S. labor markets were resilient and wages rose modestly. More broadly, global equity markets rebounded following summer losses and generally held those gains through the end of the reporting period.
Contributors to performance
Stock selection within the basic materials, utilities and communications, and energy sectors drove performance over the reporting period relative to the MSCI EAFE Index.
Within the basic materials sector, key contributors to performance included strong-performing steel producer Steel Authority of India(aa) (India), mining giant BHP Billiton (U.K.), and industrial and medical gases producer Linde (Germany). Shares of Steel Authority of India aided performance as the company announced that profits rose for a sixth straight quarter. Company management expressed the belief that demand will grow at a double-digit rate as India and its neighbors continue to build infrastructure. At BHP Billiton, strong demand for a variety of metals commodities, spurred, in part, by the development of China and India, led to significant revenue and earnings upside.
Within the utilities and communications sector, power and gas company E.ON (Germany) helped performance over the reporting period. The company’s management announced that they may raise power prices due to increased global demand for energy. Management also reported growth and earnings above consensus estimates and announced that the company will probably complete, by June of 2008, the purchase of assets in Spain, Italy, and France from Endesa (Spain).
The energy sector also benefited relative performance. Shares of oil and gas exploration and production company Petroleo Brasileiro S.A.(aa) (Brazil) aided performance as the stock soared over the reporting period.
Stocks in other sectors that helped performance included industrial machinery manufacturer Bucyrus International(aa), health care products maker Bayer (Germany), sporting goods producer Adidas (Germany), and electronics and electrical engineering company Siemens (Germany). The management of Bucyrus International stated that global mining expansion and resurging machine orders should help to extend the company’s growth. Additionally, the company benefited during the period from its ahead-of-schedule integration of German mining company, DBT, and its ability to cross-sell DBT equipment to existing customers. Our avoidance of poor-performing car maker Toyota (Japan) was another positive factor.
During the reporting period, currency exposure was a contributor to the fund’s relative performance. All of MFS’ investment decisions are driven by the fundamentals of each individual opportunity and, as such, it is common for our portfolios to have different currency exposure than the benchmark.
Detractors from performance
Stock selection in the financial services sector dampened performance relative to the benchmark over the reporting period. Several individual holdings within this sector were among the fund’s top detractors. These included financial services firms Royal Bank of Scotland (U.K.), Barclays (U.K.), Sumitomo Mitsui Financial (Japan), Credit Agricole (France), UBS (Switzerland),
3
Management review – continued
and Aeon Credit (Japan). Shares of Royal Bank of Scotland came under pressure during the period as the company announced writedowns due to slumping credit markets, the company’s exposure to the U.K. real estate market, leveraged loans, and exposure to the U.S. subprime mortgage market.
Negative stock selection within the autos and housing sector hurt results. Our positioning in tire manufacturer Bridgestone (Japan) was a drag on performance as the stock underperformed the benchmark during the reporting period.
Stocks in other sectors that detracted from performance included our decision not to hold strong-performing mining operator Rio Tinto (Australia) and mobile phone maker Nokia (Finland). The consequence of not holding Rio Tinto was exacerbated when BHP Billiton tendered a bid to acquire the company which drove the share price higher. Elsewhere, our positioning in consumer electronics manufacturer Funai Electric(aa) detracted from performance as the stock underperformed the benchmark.
Respectfully,
| | |
| Jose Luis Garcia | | Thomas Melendez |
| Portfolio Manager | | Portfolio Manager |
| (aa) | Security is not a benchmark constituent. |
The views expressed in this report are those of the portfolio managers only through the end of the period of the report as stated on the cover and do not necessarily reflect the views of MFS or any other person in the MFS organization. These views are subject to change at any time based on market or other conditions, and MFS disclaims any responsibility to update such views. These views may not be relied upon as investment advice or an indication of trading intent on behalf of any MFS portfolio. References to specific securities are not recommendations of such securities, and may not be representative of any MFS portfolio’s current or future investments.
4
PERFORMANCE SUMMARY THROUGH 12/31/07
The following chart illustrates the historical performance of the fund in comparison to its indices. Index comparisons are unmanaged; do not reflect any fees or expenses; and cannot be invested in directly. The performance of other share classes will be greater than or less than that of the class depicted below. (See Notes to Performance Summary.)
Performance data shown represents past performance and is no guarantee of future results. Investment return and principal value fluctuate so your units, when sold, may be worth more or less than the original cost; current performance may be lower or higher than quoted. The performance shown does not reflect the deduction of taxes, if any, that a contract holder would pay on fund distributions or the redemption of contract units. The returns for the fund shown also do not reflect the deduction of expenses associated with variable products, such as mortality and expense risk charges, separate account charges, and sales charges imposed by the insurance company separate accounts. Such expenses would reduce the overall returns shown.
Growth of a hypothetical $10,000 investment(t)
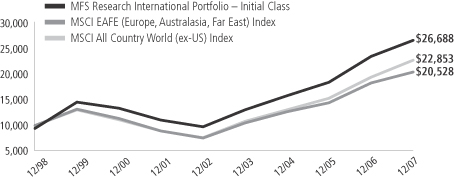
Total returns through 12/31/07
Average Annual Total Returns
| | | | | | | | | | | | |
| | | Share class | | Class inception date | | 1-yr | | 5-yr | | Life (t) | | |
| | | Initial Class | | 5/06/98 | | 13.15% | | 22.22% | | 10.70% | | |
| | | Service Class | | 8/24/01 | | 12.81% | | 21.90% | | 10.51% | | |
Comparative Index
| | | | | | | | | | | | |
| | | MSCI EAFE (Europe, Australasia, Far East) Index (f) | | 11.63% | | 22.08% | | 7.72% | | |
| | | MSCI All Country World (ex-US) Index (f) | | 17.12% | | 24.52% | | 8.93% | | |
| (f) | Source: FactSet Research Systems Inc. |
| (t) | For the period from the commencement of the fund’s investment operations, May 6, 1998 through the stated period end. Index information is from May 1, 1998. |
Index Definition
Morgan Stanley Capital International (MSCI) EAFE (Europe, Australasia, Far East) Index – a market capitalization-weighted index that is designed to measure equity market performance in the developed markets, excluding the U.S. and Canada.
Morgan Stanley Capital International (MSCI) All Country World (ex-US) Index – a market capitalization-weighted index that is designed to measure equity market performance in the developed and emerging markets, excluding the U.S.
It is not possible to invest directly in an index.
Notes to Performance Summary
Service Class share performance includes the performance of Initial Class shares for periods prior to the inception of Service Class shares (blended performance). This blended performance figure has not been adjusted to take into account differences in the class-specific operating expenses (such as Rule 12b-1 fees). Because operating expenses of Service Class shares are generally higher than those of Initial Class shares, the blended Service Class shares performance shown is higher than it would have been had Service Class shares been offered for the entire period.
Performance results reflect any applicable expense subsidies and waivers in effect during the periods shown. Without such subsidies and waivers the fund’s performance results would be less favorable. Please see the prospectus for complete details. All results are historical and assume the reinvestment of any dividends and capital gains distributions.
From time to time the fund may receive proceeds from litigation settlements, without which performance would be lower.
5
EXPENSE TABLE
Fund Expenses Borne by the Contract Holders During the Period,
July 1, 2007 through December 31, 2007
As a contract holder of the fund, you incur ongoing costs, including management fees; distribution (12b-1) fees; and other fund expenses. The example is intended to help you understand your ongoing costs (in dollars) of investing in the fund and to compare these costs with the ongoing costs of investing in other mutual funds.
This example is based on an investment of $1,000 invested at the beginning of the period and held for the entire period July 1, 2007 through December 31, 2007.
Actual expenses
The first line for each share class in the following table provides information about actual account values and actual expenses. You may use the information in this line, together with the amount you invested, to estimate the expenses that you paid over the period. Simply divide your account value by $1,000 (for example, an $8,600 account value divided by $1,000 = 8.6), then multiply the result by the number in the first line under the heading entitled “Expenses Paid During Period” to estimate the expenses you paid on your account during this period.
Hypothetical example for comparison purposes
The second line for each share class in the following table provides information about hypothetical account values and hypothetical expenses based on the fund’s actual expense ratio and an assumed rate of return of 5% per year before expenses, which is not the fund’s actual return. The hypothetical account values and expenses may not be used to estimate the actual ending account balance or expenses you paid for the period. You may use this information to compare the ongoing costs of investing in the fund and other funds. To do so, compare this 5% hypothetical example with the 5% hypothetical examples that appear in the shareholder reports of the other funds.
Please note that the expenses shown in the table are meant to highlight the fund’s ongoing costs only and do not take into account the fees and expenses imposed under the variable contracts through which your investment in the fund is made. Therefore, the second line for each share class in the table is useful in comparing ongoing costs associated with an investment in vehicles (such as the fund) which fund benefits under variable annuity and variable life insurance contracts and to qualified pension and retirement plans only, and will not help you determine the relative total costs of investing in the fund through variable annuity and variable life insurance contracts. If the fees and expenses imposed under the variable contracts were included, your costs would have been higher.
| | | | | | | | | | |
Share Class | | | | Annualized
Expense Ratio | | Beginning
Account Value
7/01/07 | | Ending
Account Value 12/31/07 | | Expenses Paid
During Period (p)
7/01/07-12/31/07 |
| Initial Class | | Actual | | 1.04% | | $1,000.00 | | $1,025.20 | | $5.31 |
| | Hypothetical (h) | | 1.04% | | $1,000.00 | | $1,019.96 | | $5.30 |
| Service Class | | Actual | | 1.29% | | $1,000.00 | | $1,023.90 | | $6.58 |
| | Hypothetical (h) | | 1.29% | | $1,000.00 | | $1,018.70 | | $6.56 |
| (h) | 5% class return per year before expenses. |
| (p) | Expenses paid is equal to each class’ annualized expense ratio, as shown above, multiplied by the average account value over the period, multiplied by the number of days in the period, divided by the number of days in the year. |
6
PORTFOLIO OF INVESTMENTS – 12/31/07
The Portfolio of Investments is a complete list of all securities owned by your fund.
It is categorized by broad-based asset classes.
| | | | | |
| Issuer | | Shares/Par | | Value ($) |
| | | | | |
| COMMON STOCKS – 98.6% | | | | | |
| Aerospace – 0.7% | | | | | |
| Finmeccanica S.p.A. | | 66,640 | | $ | 2,112,244 |
| | | | | |
| Alcoholic Beverages – 1.2% | | | | | |
| Heineken N.V. | | 58,760 | | $ | 3,784,428 |
| | | | | |
| Apparel Manufacturers – 4.0% | | | | | |
| Adidas AG | | 81,320 | | $ | 6,054,822 |
| Billabong International Ltd. (l) | | 84,153 | | | 1,093,491 |
| LVMH Moet Hennessy Louis Vuitton S.A. | | 42,820 | | | 5,146,552 |
| | | | | |
| | | | $ | 12,294,865 |
| | | | | |
| Automotive – 3.5% | | | | | |
| Bayerische Motoren Werke AG (l) | | 47,110 | | $ | 2,909,094 |
| Bridgestone Corp. (l) | | 143,100 | | | 2,520,337 |
Compagnie Generale des
Etablissements Michelin | | 22,850 | | | 2,622,516 |
| Yamaha Motor Co. Ltd. (l) | | 117,500 | | | 2,845,075 |
| | | | | |
| | | | $ | 10,897,022 |
| | | | | |
| Biotechnology – 0.4% | | | | | |
| Actelion Ltd. (a)(l) | | 26,391 | | $ | 1,202,641 |
| | | | | |
| Broadcasting – 3.0% | | | | | |
| Antena 3 de Television S.A. (l) | | 72,224 | | $ | 1,098,055 |
| Grupo Televisa S.A., ADR (l) | | 101,440 | | | 2,411,229 |
| WPP Group PLC | | 449,180 | | | 5,750,720 |
| | | | | |
| | | | $ | 9,260,004 |
| | | | | |
| Brokerage & Asset Managers – 1.3% | | | | | |
| EFG International | | 7,150 | | $ | 287,351 |
| Nomura Holdings, Inc. (l) | | 218,300 | | | 3,649,239 |
| | | | | |
| | | | $ | 3,936,590 |
| | | | | |
| Business Services – 2.4% | | | | | |
| Bunzl PLC | | 103,660 | | $ | 1,453,290 |
| Intertek Group PLC | | 91,900 | | | 1,801,785 |
| JFE Shoji Holdings, Inc. | | 95,000 | | | 606,867 |
| Mitsubishi Corp. | | 63,000 | | | 1,716,062 |
| Mitsui & Co. Ltd. | | 45,000 | | | 954,722 |
| Satyam Computer Services Ltd. | | 73,210 | | | 834,971 |
| | | | | |
| | | | $ | 7,367,697 |
| | | | | |
| Chemicals – 0.7% | | | | | |
| Makhteshim-Agan Industries Ltd. (a) | | 220,150 | | $ | 2,012,815 |
| | | | | |
| Computer Software – 1.2% | | | | | |
| SAP AG | | 48,560 | | $ | 2,508,938 |
| Trend Micro, Inc. (a) | | 36,000 | | | 1,288,994 |
| | | | | |
| | | | $ | 3,797,932 |
| | | | | |
| Computer Software – Systems – 0.2% | | | | | |
| HCL Technologies Ltd. | | 85,060 | | $ | 711,405 |
| | | | | |
| Conglomerates – 1.9% | | | | | |
| Siemens AG | | 38,470 | | $ | 6,039,378 |
| | | | | |
| Construction – 1.4% | | | | | |
| CRH PLC | | 48,540 | | $ | 1,685,341 |
| Geberit AG | | 20,593 | | | 2,807,529 |
| | | | | |
| | | | $ | 4,492,870 |
| | | | | |
| | | | | |
| Issuer | | Shares/Par | | Value ($) |
| | | | | |
| COMMON STOCKS – continued | | | | | |
| Consumer Goods & Services – 2.9% | | | | | |
| Henkel KGaA, IPS | | 36,420 | | $ | 2,041,533 |
| Kao Corp. | | 101,000 | | | 3,037,730 |
| Kimberly-Clark de Mexico S.A. de C.V., “A” | | 321,260 | | | 1,408,454 |
| Reckitt Benckiser Group PLC | | 45,220 | | | 2,612,310 |
| | | | | |
| | | | $ | 9,100,027 |
| | | | | |
| Electrical Equipment – 1.9% | | | | | |
| LS Industrial Systems Co. Ltd. (a) | | 12,520 | | $ | 740,334 |
| OMRON Corp. | | 101,100 | | | 2,392,981 |
| Schneider Electric S.A. (l) | | 21,694 | | | 2,900,746 |
| | | | | |
| | | | $ | 6,034,061 |
| | | | | |
| Electronics – 4.4% | | | | | |
| ARM Holdings PLC | | 525,920 | | $ | 1,289,294 |
| Funai Electric Co. Ltd. | | 18,500 | | | 798,855 |
| Konica Minolta Holdings, Inc. | | 54,000 | | | 950,451 |
| Nippon Electric Glass Co. Ltd. | | 55,000 | | | 893,303 |
| Ricoh Co. Ltd. | | 136,000 | | | 2,501,310 |
| Royal Philips Electronics N.V. | | 68,870 | | | 2,984,677 |
| Samsung Electronics Co. Ltd. | | 3,212 | | | 1,887,888 |
Taiwan Semiconductor Manufacturing
Co. Ltd. | | 637,000 | | | 1,211,493 |
| Venture Corp. Ltd. | | 143,000 | | | 1,252,201 |
| | | | | |
| | | | $ | 13,769,472 |
| | | | | |
| Energy – Independent – 1.5% | | | | | |
| INPEX Holdings, Inc. | | 173 | | $ | 1,860,932 |
| OMV AG | | 14,560 | | | 1,171,577 |
| PTT Public Co. Ltd. | | 134,600 | | | 1,502,437 |
| | | | | |
| | | | $ | 4,534,946 |
| | | | | |
| Energy – Integrated – 7.6% | | | | | |
| OAO Gazprom, ADR | | 45,430 | | $ | 2,558,247 |
| Petroleo Brasileiro S.A., ADR | | 18,580 | | | 2,141,159 |
| Royal Dutch Shell PLC, “A” | | 183,460 | | | 7,728,782 |
| Statoil A.S.A. | | 111,950 | | | 3,461,405 |
| TOTAL S.A. | | 93,440 | | | 7,754,549 |
| | | | | |
| | | | $ | 23,644,142 |
| | | | | |
| Food & Beverages – 2.7% | | | | | |
| Nestle S.A. | | 16,763 | | $ | 7,681,035 |
| Nong Shim Co. Ltd. (a) | | 2,660 | | | 550,673 |
| | | | | |
| | | | $ | 8,231,708 |
| | | | | |
| Insurance – 2.3% | | | | | |
| AXA (l) | | 126,380 | | $ | 5,031,989 |
| Old Mutual PLC | | 650,110 | | | 2,155,493 |
| | | | | |
| | | | $ | 7,187,482 |
| | | | | |
| Internet – 0.2% | | | | | |
| Universo Online S.A., IPS (a) | | 101,900 | | $ | 680,188 |
| | | | | |
| Machinery & Tools – 3.1% | | | | | |
| Bucyrus International, Inc., “A” (l) | | 66,640 | | $ | 6,623,350 |
| KOMATSU Ltd. (l) | | 106,300 | | | 2,874,142 |
| | | | | |
| | | | $ | 9,497,492 |
| | | | | |
7
Portfolio of Investments – continued
| | | | | |
| Issuer | | Shares/Par | | Value ($) |
| | | | | |
| COMMON STOCKS – continued | | | | | |
| Major Banks – 14.4% | | | | | |
| Australia & New Zealand Banking Group Ltd. (l) | | 96,400 | | $ | 2,311,586 |
| Barclays PLC | | 423,170 | | | 4,286,518 |
| BNP Paribas | | 37,169 | | | 3,995,481 |
| BOC Hong Kong Holdings Ltd. | | 1,550,500 | | | 4,284,943 |
| Credit Agricole S.A. | | 143,768 | | | 4,822,804 |
| DBS Group Holdings Ltd. | | 178,000 | | | 2,522,555 |
| Deutsche Postbank AG | | 34,790 | | | 3,075,778 |
| Erste Bank der Oesterreichischen Sparkassen AG | | 41,636 | | | 2,959,273 |
| Royal Bank of Scotland Group PLC | | 537,543 | | | 4,832,584 |
| Standard Bank Group Ltd. | | 102,620 | | | 1,502,734 |
| Standard Chartered PLC | | 67,237 | | | 2,441,828 |
| Sumitomo Mitsui Financial Group, Inc. | | 358 | | | 2,663,922 |
| UniCredito Italiano S.p.A. | | 616,530 | | | 5,130,137 |
| | | | | |
| | | | $ | 44,830,143 |
| | | | | |
| Metals & Mining – 4.0% | | | | | |
| BHP Billiton PLC | | 226,900 | | $ | 6,982,775 |
| Companhia Vale do Rio Doce | | 65,700 | | | 2,147,692 |
| Steel Authority of India Ltd. | | 453,331 | | | 3,253,124 |
| | | | | |
| | | | $ | 12,383,591 |
| | | | | |
| Natural Gas – Distribution – 0.9% | | | | | |
| Gaz de France (l) | | 26,840 | | $ | 1,562,895 |
| Tokyo Gas Co. Ltd. | | 262,000 | | | 1,223,244 |
| | | | | |
| | | | $ | 2,786,139 |
| | | | | |
| Oil Services – 0.5% | | | | | |
| Saipem S.p.A. | | 37,430 | | $ | 1,488,168 |
| | | | | |
| Other Banks & Diversified Financials – 7.0% | | | |
| Aeon Credit Service Co. Ltd. | | 97,100 | | $ | 1,435,474 |
| Anglo Irish Bank Corp. PLC | | 116,020 | | | 1,848,982 |
| Bank of Cyprus Public Co. Ltd. | | 87,610 | | | 1,607,805 |
| CSU Cardsystem S.A. (a) | | 92,910 | | | 298,588 |
| First City Monument Bank PLC | | 1,952,690 | | | 312,695 |
| Fortis, Inc. (a) | | 67,750 | | | 991 |
| Fortis, Inc. | | 95,870 | | | 2,491,394 |
| Hana Financial Group, Inc. | | 41,490 | | | 2,245,967 |
| Macquarie Group Ltd. (l) | | 42,154 | | | 2,793,952 |
| ORIX Corp. | | 8,670 | | | 1,449,847 |
| UBS AG | | 85,508 | | | 3,970,941 |
| Unione di Banche Italiane Scpa | | 121,316 | | | 3,339,414 |
| | | | | |
| | | | $ | 21,796,050 |
| | | | | |
| Pharmaceuticals – 6.4% | | | | | |
| Astellas Pharma, Inc. | | 46,700 | | $ | 2,035,796 |
| Bayer AG | | 40,030 | | | 3,649,716 |
| Merck KGaA | | 31,000 | | | 3,982,236 |
| Novartis AG | | 100,200 | | | 5,458,719 |
| Roche Holding AG | | 27,770 | | | 4,783,420 |
| | | | | |
| | | | $ | 19,909,887 |
| | | | | |
| Precious Metals & Minerals – 0.4% | | | | | |
| Paladin Resources Ltd. (a)(l) | | 235,056 | | $ | 1,381,477 |
| | | | | |
| Railroad & Shipping – 1.0% | | | | | |
| East Japan Railway Co. | | 389 | | $ | 3,194,331 |
| | | | | |
| | | | | | | |
| Issuer | | Shares/Par | | Value ($) | |
| | | | | | | |
| COMMON STOCKS – continued | | | | | | | |
| Real Estate – 1.2% | | | | | | | |
| CapitaLand Ltd. | | | 597,000 | | $ | 2,566,862 | |
| Hypo Real Estate Holding AG (l) | | | 23,850 | | | 1,240,767 | |
| | | | | | | |
| | | | | $ | 3,807,629 | |
| | | | | | | |
| Specialty Chemicals – 3.0% | | | | | | | |
| Akzo Nobel N.V. | | | 24,400 | | $ | 1,943,073 | |
| Linde AG | | | 55,190 | | | 7,268,844 | |
| | | | | | | |
| | | | | $ | 9,211,917 | |
| | | | | | | |
| Specialty Stores – 0.8% | | | | | | | |
| Kingfisher PLC | | | 514,090 | | $ | 1,480,365 | |
| NEXT PLC | | | 35,240 | | | 1,130,329 | |
| | | | | | | |
| | | | | $ | 2,610,694 | |
| | | | | | | |
| Telecommunications – Wireless – 3.4% | | | | | | | |
| America Movil S.A.B. de C.V., “L”, ADR | | | 31,910 | | $ | 1,958,955 | |
| MTN Group Ltd. | | | 40,170 | | | 752,693 | |
| Philippine Long Distance Telephone Co. | | | 8,700 | | | 666,095 | |
| Rogers Communications, Inc., “B” | | | 21,150 | | | 964,120 | |
| Vodafone Group PLC | | | 1,667,470 | | | 6,214,682 | |
| | | | | | | |
| | | | | $ | 10,556,545 | |
| | | | | | | |
| Telephone Services – 3.0% | | | | | | | |
| Telefonica S.A. | | | 183,690 | | $ | 5,936,348 | |
| Telenor A.S.A. | | | 95,290 | | | 2,252,563 | |
| TELUS Corp. | | | 19,470 | | | 975,325 | |
| | | | | | | |
| | | | | $ | 9,164,236 | |
| | | | | | | |
| Trucking – 0.5% | | | | | | | |
| TNT N.V. | | | 33,870 | | $ | 1,409,418 | |
| Yamato Holdings Co. Ltd. | | | 11,000 | | | 158,627 | |
| | | | | | | |
| | | | | $ | 1,568,045 | |
| | | | | | | |
| Utilities – Electric Power – 3.6% | | | | | | | |
| E.ON AG | | | 43,710 | | $ | 9,280,762 | |
| SUEZ S.A. (a) | | | 28,591 | | | 1,938,046 | |
| | | | | | | |
| | | | | $ | 11,218,808 | |
| | | | | | | |
Total Common Stocks (Identified Cost, $260,755,128) | | | | | $ | 306,497,069 | |
| | | | | | | |
| | |
| SHORT-TERM OBLIGATIONS – 0.8% | | | | | | | |
American Express Credit Corp.,
4.12%, due 1/02/08, at
Amortized Cost and Value (y) | | $ | 2,308,000 | | $ | 2,307,736 | |
| | | | | | | |
| |
| COLLATERAL FOR SECURITIES LOANED – 10.8% | | | | |
| Navigator Securities Lending Prime Portfolio, at Cost and Net Asset Value | | | 33,473,417 | | $ | 33,473,417 | |
| | | | | | | |
Total Investments (Identified Cost, $296,536,281) (k) | | | | | $ | 342,278,222 | |
| | | | | | | |
OTHER ASSETS, LESS LIABILITIES – (10.2)% | | | | | | (31,544,254 | ) |
| | | | | | | |
| Net Assets – 100.0% | | | | | $ | 310,733,968 | |
| | | | | | | |
8
Portfolio of Investments – continued
| (a) | Non-income producing security. |
| (k) | As of December 31, 2007, the series had 26 securities that were fair valued, aggregating $39,920,760 and 11.66% of market value, in accordance with the policies adopted by the Board of Trustees. |
| (l) | All or a portion of this security is on loan. |
| (y) | The rate shown represents an annualized yield at time of purchase. |
The following abbreviations are used in this report and are defined:
| ADR | American Depository Receipt |
| IPS | International Preference Stock |
See Notes to Financial Statements
9
FINANCIAL STATEMENTS | STATEMENT OF ASSETS AND LIABILITIES
This statement represents your fund’s’ balance sheet, which details the assets and liabilities comprising the total value of the fund.
| | | | |
| At 12/31/07 | | | | |
| Assets | | | | |
| Investments, at value including $32,096,508 of securities on loan (identified cost, $296,536,281) | | $342,278,222 | | |
| Cash | | 1,472 | | |
| Foreign currency, at value (identified cost, $3,032,959) | | 3,045,780 | | |
| Receivable for investments sold | | 44,450 | | |
| Receivable for fund shares sold | | 2,421 | | |
| Interest and dividends receivable | | 329,546 | | |
| Other assets | | 10,130 | | |
| Total assets | | | | $345,712,021 |
| Liabilities | | | | |
| Payable for investments purchased | | $803,620 | | |
| Payable for fund shares reacquired | | 189,626 | | |
| Collateral for securities loaned, at value (c) | | 33,473,417 | | |
| Payable to affiliates | | | | |
Management fee | | 30,693 | | |
Distribution fees | | 5,549 | | |
Administrative services fee | | 797 | | |
| Payable for independent trustees’ compensation | | 628 | | |
| Accrued expenses and other liabilities | | 473,723 | | |
| Total liabilities | | | | $34,978,053 |
| Net assets | | | | $310,733,968 |
| Net assets consist of | | | | |
| Paid-in capital | | $227,808,351 | | |
Unrealized appreciation (depreciation) on investments and translation of assets and liabilities in foreign currencies
(net of $409,212 deferred country tax) | | 45,344,837 | | |
| Accumulated net realized gain (loss) on investments and foreign currency transactions | | 33,812,139 | | |
| Undistributed net investment income | | 3,768,641 | | |
| Net assets | | | | $310,733,968 |
| Shares of beneficial interest outstanding | | | | 15,709,808 |
| Initial Class shares | | | | |
Net assets | | $108,166,956 | | |
Shares outstanding | | 5,429,739 | | |
Net asset value per share | | | | $19.92 |
| Service Class shares | | | | |
Net assets | | $202,567,012 | | |
Shares outstanding | | 10,280,069 | | |
Net asset value per share | | | | $19.70 |
| (c) | Non-cash collateral not included. |
See Notes to Financial Statements
10
FINANCIAL STATEMENTS | STATEMENT OF OPERATIONS
This statement describes how much your fund earned in investment income and accrued in expenses. It also describes any gains and/or losses generated by fund operations.
| | | | | | |
| Year ended 12/31/07 | | | | | | |
| Net investment income | | | | | | |
| Income | | | | | | |
Dividends | | $8,036,456 | | | | |
Income on securities loaned | | 276,357 | | | | |
Interest | | 70,773 | | | | |
Foreign taxes withheld | | (682,975 | ) | | | |
| Total investment income | | | | | $7,700,611 | |
| Expenses | | | | | | |
Management fee | | $2,738,828 | | | | |
Distribution fees | | 464,562 | | | | |
Administrative services fee | | 79,719 | | | | |
Independent trustees’ compensation | | 25,944 | | | | |
Custodian fee | | 267,379 | | | | |
Shareholder communications | | 28,352 | | | | |
Auditing fees | | 48,320 | | | | |
Legal fees | | 5,950 | | | | |
Miscellaneous | | 39,400 | | | | |
| Total expenses | | | | | $3,698,454 | |
Fees paid indirectly | | (1,712 | ) | | | |
| Net expenses | | | | | $3,696,742 | |
| Net investment income | | | | | $4,003,869 | |
| Realized and unrealized gain (loss) on investments and foreign currency transactions | | | | | | |
| Realized gain (loss) (identified cost basis) | | | | | | |
Investment transactions (net of $139,261 country tax) | | $34,891,582 | | | | |
Foreign currency transactions | | (145,123 | ) | | | |
| Net realized gain (loss) on investments and foreign currency transactions | | | | | $34,746,459 | |
| Change in unrealized appreciation (depreciation) | | | | | | |
Investments (net of $400,452 increase in deferred country tax) | | $(2,106,559 | ) | | | |
Translation of assets and liabilities in foreign currencies | | 11,559 | | | | |
| Net unrealized gain (loss) on investments and foreign currency translation | | | | | $(2,095,000 | ) |
| Net realized and unrealized gain (loss) on investments and foreign currency | | | | | $32,651,459 | |
| Change in net assets from operations | | | | | $36,655,328 | |
See Notes to Financial Statements
11
FINANCIAL STATEMENTS | STATEMENTS OF CHANGES IN NET ASSETS
These statements describe the increases and/or decreases in net assets resulting from operations, any distributions, and any shareholder transactions.
| | | | | | |
| For years ended 12/31 | | 2007 | | | 2006 | |
| Change in net assets | | | | | | |
| From operations | | | | | | |
| Net investment income | | $4,003,869 | | | $2,439,036 | |
| Net realized gain (loss) on investments and foreign currency transactions | | 34,746,459 | | | 33,889,501 | |
| Net unrealized gain (loss) on investments and foreign currency translation | | (2,095,000 | ) | | 18,896,075 | |
| Change in net assets from operations | | $36,655,328 | | | $55,224,612 | |
| Distributions declared to shareholders | | | | | | |
| From net investment income | | | | | | |
Initial Class | | $(1,348,290 | ) | | $(1,271,028 | ) |
Service class | | (1,714,493 | ) | | (1,111,844 | ) |
| From net realized gain on investments | | | | | | |
Initial Class | | (13,244,493 | ) | | (6,698,659 | ) |
Service class | | (19,773,948 | ) | | (6,785,735 | ) |
| Total distributions declared to shareholders | | $(36,081,224 | ) | | $(15,867,266 | ) |
| Change in net assets from fund share transactions | | $34,657,431 | | | $50,317,686 | |
| Total change in net assets | | $35,231,535 | | | $89,675,032 | |
| Net assets | | | | | | |
| At beginning of period | | 275,502,433 | | | 185,827,401 | |
At end of period (including undistributed net investment income of $3,768,641 and
$2,361,514, respectively) | | $310,733,968 | | | $275,502,433 | |
See Notes to Financial Statements
12
FINANCIAL STATEMENTS | FINANCIAL HIGHLIGHTS
The financial highlights table is intended to help you understand the fund’s financial performance for the past 5 years. Certain information reflects financial results for a single fund share. The total returns in the table represent the rate by which an investor would have earned (or lost) on an investment in the fund share class (assuming reinvestment of all distributions) held for the entire period.
Initial Class
| | | | | | | | | | | | | | | |
| | | Years ended 12/31 | |
| | | 2007 | | | 2006 | | | 2005 | | | 2004 | | | 2003 | |
| Net asset value, beginning of period | | $19.94 | | | $16.74 | | | $14.48 | | | $12.01 | | | $9.03 | |
| Income (loss) from investment operations | | | | | | | | | | | | | | | |
| Net investment income (d) | | $0.30 | | | $0.22 | | | $0.17 | | | $0.14 | | | $0.08 | |
Net realized and unrealized gain (loss) on investments
and foreign currency | | 2.21 | | | 4.30 | | | 2.21 | | | 2.39 | | | 2.96 | |
| Total from investment operations | | $2.51 | | | $4.52 | | | $2.38 | | | $2.53 | | | $3.04 | |
| Less distributions declared to shareholders | | | | | | | | | | | | | | | |
| From net investment income | | $(0.23 | ) | | $(0.21 | ) | | $(0.12 | ) | | $(0.06 | ) | | $(0.06 | ) |
From net realized gain on investments and
foreign currency transactions | | (2.30 | ) | | (1.11 | ) | | — | | | — | | | — | |
| Total distributions declared to shareholders | | $(2.53 | ) | | $(1.32 | ) | | $(0.12 | ) | | $(0.06 | ) | | $(0.06 | ) |
| Net asset value, end of period | | $19.92 | | | $19.94 | | | $16.74 | | | $14.48 | | | $12.01 | |
| Total return (%) (k)(s) | | 13.15 | | | 27.47 | | | 16.56 | | | 21.20 | | | 33.86 | |
Ratios (%) (to average net assets)
and Supplemental data: | | | | | | | | | | | | | | | |
| Expenses (f) | | 1.06 | | | 1.13 | | | 1.12 | | | 1.10 | | | 1.30 | |
| Net investment income | | 1.51 | | | 1.23 | | | 1.11 | | | 1.11 | | | 0.83 | |
| Portfolio turnover | | 68 | | | 80 | | | 83 | | | 102 | | | 97 | |
| Net assets at end of period (000 Omitted) | | $108,167 | | | $119,534 | | | $95,752 | | | $86,526 | | | $74,262 | |
See Notes to Financial Statements
13
Financial Highlights – continued
Service Class
| | | | | | | | | | | | | | | |
| | | Years ended 12/31 | |
| | | 2007 | | | 2006 | | | 2005 | | | 2004 | | | 2003 | |
| Net asset value, beginning of period | | $19.77 | | | $16.61 | | | $14.39 | | | $11.95 | | | $9.00 | |
| Net investment income (d) | | $0.23 | | | $0.16 | | | $0.12 | | | $0.10 | | | $0.03 | |
Net realized and unrealized gain (loss) on investments and foreign currency | | 2.20 | | | 4.29 | | | 2.19 | | | 2.39 | | | 2.96 | |
| Total from investment operations | | $2.43 | | | $4.45 | | | $2.31 | | | $2.49 | | | $2.99 | |
| Less distributions declared to shareholders | | | | | | | | | | | | | | | |
| From net investment income | | $(0.20 | ) | | $(0.18 | ) | | $(0.09 | ) | | $(0.05 | ) | | $(0.04 | ) |
From net realized gain on investments and
foreign currency transactions | | (2.30 | ) | | (1.11 | ) | | — | | | — | | | — | |
| Total distributions declared to shareholders | | $(2.50 | ) | | $(1.29 | ) | | $(0.09 | ) | | $(0.05 | ) | | $(0.04 | ) |
| Net asset value, end of period | | $19.70 | | | $19.77 | | | $16.61 | | | $14.39 | | | $11.95 | |
| Total return (%) (k)(s) | | 12.81 | | | 27.25 | | | 16.19 | | | 20.96 | | | 33.40 | |
Ratios (%) (to average net assets)
and Supplemental data: | | | | | | | | | | | | | | | |
| Expenses (f) | | 1.31 | | | 1.38 | | | 1.37 | | | 1.36 | | | 1.57 | |
| Net investment income | | 1.19 | | | 0.89 | | | 0.78 | | | 0.78 | | | 0.33 | |
| Portfolio turnover | | 68 | | | 80 | | | 83 | | | 102 | | | 97 | |
| Net assets at end of period (000 Omitted) | | $202,567 | | | $155,969 | | | $90,076 | | | $61,087 | | | $27,282 | |
| (d) | Per share data are based on average shares outstanding. |
| (f) | Ratios do not reflect reductions from fees paid indirectly, if applicable. |
| (k) | The total return does not reflect expenses that apply to separate accounts. Inclusion of these charges would reduce the total return figures for all periods shown. |
| (s) | From time to time the fund may receive proceeds from litigation settlements, without which performance would be lower. |
See Notes to Financial Statements
14
NOTES TO FINANCIAL STATEMENTS
| (1) | | Business and Organization |
MFS Research International Portfolio (formerly Research International Series) (the fund) is a series of MFS Variable Insurance Trust II (formerly known as MFS/Sun Life Series Trust) (the trust). The trust is organized as a Massachusetts business trust and is registered under the Investment Company Act of 1940, as amended, as an open-end management investment company. The shares of the fund are sold to variable accounts established by insurance companies to fund benefits under variable contracts issued by such companies, and qualified retirement and pension plans.
| (2) | | Significant Accounting Policies |
General – The preparation of financial statements in conformity with U.S. generally accepted accounting principles requires management to make estimates and assumptions that affect the reported amounts of assets and liabilities, and disclosure of contingent assets and liabilities at the date of the financial statements and the reported amounts of revenues and expenses during the reporting period. Actual results could differ from those estimates. The fund can invest in foreign securities, including securities of emerging market issuers. Investments in foreign securities are vulnerable to the effects of changes in the relative values of the local currency and the U.S. dollar and to the effects of changes in each country’s legal, political, and economic environment. The markets of emerging markets countries are generally more volatile than the markets of developed countries with more mature economies. All of the risks of investing in foreign securities previously described are heightened when investing in emerging markets countries.
Investment Valuations – Equity securities, including restricted equity securities, are generally valued at the last sale or official closing price as reported by an independent pricing service on the market or exchange on which they are primarily traded. For securities for which there were no sales reported that day, equity securities are generally valued at the last quoted daily bid quotation as reported by an independent pricing service on the market or exchange on which they are primarily traded. For securities held short for which there were no sales reported for the day, the position is generally valued at the last quoted daily ask quotation as reported by an independent pricing service on the market or exchange on which such securities are primarily traded. Short-term instruments with a maturity at issuance of 60 days or less may be valued at amortized cost, which approximates market value. Securities and other assets generally valued on the basis of information from an independent pricing service may also be valued at a broker-dealer bid quotation. The values of foreign securities and other assets and liabilities expressed in foreign currencies are converted to U.S. dollars using the mean of bid and asked prices for rates reported by an independent pricing service.
The Board of Trustees has delegated primary responsibility for determining or causing to be determined the value of the fund’s investments (including any fair valuation) to the adviser pursuant to valuation policies and procedures approved by the Board. If the adviser determines that reliable market quotations are not readily available, investments are valued at fair value as determined in good faith by the adviser in accordance with such procedures under the oversight of the Board of Trustees. Under the fund’s valuation policies and procedures, market quotations are not considered to be readily available for many types of debt instruments and certain types of derivatives. These investments are generally valued at fair value based on information from independent pricing services. In addition, investments may be valued at fair value if the adviser determines that an investment’s value has been materially affected by events occurring after the close of the exchange or market on which the investment is principally traded (such as foreign exchange or market) and prior to the determination of the fund’s net asset value, or after the halting of trading of a specific security where trading does not resume prior to the close of the exchange or market on which the security is principally traded. Events that occur on a frequent basis after foreign markets close (such as developments in foreign markets and significant movements in the U.S. markets) and prior to the determination of the fund’s net asset value may be deemed to have a material affect on the value of securities traded in foreign markets. Accordingly, the fund’s foreign equity securities may often be valued at fair value. The adviser may rely on independent pricing services or other information (such as the correlation with price movements of similar securities in the same or other markets; the type, cost and investment characteristics of the security; the business and financial condition of the issuer; and trading and other market data) to assist in determining whether to fair value and at what value to fair value an investment. The value of an investment for purposes of calculating the fund’s net asset value can differ depending on the source and method used to determine value. When fair valuation is used, the value of investments used to determine the fund’s net asset value may differ from quoted or published prices for the same investments.
In September 2006, FASB Statement No. 157, Fair Value Measurements (the “Statement”) was issued, and is effective for fiscal years beginning after November 15, 2007 and for all interim periods within those fiscal years. This Statement provides a single definition of fair value, a hierarchy for measuring fair value and expanded disclosures about fair value measurements. Management is evaluating the application of the Statement to the fund, and believes the impact will be limited to expanded disclosures resulting from the adoption of this Statement in the fund’s financial statements.
15
Notes to Financial Statements – continued
Repurchase Agreements – The fund may enter into repurchase agreements with institutions that the fund’s investment adviser has determined are creditworthy. Each repurchase agreement is recorded at cost. The fund requires that the securities collateral in a repurchase transaction be transferred to the custodian in a manner sufficient to enable the fund to obtain those securities in the event of a default under the repurchase agreement. The fund monitors, on a daily basis, the value of the collateral to ensure that its value, including accrued interest, is greater than amounts owed to the fund under each such repurchase agreement. The fund and other funds managed by Massachusetts Financial Services Company (MFS), may utilize a joint trading account for the purpose of entering into one or more repurchase agreements.
Foreign Currency Translation – Purchases and sales of foreign investments, income, and expenses are converted into U.S. dollars based upon currency exchange rates prevailing on the respective dates of such transactions. Gains and losses attributable to foreign currency exchange rates on sales of securities are recorded for financial statement purposes as net realized gains and losses on investments. Gains and losses attributable to foreign exchange rate movements on income and expenses are recorded for financial statement purposes as foreign currency transaction gains and losses. That portion of both realized and unrealized gains and losses on investments that results from fluctuations in foreign currency exchange rates is not separately disclosed.
Security Loans – State Street Bank and Trust Company (“State Street”), as lending agent, may loan the securities of the fund to certain qualified institutions (the “Borrowers”) approved by the fund. The loans are collateralized at all times by cash and/or U.S. Treasury securities in an amount at least equal to the market value of the securities loaned. State Street provides the fund with indemnification against Borrower default. The fund bears the risk of loss with respect to the investment of cash collateral. On loans collateralized by cash, the cash collateral is invested in a money market fund or short-term securities. A portion of the income generated upon investment of the collateral is remitted to the Borrowers, and the remainder is allocated between the fund and the lending agent. On loans collateralized by U.S. Treasury securities, a fee is received from the Borrower, and is allocated between the fund and the lending agent. The dividend and interest income earned on the securities loaned is accounted for in the same manner as other dividend and interest income.
At December 31, 2007, the value of securities loaned was $32,096,508. These loans were collateralized by cash of $33,473,417 and U.S. Treasury obligations of $2,167.
Indemnifications – Under the fund’s organizational documents, its officers and trustees may be indemnified against certain liabilities and expenses arising out of the performance of their duties to the fund. Additionally, in the normal course of business, the fund enters into agreements with service providers that may contain indemnification clauses. The fund’s maximum exposure under these agreements is unknown as this would involve future claims that may be made against the fund that have not yet occurred.
Investment Transactions and Income – Investment transactions are recorded on the trade date. Interest income is recorded on the accrual basis. All premium and discount is amortized or accreted for financial statement purposes in accordance with U.S. generally accepted accounting principles. All discount is accreted for tax reporting purposes as required by federal income tax regulations. Dividends received in cash are recorded on the ex-dividend date. Certain dividends from foreign securities will be recorded when the fund is informed of the dividend if such information is obtained subsequent to the ex-dividend date. Dividend and interest payments received in additional securities are recorded on the ex-dividend or ex-interest date in an amount equal to the value of the security on such date.
The fund may receive proceeds from litigation settlements. Any proceeds received from litigation involving portfolio holdings are reflected in the Statement of Operations in realized gain/loss if the security has been disposed of by the fund or in unrealized gain/loss if the security is still held by the fund. Any other proceeds from litigation not related to portfolio holdings are reflected as other income in the Statement of Operations.
Fees Paid Indirectly – The fund’s custody fee may be reduced according to an arrangement that measures the value of cash deposited with the custodian by the fund. This amount, for the year ended December 31, 2007, is shown as a reduction of total expenses on the Statement of Operations.
Tax Matters and Distributions – The fund intends to qualify as a regulated investment company, as defined under Subchapter M of the Internal Revenue Code, and to distribute all of its taxable income, including realized capital gains. As a result, no provision for federal income tax is required. The fund adopted the provisions of FASB Interpretation No. 48, Accounting for Uncertainty in Income Taxes (“the Interpretation”) on January 1, 2007. The Interpretation prescribes a minimum threshold for financial statement recognition of the benefit of a tax position taken or expected to be taken in a tax return. There was no impact resulting from the adoption of this Interpretation on the fund’s financial statements. Each of the fund’s federal tax returns for the prior three fiscal years remains subject to examination by the Internal Revenue Service. It is the fund’s policy to record interest and penalty charges on underpaid taxes associated with its tax positions as interest expense and other expense, respectively. No such charges were recorded in the current financial statements. Foreign taxes, if any, have been accrued by the fund in the accompanying financial statements.
16
Notes to Financial Statements – continued
Distributions to shareholders are recorded on the ex-dividend date. Income and capital gain distributions are determined in accordance with income tax regulations, which may differ from U.S. generally accepted accounting principles. Certain capital accounts in the financial statements are periodically adjusted for permanent differences in order to reflect their tax character. These adjustments have no impact on net assets or net asset value per share. Temporary differences which arise from recognizing certain items of income, expense, gain or loss in different periods for financial statement and tax purposes will reverse at some time in the future. Distributions in excess of net investment income or net realized gains are temporary overdistributions for financial statement purposes resulting from differences in the recognition or classification of income or distributions for financial statement and tax purposes.
Book/tax differences primarily relate to passive foreign investment companies, wash sale loss deferrals and foreign currency transactions.
The tax character of distributions declared to shareholders is as follows:
| | | | |
| | | 12/31/07 | | 12/31/06 |
| Ordinary income (including any short-term capital gains) | | $16,507,896 | | $4,590,713 |
| Long-term capital gain | | 19,573,328 | | 11,276,553 |
| Total distributions | | $36,081,224 | | $15,867,266 |
The federal tax cost and the tax basis components of distributable earnings were as follows:
| | | |
| As of 12/31/07 | | | |
| Cost of investments | | $297,510,738 | |
| Gross appreciation | | 55,213,968 | |
| Gross depreciation | | (10,446,484 | ) |
| Net unrealized appreciation (depreciation) | | $44,767,484 | |
| |
| Undistributed ordinary income | | $14,454,258 | |
| Undistributed long-term capital gain | | 24,126,380 | |
| Other temporary differences | | (422,505 | ) |
Multiple Classes of Shares of Beneficial Interest – The fund offers multiple classes of shares, which differ in their respective distribution fees. All shareholders bear the common expenses of the fund based on daily net assets of each class, without distinction between share classes. Dividends are declared separately for each class. Differences in per share dividend rates are generally due to differences in separate class expenses.
| (3) | | Transactions with Affiliates |
Investment Adviser – The fund has an investment advisory agreement with MFS to provide overall investment management and related administrative services and facilities to the fund. The management fee is computed daily and paid monthly at the following annual rates:
| | |
| First $1 billion of average daily net assets | | 0.90% |
| Next $1 billion of average daily net assets | | 0.80% |
| Average daily net assets in excess of $2 billion | | 0.70% |
The management fee incurred for the year ended December 31, 2007 was equivalent to an annual effective rate of 0.90% of the fund’s average net assets.
Effective September 1, 2007 the investment adviser has agreed in writing to pay a portion of the fund’s operating expenses, exclusive of certain other fees and expenses, such that total annual fund operating expenses do not exceed 1.10% for the Initial Class shares and 1.35% for the Service Class shares, based on the average daily net assets of each share class. This written agreement will continue through August 31, 2008 unless changed or rescinded by the fund’s Board of Trustees. For the year ended December 31, 2007, the fund’s actual operating expenses did not exceed the limit and therefore, the investment adviser did not pay any portion of the fund’s expenses.
Distributor – MFS Fund Distributors, Inc. (MFD), a wholly-owned subsidiary of MFS, is the distributor of shares of the fund. The Trustees have adopted a distribution plan for the Service Class shares pursuant to Rule 12b-1 under the Investment Company Act of 1940.
The fund’s distribution plan provides that the fund will pay MFD distribution fees equal to 0.25% per annum of its average daily net assets attributable to Service Class shares as partial consideration for services performed and expenses incurred by MFD and financial intermediaries in connection with the sale and distribution of the fund’s Service Class shares and the sale and distribution of the variable annuity or variable life insurance contracts investing indirectly in Service Class shares. MFD may subsequently pay all, or a portion, of the distribution fees to financial intermediaries.
Shareholder Servicing Agent – MFS Service Center, Inc. (MFSC), a wholly-owned subsidiary of MFS, has contracted to provide transfer agent and recordkeeping functions in connection with the issuance, transfer, and redemption of each class of shares of
17
Notes to Financial Statements – continued
the fund under a Shareholder Servicing Agent Agreement. During the year ended December 31, 2007, MFSC did not receive a fee for this service.
Administrator – MFS provides certain financial, legal, shareholder communications, compliance, and other administrative services to the fund. Under an administrative services agreement, the fund partially reimburses MFS the costs incurred to provide these services. The fund is charged an annual fixed amount of $10,000 plus a fee based on average daily net assets.
The administrative services fee incurred for the year ended December 31, 2007 was equivalent to an annual effective rate of 0.0262% of the fund’s average daily net assets.
Trustees’ and Officers’ Compensation – The fund pays compensation to trustees in the form of a retainer, attendance fees, and additional compensation to the Board and Committee chairperson. The fund does not pay compensation directly to officers of the fund who are also officers of the investment adviser, all of whom receive remuneration for their services to the fund from MFS. Certain officers of the fund are officers or directors of MFS, MFD, and MFSC.
Other – This fund and certain other MFS funds (the funds) have entered into a services agreement (the Agreement) which provides for payment of fees by the funds to Tarantino LLC in return for the provision of services of an Independent Chief Compliance Officer (ICCO) for the funds. The ICCO is an officer of the funds and the sole member of Tarantino LLC. The funds can terminate the Agreement with Tarantino LLC at any time under the terms of the Agreement. MFS has agreed to bear all expenses associated with office space, other administrative support, and supplies provided to the ICCO. For the year ended December 31, 2007, the fee paid to Tarantino LLC was $1,526.
Purchases and sales of investments, other than U.S. government securities, purchased option transactions, and short-term obligations, aggregated $207,436,576 and $206,265,823, respectively.
| (5) | | Shares of Beneficial Interest |
The fund’s Declaration of Trust permits the Trustees to issue an unlimited number of full and fractional shares of beneficial interest. Transactions in fund shares were as follows:
| | | | | | | | | | | | |
| | | Year ended 12/31/07 | | | Year ended 12/31/06 | |
| | | Shares | | | Amount | | | Shares | | | Amount | |
| Shares sold | | | | | | | | | | | | |
Initial Class | | 259,829 | | | $5,250,023 | | | 724,258 | | | $13,183,034 | |
Service Class | | 1,993,622 | | | 39,073,516 | | | 2,578,912 | | | 46,665,150 | |
| | 2,253,451 | | | $44,323,539 | | | 3,303,170 | | | $59,848,184 | |
| Shares issued to shareholders in reinvestment of distributions | | | | | | | | | | | | |
Initial Class | | 765,222 | | | $14,592,782 | | | 423,469 | | | $7,969,687 | |
Service Class | | 1,137,556 | | | 21,488,442 | | | 422,783 | | | 7,897,579 | |
| | 1,902,778 | | | $36,081,224 | | | 846,252 | | | $15,867,266 | |
| Shares reacquired | | | | | | | | | | | | |
Initial Class | | (1,589,072 | ) | | $(31,360,976 | ) | | (874,788 | ) | | $(15,901,318 | ) |
Service Class | | (742,158 | ) | | (14,386,356 | ) | | (532,402 | ) | | (9,496,446 | ) |
| | (2,331,230 | ) | | $(45,747,332 | ) | | (1,407,190 | ) | | $(25,397,764 | ) |
| Net change | | | | | | | | | | | | |
Initial Class | | (564,021 | ) | | $(11,518,171 | ) | | 272,939 | | | $5,251,403 | |
Service Class | | 2,389,020 | | | 46,175,602 | | | 2,469,293 | | | 45,066,283 | |
| | 1,824,999 | | | $34,657,431 | | | 2,742,232 | | | $50,317,686 | |
The fund and other funds managed by MFS participate in a $1 billion unsecured committed line of credit provided by a syndication of banks under a credit agreement. In addition, the fund and other funds managed by MFS have established uncommitted borrowing arrangements with certain banks. Borrowings may be made for temporary financing needs. Interest is charged to each fund, based on its borrowings, generally at a rate equal to the Federal Reserve funds rate plus 0.30%. In addition, a commitment fee, based on the average daily, unused portion of the committed line of credit, is allocated among the participating funds at the end of each calendar quarter. For the year ended December 31, 2007, the fund’s commitment fee and interest expense were $1,452 and $7,724, respectively, and are included in miscellaneous expense on the Statement of Operations.
18
REPORT OF INDEPENDENT REGISTERED PUBLIC ACCOUNTING FIRM
To the Board of Trustees of MFS Variable Insurance Trust II (formerly known as MFS/Sun Life Series Trust) and the Shareholders of MFS Research International Portfolio (formerly known as Research International Series):
We have audited the accompanying statement of assets and liabilities, including the portfolio of investments, of MFS Research International Portfolio (one of the portfolios comprising MFS Variable Insurance Trust II) (the “Trust”) as of December 31, 2007, and the related statement of operations for the year then ended, the statements of changes in net assets for each of the two years in the period then ended, and the financial highlights for each of the five years in the period then ended. These financial statements and financial highlights are the responsibility of the Trust’s management. Our responsibility is to express an opinion on these financial statements and financial highlights based on our audits.
We conducted our audits in accordance with the standards of the Public Company Accounting Oversight Board (United States). Those standards require that we plan and perform the audit to obtain reasonable assurance about whether the financial statements and financial highlights are free of material misstatement. The Trust is not required to have, nor were we engaged to perform, an audit of its internal control over financial reporting. Our audits included consideration of internal control over financial reporting as a basis for designing audit procedures that are appropriate in the circumstances, but not for the purpose of expressing an opinion on the effectiveness of the Trust’s internal control over financial reporting. Accordingly, we express no such opinion. An audit also includes examining, on a test basis, evidence supporting the amounts and disclosures in the financial statements, assessing the accounting principles used and significant estimates made by management, as well as evaluating the overall financial statement presentation. Our procedures included confirmation of securities owned as of December 31, 2007, by correspondence with the custodian and brokers; where replies were not received from brokers, we performed other auditing procedures. We believe that our audits provide a reasonable basis for our opinion.
In our opinion, such financial statements and financial highlights present fairly, in all material respects, the financial position of MFS Research International Portfolio as of December 31, 2007, the results of its operations for the year then ended, the changes in its net assets for each of the two years in the period then ended, and its financial highlights for each of the five years in the period then ended, in conformity with accounting principles generally accepted in the United States of America.
DELOITTE & TOUCHE LLP
Boston, Massachusetts
February 15, 2008
19
TRUSTEES AND OFFICERS – IDENTIFICATION AND BACKGROUND
The Trustees and officers of the Trust, as of February 1, 2008, are listed below, together with their principal occupations during the past five years. (Their titles may have varied during that period.) The address of each Trustee and officer is 500 Boylston Street, Boston, Massachusetts 02116.
| | | | | | |
Name, Date of Birth | | Position(s) Held
with Fund | | Trustee/Officer
Since(1) | | Principal Occupations During the Past Five Years &
Other Directorships(2) |
| INTERESTED TRUSTEE | | | | | | |
David D. Horn(3) (born 06/07/41) | | Trustee | | April 1986 | | Private investor; Retired; Sun Life Assurance Company of Canada, Former Senior Vice President and General Manager for the United States (until 1997); Retired: Sun Life Assurance Company of Canada, Director (until March 2004) |
| | |
| INDEPENDENT TRUSTEES | | | | |
J. Kermit Birchfield (born 01/08/40) | | Chairman | | May 1997 | | Consultant; Century Partners, Inc. (investments), Director (1988 to present); Displaytech, Inc. (technology), Director (1995 to present); Dessin Fournir LLC (furniture manufacturer), Director (2005 to present); Intermountain Gas Company, Inc. & Intermountain Industries, Inc. (oil & gas exploration and production) (1988 to present); Site Watch LLC (software to monitor oil tanks) Managing Director (2006 to present); Juridica Investments (fund investing in judicial matters) Director (2007 to present); Dairy Mart Convenience Stores, Inc. (convenience stores), Chairman (1997 to 2003) |
| | | |
Robert C. Bishop (born 01/13/43) | | Trustee | | May 2001 | | Autolmmune Inc. (pharmaceutical product licensing), Chairman, President and Chief Executive Officer (1992 to present); Caliper Life Sciences Corp. (laboratory analytical instruments), Director (2002 to present); Millipore Corporation (biopharmaceutical/research laboratory products), Director (1997 to present); Optobionics Corporation (ophthalmic devices), Director (2002 to 2007); Quintiles Transnational Corp. (contract research services), Director (until 2003) |
| | | |
Frederick H. Dulles (born 03/12/42) | | Trustee | | May 2001 | | Ten State International Law PLLC (law firm), Of Counsel (since 2006); Prudential Carolina Real Estate, (real estate), Broker (since 2006); Free Enterprise Foundation, Inc. (research institute), Director & Secretary (until 2008); Disher, Hamrick & Myers Residential, Inc. (real estate) Broker (until 2006); Frederick H. Dulles law practice (until 2006); Ten State Street LLP (law firm), Member (until 2005); McFadden, Pilkington & Ward LLP (solicitors and registered foreign lawyers), Member & Of Counsel (until 2003) |
| | | |
Marcia A. Kean (born 06/30/48) | | Trustee | | April 2005 | | Feinstein Kean Healthcare (consulting), Chief Executive Officer (since December 2002), Managing Director (prior to May 2001); Ardais Corporation (biotech products), Senior Vice President – Commercialization (February 2002 until November 2002) |
| | | |
Ronald G. Steinhart (born 06/15/40) | | Trustee | | May 2001 | | Private investor; Penske Automotive Group (automotive retailer), Director (2001 to present); Penson Worldwide, Inc. (securities clearance), Director (2006 to present); Animal Health International, Inc. (animal health products), Director (2007 to present); Texas Industries (concrete/aggregates/cement), Director (2007 to present); Carreker Corporation (technology consulting) Director (until 2005); Prentiss Properties Trust (real estate investment trust), Director (until 2006) |
| | | |
Haviland Wright (born 07/21/48) | | Trustee | | May 2001 | | Elixir Technologies Corporation (software) Director (2005 to present); Nano Loa Inc. (liquid crystal displays), Director (2003 to present); Silk Displays, Inc. (smart polymers) Director (2007 to present); Displaytech, Inc. (technology) Chairman and CEO (1995 – 2002) |
| | | |
| TRUSTEE EMERITUS | | | | | | |
Samuel Adams (born 10/19/25) | | Trustee Emeritus | | | | Retired; Kirkpatrick & Lockhart Preston Gates Ellis LLP (law firm), Of Counsel |
| | | |
| OFFICERS | | | | | | |
Maria F. Dwyer(4) (born 12/01/58) | | President | | November 2005 | | Massachusetts Financial Services Company, Executive Vice President and Chief Regulatory Officer (since March 2004); Fidelity Management & Research Company, Vice President (prior to March 2004); Fidelity Group of Funds, President and Treasurer (prior to March 2004) |
| | | |
Tracy Atkinson(4) (born 12/30/64) | | Treasurer | | September 2005 | | Massachusetts Financial Services Company, Senior Vice President (since September 2004); PricewaterhouseCoopers LLP, Partner (prior to September 2004) |
| | | |
Christopher R. Bohane(4) (born 01/18/74) | | Assistant Secretary and Assistant Clerk | | July 2005 | | Massachusetts Financial Services Company, Vice President and Senior Counsel (since April 2003); Kirkpatrick & Lockhart LLP (law firm), Associate (prior to April 2003) |
20
Trustees and Officers – continued
| | | | | | |
Name, Date of Birth | | Position(s) Held
with Fund | | Trustee/Officer
Since(1) | | Principal Occupations During the Past Five Years &
Other Directorships(2) |
Ethan D. Corey(4) (born 11/21/63) | | Assistant Secretary and Assistant Clerk | | July 2005 | | Massachusetts Financial Services Company, Senior Vice President and Associate General Counsel (since April 2006); Special Counsel (prior to April 2006); Dechert LLP (law firm), Counsel (prior to December 2004) |
| | | |
David L. DiLorenzo(4) (born 08/10/68) | | Assistant Treasurer | | July 2005 | | Massachusetts Financial Services Company, Vice President (since June 2005); JP Morgan Investor Services, Vice President (January 2001 to June 2005) |
| | | |
Timothy M. Fagan(4) (born 07/10/68) | | Assistant Secretary and Assistant Clerk | | September 2005 | | Massachusetts Financial Services Company, Vice President and Senior Counsel (since September 2005); John Hancock Advisers, LLC, Vice President and Chief Compliance Officer (September 2004 to August 2005) Senior Attorney (prior to September 2004); John Hancock Group of Funds, Vice President and Chief Compliance Officer (September 2004 to December 2004) |
| | | |
Mark D. Fischer(4) (born 10/27/70) | | Assistant Treasurer | | July 2005 | | Massachusetts Financial Services Company, Vice President (since May 2005); JP Morgan Investment Management Company, Vice President (prior to May 2005) |
| | | |
Brian E. Langenfeld(4) (born 03/07/73) | | Assistant Secretary and Assistant Clerk | | May 2006 | | Massachusetts Financial Services Company, Assistant Vice President and Counsel (since May 2006); John Hancock Advisers, LLC, Assistant Vice President and Counsel (May 2005 to April 2006); John Hancock Advisers, LLC, Attorney and Assistant Secretary (prior to May 2005) |
| | | |
Ellen Moynihan(4) (born 11/13/57) | | Assistant Treasurer | | May 1997 | | Massachusetts Financial Services Company, Senior Vice President |
| | | |
Susan S. Newton(4) (born 03/07/50) | | Assistant Secretary and Assistant Clerk | | May 2005 | | Massachusetts Financial Services Company, Senior Vice President and Assistant General Counsel (since April 2005); John Hancock Advisers, LLC, Senior Vice President, Secretary and Chief Legal Officer (prior to April 2005); John Hancock Group of Funds, Senior Vice President, Secretary and Chief Legal Officer (prior to April 2005) |
| | | |
Susan A. Pereira(4) (born 11/05/70) | | Assistant Secretary and Assistant Clerk | | July 2005 | | Massachusetts Financial Services Company, Vice President and Senior Counsel (since June 2004); Bingham McCutchen LLP (law firm), Associate (January 2001 to June 2004) |
| | | |
Mark N. Polebaum(4) (born 05/01/52) | | Secretary and Assistant Clerk | | February 2006 | | Massachusetts Financial Services Company, Executive Vice President, General Counsel and Secretary (since January 2006); Wilmer Cutler Pickering Hale and Dorr LLP (law firm), Partner (prior to January 2006) |
| | | |
Frank L. Tarantino (born 03/07/44) | | Independent Chief Compliance Officer | | September 2004 | | Tarantino LLC (provider of compliance services), Principal (since June 2004); CRA Business Strategies Group (consulting services), Executive Vice President (April 2003 to June 2004); David L. Babson & Co. (investment adviser), Managing Director, Chief Administrative Officer and Director (February 1997 to March 2003) |
| | | |
Richard S. Weitzel(4) (born 7/16/70) | | Assistant Secretary and Assistant Clerk | | October 2007 | | Massachusetts Financial Services Company, Vice President and Assistant General Counsel (since 2007); Vice President and Senior Counsel (since May 2004); Massachusetts Department of Business and Technology, General Counsel (February 2003 to April 2004); Massachusetts Office of the Attorney General, Assistant Attorney General ( April 2001 to February 2003); Ropes and Gray, Associate (prior to April 2001) |
| | | |
James O. Yost(4) (born 06/12/60) | | Assistant Treasurer | | April 1992 | | Massachusetts Financial Services Company, Senior Vice President |
| (1) | Date first appointed to serve as Trustee/Officer of an MFS fund or a Compass variable account. Each Trustee has served continuously since appointment. |
| (2) | Directorships or trusteeships of companies required to report to the Securities and Exchange Commission (i.e., “public companies”). |
| (3) | “Interested person” of the Sun Life of Canada (U.S.), within the meaning of the Investment Company Act of 1940 (referred to as the 1940 Act), which is the principal federal law governing investment companies like the Series. The address of Sun Life of Canada (U.S.) is One Sun Life Executive Park, Wellesley Hills, Massachusetts 02481. |
| (4) | “Interested person” of MFS within the meaning of the 1940 Act. The address of MFS is 500 Boylston Street, Boston, Massachusetts 02116. |
The Trust does not hold annual meetings for the purpose of electing Trustees, and Trustees are not elected for fixed terms. Each Trustee and officer holds office until his or her successor is chosen and qualified, or until his or her earlier death, resignation, retirement or removal.
All Trustees currently serve as Trustees of the Trust and have served in that capacity since originally elected or appointed. All of the Trustees are also Managers of the Compass Variable Accounts. The executive officers of the Trust hold similar offices for the Compass Variable Accounts and other funds in the MFS fund complex. As of January 1, 2008, each Trustee serves as a Trustee or Manager of 35 Accounts/Funds.
21
Trustees and Officers – continued
The Statement of Additional Information contains further information about the Trustees and is available without charge upon request by calling 1-800-225-2606.
| | |
Investment Adviser
Massachusetts Financial Services Company 500 Boylston Street, Boston, MA 02116-3741 | | Custodian State Street Bank and Trust Company 225 Franklin Street, Boston, MA 02110 |
Distributor
MFS Fund Distributors, Inc. 500 Boylston Street, Boston, MA 02116-3741 | | Independent Registered Public Accounting Firm Deloitte & Touche LLP 200 Berkeley Street, Boston, MA 02116 |
Portfolio Managers Jose Luis Garcia Thomas Melendez | | |
22
BOARD REVIEW OF INVESTMENT ADVISORY AGREEMENT
The Investment Company Act of 1940 requires that both the full Board of Trustees and a majority of the non-interested (“independent”) Trustees, voting separately, annually approve the continuation of the investment advisory agreement between MFS Variable Insurance Trust II (the “Trust”) and Massachusetts Financial Services Company (MFS) on behalf of the Fund. The Trustees consider matters bearing on the Fund and the advisory arrangements at their meetings throughout the year, including a review of performance data at each regular meeting. In addition, the independent Trustees met several times over the course of three months beginning in May and ending in July 2007 (“contract review meetings”) for the specific purpose of considering whether to approve the continuation of the investment advisory agreement for the Fund. The independent Trustees were assisted in their evaluation of the investment advisory agreement by independent legal counsel, from whom they received separate legal advice and with whom they met separately from MFS management during various contract review meetings. The independent Trustees were also assisted in this process by the Fund’s Independent Chief Compliance Officer, a full-time senior officer appointed by and reporting to the independent Trustees.
In connection with their deliberations, the Trustees, including the independent Trustees, considered such information and factors as they believed, in light of the legal advice furnished to them and their own business judgment, to be relevant. The investment advisory agreement was considered separately for the Fund, although the Trustees also took into account the common interests of all Funds in the Trust in their review. As described below, the Trustees considered the nature, quality, and extent of the various investment advisory, administrative, and shareholder services performed by MFS under the existing investment advisory agreement and other arrangements with the Trust.
In connection with their contract review meetings, the Trustees received and relied upon materials which included, among other items: (i) information provided by Lipper Inc. on the investment performance of the Fund for various time periods ended December 31, 2006, compared to the investment performance of a group of funds with substantially similar investment classifications/objectives (the “Lipper performance universe”), as well as the investment performance of a group of funds identified by objective criteria suggested by MFS (“peer funds”), (ii) information provided by Lipper Inc. on the Fund’s advisory fees and other expenses compared to the advisory fees and other expenses of comparable funds identified by Lipper (the “Lipper expense group”), as well as the advisory fees and other expenses of peer funds identified by objective criteria suggested by MFS, (iii) information provided by MFS on the advisory fees of comparable portfolios of its other clients, including institutional separate account and other clients, (iv) information as to whether, and to what extent applicable, expense waivers, reimbursements or fee “breakpoints” are observed for the Fund, (v) information regarding MFS’ financial results and financial condition, including MFS’ and certain of its affiliates’ estimated profitability from services performed for the Fund, (vi) MFS’ views regarding the outlook for the mutual fund industry and its strategic business plans, (vii) descriptions of various functions performed by MFS for the Trust, such as compliance monitoring and portfolio trading practices, and (viii) information regarding the overall organization of MFS, including information about MFS’ senior management and other personnel providing investment advisory, administrative and other services to the Fund. The comparative performance, fee and expense information prepared and provided by Lipper Inc. was not independently verified, and the independent Trustees did not independently verify any information provided to them by MFS.
The Trustees’ conclusion as to the continuation of the investment advisory agreement was based on comprehensive consideration of all information provided to the Trustees and not the result of any single factor. Some of the factors that figured particularly in the Trustees’ deliberations are described below for the Fund, while individual Trustees may have given different weight to various factors and evaluated the information presented as a whole differently than another Trustee. The Trustees recognized that the fee arrangements for the Fund reflect years of review and discussion between the independent Trustees and MFS, that certain aspects of such arrangements may receive greater scrutiny in some years than others, and that the Trustees’ conclusions may be based, in part, on their consideration of these same arrangements during the course of the year and in prior years.
Based on information provided by Lipper Inc. and MFS, the Trustees compared the Fund’s total return investment performance to the performance of a peer group of funds over various time periods. The Trustees placed particular emphasis on the total return performance of the Fund’s Initial Class shares in comparison to the performance of funds in its Lipper performance universe over the one-, three- and five-year periods. The Trustees did not rely on performance results for more recent periods, including those shown elsewhere in this report.
The Trustees noted the performance of the Fund’s Initial Class shares was in the 2nd quintile relative to the other funds in the Lipper Classification Index for the one-year period (the 1st quintile being the best performers and the 5th quintile being the worst performers). The total return performance of the Fund was in the 1st quintile for the three-year period and the five-year period ended December 31, 2006, relative to the Lipper performance universe. Based on the nature and quality of services provided by MFS, the Board of Trustees concluded that the Fund’s performance was satisfactory.
23
Board Review of Investment Advisory Agreement – continued
In the course of their deliberations, the Trustees took into account information provided by MFS during contract review meetings, as well as during investment review meetings conducted with portfolio management personnel during the course of the year.
In assessing the reasonableness of the Fund’s advisory fee, the Trustees considered, among other information, the Fund’s advisory fee and the total expense ratio of the Fund’s Initial Class shares as a percentage of average daily net assets, compared to the advisory fee and total expense ratios of its peer group of funds based on information provided by Lipper Inc. and MFS. The Trustees also considered the advisory fees charged by MFS to institutional accounts. In comparing these fees, the Trustees considered the generally broader scope of services provided by MFS to the Trust than those provided to institutional accounts. The Trustees also considered the higher demands placed on MFS’ investment personnel and trading infrastructure as a result of the daily cash in-flows and out-flows of the Fund, and the impact on MFS and related expenses due to the more extensive regulatory regime to which the Fund is subject, compared to institutional accounts.
In considering the fees, the Trustees noted from the Lipper data that the Fund’s effective advisory fee rate and total expense ratio were each above the median of such fees and expenses of funds in the Lipper expense group. In addition, the Trustees accepted MFS’ offer to reduce the expense limitation for the Fund to 1.10% for the next year. The Trustees further concluded that the existing breakpoints were sufficient to allow the Fund to benefit from economies of scale as its assets grow.
The Trustees also considered information prepared by MFS relating to its costs and profits with respect to the Fund and other investment companies and accounts advised by MFS, as well as MFS’ methodologies used to determine and allocate its costs to the Fund and other accounts and products for purposes of estimating profitability.
After reviewing these and other factors described below, the Trustees concluded that the advisory fee charged to the Fund represents reasonable compensation in light of the nature and quality of the services being provided by MFS.
In addition, the Trustees considered MFS’ resources and related efforts to continue to retain, attract and motivate capable personnel to serve the Fund. The Trustees also considered the financial resources of MFS and its parent, Sun Life Financial Inc. The Trustees further considered any advantages and possible disadvantages of having an adviser which also serves other investment companies as well as institutional accounts.
The Trustees also considered the nature, quality, cost, and extent of administrative, transfer agency, and distribution services provided to the Fund by MFS and its affiliates under agreements and plans other than the investment advisory agreement, including the 12b-1 fees the Fund pays to MFS Fund Distributors, Inc., an affiliate of MFS. The Trustees also considered the nature, extent and quality of certain other services MFS performs or arranges on the Fund’s behalf, which may include securities lending programs, directed expense payment programs, class action recovery programs, and MFS’ interaction with third-party service providers, principally custodians and sub-custodians. The Trustees concluded that the various non-advisory services provided by MFS and its affiliates on behalf of the Fund were satisfactory. The Trustees also considered the benefits to MFS from the use of the Fund’s portfolio brokerage commissions to pay for research and other similar services (including MFS’ policy not to use “soft dollars” generated by Fund portfolio transactions to pay for third-party research), and various other factors. Additionally, the Trustees considered so-called “fall-out benefits” to MFS such as reputational value derived from serving as investment manager to the Trust, and determined that any such benefits derived by MFS were reasonable and fair.
Based on their evaluation of factors that they deemed to be material, including those factors described above, the Board of Trustees, including a majority of the independent Trustees, concluded that the investment advisory agreement should be continued for an additional one-year period, commencing September 1, 2007.
A discussion regarding the Board’s most recent review and renewal of the Fund’s investment advisory agreement is available by clicking on the Fund’s name under “Variable Insurance Portfolios” on the “Products & Performance” page on the MFS Web site (mfs.com).
24
PROXY VOTING POLICIES AND INFORMATION
A general description of the MFS funds’ proxy voting policies and procedures is available without charge, upon request, by calling 1-800-225-2606, by visiting the About MFS section of mfs.com or by visiting the SEC’s Web site at http://www.sec.gov.
Information regarding how the fund voted proxies relating to portfolio securities during the most recent twelve-month period ended June 30 is available without charge by visiting the Proxy Voting section of mfs.com or by visiting the SEC’s Web site at http://www.sec.gov.
QUARTERLY PORTFOLIO DISCLOSURE
The fund will file a complete schedule of portfolio holdings with the Securities and Exchange Commission (the Commission) for the first and third quarters of each fiscal year on Form N-Q. The fund’s Form N-Q may be reviewed and copied at the:
Public Reference Room
Securities and Exchange Commission
100 F Street, NE, Room 1580
Washington, D.C. 20549
Information on the operation of the Public Reference Room may be obtained by calling the Commission at 1-800-SEC-0330. The fund’s Form N-Q is available on the EDGAR database on the Commission’s Internet Web site at http://www.sec.gov, and copies of this information may be obtained, upon payment of a duplicating fee, by electronic request at the following e-mail address: publicinfo@sec.gov or by writing the Public Reference Section at the above address.
A shareholder can also obtain the quarterly portfolio holdings report at mfs.com.
FEDERAL TAX INFORMATION (unaudited)
The following information is provided pursuant to provisions of the Internal Revenue Code.
The fund designates $19,573,328 as capital gain dividends paid during the fiscal year.
Income derived from foreign sources was $5,518,397. The fund intends to pass through foreign tax credits of $489,512 for the fiscal year.
25
MFS® PRIVACY NOTICE
Privacy is a concern for every investor today. At MFS Investment Management® and the MFS funds, we take this concern very seriously. We want you to understand our policies about the investment products and services that we offer, and how we protect the nonpublic personal information of investors who have a direct relationship with us and our wholly owned subsidiaries.
Throughout our business relationship, you provide us with personal information. We maintain information and records about you, your investments, and the services you use. Examples of the nonpublic personal information we maintain include
| | Ÿ | | data from investment applications and other forms |
| | Ÿ | | share balances and transactional history with us, our affiliates, or others |
| | Ÿ | | facts from a consumer reporting agency |
We do not disclose any nonpublic personal information about our customers or former customers to anyone, except as permitted by law. We may share nonpublic personal information with third parties or certain of our affiliates in connection with servicing your account or processing your transactions. We may share information with companies or financial institutions that perform marketing services on our behalf or with other financial institutions with which we have joint marketing arrangements, subject to any legal requirements.
Authorization to access your nonpublic personal information is limited to appropriate personnel who provide products, services, or information to you. We maintain physical, electronic, and procedural safeguards to help protect the personal information we collect about you.
If you have any questions about the MFS privacy policy, please call 1-800-225-2606 any business day between 8 a.m. and 8 p.m. Eastern time.
Note: If you own MFS products or receive MFS services in the name of a third party such as a bank or broker-dealer, their privacy policy may apply to you instead of ours.
26
CONTACT US
Web site
mfs.com
Account service and
literature
Shareholders
1-877-411-3325
9 a.m. to 5 p.m. ET
Investment professionals
1-800-637-8630
8 a.m. to 5 p.m. ET
Mailing address
MFS Service Center, Inc.
Attn: Institutional Alliance Services (IAS)
P.O. Box 55824
Boston, MA
02205-5824
Overnight mail
MFS Service Center, Inc.
Attn: Institutional Alliance Services (IAS)
500 Boylston Street
Boston, MA 02116-3741


MFS® Variable Insurance Trust IISM
Annual report
MFS® Total Return Portfolio
(formerly Total Return Series)
12/31/07
TRS-ANN
MFS® TOTAL RETURN PORTFOLIO
(formerly Total Return Series)
The report is prepared for the general information of contract owners. It is authorized for distribution to prospective investors only when preceded or accompanied by a current prospectus.
NOT FDIC INSURED MAY LOSE VALUE NO BANK OR CREDIT UNION GUARANTEE NOT A DEPOSIT NOT INSURED BY ANY FEDERAL GOVERNMENT AGENCY OR NCUA/NCUSIF
LETTER FROM THE CEO

Dear Contract Owners:
The past year has been a great example of why investors should keep their eyes on the long term.
In 2006 the Dow Jones Industrial Average returned 19% and was fairly stable. This year we have seen a greater level of volatility than has been experienced in recent years. The Dow hit several new highs but also experienced swift drops as a global credit crisis swept through markets, spurred by defaults on U.S. subprime loans and a liquidity crunch. Still, even with this volatility, the Dow ended the first three quarters of 2007 with a return near 13%.
U.S. Treasury bonds gained ground, especially in the third quarter as investors sought less risky asset classes. The spreads of many lower-quality debt investments widened.
In 2007 the U.S. dollar fell against the euro, oil prices hit their highest levels yet, and gold spiked to its steepest price in 28 years. Around the globe, stocks sold off as risk aversion mounted. As we have said before, markets can be volatile, and investors should make sure they have an investment plan that can carry them through the peaks and troughs.
If you are focused on a long-term investment strategy, the short-term ups and downs of the markets should not necessarily dictate portfolio action on your part. In our view, investors who remain committed to a long-term plan are more likely to achieve their financial goals.
In any market environment, we believe individual investors are best served by following a three-pronged investment strategy of allocating their holdings across the major asset classes, diversifying within each class, and regularly rebalancing their portfolios to maintain their desired allocations. Of course, these strategies cannot guarantee a profit or protect against a loss. Investing and planning for the long term require diligence and patience, two traits that in our experience are essential to capitalizing on the many opportunities the financial markets can offer — through both up and down economic cycles.
Respectfully,

Robert J. Manning
Chief Executive Officer and Chief Investment Officer
MFS Investment Management®
February 15, 2008
The opinions expressed in this letter are subject to change, may not be relied upon for investment advice, and no forecasts can be guaranteed.
1
PORTFOLIO COMPOSITION
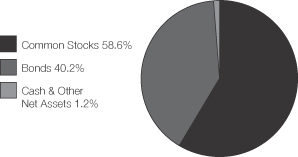
| | |
| Top ten holdings (i) | | |
| Fannie Mae, 5.5%, 30 years | | 3.9% |
| U.S. Treasury Notes, 4.875%, 2009 | | 2.2% |
| Fannie Mae, 6.0%, 30 years | | 2.1% |
| Exxon Mobil Corp. | | 2.0% |
| Altria Group, Inc. | | 1.7% |
| Lockheed Martin Corp. | | 1.5% |
| U.S. Treasury Notes, 5.625%, 2008 | | 1.3% |
| U.S. Treasury Bonds, 5.375%, 2031 | | 1.2% |
| U.S. Treasury Notes, 5.125%, 2011 | | 1.2% |
| TOTAL S.A., ADR | | 1.2% |
| | |
| Equity sectors | | |
| Financial Services | | 15.0% |
| Energy | | 8.2% |
| Utilities & Communications | | 6.6% |
| Health Care | | 5.8% |
| Consumer Staples | | 5.5% |
| Industrial Goods & Services | | 4.8% |
| Retailing | | 3.3% |
| Technology | | 2.8% |
| Basic Materials | | 2.0% |
| Leisure | | 1.8% |
| Autos & Housing | | 1.7% |
| Transportation | | 0.7% |
| Special Products & Services | | 0.4% |
| | |
| Fixed income sectors (i) | | |
| Mortgage-Backed Securities | | 15.1% |
| U.S. Treasury Securities | | 10.4% |
| High Grade Corporates | | 9.0% |
| Commercial Mortgage-Backed Securities | | 2.2% |
| U.S. Government Agencies | | 1.6% |
| Non-U.S. Government Bonds | | 0.8% |
| Asset-Backed Securities | | 0.5% |
| Emerging Market Bonds | | 0.3% |
| High Yield Corporates | | 0.2% |
| Municipal Bonds | | 0.1% |
| Residential Mortgage-Backed Securities (o) | | 0.0% |
| Collateralized Debt Obligations (o) | | 0.0% |
| (i) | For purposes of this presentation, the bond component includes accrued interest amounts and may be positively or negatively impacted by the equivalent exposure from any derivative holdings, if applicable. |
Percentages are based on net assets as of 12/31/07, unless otherwise noted.
The portfolio is actively managed and current holdings may be different.
2
MANAGEMENT REVIEW
Summary of Results
For the twelve months ended December 31, 2007, Initial Class shares of the MFS Total Return Portfolio (the “fund”) provided a total return of 4.32%, while Service Class shares provided a total return of 4.07%. These compare with a return of 5.49% for the fund’s benchmark, the Standard & Poor’s 500 Stock Index (S&P 500 Index). The fund’s other benchmark, the Lehman Brothers U.S. Aggregate Bond Index (Lehman Index), generated a total return of 6.97%.
Market Environment
Despite seemingly robust growth rates during the second and third quarters of 2007, underlying economic activity in the U.S. remained muted relative to other major economies. Overall, global economies witnessed moderate to strong growth during the reporting period as domestic demand improved and world trade accelerated.
With the strong global growth, however, concerns emerged about rising global inflation, especially as capacity became more constrained, wages rose, and energy and food prices advanced. During the reporting period, global central banks (with the exception of the U.S. Federal Reserve Board) tightened monetary conditions, which in turn pushed global bond yields to their highest levels during this economic expansion.
However, financial markets – particularly in the mortgage and structured-products areas – experienced substantial volatility in recent months. Beginning in late July, heightened uncertainty and distress concerning the subprime mortgage market caused several global credit markets to tighten up, forcing central banks to inject liquidity and to reassess their tightening biases as sovereign bond yields declined and credit spreads widened. While credit conditions improved somewhat by late October as the Federal Reserve Board cut interest rates, the level of market turbulence remained significant through year end. Increased market turmoil was also exacerbated by U.S. home foreclosures and uncertainties surrounding falling housing prices. Despite increased volatility across all asset classes and the widening in credit spreads, U.S. labor markets were resilient and wages rose modestly. More broadly, global equity markets rebounded following summer losses and generally held those gains through the end of the reporting period.
Detractors from performance
Within the equity portion of the fund, an overweighted position in the poor-performing financial services sector held back performance relative to the S&P 500 Index. Insurance companies, Genworth Financial, Conseco(aa), and Allstate, along with mortgage lending firm Countrywide Financial(g) and electronic brokerage firm E*TRADE Financial, were among the fund’s top detractors.
Stock selection and an underweighted position in the technology sector also dampened relative performance. Telecommunications equipment manufacturer Nortel Networks(aa) was a top detractor. We believe Nortel’s weaker-than-expected fundamentals and management’s inability to turn the business around contributed to the decline of the company’s stock price. Not holding strong-performing computer and personal electronics maker Apple also hurt investment results.
In the health care sector, security selection detracted from relative returns. No individual securities within this sector were among the fund’s top detractors for the period.
Elsewhere, retailer Macy’s, home improvement products maker Masco, and media titan The New York Times held back relative performance. Masco’s shares were hurt by the deterioration of the housing markets and the company’s pessimistic guidance that cited decreased housing starts.
Within the fixed income portion of the fund, our exposure to bonds in the financial sector and to structured products, particularly commercial mortgage-backed securities (CMBS) and asset-backed securities (ABS), held back performance relative to the Lehman Index as these securities suffered from the recent turmoil in the subprime mortgage market.
Credit quality, particularly holdings of lower-quality “BBB”(s) rated securities, detracted from performance as credit spreads widened over the reporting period.
Contributors to performance
Within the equity portion of the fund, stock selection and an overweighted position in the strong-performing energy sector boosted performance relative to the S&P 500 Index. Global integrated energy company Hess, and oil and gas producers, Anadarko Petroleum, Devon Energy, and Apache, were all strong contributors over the reporting period. Shares of Hess surged in recent months due largely to hopes that an oil field discovery off the coast of Brazil could nearly double the company’s reserves.
3
Management review – continued
A strong showing in the basic materials sector was principally due to stock selection. Packaging manufacturer Owens-Illinois(aa)(g) was a top contributor within this sector. The company reported quarterly earnings that exceeded consensus expectations. The firm attributed the positive results to better operating performance in its glass factories and improved pricing and product sales mix.
Elsewhere, agricultural equipment manufacturer Deere & Co. and global financial services provider Bank of New York Mellon were top contributors. Deere’s stock price gain was driven by strong capital management and better-than-expected results throughout the period which pushed its shares up in excess of the market. Not holding poor-performing financial services firm Wachovia and cable services provider Comcast benefited results, while our small positioning in insurance company American International Group, which struggled during the reporting period, also helped.
During the reporting period, currency exposure in the equity portion of the fund was a contributor to relative performance. All of MFS’ investment decisions are driven by the fundamentals of each individual opportunity and, as such, it is common for our portfolios to have different currency exposure than the benchmark.
Within the fixed income portion of the fund, our defensive positioning in shorter duration(d) corporate bond holdings, relative to the Lehman Index, and our positioning in U.S. Treasury securities, boosted relative performance as credit spreads widened.
The fund generated a higher level of income over the reporting period which also benefited relative results.
Respectfully,
| | | | | | |
| Brooks Taylor | | Nevin Chitkara | | William Douglas | | Steven Gorham |
| Porfolio Manager | | Portfolio Manager | | Portfolio Manager | | Portfolio Manager |
| | | |
| Richard Hawkins | | Gregory Locraft | | Michael Roberge | | |
| Portfolio Manager | | Portfolio Manager | | Portfolio Manager | | |
| (aa) | Security is not a benchmark constituent. |
| (d) | Duration is a measure of how much a bond’s price is likely to fluctuate with general changes in interest rates, e.g., if rates rise 1.00%, a bond with a 5-year duration is likely to lose about 5.00% of its value. |
| (g) | Security was not held in the portfolio at period end. |
| (s) | Bonds rated “BBB”, “Baa”, or higher are considered investment grade; bonds rated “BB”, “Ba”, or below are considered non-investment grade. The primary source for bond quality ratings is Moody’s Investors Service. If not available, ratings by Standard & Poor’s are used, else ratings by Fitch, Inc. For securities which are not rated by any of the three agencies, the security is considered not rated. |
The views expressed in this report are those of the portfolio managers only through the end of the period of the report as stated on the cover and do not necessarily reflect the views of MFS or any other person in the MFS organization. These views are subject to change at any time based on market and other conditions, and MFS disclaims any responsibility to update such views. These views may not be relied upon as investment advice or an indication of trading intent on behalf of any MFS portfolio. References to specific securities are not recommendations of such securities, and may not be representative of any MFS portfolio’s current or future investments.
4
PERFORMANCE SUMMARY THROUGH 12/31/07
The following chart illustrates the historical performance of the fund in comparison to its benchmark index. Index comparisons are unmanaged; do not reflect any fees or expenses; and cannot be invested in directly. The performance of other share classes will be greater than or less than that of the class depicted below. (See Notes to Performance Summary.)
Performance data shown represents past performance and is no guarantee of future results. Investment return and principal value fluctuate so your units, when sold, may be worth more or less than the original cost; current performance may be lower or higher than quoted. The performance shown does not reflect the deduction of taxes, if any, that a contract holder would pay on fund distributions or the redemption of contract units. The returns for the fund shown also do not reflect the deduction of expenses associated with variable products, such as mortality and expense risk charges, separate account charges, and sales charges imposed by the insurance company separate accounts. Such expenses would reduce the overall returns shown.
Growth of a hypothetical $10,000 investment
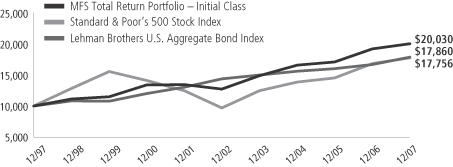
Total returns through 12/31/07
Average Annual Total Returns
| | | | | | | | | | | | |
| | | Share class | | Class inception date | | 1-yr | | 5-yr | | 10-yr | | |
| | | Initial Class | | 5/11/88 | | 4.32% | | 9.51% | | 7.19% | | |
| | | Service Class | | 8/24/01 | | 4.07% | | 9.23% | | 7.02% | | |
Comparative Indices
| | | | | | | | | | | | |
| | | Standard & Poor’s 500 Stock Index (f) | | 5.49% | | 12.83% | | 5.91% | | |
| | | Lehman Brothers U.S. Aggregate Bond Index (f) | | 6.97% | | 4.42% | | 5.97% | | |
| (f) | Source: FactSet Research Systems Inc. |
Index Definition
Lehman Brothers U.S. Aggregate Bond Index – a market capitalization-weighted index that measures the performance of the U.S. investment-grade, fixed rate bond market, with index components for government and corporate securities, mortgage pass-through securities, and asset-backed securities with at least one year to final maturity.
Standard & Poor’s 500 Stock Index – a market capitalization-weighted index of 500 widely held equity securities, designed to measure broad U.S. equity performance.
It is not possible to invest directly in an index.
Notes to Performance Summary
Service Class share performance includes the performance of Initial Class shares for periods prior to the inception of Service Class shares (blended performance). This blended performance figure has not been adjusted to take into account differences in the class-specific operating expenses (such as Rule 12b-1 fees). Because operating expenses of Service Class shares are generally higher than those of Initial Class shares, the blended Service Class shares performance shown is higher than it would have been had Service Class shares been offered for the entire period.
Performance results reflect any applicable expense subsidies and waivers in effect during the periods shown. Without such subsidies and waivers the fund’s performance results would be less favorable. Please see the prospectus for complete details. All results are historical and assume the reinvestment of any dividends and capital gains distributions.
From time to time the fund may receive proceeds from litigation settlements, without which performance would be lower.
5
EXPENSE TABLE
Fund Expenses Borne by the Contract Holders During the Period,
July 1, 2007 through December 31, 2007
As a contract holder of the fund, you incur ongoing costs, including management fees; distribution (12b-1) fees; and other fund expenses. This example is intended to help you understand your ongoing costs (in dollars) of investing in the fund and to compare these costs with the ongoing costs of investing in other mutual funds.
The example is based on an investment of $1,000 invested at the beginning of the period and held for the entire period
July 1, 2007 through December 31, 2007.
Actual expenses
The first line for each share class in the following table provides information about actual account values and actual expenses. You may use the information in this line, together with the amount you invested, to estimate the expenses that you paid over the period. Simply divide your account value by $1,000 (for example, an $8,600 account value divided by $1,000 = 8.6), then multiply the result by the number in the first line under the heading entitled “Expenses Paid During Period” to estimate the expenses you paid on your account during this period.
Hypothetical example for comparison purposes
The second line for each share class in the following table provides information about hypothetical account values and hypothetical expenses based on the fund’s actual expense ratio and an assumed rate of return of 5% per year before expenses, which is not the fund’s actual return. The hypothetical account values and expenses may not be used to estimate the actual ending account balance or expenses you paid for the period. You may use this information to compare the ongoing costs of investing in the fund and other funds. To do so, compare this 5% hypothetical example with the 5% hypothetical examples that appear in the shareholder reports of the other funds.
Please note that the expenses shown in the table are meant to highlight the fund’s ongoing costs only and do not take into account the fees and expenses imposed under the variable contracts through which your investment in the fund is made. Therefore, the second line for each share class in the table is useful in comparing ongoing costs associated with an investment in vehicles (such as the fund) which fund benefits under variable annuity and variable life insurance contracts and to qualified pension and retirement plans only, and will not help you determine the relative total costs of investing in the fund through variable annuity and variable life insurance contracts. If the fees and expenses imposed under the variable contracts were included, your costs would have been higher.
| | | | | | | | | | |
Share Class | | | | Annualized
Expense Ratio | | Beginning
Account Value
7/01/07 | | Ending
Account Value
12/31/07 | | Expenses Paid
During Period (p)
7/01/07-12/31/07 |
| Initial Class | | Actual | | 0.70% | | $1,000.00 | | $984.80 | | $3.50 |
| | Hypothetical (h) | | 0.70% | | $1,000.00 | | $1,021.68 | | $3.57 |
| Service Class | | Actual | | 0.95% | | $1,000.00 | | $983.70 | | $4.75 |
| | Hypothetical (h) | | 0.95% | | $1,000.00 | | $1,020.42 | | $4.84 |
| (h) | 5% class return per year before expenses. |
| (p) | Expenses paid is equal to each class’ annualized expense ratio, as shown above, multiplied by the average account value over the period, multiplied by the number of days in the period, divided by the number of days in the year. |
6
PORTFOLIO OF INVESTMENTS – 12/31/07
The Portfolio of Investments is a complete list of all securities owned by your fund.
It is categorized by broad-based asset classes.
| | | | | |
| Issuer | | Shares/Par | | Value ($) |
| | | | | |
| COMMON STOCKS – 58.6% | | | | | |
| Aerospace – 2.7% | | | | | |
| Lockheed Martin Corp. | | 289,140 | | $ | 30,434,876 |
| Northrop Grumman Corp. | | 85,090 | | | 6,691,478 |
| Raytheon Co. | | 16,360 | | | 993,052 |
| United Technologies Corp. | | 215,430 | | | 16,489,012 |
| | | | | |
| | | | $ | 54,608,418 |
| | | | | |
| Alcoholic Beverages – 0.6% | | | | | |
| Diageo PLC | | 538,712 | | $ | 11,531,378 |
| | | | | |
| Apparel Manufacturers – 0.6% | | | | | |
| NIKE, Inc., “B” | | 174,460 | | $ | 11,207,310 |
| | | | | |
| Automotive – 0.7% | | | | | |
| Bayerische Motoren Werke AG | | 32,430 | | $ | 2,002,588 |
| Harley-Davidson, Inc. | | 62,190 | | | 2,904,895 |
| Johnson Controls, Inc. | | 228,400 | | | 8,231,536 |
| | | | | |
| | | | $ | 13,139,019 |
| | | | | |
| Biotechnology – 0.4% | | | | | |
| Amgen, Inc. (a) | | 83,620 | | $ | 3,883,313 |
| Genzyme Corp. (a) | | 58,850 | | | 4,380,794 |
| | | | | |
| | | | $ | 8,264,107 |
| | | | | |
| Broadcasting – 0.7% | | | | | |
| Citadel Broadcasting Corp. (l) | | 4,448 | | $ | 9,163 |
| E.W. Scripps Co., “A” (l) | | 79,500 | | | 3,578,295 |
| Omnicom Group, Inc. | | 117,750 | | | 5,596,658 |
| Walt Disney Co. | | 94,000 | | | 3,034,320 |
| WPP Group PLC | | 129,310 | | | 1,655,518 |
| | | | | |
| | | | $ | 13,873,954 |
| | | | | |
| Brokerage & Asset Managers – 2.8% | | | | | |
| Bear Stearns Cos., Inc. (l) | | 95,130 | | $ | 8,395,223 |
| E*TRADE Financial Corp. (a)(l) | | 484,870 | | | 1,721,289 |
| Franklin Resources, Inc. | | 67,840 | | | 7,762,931 |
| Goldman Sachs Group, Inc. | | 73,230 | | | 15,748,112 |
KKR Private Equity Investments LP,
IEU (z) | | 75,810 | | | 1,376,710 |
| Legg Mason, Inc. | | 41,580 | | | 3,041,577 |
| Lehman Brothers Holdings, Inc. | | 164,120 | | | 10,740,013 |
| Merrill Lynch & Co., Inc. | | 137,330 | | | 7,371,874 |
| | | | | |
| | | | $ | 56,157,729 |
| | | | | |
| Business Services – 0.4% | | | | | |
| Accenture Ltd., “A” | | 129,330 | | $ | 4,659,760 |
| Automatic Data Processing, Inc. | | 25,980 | | | 1,156,889 |
| Fidelity National Information Services, Inc. | | 67,940 | | | 2,825,625 |
| | | | | |
| | | | $ | 8,642,274 |
| | | | | |
| Cable TV – 0.3% | | | | | |
| Time Warner Cable, Inc. (a) | | 194,400 | | $ | 5,365,440 |
| | | | | |
| Chemicals – 0.9% | | | | | |
| 3M Co. | | 51,860 | | $ | 4,372,835 |
| Dow Chemical Co. | | 33,670 | | | 1,327,271 |
| PPG Industries, Inc. | | 168,710 | | | 11,848,503 |
| Syngenta AG | | 4,540 | | | 1,151,913 |
| | | | | |
| | | | $ | 18,700,522 |
| | | | | |
| | | | | |
| Issuer | | Shares/Par | | Value ($) |
| | | | | |
| COMMON STOCKS – continued | | | | | |
| Computer Software – 0.5% | | | | | |
| Oracle Corp. (a) | | 448,330 | | $ | 10,123,291 |
| | | | | |
| Computer Software – Systems – 1.3% | | | | | |
| Hewlett-Packard Co. | | 193,070 | | $ | 9,746,174 |
| International Business Machines Corp. | | 149,200 | | | 16,128,520 |
| | | | | |
| | | | $ | 25,874,694 |
| | | | | |
| Construction – 0.8% | | | | | |
| D.R. Horton, Inc. | | 298,960 | | $ | 3,937,303 |
| Masco Corp. | | 280,580 | | | 6,063,334 |
| Sherwin-Williams Co. | | 28,910 | | | 1,677,936 |
| Toll Brothers, Inc. (a)(l) | | 227,540 | | | 4,564,452 |
| | | | | |
| | | | $ | 16,243,025 |
| | | | | |
| Consumer Goods & Services – 1.1% | | | | | |
| Clorox Co. | | 89,380 | | $ | 5,824,895 |
| Procter & Gamble Co. | | 219,300 | | | 16,101,006 |
| | | | | |
| | | | $ | 21,925,901 |
| | | | | |
| Containers – 0.0% | | | | | |
| Smurfit-Stone Container Corp. (a) | | 61,080 | | $ | 645,005 |
| | | | | |
| Electrical Equipment – 1.4% | | | | | |
| General Electric Co. | | 389,670 | | $ | 14,445,067 |
| Rockwell Automation, Inc. | | 38,890 | | | 2,681,854 |
| W.W. Grainger, Inc. | | 85,710 | | | 7,501,339 |
| WESCO International, Inc. (a)(l) | | 110,150 | | | 4,366,346 |
| | | | | |
| | | | $ | 28,994,606 |
| | | | | |
| Electronics – 0.8% | | | | | |
| Flextronics International Ltd. (a) | | 268,040 | | $ | 3,232,562 |
| Intel Corp. | | 438,670 | | | 11,694,942 |
| Samsung Electronics Co. Ltd., GDR | | 6,519 | | | 1,891,908 |
| | | | | |
| | | | $ | 16,819,412 |
| | | | | |
| Energy – Independent – 2.4% | | | | | |
| Anadarko Petroleum Corp. | | 137,860 | | $ | 9,056,023 |
| Apache Corp. | | 146,370 | | | 15,740,630 |
| CONSOL Energy, Inc. | | 15,500 | | | 1,108,560 |
| Devon Energy Corp. | | 150,720 | | | 13,400,515 |
| EOG Resources, Inc. | | 35,260 | | | 3,146,955 |
| Sunoco, Inc. | | 54,460 | | | 3,945,082 |
| Ultra Petroleum Corp. (a) | | 27,290 | | | 1,951,235 |
| | | | | |
| | | | $ | 48,349,000 |
| | | | | |
| Energy – Integrated – 5.6% | | | | | |
| Chevron Corp. | | 74,617 | | $ | 6,964,005 |
| ConocoPhillips | | 63,380 | | | 5,596,454 |
| Exxon Mobil Corp. | | 429,416 | | | 40,231,985 |
| Hess Corp. | | 236,670 | | | 23,870,536 |
| Marathon Oil Corp. | | 150,040 | | | 9,131,434 |
| Royal Dutch Shell PLC, ADR | | 26,450 | | | 2,227,090 |
| TOTAL S.A., ADR | | 289,410 | | | 23,905,266 |
| | | | | |
| | | | $ | 111,926,770 |
| | | | | |
| Food & Beverages – 2.1% | | | | | |
| General Mills, Inc. | | 201,560 | | $ | 11,488,920 |
7
Portfolio of Investments – continued
| | | | | |
| Issuer | | Shares/Par | | Value ($) |
| | | | | |
| | | | | |
| COMMON STOCKS – continued | | | | | |
| Food & Beverages – continued | | | | | |
| Kellogg Co. | | 139,750 | | $ | 7,327,093 |
| Nestle S.A. | | 30,798 | | | 14,112,063 |
| PepsiCo, Inc. | | 110,520 | | | 8,388,468 |
| | | | | |
| | | | $ | 41,316,544 |
| | | | | |
| Food & Drug Stores – 1.2% | | | | | |
| CVS Caremark Corp. | | 286,492 | | $ | 11,388,057 |
| Kroger Co. | | 114,210 | | | 3,050,549 |
| Safeway, Inc. | | 186,390 | | | 6,376,402 |
| Walgreen Co. | | 98,810 | | | 3,762,685 |
| | | | | |
| | | | $ | 24,577,693 |
| | | | | |
| Forest & Paper Products – 0.3% | | | | | |
| AbitibiBowater, Inc. (a)(l) | | 61,890 | | $ | 1,275,553 |
| MeadWestvaco Corp. (l) | | 119,200 | | | 3,730,960 |
| | | | | |
| | | | $ | 5,006,513 |
| | | | | |
| Furniture & Appliances – 0.2% | | | | | |
| Jarden Corp. (a)(l) | | 119,120 | | $ | 2,812,423 |
| Whirlpool Corp. (l) | | 24,210 | | | 1,976,262 |
| | | | | |
| | | | $ | 4,788,685 |
| | | | | |
| Gaming & Lodging – 0.6% | | | | | |
| Royal Caribbean Cruises Ltd. (l) | | 290,990 | | $ | 12,349,616 |
| | | | | |
| General Merchandise – 1.0% | | | | | |
| Macy’s, Inc. | | 589,920 | | $ | 15,261,230 |
| Wal-Mart Stores, Inc. | | 79,290 | | | 3,768,654 |
| | | | | |
| | | | $ | 19,029,884 |
| | | | | |
| Health Maintenance Organizations – 1.2% | | | |
| UnitedHealth Group, Inc. | | 129,200 | | $ | 7,519,440 |
| WellPoint, Inc. (a) | | 177,790 | | | 15,597,517 |
| | | | | |
| | | | $ | 23,116,957 |
| | | | | |
| Insurance – 4.5% | | | | | |
| Allstate Corp. | | 452,980 | | $ | 23,659,145 |
| Ambac Financial Group, Inc. (l) | | 68,180 | | | 1,756,999 |
| American International Group, Inc. | | 43,540 | | | 2,538,382 |
| Chubb Corp. | | 44,530 | | | 2,430,447 |
| Conseco, Inc. (a)(l) | | 336,810 | | | 4,230,334 |
| Genworth Financial, Inc., “A” | | 712,000 | | | 18,120,400 |
| Hartford Financial Services Group, Inc. | | 129,000 | | | 11,247,510 |
| Max Capital Group Ltd. | | 112,850 | | | 3,158,672 |
| Mbia, Inc. (l) | | 56,350 | | | 1,049,801 |
| MetLife, Inc. | | 208,180 | | | 12,828,052 |
| Principal Financial Group, Inc. | | 31,680 | | | 2,180,851 |
| Prudential Financial, Inc. | | 31,900 | | | 2,967,976 |
| Travelers Cos., Inc. | | 95,990 | | | 5,164,262 |
| | | | | |
| | | | $ | 91,332,831 |
| | | | | |
| Internet – 0.0% | | | | | |
| Yahoo!, Inc. (a) | | 40,780 | | $ | 948,543 |
| | | | | |
| Leisure & Toys – 0.1% | | | | | |
| Polaris Industries, Inc. (l) | | 43,310 | | $ | 2,068,919 |
| | | | | |
| Machinery & Tools – 0.7% | | | | | |
| Deere & Co. | | 54,460 | | $ | 5,071,315 |
| Eaton Corp. | | 13,830 | | | 1,340,819 |
| | | | | |
| Issuer | | Shares/Par | | Value ($) |
| | | | | |
| | | | | |
| COMMON STOCKS – continued | | | | | |
| Machinery & Tools – continued | | | | | |
| Kennametal, Inc. | | 51,560 | | $ | 1,952,062 |
| Timken Co. | | 196,160 | | | 6,443,856 |
| | | | | |
| | | | $ | 14,808,052 |
| Major Banks – 4.8% | | | | | |
| Bank of America Corp. | | 560,750 | | $ | 23,136,545 |
| Bank of New York Mellon Corp. | | 473,149 | | | 23,070,745 |
| Huntington Bancshares, Inc. | | 115,350 | | | 1,702,566 |
| JPMorgan Chase & Co. | | 420,882 | | | 18,371,499 |
| PNC Financial Services Group, Inc. | | 156,790 | | | 10,293,264 |
| State Street Corp. | | 104,220 | | | 8,462,664 |
| SunTrust Banks, Inc. | | 175,060 | | | 10,939,499 |
| | | | | |
| | | | $ | 95,976,782 |
| | | | | |
| Medical & Health Technology & Services – 0.1% | | | |
| DaVita, Inc. (a) | | 34,650 | | $ | 1,952,528 |
| Omnicare, Inc. (l) | | 43,320 | | | 988,129 |
| | | | | |
| | | | $ | 2,940,657 |
| | | | | |
| Medical Equipment – 0.5% | | | | | |
| Advanced Medical Optics, Inc. (a) | | 83,000 | | $ | 2,035,990 |
| Boston Scientific Corp. (a) | | 332,960 | | | 3,872,325 |
| Cooper Cos., Inc. (l) | | 36,560 | | | 1,389,280 |
| Pall Corp. | | 63,600 | | | 2,564,352 |
| | | | | |
| | | | $ | 9,861,947 |
| | | | | |
| Metals & Mining – 0.3% | | | | | |
| Allegheny Technologies, Inc. | | 23,220 | | $ | 2,006,208 |
| BHP Billiton PLC | | 85,060 | | | 2,617,694 |
| Century Aluminum Co. (a) | | 37,870 | | | 2,042,708 |
| | | | | |
| | | | $ | 6,666,610 |
| | | | | |
| Natural Gas – Distribution – 0.4% | | | | | |
| Sempra Energy | | 113,470 | | $ | 7,021,524 |
| | | | | |
| Natural Gas – Pipeline – 0.4% | | | | | |
| Williams Cos., Inc. | | 249,000 | | $ | 8,909,220 |
| | | | | |
| Network & Telecom – 0.2% | | | | | |
| Motorola, Inc. | | 107,670 | | $ | 1,727,027 |
| Nortel Networks Corp. (a)(l) | | 94,749 | | | 1,429,762 |
| | | | | |
| | | | $ | 3,156,789 |
| | | | | |
| Oil Services – 0.2% | | | | | |
| Halliburton Co. | | 54,340 | | $ | 2,060,029 |
| Noble Corp. | | 47,530 | | | 2,685,920 |
| | | | | |
| | | | $ | 4,745,949 |
| | | | | |
| Other Banks & Diversified Financials – 2.9% | | | |
| American Express Co. | | 150,700 | | $ | 7,839,414 |
| Citigroup, Inc. | | 556,783 | | | 16,391,692 |
| Fannie Mae | | 297,540 | | | 11,895,649 |
| Freddie Mac | | 93,390 | | | 3,181,797 |
| New York Community Bancorp, Inc. (l) | | 409,790 | | | 7,204,108 |
| UBS AG | | 138,398 | | | 6,427,121 |
| UBS AG | | 109,730 | | | 5,047,580 |
| | | | | |
| | | | $ | 57,987,361 |
| | | | | |
| Pharmaceuticals – 3.6% | | | | | |
| Abbott Laboratories | | 45,080 | | $ | 2,531,242 |
8
Portfolio of Investments – continued
| | | | | |
| Issuer | | Shares/Par | | Value ($) |
| | | | | |
| | | | | |
| COMMON STOCKS – continued | | | | | |
| Pharmaceuticals – continued | | | | | |
| Eli Lilly & Co. | | 58,630 | | $ | 3,130,256 |
| GlaxoSmithKline PLC | | 82,580 | | | 2,095,619 |
| Johnson & Johnson | | 304,840 | | | 20,332,828 |
| Merck & Co., Inc. | | 269,440 | | | 15,657,158 |
| Merck KGaA | | 25,580 | | | 3,285,987 |
| Pfizer, Inc. | | 82,740 | | | 1,880,680 |
| Warner Chilcott Ltd., “A” (a)(l) | | 89,080 | | | 1,579,388 |
| Wyeth | | 469,940 | | | 20,766,649 |
| | | | | |
| | | | $ | 71,259,807 |
| | | | | |
| Printing & Publishing – 0.1% | | | | | |
| New York Times Co., “A” (l) | | 94,780 | | $ | 1,661,493 |
| | | | | |
| Railroad & Shipping – 0.5% | | | | | |
| Burlington Northern Santa Fe Corp. | | 70,580 | | $ | 5,874,373 |
| Norfolk Southern Corp. | | 67,480 | | | 3,403,691 |
| | | | | |
| | | | $ | 9,278,064 |
| | | | | |
| Specialty Chemicals – 0.5% | | | | | |
| Air Products & Chemicals, Inc. | | 74,010 | | $ | 7,299,606 |
| Praxair, Inc. | | 24,050 | | | 2,133,476 |
| | | | | |
| | | | $ | 9,433,082 |
| | | | | |
| Specialty Stores – 0.5% | | | | | |
| Advance Auto Parts, Inc. | | 22,160 | | $ | 841,858 |
| Lowe’s Cos., Inc. | | 25,040 | | | 566,405 |
| Staples, Inc. | | 380,600 | | | 8,780,442 |
| | | | | |
| | | | $ | 10,188,705 |
| | | | | |
| Telecommunications – Wireless – 0.3% | | | | | |
| Sprint Nextel Corp. | | 185,490 | | $ | 2,435,484 |
| Vodafone Group PLC, ADR | | 115,437 | | | 4,308,109 |
| | | | | |
| | | | $ | 6,743,593 |
| | | | | |
| Telephone Services – 2.7% | | | | | |
| AT&T, Inc. | | 478,586 | | $ | 19,890,034 |
| Embarq Corp. | | 238,899 | | | 11,832,667 |
| Qwest Communications International, Inc. (l) | | 1,531,970 | | | 10,739,110 |
| TELUS Corp. | | 59,420 | | | 2,976,569 |
| TELUS Corp. (non-voting shares) | | 77,801 | | | 3,784,615 |
| Verizon Communications, Inc. | | 97,950 | | | 4,279,436 |
| | | | | |
| | | | $ | 53,502,431 |
| | | | | |
| Tobacco – 1.7% | | | | | |
| Altria Group, Inc. | | 462,690 | | $ | 34,970,110 |
| | | | | |
| Trucking – 0.2% | | | | | |
| United Parcel Service, Inc., “B” | | 57,150 | | $ | 4,041,648 |
| | | | | |
| Utilities – Electric Power – 2.8% | | | | | |
| American Electric Power Co., Inc. | | 94,390 | | $ | 4,394,798 |
| Dominion Resources, Inc. | | 103,748 | | | 4,922,843 |
| DPL, Inc. (l) | | 144,100 | | | 4,272,565 |
| Entergy Corp. | | 26,830 | | | 3,206,722 |
| FPL Group, Inc. | | 185,590 | | | 12,579,290 |
| NRG Energy, Inc. (a)(l) | | 137,540 | | | 5,960,984 |
| Pepco Holdings, Inc. | | 84,720 | | | 2,484,838 |
| PG&E Corp. | | 132,900 | | | 5,726,661 |
| PPL Corp. | | 25,520 | | | 1,329,337 |
| Public Service Enterprise Group, Inc. | | 109,090 | | | 10,717,002 |
| | | | | |
| | | | $ | 55,595,040 |
| | | | | |
Total Common Stocks
(Identified Cost, $1,017,276,447) | | | | $ | 1,175,676,904 |
| | | | | |
| | | | | | |
| Issuer | | Shares/Par | | Value ($) |
| | | | | | |
| | | | | | |
| | | | | | |
| BONDS – 39.9% | | | | | | |
| Agency – Other – 0.0% | | | | | | |
| Financing Corp., 9.65%, 2018 | | $ | 490,000 | | $ | 697,961 |
| | | | | | |
| Asset Backed & Securitized – 2.7% | | | | | | |
| Banc of America Commercial Mortgage, Inc., FRN, 5.482%, 2049 | | $ | 448,627 | | $ | 442,321 |
| Bayview Financial Revolving Mortgage Loan Trust, FRN, 5.6%, 2040 (z) | | | 1,850,000 | | | 1,480,000 |
BlackRock Capital Finance LP,
7.75%, 2026 (n) | | | 170,910 | | | 160,827 |
| Chase Commercial Mortgage Securities Corp., 7.543%, 2032 | | | 315,569 | | | 318,718 |
| Countrywide Asset-Backed Certificates, FRN, 4.575%, 2035 | | | 22,990 | | | 22,831 |
| Countrywide Asset-Backed Certificates, FRN, 4.823%, 2035 | | | 421,724 | | | 418,970 |
| Countrywide Asset-Backed Certificates, FRN, 5.689%, 2046 | | | 1,120,000 | | | 1,044,289 |
| Credit Suisse Commercial Mortgage Trust, 5.509%, 2039 | | | 1,449,204 | | | 1,425,705 |
| Credit Suisse Mortgage Capital Certificate, 5.343%, 2039 | | | 893,965 | | | 868,289 |
| CRIIMI MAE Commercial Mortgage Trust, CDO, 7%, 2033 (n) | | | 102,262 | | | 102,990 |
Falcon Franchise Loan LLC,
7.382%, 2010 (n) | | | 45,143 | | | 44,651 |
| GE Commercial Mortgage Corp., FRN, 5.339%, 2044 | | | 1,330,000 | | | 1,310,396 |
| GMAC Mortgage Corp. Loan Trust, FRN, 5.805%, 2036 | | | 1,316,000 | | | 1,073,136 |
| Greenwich Capital Commercial Funding Corp., 4.305%, 2042 | | | 1,644,482 | | | 1,624,080 |
| Greenwich Capital Commercial Funding Corp., FRN, 5.317%, 2036 | | | 625,465 | | | 636,518 |
| JPMorgan Chase Commercial Mortgage Securities Corp., 4.78%, 2042 | | | 1,620,000 | | | 1,524,530 |
| JPMorgan Chase Commercial Mortgage Securities Corp., 5.552%, 2045 | | | 1,012,000 | | | 1,026,840 |
| JPMorgan Chase Commercial Mortgage Securities Corp., 5.372%, 2047 | | | 2,020,000 | | | 1,971,632 |
| JPMorgan Chase Commercial Mortgage Securities Corp., FRN, 5.21%, 2041 | | | 1,985,000 | | | 2,017,342 |
| JPMorgan Chase Commercial Mortgage Securities Corp., FRN, 5.475%, 2043 | | | 2,420,000 | | | 2,447,237 |
| JPMorgan Chase Commercial Mortgage Securities Corp., FRN, 5.855%, 2043 | | | 2,350,000 | | | 2,378,704 |
| JPMorgan Chase Commercial Mortgage Securities Corp., FRN, 5.875%, 2045 | | | 2,420,000 | | | 2,517,919 |
| JPMorgan Chase Commercial Mortgage Securities Corp., FRN, 5.038%, 2046 | | | 2,097,327 | | | 2,038,391 |
| JPMorgan Chase Commercial Mortgage Securities Corp., FRN, 5.532%, 2047 | | | 933,070 | | | 767,042 |
| Merrill Lynch Mortgage Trust, FRN, 5.829%, 2017 | | | 999,000 | | | 895,301 |
| Merrill Lynch/Countrywide Commercial Mortgage Trust, FRN, 5.477%, 2039 | | | 1,140,000 | | | 1,134,430 |
| Morgan Stanley Capital I, Inc., 5.168%, 2042 | | | 859,244 | | | 842,751 |
9
Portfolio of Investments – continued
| | | | | | |
| Issuer | | Shares/Par | | Value ($) |
| | | | | | |
| | | | | | |
| BONDS – continued | | | | | | |
| Asset Backed & Securities – continued | | | |
| Morgan Stanley Capital I, Inc., FRN, 0.522%, 2030 (i)(n) | | $ | 52,931,153 | | $ | 447,956 |
| Multi-Family Capital Access One, Inc., 6.65%, 2024 | | | 238,621 | | | 239,380 |
| Nomura Asset Securities Corp., FRN, 9.779%, 2027 (z) | | | 2,598,672 | | | 2,896,902 |
| Residential Asset Mortgage Products, Inc., FRN, 4.97%, 2034 | | | 931,000 | | | 890,026 |
| Residential Asset Mortgage Products, Inc., 4.109%, 2035 | | | 446,047 | | | 442,364 |
| Residential Funding Mortgage Securities, Inc., FRN, 5.32%, 2035 | | | 1,405,000 | | | 1,289,657 |
| Spirit Master Funding LLC, 5.05%, 2023 (z) | | | 1,604,990 | | | 1,574,527 |
| Structured Asset Securities Corp., FRN, 4.67%, 2035 | | | 2,083,008 | | | 2,080,003 |
| Wachovia Bank Commercial Mortgage Trust, 4.75%, 2044 | | | 2,500,000 | | | 2,348,198 |
| Wachovia Bank Commercial Mortgage Trust, FRN, 4.847%, 2041 | | | 2,000,000 | | | 1,928,080 |
| Wachovia Bank Commercial Mortgage Trust, FRN, 5.083%, 2042 | | | 2,033,724 | | | 1,986,901 |
| Wachovia Bank Commercial Mortgage Trust, FRN, 5.513%, 2043 | | | 659,000 | | | 575,477 |
| Wachovia Bank Commercial Mortgage Trust, FRN, 5.466%, 2045 | | | 2,205,000 | | | 2,178,816 |
| Wachovia Bank Commercial Mortgage Trust, FRN, 5.961%, 2045 | | | 1,660,000 | | | 1,700,358 |
| Wachovia Bank Commercial Mortgage Trust, FRN, 5.795%, 2045 | | | 1,710,000 | | | 1,716,831 |
| Wachovia Bank Commercial Mortgage Trust, FRN, 5.776%, 2047 | | | 1,181,000 | | | 978,084 |
| | | | | | |
| | | | | $ | 53,809,400 |
| | | | | | |
| Automotive – 0.1% | | | | | | |
| Johnson Controls, Inc., 5.5%, 2016 | | $ | 1,608,000 | | $ | 1,584,424 |
| | | | | | |
| Broadcasting – 0.2% | | | | | | |
| CBS Corp., 6.625%, 2011 | | $ | 1,595,000 | | $ | 1,654,380 |
| News America Holdings, 8.5%, 2025 | | | 1,154,000 | | | 1,375,206 |
| News America, Inc., 6.2%, 2034 | | | 476,000 | | | 469,236 |
| | | | | | |
| | | | | $ | 3,498,822 |
| | | | | | |
| Brokerage & Asset Managers – 0.5% | | | | | | |
Goldman Sachs Group, Inc.,
5.625%, 2017 | | $ | 2,111,000 | | $ | 2,061,552 |
Lehman Brothers Holdings, Inc.,
6.5%, 2017 | | | 2,100,000 | | | 2,124,900 |
| Merrill Lynch & Co., Inc., 6.05%, 2016 | | | 1,388,000 | | | 1,363,809 |
| Merrill Lynch & Co., Inc., 6.11%, 2037 | | | 1,440,000 | | | 1,271,794 |
| Morgan Stanley, 5.75%, 2016 | | | 1,145,000 | | | 1,129,848 |
Morgan Stanley Group, Inc.,
6.75%, 2011 | | | 1,530,000 | | | 1,603,657 |
| | | | | | |
| | | | | $ | 9,555,560 |
| | | | | | |
| Building – 0.1% | | | | | | |
| CRH America, Inc., 6.95%, 2012 | | $ | 1,847,000 | | $ | 1,953,040 |
| | | | | | |
| | | | | | |
| Issuer | | Shares/Par | | Value ($) |
| | | | | | |
| | | | | | |
| BONDS – continued | | | | | | |
| Business Services – 0.1% | | | | | | |
| Xerox Corp., 5.5%, 2012 | | $ | 920,000 | | $ | 935,288 |
| Xerox Corp., 6.4%, 2016 | | | 470,000 | | | 480,943 |
| | | | | | |
| | | | | $ | 1,416,231 |
| | | | | | |
| Cable TV – 0.2% | | | | | | |
| Cox Communications, Inc., 4.625%, 2013 | | $ | 1,624,000 | | $ | 1,553,697 |
| | | | | | |
| Time Warner Entertainment Co. LP, 8.375%, 2033 | | | 1,330,000 | | | 1,602,129 |
| | | | | | |
| | | | | $ | 3,155,826 |
| | | | | | |
| Conglomerates – 0.1% | | | | | | |
| General Electric Co., 5.25%, 2017 | | $ | 940,000 | | $ | 937,994 |
| Kennametal, Inc., 7.2%, 2012 | | | 1,780,000 | | | 1,934,358 |
| | | | | | |
| | | | | $ | 2,872,352 |
| | | | | | |
| Consumer Goods & Services – 0.2% | | | | | | |
| Fortune Brands, Inc., 5.125%, 2011 | | $ | 1,671,000 | | $ | 1,667,610 |
| Western Union Co., 5.4%, 2011 | | | 2,300,000 | | | 2,317,597 |
| | | | | | |
| | | | | $ | 3,985,207 |
| | | | | | |
| Defense Electronics – 0.0% | | | | | | |
BAE Systems Holdings, Inc.,
5.2%, 2015 (n) | | $ | 753,000 | | $ | 731,182 |
| | | | | | |
| Electronics – 0.1% | | | | | | |
| Tyco Electronics Ltd., 6.55%, 2017 (n) | | $ | 1,492,000 | | $ | 1,534,628 |
| | | | | | |
| Emerging Market Quasi-Sovereign – 0.1% | | | |
| Ras Laffan Liquefied Natural Gas Co. Ltd., 5.832%, 2016 (n) | | $ | 1,130,000 | | $ | 1,148,283 |
| | | | | | |
| Emerging Market Sovereign – 0.0% | | | | | | |
| State of Israel, 4.625%, 2013 | | $ | 981,000 | | $ | 966,648 |
| | | | | | |
| Energy – Independent – 0.3% | | | | | | |
| Nexen, Inc., 5.875%, 2035 | | $ | 1,200,000 | | $ | 1,130,652 |
| Ocean Energy, Inc., 7.25%, 2011 | | | 2,246,000 | | | 2,440,960 |
| XTO Energy, Inc., 5.65%, 2016 | | | 2,120,000 | | | 2,135,060 |
| | | | | | |
| | | | | $ | 5,706,672 |
| | | | | | |
| Financial Institutions – 0.6% | | | | | | |
| American Express Co., 5.5%, 2016 | | $ | 2,360,000 | | $ | 2,346,121 |
| Capital One Financial Co., 6.15%, 2016 | | | 1,540,000 | | | 1,366,519 |
| Capmark Financial Group, Inc., 5.875%, 2012 (n) | | | 1,970,000 | | | 1,559,381 |
| CIT Group, Inc., 6.1% to 2017, FRN to 2067 | | | 200,000 | | | 145,220 |
| Countrywide Financial Corp., 6.25%, 2016 | | | 1,892,000 | | | 1,088,975 |
| General Electric Capital Corp., 5.45%, 2013 | | | 179,000 | | | 184,490 |
| General Electric Capital Corp., 5.375%, 2016 | | | 740,000 | | | 749,443 |
| HSBC Finance Corp., 5.25%, 2011 | | | 1,510,000 | | | 1,509,490 |
| ORIX Corp., 5.48%, 2011 | | | 2,290,000 | | | 2,289,927 |
| | | | | | |
| | | | | $ | 11,239,566 |
| | | | | | |
| Food & Beverages – 0.4% | | | | | | |
| Coca Cola Co., 5.35%, 2017 | | $ | 1,840,000 | | $ | 1,885,157 |
| Diageo Finance B.V., 5.5%, 2013 | | | 2,560,000 | | | 2,597,240 |
10
Portfolio of Investments – continued
| | | | | | |
| Issuer | | Shares/Par | | Value ($) |
| | | | | | |
| BONDS – continued | | | | | | |
| Food & Beverages – continued | | | | | | |
| Miller Brewing Co., 5.5%, 2013 (n) | | $ | 2,985,000 | | $ | 3,024,695 |
| | | | | | |
| | | | | $ | 7,507,092 |
| | | | | | |
| Food & Drug Stores – 0.1% | | | | | | |
| CVS Caremark Corp., 6.125%, 2016 | | $ | 1,140,000 | | $ | 1,170,193 |
| CVS Caremark Corp., 5.75%, 2017 | | | 860,000 | | | 865,535 |
| | | | | | |
| | | | | $ | 2,035,728 |
| | | | | | |
| Forest & Paper Products – 0.0% | | | | | | |
| MeadWestvaco Corp., 6.8%, 2032 | | $ | 724,000 | | $ | 681,875 |
| | | | | | |
| Gaming & Lodging – 0.1% | | | | | | |
| Marriott International, Inc., 6.375%, 2017 | | $ | 1,890,000 | | $ | 1,939,097 |
| Wyndham Worldwide Corp., 6%, 2016 | | | 1,146,000 | | | 1,086,866 |
| | | | | | |
| | | | | $ | 3,025,963 |
| | | | | | |
| Insurance – 0.3% | | | | | | |
| American International Group, Inc., 6.25%, 2037 | | $ | 1,620,000 | | $ | 1,448,959 |
| ING Groep N.V., 5.775% to 2015, FRN to 2049 | | | 2,555,000 | | | 2,362,087 |
| MetLife, Inc., 6.5%, 2032 | | | 578,000 | | | 581,623 |
| MetLife, Inc., 6.4%, 2036 | | | 1,440,000 | | | 1,319,747 |
| | | | | | |
| | | | | $ | 5,712,416 |
| | | | | | |
| Insurance – Property & Casualty – 0.4% | | | |
| Allstate Corp., 6.125%, 2032 | | $ | 1,617,000 | | $ | 1,569,874 |
| Chubb Corp., 6.375% to 2017, FRN to 2037 | | | 2,340,000 | | | 2,282,464 |
| Fund American Cos., Inc., 5.875%, 2013 | | | 1,110,000 | | | 1,112,395 |
ZFS Finance USA Trust IV,
5.875% to 2012, FRN to 2032 (n) | | | 500,000 | | | 460,742 |
| ZFS Finance USA Trust V, 6.5% to 2017, FRN to 2037 (n) | | | 2,080,000 | | | 1,920,231 |
| | | | | | |
| | | | | $ | 7,345,706 |
| | | | | | |
| International Market Quasi-Sovereign – 0.2% | | | |
| Hydro-Quebec, 6.3%, 2011 | | $ | 2,256,000 | | $ | 2,415,770 |
| Province of Ontario, 5%, 2011 | | | 2,280,000 | | | 2,356,129 |
| | | | | | |
| | | | | $ | 4,771,899 |
| | | | | | |
| Machinery & Tools – 0.1% | | | | | | |
| Atlas Copco AB, 5.6%, 2017 (n) | | $ | 1,760,000 | | $ | 1,760,642 |
| | | | | | |
| Major Banks – 0.9% | | | | | | |
| Bank of America Corp., 5.3%, 2017 | | $ | 1,390,000 | | $ | 1,351,603 |
| Bank of America Corp., 5.49%, 2019 | | | 729,000 | | | 696,613 |
BNP Paribas, 7.195% to 2037,
FRN to 2049 (n) | | | 1,500,000 | | | 1,478,865 |
| DBS Capital Funding Corp., 7.657% to 2011, FRN to 2049 (n) | | | 1,476,000 | | | 1,577,187 |
| MUFG Capital Finance 1 Ltd., 6.346% to 2016, FRN to 2049 | | | 1,638,000 | | | 1,551,405 |
| Natexis AMBS Co. LLC, 8.44% to 2008, FRN to 2049 (n) | | | 135,000 | | | 137,748 |
| PNC Funding Corp., 5.625%, 2017 | | | 1,180,000 | | | 1,148,441 |
| Royal Bank of Scotland Group PLC, 6.99% to 2017, FRN to 2049 (n) | | | 730,000 | | | 727,804 |
| | | | | | |
| Issuer | | Shares/Par | | Value ($) |
| | | | | | |
| BONDS – continued | | | | | | |
| Major Banks – continued | | | | | | |
| UniCredito Italiano Capital Trust II, 9.2% to 2010, FRN to 2049 (n) | | $ | 1,509,000 | | $ | 1,644,458 |
| Unicredito Luxembourg Finance S.A., 6%, 2017 (n) | | | 1,610,000 | | | 1,594,092 |
| Wachovia Corp., 5.25%, 2014 | | | 787,000 | | | 769,478 |
| Wells Fargo National Bank, 4.75%, 2015 | | | 3,338,000 | | | 3,188,177 |
| Wells Fargo National Bank, 5.75%, 2016 | | | 1,925,000 | | | 1,953,076 |
| | | | | | |
| | | | | $ | 17,818,947 |
| | | | | | |
| Medical & Health Technology & Services – 0.3% |
| Baxter International, Inc., 5.9%, 2016 | | $ | 1,622,000 | | $ | 1,685,321 |
| Cardinal Health, Inc., 6.3%, 2016 (n) | | | 856,000 | | | 877,340 |
| Covidien Ltd., 6%, 2017 (n) | | | 660,000 | | | 682,924 |
| Covidien Ltd., 6.55%, 2037 (n) | | | 400,000 | | | 415,414 |
| HCA, Inc., 8.75%, 2010 | | | 355,000 | | | 358,106 |
| Hospira, Inc., 5.55%, 2012 | | | 570,000 | | | 579,618 |
| Hospira, Inc., 6.05%, 2017 | | | 2,020,000 | | | 2,029,702 |
| | | | | | |
| | | | | $ | 6,628,425 |
| | | | | | |
| Metals & Mining – 0.1% | | | | | | |
| Vale Overseas Ltd., 6.25%, 2017 | | $ | 1,650,000 | | $ | 1,655,123 |
| | | | | | |
| Mortgage Backed – 15.1% | | | | | | |
| Fannie Mae, 4.01%, 2013 | | $ | 188,803 | | $ | 183,346 |
| Fannie Mae, 4.547%, 2014 | | | 1,267,522 | | | 1,258,699 |
| Fannie Mae, 4.63%, 2014 | | | 471,295 | | | 469,370 |
| Fannie Mae, 4.839%, 2014 | | | 880,921 | | | 886,758 |
| Fannie Mae, 4.88%, 2014 | | | 319,367 | | | 321,246 |
| Fannie Mae, 4.56%, 2015 | | | 312,549 | | | 308,334 |
| Fannie Mae, 4.7%, 2015 | | | 673,184 | | | 669,319 |
| Fannie Mae, 4.78%, 2015 | | | 446,503 | | | 444,956 |
| Fannie Mae, 4.856%, 2015 | | | 319,144 | | | 316,536 |
| Fannie Mae, 4.925%, 2015 | | | 3,098,189 | | | 3,121,761 |
| Fannie Mae, 5.034%, 2015 | | | 139,880 | | | 141,594 |
| Fannie Mae, 5.09%, 2016 | | | 460,000 | | | 464,473 |
| Fannie Mae, 5.5%, 2016-2037 | | | 89,263,135 | | | 89,421,944 |
| Fannie Mae, 5.05%, 2017 | | | 460,000 | | | 463,196 |
| Fannie Mae, 6%, 2017-2037 | | | 50,031,583 | | | 50,919,053 |
| Fannie Mae, 4.5%, 2018-2035 | | | 9,173,315 | | | 8,908,462 |
| Fannie Mae, 5%, 2018-2036 | | | 31,821,666 | | | 31,364,423 |
| Fannie Mae, 7.5%, 2030-2031 | | | 289,362 | | | 308,822 |
| Fannie Mae, 6.5%, 2031-2037 | | | 13,974,069 | | | 14,403,693 |
| Freddie Mac, 6%, 2016-2037 | | | 21,132,874 | | | 21,492,044 |
| Freddie Mac, 5%, 2017-2035 | | | 23,897,394 | | | 23,481,533 |
| Freddie Mac, 4.5%, 2018-2035 | | | 9,497,063 | | | 9,279,852 |
| Freddie Mac, 5.5%, 2019-2036 | | | 23,165,610 | | | 23,206,723 |
| Freddie Mac, 6.5%, 2034-2037 | | | 5,183,711 | | | 5,335,194 |
| Ginnie Mae, 4.5%, 2033-2034 | | | 1,545,697 | | | 1,467,460 |
| Ginnie Mae, 5%, 2033-2034 | | | 1,630,675 | | | 1,605,422 |
| Ginnie Mae, 5.5%, 2033-2035 | | | 7,265,153 | | | 7,318,887 |
| Ginnie Mae, 6%, 2033-2035 | | | 4,822,071 | | | 4,937,996 |
| Ginnie Mae, 6.5%, 2035-2036 | | | 792,057 | | | 818,618 |
| | | | | | |
| | | | | $ | 303,319,714 |
| | | | | | |
| Municipals – 0.1% | | | |
| Massachusetts Bay Transportation Authority, 5.25%, 2017 | | $ | 1,540,000 | | $ | 1,723,044 |
11
Portfolio of Investments – continued
| | | | | | |
| Issuer | | Shares/Par | | Value ($) |
| | | | | | |
| BONDS – continued | | | | | | |
| Natural Gas – Pipeline – 0.3% | | | | | | |
| CenterPoint Energy Resources Corp., 7.875%, 2013 | | $ | 1,285,000 | | $ | 1,410,913 |
| Kinder Morgan Energy Partners LP, 6.75%, 2011 | | | 740,000 | | | 776,300 |
| Kinder Morgan Energy Partners LP, 5.125%, 2014 | | | 956,000 | | | 931,478 |
| Kinder Morgan Energy Partners LP, 7.4%, 2031 | | | 804,000 | | | 865,696 |
| Kinder Morgan Energy Partners LP, 7.75%, 2032 | | | 590,000 | | | 659,021 |
| Spectra Energy Capital LLC, 8%, 2019 | | | 987,000 | | | 1,137,058 |
| | | | | | |
| | | | | $ | 5,780,466 |
| | | | | | |
| Network & Telecom – 0.7% | | | | | | |
| AT&T, Inc., 6.5%, 2037 | | $ | 1,619,000 | | $ | 1,692,953 |
| BellSouth Corp., 6.55%, 2034 | | | 1,472,000 | | | 1,522,495 |
| Deutsche Telekom International Finance B.V., 5.75%, 2016 | | | 2,086,000 | | | 2,087,955 |
| Telecom Italia Capital, 5.25%, 2013 | | | 752,000 | | | 743,224 |
| Telefonica Emisiones S.A.U., 7.045%, 2036 | | | 1,150,000 | | | 1,285,454 |
| Telefonica Europe B.V., 7.75%, 2010 | | | 750,000 | | | 802,765 |
| TELUS Corp., 8%, 2011 | | | 2,058,000 | | | 2,229,779 |
| Verizon New York, Inc., 6.875%, 2012 | | | 4,213,000 | | | 4,470,022 |
| | | | | | |
| | | | | $ | 14,834,647 |
| | | | | | |
| Oil Services – 0.0% | | | | | | |
| Weatherford International, Inc., 6.35%, 2017 (n) | | $ | 520,000 | | $ | 537,501 |
| | | | | | |
| Oils – 0.1% | | | | | | |
| Valero Energy Corp., 6.875%, 2012 | | $ | 1,193,000 | | $ | 1,272,994 |
| | | | | | |
| Other Banks & Diversified Financials – 0.6% | | | |
| Commonwealth Bank, 5%, 2012 (n) | | $ | 2,760,000 | | $ | 2,816,707 |
| Mizuho Capital Investment 1 Ltd., 6.686% to 2016, FRN to 2049 (n) | | | 2,140,000 | | | 2,002,248 |
| Nordea Bank AB, 5.424% to 2015, FRN to 2049 (n) | | | 1,019,000 | | | 921,286 |
| UBS Preferred Funding Trust V, 6.243% to 2016, FRN to 2049 | | | 2,140,000 | | | 2,060,518 |
| UFJ Finance Aruba AEC, 6.75%, 2013 | | | 1,624,000 | | | 1,764,265 |
| Woori Bank, 6.125% to 2011, FRN to 2016 (n) | | | 2,715,000 | | | 2,728,974 |
| | | | | | |
| | | | | $ | 12,293,998 |
| | | | | | |
| Pharmaceuticals – 0.1% | | | | | | |
| Allergan, Inc., 5.75%, 2016 | | $ | 1,720,000 | | $ | 1,761,755 |
| | | | | | |
| Pollution Control – 0.1% | | | | | | |
| Waste Management, Inc., 7.375%, 2010 | | $ | 1,341,000 | | $ | 1,416,496 |
| | | | | | |
| Railroad & Shipping – 0.1% | | | | | | |
| CSX Corp., 6.75%, 2011 | | $ | 450,000 | | $ | 472,210 |
| CSX Corp., 7.9%, 2017 | | | 1,350,000 | | | 1,512,541 |
| | | | | | |
| | | | | $ | 1,984,751 |
| | | | | | |
| Real Estate – 0.5% | | | | | | |
| Boston Properties, Inc., REIT, 5%, 2015 | | $ | 369,000 | | $ | 341,836 |
| ERP Operating LP, REIT, 5.75%, 2017 | | | 2,030,000 | | | 1,933,078 |
| | | | | | |
| Issuer | | Shares/Par | | Value ($) |
| | | | | | |
| BONDS – continued | | | | | | |
| Real Estate – continued | | | | | | |
HRPT Properties Trust, REIT, 6.25%, 2016 | | $ | 1,945,000 | | $ | 1,848,933 |
Kimco Realty Corp., REIT, 5.783%, 2016 | | | 1,090,000 | | | 1,052,345 |
| ProLogis, REIT, 5.75%, 2016 | | | 1,992,000 | | | 1,869,771 |
| Simon Property Group LP, REIT, 5.1%, 2015 | | | 1,070,000 | | | 1,006,002 |
| Simon Property Group LP, REIT, 5.875%, 2017 | | | 1,131,000 | | | 1,084,174 |
| Vornado Realty Trust, REIT, 4.75%, 2010 | | | 189,000 | | | 188,578 |
| | | | | | |
| | | | | $ | 9,324,717 |
| | | | | | |
| Retailers – 0.2% | | | | | | |
| Federated Retail Holdings, Inc., 5.35%, 2012 | | $ | 540,000 | | $ | 526,120 |
| Home Depot, Inc., 5.875%, 2036 | | | 1,410,000 | | | 1,189,900 |
| Limited Brands, Inc., 5.25%, 2014 | | | 1,504,000 | | | 1,349,950 |
| Wal-Mart Stores, Inc., 5.25%, 2035 | | | 2,241,000 | | | 1,987,798 |
| | | | | | |
| | | | | $ | 5,053,768 |
| | | | | | |
| Supermarkets – 0.0% | | | | | | |
| Kroger Co., 6.4%, 2017 | | $ | 370,000 | | $ | 386,988 |
| | | | | | |
| Supranational – 0.5% | | | | | | |
| European Investment Bank, 5.125%, 2017 | | $ | 10,682,000 | | $ | 11,143,964 |
| | | | | | |
| Telecommunications – Wireless – 0.2% | | | |
| Cingular Wireless LLC, 6.5%, 2011 | | $ | 693,000 | | $ | 729,568 |
| Nextel Communications, Inc., 5.95%, 2014 | | | 2,055,000 | | | 1,931,636 |
| Vodafone Group PLC, 5.625%, 2017 | | | 2,102,000 | | | 2,093,075 |
| | | | | | |
| | | | | $ | 4,754,279 |
| | | | | | |
| U.S. Government Agencies – 1.5% | | | | | | |
| Fannie Mae, 6.625%, 2009-2010 | | $ | 9,527,000 | | $ | 10,139,802 |
| Fannie Mae, 6%, 2011 | | | 1,539,000 | | | 1,651,510 |
| Federal Home Loan Bank, 3.9%, 2008 | | | 1,240,000 | | | 1,238,671 |
| Freddie Mac, 5.5%, 2017 | | | 8,500,000 | | | 9,120,271 |
| Small Business Administration, 4.77%, 2024 | | | 844,090 | | | 839,960 |
| Small Business Administration, 4.99%, 2024 | | | 1,259,173 | | | 1,265,895 |
| Small Business Administration, 5.18%, 2024 | | | 1,381,398 | | | 1,400,266 |
| Small Business Administration, 5.09%, 2025 | | | 1,318,185 | | | 1,328,103 |
| Small Business Administration, 5.11%, 2025 | | | 2,729,866 | | | 2,755,200 |
| Small Business Administration, 5.39%, 2025 | | | 954,037 | | | 973,542 |
| | | | | | |
| | | | | $ | 30,713,220 |
| | | | | | |
| U.S. Treasury Obligations – 10.3% | | | | | | |
| U.S. Treasury Bonds, 8%, 2021 | | $ | 320,000 | | $ | 437,950 |
| U.S. Treasury Bonds, 6%, 2026 | | | 2,999,000 | | | 3,549,131 |
| U.S. Treasury Bonds, 6.75%, 2026 | | | 12,027,000 | | | 15,394,560 |
| U.S. Treasury Bonds, 5.375%, 2031 | | | 21,514,000 | | | 24,238,554 |
| U.S. Treasury Bonds, 4.5%, 2036 | | | 1,096,000 | | | 1,101,565 |
| U.S. Treasury Notes, 5.5%, 2008 | | | 7,085,000 | | | 7,103,265 |
12
Portfolio of Investments – continued
| | | | | | |
| Issuer | | Shares/Par | | Value ($) |
| | | | | | |
| BONDS – continued | | | | | | |
| U.S. Treasury Obligations – continued | | | | | | |
| U.S. Treasury Notes, 5.625%, 2008 | | $ | 25,512,000 | | $ | 25,717,295 |
| U.S. Treasury Notes, 4.5%, 2009 | | | 16,770,000 | | | 17,050,378 |
| U.S. Treasury Notes, 4.875%, 2009 | | | 42,481,000 | | | 43,655,855 |
| U.S. Treasury Notes, 6.5%, 2010 | | | 10,736,000 | | | 11,479,973 |
| U.S. Treasury Notes, 5.125%, 2011 | | | 22,818,000 | | | 24,242,345 |
| U.S. Treasury Notes, 4.625%, 2012 | | | 1,800,000 | | | 1,890,000 |
| U.S. Treasury Notes, 4%, 2012 | | | 1,910,000 | | | 1,961,480 |
| U.S. Treasury Notes, 3.875%, 2013 | | | 10,719,000 | | | 10,933,380 |
| U.S. Treasury Notes, 4.25%, 2013 | | | 2,533,000 | | | 2,626,207 |
| U.S. Treasury Notes, 4.875%, 2016 | | $ | 14,160,000 | | $ | 15,078,191 |
| | | | | | |
| | | | | $ | 206,460,129 |
| | | | | | |
| Utilities – Electric Power – 1.3% | | | | | | |
| Bruce Mansfield Unit, 6.85%, 2034 | | $ | 2,580,000 | | $ | 2,594,163 |
| Dominion Resources, Inc., 5.15%, 2015 | | | 1,515,000 | | | 1,465,962 |
| EDP Finance B.V., 6%, 2018 (n) | | | 2,070,000 | | | 2,018,946 |
Enel Finance International,
6.25%, 2017 (n) | | | 2,050,000 | | | 2,074,424 |
| Exelon Generation Co. LLC, 6.95%, 2011 | | | 2,652,000 | | | 2,767,015 |
| Exelon Generation Co. LLC, 6.2%, 2017 | | | 930,000 | | | 924,261 |
| FirstEnergy Corp., 6.45%, 2011 | | | 2,246,000 | | | 2,319,256 |
| MidAmerican Energy Holdings Co., 3.5%, 2008 | | | 1,030,000 | | | 1,023,233 |
| MidAmerican Energy Holdings Co., 5.875%, 2012 | | | 535,000 | | | 554,521 |
MidAmerican Funding LLC,
6.927%, 2029 | | | 2,762,000 | | | 3,045,111 |
| | | | | | | |
| Issuer | | Shares/Par | | Value ($) | |
| | | | | | | |
| BONDS – continued | | | | | | | |
| Utilities – Electric Power – continued | | | | | | | |
| Oncor Electric Delivery Co., 7%, 2022 | | $ | 1,582,000 | | $ | 1,638,862 | |
| Pacific Gas & Electric Co., 4.8%, 2014 | | | 425,000 | | | 413,190 | |
| PSEG Power LLC, 6.95%, 2012 | | | 697,000 | | | 743,077 | |
| PSEG Power LLC, 5.5%, 2015 | | | 911,000 | | | 891,888 | |
System Energy Resources, Inc.,
5.129%, 2014 (n) | | | 821,619 | | | 841,469 | |
| Waterford 3 Funding Corp., 8.09%, 2017 | | | 2,012,533 | | | 2,013,318 | |
| | | | | | | |
| | | | | $ | 25,328,696 | |
| | | | | | | |
Total Bonds
(Identified Cost, $802,013,587) | | | | | $ | 800,890,745 | |
| | | | | | | |
| | |
| SHORT-TERM OBLIGATIONS – 1.1% | | | | | | | |
American Express Credit Corp., 4.12%, due 1/02/08, at
Amortized Cost and Value (y) | | $ | 22,562,000 | | $ | 22,559,418 | |
| | | | | | | |
| |
| COLLATERAL FOR SECURITIES LOANED – 3.6% | | | | |
| Navigator Securities Lending Prime Portfolio, at Cost and Net Asset Value | | | 72,991,993 | | $ | 72,991,993 | |
| | | | | | | |
Total Investments
(Identified Cost, $1,914,841,445) (k) | | | | | $ | 2,072,119,060 | |
| | | | | | | |
OTHER ASSETS, LESS
LIABILITIES – (3.2)% | | | | | | (63,676,134 | ) |
| | | | | | | |
| Net Assets – 100.0% | | | | | $ | 2,008,442,926 | |
| | | | | | | |
| (a) | Non-income producing security. |
| (i) | Interest only security for which the fund receives interest on notional principal (Par amount). Par amount shown is the notional principal and does not reflect the cost of the security. |
| (k) | As of December 31, 2007, the fund held securities fair valued in accordance with the policies adopted by the Board of Trustees, aggregating $800,890,745 and 38.65% of market value. All of these security values were provided by an independent pricing service using an evaluated bid. |
| (l) | All or a portion of this security is on loan. |
| (n) | Securities exempt from registration under Rule 144A of the Securities Act of 1933. These securities may be sold in the ordinary course of business in transactions exempt from registration, normally to qualified institutional buyers. At period end, the aggregate value of these securities was $35,973,595, representing 1.8% of net assets. |
| (y) | The rate shown represents an annualized yield at time of purchase. |
| (z) | Restricted securities are not registered under the Securities Act of 1933 and are subject to legal restrictions on resale. These securities generally may be resold in transactions exempt from registration or to the public if the securities are subsequently registered. Disposal of these securities may involve time-consuming negotiations and prompt sale at an acceptable price may be difficult. The fund holds the following restricted securities: |
| | | | | | |
| Restricted Securities | | Acquisition
Date | | Acquisition
Cost | | Current
Market Value |
| Bayview Financial Revolving Mortgage Loan Trust, FRN, 5.6%, 2040 | | 3/01/06 | | $1,850,000 | | $1,480,000 |
| KKR Private Equity Investments LP, IEU | | 5/03/06 | | 1,895,250 | | 1,376,710 |
| Nomura Asset Securities Corp., FRN, 9.779%, 2027 | | 7/16/07 | | 2,861,077 | | 2,896,902 |
| Spirit Master Funding LLC, 5.05%, 2023 | | 10/04/05 | | 1,584,301 | | 1,574,527 |
| Total Restricted Securities | | | | | | $7,328,139 |
| % of Net Assets | | | | | | 0.4% |
The following abbreviations are used in this report and are defined:
| ADR | American Depository Receipt |
| CDO | Collateralized Debt Obligation |
| FRN | Floating Rate Note. Interest rate resets periodically and may not be the rate reported at period end. |
| GDR | Global Depository Receipt |
| IEU | International Equity Unit |
| REIT | Real Estate Investment Trust |
See Portfolio Footnotes and Notes to Financial Statements
13
FINANCIAL STATEMENTS | STATEMENT OF ASSETS AND LIABILITIES
This statement represents your fund’s balance sheet, which details the assets and liabilities comprising the total value of the fund
| | | | |
| At 12/31/07 | | | | |
| Assets | | | | |
| Investments, at value, including $75,312,830 of securities on loan (identified cost, $1,914,841,445) | | $2,072,119,060 | | |
| Foreign currency, at value (identified cost, $39) | | 40 | | |
| Receivable for investments sold | | 1,462,232 | | |
| Receivable for fund shares sold | | 562,728 | | |
| Interest and dividends receivable | | 9,684,650 | | |
| Other assets | | 59,819 | | |
| Total assets | | | | $2,083,888,529 |
| Liabilities | | | | |
| Payable to custodian | | $7,057 | | |
| Payable for investments purchased | | 1,703,105 | | |
| Payable for fund shares reacquired | | 410,603 | | |
| Collateral for securities loaned, at value (c) | | 72,991,993 | | |
| Payable to affiliates | | | | |
Management fee | | 142,661 | | |
Distribution fees | | 27,195 | | |
Administrative services fee | | 5,064 | | |
Payable for independent trustees’ compensation | | 6,090 | | |
| Accrued expenses and other liabilities | | 151,835 | | |
| Total liabilities | | | | $75,445,603 |
| Net assets | | | | $2,008,442,926 |
| Net assets consist of | | | | |
| Paid-in capital | | $1,704,709,401 | | |
| Unrealized appreciation (depreciation) on investments and translation of assets and liabilities in foreign currencies | | 157,277,564 | | |
| Accumulated net realized gain (loss) on investments and foreign currency transactions | | 90,659,983 | | |
| Undistributed net investment income | | 55,795,978 | | |
| Net assets | | | | $2,008,442,926 |
| Shares of beneficial interest outstanding | | | | 103,440,483 |
| Initial Class shares | | | | |
Net assets | | $1,013,465,464 | | |
Shares outstanding | | 51,969,423 | | |
Net asset value per share | | | | $19.50 |
| Service Class shares | | | | |
Net assets | | $994,977,462 | | |
Shares outstanding | | 51,471,060 | | |
Net asset value per share | | | | $19.33 |
| (c) | Non-cash collateral not included |
See Notes to Financial Statements
14
FINANCIAL STATEMENTS | STATEMENT OF OPERATIONS
This statement describes how much your fund earned in investment income and accrued in expenses. It also describes any gains and/or losses generated by fund operations.
| | | | | | |
| Year ended 12/31/07 | | | | | | |
| Net Investment income | | | | | | |
| Income | | | | | | |
Interest | | $46,075,523 | | | | |
Dividends | | 25,145,352 | | | | |
Foreign taxes withheld | | (225,490 | ) | | | |
| Total investment income | | | | | $70,995,385 | |
| Expenses | | | | | | |
Management fee | | $13,608,437 | | | | |
Distribution fees | | 2,419,054 | | | | |
Administrative services fee | | 490,265 | | | | |
Independent trustees’ compensation | | 197,862 | | | | |
Custodian fee | | 185,522 | | | | |
Shareholder communications | | 49,331 | | | | |
Auditing fees | | 54,551 | | | | |
Legal fees | | 5,948 | | | | |
Miscellaneous | | 129,288 | | | | |
| Total expenses | | | | | $17,140,258 | |
Fees paid indirectly | | (19,739 | ) | | | |
| Net expenses | | | | | $17,120,519 | |
| Net investment income | | | | | $53,874,866 | |
| Realized and unrealized gain (loss) on investments and foreign currency transactions | | | | | | |
| Realized gain (loss) (identified cost basis) | | | | | | |
Investment transactions | | $107,190,039 | | | | |
Foreign currency transactions | | (37,075 | ) | | | |
| Net realized gain (loss) on investments and foreign currency transactions | | | | | $107,152,964 | |
| Change in unrealized appreciation (depreciation) | | | | | | |
Investments | | $(71,785,751 | ) | | | |
Translation of assets and liabilities in foreign currencies | | 588 | | | | |
| Net unrealized gain (loss) on investments and foreign currency translation | | | | | $(71,785,163 | ) |
| Net realized and unrealized gain (loss) on investments and foreign currency | | | | | $35,367,801 | |
| Change in net assets from operations | | | | | $89,242,667 | |
See Notes to Financial Statements
15
FINANCIAL STATEMENTS | STATEMENTS OF CHANGES IN NET ASSETS
These statements describe the increases and/or decreases in net assets resulting from operations, any distributions, and any shareholder transactions.
| | | | | | |
For years ended 12/31 | | 2007 | | | 2006 | |
| Change in net assets | | | | | | |
| From operations | | | | | | |
| Net investment income | | $53,874,866 | | | $57,119,322 | |
| Net realized gain (loss) on investments and foreign currency transactions | | 107,152,964 | | | 95,488,655 | |
| Net unrealized gain (loss) on investments and foreign currency translation | | (71,785,163 | ) | | 86,581,397 | |
| Change in net assets from operations | | $89,242,667 | | | $239,189,374 | |
| Distributions declared to shareholders | | | | | | |
| From net investment income | | | | | | |
Initial Class | | $(33,943,818 | ) | | $(35,643,946 | ) |
Service Class | | (25,872,154 | ) | | (20,867,672 | ) |
| From net realized gain on investments | | | | | | |
Initial Class | | (45,756,108 | ) | | (50,266,953 | ) |
Service Class | | (37,667,892 | ) | | (31,771,800 | ) |
| Total distributions declared to shareholders | | $(143,239,972 | ) | | $(138,550,371 | ) |
| Change in net assets from fund share transactions | | $(51,310,929 | ) | | $(128,122,864 | ) |
| Total change in net assets | | $(105,308,234 | ) | | $(27,483,861 | ) |
| Net assets | | | | | | |
| At beginning of period | | 2,113,751,160 | | | 2,141,235,021 | |
At end of period (including undistributed net investment income of $55,795,978 and $59,810,962, respectively) | | $2,008,442,926 | | | $2,113,751,160 | |
See Notes to Financial Statements
16
FINANCIAL STATEMENTS | FINANCIAL HIGHLIGHTS
The financial highlights table is intended to help you understand the fund’s financial performance for the past 5 years. Certain information reflects financial results for a single fund share. The total returns in the table represent the rate by which an investor would have earned (or lost) on an investment in the fund share class (assuming reinvestment of all distributions) held for the entire period.
Initial Class
| | | | | | | | | | | | | | | |
| | | Years Ended 12/31 | |
| | | 2007 | | | 2006 | | | 2005 | | | 2004 | | | 2003 | |
| Net asset value, beginning of period | | $20.02 | | | $19.10 | | | $19.55 | | | $18.00 | | | $15.90 | |
| Income (loss) from investment operations | | | | | | | | | | | | | | | |
| Net investment income (d) | | $0.53 | | | $0.54 | | | $0.48 | | | $0.48 | | | $0.42 | |
Net realized and unrealized gain (loss) on investments
and foreign currency | | 0.36 | | | 1.69 | | | 0.07 | | | 1.53 | | | 2.24 | |
| Total from investment operations | | $0.89 | | | $2.23 | | | $0.55 | | | $2.01 | | | $2.66 | |
| Less distributions declared to shareholders | | | | | | | | | | | | | | | |
| From net investment income | | $(0.60 | ) | | $(0.54 | ) | | $(0.51 | ) | | $(0.46 | ) | | $(0.56 | ) |
| From net realized gain on investments | | (0.81 | ) | | (0.77 | ) | | (0.49 | ) | | — | | | — | |
| Total distributions declared to shareholders | | $(1.41 | ) | | $(1.31 | ) | | $(1.00 | ) | | $(0.46 | ) | | $(0.56 | ) |
| Net asset value, end of period | | $19.50 | | | $20.02 | | | $19.10 | | | $19.55 | | | $18.00 | |
| Total return (%) (k)(s) | | 4.32 | | | 12.22 | | | 3.02 | | | 11.47 | (b) | | 17.15 | |
Ratios (%) (to average net assets)
and Supplemental data: | | | | | | | | | | | | | | | |
| Expenses (f) | | 0.70 | | | 0.71 | | | 0.71 | | | 0.70 | | | 0.71 | |
| Net investment income | | 2.67 | | | 2.81 | | | 2.52 | | | 2.60 | | | 2.52 | |
| Portfolio turnover | | 60 | | | 48 | | | 42 | | | 67 | | | 65 | |
| Net assets at end of period (000 Omitted) | | $1,013,465 | | | $1,210,549 | | | $1,370,782 | | | $1,571,550 | | | $1,618,983 | |
See Notes to Financial Statements
17
Financial Highlights – continued
Service Class
| | | | | | | | | | | | | | | |
| | | Years Ended 12/31 | |
| | | 2007 | | | 2006 | | | 2005 | | | 2004 | | | 2003 | |
| Net asset value, beginning of period | | $19.86 | | | $18.97 | | | $19.43 | | | $17.92 | | | $15.85 | |
| Income (loss) from investment operations | | | | | | | | | | | | | | | |
| Net investment income (d) | | $0.48 | | | $0.49 | | | $0.43 | | | $0.43 | | | $0.36 | |
Net realized and unrealized gain (loss) on investments
and foreign currency | | 0.36 | | | 1.67 | | | 0.08 | | | 1.51 | | | 2.24 | |
| Total from investment operations | | $0.84 | | | $2.16 | | | $0.51 | | | $1.94 | | | $2.60 | |
| Less distributions declared to shareholders | | | | | | | | | | | | | | | |
| From net investment income | | $(0.56 | ) | | $(0.50 | ) | | $(0.48 | ) | | $(0.43 | ) | | $(0.53 | ) |
| From net realized gain on investments | | (0.81 | ) | | (0.77 | ) | | (0.49 | ) | | — | | | — | |
| Total distributions declared to shareholders | | $(1.37 | ) | | $(1.27 | ) | | $(0.97 | ) | | $(0.43 | ) | | $(0.53 | ) |
| Net asset value, end of period | | $19.33 | | | $19.86 | | | $18.97 | | | $19.43 | | | $17.92 | |
| Total return (%) (k)(s) | | 4.07 | | | 11.91 | | | 2.81 | | | 11.14 | (b) | | 16.83 | |
Ratios (%) (to average net assets)
and Supplemental data: | | | | | | | | | | | | | | | |
| Expenses (f) | | 0.95 | | | 0.96 | | | 0.96 | | | 0.95 | | | 0.95 | |
| Net investment income | | 2.42 | | | 2.58 | | | 2.28 | | | 2.39 | | | 2.20 | |
| Portfolio turnover | | 60 | | | 48 | | | 42 | | | 67 | | | 65 | |
| Net assets at end of period (000 Omitted) | | $994,977 | | | $903,202 | | | $770,453 | | | $548,069 | | | $300,220 | |
| (b) | The fund’s net asset value and total return calculation include a non-recurring accrual recorded as a result of an administrative proceeding regarding disclosure of brokerage allocation practices in connection with fund sales. The non-recurring accrual did not have a material impact on the net asset value per share based on the shares outstanding on the day the proceeds were recorded. |
| (d) | Per share data are based on average shares outstanding. |
| (f) | Ratios do not reflect reductions from fees paid indirectly, if applicable. |
| (k) | The total return does not reflect expenses that apply to separate accounts. Inclusion of these charges would reduce the total return figures for all periods shown. |
| (s) | From time to time the fund may receive proceeds from litigation settlements, without which performance would be lower. |
See Notes to Financial Statements
18
NOTES TO FINANCIAL STATEMENTS
(1) Business and Organization
MFS Total Return Portfolio (formerly Total Return Series) (the fund) is a series of MFS Variable Insurance Trust II (formerly known as MFS/Sun Life Series Trust) (the trust). The trust is organized as a Massachusetts business trust and is registered under the Investment Company Act of 1940, as amended, as an open-end management investment company. The shares of the fund are sold only to variable accounts established by insurance companies to fund benefits under variable contracts issued by such companies and qualified retirement and pension plans.
(2) Significant Accounting Policies
General – The preparation of financial statements in conformity with U.S. generally accepted accounting principles requires management to make estimates and assumptions that affect the reported amounts of assets and liabilities, and disclosure of contingent assets and liabilities at the date of the financial statements and the reported amounts of revenues and expenses during the reporting period. Actual results could differ from those estimates. The fund can invest in foreign securities, including securities of emerging market issuers. Investments in foreign securities are vulnerable to the effects of changes in the relative values of the local currency and the U.S. dollar and to the effects of changes in each country’s legal, political, and economic environment. The markets of emerging markets countries are generally more volatile than the markets of developed countries with more mature economies. All of the risks of investing in foreign securities previously described are heightened when investing in emerging markets countries.
Investment Valuations – Equity securities, including restricted equity securities, are generally valued at the last sale or official closing price as reported by an independent pricing service on the market or exchange on which they are primarily traded. For securities for which there were no sales reported that day, equity securities are generally valued at the last quoted daily bid quotation as reported by an independent pricing service on the market or exchange on which they are primarily traded. For securities held short for which there were no sales reported for the day, the position is generally valued at the last quoted daily ask quotation as reported by an independent pricing service on the market or exchange on which such securities are primarily traded. Debt instruments (other than short-term instruments), including restricted debt instruments, are generally valued at an evaluated or composite bid as reported by an independent pricing service. Short-term instruments with a maturity at issuance of 60 days or less may be valued at amortized cost, which approximates market value. Open-end investment companies are generally valued at their net asset value per share. Securities and other assets generally valued on the basis of information from an independent pricing service may also be valued at a broker-dealer bid quotation. Values obtained from pricing services can utilize both dealer-supplied valuations and electronic data processing techniques, which take into account factors such as institutional-size trading in similar groups of securities, yield, quality, coupon rate, maturity, type of issue, trading characteristics, and other market data. The values of foreign securities and other assets and liabilities expressed in foreign currencies are converted to U.S. dollars using the mean of bid and asked prices for rates reported by an independent pricing service.
The Board of Trustees has delegated primary responsibility for determining or causing to be determined the value of the fund’s investments (including any fair valuation) to the adviser pursuant to valuation policies and procedures approved by the Board. If the adviser determines that reliable market quotations are not readily available, investments are valued at fair value as determined in good faith by the adviser in accordance with such procedures under the oversight of the Board of Trustees. Under the fund’s valuation policies and procedures, market quotations are not considered to be readily available for many types of debt instruments and certain types of derivatives. These investments are generally valued at fair value based on information from independent pricing services. In addition, investments may be valued at fair value if the adviser determines that an investment’s value has been materially affected by events occurring after the close of the exchange or market on which the investment is principally traded (such as foreign exchange or market) and prior to the determination of the fund’s net asset value, or after the halting of trading of a specific security where trading does not resume prior to the close of the exchange or market on which the security is principally traded. Events that occur on a frequent basis after foreign markets close (such as developments in foreign markets and significant movements in the U.S. markets) and prior to the determination of the fund’s net asset value may be deemed to have a material affect on the value of securities traded in foreign markets. Accordingly, the fund’s foreign equity securities may often be valued at fair value. The adviser may rely on independent pricing services or other information (such as the correlation with price movements of similar securities in the same or other markets; the type, cost and investment characteristics of the security; the business and financial condition of the issuer; and trading and other market data) to assist in determining whether to fair value and at what value to fair value an investment. The value of an investment for purposes of calculating the fund’s net asset value can differ depending on the source and method used to determine value. When fair valuation is used, the value of investments used to determine the fund’s net asset value may differ from quoted or published prices for the same investments.
In September 2006, FASB Statement No. 157, Fair Value Measurements (the “Statement”) was issued, and is effective for fiscal years beginning after November 15, 2007 and for all interim periods within those fiscal years. This Statement provides a single definition of fair value, a hierarchy for measuring fair value and expanded disclosures about fair value measurements.
19
Notes to Financial Statements – continued
Management is evaluating the application of the Statement to the fund, and believes the impact will be limited to expanded disclosures resulting from the adoption of this Statement in the fund’s financial statements.
Repurchase Agreements – The fund may enter into repurchase agreements with institutions that the fund’s investment adviser has determined are creditworthy. Each repurchase agreement is recorded at cost. The fund requires that the securities collateral in a repurchase transaction be transferred to the custodian in a manner sufficient to enable the fund to obtain those securities in the event of a default under the repurchase agreement. The fund monitors, on a daily basis, the value of the collateral to ensure that its value, including accrued interest, is greater than amounts owed to the fund under each such repurchase agreement. The fund and other funds managed by Massachusetts Financial Services Company (MFS), may utilize a joint trading account for the purpose of entering into one or more repurchase agreements.
Foreign Currency Translation – Purchases and sales of foreign investments, income, and expenses are converted into U.S. dollars based upon currency exchange rates prevailing on the respective dates of such transactions. Gains and losses attributable to foreign currency exchange rates on sales of securities are recorded for financial statement purposes as net realized gains and losses on investments. Gains and losses attributable to foreign exchange rate movements on income and expenses are recorded for financial statement purposes as foreign currency transaction gains and losses. That portion of both realized and unrealized gains and losses on investments that results from fluctuations in foreign currency exchange rates is not separately disclosed.
Security Loans – State Street Bank and Trust Company (“State Street”), as lending agent, may loan the securities of the fund to certain qualified institutions (the “Borrowers”) approved by the fund. The loans are collateralized at all times by cash and/or U.S. Treasury securities in an amount at least equal to the market value of the securities loaned. State Street provides the fund with indemnification against Borrower default. The fund bears the risk of loss with respect to the investment of cash collateral. On loans collateralized by cash, the cash collateral is invested in a money market fund or short-term securities. A portion of the income generated upon investment of the collateral is remitted to the Borrowers, and the remainder is allocated between the fund and the lending agent. On loans collateralized by U.S. Treasury securities, a fee is received from the Borrower, and is allocated between the fund and the lending agent. Net income from securities lending is included in interest income on the Statement of Operations. The dividend and interest income earned on the securities loaned is accounted for in the same manner as other dividend and interest income.
At December 31, 2007, the value of securities loaned was $75,312,830. These loans were collateralized by cash of $72,991,993 and U.S. Treasury obligations of $4,163,746.
Indemnifications – Under the fund’s organizational documents, its officers and trustees may be indemnified against certain liabilities and expenses arising out of the performance of their duties to the fund. Additionally, in the normal course of business, the fund enters into agreements with service providers that may contain indemnification clauses. The fund’s maximum exposure under these agreements is unknown as this would involve future claims that may be made against the fund that have not yet occurred.
Investment Transactions and Income – Investment transactions are recorded on the trade date. Interest income is recorded on the accrual basis. All premium and discount is amortized or accreted for financial statement purposes in accordance with U.S. generally accepted accounting principles. All discount is accreted for tax reporting purposes as required by federal income tax regulations. Dividends received in cash are recorded on the ex-dividend date. Certain dividends from foreign securities will be recorded when the fund is informed of the dividend if such information is obtained subsequent to the ex-dividend date. Dividend and interest payments received in additional securities are recorded on the ex-dividend or ex-interest date in an amount equal to the value of the security on such date.
The fund may receive proceeds from litigation settlements. Any proceeds received from litigation involving portfolio holdings are reflected in the Statement of Operations in realized gain/loss if the security has been disposed of by the fund or in unrealized gain/loss if the security is still held by the fund. Any other proceeds from litigation not related to portfolio holdings are reflected as other income in the Statement of Operations.
Fees Paid Indirectly – The fund’s custody fee may be reduced according to an arrangement that measures the value of cash deposited with the custodian by the fund. This amount, for the year ended December 31, 2007, is shown as a reduction of total expenses on the Statement of Operations.
Tax Matters and Distributions – The fund intends to qualify as a regulated investment company, as defined under Subchapter M of the Internal Revenue Code, and to distribute all of its taxable income, including realized capital gains. As a result, no provision for federal income taxes is required. The fund adopted the provisions of FASB Interpretation No. 48, Accounting for Uncertainty in Income Taxes (“the Interpretation”) on January 1, 2007. The Interpretation prescribes a minimum threshold for financial statement recognition of the benefit of a tax position taken or expected to be taken in a tax return. There was no impact resulting from the adoption of this Interpretation on the fund’s financial statements. Each of the fund’s federal tax
20
Notes to Financial Statements – continued
returns for the prior three fiscal years remains subject to examination by the Internal Revenue Service. It is the fund’s policy to record interest and penalty charges on underpaid taxes associated with its tax positions as interest expense and other expense, respectively. No such charges were recorded in the current financial statements. Foreign taxes, if any, have been accrued by the fund in the accompanying financial statements.
Distributions to shareholders are recorded on the ex-dividend date. Income and capital gain distributions are determined in accordance with income tax regulations, which may differ from U.S. generally accepted accounting principles. Certain capital accounts in the financial statements are periodically adjusted for permanent differences in order to reflect their tax character. These adjustments have no impact on net assets or net asset value per share. Temporary differences which arise from recognizing certain items of income, expense, gain or loss in different periods for financial statement and tax purposes will reverse at some time in the future. Distributions in excess of net investment income or net realized gains are temporary overdistributions for financial statement purposes resulting from differences in the recognition or classification of income or distributions for financial statement and tax purposes.
Book/tax differences primarily relate to amortization and accretion of debt securities and wash sale loss deferrals.
The tax character of distributions declared to shareholders is as follows:
| | | | |
| | | 12/31/07 | | 12/31/06 |
| Ordinary income (including any short-term capital gains) | | $67,080,618 | | $68,720,551 |
| Long-term capital gain | | 76,159,354 | | 69,829,820 |
| Total distributions | | $143,239,972 | | $138,550,371 |
The federal tax cost and the tax basis components of distributable earnings were as follows:
| | | |
| As of 12/31/07 | | | |
| Cost of investments | | $1,930,776,783 | |
| Gross appreciation | | 199,495,769 | |
| Gross depreciation | | (58,153,492 | ) |
| Net unrealized appreciation (depreciation) | | $141,342,277 | |
| Undistributed ordinary income | | 73,715,608 | |
| Undistributed long-term capital gain | | 104,992,120 | |
| Post-October capital loss deferral | | (16,017,276 | ) |
| Other temporary differences | | (299,204 | ) |
Multiple Classes of Shares of Beneficial Interest – The fund offers multiple classes of shares, which differ in their respective distribution fees. All shareholders bear the common expenses of the fund based on daily net assets of each class, without distinction between share classes. Dividends are declared separately for each class. Differences in per share dividend rates are generally due to differences in separate class expenses.
(3) Transactions with Affiliates
Investment Adviser – The fund has an investment advisory agreement with MFS to provide overall investment management and related administrative services and facilities to the fund.
The management fee is computed daily and paid monthly at the following annual rates:
| | |
| First $300 million of average daily net assets | | 0.75% |
| Next $700 million of average daily net assets | | 0.675% |
| Average daily net assets in excess of $1 billion | | 0.60% |
The management fee incurred for the year ended December 31, 2007 was equivalent to an annual effective rate of 0.65% of the fund’s average daily net assets.
The investment adviser has agreed in writing to pay a portion of the fund’s operating expenses, exclusive of certain other fees and expenses, such that total annual fund operating expenses do not exceed 1.25% of the fund’s average daily net assets. MFS’ agreement to limit the fund’s operating expenses is contained in the investment advisory agreement between MFS and the fund and may not be rescinded without shareholder approval. In addition, the investment adviser has voluntarily agreed to pay a portion of the fund’s operating expenses, exclusive of certain other fees and expenses, such that total annual operating expenses do not exceed 1.00% of the fund’s average daily net assets attributable to Initial Class shares. This voluntary agreement may be changed or rescinded at any time by MFS. For the year ended December 31, 2007, the fund’s actual operating expenses did not exceed the limit and therefore, the investment adviser did not pay a portion of the fund’s expenses.
Distributor – MFS Fund Distributors, Inc. (MFD), a wholly-owned subsidiary of MFS, is the distributor of shares of the fund. The Trustees have adopted a distribution plan for the Service Class shares pursuant to Rule 12b-1 under the Investment Company Act of 1940.
21
Notes to Financial Statements – continued
The fund’s distribution plan provides that the fund will pay MFD distribution fees equal to 0.25% per annum of its average daily net assets attributable to Service Class shares as partial consideration for services performed and expenses incurred by MFD and financial intermediaries in connection with the sale and distribution of the fund’s Service Class shares and the sale and distribution of the variable annuity or variable life insurance contracts investing indirectly in Service Class shares. MFD may subsequently pay all, or a portion, of the distribution fees to financial intermediaries.
Shareholder Servicing Agent – MFS Service Center, Inc. (MFSC), a wholly-owned subsidiary of MFS, has contracted to provide transfer agent and recordkeeping functions in connection with the issuance, transfer, and redemption of each class of shares of the fund under a Shareholder Servicing Agent Agreement. During the year ended December 31, 2007, MFSC did not receive a fee for this service.
Administrator – MFS provides certain financial, legal, shareholder communications, compliance, and other administrative services to the fund. Under an administrative services agreement, the fund partially reimburses MFS the costs incurred to provide these services. The fund is charged an annual fixed amount of $10,000 plus a fee based on average daily net assets.
The administrative services fee incurred for the year ended December 31, 2007 was equivalent to an annual effective rate of 0.0233% of the fund’s average daily net assets.
Trustees’ and Officers’ Compensation – The fund pays compensation to trustees in the form of a retainer, attendance fees, and additional compensation to the Board chairperson. The fund does not pay compensation directly to officers of the fund who are also officers of the investment adviser, all of whom receive remuneration for their services to the fund from MFS. Certain officers of the fund are officers or directors of MFS, MFD, and MFSC.
Other – This fund and certain other MFS funds (the funds) have entered into a services agreement (the Agreement) which provides for payment of fees by the funds to Tarantino LLC in return for the provision of services of an Independent Chief Compliance Officer (ICCO) for the funds. The ICCO is an officer of the funds and the sole member of Tarantino LLC. The funds can terminate the Agreement with Tarantino LLC at any time under the terms of the Agreement. MFS has agreed to bear all expenses associated with office space, other administrative support, and supplies provided to the ICCO. For the year ended December 31, 2007, the fee paid to Tarantino LLC was $10,230.
(4) Portfolio Securities
Purchases and sales of investments, other than purchased option transactions and short-term obligations, were as follows:
| | | | |
| | | Purchases | | Sales |
| U.S. government securities | | $265,408,448 | | $228,424,382 |
| Investments (non-U.S. government securities) | | $977,312,068 | | $1,105,182,165 |
(5) Shares of Beneficial Interest
The fund’s Declaration of Trust permits the Trustees to issue an unlimited number of full and fractional shares of beneficial interest. Transactions in fund shares were as follows:
| | | | | | | | | | | | |
| | | Year ended 12/31/07 | | | Year ended 12/31/06 | |
| | | Shares | | | Amount | | | Shares | | | Amount | |
| Shares sold | | | | | | | | | | | | |
Initial Class | | 413,104 | | | $8,334,688 | | | 510,905 | | | $9,819,747 | |
Service Class | | 5,705,441 | | | 112,652,944 | | | 5,726,393 | | | 107,963,264 | |
| | 6,118,545 | | | $120,987,632 | | | 6,237,298 | | | $117,783,011 | |
Shares issued to shareholders in
reinvestment of distributions | | | | | | | | | | | | |
Initial Class | | 4,011,068 | | | $79,699,926 | | | 4,641,324 | | | $85,910,899 | |
Service Class | | 3,220,479 | | | 63,540,046 | | | 2,862,397 | | | 52,639,472 | |
| | 7,231,547 | | | $143,239,972 | | | 7,503,721 | | | $138,550,371 | |
| Shares reacquired | | | | | | | | | | | | |
Initial Class | | (12,933,693 | ) | | $(257,546,785 | ) | | (16,442,558 | ) | | $(313,575,073 | ) |
Service Class | | (2,937,252 | ) | | (57,991,748 | ) | | (3,729,015 | ) | | (70,881,173 | ) |
| | (15,870,945 | ) | | $(315,538,533 | ) | | (20,171,573 | ) | | $(384,456,246 | ) |
| Net change | | | | | | | | | | | | |
Initial Class | | (8,509,521 | ) | | $(169,512,171 | ) | | (11,290,329 | ) | | $(217,844,427 | ) |
Service Class | | 5,988,668 | | | 118,201,242 | | | 4,859,775 | | | 89,721,563 | |
| | (2,520,853 | ) | | $(51,310,929 | ) | | (6,430,554 | ) | | $(128,122,864 | ) |
22
Notes to Financial Statements – continued
(6) Line of Credit
The fund and other funds managed by MFS participate in a $1 billion unsecured committed line of credit provided by a syndication of banks under a credit agreement. In addition, the fund and other funds managed by MFS have established uncommitted borrowing arrangements with certain banks. Borrowings may be made for temporary financing needs. Interest is charged to each fund, based on its borrowings, generally at a rate equal to the Federal Reserve funds rate plus 0.30%. In addition, a commitment fee, based on the average daily, unused portion of the committed line of credit, is allocated among the participating funds at the end of each calendar quarter. For the year ended December 31, 2007, the fund’s commitment fee and interest expense were $9,690 and $442, respectively, and are included in miscellaneous expense on the Statement of Operations.
23
REPORT OF INDEPENDENT REGISTERED PUBLIC ACCOUNTING FIRM
To the Board of Trustees of MFS Variable Insurance Trust II (formerly known as MFS/Sun Life Series Trust) and the Shareholders of MFS Total Return Portfolio (formerly known as Total Return Series):
We have audited the accompanying statement of assets and liabilities, including the portfolio of investments, of MFS Total Return Portfolio (one of the portfolios comprising MFS Variable Insurance Trust II) (the “Trust”) as of December 31, 2007, and the related statement of operations for the year then ended, the statements of changes in net assets for each of the two years in the period then ended, and the financial highlights for each of the five years in the period then ended. These financial statements and financial highlights are the responsibility of the Trust’s management. Our responsibility is to express an opinion on these financial statements and financial highlights based on our audits.
We conducted our audits in accordance with the standards of the Public Company Accounting Oversight Board (United States). Those standards require that we plan and perform the audit to obtain reasonable assurance about whether the financial statements and financial highlights are free of material misstatement. The Trust is not required to have, nor were we engaged to perform, an audit of its internal control over financial reporting. Our audits included consideration of internal control over financial reporting as a basis for designing audit procedures that are appropriate in the circumstances, but not for the purpose of expressing an opinion on the effectiveness of the Trust’s internal control over financial reporting. Accordingly, we express no such opinion. An audit also includes examining, on a test basis, evidence supporting the amounts and disclosures in the financial statements, assessing the accounting principles used and significant estimates made by management, as well as evaluating the overall financial statement presentation. Our procedures included confirmation of securities owned as of December 31, 2007, by correspondence with the custodian and brokers; where replies were not received from brokers, we performed other auditing procedures. We believe that our audits provide a reasonable basis for our opinion.
In our opinion, such financial statements and financial highlights present fairly, in all material respects, the financial position of MFS Total Return Portfolio as of December 31, 2007, the results of its operations for the year then ended, the changes in its net assets for each of the two years in the period then ended, and its financial highlights for each of the five years in the period then ended, in conformity with accounting principles generally accepted in the United States of America.
DELOITTE & TOUCHE LLP
Boston, Massachusetts
February 15, 2008
24
TRUSTEES AND OFFICERS – IDENTIFICATION AND BACKGROUND
The Trustees and officers of the Trust, as of February 1, 2008, are listed below, together with their principal occupations during the past five years. (Their titles may have varied during that period.) The address of each Trustee and officer is 500 Boylston Street, Boston, Massachusetts 02116.
| | | | | | |
Name, Date of Birth | | Position(s) Held
with Fund | | Trustee/Officer
Since(1) | | Principal Occupations During the Past Five Years &
Other Directorships(2) |
| INTERESTED TRUSTEE | | | | | | |
David D. Horn(3) (born 06/07/41) | | Trustee | | April 1986 | | Private investor; Retired; Sun Life Assurance Company of Canada, Former Senior Vice President and General Manager for the United States (until 1997); Retired: Sun Life Assurance Company of Canada, Director (until March 2004) |
| | |
| INDEPENDENT TRUSTEES | | | | |
J. Kermit Birchfield (born 01/08/40) | | Chairman | | May 1997 | | Consultant; Century Partners, Inc. (investments), Director (1988 to present); Displaytech, Inc. (technology), Director (1995 to present); Dessin Fournir LLC (furniture manufacturer), Director (2005 to present); Intermountain Gas Company, Inc. & Intermountain Industries, Inc. (oil & gas exploration and production) (1988 to present); Site Watch LLC (software to monitor oil tanks) Managing Director (2006 to present); Juridica Investments (fund investing in judicial matters) Director (2007 to present); Dairy Mart Convenience Stores, Inc. (convenience stores), Chairman (1997 to 2003) |
| | | |
Robert C. Bishop (born 01/13/43) | | Trustee | | May 2001 | | Autolmmune Inc. (pharmaceutical product licensing), Chairman, President and Chief Executive Officer (1992 to present); Caliper Life Sciences Corp. (laboratory analytical instruments), Director (2002 to present); Millipore Corporation (biopharmaceutical/research laboratory products), Director (1997 to present); Optobionics Corporation (ophthalmic devices), Director (2002 to 2007); Quintiles Transnational Corp. (contract research services), Director (until 2003) |
| | | |
Frederick H. Dulles (born 03/12/42) | | Trustee | | May 2001 | | Ten State International Law PLLC (law firm), Of Counsel (since 2006); Prudential Carolina Real Estate, (real estate), Broker (since 2006); Free Enterprise Foundation, Inc. (research institute), Director & Secretary (until 2008); Disher, Hamrick & Myers Residential, Inc. (real estate) Broker (until 2006); Frederick H. Dulles law practice (until 2006); Ten State Street LLP (law firm), Member (until 2005); McFadden, Pilkington & Ward LLP (solicitors and registered foreign lawyers), Member & Of Counsel (until 2003) |
| | | |
Marcia A. Kean (born 06/30/48) | | Trustee | | April 2005 | | Feinstein Kean Healthcare (consulting), Chief Executive Officer (since December 2002), Managing Director (prior to May 2001); Ardais Corporation (biotech products), Senior Vice President – Commercialization (February 2002 until November 2002) |
| | | |
Ronald G. Steinhart (born 06/15/40) | | Trustee | | May 2001 | | Private investor; Penske Automotive Group (automotive retailer), Director (2001 to present); Penson Worldwide, Inc. (securities clearance), Director (2006 to present); Animal Health International, Inc. (animal health products), Director (2007 to present); Texas Industries (concrete/aggregates/cement), Director (2007 to present); Carreker Corporation (technology consulting) Director (until 2005); Prentiss Properties Trust (real estate investment trust), Director (until 2006) |
| | | |
Haviland Wright (born 07/21/48) | | Trustee | | May 2001 | | Elixir Technologies Corporation (software) Director (2005 to present); Nano Loa Inc. (liquid crystal displays), Director (2003 to present); Silk Displays, Inc. (smart polymers) Director (2007 to present); Displaytech, Inc. (technology) Chairman and CEO (1995 – 2002) |
| | | |
| TRUSTEE EMERITUS | | | | | | |
Samuel Adams (born 10/19/25) | | Trustee Emeritus | | | | Retired; Kirkpatrick & Lockhart Preston Gates Ellis LLP (law firm), Of Counsel |
| | | |
| OFFICERS | | | | | | |
Maria F. Dwyer(4) (born 12/01/58) | | President | | November 2005 | | Massachusetts Financial Services Company, Executive Vice President and Chief Regulatory Officer (since March 2004); Fidelity Management & Research Company, Vice President (prior to March 2004); Fidelity Group of Funds, President and Treasurer (prior to March 2004) |
| | | |
Tracy Atkinson(4) (born 12/30/64) | | Treasurer | | September 2005 | | Massachusetts Financial Services Company, Senior Vice President (since September 2004); PricewaterhouseCoopers LLP, Partner (prior to September 2004) |
| | | |
Christopher R. Bohane(4) (born 01/18/74) | | Assistant Secretary and Assistant Clerk | | July 2005 | | Massachusetts Financial Services Company, Vice President and Senior Counsel (since April 2003); Kirkpatrick & Lockhart LLP (law firm), Associate (prior to April 2003) |
25
Trustees and Officers – continued
| | | | | | |
Name, Date of Birth | | Position(s) Held
with Fund | | Trustee/Officer
Since(1) | | Principal Occupations During the Past Five Years &
Other Directorships(2) |
| | | |
Ethan D. Corey(4) (born 11/21/63) | | Assistant Secretary and Assistant Clerk | | July 2005 | | Massachusetts Financial Services Company, Senior Vice President and Associate General Counsel (since April 2006); Special Counsel (prior to April 2006); Dechert LLP (law firm), Counsel (prior to December 2004) |
| | | |
David L. DiLorenzo(4) (born 08/10/68) | | Assistant Treasurer | | July 2005 | | Massachusetts Financial Services Company, Vice President (since June 2005); JP Morgan Investor Services, Vice President (January 2001 to June 2005) |
| | | |
Timothy M. Fagan(4) (born 07/10/68) | | Assistant Secretary and Assistant Clerk | | September 2005 | | Massachusetts Financial Services Company, Vice President and Senior Counsel (since September 2005); John Hancock Advisers, LLC, Vice President and Chief Compliance Officer (September 2004 to August 2005) Senior Attorney (prior to September 2004); John Hancock Group of Funds, Vice President and Chief Compliance Officer (September 2004 to December 2004) |
| | | |
Mark D. Fischer(4) (born 10/27/70) | | Assistant Treasurer | | July 2005 | | Massachusetts Financial Services Company, Vice President (since May 2005); JP Morgan Investment Management Company, Vice President (prior to May 2005) |
| | | |
Brian E. Langenfeld(4) (born 03/07/73) | | Assistant Secretary and Assistant Clerk | | May 2006 | | Massachusetts Financial Services Company, Assistant Vice President and Counsel (since May 2006); John Hancock Advisers, LLC, Assistant Vice President and Counsel (May 2005 to April 2006); John Hancock Advisers, LLC, Attorney and Assistant Secretary (prior to May 2005) |
| | | |
Ellen Moynihan(4) (born 11/13/57) | | Assistant Treasurer | | May 1997 | | Massachusetts Financial Services Company, Senior Vice President |
| | | |
Susan S. Newton(4) (born 03/07/50) | | Assistant Secretary and Assistant Clerk | | May 2005 | | Massachusetts Financial Services Company, Senior Vice President and Assistant General Counsel (since April 2005); John Hancock Advisers, LLC, Senior Vice President, Secretary and Chief Legal Officer (prior to April 2005); John Hancock Group of Funds, Senior Vice President, Secretary and Chief Legal Officer (prior to April 2005) |
| | | |
Susan A. Pereira(4) (born 11/05/70) | | Assistant Secretary and Assistant Clerk | | July 2005 | | Massachusetts Financial Services Company, Vice President and Senior Counsel (since June 2004); Bingham McCutchen LLP (law firm), Associate (January 2001 to June 2004) |
| | | |
Mark N. Polebaum(4) (born 05/01/52) | | Secretary and Assistant Clerk | | February 2006 | | Massachusetts Financial Services Company, Executive Vice President, General Counsel and Secretary (since January 2006); Wilmer Cutler Pickering Hale and Dorr LLP (law firm), Partner (prior to January 2006) |
| | | |
Frank L. Tarantino (born 03/07/44) | | Independent Chief Compliance Officer | | September 2004 | | Tarantino LLC (provider of compliance services), Principal (since June 2004); CRA Business Strategies Group (consulting services), Executive Vice President (April 2003 to June 2004); David L. Babson & Co. (investment adviser), Managing Director, Chief Administrative Officer and Director (February 1997 to March 2003) |
| | | |
Richard S. Weitzel(4) (born 7/16/70) | | Assistant Secretary and Assistant Clerk | | October 2007 | | Massachusetts Financial Services Company, Vice President and Assistant General Counsel (since 2007); Vice President and Senior Counsel (since May 2004); Massachusetts Department of Business and Technology, General Counsel (February 2003 to April 2004); Massachusetts Office of the Attorney General, Assistant Attorney General ( April 2001 to February 2003); Ropes and Gray, Associate (prior to April 2001) |
| | | |
James O. Yost(4) (born 06/12/60) | | Assistant Treasurer | | April 1992 | | Massachusetts Financial Services Company, Senior Vice President |
| (1) | Date first appointed to serve as Trustee/Officer of an MFS fund or a Compass variable account. Each Trustee has served continuously since appointment. |
| (2) | Directorships or trusteeships of companies required to report to the Securities and Exchange Commission (i.e., “public companies”). |
| (3) | “Interested person” of the Sun Life of Canada (U.S.), within the meaning of the Investment Company Act of 1940 (referred to as the 1940 Act), which is the principal federal law governing investment companies like the Series. The address of Sun Life of Canada (U.S.) is One Sun Life Executive Park, Wellesley Hills, Massachusetts 02481. |
| (4) | “Interested person” of MFS within the meaning of the 1940 Act. The address of MFS is 500 Boylston Street, Boston, Massachusetts 02116. |
The Trust does not hold annual meetings for the purpose of electing Trustees, and Trustees are not elected for fixed terms. Each Trustee and officer holds office until his or her successor is chosen and qualified, or until his or her earlier death, resignation, retirement or removal.
All Trustees currently serve as Trustees of the Trust and have served in that capacity since originally elected or appointed. All of the Trustees are also Managers of the Compass Variable Accounts. The executive officers of the Trust hold similar offices for the Compass Variable Accounts and other funds in the MFS fund complex. As of January 1, 2008, each Trustee serves as a Trustee or Manager of 35 Accounts/Funds.
26
Trustees and Officers – continued
The Statement of Additional Information contains further information about the Trustees and is available without charge upon request by calling 1-800-225-2606.
| | |
Investment Adviser
Massachusetts Financial Services Company 500 Boylston Street, Boston, MA 02116-3741 | | Custodian State Street Bank and Trust Company 225 Franklin Street, Boston, MA 02110 |
Distributor
MFS Fund Distributors, Inc. 500 Boylston Street, Boston, MA 02116-3741 | | Independent Registered Public Accounting Firm Deloitte & Touche LLP 200 Berkeley Street, Boston, MA 02116 |
Portfolio Managers Brooks Taylor Nevin Chitkara William Douglas Steven Gorham Richard Hawkins Gregory Locraft Michael Roberge | | |
27
BOARD REVIEW OF INVESTMENT ADVISORY AGREEMENT
The Investment Company Act of 1940 requires that both the full Board of Trustees and a majority of the non-interested (“independent”) Trustees, voting separately, annually approve the continuation of the investment advisory agreement between MFS Variable Insurance Trust II (the “Trust”) and Massachusetts Financial Services Company (MFS) on behalf of the Fund. The Trustees consider matters bearing on the Fund and the advisory arrangements at their meetings throughout the year, including a review of performance data at each regular meeting. In addition, the independent Trustees met several times over the course of three months beginning in May and ending in July 2007 (“contract review meetings”) for the specific purpose of considering whether to approve the continuation of the investment advisory agreement for the Fund. The independent Trustees were assisted in their evaluation of the investment advisory agreement by independent legal counsel, from whom they received separate legal advice and with whom they met separately from MFS management during various contract review meetings. The independent Trustees were also assisted in this process by the Fund’s Independent Chief Compliance Officer, a full-time senior officer appointed by and reporting to the independent Trustees.
In connection with their deliberations, the Trustees, including the independent Trustees, considered such information and factors as they believed, in light of the legal advice furnished to them and their own business judgment, to be relevant. The investment advisory agreement was considered separately for the Fund, although the Trustees also took into account the common interests of all Funds in the Trust in their review. As described below, the Trustees considered the nature, quality, and extent of the various investment advisory, administrative, and shareholder services performed by MFS under the existing investment advisory agreement and other arrangements with the Trust.
In connection with their contract review meetings, the Trustees received and relied upon materials which included, among other items: (i) information provided by Lipper Inc. on the investment performance of the Fund for various time periods ended December 31, 2006, compared to the investment performance of a group of funds with substantially similar investment classifications/objectives (the “Lipper performance universe”), as well as the investment performance of a group of funds identified by objective criteria suggested by MFS (“peer funds”), (ii) information provided by Lipper Inc. on the Fund’s advisory fees and other expenses compared to the advisory fees and other expenses of comparable funds identified by Lipper (the “Lipper expense group”), as well as the advisory fees and other expenses of peer funds identified by objective criteria suggested by MFS, (iii) information provided by MFS on the advisory fees of comparable portfolios of its other clients, including institutional separate account and other clients, (iv) information as to whether, and to what extent applicable, expense waivers, reimbursements or fee “breakpoints” are observed for the Fund, (v) information regarding MFS’ financial results and financial condition, including MFS’ and certain of its affiliates’ estimated profitability from services performed for the Fund, (vi) MFS’ views regarding the outlook for the mutual fund industry and its strategic business plans, (vii) descriptions of various functions performed by MFS for the Trust, such as compliance monitoring and portfolio trading practices, and (viii) information regarding the overall organization of MFS, including information about MFS’ senior management and other personnel providing investment advisory, administrative and other services to the Fund. The comparative performance, fee and expense information prepared and provided by Lipper Inc. was not independently verified, and the independent Trustees did not independently verify any information provided to them by MFS.
The Trustees’ conclusion as to the continuation of the investment advisory agreement was based on comprehensive consideration of all information provided to the Trustees and not the result of any single factor. Some of the factors that figured particularly in the Trustees’ deliberations are described below for the Fund, while individual Trustees may have given different weight to various factors and evaluated the information presented as a whole differently than another Trustee. The Trustees recognized that the fee arrangements for the Fund reflect years of review and discussion between the independent Trustees and MFS, that certain aspects of such arrangements may receive greater scrutiny in some years than others, and that the Trustees’ conclusions may be based, in part, on their consideration of these same arrangements during the course of the year and in prior years.
Based on information provided by Lipper Inc. and MFS, the Trustees compared the Fund’s total return investment performance to the performance of a peer group of funds over various time periods. The Trustees placed particular emphasis on the total return performance of the Fund’s Initial Class shares in comparison to the performance of funds in its Lipper performance universe over the one-, three- and five-year periods. The Trustees did not rely on performance results for more recent periods, including those shown elsewhere in this report.
The Trustees noted the performance of the Fund’s Initial Class shares was in the 1st quintile relative to the other funds in the Lipper Classification Index for the one-year period (the 1st quintile being the best performers and the 5th quintile being the worst performers). The total return performance of the Fund was also in the 1st quintile for the three-year period and the five-year period ended December 31, 2006, relative to the Lipper performance universe. Based on the nature and quality of services provided by MFS, the Board of Trustees concluded that the Fund’s performance was satisfactory.
28
Board Review of Investment Advisory Agreement – continued
In the course of their deliberations, the Trustees took into account information provided by MFS during contract review meetings, as well as during investment review meetings conducted with portfolio management personnel during the course of the year.
In assessing the reasonableness of the Fund’s advisory fee, the Trustees considered, among other information, the Fund’s advisory fee and the total expense ratio of the Fund’s Initial Class shares as a percentage of average daily net assets, compared to the advisory fee and total expense ratios of its peer group of funds based on information provided by Lipper Inc. and MFS. The Trustees also considered the advisory fees charged by MFS to institutional accounts. In comparing these fees, the Trustees considered the generally broader scope of services provided by MFS to the Trust than those provided to institutional accounts. The Trustees also considered the higher demands placed on MFS’ investment personnel and trading infrastructure as a result of the daily cash in-flows and out-flows of the Fund, and the impact on MFS and related expenses due to the more extensive regulatory regime to which the Fund is subject, compared to institutional accounts.
In considering the fees, the Trustees noted from the Lipper data that the Fund’s effective advisory fee rate was above the median and total expense ratio was approximately at the median of such fees and expenses of funds in the Lipper expense group. In addition, the Trustees accepted MFS’ offer to continue the expense limitation for the Fund. The Trustees further concluded that the existing breakpoints were sufficient to allow the Fund to benefit from economies of scale as its assets grow.
The Trustees also considered information prepared by MFS relating to its costs and profits with respect to the Fund and other investment companies and accounts advised by MFS, as well as MFS’ methodologies used to determine and allocate its costs to the Fund and other accounts and products for purposes of estimating profitability.
After reviewing these and other factors described below, the Trustees concluded that the advisory fee charged to the Fund represents reasonable compensation in light of the nature and quality of the services being provided by MFS.
In addition, the Trustees considered MFS’ resources and related efforts to continue to retain, attract and motivate capable personnel to serve the Fund. The Trustees also considered the financial resources of MFS and its parent, Sun Life Financial Inc. The Trustees further considered any advantages and possible disadvantages of having an adviser which also serves other investment companies as well as institutional accounts.
The Trustees also considered the nature, quality, cost, and extent of administrative, transfer agency, and distribution services provided to the Fund by MFS and its affiliates under agreements and plans other than the investment advisory agreement, including the 12b-1 fees the Fund pays to MFS Fund Distributors, Inc., an affiliate of MFS. The Trustees also considered the nature, extent and quality of certain other services MFS performs or arranges on the Fund’s behalf, which may include securities lending programs, directed expense payment programs, class action recovery programs, and MFS’ interaction with third-party service providers, principally custodians and sub-custodians. The Trustees concluded that the various non-advisory services provided by MFS and its affiliates on behalf of the Fund were satisfactory. The Trustees also considered the benefits to MFS from the use of the Fund’s portfolio brokerage commissions to pay for research and other similar services (including MFS’ policy not to use “soft dollars” generated by Fund portfolio transactions to pay for third-party research), and various other factors. Additionally, the Trustees considered so-called “fall-out benefits” to MFS such as reputational value derived from serving as investment manager to the Trust, and determined that any such benefits derived by MFS were reasonable and fair.
Based on their evaluation of factors that they deemed to be material, including those factors described above, the Board of Trustees, including a majority of the independent Trustees, concluded that the investment advisory agreement should be continued for an additional one-year period, commencing September 1, 2007.
A discussion regarding the Board’s most recent review and renewal of the Fund’s investment advisory agreement is available by clicking on the Fund’s name under ‘‘Variable Insurance Portfolios’’ on the “Products & Performance” page on the MFS Web site (mfs.com).
29
PROXY VOTING POLICIES AND INFORMATION
A general description of the MFS funds’ proxy voting policies and procedures is available without charge, upon request, by calling 1-800-225-2606, by visiting the About MFS section of mfs.com or by visiting the SEC’s Web site at http://www.sec.gov.
Information regarding how the fund voted proxies relating to portfolio securities during the most recent twelve-month period ended June 30 is available without charge by visiting the Proxy Voting section of mfs.com or by visiting the SEC’s Web site at http://www.sec.gov.
QUARTERLY PORTFOLIO DISCLOSURE
The fund will file a complete schedule of portfolio holdings with the Securities and Exchange Commission (the Commission) for the first and third quarters of each fiscal year on Form N-Q. The fund’s Form N-Q may be reviewed and copied at the:
Public Reference Room
Securities and Exchange Commission
100 F Street, NE, Room 1580
Washington, D.C. 20549
Information on the operation of the Public Reference Room may be obtained by calling the Commission at 1-800-SEC-0330. The fund’s Form N-Q is available on the EDGAR database on the Commission’s Internet Web site at http://www.sec.gov, and copies of this information may be obtained, upon payment of a duplicating fee, by electronic request at the following e-mail address: publicinfo@sec.gov or by writing the Public Reference Section at the above address.
A shareholder can also obtain the quarterly portfolio holdings report at mfs.com.
FEDERAL TAX INFORMATION (unaudited)
The following information is provided pursuant to provisions of the Internal Revenue Code.
The fund designates $76,159,354 as capital gain dividends paid during the fiscal year.
For corporate shareholders, 37.53% of the ordinary income dividends paid during the fiscal year qualify for the corporate dividends received deduction.
30
MFS® PRIVACY NOTICE
Privacy is a concern for every investor today. At MFS Investment Management® and the MFS funds, we take this concern very seriously. We want you to understand our policies about the investment products and services that we offer, and how we protect the nonpublic personal information of investors who have a direct relationship with us and our wholly owned subsidiaries.
Throughout our business relationship, you provide us with personal information. We maintain information and records about you, your investments, and the services you use. Examples of the nonpublic personal information we maintain include
| | Ÿ | | data from investment applications and other forms |
| | Ÿ | | share balances and transactional history with us, our affiliates, or others |
| | Ÿ | | facts from a consumer reporting agency |
We do not disclose any nonpublic personal information about our customers or former customers to anyone, except as permitted by law. We may share nonpublic personal information with third parties or certain of our affiliates in connection with servicing your account or processing your transactions. We may share information with companies or financial institutions that perform marketing services on our behalf or with other financial institutions with which we have joint marketing arrangements, subject to any legal requirements.
Authorization to access your nonpublic personal information is limited to appropriate personnel who provide products, services, or information to you. We maintain physical, electronic, and procedural safeguards to help protect the personal information we collect about you.
If you have any questions about the MFS privacy policy, please call 1-800-225-2606 any business day between 8 a.m. and 8 p.m. Eastern time.
Note: If you own MFS products or receive MFS services in the name of a third party such as a bank or broker-dealer, their privacy policy may apply to you instead of ours.
31
CONTACT US
Web site
mfs.com
Account service and
literature
Shareholders
1-877-411-3325
9 a.m. to 5 p.m. ET
Investment professionals
1-800-637-8630
8 a.m. to 5 p.m. ET
Mailing address
MFS Service Center, Inc.
Attn: Institutional Alliance Services (IAS)
P.O. Box 55824
Boston, MA
02205-5824
Overnight mail
MFS Service Center, Inc.
Attn: Institutional Alliance Services (IAS)
500 Boylston Street
Boston, MA 02116-3741


MFS® Variable Insurance Trust IISM
Annual report
MFS® Blended ResearchSM Core Equity Portfolio
(formerly Massachusetts Investors Trust Series)
12/31/07
CGS-ANN
MFS® BLENDED RESEARCHSM CORE EQUITY PORTFOLIO
The report is prepared for the general information of contract owners. It is authorized for distribution to prospective investors only when preceded or accompanied by a current prospectus.
NOT FDIC INSURED MAY LOSE VALUE NO BANK OR CREDIT UNION GUARANTEE NOT A DEPOSIT NOT INSURED BY ANY FEDERAL GOVERNMENT AGENCY OR NCUA/NCUSIF
LETTER FROM THE CEO

Dear Contract Owners:
The past year has been a great example of why investors should keep their eyes on the long term.
In 2006 the Dow Jones Industrial Average returned 19% and was fairly stable. This year we have seen a greater level of volatility than has been experienced in recent years. The Dow hit several new highs but also experienced swift drops as a global credit crisis swept through markets, spurred by defaults on U.S. subprime loans and a liquidity crunch. Still, even with this volatility, the Dow ended the first three quarters of 2007 with a return near 13%.
U.S. Treasury bonds gained ground, especially in the third quarter as investors sought less risky asset classes. The spreads of many lower-quality debt investments widened.
In 2007 the U.S. dollar fell against the euro, oil prices hit their highest levels yet, and gold spiked to its steepest price in 28 years. Around the globe, stocks sold off as risk aversion mounted. As we have said before, markets can be volatile, and investors should make sure they have an investment plan that can carry them through the peaks and troughs.
If you are focused on a long-term investment strategy, the short-term ups and downs of the markets should not necessarily dictate portfolio action on your part. In our view, investors who remain committed to a long-term plan are more likely to achieve their financial goals.
In any market environment, we believe individual investors are best served by following a three-pronged investment strategy of allocating their holdings across the major asset classes, diversifying within each class, and regularly rebalancing their portfolios to maintain their desired allocations. Of course, these strategies cannot guarantee a profit or protect against a loss. Investing and planning for the long term require diligence and patience, two traits that in our experience are essential to capitalizing on the many opportunities the financial markets can offer — through both up and down economic cycles.
Respectfully,

Robert J. Manning
Chief Executive Officer and Chief Investment Officer
MFS Investment Management®
February 15, 2008
The opinions expressed in this letter are subject to change, may not be relied upon for investment advice, and no forecasts can be guaranteed.
1
PORTFOLIO COMPOSITION
Portfolio structure
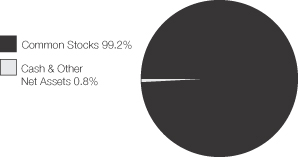
| | |
| Top ten holdings | | |
| Exxon Mobil Corp. | | 4.4% |
| Johnson & Johnson | | 2.5% |
| Intel Corp. | | 2.3% |
| Merck & Co., Inc. | | 2.2% |
| Hewlett-Packard Co. | | 2.2% |
| Bank of America Corp. | | 2.1% |
| JPMorgan Chase & Co. | | 2.1% |
| Altria Group, Inc. | | 2.0% |
| PepsiCo, Inc. | | 2.0% |
| Procter & Gamble Co. | | 1.9% |
| | |
| Equity sectors | | |
| Financial Services | | 18.8% |
| Technology | | 16.9% |
| Health Care | | 11.7% |
| Energy | | 11.7% |
| Utilities & Communications | | 8.5% |
| Consumer Staples | | 8.5% |
| Industrial Goods & Services | | 7.7% |
| Retailing | | 5.2% |
| Basic Materials | | 4.2% |
| Leisure | | 4.1% |
| Transportation | | 0.9% |
| Autos & Housing | | 0.6% |
| Special Products & Services | | 0.4% |
Percentages are based on net assets as of 12/31/07.
The portfolio is actively managed and current holdings may be different.
2
MANAGEMENT REVIEW
Summary of Results
For the twelve months ended December 31, 2007, Initial Class shares of the MFS Blended Research Core Equity Portfolio (the “fund”) provided a total return of 5.95%, while Service Class shares provided a total return of 5.69%. These compare with a return of 5.49% for the fund’s benchmark, the Standard & Poor’s 500 Stock Index (S&P 500 Index).
Market Environment
Despite seemingly robust growth rates during the second and third quarters of 2007, underlying economic activity in the U.S. remained muted relative to other major economies. Overall, global economies witnessed moderate to strong growth during the reporting period as domestic demand improved and world trade accelerated.
With the strong global growth, however, concerns emerged about rising global inflation, especially as capacity became more constrained, wages rose, and energy and food prices advanced. During the reporting period, global central banks (with the exception of the U.S. Federal Reserve Board) tightened monetary conditions, which in turn pushed global bond yields to their highest levels during this economic expansion.
However, financial markets – particularly in the mortgage and structured-products areas – experienced substantial volatility in recent months. Beginning in late July, heightened uncertainty and distress concerning the subprime mortgage market caused several global credit markets to tighten up, forcing central banks to inject liquidity and to reassess their tightening biases as sovereign bond yields declined and credit spreads widened. While credit conditions improved somewhat by late October as the Federal Reserve Board cut interest rates, the level of market turbulence remained significant through year end. Increased market turmoil was also exacerbated by U.S. home foreclosures and uncertainties surrounding falling housing prices. Despite increased volatility across all asset classes and the widening in credit spreads, U.S. labor markets were resilient and wages rose modestly. More broadly, global equity markets rebounded following summer losses and generally held those gains through the end of the reporting period.
Contributors to performance
Stock selection in the financial services sector contributed to the fund’s performance relative to the S&P 500 Index during the reporting period. Our positioning in financial services firms Wachovia(g) and Merrill Lynch(g) benefited relative results.
Security selection in the technology sector boosted relative returns. Strong performers in this sector included data storage systems provider EMC, computer and personal electronics maker Apple, and software giant Oracle. Apple delivered strong growth in revenues, profits, and earnings over the reporting period driven by standout sales of its iPod and Mac products.
Stocks in other sectors that helped relative results included specialty chemical company Praxair, global integrated energy company Hess, household products manufacturer Reckitt Benckiser(aa)(g) (U.K.), and credit card transactions processor First Data(g). Avoiding poor-performing cable services provider Comcast also aided relative performance.
Detractors from performance
Stock selection in the health care sector was the greatest detractor from relative performance over the period. Biotechnology firm Amgen and vision care and gynecology medical devices maker Cooper Companies were among the fund’s largest detractors within this sector. Shares of Amgen suffered, in part, due to studies that raised concerns about the safety profile of the company’s anemia drug Aranesp.
Security selection in the retailing sector dampened relative results. Discount retailer Family Dollar Stores, consumer electronics retail chains Radioshack, and apparel retailer Phillips-Van Heusen(aa) were negative contributors in this sector.
Stock selection, and to a lesser extent, an underweighted position in the industrial goods and services sector held back relative performance. No individual holdings within this sector were among the fund’s top detractors.
A number of individual securities in other sectors that hindered relative returns included credit card issuer Capital One Financial, mortgage financer Fannie Mae, and software developer Compuware(g) . Not owning strong-performing energy companies Chevron and Schlumberger also hurt relative results.
Respectfully,
Matthew Krummell
Portfolio Manager
| (aa) | Security is not a benchmark constituent. |
| (g) | Security was not held in the portfolio at period end. |
Note to Shareholders: Effective June 22, 2007, the fund changed its name from Massachusetts Investors Trust Series to Blended Research Core Equity Series and subsequently changed its name to MFS® Blended ResearchSM Core Equity Portfolio.
The views expressed in this report are those of the portfolio manager only through the end of the period of the report as stated on the cover and do not necessarily reflect the views of MFS or any other person in the MFS organization. These views are subject to change at any time based on market and other conditions, and MFS disclaims any responsibility to update such views. These views may not be relied upon as investment advice or an indication of trading intent on behalf of any MFS portfolio. References to specific securities are not recommendations of such securities, and may not be representative of any MFS portfolio’s current or future investments.
3
PERFORMANCE SUMMARY THROUGH 12/31/07
The following chart illustrates the historical performance of the fund in comparison to its benchmark index. Index comparisons are unmanaged; do not reflect any fees or expenses; and cannot be invested in directly. The performance of other share classes will be greater than or less than that of the class depicted below. (See Notes to Performance Summary.)
Performance data shown represents past performance and is no guarantee of future results. Investment return and principal value fluctuate so your units, when sold, may be worth more or less than the original cost; current performance may be lower or higher than quoted. The performance shown does not reflect the deduction of taxes, if any, that a contract holder would pay on fund distributions or the redemption of contract units. The returns for the fund shown also do not reflect the deduction of expenses associated with variable products, such as mortality and expense risk charges, separate account charges, and sales charges imposed by the insurance company separate accounts. Such expenses would reduce the overall returns shown.
Growth of a hypothetical $10,000 investment
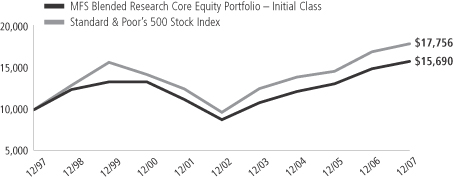
Total returns through 12/31/07
Average Annual Total Returns
| | | | | | | | | | | | |
| | | Share class | | Class inception date | | 1-yr | | 5-yr | | 10-yr | | |
| | | Initial Class | | 11/14/86 | | 5.95% | | 12.20% | | 4.61% | | |
| | | Service Class | | 8/24/01 | | 5.69% | | 11.92% | | 4.44% | | |
Comparative Index
| | | | | | | | | | | | |
| | | Standard & Poor’s 500 Stock Index (f) | | 5.49% | | 12.83% | | 5.91% | | |
| (f) | Source: FactSet Research Systems Inc. |
Index Definition
Standard & Poor’s 500 Stock Index – a market capitalization-weighted index of 500 widely held equity securities, designed to measure broad U.S. equity performance.
It is not possible to invest directly in an index.
Notes to Performance Summary
Service Class share performance includes the performance of Initial Class shares for periods prior to the inception of Service Class shares (blended performance). This blended performance figure has not been adjusted to take into account differences in the class-specific operating expenses (such as Rule 12b-1 fees). Because operating expenses of Service Class shares are generally higher than those of Initial Class shares, the blended Service Class shares performance shown is higher than it would have been had Service Class shares been offered for the entire period.
Performance results reflect any applicable expense subsidies and waivers in effect during the periods shown. Without such subsidies and waivers the fund’s performance results would be less favorable. Please see the prospectus for complete details. All results are historical and assume the reinvestment of any dividends and capital gains distributions.
From time to time the fund may receive proceeds from litigation settlements, without which performance would be lower.
4
EXPENSE TABLE
Fund Expenses Borne by the Contract Holders During the Period,
July 1, 2007 through December 31, 2007
As a contract holder of the fund, you incur ongoing costs, including management fees; distribution (12b-1) fees; and other fund expenses. This example is intended to help you understand your ongoing costs (in dollars) of investing in the fund and to compare these costs with the ongoing costs of investing in other mutual funds.
The example is based on an investment of $1,000 invested at the beginning of the period and held for the entire period July 1, 2007 through December 31, 2007.
Actual expenses
The first line for each share class in the following table provides information about actual account values and actual expenses. You may use the information in this line, together with the amount you invested, to estimate the expenses that you paid over the period. Simply divide your account value by $1,000 (for example, an $8,600 account value divided by $1,000 = 8.6), then multiply the result by the number in the first line under the heading entitled “Expenses Paid During Period” to estimate the expenses you paid on your account during this period.
Hypothetical example for comparison purposes
The second line for each share class in the following table provides information about hypothetical account values and hypothetical expenses based on the fund’s actual expense ratio and an assumed rate of return of 5% per year before expenses, which is not the fund’s actual return. The hypothetical account values and expenses may not be used to estimate the actual ending account balance or expenses you paid for the period. You may use this information to compare the ongoing costs of investing in the fund and other funds. To do so, compare this 5% hypothetical example with the 5% hypothetical examples that appear in the shareholder reports of the other funds.
Please note that the expenses shown in the table are meant to highlight the fund’s ongoing costs only and do not take into account the fees and expenses imposed under the variable contracts through which your investment in the fund is made. Therefore, the second line for each share class in the table is useful in comparing ongoing costs associated with an investment in vehicles (such as the fund) which fund benefits under variable annuity and variable life insurance contracts and to qualified pension and retirement plans only, and will not help you determine the relative total costs of investing in the fund through variable annuity and variable life insurance contracts. If the fees and expenses imposed under the variable contracts were included, your costs would have been higher.
| | | | | | | | | | |
| Share Class | | | | Annualized
Expense Ratio | | Beginning
Account Value
7/01/07 | | Ending Account Value
12/31/07 | | Expenses Paid
During Period (p)
7/01/07-12/31/07 |
| Initial Class | | Actual | | 0.60% | | $1,000.00 | | $991.30 | | $3.01 |
| | Hypothetical (h) | | 0.60% | | $1,000.00 | | $1,022.18 | | $3.06 |
| Service Class | | Actual | | 0.85% | | $1,000.00 | | $990.20 | | $4.26 |
| | Hypothetical (h) | | 0.85% | | $1,000.00 | | $1,020.92 | | $4.33 |
| (h) | 5% class return per year before expenses. |
| (p) | Expenses paid is equal to each class’ annualized expense ratio, as shown above, multiplied by the average account value over the period, multiplied by the number of days in the period, divided by the number of days in the year. |
5
PORTFOLIO OF INVESTMENTS – 12/31/07
The Portfolio of Investments is a complete list of all securities owned by your fund.
It is categorized by broad-based asset classes.
| | | | | |
| Issuer | | Shares/Par | | Value ($) |
| | | | | |
| COMMON STOCKS – 99.2% | | | | | |
| Aerospace – 2.8% | | | | | |
| Lockheed Martin Corp. | | 149,080 | | $ | 15,692,161 |
| Northrop Grumman Corp. | | 162,870 | | | 12,808,097 |
| | | | | |
| | | | $ | 28,500,258 |
| | | | | |
| Apparel Manufacturers – 0.8% | | | | | |
| Phillips-Van Heusen Corp. | | 206,230 | | $ | 7,601,638 |
| | | | | |
| Automotive – 0.3% | | | | | |
| Autoliv, Inc. (l) | | 53,110 | | $ | 2,799,428 |
| | | | | |
| Biotechnology – 1.3% | | | | | |
| Amgen, Inc. (a) | | 219,110 | | $ | 10,175,468 |
| Genentech, Inc. (a) | | 40,300 | | | 2,702,921 |
| | | | | |
| | | | $ | 12,878,389 |
| | | | | |
| Broadcasting – 2.1% | | | | | |
| Time Warner, Inc. | | 485,220 | | $ | 8,010,982 |
| Walt Disney Co. | | 423,930 | | | 13,684,460 |
| | | | | |
| | | | $ | 21,695,442 |
| | | | | |
| Brokerage & Asset Managers – 3.8% | | | | | |
| Goldman Sachs Group, Inc. | | 70,920 | | $ | 15,251,346 |
| Lehman Brothers Holdings, Inc. | | 229,580 | | | 15,023,715 |
| Morgan Stanley | | 158,510 | | | 8,418,466 |
| | | | | |
| | | | $ | 38,693,527 |
| | | | | |
| Chemicals – 1.1% | | | | | |
| 3M Co. | | 132,870 | | $ | 11,203,598 |
| | | | | |
| Computer Software – 2.9% | | | | | |
| Microsoft Corp. | | 307,310 | | $ | 10,940,236 |
| Oracle Corp. (a) | | 831,560 | | | 18,776,625 |
| | | | | |
| | | | $ | 29,716,861 |
| | | | | |
| Computer Software – Systems – 7.0% | | | | | |
| Apple Computer, Inc. (a) | | 90,760 | | $ | 17,977,741 |
| EMC Corp. (a) | | 690,360 | | | 12,792,371 |
| Hewlett-Packard Co. | | 431,800 | | | 21,797,264 |
| International Business Machines Corp. | | 165,530 | | | 17,893,793 |
| | | | | |
| | | | $ | 70,461,169 |
| | | | | |
| Construction – 0.3% | | | | | |
| NVR, Inc. (a)(l) | | 6,120 | | $ | 3,206,880 |
| | | | | |
| Consumer Goods & Services – 3.4% | | | | | |
| Apollo Group, Inc., “A” (a) | | 57,790 | | $ | 4,053,969 |
| Colgate-Palmolive Co. | | 142,040 | | | 11,073,438 |
| Procter & Gamble Co. | | 267,110 | | | 19,611,216 |
| | | | | |
| | | | $ | 34,738,623 |
| | | | | |
| Electrical Equipment – 2.6% | | | | | |
| General Electric Co. | | 483,320 | | $ | 17,916,672 |
| Tyco International Ltd. (a) | | 117,300 | | | 4,650,945 |
| WESCO International, Inc. (a)(l) | | 98,320 | | | 3,897,405 |
| | | | | |
| | | | $ | 26,465,022 |
| | | | | |
| Electronics – 3.0% | | | | | |
| Intel Corp. | | 865,950 | | $ | 23,086,227 |
| | | | | |
| Issuer | | Shares/Par | | Value ($) |
| | | | | |
| COMMON STOCKS – continued | | | | | |
| Electronics – continued | | | | | |
| National Semiconductor Corp. (l) | | 301,800 | | $ | 6,832,752 |
| | | | | |
| | | | $ | 29,918,979 |
| | | | | |
| Energy – Independent – 3.2% | | | | | |
| Apache Corp. | | 51,170 | | $ | 5,502,822 |
| Devon Energy Corp. | | 177,130 | | | 15,748,628 |
| Valero Energy Corp. | | 159,930 | | | 11,199,898 |
| | | | | |
| | | | $ | 32,451,348 |
| | | | | |
| Energy – Integrated – 6.6% | | | | | |
| Exxon Mobil Corp. | | 477,420 | | $ | 44,729,480 |
| Hess Corp. | | 73,530 | | | 7,416,236 |
| Marathon Oil Corp. | | 235,770 | | | 14,348,962 |
| | | | | |
| | | | $ | 66,494,678 |
| | | | | |
| Food & Beverages – 3.5% | | | | | |
| Coca-Cola Co. | | 61,390 | | $ | 3,767,504 |
| General Mills, Inc. | | 200,830 | | | 11,447,310 |
| PepsiCo, Inc. | | 260,920 | | | 19,803,828 |
| | | | | |
| | | | $ | 35,018,642 |
| | | | | |
| Food & Drug Stores – 1.8% | | | | | |
| CVS Caremark Corp. | | 210,180 | | $ | 8,354,655 |
| Kroger Co. | | 355,260 | | | 9,488,995 |
| | | | | |
| | | | $ | 17,843,650 |
| | | | | |
| Gaming & Lodging – 0.8% | | | | | |
| International Game Technology | | 188,850 | | $ | 8,296,181 |
| | | | | |
| General Merchandise – 1.0% | | | | | |
| Family Dollar Stores, Inc. (l) | | 411,910 | | $ | 7,921,029 |
| Wal-Mart Stores, Inc. | | 49,950 | | | 2,374,124 |
| | | | | |
| | | | $ | 10,295,153 |
| | | | | |
| Health Maintenance Organizations – 2.0% | | | |
| Humana, Inc. (a) | | 164,810 | | $ | 12,411,841 |
| UnitedHealth Group, Inc. | | 138,390 | | | 8,054,298 |
| | | | | |
| | | | $ | 20,466,139 |
| | | | | |
| Insurance – 4.9% | | | | | |
| Allstate Corp. | | 92,620 | | $ | 4,837,543 |
| American International Group, Inc. | | 45,927 | | | 2,677,544 |
| Hartford Financial Services Group, Inc. | | 137,630 | | | 11,999,960 |
| MetLife, Inc. | | 63,520 | | | 3,914,102 |
| Prudential Financial, Inc. | | 143,240 | | | 13,327,050 |
| Travelers Cos., Inc. | | 238,770 | | | 12,845,826 |
| | | | | |
| | | | $ | 49,602,025 |
| | | | | |
| Internet – 1.4% | | | | | |
| Google, Inc., “A” (a) | | 21,110 | | $ | 14,597,143 |
| | | | | |
| Machinery & Tools – 2.1% | | | | | |
| Eaton Corp. | | 115,070 | | $ | 11,156,037 |
| Timken Co. (l) | | 317,420 | | | 10,427,247 |
| | | | | |
| | | | $ | 21,583,284 |
| | | | | |
6
Portfolio of Investments – continued
| | | | | |
| Issuer | | Shares/Par | | Value ($) |
| | | | | |
| COMMON STOCKS – continued | | | | | |
| Major Banks – 6.5% | | | | | |
| Bank of America Corp. | | 511,960 | | $ | 21,123,470 |
| Bank of New York Mellon Corp. | | 322,138 | | | 15,707,449 |
| JPMorgan Chase & Co. | | 476,830 | | | 20,813,630 |
| State Street Corp. | | 94,820 | | | 7,699,384 |
| | | | | |
| | | | $ | 65,343,933 |
| | | | | |
| Medical Equipment – 1.4% | | | | | |
| Baxter International, Inc. | | 70,780 | | $ | 4,108,779 |
| Cooper Cos., Inc. (l) | | 200,110 | | | 7,604,180 |
| Medtronic, Inc. | | 55,110 | | | 2,770,380 |
| | | | | |
| | | | $ | 14,483,339 |
| | | | | |
| Metals & Mining – 1.6% | | | | | |
| Freeport-McMoRan Copper & Gold, Inc. (l) | | 70,290 | | $ | 7,200,508 |
| Southern Copper Corp. (l) | | 84,520 | | | 8,885,588 |
| | | | | |
| | | | $ | 16,086,096 |
| | | | | |
| Natural Gas – Pipeline – 1.4% | | | | | |
| Williams Cos., Inc. | | 393,450 | | $ | 14,077,641 |
| | | | | |
| Network & Telecom – 2.2% | | | | | |
| Cisco Systems, Inc. (a) | | 353,240 | | $ | 9,562,207 |
| Motorola, Inc. | | 805,750 | | | 12,924,230 |
| | | | | |
| | | | $ | 22,486,437 |
| | | | | |
| Oil Services – 1.9% | | | | | |
| Halliburton Co. | | 366,780 | | $ | 13,904,630 |
| Tidewater, Inc. (l) | | 70,220 | | | 3,852,269 |
| Transocean, Inc. | | 6,860 | | | 982,009 |
| | | | | |
| | | | $ | 18,738,908 |
| | | | | |
Other Banks & Diversified
Financials – 3.6% | | | |
| Capital One Financial Corp. | | 186,770 | | $ | 8,826,750 |
| Citigroup, Inc. | | 338,600 | | | 9,968,384 |
| Fannie Mae | | 158,590 | | | 6,340,428 |
| Freddie Mac | | 55,760 | | | 1,899,743 |
| Ryder System, Inc. (l) | | 201,580 | | | 9,476,276 |
| | | | | |
| | | | $ | 36,511,581 |
| | | | | |
| Personal Computers & Peripherals – 0.4% | | | |
| Nuance Communications, Inc. (a) | | 200,430 | | $ | 3,744,032 |
| | | | | |
| Pharmaceuticals – 7.0% | | | | | |
| Bristol-Myers Squibb Co. | | 165,680 | | $ | 4,393,834 |
| Endo Pharmaceuticals Holdings, Inc. (a) | | 325,490 | | | 8,680,818 |
| Johnson & Johnson | | 384,950 | | | 25,676,165 |
| Merck & Co., Inc. | | 386,250 | | | 22,444,988 |
| Pfizer, Inc. | | 122,640 | | | 2,787,607 |
| Wyeth | | 156,920 | | | 6,934,295 |
| | | | | |
| | | | $ | 70,917,707 |
| | | | | |
| Pollution Control – 0.2% | | | | | |
| Allied Waste Industries, Inc. (a)(l) | | 208,450 | | $ | 2,297,119 |
| | | | | |
| Railroad & Shipping – 0.9% | | | | | |
| Burlington Northern Santa Fe Corp. | | 12,290 | | $ | 1,022,897 |
| Union Pacific Corp. | | 65,400 | | | 8,215,548 |
| | | | | |
| | | | $ | 9,238,445 |
| | | | | |
| | | | | | | |
| Issuer | | Shares/Par | | Value ($) | |
| | | | | | | |
| COMMON STOCKS – continued | | | | | | | |
| Restaurants – 1.2% | | | | | | | |
| McDonald’s Corp. | | | 212,070 | | $ | 12,493,044 | |
| | | | | | | |
| Specialty Chemicals – 1.5% | | | | | | | |
| Praxair, Inc. | | | 173,690 | | $ | 15,408,040 | |
| | | | | | | |
| Specialty Stores – 1.6% | | | | | | | |
| GameStop Corp., “A” (a) | | | 91,630 | | $ | 5,691,139 | |
| Lowe’s Cos., Inc. | | | 207,300 | | | 4,689,126 | |
| RadioShack Corp. (l) | | | 320,470 | | | 5,403,124 | |
| | | | | | | |
| | | | | $ | 15,783,389 | |
| | | | | | | |
| Telephone Services – 3.5% | | | | | | | |
| AT&T, Inc. | | | 298,130 | | $ | 12,390,283 | |
| Embarq Corp. | | | 162,920 | | | 8,069,428 | |
| Verizon Communications, Inc. | | | 337,940 | | | 14,764,599 | |
| | | | | | | |
| | | | | $ | 35,224,310 | |
| | | | | | | |
| Tobacco – 2.0% | | | | | | | |
| Altria Group, Inc. | | | 265,230 | | $ | 20,046,083 | |
| | | | | | | |
| Utilities – Electric Power – 3.6% | | | | | | | |
| Constellation Energy Group, Inc. | | | 150,340 | | $ | 15,414,360 | |
| FirstEnergy Corp. | | | 47,660 | | | 3,447,724 | |
| Mirant Corp. (a) | | | 207,510 | | | 8,088,736 | |
| NRG Energy, Inc. (a)(l) | | | 223,300 | | | 9,677,822 | |
| | | | | | | |
| | | | | $ | 36,628,642 | |
| | | | | | | |
Total Common Stocks
(Identified Cost, $966,057,904) | | | | | $ | 1,004,036,803 | |
| | | | | | | |
| |
| SHORT-TERM OBLIGATIONS – 0.7% | | | | |
American Express Credit Corp.,
4.12%, due 1/02/08, at
Amortized Cost and Value (y) | | $ | 6,674,000 | | $ | 6,673,236 | |
| | | | | | | |
| |
| COLLATERAL FOR SECURITIES LOANED – 4.9% | | | | |
| Navigator Securities Lending Prime Portfolio, at Cost and Net Asset Value | | | 49,714,835 | | $ | 49,714,835 | |
| | | | | | | |
Total Investments
(Identified Cost, $1,022,445,975) | | | | | $ | 1,060,424,874 | |
| | | | | | | |
OTHER ASSETS, LESS
LIABILITIES – (4.8)% | | | | | | (48,769,258 | ) |
| | | | | | | |
| Net Assets – 100.0% | | | | | $ | 1,011,655,616 | |
| | | | | | | |
| (a) | Non-income producing security. |
| (l) | All or a portion of this security is on loan. |
| (y) | The rate shown represents an annualized yield at time of purchase. |
See Notes to Financial Statements
7
FINANCIAL STATEMENTS | STATEMENT OF ASSETS AND LIABILITIES
This statement represents your fund’s balance sheet, which details the assets and liabilities comprising the total value of the fund.
| | | | | |
| At 12/31/07 | | | | | |
| Assets | | | | | |
| Investments, at value, including $51,714,027 of securities on loan (identified cost, $1,022,445,975) | | $1,060,424,874 | | | |
| Cash | | 1,476 | | | |
| Receivable for fund shares sold | | 5,465 | | | |
| Interest and dividends receivable | | 1,274,152 | | | |
| Other assets | | 630,058 | | | |
| Total assets | | | | | $1,062,336,025 |
| Liabilities | | | | | |
| Payable for fund shares reacquired | | $750,160 | | | |
| Collateral for securities loaned, at value (c) | | 49,714,835 | | | |
| Payable to affiliates | | | | | |
Investment adviser | | 39,160 | | | |
Management fee | | 61,472 | | | |
Distribution fees | | 9,343 | | | |
Administrative services fee | | 2,631 | | | |
| Payable for independent trustees’ compensation | | 3,451 | | | |
| Accrued expenses and other liabilities | | 99,357 | | | |
| Total liabilities | | | | | $50,680,409 |
| Net assets | | | | | $1,011,655,616 |
| Net assets consist of | | | | | |
| Paid-in capital | | $967,514,387 | | | |
| Unrealized appreciation (depreciation) on investments and translation of assets and liabilities in foreign currencies | | 37,979,440 | | | |
| Accumulated net realized gain (loss) on investments and foreign currency transactions | | (4,929,334 | ) | | |
| Undistributed net investment income | | 11,091,123 | | | |
| Net assets | | | | | $1,011,655,616 |
| Shares of beneficial interest outstanding | | | | | 28,567,709 |
| Initial Class shares | | | | | |
Net assets | | $673,008,141 | | | |
Shares outstanding | | 18,954,418 | | | |
Net asset value per share | | | | | $35.51 |
| Service Class shares | | | | | |
Net Assets | | $338,647,475 | | | |
Shares outstanding | | 9,613,291 | | | |
Net asset value per share | | | | | $35.23 |
| (c) | Non-cash collateral not included. |
See Notes to Financial Statements
8
FINANCIAL STATEMENTS | STATEMENT OF OPERATIONS
This statement describes how much your fund earned in investment income and accrued in expenses. It also describes any gains and/or losses generated by fund operations.
| | | | | | |
| Year ended 12/31/07 | | | | | | |
| Net investment income | | | | | | |
| Income | | | | | | |
Dividends | | $18,384,657 | | | | |
Interest | | 610,727 | | | | |
Foreign taxes withheld | | (227,934 | ) | | | |
| Total investment income | | | | | $18,767,450 | |
| Expenses | | | | | | |
Management fee | | $6,138,303 | | | | |
Distribution fees | | 873,038 | | | | |
Administrative services fee | | 281,246 | | | | |
Independent trustees’ compensation | | 107,075 | | | | |
Custodian fee | | 157,919 | | | | |
Shareholder communications | | 60,591 | | | | |
Auditing fees | | 41,993 | | | | |
Legal fees | | 5,950 | | | | |
Miscellaneous | | 84,155 | | | | |
| Total expenses | | | | | $7,750,270 | |
Fees paid indirectly | | (1,799 | ) | | | |
Reduction of expenses by investment adviser | | (115,258 | ) | | | |
| Net expenses | | | | | $7,633,213 | |
| Net investment income | | | | | $11,134,237 | |
| Realized and unrealized gain (loss) on investments and foreign currency transactions | | | | | | |
| Realized gain (loss) (identified cost basis) | | | | | | |
Investment transactions | | $191,497,586 | | | | |
Foreign currency transactions | | (38,060 | ) | | | |
| Net realized gain (loss) on investments and foreign currency transactions | | | | | $191,459,526 | |
| Change in unrealized appreciation (depreciation) | | | | | | |
Investments | | $(135,347,233 | ) | | | |
Translation of assets and liabilities in foreign currencies | | 1,108 | | | | |
| Net unrealized gain (loss) on investments and foreign currency translation | | | | | $(135,346,125 | ) |
| Net realized and unrealized gain (loss) on investments and foreign currency | | | | | $56,113,401 | |
| Change in net assets from operations | | | | | $67,247,638 | |
See Notes to Financial Statements
9
FINANCIAL STATEMENTS | STATEMENTS OF CHANGES IN NET ASSETS
These statements describe the increases and/or decreases in net assets resulting from operations, any distributions, and any shareholder transactions.
| | | | | | |
| For years ended 12/31 | | 2007 | | | 2006 | |
| Change in net assets | | | | | | |
| From operations | | | | | | |
| Net investment income | | $11,134,237 | | | $12,429,589 | |
| Net realized gain (loss) on investments and foreign currency transactions | | 191,459,526 | | | 101,625,772 | |
| Net unrealized gain (loss) on investments and foreign currency translation | | (135,346,125 | ) | | 25,639,441 | |
| Change in net assets from operations | | $67,247,638 | | | $139,694,802 | |
| Distributions declared to shareholders | | | | | | |
| From net investment income | | | | | | |
Initial Class | | $(9,003,386 | ) | | $(7,057,076 | ) |
Service Class | | (3,474,027 | ) | | (1,512,887 | ) |
| Total distributions declared to shareholders | | $(12,477,413 | ) | | $(8,569,963 | ) |
| Change in net assets from fund share transactions | | $(189,920,509 | ) | | $(112,817,168 | ) |
| Total change in net assets | | $(135,150,284 | ) | | $18,307,671 | |
| Net assets | | | | | | |
| At beginning of period | | 1,146,805,900 | | | 1,128,498,229 | |
At end of period (including undistributed net investment income of $11,091,123 and
$12,472,359, respectively) | | $1,011,655,616 | | | $1,146,805,900 | |
See Notes to Financial Statements
10
FINANCIAL STATEMENTS | FINANCIAL HIGHLIGHTS
The financial highlights table is intended to help you understand the fund’s financial performance for the past 5 years. Certain information reflects financial results for a single fund share. The total returns in the table represent the rate by which an investor would have earned (or lost) on an investment in the fund share class (assuming reinvestment of all distributions) held for the entire period.
Initial Class
| | | | | | | | | | | | | | | |
| | | Years ended 12/31 | |
| | | 2007 | | | 2006 | | | 2005 | | | 2004 | | | 2003 | |
| Net asset value, beginning of period | | $33.89 | | | $30.15 | | | $28.27 | | | $25.51 | | | $21.01 | |
| Income (loss) from investment operations | | | | | | | | | | | | | | | |
| Net investment income (d) | | $0.38 | | | $0.37 | | | $0.23 | | | $0.25 | | | $0.23 | |
Net realized and unrealized gain (loss) on investments
and foreign currency | | 1.64 | | | 3.62 | | | 1.92 | | | 2.77 | | | 4.52 | |
| Total from investment operations | | $2.02 | | | $3.99 | | | $2.15 | | | $3.02 | | | $4.75 | |
| Less distributions declared to shareholders | | | | | | | | | | | | | | | |
| From net investment income | | $(0.40 | ) | | $(0.25 | ) | | $(0.27 | ) | | $(0.26 | ) | | $(0.25 | ) |
| Net asset value, end of period | | $35.51 | | | $33.89 | | | $30.15 | | | $28.27 | | | $25.51 | |
| Total return (%) (k)(s) | | 5.95 | | | 13.30 | | | 7.70 | | | 11.99 | (b) | | 22.83 | (j) |
Ratios (%) (to average net assets)
and Supplemental data: | | | | | | | | | | | | | | | |
| Expenses before expense reductions (f) | | 0.62 | | | 0.61 | | | 0.63 | | | 0.61 | | | 0.61 | |
| Expenses after expense reductions (f) | | 0.61 | | | N/A | | | N/A | | | N/A | | | N/A | |
| Net investment income | | 1.07 | | | 1.18 | | | 0.79 | | | 0.95 | | | 1.04 | |
| Portfolio turnover | | 102 | | | 35 | | | 49 | | | 78 | | | 78 | |
| Net assets at end of period (000 Omitted) | | $673,008 | | | $826,937 | | | $929,794 | | | $1,073,587 | | | $1,153,238 | |
See Notes to Financial Statements
11
Financial Highlights – continued
Service Class
| | | | | | | | | | | | | | | |
| | | Years ended 12/31 | |
| | | 2007 | | | 2006 | | | 2005 | | | 2004 | | | 2003 | |
| Net asset value, beginning of period | | $33.65 | | | $29.96 | | | $28.13 | | | $25.39 | | | $20.94 | |
| Net investment income (d) | | $0.29 | | | $0.28 | | | $0.16 | | | $0.18 | | | $0.18 | |
Net realized and unrealized gain (loss) on investments
and foreign currency | | 1.63 | | | 3.61 | | | 1.90 | | | 2.77 | | | 4.49 | |
| Total from investment operations | | $1.92 | | | $3.89 | | | $2.06 | | | $2.95 | | | $4.67 | |
| Less distributions declared to shareholders | | | | | | | | | | | | | | | |
| From net investment income | | $(0.34 | ) | | $(0.20 | ) | | $(0.23 | ) | | $(0.21 | ) | | $(0.22 | ) |
| Net asset value, end of period | | $35.23 | | | $33.65 | | | $29.96 | | | $28.13 | | | $25.39 | |
| Total return (%) (k)(s) | | 5.69 | | | 13.04 | | | 7.42 | | | 11.74 | (b) | | 22.45 | (j) |
Ratios (%) (to average net assets)
and Supplemental data: | | | | | | | | | | | | | | | |
| Expenses before expense reductions (f) | | 0.87 | | | 0.86 | | | 0.88 | | | 0.86 | | | 0.86 | |
| Expenses after expense reductions (f) | | 0.86 | | | N/A | | | N/A | | | N/A | | | N/A | |
| Net investment income | | 0.84 | | | 0.88 | | | 0.54 | | | 0.70 | | | 0.79 | |
| Portfolio turnover | | 102 | | | 35 | | | 49 | | | 78 | | | 78 | |
| Net assets at end of period (000 Omitted) | | $338,647 | | | $319,869 | | | $198,705 | | | $82,053 | | | $76,899 | |
| (b) | The fund’s net asset value and total return calculation include a non-recurring accrual recorded as a result of an administrative proceeding regarding disclosure of brokerage allocation practices in connection with fund sales. The non-recurring accrual resulted in an increase in the net asset value of $0.01 per share based on shares outstanding on the day the proceeds were recorded. |
| (d) | Per share data are based on average shares outstanding. |
| (f) | Ratios do not reflect reductions from fees paid indirectly, if applicable. |
| (j) | The fund’s net asset value and total return calculation include proceeds received on March 26, 2003 for the partial payment of a non-recurring litigation settlement from Cendant Corporation, recorded as a realized gain on investment transactions. The proceeds resulted in an increase in the net asset value of $0.002 per share based on shares outstanding on the day the proceeds were received. Excluding the effect of this payment from the ending net asset value per share, the Initial Class and Service Class total returns for the year ended December 31, 2003 would have each been lower by approximately 0.01%. |
| (k) | The total return does not reflect expenses that apply to separate accounts. Inclusion of these charges would reduce the total return figures for all periods shown. |
| (s) | From time to time the fund may receive proceeds from litigation settlements, without which performance would be lower. |
See Notes to Financial Statements
12
NOTES TO FINANCIAL STATEMENTS
(1) Business and Organization
MFS Blended Research Core Equity Portfolio (formerly Massachusetts Investors Trust Series) (the fund) is a series of MFS Variable Insurance Trust II (formerly known as MFS/Sun Life Series Trust) (the trust). The trust is organized as a Massachusetts business trust and is registered under the Investment Company Act of 1940, as amended, as an open-end management investment company. The shares of the fund are sold only to variable accounts established by insurance companies to fund benefits under variable contracts issued by such companies and qualified retirement and pension plans.
(2) Significant Accounting Policies
General – The preparation of financial statements in conformity with U.S. generally accepted accounting principles requires management to make estimates and assumptions that affect the reported amounts of assets and liabilities, and disclosure of contingent assets and liabilities at the date of the financial statements and the reported amounts of revenues and expenses during the reporting period. Actual results could differ from those estimates.
Investment Valuations – Equity securities, including restricted equity securities, are generally valued at the last sale or official closing price as reported by an independent pricing service on the market or exchange on which they are primarily traded. For securities for which there were no sales reported that day, equity securities are generally valued at the last quoted daily bid quotation as reported by an independent pricing service on the market or exchange on which they are primarily traded. For securities held short for which there were no sales reported for the day, the position is generally valued at the last quoted daily ask quotation as reported by an independent pricing service on the market or exchange on which such securities are primarily traded. Short-term instruments with a maturity at issuance of 60 days or less may be valued at amortized cost, which approximates market value. Forward foreign currency contracts are generally valued at the mean of bid and asked prices for the time period interpolated from rates reported by an independent pricing service for proximate time periods. Open-end investment companies are generally valued at their net asset value per share. Securities and other assets generally valued on the basis of information from an independent pricing service may also be valued at a broker-dealer bid quotation. The values of foreign securities and other assets and liabilities expressed in foreign currencies are converted to U.S. dollars using the mean of bid and asked prices for rates reported by an independent pricing service.
The Board of Trustees has delegated primary responsibility for determining or causing to be determined the value of the fund’s investments (including any fair valuation) to the adviser pursuant to valuation policies and procedures approved by the Board. If the adviser determines that reliable market quotations are not readily available, investments are valued at fair value as determined in good faith by the adviser in accordance with such procedures under the oversight of the Board of Trustees. Under the fund’s valuation policies and procedures, market quotations are not considered to be readily available for many types of debt instruments and certain types of derivatives. These investments are generally valued at fair value based on information from independent pricing services. In addition, investments may be valued at fair value if the adviser determines that an investment’s value has been materially affected by events occurring after the close of the exchange or market on which the investment is principally traded (such as foreign exchange or market) and prior to the determination of the fund’s net asset value, or after the halting of trading of a specific security where trading does not resume prior to the close of the exchange or market on which the security is principally traded. Events that occur on a frequent basis after foreign markets close (such as developments in foreign markets and significant movements in the U.S. markets) and prior to the determination of the fund’s net asset value may be deemed to have a material affect on the value of securities traded in foreign markets. Accordingly, the fund’s foreign equity securities may often be valued at fair value. The adviser may rely on independent pricing services or other information (such as the correlation with price movements of similar securities in the same or other markets; the type, cost and investment characteristics of the security; the business and financial condition of the issuer; and trading and other market data) to assist in determining whether to fair value and at what value to fair value an investment. The value of an investment for purposes of calculating the fund’s net asset value can differ depending on the source and method used to determine value. When fair valuation is used, the value of investments used to determine the fund’s net asset value may differ from quoted or published prices for the same investments.
In September 2006, FASB Statement No. 157, Fair Value Measurements (the “Statement”) was issued, and is effective for fiscal years beginning after November 15, 2007 and for all interim periods within those fiscal years. This Statement provides a single definition of fair value, a hierarchy for measuring fair value and expanded disclosures about fair value measurements. Management is evaluating the application of the Statement to the fund, and believes the impact will be limited to expanded disclosures resulting from the adoption of this Statement in the fund’s financial statements.
Repurchase Agreements – The fund may enter into repurchase agreements with institutions that the fund’s investment adviser has determined are creditworthy. Each repurchase agreement is recorded at cost. The fund requires that the securities collateral in a repurchase transaction be transferred to the custodian in a manner sufficient to enable the fund to obtain those securities in the event of a default under the repurchase agreement. The fund monitors, on a daily basis, the value of the collateral to ensure that its value, including accrued interest, is greater than amounts owed to the fund under each such repurchase agreement. The fund and other
13
Notes to Financial Statements – continued
funds managed by Massachusetts Financial Services Company (MFS), may utilize a joint trading account for the purpose of entering into one or more repurchase agreements.
Foreign Currency Translation – Purchases and sales of foreign investments, income, and expenses are converted into U.S. dollars based upon currency exchange rates prevailing on the respective dates of such transactions. Gains and losses attributable to foreign currency exchange rates on sales of securities are recorded for financial statement purposes as net realized gains and losses on investments. Gains and losses attributable to foreign exchange rate movements on income and expenses are recorded for financial statement purposes as foreign currency transaction gains and losses. That portion of both realized and unrealized gains and losses on investments that results from fluctuations in foreign currency exchange rates is not separately disclosed.
Derivative Risk – The fund may invest in derivatives for hedging or non-hedging purposes. While hedging can reduce or eliminate losses, it can also reduce or eliminate gains. When the fund uses derivatives as an investment to gain market exposure, or for hedging purposes, gains and losses from derivative instruments may be substantially greater than the derivative’s original cost. Derivative instruments include forward foreign currency exchange contracts.
Forward Foreign Currency Exchange Contracts – The fund may enter into forward foreign currency exchange contracts for the purchase or sale of a specific foreign currency at a fixed price on a future date. Risks may arise upon entering into these contracts from the potential inability of counterparties to meet the terms of their contracts and from unanticipated movements in the value of the contract. The fund may enter into forward foreign currency exchange contracts for hedging purposes as well as for non-hedging purposes. For hedging purposes, the fund may enter into contracts to deliver or receive foreign currency it will receive from or require for its normal investment activities. The fund may also use contracts in a manner intended to protect foreign currency denominated securities from declines in value due to unfavorable exchange rate movements. For non-hedging purposes, the fund may enter into contracts with the intent of changing the relative exposure of the fund’s portfolio of securities to different currencies to take advantage of anticipated changes. The forward foreign currency exchange contracts are adjusted by the daily exchange rate of the underlying currency and any gains or losses are recorded as unrealized until the contract settlement date. On contract settlement date, the gains or losses are recorded as realized gains or losses on foreign currency transactions.
Security Loans – State Street Bank and Trust Company (“State Street”), as lending agent, may loan the securities of the fund to certain qualified institutions (the “Borrowers”) approved by the fund. The loans are collateralized at all times by cash and/or U.S. Treasury securities in an amount at least equal to the market value of the securities loaned. State Street provides the fund with indemnification against Borrower default. The fund bears the risk of loss with respect to the investment of cash collateral. On loans collateralized by cash, the cash collateral is invested in a money market fund or short-term securities. A portion of the income generated upon investment of the collateral is remitted to the Borrowers, and the remainder is allocated between the fund and the lending agent. On loans collateralized by U.S. Treasury securities, a fee is received from the Borrower, and is allocated between the fund and the lending agent. Net income from securities lending is included in interest income on the Statement of Operations. The dividend and interest income earned on the securities loaned is accounted for in the same manner as other dividend and interest income.
At December 31, 2007, the value of securities loaned was $51,714,027. These loans were collateralized by cash of $49,714,835 and U.S. Treasury obligations of $3,201,864.
Indemnifications – Under the fund’s organizational documents, its officers and trustees may be indemnified against certain liabilities and expenses arising out of the performance of their duties to the fund. Additionally, in the normal course of business, the fund enters into agreements with service providers that may contain indemnification clauses. The fund’s maximum exposure under these agreements is unknown as this would involve future claims that may be made against the fund that have not yet occurred.
Investment Transactions and Income – Investment transactions are recorded on the trade date. Interest income is recorded on the accrual basis. All premium and discount is amortized or accreted for financial statement purposes in accordance with U.S. generally accepted accounting principles. All discount is accreted for tax reporting purposes as required by federal income tax regulations. Dividends received in cash are recorded on the ex-dividend date. Certain dividends from foreign securities will be recorded when the fund is informed of the dividend if such information is obtained subsequent to the ex-dividend date. Dividend and interest payments received in additional securities are recorded on the ex-dividend or ex-interest date in an amount equal to the value of the security on such date.
The fund may receive proceeds from litigation settlements. Any proceeds received from litigation involving portfolio holdings are reflected in the Statement of Operations in realized gain/loss if the security has been disposed of by the fund or in unrealized gain/loss if the security is still held by the fund. Any other proceeds from litigation not related to portfolio holdings are reflected as other income in the Statement of Operations.
14
Notes to Financial Statements – continued
Fees Paid Indirectly – The fund’s custody fee may be reduced according to an arrangement that measures the value of cash deposited with the custodian by the fund. This amount, for the year ended December 31, 2007, is shown as a reduction of total expenses on the Statement of Operations.
Tax Matters and Distributions – The fund intends to qualify as a regulated investment company, as defined under Subchapter M of the Internal Revenue Code, and to distribute all of its taxable income, including realized capital gains. As a result, no provision for federal income taxes is required. The fund adopted the provisions of FASB Interpretation No. 48, Accounting for Uncertainty in Income Taxes (“the Interpretation”) on January 1, 2007. The Interpretation prescribes a minimum threshold for financial statement recognition of the benefit of a tax position taken or expected to be taken in a tax return. There was no impact resulting from the adoption of this Interpretation on the fund’s financial statements. Each of the fund’s federal tax returns for the prior three fiscal years remains subject to examination by the Internal Revenue Service. It is the fund’s policy to record interest and penalty charges on underpaid taxes associated with its tax positions as interest expense and other expense, respectively. No such charges were recorded in the current financial statements. Foreign taxes, if any, have been accrued by the fund in the accompanying financial statements.
Distributions to shareholders are recorded on the ex-dividend date. Income and capital gain distributions are determined in accordance with income tax regulations, which may differ from U.S. generally accepted accounting principles. Certain capital accounts in the financial statements are periodically adjusted for permanent differences in order to reflect their tax character. These adjustments have no impact on net assets or net asset value per share. Temporary differences which arise from recognizing certain items of income, expense, gain or loss in different periods for financial statement and tax purposes will reverse at some time in the future. Distributions in excess of net investment income or net realized gains are temporary overdistributions for financial statement purposes resulting from differences in the recognition or classification of income or distributions for financial statement and tax purposes.
Book/tax differences primarily relate to wash sale loss deferrals.
The tax character of distributions declared to shareholders is as follows:
| | | | |
| | | 12/31/07 | | 12/31/06 |
| Ordinary income (including any short-term capital gains) | | $12,477,413 | | $8,569,963 |
The federal tax cost and the tax basis components of distributable earnings were as follows:
| | | |
| As of 12/31/07 | | | |
| Cost of investments | | $1,023,706,978 | |
| Gross appreciation | | $111,783,921 | |
| Gross depreciation | | (75,066,025 | ) |
| Net unrealized appreciation (depreciation) | | $36,717,896 | |
| Undistributed ordinary income | | 11,091,123 | |
| Capital loss carryforwards | | (3,630,846 | ) |
| Other temporary differences | | (36,944 | ) |
As of December 31, 2007, the fund had capital loss carryforwards available to offset future realized gains. Such losses expire as follows:
Multiple Classes of Shares of Beneficial Interest – The fund offers multiple classes of shares, which differ in their respective distribution fees. All shareholders bear the common expenses of the fund based on daily net assets of each class, without distinction between share classes. Dividends are declared separately for each class. Differences in per share dividend rates are generally due to differences in separate class expenses.
(3) Transactions with Affiliates
Investment Adviser – The fund has an investment advisory agreement with MFS to provide overall investment management and related administrative services and facilities to the fund.
The management fee is computed daily and paid monthly at an annual rate of 0.55% of the fund’s average daily net assets. The investment advisor has agreed in writing to pay a portion of the fund’s operating expenses, exclusive of certain other fees and expenses, such that total annual fund operating expenses do not exceed 1.25% of the fund’s average daily net assets. MFS’ agreement to limit the fund’s operating expenses is contained in the investment advisory agreement between MFS and the fund and may not be rescinded without shareholder approval. Effective June 23, 2007, the investment adviser has agreed in writing to pay a portion of the operating expenses, exclusive of certain other fees and expenses such that total annual fund operating expenses do not exceed 0.60% of Initial Class average daily net assets and 0.85% of Service Class average daily net assets. This written agreement will continue through April 30, 2010, unless changed or rescinded by the fund’s Board of
15
Notes to Financial Statements – continued
Trustees. For the year ended December 31, 2007, this reduction amounted to $115,258 and is reflected as a reduction of total expenses in the Statement of Operations.
Distributor – MFS Fund Distributors, Inc. (MFD), a wholly-owned subsidiary of MFS, is the distributor of shares of the fund. The Trustees have adopted a distribution plan for the Service Class shares pursuant to Rule 12b-1 under the Investment Company Act of 1940.
The fund’s distribution plan provides that the fund will pay MFD distribution fees equal to 0.25% per annum of the average daily net assets attributable to Service Class shares as partial consideration for services performed and expenses incurred by MFD and financial intermediaries in connection with the sale and distribution of the fund’s Service Class shares and the sale and distribution of the variable annuity or variable life insurance contracts investing indirectly in Service Class shares. MFD may subsequently pay all, or a portion, of the distribution fees to financial intermediaries.
Shareholder Servicing Agent – MFS Service Center, Inc. (MFSC), a wholly-owned subsidiary of MFS, has contracted to provide transfer agent and recordkeeping functions in connection with the issuance, transfer, and redemption of each class of shares of the fund under a Shareholder Servicing Agent Agreement. During the year ended December 31, 2007, MFSC did not receive a fee for this service.
Administrator – MFS provides certain financial, legal, shareholder communications, compliance, and other administrative services to the fund. Under an administrative services agreement, the fund partially reimburses MFS the costs incurred to provide these services. The fund is charged an annual fixed amount of $10,000 plus a fee based on average daily net assets.
The administrative services fee incurred for the year ended December 31, 2007 was equivalent to an annual effective rate of 0.0252% of the fund’s average daily net assets.
Trustees’ and Officers’ Compensation – The fund pays compensation to trustees in the form of a retainer, attendance fees, and additional compensation to the Board chairperson. The fund does not pay compensation directly to officers of the fund who are also officers of the investment adviser, all of whom receive remuneration for their services to the fund from MFS. Certain officers of the fund are officers or directors of MFS, MFD, and MFSC.
Other – This fund and certain other MFS funds (the funds) have entered into a services agreement (the Agreement) which provides for payment of fees by the funds to Tarantino LLC in return for the provision of services of an Independent Chief Compliance Officer (ICCO) for the funds. The ICCO is an officer of the funds and the sole member of Tarantino LLC. The funds can terminate the Agreement with Tarantino LLC at any time under the terms of the Agreement. MFS has agreed to bear all expenses associated with office space, other administrative support, and supplies provided to the ICCO. For the year ended December 31, 2007, the fee paid to Tarantino LLC was $5,450.
(4) Portfolio Securities
Purchases and sales of investments, other than purchased option transactions and short-term obligations, were as follows:
| | | | |
| | | Purchases | | Sales |
| U.S. government securities | | $13,424,840 | | $684,555 |
| Investments (non-U.S. government securities) | | $1,106,286,029 | | $1,304,801,823 |
(5) Shares of Beneficial Interest
The fund’s Declaration of Trust permits the Trustees to issue an unlimited number of full and fractional shares of beneficial interest. Transactions in fund shares were as follows:
| | | | | | | | | | | | |
| | | Year ended 12/31/07 | | | Year ended 12/31/06 | |
| | | Shares | | | Amount | | | Shares | | | Amount | |
| Shares sold | | | | | | | | | | | | |
Initial Class | | 86,672 | | | $3,059,054 | | | 98,605 | | | $3,158,503 | |
Service Class | | 1,042,843 | | | 35,700,919 | | | 3,136,512 | | | 98,044,949 | |
| | 1,129,515 | | | $38,759,973 | | | 3,235,117 | | | $101,203,452 | |
| Shares issued to shareholders in reinvestment of distributions | | | | | | | | | | | | |
Initial Class | | 250,233 | | | $9,003,386 | | | 225,827 | | | $7,057,076 | |
Service Class | | 97,176 | | | 3,474,027 | | | 48,677 | | | 1,512,887 | |
| | 347,409 | | | $12,477,413 | | | 274,504 | | | $8,569,963 | |
| Shares reacquired | | | | | | | | | | | | |
Initial Class | | (5,784,415 | ) | | $(204,630,142 | ) | | (6,766,259 | ) | | $(212,683,785 | ) |
Service Class | | (1,032,539 | ) | | (36,527,753 | ) | | (311,429 | ) | | (9,906,798 | ) |
| | (6,816,954 | ) | | $(241,157,895 | ) | | (7,077,688 | ) | | $(222,590,583 | ) |
| Net change | | | | | | | | | | | | |
Initial Class | | (5,447,510 | ) | | $(192,567,702 | ) | | (6,441,827 | ) | | $(202,468,206 | ) |
Service Class | | 107,480 | | | 2,647,193 | | | 2,873,760 | | | 89,651,038 | |
| | (5,340,030 | ) | | $(189,920,509 | ) | | (3,568,067 | ) | | $(112,817,168 | ) |
16
Notes to Financial Statements – continued
(6) Line of Credit
The fund and other funds managed by MFS participate in a $1 billion unsecured committed line of credit provided by a syndication of banks under a credit agreement. In addition, the fund and other funds managed by MFS have established uncommitted borrowing arrangements with certain banks. Borrowings may be made for temporary financing needs. Interest is charged to each fund, based on its borrowings, generally at a rate equal to the Federal Reserve funds rate plus 0.30%. In addition, a commitment fee, based on the average daily, unused portion of the committed line of credit, is allocated among the participating funds at the end of each calendar quarter. For the year ended December 31, 2007, the fund’s commitment fee and interest expense were $5,354 and $4,146, respectively, and are included in miscellaneous expense on the Statement of Operations.
17
REPORT OF INDEPENDENT REGISTERED PUBLIC ACCOUNTING FIRM
To the Board of Trustees of MFS Variable Insurance Trust II (formerly known as MFS/Sun Life Series Trust) and the Shareholders of MFS Blended Research Core Equity Portfolio (formerly known as Massachusetts Investors Trust Series):
We have audited the accompanying statement of assets and liabilities, including the portfolio of investments, of MFS Blended Research Core Equity Portfolio (one of the portfolios comprising MFS Variable Insurance Trust II) (the “Trust”) as of December 31, 2007, and the related statement of operations for the year then ended, the statements of changes in net assets for each of the two years in the period then ended, and the financial highlights for each of the five years in the period then ended. These financial statements and financial highlights are the responsibility of the Trust’s management. Our responsibility is to express an opinion on these financial statements and financial highlights based on our audits.
We conducted our audits in accordance with the standards of the Public Company Accounting Oversight Board (United States). Those standards require that we plan and perform the audit to obtain reasonable assurance about whether the financial statements and financial highlights are free of material misstatement. The Trust is not required to have, nor were we engaged to perform, an audit of its internal control over financial reporting. Our audits included consideration of internal control over financial reporting as a basis for designing audit procedures that are appropriate in the circumstances, but not for the purpose of expressing an opinion on the effectiveness of the Trust’s internal control over financial reporting. Accordingly, we express no such opinion. An audit also includes examining, on a test basis, evidence supporting the amounts and disclosures in the financial statements, assessing the accounting principles used and significant estimates made by management, as well as evaluating the overall financial statement presentation. Our procedures included confirmation of securities owned as of December 31, 2007, by correspondence with the custodian and brokers; where replies were not received from brokers, we performed other auditing procedures. We believe that our audits provide a reasonable basis for our opinion.
In our opinion, such financial statements and financial highlights present fairly, in all material respects, the financial position of MFS Blended Research Core Equity Portfolio as of December 31, 2007, the results of its operations for the year then ended, the changes in its net assets for each of the two years in the period then ended, and its financial highlights for each of the five years in the period then ended, in conformity with accounting principles generally accepted in the United States of America.
DELOITTE & TOUCHE LLP
Boston, Massachusetts
February 15, 2008
18
TRUSTEES AND OFFICERS – IDENTIFICATION AND BACKGROUND
The Trustees and officers of the Trust, as of February 1, 2008, are listed below, together with their principal occupations during the past five years. (Their titles may have varied during that period.) The address of each Trustee and officer is 500 Boylston Street, Boston, Massachusetts 02116.
| | | | | | |
Name, Date of Birth | | Position(s) Held
with Fund | | Trustee/Officer
Since(1) | | Principal Occupations During the Past Five Years &
Other Directorships(2) |
| INTERESTED TRUSTEE | | | | | | |
David D. Horn(3) (born 06/07/41) | | Trustee | | April 1986 | | Private investor; Retired; Sun Life Assurance Company of Canada, Former Senior Vice President and General Manager for the United States (until 1997); Retired: Sun Life Assurance Company of Canada, Director (until March 2004) |
| | |
| INDEPENDENT TRUSTEES | | | | |
J. Kermit Birchfield (born 01/08/40) | | Chairman | | May 1997 | | Consultant; Century Partners, Inc. (investments), Director (1988 to present); Displaytech, Inc. (technology), Director (1995 to present); Dessin Fournir LLC (furniture manufacturer), Director (2005 to present); Intermountain Gas Company, Inc. & Intermountain Industries, Inc. (oil & gas exploration and production) (1988 to present); Site Watch LLC (software to monitor oil tanks) Managing Director (2006 to present); Juridica Investments (fund investing in judicial matters) Director (2007 to present); Dairy Mart Convenience Stores, Inc. (convenience stores), Chairman (1997 to 2003) |
| | | |
Robert C. Bishop (born 01/13/43) | | Trustee | | May 2001 | | Autolmmune Inc. (pharmaceutical product licensing), Chairman, President and Chief Executive Officer (1992 to present); Caliper Life Sciences Corp. (laboratory analytical instruments), Director (2002 to present); Millipore Corporation (biopharmaceutical/research laboratory products), Director (1997 to present); Optobionics Corporation (ophthalmic devices), Director (2002 to 2007); Quintiles Transnational Corp. (contract research services), Director (until 2003) |
| | | |
Frederick H. Dulles (born 03/12/42) | | Trustee | | May 2001 | | Ten State International Law PLLC (law firm), Of Counsel (since 2006); Prudential Carolina Real Estate, (real estate), Broker (since 2006); Free Enterprise Foundation, Inc. (research institute), Director & Secretary (until 2008); Disher, Hamrick & Myers Residential, Inc. (real estate) Broker (until 2006); Frederick H. Dulles law practice (until 2006); Ten State Street LLP (law firm), Member (until 2005); McFadden, Pilkington & Ward LLP (solicitors and registered foreign lawyers), Member & Of Counsel (until 2003) |
| | | |
Marcia A. Kean (born 06/30/48) | | Trustee | | April 2005 | | Feinstein Kean Healthcare (consulting), Chief Executive Officer (since December 2002), Managing Director (prior to May 2001); Ardais Corporation (biotech products), Senior Vice President – Commercialization (February 2002 until November 2002) |
| | | |
Ronald G. Steinhart (born 06/15/40) | | Trustee | | May 2001 | | Private investor; Penske Automotive Group (automotive retailer), Director (2001 to present); Penson Worldwide, Inc. (securities clearance), Director (2006 to present); Animal Health International, Inc. (animal health products), Director (2007 to present); Texas Industries (concrete/aggregates/cement), Director (2007 to present); Carreker Corporation (technology consulting) Director (until 2005); Prentiss Properties Trust (real estate investment trust), Director (until 2006) |
| | | |
Haviland Wright (born 07/21/48) | | Trustee | | May 2001 | | Elixir Technologies Corporation (software) Director (2005 to present); Nano Loa Inc. (liquid crystal displays), Director (2003 to present); Silk Displays, Inc. (smart polymers) Director (2007 to present); Displaytech, Inc. (technology) Chairman and CEO (1995 – 2002) |
| | | |
| TRUSTEE EMERITUS | | | | | | |
Samuel Adams (born 10/19/25) | | Trustee Emeritus | | | | Retired; Kirkpatrick & Lockhart Preston Gates Ellis LLP (law firm), Of Counsel |
| | | |
| OFFICERS | | | | | | |
Maria F. Dwyer(4) (born 12/01/58) | | President | | November 2005 | | Massachusetts Financial Services Company, Executive Vice President and Chief Regulatory Officer (since March 2004); Fidelity Management & Research Company, Vice President (prior to March 2004); Fidelity Group of Funds, President and Treasurer (prior to March 2004) |
| | | |
Tracy Atkinson(4) (born 12/30/64) | | Treasurer | | September 2005 | | Massachusetts Financial Services Company, Senior Vice President (since September 2004); PricewaterhouseCoopers LLP, Partner (prior to September 2004) |
| | | |
Christopher R. Bohane(4) (born 01/18/74) | | Assistant Secretary and Assistant Clerk | | July 2005 | | Massachusetts Financial Services Company, Vice President and Senior Counsel (since April 2003); Kirkpatrick & Lockhart LLP (law firm), Associate (prior to April 2003) |
19
Trustees and Officers – continued
| | | | | | |
Name, Date of Birth | | Position(s) Held
with Fund | | Trustee/Officer
Since(1) | | Principal Occupations During the Past Five Years &
Other Directorships(2) |
| | | |
Ethan D. Corey(4) (born 11/21/63) | | Assistant Secretary and Assistant Clerk | | July 2005 | | Massachusetts Financial Services Company, Senior Vice President and Associate General Counsel (since April 2006); Special Counsel (prior to April 2006); Dechert LLP (law firm), Counsel (prior to December 2004) |
| | | |
David L. DiLorenzo(4) (born 08/10/68) | | Assistant Treasurer | | July 2005 | | Massachusetts Financial Services Company, Vice President (since June 2005); JP Morgan Investor Services, Vice President (January 2001 to June 2005) |
| | | |
Timothy M. Fagan(4) (born 07/10/68) | | Assistant Secretary and Assistant Clerk | | September 2005 | | Massachusetts Financial Services Company, Vice President and Senior Counsel (since September 2005); John Hancock Advisers, LLC, Vice President and Chief Compliance Officer (September 2004 to August 2005) Senior Attorney (prior to September 2004); John Hancock Group of Funds, Vice President and Chief Compliance Officer (September 2004 to December 2004) |
| | | |
Mark D. Fischer(4) (born 10/27/70) | | Assistant Treasurer | | July 2005 | | Massachusetts Financial Services Company, Vice President (since May 2005); JP Morgan Investment Management Company, Vice President (prior to May 2005) |
| | | |
Brian E. Langenfeld(4) (born 03/07/73) | | Assistant Secretary and Assistant Clerk | | May 2006 | | Massachusetts Financial Services Company, Assistant Vice President and Counsel (since May 2006); John Hancock Advisers, LLC, Assistant Vice President and Counsel (May 2005 to April 2006); John Hancock Advisers, LLC, Attorney and Assistant Secretary (prior to May 2005) |
| | | |
Ellen Moynihan(4) (born 11/13/57) | | Assistant Treasurer | | May 1997 | | Massachusetts Financial Services Company, Senior Vice President |
| | | |
Susan S. Newton(4) (born 03/07/50) | | Assistant Secretary and Assistant Clerk | | May 2005 | | Massachusetts Financial Services Company, Senior Vice President and Assistant General Counsel (since April 2005); John Hancock Advisers, LLC, Senior Vice President, Secretary and Chief Legal Officer (prior to April 2005); John Hancock Group of Funds, Senior Vice President, Secretary and Chief Legal Officer (prior to April 2005) |
| | | |
Susan A. Pereira(4) (born 11/05/70) | | Assistant Secretary and Assistant Clerk | | July 2005 | | Massachusetts Financial Services Company, Vice President and Senior Counsel (since June 2004); Bingham McCutchen LLP (law firm), Associate (January 2001 to June 2004) |
| | | |
Mark N. Polebaum(4) (born 05/01/52) | | Secretary and Assistant Clerk | | February 2006 | | Massachusetts Financial Services Company, Executive Vice President, General Counsel and Secretary (since January 2006); Wilmer Cutler Pickering Hale and Dorr LLP (law firm), Partner (prior to January 2006) |
| | | |
Frank L. Tarantino (born 03/07/44) | | Independent Chief Compliance Officer | | September 2004 | | Tarantino LLC (provider of compliance services), Principal (since June 2004); CRA Business Strategies Group (consulting services), Executive Vice President (April 2003 to June 2004); David L. Babson & Co. (investment adviser), Managing Director, Chief Administrative Officer and Director (February 1997 to March 2003) |
| | | |
Richard S. Weitzel(4) (born 7/16/70) | | Assistant Secretary and Assistant Clerk | | October 2007 | | Massachusetts Financial Services Company, Vice President and Assistant General Counsel (since 2007); Vice President and Senior Counsel (since May 2004); Massachusetts Department of Business and Technology, General Counsel (February 2003 to April 2004); Massachusetts Office of the Attorney General, Assistant Attorney General ( April 2001 to February 2003); Ropes and Gray, Associate (prior to April 2001) |
| | | |
James O. Yost(4) (born 06/12/60) | | Assistant Treasurer | | April 1992 | | Massachusetts Financial Services Company, Senior Vice President |
| (1) | Date first appointed to serve as Trustee/Officer of an MFS fund or a Compass variable account. Each Trustee has served continuously since appointment. |
| (2) | Directorships or trusteeships of companies required to report to the Securities and Exchange Commission (i.e., “public companies”). |
| (3) | “Interested person” of the Sun Life of Canada (U.S.), within the meaning of the Investment Company Act of 1940 (referred to as the 1940 Act), which is the principal federal law governing investment companies like the Series. The address of Sun Life of Canada (U.S.) is One Sun Life Executive Park, Wellesley Hills, Massachusetts 02481. |
| (4) | “Interested person” of MFS within the meaning of the 1940 Act. The address of MFS is 500 Boylston Street, Boston, Massachusetts 02116. |
The Trust does not hold annual meetings for the purpose of electing Trustees, and Trustees are not elected for fixed terms. Each Trustee and officer holds office until his or her successor is chosen and qualified, or until his or her earlier death, resignation, retirement or removal.
All Trustees currently serve as Trustees of the Trust and have served in that capacity since originally elected or appointed. All of the Trustees are also Managers of the Compass Variable Accounts. The executive officers of the Trust hold similar offices for the Compass Variable Accounts and other funds in the MFS fund complex. As of January 1, 2008, each Trustee serves as a Trustee or Manager of 35 Accounts/Funds.
20
Trustees and Officers – continued
The Statement of Additional Information contains further information about the Trustees and is available without charge upon request by calling 1-800-225-2606.
| | |
Investment Adviser
Massachusetts Financial Services Company 500 Boylston Street, Boston, MA 02116-3741 | | Custodian State Street Bank and Trust Company 225 Franklin Street, Boston, MA 02110 |
Distributor
MFS Fund Distributors, Inc. 500 Boylston Street, Boston, MA 02116-3741 | | Independent Registered Public Accounting Firm Deloitte & Touche LLP 200 Berkeley Street, Boston, MA 02116 |
Portfolio Manager Matthew Krummell | | |
21
BOARD REVIEW OF INVESTMENT ADVISORY AGREEMENT
The Investment Company Act of 1940 requires that both the full Board of Trustees and a majority of the non-interested (“independent”) Trustees, voting separately, annually approve the continuation of the investment advisory agreement between MFS Variable Insurance Trust II (the “Trust”) and Massachusetts Financial Services Company (MFS) on behalf of the Fund. The Trustees consider matters bearing on the Fund and the advisory arrangements at their meetings throughout the year, including a review of performance data at each regular meeting. In addition, the independent Trustees met several times over the course of three months beginning in May and ending in July 2007 (“contract review meetings”) for the specific purpose of considering whether to approve the continuation of the investment advisory agreement for the Fund. The independent Trustees were assisted in their evaluation of the investment advisory agreement by independent legal counsel, from whom they received separate legal advice and with whom they met separately from MFS management during various contract review meetings. The independent Trustees were also assisted in this process by the Fund’s Independent Chief Compliance Officer, a full-time senior officer appointed by and reporting to the independent Trustees.
In connection with their deliberations, the Trustees, including the independent Trustees, considered such information and factors as they believed, in light of the legal advice furnished to them and their own business judgment, to be relevant. The investment advisory agreement was considered separately for the Fund, although the Trustees also took into account the common interests of all Funds in the Trust in their review. As described below, the Trustees considered the nature, quality, and extent of the various investment advisory, administrative, and shareholder services performed by MFS under the existing investment advisory agreement and other arrangements with the Trust.
In connection with their contract review meetings, the Trustees received and relied upon materials which included, among other items: (i) information provided by Lipper Inc. on the investment performance of the Fund for various time periods ended December 31, 2006, compared to the investment performance of a group of funds with substantially similar investment classifications/objectives (the “Lipper performance universe”), as well as the investment performance of a group of funds identified by objective criteria suggested by MFS (“peer funds”), (ii) information provided by Lipper Inc. on the Fund’s advisory fees and other expenses compared to the advisory fees and other expenses of comparable funds identified by Lipper (the “Lipper expense group”), as well as the advisory fees and other expenses of peer funds identified by objective criteria suggested by MFS, (iii) information provided by MFS on the advisory fees of comparable portfolios of its other clients, including institutional separate account and other clients, (iv) information as to whether, and to what extent applicable, expense waivers, reimbursements or fee “breakpoints” are observed for the Fund, (v) information regarding MFS’ financial results and financial condition, including MFS’ and certain of its affiliates’ estimated profitability from services performed for the Fund, (vi) MFS’ views regarding the outlook for the mutual fund industry and its strategic business plans, (vii) descriptions of various functions performed by MFS for the Trust, such as compliance monitoring and portfolio trading practices, and (viii) information regarding the overall organization of MFS, including information about MFS’ senior management and other personnel providing investment advisory, administrative and other services to the Fund. The comparative performance, fee and expense information prepared and provided by Lipper Inc. was not independently verified, and the independent Trustees did not independently verify any information provided to them by MFS.
The Trustees’ conclusion as to the continuation of the investment advisory agreement was based on comprehensive consideration of all information provided to the Trustees and not the result of any single factor. Some of the factors that figured particularly in the Trustees’ deliberations are described below for the Fund, while individual Trustees may have given different weight to various factors and evaluated the information presented as a whole differently than another Trustee. The Trustees recognized that the fee arrangements for the Fund reflect years of review and discussion between the independent Trustees and MFS, that certain aspects of such arrangements may receive greater scrutiny in some years than others, and that the Trustees’ conclusions may be based, in part, on their consideration of these same arrangements during the course of the year and in prior years.
Based on information provided by Lipper Inc. and MFS, the Trustees compared the Fund’s total return investment performance to the performance of a peer group of funds over various time periods. The Trustees placed particular emphasis on the total return performance of the Fund’s Initial Class shares in comparison to the performance of funds in its Lipper performance universe over the one-, three- and five-year periods. The Trustees did not rely on performance results for more recent periods, including those shown elsewhere in this report.
The Trustees noted the performance of the Fund’s Initial Class shares was in the 3rd quintile relative to the other funds in the Lipper Classification Index for the one-year period (the 1st quintile being the best performers and the 5th quintile being the worst performers). The total return performance of the Fund was in the 1st quintile for the three-year period and the 2nd quintile for the five-year period ended December 31, 2006, relative to the Lipper performance universe. The Board further noted the recent change in the name and the change of investment objective and principal investment strategies of the Fund
22
Board Review of Investment Advisory Agreement – continued
and management’s explanation of its steps to improve the organization of the Fund. Based on the nature and quality of services provided by MFS, the Board of Trustees concluded that the Fund’s performance was satisfactory.
In the course of their deliberations, the Trustees took into account information provided by MFS during contract review meetings, as well as during investment review meetings conducted with portfolio management personnel during the course of the year.
In assessing the reasonableness of the Fund’s advisory fee, the Trustees considered, among other information, the Fund’s advisory fee and the total expense ratio of the Fund’s Initial Class shares as a percentage of average daily net assets, compared to the advisory fee and total expense ratios of its peer group of funds based on information provided by Lipper Inc. and MFS. The Trustees also considered the advisory fees charged by MFS to institutional accounts. In comparing these fees, the Trustees considered the generally broader scope of services provided by MFS to the Trust than those provided to institutional accounts. The Trustees also considered the higher demands placed on MFS’ investment personnel and trading infrastructure as a result of the daily cash in-flows and out-flows of the Fund, and the impact on MFS and related expenses due to the more extensive regulatory regime to which the Fund is subject, compared to institutional accounts.
In considering the fees, the Trustees noted from the Lipper data that the Fund’s effective advisory fee rate and total expense ratio were each approximately at the median of such fees and expenses of funds in the Lipper expense group. In addition, the Trustees accepted MFS’ offer to continue the expense limitation for the Fund. They noted that the Fund’s advisory fee rate schedule is not currently subject to any breakpoints. However, the Trustees concluded that the fees were reasonable in light of the nature and quality of services provided by MFS, and determined not to recommend any advisory fee breakpoints for the Fund at this time.
The Trustees also considered information prepared by MFS relating to its costs and profits with respect to the Fund and other investment companies and accounts advised by MFS, as well as MFS’ methodologies used to determine and allocate its costs to the Fund and other accounts and products for purposes of estimating profitability.
After reviewing these and other factors described below, the Trustees concluded that the advisory fee charged to the Fund represents reasonable compensation in light of the nature and quality of the services being provided by MFS.
In addition, the Trustees considered MFS’ resources and related efforts to continue to retain, attract and motivate capable personnel to serve the Fund. The Trustees also considered the financial resources of MFS and its parent, Sun Life Financial Inc. The Trustees further considered any advantages and possible disadvantages of having an adviser which also serves other investment companies as well as institutional accounts.
The Trustees also considered the nature, quality, cost, and extent of administrative, transfer agency, and distribution services provided to the Fund by MFS and its affiliates under agreements and plans other than the investment advisory agreement, including the 12b-1 fees the Fund pays to MFS Fund Distributors, Inc., an affiliate of MFS. The Trustees also considered the nature, extent and quality of certain other services MFS performs or arranges on the Fund’s behalf, which may include securities lending programs, directed expense payment programs, class action recovery programs, and MFS’ interaction with third-party service providers, principally custodians and sub-custodians. The Trustees concluded that the various non-advisory services provided by MFS and its affiliates on behalf of the Fund were satisfactory. The Trustees also considered the benefits to MFS from the use of the Fund’s portfolio brokerage commissions to pay for research and other similar services (including MFS’ policy not to use “soft dollars” generated by Fund portfolio transactions to pay for third-party research), and various other factors. Additionally, the Trustees considered so-called “fall-out benefits” to MFS such as reputational value derived from serving as investment manager to the Trust, and determined that any such benefits derived by MFS were reasonable and fair.
Based on their evaluation of factors that they deemed to be material, including those factors described above, the Board of Trustees, including a majority of the independent Trustees, concluded that the investment advisory agreement should be continued for an additional one-year period, commencing September 1, 2007.
A discussion regarding the Board’s most recent review and renewal of the Fund’s investment advisory agreement is available by clicking on the Fund’s name under “Variable Insurance Portfolios” on the “Products & Performance” page on the MFS Web site (mfs.com).
23
PROXY VOTING POLICIES AND INFORMATION
A general description of the MFS funds’ proxy voting policies and procedures is available without charge, upon request, by calling 1-800-225-2606, by visiting the About MFS section of mfs.com or by visiting the SEC’s Web site at http://www.sec.gov.
Information regarding how the fund voted proxies relating to portfolio securities during the most recent twelve-month period ended June 30 is available without charge by visiting the Proxy Voting section of mfs.com or by visiting the SEC’s Web site at http://www.sec.gov.
QUARTERLY PORTFOLIO DISCLOSURE
The fund will file a complete schedule of portfolio holdings with the Securities and Exchange Commission (the Commission) for the first and third quarters of each fiscal year on Form N-Q. The fund’s Form N-Q may be reviewed and copied at the:
Public Reference Room
Securities and Exchange Commission
100 F Street, NE, Room 1580
Washington, D.C. 20549
Information on the operation of the Public Reference Room may be obtained by calling the Commission at 1-800-SEC-0330. The fund’s Form N-Q is available on the EDGAR database on the Commission’s Internet Web site at http://www.sec.gov, and copies of this information may be obtained, upon payment of a duplicating fee, by electronic request at the following e-mail address: publicinfo@sec.gov or by writing the Public Reference Section at the above address.
A shareholder can also obtain the quarterly portfolio holdings report at mfs.com.
FEDERAL TAX INFORMATION (unaudited)
The following information is provided pursuant to provisions of the Internal Revenue Code.
For corporate shareholders, 97.07% of the ordinary income dividends paid during the fiscal year qualify for the corporate dividends received deduction.
24
MFS® PRIVACY NOTICE
Privacy is a concern for every investor today. At MFS Investment Management® and the MFS funds, we take this concern very seriously. We want you to understand our policies about the investment products and services that we offer, and how we protect the nonpublic personal information of investors who have a direct relationship with us and our wholly owned subsidiaries.
Throughout our business relationship, you provide us with personal information. We maintain information and records about you, your investments, and the services you use. Examples of the nonpublic personal information we maintain include
| | Ÿ | | data from investment applications and other forms |
| | Ÿ | | share balances and transactional history with us, our affiliates, or others |
| | Ÿ | | facts from a consumer reporting agency |
We do not disclose any nonpublic personal information about our customers or former customers to anyone, except as permitted by law. We may share nonpublic personal information with third parties or certain of our affiliates in connection with servicing your account or processing your transactions. We may share information with companies or financial institutions that perform marketing services on our behalf or with other financial institutions with which we have joint marketing arrangements, subject to any legal requirements.
Authorization to access your nonpublic personal information is limited to appropriate personnel who provide products, services, or information to you. We maintain physical, electronic, and procedural safeguards to help protect the personal information we collect about you.
If you have any questions about the MFS privacy policy, please call 1-800-225-2606 any business day between 8 a.m. and 8 p.m. Eastern time.
Note: If you own MFS products or receive MFS services in the name of a third party such as a bank or broker-dealer, their privacy policy may apply to you instead of ours.
25
CONTACT US
Web site
mfs.com
Account service and
literature
Shareholders
1-877-411-3325
9 a.m. to 5 p.m. ET
Investment professionals
1-800-637-8630
8 a.m. to 5 p.m. ET
Mailing address
MFS Service Center, Inc.
Attn: Institutional Alliance Services (IAS)
P.O. Box 55824
Boston, MA
02205-5824
Overnight mail
MFS Service Center, Inc.
Attn: Institutional Alliance Services (IAS)
500 Boylston Street
Boston, MA 02116-3741


MFS® Variable Insurance Trust IISM
Annual report
MFS® Global Total Return Portfolio
(formerly Global Total Return Series)
12/31/07
WTS-ANN
MFS® GLOBAL TOTAL RETURN PORTFOLIO
(formerly Global Total Return Series)
The report is prepared for the general information of contract owners. It is authorized for distribution to prospective investors only when preceded or accompanied by a current prospectus.
NOT FDIC INSURED MAY LOSE VALUE NO BANK OR CREDIT UNION GUARANTEE NOT A DEPOSIT NOT INSURED BY ANY FEDERAL GOVERNMENT AGENCY OR NCUA/NCUSIF
LETTER FROM THE CEO

Dear Contract Owners:
The past year has been a great example of why investors should keep their eyes on the long term.
In 2006 the Dow Jones Industrial Average returned 19% and was fairly stable. This year we have seen a greater level of volatility than has been experienced in recent years. The Dow hit several new highs but also experienced swift drops as a global credit crisis swept through markets, spurred by defaults on U.S. subprime loans and a liquidity crunch. Still, even with this volatility, the Dow ended the first three quarters of 2007 with a return near 13%.
U.S. Treasury bonds gained ground, especially in the third quarter as investors sought less risky asset classes. The spreads of many lower-quality debt investments widened.
In 2007 the U.S. dollar fell against the euro, oil prices hit their highest levels yet, and gold spiked to its steepest price in 28 years. Around the globe, stocks sold off as risk aversion mounted. As we have said before, markets can be volatile, and investors should make sure they have an investment plan that can carry them through the peaks and troughs.
If you are focused on a long-term investment strategy, the short-term ups and downs of the markets should not necessarily dictate portfolio action on your part. In our view, investors who remain committed to a long-term plan are more likely to achieve their financial goals.
In any market environment, we believe individual investors are best served by following a three-pronged investment strategy of allocating their holdings across the major asset classes, diversifying within each class, and regularly rebalancing their portfolios to maintain their desired allocations. Of course, these strategies cannot guarantee a profit or protect against a loss. Investing and planning for the long term require diligence and patience, two traits that in our experience are essential to capitalizing on the many opportunities the financial markets can offer — through both up and down economic cycles.
Respectfully,

Robert J. Manning
Chief Executive Officer and Chief Investment Officer
MFS Investment Management®
February 15, 2008
The opinions expressed in this letter are subject to change, may not be relied upon for investment advice, and no forecasts can be guaranteed.
1
PORTFOLIO COMPOSITION
Portfolio structure (i)
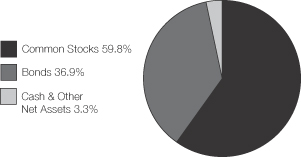
| | |
| Top ten holdings (i) | | |
| U.S. Treasury Notes, 4%, 2015 | | 1.8% |
| Nestle S.A. | | 1.8% |
| United Kingdom Treasury, 8%, 2015 | | 1.8% |
| TOTAL S.A., ADR | | 1.7% |
| Republic of Italy, 4.75%, 2013 | | 1.6% |
| Kingdom of Spain, 5%, 2012 | | 1.6% |
| Republic of France, 6%, 2025 | | 1.6% |
| Federal Republic of Germany, 6.25%, 2030 | | 1.6% |
| Kingdom of Netherlands, 3.75%, 2014 | | 1.5% |
| Kingdom of Belgium, 5.5%, 2017 | | 1.4% |
| | |
| Equity sectors | | |
| Financial Services | | 13.0% |
| Energy | | 6.9% |
| Health Care | | 6.9% |
| Consumer Staples | | 6.7% |
| Utilities & Communications | | 6.4% |
| Industrial Goods & Services | | 4.9% |
| Technology | | 3.5% |
| Leisure | | 2.9% |
| Autos & Housing | | 2.5% |
| Basic Materials | | 2.0% |
| Retailing | | 1.7% |
| Transportation | | 1.6% |
| Special Products & Services | | 0.8% |
| | |
| Fixed income sectors (i) | | |
| Non-U.S. Government Bonds | | 26.9% |
| U.S. Treasury Securities | | 4.8% |
| Emerging Market Bonds | | 1.5% |
| Mortgage-Backed Securities | | 1.4% |
| Commercial Mortgage-Backed Securities | | 1.3% |
| U.S. Government Agencies | | 0.8% |
| Municipal Bonds | | 0.2% |
| | |
| Country weightings (i) | | |
| United States | | 33.3% |
| Japan | | 16.5% |
| United Kingdom | | 15.3% |
| Germany | | 6.3% |
| France | | 5.8% |
| Netherlands | | 4.4% |
| Switzerland | | 4.0% |
| Italy | | 2.3% |
| Spain | | 2.2% |
| Other Countries | | 9.9% |
| (i) | For purposes of this presentation, the bond component includes accrued interest amounts and may be positively or negatively impacted by the equivalent exposure from any derivative holdings, if applicable. |
Percentages are based on net assets as of 12/31/07, unless otherwise noted.
The portfolio is actively managed and current holdings may be different.
2
MANAGEMENT REVIEW
Summary of Results
For the twelve months ended December 31, 2007, Initial Class shares of the MFS Global Total Return Portfolio (the “fund”) provided a total return of 8.87%, while Service Class shares provided a total return of 8.62%. These compare with a return of 9.57% for the fund’s benchmark, the MSCI World Index. The fund’s other benchmarks, a hybrid benchmark comprised of 60% of the MSCI World Index and 40% of the JPMorgan Global Government Bond Index Unhedged, and the JPMorgan Global Government Bond Index Unhedged, generated returns of 10.25% and 10.81%, respectively, over the same period.
Market Environment
Despite seemingly robust growth rates during the second and third quarters of 2007, underlying economic activity in the U.S. remained muted relative to other major economies. Overall, global economies witnessed moderate to strong growth during the reporting period as domestic demand improved and world trade accelerated.
With the strong global growth, however, concerns emerged about rising global inflation, especially as capacity became more constrained, wages rose, and energy and food prices advanced. During the reporting period, global central banks (with the exception of the U.S. Federal Reserve Board) tightened monetary conditions, which in turn pushed global bond yields to their highest levels during this economic expansion.
However, financial markets – particularly in the mortgage and structured-products areas – experienced substantial volatility in recent months. Beginning in late July, heightened uncertainty and distress concerning the subprime mortgage market caused several global credit markets to tighten up, forcing central banks to inject liquidity and to reassess their tightening biases as sovereign bond yields declined and credit spreads widened. While credit conditions improved somewhat by late October as the Federal Reserve Board cut interest rates, the level of market turbulence remained significant through year end. Increased market turmoil was also exacerbated by U.S. home foreclosures and uncertainties surrounding falling housing prices. Despite increased volatility across all asset classes and the widening in credit spreads, U.S. labor markets were resilient and wages rose modestly. More broadly, global equity markets rebounded following summer losses and generally held those gains through the end of the reporting period.
Detractors from performance
Within the equity portion of the fund, the combination of stock selection and an underweighted position in the basic materials sector detracted from performance relative to the MSCI World Index. Not holding mining giant BHP Billiton held back results as this strong-performing benchmark constituent outpaced the return of the overall benchmark.
Stock selection and an underweighted position in the special products and services sector also hurt relative performance. No individual stocks within this sector were among the fund’s top detractors for the reporting period.
Several holdings in the financial services sector held back relative returns, including insurance company Allstate, French bank Credit Agricole, home equity loan provider Fannie Mae (Federal National Mortgage Association), and consumer financing firm Aiful (Japan). Shares of Allstate were negatively affected by investor concerns regarding the potential subprime mortgage market exposures in its investment portfolios and a slowdown in its core insurance operations.
Elsewhere, retailer Macy’s and home improvement products maker Masco were also top detractors. Macy’s shares were hurt by disappointing same-store sales results which led to decreased earnings guidance and increasing investor concern about the health of the consumer in the U.S. Not holding strong-performing computer and personal electronics maker Apple and mobile phone maker Nokia (Finland) also hurt relative results.
During the reporting period, our currency exposure in the equity portion of the fund held back relative performance. All of MFS’ investment decisions are driven by the fundamentals of each individual opportunity and, as such, it is common for our portfolios to have different currency exposure than the benchmark.
The cash position in the equity portion of the fund was also a detractor. As with nearly all mutual funds, this portfolio holds cash to buy new holdings and to provide liquidity. In a period when equity markets rose, as measured by the fund’s benchmark, holding cash hurt performance versus the benchmark, which has no cash position.
Within the fixed income portion of the fund, our U.S. yield curve(y) positioning detracted from performance relative to the JPMorgan Global Government Bond Index Unhedged as interest rates generally declined over the reporting period.
During the latter half of the period, as swap and credit spreads widened, the fund’s exposure to “AAA”(s) rated commercial mortgage-backed securities (CMBS), delegated underwriting services (DUS) pools, Small Business Association (SBA) bonds, and emerging markets debt securities detracted from relative results.
3
Management review – continued
Contributors to performance
The fund’s overweighted position in the strong-performing consumer staples sector boosted relative performance. Holdings of global food company Nestle (Switzerland) and global confectioner and beverage company Cadbury Schweppes(g) were top contributors.
Aided by stock selection, the utilities and communications sector was another positive area for relative returns. Strong performance from our holdings of power and gas company E.ON (Germany), voice and data communications services company Vodafone, and Spanish telecommunications company Telefonica helped bolster results.
A combination of security selection and an overweighted position in the retailing sector also contributed to relative performance. No individual stocks within this sector were among the fund’s top contributors over the reporting period.
Elsewhere, global integrated oil companies, Hess and TOTAL (France), and oil and gas exploration and production company Apache were top contributors. Shares of Hess surged in recent months due largely to hopes that an oil field discovery off the coast of Brazil could nearly double the company’s reserves. Additionally, the fund’s positioning in agricultural equipment manufacturer, Deere & Co.(g), positively affected results. Deere’s stock price gain was driven by strong capital management and better-than-expected results throughout the period. Not holding car maker Toyota (Japan), whose stock underperformed the benchmark, also helped.
Within the fixed income portion of the fund, our duration(d) positioning in European bonds contributed to performance relative to the JPMorgan Global Government Bond Index Unhedged.
The fund’s underweighted exposure to the U.S. dollar, particularly versus the Euro, also modestly benefited relative results as the value of the dollar weakened relative to most of the world’s major currencies.
Relative performance was also aided by security selection, particularly in some of the fund’s European government bonds.
Respectfully,
| | | | | | |
| Nevin Chitkara | | Steven Gorham | | Matthew Ryan | | Erik Weisman |
| Portfolio Manager | | Portfolio Manager | | Portfolio Manager | | Portfolio Manager |
| (g) | Security was not held in the portfolio at period end. |
| (s) | Bonds rated “BBB”, “Baa”, or higher are considered investment grade; bonds rated “BB”, “Ba”, or below are considered non-investment grade. The primary source for bond quality ratings is Moody’s Investors Service. If not available, ratings by Standard & Poor’s are used, else ratings by Fitch, Inc. For securities which are not rated by any of the three agencies, the security is considered Not Rated. |
| (y) | A yield curve graphically depicts the yields of different maturity bonds of the same credit quality and type; a normal yield curve is upward sloping, with short-term rates lower than long-term rates. |
The views expressed in this report are those of the portfolio managers only through the end of the period of the report as stated on the cover and do not necessarily reflect the views of MFS or any other person in the MFS organization. These views are subject to change at any time based on market or other conditions, and MFS disclaims any responsibility to update such views. These views may not be relied upon as investment advice or an indication of trading intent on behalf of any MFS portfolio. References to specific securities are not recommendations of such securities, and may not be representative of any MFS portfolio’s current or future investments.
4
PERFORMANCE SUMMARY THROUGH 12/31/07
The following chart illustrates the historical performance of the fund in comparison to its benchmark index. Index comparisons are unmanaged; do not reflect any fees or expenses; and cannot be invested in directly. The performance of other share classes will be greater than or less than that of the class depicted below. (See Notes to Performance Summary.)
Performance data shown represents past performance and is no guarantee of future results. Investment return and principal value fluctuate so your units, when sold, may be worth more or less than the original cost; current performance may be lower or higher than quoted. The performance shown does not reflect the deduction of taxes, if any, that a contract holder would pay on fund distributions or the redemption of contract units. The returns for the fund shown also do not reflect the deduction of expenses associated with variable products, such as mortality and expense risk charges, separate account charges, and sales charges imposed by the insurance company separate accounts. Such expenses would reduce the overall returns shown.
Growth of a hypothetical $10,000 investment
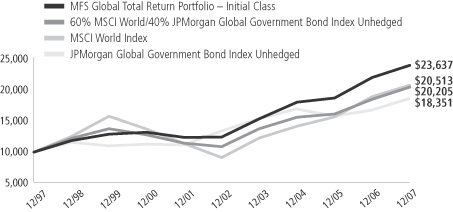
Total returns through 12/31/07
Average Annual Total Returns
| | | | | | | | | | | | |
| | | Share class | | Class inception date | | 1-yr | | 5-yr | | 10-yr | | |
| | | Initial Class | | 11/07/94 | | 8.87% | | 13.79% | | 8.98% | | |
| | | Service Class | | 8/24/01 | | 8.62% | | 13.49% | | 8.81% | | |
Comparative Index
| | | | | | | | | | | | |
| | | JPMorgan Global Government Bond Index Unhedged (f) | | 10.81% | | 6.71% | | 6.26% | | |
| | | MSCI World Index (f) | | 9.57% | | 17.53% | | 7.45% | | |
| | | 60% MSCI World/40% JPMorgan Global Government Bond
Index Unhedged (f) | | 10.25% | | 13.22% | | 7.29% | | |
| (f) | Source: Fact Set Research Systems Inc. |
Index Definition
JPMorgan Global Government Bond Index Unhedged – measures the performance of developed government bond markets around the world.
Morgan Stanley Capital International (MSCI) World Index – a market capitalization index that is designed to measure global developed market equity performance.
It is not possible to invest directly in an index.
Notes to Performance Summary
Service Class share performance includes the performance of Initial Class shares for periods prior to the inception of Service Class shares (blended performance). This blended performance figure has not been adjusted to take into account differences in the class-specific operating expenses (such as Rule 12b-1 fees). Because operating expenses of Service Class shares are generally higher than those of Initial Class shares, the blended Service Class shares performance shown is higher than it would have been had Service Class shares been offered for the entire period.
Performance results reflect any applicable expense subsidies and waivers in effect during the periods shown. Without such subsidies and waivers the fund’s performance results would be less favorable. Please see the prospectus for complete details. All results are historical and assume the reinvestment of any dividends and capital gains distributions.
From time to time the fund may receive proceeds from litigation settlements, without which performance would be lower.
5
EXPENSE TABLE
Fund Expenses Borne by the Contract holders During the Period,
July 1, 2007 through December 31, 2007
As a contract holder of the fund, you incur ongoing costs, including management fees; distribution (12b-1) fees; and other fund expenses. This example is intended to help you understand your ongoing costs (in dollars) of investing in the fund and to compare these costs with the ongoing costs of investing in other mutual funds.
The example is based on an investment of $1,000 invested at the beginning of the period and held for the entire period July 1, 2007 through December 31, 2007.
Actual expenses
The first line for each share class in the following table provides information about actual account values and actual expenses. You may use the information in this line, together with the amount you invested, to estimate the expenses that you paid over the period. Simply divide your account value by $1,000 (for example, an $8,600 account value divided by $1,000 = 8.6), then multiply the result by the number in the first line under the heading entitled “Expenses Paid During Period” to estimate the expenses you paid on your account during this period.
Hypothetical example for comparison purposes
The second line for each share class in the following table provides information about hypothetical account values and hypothetical expenses based on the fund’s actual expense ratio and an assumed rate of return of 5% per year before expenses, which is not the fund’s actual return. The hypothetical account values and expenses may not be used to estimate the actual ending account balance or expenses you paid for the period. You may use this information to compare the ongoing costs of investing in the fund and other funds. To do so, compare this 5% hypothetical example with the 5% hypothetical examples that appear in the shareholder reports of the other funds.
Please note that the expenses shown in the table are meant to highlight the fund’s ongoing costs only and do not take into account the fees and expenses imposed under the variable contracts through which your investment in the fund is made. Therefore, the second line for each share class in the table is useful in comparing ongoing costs associated with an investment in vehicles (such as the fund) which fund benefits under variable annuity and variable life insurance contracts and to qualified pension and retirement plans only, and will not help you determine the relative total costs of investing in the fund through variable annuity and variable life insurance contracts. If the fees and expenses imposed under the variable contracts were included, your costs would have been higher.
| | | | | | | | | | |
| Share Class | | | | Annualized
Expense Ratio | | Beginning
Account Value
7/01/07 | | Ending Account Value
12/31/07 | | Expenses Paid
During Period (p)
7/01/07-12/31/07 |
| Initial Class | | Actual | | 0.92% | | $1,000.00 | | $1,042.10 | | $4.74 |
| | Hypothetical (h) | | 0.92% | | $1,000.00 | | $1,020.57 | | $4.69 |
| Service Class | | Actual | | 1.17% | | $1,000.00 | | $1,040.50 | | $6.02 |
| | Hypothetical (h) | | 1.17% | | $1,000.00 | | $1,019.31 | | $5.96 |
| (h) | 5% class return per year before expenses. |
| (p) | Expenses paid is equal to each class’ annualized expense ratio, as shown above, multiplied by the average account value over the period, multiplied by the number of days in the period, divided by the number of days in the year. |
6
PORTFOLIO OF INVESTMENTS – 12/31/07
The Portfolio of Investments is a complete list of all securities owned by your fund.
It is categorized by broad-based asset classes.
| | | | | |
| Issuer | | Shares/Par | | Value ($) |
| | | | | |
| COMMON STOCKS – 59.8% | | | | | |
| Aerospace – 2.5% | | | | | |
| Lockheed Martin Corp. | | 21,100 | | $ | 2,220,986 |
| Northrop Grumman Corp. | | 10,480 | | | 824,147 |
| United Technologies Corp. | | 13,100 | | | 1,002,674 |
| | | | | |
| | | | $ | 4,047,807 |
| | | | | |
| Alcoholic Beverages – 0.5% | | | | | |
| Heineken N.V. | | 13,590 | | $ | 875,262 |
| | | | | |
| Apparel Manufacturers – 0.5% | | | | | |
| NIKE, Inc., “B” | | 13,740 | | $ | 882,658 |
| | | | | |
| Automotive – 0.9% | | | | | |
| Bayerische Motoren Werke AG | | 18,950 | | $ | 1,170,183 |
| Johnson Controls, Inc. (l) | | 7,480 | | | 269,579 |
| | | | | |
| | | | $ | 1,439,762 |
| | | | | |
| Broadcasting – 1.6% | | | | | |
| Fuji Television Network, Inc. | | 292 | | $ | 483,552 |
| Nippon Television Network Corp. | | 2,290 | | | 307,274 |
| Vivendi S.A. | | 16,710 | | | 761,430 |
| Walt Disney Co. | | 12,500 | | | 403,500 |
| WPP Group PLC | | 49,210 | | | 630,021 |
| | | | | |
| | | | $ | 2,585,777 |
| | | | | |
| Brokerage & Asset Managers – 1.0% | | | | | |
| Franklin Resources, Inc. | | 3,550 | | $ | 406,227 |
| Goldman Sachs Group, Inc. (l) | | 3,900 | | | 838,695 |
| Lehman Brothers Holdings, Inc. (l) | | 5,070 | | | 331,781 |
| | | | | |
| | | | $ | 1,576,703 |
| | | | | |
| Business Services – 0.8% | | | | | |
| Accenture Ltd., “A” | | 14,090 | | $ | 507,663 |
| Bunzl PLC | | 28,540 | | | 400,124 |
| USS Co. Ltd. | | 6,440 | | | 399,551 |
| | | | | |
| | | | $ | 1,307,338 |
| | | | | |
| Chemicals – 0.9% | | | | | |
| PPG Industries, Inc. (l) | | 15,410 | | $ | 1,082,244 |
| Syngenta AG | | 1,670 | | | 423,721 |
| | | | | |
| | | | $ | 1,505,965 |
| | | | | |
| Computer Software – 0.5% | | | | | |
| Oracle Corp. (a) | | 36,060 | | $ | 814,235 |
| | | | | |
| Computer Software – Systems – 1.0% | | | | | |
| Fujitsu Ltd. | | 79,000 | | $ | 528,663 |
| Hewlett-Packard Co. | | 9,340 | | | 471,483 |
| International Business Machines Corp. | | 5,440 | | | 588,064 |
| | | | | |
| | | | $ | 1,588,210 |
| | | | | |
| Construction – 1.6% | | | | | |
| CRH PLC | | 23,350 | | $ | 810,727 |
| Geberit AG | | 2,691 | | | 366,875 |
| Masco Corp. (l) | | 33,620 | | | 726,528 |
| Sekisui Chemical Co. Ltd. | | 65,000 | | | 438,124 |
| Toll Brothers, Inc. (a) | | 18,180 | | | 364,691 |
| | | | | |
| | | | $ | 2,706,945 |
| | | | | |
| | | | | |
| Issuer | | Shares/Par | | Value ($) |
| | | | | |
| COMMON STOCKS – continued | | | | | |
| Consumer Goods & Services – 2.3% | | | | | |
| Henkel KGaA, IPS | | 19,560 | | $ | 1,096,441 |
| Kao Corp. | | 32,000 | | | 962,449 |
| Procter & Gamble Co. | | 15,950 | | | 1,171,049 |
| Uni-Charm Corp. (l) | | 9,300 | | | 585,562 |
| | | | | |
| | | | $ | 3,815,501 |
| | | | | |
| Electrical Equipment – 1.7% | | | | | |
| Legrand S.A. | | 26,680 | | $ | 906,220 |
| OMRON Corp. | | 22,800 | | | 539,663 |
| Rockwell Automation, Inc. | | 3,960 | | | 273,082 |
| Spectris PLC | | 44,640 | | | 601,678 |
| W.W. Grainger, Inc. (l) | | 5,410 | | | 473,483 |
| | | | | |
| | | | $ | 2,794,126 |
| | | | | |
| Electronics – 2.0% | | | | | |
| Intel Corp. | | 27,420 | | $ | 731,017 |
| Konica Minolta Holdings, Inc. | | 22,000 | | | 387,221 |
| Ricoh Co. Ltd. | | 22,000 | | | 404,624 |
| Samsung Electronics Co. Ltd. | | 1,344 | | | 789,951 |
| Taiwan Semiconductor Manufacturing Co. Ltd., ADR | | 102,819 | | | 1,024,077 |
| | | | | |
| | | | $ | 3,336,890 |
| | | | | |
| Energy – Independent – 1.1% | | | | | |
| Apache Corp. | | 5,890 | | $ | 633,411 |
| Devon Energy Corp. (l) | | 7,540 | | | 670,381 |
| EOG Resources, Inc. (l) | | 6,080 | | | 542,640 |
| | | | | |
| | | | $ | 1,846,432 |
| | | | | |
| Energy – Integrated – 5.6% | | | | | |
| ConocoPhillips | | 8,540 | | $ | 754,082 |
| Exxon Mobil Corp. | | 16,040 | | | 1,502,788 |
| Hess Corp. | | 11,590 | | | 1,168,967 |
| Royal Dutch Shell PLC, “A” | | 47,200 | | | 1,988,436 |
| Statoil A.S.A. | | 34,580 | | | 1,069,186 |
| TOTAL S.A., ADR | | 34,460 | | | 2,846,396 |
| | | | | |
| | | | $ | 9,329,855 |
| | | | | |
| Food & Beverages – 2.6% | | | | | |
| Kellogg Co. (l) | | 10,510 | | $ | 551,039 |
| Nestle S.A. | | 6,417 | | | 2,940,357 |
| Nong Shim Co. Ltd. (a) | | 1,335 | | | 276,372 |
| PepsiCo, Inc. | | 7,700 | | | 584,430 |
| | | | | |
| | | | $ | 4,352,198 |
| | | | | |
| Food & Drug Stores – 0.6% | | | | | |
| CVS Caremark Corp. | | 11,020 | | $ | 438,045 |
| Lawson, Inc. | | 16,100 | | | 570,702 |
| | | | | |
| | | | $ | 1,008,747 |
| | | | | |
| Forest & Paper Products – 0.4% | | | | | |
| UPM-Kymmene Corp. | | 34,970 | | $ | 700,644 |
| | | | | |
| Gaming & Lodging – 0.5% | | | | | |
| Royal Caribbean Cruises Ltd. (l) | | 18,730 | | $ | 794,901 |
| | | | | |
7
Portfolio of Investments – continued
| | | | | |
| Issuer | | Shares/Par | | Value ($) |
| | | | | |
| COMMON STOCKS – continued | | | | | |
| General Merchandise – 0.4% | | | | | |
| Macy’s, Inc. | | 25,900 | | $ | 670,033 |
| | | | | |
| Health Maintenance Organizations – 0.7% | | | |
| WellPoint, Inc. (a) | | 12,750 | | $ | 1,118,558 |
| | | | | |
| Insurance – 3.4% | | | |
| Allstate Corp. | | 32,540 | | $ | 1,699,564 |
| Aviva PLC | | 40,870 | | | 542,842 |
| Benfield Group PLC | | 57,790 | | | 323,714 |
| Genworth Financial, Inc., “A” | | 16,480 | | | 419,416 |
| Hartford Financial Services Group, Inc. | | 6,110 | | | 532,731 |
| Jardine Lloyd Thompson Group PLC | | 64,900 | | | 426,619 |
| MetLife, Inc. | | 21,990 | | | 1,355,024 |
| Prudential Financial, Inc. | | 4,060 | | | 377,742 |
| | | | | |
| | | | $ | 5,677,652 |
| | | | | |
| Leisure & Toys – 0.4% | | | |
| Heiwa Corp. (l) | | 19,100 | | $ | 168,919 |
| NAMCO BANDAI Holdings, Inc. (l) | | 19,300 | | | 305,655 |
| Sankyo Co. Ltd. | | 5,600 | | | 260,162 |
| | | | | |
| | | | $ | 734,736 |
| | | | | |
| Machinery & Tools – 0.7% | | | |
| Assa Abloy AB, “B” | | 38,360 | | $ | 763,171 |
| GEA Group AG (a) | | 9,790 | | | 338,130 |
| | | | | |
| | | | $ | 1,101,301 |
| | | | | |
| Major Banks – 4.9% | | | |
| Bank of America Corp. | | 28,284 | | $ | 1,166,998 |
| Bank of New York Mellon Corp. | | 28,161 | | | 1,373,130 |
| Credit Agricole S.A. | | 42,912 | | | 1,439,515 |
| First Financial Holding Co. Ltd. | | 416,000 | | | 305,565 |
| PNC Financial Services Group, Inc. | | 8,900 | | | 584,285 |
| Royal Bank of Scotland Group PLC | | 135,054 | | | 1,214,154 |
| State Street Corp. (l) | | 4,770 | | | 387,324 |
| SunTrust Banks, Inc. | | 6,850 | | | 428,057 |
| Svenska Handelsbanken AB, “A” | | 17,400 | | | 551,907 |
| UniCredito Italiano S.p.A. | | 70,160 | | | 583,800 |
| | | | | |
| | | | $ | 8,034,735 |
| | | | | |
| Metals & Mining – 0.5% | | | |
| Anglo American PLC | | 13,280 | | $ | 804,820 |
| | | | | |
| Natural Gas – Distribution – 0.4% | | | |
| Tokyo Gas Co. Ltd. | | 146,000 | | $ | 681,655 |
| | | | | |
| Oil Services – 0.2% | | | |
| Fugro N.V. | | 4,200 | | $ | 321,935 |
| | | | | |
| Other Banks & Diversified Financials – 3.7% | | | |
| Aiful Corp. (l) | | 8,700 | | $ | 153,149 |
| Bangkok Bank Public Co. Ltd. | | 107,900 | | | 381,427 |
| Citigroup, Inc. | | 21,063 | | | 620,095 |
| DNB Holding A.S.A. | | 41,200 | | | 624,840 |
| Fannie Mae (l) | | 18,710 | | | 748,026 |
| Hachijuni Bank Ltd. (l) | | 43,000 | | | 289,146 |
| ING Groep N.V. | | 36,680 | | | 1,431,714 |
| Joyo Bank Ltd. | | 43,000 | | | 239,742 |
| Sapporo Hokuyo Holdings, Inc. | | 29 | | | 260,482 |
| Shinhan Financial Group Co. Ltd. (a) | | 11,810 | | | 677,624 |
| | | | | |
| Issuer | | Shares/Par | | Value ($) |
| | | | | |
| COMMON STOCKS – continued | | | | | |
| Other Banks & Diversified Financials – continued | | | |
| Takefuji Corp. | | 12,190 | | $ | 292,669 |
| Unione di Banche Italiane Scpa | | 16,124 | | | 443,839 |
| | | | | |
| | | | $ | 6,162,753 |
| | | | | |
| Pharmaceuticals – 6.2% | | | |
| Astellas Pharma, Inc. | | 18,200 | | $ | 793,394 |
| GlaxoSmithKline PLC | | 89,300 | | | 2,266,151 |
| Hisamitsu Pharmaceutical Co., Inc. | | 17,000 | | | 517,388 |
| Johnson & Johnson | | 18,950 | | | 1,263,965 |
| Merck & Co., Inc. | | 15,590 | | | 905,935 |
| Merck KGaA | | 4,000 | | | 513,837 |
| Novartis AG | | 33,450 | | | 1,822,297 |
| Pfizer, Inc. | | 14,680 | | | 333,676 |
| Roche Holding AG | | 5,860 | | | 1,009,393 |
| Wyeth | | 19,840 | | | 876,730 |
| | | | | |
| | | | $ | 10,302,766 |
| | | | | |
| Printing & Publishing – 0.4% | | | |
| Reed Elsevier PLC | | 46,100 | | $ | 620,267 |
| | | | | |
| Railroad & Shipping – 0.3% | | | |
| Burlington Northern Santa Fe Corp. | | 5,160 | | $ | 429,467 |
| | | | | |
| Specialty Chemicals – 0.2% | | | |
| Praxair, Inc. | | 2,980 | | $ | 264,356 |
| | | | | |
| Specialty Stores – 0.2% | | | |
| Praktiker Bau-und Heimwerkermaerkte Holding AG | | 8,320 | | $ | 246,095 |
| | | | | |
| Telecommunications – Wireless – 1.9% | | | |
| KDDI Corp. | | 149 | | $ | 1,106,365 |
| Sprint Nextel Corp. | | 24,890 | | | 326,806 |
| Vodafone Group PLC | | 438,990 | | | 1,636,121 |
| | | | | |
| | | | $ | 3,069,292 |
| | | | | |
| Telephone Services – 2.2% | | | |
| AT&T, Inc. | | 14,640 | | $ | 608,438 |
| Embarq Corp. | | 6,774 | | | 335,516 |
| Royal KPN N.V. | | 51,560 | | | 932,484 |
| Telefonica S.A. | | 29,680 | | | 959,175 |
| Telekom Austria AG | | 23,340 | | | 646,814 |
| TELUS Corp. (non-voting shares) | | 3,956 | | | 192,439 |
| | | | | |
| | | | $ | 3,674,866 |
| | | | | |
| Tobacco – 1.3% | | | |
| Altria Group, Inc. | | 29,466 | | $ | 2,227,040 |
| | | | | |
| Trucking – 1.3% | | | |
| TNT N.V. | | 30,810 | | $ | 1,282,083 |
| Yamato Holdings Co., Ltd. | | 59,000 | | | 850,817 |
| | | | | |
| | | | $ | 2,132,900 |
| | | | | |
| Utilities – Electric Power – 1.9% | | | |
| Dominion Resources, Inc. (l) | | 13,650 | | $ | 647,693 |
| E.ON AG | | 7,110 | | | 1,509,637 |
| FPL Group, Inc. | | 7,760 | | | 525,973 |
| United Utilities PLC | | 32,030 | | | 479,573 |
| | | | | |
| | | | $ | 3,162,876 |
| | | | | |
Total Common Stocks
(Identified Cost, $85,472,468) | | | | $ | 98,748,059 |
| | | | | |
8
Portfolio of Investments – continued
| | | | | | | |
| Issuer | | | | Shares/Par | | Value ($) |
| | | | | | | |
| BONDS – 32.7% | | | | | | | |
| Asset Backed & Securitized – 1.3% | | | | | |
| Bayview Commercial Asset Trust, FRN, 5.158%, 2023 (n) | | CAD | | 170,000 | | $ | 154,432 |
| Commercial Mortgage Asset Trust, FRN, 0.876%, 2032 (i)(n) | | $ | | 3,815,110 | | | 117,727 |
| Commercial Mortgage Pass-Through Certificates, FRN, 5.217%, 2017 (n) | | | | 360,000 | | | 358,203 |
| Commercial Mortgage Pass-Through Certificates, FRN, 5.227%, 2017 (n) | | | | 700,000 | | | 683,801 |
First Union National Bank Commercial Mortgage Trust, FRN,
0.931%, 2043 (i)(n) | | | | 7,762,461 | | | 185,045 |
| IMPAC CMB Trust, FRN, 5.215%, 2036 | | | | 614,769 | | | 586,993 |
| Lehman Brothers Floating Rate Commercial Mortgage Trust, FRN, 5.187%, 2018 (n) | | | | 123,062 | | | 122,872 |
| | | | | | | |
| | | | | | $ | 2,209,073 |
| | | | | | | |
| Emerging Market Quasi-Sovereign – 0.6% | | | |
Gazprom International S.A.,
7.201%, 2020 | | $ | | 382,502 | | $ | 390,650 |
Gazprom International S.A.,
6.51%, 2022 (n) | | | | 120,000 | | | 114,084 |
| Pemex Project Funding Master Trust, 5.75%, 2018 (n) | | | | 101,000 | | | 100,748 |
| Petronas Capital Ltd., 7.875%, 2022 | | | | 254,000 | | | 317,641 |
| | | | | | | |
| | | | | | $ | 923,123 |
| | | | | | | |
| Emerging Market Sovereign – 0.7% | | | | | |
| Banco Central del Peru, 0%, 2008 | | PEN | | 630,000 | | $ | 206,706 |
Republic of Argentina, FRN,
5.389%, 2012 | | $ | | 163,750 | | | 145,617 |
| United Mexican States, 5.625%, 2017 | | | | 404,000 | | | 409,454 |
| United Mexican States, 6.75%, 2034 | | | | 357,000 | | | 394,307 |
| | | | | | | |
| | | | | | $ | 1,156,084 |
| | | | | | | |
International Market
Quasi-Sovereign – 0.3% | | | | | |
| Canada Housing Trust, 4.6%, 2011 | | CAD | | 410,000 | | $ | 421,964 |
| | | | | | | |
International Market
Sovereign – 22.5% | | | | | |
Federal Republic of Germany,
5.25%, 2010 | | EUR | | 1,345,000 | | $ | 2,020,061 |
Federal Republic of Germany,
3.75%, 2015 | | EUR | | 604,000 | | | 856,809 |
Federal Republic of Germany,
6.25%, 2030 | | EUR | | 1,375,000 | | | 2,447,578 |
| Government of Canada, 4.5%, 2015 | | CAD | | 1,060,000 | | | 1,111,488 |
| Government of Canada, 5.75%, 2033 | | CAD | | 106,000 | | | 135,079 |
| Government of Japan, 0.8%, 2010 | | JPY | | 58,000,000 | | | 519,825 |
| Government of Japan, 1.5%, 2012 | | JPY | | 210,000,000 | | | 1,924,652 |
| Government of Japan, 1.3%, 2014 | | JPY | | 224,000,000 | | | 2,017,283 |
| Government of Japan, 1.7%, 2017 | | JPY | | 186,000,000 | | | 1,701,818 |
| Government of Japan, 2.1%, 2024 | | JPY | | 241,000,000 | | | 2,202,511 |
| Government of Japan, 2.2%, 2027 | | JPY | | 94,000,000 | | | 856,361 |
| Government of Japan, 2.4%, 2037 | | JPY | | 44,000,000 | | | 398,578 |
| Kingdom of Belgium, 5.5%, 2017 | | EUR | | 1,490,000 | | | 2,355,528 |
| | | | | | | |
| Issuer | | | | Shares/Par | | Value ($) |
| | | | | | | |
| BONDS – continued | | | | | | | |
| International Market Sovereign – continued | | | |
| Kingdom of Denmark, 4%, 2015 | | DKK | | 2,135,000 | | $ | 408,121 |
| Kingdom of Netherlands, 3.75%, 2014 | | EUR | | 1,701,000 | | | 2,419,574 |
| Kingdom of Spain, 5%, 2012 | | EUR | | 1,747,000 | | | 2,639,098 |
| Kingdom of Sweden, 4.5%, 2015 | | SEK | | 2,630,000 | | | 412,015 |
| Republic of France, 6%, 2025 | | EUR | | 1,524,000 | | | 2,598,450 |
| Republic of France, 4.75%, 2035 | | EUR | | 645,000 | | | 954,313 |
| Republic of Italy, 4.75%, 2013 | | EUR | | 1,780,000 | | | 2,663,633 |
| United Kingdom Treasury, 9%, 2011 | | GBP | | 588,000 | | | 1,343,703 |
| United Kingdom Treasury, 8%, 2015 | | GBP | | 1,199,000 | | | 2,925,295 |
| United Kingdom Treasury, 8%, 2021 | | GBP | | 358,000 | | | 956,071 |
| United Kingdom Treasury, 4.25%, 2036 | | GBP | | 694,000 | | | 1,365,590 |
| | | | | | | |
| | | | | | $ | 37,233,434 |
| | | | | | | |
| Mortgage Backed – 1.4% | | | | | | | |
| Fannie Mae, 5.37%, 2013 | | $ | | 146,823 | | $ | 151,267 |
| Fannie Mae, 4.78%, 2015 | | | | 98,579 | | | 98,237 |
| Fannie Mae, 4.856%, 2015 | | | | 78,335 | | | 77,695 |
| Fannie Mae, 5.09%, 2016 | | | | 99,000 | | | 99,963 |
| Fannie Mae, 5.423%, 2016 | | | | 105,704 | | | 109,239 |
| Fannie Mae, 4.994%, 2017 | | | | 43,972 | | | 44,445 |
| Fannie Mae, 5.05%, 2017 | | | | 90,000 | | | 90,625 |
| Fannie Mae, 5.32%, 2017 | | | | 72,585 | | | 74,203 |
| Fannie Mae, 5.5%, 2024 | | | | 162,521 | | | 163,162 |
| Freddie Mac, 5%, 2022-2025 | | | | 1,271,870 | | | 1,273,467 |
| Freddie Mac, 4%, 2024 | | | | 160,227 | | | 159,020 |
| | | | | | | |
| | | | | | $ | 2,341,323 |
| | | | | | | |
| Municipals – 0.2% | | | | | | | |
Minnesota Public Facilities Authority, Water Pollution Control Rev., “B”,
5%, 2018 | | $ | | 355,000 | | $ | 394,082 |
| | | | | | | |
| Natural Gas – Pipeline – 0.1% | | | | | | | |
| Intergas Finance B.V., 6.875%, 2011 | | $ | | 171,000 | | $ | 165,870 |
| | | | | | | |
| Telecommunications – Wireless – 0.1% | | | | | |
OJSC Vimpel-Communications,
8.25%, 2016 | | $ | | 198,000 | | $ | 198,000 |
| | | | | | | |
| U.S. Government Agencies – 0.8% | | | | | | | |
| Aid-Egypt, 4.45%, 2015 | | $ | | 349,000 | | $ | 347,182 |
Small Business Administration,
5.09%, 2025 | | | | 66,845 | | | 67,348 |
Small Business Administration,
5.21%, 2026 | | | | 817,118 | | | 827,938 |
Small Business Administration,
5.36%, 2026 | | | | 95,023 | | | 96,333 |
| | | | | | | |
| | | | | | $ | 1,338,801 |
| | | | | | | |
| U.S. Treasury Obligations – 4.7% | | | | | | | |
| U.S. Treasury Bonds, 4.75%, 2017 | | $ | | 1,920,000 | | $ | 2,027,849 |
| U.S. Treasury Bonds, 8%, 2021 | | | | 874,000 | | | 1,196,151 |
| U.S. Treasury Bonds, 4.75%, 2037 | | | | 185,000 | | | 193,614 |
U.S. Treasury Bonds, TIPS,
2.375%, 2025 | | | | 678,316 | | | 712,126 |
| U.S. Treasury Notes, 4.75%, 2012 | | | | 308,000 | | | 324,651 |
| U.S. Treasury Notes, 4%, 2015 (f) | | | | 2,905,000 | | | 2,946,080 |
| U.S. Treasury Notes, TIPS, 2%, 2014 | | | | 338,076 | | | 349,196 |
| | | | | | | |
| | | | | | $ | 7,749,667 |
| | | | | | | |
Total Bonds
(Identified Cost, $53,114,167) | | | | | | $ | 54,131,421 |
| | | | | | | |
9
Portfolio of Investments – continued
| | | | | | | | | |
| Issuer | | | | Shares/Par | | Value ($) | |
| | | | | | | | | |
| SHORT-TERM OBLIGATIONS (y) – 7.2% | | | | |
| Abbey National North America LLC, 4%, due 1/02/08 | | | | $ | 6,638,000 | | $ | 6,637,262 | |
| American Express Credit Corp., 4.12%, due 1/02/08 | | | | | 5,201,000 | | | 5,200,405 | |
| | | | | | | | | |
| Total Short-Term Obligations, at Amortized Cost and Value | | | | | | | $ | 11,837,667 | |
| | | | | | | | | |
| |
| COLLATERAL FOR SECURITIES LOANED – 4.7% | | | | |
| Navigator Securities Lending Prime Portfolio, at Cost and Net Asset Value | | | | | 7,705,412 | | $ | 7,705,412 | |
| | | | | | | | | |
Total Investments
(Identified Cost, $158,129,714) (k) | | | | | | | $ | 172,422,559 | |
| | | | | | | | | |
OTHER ASSETS, LESS
LIABILITIES – (4.4)% | | | | | | | | (7,200,041 | ) |
| | | | | | | | | |
| Net Assets – 100.0% | | | | | | | $ | 165,222,518 | |
| | | | | | | | | |
| (a) | Non-income producing security. |
| (f) | All or a portion of the security has been segregated as collateral for an open futures contract. |
| (i) | Interest only security for which the fund receives interest on notional principal (Par amount). Par amount shown is the notional principal and does not reflect the cost of the security. |
| (k) | As of December 31, 2007, the fund held securities fair valued in accordance with the policies adopted by the Board of Trustees, aggregating $100,324,558 and 58.19% of market value. An independent pricing service provided an evaluated bid for 30.71% of the market value. |
| (l) | All or a portion of this security is on loan. |
| (n) | Securities exempt from registration under Rule 144A of the Securities Act of 1933. These securities may be sold in the ordinary course of business in transactions exempt from registration, normally to qualified institutional buyers. At period end, the aggregate value of these securities was $1,836,912, representing 1.1% of net assets. |
| (y) | The rate shown represents an annualized yield at time of purchase. |
The following abbreviations are used in this report and are defined:
| ADR | American Depository Receipt |
| FRN | Floating Rate Note. Interest rate resets periodically and may not be the rate reported at period end. |
| IPS | International Preference Stock |
| TIPS | Treasury Inflation Protected Security |
Abbreviations indicate amounts shown in currencies other than the U.S. dollar. All amounts are stated in U.S. dollars unless otherwise indicated. A list of abbreviations is shown below:
See Notes to Financial Statements
10
Portfolio of Investments – continued
Derivative Contracts at 12/31/07
Forward Foreign Currency Exchange Contracts at 12/31/07
| | | | | | | | | | | | | | | | | | |
| Type | | Currency | | Contracts to
Deliver/Receive | | Settlement Date
Range | | In Exchange For | | Contracts at
Value | | Net Unrealized
Appreciation
(Depreciation) | |
| Appreciation | | | | | | | | | | | | | | | | | | |
| BUY | | AUD | | 175,000 | | 1/16/08 | | $ | 152,932 | | $ | 153,522 | | $ | 590 | |
| SELL | | AUD | | 40,000 | | 1/16/08 | | | 35,526 | | | 35,091 | | | 435 | |
| SELL | | CAD | | 665,735 | | 1/09/08 | | | 675,590 | | | 674,617 | | | 973 | |
| BUY | | DKK | | 356,153 | | 2/07/08 | | | 69,765 | | | 69,870 | | | 106 | |
| BUY | | EUR | | 663,044 | | 1/16/08-2/13/08 | | | 962,016 | | | 969,994 | | | 7,978 | |
| SELL | | EUR | | 2,582,554 | | 2/05/08-2/13/08 | | | 3,790,843 | | | 3,778,247 | | | 12,596 | |
| SELL | | GBP | | 2,253,678 | | 2/05/08-2/14/08 | | | 4,594,539 | | | 4,480,780 | | | 113,759 | |
| BUY | | IDR | | 948,760,013 | | 1/28/08 | | | 100,611 | | | 100,901 | | | 290 | |
| BUY | | JPY | | 1,215,213,713 | | 1/15/08-2/05/08 | | | 10,887,604 | | | 10,896,583 | | | 8,979 | |
| SELL | | JPY | | 511,065,168 | | 1/15/08-2/06/08 | | | 4,668,941 | | | 4,587,377 | | | 81,564 | |
| BUY | | MYR | | 356,838 | | 1/28/08 | | | 107,158 | | | 107,988 | | | 829 | |
| SELL | | SEK | | 1,554,652 | | 1/15/08 | | | 245,000 | | | 240,576 | | | 4,424 | |
| | | | | | | | | | | | | | | | $ | 232,523 | |
| | | | | | | |
| Depreciation | | | | | | | | | | | | | | | | | | |
| BUY | | AUD | | 690,516 | | 1/16/08 | | $ | 620,166 | | $ | 605,769 | | $ | (14,397 | ) |
| SELL | | AUD | | 376,594 | | 1/16/08 | | | 327,237 | | | 330,375 | | | (3,138 | ) |
| BUY | | CAD | | 342,462 | | 1/09/08 | | | 360,684 | | | 347,031 | | | (13,653 | ) |
| SELL | | CAD | | 452,374 | | 1/09/08 | | | 446,145 | | | 458,410 | | | (12,265 | ) |
| BUY | | CHF | | 200,777 | | 2/04/08 | | | 180,485 | | | 177,738 | | | (2,748 | ) |
| BUY | | EUR | | 8,116,488 | | 1/16/08-2/13/08 | | | 11,901,736 | | | 11,870,312 | | | (31,424 | ) |
| SELL | | EUR | | 2,057,370 | | 1/16/08-2/13/08 | | | 2,970,611 | | | 3,009,813 | | | (39,202 | ) |
| BUY | | GBP | | 708,978 | | 2/14/08 | | | 1,425,791 | | | 1,409,531 | | | (16,260 | ) |
| BUY | | JPY | | 563,910,115 | | 1/15/08-2/05/08 | | | 5,161,627 | | | 5,059,018 | | | (102,608 | ) |
| SELL | | JPY | | 138,916,938 | | 1/15/08-2/05/08 | | | 1,239,151 | | | 1,246,577 | | | (7,426 | ) |
| BUY | | NOK | | 908,696 | | 2/19/08 | | | 167,718 | | | 167,127 | | | (591 | ) |
| BUY | | SEK | | 2,054,984 | | 1/15/08 | | | 326,231 | | | 318,000 | | | (8,231 | ) |
| | | | | | | | | | | | | | | | $ | (251,943 | ) |
Futures contracts outstanding at 12/31/07
| | | | | | | | |
| Description | | Contracts | | Value | | Expiration
Date | | Unrealized
Appreciation/
(Depreciation) |
| Japan Government Bonds 10 yr (Long) | | 5 | | $6,123,171 | | Mar-08 | | $23,065 |
At December 31, 2007, the fund had sufficient cash and/or securities to cover any commitments under these derivative contracts.
See Portfolio Footnotes and Notes to Financial Statements
11
FINANCIAL STATEMENTS | STATEMENT OF ASSETS AND LIABILITIES
This statement represents your fund’s’ balance sheet, which details the assets and liabilities comprising the total value of the fund.
| | | | |
| At 12/31/07 | | | | |
| Assets | | | | |
| Investments, at value, including $7,829,666 of securities on loan (identified cost, $158,129,714) | | $172,422,559 | | |
| Cash | | 111 | | |
| Foreign currency, at value (identified cost, $18,518) | | 18,805 | | |
| Receivable for forward foreign currency exchange contracts | | 232,523 | | |
| Receivable for daily variation margin on open futures contracts | | 270 | | |
| Interest and dividends receivable | | 931,345 | | |
| Receivable from investment adviser | | 26,394 | | |
| Other assets | | 5,842 | | |
| Total assets | | | | $173,637,849 |
| Liabilities | | | | |
| Payable for forward foreign currency exchange contracts | | $251,943 | | |
| Payable for investments purchased | | 160,599 | | |
| Payable for fund shares reacquired | | 177,569 | | |
| Collateral for securities loaned, at value (c) | | 7,705,412 | | |
| Payable to affiliates | | | | |
Management fee | | 13,595 | | |
Distribution fees | | 550 | | |
Administrative services fee | | 413 | | |
| Payable for independent trustees’ compensation | | 528 | | |
| Accrued expenses and other liabilities | | 104,722 | | |
| Total liabilities | | | | $8,415,331 |
| Net assets | | | | $165,222,518 |
| Net assets consist of | | | | |
| Paid-in capital | | $134,205,700 | | |
Unrealized appreciation (depreciation) on investments and translation of assets and liabilities in foreign currencies
(net of $2,905 deferred country tax) | | 14,304,951 | | |
| Accumulated net realized gain (loss) on investments and foreign currency transactions | | 9,476,799 | | |
| Undistributed net investment income | | 7,235,068 | | |
Net assets | | | | $165,222,518 |
Shares of beneficial interest outstanding | | | | 9,400,079 |
| Initial Class shares | | | | |
Net assets | | $145,113,051 | | |
Shares outstanding | | 8,248,525 | | |
Net asset value per share | | | | $17.59 |
| Service Class shares | | | | |
Net assets | | $20,109,467 | | |
Shares outstanding | | 1,151,554 | | |
Net asset value per share | | | | $17.46 |
| (c) | Non-cash collateral not included. |
See Notes to Financial Statements
12
FINANCIAL STATEMENTS | STATEMENT OF OPERATIONS
This statement describes how much your fund earned in investment income and accrued in expenses. It also describes any gains and/or losses generated by fund operations.
| | | | | | |
| Year ended 12/31/07 | | | | | | |
| Net Investment income | | | | | | |
| Income | | | | | | |
Interest | | $3,152,926 | | | | |
Dividends | | 2,513,327 | | | | |
Foreign taxes withheld | | (153,106 | ) | | | |
| Total investment income | | | | | $5,513,147 | |
| Expenses | | | | | | |
Management fee | | $1,305,898 | | | | |
Distribution fees | | 48,839 | | | | |
Administrative services fee | | 45,610 | | | | |
Independent trustees’ compensation | | 16,653 | | | | |
Custodian fee | | 186,084 | | | | |
Shareholder communications | | 14,616 | | | | |
Auditing fees | | 52,569 | | | | |
Legal fees | | 5,950 | | | | |
Miscellaneous | | 24,199 | | | | |
| Total expenses | | | | | $1,700,418 | |
Fees paid indirectly | | (2,070 | ) | | | |
Reduction of expenses by investment adviser | | (40,247 | ) | | | |
| Net expenses | | | | | $1,658,101 | |
| Net investment income | | | | | $3,855,046 | |
| Realized and unrealized gain (loss) on investments and foreign currency transactions | | | | | | |
| Realized gain (loss) (identified cost basis) | | | | | | |
Investment transactions (net of $396 country tax) | | $19,470,551 | | | | |
Futures contracts | | 107,308 | | | | |
Foreign currency transactions | | 109,899 | | | | |
| Net realized gain (loss) on investments and foreign currency transactions | | | | | $19,687,758 | |
| Change in unrealized appreciation (depreciation) | | | | | | |
Investments (net of $2,905 increase in deferred country tax) | | $(8,839,638 | ) | | | |
Futures contracts | | 29,394 | | | | |
Translation of assets and liabilities in foreign currencies | | 71,482 | | | | |
| Net unrealized gain (loss) on investments and foreign currency translation | | | | | $(8,738,762 | ) |
| Net realized and unrealized gain (loss) on investments and foreign currency | | | | | $10,948,996 | |
| Change in net assets from operations | | | | | $14,804,042 | |
See Notes to Financial Statements
13
FINANCIAL STATEMENTS | STATEMENTS OF CHANGES IN NET ASSETS
These statements describe the increases and/or decreases in net assets resulting from operations, any distributions, and any shareholder transactions.
| | | | | | |
For years ended 12/31 | | 2007 | | | 2006 | |
| Change in net assets | | | | | | |
| From operations | | | | | | |
| Net investment income | | $3,855,046 | | | $4,216,105 | |
| Net realized gain (loss) on investments and foreign currency transactions | | 19,687,758 | | | 18,772,904 | |
| Net unrealized gain (loss) on investments and foreign currency translation | | (8,738,762 | ) | | 5,111,637 | |
| Change in net assets from operations | | $14,804,042 | | | $28,100,646 | |
| Distributions declared to shareholders | | | | | | |
| From net investment income | | | | | | |
Initial Class | | $(3,400,940 | ) | | $(1,461,088 | ) |
Service Class | | (389,718 | ) | | (114,800 | ) |
| From net realized gain on investments | | | | | | |
Initial Class | | (13,963,818 | ) | | (10,553,650 | ) |
Service Class | | (1,777,176 | ) | | (1,109,353 | ) |
| Total distributions declared to shareholders | | $(19,531,652 | ) | | $(13,238,891 | ) |
| Change in net assets from fund share transactions | | $(9,895,179 | ) | | $(12,956,875 | ) |
| Total change in net assets | | $(14,622,789 | ) | | $1,904,880 | |
| Net assets | | | | | | |
| At beginning of period | | 179,845,307 | | | 177,940,427 | |
At end of period (including undistributed net investment income of $7,235,068 and $3,728,347, respectively) | | $165,222,518 | | | $179,845,307 | |
See Notes to Financial Statements
14
FINANCIAL STATEMENTS | FINANCIAL HIGHLIGHTS
The financial highlights table is intended to help you understand the fund’s financial performance for the past 5 years. Certain information reflects financial results for a single fund share. The total returns in the table represent the rate by which an investor would have earned (or lost) on an investment in the fund share class (assuming reinvestment of all distributions) held for the entire period.
Initial Class
| | | | | | | | | | | | | | | |
| | | Years ended 12/31 | |
| | | 2007 | | | 2006 | | | 2005 | | | 2004 | | | 2003 | |
| Net asset value, beginning of period | | $18.11 | | | $16.66 | | | $17.91 | | | $15.70 | | | $13.11 | |
| Income (loss) from investment operations | | | | | | | | | | | | | | | |
| Net investment income (d) | | $0.40 | | | $0.41 | | | $0.37 | | | $0.32 | | | $0.29 | |
Net realized and unrealized gain (loss) on investments and foreign currency | | 1.13 | | | 2.38 | | | 0.23 | | | 2.29 | | | 2.66 | |
| Total from investment operations | | $1.53 | | | $2.79 | | | $0.60 | | | $2.61 | | | $2.95 | |
| Less distributions declared to shareholders | | | | | | | | | | | | | | | |
| From net investment income | | $(0.40 | ) | | $(0.16 | ) | | $(0.75 | ) | | $(0.40 | ) | | $(0.36 | ) |
| From net realized gain on investments | | (1.65 | ) | | (1.18 | ) | | (1.10 | ) | | — | | | — | |
| Total distributions declared to shareholders | | $(2.05 | ) | | $(1.34 | ) | | $(1.85 | ) | | $(0.40 | ) | | $(0.36 | ) |
| Net asset value, end of period | | $17.59 | | | $18.11 | | | $16.66 | | | $17.91 | | | $15.70 | |
| Total return (%) (k)(r)(s) | | 8.87 | | | 17.20 | | | 3.83 | | | 17.12 | | | 22.97 | |
Ratios (%) (to average net assets)
and Supplemental data: | | | | | | | | | | | | | | | |
| Expenses before expense reductions (f) | | 0.95 | | | 0.93 | | | 0.92 | | | 0.89 | | | 0.94 | |
| Expenses after expense reductions (f) | | 0.93 | | | N/A | | | N/A | | | N/A | | | N/A | |
| Net investment income | | 2.24 | | | 2.41 | | | 2.18 | | | 1.97 | | | 2.06 | |
| Portfolio turnover | | 78 | | | 76 | | | 78 | | | 86 | | | 93 | |
| Net assets at end of period (000 Omitted) | | $145,113 | | | $161,209 | | | $161,143 | | | $166,034 | | | $156,675 | |
See Notes to Financial Statements
15
Financial Highlights – continued
Service Class
| | | | | | | | | | | | | | | |
| | | Years ended 12/31 | |
| | | 2007 | | | 2006 | | | 2005 | | | 2004 | | | 2003 | |
| Net asset value, beginning of period | | $17.99 | | | $16.56 | | | $17.82 | | | $15.63 | | | $13.08 | |
| Net investment income (d) | | $0.35 | | | $0.37 | | | $0.32 | | | $0.28 | | | $0.26 | |
Net realized and unrealized gain (loss) on investments
and foreign currency | | 1.13 | | | 2.36 | | | 0.23 | | | 2.29 | | | 2.63 | |
| Total from investment operations | | $1.48 | | | $2.73 | | | $0.55 | | | $2.57 | | | $2.89 | |
| Less distributions declared to shareholders | | | | | | | | | | | | | | | |
| From net investment income | | $(0.36 | ) | | $(0.12 | ) | | $(0.71 | ) | | $(0.38 | ) | | $(0.34 | ) |
| From net realized gain on investments | | (1.65 | ) | | (1.18 | ) | | (1.10 | ) | | — | | | — | |
| Total distributions declared to shareholders | | $(2.01 | ) | | $(1.30 | ) | | $(1.81 | ) | | $(0.38 | ) | | $(0.34 | ) |
| Net asset value, end of period | | $17.46 | | | $17.99 | | | $16.56 | | | $17.82 | | | $15.63 | |
| Total return (%) (k)(r)(s) | | 8.62 | | | 16.91 | | | 3.54 | | | 16.88 | | | 22.53 | |
Ratios (%) (to average net assets) and Supplemental data: | | | | | | | | | | | | | | | |
| Expenses before expense reductions (f) | | 1.20 | | | 1.18 | | | 1.17 | | | 1.14 | | | 1.19 | |
| Expenses after expense reductions (f) | | 1.18 | | | N/A | | | N/A | | | N/A | | | N/A | |
| Net investment income | | 1.99 | | | 2.15 | | | 1.91 | | | 1.72 | | | 1.83 | |
| Portfolio turnover | | 78 | | | 76 | | | 78 | | | 86 | | | 93 | |
| Net assets at end of period (000 Omitted) | | $20,109 | | | $18,637 | | | $16,797 | | | $14,460 | | | $11,545 | |
| (d) | Per share data are based on average shares outstanding. |
| (f) | Ratios do not reflect reductions from fees paid indirectly, if applicable. |
| (k) | The total return does not reflect expenses that apply to separate accounts. Inclusion of these charges would reduce the total return figures for all periods shown. |
| (r) | Certain expenses have been reduced without which performance would have been lower. |
| (s) | From time to time the fund may receive proceeds from litigation settlements, without which performance would be lower. |
See Notes to Financial Statements
16
NOTES TO FINANCIAL STATEMENTS
| (1) | | Business and Organization |
MFS Global Total Return Portfolio (formerly Global Total Return Series) (the fund) is a series of MFS Variable Insurance Trust II (formerly known as MFS/Sun Life Series Trust) (the trust). The trust is organized as a Massachusetts business trust and is registered under the Investment Company Act of 1940, as amended, as an open-end management investment company. The shares of the fund are sold to variable accounts established by insurance companies to fund benefits under variable contracts issued by such companies, and qualified retirement and pension plans.
| (2) | | Significant Accounting Policies |
General – The preparation of financial statements in conformity with U.S. generally accepted accounting principles requires management to make estimates and assumptions that affect the reported amounts of assets and liabilities, and disclosure of contingent assets and liabilities at the date of the financial statements and the reported amounts of revenues and expenses during the reporting period. Actual results could differ from those estimates. The fund can invest in foreign securities, including securities of emerging market issuers. Investments in foreign securities are vulnerable to the effects of changes in the relative values of the local currency and the U.S. dollar and to the effects of changes in each country’s legal, political, and economic environment. The markets of emerging markets countries are generally more volatile than the markets of developed countries with more mature economies. All of the risks of investing in foreign securities previously described are heightened when investing in emerging markets countries.
Investment Valuations – Equity securities, including restricted equity securities, are generally valued at the last sale or official closing price as reported by an independent pricing service on the market or exchange on which they are primarily traded. For securities for which there were no sales reported that day, equity securities are generally valued at the last quoted daily bid quotation as reported by an independent pricing service on the market or exchange on which they are primarily traded. For securities held short for which there were no sales reported for the day, the position is generally valued at the last quoted daily ask quotation as reported by an independent pricing service on the market or exchange on which such securities are primarily traded. Debt instruments (other than short-term instruments), including restricted debt instruments, are generally valued at an evaluated or composite bid as reported by an independent pricing service. Short-term instruments with a maturity at issuance of 60 days or less may be valued at amortized cost, which approximates market value. Futures contracts are generally valued at last posted settlement price as reported by an independent pricing service on the market on which they are primarily traded. Futures contracts for which there were no trades that day for a particular position are generally valued at the closing bid quotation as reported by an independent pricing service on the market on which such futures contracts are primarily traded. Forward foreign currency contracts are generally valued at the mean of bid and asked prices for the time period interpolated from rates reported by an independent pricing service for proximate time periods. Open-end investment companies are generally valued at their net asset value per share. Securities and other assets generally valued on the basis of information from an independent pricing service may also be valued at a broker-dealer bid quotation. Values obtained from pricing services can utilize both dealer-supplied valuations and electronic data processing techniques, which take into account factors such as institutional-size trading in similar groups of securities, yield, quality, coupon rate, maturity, type of issue, trading characteristics, and other market data. The values of foreign securities and other assets and liabilities expressed in foreign currencies are converted to U.S. dollars using the mean of bid and asked prices for rates reported by an independent pricing service.
The Board of Trustees has delegated primary responsibility for determining or causing to be determined the value of the fund’s investments (including any fair valuation) to the adviser pursuant to valuation policies and procedures approved by the Board. If the adviser determines that reliable market quotations are not readily available, investments are valued at fair value as determined in good faith by the adviser in accordance with such procedures under the oversight of the Board of Trustees. Under the fund’s valuation policies and procedures, market quotations are not considered to be readily available for many types of debt instruments and certain types of derivatives. These investments are generally valued at fair value based on information from independent pricing services. In addition, investments may be valued at fair value if the adviser determines that an investment’s value has been materially affected by events occurring after the close of the exchange or market on which the investment is principally traded (such as foreign exchange or market) and prior to the determination of the fund’s net asset value, or after the halting of trading of a specific security where trading does not resume prior to the close of the exchange or market on which the security is principally traded. Events that occur on a frequent basis after foreign markets close (such as developments in foreign markets and significant movements in the U.S. markets) and prior to the determination of the fund’s net asset value may be deemed to have a material affect on the value of securities traded in foreign markets. Accordingly, the fund’s foreign equity securities may often be valued at fair value. The adviser may rely on independent pricing services or other information (such as the correlation with price movements of similar securities in the same or other markets; the type, cost and investment characteristics of the security; the business and financial condition of the issuer; and trading and other market data) to assist in determining whether to fair value and at what value to fair value an investment. The value of an investment for purposes of calculating the fund’s net asset value can differ depending on the source and method used to
17
Notes to Financial Statements – continued
determine value. When fair valuation is used, the value of investments used to determine the fund’s net asset value may differ from quoted or published prices for the same investments.
In September 2006, FASB Statement No. 157, Fair Value Measurements (the “Statement”) was issued, and is effective for fiscal years beginning after November 15, 2007 and for all interim periods within those fiscal years. This Statement provides a single definition of fair value, a hierarchy for measuring fair value and expanded disclosures about fair value measurements. Management is evaluating the application of the Statement to the fund, and believes the impact will be limited to expanded disclosures resulting from the adoption of this Statement in the fund’s financial statements.
Repurchase Agreements – The fund may enter into repurchase agreements with institutions that the fund’s investment adviser has determined are creditworthy. Each repurchase agreement is recorded at cost. The fund requires that the securities collateral in a repurchase transaction be transferred to the custodian in a manner sufficient to enable the fund to obtain those securities in the event of a default under the repurchase agreement. The fund monitors, on a daily basis, the value of the collateral to ensure that its value, including accrued interest, is greater than amounts owed to the fund under each such repurchase agreement. The fund and other funds managed by Massachusetts Financial Services Company (MFS), may utilize a joint trading account for the purpose of entering into one or more repurchase agreements.
Inflation-Adjusted Debt Securities – The fund invests in inflation-adjusted debt securities issued by the U.S. Treasury. The fund may also invest in inflation-adjusted debt securities issued by U.S. Government agencies and instrumentalities other than the U.S. Treasury and by other entities such as U.S. and foreign corporations and foreign governments. The principal value of these debt securities is adjusted through income according to changes in the Consumer Price Index or another general price or wage index. These debt securities typically pay a fixed rate of interest, but this fixed rate is applied to the inflation-adjusted principal amount. The principal paid at maturity of the debt security is typically equal to the inflation-adjusted principal amount, or the security’s original par value, whichever is greater. Other types of inflation-adjusted securities may use other methods to adjust for other measures of inflation.
Foreign Currency Translation – Purchases and sales of foreign investments, income, and expenses are converted into U.S. dollars based upon currency exchange rates prevailing on the respective dates of such transactions. Gains and losses attributable to foreign currency exchange rates on sales of securities are recorded for financial statement purposes as net realized gains and losses on investments. Gains and losses attributable to foreign exchange rate movements on income and expenses are recorded for financial statement purposes as foreign currency transaction gains and losses. That portion of both realized and unrealized gains and losses on investments that results from fluctuations in foreign currency exchange rates is not separately disclosed.
Derivative Risk – The fund may invest in derivatives for hedging or non-hedging purposes. While hedging can reduce or eliminate losses, it can also reduce or eliminate gains. When the fund uses derivatives as an investment to gain market exposure, or for hedging purposes, gains and losses from derivative instruments may be substantially greater than the derivative’s original cost. Derivative instruments include futures contracts and forward foreign currency exchange contracts.
Futures Contracts – The fund may enter into futures contracts for the delayed delivery of securities or currency, or contracts based on financial indices at a fixed price on a future date. In entering such contracts, the fund is required to deposit with the broker either in cash or securities an amount equal to a certain percentage of the contract amount. Subsequent payments are made or received by the fund each day, depending on the daily fluctuations in the value of the contract, and are recorded for financial statement purposes as unrealized gains or losses by the fund. Upon entering into such contracts, the fund bears the risk of interest or exchange rates or securities prices moving unexpectedly, in which case, the fund may not achieve the anticipated benefits of the futures contracts and may realize a loss.
Forward Foreign Currency Exchange Contracts – The fund may enter into forward foreign currency exchange contracts for the purchase or sale of a specific foreign currency at a fixed price on a future date. Risks may arise upon entering into these contracts from the potential inability of counterparties to meet the terms of their contracts and from unanticipated movements in the value of the contract. The fund may enter into forward foreign currency exchange contracts for hedging purposes as well as for non-hedging purposes. For hedging purposes, the fund may enter into contracts to deliver or receive foreign currency it will receive from or require for its normal investment activities. The fund may also use contracts in a manner intended to protect foreign currency denominated securities from declines in value due to unfavorable exchange rate movements. For non-hedging purposes, the fund may enter into contracts with the intent of changing the relative exposure of the fund’s portfolio of securities to different currencies to take advantage of anticipated changes. The forward foreign currency exchange contracts are adjusted by the daily exchange rate of the underlying currency and any gains or losses are recorded as unrealized until the contract settlement date. On contract settlement date, the gains or losses are recorded as realized gains or losses on foreign currency transactions.
18
Notes to Financial Statements – continued
Security Loans – State Street Bank and Trust Company (“State Street”), as lending agent, may loan the securities of the fund to certain qualified institutions (the “Borrowers”) approved by the fund. The loans are collateralized at all times by cash and/or U.S. Treasury securities in an amount at least equal to the market value of the securities loaned. State Street provides the fund with indemnification against Borrower default. The fund bears the risk of loss with respect to the investment of cash collateral. On loans collateralized by cash, the cash collateral is invested in a money market fund or short-term securities. A portion of the income generated upon investment of the collateral is remitted to the Borrowers, and the remainder is allocated between the fund and the lending agent. On loans collateralized by U.S. Treasury securities, a fee is received from the Borrower, and is allocated between the fund and the lending agent. Net income from securities lending is included in interest income on the Statement of Operations. The dividend and interest income earned on the securities loaned is accounted for in the same manner as other dividend and interest income. At December 31, 2007, the value of securities loaned was $7,829,666. These loans were collateralized by cash of $7,705,412 and U.S. Treasury obligations of $337,040.
Indemnifications – Under the fund’s organizational documents, its officers and trustees may be indemnified against certain liabilities and expenses arising out of the performance of their duties to the fund. Additionally, in the normal course of business, the fund enters into agreements with service providers that may contain indemnification clauses. The fund’s maximum exposure under these agreements is unknown as this would involve future claims that may be made against the fund that have not yet occurred.
Investment Transactions and Income – Investment transactions are recorded on the trade date. Interest income is recorded on the accrual basis. All premium and discount is amortized or accreted for financial statement purposes in accordance with U.S. generally accepted accounting principles. All discount is accreted for tax reporting purposes as required by federal income tax regulations. Dividends received in cash are recorded on the ex-dividend date. Certain dividends from foreign securities will be recorded when the fund is informed of the dividend if such information is obtained subsequent to the ex-dividend date. Dividend and interest payments received in additional securities are recorded on the ex-dividend or ex-interest date in an amount equal to the value of the security on such date.
The fund may receive proceeds from litigation settlements. Any proceeds received from litigation involving portfolio holdings are reflected in the Statement of Operations in realized gain/loss if the security has been disposed of by the fund or in unrealized gain/loss if the security is still held by the fund. Any other proceeds from litigation not related to portfolio holdings are reflected as other income in the Statement of Operations.
Fees Paid Indirectly – The fund’s custody fee may be reduced according to an arrangement that measures the value of cash deposited with the custodian by the fund. This amount, for the year ended December 31, 2007, is shown as a reduction of total expenses on the Statement of Operations.
Tax Matters and Distributions – The fund intends to qualify as a regulated investment company, as defined under Subchapter M of the Internal Revenue Code, and to distribute all of its taxable income, including realized capital gains. As a result, no provision for federal income taxes is required. The fund adopted the provisions of FASB Interpretation No. 48, Accounting for Uncertainty in Income Taxes (“the Interpretation”) on January 1, 2007. The Interpretation prescribes a minimum threshold for financial statement recognition of the benefit of a tax position taken or expected to be taken in a tax return. There was no impact resulting from the adoption of this Interpretation on the fund’s financial statements. Each of the fund’s federal tax returns for the prior three fiscal years remains subject to examination by the Internal Revenue Service. It is the fund’s policy to record interest and penalty charges on underpaid taxes associated with its tax positions as interest expense and other expense, respectively. No such charges were recorded in the current financial statements. Foreign taxes, if any, have been accrued by the fund in the accompanying financial statements.
Distributions to shareholders are recorded on the ex-dividend date. Income and capital gain distributions are determined in accordance with income tax regulations, which may differ from U.S. generally accepted accounting principles. Certain capital accounts in the financial statements are periodically adjusted for permanent differences in order to reflect their tax character. These adjustments have no impact on net assets or net asset value per share. Temporary differences which arise from recognizing certain items of income, expense, gain or loss in different periods for financial statement and tax purposes will reverse at some time in the future. Distributions in excess of net investment income or net realized gains are temporary overdistributions for financial statement purposes resulting from differences in the recognition or classification of income or distributions for financial statement and tax purposes.
Book/tax differences primarily relate to amortization and accretion of debt securities, wash sale loss deferrals, straddle loss deferrals, foreign currency transactions, and derivative transactions.
19
Notes to Financial Statements – continued
The tax character of distributions declared to shareholders is as follows:
| | | | |
| | | 12/31/07 | | 12/31/06 |
| Ordinary income (including any short-term capital gains) | | $4,471,676 | | $2,629,612 |
| Long-term capital gain | | 15,059,976 | | 10,609,279 |
| Total distributions | | $19,531,652 | | $13,238,891 |
The federal tax cost and the tax basis components of distributable earnings were as follows:
| | | |
| As of 12/31/07 | | | |
| Cost of investments | | $158,349,737 | |
| Gross appreciation | | 18,773,276 | |
| Gross depreciation | | (4,700,454 | ) |
| Net unrealized appreciation (depreciation) | | $14,072,822 | |
| Undistributed ordinary income | | 7,608,378 | |
| Undistributed long-term capital gain | | 13,078,517 | |
| Capital loss carryforwards | | (3,564,082 | ) |
| Other temporary differences | | (178,817 | ) |
As of December 31, 2007, the fund had capital loss carryforwards available to offset future realized gains. Such losses expire as follows:
The availability of a portion of the capital loss carryforwards, which were acquired on September 5, 2003 in connection with the Global Asset Allocation fund merger, may be limited in a given year.
Multiple Classes of Shares of Beneficial Interest – The fund offers multiple classes of shares, which differ in their respective distribution fees. All shareholders bear the common expenses of the fund based on daily net assets of each class, without distinction between share classes. Dividends are declared separately for each class. Differences in per share dividend rates are generally due to differences in separate class expenses.
| (3) | | Transactions with Affiliates |
Investment Adviser – The fund has an investment advisory agreement with MFS to provide overall investment management and related administrative services and facilities to the fund. The management fee is computed daily and paid monthly at the following annual rates:
| | |
| First $300 million of average daily net assets | | 0.75% |
| Average daily net assets in excess of $300 million | | 0.675% |
The management fee incurred for the year ended December 31, 2007 was equivalent to an annual effective rate of 0.75% of the fund’s average daily net assets.
Effective September 1, 2007, the investment adviser has agreed in writing to pay a portion of the fund’s operating expenses, exclusive of certain other fees and expenses, such that total annual fund operating expenses do not exceed 0.90% for Initial Class shares and 1.15% for Service Class shares. This written agreement will continue through August 31, 2008 unless changed or rescinded by the fund’s Board of Trustees. For the year ended December 31, 2007, this reduction amounted to $40,247 and is reflected as a reduction of total expenses in the Statement of Operations.
Distributor – MFS Fund Distributors, Inc. (MFD), a wholly-owned subsidiary of MFS, is the distributor of shares of the fund. The Trustees have adopted a distribution plan for the Service Class shares pursuant to Rule 12b-1 under the Investment Company Act of 1940.
The fund’s distribution plan provides that the fund will pay MFD distribution fees equal to 0.25% per annum of its average daily net assets attributable to Service Class shares as partial consideration for services performed and expenses incurred by MFD and financial intermediaries in connection with the sale and distribution of the fund’s Service Class shares and the sale and distribution of the variable annuity or variable life insurance contracts investing indirectly in Service Class shares. MFD may subsequently pay all, or a portion, of the distribution fees to financial intermediaries.
Shareholder Servicing Agent – MFS Service Center, Inc. (MFSC), a wholly-owned subsidiary of MFS, has contracted to provide transfer agent and recordkeeping functions in connection with the issuance, transfer, and redemption of each class of shares of the fund under a Shareholder Servicing Agent Agreement. During the year ended December 31, 2007, MFSC did not receive a fee for this service.
20
Notes to Financial Statements – continued
Administrator – MFS provides certain financial, legal, shareholder communications, compliance, and other administrative services to the fund. Under an administrative services agreement, the fund partially reimburses MFS the costs incurred to provide these services. The fund is charged an annual fixed amount of $10,000 plus a fee based on average daily net assets.
The administrative services fee incurred for the year ended December 31, 2007 was equivalent to an annual effective rate of 0.0262% of the fund’s average daily net assets.
Trustees’ and Officers’ Compensation – The fund pays compensation to trustees in the form of a retainer, attendance fees, and additional compensation to the Board chairperson. The fund does not pay compensation directly to officers of the fund who are also officers of the investment adviser, all of whom receive remuneration for their services to the fund from MFS. Certain officers of the fund are officers or directors of MFS, MFD, and MFSC.
Other – This fund and certain other MFS funds (the funds) have entered into a services agreement (the Agreement) which provides for payment of fees by the funds to Tarantino LLC in return for the provision of services of an Independent Chief Compliance Officer (ICCO) for the funds. The ICCO is an officer of the funds and the sole member of Tarantino LLC. The funds can terminate the Agreement with Tarantino LLC at any time under the terms of the Agreement. MFS has agreed to bear all expenses associated with office space, other administrative support, and supplies provided to the ICCO. For the year ended December 31, 2007, the fee paid to Tarantino LLC was $846.
Purchases and sales of investments, other than purchased option transactions and short-term obligations, were as follows:
| | | | |
| | | Purchases | | Sales |
| U.S. government securities | | $20,052,635 | | $20,229,274 |
| Investments (non-U.S. government securities) | | $103,805,275 | | $128,521,583 |
| (5) | | Shares of Beneficial Interest |
The fund’s Declaration of Trust permits the Trustees to issue an unlimited number of full and fractional shares of beneficial interest. Transactions in fund shares were as follows:
| | | | | | | | | | | | |
| | | Year ended 12/31/07 | | | Year ended 12/31/06 | |
| | | Shares | | | Amount | | | Shares | | | Amount | |
| Shares sold | | | | | | | | | | | | |
Initial Class | | 104,489 | | | $1,868,162 | | | 279,698 | | | $4,847,132 | |
Service Class | | 165,602 | | | 2,999,239 | | | 175,674 | | | 2,986,285 | |
| | 270,091 | | | $4,867,401 | | | 455,372 | | | $7,833,417 | |
| Shares issued to shareholders in reinvestment of distributions | | | | | | | | | | | | |
Initial Class | | 1,023,262 | | | $17,364,758 | | | 702,206 | | | $12,014,738 | |
Service Class | | 128,447 | | | 2,166,894 | | | 71,882 | | | 1,224,153 | |
| | 1,151,709 | | | $19,531,652 | | | 774,088 | | | $13,238,891 | |
| Shares reacquired | | | | | | | | | | | | |
Initial Class | | (1,783,093 | ) | | $(31,189,719 | ) | | (1,752,724 | ) | | $(30,164,017 | ) |
Service Class | | (178,422 | ) | | (3,104,513 | ) | | (225,954 | ) | | (3,865,166 | ) |
| | (1,961,515 | ) | | $(34,294,232 | ) | | (1,978,678 | ) | | $(34,029,183 | ) |
| Net change | | | | | | | | | | | | |
Initial Class | | (655,342 | ) | | $(11,956,799 | ) | | (770,820 | ) | | $(13,302,147 | ) |
Service Class | | 115,627 | | | 2,061,620 | | | 21,602 | | | 345,272 | |
| | (539,715 | ) | | $(9,895,179 | ) | | (749,218 | ) | | $(12,956,875 | ) |
The fund and other funds managed by MFS participate in a $1 billion unsecured committed line of credit provided by a syndication of banks under a credit agreement. In addition, the fund and other funds managed by MFS have established uncommitted borrowing arrangements with certain banks. Borrowings may be made for temporary financing needs. Interest is charged to each fund, based on its borrowings, generally at a rate equal to the Federal Reserve funds rate plus 0.30%. In addition, a commitment fee, based on the average daily, unused portion of the committed line of credit, is allocated among the participating funds at the end of each calendar quarter. For the year ended December 31, 2007, the fund’s commitment fee and interest expense were $807 and $0, respectively, and are included in miscellaneous expense on the Statement of Operations.
21
REPORT OF INDEPENDENT REGISTERED PUBLIC ACCOUNTING FIRM
To the Board of Trustees of MFS Variable Insurance Trust II (formerly known as MFS/Sun Life Series Trust) and the Shareholders of MFS Global Total Return Portfolio (formerly known as Global Total Return Series):
We have audited the accompanying statement of assets and liabilities, including the portfolio of investments, of MFS Global Total Return Portfolio (one of the portfolios comprising MFS Variable Insurance Trust II) (the “Trust”) as of December 31, 2007, and the related statement of operations for the year then ended, the statements of changes in net assets for each of the two years in the period then ended, and the financial highlights for each of the five years in the period then ended. These financial statements and financial highlights are the responsibility of the Trust’s management. Our responsibility is to express an opinion on these financial statements and financial highlights based on our audits.
We conducted our audits in accordance with the standards of the Public Company Accounting Oversight Board (United States). Those standards require that we plan and perform the audit to obtain reasonable assurance about whether the financial statements and financial highlights are free of material misstatement. The Trust is not required to have, nor were we engaged to perform, an audit of its internal control over financial reporting. Our audits included consideration of internal control over financial reporting as a basis for designing audit procedures that are appropriate in the circumstances, but not for the purpose of expressing an opinion on the effectiveness of the Trust’s internal control over financial reporting. Accordingly, we express no such opinion. An audit also includes examining, on a test basis, evidence supporting the amounts and disclosures in the financial statements, assessing the accounting principles used and significant estimates made by management, as well as evaluating the overall financial statement presentation. Our procedures included confirmation of securities owned as of December 31, 2007, by correspondence with the custodian and brokers; where replies were not received from brokers, we performed other auditing procedures. We believe that our audits provide a reasonable basis for our opinion.
In our opinion, such financial statements and financial highlights present fairly, in all material respects, the financial position of MFS Global Total Return Portfolio as of December 31, 2007, the results of its operations for the year then ended, the changes in its net assets for each of the two years in the period then ended, and its financial highlights for each of the five years in the period then ended, in conformity with accounting principles generally accepted in the United States of America.
DELOITTE & TOUCHE LLP
Boston, Massachusetts
February 15, 2008
22
TRUSTEES AND OFFICERS – IDENTIFICATION AND BACKGROUND
The Trustees and officers of the Trust, as of February 1, 2008, are listed below, together with their principal occupations during the past five years. (Their titles may have varied during that period.) The address of each Trustee and officer is 500 Boylston Street, Boston, Massachusetts 02116.
| | | | | | |
Name, Date of Birth | | Position(s) Held
with Fund | | Trustee/Officer
Since(1) | | Principal Occupations During the Past Five Years &
Other Directorships(2) |
| INTERESTED TRUSTEE | | | | | | |
David D. Horn(3) (born 06/07/41) | | Trustee | | April 1986 | | Private investor; Retired; Sun Life Assurance Company of Canada, Former Senior Vice President and General Manager for the United States (until 1997); Retired: Sun Life Assurance Company of Canada, Director (until March 2004) |
| | |
| INDEPENDENT TRUSTEES | | | | |
J. Kermit Birchfield (born 01/08/40) | | Chairman | | May 1997 | | Consultant; Century Partners, Inc. (investments), Director (1988 to present); Displaytech, Inc. (technology), Director (1995 to present); Dessin Fournir LLC (furniture manufacturer), Director (2005 to present); Intermountain Gas Company, Inc. & Intermountain Industries, Inc. (oil & gas exploration and production) (1988 to present); Site Watch LLC (software to monitor oil tanks) Managing Director (2006 to present); Juridica Investments (fund investing in judicial matters) Director (2007 to present); Dairy Mart Convenience Stores, Inc. (convenience stores), Chairman (1997 to 2003) |
| | | |
Robert C. Bishop (born 01/13/43) | | Trustee | | May 2001 | | Autolmmune Inc. (pharmaceutical product licensing), Chairman, President and Chief Executive Officer (1992 to present); Caliper Life Sciences Corp. (laboratory analytical instruments), Director (2002 to present); Millipore Corporation (biopharmaceutical/research laboratory products), Director (1997 to present); Optobionics Corporation (ophthalmic devices), Director (2002 to 2007); Quintiles Transnational Corp. (contract research services), Director (until 2003) |
| | | |
Frederick H. Dulles (born 03/12/42) | | Trustee | | May 2001 | | Ten State International Law PLLC (law firm), Of Counsel (since 2006); Prudential Carolina Real Estate, (real estate), Broker (since 2006); Free Enterprise Foundation, Inc. (research institute), Director & Secretary (until 2008); Disher, Hamrick & Myers Residential, Inc. (real estate) Broker (until 2006); Frederick H. Dulles law practice (until 2006); Ten State Street LLP (law firm), Member (until 2005); McFadden, Pilkington & Ward LLP (solicitors and registered foreign lawyers), Member & Of Counsel (until 2003) |
| | | |
Marcia A. Kean (born 06/30/48) | | Trustee | | April 2005 | | Feinstein Kean Healthcare (consulting), Chief Executive Officer (since December 2002), Managing Director (prior to May 2001); Ardais Corporation (biotech products), Senior Vice President – Commercialization (February 2002 until November 2002) |
| | | |
Ronald G. Steinhart (born 06/15/40) | | Trustee | | May 2001 | | Private investor; Penske Automotive Group (automotive retailer), Director (2001 to present); Penson Worldwide, Inc. (securities clearance), Director (2006 to present); Animal Health International, Inc. (animal health products), Director (2007 to present); Texas Industries (concrete/aggregates/cement), Director (2007 to present); Carreker Corporation (technology consulting) Director (until 2005); Prentiss Properties Trust (real estate investment trust), Director (until 2006) |
| | | |
Haviland Wright (born 07/21/48) | | Trustee | | May 2001 | | Elixir Technologies Corporation (software) Director (2005 to present); Nano Loa Inc. (liquid crystal displays), Director (2003 to present); Silk Displays, Inc. (smart polymers) Director (2007 to present); Displaytech, Inc. (technology) Chairman and CEO
(1995 – 2002) |
| | | |
| TRUSTEE EMERITUS | | | | | | |
Samuel Adams (born 10/19/25) | | Trustee Emeritus | | | | Retired; Kirkpatrick & Lockhart Preston Gates Ellis LLP (law firm), Of Counsel |
| | | |
| OFFICERS | | | | | | |
Maria F. Dwyer(4) (born 12/01/58) | | President | | November 2005 | | Massachusetts Financial Services Company, Executive Vice President and Chief Regulatory Officer (since March 2004); Fidelity Management & Research Company, Vice President (prior to March 2004); Fidelity Group of Funds, President and Treasurer (prior to March 2004) |
| | | |
Tracy Atkinson(4) (born 12/30/64) | | Treasurer | | September 2005 | | Massachusetts Financial Services Company, Senior Vice President (since September 2004); PricewaterhouseCoopers LLP, Partner (prior to September 2004) |
| | | |
Christopher R. Bohane(4) (born 01/18/74) | | Assistant Secretary and Assistant Clerk | | July 2005 | | Massachusetts Financial Services Company, Vice President and Senior Counsel (since April 2003); Kirkpatrick & Lockhart LLP (law firm), Associate (prior to April 2003) |
23
Trustees and Officers – continued
| | | | | | |
Name, Date of Birth | | Position(s) Held
with Fund | | Trustee/Officer
Since(1) | | Principal Occupations During the Past Five Years &
Other Directorships(2) |
| | | |
Ethan D. Corey(4) (born 11/21/63) | | Assistant Secretary and Assistant Clerk | | July 2005 | | Massachusetts Financial Services Company, Senior Vice President and Associate General Counsel (since April 2006); Special Counsel (prior to April 2006); Dechert LLP (law firm), Counsel (prior to December 2004) |
| | | |
David L. DiLorenzo(4) (born 08/10/68) | | Assistant Treasurer | | July 2005 | | Massachusetts Financial Services Company, Vice President (since June 2005); JP Morgan Investor Services, Vice President (January 2001 to June 2005) |
| | | |
Timothy M. Fagan(4) (born 07/10/68) | | Assistant Secretary and Assistant Clerk | | September 2005 | | Massachusetts Financial Services Company, Vice President and Senior Counsel (since September 2005); John Hancock Advisers, LLC, Vice President and Chief Compliance Officer (September 2004 to August 2005) Senior Attorney (prior to September 2004); John Hancock Group of Funds, Vice President and Chief Compliance Officer (September 2004 to December 2004) |
| | | |
Mark D. Fischer(4) (born 10/27/70) | | Assistant Treasurer | | July 2005 | | Massachusetts Financial Services Company, Vice President (since May 2005); JP Morgan Investment Management Company, Vice President (prior to May 2005) |
| | | |
Brian E. Langenfeld(4) (born 03/07/73) | | Assistant Secretary and Assistant Clerk | | May 2006 | | Massachusetts Financial Services Company, Assistant Vice President and Counsel (since May 2006); John Hancock Advisers, LLC, Assistant Vice President and Counsel (May 2005 to April 2006); John Hancock Advisers, LLC, Attorney and Assistant Secretary (prior to May 2005) |
| | | |
Ellen Moynihan(4) (born 11/13/57) | | Assistant Treasurer | | May 1997 | | Massachusetts Financial Services Company, Senior Vice President |
| | | |
Susan S. Newton(4) (born 03/07/50) | | Assistant Secretary and Assistant Clerk | | May 2005 | | Massachusetts Financial Services Company, Senior Vice President and Assistant General Counsel (since April 2005); John Hancock Advisers, LLC, Senior Vice President, Secretary and Chief Legal Officer (prior to April 2005); John Hancock Group of Funds, Senior Vice President, Secretary and Chief Legal Officer (prior to April 2005) |
| | | |
Susan A. Pereira(4) (born 11/05/70) | | Assistant Secretary and Assistant Clerk | | July 2005 | | Massachusetts Financial Services Company, Vice President and Senior Counsel (since June 2004); Bingham McCutchen LLP (law firm), Associate (January 2001 to June 2004) |
| | | |
Mark N. Polebaum(4) (born 05/01/52) | | Secretary and Assistant Clerk | | February 2006 | | Massachusetts Financial Services Company, Executive Vice President, General Counsel and Secretary (since January 2006); Wilmer Cutler Pickering Hale and Dorr LLP (law firm), Partner (prior to January 2006) |
| | | |
Frank L. Tarantino (born 03/07/44) | | Independent Chief Compliance Officer | | September 2004 | | Tarantino LLC (provider of compliance services), Principal (since June 2004); CRA Business Strategies Group (consulting services), Executive Vice President (April 2003 to June 2004); David L. Babson & Co. (investment adviser), Managing Director, Chief Administrative Officer and Director (February 1997 to March 2003) |
| | | |
Richard S. Weitzel(4) (born 7/16/70) | | Assistant Secretary and Assistant Clerk | | October 2007 | | Massachusetts Financial Services Company, Vice President and Assistant General Counsel (since 2007); Vice President and Senior Counsel (since May 2004); Massachusetts Department of Business and Technology, General Counsel (February 2003 to April 2004); Massachusetts Office of the Attorney General, Assistant Attorney General ( April 2001 to February 2003); Ropes and Gray, Associate (prior to April 2001) |
| | | |
James O. Yost(4) (born 06/12/60) | | Assistant Treasurer | | April 1992 | | Massachusetts Financial Services Company, Senior Vice President |
| (1) | Date first appointed to serve as Trustee/Officer of an MFS fund or a Compass variable account. Each Trustee has served continuously since appointment. |
| (2) | Directorships or trusteeships of companies required to report to the Securities and Exchange Commission (i.e., “public companies”). |
| (3) | “Interested person” of the Sun Life of Canada (U.S.), within the meaning of the Investment Company Act of 1940 (referred to as the 1940 Act), which is the principal federal law governing investment companies like the Series. The address of Sun Life of Canada (U.S.) is One Sun Life Executive Park, Wellesley Hills, Massachusetts 02481. |
| (4) | “Interested person” of MFS within the meaning of the 1940 Act. The address of MFS is 500 Boylston Street, Boston, Massachusetts 02116. |
The Trust does not hold annual meetings for the purpose of electing Trustees, and Trustees are not elected for fixed terms. Each Trustee and officer holds office until his or her successor is chosen and qualified, or until his or her earlier death, resignation, retirement or removal.
All Trustees currently serve as Trustees of the Trust and have served in that capacity since originally elected or appointed. All of the Trustees are also Managers of the Compass Variable Accounts. The executive officers of the Trust hold similar offices for the Compass Variable Accounts and other funds in the MFS fund complex. As of January 1, 2008, each Trustee serves as a Trustee or Manager of 35 Accounts/Funds.
24
Trustees and Officers – continued
The Statement of Additional Information contains further information about the Trustees and is available without charge upon request by calling 1-800-225-2606.
| | |
Investment Adviser
Massachusetts Financial Services Company 500 Boylston Street, Boston, MA 02116-3741 | | Custodian State Street Bank and Trust Company 225 Franklin Street, Boston, MA 02110 |
Distributor
MFS Fund Distributors, Inc. 500 Boylston Street, Boston, MA 02116-3741 | | Independent Registered Public Accounting Firm Deloitte & Touche LLP 200 Berkeley Street, Boston, MA 02116 |
Portfolio Managers Nevin Chitkara Steven Gorham Matthew Ryan Erik Weisman | | |
25
BOARD REVIEW OF INVESTMENT ADVISORY AGREEMENT
The Investment Company Act of 1940 requires that both the full Board of Trustees and a majority of the non-interested (“independent”) Trustees, voting separately, annually approve the continuation of the investment advisory agreement between MFS Variable Insurance Trust II (the “Trust”) and Massachusetts Financial Services Company (MFS) on behalf of the Fund. The Trustees consider matters bearing on the Fund and the advisory arrangements at their meetings throughout the year, including a review of performance data at each regular meeting. In addition, the independent Trustees met several times over the course of three months beginning in May and ending in July 2007 (“contract review meetings”) for the specific purpose of considering whether to approve the continuation of the investment advisory agreement for the Fund. The independent Trustees were assisted in their evaluation of the investment advisory agreement by independent legal counsel, from whom they received separate legal advice and with whom they met separately from MFS management during various contract review meetings. The independent Trustees were also assisted in this process by the Fund’s Independent Chief Compliance Officer, a full-time senior officer appointed by and reporting to the independent Trustees.
In connection with their deliberations, the Trustees, including the independent Trustees, considered such information and factors as they believed, in light of the legal advice furnished to them and their own business judgment, to be relevant. The investment advisory agreement was considered separately for the Fund, although the Trustees also took into account the common interests of all Funds in the Trust in their review. As described below, the Trustees considered the nature, quality, and extent of the various investment advisory, administrative, and shareholder services performed by MFS under the existing investment advisory agreement and other arrangements with the Trust.
In connection with their contract review meetings, the Trustees received and relied upon materials which included, among other items: (i) information provided by Lipper Inc. on the investment performance of the Fund for various time periods ended December 31, 2006, compared to the investment performance of a group of funds with substantially similar investment classifications/objectives (the “Lipper performance universe”), as well as the investment performance of a group of funds identified by objective criteria suggested by MFS (“peer funds”), (ii) information provided by Lipper Inc. on the Fund’s advisory fees and other expenses compared to the advisory fees and other expenses of comparable funds identified by Lipper (the “Lipper expense group”), as well as the advisory fees and other expenses of peer funds identified by objective criteria suggested by MFS, (iii) information provided by MFS on the advisory fees of comparable portfolios of its other clients, including institutional separate account and other clients, (iv) information as to whether, and to what extent applicable, expense waivers, reimbursements or fee “breakpoints” are observed for the Fund, (v) information regarding MFS’ financial results and financial condition, including MFS’ and certain of its affiliates’ estimated profitability from services performed for the Fund, (vi) MFS’ views regarding the outlook for the mutual fund industry and its strategic business plans, (vii) descriptions of various functions performed by MFS for the Trust, such as compliance monitoring and portfolio trading practices, and (viii) information regarding the overall organization of MFS, including information about MFS’ senior management and other personnel providing investment advisory, administrative and other services to the Fund. The comparative performance, fee and expense information prepared and provided by Lipper Inc. was not independently verified, and the independent Trustees did not independently verify any information provided to them by MFS.
The Trustees’ conclusion as to the continuation of the investment advisory agreement was based on comprehensive consideration of all information provided to the Trustees and not the result of any single factor. Some of the factors that figured particularly in the Trustees’ deliberations are described below for the Fund, while individual Trustees may have given different weight to various factors and evaluated the information presented as a whole differently than another Trustee. The Trustees recognized that the fee arrangements for the Fund reflect years of review and discussion between the independent Trustees and MFS, that certain aspects of such arrangements may receive greater scrutiny in some years than others, and that the Trustees’ conclusions may be based, in part, on their consideration of these same arrangements during the course of the year and in prior years.
Based on information provided by Lipper Inc. and MFS, the Trustees compared the Fund’s total return investment performance to the performance of a peer group of funds over various time periods. The Trustees placed particular emphasis on the total return performance of the Fund’s Initial Class shares in comparison to the performance of funds in its Lipper performance universe over the one-, three- and five-year periods. The Trustees did not rely on performance results for more recent periods, including those shown elsewhere in this report.
The Trustees noted the performance of the Fund’s Initial Class shares was in the 1st quintile relative to the other funds in the Lipper Classification Index for the one-year period (the 1st quintile being the best performers and the 5th quintile being the worst performers). The total return performance of the Fund was also in the 1st quintile for the three-year and the five-year periods ended December 31, 2006, relative to the Lipper performance universe. Based on the nature and quality of services provided by MFS, the Board of Trustees concluded that the Fund’s performance was satisfactory.
26
Board Review of Investment Advisory Agreement – continued
In the course of their deliberations, the Trustees took into account information provided by MFS during contract review meetings, as well as during investment review meetings conducted with portfolio management personnel during the course of the year.
In assessing the reasonableness of the Fund’s advisory fee, the Trustees considered, among other information, the Fund’s advisory fee and the total expense ratio of the Fund’s Initial Class shares as a percentage of average daily net assets, compared to the advisory fee and total expense ratios of its peer group of funds based on information provided by Lipper Inc. and MFS. The Trustees also considered the advisory fees charged by MFS to institutional accounts. In comparing these fees, the Trustees considered the generally broader scope of services provided by MFS to the Trust than those provided to institutional accounts. The Trustees also considered the higher demands placed on MFS’ investment personnel and trading infrastructure as a result of the daily cash in-flows and out-flows of the Fund, and the impact on MFS and related expenses due to the more extensive regulatory regime to which the Fund is subject, compared to institutional accounts.
In considering the fees, the Trustees noted from the Lipper data that the Fund’s effective advisory fee rate and total expense ratio were each above the median of such fees and expenses of funds in the Lipper expense group. In addition, the Trustees accepted MFS’ offer to implement an expense limitation for the Fund for the next year. The Trustees further concluded that the existing breakpoints were sufficient to allow the Fund to benefit from economies of scale as its assets grow.
The Trustees also considered information prepared by MFS relating to its costs and profits with respect to the Fund and other investment companies and accounts advised by MFS, as well as MFS’ methodologies used to determine and allocate its costs to the Fund and other accounts and products for purposes of estimating profitability.
After reviewing these and other factors described below, the Trustees concluded that the advisory fee charged to the Fund represents reasonable compensation in light of the nature and quality of the services being provided by MFS.
In addition, the Trustees considered MFS’ resources and related efforts to continue to retain, attract and motivate capable personnel to serve the Fund. The Trustees also considered the financial resources of MFS and its parent, Sun Life Financial Inc. The Trustees further considered any advantages and possible disadvantages of having an adviser which also serves other investment companies as well as institutional accounts.
The Trustees also considered the nature, quality, cost, and extent of administrative, transfer agency, and distribution services provided to the Fund by MFS and its affiliates under agreements and plans other than the investment advisory agreement, including the 12b-1 fees the Fund pays to MFS Fund Distributors, Inc., an affiliate of MFS. The Trustees also considered the nature, extent and quality of certain other services MFS performs or arranges on the Fund’s behalf, which may include securities lending programs, directed expense payment programs, class action recovery programs, and MFS’ interaction with third-party service providers, principally custodians and sub-custodians. The Trustees concluded that the various non-advisory services provided by MFS and its affiliates on behalf of the Fund were satisfactory. The Trustees also considered the benefits to MFS from the use of the Fund’s portfolio brokerage commissions to pay for research and other similar services (including MFS’ policy not to use “soft dollars” generated by Fund portfolio transactions to pay for third-party research), and various other factors. Additionally, the Trustees considered so-called “fall-out benefits” to MFS such as reputational value derived from serving as investment manager to the Trust, and determined that any such benefits derived by MFS were reasonable and fair.
Based on their evaluation of factors that they deemed to be material, including those factors described above, the Board of Trustees, including a majority of the independent Trustees, concluded that the investment advisory agreement should be continued for an additional one-year period, commencing September 1, 2007.
A discussion regarding the Board’s most recent review and renewal of the Fund’s investment advisory agreement is available by clicking on the Fund’s name under ‘‘Variable Insurance Portfolios’’ on the “Products & Performance” page on the MFS Web site (mfs.com).
27
PROXY VOTING POLICIES AND INFORMATION
A general description of the MFS funds’ proxy voting policies and procedures is available without charge, upon request, by calling 1-800-225-2606, by visiting the About MFS section of mfs.com or by visiting the SEC’s Web site at http://www.sec.gov.
Information regarding how the fund voted proxies relating to portfolio securities during the most recent twelve-month period ended June 30 is available without charge by visiting the Proxy Voting section of mfs.com or by visiting the SEC’s Web site at http://www.sec.gov.
QUARTERLY PORTFOLIO DISCLOSURE
The fund will file a complete schedule of portfolio holdings with the Securities and Exchange Commission (the Commission) for the first and third quarters of each fiscal year on Form N-Q. The fund’s Form N-Q may be reviewed and copied at the:
Public Reference Room
Securities and Exchange Commission
100 F Street, NE, Room 1580
Washington, D.C. 20549
Information on the operation of the Public Reference Room may be obtained by calling the Commission at 1-800-SEC-0330. The fund’s Form N-Q is available on the EDGAR database on the Commission’s Internet Web site at http://www.sec.gov, and copies of this information may be obtained, upon payment of a duplicating fee, by electronic request at the following e-mail address: publicinfo@sec.gov or by writing the Public Reference Section at the above address.
A shareholder can also obtain the quarterly portfolio holdings report at mfs.com.
FEDERAL TAX INFORMATION (unaudited)
The following information is provided pursuant to provisions of the Internal Revenue Code.
The fund designates $15,059,976 as capital gain dividends paid during the fiscal year.
For corporate shareholders, 21.89% of the ordinary income dividends paid during the fiscal year qualify for the corporate dividends received deduction.
28
MFS® PRIVACY NOTICE
Privacy is a concern for every investor today. At MFS Investment Management® and the MFS funds, we take this concern very seriously. We want you to understand our policies about the investment products and services that we offer, and how we protect the nonpublic personal information of investors who have a direct relationship with us and our wholly owned subsidiaries.
Throughout our business relationship, you provide us with personal information. We maintain information and records about you, your investments, and the services you use. Examples of the nonpublic personal information we maintain include
| | Ÿ | | data from investment applications and other forms |
| | Ÿ | | share balances and transactional history with us, our affiliates, or others |
| | Ÿ | | facts from a consumer reporting agency |
We do not disclose any nonpublic personal information about our customers or former customers to anyone, except as permitted by law. We may share nonpublic personal information with third parties or certain of our affiliates in connection with servicing your account or processing your transactions. We may share information with companies or financial institutions that perform marketing services on our behalf or with other financial institutions with which we have joint marketing arrangements, subject to any legal requirements.
Authorization to access your nonpublic personal information is limited to appropriate personnel who provide products, services, or information to you. We maintain physical, electronic, and procedural safeguards to help protect the personal information we collect about you.
If you have any questions about the MFS privacy policy, please call 1-800-225-2606 any business day between 8 a.m. and 8 p.m. Eastern time.
Note: If you own MFS products or receive MFS services in the name of a third party such as a bank or broker-dealer, their privacy policy may apply to you instead of ours.
29
CONTACT US
Web site
mfs.com
Account service and
literature
Shareholders
1-877-411-3325
9 a.m. to 5 p.m. ET
Investment professionals
1-800-637-8630
8 a.m. to 5 p.m. ET
Mailing address
MFS Service Center, Inc.
Attn: Institutional Alliance Services (IAS)
P.O. Box 55824
Boston, MA
02205-5824
Overnight mail
MFS Service Center, Inc.
Attn: Institutional Alliance Services (IAS)
500 Boylston Street
Boston, MA 02116-3741


MFS® Variable Insurance Trust IISM
Annual report
MFS® High Yield Portfolio
(formerly High Yield Series)
12/31/07
HYS-ANN
MFS® HIGH YIELD PORTFOLIO
(formerly High Yield Series)
The report is prepared for the general information of contract owners. It is authorized for distribution to prospective investors only when preceded or accompanied by a current prospectus.
NOT FDIC INSURED MAY LOSE VALUE NO BANK OR CREDIT UNION GUARANTEE NOT A DEPOSIT NOT INSURED BY ANY FEDERAL GOVERNMENT AGENCY OR NCUA/NCUSIF
LETTER FROM THE CEO

Dear Contract Owners:
The past year has been a great example of why investors should keep their eyes on the long term.
In 2006 the Dow Jones Industrial Average returned 19% and was fairly stable. This year we have seen a greater level of volatility than has been experienced in recent years. The Dow hit several new highs but also experienced swift drops as a global credit crisis swept through markets, spurred by defaults on U.S. subprime loans and a liquidity crunch. Still, even with this volatility, the Dow ended the first three quarters of 2007 with a return near 13%.
U.S. Treasury bonds gained ground, especially in the third quarter as investors sought less risky asset classes. The spreads of many lower-quality debt investments widened.
In 2007 the U.S. dollar fell against the euro, oil prices hit their highest levels yet, and gold spiked to its steepest price in 28 years. Around the globe, stocks sold off as risk aversion mounted. As we have said before, markets can be volatile, and investors should make sure they have an investment plan that can carry them through the peaks and troughs.
If you are focused on a long-term investment strategy, the short-term ups and downs of the markets should not necessarily dictate portfolio action on your part. In our view, investors who remain committed to a long-term plan are more likely to achieve their financial goals.
In any market environment, we believe individual investors are best served by following a three-pronged investment strategy of allocating their holdings across the major asset classes, diversifying within each class, and regularly rebalancing their portfolios to maintain their desired allocations. Of course, these strategies cannot guarantee a profit or protect against a loss. Investing and planning for the long term require diligence and patience, two traits that in our experience are essential to capitalizing on the many opportunities the financial markets can offer — through both up and down economic cycles.
Respectfully,

Robert J. Manning
Chief Executive Officer and Chief Investment Officer
MFS Investment Management®
February 15, 2008
The opinions expressed in this letter are subject to change, may not be relied upon for investment advice, and no forecasts can be guaranteed.
1
PORTFOLIO COMPOSITION
Portfolio structure (i)
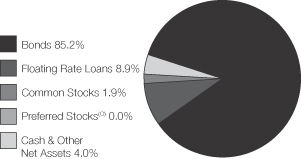
| | |
| Top five industries (i) | | |
| Medical & Health Technology & Services | | 8.6% |
| Broadcasting | | 8.0% |
| Gaming & Lodging | | 5.9% |
| Utilities – Electric Power | | 5.5% |
| Energy – Independent | | 5.2% |
| | |
| Credit quality of bonds (r) | | |
| AAA | | 0.6% |
| AA | | 0.4% |
| A | | 0.1% |
| BBB | | 3.4% |
| BB | | 29.6% |
| B | | 51.1% |
| CCC | | 14.3% |
| Not Rated | | 0.5% |
| | |
| Portfolio facts | | |
| Average Duration (d)(i) | | 4.2 |
| Average Life (i)(m) | | 6.7 yrs. |
| Average Maturity (i)(m) | | 7.2 yrs. |
| Average Credit Quality of Rated Securities (long-term) (a) | | B+ |
| Average Credit Quality of Rated Securities (short-term) (a) | | A-1 |
| (a) | The average credit quality of rated securities is based upon a market weighted average of portfolio holdings that are rated by public rating agencies. |
| (d) | Duration is a measure of how much a bond’s price is likely to fluctuate with general changes in interest rates, e.g., if rates rise 1.00%, a bond with a 5-year duration is likely to lose about 5.00% of its value. |
| (i) | For purposes of this presentation, the bond component includes accrued interest amounts and may be positively or negatively impacted by the equivalent exposure from any derivative holdings, if applicable. |
| (m) | The average maturity shown is calculated using the final stated maturity on the portfolio’s holdings without taking into account any holdings which have been pre-refunded or pre-paid to an earlier date or which have a mandatory put date prior to the stated maturity. The average life shown takes into account these earlier dates. |
| (r) | Each security is assigned a rating from Moody’s Investors Service. If not rated by Moody’s, the rating will be that assigned by Standard & Poor’s. Likewise, if not assigned a rating by Standard & Poor’s, it will be based on the rating assigned by Fitch, Inc. For those portfolios that hold a security which is not rated by any of the three agencies, the security is considered Not Rated. Holdings in U.S. Treasuries and government agency mortgage-backed securities, if any, are included in the “AAA”-rating category. Percentages are based on the total market value of investments as of 12/31/07. |
Percentages are based on net assets as of 12/31/07, unless otherwise noted.
The portfolio is actively managed and current holdings may be different.
2
MANAGEMENT REVIEW
Summary of Results
For the twelve months ended December 31, 2007, Initial Class shares of the MFS High Yield Portfolio (the “fund”) provided a total return of 1.93%, while Service Class shares provided a total return of 1.56%. These compare with a return of 1.87% for the fund’s benchmark, the Lehman Brothers U.S. High-Yield Corporate Bond Index.
Market Environment
Despite seemingly robust growth rates during the second and third quarters of 2007, underlying economic activity in the U.S. remained muted relative to other major economies. Overall, global economies witnessed moderate to strong growth during the reporting period as domestic demand improved and world trade accelerated.
With the strong global growth, however, concerns emerged about rising global inflation, especially as capacity became more constrained, wages rose, and energy and food prices advanced. During the reporting period, global central banks (with the exception of the U.S. Federal Reserve Board) tightened monetary conditions, which in turn pushed global bond yields to their highest levels during this economic expansion.
However, financial markets – particularly in the mortgage and structured-products areas – experienced substantial volatility in recent months. Beginning in late July, heightened uncertainty and distress concerning the subprime mortgage market caused several global credit markets to tighten up, forcing central banks to inject liquidity and to reassess their tightening biases as sovereign bond yields declined and credit spreads widened. While credit conditions improved somewhat by late October as the Federal Reserve Board cut interest rates, the level of market turbulence remained significant through year end. Increased market turmoil was also exacerbated by U.S. home foreclosures and uncertainties surrounding falling housing prices. Despite increased volatility across all asset classes and the widening in credit spreads, U.S. labor markets were resilient and wages rose modestly. More broadly, global equity markets rebounded following summer losses and generally held those gains through the end of the reporting period.
Detractors from performance
Over the reporting period, yield was a negative factor in performance relative to the Lehman Brothers U.S. High-Yield Corporate Bond Index. The fund’s yield curve(y) positioning and relative exposure to “B” rated(s) bonds also held back relative performance.
Debt holdings that detracted from results included the bonds of Harrah’s Operating Co., Tropicana Entertainment, General Motors Acceptance Corp. (GMAC), Ford Motor Credit Co., and Realogy(g).
Contributors to performance
Security selection was an overall positive for the fund’s relative performance. For the reporting period, the debt of FMG Finance, Freeport-McMoRan, and Hospital Corporation of America (HCA) was among the fund’s leading contributors relative to the benchmark. Additionally, our positioning in “BB” and, to a lesser extent, “CCC” rated securities helped relative performance.
Respectfully,
| | |
| John Addeo | | David Cole |
| Portfolio Manager | | Portfolio Manager |
| (g) | Security was not held in the portfolio at period end. |
| (s) | Bonds rated “BBB”, “Baa”, or higher are considered investment grade; bonds rated “BB”, “Ba”, or below are considered non-investment grade. The primary source for bond quality ratings is Moody’s Investors Service. If not available, ratings by Standard & Poor’s are used, else ratings by Fitch, Inc. For securities which are not rated by any of the three agencies, the security is considered Not Rated. |
| (y) | A yield curve graphically depicts the yields of different maturity bonds of the same credit quality and type; a normal yield curve is upward sloping, with short-term rates lower than long-term rates. |
The views expressed in this report are those of the portfolio managers only through the end of the period of the report as stated on the cover and do not necessarily reflect the views of MFS or any other person in the MFS organization. These views are subject to change at any time based on market and other conditions, and MFS disclaims any responsibility to update such views. These views may not be relied upon as investment advice or an indication of trading intent on behalf of any MFS portfolio. References to specific securities are not recommendations of such securities, and may not be representative of any MFS portfolio’s current or future investments.
3
PERFORMANCE SUMMARY THROUGH 12/31/07
The following chart illustrates the historical performance of the fund in comparison to its benchmark index. Index comparisons are unmanaged; do not reflect any fees or expenses; and cannot be invested in directly. The performance of other share classes will be greater than or less than that of the class depicted below. (See Notes to Performance Summary.)
Performance data shown represents past performance and is no guarantee of future results. Investment return and principal value fluctuate so your units, when sold, may be worth more or less than the original cost; current performance may be lower or higher than quoted. The performance shown does not reflect the deduction of taxes, if any, that a contract holder would pay on fund distributions or the redemption of contract units. The returns for the fund shown also do not reflect the deduction of expenses associated with variable products, such as mortality and expense risk charges, separate account charges, and sales charges imposed by the insurance company separate accounts. Such expenses would reduce the overall returns shown.
Growth of a hypothetical $10,000 investment
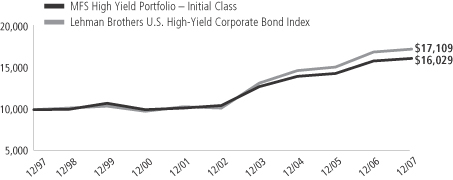
Total returns through 12/31/07
Average Annual Total Returns
| | | | | | | | | | | | |
| | | Share class | | Class inception date | | 1-yr | | 5-yr | | 10-yr | | |
| | | Initial Class | | 6/12/85 | | 1.93% | | 8.87% | | 4.83% | | |
| | | Service Class | | 8/24/01 | | 1.56% | | 8.59% | | 4.65% | | |
Comparative Index
| | | | | | | | | | | | |
| | | Lehman Brothers U.S. High-Yield Corporate Bond Index (f) | | 1.87% | | 10.91% | | 5.52% | | |
| (f) | Source: FactSet Research Systems Inc. |
Index Definition
Lehman Brothers U.S. High-Yield Corporate Bond Index – a market capitalization-weighted index that measures the performance of non-investment grade, fixed rate debt. Eurobonds and debt issues from countries designated as emerging markets (e.g., Argentina, Brazil, Venezuela, etc.) are excluded.
It is not possible to invest directly in an index.
Notes to Performance Summary
Service Class share performance includes the performance of Initial Class shares for periods prior to the inception of Service Class shares (blended performance). This blended performance figure has not been adjusted to take into account differences in the class-specific operating expenses (such as Rule 12b-1 fees). Because operating expenses of Service Class shares are generally higher than those of Initial Class shares, the blended Service Class shares performance shown is higher than it would have been had Service Class shares been offered for the entire period.
Performance results reflect any applicable expense subsidies and waivers in effect during the periods shown. Without such subsidies and waivers the fund’s performance results would be less favorable. Please see the prospectus for complete details. All results are historical and assume the reinvestment of any dividends and capital gains distributions.
From time to time the fund may receive proceeds from litigation settlements, without which performance would be lower.
4
EXPENSE TABLE
Fund Expenses Borne by the Contract Holders During the Period, July 1, 2007 through December 31, 2007
As a contract holder of the fund, you incur ongoing costs, including management fees; distribution (12b-1) fees; and other fund expenses. This example is intended to help you understand your ongoing costs (in dollars) of investing in the fund and to compare these costs with the ongoing costs of investing in other mutual funds.
The example is based on an investment of $1,000 invested at the beginning of the period and held for the entire period, July 1, 2007 through December 31, 2007.
Actual expenses
The first line for each share class in the following table provides information about actual account values and actual expenses. You may use the information in this line, together with the amount you invested, to estimate the expenses that you paid over the period. Simply divide your account value by $1,000 (for example, an $8,600 account value divided by $1,000 = 8.6), then multiply the result by the number in the first line under the heading entitled “Expenses Paid During Period” to estimate the expenses you paid on your account during this period.
Hypothetical example for comparison purposes
The second line for each share class in the following table provides information about hypothetical account values and hypothetical expenses based on the fund’s actual expense ratio and an assumed rate of return of 5% per year before expenses, which is not the fund’s actual return. The hypothetical account values and expenses may not be used to estimate the actual ending account balance or expenses you paid for the period. You may use this information to compare the ongoing costs of investing in the fund and other funds. To do so, compare this 5% hypothetical example with the 5% hypothetical examples that appear in the shareholder reports of the other funds.
Please note that the expenses shown in the table are meant to highlight the fund’s ongoing costs only and do not take into account the fees and expenses imposed under the variable contracts through which your investment in the fund is made. Therefore, the second line for each share class in the table is useful in comparing ongoing costs associated with an investment in vehicles (such as the fund) which fund benefits under variable annuity and variable life insurance contracts and to qualified pension and retirement plans only, and will not help you determine the relative total costs of investing in the fund through variable annuity and variable life insurance contracts. If the fees and expenses imposed under the variable contracts were included, your costs would have been higher.
| | | | | | | | | | |
| Share Class | | | | Annualized
Expense Ratio | | Beginning
Account Value
7/01/07 | | Ending
Account Value
12/31/07 | | Expenses Paid
During Period (p)
7/01/07-12/31/07 |
| Initial Class | | Actual | | 0.80% | | $1,000.00 | | $989.40 | | $4.01 |
| | Hypothetical (h) | | 0.80% | | $1,000.00 | | $1,021.17 | | $4.08 |
| Service Class | | Actual | | 1.05% | | $1,000.00 | | $987.80 | | $5.26 |
| | Hypothetical (h) | | 1.05% | | $1,000.00 | | $1,019.91 | | $5.35 |
| (h) | 5% class return per year before expenses. |
| (p) | Expenses paid is equal to each class’ annualized expense ratio, as shown above, multiplied by the average account value over the period, multiplied by the number of days in the period, divided by the number of days in the year. |
5
PORTFOLIO OF INVESTMENTS – 12/31/07
The Portfolio of Investments is a complete list of all securities owned by your fund.
It is categorized by broad-based asset classes.
| | | | | | |
| Issuer | | Shares/Par | | Value ($) |
| | | | | | |
| BONDS – 83.2% | | | | | | |
| Aerospace – 1.7% | | | | | | |
| Bombardier, Inc., 8%, 2014 (n) | | $ | 1,723,000 | | $ | 1,800,535 |
| Hawker Beechcraft Acquisition Co., 9.75%, 2017 (n) | | | 1,455,000 | | | 1,447,725 |
| TransDigm, Inc., 7.75%, 2014 | | | 670,000 | | | 680,050 |
| Vought Aircraft Industries, Inc., 8%, 2011 | | | 1,615,000 | | | 1,530,213 |
| | | | | | |
| | | | | $ | 5,458,523 |
| | | | | | |
| Airlines – 0.6% | | | | | | |
| Continental Airlines, Inc., 6.9%, 2017 | | $ | 306,782 | | $ | 294,511 |
| Continental Airlines, Inc., 6.748%, 2017 | | | 265,571 | | | 253,621 |
| Continental Airlines, Inc., 6.795%, 2018 | | | 547,987 | | | 520,587 |
| Continental Airlines, Inc., 7.566%, 2020 | | | 759,396 | | | 736,614 |
| | | | | | |
| | | | | $ | 1,805,333 |
| | | | | | |
| Apparel Manufacturers – 0.2% | | | | | | |
| Levi Strauss & Co., 9.75%, 2015 | | $ | 680,000 | | $ | 678,300 |
| | | | | | |
| Asset Backed & Securitized – 1.9% | | | | | | |
| Airlie LCDO Ltd., CDO, FRN, 7.11%, 2011 (z) | | $ | 665,000 | | $ | 586,730 |
| Anthracite Ltd., CDO, 6%, 2037 (z) | | | 1,300,000 | | | 907,969 |
| Arbor Realty Mortgage Securities, CDO, FRN, 7.48%, 2041 (z) | | | 686,380 | | | 599,251 |
Babson Ltd., CLO, “D”, FRN,
6.742%, 2018 (n) | | | 670,000 | | | 542,365 |
| CWCapital Cobalt Ltd., CDO, 6.23%, 2045 (n) | | | 950,000 | | | 670,757 |
| CWCapital Cobalt Ltd., CDO, “F”, FRN, 6.365%, 2050 (z) | | | 500,000 | | | 348,440 |
| First Union National Bank Commercial Mortgage Corp., 6.75%, 2010 | | | 855,000 | | | 857,493 |
| JPMorgan Chase Commercial Mortgage Securities Corp., FRN, 6.062%, 2051 | | | 690,000 | | | 640,042 |
Merrill Lynch Mortgage Trust, FRN,
5.829%, 2050 | | | 690,000 | | | 631,377 |
Wachovia Credit, CDO, FRN,
6.233%, 2026 (z) | | | 376,000 | | | 303,383 |
| | | | | | |
| | | | | $ | 6,087,807 |
| | | | | | |
| Automotive – 3.4% | | | | | | |
| Allison Transmission, Inc., 11%, 2015 (n) | | $ | 1,705,000 | | $ | 1,551,550 |
| Ford Motor Credit Co. LLC, 8.625%, 2010 | | | 1,065,000 | | | 988,268 |
| Ford Motor Credit Co. LLC, 9.75%, 2010 | | | 6,182,000 | | | 5,898,873 |
General Motors Acceptance Corp.,
8.375%, 2033 | | | 2,454,000 | | | 1,975,470 |
| TRW Automotive, Inc., 7%, 2014 (n) | | | 650,000 | | | 598,000 |
| | | | | | |
| | | | | $ | 11,012,161 |
| | | | | | |
| Broadcasting – 7.1% | | | | | | |
| Allbritton Communications Co., 7.75%, 2012 | | $ | 2,383,000 | | $ | 2,359,170 |
Bonten Media Acquisition Co.,
9%, 2015 (n)(p) | | | 835,000 | | | 728,538 |
| CanWest MediaWorks LP, 9.25%, 2015 (n) | | | 1,480,000 | | | 1,448,550 |
Clear Channel Communications, Inc.,
5.5%, 2014 | | | 1,865,000 | | | 1,421,568 |
| Intelsat Bermuda Ltd., 11.25%, 2016 | | | 2,295,000 | | | 2,369,588 |
| Intelsat Corp., 0% to 2010, 9.25% to 2015 | | | 1,590,000 | | | 1,299,825 |
| Intelsat Ltd., FRN, 10.828%, 2013 | | | 580,000 | | | 594,500 |
| | | | | | |
| Issuer | | Shares/Par | | Value ($) |
| | | | | | |
| BONDS – continued | | | | | | |
| Broadcasting – continued | | | | | | |
Intelsat Subsidiary Holding Co. Ltd.,
8.625%, 2015 | | $ | 900,000 | | $ | 904,500 |
ION Media Networks, Inc., FRN,
11.492%, 2013 (n) | | | 1,575,000 | | | 1,549,406 |
| Lamar Media Corp., 6.625%, 2015 (n) | | | 925,000 | | | 899,563 |
| Lamar Media Corp., 6.625%, 2015 | | | 1,430,000 | | | 1,390,675 |
| LBI Media, Inc., 8.5%, 2017 (n) | | | 940,000 | | | 905,925 |
| LIN TV Corp., 6.5%, 2013 | | | 2,080,000 | | | 1,957,800 |
| Local TV Finance LLC, 9.25%, 2015 (n)(p) | | | 1,515,000 | | | 1,446,825 |
| Nexstar Broadcasting Group, Inc., 7%, 2014 | | | 1,070,000 | | | 996,438 |
Univision Communications, Inc.,
9.75%, 2015 (n)(p) | | | 3,090,000 | | | 2,815,763 |
| | | | | | |
| | | | | $ | 23,088,634 |
| | | | | | |
| Brokerage & Asset Managers – 0.3% | | | | | | |
| Nuveen Investments, Inc., 10.5%, 2015 (z) | | $ | 920,000 | | $ | 916,550 |
| | | | | | |
| Building – 1.1% | | | | | | |
| Interface, Inc., 10.375%, 2010 | | $ | 943,000 | | $ | 987,793 |
| Interface, Inc., 9.5%, 2014 | | | 170,000 | | | 177,650 |
| Nortek Holdings, Inc., 8.5%, 2014 | | | 975,000 | | | 780,000 |
| Ply Gem Industries, Inc., 9%, 2012 | | | 2,270,000 | | | 1,759,250 |
| | | | | | |
| | | | | $ | 3,704,693 |
| | | | | | |
| Business Services – 0.8% | | | | | | |
| SunGard Data Systems, Inc., 10.25%, 2015 | | $ | 2,387,000 | | $ | 2,440,708 |
| | | | | | |
| Cable TV – 2.5% | | | | | | |
| CCH I Holdings LLC, 11%, 2015 | | $ | 1,684,000 | | $ | 1,372,460 |
| CCO Holdings LLC, 8.75%, 2013 | | | 2,030,000 | | | 1,938,650 |
| CSC Holdings, Inc., 6.75%, 2012 | | | 1,905,000 | | | 1,821,656 |
| Mediacom LLC, 9.5%, 2013 | | | 980,000 | | | 910,175 |
| NTL Cable PLC, 9.125%, 2016 | | | 1,130,000 | | | 1,118,700 |
| Videotron Ltee, 6.875%, 2014 | | | 905,000 | | | 885,769 |
| | | | | | |
| | | | | $ | 8,047,410 |
| | | | | | |
| Chemicals – 3.2% | | | | | | |
| Innophos, Inc., 8.875%, 2014 | | $ | 1,600,000 | | $ | 1,592,000 |
Koppers Holdings, Inc., 0% to 2009,
9.875% to 2014 | | | 1,960,000 | | | 1,646,400 |
| Koppers Holdings, Inc., 9.875%, 2013 | | | 1,365,000 | | | 1,436,663 |
Momentive Performance Materials, Inc.,
9.75%, 2014 (n) | | | 1,625,000 | | | 1,495,000 |
| Mosaic Co., 7.875%, 2016 (n) | | | 1,780,000 | | | 1,922,400 |
| Nalco Co., 7.75%, 2011 | | | 475,000 | | | 480,938 |
| Nalco Co., 8.875%, 2013 | | | 1,895,000 | | | 1,975,538 |
| | | | | | |
| | | | | $ | 10,548,939 |
| | | | | | |
| Computer Software – 0.4% | | | | | | |
| First Data Corp., 9.875%, 2015 (n) | | $ | 1,515,000 | | $ | 1,408,950 |
| | | | | | |
| Consumer Goods & Services – 2.7% | | | | | | |
| Corrections Corp. of America, 6.25%, 2013 | | $ | 1,090,000 | | $ | 1,073,650 |
| GEO Group, Inc., 8.25%, 2013 | | | 1,270,000 | | | 1,282,700 |
| Jarden Corp., 7.5%, 2017 | | | 945,000 | | | 812,700 |
| Kar Holdings, Inc., 10%, 2015 (n) | | | 1,085,000 | | | 968,363 |
6
Portfolio of Investments – continued
| | | | | | |
| Issuer | | Shares/Par | | Value ($) |
| | | | | | |
| BONDS – continued | | | | | | |
| Consumer Goods & Services – continued | | | | | | |
| Service Corp. International, 7.375%, 2014 | | $ | 700,000 | | $ | 707,875 |
| Service Corp. International, 6.75%, 2015 | | | 405,000 | | | 399,938 |
| Service Corp. International, 7%, 2017 | | | 2,830,000 | | | 2,709,725 |
| Visant Holding Corp., 8.75%, 2013 | | | 818,000 | | | 822,090 |
| | | | | | |
| | | | | $ | 8,777,041 |
| | | | | | |
| Containers – 1.3% | | | | | | |
| Crown Americas LLC, 7.625%, 2013 | | $ | 980,000 | | $ | 1,002,050 |
| Graham Packaging Co. LP, 9.875%, 2014 | | | 980,000 | | | 901,600 |
| Greif, Inc., 6.75%, 2017 | | | 1,005,000 | | | 982,388 |
| Owens-Brockway Glass Container, Inc., 8.25%, 2013 | | | 1,360,000 | | | 1,411,000 |
| | | | | | |
| | | | | $ | 4,297,038 |
| | | | | | |
| Defense Electronics – 0.9% | | | | | | |
| L-3 Communications Corp., 6.125%, 2014 | | $ | 1,740,000 | | $ | 1,705,200 |
| L-3 Communications Corp., 5.875%, 2015 | | | 1,300,000 | | | 1,254,500 |
| | | | | | |
| | | | | $ | 2,959,700 |
| | | | | | |
| Electronics – 1.0% | | | | | | |
| Avago Technologies Finance, 11.875%, 2015 | | $ | 740,000 | | $ | 790,875 |
| Flextronics International Ltd., 6.25%, 2014 | | | 1,125,000 | | | 1,071,563 |
| Spansion LLC, 11.25%, 2016 (n) | | | 1,545,000 | | | 1,313,250 |
| | | | | | |
| | | | | $ | 3,175,688 |
| | | | | | |
| Emerging Market Sovereign – 0.5% | | | | | | |
| Republic of Argentina, FRN, 5.389%, 2012 | | $ | 1,908,750 | | $ | 1,697,383 |
| | | | | | |
| Energy – Independent – 5.1% | | | | | | |
| Chaparral Energy, Inc., 8.875%, 2017 (n) | | $ | 1,860,000 | | $ | 1,678,650 |
| Chesapeake Energy Corp., 7%, 2014 | | | 1,358,000 | | | 1,364,790 |
| Chesapeake Energy Corp., 6.375%, 2015 | | | 1,945,000 | | | 1,881,788 |
| Forest Oil Corp., 7.25%, 2019 (n) | | | 915,000 | | | 919,575 |
| Hilcorp Energy I LP, 7.75%, 2015 (n) | | | 710,000 | | | 697,575 |
| Hilcorp Energy I LP, 9%, 2016 (n) | | | 1,635,000 | | | 1,692,225 |
| Mariner Energy, Inc., 8%, 2017 | | | 1,700,000 | | | 1,617,125 |
| Newfield Exploration Co., 6.625%, 2014 | | | 1,625,000 | | | 1,608,750 |
| OPTI Canada, Inc., 8.25%, 2014 (n) | | | 1,530,000 | | | 1,514,700 |
Plains Exploration & Production Co.,
7%, 2017 | | | 2,220,000 | | | 2,122,875 |
| Quicksilver Resources, Inc., 7.125%, 2016 | | | 1,580,000 | | | 1,552,350 |
| | | | | | |
| | | | | $ | 16,650,403 |
| | | | | | |
| Entertainment – 0.4% | | | | | | |
| AMC Entertainment, Inc., 11%, 2016 | | $ | 1,150,000 | | $ | 1,210,375 |
| | | | | | |
| Financial Institutions – 1.4% | | | | | | |
General Motors Acceptance Corp.,
6.875%, 2011 | | $ | 3,557,000 | | $ | 3,042,992 |
| Residential Capital LLC, 7.625%, 2008 | | | 1,550,000 | | | 1,232,250 |
| Residential Capital LLC, 8%, 2012 | | | 179,000 | | | 110,085 |
| | | | | | |
| | | | | $ | 4,385,327 |
| | | | | | |
| Food & Beverages – 1.8% | | | | | | |
| ARAMARK Corp., 8.5%, 2015 | | $ | 2,460,000 | | $ | 2,490,750 |
| B&G Foods, Inc., 8%, 2011 | | | 1,190,000 | | | 1,166,200 |
| Del Monte Corp., 6.75%, 2015 | | | 1,350,000 | | | 1,275,750 |
| Michael Foods, Inc., 8%, 2013 | | | 950,000 | | | 940,500 |
| | | | | | |
| | | | | $ | 5,873,200 |
| | | | | | |
| | | | | | |
| Issuer | | Shares/Par | | Value ($) |
| | | | | | |
| BONDS – continued | | | | | | |
| Forest & Paper Products – 2.0% | | | | | | |
| Buckeye Technologies, Inc., 8%, 2010 | | $ | 316,000 | | $ | 312,840 |
| Buckeye Technologies, Inc., 8.5%, 2013 | | | 2,165,000 | | | 2,202,888 |
| Catalyst Paper Corp., 8.625%, 2011 | | | 490,000 | | | 406,700 |
| Jefferson Smurfit Corp., 8.25%, 2012 | | | 1,435,000 | | | 1,413,475 |
| JSG Funding PLC, 7.75%, 2015 | | | 150,000 | | | 142,500 |
Millar Western Forest Products Ltd.,
7.75%, 2013 | | | 1,395,000 | | | 1,039,275 |
| NewPage Holdings Corp., 10%, 2012 (z) | | | 980,000 | | | 984,900 |
| | | | | | |
| | | | | $ | 6,502,578 |
| | | | | | |
| Gaming & Lodging – 5.8% | | | | | | |
| Fontainebleau Las Vegas Holdings LLC, 10.25%, 2015 (n) | | $ | 1,260,000 | | $ | 1,093,050 |
| Harrah’s Operating Co., Inc., 5.375%, 2013 | | | 505,000 | | | 383,800 |
| Harrah’s Operating Co., Inc., 5.75%, 2017 | | | 3,945,000 | | | 2,672,738 |
| Isle of Capri Casinos, Inc., 7%, 2014 | | | 1,075,000 | | | 881,500 |
| Mandalay Resort Group, 9.375%, 2010 | | | 1,085,000 | | | 1,122,975 |
| MGM Mirage, Inc., 8.5%, 2010 | | | 1,165,000 | | | 1,208,688 |
| MGM Mirage, Inc., 8.375%, 2011 | | | 1,025,000 | | | 1,048,063 |
| MGM Mirage, Inc., 6.75%, 2013 | | | 1,125,000 | | | 1,091,250 |
| MGM Mirage, Inc., 5.875%, 2014 | | | 970,000 | | | 887,550 |
| MGM Mirage, Inc., 7.5%, 2016 | | | 2,450,000 | | | 2,425,500 |
| Pinnacle Entertainment, Inc., 8.25%, 2012 | | | 1,055,000 | | | 1,065,550 |
| Station Casinos, Inc., 6.5%, 2014 | | | 2,635,000 | | | 1,976,250 |
| Station Casinos, Inc., 6.875%, 2016 | | | 350,000 | | | 255,500 |
| Tropicana Entertainment LLC, 9.625%, 2014 | | | 995,000 | | | 631,825 |
| Wynn Las Vegas LLC, 6.625%, 2014 | | | 2,060,000 | | | 2,023,950 |
| | | | | | |
| | | | | $ | 18,768,189 |
| | | | | | |
| Industrial – 1.5% | | | | | | |
| Blount, Inc., 8.875%, 2012 | | $ | 1,170,000 | | $ | 1,172,925 |
| Cii Carbon LLC, 11.125%, 2015 (n) | | | 570,000 | | | 561,450 |
JohnsonDiversey Holdings, Inc., “B”,
9.625%, 2012 | | | 2,720,000 | | | 2,781,200 |
| Wesco Distribution, Inc., 7.5%, 2017 | | | 340,000 | | | 316,200 |
| | | | | | |
| | | | | $ | 4,831,775 |
| | | | | | |
| Insurance – Health – 0.3% | | | | | | |
| Centene Corp., 7.25%, 2014 | | $ | 1,120,000 | | $ | 1,092,000 |
| | | | | | |
| Insurance – Property & Casualty – 0.3% | | | | | | |
| USI Holdings Corp., 9.75%, 2015 (n) | | $ | 1,365,000 | | $ | 1,098,825 |
| | | | | | |
| Machinery & Tools – 0.6% | | | | | | |
| Case New Holland, Inc., 7.125%, 2014 | | $ | 2,100,000 | | $ | 2,094,750 |
| | | | | | |
| Medical & Health Technology & Services – 7.3% | | | |
Community Health Systems, Inc.,
8.875%, 2015 | | $ | 2,585,000 | | $ | 2,633,469 |
| Cooper Cos., Inc., 7.125%, 2015 | | | 1,625,000 | | | 1,580,313 |
| DaVita, Inc., 6.625%, 2013 | | | 740,000 | | | 736,300 |
| DaVita, Inc., 7.25%, 2015 | | | 2,595,000 | | | 2,601,488 |
| HCA, Inc., 6.375%, 2015 | | | 2,605,000 | | | 2,201,225 |
| HCA, Inc., 9.25%, 2016 | | | 4,745,000 | | | 4,982,250 |
| HealthSouth Corp., 10.75%, 2016 | | | 510,000 | | | 532,950 |
LVB Acquisition Merger Sub, Inc.,
10%, 2017 (n) | | | 1,580,000 | | | 1,611,600 |
LVB Acquisition Merger Sub, Inc.,
11.625%, 2017 (n) | | | 690,000 | | | 679,650 |
7
Portfolio of Investments – continued
| | | | | | |
| Issuer | | Shares/Par | | Value ($) |
| | | | | | |
| BONDS – continued | | | | | | |
| Medical & Health Technology & Services – continued | | | |
| Psychiatric Solutions, Inc., 7.75%, 2015 | | $ | 1,605,000 | | $ | 1,600,988 |
| U.S. Oncology, Inc., 10.75%, 2014 | | | 2,150,000 | | | 2,123,125 |
Universal Hospital Services, Inc.,
8.5%, 2015 (p) | | | 1,195,000 | | | 1,206,950 |
Universal Hospital Services, Inc., FRN,
8.287%, 2015 | | | 290,000 | | | 290,000 |
| VWR Funding, Inc., 10.25%, 2015 (n) | | | 840,000 | | | 800,100 |
| | | | | | |
| | | | | $ | 23,580,408 |
| | | | | | |
| Metals & Mining – 4.1% | | | | | | |
| Arch Western Finance LLC, 6.75%, 2013 | | $ | 1,145,000 | | $ | 1,110,650 |
| FMG Finance Ltd., 10.625%, 2016 (n) | | | 2,140,000 | | | 2,450,300 |
| Foundation PA Coal Co., 7.25%, 2014 | | | 495,000 | | | 488,813 |
Freeport-McMoRan Copper & Gold, Inc.,
8.25%, 2015 | | | 690,000 | | | 731,400 |
Freeport-McMoRan Copper & Gold, Inc.,
8.375%, 2017 | | | 3,360,000 | | | 3,603,600 |
| Freeport-McMoRan Copper & Gold, Inc., FRN, 8.394%, 2015 | | | 690,000 | | | 700,350 |
| Peabody Energy Corp., 5.875%, 2016 | | | 1,255,000 | | | 1,179,700 |
| Peabody Energy Corp., 7.375%, 2016 | | | 1,310,000 | | | 1,342,750 |
| PNA Group, Inc., 10.75%, 2016 | | | 1,150,000 | | | 1,081,000 |
| Ryerson, Inc., 12%, 2015 (n) | | | 640,000 | | | 632,000 |
| | | | | | |
| | | | | $ | 13,320,563 |
| | | | | | |
| Natural Gas – Distribution – 0.9% | | | | | | |
| AmeriGas Partners LP, 7.125%, 2016 | | $ | 1,580,000 | | $ | 1,532,600 |
| Inergy LP, 6.875%, 2014 | | | 1,435,000 | | | 1,395,538 |
| | | | | | |
| | | | | $ | 2,928,138 |
| | | | | | |
| Natural Gas – Pipeline – 3.1% | | | | | | |
| Atlas Pipeline Partners LP, 8.125%, 2015 | | $ | 1,625,000 | | $ | 1,608,750 |
| Deutsche Bank (El Paso Performance-Linked Trust, CLN), 7.75%, 2011 (n) | | | 2,780,000 | | | 2,852,919 |
| El Paso Corp., 7.75%, 2032 | | | 895,000 | | | 908,494 |
| Knight Energy, Inc., 7.25%, 2028 | | | 875,000 | | | 821,147 |
Transcontinental Gas Pipe Line Corp.,
7%, 2011 | | | 303,000 | | | 317,771 |
| Williams Cos., Inc., 7.125%, 2011 | | | 733,000 | | | 774,231 |
| Williams Cos., Inc., 8.75%, 2032 | | | 1,247,000 | | | 1,524,458 |
| Williams Partners LP, 7.25%, 2017 | | | 1,230,000 | | | 1,266,900 |
| | | | | | |
| | | | | $ | 10,074,670 |
| | | | | | |
| Network & Telecom – 3.2% | | | | | | |
| Cincinnati Bell, Inc., 8.375%, 2014 | | $ | 1,705,000 | | $ | 1,662,375 |
| Citizens Communications Co., 9.25%, 2011 | | | 1,286,000 | | | 1,392,095 |
Nordic Telephone Co. Holdings,
8.875%, 2016 (n) | | | 1,120,000 | | | 1,148,000 |
| Qwest Capital Funding, Inc., 7.25%, 2011 | | | 1,035,000 | | | 1,019,475 |
| Qwest Corp., 7.875%, 2011 | | | 465,000 | | | 483,600 |
| Qwest Corp., 8.875%, 2012 | | | 1,530,000 | | | 1,637,100 |
Time Warner Telecom Holdings, Inc.,
9.25%, 2014 | | | 750,000 | | | 766,875 |
| Windstream Corp., 8.625%, 2016 | | | 2,155,000 | | | 2,262,750 |
| | | | | | |
| | | | | $ | 10,372,270 |
| | | | | | |
| | | | | | |
| Issuer | | Shares/Par | | Value ($) |
| | | | | | |
| BONDS – continued | | | | | | |
| Oil Services – 1.0% | | | | | | |
| Basic Energy Services, Inc., 7.125%, 2016 | | $ | 1,650,000 | | $ | 1,551,000 |
Compagnie Generale de
Geophysique – Veritas, 7.75%, 2017 | | | 825,000 | | | 833,250 |
| GulfMark Offshore, Inc., 7.75%, 2014 | | | 745,000 | | | 752,450 |
| | | | | | |
| | | | | $ | 3,136,700 |
| | | | | | |
| Other Banks & Diversified Financials – 0.1% | | | |
| VTB Capital S.A., 6.609%, 2012 (z) | | $ | 362,000 | | $ | 355,303 |
| | | | | | |
| Printing & Publishing – 4.2% | | | | | | |
American Media Operations, Inc.,
10.25%, 2009 | | $ | 1,333,000 | | $ | 1,138,049 |
| Dex Media, Inc., 0% to 2008, 9% to 2013 | | | 3,710,000 | | | 3,376,100 |
| Dex Media, Inc., 0% to 2008, 9% to 2013 | | | 1,710,000 | | | 1,556,100 |
| Idearc, Inc., 8%, 2016 | | | 4,350,000 | | | 3,991,120 |
| Nielsen Finance LLC, 10%, 2014 | | | 910,000 | | | 930,475 |
Nielsen Finance LLC, 0% to 2011,
12.5% to 2016 | | | 1,450,000 | | | 1,018,625 |
| R.H. Donnelley Corp., 8.875%, 2016 | | | 1,785,000 | | | 1,668,975 |
| | | | | | |
| | | | | $ | 13,679,444 |
| | | | | | |
| Retailers – 0.9% | | | | | | |
| Buhrmann U.S., Inc., 7.875%, 2015 | | $ | 1,035,000 | | $ | 975,488 |
| Couche-Tard, Inc., 7.5%, 2013 | | | 930,000 | | | 927,675 |
| Rite Aid Corp., 7.5%, 2017 | | | 1,020,000 | | | 898,875 |
| Rite Aid Corp., 9.5%, 2017 | | | 220,000 | | | 182,050 |
| | | | | | |
| | | | | $ | 2,984,088 |
| | | | | | |
| Specialty Stores – 0.6% | | | | | | |
| Michaels Stores, Inc., 10%, 2014 | | $ | 965,000 | | $ | 916,750 |
| Payless ShoeSource, Inc., 8.25%, 2013 | | | 1,040,000 | | | 977,600 |
| | | | | | |
| | | | | $ | 1,894,350 |
| | | | | | |
| Supermarkets – 0.7% | | | | | | |
| Stater Brothers Holdings, Inc., 7.75%, 2015 | | $ | 1,035,000 | | $ | 998,775 |
| SUPERVALU, Inc., 7.5%, 2014 | | | 1,125,000 | | | 1,153,125 |
| | | | | | |
| | | | | $ | 2,151,900 |
| | | | | | |
| Telecommunications – Wireless – 1.6% | | | | | | |
| Alltel Corp., 7%, 2012 | | $ | 1,379,000 | | $ | 1,189,388 |
| American Tower Corp., 7%, 2017 (n) | | | 615,000 | | | 618,075 |
Centennial Communications Corp.,
10.125%, 2013 | | | 655,000 | | | 687,750 |
MetroPCS Communications Wireless, Inc.,
9.25%, 2014 | | | 1,005,000 | | | 944,700 |
Wind Acquisition Finance S.A.,
10.75%, 2015 (n) | | | 1,580,000 | | | 1,722,200 |
| | | | | | |
| | | | | $ | 5,162,113 |
| | | | | | |
| Transportation – Services – 0.7% | | | | | | |
| Hertz Corp., 8.875%, 2014 | | $ | 2,390,000 | | $ | 2,422,863 |
| | | | | | |
| U.S. Treasury Obligations – 0.5% | | | | | | |
| U.S. Treasury Bonds, 4.5%, 2036 | | $ | 1,693,000 | | $ | 1,701,597 |
| | | | | | |
| Utilities – Electric Power – 5.5% | | | | | | |
| AES Corp., 9.375%, 2010 | | $ | 2,005,000 | | $ | 2,105,250 |
| Dynegy Holdings, Inc., 7.5%, 2015 | | | 860,000 | | | 804,100 |
| Edison Mission Energy, 7%, 2017 | | | 3,930,000 | | | 3,861,225 |
| Intergen N.V., 9%, 2017 (n) | | | 800,000 | | | 842,000 |
8
Portfolio of Investments – continued
| | | | | | |
| Issuer | | Shares/Par | | Value ($) |
| | | | | | |
| BONDS – continued | | | | | | |
| Utilities – Electric Power – continued | | | | | | |
Mirant Americas Generation LLC,
8.3%, 2011 | | $ | 800,000 | | $ | 802,000 |
Mirant North American LLC,
7.375%, 2013 | | | 1,340,000 | | | 1,343,350 |
| NRG Energy, Inc., 7.375%, 2016 | | | 4,595,000 | | | 4,480,120 |
| Reliant Energy, Inc., 6.75%, 2014 | | | 495,000 | | | 496,238 |
| Reliant Energy, Inc., 7.875%, 2017 | | | 2,190,000 | | | 2,168,100 |
| Sierra Pacific Resources, 8.625%, 2014 | | | 760,000 | | | 812,084 |
| | | | | | |
| | | | | $ | 17,714,467 |
| | | | | | |
Total Bonds
(Identified Cost, $279,401,811) | | | | | $ | 270,091,154 |
| | | | | | |
| FLOATING RATE LOANS (g)(r) – 8.8% | | | | | | |
| Aerospace – 0.3% | | | | | | |
| Hawker Beechcraft Acquisition Co., Letter of Credit, 6.93%, 2014 | | $ | 39,688 | | $ | 37,637 |
| Hawker Beechcraft Acquisition Co., Term Loan, 6.83%, 2014 | | | 975,744 | | | 925,330 |
| | | | | | |
| | | | | $ | 962,967 |
| | | | | | |
| Automotive – 1.5% | | | | | | |
Allison Transmission, Inc., Term Loan B,
7.96%, 2014 | | $ | 530,848 | | $ | 495,149 |
| Ford Motor Co., Term Loan B, 8%, 2013 | | | 1,814,816 | | | 1,676,689 |
| Goodyear Tire & Rubber Co., Second Lien Term Loan, 6.43%, 2014 | | | 2,021,964 | | | 1,892,433 |
| Mark IV Industries, Inc., Second Lien Term Loan, 10.76%, 2011 | | | 994,489 | | | 924,875 |
| | | | | | |
| | | | | $ | 4,989,146 |
| | | | | | |
| Broadcasting – 0.8% | | | | | | |
Gray Television, Inc., Term Loan,
6.73%, 2014 | | $ | 780,518 | | $ | 724,906 |
| Univision Communications, Inc., Term Loan B, 7.2%, 2014 (o) | | | 1,935,538 | | | 1,761,825 |
| | | | | | |
| | | | | $ | 2,486,731 |
| | | | | | |
| Building – 0.2% | | | | | | |
| Building Materials Corp. of America, Second Lien Term Loan, 10.68%, 2014 (o) | | $ | 1,021,862 | | $ | 737,019 |
| | | | | | |
| Cable TV – 1.1% | | | | | | |
| Charter Communications Operating LLC, Term Loan, 7.36%, 2013 | | $ | 1,594,902 | | $ | 1,488,697 |
| CSC Holdings, Inc., Incremental Term Loan, 6.89%, 2013 | | | 1,194,027 | | | 1,126,988 |
Mediacom Illinois LLC, Term Loan A,
6.52%, 2011 | | | 1,077,104 | | | 999,015 |
| | | | | | |
| | | | | $ | 3,614,700 |
| | | | | | |
| Chemicals – 0.5% | | | | | | |
Celanese AG, Term Loan B,
6.97%, 2014 | | $ | 1,683,886 | | $ | 1,622,243 |
| | | | | | |
| Computer Software – 0.2% | | | | | | |
First Data Corp., Term Loan B-1,
7.63%, 2014 | | $ | 830,095 | | $ | 787,099 |
| | | | | | |
| | | | | | |
| Issuer | | Shares/Par | | Value ($) |
| | | | | | |
| FLOATING RATE LOANS (g)(r) – continued | | | |
| Containers – 0.1% | | | | | | |
| Altivity Packaging LLC, Second Lien Term Loan, 9.98%, 2013 | | $ | 81,455 | | $ | 81,505 |
| Altivity Packaging LLC, Second Lien Term Loan, 9.98%, 2013 | | | 254,545 | | | 254,705 |
| | | | | | |
| | | | | $ | 336,210 |
| | | | | | |
| Food & Beverages – 0.7% | | | | | | |
Dean Foods Co., Term Loan B,
6.58%, 2014 | | $ | 1,298,032 | | $ | 1,223,395 |
Dole Food Co., Inc., Letter of Credit,
6.99%, 2013 | | | 108,499 | | | 100,226 |
Dole Food Co., Inc., Term Loan,
7.16%, 2013 | | | 239,851 | | | 221,562 |
Dole Food Co., Inc., Term Loan C,
7.21%, 2013 | | | 799,502 | | | 738,540 |
| | | | | | |
| | | | | $ | 2,283,723 |
| | | | | | |
| Forest & Paper Products – 0.5% | | | | | | |
Georgia-Pacific Corp., Term Loan,
6.86%, 2012 | | $ | 1,683,690 | | $ | 1,602,487 |
Georgia-Pacific Corp., Term Loan B-2,
6.83%, 2012 | | | 111,743 | | | 106,354 |
| | | | | | |
| | | | | $ | 1,708,841 |
| | | | | | |
| Medical & Health Technology & Services – 1.1% | | | |
| Advanced Medical Optics, Inc., Term Loan, 6.66%, 2014 | | $ | 624,157 | | $ | 582,026 |
| Community Health Systems, Inc., Term Loan B, 7.33%, 2014 | | | 953,591 | | | 916,878 |
| HCA, Inc., Term Loan B, 7.08%, 2013 | | | 2,236,762 | | | 2,152,668 |
| | | | | | |
| | | | | $ | 3,651,572 |
| | | | | | |
| Natural Gas – Pipeline – 0.2% | | | | | | |
| Kinder Morgan, Term Loan, 6.35%, 2014 | | $ | 554,315 | | $ | 550,366 |
| | | | | | |
| Pollution Control – 0.4% | | | | | | |
| Allied Waste North America, Inc., Term Loan, 6.58%, 2012 | | $ | 747,053 | | $ | 713,643 |
Allied Waste North America, Inc., Term Loan A, Credit Linked Deposit,
6.62%, 2012 | | | 473,004 | | | 451,850 |
| | | | | | |
| | | | | $ | 1,165,493 |
| | | | | | |
| Printing & Publishing – 0.4% | | | | | | |
Nielsen Finance LLC, Term Loan B,
7.27%, 2013 | | $ | 1,420,690 | | $ | 1,344,836 |
| | | | | | |
| Retailers – 0.4% | | | | | | |
| Neiman-Marcus Group, Inc., Term Loan, 2013 (o) | | $ | 1,174,259 | | $ | 1,127,741 |
| | | | | | |
| Specialty Stores – 0.4% | | | | | | |
Michaels Stores, Inc., Term Loan B,
7.61%, 2013 | | $ | 1,385,026 | | $ | 1,269,992 |
| | | | | | |
Total Floating Rate Loans
(Identified Cost, $30,173,501) | | | | | $ | 28,638,679 |
| | | | | | |
9
Portfolio of Investments – continued
| | | | | |
| Issuer | | Shares/Par | | Value ($) |
| | | | | |
| COMMON STOCKS – 1.9% | | | | | |
| Automotive – 0.0% | | | | | |
| Oxford Automotive, Inc. (a) | | 21 | | $ | 0 |
| | | | | |
| Cable TV – 0.6% | | | | | |
| Comcast Corp., “A” (a) | | 73,100 | | $ | 1,334,806 |
| Time Warner Cable, Inc. (a) | | 17,400 | | | 480,240 |
| | | | | |
| | | | $ | 1,815,046 |
| | | | | |
| Construction – 0.3% | | | | | |
| Goodman Global, Inc. (a) | | 36,200 | | $ | 888,348 |
| | | | | |
| Consumer Goods & Services – 0.0% | | | |
| Central Garden & Pet Co. (a) | | 14,000 | | $ | 80,640 |
| | | | | |
| Electronics – 0.1% | | | | | |
| Intel Corp. | | 14,500 | | $ | 386,570 |
| | | | | |
| Energy – Integrated – 0.2% | | | | | |
| Chevron Corp. | | 6,100 | | $ | 569,313 |
| | | | | |
| Forest & Paper Products – 0.1% | | | | | |
| Louisiana-Pacific Corp. | | 15,600 | | $ | 213,408 |
| | | | | |
| Major Banks – 0.1% | | | | | |
| Bank of America Corp. | | 3,600 | | $ | 148,536 |
| JPMorgan Chase & Co. | | 3,600 | | | 157,140 |
| | | | | |
| | | | $ | 305,676 |
| | | | | |
| Pharmaceuticals – 0.1% | | | | | |
| Johnson & Johnson | | 5,700 | | $ | 380,190 |
| | | | | |
| Printing & Publishing – 0.0% | | | | | |
| Golden Books Family Entertainment, Inc. (a) | | 17,708 | | $ | 0 |
| | | | | |
| Real Estate – 0.1% | | | | | |
| Host Hotels & Resorts, Inc., REIT | | 30,200 | | $ | 514,608 |
| | | | | |
| Telephone Services – 0.3% | | | | | |
| Knology, Inc. (a) | | 121 | | $ | 1,546 |
| Windstream Corp. | | 72,400 | | | 942,648 |
| | | | | |
| | | | $ | 944,194 |
| | | | | |
Total Common Stocks
(Identified Cost, $7,178,224) | | | | $ | 6,097,993 |
| | | | | |
| | | | | | |
| Issuer | | Shares/Par | | Value ($) |
| PREFERRED STOCKS – 0.0% | | | | | | |
| Real Estate – 0.0% | | | | | | |
HRPT Properties Trust, “B”, REIT,
8.75%
(Identified Cost, $19,555) | | | 715 | | $ | 17,846 |
| | | | | | |
| |
| REPURCHASE AGREEMENTS – 4.2% | | | |
| Merrill Lynch, 4.5%, dated 12/31/07, due 1/02/08, total to be received $13,631,407 (secured by various U.S. Treasury and Federal Agency obligations and Mortgage Backed securities in a jointly traded account), at Cost | | $ | 13,628,000 | | $ | 13,628,000 |
| | | | | | |
Total Investments
(Identified Cost, $330,401,091) (k) | | | | | $ | 318,473,672 |
| | | | | | |
OTHER ASSETS, LESS
LIABILITIES – 1.9% | | | | | | 6,096,009 |
| | | | | | |
| Net Assets – 100.0% | | | | | $ | 324,569,681 |
| | | | | | |
| (a) | Non-income producing security. |
| (g) | The rate shown represents a weighted average coupon rate on settled positions at period end. |
| (k) | As of December 31, 2007, the fund held securities fair valued in accordance with the policies adopted by the Board of Trustees, aggregating $264,434,876 and 83.03% of market value. All of these security values were provided by an independent pricing service using an evaluated bid. |
| (n) | Securities exempt from registration under Rule 144A of the Securities Act of 1933. These securities may be sold in the ordinary course of business in transactions exempt from registration, normally to qualified institutional buyers. At period end, the aggregate value of these securities was $46,126,359, representing 14.2% of net assets. |
| (o) | All or a portion of this position has not settled. Upon settlement date, interest rates will be determined. |
| (p) | Payment-in-kind security. |
| (r) | Remaining maturities of floating rate loans may be less than stated maturities shown as a result of contractual or optional prepayments by the borrower. Such prepayments cannot be predicted with certainty. These loans may be subject to restrictions on resale. Floating rate loans generally have rates of interest which are determined periodically by reference to a base lending rate plus a premium. |
| (z) | Restricted securities are not registered under the Securities Act of 1933 and are subject to legal restrictions on resale. These securities generally may be resold in transactions exempt from registration or to the public if the securities are subsequently registered. Disposal of these securities may involve time-consuming negotiations and prompt sale at an acceptable price may be difficult. The fund holds the following restricted securities: |
10
Portfolio of Investments – continued
| | | | | | |
| Restricted Securities | | Acquisition Date | | Acquisition
Cost | | Current
Market Value |
| Airlie LCDO Ltd., CDO, FRN, 7.11%, 2011 | | 10/13/06 | | $665,000 | | $586,730 |
| Anthracite Ltd., CDO, 6%, 2037 | | 5/14/02 | | 839,044 | | 907,969 |
| Arbor Realty Mortgage Securities, CDO, FRN, 7.48%, 2041 | | 12/20/05 | | 686,380 | | 599,251 |
| CWCapital Cobalt Ltd., CDO, “F”, FRN, 6.365%, 2050 | | 4/12/06 | | 500,000 | | 348,440 |
| NewPage Holdings Corp., 10%, 2012 | | 12/07/07-12/11/07 | | 989,200 | | 984,900 |
| Nuveen Investments, Inc., 10.5%, 2015 | | 10/31/07 | | 920,000 | | 916,550 |
| VTB Capital S.A., 6.609%, 2012 | | 10/25/07 | | 362,000 | | 355,303 |
| Wachovia Credit, CDO, FRN, 6.233%, 2026 | | 6/08/06 | | 376,000 | | 303,383 |
| Total Restricted Securities | | | | | | $5,002,526 |
| % of Net Assets | | | | | | 1.5% |
Unfunded Loan Commitments
As of December 31, 2007, the portfolio had the following unfunded loan commitments of $115,165, which could be extended at the option of the borrower:
| | | | | |
| Borrower | | Unfunded
Loan
Commitment | | Unrealized
Appreciation
(Depreciation) | |
| Community Health Systems, Inc., Delayed Draw Term Loan, 2014 | | $47,959 | | $(1,846 | ) |
| Univision Communications, Inc., Delayed Draw Term Loan, 2014 | | 67,206 | | (811 | ) |
| | $115,165 | | $(2,657 | ) |
At December 31, 2007, the fund had sufficient cash and/or other liquid securities to cover any commitments under these contracts.
Derivative Contracts at 12/31/07
Swap Agreements at 12/31/07
| | | | | | | | | | | | | |
| Expiration | | | | Notional
Amount | | Counterparty | | Cash Flows to
Receive | | Cash Flows to
Pay | | Value | |
| Credit Default Swaps | | | | | | | | | | | | | |
| 6/20/09 | | USD | | 600,000 | | JPMorgan Chase Bank | | 4.80% (fixed rate) | | (1) | | $ (34,254 | ) |
| 6/20/09 | | USD | | 1,200,000 | | JPMorgan Chase Bank | | 4.10% (fixed rate) | | (1) | | (79,740 | ) |
| 6/20/12 | | USD | | 2,900,000 | | JPMorgan Chase Bank (a) | | (2) | | 4.21% (fixed rate) | | 137,675 | |
| 6/20/12 | | USD | | 600,000 | | Morgan Stanley Capital Services, Inc. | | 4.15% (fixed rate) | | (3) | | (107,665 | ) |
| 6/20/12 | | USD | | 1,200,000 | | Morgan Stanley Capital Services, Inc. | | 3.76% (fixed rate) | | (3) | | (229,451 | ) |
| 9/20/12 | | USD | | 1,200,000 | | Goldman Sachs International | | 3.75% (fixed rate) | | (4) | | 7,064 | |
| 3/20/17 | | USD | | 200,000 | | JPMorgan Chase Bank | | (5) | | 0.78% (fixed rate) | | (935 | ) |
| 3/20/17 | | USD | | 200,000 | | JPMorgan Chase Bank | | (5) | | 0.80% (fixed rate) | | (1,232 | ) |
| 3/20/17 | | USD | | 200,000 | | Merrill Lynch International | | (5) | | 0.81% (fixed rate) | | (1,380 | ) |
| | | | | | | | | | | | $ (309,918 | ) |
| (1) | Fund to pay notional amount upon a defined credit event by Abitibi Consolidated, Inc., 8.375%, 4/1/15. |
| (2) | Fund to receive notional amount upon a defined credit event by a reference obligation specified in the CDX High Yield Index. |
| (3) | Fund to pay notional amount upon a defined credit event by Bowater, Inc., 6.5%, 6/15/13. |
| (4) | Fund to pay notional amount upon a defined credit event by Allied Waste, Inc., 7.375%, 4/15/14. |
| (5) | Fund to receive notional amount upon a defined credit event by Waste Management, Inc., 7.375%, 8/1/10. |
| (a) | Premiums paid by the fund amounted to $145,656. |
At December 31, 2007, the fund had sufficient cash and/or other liquid securities to cover any commitments under these derivative contracts.
The following abbreviations are used in this report and are defined:
| CDO | Collateralized Debt Obligation |
| CLO | Collateralized Loan Obligation |
| FRN | Floating Rate Note. Interest rate resets periodically and may not be the rate reported at period end. |
| REIT | Real Estate Investment Trust |
See Notes to Financial Statements
11
FINANCIAL STATEMENTS | STATEMENT OF ASSETS AND LIABILITIES
This statement represents your fund’s balance sheet, which details the assets and liabilities comprising the total value of the fund.
| | | | | |
| At 12/31/07 | | | | | |
| Assets | | | | | |
| Investments, at value (identified cost, $330,401,091) | | $318,473,672 | | | |
| Cash | | 229,397 | | | |
| Restricted cash | | 260,000 | | | |
| Receivable for investments sold | | 2,471,081 | | | |
| Receivable for fund shares sold | | 52,490 | | | |
| Interest and dividends receivable | | 5,955,448 | | | |
| Swaps, at value (premiums paid, $145,656) | | 144,739 | | | |
| Other assets | | 10,092 | | | |
| Total assets | | | | | $327,596,919 |
| Liabilities | | | | | |
| Payable for investments purchased | | $2,332,419 | | | |
| Payable for fund shares reacquired | | 129,219 | | | |
| Unrealized depreciation on unfunded loan commitments | | 2,657 | | | |
| Swaps, at value | | 454,657 | | | |
| Payable to affiliates | | | | | |
Management fee | | 24,907 | | | |
Distribution and service fees | | 4,081 | | | |
Administrative services fee | | 832 | | | |
| Payable for independent trustees’ compensation | | 1,044 | | | |
| Accrued expenses and other liabilities | | 77,422 | | | |
| Total liabilities | | | | | $3,027,238 |
| Net assets | | | | | $324,569,681 |
| Net assets consist of | | | | | |
| Paid-in capital | | $415,441,888 | | | |
| Unrealized appreciation (depreciation) on investments | | (12,385,650 | ) | | |
| Accumulated net realized gain (loss) on investments | | (103,928,502 | ) | | |
| Undistributed net investment income | | 25,441,945 | | | |
| Net assets | | | | | $324,569,681 |
| Shares of beneficial interest outstanding | | | | | 49,681,901 |
| Initial Class shares | | | | | |
Net assets | | $175,407,907 | | | |
Shares outstanding | | 26,751,561 | | | |
Net asset value per share | | | | | $6.56 |
| Service Class shares | | | | | |
Net assets | | $149,161,774 | | | |
Shares outstanding | | 22,930,340 | | | |
Net asset value per share | | | | | $6.50 |
See Notes to Financial Statements
12
FINANCIAL STATEMENTS | STATEMENT OF OPERATIONS
This statement describes how much your fund earned in investment income and accrued in expenses. It also describes any gains and/or losses generated by fund operations.
| | | | | | |
| Year ended 12/31/07 | | | | | | |
| Net Investment income | | | | | | |
| Income | | | | | | |
Interest | | $27,601,964 | | | | |
Dividends | | 148,291 | | | | |
| Total investment income | | | | | $27,750,255 | |
| Expenses | | | | | | |
Management fee | | $2,589,144 | | | | |
Distribution fees | | 354,239 | | | | |
Administrative services fee | | 90,686 | | | | |
Independent trustees’ compensation | | 33,089 | | | | |
Custodian fee | | 59,934 | | | | |
Shareholder communications | | 50,694 | | | | |
Auditing fees | | 52,266 | | | | |
Legal fees | | 7,928 | | | | |
Miscellaneous | | 31,053 | | | | |
| Total expenses | | | | | $3,269,033 | |
Fees paid indirectly | | (20,613 | ) | | | |
Reduction of expenses by investment adviser | | (172,610 | ) | | | |
| Net expenses | | | | | $3,075,810 | |
| Net investment income | | | | | $24,674,445 | |
| Realized and unrealized gain (loss) on investments | | | | | | |
| Realized gain (loss) (identified cost basis) | | | | | | |
Investment transactions | | $1,187,486 | | | | |
Swap transactions | | 195,425 | | | | |
| Net realized gain (loss) on investments | | | | | $1,382,911 | |
| Change in unrealized appreciation (depreciation) | | | | | | |
Investments | | $(19,111,311 | ) | | | |
Swap transactions | | (455,574 | ) | | | |
Unfunded loan commitments | | (2,657 | ) | | | |
| Net unrealized gain (loss) on investments | | | | | $(19,569,542 | ) |
| Net realized and unrealized gain (loss) on investments | | | | | $(18,186,631 | ) |
| Change in net assets from operations | | | | | $6,487,814 | |
See Notes to Financial Statements
13
FINANCIAL STATEMENTS | STATEMENTS OF CHANGES IN NET ASSETS
These statements describe the increases and/or decreases in net assets resulting from operations, any distributions, and any shareholder transactions.
| | | | | | |
For years ended 12/31 | | 2007 | | | 2006 | |
| Change in net assets | | | | | | |
| From operations | | | | | | |
| Net investment income | | $24,674,445 | | | $24,983,630 | |
| Net realized gain (loss) on investments | | 1,382,911 | | | (764,579 | ) |
| Net unrealized gain (loss) on investments | | (19,569,542 | ) | | 10,294,387 | |
| Change in net assets from operations | | $6,487,814 | | | $34,513,438 | |
| Distributions declared to shareholders | | | | | | |
| From net investment income | | | | | | |
Initial Class | | $(15,332,557 | ) | | $(19,601,820 | ) |
Service Class | | (10,039,719 | ) | | (9,556,650 | ) |
| Total distributions declared to shareholders | | $(25,372,276 | ) | | $(29,158,470 | ) |
| Change in net assets from fund share transactions | | $(12,797,321 | ) | | $(16,450,874 | ) |
| Total change in net assets | | $(31,681,783 | ) | | $(11,095,906 | ) |
| Net assets | | | | | | |
| At beginning of period | | 356,251,464 | | | 367,347,370 | |
At end of period (including undistributed net investment income of $25,441,945 and
$25,365,403, respectively) | | $324,569,681 | | | $356,251,464 | |
See Notes to Financial Statements
14
FINANCIAL STATEMENTS | FINANCIAL HIGHLIGHTS
The financial highlights table is intended to help you understand the fund’s financial performance for the past 5 years. Certain information reflects financial results for a single fund share. The total returns in the table represent the rate by which an investor would have earned (or lost) on an investment in the fund share class (assuming reinvestment of all distributions) held for the entire period.
Initial Class
| | | | | | | | | | | | | | | |
| | | Years Ended 12/31 | |
| | | 2007 | | | 2006 | | | 2005 | | | 2004 | | | 2003 | |
| Net asset value, beginning of period | | $6.93 | | | $6.83 | | | $7.32 | | | $7.27 | | | $6.56 | |
| Income (loss) from investment operations | | | | | | | | | | | | | | | |
| Net investment income (d) | | $0.49 | | | $0.48 | | | $0.49 | | | $0.52 | | | $0.54 | |
| Net realized and unrealized gain (loss) on investments | | (0.34 | ) | | 0.19 | | | (0.36 | ) | | 0.11 | | | 0.80 | |
| Total from investment operations | | $0.15 | | | $0.67 | | | $0.13 | | | $0.63 | | | $1.34 | |
| Less distributions declared to shareholders | | | | | | | | | | | | | | | |
| From net investment income | | $(0.52 | ) | | $(0.57 | ) | | $(0.62 | ) | | $(0.58 | ) | | $(0.63 | ) |
| Net asset value, end of period | | $6.56 | | | $6.93 | | | $6.83 | | | $7.32 | | | $7.27 | |
| Total return (%) (k)(r)(s) | | 1.93 | | | 10.39 | | | 2.19 | | | 9.54 | | | 21.44 | |
Ratios (%) (to average net assets)
and Supplemental data: | | | | | | | | | | | | | | | |
| Expenses before expense reductions (f) | | 0.84 | | | 0.85 | | | 0.86 | | | 0.83 | | | 0.83 | |
| Expenses after expense reductions (f) | | 0.79 | | | 0.83 | | | N/A | | | N/A | | | N/A | |
| Net investment income | | 7.25 | | | 7.14 | | | 7.06 | | | 7.27 | | | 7.89 | |
| Portfolio turnover | | 69 | | | 92 | | | 53 | | | 68 | | | 92 | |
| Net assets at end of period (000 omitted) | | $175,408 | | | $224,412 | | | $255,999 | | | $319,653 | | | $360,207 | |
See Notes to Financial Statements
15
Financial Highlights – continued
Service Class
| | | | | | | | | | | | | | | |
| | | Years ended 12/31 | |
| | | 2007 | | | 2006 | | | 2005 | | | 2004 | | | 2003 | |
| Net asset value, beginning of period | | $6.88 | | | $6.79 | | | $7.28 | | | $7.23 | | | $6.53 | |
| Income (loss) from investment operations | | | | | | | | | | | | | | | |
| Net investment income (d) | | $0.47 | | | $0.46 | | | $0.47 | | | $0.49 | | | $0.51 | |
| Net realized and unrealized gain (loss) on investments | | (0.35 | ) | | 0.19 | | | (0.36 | ) | | 0.12 | | | 0.81 | |
| Total from investment operations | | $0.12 | | | $0.65 | | | $0.11 | | | $0.61 | | | $1.32 | |
| Less distributions declared to shareholders | | | | | | | | | | | | | | | |
| From net investment income | | $(0.50 | ) | | $(0.56 | ) | | $(0.60 | ) | | $(0.56 | ) | | $(0.62 | ) |
| Net asset value, end of period | | $6.50 | | | $6.88 | | | $6.79 | | | $7.28 | | | $7.23 | |
| Total return (%) (k)(r)(s) | | 1.56 | | | 10.04 | | | 1.93 | | | 9.37 | | | 21.21 | |
Ratios (%) (to average net assets)
and Supplemental data: | | | | | | | | | | | | | | | |
| Expenses before expense reductions (f) | | 1.09 | | | 1.10 | | | 1.11 | | | 1.08 | | | 1.08 | |
| Expenses after expense reductions (f) | | 1.04 | | | 1.08 | | | N/A | | | N/A | | | N/A | |
| Net investment income | | 7.01 | | | 6.89 | | | 6.81 | | | 6.99 | | | 7.59 | |
| Portfolio turnover | | 69 | | | 92 | | | 53 | | | 68 | | | 92 | |
| Net assets at end of period (000 Omitted) | | $149,162 | | | $131,839 | | | $111,348 | | | $109,914 | | | $98,931 | |
| (d) | Per share data are based on average shares outstanding. |
| (f) | Ratios do not reflect reductions from fees paid indirectly, if applicable. |
| (k) | The total return does not reflect expenses that apply to separate accounts. Inclusion of these charges would reduce the total return figures for all periods shown. |
| (r) | Certain expenses have been reduced without which performance would have been lower. |
| (s) | From time to time the fund may receive proceeds from litigation settlements, without which performance would be lower. |
See Notes to Financial Statements
16
NOTES TO FINANCIAL STATEMENTS
| (1) | | Business and Organization |
MFS High Yield Portfolio (formerly High Yield Series) (the fund) is a series of MFS Variable Insurance Trust II (formerly known as MFS/Sun Life Series Trust) (the trust). The trust is organized as a Massachusetts business trust and is registered under the Investment Company Act of 1940, as amended, as an open-end management investment company. The shares of the fund are sold to variable accounts established by insurance companies to fund benefits under variable contracts issued by such companies, and qualified retirement and pension plans.
| (2) | | Significant Accounting Policies |
General – The preparation of financial statements in conformity with U.S. generally accepted accounting principles requires management to make estimates and assumptions that affect the reported amounts of assets and liabilities, and disclosure of contingent assets and liabilities at the date of the financial statements and the reported amounts of revenues and expenses during the reporting period. Actual results could differ from those estimates. The fund can invest up to 100% of its portfolio in high-yield securities rated below investment grade. Investments in high-yield securities involve greater degrees of credit and market risk than investments in higher-rated securities and tend to be more sensitive to economic conditions. The fund can invest in foreign securities, including securities of emerging market issuers. Investments in foreign securities are vulnerable to the effects of changes in the relative values of the local currency and the U.S. dollar and to the effects of changes in each country’s legal, political, and economic environment. The markets of emerging markets countries are generally more volatile than the markets of developed countries with more mature economies. All of the risks of investing in foreign securities previously described are heightened when investing in emerging markets countries.
Investment Valuations – Equity securities, including restricted equity securities, are generally valued at the last sale or official closing price as reported by an independent pricing service on the market or exchange on which they are primarily traded. For securities for which there were no sales reported that day, equity securities are generally valued at the last quoted daily bid quotation as reported by an independent pricing service on the market or exchange on which they are primarily traded. For securities held short for which there were no sales reported for the day, the position is generally valued at the last quoted daily ask quotation as reported by an independent pricing service on the market or exchange on which such securities are primarily traded. Debt instruments (other than short-term instruments), including restricted debt instruments, are generally valued at an evaluated or composite bid as reported by an independent pricing service. Short-term instruments with a maturity at issuance of 60 days or less may be valued at amortized cost, which approximates market value. Swaps are generally valued at an evaluated bid as reported by an independent pricing service. Securities and other assets generally valued on the basis of information from an independent pricing service may also be valued at a broker-dealer bid quotation. Values obtained from pricing services can utilize both dealer-supplied valuations and electronic data processing techniques, which take into account factors such as institutional-size trading in similar groups of securities, yield, quality, coupon rate, maturity, type of issue, trading characteristics, and other market data. The values of foreign securities and other assets and liabilities expressed in foreign currencies are converted to U.S. dollars using the mean of bid and asked prices for rates reported by an independent pricing service.
The Board of Trustees has delegated primary responsibility for determining or causing to be determined the value of the fund’s investments (including any fair valuation) to the adviser pursuant to valuation policies and procedures approved by the Board. If the adviser determines that reliable market quotations are not readily available, investments are valued at fair value as determined in good faith by the adviser in accordance with such procedures under the oversight of the Board of Trustees. Under the fund’s valuation policies and procedures, market quotations are not considered to be readily available for many types of debt instruments and certain types of derivatives. These investments are generally valued at fair value based on information from independent pricing services. In addition, investments may be valued at fair value if the adviser determines that an investment’s value has been materially affected by events occurring after the close of the exchange or market on which the investment is principally traded (such as foreign exchange or market) and prior to the determination of the fund’s net asset value, or after the halting of trading of a specific security where trading does not resume prior to the close of the exchange or market on which the security is principally traded. The adviser may rely on independent pricing services or other information (such as the correlation with price movements of similar securities in the same or other markets; the type, cost and investment characteristics of the security; the business and financial condition of the issuer; and trading and other market data) to assist in determining whether to fair value and at what value to fair value an investment. The value of an investment for purposes of calculating the fund’s net asset value can differ depending on the source and method used to determine value. When fair valuation is used, the value of investments used to determine the fund’s net asset value may differ from quoted or published prices for the same investments.
In September 2006, FASB Statement No. 157, Fair Value Measurements (the “Statement”) was issued, and is effective for fiscal years beginning after November 15, 2007 and for all interim periods within those fiscal years. This Statement provides a single definition of fair value, a hierarchy for measuring fair value and expanded disclosures about fair value measurements.
17
Notes to Financial Statements – continued
Management is evaluating the application of the Statement to the fund, and believes the impact will be limited to expanded disclosures resulting from the adoption of this Statement in the fund’s financial statements.
Repurchase Agreements – The fund may enter into repurchase agreements with institutions that the fund’s investment adviser has determined are creditworthy. Each repurchase agreement is recorded at cost. The fund requires that the securities collateral in a repurchase transaction be transferred to the custodian in a manner sufficient to enable the fund to obtain those securities in the event of a default under the repurchase agreement. The fund monitors, on a daily basis, the value of the collateral to ensure that its value, including accrued interest, is greater than amounts owed to the fund under each such repurchase agreement. The fund and other funds managed by Massachusetts Financial Services Company (MFS), may utilize a joint trading account for the purpose of entering into one or more repurchase agreements.
Derivative Risk – The fund may invest in derivatives for hedging or non-hedging purposes. While hedging can reduce or eliminate losses, it can also reduce or eliminate gains. When the fund uses derivatives as an investment to gain market exposure, or for hedging purposes, gains and losses from derivative instruments may be substantially greater than the derivative’s original cost. Cash that has been segregated on behalf of certain derivative contracts will be reported separately on the Statement of Assets and Liabilities as restricted cash. Derivative instruments include swap agreements.
Swap Agreements – The fund may enter into swap agreements. A swap is an exchange of cash payments between the fund and another party. Net cash payments are exchanged at specified intervals and are recorded as a realized gain or loss in the Statement of Operations. The value of the swap is adjusted daily and the change in value, including accruals of periodic amounts of interest to be paid or received, is recorded as unrealized appreciation or depreciation in the Statement of Operations. Amounts paid or received at the inception of the swap are reflected as premiums paid or received on the Statement of Assets and Liabilities and are amortized using the effective interest method over the term of the agreement. A liquidation payment received or made upon early termination is recorded as a realized gain or loss in the Statement of Operations. Collateral, in the form of cash or securities, may be required to be held in segregated accounts with the fund’s custodian in connection with these agreements. Risk of loss may exceed amounts recognized on the Statement of Assets and Liabilities. These risks include the possible lack of a liquid market, failure of the counterparty to perform under the terms of the agreements, and unfavorable market movement of the underlying instrument. All swap agreements entered into by the fund with the same counterparty are generally governed by a single master agreement, which provides for the netting of all amounts owed by the parties under the agreement upon the occurrence of an event of default, thereby reducing the credit risk to which such party is exposed.
The fund holds a credit default swap in which one party makes a stream of payments based on a fixed percentage applied to the notional amount to another party in exchange for the right to receive a specified return in the event of a default by a third party, such as a corporate issuer or foreign issuer, on its obligation. The fund may enter into credit default swaps to limit or to reduce its risk exposure to defaults of corporate and sovereign issuers or to create direct or synthetic short or long exposure to corporate debt securities or certain sovereign debt securities to which it is not otherwise exposed.
Hybrid Instruments – The fund may invest in indexed or hybrid securities on which any combination of interest payments, the principal or stated amount payable at maturity is determined by reference to prices of other securities, currencies, indexes, economic factors or other measures, including interest rates, currency exchange rates, or securities indices. The risks of investing in hybrid instruments reflect a combination of the risks of investing in securities, swaps, options, futures and currencies. Hybrid instruments are potentially more volatile and carry greater market risks than traditional debt instruments. Depending on the structure of the particular hybrid instrument, changes in a benchmark, underlying assets or economic indicator may be magnified by the terms of the hybrid instrument and have an even more dramatic and substantial effect upon the value of the hybrid instrument. Also, the prices of the hybrid instrument and the benchmark, underlying asset or economic indicator may not move in the same direction or at the same time.
Loans and Other Direct Debt Instruments – The fund may invest in loans and loan participations or other receivables. These investments may include standby financing commitments, including revolving credit facilities, which obligate the fund to supply additional cash to the borrower on demand. At December 31, 2007, the portfolio had unfunded loan commitments of $115,165, which could be extended at the option of the borrower and which are covered by sufficient cash and/or liquid securities held by the fund. Loan participations involve a risk of insolvency of the lending bank or other financial intermediary.
Indemnifications – Under the fund’s organizational documents, its officers and trustees may be indemnified against certain liabilities and expenses arising out of the performance of their duties to the fund. Additionally, in the normal course of business, the fund enters into agreements with service providers that may contain indemnification clauses. The fund’s maximum exposure under these agreements is unknown as this would involve future claims that may be made against the fund that have not yet occurred.
18
Notes to Financial Statements – continued
Investment Transactions and Income – Investment transactions are recorded on the trade date. Interest income is recorded on the accrual basis. All premium and discount is amortized or accreted for financial statement purposes in accordance with U.S. generally accepted accounting principles. All discount is accreted for tax reporting purposes as required by federal income tax regulations. The fund earns certain fees in connection with its floating rate loan purchasing activities. These fees are in addition to interest payments earned and may include amendment fees, commitment fees, facility fees, consent fees, and prepayment fees. Commitment fees are recorded on an accrual basis as income in the accompanying financial statements. Dividends received in cash are recorded on the ex-dividend date. Certain dividends from foreign securities will be recorded when the fund is informed of the dividend if such information is obtained subsequent to the ex-dividend date. Dividend and interest payments received in additional securities are recorded on the ex-dividend or ex-interest date in an amount equal to the value of the security on such date.
The fund may receive proceeds from litigation settlements. Any proceeds received from litigation involving portfolio holdings are reflected in the Statement of Operations in realized gain/loss if the security has been disposed of by the fund or in unrealized gain/loss if the security is still held by the fund. Any other proceeds from litigation not related to portfolio holdings are reflected as other income in the Statement of Operations.
Fees Paid Indirectly – The fund’s custody fee may be reduced according to an arrangement that measures the value of cash deposited with the custodian by the fund. This amount, for the year ended December 31, 2007, is shown as a reduction of total expenses on the Statement of Operations.
Tax Matters and Distributions – The fund intends to qualify as a regulated investment company, as defined under Subchapter M of the Internal Revenue Code, and to distribute all of its taxable income, including realized capital gains. As a result, no provision for federal income tax is required. The fund adopted the provisions of FASB Interpretation No. 48, Accounting for Uncertainty in Income Taxes (“the Interpretation”) on January 1, 2007. The Interpretation prescribes a minimum threshold for financial statement recognition of the benefit of a tax position taken or expected to be taken in a tax return. There was no impact resulting from the adoption of this Interpretation on the fund’s financial statements. Each of the fund’s federal tax returns for the prior three fiscal years remains subject to examination by the Internal Revenue Service. It is the fund’s policy to record interest and penalty charges on underpaid taxes associated with its tax positions as interest expense and other expense, respectively. No such charges were recorded in the current financial statements. Foreign taxes, if any, have been accrued by the fund in the accompanying financial statements.
Distributions to shareholders are recorded on the ex-dividend date. Income and capital gain distributions are determined in accordance with income tax regulations, which may differ from U.S. generally accepted accounting principles. Certain capital accounts in the financial statements are periodically adjusted for permanent differences in order to reflect their tax character. These adjustments have no impact on net assets or net asset value per share. Temporary differences which arise from recognizing certain items of income, expense, gain or loss in different periods for financial statement and tax purposes will reverse at some time in the future. Distributions in excess of net investment income or net realized gains are temporary overdistributions for financial statement purposes resulting from differences in the recognition or classification of income or distributions for financial statement and tax purposes.
Book/tax differences primarily relate to expiration of capital loss carryforwards, amortization and accretion of debt securities, and derivative transactions.
The tax character of distributions declared to shareholders is as follows:
| | | | |
| | | 12/31/07 | | 12/31/06 |
| Ordinary income (including any short-term capital gains) | | $25,372,276 | | $29,158,470 |
The federal tax cost and the tax basis components of distributable earnings were as follows:
| | | |
| As of 12/31/07 | | | |
| Cost of investments | | $331,443,529 | |
| Gross appreciation | | 2,062,651 | |
| Gross depreciation | | (15,032,508 | ) |
| Net unrealized appreciation (depreciation) | | $(12,969,857 | ) |
| |
| Undistributed ordinary income | | 25,128,410 | |
| Capital loss carryforwards | | (103,028,102 | ) |
| Other temporary differences | | (2,658 | ) |
19
Notes to Financial Statements – continued
As of December 31, 2007, the fund had capital loss carryforwards available to offset future realized gains. Such losses expire as follows:
| | | |
| 12/31/08 | | $(6,617,797 | ) |
| 12/31/09 | | (37,568,488 | ) |
| 12/31/10 | | (46,740,625 | ) |
| 12/31/13 | | (5,089,839 | ) |
| 12/31/14 | | (7,011,353 | ) |
| | $(103,028,102 | ) |
Multiple Classes of Shares of Beneficial Interest – The fund offers multiple classes of shares, which differ in their respective distribution fees. All shareholders bear the common expenses of the fund based on daily net assets of each class, without distinction between share classes. Dividends are declared separately for each class. Differences in per share dividend rates are generally due to differences in separate class expenses.
| (3) | | Transactions with Affiliates |
Investment Adviser – The fund has an investment advisory agreement with MFS to provide overall investment management and related administrative services and facilities to the fund. The management fee is computed daily and paid monthly at an annual rate of 0.75% of the fund’s average daily net assets. The investment adviser has agreed in writing to reduce its management fee to 0.70% for the first $1 billion of average daily net assets and 0.65% of average daily net assets in excess of $1 billion. This written agreement will continue through August 31, 2008 unless changed or rescinded by the fund’s Board of Trustees. This management fee reduction amounted to $172,610, which is shown as a reduction of total expenses in the Statement of Operations. The management fee incurred for the year ended December 31, 2007 was equivalent to an annual effective rate of 0.70% of the fund’s average daily net assets.
The investment adviser has agreed in writing to pay a portion of the fund’s operating expenses, exclusive of certain other fees and expenses, such that total annual fund operating expenses do not exceed 1.25% of the fund’s average daily net assets. MFS’ agreement to limit the fund’s operating expenses is contained in the investment advisory agreement between MFS and the fund and may not be rescinded without shareholder approval. Effective September 1, 2007, the investment adviser has agreed in writing to pay a portion of the fund’s operating expenses, exclusive of certain other fees and expenses, such that total annual fund operating expenses do not exceed 1.00% of Initial Class average daily net assets and 1.25% of Service Class average daily net assets. This written agreement will continue through August 31, 2008, unless changed or rescinded by the fund’s Board of Trustees. For the year ended December 31, 2007, the fund’s actual operating expenses did not exceed the limit and therefore, the investment adviser did not pay any portion of the fund’s expenses.
Distributor – MFS Fund Distributors, Inc. (MFD), a wholly-owned subsidiary of MFS, is the distributor of shares of the fund. The Trustees have adopted a distribution plan for the Service Class shares pursuant to Rule 12b-1 under the Investment Company Act of 1940.
The fund’s distribution plan provides that the fund will pay MFD distribution fees equal to 0.25% per annum of its average daily net assets attributable to Service Class shares as partial consideration for services performed and expenses incurred by MFD and financial intermediaries in connection with the sale and distribution of the fund’s Service Class shares and the sale and distribution of the variable annuity or variable life insurance contracts investing indirectly in Service Class shares. MFD may subsequently pay all, or a portion, of the distribution fees to financial intermediaries.
Shareholder Servicing Agent – MFS Service Center, Inc. (MFSC), a wholly-owned subsidiary of MFS, has contracted to provide transfer agent and recordkeeping functions in connection with the issuance, transfer, and redemption of each class of shares of the fund under a Shareholder Servicing Agent Agreement. During the year ended December 31, 2007, MFSC did not receive a fee for this service.
Administrator – MFS provides certain financial, legal, shareholder communications, compliance, and other administrative services to the fund. Under an administrative services agreement, the fund partially reimburses MFS the costs incurred to provide these services. The fund is charged an annual fixed amount of $10,000 plus a fee based on average daily net assets.
The administrative services fee incurred for the year ended December 31, 2007 was equivalent to an annual effective rate of 0.0263% of the fund’s average daily net assets.
Trustees’ and Officers’ Compensation – The fund pays compensation to trustees in the form of a retainer, attendance fees, and additional compensation to the Board chairperson. The fund does not pay compensation directly to officers of the fund who are also officers of the investment adviser, all of whom receive remuneration for their services to the fund from MFS. Certain officers of the fund are officers or directors of MFS, MFD, and MFSC.
20
Notes to Financial Statements – continued
Other – This fund and certain other MFS funds (the funds) have entered into a services agreement (the Agreement) which provides for payment of fees by the funds to Tarantino LLC in return for the provision of services of an Independent Chief Compliance Officer (ICCO) for the funds. The ICCO is an officer of the funds and the sole member of Tarantino LLC. The funds can terminate the Agreement with Tarantino LLC at any time under the terms of the Agreement. MFS has agreed to bear all expenses associated with office space, other administrative support, and supplies provided to the ICCO. For the year ended December 31, 2007, the fee paid to Tarantino LLC was $1,679.
Purchases and sales of investments, other than U.S. government securities, purchased option transactions, and short-term obligations, aggregated $225,387,955 and $243,921,374, respectively.
| (5) | | Shares of Beneficial Interest |
The fund’s Declaration of Trust permits the Trustees to issue an unlimited number of full and fractional shares of beneficial interest. Transactions in fund shares were as follows:
| | | | | | | | | | | | |
| | | Year ended 12/31/07 | | | Year ended 12/31/06 | |
| | | Shares | | | Amount | | | Shares | | | Amount | |
| Shares sold | | | | | | | | | | | | |
Initial Class | | 1,097,309 | | | $7,281,527 | | | 1,957,194 | | | $12,923,475 | |
Service Class | | 5,200,205 | | | 34,692,961 | | | 5,001,880 | | | 33,148,087 | |
| | 6,297,514 | | | $41,974,488 | | | 6,959,074 | | | $46,071,562 | |
| Shares issued to shareholders in reinvestment of distributions | | | | | | | | | | | | |
Initial Class | | 2,278,240 | | | $15,332,557 | | | 3,011,032 | | | $19,601,820 | |
Service Class | | 1,500,705 | | | 10,039,719 | | | 1,474,792 | | | 9,556,650 | |
| | 3,778,945 | | | $25,372,276 | | | 4,485,824 | | | $29,158,470 | |
| Shares reacquired | | | | | | | | | | | | |
Initial Class | | (8,997,898 | ) | | $(60,695,053 | ) | | (10,062,177 | ) | | $(67,473,253 | ) |
Service Class | | (2,925,600 | ) | | (19,449,032 | ) | | (3,723,299 | ) | | (24,207,653 | ) |
| | (11,923,498 | ) | | $(80,144,085 | ) | | (13,785,476 | ) | | $(91,680,906 | ) |
| Net change | | | | | | | | | | | | |
Initial Class | | (5,622,349 | ) | | $(38,080,969 | ) | | (5,093,951 | ) | | $(34,947,958 | ) |
Service Class | | 3,775,310 | | | 25,283,648 | | | 2,753,373 | | | 18,497,084 | |
| | (1,847,039 | ) | | $(12,797,321 | ) | | (2,340,578 | ) | | $(16,450,874 | ) |
The fund and other funds managed by MFS participate in a $1 billion unsecured committed line of credit provided by a syndication of banks under a credit agreement. In addition, the fund and other funds managed by MFS have established uncommitted borrowing arrangements with certain banks. Borrowings may be made for temporary financing needs. Interest is charged to each fund, based on its borrowings, generally at a rate equal to the Federal Reserve funds rate plus 0.30%. In addition, a commitment fee, based on the average daily, unused portion of the committed line of credit, is allocated among the participating funds at the end of each calendar quarter. For the year ended December 31, 2007, the fund’s commitment fee and interest expense were $1,668 and $0, respectively, and are included in miscellaneous expense on the Statement of Operations.
21
REPORT OF INDEPENDENT REGISTERED PUBLIC ACCOUNTING FIRM
To the Board of Trustees of MFS Variable Insurance Trust II (formerly known as MFS/Sun Life Series Trust) and the Shareholders of MFS High Yield Portfolio (formerly known as High Yield Series):
We have audited the accompanying statement of assets and liabilities, including the portfolio of investments, of MFS High Yield Portfolio (one of the portfolios comprising MFS Variable Insurance Trust II) (the “Trust”) as of December 31, 2007, and the related statement of operations for the year then ended, the statements of changes in net assets for each of the two years in the period then ended, and the financial highlights for each of the five years in the period then ended. These financial statements and financial highlights are the responsibility of the Trust’s management. Our responsibility is to express an opinion on these financial statements and financial highlights based on our audits.
We conducted our audits in accordance with the standards of the Public Company Accounting Oversight Board (United States). Those standards require that we plan and perform the audit to obtain reasonable assurance about whether the financial statements and financial highlights are free of material misstatement. The Trust is not required to have, nor were we engaged to perform, an audit of its internal control over financial reporting. Our audits included consideration of internal control over financial reporting as a basis for designing audit procedures that are appropriate in the circumstances, but not for the purpose of expressing an opinion on the effectiveness of the Trust’s internal control over financial reporting. Accordingly, we express no such opinion. An audit also includes examining, on a test basis, evidence supporting the amounts and disclosures in the financial statements, assessing the accounting principles used and significant estimates made by management, as well as evaluating the overall financial statement presentation. Our procedures included confirmation of securities owned as of December 31, 2007, by correspondence with the custodian and brokers; where replies were not received from brokers, we performed other auditing procedures. We believe that our audits provide a reasonable basis for our opinion.
In our opinion, such financial statements and financial highlights present fairly, in all material respects, the financial position of MFS High Yield Portfolio as of December 31, 2007, the results of its operations for the year then ended, the changes in its net assets for each of the two years in the period then ended, and its financial highlights for each of the five years in the period then ended, in conformity with accounting principles generally accepted in the United States of America.
DELOITTE & TOUCHE LLP
Boston, Massachusetts
February 15, 2008
22
TRUSTEES AND OFFICERS – IDENTIFICATION AND BACKGROUND
The Trustees and officers of the Trust, as of February 1, 2008, are listed below, together with their principal occupations during the past five years. (Their titles may have varied during that period.) The address of each Trustee and officer is 500 Boylston Street, Boston, Massachusetts 02116.
| | | | | | |
Name, Date of Birth | | Position(s) Held
with Fund | | Trustee/Officer
Since(1) | | Principal Occupations During the Past Five Years &
Other Directorships(2) |
| INTERESTED TRUSTEE | | | | | | |
David D. Horn(3) (born 06/07/41) | | Trustee | | April 1986 | | Private investor; Retired; Sun Life Assurance Company of Canada, Former Senior Vice President and General Manager for the United States (until 1997); Retired: Sun Life Assurance Company of Canada, Director (until March 2004) |
| | |
| INDEPENDENT TRUSTEES | | | | |
J. Kermit Birchfield (born 01/08/40) | | Chairman | | May 1997 | | Consultant; Century Partners, Inc. (investments), Director (1988 to present); Displaytech, Inc. (technology), Director (1995 to present); Dessin Fournir LLC (furniture manufacturer), Director (2005 to present); Intermountain Gas Company, Inc. & Intermountain Industries, Inc. (oil & gas exploration and production) (1988 to present); Site Watch LLC (software to monitor oil tanks) Managing Director (2006 to present); Juridica Investments (fund investing in judicial matters) Director (2007 to present); Dairy Mart Convenience Stores, Inc. (convenience stores), Chairman (1997 to 2003) |
| | | |
Robert C. Bishop (born 01/13/43) | | Trustee | | May 2001 | | Autolmmune Inc. (pharmaceutical product licensing), Chairman, President and Chief Executive Officer (1992 to present); Caliper Life Sciences Corp. (laboratory analytical instruments), Director (2002 to present); Millipore Corporation (biopharmaceutical/research laboratory products), Director (1997 to present); Optobionics Corporation (ophthalmic devices), Director (2002 to 2007); Quintiles Transnational Corp. (contract research services), Director (until 2003) |
| | | |
Frederick H. Dulles (born 03/12/42) | | Trustee | | May 2001 | | Ten State International Law PLLC (law firm), Of Counsel (since 2006); Prudential Carolina Real Estate, (real estate), Broker (since 2006); Free Enterprise Foundation, Inc. (research institute), Director & Secretary (until 2008); Disher, Hamrick & Myers Residential, Inc. (real estate) Broker (until 2006); Frederick H. Dulles law practice (until 2006); Ten State Street LLP (law firm), Member (until 2005); McFadden, Pilkington & Ward LLP (solicitors and registered foreign lawyers), Member & Of Counsel (until 2003) |
| | | |
Marcia A. Kean (born 06/30/48) | | Trustee | | April 2005 | | Feinstein Kean Healthcare (consulting), Chief Executive Officer (since December 2002), Managing Director (prior to May 2001); Ardais Corporation (biotech products), Senior Vice President – Commercialization (February 2002 until November 2002) |
| | | |
Ronald G. Steinhart (born 06/15/40) | | Trustee | | May 2001 | | Private investor; Penske Automotive Group (automotive retailer), Director (2001 to present); Penson Worldwide, Inc. (securities clearance), Director (2006 to present); Animal Health International, Inc. (animal health products), Director (2007 to present); Texas Industries (concrete/aggregates/cement), Director (2007 to present); Carreker Corporation (technology consulting) Director (until 2005); Prentiss Properties Trust (real estate investment trust), Director (until 2006) |
| | | |
Haviland Wright (born 07/21/48) | | Trustee | | May 2001 | | Elixir Technologies Corporation (software) Director (2005 to present); Nano Loa Inc. (liquid crystal displays), Director (2003 to present); Silk Displays, Inc. (smart polymers) Director (2007 to present); Displaytech, Inc. (technology) Chairman and CEO (1995 – 2002) |
| | | |
| TRUSTEE EMERITUS | | | | | | |
Samuel Adams (born 10/19/25) | | Trustee Emeritus | | | | Retired; Kirkpatrick & Lockhart Preston Gates Ellis LLP (law firm), Of Counsel |
| | | |
| OFFICERS | | | | | | |
Maria F. Dwyer(4) (born 12/01/58) | | President | | November 2005 | | Massachusetts Financial Services Company, Executive Vice President and Chief Regulatory Officer (since March 2004); Fidelity Management & Research Company, Vice President (prior to March 2004); Fidelity Group of Funds, President and Treasurer (prior to March 2004) |
| | | |
Tracy Atkinson(4) (born 12/30/64) | | Treasurer | | September 2005 | | Massachusetts Financial Services Company, Senior Vice President (since September 2004); PricewaterhouseCoopers LLP, Partner (prior to September 2004) |
| | | |
Christopher R. Bohane(4) (born 01/18/74) | | Assistant Secretary and Assistant Clerk | | July 2005 | | Massachusetts Financial Services Company, Vice President and Senior Counsel (since April 2003); Kirkpatrick & Lockhart LLP (law firm), Associate (prior to April 2003) |
23
Trustees and Officers – continued
| | | | | | |
Name, Date of Birth | | Position(s) Held
with Fund | | Trustee/Officer
Since(1) | | Principal Occupations During the Past Five Years &
Other Directorships(2) |
| | | |
Ethan D. Corey(4) (born 11/21/63) | | Assistant Secretary and Assistant Clerk | | July 2005 | | Massachusetts Financial Services Company, Senior Vice President and Associate General Counsel (since April 2006); Special Counsel (prior to April 2006); Dechert LLP (law firm), Counsel (prior to December 2004) |
| | | |
David L. DiLorenzo(4) (born 08/10/68) | | Assistant Treasurer | | July 2005 | | Massachusetts Financial Services Company, Vice President (since June 2005); JP Morgan Investor Services, Vice President (January 2001 to June 2005) |
| | | |
Timothy M. Fagan(4) (born 07/10/68) | | Assistant Secretary and Assistant Clerk | | September 2005 | | Massachusetts Financial Services Company, Vice President and Senior Counsel (since September 2005); John Hancock Advisers, LLC, Vice President and Chief Compliance Officer (September 2004 to August 2005) Senior Attorney (prior to September 2004); John Hancock Group of Funds, Vice President and Chief Compliance Officer (September 2004 to December 2004) |
| | | |
Mark D. Fischer(4) (born 10/27/70) | | Assistant Treasurer | | July 2005 | | Massachusetts Financial Services Company, Vice President (since May 2005); JP Morgan Investment Management Company, Vice President (prior to May 2005) |
| | | |
Brian E. Langenfeld(4) (born 03/07/73) | | Assistant Secretary and Assistant Clerk | | May 2006 | | Massachusetts Financial Services Company, Assistant Vice President and Counsel (since May 2006); John Hancock Advisers, LLC, Assistant Vice President and Counsel (May 2005 to April 2006); John Hancock Advisers, LLC, Attorney and Assistant Secretary (prior to May 2005) |
| | | |
Ellen Moynihan(4) (born 11/13/57) | | Assistant Treasurer | | May 1997 | | Massachusetts Financial Services Company, Senior Vice President |
| | | |
Susan S. Newton(4) (born 03/07/50) | | Assistant Secretary and Assistant Clerk | | May 2005 | | Massachusetts Financial Services Company, Senior Vice President and Assistant General Counsel (since April 2005); John Hancock Advisers, LLC, Senior Vice President, Secretary and Chief Legal Officer (prior to April 2005); John Hancock Group of Funds, Senior Vice President, Secretary and Chief Legal Officer (prior to April 2005) |
| | | |
Susan A. Pereira(4) (born 11/05/70) | | Assistant Secretary and Assistant Clerk | | July 2005 | | Massachusetts Financial Services Company, Vice President and Senior Counsel (since June 2004); Bingham McCutchen LLP (law firm), Associate (January 2001 to June 2004) |
| | | |
Mark N. Polebaum(4) (born 05/01/52) | | Secretary and Assistant Clerk | | February 2006 | | Massachusetts Financial Services Company, Executive Vice President, General Counsel and Secretary (since January 2006); Wilmer Cutler Pickering Hale and Dorr LLP (law firm), Partner (prior to January 2006) |
| | | |
Frank L. Tarantino (born 03/07/44) | | Independent Chief Compliance Officer | | September 2004 | | Tarantino LLC (provider of compliance services), Principal (since June 2004); CRA Business Strategies Group (consulting services), Executive Vice President (April 2003 to June 2004); David L. Babson & Co. (investment adviser), Managing Director, Chief Administrative Officer and Director (February 1997 to March 2003) |
| | | |
Richard S. Weitzel(4) (born 7/16/70) | | Assistant Secretary and Assistant Clerk | | October 2007 | | Massachusetts Financial Services Company, Vice President and Assistant General Counsel (since 2007); Vice President and Senior Counsel (since May 2004); Massachusetts Department of Business and Technology, General Counsel (February 2003 to April 2004); Massachusetts Office of the Attorney General, Assistant Attorney General ( April 2001 to February 2003); Ropes and Gray, Associate (prior to April 2001) |
| | | |
James O. Yost(4) (born 06/12/60) | | Assistant Treasurer | | April 1992 | | Massachusetts Financial Services Company, Senior Vice President |
| (1) | Date first appointed to serve as Trustee/Officer of an MFS fund or a Compass variable account. Each Trustee has served continuously since appointment. |
| (2) | Directorships or trusteeships of companies required to report to the Securities and Exchange Commission (i.e., “public companies”). |
| (3) | “Interested person” of the Sun Life of Canada (U.S.), within the meaning of the Investment Company Act of 1940 (referred to as the 1940 Act), which is the principal federal law governing investment companies like the Series. The address of Sun Life of Canada (U.S.) is One Sun Life Executive Park, Wellesley Hills, Massachusetts 02481. |
| (4) | “Interested person” of MFS within the meaning of the 1940 Act. The address of MFS is 500 Boylston Street, Boston, Massachusetts 02116. |
The Trust does not hold annual meetings for the purpose of electing Trustees, and Trustees are not elected for fixed terms. Each Trustee and officer holds office until his or her successor is chosen and qualified, or until his or her earlier death, resignation, retirement or removal.
All Trustees currently serve as Trustees of the Trust and have served in that capacity since originally elected or appointed. All of the Trustees are also Managers of the Compass Variable Accounts. The executive officers of the Trust hold similar offices for the Compass Variable Accounts and other funds in the MFS fund complex. As of January 1, 2008, each Trustee serves as a Trustee or Manager of 35 Accounts/Funds.
24
Trustees and Officers – continued
The Statement of Additional Information contains further information about the Trustees and is available without charge upon request by calling 1-800-752-7215.
| | |
Investment Adviser
Massachusetts Financial Services Company 500 Boylston Street, Boston, MA 02116-3741 | | Custodian State Street Bank and Trust Company 225 Franklin Street, Boston, MA 02110 |
Distributor
MFS Fund Distributors, Inc. 500 Boylston Street, Boston, MA 02116-3741 | | Independent Registered Public Accounting Firm Deloitte & Touche LLP 200 Berkeley Street, Boston, MA 02116 |
Portfolio Managers John Addeo David Cole | | |
25
BOARD REVIEW OF INVESTMENT ADVISORY AGREEMENT
The Investment Company Act of 1940 requires that both the full Board of Trustees and a majority of the non-interested (“independent”) Trustees, voting separately, annually approve the continuation of the investment advisory agreement between MFS Variable Insurance Trust II (the “Trust”) and Massachusetts Financial Services Company (MFS) on behalf of the Fund. The Trustees consider matters bearing on the Fund and the advisory arrangements at their meetings throughout the year, including a review of performance data at each regular meeting. In addition, the independent Trustees met several times over the course of three months beginning in May and ending in July 2007 (“contract review meetings”) for the specific purpose of considering whether to approve the continuation of the investment advisory agreement for the Fund. The independent Trustees were assisted in their evaluation of the investment advisory agreement by independent legal counsel, from whom they received separate legal advice and with whom they met separately from MFS management during various contract review meetings. The independent Trustees were also assisted in this process by the Fund’s Independent Chief Compliance Officer, a full-time senior officer appointed by and reporting to the independent Trustees.
In connection with their deliberations, the Trustees, including the independent Trustees, considered such information and factors as they believed, in light of the legal advice furnished to them and their own business judgment, to be relevant. The investment advisory agreement was considered separately for the Fund, although the Trustees also took into account the common interests of all Funds in the Trust in their review. As described below, the Trustees considered the nature, quality, and extent of the various investment advisory, administrative, and shareholder services performed by MFS under the existing investment advisory agreement and other arrangements with the Trust.
In connection with their contract review meetings, the Trustees received and relied upon materials which included, among other items: (i) information provided by Lipper Inc. on the investment performance of the Fund for various time periods ended December 31, 2006, compared to the investment performance of a group of funds with substantially similar investment classifications/objectives (the “Lipper performance universe”), as well as the investment performance of a group of funds identified by objective criteria suggested by MFS (“peer funds”), (ii) information provided by Lipper Inc. on the Fund’s advisory fees and other expenses compared to the advisory fees and other expenses of comparable funds identified by Lipper (the “Lipper expense group”), as well as the advisory fees and other expenses of peer funds identified by objective criteria suggested by MFS, (iii) information provided by MFS on the advisory fees of comparable portfolios of its other clients, including institutional separate account and other clients, (iv) information as to whether, and to what extent applicable, expense waivers, reimbursements or fee “breakpoints” are observed for the Fund, (v) information regarding MFS’ financial results and financial condition, including MFS’ and certain of its affiliates’ estimated profitability from services performed for the Fund, (vi) MFS’ views regarding the outlook for the mutual fund industry and its strategic business plans, (vii) descriptions of various functions performed by MFS for the Trust, such as compliance monitoring and portfolio trading practices, and (viii) information regarding the overall organization of MFS, including information about MFS’ senior management and other personnel providing investment advisory, administrative and other services to the Fund. The comparative performance, fee and expense information prepared and provided by Lipper Inc. was not independently verified, and the independent Trustees did not independently verify any information provided to them by MFS.
The Trustees’ conclusion as to the continuation of the investment advisory agreement was based on comprehensive consideration of all information provided to the Trustees and not the result of any single factor. Some of the factors that figured particularly in the Trustees’ deliberations are described below for the Fund, while individual Trustees may have given different weight to various factors and evaluated the information presented as a whole differently than another Trustee. The Trustees recognized that the fee arrangements for the Fund reflect years of review and discussion between the independent Trustees and MFS, that certain aspects of such arrangements may receive greater scrutiny in some years than others, and that the Trustees’ conclusions may be based, in part, on their consideration of these same arrangements during the course of the year and in prior years.
Based on information provided by Lipper Inc. and MFS, the Trustees compared the Fund’s total return investment performance to the performance of a peer group of funds over various time periods. The Trustees placed particular emphasis on the total return performance of the Fund’s Initial Class shares in comparison to the performance of funds in its Lipper performance universe over the one-, three- and five-year periods. The Trustees did not rely on performance results for more recent periods, including those shown elsewhere in this report.
The Trustees noted the performance of the Fund’s Initial Class shares was in the 2nd quintile relative to the other funds in the Lipper Classification Index for the one-year period (the 1st quintile being the best performers and the 5th quintile being the worst performers). The total return performance of the Fund was in the 3rd quintile for the three-year and the five-year periods ended December 31, 2006, relative to the Lipper performance universe. Based on the nature and quality of services provided by MFS, the Board of Trustees concluded that the Fund’s performance was satisfactory.
26
Board Review of Investment Advisory Agreement – continued
In the course of their deliberations, the Trustees took into account information provided by MFS during contract review meetings, as well as during investment review meetings conducted with portfolio management personnel during the course of the year.
In assessing the reasonableness of the Fund’s advisory fee, the Trustees considered, among other information, the Fund’s advisory fee and the total expense ratio of the Fund’s Initial Class shares as a percentage of average daily net assets, compared to the advisory fee and total expense ratios of its peer group of funds based on information provided by Lipper Inc. and MFS. The Trustees also considered the advisory fees charged by MFS to institutional accounts. In comparing these fees, the Trustees considered the generally broader scope of services provided by MFS to the Trust than those provided to institutional accounts. The Trustees also considered the higher demands placed on MFS’ investment personnel and trading infrastructure as a result of the daily cash in-flows and out-flows of the Fund, and the impact on MFS and related expenses due to the more extensive regulatory regime to which the Fund is subject, compared to institutional accounts.
In considering the fees, the Trustees noted from the Lipper data that the Fund’s effective advisory fee rate and total expense ratio were each above the median of such fees and expenses of funds in the Lipper expense group. The Trustees further noted that MFS agreed to continue its waiver to reduce its advisory fee, and the Trustees accepted MFS’ offer to continue the total expense limitation for the next year. The Trustees further concluded that the existing breakpoints were sufficient to allow the Fund to benefit from economies of scale as its assets grow.
The Trustees also considered information prepared by MFS relating to its costs and profits with respect to the Fund and other investment companies and accounts advised by MFS, as well as MFS’ methodologies used to determine and allocate its costs to the Fund and other accounts and products for purposes of estimating profitability.
After reviewing these and other factors described below, the Trustees concluded that the advisory fee charged to the Fund represents reasonable compensation in light of the nature and quality of the services being provided by MFS.
In addition, the Trustees considered MFS’ resources and related efforts to continue to retain, attract and motivate capable personnel to serve the Fund. The Trustees also considered the financial resources of MFS and its parent, Sun Life Financial Inc. The Trustees further considered any advantages and possible disadvantages of having an adviser which also serves other investment companies as well as institutional accounts.
The Trustees also considered the nature, quality, cost, and extent of administrative, transfer agency, and distribution services provided to the Fund by MFS and its affiliates under agreements and plans other than the investment advisory agreement, including the 12b-1 fees the Fund pays to MFS Fund Distributors, Inc., an affiliate of MFS. The Trustees also considered the nature, extent and quality of certain other services MFS performs or arranges on the Fund’s behalf, which may include securities lending programs, directed expense payment programs, class action recovery programs, and MFS’ interaction with third-party service providers, principally custodians and sub-custodians. The Trustees concluded that the various non-advisory services provided by MFS and its affiliates on behalf of the Fund were satisfactory. The Trustees also considered the benefits to MFS from the use of the Fund’s portfolio brokerage commissions to pay for research and other similar services (including MFS’ policy not to use “soft dollars” generated by Fund portfolio transactions to pay for third-party research), and various other factors. Additionally, the Trustees considered so-called “fall-out benefits” to MFS such as reputational value derived from serving as investment manager to the Trust, and determined that any such benefits derived by MFS were reasonable and fair.
Based on their evaluation of factors that they deemed to be material, including those factors described above, the Board of Trustees, including a majority of the independent Trustees, concluded that the investment advisory agreement should be continued for an additional one-year period, commencing September 1, 2007.
A discussion regarding the Board’s most recent review and renewal of the Fund’s investment advisory agreement is available by clicking on the Fund’s name under “Variable Insurance Portfolios” on the “Products & Performance” page on the MFS Web site (mfs.com).
27
PROXY VOTING POLICIES AND INFORMATION
A general description of the MFS funds’ proxy voting policies and procedures is available without charge, upon request, by calling 1-800-225-2606, by visiting the About MFS section of mfs.com or by visiting the SEC’s Web site at http://www.sec.gov.
Information regarding how the fund voted proxies relating to portfolio securities during the most recent twelve-month period ended June 30 is available without charge by visiting the Proxy Voting section of mfs.com or by visiting the SEC’s Web site at http://www.sec.gov.
QUARTERLY PORTFOLIO DISCLOSURE
The fund will file a complete schedule of portfolio holdings with the Securities and Exchange Commission (the Commission) for the first and third quarters of each fiscal year on Form N-Q. The fund’s Form N-Q may be reviewed and copied at the:
Public Reference Room
Securities and Exchange Commission
100 F Street, NE, Room 1580
Washington, D.C. 20549
Information on the operation of the Public Reference Room may be obtained by calling the Commission at 1-800-SEC-0330. The fund’s Form N-Q is available on the EDGAR database on the Commission’s Internet Web site at http://www.sec.gov, and copies of this information may be obtained, upon payment of a duplicating fee, by electronic request at the following e-mail address: publicinfo@sec.gov or by writing the Public Reference Section at the above address.
A shareholder can also obtain the quarterly portfolio holdings report at mfs.com.
28
MFS® PRIVACY NOTICE
Privacy is a concern for every investor today. At MFS Investment Management® and the MFS funds, we take this concern very seriously. We want you to understand our policies about the investment products and services that we offer, and how we protect the nonpublic personal information of investors who have a direct relationship with us and our wholly owned subsidiaries.
Throughout our business relationship, you provide us with personal information. We maintain information and records about you, your investments, and the services you use. Examples of the nonpublic personal information we maintain include
| | Ÿ | | data from investment applications and other forms |
| | Ÿ | | share balances and transactional history with us, our affiliates, or others |
| | Ÿ | | facts from a consumer reporting agency |
We do not disclose any nonpublic personal information about our customers or former customers to anyone, except as permitted by law. We may share nonpublic personal information with third parties or certain of our affiliates in connection with servicing your account or processing your transactions. We may share information with companies or financial institutions that perform marketing services on our behalf or with other financial institutions with which we have joint marketing arrangements, subject to any legal requirements.
Authorization to access your nonpublic personal information is limited to appropriate personnel who provide products, services, or information to you. We maintain physical, electronic, and procedural safeguards to help protect the personal information we collect about you.
If you have any questions about the MFS privacy policy, please call 1-800-225-2606 any business day between 8 a.m. and 8 p.m. Eastern time.
Note: If you own MFS products or receive MFS services in the name of a third party such as a bank or broker-dealer, their privacy policy may apply to you instead of ours.
29
CONTACT US
Web site
mfs.com
Account service and
literature
Shareholders
1-877-411-3325
9 a.m. to 5 p.m. ET
Investment professionals
1-800-637-8630
8 a.m. to 5 p.m. ET
Mailing address
MFS Service Center, Inc.
Attn: Institutional Alliance Services (IAS)
P.O. Box 55824
Boston, MA
02205-5824
Overnight mail
MFS Service Center, Inc.
Attn: Institutional Alliance Services (IAS)
500 Boylston Street
Boston, MA 02116-3741


MFS® Variable Insurance Trust IISM
Annual report
MFS® Bond Portfolio
(formerly Bond Series)
12/31/07
BDS-ANN
MFS® BOND PORTFOLIO
(formerly Bond Series)
The report is prepared for the general information of contract owners. It is authorized for distribution to prospective investors only when preceded or accompanied by a current prospectus.
NOT FDIC INSURED MAY LOSE VALUE NO BANK OR CREDIT UNION GUARANTEE NOT A DEPOSIT NOT INSURED BY ANY FEDERAL GOVERNMENT AGENCY OR NCUA/NCUSIF
LETTER FROM THE CEO

Dear Contract Owners:
The past year has been a great example of why investors should keep their eyes on the long term.
In 2006 the Dow Jones Industrial Average returned 19% and was fairly stable. This year we have seen a greater level of volatility than has been experienced in recent years. The Dow hit several new highs but also experienced swift drops as a global credit crisis swept through markets, spurred by defaults on U.S. subprime loans and a liquidity crunch. Still, even with this volatility, the Dow ended the first three quarters of 2007 with a return near 13%.
U.S. Treasury bonds gained ground, especially in the third quarter as investors sought less risky asset classes. The spreads of many lower-quality debt investments widened.
In 2007 the U.S. dollar fell against the euro, oil prices hit their highest levels yet, and gold spiked to its steepest price in 28 years. Around the globe, stocks sold off as risk aversion mounted. As we have said before, markets can be volatile, and investors should make sure they have an investment plan that can carry them through the peaks and troughs.
If you are focused on a long-term investment strategy, the short-term ups and downs of the markets should not necessarily dictate portfolio action on your part. In our view, investors who remain committed to a long-term plan are more likely to achieve their financial goals.
In any market environment, we believe individual investors are best served by following a three-pronged investment strategy of allocating their holdings across the major asset classes, diversifying within each class, and regularly rebalancing their portfolios to maintain their desired allocations. Of course, these strategies cannot guarantee a profit or protect against a loss. Investing and planning for the long term require diligence and patience, two traits that in our experience are essential to capitalizing on the many opportunities the financial markets can offer — through both up and down economic cycles.
Respectfully,

Robert J. Manning
Chief Executive Officer and Chief Investment Officer
MFS Investment Management®
February 15, 2008
The opinions expressed in this letter are subject to change, may not be relied upon for investment advice, and no forecasts can be guaranteed.
1
PORTFOLIO COMPOSITION
Portfolio structure (i)
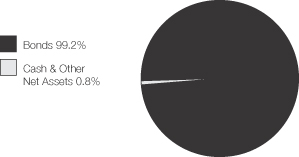
| | |
| Fixed income sectors (i) | | |
| High Grade Corporates | | 56.8% |
| High Yield Corporates | | 13.9% |
| Mortgage-Backed Securities | | 9.1% |
| Commercial Mortgage-Backed Securities | | 7.9% |
| Emerging Market Bonds | | 4.7% |
| U.S. Treasury Securities | | 4.1% |
| Municipal Bonds | | 1.1% |
| Asset-Backed Securities | | 0.7% |
| Non-U.S. Government Bonds | | 0.5% |
| Collateralized Debt Obligations | | 0.4% |
| | |
| Credit quality of bonds (r) | | |
| AAA | | 18.5% |
| AA | | 10.9% |
| A | | 18.6% |
| BBB | | 37.0% |
| BB | | 9.2% |
| B | | 5.3% |
| CCC | | 0.5% |
| | |
| Portfolio facts | | |
| Average Duration (d)(i) | | 5.1 |
| Average Life (i)(m) | | 7.4 yrs. |
| Average Maturity (i)(m) | | 14.3 yrs. |
| Average Credit Quality of Rated Securities (long-term) (a) | | A- |
| Average Credit Quality of Rated Securities (short-term) (a) | | A-1 |
| (a) | The average credit quality of rated securities is based upon a market weighted average of portfolio holdings that are rated by public rating agencies. |
| (d) | Duration is a measure of how much a bond’s price is likely to fluctuate with general changes in interest rates, e.g., if rates rise 1.00%, a bond with a 5-year duration is likely to lose about 5.00% of its value. |
| (i) | For purposes of this presentation, the bond component includes accrued interest amounts and may be positively or negatively impacted by the equivalent exposure from any derivative holdings, if applicable. |
| (m) | The average maturity shown is calculated using the final stated maturity on the portfolio’s holdings without taking into account any holdings which have been pre-refunded or pre-paid to an earlier date or which have a mandatory put date prior to the stated maturity. The average life shown takes into account these earlier dates. |
| (r) | Each security is assigned a rating from Moody’s Investors Service. If not rated by Moody’s, the rating will be that assigned by Standard & Poor’s. Likewise, if not assigned a rating by Standard & Poor’s, it will be based on the rating assigned by Fitch, Inc. For those portfolios that hold a security which is not rated by any of the three agencies, the security is considered Not Rated. Holdings in U.S. Treasuries and government agency mortgage-backed securities, if any, are included in the “AAA” – rating category. Percentages are based on the total market value of investments as of 12/31/07. |
Percentages are based on net assets as of 12/31/07, unless otherwise noted.
The portfolio is actively managed and current holdings may be different.
2
MANAGEMENT REVIEW
Summary of Results
For the twelve months ended December 31, 2007, Initial Class shares of the MFS Bond Portfolio (the “fund”) provided a total return of 3.53%, while Service Class shares provided a total return of 3.28%. These compare with a return of 7.23% for the fund’s benchmark, the Lehman Brothers U.S. Government/Credit Bond Index (Lehman Index).
Market Environment
Despite seemingly robust growth rates during the second and third quarters of 2007, underlying economic activity in the U.S. remained muted relative to other major economies. Overall, global economies witnessed moderate to strong growth during the reporting period as domestic demand improved and world trade accelerated.
With the strong global growth, however, concerns emerged about rising global inflation, especially as capacity became more constrained, wages rose, and energy and food prices advanced. During the reporting period, global central banks (with the exception of the U.S. Federal Reserve Board) tightened monetary conditions, which in turn pushed global bond yields to their highest levels during this economic expansion.
However, financial markets – particularly in the mortgage and structured-products areas – experienced substantial volatility in recent months. Beginning in late July, heightened uncertainty and distress concerning the subprime mortgage market caused several global credit markets to tighten up, forcing central banks to inject liquidity and to reassess their tightening biases as sovereign bond yields declined and credit spreads widened. While credit conditions improved somewhat by late October as the Federal Reserve Board cut interest rates, the level of market turbulence remained significant through year end. Increased market turmoil was also exacerbated by U.S. home foreclosures and uncertainties surrounding falling housing prices. Despite increased volatility across all asset classes and the widening in credit spreads, U.S. labor markets were resilient and wages rose modestly. More broadly, global equity markets rebounded following summer losses and generally held those gains through the end of the reporting period.
Detractors from performance
Sector selection hurt performance relative to the Lehman Index. Areas that were hard hit included the banking and finance sectors and our higher-yielding corporate bond holdings. The fund’s positioning in commercial mortgage-backed securities (CMBS), in particular, detracted from performance. The fund’s overweighted positions in “BBB”, “BB”, and “B” rated(s) bonds also held back results as credit spreads widened over the reporting period.
Contributors to performance
Yield was a positive factor that contributed to the fund’s relative performance. During the period, the fund held bonds that produced a greater level of income than the benchmark. Our holdings of U.S. Treasury securities also benefited results, and were among the fund’s strongest relative contributors.
Respectfully,
| | |
| Richard Hawkins | | Robert Persons |
| Portfolio Manager | | Portfolio Manager |
| (s) | Bonds rated “BBB”, “Baa”, or higher are considered investment grade; bonds rated “BB”, “Ba”, or below are considered non-investment grade. The primary source for bond quality ratings is Moody’s Investors Service. If not available, ratings by Standard & Poor’s are used, else ratings by Fitch, Inc. For securities which are not rated by any of the three agencies, the security is considered Not Rated. |
The views expressed in this report are those of the portfolio managers only through the end of the period of the report as stated on the cover and do not necessarily reflect the views of MFS or any other person in the MFS organization. These views are subject to change at any time based on market and other conditions, and MFS disclaims any responsibility to update such views. These views may not be relied upon as investment advice or an indication of trading intent on behalf of any MFS portfolio. References to specific securities are not recommendations of such securities, and may not be representative of any MFS portfolio’s current or future investments.
3
PERFORMANCE SUMMARY THROUGH 12/31/07
The following chart illustrates the historical performance of the fund in comparison to its indices. Index comparisons are unmanaged; do not reflect any fees or expenses; and cannot be invested in directly. The performance of other share classes will be greater than or less than that of the class depicted below. (See Notes to Performance Summary.)
Performance data shown represents past performance and is no guarantee of future results. Investment return and principal value fluctuate so your units, when sold, may be worth more or less than the original cost; current performance may be lower or higher than quoted. The performance shown does not reflect the deduction of taxes, if any, that a contract holder would pay on fund distributions or the redemption of contract units. The returns for the fund shown also do not reflect the deduction of expenses associated with variable products, such as mortality and expense risk charges, separate account charges, and sales charges imposed by the insurance company separate accounts. Such expenses would reduce the overall returns shown.
Growth of a hypothetical $10,000 investment(t)
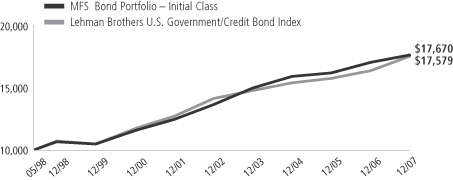
Total returns through 12/31/07
Average Annual Total Returns
| | | | | | | | | | | | |
| | | Share class | | Class inception date | | 1-yr | | 5-yr | | Life (t) | | |
| | | Initial Class | | 5/06/98 | | 3.53% | | 5.26% | | 6.07% | | |
| | | Service Class | | 8/24/01 | | 3.28% | | 4.98% | | 5.89% | | |
Comparative Index
| | | | | | | | | | | | |
| | | Lehman Brothers U.S. Government/Credit Bond Index (f) | | 7.23% | | 4.43% | | 6.00% | | |
| (f) | Source: FactSet Research Systems Inc. |
| (t) | For the period from the commencement of the fund’s investment operations, May 6, 1998, through the stated period end. |
Index Definition
Lehman Brothers U.S. Government/Credit Bond Index – a market capitalization-weighted index that measures the performance of investment-grade debt obligations of the U.S. Treasury and U.S. government agencies, as well as U.S. corporate and foreign debentures and secured notes that meet specified maturity, liquidity, and quality requirements.
It is not possible to invest directly in an index.
Notes to Performance Summary
Service Class share performance includes the performance of Initial Class shares for periods prior to the inception of Service Class shares (blended performance). This blended performance figure has not been adjusted to take into account differences in the class-specific operating expenses (such as Rule 12b-1 fees). Because operating expenses of Service Class shares are generally higher than those of Initial Class shares, the blended Service Class shares performance shown is higher than it would have been had Service Class shares been offered for the entire period.
Performance results reflect any applicable expense subsidies and waivers in effect during the periods shown. Without such subsidies and waivers the fund’s performance results would be less favorable. Please see the prospectus for complete details. All results are historical and assume the reinvestment of any dividends and capital gains distributions.
From time to time the fund may receive proceeds from litigation settlements, without which performance would be lower.
4
EXPENSE TABLE
Fund Expenses Borne by the Contract Holders During the Period,
July 1, 2007 through December 31, 2007
As a contract holder of the fund, you incur ongoing costs, including management fees; distribution (12b-1) fees; and other fund expenses. This example is intended to help you understand your ongoing costs (in dollars) of investing in the fund and to compare these costs with the ongoing costs of investing in other mutual funds.
The example is based on an investment of $1,000 invested at the beginning of the period and held for the entire period July 1, 2007 through December 31, 2007.
Actual expenses
The first line for each share class in the following table provides information about actual account values and actual expenses. You may use the information in this line, together with the amount you invested, to estimate the expenses that you paid over the period. Simply divide your account value by $1,000 (for example, an $8,600 account value divided by $1,000 = 8.6), then multiply the result by the number in the first line under the heading entitled “Expenses Paid During Period” to estimate the expenses you paid on your account during this period.
Hypothetical example for comparison purposes
The second line for each share class in the following table provides information about hypothetical account values and hypothetical expenses based on the fund’s actual expense ratio and an assumed rate of return of 5% per year before expenses, which is not the fund’s actual return. The hypothetical account values and expenses may not be used to estimate the actual ending account balance or expenses you paid for the period. You may use this information to compare the ongoing costs of investing in the fund and other funds. To do so, compare this 5% hypothetical example with the 5% hypothetical examples that appear in the shareholder reports of the other funds.
Please note that the expenses shown in the table are meant to highlight the fund’s ongoing costs only and do not take into account the fees and expenses imposed under the variable contracts through which your investment in the fund is made. Therefore, the second line for each share class in the table is useful in comparing ongoing costs associated with an investment in vehicles (such as the fund) which fund benefits under variable annuity and variable life insurance contracts and to qualified pension and retirement plans only, and will not help you determine the relative total costs of investing in the fund through variable annuity and variable life insurance contracts. If the fees and expenses imposed under the variable contracts were included, your costs would have been higher.
| | | | | | | | | | |
Share Class | | | | Annualized
Expense Ratio | | Beginning
Account Value
7/01/07 | | Ending
Account Value
12/31/07 | | Expenses Paid
During Period (p)
7/01/07-12/31/07 |
| Initial Class | | Actual | | 0.72% | | $1,000.00 | | $1,025.40 | | $3.68 |
| | Hypothetical (h) | | 0.72% | | $1,000.00 | | $1,021.58 | | $3.67 |
| Service Class | | Actual | | 0.97% | | $1,000.00 | | $1,023.70 | | $4.95 |
| | Hypothetical (h) | | 0.97% | | $1,000.00 | | $1,020.32 | | $4.94 |
| (h) | 5% class return per year before expenses. |
| (p) | Expenses paid is equal to each class’ annualized expense ratio, as shown above, multiplied by the average account value over the period, multiplied by the number of days in the period, divided by the number of days in the year. |
5
PORTFOLIO OF INVESTMENTS – 12/31/07
The Portfolio of Investments is a complete list of all securities owned by your fund.
It is categorized by broad-based asset classes.
| | | | | |
| Issuer | | Shares/Par | | Value ($) |
| | | | | |
| BONDS – 98.7% | | | | | |
| Asset Backed & Securitized – 9.0% | | | | | |
| ARCap REIT, Inc., CDO, “G”, 6.1%, 2045 (n) | | 350,000 | | $ | 175,000 |
| Asset Securitization Corp., FRN, 8.335%, 2029 | | 594,742 | | | 650,438 |
| Bayview Financial Revolving Mortgage Loan Trust, FRN, 5.6%, 2040 (z) | | 470,000 | | | 376,000 |
| Brazilian Merchant Voucher Receivables Ltd., 5.911%, 2011 (z) | | 722,562 | | | 715,336 |
| Citigroup/Deutsche Bank Commercial Mortgage Trust, FRN, 5.555%, 2049 | | 472,000 | | | 387,113 |
| Commercial Mortgage Acceptance Corp., FRN, 1.023%, 2030 (i) | | 5,703,413 | | | 128,862 |
| Countrywide Asset-Backed Certificates, FRN, 4.575%, 2035 | | 33,776 | | | 33,542 |
| Credit Suisse Mortgage Capital Certificate, 5.343%, 2039 | | 890,177 | | | 864,610 |
| CRIIMI MAE Commercial Mortgage Trust, CDO, 7%, 2033 (n) | | 65,875 | | | 66,343 |
| DLJ Commercial Mortgage Corp., 6.04%, 2031 (z) | | 625,000 | | | 635,642 |
| Falcon Franchise Loan LLC, 6.5%, 2014 (z) | | 440,000 | | | 301,818 |
| Falcon Franchise Loan LLC, FRN, 3.614%, 2025 (i)(z) | | 2,406,379 | | | 302,169 |
| First Union-Lehman Brothers Commercial Mortgage Trust, 7%, 2029 (n) | | 489,524 | | | 522,456 |
| GE Commercial Mortgage Corp., FRN, 5.339%, 2044 | | 440,000 | | | 433,515 |
| GMAC Commercial Mortgage Securities, Inc., FRN, 6.02%, 2033 (z) | | 800,000 | | | 809,245 |
| GMAC Commercial Mortgage Securities, Inc., FRN, 7.662%, 2034 (n) | | 825,000 | | | 883,951 |
| Greenwich Capital Commercial Funding Corp., 4.305%, 2042 | | 589,156 | | | 581,847 |
| Greenwich Capital Commercial Funding Corp., FRN, 5.911%, 2038 | | 350,000 | | | 357,413 |
| JPMorgan Chase Commercial Mortgage Securities Corp., 5.372%, 2047 | | 820,000 | | | 800,366 |
| JPMorgan Chase Commercial Mortgage Securities Corp., FRN, 5.344%, 2042 (n) | | 765,072 | | | 670,395 |
| JPMorgan Chase Commercial Mortgage Securities Corp., FRN, 5.364%, 2043 | | 1,168,381 | | | 1,107,576 |
| JPMorgan Chase Commercial Mortgage Securities Corp., FRN, 5.855%, 2043 | | 681,261 | | | 689,582 |
| JPMorgan Chase Commercial Mortgage Securities Corp., FRN, 5.038%, 2046 | | 880,000 | | | 855,271 |
| JPMorgan Chase Commercial Mortgage Securities Corp., FRN, 5.532%, 2047 | | 218,640 | | | 179,736 |
| KKR Financial CLO Ltd., “C”, CDO, FRN, 6.82%, 2021 (n) | | 505,395 | | | 415,435 |
| Lehman Brothers Commercial Conduit Mortgage Trust, FRN, 0.741%, 2030 (i) | | 2,812,463 | | | 107,490 |
| Merrill Lynch Mortgage Trust, FRN, 5.829%, 2017 | | 234,000 | | | 209,710 |
| Morgan Stanley Capital I, Inc., 5.72%, 2032 | | 265,891 | | | 269,293 |
| Morgan Stanley Capital I, Inc., FRN, 0.522%, 2030 (i)(n) | | 19,051,040 | | | 161,229 |
| | | | | |
| Issuer | | Shares/Par | | Value ($) |
| | | | | |
| BONDS – continued | | | | | |
| Asset Backed & Securitized – continued | | | | | |
| Mortgage Capital Funding, Inc., FRN, 0.59%, 2031 (i) | | 5,122,887 | | $ | 12,131 |
| Nomura Asset Acceptance Corp., FRN, 4.423%, 2034 | | 158,651 | | | 157,983 |
| Prudential Securities Secured Financing Corp., FRN, 7.243%, 2013 (z) | | 567,000 | | | 590,097 |
| Spirit Master Funding LLC, 5.05%, 2023 (z) | | 445,831 | | | 437,369 |
| Wachovia Bank Commercial Mortgage Trust, FRN, 4.847%, 2041 | | 551,473 | | | 531,642 |
| Wachovia Bank Commercial Mortgage Trust, FRN, 5.513%, 2043 | | 154,000 | | | 134,482 |
| Wachovia Bank Commercial Mortgage Trust, FRN, 5.961%, 2045 | | 680,000 | | | 696,532 |
| Wachovia Bank Commercial Mortgage Trust, FRN, 5.776%, 2047 | | 277,000 | | | 229,407 |
| | | | | |
| | | | $ | 16,481,026 |
| | | | | |
| Automotive – 0.8% | | | | | |
| Ford Motor Credit Co. LLC, 9.75%, 2010 | | 530,000 | | $ | 505,727 |
| Johnson Controls, Inc., 5.5%, 2016 | | 1,050,000 | | | 1,034,605 |
| | | | | |
| | | | $ | 1,540,332 |
| | | | | |
| Broadcasting – 1.6% | | | | | |
| CBS Corp., 6.625%, 2011 | | 933,000 | | $ | 967,735 |
| Clear Channel Communications, Inc., 7.65%, 2010 | | 671,000 | | | 689,249 |
| Clear Channel Communications, Inc., 6.25%, 2011 | | 480,000 | | | 434,400 |
| News America Holdings, 8.5%, 2025 | | 770,000 | | | 917,598 |
| | | | | |
| | | | $ | 3,008,982 |
| | | | | |
| Brokerage & Asset Managers – 3.2% | | | | | |
| Bear Stearns Cos., Inc., 5.85%, 2010 | | 1,050,000 | | $ | 1,043,484 |
| Goldman Sachs Group, Inc., 5.625%, 2017 | | 1,059,000 | | | 1,034,194 |
| INVESCO PLC, 4.5%, 2009 | | 1,097,000 | | | 1,082,431 |
| Lehman Brothers Holdings, Inc., 6.2%, 2014 | | 260,000 | | | 264,802 |
| Lehman Brothers Holdings, Inc., 6.5%, 2017 | | 480,000 | | | 485,691 |
| Merrill Lynch & Co., Inc., 6.05%, 2016 | | 979,000 | | | 961,937 |
| Morgan Stanley, 5.75%, 2016 | | 906,000 | | | 894,011 |
| | | | | |
| | | | $ | 5,766,550 |
| | | | | |
| Building – 0.8% | | | | | |
| American Standard Cos., Inc., 7.375%, 2008 | | 1,150,000 | | $ | 1,151,372 |
| American Standard Cos., Inc., 7.625%, 2010 | | 302,000 | | | 317,120 |
| | | | | |
| | | | $ | 1,468,492 |
| | | | | |
| Business Services – 0.7% | | | | | |
| Xerox Corp., 6.4%, 2016 | | 1,020,000 | | $ | 1,043,749 |
| Xerox Corp., 6.75%, 2017 | | 195,000 | | | 203,252 |
| | | | | |
| | | | $ | 1,247,001 |
| | | | | |
| Cable TV – 1.1% | | | | | |
| Comcast Corp., 6.45%, 2037 | | 196,000 | | $ | 199,563 |
| Cox Communications, Inc., 4.625%, 2013 | | 994,000 | | | 950,970 |
| TCI Communications, Inc., 9.8%, 2012 | | 439,000 | | | 507,066 |
6
Portfolio of Investments – continued
| | | | | |
| Issuer | | Shares/Par | | Value ($) |
| | | | | |
| BONDS – continued | | | | | |
| Cable TV – continued | | | | | |
| Time Warner Entertainment Co. LP, 8.375%, 2033 | | 266,000 | | $ | 320,426 |
| | | | | |
| | | | $ | 1,978,025 |
| | | | | |
| Computer Software – 0.6% | | | | | |
| Seagate Technology HDD Holdings, 6.375%, 2011 | | 1,070,000 | | $ | 1,055,288 |
| | | | | |
| Conglomerates – 0.3% | | | | | |
| Kennametal, Inc., 7.2%, 2012 | | 526,000 | | $ | 571,614 |
| | | | | |
| Construction – 0.7% | | | | | |
| D.R. Horton, Inc., 7.875%, 2011 | | 764,000 | | $ | 724,118 |
| D.R. Horton, Inc., 5.625%, 2014 | | 269,000 | | | 225,938 |
| Pulte Homes, Inc., 7.875%, 2011 | | 330,000 | | | 317,481 |
| | | | | |
| | | | $ | 1,267,537 |
| | | | | |
| Consumer Goods & Services – 1.2% | | | | | |
| Fortune Brands, Inc., 5.125%, 2011 | | 940,000 | | $ | 938,093 |
| Service Corp. International, 7.375%, 2014 | | 300,000 | | | 303,375 |
| Western Union Co., 5.4%, 2011 | | 1,023,000 | | | 1,030,827 |
| | | | | |
| | | | $ | 2,272,295 |
| | | | | |
| Defense Electronics – 1.4% | | | | | |
| L-3 Communications Corp., 6.375%, 2015 | | 1,115,000 | | $ | 1,098,275 |
| Litton Industries, Inc., 8%, 2009 | | 1,300,000 | | | 1,380,456 |
| | | | | |
| | | | $ | 2,478,731 |
| | | | | |
| Electronics – 0.4% | | | | | |
| Tyco Electronics Ltd., 6.55%, 2017 (n) | | 360,000 | | $ | 370,286 |
| Tyco Electronics Ltd., 7.125%, 2037 (z) | | 260,000 | | | 273,714 |
| | | | | |
| | | | $ | 644,000 |
| | | | | |
| Emerging Market Quasi-Sovereign – 0.5% | | | | | |
| Corporacion Nacional del Cobre de Chile, 6.375%, 2012 (n) | | 342,000 | | $ | 366,062 |
| Gazprom International S.A., 6.51%, 2022 (n) | | 460,000 | | | 437,322 |
| OAO Gazprom, 9.625%, 2013 | | 80,000 | | | 90,616 |
| | | | | |
| | | | $ | 894,000 |
| | | | | |
| Emerging Market Sovereign – 0.4% | | | | | |
| Gabonese Republic, 8.2%, 2017 (z) | | 364,000 | | $ | 376,740 |
| Republic of Argentina, FRN, 5.389%, 2012 | | 467,500 | | | 415,731 |
| | | | | |
| | | | $ | 792,471 |
| | | | | |
| Energy – Independent – 0.8% | | | | | |
| Ocean Energy, Inc., 7.25%, 2011 | | 1,400,000 | | $ | 1,521,524 |
| | | | | |
| Energy – Integrated – 0.7% | | | | | |
| TNK-BP Ltd., 6.875%, 2011 (n) | | 1,360,000 | | $ | 1,343,000 |
| | | | | |
| Entertainment – 0.6% | | | | | |
| Time Warner, Inc., 9.125%, 2013 | | 916,000 | | $ | 1,040,647 |
| Time Warner, Inc., 6.5%, 2036 | | 110,000 | | | 107,031 |
| | | | | |
| | | | $ | 1,147,678 |
| | | | | |
| Financial Institutions – 5.1% | | | | | |
American Express Centurion Bank,
5.55%, 2012 | | 840,000 | | $ | 854,750 |
| American Express Co., 6.15%, 2017 | | 1,000,000 | | | 1,026,274 |
| Capmark Financial Group, Inc., 5.875%, 2012 (n) | | 1,030,000 | | | 815,311 |
| | | | | |
| Issuer | | Shares/Par | | Value ($) |
| | | | | |
| BONDS – continued | | | | | |
| Financial Institutions – continued | | | | | |
| CIT Group, Inc., 6.1% to 2017, FRN to 2067 | | 150,000 | | $ | 108,915 |
| Countrywide Financial Corp., 6.25%, 2016 | | 931,000 | | | 535,854 |
| Deluxe Corp., 5%, 2012 | | 535,000 | | | 472,138 |
| Deluxe Corp., 5.125%, 2014 | | 260,000 | | | 220,350 |
| Deluxe Corp., 7.375%, 2015 | | 260,000 | | | 258,700 |
General Motors Acceptance Corp.,
5.85%, 2009 | | 696,000 | | | 665,610 |
General Motors Acceptance Corp.,
7.25%, 2011 | | 739,000 | | | 647,762 |
| HSBC Finance Corp., 6.75%, 2011 | | 550,000 | | | 570,551 |
| HSBC Finance Corp., 5.5%, 2016 | | 1,402,000 | | | 1,368,261 |
| ILFC E-Capital Trust I, 5.9% to 2010, FRN to 2065 (n) | | 1,000,000 | | | 987,244 |
| International Lease Finance Corp., 5.625%, 2013 | | 524,000 | | | 525,218 |
| Residential Capital LLC, 6.5%, 2012 | | 510,000 | | | 313,650 |
| | | | | |
| | | | $ | 9,370,588 |
| | | | | |
| Food & Beverages – 2.6% | | | | | |
| Diageo Capital PLC, 5.5%, 2016 | | 1,070,000 | | $ | 1,062,583 |
| Diageo Capital PLC, 5.75%, 2017 | | 500,000 | | | 502,840 |
| General Mills, Inc., 5.65%, 2012 | | 610,000 | | | 619,953 |
| Miller Brewing Co., 5.5%, 2013 (n) | | 1,494,000 | | | 1,513,867 |
| Tyson Foods, Inc., 6.85%, 2016 | | 950,000 | | | 974,847 |
| | | | | |
| | | | $ | 4,674,090 |
| | | | | |
| Food & Drug Stores – 0.6% | | | | | |
| CVS Caremark Corp., 5.75%, 2017 | | 1,040,000 | | $ | 1,046,693 |
| | | | | |
| Forest & Paper Products – 0.7% | | | | | |
| MeadWestvaco Corp., 6.8%, 2032 | | 524,000 | | $ | 493,512 |
| Stora Enso Oyj, 7.25%, 2036 (n) | | 823,000 | | | 821,690 |
| | | | | |
| | | | $ | 1,315,202 |
| | | | | |
| Gaming & Lodging – 2.2% | | | | | |
| Host Marriott LP, 6.75%, 2016 | | 1,110,000 | | $ | 1,093,350 |
| MGM Mirage, Inc., 8.375%, 2011 | | 930,000 | | | 950,925 |
| Royal Caribbean Cruises Ltd., 8%, 2010 | | 705,000 | | | 728,847 |
| Starwood Hotels & Resorts Worldwide, Inc., 7.875%, 2012 | | 575,000 | | | 610,997 |
| Wyndham Worldwide Corp., 6%, 2016 | | 670,000 | | | 635,428 |
| | | | | |
| | | | $ | 4,019,547 |
| | | | | |
| Insurance – 1.6% | | | | | |
| American International Group, Inc., 6.25%, 2037 | | 810,000 | | $ | 724,479 |
| ING Groep N.V., 5.775% to 2015, FRN to 2049 | | 902,000 | | | 833,895 |
| UnumProvident Corp., 6.85%, 2015 (n) | | 1,340,000 | | | 1,388,879 |
| | | | | |
| | | | $ | 2,947,253 |
| | | | | |
| Insurance – Property & Casualty – 1.5% | | | | | |
| AXIS Capital Holdings Ltd., 5.75%, 2014 | | 605,000 | | $ | 593,035 |
| Chubb Corp., 6.375% to 2017, FRN to 2037 | | 660,000 | | | 643,772 |
| Fund American Cos., Inc., 5.875%, 2013 | | 993,000 | | | 995,143 |
| ZFS Finance USA Trust V, 6.5% to 2017, FRN to 2037 (n) | | 580,000 | | | 535,449 |
| | | | | |
| | | | $ | 2,767,399 |
| | | | | |
| Machinery & Tools – 0.6% | | | | | |
| Case New Holland, Inc., 7.125%, 2014 | | 1,095,000 | | $ | 1,092,263 |
| | | | | |
| Major Banks – 6.5% | | | | | |
| BAC Capital Trust XIV, 5.63% to 2012, FRN to 2049 | | 970,000 | | $ | 860,788 |
7
Portfolio of Investments – continued
| | | | | |
| Issuer | | Shares/Par | | Value ($) |
| | | | | |
| BONDS – continued | | | | | |
| Major Banks – continued | | | | | |
| Barclays Bank PLC, 8.55% to 2011, FRN to 2049 (n) | | 1,682,000 | | $ | 1,771,642 |
| BNP Paribas, 5.186% to 2015, FRN to 2049 (n) | | 1,147,000 | | | 1,043,911 |
| BNP Paribas, 7.195% to 2037, FRN to 2049 (n) | | 700,000 | | | 690,137 |
| MUFG Capital Finance 1 Ltd., 6.346% to 2016, FRN to 2049 | | 1,186,000 | | | 1,123,301 |
| Natexis AMBS Co. LLC, 8.44% to 2008, FRN to 2049 (n) | | 1,637,000 | | | 1,670,323 |
| PNC Funding Corp., 5.625%, 2017 | | 710,000 | | | 691,011 |
| Royal Bank of Scotland Group PLC, 9.118%, 2049 | | 348,000 | | | 372,029 |
| Royal Bank of Scotland Group PLC, 6.99% to 2017, FRN to 2049 (n) | | 570,000 | | | 568,285 |
| UniCredito Italiano Capital Trust II, 9.2% to 2010, FRN to 2049 (n) | | 851,000 | | | 927,392 |
| Unicredito Luxembourg Finance S.A., 6%, 2017 (n) | | 1,020,000 | | | 1,009,921 |
| Wachovia Corp., 6.605%, 2025 | | 1,270,000 | | | 1,262,620 |
| | | | | |
| | | | $ | 11,991,360 |
| | | | | |
| Medical & Health Technology & Services – 2.7% | | | |
| Covidien Ltd., 6%, 2017 (n) | | 410,000 | | $ | 424,241 |
| Covidien Ltd., 6.55%, 2037 (n) | | 520,000 | | | 540,039 |
| Fisher Scientific International, Inc., 6.125%, 2015 | | 1,440,000 | | | 1,430,400 |
| HCA, Inc., 8.75%, 2010 | | 838,000 | | | 845,333 |
| Hospira, Inc., 5.55%, 2012 | | 210,000 | | | 213,544 |
| Hospira, Inc., 6.05%, 2017 | | 760,000 | | | 763,650 |
| McKesson Corp., 5.7%, 2017 | | 770,000 | | | 765,599 |
| | | | | |
| | | | $ | 4,982,806 |
| | | | | |
| Metals & Mining – 0.9% | | | | | |
| International Steel Group, Inc., 6.5%, 2014 | | 945,000 | | $ | 970,351 |
| Vale Overseas Ltd., 6.25%, 2017 | | 663,000 | | | 665,059 |
| | | | | |
| | | | $ | 1,635,410 |
| | | | | |
| Mortgage Backed – 9.1% | | | | | |
| Fannie Mae, 5.5%, 2017 – 2035 | | 5,447,295 | | $ | 5,487,064 |
| Fannie Mae, 6%, 2017 – 2035 | | 1,918,055 | | | 1,953,658 |
| Fannie Mae, 4.5%, 2018 | | 1,548,136 | | | 1,523,247 |
| Fannie Mae, 7.5%, 2030 – 2031 | | 232,425 | | | 247,977 |
| Fannie Mae, 6.5%, 2032 | | 792,018 | | | 818,795 |
| Freddie Mac, 6%, 2021 – 2034 | | 669,178 | | | 682,334 |
| Freddie Mac, 5%, 2025 – 2035 | | 4,261,209 | | | 4,171,895 |
| Freddie Mac, 5.5%, 2035 | | 1,808,618 | | | 1,805,585 |
| | | | | |
| | | | $ | 16,690,555 |
| | | | | |
| Municipals – 1.1% | | | | | |
| Texas Transportation Commission Mobility Fund, 5%, 2037 | | 1,850,000 | | $ | 1,924,870 |
| | | | | |
| Natural Gas – Pipeline – 3.4% | | | | | |
| CenterPoint Energy Resources Corp., 7.875%, 2013 | | 1,383,000 | | $ | 1,518,516 |
| CenterPoint Energy, Inc., 5.95%, 2017 | | 450,000 | | | 445,816 |
| Enterprise Products Partners LP, 6.3%, 2017 | | 540,000 | | | 552,505 |
| Intergas Finance B.V., 6.375%, 2017 (n) | | 144,000 | | | 129,240 |
| | | | | |
| Issuer | | Shares/Par | | Value ($) |
| | | | | |
| BONDS – continued | | | | | |
| Natural Gas – Pipeline – continued | | | | | |
| Kinder Morgan Energy Partners LP, 5.125%, 2014 | | 410,000 | | $ | 399,483 |
| Kinder Morgan Energy Partners LP, 7.4%, 2031 | | 581,000 | | | 625,584 |
| Spectra Energy Capital LLC, 8%, 2019 | | 942,000 | | | 1,085,216 |
| Williams Cos., Inc., 7.125%, 2011 | | 1,349,000 | | | 1,424,881 |
| | | | | |
| | | | $ | 6,181,241 |
| | | | | |
| Network & Telecom – 4.1% | | | | | |
| AT&T, Inc., 5.1%, 2014 | | 1,361,000 | | $ | 1,346,920 |
| AT&T, Inc., 6.3%, 2038 | | 350,000 | | | 355,598 |
| CenturyTel, Inc., 8.375%, 2010 | | 30,000 | | | 32,653 |
| Deutsche Telekom International Finance B.V., 8%, 2010 | | 548,000 | | | 585,040 |
| Telecom Italia Capital, 6.2%, 2011 | | 930,000 | | | 955,787 |
| Telefonica Emisiones S.A.U., 7.045%, 2036 | | 550,000 | | | 614,782 |
| Telefonica Europe B.V., 7.75%, 2010 | | 981,000 | | | 1,050,016 |
| TELUS Corp., 8%, 2011 | | 1,734,000 | | | 1,878,735 |
| Verizon New York, Inc., 6.875%, 2012 | | 635,000 | | | 673,739 |
| | | | | |
| | | | $ | 7,493,270 |
| | | | | |
| Oil Services – 0.3% | | | | | |
| Weatherford International, Inc., 6.35%, 2017 (n) | | 440,000 | | $ | 454,809 |
| | | | | |
| Oils – 1.0% | | | | | |
| Premcor Refining Group, Inc., 7.5%, 2015 | | 1,690,000 | | $ | 1,750,282 |
| | | | | |
| Other Banks & Diversified Financials – 6.1% | | | |
| Alfa Diversified Payment Rights Finance Co. S.A., FRN, 7.694%, 2012 (z) | | 530,000 | | $ | 499,525 |
| Alfa Diversified Payment Rights Finance Co., FRN, 6.89%, 2011 (n) | | 530,400 | | | 511,200 |
| Banco Mercantil del Norte S.A., 5.875% to 2009, FRN to 2014 (n) | | 1,000,000 | | | 989,500 |
| Citigroup, Inc., 5%, 2014 | | 324,000 | | | 308,721 |
| Credit Suisse (USA), Inc., 4.875%, 2010 | | 1,389,000 | | | 1,406,596 |
| Deutsche Bank AG, 5.375%, 2012 | | 820,000 | | | 840,220 |
| Fifth Third Bancorp, 5.45%, 2017 | | 428,000 | | | 409,078 |
| Mizuho Capital Investment 1 Ltd., 6.686% to 2016, FRN to 2049 (n) | | 1,250,000 | | | 1,169,538 |
| Mizuho Financial Group, Inc., 5.79%, 2014 (n) | | 929,000 | | | 971,671 |
| Nordea Bank AB, 5.424% to 2015, FRN to 2049 (n) | | 700,000 | | | 632,876 |
| Resona Bank Ltd., 5.85% to 2016, FRN to 2049 (n) | | 1,051,000 | | | 977,064 |
| Russian Standard Finance S.A., 8.625%, 2011 (n) | | 454,000 | | | 410,870 |
| UBS Preferred Funding Trust V, 6.243% to 2016, FRN to 2049 | | 1,030,000 | | | 991,745 |
| UFJ Finance Aruba AEC, 6.75%, 2013 | | 1,028,000 | | | 1,116,788 |
| | | | | |
| | | | $ | 11,235,392 |
| | | | | |
| Printing & Publishing – 0.8% | | | | | |
| Dex Media West LLC, 9.875%, 2013 | | 659,000 | | $ | 685,360 |
| Idearc, Inc., 8%, 2016 | | 870,000 | | | 798,225 |
| | | | | |
| | | | $ | 1,483,585 |
| | | | | |
8
Portfolio of Investments – continued
| | | | | |
| Issuer | | Shares/Par | | Value ($) |
| | | | | |
| BONDS – continued | | | | | |
| Railroad & Shipping – 1.2% | | | | | |
| CSX Corp., 6.3%, 2012 | | 826,000 | | $ | 845,728 |
| Kansas City Southern de Mexico, 7.375%, 2014 (n) | | 330,000 | | | 320,925 |
| TFM S.A. de C.V., 9.375%, 2012 | | 968,000 | | | 1,013,980 |
| | | | | |
| | | | $ | 2,180,633 |
| | | | | |
| Real Estate – 3.0% | | | | | |
| ERP Operating LP, REIT, 5.75%, 2017 | | 970,000 | | $ | 923,687 |
| HRPT Properties Trust, REIT, 6.25%, 2016 | | 1,027,000 | | | 976,274 |
| Liberty Property Ltd. Partnership, REIT, 5.5%, 2016 | | 660,000 | | | 617,512 |
| ProLogis, REIT, 5.75%, 2016 | | 1,113,000 | | | 1,044,706 |
| ProLogis, REIT, 5.625%, 2016 | | 160,000 | | | 148,374 |
| Simon Property Group LP, REIT, 6.35%, 2012 | | 629,000 | | | 646,199 |
| Simon Property Group LP, REIT, 5.75%, 2015 | | 1,200,000 | | | 1,165,505 |
| | | | | |
| | | | $ | 5,522,257 |
| | | | | |
| Restaurants – 0.3% | | | | | |
| YUM! Brands, Inc., 8.875%, 2011 | | 466,000 | | $ | 514,011 |
| | | | | |
| Retailers – 1.1% | | | | | |
| Federated Retail Holdings, Inc., 5.35%, 2012 | | 480,000 | | $ | 467,662 |
| Home Depot, Inc., 5.875%, 2036 | | 900,000 | | | 759,511 |
| J.C. Penney Corp., Inc., 8%, 2010 | | 81,000 | | | 84,335 |
| Macy’s, Inc., 6.625%, 2011 | | 426,000 | | | 445,208 |
| Target Corp., 6.5%, 2037 | | 246,000 | | | 247,255 |
| | | | | |
| | | | $ | 2,003,971 |
| | | | | |
| Supermarkets – 0.9% | | | | | |
| Delhaize America, Inc., 9%, 2031 | | 360,000 | | $ | 416,223 |
| Kroger Co., 6.4%, 2017 | | 750,000 | | | 784,435 |
| Tesco PLC, 6.15%, 2037 (n) | | 410,000 | | | 400,545 |
| | | | | |
| | | | $ | 1,601,203 |
| | | | | |
| Supranational – 0.5% | | | | | |
| Corporacion Andina de Fomento, 6.875%, 2012 | | 481,000 | | $ | 513,239 |
| European Investment Bank, 5.125%, 2017 | | 357,000 | | | 372,439 |
| | | | | |
| | | | $ | 885,678 |
| | | | | |
| Telecommunications – Wireless – 1.3% | | | | | |
| Nextel Communications, Inc., 5.95%, 2014 | | 1,570,000 | | $ | 1,475,751 |
| Rogers Cable, Inc., 5.5%, 2014 | | 364,000 | | | 358,646 |
| Rogers Wireless, Inc., 7.25%, 2012 | | 535,000 | | | 579,883 |
| | | | | |
| | | | $ | 2,414,280 |
| | | | | |
| Telephone Services – 0.3% | | | | | |
| Embarq Corp., 7.082%, 2016 | | 540,000 | | $ | 556,406 |
| | | | | |
| Tobacco – 1.1% | | | | | |
| Reynolds American, Inc., 7.25%, 2012 | | 881,000 | | $ | 930,036 |
| Reynolds American, Inc., 6.75%, 2017 | | 1,100,000 | | | 1,133,000 |
| | | | | |
| | | | $ | 2,063,036 |
| | | | | |
| | | | | | |
| Issuer | | Shares/Par | | Value ($) |
| | | | | | |
| BONDS – continued | | | | | | |
| Transportation – Services – 0.5% | | | | | | |
| FedEx Corp., 9.65%, 2012 | | | 852,000 | | $ | 998,930 |
| | | | | | |
| U.S. Treasury Obligations – 4.1% | | | | | | |
| U.S. Treasury Bonds, 6.25%, 2023 | | | 963,000 | | $ | 1,152,967 |
| U.S. Treasury Bonds, 5.375%, 2031 | | | 1,374,000 | | | 1,548,005 |
| U.S. Treasury Notes, 4.75%, 2014 | | | 1,938,000 | | | 2,060,790 |
| U.S. Treasury Notes, 4.875%, 2016 | | | 1,340,000 | | | 1,426,891 |
| U.S. Treasury Notes, TIPS, 2%, 2014 | | | 1,263,530 | | | 1,305,483 |
| | | | | | |
| | | | | $ | 7,494,136 |
| | | | | | |
| Utilities – Electric Power – 8.7% | | | | | | |
| AES Corp., 8.875%, 2011 | | | 1,327,000 | | $ | 1,383,398 |
| Allegheny Energy Supply Co. LLC, 8.25%, 2012 (n) | | | 1,110,000 | | | 1,184,925 |
| Beaver Valley Funding Corp., 9%, 2017 | | | 1,002,000 | | | 1,128,773 |
| DPL, Inc., 6.875%, 2011 | | | 614,000 | | | 653,076 |
| EDP Finance B.V., 6%, 2018 (n) | | | 1,010,000 | | | 985,089 |
| Empresa Nacional de Electricidad S.A., 8.35%, 2013 | | | 332,000 | | | 376,133 |
| Enel Finance International S.A., 6.8%, 2037 (z) | | | 750,000 | | | 753,529 |
| Enersis S.A., 7.375%, 2014 | | | 686,000 | | | 734,410 |
| Exelon Generation Co. LLC, 6.95%, 2011 | | | 1,790,000 | | | 1,867,631 |
| Mirant Americas Generation LLC, 8.3%, 2011 | | | 700,000 | | | 701,750 |
| NiSource Finance Corp., 7.875%, 2010 | | | 1,173,000 | | | 1,244,342 |
| NorthWestern Corp., 5.875%, 2014 | | | 680,000 | | | 670,229 |
| NRG Energy, Inc., 7.375%, 2016 | | | 1,505,000 | | | 1,467,369 |
| PSEG Power LLC, 5.5%, 2015 | | | 284,000 | | | 278,042 |
| Reliant Energy, Inc., 7.625%, 2014 | | | 1,030,000 | | | 1,019,700 |
| System Energy Resources, Inc., 5.129%, 2014 (n) | | | 674,375 | | | 690,668 |
| Waterford 3 Funding Corp., 8.09%, 2017 | | | 841,186 | | | 841,514 |
| | | | | | |
| | | | | $ | 15,980,578 |
| | | | | | |
Total Bonds
(Identified Cost, $183,728,021) | | | | | $ | 180,750,280 |
| | | | | | |
| | |
| SHORT-TERM OBLIGATIONS – 0.2% | | | | | | |
American Express Credit Corp.,
4.12%, due 1/02/08, at Amortized Cost and Value (y) | | $ | 343,000 | | $ | 342,961 |
| | | | | | |
Total Investments
(Identified Cost, $184,070,982) (k) | | | | | $ | 181,093,241 |
| | | | | | |
OTHER ASSETS, LESS
LIABILITIES – 1.1% | | | | | | 2,048,742 |
| | | | | | |
| Net Assets – 100.0% | | | | | $ | 183,141,983 |
| | | | | | |
| (i) | Interest only security for which the fund receives interest on notional principal (Par amount). Par amount shown is the notional principal and does not reflect the cost of the security. |
| (k) | As of December 31, 2007, the fund held securities fair valued in accordance with the policies adopted by the Board of Trustees, aggregating $178,533,118 and 98.59% of market value. An independent pricing service provided an evaluated bid for 98.54% of the market value. |
| (n) | Securities exempt from registration under Rule 144A of the Securities Act of 1933. These securities may be sold in the ordinary course of business in transactions exempt from registration, normally to qualified institutional buyers. At period end, the aggregate value of these securities was $29,948,730, representing 16.4% of net assets. |
| (y) | The rate shown represents an annualized yield at time of purchase. |
9
Portfolio of Investments – continued
| (z) | Restricted securities are not registered under the Securities Act of 1933 and are subject to legal restrictions on resale. These securities generally may be resold in transactions exempt from registration or to the public if the securities are subsequently registered. Disposal of these securities may involve time-consuming negotiations and prompt sale at an acceptable price may be difficult. The fund holds the following restricted securities: |
| | | | | | |
| Restricted Securities | | Acquisition
Date | | Acquisition
Cost | | Current
Market Value |
| Alfa Diversified Payment Rights Finance Co. S.A., FRN, 7.694%, 2012 | | 3/23/07 | | $530,000 | | $499,525 |
| Bayview Financial Revolving Mortgage Loan Trust, FRN, 5.6%, 2040 | | 3/01/06 | | 470,000 | | 376,000 |
| Brazilian Merchant Voucher Receivables Ltd., 5.911%, 2011 | | 7/02/03-3/08/07 | | 723,808 | | 715,336 |
| DLJ Commercial Mortgage Corp., 6.04%, 2031 | | 7/23/04 | | 615,454 | | 635,642 |
| Enel Finance International S.A., 6.8%, 2037 | | 9/13/07 | | 748,013 | | 753,529 |
| Falcon Franchise Loan LLC, 6.5%, 2014 | | 7/15/05 | | 381,666 | | 301,818 |
| Falcon Franchise Loan LLC, FRN, 3.614%, 2025 | | 1/29/03 | | 457,123 | | 302,169 |
| Gabonese Republic, 8.2%, 2017 | | 12/06/07 | | 373,100 | | 376,740 |
| GMAC Commercial Mortgage Securities, Inc., FRN, 6.02%, 2033 | | 3/20/02 | | 637,341 | | 809,245 |
| Prudential Securities Secured Financing Corp., FRN, 7.243%, 2013 | | 12/06/04 | | 629,481 | | 590,097 |
| Spirit Master Funding LLC, 5.05%, 2023 | | 10/04/05 | | 440,084 | | 437,369 |
| Tyco Electronics Ltd., 7.125%, 2037 | | 9/20/07 | | 258,814 | | 273,714 |
| Total Restricted Securities | | | | | | $6,071,184 |
| % of Net Assets | | | | | | 3.3% |
The following abbreviations are used in this report and are defined:
| CDO | Collateralized Debt Obligation |
| CLO | Collateralized Loan Obligation |
| FRN | Floating Rate Note. Interest rate resets periodically and may not be the rate reported at period end. |
| REIT | Real Estate Investment Trust |
| TIPS | Treasury Inflation Protected Security |
Derivative Contracts at 12/31/07
Swap Agreements at 12/31/07
| | | | | | | | | | | | | | |
| Expiration | | | | Notional
Amount | | Counterparty | | Cash Flows
to Receive | | Cash Flows to Pay | | Unrealized
Appreciation (Depreciation) | |
| Credit Default Swaps | | | | | | | | | | | | | | |
| 6/20/09 | | USD | | 500,000 | | JPMorgan Chase Bank | | 4.1% (fixed rate) | | (1) | | $ | (33,231 | ) |
| 12/20/12 | | USD | | 390,000 | | Goldman Sachs International | | (2) | | 1.55% (fixed rate) | | | (340 | ) |
| 12/20/12 | | USD | | 910,000 | | Merrill Lynch International | | 1.0% (fixed rate) | | (3) | | | (156,850 | ) |
| 12/20/12 | | USD | | 190,000 | | Morgan Stanley Capital Services, Inc. | | (4) | | 1.6% (fixed rate) | | | 1,368 | |
| 12/20/12 | | USD | | 390,000 | | Goldman Sachs International | | (5) | | 1.3% (fixed rate) | | | (2,863 | ) |
| 3/20/13 | | USD | | 800,000 | | Goldman Sachs International | | 2.72% (fixed rate) | | (6) | | | (16,282 | ) |
| 3/20/17 | | USD | | 380,000 | | Goldman Sachs International | | (7) | | 0.40% (fixed rate) | | | 848 | |
| 3/20/17 | | USD | | 500,000 | | JPMorgan Chase Bank | | (8) | | 0.38% (fixed rate) | | | 6,679 | |
| 3/20/17 | | USD | | 160,000 | | JPMorgan Chase Bank | | (9) | | 0.78% (fixed rate) | | | (748 | ) |
| 3/20/17 | | USD | | 160,000 | | JPMorgan Chase Bank | | (9) | | 0.80% (fixed rate) | | | (985 | ) |
| 3/20/17 | | USD | | 166,000 | | Merrill Lynch International | | (9) | | 0.81% (fixed rate) | | | (1,145 | ) |
| 6/20/17 | | USD | | 500,000 | | Merrill Lynch International | | (10) | | 0.91% (fixed rate) | | | 2,922 | |
| 6/20/17 | | USD | | 540,000 | | Morgan Stanley Capital Services, Inc. | | (11) | | 0.74% (fixed rate) | | | (3,851 | ) |
| | | | | | | | | | | | $ | (204,478 | ) |
| (1) | Fund to pay notional amount upon a defined credit event by Abitibi Consolidated, 8.375%, 4/01/15. |
| (2) | Fund to receive notional amount upon a defined credit event by Equity Residential, 5.75%, 6/15/17. |
| (3) | Fund to pay notional amount upon a defined credit event by MBIA, Inc., 6.625%, 10/01/28. |
| (4) | Fund to receive notional amount upon a defined credit event by ProLogis, 7.1%, 4/15/08. |
| (5) | Fund to receive notional amount upon a defined credit event by Simon Property Group, LP, 6.35%, 8/28/12. |
10
Portfolio of Investments – continued
| (6) | Fund to pay notional amount upon a defined credit event by AMBAC Financial Group Corp., 9.375%, 8/01/11. |
| (7) | Fund to receive notional amount upon a defined credit event by Dover Corp., 6.25%, 6/01/08. |
| (8) | Fund to receive notional amount upon a defined credit event by PPG Industries, Inc., 7.05%, 8/15/09. |
| (9) | Fund to receive notional amount upon a defined credit event by Waste Management, Inc., 7.375%, 8/01/10. |
| (10) | Fund to receive notional amount upon a defined credit event by New York Times Co., 4.61%, 9/26/12. |
| (11) | Fund to receive notional amount upon a defined credit event by Spectra Energy Capital LLC, 6.25%, 2/15/13. |
At December 31, 2007, the fund had sufficient cash and/or other liquid securities to cover any commitments under these derivative contracts.
See Notes to Financial Statements
11
FINANCIAL STATEMENTS | STATEMENT OF ASSETS AND LIABILITIES
This statement represents your fund’s balance sheet, which details the assets and liabilities comprising the total value of the fund.
| | | | | |
| At 12/31/07 | | | | | |
| Assets | | | | | |
| Investments, at value (identified cost, $184,070,982) | | $181,093,241 | | | |
| Interest receivable | | 2,579,009 | | | |
| Swaps, at value | | 11,817 | | | |
| Other assets | | 6,122 | | | |
| Total assets | | | | | $183,690,189 |
| Liabilities | | | | | |
| Payable to custodian | | $68,508 | | | |
| Payable for fund shares reacquired | | 178,029 | | | |
| Swaps, at value | | 216,295 | | | |
| Payable to affiliates | | | | | |
Management fee | | 12,010 | | | |
Distribution fees | | 2,119 | | | |
Administrative services fee | | 458 | | | |
Payable for independent trustees’ compensation | | 577 | | | |
| Accrued expenses and other liabilities | | 70,210 | | | |
| Total liabilities | | | | | $548,206 |
| Net assets | | | | | $183,141,983 |
| Net assets consist of | | | | | |
| Paid-in capital | | $180,145,859 | | | |
| Unrealized appreciation (depreciation) on investments | | (3,182,219 | ) | | |
| Accumulated net realized gain (loss) on investments | | (4,812,973 | ) | | |
| Undistributed net investment income | | 10,991,316 | | | |
| Net assets | | | | | $183,141,983 |
| Shares of beneficial interest outstanding | | | | | 16,866,511 |
| Initial Class Shares | | | | | |
Net assets | | $105,553,525 | | | |
Shares outstanding | | 9,691,956 | | | |
Net asset value per share | | | | | $10.89 |
| Service Class Shares | | | | | |
Net assets | | $77,588,458 | | | |
Shares outstanding | | 7,174,555 | | | |
Net asset value per share | | | | | $10.81 |
See Notes to Financial Statements
12
FINANCIAL STATEMENTS | STATEMENT OF OPERATIONS
This statement describes how much your fund earned in investment income and accrued in expenses. It also describes any gains and/or losses generated by fund operations.
| | | | | | |
| Year ended 12/31/07 | | | | | | |
| Net investment income | | | | | | |
| Income | | | | | | |
Interest | | $11,935,804 | | | | |
Foreign taxes withheld | | (158 | ) | | | |
| Total investment income | | | | | $11,935,646 | |
| Expenses | | | | | | |
Management fee | | $1,153,886 | | | | |
Distribution fees | | 191,829 | | | | |
Administrative services fee | | 50,426 | | | | |
Independent trustees’ compensation | | 18,307 | | | | |
Custodian fee | | 53,707 | | | | |
Shareholder communications | | 15,897 | | | | |
Auditing fees | | 54,248 | | | | |
Legal fees | | 6,448 | | | | |
Miscellaneous | | 21,018 | | | | |
| Total expenses | | | | | $1,565,766 | |
Fees paid indirectly | | (7,874 | ) | | | |
| Net expenses | | | | | $1,557,892 | |
| Net investment income | | | | | $10,377,754 | |
| Realized and unrealized gain (loss) on investments | | | | | | |
| Realized gain (loss) (identified cost basis) | | | | | | |
Investment transactions | | $(627,093 | ) | | | |
Futures contracts | | 37,056 | | | | |
Swap transactions | | 9,649 | | | | |
| Net realized gain (loss) on investments | | | | | $(580,388 | ) |
| Change in unrealized appreciation (depreciation) | | | | | | |
Investments | | $(3,055,974 | ) | | | |
Futures contracts | | (23,567 | ) | | | |
Swap transactions | | (196,121 | ) | | | |
| Net unrealized gain (loss) on investments | | | | | $(3,275,662 | ) |
| Net realized and unrealized gain (loss) on investments | | | | | $(3,856,050 | ) |
| Change in net assets from operations | | | | | $6,521,704 | |
See Notes to Financial Statements
13
FINANCIAL STATEMENTS | STATEMENTS OF CHANGES IN NET ASSETS
These statements describe the increases and/or decreases in net assets resulting from operations, any distributions, and any shareholder transactions.
| | | | | | |
For years ended 12/31 | | 2007 | | | 2006 | |
| Change in net assets | | | | | | |
| From operations | | | | | | |
| Net investment income | | $10,377,754 | | | $10,780,457 | |
| Net realized gain (loss) on investments | | (580,388 | ) | | (183,527 | ) |
| Net unrealized gain (loss) on investments | | (3,275,662 | ) | | (836,004 | ) |
| Change in net assets from operations | | $6,521,704 | | | $9,760,926 | |
| Distributions declared to shareholders | | | | | | |
| From net investment income | | | | | | |
Initial Class | | $(7,180,439 | ) | | $(8,023,602 | ) |
Service Class | | (4,365,847 | ) | | (4,507,857 | ) |
| From net realized gain on investments | | | | | | |
Initial Class | | — | | | (759,589 | ) |
Service Class | | — | | | (444,627 | ) |
| Total distributions declared to shareholders | | $(11,546,286 | ) | | $(13,735,675 | ) |
| Change in net assets from fund share transactions | | $(9,296,035 | ) | | $(18,018,509 | ) |
| Total change in net assets | | $(14,320,617 | ) | | $(21,993,258 | ) |
| Net assets | | | | | | |
| At beginning of period | | 197,462,600 | | | 219,455,858 | |
At end of period (including undistributed net investment
income of $10,991,316 and $11,549,389, respectively) | | $183,141,983 | | | $197,462,600 | |
See Notes to Financial Statements
14
FINANCIAL STATEMENTS | FINANCIAL HIGHLIGHTS
The financial highlights table is intended to help you understand the fund’s financial performance for the past 5 years. Certain information reflects financial results for a single fund share. The total returns in the table represent the rate by which an investor would have earned (or lost) on an investment in the fund share class (assuming reinvestment of all distributions) held for the entire period.
Initial Class
| | | | | | | | | | | | | | | |
| | | Years ended 12/31 | |
| | | 2007 | | | 2006 | | | 2005 | | | 2004 | | | 2003 | |
| Net asset value, beginning of period | | $11.19 | | | $11.40 | | | $12.15 | | | $12.39 | | | $11.85 | |
| Income (loss) from investment operations | | | | | | | | | | | | | | | |
| Net investment income (d) | | $0.60 | | | $0.59 | | | $0.59 | | | $0.61 | | | $0.62 | |
Net realized and unrealized gain (loss) on investments and foreign currency | | (0.21 | ) | | (0.04 | ) | | (0.39 | ) | | 0.09 | | | 0.51 | |
| Total from investment operations | | $0.39 | | | $0.55 | | | $0.20 | | | $0.70 | | | $1.13 | |
| Less distributions declared to shareholders | | | | | | | | | | | | | | | |
| From net investment income | | $(0.69 | ) | | $(0.69 | ) | | $(0.74 | ) | | $(0.76 | ) | | $(0.59 | ) |
| From net realized gain on investments | | — | | | (0.07 | ) | | (0.21 | ) | | (0.18 | ) | | — | |
| Total distributions declared to shareholders | | $(0.69 | ) | | $(0.76 | ) | | $(0.95 | ) | | $(0.94 | ) | | $(0.59 | ) |
| Net asset value, end of period | | $10.89 | | | $11.19 | | | $11.40 | | | $12.15 | | | $12.39 | |
| Total return (%) (k)(s) | | 3.53 | | | 5.20 | | | 1.75 | | | 6.25 | | | 9.72 | |
Ratios (%) (to average net assets) and Supplemental data: | | | | | | | | | | | | | | | |
| Expenses (f) | | 0.71 | | | 0.71 | | | 0.72 | | | 0.69 | | | 0.69 | |
| Net investment income | | 5.50 | | | 5.32 | | | 5.05 | | | 5.04 | | | 5.10 | |
| Portfolio turnover | | 42 | | | 47 | | | 52 | | | 50 | | | 96 | |
| Net assets at end of period (000 Omitted) | | $105,554 | | | $120,991 | | | $143,680 | | | $164,227 | | | $199,735 | |
See Notes to Financial Statements
15
Financial Highlights – continued
Service Class
| | | | | | | | | | | | | | | |
| | | Years ended 12/31 | |
| | | 2007 | | | 2006 | | | 2005 | | | 2004 | | | 2003 | |
| Net asset value, beginning of period | | $11.11 | | | $11.33 | | | $12.07 | | | $12.33 | | | $11.81 | |
| Net investment income (d) | | $0.57 | | | $0.56 | | | $0.56 | | | $0.58 | | | $0.57 | |
| Net realized and unrealized gain (loss) on investments | | (0.21 | ) | | (0.05 | ) | | (0.38 | ) | | 0.08 | | | 0.53 | |
| Total from investment operations | | $0.36 | | | $0.51 | | | $0.18 | | | $0.66 | | | $1.10 | |
| Less distributions declared to shareholders | | | | | | | | | | | | | | | |
| From net investment income | | $(0.66 | ) | | $(0.66 | ) | | $(0.71 | ) | | $(0.74 | ) | | $(0.58 | ) |
| From net realized gain on investments | | — | | | (0.07 | ) | | (0.21 | ) | | (0.18 | ) | | — | |
| Total distributions declared to shareholders | | $(0.66 | ) | | $(0.73 | ) | | $(0.92 | ) | | $(0.92 | ) | | $(0.58 | ) |
| Net asset value, end of period | | $10.81 | | | $11.11 | | | $11.33 | | | $12.07 | | | $12.33 | |
| Total return (%) (k)(s) | | 3.28 | | | 4.87 | | | 1.59 | | | 5.91 | | | 9.43 | |
Ratios (%) (to average net assets) and Supplemental data: | | | | | | | | | | | | | | | |
| Expenses (f) | | 0.96 | | | 0.96 | | | 0.97 | | | 0.94 | | | 0.94 | |
| Net investment income | | 5.25 | | | 5.07 | | | 4.81 | | | 4.80 | | | 4.77 | |
| Portfolio turnover | | 42 | | | 47 | | | 52 | | | 50 | | | 96 | |
| Net assets at end of period (000 Omitted) | | $77,588 | | | $76,471 | | | $75,776 | | | $73,572 | | | $66,091 | |
| (d) | Per share data are based on average shares outstanding. |
| (f) | Ratios do not reflect reductions from fees paid indirectly, if applicable. |
| (k) | The total return does not reflect expenses that apply to separate accounts. Inclusion of these charges would reduce the total return figures for all periods shown. |
| (s) | From time to time the fund may receive proceeds from litigation settlements, without which performance would be lower. |
See Notes to Financial Statements
16
NOTES TO FINANCIAL STATEMENTS
| (1) | | Business and Organization |
MFS Bond Portfolio (formerly Bond Series) (the fund) is a series of MFS Variable Insurance Trust II (formerly known as MFS/Sun Life Series Trust) (the trust). The trust is organized as a Massachusetts business trust and is registered under the Investment Company Act of 1940, as amended, as an open-end management investment company. The shares of the fund are sold to variable accounts established by insurance companies to fund benefits under variable contracts issued by such companies, and qualified retirement and pension plans.
| (2) | | Significant Accounting Policies |
General – The preparation of financial statements in conformity with U.S. generally accepted accounting principles requires management to make estimates and assumptions that affect the reported amounts of assets and liabilities, and disclosure of contingent assets and liabilities at the date of the financial statements and the reported amounts of revenues and expenses during the reporting period. Actual results could differ from those estimates. The fund can invest in foreign securities, including securities of emerging market issuers. Investments in foreign securities are vulnerable to the effects of changes in the relative values of the local currency and the U.S. dollar and to the effects of changes in each country’s legal, political, and economic environment. The markets of emerging markets countries are generally more volatile than the markets of developed countries with more mature economies. All of the risks of investing in foreign securities previously described are heightened when investing in emerging markets countries.
Investment Valuations – Debt instruments (other than short-term instruments), including restricted debt instruments, are generally valued at an evaluated or composite bid as reported by an independent pricing service. Short-term instruments with a maturity at issuance of 60 days or less may be valued at amortized cost, which approximates market value. Futures contracts are generally valued at last posted settlement price as reported by an independent pricing service on the market on which they are primarily traded. Futures contracts for which there were no trades that day for a particular position are generally valued at the closing bid quotation as reported by an independent pricing service on the market on which such futures contracts are primarily traded. Swaps are generally valued at an evaluated bid as reported by an independent pricing service. Securities and other assets generally valued on the basis of information from an independent pricing service may also be valued at a broker-dealer bid quotation. Values obtained from pricing services can utilize both dealer-supplied valuations and electronic data processing techniques, which take into account factors such as institutional-size trading in similar groups of securities, yield, quality, coupon rate, maturity, type of issue, trading characteristics, and other market data. The values of foreign securities and other assets and liabilities expressed in foreign currencies are converted to U.S. dollars using the mean of bid and asked prices for rates reported by an independent pricing service.
The Board of Trustees has delegated primary responsibility for determining or causing to be determined the value of the fund’s investments (including any fair valuation) to the adviser pursuant to valuation policies and procedures approved by the Board. If the adviser determines that reliable market quotations are not readily available, investments are valued at fair value as determined in good faith by the adviser in accordance with such procedures under the oversight of the Board of Trustees. Under the fund’s valuation policies and procedures, market quotations are not considered to be readily available for many types of debt instruments and certain types of derivatives. These investments are generally valued at fair value based on information from independent pricing services. In addition, investments may be valued at fair value if the adviser determines that an investment’s value has been materially affected by events occurring after the close of the exchange or market on which the investment is principally traded (such as foreign exchange or market) and prior to the determination of the fund’s net asset value, or after the halting of trading of a specific security where trading does not resume prior to the close of the exchange or market on which the security is principally traded. The adviser may rely on independent pricing services or other information (such as the correlation with price movements of similar securities in the same or other markets; the type, cost and investment characteristics of the security; the business and financial condition of the issuer; and trading and other market data) to assist in determining whether to fair value and at what value to fair value an investment. The value of an investment for purposes of calculating the fund’s net asset value can differ depending on the source and method used to determine value. When fair valuation is used, the value of investments used to determine the fund’s net asset value may differ from quoted or published prices for the same investments.
In September 2006, FASB Statement No. 157, Fair Value Measurements (the “Statement”) was issued, and is effective for fiscal years beginning after November 15, 2007 and for all interim periods within those fiscal years. This Statement provides a single definition of fair value, a hierarchy for measuring fair value and expanded disclosures about fair value measurements. Management is evaluating the application of the Statement to the fund, and believes the impact will be limited to expanded disclosures resulting from the adoption of this Statement in the fund’s financial statements.
Repurchase Agreements – The fund may enter into repurchase agreements with institutions that the fund’s investment adviser has determined are creditworthy. Each repurchase agreement is recorded at cost. The fund requires that the securities
17
Notes to Financial Statements – continued
collateral in a repurchase transaction be transferred to the custodian in a manner sufficient to enable the fund to obtain those securities in the event of a default under the repurchase agreement. The fund monitors, on a daily basis, the value of the collateral to ensure that its value, including accrued interest, is greater than amounts owed to the fund under each such repurchase agreement. The fund and other funds managed by Massachusetts Financial Services Company (MFS), may utilize a joint trading account for the purpose of entering into one or more repurchase agreements.
Inflation-Adjusted Debt Securities – The fund invests in inflation-adjusted debt securities issued by the U.S. Treasury. The fund may also invest in inflation-adjusted debt securities issued by U.S. Government agencies and instrumentalities other than the U.S. Treasury and by other entities such as U.S. and foreign corporations and foreign governments. The principal value of these debt securities is adjusted through income according to changes in the Consumer Price Index or another general price or wage index. These debt securities typically pay a fixed rate of interest, but this fixed rate is applied to the inflation-adjusted principal amount. The principal paid at maturity of the debt security is typically equal to the inflation-adjusted principal amount, or the security’s original par value, whichever is greater. Other types of inflation-adjusted securities may use other methods to adjust for other measures of inflation.
Derivative Risk – The fund may invest in derivatives for hedging or non-hedging purposes. While hedging can reduce or eliminate losses, it can also reduce or eliminate gains. When the fund uses derivatives as an investment to gain market exposure, or for hedging purposes, gains and losses from derivative instruments may be substantially greater than the derivative’s original cost. Derivative instruments include futures contracts and swap agreements.
Futures Contracts – The fund may enter into futures contracts for the delayed delivery of securities or currency, or contracts based on financial indices at a fixed price on a future date. In entering such contracts, the fund is required to deposit with the broker either in cash or securities an amount equal to a certain percentage of the contract amount. Subsequent payments are made or received by the fund each day, depending on the daily fluctuations in the value of the contract, and are recorded for financial statement purposes as unrealized gains or losses by the fund. Upon entering into such contracts, the fund bears the risk of interest or exchange rates or securities prices moving unexpectedly, in which case, the fund may not achieve the anticipated benefits of the futures contracts and may realize a loss.
Swap Agreements – The fund may enter into swap agreements. A swap is an exchange of cash payments between the fund and another party. Net cash payments are exchanged at specified intervals and are recorded as a realized gain or loss in the Statement of Operations. The value of the swap is adjusted daily and the change in value, including accruals of periodic amounts of interest to be paid or received, is recorded as unrealized appreciation or depreciation in the Statement of Operations. A liquidation payment received or made upon early termination is recorded as a realized gain or loss in the Statement of Operations. Collateral, in the form of cash or securities, may be required to be held in segregated accounts with the fund’s custodian in connection with these agreements. Risk of loss may exceed amounts recognized on the Statement of Assets and Liabilities. These risks include the possible lack of a liquid market, failure of the counterparty to perform under the terms of the agreements, and unfavorable market movement of the underlying instrument. All swap agreements entered into by the fund with the same counterparty are generally governed by a single master agreement, which provides for the netting of all amounts owed by the parties under the agreement upon the occurrence of an event of default, thereby reducing the credit risk to which such party is exposed.
The fund holds credit default swaps in which one party makes a stream of payments based on a fixed percentage applied to the notional amount to another party in exchange for the right to receive a specified return in the event of a default by a third party, such as a corporate issuer or foreign issuer, on its obligation. The fund may enter into credit default swaps to limit or to reduce its risk exposure to defaults of corporate and sovereign issuers or to create direct or synthetic short or long exposure to corporate debt securities or certain sovereign debt securities to which it is not otherwise exposed.
Indemnifications – Under the fund’s organizational documents, its officers and trustees may be indemnified against certain liabilities and expenses arising out of the performance of their duties to the fund. Additionally, in the normal course of business, the fund enters into agreements with service providers that may contain indemnification clauses. The fund’s maximum exposure under these agreements is unknown as this would involve future claims that may be made against the fund that have not yet occurred.
Investment Transactions and Income – Investment transactions are recorded on the trade date. Interest income is recorded on the accrual basis. All premium and discount is amortized or accreted for financial statement purposes in accordance with U.S. generally accepted accounting principles. All discount is accreted for tax reporting purposes as required by federal income tax regulations. The fund may receive proceeds from litigation settlements. Any proceeds received from litigation involving portfolio holdings are reflected in the Statement of Operations in realized gain/loss if the security has been disposed of by the fund or in unrealized gain/loss if the security is still held by the fund. Any other proceeds from litigation not related to portfolio holdings are reflected as other income in the Statement of Operations.
18
Notes to Financial Statements – continued
Fees Paid Indirectly – The fund’s custody fee may be reduced according to an arrangement that measures the value of cash deposited with the custodian by the fund. This amount, for the year ended December 31, 2007, is shown as a reduction of total expenses on the Statement of Operations.
Tax Matters and Distributions – The fund intends to qualify as a regulated investment company, as defined under Subchapter M of the Internal Revenue Code, and to distribute all of its taxable income, including realized capital gains. As a result, no provision for federal income taxes is required. The fund adopted the provisions of FASB Interpretation No. 48, Accounting for Uncertainty in Income Taxes (“the Interpretation”) on January 1, 2007. The Interpretation prescribes a minimum threshold for financial statement recognition of the benefit of a tax position taken or expected to be taken in a tax return. There was no impact resulting from the adoption of this Interpretation on the fund’s financial statements. Each of the fund’s federal tax returns for the prior three fiscal years remains subject to examination by the Internal Revenue Service. It is the fund’s policy to record interest and penalty charges on underpaid taxes associated with its tax positions as interest expense and other expense, respectively. No such charges were recorded in the current financial statements. Foreign taxes, if any, have been accrued by the fund in the accompanying financial statements.
Distributions to shareholders are recorded on the ex-dividend date. Income and capital gain distributions are determined in accordance with income tax regulations, which may differ from U.S. generally accepted accounting principles. Certain capital accounts in the financial statements are periodically adjusted for permanent differences in order to reflect their tax character. These adjustments have no impact on net assets or net asset value per share. Temporary differences which arise from recognizing certain items of income, expense, gain or loss in different periods for financial statement and tax purposes will reverse at some time in the future. Distributions in excess of net investment income or net realized gains are temporary overdistributions for financial statement purposes resulting from differences in the recognition or classification of income or distributions for financial statement and tax purposes.
Book/tax differences primarily relate to amortization and accretion of debt securities and derivative transactions.
The tax character of distributions declared to shareholders is as follows:
| | | | |
| | | 12/31/07 | | 12/31/06 |
| Ordinary income (including any short-term capital gains) | | $11,546,286 | | $12,531,880 |
| Long-term capital gain | | — | | 1,203,795 |
| Total distributions | | $11,546,286 | | $13,735,675 |
The federal tax cost and the tax basis components of distributable earnings were as follows:
| | | |
| As of 12/31/07 | | | |
| Cost of investments | | $185,535,288 | |
| Gross appreciation | | 1,746,548 | |
| Gross depreciation | | (6,188,595 | ) |
| Net unrealized appreciation (depreciation) | | $(4,442,047 | ) |
| Undistributed ordinary income | | 10,786,335 | |
| Capital loss carryforwards | | (3,369,890 | ) |
| Other temporary differences | | 21,726 | |
As of December 31, 2007, the fund had capital loss carryforwards available to offset future realized gains. Such losses expire as follows:
| | | |
| 12/31/14 | | $(2,113,205 | ) |
| 12/31/15 | | (1,256,685 | ) |
| | $(3,369,890 | ) |
Multiple Classes of Shares of Beneficial Interest – The fund offers multiple classes of shares, which differ in their respective distribution fees. All shareholders bear the common expenses of the fund based on daily net assets of each class, without distinction between share classes. Dividends are declared separately for each class. Differences in per share dividend rates are generally due to differences in separate class expenses.
| (3) | | Transactions with Affiliates |
Investment Adviser – The fund has an investment advisory agreement with MFS to provide overall investment management and related administrative services and facilities to the fund. The management fee was computed daily and paid monthly at the annual rate of 0.60% of the fund’s average daily net assets. Effective September 1, 2007, the investment adviser has agreed in writing to reduce its management fee to 0.50% of average daily net assets in excess of $1 billion. This written agreement may be rescinded only upon consent of the fund’s Board of Trustees. The management fee incurred for the year ended December 31, 2007 was equivalent to an annual effective rate of 0.60% of the fund’s average daily net assets.
19
Notes to Financial Statements – continued
Distributor – MFS Fund Distributors, Inc. (MFD), a wholly-owned subsidiary of MFS, is the distributor of shares of the fund. The Trustees have adopted a distribution plan for the Service Class shares pursuant to Rule 12b-1 under the Investment Company Act of 1940.
The fund’s distribution plan provides that the fund will pay MFD distribution fees equal to 0.25% per annum of its average daily net assets attributable to Service Class shares as partial consideration for services performed and expenses incurred by MFD and financial intermediaries in connection with the sale and distribution of the fund’s Service Class shares and the sale and distribution of the variable annuity or variable life insurance contracts investing indirectly in Service Class shares. MFD may subsequently pay all, or a portion, of the distribution fees to financial intermediaries.
Shareholder Servicing Agent – MFS Service Center, Inc. (MFSC), a wholly-owned subsidiary of MFS, has contracted to provide transfer agent and recordkeeping functions in connection with the issuance, transfer, and redemption of each class of shares of the fund under a Shareholder Servicing Agent Agreement. During the year ended December 31, 2007, MFSC did not receive a fee for this service.
Administrator – MFS provides certain financial, legal, shareholder communications, compliance, and other administrative services to the fund. Under an administrative services agreement, the fund partially reimburses MFS the costs incurred to provide these services. The fund is charged an annual fixed amount of $10,000 plus a fee based on average daily net assets.
The administrative services fee incurred for the year ended December 31, 2007 was equivalent to an annual effective rate of 0.0262% of the fund’s average daily net assets.
Trustees’ and Officers’ Compensation – The fund pays compensation to trustees in the form of a retainer, attendance fees, and additional compensation to the Board chairperson. The fund does not pay compensation directly to officers of the fund who are also officers of the investment adviser, all of whom receive remuneration for their services to the fund from MFS. Certain officers of the fund are officers or directors of MFS, MFD, and MFSC.
Other – This fund and certain other MFS funds (the funds) have entered into a services agreement (the Agreement) which provides for payment of fees by the funds to Tarantino LLC in return for the provision of services of an Independent Chief Compliance Officer (ICCO) for the funds. The ICCO is an officer of the funds and the sole member of Tarantino LLC. The funds can terminate the Agreement with Tarantino LLC at any time under the terms of the Agreement. MFS has agreed to bear all expenses associated with office space, other administrative support, and supplies provided to the ICCO. For the year ended December 31, 2007, the fee paid to Tarantino LLC was $924.
Purchases and sales of investments, other than purchased option transactions and short-term obligations, were as follows:
| | | | | | |
| | | Purchases | | Sales |
| U.S. government securities | | $ | 6,266,708 | | $ | 7,380,757 |
| Investments (non-U.S. government securities) | | $ | 72,869,334 | | $ | 79,220,269 |
20
Notes to Financial Statements – continued
| (5) | | Shares of Beneficial Interest |
The fund’s Declaration of Trust permits the Trustees to issue an unlimited number of full and fractional shares of beneficial interest. Transactions in fund shares were as follows:
| | | | | | | | | | | | |
| | | Year ended 12/31/07 | | | Year ended 12/31/06 | |
| | | Shares | | | Amount | | | Shares | | | Amount | |
| Shares sold | | | | | | | | | | | | |
Initial Class | | 729,940 | | | $8,016,412 | | | 511,623 | | | $5,696,273 | |
Service Class | | 1,038,873 | | | 11,209,759 | | | 757,341 | | | 8,481,493 | |
| | 1,768,813 | | | $19,226,171 | | | 1,268,964 | | | $14,177,766 | |
| Shares issued to shareholders in reinvestment of distributions | | | | | | | | | | | | |
Initial Class | | 667,327 | | | $7,180,439 | | | 830,955 | | | $8,783,191 | |
Service Class | | 408,023 | | | 4,365,847 | | | 471,216 | | | 4,952,484 | |
| | 1,075,350 | | | $11,546,286 | | | 1,302,171 | | | $13,735,675 | |
| Shares reacquired | | | | | | | | | | | | |
Initial Class | | (2,517,785 | ) | | $(27,442,705 | ) | | (3,130,238 | ) | | $(34,566,125 | ) |
Service Class | | (1,152,487 | ) | | (12,625,787 | ) | | (1,035,814 | ) | | (11,365,825 | ) |
| | (3,670,272 | ) | | $(40,068,492 | ) | | (4,166,052 | ) | | $(45,931,950 | ) |
| Net change | | | | | | | | | | | | |
Initial Class | | (1,120,518 | ) | | $(12,245,854 | ) | | (1,787,660 | ) | | $(20,086,661 | ) |
Service Class | | 294,409 | | | 2,949,819 | | | 192,743 | | | 2,068,152 | |
| | (826,109 | ) | | $(9,296,035 | ) | | (1,594,917 | ) | | $(18,018,509 | ) |
The fund and other funds managed by MFS participate in a $1 billion unsecured committed line of credit provided by a syndication of banks under a credit agreement. In addition, the fund and other funds managed by MFS have established uncommitted borrowing arrangements with certain banks. Borrowings may be made for temporary financing needs. Interest is charged to each fund, based on its borrowings, generally at a rate equal to the Federal Reserve funds rate plus 0.30%. In addition, a commitment fee, based on the average daily, unused portion of the committed line of credit, is allocated among the participating funds at the end of each calendar quarter. For the year ended December 31, 2007, the fund’s commitment fee and interest expense were $856 and $276, respectively, and are included in miscellaneous expense on the Statement of Operations.
21
REPORT OF INDEPENDENT REGISTERED PUBLIC ACCOUNTING FIRM
To the Board of Trustees of MFS Variable Insurance Trust II (formerly known as MFS/Sun Life Series Trust) and the Shareholders of MFS Bond Portfolio (formerly known as Bond Series):
We have audited the accompanying statement of assets and liabilities, including the portfolio of investments, of MFS Bond Portfolio (one of the portfolios comprising MFS Variable Insurance Trust II) (the “Trust”) as of December 31, 2007, and the related statement of operations for the year then ended, the statements of changes in net assets for each of the two years in the period then ended, and the financial highlights for each of the five years in the period then ended. These financial statements and financial highlights are the responsibility of the Trust’s management. Our responsibility is to express an opinion on these financial statements and financial highlights based on our audits.
We conducted our audits in accordance with the standards of the Public Company Accounting Oversight Board (United States). Those standards require that we plan and perform the audit to obtain reasonable assurance about whether the financial statements and financial highlights are free of material misstatement. The Trust is not required to have, nor were we engaged to perform, an audit of its internal control over financial reporting. Our audits included consideration of internal control over financial reporting as a basis for designing audit procedures that are appropriate in the circumstances, but not for the purpose of expressing an opinion on the effectiveness of the Trust’s internal control over financial reporting. Accordingly, we express no such opinion. An audit also includes examining, on a test basis, evidence supporting the amounts and disclosures in the financial statements, assessing the accounting principles used and significant estimates made by management, as well as evaluating the overall financial statement presentation. Our procedures included confirmation of securities owned as of December 31, 2007, by correspondence with the custodian and brokers; where replies were not received from brokers, we performed other auditing procedures. We believe that our audits provide a reasonable basis for our opinion.
In our opinion, such financial statements and financial highlights present fairly, in all material respects, the financial position of MFS Bond Portfolio as of December 31, 2007, the results of its operations for the year then ended, the changes in its net assets for each of the two years in the period then ended, and its financial highlights for each of the five years in the period then ended, in conformity with accounting principles generally accepted in the United States of America.
DELOITTE & TOUCHE LLP
Boston, Massachusetts
February 15, 2008
22
TRUSTEES AND OFFICERS – IDENTIFICATION AND BACKGROUND
The Trustees and officers of the Trust, as of February 1, 2008, are listed below, together with their principal occupations during the past five years. (Their titles may have varied during that period.) The address of each Trustee and officer is 500 Boylston Street, Boston, Massachusetts 02116.
| | | | | | |
Name, Date of Birth | | Position(s) Held
with Fund | | Trustee/Officer
Since(1) | | Principal Occupations During the Past Five Years &
Other Directorships(2) |
| INTERESTED TRUSTEE | | | | | | |
David D. Horn(3) (born 06/07/41) | | Trustee | | April 1986 | | Private investor; Retired; Sun Life Assurance Company of Canada, Former Senior Vice President and General Manager for the United States (until 1997); Retired: Sun Life Assurance Company of Canada, Director (until March 2004) |
| | |
| INDEPENDENT TRUSTEES | | | | |
J. Kermit Birchfield (born 01/08/40) | | Chairman | | May 1997 | | Consultant; Century Partners, Inc. (investments), Director (1988 to present); Displaytech, Inc. (technology), Director (1995 to present); Dessin Fournir LLC (furniture manufacturer), Director (2005 to present); Intermountain Gas Company, Inc. & Intermountain Industries, Inc. (oil & gas exploration and production) (1988 to present); Site Watch LLC (software to monitor oil tanks) Managing Director (2006 to present); Juridica Investments (fund investing in judicial matters) Director (2007 to present); Dairy Mart Convenience Stores, Inc. (convenience stores), Chairman (1997 to 2003) |
| | | |
Robert C. Bishop (born 01/13/43) | | Trustee | | May 2001 | | Autolmmune Inc. (pharmaceutical product licensing), Chairman, President and Chief Executive Officer (1992 to present); Caliper Life Sciences Corp. (laboratory analytical instruments), Director (2002 to present); Millipore Corporation (biopharmaceutical/research laboratory products), Director (1997 to present); Optobionics Corporation (ophthalmic devices), Director (2002 to 2007); Quintiles Transnational Corp. (contract research services), Director (until 2003) |
| | | |
Frederick H. Dulles (born 03/12/42) | | Trustee | | May 2001 | | Ten State International Law PLLC (law firm), Of Counsel (since 2006); Prudential Carolina Real Estate, (real estate), Broker (since 2006); Free Enterprise Foundation, Inc. (research institute), Director & Secretary (until 2008); Disher, Hamrick & Myers Residential, Inc. (real estate) Broker (until 2006); Frederick H. Dulles law practice (until 2006); Ten State Street LLP (law firm), Member (until 2005); McFadden, Pilkington & Ward LLP (solicitors and registered foreign lawyers), Member & Of Counsel (until 2003) |
| | | |
Marcia A. Kean (born 06/30/48) | | Trustee | | April 2005 | | Feinstein Kean Healthcare (consulting), Chief Executive Officer (since December 2002), Managing Director (prior to May 2001); Ardais Corporation (biotech products), Senior Vice President – Commercialization (February 2002 until November 2002) |
| | | |
Ronald G. Steinhart (born 06/15/40) | | Trustee | | May 2001 | | Private investor; Penske Automotive Group (automotive retailer), Director (2001 to present); Penson Worldwide, Inc. (securities clearance), Director (2006 to present); Animal Health International, Inc. (animal health products), Director (2007 to present); Texas Industries (concrete/aggregates/cement), Director (2007 to present); Carreker Corporation (technology consulting) Director (until 2005); Prentiss Properties Trust (real estate investment trust), Director (until 2006) |
| | | |
Haviland Wright (born 07/21/48) | | Trustee | | May 2001 | | Elixir Technologies Corporation (software) Director (2005 to present); Nano Loa Inc. (liquid crystal displays), Director (2003 to present); Silk Displays, Inc. (smart polymers) Director (2007 to present); Displaytech, Inc. (technology) Chairman and CEO (1995 – 2002) |
| | | |
| TRUSTEE EMERITUS | | | | | | |
Samuel Adams (born 10/19/25) | | Trustee Emeritus | | | | Retired; Kirkpatrick & Lockhart Preston Gates Ellis LLP (law firm), Of Counsel |
| | | |
| OFFICERS | | | | | | |
Maria F. Dwyer(4) (born 12/01/58) | | President | | November 2005 | | Massachusetts Financial Services Company, Executive Vice President and Chief Regulatory Officer (since March 2004); Fidelity Management & Research Company, Vice President (prior to March 2004); Fidelity Group of Funds, President and Treasurer (prior to March 2004) |
| | | |
Tracy Atkinson(4) (born 12/30/64) | | Treasurer | | September 2005 | | Massachusetts Financial Services Company, Senior Vice President (since September 2004); PricewaterhouseCoopers LLP, Partner (prior to September 2004) |
| | | |
Christopher R. Bohane(4) (born 01/18/74) | | Assistant Secretary and Assistant Clerk | | July 2005 | | Massachusetts Financial Services Company, Vice President and Senior Counsel (since April 2003); Kirkpatrick & Lockhart LLP (law firm), Associate (prior to April 2003) |
| | | |
Ethan D. Corey(4) (born 11/21/63) | | Assistant Secretary and Assistant Clerk | | July 2005 | | Massachusetts Financial Services Company, Senior Vice President and Associate General Counsel (since April 2006); Special Counsel (prior to April 2006); Dechert LLP (law firm), Counsel (prior to December 2004) |
23
Trustees and Officers – continued
| | | | | | |
Name, Date of Birth | | Position(s) Held
with Fund | | Trustee/Officer
Since(1) | | Principal Occupations During the Past Five Years &
Other Directorships(2) |
David L. DiLorenzo(4) (born 08/10/68) | | Assistant Treasurer | | July 2005 | | Massachusetts Financial Services Company, Vice President (since June 2005); JP Morgan Investor Services, Vice President (January 2001 to June 2005) |
| | | |
Timothy M. Fagan(4) (born 07/10/68) | | Assistant Secretary and Assistant Clerk | | September 2005 | | Massachusetts Financial Services Company, Vice President and Senior Counsel (since September 2005); John Hancock Advisers, LLC, Vice President and Chief Compliance Officer (September 2004 to August 2005) Senior Attorney (prior to September 2004); John Hancock Group of Funds, Vice President and Chief Compliance Officer (September 2004 to December 2004) |
| | | |
Mark D. Fischer(4) (born 10/27/70) | | Assistant Treasurer | | July 2005 | | Massachusetts Financial Services Company, Vice President (since May 2005); JP Morgan Investment Management Company, Vice President (prior to May 2005) |
| | | |
Brian E. Langenfeld(4) (born 03/07/73) | | Assistant Secretary and Assistant Clerk | | May 2006 | | Massachusetts Financial Services Company, Assistant Vice President and Counsel (since May 2006); John Hancock Advisers, LLC, Assistant Vice President and Counsel (May 2005 to April 2006); John Hancock Advisers, LLC, Attorney and Assistant Secretary (prior to May 2005) |
| | | |
Ellen Moynihan(4) (born 11/13/57) | | Assistant Treasurer | | May 1997 | | Massachusetts Financial Services Company, Senior Vice President |
| | | |
Susan S. Newton(4) (born 03/07/50) | | Assistant Secretary and Assistant Clerk | | May 2005 | | Massachusetts Financial Services Company, Senior Vice President and Assistant General Counsel (since April 2005); John Hancock Advisers, LLC, Senior Vice President, Secretary and Chief Legal Officer (prior to April 2005); John Hancock Group of Funds, Senior Vice President, Secretary and Chief Legal Officer (prior to April 2005) |
| | | |
Susan A. Pereira(4) (born 11/05/70) | | Assistant Secretary and Assistant Clerk | | July 2005 | | Massachusetts Financial Services Company, Vice President and Senior Counsel (since June 2004); Bingham McCutchen LLP (law firm), Associate (January 2001 to June 2004) |
| | | |
Mark N. Polebaum(4) (born 05/01/52) | | Secretary and Assistant Clerk | | February 2006 | | Massachusetts Financial Services Company, Executive Vice President, General Counsel and Secretary (since January 2006); Wilmer Cutler Pickering Hale and Dorr LLP (law firm), Partner (prior to January 2006) |
| | | |
Frank L. Tarantino (born 03/07/44) | | Independent Chief Compliance Officer | | September 2004 | | Tarantino LLC (provider of compliance services), Principal (since June 2004); CRA Business Strategies Group (consulting services), Executive Vice President (April 2003 to June 2004); David L. Babson & Co. (investment adviser), Managing Director, Chief Administrative Officer and Director (February 1997 to March 2003) |
| | | |
Richard S. Weitzel(4) (born 7/16/70) | | Assistant Secretary and Assistant Clerk | | October 2007 | | Massachusetts Financial Services Company, Vice President and Assistant General Counsel (since 2007); Vice President and Senior Counsel (since May 2004); Massachusetts Department of Business and Technology, General Counsel (February 2003 to April 2004); Massachusetts Office of the Attorney General, Assistant Attorney General ( April 2001 to February 2003); Ropes and Gray, Associate (prior to April 2001) |
| | | |
James O. Yost(4) (born 06/12/60) | | Assistant Treasurer | | April 1992 | | Massachusetts Financial Services Company, Senior Vice President |
| (1) | Date first appointed to serve as Trustee/Officer of an MFS fund or a Compass variable account. Each Trustee has served continuously since appointment. |
| (2) | Directorships or trusteeships of companies required to report to the Securities and Exchange Commission (i.e., “public companies”). |
| (3) | “Interested person” of the Sun Life of Canada (U.S.), within the meaning of the Investment Company Act of 1940 (referred to as the 1940 Act), which is the principal federal law governing investment companies like the Series. The address of Sun Life of Canada (U.S.) is One Sun Life Executive Park, Wellesley Hills, Massachusetts 02481. |
| (4) | “Interested person” of MFS within the meaning of the 1940 Act. The address of MFS is 500 Boylston Street, Boston, Massachusetts 02116. |
The Trust does not hold annual meetings for the purpose of electing Trustees, and Trustees are not elected for fixed terms. Each Trustee and officer holds office until his or her successor is chosen and qualified, or until his or her earlier death, resignation, retirement or removal.
All Trustees currently serve as Trustees of the Trust and have served in that capacity since originally elected or appointed. All of the Trustees are also Managers of the Compass Variable Accounts. The executive officers of the Trust hold similar offices for the Compass Variable Accounts and other funds in the MFS fund complex. As of January 1, 2008, each Trustee serves as a Trustee or Manager of 35 Accounts/Funds.
24
Trustees and Officers – continued
The Statement of Additional Information contains further information about the Trustees and is available without charge upon request by calling 1-800-225-2606.
| | |
Investment Adviser
Massachusetts Financial Services Company 500 Boylston Street, Boston, MA 02116-3741 | | Custodian State Street Bank and Trust Company 225 Franklin Street, Boston, MA 02110 |
Distributor
MFS Fund Distributors, Inc. 500 Boylston Street, Boston, MA 02116-3741 | | Independent Registered Public Accounting Firm Deloitte & Touche LLP 200 Berkeley Street, Boston, MA 02116 |
Portfolio Managers Richard Hawkins Robert Persons | | |
25
BOARD REVIEW OF INVESTMENT ADVISORY AGREEMENT
The Investment Company Act of 1940 requires that both the full Board of Trustees and a majority of the non-interested (“independent”) Trustees, voting separately, annually approve the continuation of the investment advisory agreement between MFS Variable Insurance Trust II (the “Trust”) and Massachusetts Financial Services Company (MFS) on behalf of the Fund. The Trustees consider matters bearing on the Fund and the advisory arrangements at their meetings throughout the year, including a review of performance data at each regular meeting. In addition, the independent Trustees met several times over the course of three months beginning in May and ending in July 2007 (“contract review meetings”) for the specific purpose of considering whether to approve the continuation of the investment advisory agreement for the Fund. The independent Trustees were assisted in their evaluation of the investment advisory agreement by independent legal counsel, from whom they received separate legal advice and with whom they met separately from MFS management during various contract review meetings. The independent Trustees were also assisted in this process by the Fund’s Independent Chief Compliance Officer, a full-time senior officer appointed by and reporting to the independent Trustees.
In connection with their deliberations, the Trustees, including the independent Trustees, considered such information and factors as they believed, in light of the legal advice furnished to them and their own business judgment, to be relevant. The investment advisory agreement was considered separately for the Fund, although the Trustees also took into account the common interests of all Funds in the Trust in their review. As described below, the Trustees considered the nature, quality, and extent of the various investment advisory, administrative, and shareholder services performed by MFS under the existing investment advisory agreement and other arrangements with the Trust.
In connection with their contract review meetings, the Trustees received and relied upon materials which included, among other items: (i) information provided by Lipper Inc. on the investment performance of the Fund for various time periods ended December 31, 2006, compared to the investment performance of a group of funds with substantially similar investment classifications/objectives (the “Lipper performance universe”), as well as the investment performance of a group of funds identified by objective criteria suggested by MFS (“peer funds”), (ii) information provided by Lipper Inc. on the Fund’s advisory fees and other expenses compared to the advisory fees and other expenses of comparable funds identified by Lipper (the “Lipper expense group”), as well as the advisory fees and other expenses of peer funds identified by objective criteria suggested by MFS, (iii) information provided by MFS on the advisory fees of comparable portfolios of its other clients, including institutional separate account and other clients, (iv) information as to whether, and to what extent applicable, expense waivers, reimbursements or fee “breakpoints” are observed for the Fund, (v) information regarding MFS’ financial results and financial condition, including MFS’ and certain of its affiliates’ estimated profitability from services performed for the Fund, (vi) MFS’ views regarding the outlook for the mutual fund industry and its strategic business plans, (vii) descriptions of various functions performed by MFS for the Trust, such as compliance monitoring and portfolio trading practices, and (viii) information regarding the overall organization of MFS, including information about MFS’ senior management and other personnel providing investment advisory, administrative and other services to the Fund. The comparative performance, fee and expense information prepared and provided by Lipper Inc. was not independently verified, and the independent Trustees did not independently verify any information provided to them by MFS.
The Trustees’ conclusion as to the continuation of the investment advisory agreement was based on comprehensive consideration of all information provided to the Trustees and not the result of any single factor. Some of the factors that figured particularly in the Trustees’ deliberations are described below for the Fund, while individual Trustees may have given different weight to various factors and evaluated the information presented as a whole differently than another Trustee. The Trustees recognized that the fee arrangements for the Fund reflect years of review and discussion between the independent Trustees and MFS, that certain aspects of such arrangements may receive greater scrutiny in some years than others, and that the Trustees’ conclusions may be based, in part, on their consideration of these same arrangements during the course of the year and in prior years.
Based on information provided by Lipper Inc. and MFS, the Trustees compared the Fund’s total return investment performance to the performance of a peer group of funds over various time periods. The Trustees placed particular emphasis on the total return performance of the Fund’s Initial Class shares in comparison to the performance of funds in its Lipper performance universe over the one-, three- and five-year periods. The Trustees did not rely on performance results for more recent periods, including those shown elsewhere in this report.
The Trustees noted the performance of the Fund’s Initial Class shares was in the 2nd quintile relative to the other funds in the Lipper Classification Index for the one-year period (the 1st quintile being the best performers and the 5th quintile being the worst performers). The total return performance of the Fund was in the 1st quintile for the three-year period and the five-year period ended December 31, 2006, relative to the Lipper performance universe. Based on the nature and quality of services provided by MFS, the Board of Trustees concluded that the Fund’s performance was satisfactory.
26
Board Review of Investment Advisory Agreement – continued
In the course of their deliberations, the Trustees took into account information provided by MFS during contract review meetings, as well as during investment review meetings conducted with portfolio management personnel during the course of the year.
In assessing the reasonableness of the Fund’s advisory fee, the Trustees considered, among other information, the Fund’s advisory fee and the total expense ratio of the Fund’s Initial Class shares as a percentage of average daily net assets, compared to the advisory fee and total expense ratios of its peer group of funds based on information provided by Lipper Inc. and MFS. The Trustees also considered the advisory fees charged by MFS to institutional accounts. In comparing these fees, the Trustees considered the generally broader scope of services provided by MFS to the Trust than those provided to institutional accounts. The Trustees also considered the higher demands placed on MFS’ investment personnel and trading infrastructure as a result of the daily cash in-flows and out-flows of the Fund, and the impact on MFS and related expenses due to the more extensive regulatory regime to which the Fund is subject, compared to institutional accounts.
In considering the fees, the Trustees noted from the Lipper data that the Fund’s effective advisory fee rate and total expense ratio were each above the median of such fees and expenses of funds in the Lipper expense group. The Trustees further noted that MFS agreed to reduce its advisory fee to an annual rate of 0.50% in excess of the first $1 billion of assets.
The Trustees also considered information prepared by MFS relating to its costs and profits with respect to the Fund and other investment companies and accounts advised by MFS, as well as MFS’ methodologies used to determine and allocate its costs to the Fund and other accounts and products for purposes of estimating profitability.
After reviewing these and other factors described below, the Trustees concluded that the advisory fee charged to the Fund represents reasonable compensation in light of the nature and quality of the services being provided by MFS.
In addition, the Trustees considered MFS’ resources and related efforts to continue to retain, attract and motivate capable personnel to serve the Fund. The Trustees also considered the financial resources of MFS and its parent, Sun Life Financial Inc. The Trustees further considered any advantages and possible disadvantages of having an adviser which also serves other investment companies as well as institutional accounts.
The Trustees also considered the nature, quality, cost, and extent of administrative, transfer agency, and distribution services provided to the Fund by MFS and its affiliates under agreements and plans other than the investment advisory agreement, including the 12b-1 fees the Fund pays to MFS Fund Distributors, Inc., an affiliate of MFS. The Trustees also considered the nature, extent and quality of certain other services MFS performs or arranges on the Fund’s behalf, which may include securities lending programs, directed expense payment programs, class action recovery programs, and MFS’ interaction with third-party service providers, principally custodians and sub-custodians. The Trustees concluded that the various non-advisory services provided by MFS and its affiliates on behalf of the Fund were satisfactory. The Trustees also considered the benefits to MFS from the use of the Fund’s portfolio brokerage commissions to pay for research and other similar services (including MFS’ policy not to use “soft dollars” generated by Fund portfolio transactions to pay for third-party research), and various other factors. Additionally, the Trustees considered so-called “fall-out benefits” to MFS such as reputational value derived from serving as investment manager to the Trust, and determined that any such benefits derived by MFS were reasonable and fair.
Based on their evaluation of factors that they deemed to be material, including those factors described above, the Board of Trustees, including a majority of the independent Trustees, concluded that the investment advisory agreement should be continued for an additional one-year period, commencing September 1, 2007.
A discussion regarding the Board’s most recent review and renewal of the Fund’s investment advisory agreement is available by clicking on the Fund’s name under “Variable Insurance Portfolios” on the “Products & Performance” page on the MFS Web site (mfs.com).
27
PROXY VOTING POLICIES AND INFORMATION
A general description of the MFS funds’ proxy voting policies and procedures is available without charge, upon request, by calling 1-800-225-2606, by visiting the About MFS section of mfs.com or by visiting the SEC’s Web site at http://www.sec.gov.
Information regarding how the fund voted proxies relating to portfolio securities during the most recent twelve-month period ended June 30 is available without charge by visiting the Proxy Voting section of mfs.com or by visiting the SEC’s Web site at http://www.sec.gov.
QUARTERLY PORTFOLIO DISCLOSURE
The fund will file a complete schedule of portfolio holdings with the Securities and Exchange Commission (the Commission) for the first and third quarters of each fiscal year on Form N-Q. The fund’s Form N-Q may be reviewed and copied at the:
Public Reference Room
Securities and Exchange Commission
100 F Street, NE, Room 1580
Washington, D.C. 20549
Information on the operation of the Public Reference Room may be obtained by calling the Commission at 1-800-SEC-0330. The fund’s Form N-Q is available on the EDGAR database on the Commission’s Internet Web site at http://www.sec.gov, and copies of this information may be obtained, upon payment of a duplicating fee, by electronic request at the following e-mail address: publicinfo@sec.gov or by writing the Public Reference Section at the above address.
A shareholder can also obtain the quarterly portfolio holdings report at mfs.com.
28
MFS® PRIVACY NOTICE
Privacy is a concern for every investor today. At MFS Investment Management® and the MFS funds, we take this concern very seriously. We want you to understand our policies about the investment products and services that we offer, and how we protect the nonpublic personal information of investors who have a direct relationship with us and our wholly owned subsidiaries.
Throughout our business relationship, you provide us with personal information. We maintain information and records about you, your investments, and the services you use. Examples of the nonpublic personal information we maintain include
| | Ÿ | | data from investment applications and other forms |
| | Ÿ | | share balances and transactional history with us, our affiliates, or others |
| | Ÿ | | facts from a consumer reporting agency |
We do not disclose any nonpublic personal information about our customers or former customers to anyone, except as permitted by law. We may share nonpublic personal information with third parties or certain of our affiliates in connection with servicing your account or processing your transactions. We may share information with companies or financial institutions that perform marketing services on our behalf or with other financial institutions with which we have joint marketing arrangements, subject to any legal requirements.
Authorization to access your nonpublic personal information is limited to appropriate personnel who provide products, services, or information to you. We maintain physical, electronic, and procedural safeguards to help protect the personal information we collect about you.
If you have any questions about the MFS privacy policy, please call 1-800-225-2606 any business day between 8 a.m. and 8 p.m. Eastern time.
Note: If you own MFS products or receive MFS services in the name of a third party such as a bank or broker-dealer, their privacy policy may apply to you instead of ours.
29
CONTACT US
Web site
mfs.com
Account service and
literature
Shareholders
1-877-411-3325
9 a.m. to 5 p.m. ET
Investment professionals
1-800-637-8630
8 a.m. to 5 p.m. ET
Mailing address
MFS Service Center, Inc.
Attn: Institutional Alliance Services (IAS)
P.O. Box 55824
Boston, MA
02205-5824
Overnight mail
MFS Service Center, Inc.
Attn: Institutional Alliance Services (IAS)
500 Boylston Street
Boston, MA 02116-3741

MFS Variable Insurance Trust II
ANNUAL REPORT • December 31, 2007
MFS Capital Appreciation Portfolio (formerly Capital Appreciation Series)
MFS Emerging Growth Portfolio (formerly Emerging Growth Series)
MFS Global Governments Portfolio (formerly Global Governments Series)
MFS Massachusetts Investors Growth Stock Portfolio (formerly Massachusetts Investors Growth Stock Series)
MFS Mid Cap Growth Portfolio (formerly Mid Cap Growth Series)
MFS Mid Cap Value Portfolio (formerly Mid Cap Value Series)
MFS Money Market Portfolio (formerly Money Market Series)
MFS New Discovery Portfolio (formerly New Discovery Series)
MFS Research Portfolio (formerly Research Series)
MFS Strategic Income Portfolio (formerly Strategic Income Series)
MFS Strategic Value Portfolio (formerly Strategic Value Series)
MFS Technology Portfolio (formerly Technology Series)
Table of Contents
The report is prepared for the general information of contract owners. It is authorized for distribution to prospective investors only when preceded or accompanied by a current prospectus.
| | | | |
| NOT FDIC INSURED MAY LOSE VALUE NO BANK OR CREDIT UNION GUARANTEE |
| NOT A DEPOSIT NOT INSURED BY ANY FEDERAL GOVERNMENT AGENCY OR NCUA/NCUSIF |
Letter from the CEO of MFS
Dear Contract Owners:
The past year has been a great example of why investors should keep their eyes on the long term.
In 2006 the Dow Jones Industrial Average returned 19% and was fairly stable. This year we have seen a greater level of volatility than has been experienced in recent years. The Dow hit several new highs but also experienced swift drops as a global credit crisis swept through markets, spurred by defaults on U.S. subprime loans and a liquidity crunch. Still, even with this volatility, the Dow ended the first three quarters of 2007 with a return near 13%.
U.S. Treasury bonds gained ground, especially in the third quarter as investors sought less risky asset classes. The spreads of many lower-quality debt investments widened.
In 2007 the U.S. dollar fell against the euro, oil prices hit their highest levels yet, and gold spiked to its steepest price in 28 years. Around the globe, stocks sold off as risk aversion mounted. As we have said before, markets can be volatile, and investors should make sure they have an investment plan that can carry them through the peaks and troughs.
If you are focused on a long-term investment strategy, the short-term ups and downs of the markets should not necessarily dictate portfolio action on your part. In our view, investors who remain committed to a long-term plan are more likely to achieve their financial goals.
In any market environment, we believe individual investors are best served by following a three-pronged investment strategy of allocating their holdings across the major asset classes, diversifying within each class, and regularly rebalancing their portfolios to maintain their desired allocations. Of course, these strategies cannot guarantee a profit or protect against a loss. Investing and planning for the long term require diligence and patience, two traits that in our experience are essential to capitalizing on the many opportunities the financial markets can offer — through both up and down economic cycles.
Respectfully,

Robert J. Manning
Chief Executive Officer and Chief Investment Officer
MFS Investment Management®
February 15, 2008
The opinions expressed in this letter are subject to change, may not be relied upon for investment advice, and no forecasts can be guaranteed.
Management Reviews
The following management reviews, for the twelve months ended December 31, 2007, exclude the MFS Money Market Portfolio.
Market Environment
Despite seemingly robust growth rates during the second and third quarters of 2007, underlying economic activity in the U.S. remained muted relative to other major economies. Overall, global
economies witnessed moderate to strong growth during the reporting period as domestic demand improved and world trade accelerated.
With the strong global growth, however, concerns emerged about rising global inflation, especially as capacity became more constrained, wages rose, and energy and food prices advanced. During the reporting period, global central banks (with the exception of the U.S. Federal Reserve Board) tightened monetary conditions, which in turn pushed global bond yields to their highest levels during this economic expansion.
However, financial markets – particularly in the mortgage and structured-products areas – experienced substantial volatility in recent months. Beginning in late July, heightened uncertainty and distress concerning the subprime mortgage market caused several global credit markets to tighten up, forcing central banks to inject liquidity and to reassess their tightening biases as sovereign bond yields declined and credit spreads widened. While credit conditions improved somewhat by late October as the Federal Reserve Board cut interest rates, the level of market turbulence remained significant through year end. Increased market turmoil was also exacerbated by U.S. home foreclosures and uncertainties surrounding falling housing prices. Despite increased volatility across all asset classes and the widening in credit spreads, U.S. labor markets were resilient and wages rose modestly. More broadly, global equity markets rebounded following summer losses and generally held those gains through the end of the reporting period.
MFS Capital Appreciation Portfolio
Summary of Results
For the twelve months ended December 31, 2007, Initial Class shares of the MFS Capital Appreciation Portfolio (the “fund”) provided a total return of 11.14%, while Service Class shares provided a total return of 10.93%. These compare with a return of 11.81% for the fund’s benchmark, the Russell 1000 Growth Index.
Detractors from performance
An overweighted position and stock selection in the health care sector detracted from the fund’s performance relative to the benchmark during the reporting period. Eye care medical products maker Advanced Medical Optics, biotechnology firm Amgen, and pharmaceutical and diagnostic company Roche Holding(aa) (Switzerland) were among the fund’s largest detractors within this sector. Shares of Advanced Medical Optics suffered a steady decline during the period due to several recalls of its lens solution products, which resulted in a dramatic decrease in eye care sales. Shares of Amgen suffered, in part, due to studies that raised concerns about the safety profile of the company’s anemia drug Aranesp.
An underweighted position in the basic materials sector hindered relative returns. Our positioning in strong-performing agrichemical products company Monsanto(g) was the principal negative factor in this sector.
Several individual securities in other sectors dampened relative results, including our holdings of investment management and banking firm UBS(aa) (Switzerland), billing software company Amdocs, discount retailer Family Dollar Stores(g), office supply superstore operator Staples, and upscale apparel retailer
1
Nordstrom. An underweighted position in computer and personal electronics maker Apple also detracted from relative results.
Contributors to performance
Security selection in the retailing sector contributed to the fund’s relative performance. Avoiding poor-performing home improvement retailer Home Depot was the principal positive factor in this sector.
Our underweighted position and stock selection in the autos and housing sector also boosted relative returns. No individual holdings within this sector were among the fund’s top contributors.
Stock selection in the industrial goods and services sector benefited relative results. Aerospace metal parts manufacturer Precision Castparts was a strong contributor in this sector.
Standout performers in other sectors included financial exchange Deutsche Boerse(aa) (Germany) and global integrated energy company Hess(aa). Shares of Deutsche Boerse rose significantly during the year. The company acquired International Securities Exchange Holdings, which we believe positioned the company as a key player in the U.S. options market and in global derivatives trading. Shares of Hess surged in recent months due largely to hopes that an oil field discovery off the coast of Brazil could nearly double the company’s reserves.
Elsewhere, oil field services company Schlumberger, offshore drilling company Noble, network equipment manufacturer Juniper Networks, credit card transactions processor First Data(g), enterprise software giant Oracle, and food company Nestle(aa) (Switzerland) also boosted relative performance.
During the reporting period, currency exposure was a contributor to relative performance. All of MFS’ investment decisions are driven by the fundamentals of each individual opportunity and, as such, it is common for our portfolios to have different currency exposure than the benchmark.
MFS Emerging Growth Portfolio
Summary of Results
For the twelve months ended December 31, 2007, Initial Class shares of the MFS Emerging Growth Portfolio (the “fund”) provided a total return of 21.25%, while Service Class shares provided a total return of 21.00%. These compare with a return of 11.40% for the fund’s benchmark, the Russell 3000 Growth Index.
Contributors to performance
The technology, financial services, leisure, and special products and services sectors were the top contributors to performance relative to the benchmark during the reporting period. Strong stock selection played the major role in each case.
Within the technology sector, wireless solutions provider Research In Motion(aa) (Canada) performed exceptionally well as the company’s shares gained on standout quarterly results and increased earnings guidance. In addition, the successful launch of its World Phone helped fuel the very healthy appreciation in the stock’s price during the reporting period. Network equipment manufacturer Juniper Networks(g) also delivered strong appreciation.
Financial exchange Deutsche Boerse(aa) (Germany) was a strong contributor to relative performance in the financial services sector. Shares of Deutsche Boerse rose significantly during the year. The
company acquired International Securities Exchange Holdings, which we believe positioned the company as a key player in the U.S. options market and in global derivatives trading.
The fund also derived significant gains in the leisure sector from its investment in educational software and video game publishing and distribution company Ubisoft Entertainment(aa).
In the special products and services sector, education services companies New Oriental Education & Technology(aa) (China) and ITT Educational Services(g) were top contributors. New Oriental Education & Technology benefited from continued growth in the four major Chinese markets (Beijing, Shanghai, Guangzhou, and Wuhan).
In other sectors, the fund’s investment in global integrated energy company Hess(aa) was among the top contributors. Shares of Hess surged in recent months due largely to hopes that an oil field discovery off the coast of Brazil could nearly double the company’s reserves. Also delivering strong gains was wireless communications company America Movil(aa) (Mexico). Shares rose as the company reported strong earnings which exceeded investors’ expectations as well as continued strength in subscriber growth and stable average revenue per user. Holdings of medical device company Cytyc(g) and video game retailer GameStop were also top contributors.
During the reporting period, currency exposure was a contributor to relative performance. All of MFS’ investment decisions are driven by the fundamentals of each individual opportunity and, as such, it is common for our portfolios to have different currency exposure than the benchmark.
Detractors from performance
Individual stocks that adversely impacted relative performance included medical device maker Advanced Medical Optics. Shares of the company suffered a steady decline during the period due to several recalls of its lens solution products, which resulted in a dramatic decrease in eye care sales. The fund’s holdings of networking chip maker Marvell Technology also hurt relative returns. Shares of Marvell struggled after the company reported a disappointing earnings outlook and from issues surrounding a stock options scandal. Underweighting computer and personal electronics maker Apple also held back relative performance as this stock outperformed the benchmark.
Note to Shareholders: Effective May 1, 2008, the portfolio will change its name to MFS Growth Portfolio.
MFS Global Governments Portfolio
Summary of Results
For the twelve months ended December 31, 2007, Initial Class shares of the MFS Global Governments Portfolio (the “fund”) provided a total return of 8.99%, while Service Class shares provided a total return of 8.67%. These compare with a return of 10.81% for the fund’s benchmark, the JPMorgan Global Government Bond Index Unhedged.
Detractors from performance
The fund’s U.S. yield curve(y) positioning had a negative impact on relative performance as interest rates generally declined over the reporting period.
2
During the latter half of the period, as swap and credit spreads widened, the fund’s exposure to “AAA”(s) rated commercial mortgage-backed securities (CMBS), delegated underwriting services (DUS) pools, Small Business Association (SBA) bonds, and emerging markets debt securities detracted from relative results.
Contributors to performance
The fund’s underweighted exposure to the U.S. dollar, particularly versus the Euro, modestly contributed to relative performance as the value of the dollar weakened relative to most of the world’s major currencies.
Our duration(d) positioning in European bonds also benefited relative results during the reporting period.
Relative performance was also aided by security selection, particularly from some of the fund’s holdings of European government bonds.
MFS Massachusetts Investors Growth Stock Portfolio
Summary of Results
For the twelve months ended December 31, 2007, Initial Class shares of the MFS Massachusetts Investors Growth Stock Portfolio (the “fund”) provided a total return of 11.53%, while Service Class shares provided a total return of 11.26%. These compare with a return of 11.81% for the fund’s benchmark, the Russell 1000 Growth Index.
Detractors from performance
An overweighted position and stock selection in the health care sector detracted from the fund’s performance relative to the benchmark during the reporting period. Eye care medical products maker Advanced Medical Optics, pharmaceutical and diagnostic company Roche Holding(aa) (Switzerland), and biotechnology firm Amgen were among the fund’s largest detractors within this sector. Shares of Advanced Medical Optics suffered a steady decline during the period due to several recalls of its lens solution products, which resulted in a dramatic decrease in eye care sales. Shares of Amgen suffered, in part, due to studies that raised concerns about the safety profile of the company’s anemia drug Aranesp. Not owning pharmaceutical giant Merck, which outperformed the benchmark over the reporting period, also dampened relative results.
An underweighted position in the basic materials sector hindered relative returns. In particular, our positioning in strong-performing agrichemical products company Monsanto(g) was the principal negative factor in this sector.
Several individual securities in other sectors dampened relative results, including our holdings of investment management and banking firm UBS(aa) (Switzerland), billing software company Amdocs, discount retailer Family Dollar Stores(g), and office supply superstore operator Staples. An underweighted position in computer and personal electronics maker Apple also detracted from results.
Contributors to performance
Security selection in the retailing sector contributed to the fund’s relative performance. Avoiding poor-performing home
improvement retailer Home Depot was the principal positive factor in this sector.
Our underweighted position and stock selection in the autos and housing sector boosted relative returns. No individual holdings within this sector were among the fund’s top contributors.
Stock selection in the utilities and communications sector also benefited relative results. Wireless communications firm America Movil(aa) (Mexico) was a positive contributor in this sector. America Movil’s shares rose as the company reported strong earnings which exceeded investors’ expectations as well as continued strength in subscriber growth and stable average revenue per user.
Several individual securities in other sectors also aided relative returns, including financial exchange Deutsche Boerse(aa) (Germany), aerospace metal parts manufacturer Precision Castparts, credit card transactions processor First Data(g), network equipment manufacturer Juniper Networks, enterprise software giant Oracle, and food company Nestle(aa) (Switzerland). The fund’s holdings of offshore drilling company Noble and global integrated energy company Hess(aa) were also strong contributors.
During the reporting period, currency exposure was a contributor to relative performance. All of MFS’ investment decisions are driven by the fundamentals of each individual opportunity and, as such, it is common for our portfolios to have different currency exposure than the benchmark.
MFS Mid Cap Growth Portfolio
Summary of Results
For the twelve months ended December 31, 2007, Initial Class shares of the MFS Mid Cap Growth Portfolio (the “fund”) provided a total return of 9.84%, while Service Class shares provided a total return of 9.59%. These compare with a return of 11.43% for the fund’s benchmark, the Russell Midcap Growth Index.
Detractors from performance
The financial services and technology sectors were the largest detractors from performance relative to the benchmark over the reporting period. In both sectors, stock selection was the principal factor that held back relative returns.
In financial services, the fund’s position in poor-performing insurance and investment company Genworth Financial(aa) was among the fund’s top detractors. Genworth Financial, which derives a portion of its earnings from selling mortgage insurance in the U.S. market, declined significantly near the end of the reporting period amid concerns that more homeowners would default on their mortgages. Holdings in private student loans provider The First Marblehead(g) also hurt relative result.
Several individual securities in the technology sector weighed on performance, including printer manufacturer Lexmark International(g) and digital media services and software maker RealNetworks(aa)(g). Shares of Lexmark declined due, in part, to lower demand for inkjet supplies.
Elsewhere in the fund, our positioning in managed care services provider Wellcare Health Plans(g), electronics retailer RadioShack(g), home builder NVR(g), apparel retailer Phillips-Van Heusen, and business research provider Corporate Executive Board detracted from relative performance. Not holding oil and gas drilling equipment manufacturer National Oilwell Varco also hindered relative returns as this stock outperformed the benchmark.
3
Contributors to performance
Boosted by stock selection, the energy sector was a positive factor in relative returns for the reporting period. Holdings of global integrated energy company Hess(aa) were among the top contributors. Shares of Hess surged in recent months due largely to hopes that an oil field discovery off the coast of Brazil could nearly double the company’s reserves. The fund’s positioning in oil and gas equipment company Cameron International also helped.
In the utilities and communications sector, natural gas pipelines operator Williams Cos. delivered strong appreciation.
Stock selection in the leisure sector also bolstered results. Gaming services provider Penn National Gaming(g) was among the leaders of the fund’s relative performance.
In other sectors, diesel engine maker Cummins and digital map database provider NAVTEQ(g) contributed to relative returns. The fund’s positions in education services company ITT Educational Services, diagnostic and medical device company Cytyc(g), and specialty chemical company Praxair(aa) were other standout performers. Not owning clothing retailer JC Penny also helped investment results.
MFS Mid Cap Value Portfolio
Summary of Results
For the twelve months ended December 31, 2007, Initial Class shares of the MFS Mid Cap Value Portfolio (the “fund”) provided a total return of 1.84%, while Service Class shares provided a total return of 1.61%. These compare with a return of -1.42% for the fund’s benchmark, the Russell Midcap Value Index.
Contributors to performance
Stock selection in the utilities and communications sector boosted performance relative to the benchmark. Holdings within this sector that contributed to relative returns included energy products and services supplier Constellation Energy, natural gas pipelines operator Williams Cos., and power generation company NRG Shares of NRG gained on strong quarterly results, increased earnings guidance, and an optimistic outlook on growth which helped fuel the very healthy appreciation in the stock’s price during the reporting period.
A combination of an overweighted position and stock selection in the strong-performing industrial goods and services sector had a positive impact on results. Diesel engine manufacturer Cummins and leading diversified industrial manufacturer Eaton were among the top contributors.
Although no individual stocks in the financial services sector were among the top relative contributors, the combination of an underweighted position and stock selection in this sector helped the fund’s relative returns.
Stock selection in the consumer staples also bolstered results. Tobacco company Carolina(g) and manufacturer and distributor of Pepsi Bottling Group were among the leaders of the fund’s relative performance.
Elsewhere, precious metal company Freeport-McMoRan, antivirus software and security products maker McAfee, and integrated oil and gas company Hess also turned in attractive results. Shares of Hess surged in recent months due largely to hopes that an oil field discovery off the coast of Brazil could nearly double the company’s reserves.
Detractors from performance
An underweighted position in the basic materials sector was the primary detractor from performance relative to the benchmark. However, no individual stocks within this sector were among the top detractors.
Stocks positions in other sectors that held back results included home improvement products maker D.R. Horton(g). The company’s stock suffered from an inventory glut and increased home foreclosures that continued to weigh on demand. The company was forced to slash prices, putting pressure on its profit margin.
Several financial stocks also dampened results during the investment period. These included mortgage financier MGIC Investment(g), mortgage lending firm Countrywide Financial(aa), real estate investment consultants CBL & Associates Properties, insurance and investment company Genworth Financial, and financial services firm BankUnited Financial(aa)(g).
Elsewhere, digital media services and software maker RealNetworks(aa)(g), casual dinning restaurants operator Darden Restaurants(aa), flash memory storage products maker SanDisk, and discount retailer Family Dollar Stores(g) hurt relative returns.
MFS New Discovery Portfolio
Summary of Results
For the twelve months ended December 31, 2007, Initial Class shares of the MFS New Discovery Portfolio (the “fund”) provided a total return of 2.56%, while Service Class shares provided a total return of 2.28%. These compare with a return of 7.05% for the fund’s benchmark, the Russell 2000 Growth Index.
Detractors from performance
Stock selection in the consumer staples sector was a key factor that dampened relative results. Our positioning in manufacturer and distributor of lawn, garden, and pet supplies Central Garden & Pet was the largest relative detractor from performance for the reporting period. Shares of Central Garden & Pet fell after the company reported a quarterly loss and analysts reduced earnings estimates for the company.
A combination of stock selection and an overweighted position in the retailing sector held back relative returns. Our holdings in weak-performing urban fashion apparel retailer Citi Trends was the principal detractor in the sector. Citi Trends declined after its top executive said inventory losses from crime and paperwork errors will likely persist for some time.
A combination of stock selection and an underweighted position in both the industrial goods and services and basic materials sectors held back relative performance. Within the industrial goods and services sector, our positioning in oil service company North American Energy Partners(aa) hurt performance as the stock underperformed the benchmark over the reporting period. No individual securities within the basic materials sector were among the fund’s top detractors.
Stocks in other areas that hurt performance included retail bakery-cafes operator Panera Bread(aa), medical device maker Advanced Medical Optics(aa), mortgage financer Accredited Home Lenders(g)(aa), homebuilder MDC Holdings, commercial real estate and capital markets services firm HFF Inc., electronic payments software producer ACI Worldwide, and business research provider
4
Corporate Executive Board(aa). Shares of ACI Worldwide suffered as the company transitioned its sales model to focus on new customer acquisitions. In addition, their customer base in the financial industry was under pressure due to deteriorating credit concerns. The stock price of Corporate Executive Board declined on concerns that a slowing economy and a financial services industry under pressure would eventually lead to a slowdown in revenue from its corporate customers.
Contributors to performance
A combination of stock selection and an overweighted position in the health care sector helped relative performance. Our positioning in strong-performing diagnostics instruments firm Ventana Medical Systems(g), medical equipment manufacturer Resmed(aa), and diagnostic device maker IDEXX Laboratories(aa) aided relative results. Shares of Ventana Medical Systems rose when Roche made a bid to acquire the company at a substantial premium.
Underweighting the weak-performing financial services sector was another positive factor. Within the sector, our holdings of Investors Financial Services(g)(aa) was helpful to performance. During the reporting period, Investors Financial Services was purchased by State Street.
Stock selection in the leisure sector also contributed to performance over the period. Our holdings of index data provider MSCI(aa) performed well, adding to relative results. Positioning in gaming machine manufacturer and distributor WMS Industries also bolstered performance within the sector.
Stocks in other sectors that helped performance included educational services company New Oriental Educational and Technology(g)(aa), energy equipment company Dresser-Rand(aa), designer and developer of semiconductors Hittite Microwave, speech and imaging software firm Nuance. New Oriental Educational and Technology is the leading provider of English language and test preparation in China. The company has a dominant brand name in China, generates very high returns on capital, and is rapidly expanding throughout the country. Dresser-Rand experienced strong earnings growth as demand for its equipment increased and it captured an increasing share of aftermarket parts. Hittite Microwave performed well as the company continued to grow revenues through new product rollouts and market share gains.
MFS Research Portfolio
Summary of Results
For the twelve months ended December 31, 2007, Initial Class shares of the MFS Research Portfolio (the “fund”) provided a total return of 13.24%, while Service Class shares provided a total return of 12.97%. These compare with a return of 5.49% for the fund’s benchmark, the Standard & Poor’s 500 Stock Index.
Contributors to performance
Strong stock selection in the financial services sector was a principal factor that contributed to performance relative to the benchmark. In particular, avoiding financial services giant Citigroup and insurance company American International Group (AIG) was favorable to relative results as both companies’ stocks tumbled over the reporting period due to the subprime mortgage-related woes.
Stock selection in the special products and services sector also contributed to relative returns. Among the fund’s top contributors was for-profit education company Apollo Group(g).
The basic materials sector turned in strong results, bolstered by stock selection. Holdings of mining giant BHP Billiton(aa) (U.K.) and package manufacturer Owens-Illinois(aa)(g) helped the fund’s relative performance. BHP Billiton reported strong quarterly results in the latter part of the reporting period, citing robust demand from Asia and surging commodities prices as profit drivers.
Stock selection in the energy sector further boosted the fund’s performance relative to the benchmark. The notable contributors were oil and gas exploration and production company Apache, coal mining company CONSOL Energy, and integrated oil and gas company Hess. Shares of Hess surged in recent months due largely to hopes that an oil field discovery off the coast of Brazil could nearly double the company’s reserves.
Stocks in other sectors that contributed to relative performance included Internet search engine Google and natural gas pipelines operator Williams Cos.
During the reporting period, currency exposure was a contributor to the fund’s relative performance. All of MFS’ investment decisions are driven by the fundamentals of each individual opportunity and, as such, it is common for our portfolios to have different currency exposure than the benchmark.
Detractors from performance
An underweighted position in computer and personal electronics maker Apple(g), and not owning integrated oil company Chevron, held back relative results as both stocks outperformed the benchmark. The fund’s holdings that detracted from relative performance included biotechnology firm Amgen, electronic brokerage firm E*Trade(g), insurance and investment company Genworth Financial, medical device maker Boston Scientific, department store operators Macy’s and Nordstrom, network storage company Network Appliance(g), and networking chip maker Marvell Technology(aa). Shares of Marvell struggled after the company reported a disappointing earnings outlook and from issues surrounding a stock options scandal.
MFS Strategic Income Portfolio
Summary of Results
For the twelve months ended December 31, 2007, Initial Class shares of the MFS Strategic Income Portfolio (the “fund”) provided a total return of 3.49%, while Service Class shares provided a total return of 3.24%. These compare with returns of 6.97%, 1.87%, 6.28%, and 4.88%, respectively, for the fund’s benchmarks, the Lehman Brothers U.S. Aggregate Bond Index, the Lehman Brothers U.S. High-Yield Corporate Bond Index, the JPMorgan Emerging Markets Bond Index Global, and the Citigroup World Government Bond Non-Dollar Hedged Index.
Detractors from performance
The fund’s exposure to the financial sector held back performance as holdings of many finance companies suffered from the recent turmoil in the subprime mortgage market. Our exposure to the industrial sector was another negative.
Credit quality, particularly holdings of “BBB” rated(s) securities, detracted from performance as credit spreads widened.
5
The fund’s shorter duration(d) stance also hurt as interest rates generally declined over the reporting period.
Contributors to performance
The fund generated a high level of income which had a positive impact on performance. The fund’s relative exposure to Euro currency also contributed to results.
Over the reporting period, holdings of European government bonds aided relative performance.
The fund’s greater exposure to the long end of the credit curve also benefited results as spreads on shorter maturity corporate bonds widened more than spreads on longer maturity corporate bonds. This helped offset some of the negative impact that came from the fund’s sector and credit quality exposure.
MFS Strategic Value Portfolio
Summary of Results
For the twelve months ended December 31, 2007, Initial Class shares of the MFS Strategic Value Portfolio (the “fund”) provided a total return of - -2.33%, while Service Class shares provided a total return of -2.62%. These compare with a return of -0.17% for the fund’s benchmark, the Russell 1000 Value Index. Effective December 1, 2007, the Russell 3000 Value Index became the fund’s benchmark. For the period December 31, 2006 to November 30, 2007, the fund’s benchmark was the Russell 1000 Value Index. The Russell 3000 Value Index generated a return of -1.01% for the twelve months ended December 31, 2007.
Detractors from performance
Stock selection in the health care sector was a principal factor holding back performance relative to the Russell 1000 Value Index. Within this sector, biotechnology firm Amgen and medical device maker Boston Scientific were among the top detractors. Shares of Amgen suffered, in part, due to studies that raised concerns about the safety profile of the company’s anemia drug Aranesp.
The combination of an overweighted position and stock selection in the autos and housing sector also had a negative impact on relative returns. Holdings of home improvement products maker Masco was particularly disappointing. Masco’s shares were hurt by the deterioration of the housing markets and the company’s pessimistic guidance that cited a recent decrease in housing starts.
The combination of stock selection and an underweighted position in the industrial goods and services sector dampened results. However, no individual stocks within this sector were among the fund’s top detractors.
Elsewhere, insurance companies Conseco and Genworth Financial, electronic brokerage firm E*Trade, telecommunications equipment company Nortel Networks(aa), media company New York Times(g), and department stores operator Macy’s hurt relative performance. Not holding integrated oil and gas company Exxon Mobil, for most of the reporting period, also had a negative effect on results as the stock turned in strong performance during the period.
Contributors to performance
Boosted by stock selection, the basic materials sector was the largest contributing sector for this reporting period. Package manufacturer Owens-Illinois(g) was a standout performer. The
company reported quarterly earnings that exceeded consensus expectations, and attributed the positive results to better operating performance in its glass factories and improved pricing and product sales mix.
An underweighted position in the financial services sector was another positive factor. Not owning financial services giant Citigroup favorably affected relative returns as the company’s stock suffered amid the subprime mortgage crisis. Our overweighted position in shares of Bank of New York Mellon, which outperformed the Russell 1000 Value Index, also helped.
Stock selection in the utilities and communications sector also bolstered relative performance. Natural gas pipelines operator Williams Cos. and telecommunications services provider Verizon Communications were among the fund’s top contributors.
Top relative contributors in other sectors included oil and gas companies Anadarko Petroleum and Devon Energy, drilling rig operator GlobalSantaFe(g), software developer Compuware(g), and filtration and separation systems manufacturer Pall.
MFS Technology Portfolio
Summary of Results
For the twelve months ended December 31, 2007, Initial Class shares of the MFS Technology Portfolio (the “fund”) provided a total return of 20.22%, while Service Class shares provided a total return of 20.00%. These compare with returns of 5.49% and 16.94% for the fund’s benchmarks, the Standard & Poor’s 500 Stock Index and the Goldman Sachs Technology Industry Composite Index (GSTI Composite Index), respectively.
Contributors to performance
Stock selection in the internet industry was a primary driver of performance relative to the GSTI Composite Index over the reporting period. Our positioning in internet software service provider Tencent Holdings(aa) contributed significantly to performance. The share price of Tencent Holdings appreciated significantly over the year due to better-than-expected progress in monetizing its large customer base within the Chinese social networking instant messaging segments. The fund’s holdings in the stocks of on-line information service provider NHN(g)(aa) and Chinese language internet search provider Baidu.Com(g)(aa) were also significant contributors to relative performance. Over the reporting period, our holdings of analytic software service provider Omniture(aa) also helped results.
Stock selection and, to a lesser extent, our overweighting in the leisure and toys industry benefited performance. The fund’s holdings of video game publishing and distribution company Ubisoft Entertainment were a strong contributor to performance. Ubisoft’s stock gained due to its participation in the current video game console cycle, new title releases, and success with existing franchises.
A combination of stock selection and an underweighted position in the network and telecom industry added to positive results over the reporting period. Underweighting network equipment giant Cisco(g) helped relative performance as the stock underperformed the GSTI Composite Index.
Stock selection in the computer software industry was also helpful to performance. Our overweighting in business intelligence
6
software firm Microstrategy and digital commerce company Verisign benefited performance as the returns of both stocks surpassed that of the GSTI Composite Index.
Other positives for relative performance included our holdings of Salesforce.com. The company’s share price was up markedly due to success driven by the accelerated adoption of its next generation software service for customer relationship management.
Another positive for relative performance included our holdings of Japanese video game console maker Nintendo. The company benefited from the runaway success of their Wii gaming console.
Detractors from performance
A combination of stock selection and an underweighted position in the computer systems industry was a principal factor that negatively affected the fund’s relative performance. Our positioning in computer and personal electronics maker Apple(g) hindered results over the reporting period. We owned Apple for a portion of the period but exited too early as subsequent excitement over the iPhone and Mac computers propelled the stock to new highs. Other factors that detracted from performance included our positioning in network storage company Network Appliance, and manufacturer and marketer of high performance computer systems Cray Inc.(aa). Network Appliance disappointed by missing earnings estimates due to weakness in the high end of its storage systems at its core business.
The fund’s allocation to the broadcasting industry, which is not represented in the GSTI Composite Index, also held back results. Here, our positioning in XM Satellite Radio proved disappointing as the stock underperformed the GSTI Composite Index over the reporting period.
Stocks in other areas that detracted from performance included networking chip maker Marvell Technology. Shares of Marvell struggled after the company reported a disappointing earnings outlook and from issues surrounding a stock options scandal. Our positioning in non-benchmark constituent MSC Software, an enterprise software company, and telecommunications equipment provider Sonus Networks hurt relative results. Elsewhere, missing the run-up in the price of internet retailer Amazon.com was another negative.
The views expressed in this report are those of the portfolio managers only through the end of the period of the report as stated on the cover and do not necessarily reflect the views of MFS or any other person in the MFS organization. These views are subject to change at any time based on market and other conditions, and MFS disclaims any responsibility to update such views. These views may not be relied upon as investment advice or an indication of trading intent on behalf of any MFS portfolio. References to specific securities are not recommendations of such securities, and may not be representative of any MFS portfolio’s current or future investments.
| (aa) | Security is not a benchmark constituent. |
| (d) | Duration is a measure of how much a bond’s price is likely to fluctuate with general changes in interest rates, e.g., if rates rise 1.00%, a bond with a 5-year duration is likely to lose about 5.00% of its value. |
| (g) | Security was not held in the portfolio at period end. |
| (s) | Bonds rated “BBB”, “Baa”, or higher are considered investment grade; bonds rated “BB”, “Ba”, or below are considered non-investment grade. The primary source for bond quality ratings is Moody’s Investors Service. If not available, ratings by Standard & Poor’s are used, else ratings by Fitch, Inc. For securities which are not rated by any of the three agencies, the security is considered Not Rated. |
| (y) | A yield curve graphically depicts the yields of different maturity bonds of the same credit quality and type; a normal yield curve is upward sloping, with short-term rates lower than long-term rates. |
7
Portfolio Composition — MFS Capital Appreciation Portfolio
Portfolio Structure
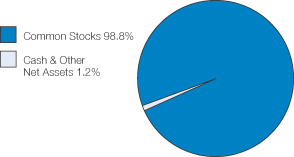
| | |
| Top ten holdings | | |
| Microsoft Corp. | | 3.0% |
| Google, Inc., “A” | | 2.8% |
| Cisco Systems, Inc. | | 2.5% |
| Oracle Corp. | | 2.5% |
| Genzyme Corp. | | 2.2% |
| Procter & Gamble Co. | | 2.2% |
| Amdocs Ltd. | | 2.2% |
| State Street Corp. | | 2.1% |
| Medtronic, Inc. | | 2.1% |
| Roche Holding AG | | 2.0% |
| | |
| Equity sectors | | |
| Technology | | 23.8% |
| Health Care | | 18.6% |
| Financial Services | | 10.3% |
| Consumer Staples | | 9.2% |
| Retailing | | 9.0% |
| Industrial Goods & Services | | 7.0% |
| Special Products & Services | | 5.7% |
| Energy | | 5.6% |
| Leisure | | 4.7% |
| Utilities & Communications | | 1.8% |
| Transportation | | 1.2% |
| Basic Materials | | 1.1% |
| Autos & Housing | | 0.8% |
Percentages are based on net assets as of 12/31/07.
The portfolio is actively managed and current holdings may be different.
8
Portfolio Composition — MFS Emerging Growth Portfolio
Portfolio Structure
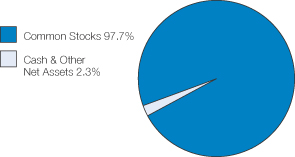
| | |
| Top ten holdings | | |
| Google, Inc., “A” | | 2.7% |
| VeriSign, Inc. | | 2.6% |
| Intel Corp. | | 2.1% |
| Electronic Arts, Inc. | | 1.9% |
| Nestle S.A. | | 1.7% |
| Merck & Co., Inc. | | 1.7% |
| PepsiCo, Inc. | | 1.7% |
| Danaher Corp. | | 1.6% |
| Lockheed Martin Corp. | | 1.6% |
| Altria Group, Inc. | | 1.6% |
| | |
| Equity sectors | | |
| Technology | | 22.2% |
| Health Care | | 15.1% |
| Industrial Goods & Services | | 9.0% |
| Leisure | | 8.7% |
| Energy | | 8.6% |
| Retailing | | 7.0% |
| Financial Services | | 6.8% |
| Utilities & Communications | | 6.2% |
| Consumer Staples | | 5.7% |
| Special Products & Services | | 5.5% |
| Basic Materials | | 2.9% |
Percentages are based on net assets as of 12/31/07.
The portfolio is actively managed and current holdings may be different.
9
Portfolio Composition — MFS Global Governments Portfolio
Portfolio Structure (i)
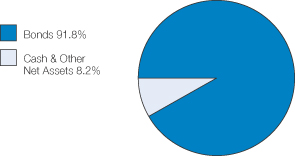
| | |
| Fixed income sectors (i) | | |
| Non-U.S. Government Bonds | | 66.2% |
| U.S. Treasury Securities | | 14.0% |
| Commercial Mortgage-Backed Securities | | 4.7% |
| Emerging Market Bonds | | 3.0% |
| U.S. Government Agencies | | 2.2% |
| Mortgage-Backed Securities | | 1.1% |
| Municipal Bonds | | 0.6% |
| | |
| Credit quality of bonds (r) | | |
| AAA | | 68.2% |
| AA | | 10.5% |
| A | | 18.0% |
| BBB | | 3.3% |
| | |
| Portfolio facts | | |
| Average Duration (d)(i) | | 6.6 |
| Average Life (i)(m) | | 8.8 yrs. |
| Average Maturity (i)(m) | | 9.8 yrs. |
Average Credit Quality of Rated Securities
(long-term) (a) | | AA+ |
Average Credit Quality of Rated Securities
(short-term) (a) | | A-1 |
| | |
| Country weightings (i) | | |
| United States | | 30.5% |
| Japan | | 23.7% |
| United Kingdom | | 9.9% |
| Germany | | 8.2% |
| France | | 5.0% |
| Belgium | | 4.2% |
| Italy | | 4.1% |
| Spain | | 4.0% |
| Netherlands | | 3.5% |
| Other Countries | | 6.9% |
| (a) | The average credit quality of rated securities is based upon a market weighted average of portfolio holdings that are rated by public rating agencies. |
| (d) | Duration is a measure of how much a bond’s price is likely to fluctuate with general changes in interest rates, e.g., if rates rise 1.00%, a bond with a 5-year duration is likely to lose about 5.00% of its value. |
| (i) | For purposes of this presentation, the bond component includes accrued interest amounts and may be positively or negatively impacted by the equivalent exposure from any derivative holdings, if applicable. |
| (m) | The average maturity shown is calculated using the final stated maturity on the portfolio’s holdings without taking into account any holdings which have been pre-refunded or pre-paid to an earlier date or which have a mandatory put date prior to the stated maturity. The average life shown takes into account these earlier dates. |
| (r) | Each security is assigned a rating from Moody’s Investors Service. If not rated by Moody’s, the rating will be that assigned by Standard & Poor’s. Likewise, if not assigned a rating by Standard & Poor’s, it will be based on the rating assigned by Fitch, Inc. For those portfolios that hold a security which is not rated by any of the three agencies, the security is considered Not Rated. Holdings in U.S. Treasuries and government agency mortgage-backed securities, if any, are included in the “AAA”-rating category. Percentages are based on the total market value of investments as of 12/31/07. |
Percentages are based on net assets as of 12/31/07, unless otherwise noted.
The portfolio is actively managed and current holdings may be different.
10
Portfolio Composition — MFS Massachusetts Investors Growth Stock Portfolio
Portfolio Structure
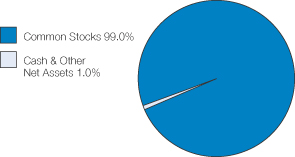
| | |
| Top ten holdings | | |
| Microsoft Corp. | | 3.0% |
| Google, Inc., “A” | | 2.8% |
| Cisco Systems, Inc. | | 2.5% |
| Oracle Corp. | | 2.5% |
| Genzyme Corp. | | 2.2% |
| Procter & Gamble Co. | | 2.2% |
| Amdocs Ltd. | | 2.2% |
| State Street Corp. | | 2.1% |
| Medtronic, Inc. | | 2.1% |
| Roche Holding AG | | 2.0% |
| | |
| Equity sectors | | |
| Technology | | 23.9% |
| Health Care | | 18.7% |
| Financial Services | | 10.3% |
| Consumer Staples | | 9.2% |
| Retailing | | 9.0% |
| Industrial Goods & Services | | 7.0% |
| Special Products & Services | | 5.7% |
| Energy | | 5.6% |
| Leisure | | 4.7% |
| Utilities & Communications | | 1.8% |
| Transportation | | 1.1% |
| Basic Materials | | 1.1% |
| Autos & Housing | | 0.9% |
Percentages are based on net assets as of 12/31/07.
The portfolio is actively managed and current holdings may be different.
11
Portfolio Composition — MFS Mid Cap Growth Portfolio
Portfolio Structure
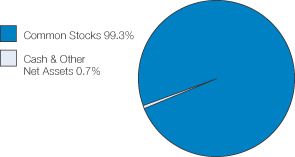
| | |
| Top ten holdings | | |
| Hess Corp. | | 3.3% |
| Williams Cos., Inc. | | 2.8% |
| Apollo Group, Inc., “A” | | 2.8% |
| Noble Corp. | | 2.8% |
| International Game Technology | | 2.5% |
| McAfee, Inc. | | 2.5% |
| Rockwell Automation, Inc. | | 2.4% |
| Humana, Inc. | | 2.4% |
| VeriSign, Inc. | | 2.3% |
| YUM! Brands, Inc. | | 2.3% |
| | |
| Equity sectors | | |
| Technology | | 17.8% |
| Health Care | | 14.4% |
| Energy | | 12.0% |
| Industrial Goods & Services | | 9.6% |
| Leisure | | 8.7% |
| Utilities & Communications | | 6.8% |
| Special Products & Services | | 6.3% |
| Retailing | | 6.3% |
| Financial Services | | 6.1% |
| Basic Materials | | 4.1% |
| Consumer Staples | | 3.7% |
| Autos & Housing | | 2.7% |
| Transportation | | 0.8% |
Percentages are based on net assets as of 12/31/07.
The portfolio is actively managed and current holdings may be different.
12
Portfolio Composition — MFS Mid Cap Value Portfolio
Portfolio Structure
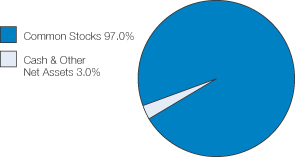
| | |
| Top ten holdings | | |
| Hess Corp. | | 4.2% |
| Eaton Corp. | | 3.2% |
| Timken Co. | | 2.4% |
| NRG Energy, Inc. | | 2.3% |
| El Paso Corp. | | 2.3% |
| Constellation Energy Group, Inc. | | 2.2% |
| PPG Industries, Inc. | | 2.1% |
| Williams Cos., Inc. | | 2.1% |
| Genworth Financial, Inc., “A” | | 2.1% |
| Pepco Holdings, Inc. | | 2.1% |
| | |
| Equity sectors | | |
| Financial Services | | 23.0% |
| Utilities & Communications | | 21.3% |
| Industrial Goods & Services | | 12.1% |
| Technology | | 5.7% |
| Leisure | | 5.7% |
| Basic Materials | | 5.5% |
| Consumer Staples | | 5.2% |
| Health Care | | 5.1% |
| Energy | | 4.2% |
| Retailing | | 4.0% |
| Autos & Housing | | 3.9% |
| Special Products & Services | | 1.3% |
Percentages are based on net assets as of 12/31/07.
The portfolio is actively managed and current holdings may be different.
13
Portfolio Composition — MFS Money Market Portfolio
Portfolio Structure (u)
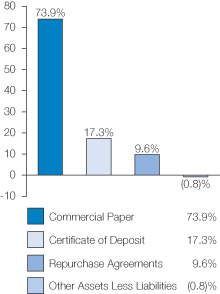
| | |
| Short-term credit quality (q) | | |
| Average Credit Quality Short-Term Bonds (a) | | A-1 |
| All holdings are rated A-1 | | |
| | |
| Maturity breakdown (u) | | |
| 0 – 29 days | | 45.1% |
| 30 – 59 days | | 39.5% |
| 60 – 89 days | | 11.4% |
| 90 – 366 days | | 4.8% |
| Other Assets Less Liabilities | | (0.8)% |
| (a) | The average credit quality is based upon a market weighted average of portfolio holdings that are rated by public rating agencies. |
| (q) | Each security is assigned a rating from Moody’s Investors Service. If not rated by Moody’s, the rating will be that assigned by Standard & Poor’s. Likewise, if not assigned a rating by Standard & Poor’s, it will be based on the rating assigned by Fitch, Inc. If not rated by any of the three agencies, the security is considered Not Rated. U.S. Treasuries and U.S. Agency securities are included in the “A-1”-rating category. Percentages are based on the total market value of investments as of 12/31/07. |
| (u) | For purposes of this presentation, accrued interest, where applicable, is included. |
From time to time ‘Other Assets Less Liabilities’ may be negative due to timing of cash receipts.
Percentages are based on net assets as of 12/31/07, unless otherwise noted.
The portfolio is actively managed and current holdings may be different.
14
Portfolio Composition — MFS New Discovery Portfolio
Portfolio Structure
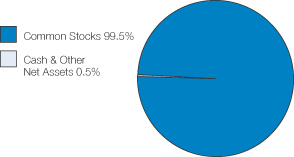
| | |
| Top ten holdings | | |
| Corporate Executive Board Co. | | 2.7% |
| NICE Systems Ltd., ADR | | 2.6% |
| MWI Veterinary Supply, Inc. | | 2.3% |
| Panera Bread Co., “A” | | 1.9% |
| Polypore International, Inc. | | 1.9% |
| Hittite Microwave Corp. | | 1.9% |
| Nuance Communications, Inc. | | 1.8% |
| Quanta Services, Inc. | | 1.8% |
| M.D.C. Holdings, Inc. | | 1.8% |
| THQ, Inc. | | 1.8% |
| | |
| Equity sectors | | |
| Health Care | | 25.0% |
| Technology | | 20.8% |
| Leisure | | 11.7% |
| Retailing | | 8.9% |
| Special Products & Services | | 7.6% |
| Industrial Goods & Services | | 7.0% |
| Energy | | 5.0% |
| Consumer Staples | | 3.7% |
| Autos & Housing | | 3.2% |
| Basic Materials | | 2.7% |
| Financial Services | | 2.1% |
| Utilities & Communications | | 1.3% |
| Transportation | | 0.5% |
| Percentages | are based on net assets as of 12/31/07. |
The portfolio is actively managed and current holdings may be different.
15
Portfolio Composition — MFS Research Portfolio
Portfolio Structure
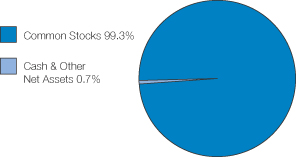
| | |
| Top ten holdings | | |
| Exxon Mobil Corp. | | 3.0% |
| Bank of New York Mellon Corp. | | 2.8% |
| Altria Group, Inc. | | 2.5% |
| International Business Machines Corp. | | 2.4% |
| Danaher Corp. | | 2.1% |
| PepsiCo, Inc. | | 2.1% |
| Merck & Co., Inc. | | 2.0% |
| AT&T, Inc. | | 1.9% |
| State Street Corp. | | 1.9% |
| JPMorgan Chase & Co. | | 1.8% |
| | |
| Equity sectors | | |
| Financial Services | | 18.7% |
| Technology | | 14.7% |
| Health Care | | 12.0% |
| Energy | | 10.9% |
| Utilities & Communications | | 8.7% |
| Consumer Staples | | 7.9% |
| Industrial Goods & Services | | 7.8% |
| Retailing | | 6.3% |
| Basic Materials | | 5.1% |
| Leisure | | 4.2% |
| Special Products & Services | | 2.3% |
| Autos & Housing | | 0.7% |
Percentages are based on net assets as of 12/31/07.
The portfolio is actively managed and current holdings may be different.
16
Portfolio Composition — MFS Strategic Income Portfolio
Portfolio Structure (i)
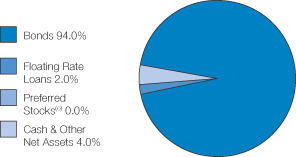
| | |
| Fixed income sectors (i) | | |
| High Yield Corporates | | 33.8% |
| High Grade Corporates | | 23.5% |
| Non-U.S. Government Bonds | | 14.0% |
| Emerging Market Bonds | | 12.0% |
| Commercial Mortgage-Backed Securities | | 4.6% |
| Mortgage-Backed Securities | | 4.5% |
| U.S. Government Agencies | | 2.9% |
| Floating Rate Loans | | 2.0% |
| Asset-Backed Securities | | 0.7% |
Collateralized Debt Obligations | | 0.6% |
| U.S. Treasury Securities | | (2.6)% |
| | |
| Credit quality of bonds (r) | | |
| AAA | | 22.3% |
| AA | | 5.2% |
| A | | 10.1% |
| BBB | | 19.5% |
| BB | | 18.3% |
| B | | 19.3% |
| CCC | | 5.1% |
| Not Rated | | 0.2% |
| |
| Portfolio facts | | |
| Average Duration (d)(i) | | 4.9 |
| Average Life (i)(m) | | 7.6 yrs. |
| Average Maturity (i)(m) | | 11.4 yrs. |
Average Credit Quality of Rated Securities
(long-term) (a) | | BBB |
Average Credit Quality of Rated Securities
(short-term) (a) | | A-1 |
| |
| Country weightings (i) | | |
| United States | | 65.2% |
| Japan | | 3.6% |
| Germany | | 3.4% |
| Russia | | 2.9% |
| Netherlands | | 2.8% |
| France | | 2.1% |
| United Kingdom | | 1.9% |
| Canada | | 1.9% |
| Mexico | | 1.7% |
| Other Countries | | 14.5% |
| (a) | The average credit quality of rated securities is based upon a market weighted average of portfolio holdings that are rated by public rating agencies. |
| (d) | Duration is a measure of how much a bond’s price is likely to fluctuate with general changes in interest rates, e.g., if rates rise 1.00%, a bond with a 5-year duration is likely to lose about 5.00% of its value. |
| (i) | For purposes of this presentation, the bond component includes accrued interest amounts and may be positively or negatively impacted by the equivalent exposure from any derivative holdings, if applicable, which may result in the investment in a sector less than 0%. |
| (m) | The average maturity shown is calculated using the final stated maturity on the portfolio’s holdings without taking into account any holdings which have been pre-refunded or pre-paid to an earlier date or which have a mandatory put date prior to the stated maturity. The average life shown takes into account these earlier dates. |
| (r) | Each security is assigned a rating from Moody’s Investors Service. If not rated by Moody’s, the rating will be that assigned by Standard & Poor’s. Likewise, if not assigned a rating by Standard & Poor’s, it will be based on the rating assigned by Fitch, Inc. For those portfolios that hold a security which is not rated by any of the three agencies, the security is considered Not Rated. Holdings in U.S. Treasuries and government agency mortgage-backed securities, if any, are included in the “AAA”-rating category. Percentages are based on the total market value of investments as of 12/31/07. |
Percentages are based on net assets as of 12/31/07, unless otherwise noted.
The portfolio is actively managed and current holdings may be different.
17
Portfolio Composition — MFS Strategic Value Portfolio
Portfolio Structure

| | |
| Top ten holdings | | |
| Travelers Cos., Inc. | | 2.7% |
| Genworth Financial, Inc., “A” | | 2.7% |
| Conseco, Inc. | | 2.2% |
| D.R. Horton, Inc. | | 2.0% |
| Amgen, Inc. | | 2.0% |
| Boston Scientific Corp. | | 2.0% |
| Wyeth | | 2.0% |
| TOTAL S.A., ADR | | 1.9% |
| Macy’s, Inc. | | 1.9% |
| Staples, Inc. | | 1.8% |
| | |
| Equity sectors | | |
| Financial Services | | 27.2% |
| Utilities & Communications | | 12.6% |
| Health Care | | 12.4% |
| Energy | | 11.2% |
| Autos & Housing | | 7.7% |
| Industrial Goods & Services | | 5.2% |
| Consumer Staples | | 5.2% |
| Retailing | | 4.7% |
| Technology | | 4.5% |
| Leisure | | 4.1% |
| Basic Materials | | 2.8% |
| Special Products & Services | | 1.5% |
Percentages are based on net assets as of 12/31/07.
The portfolio is actively managed and current holdings may be different.
18
.
Portfolio Composition — MFS Technology Portfolio
Portfolio Structure
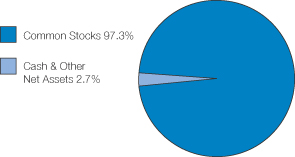
| | |
| Top ten holdings | | |
| Intel Corp. | | 9.7% |
| Flextronics International Ltd. | | 7.2% |
| International Business Machines Corp. | | 6.5% |
| MSC Software Corp. | | 4.5% |
| Salesforce.com, Inc. | | 4.5% |
| Microsoft Corp. | | 4.1% |
| MicroStrategy, Inc., “A” | | 4.0% |
| Research In Motion Ltd. | | 4.0% |
| Google, Inc., “A” | | 3.8% |
| VeriSign, Inc. | | 3.5% |
| | |
| Top five industries | | |
| Electronics | | 29.9% |
| Computer Software | | 20.6% |
| Computer Systems | | 14.6% |
| Network & Telecom | | 9.6% |
| Leisure & Toys | | 8.6% |
Percentages are based on net assets as of 12/31/07.
The portfolio is actively managed and current holdings may be different.
19
Performance Summary
The following charts illustrate the historical performance of the funds in comparison to their benchmark index. Index comparisons are unmanaged; do not reflect any fees or expenses; and cannot be invested in directly. The performance of other share classes will be greater than or less than that of the class depicted below. (See Notes to Performance Summary.)
Performance data shown represents past performance and is no guarantee of future results. Investment return and principal value fluctuate so your units, when sold, may be worth more or less than the original cost; current performance may be lower or higher than quoted. The performance shown does not reflect the deduction of taxes, if any, that a contract holder would pay on fund distributions or the redemption of contract units. The returns for the funds shown also do not reflect the deduction of expenses associated with variable products, such as mortality and expense risk charges, separate account charges, and sales charges imposed by the insurance company separate accounts. Such expenses would reduce the overall returns shown.
MFS Capital Appreciation Portfolio
Growth of a hypothetical $10,000 investment
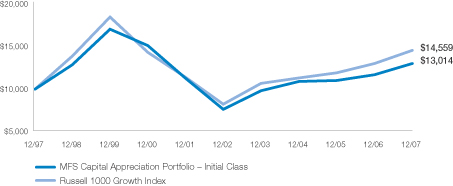
Total Returns through 12/31/07
Average Annual Total Returns
| | | | | | | | |
| Share Class | | Class Inception Date | | 1-yr | | 5-yr | | 10-yr |
Initial Class | | 6/12/85 | | 11.14% | | 11.26% | | 2.67% |
Service Class | | 8/24/01 | | 10.93% | | 10.98% | | 2.51% |
| | | | |
| Comparative Index | | | | | | | | |
| Russell 1000 Growth Index (f) | | | | 11.81% | | 12.11% | | 3.83% |
| (f) | Source: FactSet Research Systems Inc. |
20
Performance Summary — continued
MFS Emerging Growth Portfolio
Growth of a hypothetical $10,000 investment
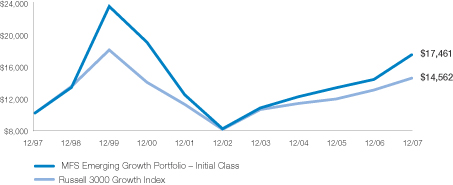
Total Returns through 12/31/07
Average Annual Total Returns
| | | | | | | | |
| Share Class | | Class Inception Date | | 1-yr | | 5-yr | | 10-yr |
| Initial Class | | 5/01/95 | | 21.25% | | 16.31% | | 5.73% |
| Service Class | | 8/24/01 | | 21.00% | | 16.02% | | 5.56% |
| | | | |
| Comparative Index | | | | | | | | |
| Russell 3000 Growth Index (f) | | | | 11.40% | | 12.42% | | 3.83% |
| (f) | Source: FactSet Research Systems Inc. |
MFS Global Governments Portfolio
Growth of a hypothetical $10,000 investment
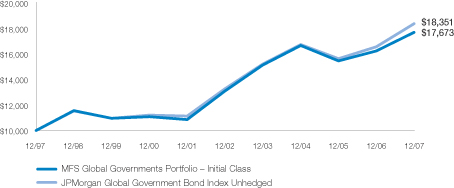
Total Returns through 12/31/07
Average Annual Total Returns
| | | | | | | | |
| Share Class | | Class Inception Date | | 1-yr | | 5-yr | | 10-yr |
| Initial Class | | 5/16/88 | | 8.99% | | 6.19% | | 5.86% |
| Service Class | | 8/24/01 | | 8.67% | | 5.91% | | 5.68% |
| | | | |
| Comparative Index | | | | | | | | |
| JPMorgan Global Government Bond Index Unhedged (f) | | 10.81% | | 6.71% | | 6.26% |
| (f) | Source: FactSet Research Systems Inc. |
21
Performance Summary — continued
MFS Massachusetts Investors Growth Stock Portfolio
Growth of a hypothetical $10,000 investment(t)
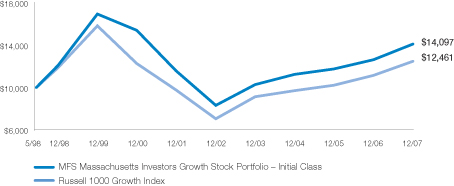
Total Returns through 12/31/07
Average Annual Total Returns
| | | | | | | | |
| Share Class | | Class Inception Date | | 1-yr | | 5-yr | | Life (t) |
| Initial Class | | 5/06/98 | | 11.53% | | 11.13% | | 3.62% |
| Service Class | | 8/24/01 | | 11.26% | | 10.83% | | 3.46% |
| | | | |
| Comparative Index | | | | | | | | |
| Russell 1000 Growth Index (f) | | | | 11.81% | | 12.11% | | 2.30% |
| (f) | Source: FactSet Research Systems Inc. |
| (t) | For the period from the commencement of the fund’s investment operations, May 6, 1998, through the stated period end. |
MFS Mid Cap Growth Portfolio
Growth of a hypothetical $10,000 investment(t)
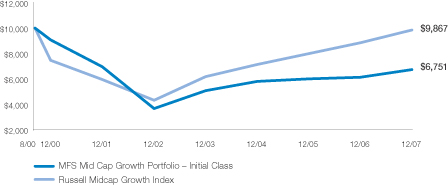
Total Returns through 12/31/07
Average Annual Total Returns
| | | | | | | | | | |
| Share Class | | Class Inception Date | | 1-yr | | | 5-yr | | Life (t) |
| Initial Class | | 8/31/00 | | 9.84 | % | | 12.87% | | – | 5.21% |
| Service Class | | 8/24/01 | | 9.59 | % | | 12.56% | | – | 5.39% |
| | | | |
| Comparative Index | | | | | | | | | |
| Russell Midcap Growth Index (f) | | | | 11.43 | % | | 17.90% | | – | 0.18% |
| (f) | Source: FactSet Research Systems Inc. |
| (t) | For the period from the commencement of the fund’s investment operations, August 31, 2000, through the stated period end. |
22
Performance Summary — continued
MFS Mid Cap Value Portfolio
Growth of a hypothetical $10,000 investment(t)
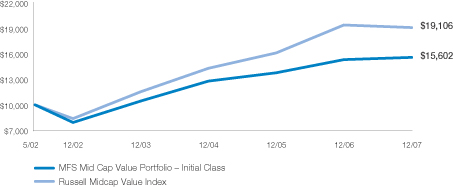
Total Returns through 12/31/07
Average Annual Total Returns
| | | | | | | | | |
| Share Class | | Class Inception Date | | 1-yr | | 5-yr | | Life (t) |
| Initial Class | | 5/01/02 | | | 1.84% | | 14.52% | | 8.16% |
| Service Class | | 5/01/02 | | | 1.61% | | 14.24% | | 7.95% |
| | | | |
| Comparative Index | | | | | | | | |
| Russell Midcap Value Index (f) | | | | – | 1.42% | | 17.92% | | 12.10% |
| (f) | Source: FactSet Research Systems Inc. |
| (t) | For the period from the commencement of the fund’s investment operations, May 1, 2002, through the stated period end. |
MFS Money Market Portfolio
Total Returns through 12/31/07
Average Annual Total Returns
| | | | | | |
Share Class | | Class Inception Date | | 1-Year Total Return | | Current 7-day yield (y) |
| Initial Class | | 7/19/85 | | 4.84% | | 4.21% |
| Service Class | | 8/24/01 | | 4.58% | | 3.96% |
| (y) | Based on the latest seven days ended as of December 31, 2007, with dividends annualized. The yield quotation more closely reflects the current earnings of the fund than the total return quotation. |
23
Performance Summary — continued
MFS New Discovery Portfolio
Growth of a hypothetical $10,000 investment(t)
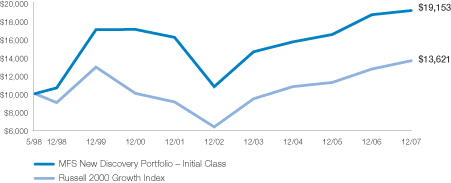
Total Returns through 12/31/07
Average Annual Total Returns
| | | | | | | | |
| Share Class | | Class Inception Date | | 1-yr | | 5-yr | | Life (t) |
| Initial Class | | 5/06/98 | | 2.56% | | 12.17% | | 6.96% |
| Service Class | | 8/24/01 | | 2.28% | | 11.90% | | 6.78% |
| | | | |
| Comparative Index | | | | | | | | |
| Russell 2000 Growth Index (f) | | | | 7.05% | | 16.50% | | 3.24% |
| (f) | Source: FactSet Research Systems Inc. |
| (t) | For the period from the commencement of the fund’s investment operations, May 6, 1998, through the stated period end. |
MFS Research Portfolio
Growth of a hypothetical $10,000 investment

Total Returns through 12/31/07
Average Annual Total Returns
| | | | | | | | |
| Share Class | | Class Inception Date | | 1-yr | | 5-yr | | 10-yr |
| Initial Class | | 11/07/94 | | 13.24% | | 14.44% | | 5.45% |
| Service Class | | 8/24/01 | | 12.97% | | 14.16% | | 5.27% |
| | | | |
| Comparative Index | | | | | | | | |
| Standard & Poor’s 500 Stock Index (f) | | | | 5.49% | | 12.83% | | 5.91% |
| (f) | Source: FactSet Research Systems Inc. |
24
Performance Summary — continued
MFS Strategic Income Portfolio
Growth of a hypothetical $10,000 investment(t)
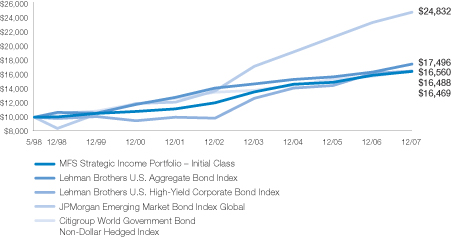
Total Returns through 12/31/07
Average Annual Total Returns
| | | | | | | | |
| Share Class | | Class Inception Date | | 1-yr | | 5-yr | | Life (t) |
| Initial Class | | 5/06/98 | | 3.49% | | 6.53% | | 5.30% |
| Service Class | | 8/24/01 | | 3.24% | | 6.25% | | 5.13% |
| | | | |
| Comparative Index | | | | | | | | |
| Citigroup World Government Bond Non-Dollar Hedged Index (f) | | | | 4.88% | | 4.13% | | 5.34% |
| JPMorgan Emerging Market Bond Index Global (f) | | | | 6.28% | | 12.67% | | 9.84% |
| Lehman Brothers U.S. Aggregate Bond Index (f) | | | | 6.97% | | 4.42% | | 5.94% |
| Lehman Brothers U.S. High-Yield Corporate Bond Index (f) | | | | 1.87% | | 10.91% | | 5.31% |
| (f) | Source: FactSet Research Systems Inc. |
| (t) | For the period from the commencement of the fund’s investment operations, May 6, 1998, through the stated period end. Index information for the Lehman Brothers U.S. High-Yield Corporate Bond Index is from May 1, 1998. |
25
Performance Summary — continued
MFS Strategic Value Portfolio
Growth of a hypothetical $10,000 investment(t)
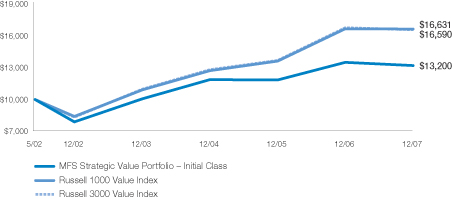
Total Returns through 12/31/07
Average Annual Total Returns
| | | | | | | | |
| Share Class | | Class Inception Date | | 1-yr | | 5-yr | | Life (t) |
| Initial Class | | 5/01/02 | | –2.33% | | 10.81% | | 5.02% |
| Service Class | | 5/01/02 | | –2.62% | | 10.50% | | 4.76% |
| | | | |
| Comparative Index | | | | | | | | |
| Russell 1000 Value Index (f) | | | | –0.17% | | 14.63% | | 9.39% |
| Russell 3000 Value Index | | | | –1.01% | | 14.69% | | 9.34% |
| (f) | Source: FactSet Research Systems Inc. |
| (t) | For the period from the commencement of the fund’s investment operations May 1, 2002 through the stated period end. |
MFS Technology Portfolio
Growth of a hypothetical $10,000 investment(t)
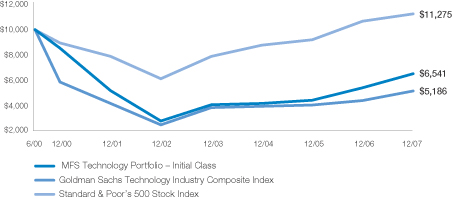
Total Returns through 12/31/07
Average Annual Total Returns
| | | | | | | | | |
| Share Class | | Class Inception Date | | 1-yr | | 5-yr | | Life (t) |
| Initial Class | | 6/16/00 | | 20.22% | | 18.32% | | – | 5.47% |
| Service Class | | 8/24/01 | | 20.00% | | 18.05% | | – | 5.70% |
| | | | |
| Comparative Index | | | | | | | | |
| Goldman Sachs Technology Industry Composite Index (f) | | | | 16.94% | | 15.58% | | – | 8.31% |
| Standard & Poor’s 500 Stock Index (f)(b) | | | | 5.49% | | 12.83% | | | 1.60% |
| (b) | MFS has added the S&P 500 Stock Index to compare the fund’s performance in order to show a broader based benchmark than the Goldman Sachs Technology Industry Composite Index. |
| (f) | Source: FactSet Research Systems Inc. |
| (t) | For the period from the commencement of the fund’s investment operations, June 16, 2000, through the stated period end. |
26
Performance Summary — continued
Index Definitions
Citigroup World Government Bond Non-Dollar Hedged Index — a market capitalization-weighted index that is designed to represent the currency-hedged performance of the international developed government bond markets, excluding the United States.
Goldman Sachs Technology Industry Composite Index — a modified market capitalization-weighted index that measures the performance of selected technology stocks.
JPMorgan Emerging Markets Bond Index Global (EMBI Global) — measures the performance of U.S.-dollar-denominated debt instruments issued by emerging market sovereign and quasi-sovereign entities: Brady bonds, loans, Eurobonds.
JPMorgan Global Government Bond Index Unhedged — measures the performance of developed government bond markets around the world.
Lehman Brothers U.S. Aggregate Bond Index — a market capitalization-weighted index that measures the performance of the U.S. investment-grade, fixed rate bond market, with index components for government and corporate securities, mortgage pass-through securities, and asset-backed securities with at least one year to final maturity.
Lehman Brothers U.S. High-Yield Corporate Bond Index — a market capitalization-weighted index that measures the performance of non-investment grade, fixed rate debt. Eurobonds and debt issues from countries designated as emerging markets (e.g., Argentina, Brazil, Venezuela, etc.) are excluded.
Russell 1000 Growth Index — constructed to provide a comprehensive barometer for growth securities in the large-cap segment of the U.S. equity universe. Companies in this index generally have higher price-to-book ratios and higher forecasted growth values.
Russell 1000 Value Index — constructed to provide a comprehensive barometer for the value securities in the large-cap segment of the U.S. equity universe. Companies in this index generally have lower price-to-book ratios and lower forecasted growth values.
Russell 2000 Growth Index — constructed to provide a comprehensive barometer for growth securities in the small-cap segment of the U.S. equity universe. Companies in this index generally have higher price-to-book ratios and higher forecasted growth values.
Russell 3000 Growth Index — constructed to provide a comprehensive barometer for growth securities in the small to large-cap segment of the U.S. equity universe. Companies in this index generally have higher price-to-book ratios and higher forecasted growth values.
Russell 3000 Value Index — constructed to provide a comprehensive barometer for the value securities in the small to large-cap segment of the U.S. equity universe. Companies in this index generally have lower price-to-book ratios and lower forecasted growth values.
Russell Midcap Growth Index — constructed to provide a comprehensive barometer for growth securities in the mid-cap segment of the U.S. equity universe. Companies in this index generally have higher price-to-book ratios and higher forecasted growth values.
Russell Midcap Value Index — constructed to provide a comprehensive barometer for value securities in the mid-cap segment of the U.S. equity universe. Companies in this index generally have lower price-to-book ratios and lower forecasted growth values.
Standard & Poor’s 500 Stock Index — a market capitalization-weighted index of 500 widely held equity securities, designed to measure broad U.S. equity performance.
It is not possible to invest directly in an index.
Notes to Performance Summary
Service Class share performance for all funds except MFS Mid Cap Value Portfolio and MFS Strategic Value Portfolio, includes the performance of Initial Class shares for periods prior to the inception of Service Class shares (blended performance). These blended performance figures have not been adjusted to take into account differences in the class-specific operating expenses (such as Rule 12b-1 fees). Because operating expenses of Service Class shares are generally higher than those of Initial Class shares, the blended Service Class share performance shown is higher than it would have been had Service Class shares been offered for the entire period.
Performance results reflect any applicable expense subsidies and waivers in effect during the periods shown. Without such subsidies and waivers each fund’s performance results would be less favorable. Please see the prospectus for complete details. All results are historical and assume the reinvestment of any dividends and capital gains distributions.
The returns for the funds shown do not reflect the deduction of expenses associated with variable products, such as mortality and expense risk charges, separate account charges, and sales charges imposed by the insurance company separate accounts. Such expenses would reduce the overall returns shown.
From time to time the funds may receive proceeds from litigation settlements, without which performance would be lower.
27
Expense Tables
Fund Expenses Borne by the Contract Holders During the Period,
July 1, 2007 through December 31, 2007
As a contract holder of a fund, you incur ongoing costs, including management fees; distribution (12b-1) fees; and other fund expenses. The examples are intended to help you understand your ongoing costs (in dollars) of investing in each fund and to compare these costs with the ongoing costs of investing in other mutual funds.
The examples are based on an investment of $1,000 invested at the beginning of the period and held for the entire period, July 1, 2007 through December 31, 2007.
Actual expenses
The first line for each share class in the following tables provides information about actual account values and actual expenses. You may use the information in this line, together with the amount you invested, to estimate the expenses that you paid over the period. Simply divide your account value by $1,000 (for example, an $8,600 account value divided by $1,000 = 8.6), then multiply the result by the number in the first line under the heading entitled “Expenses Paid During Period” to estimate the expenses you paid on your account during this period.
Hypothetical example for comparison purposes
The second line for each share class in the following tables provides information about hypothetical account values and hypothetical expenses based on each fund’s actual expense ratio and an assumed rate of return of 5% per year before expenses, which is not each fund’s actual return. The hypothetical account values and expenses may not be used to estimate the actual ending account balance or expenses you paid for the period. You may use this information to compare the ongoing costs of investing in each fund and other funds. To do so, compare this 5% hypothetical example with the 5% hypothetical examples that appear in the shareholder reports of the other funds.
Please note that the expenses shown in the tables are meant to highlight each fund’s ongoing costs only and do not take into account the fees and expenses imposed under the variable contracts through which your investment in each fund is made. Therefore, the second line for each share class in the tables is useful in comparing ongoing costs associated with an investment in vehicles (such as the fund) which fund benefits under variable annuity and variable life insurance contracts and to qualified pension and retirement plans only, and will not help you determine the relative total costs of investing in each fund through variable annuity and variable life insurance contracts. If the fees and expenses imposed under the variable contracts were included, your costs would have been higher.
| | | | | | | | | | | | |
MFS Capital
Appreciation
Portfolio | | Annualized
Expense
Ratio | | | Beginning
Account
Value
7/01/07 | | Ending
Account
Value
12/31/07 | | Expenses Paid
During Period (p)
7/01/07-12/31/07 |
| Initial Class | | | | | | | | | | | | |
Actual | | 0.84 | % | | $ | 1,000.00 | | $ | 1,036.50 | | $ | 4.31 |
Hypothetical (h) | | 0.84 | % | | $ | 1,000.00 | | $ | 1,020.97 | | $ | 4.28 |
| Service Class | | | | | | | | | | | | |
Actual | | 1.09 | % | | $ | 1,000.00 | | $ | 1,035.40 | | $ | 5.59 |
Hypothetical (h) | | 1.09 | % | | $ | 1,000.00 | | $ | 1,019.71 | | $ | 5.55 |
| | | | |
MFS Emerging
Growth
Portfolio | | | | | | | | | |
| Initial Class | | | | | | | | | | | | |
Actual | | 0.84 | % | | $ | 1,000.00 | | $ | 1,087.00 | | $ | 4.42 |
Hypothetical (h) | | 0.84 | % | | $ | 1,000.00 | | $ | 1,020.97 | | $ | 4.28 |
| Service Class | | | | | | | | | | | | |
Actual | | 1.09 | % | | $ | 1,000.00 | | $ | 1,085.80 | | $ | 5.73 |
Hypothetical (h) | | 1.09 | % | | $ | 1,000.00 | | $ | 1,019.71 | | $ | 5.55 |
| | | | |
MFS Global
Governments
Portfolio | | | | | | | | | |
| Initial Class | | | | | | | | | | | | |
Actual | | 1.00 | % | | $ | 1,000.00 | | $ | 1,100.10 | | $ | 5.29 |
Hypothetical (h) | | 1.00 | % | | $ | 1,000.00 | | $ | 1,020.16 | | $ | 5.09 |
| Service Class | | | | | | | | | | | | |
Actual | | 1.25 | % | | $ | 1,000.00 | | $ | 1,098.00 | | $ | 6.61 |
Hypothetical (h) | | 1.25 | % | | $ | 1,000.00 | | $ | 1,018.90 | | $ | 6.36 |
| | | | |
MFS
Massachusetts
Investors
Growth Stock
Portfolio | | | | | | | | | |
| Initial Class | | | | | | | | | | | | |
Actual | | 0.82 | % | | $ | 1,000.00 | | $ | 1,038.20 | | $ | 4.21 |
Hypothetical (h) | | 0.82 | % | | $ | 1,000.00 | | $ | 1,021.07 | | $ | 4.18 |
| Service Class | | | | | | | | | | | | |
Actual | | 1.07 | % | | $ | 1,000.00 | | $ | 1,036.70 | | $ | 5.49 |
Hypothetical (h) | | 1.07 | % | | $ | 1,000.00 | | $ | 1,019.81 | | $ | 5.45 |
| | | | |
MFS Mid Cap
Growth
Portfolio | | | | | | | | | |
| Initial Class | | | | | | | | | | | | |
Actual | | 0.87 | % | | $ | 1,000.00 | | $ | 985.30 | | $ | 4.35 |
Hypothetical (h) | | 0.87 | % | | $ | 1,000.00 | | $ | 1,020.82 | | $ | 4.43 |
| Service Class | | | | | | | | | | | | |
Actual | | 1.12 | % | | $ | 1,000.00 | | $ | 985.10 | | $ | 5.60 |
Hypothetical (h) | | 1.12 | % | | $ | 1,000.00 | | $ | 1,019.56 | | $ | 5.70 |
| | | | |
MFS Mid Cap
Value Portfolio | | | | | | | | | |
| Initial Class | | | | | | | | | | | | |
Actual | | 0.99 | % | | $ | 1,000.00 | | $ | 925.20 | | $ | 4.80 |
Hypothetical (h) | | 0.99 | % | | $ | 1,000.00 | | $ | 1,020.21 | | $ | 5.04 |
| Service Class | | | | | | | | | | | | |
Actual | | 1.24 | % | | $ | 1,000.00 | | $ | 923.70 | | $ | 6.01 |
Hypothetical (h) | | 1.24 | % | | $ | 1,000.00 | | $ | 1,018.95 | | $ | 6.31 |
28
Expense Tables — continued
Fund Expenses Borne by the Contract Holders During the Period,
July 1, 2007 through December 31, 2007 — continued
| | | | | | | | | | | | |
MFS Money
Market
Portfolio | | Annualized
Expense
Ratio | | | Beginning
Account
Value
7/01/07 | | Ending
Account
Value
12/31/07 | | Expenses Paid
During Period (p)
7/01/07-12/31/07 |
| Initial Class | | | | | | | | | | | | |
Actual | | 0.53 | % | | $ | 1,000.00 | | $ | 1,023.90 | | $ | 2.70 |
Hypothetical (h) | | 0.53 | % | | $ | 1,000.00 | | $ | 1,022.53 | | $ | 2.70 |
| Service Class | | | | | | | | | | | | |
Actual | | 0.78 | % | | $ | 1,000.00 | | $ | 1,022.60 | | $ | 3.98 |
Hypothetical (h) | | 0.78 | % | | $ | 1,000.00 | | $ | 1,021.27 | | $ | 3.97 |
| | | | |
MFS New
Discovery
Portfolio | | | | | | | | | |
| Initial Class | | | | | | | | | | | | |
Actual | | 0.95 | % | | $ | 1,000.00 | | $ | 937.60 | | $ | 4.64 |
Hypothetical (h) | | 0.95 | % | | $ | 1,000.00 | | $ | 1,020.42 | | $ | 4.84 |
| Service Class | | | | | | | | | | | | |
Actual | | 1.20 | % | | $ | 1,000.00 | | $ | 936.10 | | $ | 5.86 |
Hypothetical (h) | | 1.20 | % | | $ | 1,000.00 | | $ | 1,019.16 | | $ | 6.11 |
| | | | |
MFS Research
Portfolio | | | | | | | | | |
| Initial Class | | | | | | | | | | | | |
Actual | | 0.84 | % | | $ | 1,000.00 | | $ | 1,029.40 | | $ | 4.30 |
Hypothetical (h) | | 0.84 | % | | $ | 1,000.00 | | $ | 1,020.97 | | $ | 4.28 |
| Service Class | | | | | | | | | | | | |
Actual | | 1.09 | % | | $ | 1,000.00 | | $ | 1,028.10 | | $ | 5.57 |
Hypothetical (h) | | 1.09 | % | | $ | 1,000.00 | | $ | 1,019.71 | | $ | 5.55 |
| | | | |
MFS Strategic
Income
Portfolio | | | | | | | | | |
| Initial Class | | | | | | | | | | | | |
Actual | | 0.90 | % | | $ | 1,000.00 | | $ | 1,020.60 | | $ | 4.58 |
Hypothetical (h) | | 0.90 | % | | $ | 1,000.00 | | $ | 1,020.67 | | $ | 4.58 |
| Service Class | | | | | | | | | | | | |
Actual | | 1.15 | % | | $ | 1,000.00 | | $ | 1,018.70 | | $ | 5.85 |
Hypothetical (h) | | 1.15 | % | | $ | 1,000.00 | | $ | 1,019.41 | | $ | 5.85 |
| | | | |
MFS Strategic
Value Portfolio | | | | | | | | | |
| Initial Class | | | | | | | | | | | | |
Actual | | 0.99 | % | | $ | 1,000.00 | | $ | 879.40 | | $ | 4.69 |
Hypothetical (h) | | 0.99 | % | | $ | 1,000.00 | | $ | 1,020.21 | | $ | 5.04 |
| Service Class | | | | | | | | | | | | |
Actual | | 1.24 | % | | $ | 1,000.00 | | $ | 877.90 | | $ | 5.87 |
Hypothetical (h) | | 1.24 | % | | $ | 1,000.00 | | $ | 1,018.95 | | $ | 6.31 |
| | | | |
MFS
Technology
Portfolio | | | | | | | | | |
| Initial Class | | | | | | | | | | | | |
Actual | | 1.00 | % | | $ | 1,000.00 | | $ | 1,088.20 | | $ | 5.26 |
Hypothetical (h) | | 1.00 | % | | $ | 1,000.00 | | $ | 1,020.16 | | $ | 5.09 |
| Service Class | | | | | | | | | | | | |
Actual | | 1.25 | % | | $ | 1,000.00 | | $ | 1,086.30 | | $ | 6.57 |
Hypothetical (h) | | 1.25 | % | | $ | 1,000.00 | | $ | 1,018.90 | | $ | 6.36 |
| (h) | 5% class return per year before expenses. |
| (p) | Expenses paid is equal to each class’ annualized expense ratio, as shown above, multiplied by the average account value over the period, multiplied by the number of days in the period, divided by the number of days in the year. |
29
Portfolio of Investments — December 31, 2007
MFS Capital Appreciation Portfolio
Common Stocks — 98.8%
| | | | | |
| Issuer | | Shares/Par | | Value ($) |
| | | | | |
Aerospace — 2.8% |
Precision Castparts Corp. | | 28,960 | | $ | 4,016,749 |
United Technologies Corp. | | 125,820 | | | 9,630,263 |
| | | | | |
| | | | $ | 13,647,012 |
| | | | | |
Alcoholic Beverages — 1.4% |
Diageo PLC | | 318,360 | | $ | 6,814,642 |
| | | | | |
Apparel Manufacturers — 2.9% |
LVMH Moet Hennessy Louis Vuitton S.A. | | 67,390 | | $ | 8,099,630 |
NIKE, Inc., “B” | | 93,670 | | | 6,017,361 |
| | | | | |
| | | | $ | 14,116,991 |
| | | | | |
Automotive — 0.8% |
Bayerische Motoren Werke AG | | 65,530 | | $ | 4,046,549 |
| | | | | |
Biotechnology — 4.2% |
Amgen, Inc. (a) | | 47,750 | | $ | 2,217,510 |
Celgene Corp. (a) | | 43,420 | | | 2,006,438 |
Genentech, Inc. (a) | | 32,450 | | | 2,176,422 |
Genzyme Corp. (a) | | 141,260 | | | 10,515,394 |
Millipore Corp. (a) | | 46,410 | | | 3,396,284 |
| | | | | |
| | | | $ | 20,312,048 |
| | | | | |
Broadcasting — 2.0% |
News Corp., “A” | | 254,310 | | $ | 5,210,812 |
Omnicom Group, Inc. | | 96,230 | | | 4,573,812 |
| | | | | |
| | | | $ | 9,784,624 |
| | | | | |
Brokerage & Asset Managers — 3.6% |
Bolsa de Mercadorias & Futuros (a) | | 18,800 | | $ | 264,045 |
Charles Schwab Corp. | | 249,600 | | | 6,377,280 |
Deutsche Boerse AG | | 35,270 | | | 6,961,625 |
Franklin Resources, Inc. | | 7,770 | | | 889,121 |
ICAP PLC | | 202,010 | | | 2,907,519 |
| | | | | |
| | | | $ | 17,399,590 |
| | | | | |
Business Services — 4.5% |
Amdocs Ltd. (a) | | 302,680 | | $ | 10,433,380 |
Automatic Data Processing, Inc. | | 71,730 | | | 3,194,137 |
Fidelity National Information Services, Inc. | | 51,180 | | | 2,128,576 |
Western Union Co. | | 238,590 | | | 5,792,965 |
| | | | | |
| | | | $ | 21,549,058 |
| | | | | |
Cable TV — 0.9% |
Comcast Corp., “A” (a) | | 238,800 | | $ | 4,360,488 |
| | | | | |
Computer Software — 6.7% |
Citrix Systems, Inc. (a) | | 82,510 | | $ | 3,136,205 |
Microsoft Corp. | | 403,030 | | | 14,347,868 |
Oracle Corp. (a) | | 534,640 | | | 12,072,171 |
VeriSign, Inc. (a) | | 74,490 | | | 2,801,569 |
| | | | | |
| | | | $ | 32,357,813 |
| | | | | |
Computer Software — Systems — 4.3% |
Apple Computer, Inc. (a) | | 32,430 | | $ | 6,423,734 |
Dell, Inc. (a) | | 154,890 | | | 3,796,354 |
EMC Corp. (a) | | 217,660 | | | 4,033,240 |
International Business Machines Corp. | | 36,780 | | | 3,975,918 |
Network Appliance, Inc. (a) | | 102,950 | | | 2,569,632 |
| | | | | |
| | | | $ | 20,798,878 |
| | | | | |
Consumer Goods & Services — 4.1% |
Apollo Group, Inc., “A” (a) | | 32,040 | | $ | 2,247,606 |
Colgate-Palmolive Co. | | 40,570 | | | 3,162,837 |
| | | | | |
| Issuer | | Shares/Par | | Value ($) |
| | | | | |
Consumer Goods & Services — continued |
eBay, Inc. (a) | | 109,260 | | $ | 3,626,339 |
Procter & Gamble Co. | | 143,020 | | | 10,500,528 |
| | | | | |
| | | | $ | 19,537,310 |
| | | | | |
Electrical Equipment — 4.2% |
Danaher Corp. | | 107,450 | | $ | 9,427,663 |
General Electric Co. | | 194,320 | | | 7,203,442 |
W.W. Grainger, Inc. | | 41,040 | | | 3,591,821 |
| | | | | |
| | | | $ | 20,222,926 |
| | | | | |
Electronics — 6.2% |
Intel Corp. (a) | | 354,720 | | $ | 9,456,835 |
Intersil Corp., “A” | | 99,040 | | | 2,424,499 |
KLA-Tencor Corp. | | 90,690 | | | 4,367,630 |
National Semiconductor Corp. | | 123,050 | | | 2,785,852 |
Samsung Electronics Co. Ltd., GDR | | 20,072 | | | 5,825,185 |
Taiwan Semiconductor Manufacturing Co. Ltd., ADR | | 529,483 | | | 5,273,651 |
| | | | | |
| | | | $ | 30,133,652 |
| | | | | |
Energy – Integrated — 2.7% |
Exxon Mobil Corp. | | 82,180 | | $ | 7,699,444 |
Hess Corp. | | 27,420 | | | 2,765,581 |
Marathon Oil Corp. | | 40,670 | | | 2,475,176 |
| | | | | |
| | | | $ | 12,940,201 |
| | | | | |
Food & Beverages — 4.3% |
General Mills, Inc. | | 58,160 | | $ | 3,315,120 |
Nestle S.A. | | 20,019 | | | 9,172,979 |
PepsiCo, Inc. | | 108,800 | | | 8,257,920 |
| | | | | |
| | | | $ | 20,746,019 |
| | | | | |
Food & Drug Stores — 2.1% |
CVS Caremark Corp. | | 189,082 | | $ | 7,516,010 |
Walgreen Co. | | 66,650 | | | 2,538,032 |
| | | | | |
| | | | $ | 10,054,042 |
| | | | | |
Gaming & Lodging — 1.8% |
International Game Technology | | 73,630 | | $ | 3,234,566 |
Royal Caribbean Cruises Ltd. | | 122,090 | | | 5,181,500 |
| | | | | |
| | | | $ | 8,416,066 |
| | | | | |
General Merchandise — 0.9% |
Target Corp. | | 83,450 | | $ | 4,172,500 |
| | | | | |
Health Maintenance Organizations — 0.8% |
UnitedHealth Group, Inc. | | 68,080 | | $ | 3,962,256 |
| | | | | |
Insurance — 1.1% |
Aflac, Inc. | | 87,340 | | $ | 5,470,104 |
| | | | | |
Internet — 3.1% |
Google, Inc., “A” (a) | | 19,820 | | $ | 13,705,134 |
Yahoo!, Inc. (a) | | 61,200 | | | 1,423,512 |
| | | | | |
| | | | $ | 15,128,646 |
| | | | | |
Major Banks — 3.2% |
Bank of New York Mellon Corp. | | 105,171 | | $ | 5,128,138 |
State Street Corp. | | 126,320 | | | 10,257,184 |
| | | | | |
| | | | $ | 15,385,322 |
| | | | | |
Medical & Health Technology & Services — 0.5% |
Cardinal Health, Inc. | | 43,790 | | $ | 2,528,873 |
| | | | | |
Medical Equipment — 4.7% |
Advanced Medical Optics, Inc. (a) | | 165,050 | | $ | 4,048,677 |
C.R. Bard, Inc. | | 29,060 | | | 2,754,888 |
Medtronic, Inc. | | 201,650 | | | 10,136,946 |
30-CAP
Portfolio of Investments — continued
| | |
| Common Stocks — continued | | Short-Term Obligations — 0.4% |
| | | | | |
| Issuer | | Shares/Par | | Value ($) |
| | | | | |
Medical Equipment — continued |
ResMed, Inc. (a) | | 79,860 | | $ | 4,195,046 |
Zimmer Holdings, Inc. (a) | | 26,440 | | | 1,749,006 |
| | | | | |
| | | | $ | 22,884,563 |
| | | | | |
Network & Telecom — 3.5% |
Cisco Systems, Inc. (a) | | 449,910 | | $ | 12,179,064 |
Juniper Networks, Inc. (a) | | 60,750 | | | 2,016,900 |
QUALCOMM, Inc. | | 69,490 | | | 2,734,432 |
| | | | | |
| | | | $ | 16,930,396 |
| | | | | |
Oil Services — 2.9% | | | | | |
Halliburton Co. | | 134,590 | | $ | 5,102,307 |
Noble Corp. | | 63,870 | | | 3,609,294 |
Schlumberger Ltd. | | 26,330 | | | 2,590,082 |
Weatherford International Ltd. (a) | | 42,030 | | | 2,883,258 |
| | | | | |
| | | | $ | 14,184,941 |
| | | | | |
Other Banks & Diversified Financials — 2.4% |
American Express Co. | | 120,390 | | $ | 6,262,688 |
Moody’s Corp. | | 54,840 | | | 1,957,788 |
UBS AG | | 73,714 | | | 3,423,235 |
| | | | | |
| | | | $ | 11,643,711 |
| | | | | |
Pharmaceuticals — 8.4% |
Allergan, Inc. | | 80,440 | | $ | 5,167,466 |
Bayer AG | | 38,190 | | | 3,481,955 |
Johnson & Johnson | | 127,050 | | | 8,474,235 |
Merck KGaA | | 21,900 | | | 2,813,257 |
Novartis AG, ADR | | 72,620 | | | 3,943,992 |
Roche Holding AG | | 57,430 | | | 9,892,395 |
Wyeth | | 156,640 | | | 6,921,922 |
| | | | | |
| | | | $ | 40,695,222 |
| | | | | |
Specialty Chemicals — 1.1% |
Praxair, Inc. | | 61,240 | | $ | 5,432,600 |
| | | | | |
Specialty Stores — 3.1% |
CarMax, Inc. (a) | | 130,230 | | $ | 2,572,043 |
Lowe’s Cos., Inc. | | 104,150 | | | 2,355,873 |
Nordstrom, Inc. | | 88,090 | | | 3,235,546 |
Staples, Inc. | | 294,390 | | | 6,791,577 |
| | | | | |
| | | | $ | 14,955,039 |
| | | | | |
Telecommunications — Wireless — 1.8% |
America Movil S.A.B. de C.V., “L”, ADR | | 98,050 | | $ | 6,019,290 |
Rogers Communications, Inc., “B” | | 58,240 | | | 2,635,360 |
| | | | | |
| | | | $ | 8,654,650 |
| | | | | |
Tobacco — 0.6% |
Altria Group, Inc. | | 38,910 | | $ | 2,940,818 |
| | | | | |
Trucking — 1.2% | | | | | |
FedEx Corp. | | 29,000 | | $ | 2,585,930 |
United Parcel Service, Inc., “B” | | 41,330 | | | 2,922,858 |
| | | | | |
| | | | $ | 5,508,788 |
| | | | | |
Total Common Stocks
(Identified Cost, $436,944,562) | | $ | 477,716,338 |
| | | | | |
| | | | | | |
| Issuer | | Shares/Par | | Value ($) |
| | | | | | |
American Express Credit Corp.,
4.12%, due 1/02/08, at
Amortized Cost and Value (y) | | $ | 1,937,000 | | $ | 1,936,778 |
| | | | | | |
Total Investments
(Identified Cost, $438,881,340) | | $ | 479,653,116 |
| | | | | | |
| |
Other Assets,
Less Liabilities — 0.8% | | | 3,906,665 |
| | | | | | |
Net Assets — 100.0% | | $ | 483,559,781 |
| | | | | | |
See portfolio footnotes and notes to financial statements.
31-CAP
Portfolio of Investments — December 31, 2007
MFS Emerging Growth Portfolio
Common Stocks — 97.7%
| | | | | |
| Issuer | | Shares/Par | | Value ($) |
| | | | | |
| | | | | |
Aerospace — 3.9% |
Lockheed Martin Corp. | | 44,240 | | $ | 4,656,702 |
Rockwell Collins, Inc. | | 34,600 | | | 2,490,162 |
United Technologies Corp. | | 55,060 | | | 4,214,292 |
| | | | | |
| | | | $ | 11,361,156 |
| | | | | |
Apparel Manufacturers — 1.6% |
Li & Fung Ltd. | | 156,000 | | $ | 623,387 |
LVMH Moet Hennessy Louis Vuitton S.A. | | 9,400 | | | 1,129,790 |
NIKE, Inc., “B” | | 36,138 | | | 2,321,505 |
Quiksilver, Inc. (a)(l) | | 45,590 | | | 391,162 |
| | | | | |
| | | | $ | 4,465,844 |
| | | | | |
Biotechnology — 4.1% |
Celgene Corp. (a)(l) | | 29,150 | | $ | 1,347,022 |
Genzyme Corp. (a) | | 59,430 | | | 4,423,969 |
Gilead Sciences, Inc. (a) | | 62,130 | | | 2,858,601 |
Millipore Corp. (a)(l) | | 41,449 | | | 3,033,238 |
| | | | | |
| | | | $ | 11,662,830 |
| | | | | |
Broadcasting — 1.7% |
Grupo Televisa S.A., ADR | | 58,420 | | $ | 1,388,643 |
News Corp., “A” | | 177,500 | | | 3,636,975 |
| | | | | |
| | | | $ | 5,025,618 |
| | | | | |
Brokerage & Asset Managers — 5.1% |
Affiliated Managers Group, Inc. (a)(l) | | 6,140 | | $ | 721,204 |
Bolsa de Mercadorias & Futuros (a) | | 77,800 | | | 1,092,697 |
Bovespa Holding, S.A. (a) | | 14,900 | | | 287,118 |
Charles Schwab Corp. | | 90,740 | | | 2,318,407 |
Deutsche Boerse AG | | 14,570 | | | 2,875,840 |
EFG International | | 21,730 | | | 873,307 |
GFI Group, Inc. (a) | | 6,410 | | | 613,565 |
Goldman Sachs Group, Inc. | | 6,890 | | | 1,481,695 |
ICAP PLC | | 158,390 | | | 2,279,699 |
Invesco Ltd. (l) | | 65,600 | | | 2,058,528 |
| | | | | |
| | | | $ | 14,602,060 |
| | | | | |
Business Services — 1.7% |
Amdocs Ltd. (a) | | 66,220 | | $ | 2,282,603 |
Corporate Executive Board Co. (l) | | 16,071 | | | 965,867 |
CoStar Group, Inc. (a)(l) | | 9,890 | | | 467,303 |
Satyam Computer Services Ltd., ADR (l) | | 44,080 | | | 1,177,818 |
| | | | | |
| | | | $ | 4,893,591 |
| | | | | |
Chemicals — 1.3% |
Monsanto Co. | | 22,520 | | $ | 2,515,259 |
Potash Corporation of Saskatchewan, Inc. | | 9,140 | | | 1,315,794 |
| | | | | |
| | | | $ | 3,831,053 |
| | | | | |
Computer Software — 5.8% |
Adobe Systems, Inc. (a) | | 17,070 | | $ | 729,401 |
Microsoft Corp. | | 92,100 | | | 3,278,760 |
NAVTEQ Corp. (a) | | 30,270 | | | 2,288,412 |
Salesforce.com, Inc. (a)(l) | | 29,130 | | | 1,826,160 |
Synopsys, Inc. (a)(l) | | 40,960 | | | 1,062,093 |
VeriSign, Inc. (a) | | 198,098 | | | 7,450,466 |
| | | | | |
| | | | $ | 16,635,292 |
| | | | | |
Computer Software — Systems — 1.9% |
Apple Computer, Inc. (a) | | 10,190 | | $ | 2,018,435 |
EMC Corp. (a) | | 191,002 | | | 3,539,267 |
| | | | | |
| | | | $ | 5,557,702 |
| | | | | |
| | | | | |
| Issuer | | Shares/Par | | Value ($) |
| | | | | |
Conglomerates — 0.3% |
Siemens AG, ADR | | 5,500 | | $ | 865,480 |
| | | | | |
Consumer Goods & Services — 3.9% |
Alibaba.com Corp. (a)(z) | | 72,000 | | $ | 255,316 |
Apollo Group, Inc., “A” (a) | | 49,010 | | | 3,438,052 |
Avon Products, Inc. | | 26,360 | | | 1,042,011 |
Capella Education Co. (a)(l) | | 8,260 | | | 540,700 |
Corinthian Colleges, Inc. (a)(l) | | 65,900 | | | 1,014,860 |
New Oriental Education & Technology Group, Inc., ADR (a) | | 25,800 | | | 2,079,222 |
Priceline.com, Inc. (a)(l) | | 8,510 | | | 977,459 |
Strayer Education, Inc. | | 11,540 | | | 1,968,493 |
| | | | | |
| | | | $ | 11,316,113 |
| | | | | |
Electrical Equipment — 1.6% |
Danaher Corp. | | 53,990 | | $ | 4,737,083 |
| | | | | |
Electronics — 6.1% |
ARM Holdings PLC | | 555,820 | | $ | 1,362,594 |
Flextronics International Ltd. (a) | | 141,990 | | | 1,712,399 |
Hittite Microwave Corp. (a)(l) | | 17,630 | | | 842,009 |
Intel Corp. (a) | | 230,460 | | | 6,144,064 |
Intersil Corp., “A” | | 58,330 | | | 1,427,918 |
Marvell Technology Group Ltd. (a) | | 96,830 | | | 1,353,683 |
National Semiconductor Corp. (l) | | 73,740 | | | 1,669,474 |
Nintendo Co. Ltd. | | 3,100 | | | 1,882,158 |
SanDisk Corp. (a)(l) | | 34,040 | | | 1,129,107 |
| | | | | |
| | | | $ | 17,523,406 |
| | | | | |
Energy — Independent — 2.7% |
Apache Corp. | | 17,830 | | $ | 1,917,438 |
Arch Coal, Inc. | | 29,240 | | | 1,313,753 |
Sandridge Energy, Inc. (a) | | 8,650 | | | 310,189 |
Ultra Petroleum Corp. (a) | | 28,260 | | | 2,020,590 |
XTO Energy, Inc. | | 44,015 | | | 2,260,610 |
| | | | | |
| | | | $ | 7,822,580 |
| | | | | |
Energy — Integrated — 2.3% |
Hess Corp. | | 37,222 | | $ | 3,754,211 |
Marathon Oil Corp. | | 39,510 | | | 2,404,579 |
Petroleo Brasileiro S.A., ADR | | 3,800 | | | 437,912 |
| | | | | |
| | | | $ | 6,596,702 |
| | | | | |
Engineering — Construction — 1.1% |
Fluor Corp. | | 15,710 | | $ | 2,289,261 |
Quanta Services, Inc. (a)(l) | | 30,950 | | | 812,128 |
| | | | | |
| | | | $ | 3,101,389 |
| | | | | |
Entertainment — 0.9% |
DreamWorks Animation, Inc., “A” (a) | | 72,700 | | $ | 1,856,758 |
TiVo, Inc. (a)(l) | | 105,100 | | | 876,534 |
| | | | | |
| | | | $ | 2,733,292 |
| | | | | |
Food & Beverages — 3.7% |
Hain Celestial Group, Inc. (a)(l) | | 22,140 | | $ | 708,480 |
Nestle S.A. | | 10,939 | | | 5,012,399 |
PepsiCo, Inc. | | 63,220 | | | 4,798,398 |
| | | | | |
| | | | $ | 10,519,277 |
| | | | | |
Food & Drug Stores — 1.3% |
CVS Caremark Corp. | | 73,140 | | $ | 2,907,315 |
Whole Foods Market, Inc. | | 23,350 | | | 952,680 |
| | | | | |
| | | | $ | 3,859,995 |
| | | | | |
Gaming & Lodging — 1.9% |
International Game Technology | | 55,900 | | $ | 2,455,687 |
Melco PBL Entertainment (Macau) Ltd., ADR (a) | | 40,310 | | | 465,984 |
32-EGP
Portfolio of Investments — continued
Common Stocks — continued
| | | | | |
| Issuer | | Shares/Par | | Value ($) |
| | | | | |
Gaming & Lodging — continued |
MGM Mirage (a)(l) | | 8,190 | | $ | 688,124 |
Royal Caribbean Cruises Ltd. (l) | | 42,242 | | | 1,792,750 |
| | | | | |
| | | | $ | 5,402,545 |
| | | | | |
Insurance — 0.3% |
Aflac, Inc. | | 12,400 | | $ | 776,612 |
| | | | | |
Internet — 3.9% |
Google, Inc., “A” (a) | | 11,340 | | $ | 7,841,383 |
Omniture, Inc. (a) | | 42,050 | | | 1,399,845 |
Tencent Holdings Ltd. | | 146,600 | | | 1,091,874 |
Yahoo!, Inc. (a) | | 39,410 | | | 916,677 |
| | | | | |
| | | | $ | 11,249,779 |
| | | | | |
Leisure & Toys — 4.0% |
Activision, Inc. (a) | | 37,550 | | $ | 1,115,235 |
Electronic Arts, Inc. (a) | | 93,920 | | | 5,485,867 |
THQ, Inc. (a)(l) | | 43,080 | | | 1,214,425 |
Ubisoft Entertainment S.A. (a) | | 35,345 | | | 3,562,487 |
| | | | | |
| | | | $ | 11,378,014 |
| | | | | |
Machinery & Tools — 2.4% |
Bucyrus International, Inc., “A” | | 41,365 | | $ | 4,111,267 |
Flowserve Corp. | | 11,800 | | | 1,135,160 |
Kennametal, Inc. | | 24,780 | | | 938,171 |
Timken Co. | | 18,190 | | | 597,542 |
| | | | | |
| | | | $ | 6,782,140 |
| | | | | |
Major Banks — 1.1% |
State Street Corp. | | 37,440 | | $ | 3,040,128 |
| | | | | |
Medical & Health Technology & Services — 1.3% |
IDEXX Laboratories, Inc. (a) | | 64,620 | | $ | 3,788,671 |
| | | | | |
Medical Equipment — 5.2% |
Advanced Medical Optics, Inc. (a)(l) | | 86,503 | | $ | 2,121,919 |
Becton, Dickinson & Co. | | 39,200 | | | 3,276,336 |
C.R. Bard, Inc. | | 17,540 | | | 1,662,792 |
Conceptus, Inc. (a)(l) | | 81,160 | | | 1,561,518 |
Medtronic, Inc. | | 26,210 | | | 1,317,577 |
ResMed, Inc. (a)(l) | | 20,290 | | | 1,065,834 |
St. Jude Medical, Inc. (a) | | 46,550 | | | 1,891,792 |
Stryker Corp. | | 19,250 | | | 1,438,360 |
Thoratec Corp. (a)(l) | | 41,605 | | | 756,795 |
| | | | | |
| | | | $ | 15,092,923 |
| | | | | |
Metals & Mining — 1.6% |
Cameco Corp. | | 26,490 | | $ | 1,054,567 |
Century Aluminum Co. (a)(l) | | 13,570 | | | 731,966 |
Companhia Vale do Rio Doce, ADR | | 83,458 | | | 2,726,573 |
| | | | | |
| | | | $ | 4,513,106 |
| | | | | |
Network & Telecom — 4.5% |
Cisco Systems, Inc. (a) | | 152,180 | | $ | 4,119,513 |
NICE Systems Ltd., ADR (a) | | 76,070 | | | 2,610,722 |
Nokia Corp., ADR | | 99,540 | | | 3,821,341 |
QLogic Corp. (a) | | 84,250 | | | 1,196,350 |
Research In Motion Ltd. (a) | | 10,811 | | | 1,225,967 |
| | | | | |
| | | | $ | 12,973,893 |
| | | | | |
Oil Services — 3.6% |
Exterran Holdings, Inc. (a)(l) | | 3,716 | | $ | 303,969 |
National Oilwell Varco, Inc. (a) | | 26,412 | | | 1,940,226 |
Noble Corp. | | 76,178 | | | 4,304,819 |
Schlumberger Ltd. | | 21,340 | | | 2,099,216 |
Weatherford International Ltd. (a) | | 26,820 | | | 1,839,852 |
| | | | | |
| | | | $ | 10,488,082 |
| | | | | |
| | | | | | | |
| Issuer | | Shares/Par | | Value ($) | |
| | | | | | | |
Other Banks & Diversified Financials — 0.3% | |
Northern Trust Corp. | | | 12,730 | | $ | 974,863 | |
| | | | | | | |
Pharmaceuticals — 4.5% | |
Allergan, Inc. | | | 21,630 | | $ | 1,389,511 | |
Elan Corp. PLC, ADR (a) | | | 153,140 | | | 3,366,017 | |
Inverness Medical Innovations, Inc. (a)(l) | | | 10,330 | | | 580,339 | |
Merck & Co., Inc. | | | 84,330 | | | 4,900,416 | |
Roche Holding AG | | | 10,810 | | | 1,862,037 | |
Schering-Plough Corp. | | | 28,070 | | | 747,785 | |
| | | | | | | |
| | | | | $ | 12,846,105 | |
| | | | | | | |
Printing & Publishing — 0.2% | |
Playboy Enterprises, Inc.,”B” (a)(l) | | | 54,410 | | $ | 496,219 | |
| | | | | | | |
Specialty Stores — 4.1% | |
Advance Auto Parts, Inc. | | | 32,200 | | $ | 1,223,278 | |
CarMax, Inc. (a)(l) | | | 25,930 | | | 512,118 | |
Dick’s Sporting Goods, Inc. (a)(l) | | | 66,930 | | | 1,857,977 | |
GameStop Corp., “A” (a) | | | 23,350 | | | 1,450,269 | |
Lowe’s Cos., Inc. | | | 93,210 | | | 2,108,410 | |
Nordstrom, Inc. (l) | | | 90,330 | | | 3,317,821 | |
Staples, Inc. | | | 31,670 | | | 730,627 | |
Urban Outfitters, Inc. (a) | | | 25,310 | | | 689,951 | |
| | | | | | | |
| | | | | $ | 11,890,451 | |
| | | | | | | |
Telecommunications — Wireless — 2.8% | |
America Movil S.A.B. de C.V., “L”, ADR | | | 70,590 | | $ | 4,333,520 | |
NII Holdings, Inc. “B” (a) | | | 14,380 | | | 694,842 | |
Rogers Communications, Inc., “B” | | | 68,670 | | | 3,130,314 | |
| | | | | | | |
| | | | | $ | 8,158,676 | |
| | | | | | | |
Telephone Services — 2.2% | |
American Tower Corp., “A” (a) | | | 70,885 | | $ | 3,019,701 | |
AT&T, Inc. | | | 76,430 | | | 3,176,431 | |
| | | | | | | |
| | | | | $ | 6,196,132 | |
| | | | | | | |
Tobacco — 1.6% | |
Altria Group, Inc. | | | 60,350 | | $ | 4,561,253 | |
| | | | | | | |
Utilities — Electric Power — 1.2% | |
FPL Group, Inc. | | | 28,240 | | $ | 1,914,102 | |
NRG Energy, Inc. (a)(l) | | | 33,270 | | | 1,441,922 | |
| | | | | | | |
| | | | | $ | 3,356,024 | |
| | | | | | | |
Total Common Stocks
(Identified Cost, $239,531,523) | | $ | 281,076,079 | |
| | | | | | | |
|
Short-Term Obligations — 2.4% | |
American Express Credit Corp., 4.12%, due 1/02/08, at Amortized Cost and Value (y) | | $ | 7,023,000 | | $ | 7,022,196 | |
| | | | | | | |
|
Collateral for Securities Loaned — 10.7% | |
Navigator Securities Lending Prime Portfolio, at Cost and Net Asset Value | | | 30,860,123 | | $ | 30,860,123 | |
| | | | | | | |
Total Investments
(Identified Cost, $277,413,842) (k) | | $ | 318,958,398 | |
| | | | | | | |
| |
Other Assets,
Less Liabilities — (10.8)% | | | (31,096,340 | ) |
| | | | | | | |
Net Assets — 100.0% | | $ | 287,862,058 | |
| | | | | | | |
See portfolio footnotes and notes to financial statements.
33-EGP
Portfolio of Investments — December 31, 2007
MFS Global Governments Portfolio
Bonds — 81.6%
| | | | | | |
| Issuer | | Shares/Par | | Value ($) |
| | | | | | |
Foreign Bonds — 59.3% | | | |
Belgium — 4.2% |
Kingdom of Belgium,
5.5%, 2017 | | EUR | 1,079,000 | | $ | 1,705,782 |
| | | | | | |
Canada — 2.4% |
Canada Housing Trust,
4.6%, 2011 | | CAD | 237,000 | | $ | 243,916 |
Government of Canada,
4.5%, 2015 | | CAD | 626,000 | | | 656,407 |
Government of Canada,
5.75%, 2033 | | CAD | 65,000 | | | 82,831 |
| | | | | | |
| | | | | $ | 983,154 |
| | | | | | |
Denmark — 0.6% |
Kingdom of Denmark, 4%, 2015 | | DKK | 1,206,000 | | $ | 230,536 |
France — 5.0% |
Republic of France, 6%, 2025 | | EUR | 851,000 | | $ | 1,450,972 |
Republic of France, 4.75%, 2035 | | EUR | 83,000 | | | 566,670 |
| | | | | | |
| | | | | $ | 2,017,642 |
| | | | | | |
Germany — 7.8% |
Federal Republic of Germany,
5.25%, 2010 | | EUR | 811,000 | | $ | 1,218,044 |
Federal Republic of Germany,
3.75%, 2015 | | EUR | 334,000 | | | 473,799 |
Federal Republic of Germany,
6.25%, 2030 | | EUR | 842,000 | | | 1,498,808 |
| | | | | | |
| | | | | $ | 3,190,651 |
| | | | | | |
Italy — 4.0% |
Republic of Italy, 4.75%, 2013 | | EUR | 1,080,000 | | $ | 1,616,137 |
| | | | | | |
Japan — 14.6% |
Government of Japan,
0.8%, 2010 | | JPY | 33,000,000 | | $ | 295,763 |
Government of Japan,
1.5%, 2012 | | JPY | 43,000,000 | | | 1,310,596 |
Government of Japan,
1.3%, 2014 | | JPY | 136,000,000 | | | 1,224,779 |
Government of Japan,
1.7%, 2017 | | JPY | 113,000,000 | | | 1,033,900 |
Government of Japan,
2.1%, 2024 | | JPY | 147,000,000 | | | 1,343,440 |
Government of Japan,
2.2%, 2027 | | JPY | 54,000,000 | | | 491,952 |
Government of Japan,
2.4%, 2037 | | JPY | 27,000,000 | | | 244,582 |
| | | | | | |
| | | | | $ | 5,945,012 |
| | | | | | |
Luxembourg — 0.8% |
Gazprom International S.A.,
7.201%, 2020 | | $ | 241,103 | | $ | 246,239 |
Gazprom International S.A.,
6.51%, 2022 (n) | | | 100,000 | | | 95,070 |
| | | | | | |
| | | | | $ | 341,309 |
| | | | | | |
Malaysia — 0.9% |
Petronas Capital Ltd.,
7.875%, 2022 | | $ | 293,000 | | $ | 366,412 |
Mexico — 1.0% |
United Mexican States,
5.625%, 2017 | | $ | 34,000 | | $ | 34,459 |
| | | | | | |
| Issuer | | Shares/Par | | Value ($) |
| | | | | | |
Mexico — continued | | | |
United Mexican States,
6.75%, 2034 | | $ | 322,000 | | $ | 355,649 |
| | | | | | |
| | | | | $ | 390,108 |
| | | | | | |
Netherlands — 3.7% | | | | | | |
Intergas Finance B.V.,
6.875%, 2011 | | $ | 105,000 | | $ | 101,850 |
Kingdom of Netherlands,
3.75%, 2014 | | EUR | 976,000 | | | 1,388,303 |
| | | | | | |
| | | | | $ | 1,490,153 |
| | | | | | |
Spain — 4.0% |
Kingdom of Spain, 5%, 2012 | | EUR | 1,065,000 | | $ | 1,608,838 |
| | | | | | |
Sweden — 0.6% |
Kingdom of Sweden, 4.5%, 2015 | | SEK | 1,500,000 | | $ | 234,990 |
| | | | | | |
United Kingdom — 9.7% |
United Kingdom Treasury,
9%, 2011 | | GBP | 345,000 | | $ | 788,397 |
United Kingdom Treasury,
8%, 2015 | | GBP | 719,000 | | | 1,754,201 |
United Kingdom Treasury,
8%, 2021 | | GBP | 219,000 | | | 584,859 |
United Kingdom Treasury,
4.25%, 2036 | | GBP | 421,000 | | | 828,405 |
| | | | | | |
| | | | | $ | 3,955,862 |
| | | | | | |
Total Foreign Bonds | | $ | 24,076,586 |
| | | | | | |
U.S. Bonds — 22.3% |
Asset Backed & Securitized — 4.7% |
Bayview Commercial Asset Trust, FRN, 5.158%, 2023 (n) | | CAD | 150,000 | | $ | 136,264 |
Commercial Mortgage Asset Trust, FRN, 0.876%, 2032 (i)(n) | | $ | 7,941,659 | | | 245,064 |
Commercial Mortgage Pass-Through Certificates, FRN,
5.217%, 2017 (n) | | | 331,000 | | | 329,347 |
Commercial Mortgage Pass-Through Certificates, FRN,
5.227%, 2017 (n) | | | 500,000 | | | 488,429 |
First Union National Bank Commercial Mortgage Trust, FRN,
0.931%, 2043 (i)(n) | | | 8,506,170 | | | 202,774 |
IMPAC CMB Trust, FRN,
5.215%, 2036 | | | 439,121 | | | 419,281 |
Lehman Brothers Floating Rate Commercial Mortgage Trust, FRN,
5.187%, 2018 (n) | | | 87,902 | | | 87,766 |
| | | | | | |
| | | | | $ | 1,908,925 |
| | | | | | |
Mortgage Backed — 1.1% |
Fannie Mae, 5.37%, 2013 | | $ | 97,882 | | $ | 100,845 |
Fannie Mae, 4.78%, 2015 | | | 72,484 | | | 72,233 |
Fannie Mae, 4.856%, 2015 | | | 46,421 | | | 46,042 |
Fannie Mae, 5.09%, 2016 | | | 59,000 | | | 59,574 |
Fannie Mae, 5.423%, 2016 | | | 72,427 | | | 74,849 |
Fannie Mae, 5.05%, 2017 | | | 54,000 | | | 54,375 |
Fannie Mae, 5.32%, 2017 | | | 43,750 | | | 44,725 |
| | | | | | |
| | | | | $ | 452,643 |
| | | | | | |
34-GGP
Portfolio of Investments — continued
| | | | | | |
| Issuer | | Shares/Par | | Value ($) |
| | | | | | |
Municipals — 0.6% |
Minnesota Public Facilities Authority, Water Pollution Control Rev., “B”,
5%, 2018 | | $ | 215,000 | | $ | 238,669 |
| | | | | | |
U.S. Government Agencies — 2.1% |
Aid-Egypt, 4.45%, 2015 | | | 252,000 | | $ | 250,687 |
Small Business Administration,
5.09%, 2025 | | | 51,694 | | | 52,082 |
Small Business Administration,
5.21%, 2026 | | | 550,866 | | | 558,161 |
| | | | | | |
| | | | | $ | 860,930 |
| | | | | | |
U.S. Treasury Obligations — 13.8% |
U.S. Treasury Bonds, 4.75%, 2017 | | $ | 1,330,000 | | $ | 1,404,709 |
U.S. Treasury Bonds, 8%, 2021 | | | 238,000 | | | 325,725 |
U.S. Treasury Bonds, 4.75%, 2037 | | | 113,000 | | | 118,262 |
U.S. Treasury Bonds, TIPS,
2.375%, 2025 | | | 390,143 | | | 409,589 |
U.S. Treasury Notes, 4%, 2010 | | | 888,000 | | | 906,037 |
U.S. Treasury Notes, 4.75%, 2012 | | | 192,000 | | | 202,380 |
U.S. Treasury Notes, 4%, 2015 (f) | | | 1,999,000 | | | 2,027,268 |
U.S. Treasury Notes, TIPS, 2%, 2014 | | | 205,786 | | | 212,554 |
| | | | | | |
| | | | | $ | 5,606,524 |
| | | | | | |
Total U.S. Bonds | | $ | 9,067,691 |
| | | | | | |
Total Bonds
(Identified Cost, $32,454,313) | | $ | 33,144,277 |
| | | | | | |
| |
Short-Term Obligations — 13.0% | | | |
Federal Home Loan Bank, 1.21%, due 1/02/08, at Amortized Cost and
Value (y) | | $ | 5,307,000 | | $ | 5,306,779 |
| | | | | | |
|
Repurchase Agreements — 4.5% |
Merrill Lynch, 4.5%, dated 12/31/07, due 1/02/08, total to be received $1,822,455 (secured by various U.S. Treasury and Federal Agency obligations and Mortgage Backed securities in a jointly traded account), at Cost | | $ | 1,822,000 | | $ | 1,822,000 |
| | | | | | |
Total Investments
(Identified Cost, $39,583,092) (k) | | $ | 40,273,056 |
| | | | | | |
| |
Other Assets,
Less Liabilities — 0.9% | | | 348,506 |
| | | | | | |
Net Assets — 100.0% | | $ | 40,621,562 |
| | | | | | |
35-GGP
Portfolio of Investments — continued
Derivative contracts at 12/31/07
Futures contracts outstanding at 12/31/07
| | | | | | | | | | |
| Description | | Contracts | | Value | | Expiration
Date | | Unrealized
Appreciation/
(Depreciation) |
| Japan Government Bonds 10 Yr (Long) | | 3 | | $ | 3,673,902 | | Mar-08 | | $ | 13,709 |
Forward Foreign Currency Exchange Contracts at 12/31/07
| | | | | | | | | | | | | | | | |
| Type | | Currency | | Contracts to
Deliver/Receive | | Settlement
Date Range | | In Exchange For | | Contracts
at Value | | Net
Unrealized
Appreciation
(Depreciation) | |
Appreciation | | | | | | | | | | | | | | | | |
| BUY | | AUD | | 111,000 | | 1/16/08 | | $ | 97,003 | | $ | 97,377 | | $ | 374 | |
| SELL | | CAD | | 405,546 | | 1/09/08 | | | 411,549 | | | 410,957 | | | 593 | |
| BUY | | DKK | | 281,092 | | 2/07/08 | | | 55,062 | | | 55,145 | | | 83 | |
| BUY | | EUR | | 394,848 | | 2/05/08 - 2/13/08 | | | 572,949 | | | 577,645 | | | 4,696 | |
| SELL | | EUR | | 1,586,104 | | 2/05/08 - 2/13/08 | | | 2,327,007 | | | 2,320,452 | | | 6,555 | |
| SELL | | GBP | | 1,242,170 | | 2/05/08 - 2/14/08 | | | 2,532,386 | | | 2,469,695 | | | 62,691 | |
| BUY | | IDR | | 560,083,284 | | 1/28/08 | | | 59,394 | | | 59,565 | | | 171 | |
| BUY | | JPY | | 725,178,426 | | 1/15/08 - 2/05/08 | | | 6,496,634 | | | 6,502,720 | | | 6,086 | |
| SELL | | JPY | | 229,369,056 | | 1/15/08 - 2/06/08 | | | 2,097,249 | | | 2,058,491 | | | 38,758 | |
| BUY | | MYR | | 210,653 | | 1/28/08 | | | 63,259 | | | 63,749 | | | 490 | |
| SELL | | SEK | | 920,100 | | 1/15/08 | | | 145,000 | | | 142,382 | | | 2,618 | |
| | | | | | | | | | | | | | | | |
| | | | | | | | | | | | | | $ | 123,115 | |
| | | | | | | | | | | | | | | | |
Depreciation | | | | | | | | | | | | | | | | |
| BUY | | AUD | | 392,405 | | 1/16/08 | | $ | 352,427 | | $ | 344,245 | | $ | (8,182 | ) |
| SELL | | AUD | | 229,058 | | 1/16/08 | | | 199,038 | | | 200,946 | | | (1,908 | ) |
| BUY | | CAD | | 194,838 | | 1/09/08 | | | 203,311 | | | 197,437 | | | (5,874 | ) |
| SELL | | CAD | | 272,680 | | 1/09/08 | | | 268,944 | | | 276,318 | | | (7,375 | ) |
| BUY | | CHF | | 117,682 | | 2/04/08 | | | 105,788 | | | 104,178 | | | (1,611 | ) |
| BUY | | EUR | | 4,310,592 | | 1/16/08 - 2/13/08 | | | 6,323,586 | | | 6,304,525 | | | (19,061 | ) |
| SELL | | EUR | | 561,001 | | 1/16/08 - 2/13/08 | | | 810,622 | | | 820,670 | | | (10,048 | ) |
| BUY | | GBP | | 332,520 | | 2/14/08 | | | 668,715 | | | 661,089 | | | (7,626 | ) |
| BUY | | JPY | | 268,490,480 | | 1/15/08 - 2/05/08 | | | 2,457,732 | | | 2,409,807 | | | (47,925 | ) |
| SELL | | JPY | | 81,405,339 | | 1/15/08 - 2/05/08 | | | 725,766 | | | 730,529 | | | (4,763 | ) |
| BUY | | NOK | | 548,430 | | 2/19/08 | | | 101,224 | | | 100,867 | | | (356 | ) |
| BUY | | SEK | | 1,334,549 | | 1/15/08 | | | 211,763 | | | 206,516 | | | (5,247 | ) |
| | | | | | | | | | | | | | | | |
| | | | | | | | | | | | | | $ | (119,976 | ) |
| | | | | | | | | | | | | | | | |
At December 31, 2007, the fund had sufficient cash and/or other liquid securities to cover any commitments under these derivative contracts.
See portfolio footnotes and notes to financial statements.
36-GGP
Portfolio of Investments — December 31, 2007
MFS Massachusetts Investors Growth Stock Portfolio
Common Stocks — 99.0%
| | | | | |
| Issuer | | Shares/Par | | Value ($) |
| | | | | |
Aerospace — 2.8% | | | | | |
Precision Castparts Corp. | | 25,720 | | $ | 3,567,364 |
United Technologies Corp. | | 111,710 | | | 8,550,283 |
| | | | | |
| | | | $ | 12,117,647 |
| | | | | |
Alcoholic Beverages — 1.4% | | | | | |
Diageo PLC | | 282,650 | | $ | 6,050,253 |
| | | | | |
Apparel Manufacturers — 2.9% | | | |
LVMH Moet Hennessy Louis Vuitton S.A. | | 59,830 | | $ | 7,190,991 |
NIKE, Inc., “B” | | 83,170 | | | 5,342,841 |
| | | | | |
| | | | $ | 12,533,832 |
| | | | | |
Automotive — 0.9% | | | | | |
Bayerische Motoren Werke AG | | 58,610 | | $ | 3,619,231 |
| | | | | |
Biotechnology — 4.2% | | | | | |
Amgen, Inc. (a) | | 42,390 | | $ | 1,968,592 |
Celgene Corp. (a) | | 38,550 | | | 1,781,396 |
Genentech, Inc. (a) | | 28,820 | | | 1,932,957 |
Genzyme Corp. (a) | | 125,420 | | | 9,336,265 |
Millipore Corp. (a)(l) | | 41,200 | | | 3,015,016 |
| | | | | |
| | | | $ | 18,034,226 |
| | | | | |
Broadcasting — 2.0% | | | | | |
News Corp., “A” | | 225,790 | | $ | 4,626,437 |
Omnicom Group, Inc. | | 85,440 | | | 4,060,963 |
| | | | | |
| | | | $ | 8,687,400 |
| | | | | |
Brokerage & Asset Managers — 3.6% | | | |
Bolsa de Mercadorias & Futuros (a) | | 16,800 | | $ | 235,955 |
Charles Schwab Corp. | | 221,610 | | | 5,662,136 |
Deutsche Boerse AG | | 31,550 | | | 6,227,368 |
Franklin Resources, Inc. | | 6,900 | | | 789,567 |
ICAP PLC | | 179,360 | | | 2,581,519 |
| | | | | |
| | | | $ | 15,496,545 |
| | | | | |
Business Services — 4.5% | | | | | |
Amdocs Ltd. (a) | | 268,730 | | $ | 9,263,123 |
Automatic Data Processing, Inc. | | 63,690 | | | 2,836,116 |
Fidelity National Information Services, Inc. | | 45,440 | | | 1,889,850 |
Western Union Co. | | 211,840 | | | 5,143,475 |
| | | | | |
| | | | $ | 19,132,564 |
| | | | | |
Cable TV — 0.9% | | | | | |
Comcast Corp., “A” (a) | | 212,020 | | $ | 3,871,485 |
| | | | | |
Computer Software — 6.7% | | | | | |
Citrix Systems, Inc. (a) | | 73,260 | | $ | 2,784,613 |
Microsoft Corp. | | 357,834 | | | 12,738,890 |
Oracle Corp. (a) | | 474,690 | | | 10,718,500 |
VeriSign, Inc. (a) | | 66,140 | | | 2,487,525 |
| | | | | |
| | | | $ | 28,729,528 |
| | | | | |
Computer Software — Systems — 4.3% | | | |
Apple Computer, Inc. (a) | | 28,790 | | $ | 5,702,723 |
Dell, Inc. (a) | | 137,520 | | | 3,370,615 |
EMC Corp. (a) | | 193,250 | | | 3,580,923 |
International Business Machines Corp. | | 32,660 | | | 3,530,546 |
Network Appliance, Inc. (a) | | 91,400 | | | 2,281,344 |
| | | | | |
| | | | $ | 18,466,151 |
| | | | | |
| | | | | |
| Issuer | | Shares/Par | | Value ($) |
| | | | | |
Consumer Goods & Services — 4.1% | | | |
Apollo Group, Inc., “A” (a) | | 28,440 | | $ | 1,995,066 |
Colgate-Palmolive Co. | | 36,020 | | | 2,808,119 |
eBay, Inc. (a) | | 97,000 | | | 3,219,430 |
Procter & Gamble Co. | | 126,981 | | | 9,322,945 |
| | | | | |
| | | | $ | 17,345,560 |
| | | | | |
Electrical Equipment — 4.2% | | | | | |
Danaher Corp. | | 95,400 | | $ | 8,370,396 |
General Electric Co. | | 172,526 | | | 6,395,539 |
W.W. Grainger, Inc. | | 36,440 | | | 3,189,229 |
| | | | | |
| | | | $ | 17,955,164 |
| | | | | |
Electronics — 6.3% | | | | | |
Intel Corp. (a) | | 314,940 | | $ | 8,396,300 |
Intersil Corp., “A” | | 87,930 | | | 2,152,526 |
KLA-Tencor Corp. (l) | | 80,520 | | | 3,877,843 |
National Semiconductor Corp. | | 109,250 | | | 2,473,420 |
Samsung Electronics Co. Ltd., GDR | | 17,821 | | | 5,171,912 |
Taiwan Semiconductor Manufacturing Co. Ltd., ADR | | 470,103 | | | 4,682,226 |
| | | | | |
| | | | $ | 26,754,227 |
| | | | | |
Energy — Integrated — 2.7% | | | | | |
Exxon Mobil Corp. | | 72,970 | | $ | 6,836,559 |
Hess Corp. | | 24,350 | | | 2,455,941 |
Marathon Oil Corp. | | 36,110 | | | 2,197,655 |
| | | | | |
| | | | $ | 11,490,155 |
| | | | | |
Food & Beverages — 4.3% | | | | | |
General Mills, Inc. | | 51,640 | | $ | 2,943,480 |
Nestle S.A. | | 17,774 | | | 8,144,289 |
PepsiCo, Inc. | | 96,600 | | | 7,331,940 |
| | | | | |
| | | | $ | 18,419,709 |
| | | | | |
Food & Drug Stores — 2.1% | | | | | |
CVS Caremark Corp. | | 167,875 | | $ | 6,673,031 |
Walgreen Co. | | 59,180 | | | 2,253,574 |
| | | | | |
| | | | $ | 8,926,605 |
| | | | | |
Gaming & Lodging — 1.8% | | | | | |
International Game Technology | | 65,370 | | $ | 2,871,704 |
Royal Caribbean Cruises Ltd. (l) | | 108,400 | | | 4,600,496 |
| | | | | |
| | | | $ | 7,472,200 |
| | | | | |
General Merchandise — 0.9% | | | | | |
Target Corp. | | 74,090 | | $ | 3,704,500 |
| | | | | |
Health Maintenance Organizations — 0.8% | | | |
UnitedHealth Group, Inc. | | 60,440 | | $ | 3,517,608 |
| | | | | |
Insurance — 1.1% | | | | | |
Aflac, Inc. | | 77,540 | | $ | 4,856,330 |
| | | | | |
Internet — 3.1% | | | | | |
Google, Inc., “A” (a) | | 17,600 | | $ | 12,170,048 |
Yahoo!, Inc. (a) | | 54,270 | | | 1,262,320 |
| | | | | |
| | | | $ | 13,432,368 |
| | | | | |
Major Banks — 3.2% | | | | | |
Bank of New York Mellon Corp. | | 93,374 | | $ | 4,552,916 |
State Street Corp. | | 112,150 | | | 9,106,580 |
| | | | | |
| | | | $ | 13,659,496 |
| | | | | |
37-MIGSP
Portfolio of Investments — continued
Common Stocks — continued
| | | | | |
| Issuer | | Shares/Par | | Value ($) |
| | | | | |
Medical & Health Technology & Services — 0.5% |
Cardinal Health, Inc. | | 38,880 | | $ | 2,245,320 |
| | | | | |
Medical Equipment — 4.7% | | | | | |
Advanced Medical Optics, Inc. (a)(l) | | 146,540 | | $ | 3,594,626 |
C.R. Bard, Inc. | | 25,800 | | | 2,445,840 |
Medtronic, Inc. | | 179,030 | | | 8,999,838 |
ResMed, Inc. (a)(l) | | 70,900 | | | 3,724,377 |
Zimmer Holdings, Inc. (a) | | 23,470 | | | 1,552,541 |
| | | | | |
| | | | $ | 20,317,222 |
| | | | | |
Network & Telecom — 3.5% | | | | | |
Cisco Systems, Inc. (a) | | 399,457 | | $ | 10,813,301 |
Juniper Networks, Inc. (a) | | 53,940 | | | 1,790,808 |
QUALCOMM, Inc. | | 61,700 | | | 2,427,895 |
| | | | | |
| | | | $ | 15,032,004 |
| | | | | |
Oil Services — 2.9% | | | | | |
Halliburton Co. | | 119,490 | | $ | 4,529,866 |
Noble Corp. | | 56,710 | | | 3,204,682 |
Schlumberger Ltd. | | 23,370 | | | 2,298,907 |
Weatherford International Ltd. (a) | | 37,320 | | | 2,560,152 |
| | | | | |
| | | | $ | 12,593,607 |
| | | | | |
Other Banks & Diversified Financials — 2.4% |
American Express Co. | | 106,890 | | $ | 5,560,418 |
Moody’s Corp. (l) | | 48,690 | | | 1,738,233 |
UBS AG | | 65,447 | | | 3,039,320 |
| | | | | |
| | | | $ | 10,337,971 |
| | | | | |
Pharmaceuticals — 8.5% | | | | | |
Allergan, Inc. | | 71,420 | | $ | 4,588,021 |
Bayer AG | | 34,160 | | | 3,114,522 |
Johnson & Johnson | | 112,800 | | | 7,523,760 |
Merck KGaA | | 19,600 | | | 2,517,801 |
Novartis AG, ADR | | 64,480 | | | 3,501,909 |
Roche Holding AG | | 50,990 | | | 8,783,097 |
Wyeth | | 139,070 | | | 6,145,503 |
| | | | | |
| | | | $ | 36,174,613 |
| | | | | |
Specialty Chemicals — 1.1% | | | | | |
Praxair, Inc. | | 54,370 | | $ | 4,823,163 |
| | | | | |
Specialty Stores—3.1% | | | | | |
CarMax, Inc. (a)(l) | | 115,630 | | $ | 2,283,693 |
Lowe’s Cos., Inc. (l) | | 92,470 | | | 2,091,671 |
Nordstrom, Inc. (l) | | 78,210 | | | 2,872,653 |
Staples, Inc. | | 261,380 | | | 6,030,037 |
| | | | | |
| | | | $ | 13,278,054 |
| | | | | |
Telecommunications — Wireless — 1.8% | | | |
America Movil S.A.B. de C.V., “L”, ADR | | 87,050 | | $ | 5,344,000 |
Rogers Communications, Inc., “B” | | 51,710 | | | 2,339,878 |
| | | | | |
| | | | $ | 7,683,878 |
| | | | | |
Tobacco—0.6% | | | | | |
Altria Group, Inc. | | 34,550 | | $ | 2,611,288 |
| | | | | |
| | | | | | |
| Issuer | | Shares/Par | | Value ($) | |
| | | | | | |
Trucking—1.1% | | | | | | |
FedEx Corp. | | 25,750 | | $ | 2,296,128 | |
United Parcel Service, Inc., “B” | | 36,690 | | | 2,594,717 | |
| | | | | | |
| | | | $ | 4,890,845 | |
| | | | | | |
Total Common Stocks
(Identified Cost, $392,083,968) | | $ | 424,260,749 | |
| | | | | | |
|
Collateral for Securities Loaned — 5.8% | |
Navigator Securities Lending
Prime Portfolio, at Cost and
Net Asset Value | | 24,980,582 | | $ | 24,980,582 | |
| | | | | | |
Total Investments
(Identified Cost, $417,064,550) | | $ | 449,241,331 | |
| | | | | | |
| |
Other Assets,
Less Liabilities — (4.8)% | | | (20,709,222 | ) |
| | | | | | |
Net Assets — 100.0% | | $ | 428,532,109 | |
| | | | | | |
See portfolio footnotes and notes to financial statements.
38-MIGSP
Portfolio of Investments — December 31, 2007
MFS Mid Cap Growth Portfolio
Common Stocks — 99.3%
| | | | | |
| Issuer | | Shares/Par | | Value ($) |
| | | | | |
Alcoholic Beverages — 0.8% | | | | | |
Molson Coors Brewing Co. | | 11,510 | | $ | 594,144 |
| | | | | |
Apparel Manufacturers — 1.8% | | | | | |
Coach, Inc. (a) | | 23,500 | | $ | 718,630 |
Phillips-Van Heusen Corp. | | 18,400 | | | 678,224 |
| | | | | |
| | | | $ | 1,396,854 |
| | | | | |
Automotive — 1.8% | | | | | |
Autoliv, Inc. (l) | | 8,420 | | $ | 443,818 |
BorgWarner Transmission Systems, Inc. | | 4,710 | | | 228,011 |
Goodyear Tire & Rubber Co. (a)(l) | | 26,220 | | | 739,928 |
| | | | | |
| | | | $ | 1,411,757 |
| | | | | |
Biotechnology — 2.3% | | | | | |
Genzyme Corp. (a) | | 11,770 | | $ | 876,159 |
Invitrogen Corp. (a) | | 3,150 | | | 294,242 |
Millipore Corp. (a)(l) | | 8,170 | | | 597,881 |
| | | | | |
| | | | $ | 1,768,282 |
| | | | | |
Brokerage & Asset Managers — 2.7% |
Affiliated Managers Group, Inc. (a)(l) | | 5,270 | | $ | 619,014 |
CME Group, Inc. (l) | | 980 | | | 672,280 |
Legg Mason, Inc. | | 6,610 | | | 483,522 |
TD AMERITRADE Holding Corp. (a) | | 17,160 | | | 344,230 |
| | | | | |
| | | | $ | 2,119,046 |
| | | | | |
Business Services — 2.2% | | | | | |
Amdocs Ltd. (a) | | 30,690 | | $ | 1,057,884 |
Cognizant Technology Solutions Corp.,
“A” (a) | | 7,470 | | | 253,532 |
Corporate Executive Board Co. (l) | | 6,460 | | | 388,246 |
| | | | | |
| | | | $ | 1,699,662 |
| | | | | |
Cable TV — 0.8% | | | | | |
EchoStar Communications Corp.,
“A” (a)(l) | | 17,650 | | $ | 665,758 |
| | | | | |
Chemicals — 1.1% | | | | | |
PPG Industries, Inc. (l) | | 12,340 | | $ | 866,638 |
| | | | | |
Computer Software — 6.9% | | | | | |
McAfee, Inc. (a) | | 51,300 | | $ | 1,923,750 |
Salesforce.com, Inc. (a)(l) | | 6,510 | | | 408,112 |
Synopsys, Inc. (a)(l) | | 47,710 | | | 1,237,120 |
VeriSign, Inc. (a) | | 47,800 | | | 1,797,758 |
| | | | | |
| | | | $ | 5,366,740 |
| | | | | |
Computer Software — Systems — 0.5% |
Network Appliance, Inc. (a) | | 15,210 | | $ | 379,642 |
| | | | | |
Construction — 0.9% | | | | | |
Sherwin-Williams Co. (l) | | 11,530 | | $ | 669,201 |
| | | | | |
Consumer Goods & Services — 5.0% |
Apollo Group, Inc., “A” (a) | | 30,980 | | $ | 2,173,247 |
Avon Products, Inc. | | 9,100 | | | 359,723 |
Estee Lauder Cos., Inc., “A” (l) | | 7,140 | | | 311,375 |
ITT Educational Services, Inc. (a)(l) | | 6,430 | | | 548,286 |
Priceline.com, Inc. (a)(l) | | 4,360 | | | 500,790 |
| | | | | |
| | | | $ | 3,893,421 |
| | | | | |
Electrical Equipment — 3.4% | | | | | |
Rockwell Automation, Inc. | | 26,750 | | $ | 1,844,680 |
W.W. Grainger, Inc. (l) | | 3,790 | | | 331,701 |
WESCO International, Inc. (a)(l) | | 11,600 | | | 459,824 |
| | | | | |
| | | | $ | 2,636,205 |
| | | | | |
| | | | | |
| Issuer | | Shares/Par | | Value ($) |
| | | | | |
Electronics — 7.9% | | | | | |
Amkor Technology, Inc. (a)(l) | | 36,750 | | $ | 313,478 |
Flextronics International Ltd. (a) | | 114,390 | | | 1,379,543 |
Intersil Corp., “A” | | 49,140 | | | 1,202,947 |
MEMC Electronic Materials, Inc. (a) | | 5,370 | | | 475,191 |
National Semiconductor Corp. (l) | | 32,880 | | | 744,403 |
ON Semiconductor Corp. (a)(l) | | 126,530 | | | 1,123,586 |
SanDisk Corp. (a)(l) | | 16,240 | | | 538,681 |
Varian Semiconductor Equipment Associates, Inc. (a) | | 9,305 | | | 344,285 |
| | | | | |
| | | | $ | 6,122,114 |
| | | | | |
Energy — Independent — 1.7% | | | | | |
CONSOL Energy, Inc. | | 15,270 | | $ | 1,092,110 |
Tesoro Corp. | | 5,150 | | | 245,655 |
| | | | | |
| | | | $ | 1,337,765 |
| | | | | |
Energy — Integrated — 3.3% | | | | | |
Hess Corp. | | 25,160 | | $ | 2,537,638 |
| | | | | |
Food & Beverages — 0.9% | | | | | |
Pepsi Bottling Group, Inc. (l) | | 17,210 | | $ | 679,107 |
| | | | | |
Food & Drug Stores — 1.9% | | | | | |
Kroger Co. | | 54,140 | | $ | 1,446,079 |
| | | | | |
Gaming & Lodging — 3.4% | | | | | |
International Game Technology | | 43,920 | | $ | 1,929,406 |
Royal Caribbean Cruises Ltd. (l) | | 16,820 | | | 713,841 |
| | | | | |
| | | | $ | 2,643,247 |
| | | | | |
Health Maintenance Organizations — 2.4% |
Humana, Inc. (a) | | 24,400 | | $ | 1,837,564 |
| | | | | |
Insurance — 2.3% | | | | | |
Aspen Insurance Holdings Ltd. | | 15,780 | | $ | 455,095 |
Genworth Financial, Inc., “A” | | 41,980 | | | 1,068,391 |
Max Capital Group Ltd. | | 8,500 | | | 237,915 |
| | | | | |
| | | | $ | 1,761,401 |
| | | | | |
Leisure & Toys — 1.6% | | | | | |
Electronic Arts, Inc. (a)(l) | | 21,460 | | $ | 1,253,479 |
| | | | | |
Machinery & Tools — 6.2% | | | | | |
Cummins, Inc. | | 9,260 | | $ | 1,179,446 |
Eaton Corp. | | 15,540 | | | 1,506,603 |
Kennametal, Inc. | | 9,440 | | | 357,398 |
Parker Hannifin Corp. (l) | | 4,290 | | | 323,080 |
Timken Co. | | 43,850 | | | 1,440,473 |
| | | | | |
| | | | $ | 4,807,000 |
| | | | | |
Medical & Health Technology & Services — 3.3% |
Express Scripts, Inc. (a) | | 16,790 | | $ | 1,225,670 |
HLTH Corp. (a)(l) | | 68,040 | | | 911,736 |
Patterson Cos., Inc. (a)(l) | | 12,890 | | | 437,616 |
| | | | | |
| | | | $ | 2,575,022 |
| | | | | |
Medical Equipment — 4.0% | | | | | |
Advanced Medical Optics, Inc. (a) | | 25,020 | | $ | 613,741 |
Cooper Cos., Inc. (l) | | 5,080 | | | 193,040 |
DENTSPLY International, Inc. | | 12,000 | | | 540,240 |
St. Jude Medical, Inc. (a) | | 15,540 | | | 631,546 |
Zimmer Holdings, Inc. (a) | | 17,720 | | | 1,172,178 |
| | | | | |
| | | | $ | 3,150,745 |
| | | | | |
Metals & Mining — 1.2% | | | | | |
Cleveland-Cliffs, Inc. (l) | | 9,700 | | $ | 977,760 |
| | | | | |
39-MCGP
Portfolio of Investments — continued
| | |
| Common Stocks — continued | | Short-Term Obligations — 0.0% |
| | | | | |
| Issuer | | Shares/Par | | Value ($) |
| | | | | |
Natural Gas — Pipeline — 2.8% | | | | | |
Williams Cos., Inc. | | 61,820 | | $ | 2,211,920 |
| | | | | |
Network & Telecom — 1.0% | | | | | |
QLogic Corp. (a)(l) | | 54,400 | | $ | 772,480 |
| | | | | |
Oil Services — 7.0% | | | | | |
Cameron International Corp. (a)(l) | | 29,130 | | $ | 1,402,027 |
Noble Corp. (l) | | 38,290 | | | 2,163,768 |
Pride International, Inc. (a) | | 14,180 | | | 480,702 |
Smith International, Inc. (l) | | 8,770 | | | 647,665 |
Transocean, Inc. (a) | | 5,095 | | | 729,349 |
| | | | | |
| | | | $ | 5,423,511 |
| | | | | |
Other Banks & Diversified Financials — 1.1% |
Northern Trust Corp. (l) | | 11,720 | | $ | 897,518 |
| | | | | |
Personal Computers & Peripherals — 1.5% |
Nuance Communications, Inc. (a)(l) | | 61,200 | | $ | 1,143,216 |
| | | | | |
Pharmaceuticals — 2.4% | | | | | |
Allergan, Inc. | | 17,850 | | $ | 1,146,684 |
Endo Pharmaceuticals
Holdings, Inc. (a) | | 28,370 | | | 756,628 |
| | | | | |
| | | | $ | 1,903,312 |
| | | | | |
Printing & Publishing — 0.6% | | | | | |
Dun & Bradstreet Corp. (l) | | 5,760 | | $ | 510,509 |
| | | | | |
Railroad & Shipping — 0.8% | | | | | |
Kirby Corp. (a) | | 14,050 | | $ | 653,044 |
| | | | | |
Restaurants — 2.3% | | | | | |
YUM! Brands, Inc. | | 46,370 | | $ | 1,774,580 |
| | | | | |
Specialty Chemicals — 1.8% | | | | | |
Praxair, Inc. | | 15,700 | | $ | 1,392,747 |
| | | | | |
Specialty Stores — 2.6% | | | | | |
Advance Auto Parts, Inc. | | 8,960 | | $ | 340,390 |
GameStop Corp., “A” (a)(l) | | 22,390 | | | 1,390,643 |
Ross Stores, Inc. (l) | | 12,100 | | | 309,397 |
| | | | | |
| | | | $ | 2,040,430 |
| | | | | |
Telephone Services — 1.0% | | | | | |
Embarq Corp. | | 15,710 | | $ | 778,116 |
| | | | | |
Tobacco — 1.1% | | | | | |
Loews Corp. | | 9,940 | | $ | 847,882 |
| | | | | |
Utilities — Electric Power — 3.0% |
Constellation Energy Group, Inc. | | 7,410 | | $ | 759,747 |
Mirant Corp. (a) | | 20,540 | | | 800,649 |
NRG Energy, Inc. (a)(l) | | 18,260 | | | 791,388 |
| | | | | |
| | | | $ | 2,351,784 |
| | | | | |
Total Common Stocks
(Identified Cost, $70,285,371) | | $ | 77,297,320 |
| | | | | |
|
Collateral for Securities Loaned — 21.9% |
Navigator Securities Lending Prime Portfolio, at Cost and Net Asset Value | | 17,058,214 | | $ | 17,058,214 |
| | | | | |
| | | | | | | |
| Issuer | | Shares/Par | | Value ($) | |
| | | | | | | |
American Express Credit Corp.,
4.12%, due 1/02/08, at
Amortized Cost and Value (y) | | $ | 17,000 | | $ | 16,998 | |
| | | | | | | |
Total Investments
(Identified Cost, $87,360,583) | | $ | 94,372,532 | |
| | | | | | | |
| |
Other Assets,
Less Liabilities — (21.2)% | | | (16,509,255 | ) |
| | | | | | | |
Net Assets — 100.0% | | $ | 77,863,277 | |
| | | | | | | |
See portfolio footnotes and notes to financial statements
40-MCGP
Portfolio of Investments — December 31, 2007
MFS Mid Cap Value Portfolio
Common Stocks – 97.0%
| | | | | |
| Issuer | | Shares/Par | | Value ($) |
Alcoholic Beverages — 0.4% | | | | | |
Molson Coors Brewing Co. | | 1,630 | | $ | 84,141 |
| | | | | |
Automotive — 1.4% | | | | | |
Autoliv, Inc. | | 4,480 | | $ | 236,141 |
Goodyear Tire & Rubber Co. (a) | | 3,170 | | | 89,457 |
| | | | | |
| | | | $ | 325,598 |
| | | | | |
Biotechnology — 1.3% | | | | | |
Invitrogen Corp. (a) | | 3,200 | | $ | 298,912 |
| | | | | |
Brokerage & Asset Managers — 0.7% | | | | | |
Legg Mason, Inc. | | 1,370 | | $ | 100,216 |
TD AMERITRADE Holding Corp. (a) | | 2,700 | | | 54,162 |
| | | | | |
| | | | $ | 154,378 |
| | | | | |
Business Services — 1.1% | | | | | |
Fidelity National Information Services, Inc. | | 5,700 | | $ | 237,063 |
| | | | | |
Cable TV — 0.4% | | | | | |
Liberty Global, Inc., “A” (a) | | 2,250 | | $ | 88,178 |
| | | | | |
Chemicals — 2.1% | | | | | |
PPG Industries, Inc. | | 6,850 | | $ | 481,076 |
| | | | | |
Computer Software — 2.0% | | | | | |
McAfee, Inc. (a) | | 8,870 | | $ | 332,625 |
Parametric Technology Corp. (a) | | 6,550 | | | 116,918 |
| | | | | |
| | | | $ | 449,543 |
| | | | | |
Construction — 1.7% | | | | | |
Masco Corp. | | 9,690 | | $ | 209,401 |
Sherwin-Williams Co. | | 3,010 | | | 174,700 |
| | | | | |
| | | | $ | 384,101 |
| | | | | |
Electrical Equipment — 2.1% | | | | | |
Rockwell Automation, Inc. | | 4,400 | | $ | 303,424 |
WESCO International, Inc. (a) | | 4,240 | | | 168,074 |
| | | | | |
’ | | | | $ | 471,498 |
| | | | | |
Electronics — 1.6% | | | | | |
Intersil Corp., “A” | | 8,480 | | $ | 207,590 |
National Semiconductor Corp. | | 2,840 | | | 64,298 |
SanDisk Corp. (a) | | 2,800 | | | 92,876 |
| | | | | |
| | | | $ | 364,764 |
| | | | | |
Energy — Integrated — 4.2% | | | | | |
Hess Corp. | | 9,400 | | $ | 948,084 |
| | | | | |
Engineering — Construction — 0.7% | | | | | |
Shaw Group, Inc. (a) | | 2,690 | | $ | 162,584 |
| | | | | |
Food & Beverages — 2.7% | | | | | |
Dean Foods Co. | | 6,890 | | $ | 178,175 |
Pepsi Bottling Group, Inc. | | 10,800 | | | 426,168 |
| | | | | |
| | | | $ | 604,343 |
| | | | | |
Food & Drug Stores — 1.7% | | | | | |
Kroger Co. | | 8,690 | | $ | 232,110 |
Longs Drug Stores Corp. | | 3,000 | | | 141,000 |
| | | | | |
| | | | $ | 373,110 |
| | | | | |
Furniture & Appliances — 0.8% | | | | | |
Tupperware Brands Corp. | | 5,160 | | $ | 170,435 |
| | | | | |
Gaming & Lodging — 2.2% | | | | | |
Pinnacle Entertainment, Inc. (a) | | 3,010 | | $ | 70,916 |
Royal Caribbean Cruises Ltd. | | 9,730 | | | 412,941 |
| | | | | |
| | | | $ | 483,857 |
| | | | | |
| | | | | |
| Issuer | | Shares/Par | | Value ($) |
General Merchandise — 1.0% | | | | | |
Macy’s, Inc. | | 9,080 | | $ | 234,900 |
| | | | | |
Health Maintenance Organizations — 1.4% |
CIGNA Corp. | | 4,740 | | $ | 254,680 |
Coventry Health Care, Inc. (a) | | 1,010 | | | 59,843 |
| | | | | |
| | | | $ | 314,523 |
| | | | | |
Insurance — 11.6% | | | | | |
Ace Ltd. | | 2,650 | | $ | 163,717 |
Allied World Assurance Co. Holdings Ltd. | | 3,560 | | | 178,605 |
Aspen Insurance Holdings Ltd. | | 12,060 | | | 347,810 |
Employers Holdings, Inc. | | 1,170 | | | 19,551 |
Endurance Specialty Holdings Ltd. | | 10,030 | | | 418,552 |
Genworth Financial, Inc., “A” | | 18,120 | | | 461,154 |
IPC Holdings Ltd. | | 1,820 | | | 52,543 |
Max Capital Group Ltd. | | 1,730 | | | 48,423 |
Mercury General Corp. | | 410 | | | 20,422 |
PartnerRe Ltd. | | 4,850 | | | 400,271 |
Protective Life Corp. | | 2,400 | | | 98,448 |
RenaissanceRe Holdings Ltd. | | 1,130 | | | 68,071 |
W.R. Berkley Corp. | | 5,120 | | | 152,627 |
XL Capital Ltd., “A” | | 1,950 | | | 98,105 |
Zenith National Insurance Corp. | | 1,840 | | | 82,303 |
| | | | | |
| | | | $ | 2,610,602 |
| | | | | |
Leisure & Toys — 0.8% | | | | | |
Hasbro, Inc. | | 6,610 | | $ | 169,084 |
| | | | | |
Machinery & Tools — 8.2% | | | | | |
Commercial Metals Co. | | 3,800 | | $ | 111,910 |
Cummins, Inc. | | 1,690 | | | 215,255 |
Eaton Corp. | | 7,330 | | | 710,644 |
Kennametal, Inc. | | 2,540 | | | 96,164 |
Timken Co. | | 16,530 | | | 543,011 |
Trinity Industries, Inc. | | 5,630 | | | 156,289 |
| | | | | |
| | | | $ | 1,833,273 |
| | | | | |
Major Banks — 1.6% | | | | | |
Bank of New York Mellon Corp. | | 3,320 | | $ | 161,883 |
PNC Financial Services Group, Inc. | | 2,990 | | | 196,294 |
| | | | | |
| | | | $ | 358,177 |
| | | | | |
Medical Equipment — 1.4% | | | | | |
Advanced Medical Optics, Inc. (a) | | 1,550 | | $ | 38,022 |
Cooper Cos., Inc. | | 7,140 | | | 271,320 |
| | | | | |
| | | | $ | 309,342 |
| | | | | |
Metals & Mining — 1.9% | | | | | |
Freeport-McMoRan Copper & Gold, Inc. | | 3,670 | | $ | 375,955 |
Olin Corp. | | 2,240 | | | 43,299 |
| | | | | |
| | | | $ | 419,254 |
| | | | | |
Natural Gas — Distribution — 2.0% | | | | | |
Energen Corp. | | 3,170 | | $ | 203,609 |
Questar Corp. | | 4,710 | | | 254,811 |
| | | | | |
| | | | $ | 458,420 |
| | | | | |
Natural Gas — Pipeline — 4.4% | | | | | |
El Paso Corp. | | 29,370 | | $ | 506,339 |
Williams Cos., Inc. | | 13,120 | | | 469,434 |
| | | | | |
| | | | $ | 975,773 |
| | | | | |
Network & Telecom — 1.5% | | | | | |
QLogic Corp. (a) | | 24,400 | | $ | 346,480 |
| | | | | |
41-MCVP
Portfolio of Investments — continued
Common Stocks — continued
| | | | | |
| Issuer | | Shares/Par | | Value ($) |
Other Banks & Diversified Financials — 3.2% | | | |
AmeriCredit Corp. (a) | | 5,010 | | $ | 64,078 |
CIT Group, Inc. | | 2,290 | | | 55,029 |
Countrywide Financial Corp. | | 9,570 | | | 85,556 |
East West Bancorp, Inc. | | 2,350 | | | 56,941 |
Marshall & Ilsley Corp. | | 1,878 | | | 49,729 |
New York Community Bancorp, Inc. | | 13,080 | | | 229,946 |
Northern Trust Corp. | | 2,210 | | | 169,242 |
| | | | | |
| | | | $ | 710,521 |
| | | | | |
Personal Computers & Peripherals — 0.6% |
Western Digital Corp. (a) | | 4,250 | | $ | 128,393 |
| | | | | |
Pharmaceuticals — 1.0% | | | | | |
Endo Pharmaceuticals Holdings, Inc. (a) | | 1,210 | | $ | 32,271 |
Medicis Pharmaceutical Corp., “A” | | 7,430 | | | 192,957 |
| | | | | |
| | | | $ | 225,228 |
| | | | | |
Pollution Control — 1.1% | | | | | |
Allied Waste Industries, Inc. (a) | | 22,320 | | $ | 245,966 |
| | | | | |
Printing & Publishing — 0.7% | | | | | |
Washington Post Co., “B” | | 210 | | $ | 166,200 |
| | | | | |
Real Estate — 5.9% | | | | | |
BRE Properties, Inc., REIT | | 2,540 | | $ | 102,946 |
CBL & Associates Properties, Inc., REIT | | 5,060 | | | 120,985 |
Equity Residential, REIT | | 12,120 | | | 442,016 |
Host Hotels & Resorts, Inc., REIT | | 13,350 | | | 227,484 |
Macerich Co., REIT | | 1,200 | | | 85,272 |
Mack-Cali Realty Corp., REIT | | 4,620 | | | 157,080 |
Maguire Properties, Inc., REIT | | 2,770 | | | 81,632 |
Taubman Centers, Inc., REIT | | 2,020 | | | 99,364 |
| | | | | |
| | | | $ | 1,316,779 |
| | | | | |
Restaurants — 1.6% | | | | | |
Brinker International, Inc. | | 4,820 | | $ | 94,279 |
Darden Restaurants, Inc. | | 9,160 | | | 253,824 |
| | | | | |
| | | | $ | 348,103 |
| | | | | |
Special Products & Services — 0.2% | | | | | |
H.B. Fuller Co. | | 2,000 | | $ | 44,900 |
| | | | | |
Specialty Chemicals — 1.5% | | | | | |
Air Products & Chemicals, Inc. | | 1,510 | | $ | 148,931 |
Albemarle Corp. | | 4,530 | | | 186,863 |
| | | | | |
| | | | $ | 335,794 |
| | | | | |
Specialty Stores — 1.3% | | | | | |
Advance Auto Parts, Inc. | | 5,400 | | $ | 205,146 |
RadioShack Corp. | | 4,710 | | | 79,411 |
| | | | | |
| | | | $ | 284,557 |
| | | | | |
Telecommunications — Wireless — 0.8% |
NII Holdings, Inc. “B” (a) | | 3,800 | | $ | 183,616 |
| | | | | |
Telephone Services — 3.2% | | | | | |
Embarq Corp. | | 8,680 | | $ | 429,920 |
Qwest Communications International, Inc. | | 42,150 | | | 295,472 |
| | | | | |
| | | | $ | 725,392 |
| | | | | |
Tobacco — 2.1% | | | | | |
Loews Corp. | | 4,820 | | $ | 411,146 |
Reynolds American, Inc. | | 920 | | | 60,683 |
| | | | | |
| | | | $ | 471,829 |
| | | | | |
| | | | | | | |
| Issuer | | Shares/Par | | Value ($) | |
Utilities — Electric Power — 10.9% | |
American Electric Power Co., Inc. | | | 2,020 | | $ | 94,051 | |
CMS Energy Corp. | | | 2,570 | | | 44,667 | |
Constellation Energy Group, Inc. | | | 4,710 | | | 482,916 | |
Edison International | | | 1,100 | | | 58,707 | |
FPL Group, Inc. | | | 2,230 | | | 151,149 | |
Mirant Corp. (a) | | | 4,670 | | | 182,037 | |
NRG Energy, Inc. (a) | | | 12,010 | | | 520,507 | |
Pepco Holdings, Inc. | | | 15,680 | | | 459,894 | |
PG&E Corp. | | | 10,510 | | | 452,876 | |
| | | | | | | |
| | | | | $ | 2,446,804 | |
| | | | | | | |
Total Common Stocks
(Identified Cost, $20,340,934) | | $ | 21,745,575 | |
| | | | | | | |
|
Short-Term Obligations – 3.2% | |
American Express Credit Corp.,
4.12%, due 1/02/08, at
Amortized Cost and Value (y) | | $ | 706,000 | | $ | 705,919 | |
| | | | | | | |
Total Investments
(Identified Cost, $21,042,639) | | $ | 22,451,494 | |
| | | | | | | |
| |
Other Assets,
Less Liabilities — (0.2)% | | | (41,470 | ) |
| | | | | | | |
Net Assets — 100.0% | | $ | 22,410,024 | |
| | | | | | | |
See portfolio footnotes and notes to financial statements.
42-MCVP
Portfolio of Investments — December 31, 2007
MFS Money Market Portfolio
Certificates of Deposit - 17.2%
| | | | | | |
| Issuer | | Shares/Par | | Value ($) |
| | | | | | |
Financial Institutions — 4.0% | | | |
Swedbank,
4.88%, NY, due 02/11/08 | | $ | 21,952,000 | | $ | 21,952,000 |
| | | | | | |
Major Banks — 6.5% | | | | | | |
Bank of Scotland PLC, NY,
4.845%, due 02/04/08 | | $ | 7,965,000 | | $ | 7,965,000 |
Barclays Bank PLC, NY,
4.99%, due 01/23/08 | | | 21,155,000 | | | 21,155,000 |
BNP Paribas, NY,
4.8%, due 02/13/08 | | | 7,178,000 | | | 7,178,000 |
| | | | | | |
| | | | | $ | 36,298,000 |
| | | | | | |
Other Banks & Diversified Financials — 6.7% |
DEPFA Bank PLC, NY,
5.125%, due 01/23/08 | | $ | 15,315,000 | | $ | 15,315,000 |
Fortis Bank, NY,
4.82%, due 02/07/08 | | | 21,700,000 | | | 21,700,000 |
| | | | | | |
| | | | | $ | 37,015,000 |
| | | | | | |
Total Certificates of Deposit, at Amortized Cost and Value | | | | | $ | 95,265,000 |
| | | | | | |
| |
Commercial Paper (y) — 73.9% | | | |
Automotive—4.0% | | | | | | |
Toyota Motor Credit Corp.,
4.68%, due 3/28/08 | | $ | 22,670,000 | | $ | 22,413,602 |
| | | | | | |
Brokerage & Asset Managers — 12.1% |
Goldman Sachs Group, Inc.,
4.8%, due 1/31/08 | | $ | 22,270,000 | | $ | 22,180,920 |
Merrill Lynch & Co., Inc.,
5.25%, due 1/28/08 | | | 8,258,000 | | | 8,225,484 |
Merrill Lynch & Co., Inc.,
5%, due 3/20/08 | | | 10,013,000 | | | 9,903,135 |
Merrill Lynch & Co., Inc.,
4.73%, due 4/15/08 | | | 4,205,000 | | | 4,146,989 |
Morgan Stanley, 4.8%, due 6/13/08 | | | 22,827,000 | | | 22,327,850 |
| | | | | | |
| | | | | $ | 66,784,378 |
| | | | | | |
Financial Institutions — 12.1% | | | |
American Express Credit Corp.,
4.68%, due 2/08/08 | | $ | 2,507,000 | | $ | 2,494,615 |
American Express Credit Corp.,
4.42%, due 3/20/08 | | | 20,048,000 | | | 19,853,546 |
Cargill, Inc., 4.75%, due 1/24/08 (t) | | | 4,763,000 | | | 4,748,546 |
Cargill, Inc., 4.74%, due 2/13/08 (t) | | | 6,786,000 | | | 6,747,580 |
Cargill, Inc., 5%, due 2/29/08 (t) | | | 11,101,000 | | | 11,010,033 |
General Electric Capital Corp.,
5.17%, due 1/23/08 | | | 5,800,000 | | | 5,781,675 |
General Electric Capital Corp.,
4.62%, due 2/22/08 | | | 11,430,000 | | | 11,353,724 |
General Electric Capital Corp.,
4.65%, due 3/27/08 | | | 5,340,000 | | | 5,280,682 |
| | | | | | |
| | | | | $ | 67,270,401 |
| | | | | | |
Food & Beverages — 5.4% | | | | | | |
Archer Daniels Midland Co.,
4.5%, due 1/29/08 (t) | | $ | 22,457,000 | | $ | 22,378,401 |
Hershey Foods Corp.,
4.5%, due 1/14/08 (t) | | | 7,510,000 | | | 7,497,796 |
| | | | | | |
| | | | | $ | 29,876,197 |
| | | | | | |
Insurance — 4.0% | | | | | | |
AIG Funding, Inc.,
4.85%, due 2/01/08 | | $ | 22,219,000 | | $ | 22,126,205 |
| | | | | | |
| | | | | | | |
| Issuer | | Shares/Par | | Value ($) | |
| | | | | | | |
Machinery & Tools — 5.8% | | | | | | | |
Caterpillar Financial Services Corp.,
4.2%, due 2/07/08 | | $ | 10,000,000 | | $ | 9,956,833 | |
Du Pont E.I. de Nemours Co.,
4.2%, due 1/11/08 (t) | | | 22,352,000 | | | 22,325,923 | |
| | | | | | | |
| | | | | $ | 32,282,756 | |
| | | | | | | |
Major Banks — 18.0% | | | | | | | |
ABN Amro North America Finance, Inc.,
5.105%, due 1/10/08 | | $ | 21,709,000 | | $ | 21,681,294 | |
BNP Paribas Finance, Inc.,
4.663%, due 1/14/08 | | | 14,980,000 | | | 14,954,776 | |
JPMorgan Chase & Co.,
5.03%, due 1/22/08 | | | 22,119,000 | | | 22,054,099 | |
Natexis Banques Populaires U.S. Finance Co., LLC,
5.07%, due 2/04/08 | | | 22,284,000 | | | 22,177,297 | |
Societe Generale North America, Inc.,
5.155%, due 1/09/08 | | | 18,630,000 | | | 18,608,658 | |
| | | | | | | |
| | | | | $ | 99,476,124 | |
| | | | | | | |
Other Banks & Diversified Financials — 12.5% | |
Calyon North America, Inc.,
5.06%, due 2/06/08 | | $ | 9,752,000 | | $ | 9,702,655 | |
Citigroup Funding, Inc.,
4.88%, due 2/25/08 | | | 16,768,000 | | | 16,642,985 | |
Citigroup Funding, Inc.,
4.9%, due 3/26/08 | | | 5,753,000 | | | 5,686,441 | |
Dexia Delaware LLC,
5.22%, due 1/14/08 | | | 12,129,000 | | | 12,106,137 | |
Dexia Delaware LLC,
4.96%, due 2/19/08 | | | 10,000,000 | | | 9,932,489 | |
UBS Financial Delaware LLC,
5.33%, due 2/19/08 | | | 15,515,000 | | | 15,402,442 | |
| | | | | | | |
| | | | | $ | 69,473,149 | |
| | | | | | | |
Total Commercial Paper, at
Amortized Cost and Value | | $ | 409,702,812 | |
| | | | | | | |
|
Repurchase Agreements – 9.6% | |
Merrill Lynch & Co., 4.5%, dated 12/31/07, due 1/02/08, total to be received $53,136,281 (secured by various U.S. Treasury and Federal Agency obligations and Mortgage Backed securities in a jointly traded account), at Cost | | $ | 53,123,000 | | $ | 53,123,000 | |
| | | | | | | |
Total Investments, at
Cost and Value | | $ | 558,090,812 | |
| | | | | | | |
| |
Other Assets,
Less Liabilities — (0.7)% | | | (3,761,299 | ) |
| | | | | | | |
Net Assets — 100.0% | | $ | 554,329,513 | |
| | | | | | | |
See portfolio footnotes and notes to financial statements.
43-MCVP
Portfolio of Investments — December 31, 2007
MFS New Discovery Portfolio
Common Stocks - 99.5%
| | | | | |
| Issuer | | Shares/Par | | Value ($) |
| | | | | |
Airlines — 0.5% | | | | | |
Allegiant Travel Co. (a) | | 49,710 | | $ | 1,597,679 |
| | | | | |
Alcoholic Beverages — 0.2% | | | | | |
Castle Brands, Inc. (a)(z) | | 126,100 | | $ | 279,942 |
Castle Brands, Inc. (a)(l) | | 93,470 | | | 207,503 |
| | | | | |
| | | | $ | 487,445 |
| | | | | |
Apparel Manufacturers — 0.8% | | | |
Quiksilver, Inc. (a) | | 312,370 | | $ | 2,680,135 |
| | | | | |
Biotechnology — 2.1% | | | | | |
Millipore Corp. (a) | | 74,860 | | $ | 5,478,255 |
Nanosphere, Inc. (a) | | 82,340 | | | 1,151,937 |
| | | | | |
| | | | $ | 6,630,192 |
| | | | | |
Brokerage & Asset Managers — 0.8% | | | |
HFF, Inc., “A” (a) | | 169,090 | | $ | 1,308,756 |
Thomas Weisel Partners Group (a) | | 80,540 | | | 1,105,814 |
| | | | | |
| | | | $ | 2,414,570 |
| | | | | |
Business Services — 5.2% | | | | | |
Constant Contact, Inc. (a) | | 80,650 | | $ | 1,733,975 |
Corporate Executive Board Co. (l) | | 143,340 | | | 8,614,734 |
CoStar Group, Inc. (a)(l) | | 50,130 | | | 2,368,642 |
iGate Corp. (a)(l) | | 213,170 | | | 1,805,550 |
Syntel, Inc. (l) | | 49,570 | | | 1,909,436 |
| | | | | |
| | | | $ | 16,432,337 |
| | | | | |
Chemicals — 0.4% | | | |
Nalco Holding Co. | | 57,500 | | $ | 1,390,350 |
| | | | | |
Computer Software — 3.1% | | | | | |
ACI Worldwide, Inc. (a)(l) | | 263,830 | | $ | 5,023,323 |
CommVault Systems, Inc. (a) | | 147,010 | | | 3,113,672 |
Guidance Software, Inc. (a)(l) | | 121,870 | | | 1,698,868 |
| | | | | |
| | | | $ | 9,835,863 |
| | | | | |
Computer Software — Systems — 1.4% | | | |
Deltek, Inc. (a) | | 109,120 | | $ | 1,661,897 |
Enernoc, Inc. (a)(l) | | 18,320 | | | 899,512 |
PROS Holdings, Inc. (a) | | 97,120 | | | 1,905,494 |
| | | | | |
| | | | $ | 4,466,903 |
| | | | | |
Construction — 3.2% | | | |
D.R. Horton, Inc. | | 278,600 | | $ | 3,669,162 |
Dayton Superior Corp. (a)(l) | | 196,630 | | | 766,857 |
M.D.C. Holdings, Inc. (l) | | 153,490 | | | 5,699,084 |
| | | | | |
| | | | $ | 10,135,103 |
| | | | | |
Consumer Goods & Services — 4.4% | | | |
Bright Horizons Family Solutions, Inc. (a) | | 86,180 | | $ | 2,976,657 |
Central Garden & Pet Co., “A” (a)(l) | | 752,240 | | | 4,032,006 |
Knot, Inc. (a)(l) | | 153,800 | | | 2,451,572 |
NutriSystem, Inc. (a)(l) | | 82,080 | | | 2,214,518 |
Physicians Formula Holdings, Inc. (a) | | 187,300 | | | 2,225,124 |
| | | | | |
| | | | $ | 13,899,877 |
| | | | | |
Electronics — 7.7% | | | |
ARM Holdings PLC | | 1,968,090 | | $ | 4,824,776 |
ATMI, Inc. (a) | | 122,900 | | | 3,963,525 |
Hittite Microwave Corp. (a)(l) | | 125,800 | | | 6,008,208 |
Intersil Corp., “A” | | 127,890 | | | 3,130,747 |
Jabil Circuit, Inc. | | 185,670 | | | 2,835,181 |
MathStar, Inc. (a) | | 225,000 | | | 146,250 |
| | | | | |
| Issuer | | Shares/Par | | Value ($) |
| | | | | |
Electronics — continued | | | |
PLX Technology, Inc. (a)(l) | | 131,190 | | $ | 1,220,067 |
Volterra Semiconductor Corp. (a)(l) | | 209,320 | | | 2,308,800 |
| | | | | |
| | | | $ | 24,437,554 |
| | | | | |
Energy — Independent — 2.6% | | | |
EXCO Resources, Inc. (a)(l) | | 214,100 | | $ | 3,314,268 |
Goodrich Petroleum Corp. (a)(l) | | 108,640 | | | 2,457,437 |
Kodiak Oil & Gas Corp. (a) | | 502,520 | | | 1,105,544 |
Sandridge Energy, Inc. (a) | | 38,990 | | | 1,398,181 |
| | | | | |
| | | | $ | 8,275,430 |
| | | | | |
Engineering — Construction — 3.3% | | | |
North American Energy Partners, Inc. (a) | | 335,060 | | $ | 4,540,063 |
Quanta Services, Inc. (a)(l) | | 220,624 | | | 5,789,174 |
| | | | | |
| | | | $ | 10,329,237 |
| | | | | |
Food & Beverages — 1.5% | | | |
Diamond Foods, Inc. | | 136,130 | | $ | 2,917,266 |
Hain Celestial Group, Inc. (a)(l) | | 61,350 | | | 1,963,200 |
| | | | | |
| | | | $ | 4,880,466 |
| | | | | |
Food & Drug Stores — 0.5% | | | |
Susser Holdings Corp. (a) | | 72,990 | | $ | 1,496,295 |
| | | | | |
Forest & Paper Products — 1.3% | | | |
Universal Forest Products, Inc. (l) | | 136,190 | | $ | 4,012,157 |
| | | | | |
Gaming & Lodging — 1.7% | | | | | |
WMS Industries, Inc. (a)(l) | | 145,165 | | $ | 5,318,846 |
| | | | | |
General Merchandise — 2.3% | | | | | |
99 Cents Only Stores (a)(l) | | 420,470 | | $ | 3,346,941 |
Stage Stores, Inc. | | 276,915 | | | 4,098,342 |
| | | | | |
| | | | $ | 7,445,283 |
| | | | | |
Internet — 1.8% | | | |
Dealertrack Holdings, Inc. (a) | | 62,280 | | $ | 2,084,511 |
TechTarget, Inc. (a) | | 236,320 | | | 3,492,810 |
| | | | | |
| | | | $ | 5,577,321 |
| | | | | |
Leisure & Toys — 2.9% | | | |
Take-Two Interactive Software, Inc. (a)(l) | | 189,770 | | $ | 3,501,257 |
THQ, Inc. (a) | | 201,419 | | | 5,678,002 |
| | | | | |
| | | | $ | 9,179,259 |
| | | | | |
Machinery & Tools — 3.5% | | | |
Bucyrus International, Inc., “A” | | 17,480 | | $ | 1,737,337 |
Kennametal, Inc. | | 40,730 | | | 1,542,038 |
Polypore International, Inc. (a) | | 349,680 | | | 6,119,400 |
Ritchie Bros. Auctioneers, Inc. | | 20,470 | | | 1,692,869 |
| | | | | |
| | | | $ | 11,091,644 |
| | | | | |
Medical & Health Technology & Services — 7.0% |
Animal Health International, Inc. (a) | | 159,340 | | $ | 1,959,882 |
Genoptix, Inc. (a) | | 21,020 | | | 645,314 |
Healthcare Services Group, Inc. (l) | | 192,775 | | | 4,082,975 |
IDEXX Laboratories, Inc. (a) | | 95,806 | | | 5,617,106 |
Medassets, Inc. (a) | | 117,530 | | | 2,813,668 |
MWI Veterinary Supply, Inc. (a) | | 180,090 | | | 7,203,600 |
| | | | | |
| | | | $ | 22,322,545 |
| | | | | |
Medical Equipment — 14.4% | | | | | |
ABIOMED, Inc. (a)(l) | | 198,340 | | $ | 3,082,204 |
Advanced Medical Optics, Inc. (a)(l) | | 212,780 | | | 5,219,493 |
AngioDynamics, Inc. (a) | | 146,160 | | | 2,782,886 |
44-NDP
Portfolio of Investments — continued
| | |
| Common Stocks — continued | | |
| | | | | |
| Issuer | | Shares/Par | | Value ($) |
| | | | | |
Medical Equipment — continued | | | |
Aspect Medical Systems, Inc. (a)(l) | | 284,400 | | $ | 3,981,600 |
AtriCure, Inc. (a) | | 108,560 | | | 1,423,222 |
Conceptus, Inc. (a)(l) | | 279,760 | | | 5,382,582 |
Cooper Cos., Inc. (l) | | 78,690 | | | 2,990,220 |
Dexcom, Inc. (a)(l) | | 150,200 | | | 1,326,266 |
Immucor, Inc. (a) | | 68,290 | | | 2,321,177 |
Insulet Corp. (a)(l) | | 93,810 | | | 2,202,659 |
NxStage Medical, Inc. (a)(l) | | 209,170 | | | 3,173,109 |
ResMed, Inc. (a)(l) | | 102,460 | | | 5,382,224 |
Somanetics Corp. (a) | | 79,290 | | | 1,875,209 |
Thoratec Corp. (a)(l) | | 250,510 | | | 4,556,777 |
| | | | | |
| | | | $ | 45,699,628 |
| | | | | |
Metals & Mining — 0.7% | | | | | |
Century Aluminum Co. (a) | | 43,730 | | $ | 2,358,796 |
| | | | | |
Network & Telecom — 4.0% | | | | | |
NICE Systems Ltd., ADR (a) | | 237,190 | | $ | 8,140,361 |
Polycom, Inc. (a) | | 120,290 | | | 3,341,656 |
Sonus Networks, Inc. (a)(l) | | 182,630 | | | 1,064,733 |
| | | | | |
| | | | $ | 12,546,750 |
| | | | | |
Oil Services — 2.4% | | | | | |
Dresser-Rand Group, Inc. (a) | | 43,020 | | $ | 1,679,931 |
Exterran Holdings, Inc. (a)(l) | | 53,630 | | | 4,386,934 |
Natural Gas Services Group, Inc. (a) | | 71,570 | | | 1,403,488 |
| | | | | |
| | | | $ | 7,470,353 |
| | | | | |
Other Banks & Diversified Financials — 1.3% |
New York Community Bancorp, Inc. (l) | | 112,990 | | $ | 1,986,364 |
Signature Bank (a) | | 63,390 | | | 2,139,413 |
| | | | | |
| | | | $ | 4,125,777 |
| | | | | |
Personal Computers & Peripherals — 2.8% |
Mellanox Technologies Ltd. (a) | | 161,640 | | $ | 2,945,081 |
Nuance Communications, Inc. (a) | | 309,995 | | | 5,790,707 |
| | | | | |
| | | | $ | 8,735,788 |
| | | | | |
Pharmaceuticals — 1.5% |
Cadence Pharmaceuticals, Inc. (a)(l) | | 85,630 | | $ | 1,272,462 |
Medicis Pharmaceutical Corp., “A” (l) | | 118,060 | | | 3,066,018 |
Synta Pharmaceuticals Corp. (a)(l) | | 65,280 | | | 437,376 |
| | | | | |
| | | | $ | 4,775,856 |
| | | | | |
Pollution Control — 0.2% |
Team, Inc. (a) | | 18,700 | | $ | 684,046 |
| | | | | |
Printing & Publishing — 1.2% | | | | | |
MSCI, Inc., “A” (a) | | 95,880 | | $ | 3,681,792 |
| | | | | |
Restaurants — 5.9% | | | | | |
McCormick & Schmick’s Seafood Restaurant, Inc. (a) | | 202,210 | | $ | 2,412,365 |
Panera Bread Co., “A” (a)(l) | | 172,040 | | | 6,162,473 |
Peet’s Coffee & Tea, Inc. (a)(l) | | 70,090 | | | 2,037,516 |
Red Robin Gourmet Burgers, Inc. (a)(l) | | 149,450 | | | 4,780,906 |
Texas Roadhouse, Inc., “A” (a)(l) | | 307,850 | | | 3,404,821 |
| | | | | |
| | | | $ | 18,798,081 |
| | | | | |
Specialty Chemicals — 0.3% |
Metabolix, Inc. (a)(l) | | 40,310 | | $ | 959,378 |
| | | | | |
| | | | | |
| Issuer | | Shares/Par | | Value ($) |
| | | | | |
Specialty Stores — 5.3% | | | | | |
CarMax, Inc. (a)(l) | | 162,870 | | $ | 3,216,682 |
Citi Trends, Inc. (a)(l) | | 304,830 | | | 4,706,575 |
Dick’s Sporting Goods, Inc. (a) | | 40,830 | | | 1,133,441 |
Lumber Liquidators, Inc. (a) | | 177,750 | | | 1,597,973 |
Monro Muffler Brake, Inc. | | 115,245 | | | 2,246,125 |
Urban Outfitters, Inc. (a)(l) | | 137,270 | | | 3,741,980 |
| | | | | |
| | | | $ | 16,642,776 |
| | | | | |
Telephone Services — 1.3% |
Global Crossing Ltd. (a)(l) | | 184,300 | | $ | 4,063,815 |
| | | | | |
Total Common Stocks
(Identified Cost, $318,637,931) | | $ | 314,879,327 |
| | | | | |
| | | | | | | | | | |
| | | Strike
Price | | First
Exercise | | | | |
| | | |
Warrants — 0.0% | | | | | | | |
Alcoholic Beverages — 0.0% | | | | | |
Castle Brands, Inc.
(Identified Cost, $70,840) (a)(z) | | $ | 6.57 | | 5/08/07 | | 50,440 | | $ | 1,205 |
| | | | | | | | | | |
| | | | | | | |
|
Short-Term Obligations — 0.3% | |
American Express Credit Corp., 4.12%, due 1/02/08, at Amortized Cost and Value (y) | | $ | 1,007,000 | | $ | 1,006,885 | |
| | | | | | | |
|
Collateral for Securities Loaned — 22.9% | |
Navigator Securities Lending Prime Portfolio, at Cost and Net Asset Value | | | 72,654,740 | | $ | 72,654,740 | |
| | | | | | | |
Total Investments
(Identified Cost, $392,370,396) (k) | | $ | 388,542,157 | |
| | | | | | | |
| |
Other Assets, Less
Liabilities — (22.7)% | | | (71,997,433 | ) |
| | | | | | | |
Net Assets — 100.0% | | $ | 316,544,724 | |
| | | | | | | |
See portfolio footnotes and notes to financial statements
45-NDP
Portfolio of Investments — December 31, 2007
MFS Research Portfolio
Common Stocks — 99.3%
| | | | | |
| Issuer | | Shares/Par | | Value ($) |
| | | | | |
| | | | | |
Aerospace — 2.9% |
Lockheed Martin Corp. | | 38,970 | | $ | 4,101,982 |
United Technologies Corp. | | 59,860 | | | 4,581,684 |
| | | | | |
| | | | $ | 8,683,666 |
| | | | | |
Apparel Manufacturers — 1.2% | | | |
Coach, Inc. (a) | | 42,320 | | $ | 1,294,146 |
NIKE, Inc., “B” | | 36,070 | | | 2,317,137 |
| | | | | |
| | | | $ | 3,611,283 |
| | | | | |
Biotechnology — 3.3% | | | | | |
Amgen, Inc. (a) | | 39,520 | | $ | 1,835,309 |
Genzyme Corp. (a) | | 67,060 | | | 4,991,946 |
Millipore Corp. (a)(l) | | 40,050 | | | 2,930,859 |
| | | | | |
| | | | $ | 9,758,114 |
| | | | | |
Broadcasting — 1.7% | | | | | |
News Corp., “A” | | 92,840 | | $ | 1,902,292 |
Omnicom Group, Inc. | | 30,940 | | | 1,470,578 |
WPP Group PLC | | 120,160 | | | 1,538,373 |
| | | | | |
| | | | $ | 4,911,243 |
| | | | | |
Brokerage & Asset Managers — 3.8% | | | |
Affiliated Managers Group, Inc. (a)(l) | | 21,690 | | $ | 2,547,707 |
Goldman Sachs Group, Inc. | | 12,250 | | | 2,634,362 |
ICAP PLC | | 143,990 | | | 2,072,440 |
Invesco Ltd. (l) | | 88,720 | | | 2,784,034 |
TD AMERITRADE Holding Corp. (a) | | 69,910 | | | 1,402,395 |
| | | | | |
| | | | $ | 11,440,938 |
| | | | | |
Business Services — 1.0% | | | | | |
Satyam Computer Services Ltd., ADR (l) | | 106,880 | | $ | 2,855,834 |
| | | | | |
Cable TV — 1.0% | | | | | |
Comcast Corp., “Special A” (a) | | 106,245 | | $ | 1,925,159 |
Time Warner Cable, Inc. (a) | | 34,910 | | | 963,516 |
| | | | | |
| | | | $ | 2,888,675 |
| | | | | |
Chemicals — 2.0% | | | | | |
3M Co. | | 20,590 | | $ | 1,736,149 |
PPG Industries, Inc. | | 58,360 | | | 4,098,623 |
| | | | | |
| | | | $ | 5,834,772 |
| | | | | |
Computer Software — 2.5% | | | | | |
Microsoft Corp. | | 102,990 | | $ | 3,666,444 |
Salesforce.com, Inc. (a)(l) | | 21,930 | | | 1,374,792 |
VeriSign, Inc. (a) | | 64,650 | | | 2,431,487 |
| | | | | |
| | | | $ | 7,472,723 |
| | | | | |
Computer Software — Systems — 2.9% | | | |
EMC Corp. (a) | | 82,050 | | $ | 1,520,386 |
International Business Machines Corp. | | 65,390 | | | 7,068,659 |
| | | | | |
| | | | $ | 8,589,045 |
| | | | | |
Conglomerates — 1.3% | | | | | |
Siemens AG | | 24,920 | | $ | 3,912,173 |
| | | | | |
Construction — 0.7% | | | | | |
D.R. Horton, Inc. | | 167,210 | | $ | 2,202,156 |
| | | | | |
Consumer Goods & Services — 1.4% | | | |
Colgate-Palmolive Co. | | 53,310 | | $ | 4,156,048 |
| | | | | |
| | | | | |
| Issuer | | Shares/Par | | Value ($) |
| | | | | |
| | | | | |
Electrical Equipment — 2.8% | | | | | |
Danaher Corp. | | 70,110 | | $ | 6,151,451 |
Rockwell Automation, Inc. | | 32,520 | | | 2,242,579 |
| | | | | |
| | | | $ | 8,394,030 |
| | | | | |
Electronics — 4.8% | | | | | |
Flextronics International Ltd. (a) | | 128,530 | | $ | 1,550,072 |
Intel Corp. | | 200,420 | | | 5,343,197 |
Marvell Technology Group Ltd. (a) | | 97,100 | | | 1,357,458 |
National Semiconductor Corp. (l) | | 90,100 | | | 2,039,864 |
SanDisk Corp. (a)(l) | | 36,090 | | | 1,197,105 |
Taiwan Semiconductor Manufacturing Co. Ltd., ADR | | 275,920 | | | 2,748,163 |
| | | | | |
| | | | $ | 14,235,859 |
| | | | | |
Energy — Independent — 3.5% | | | | | |
Apache Corp. | | 42,050 | | $ | 4,522,057 |
CONSOL Energy, Inc. | | 33,450 | | | 2,392,344 |
Ultra Petroleum Corp. (a) | | 19,970 | | | 1,427,855 |
XTO Energy, Inc. | | 37,220 | | | 1,911,619 |
| | | | | |
| | | | $ | 10,253,875 |
| | | | | |
Energy — Integrated — 5.5% | | | | | |
Exxon Mobil Corp. | | 96,460 | | $ | 9,037,337 |
Hess Corp. | | 25,280 | | | 2,549,741 |
Marathon Oil Corp. | | 41,830 | | | 2,545,774 |
TOTAL S.A., ADR | | 28,350 | | | 2,341,710 |
| | | | | |
| | | | $ | 16,474,562 |
| | | | | |
Engineering — Construction — 0.6% | | | |
Fluor Corp. | | 11,590 | | $ | 1,688,895 |
| | | | | |
Food & Beverages — 4.0% | | | | | |
Dean Foods Co. (l) | | 40,070 | | $ | 1,036,210 |
General Mills, Inc. | | 41,730 | | | 2,378,610 |
Nestle S.A. | | 5,195 | | | 2,380,420 |
PepsiCo, Inc. | | 80,300 | | | 6,094,770 |
| | | | | |
| | | | $ | 11,890,010 |
| | | | | |
Food & Drug Stores — 1.2% | | | | | |
CVS Caremark Corp. | | 91,990 | | $ | 3,656,602 |
| | | | | |
Gaming & Lodging — 1.5% | | | | | |
International Game Technology | | 44,590 | | $ | 1,958,839 |
Royal Caribbean Cruises Ltd. (l) | | 58,810 | | | 2,495,896 |
| | | | | |
| | | | $ | 4,454,735 |
| | | | | |
General Merchandise — 0.8% | | | | | |
Macy’s, Inc. | | 91,900 | | $ | 2,377,453 |
| | | | | |
Health Maintenance Organizations — 1.1% | | | |
WellPoint, Inc. (a) | | 37,120 | | $ | 3,256,538 |
| | | | | |
Insurance — 5.7% | | | | | |
Chubb Corp. | | 46,150 | | $ | 2,518,867 |
Genworth Financial, Inc., “A” | | 104,010 | | | 2,647,055 |
Hartford Financial Services Group, Inc. | | 28,260 | | | 2,463,989 |
MetLife, Inc. | | 85,930 | | | 5,295,007 |
Prudential Financial, Inc. | | 43,180 | | | 4,017,467 |
| | | | | |
| | | | $ | 16,942,385 |
| | | | | |
Internet — 2.3% | | | | | |
Google, Inc., “A” (a) | | 7,660 | | $ | 5,296,737 |
Yahoo!, Inc. (a) | | 68,930 | | | 1,603,312 |
| | | | | |
| | | | $ | 6,900,049 |
| | | | | |
46-REP
Portfolio of Investments — continued
| | |
| Common Stocks — continued | | |
| | | | | |
| Issuer | | Shares/Par | | Value ($) |
| | | | | |
Machinery & Tools — 1.5% | | | | | |
Bucyrus International, Inc., “A” | | 3,690 | | $ | 366,749 |
Eaton Corp. | | 15,820 | | | 1,533,749 |
GEA Group AG (a) | | 23,900 | | | 825,464 |
Timken Co. | | 55,990 | | | 1,839,272 |
| | | | | |
| | | | $ | 4,565,234 |
| | | | | |
Major Banks — 8.0% | | | | | |
Bank of America Corp. | | 102,940 | | $ | 4,247,304 |
Bank of New York Mellon Corp. | | 172,766 | | | 8,424,070 |
JPMorgan Chase & Co. | | 125,480 | | | 5,477,202 |
State Street Corp. | | 67,740 | | | 5,500,488 |
| | | | | |
| | | | $ | 23,649,064 |
| | | | | |
Medical & Health Technology & Services — 0.6% |
DaVita, Inc. (a) | | 31,160 | | $ | 1,755,866 |
| | | | | |
Medical Equipment — 3.0% | | | | | |
Boston Scientific Corp. (a) | | 210,590 | | $ | 2,449,162 |
C.R. Bard, Inc. | | 18,240 | | | 1,729,152 |
ResMed, Inc. (a)(l) | | 50,220 | | | 2,638,057 |
Zimmer Holdings, Inc. (a) | | 33,220 | | | 2,197,503 |
| | | | | |
| | | | $ | 9,013,874 |
| | | | | |
Metals & Mining — 1.9% |
BHP Billiton PLC | | 97,750 | | $ | 3,008,225 |
Cameco Corp. | | 28,460 | | | 1,132,992 |
United States Steel Corp. | | 13,580 | | | 1,641,958 |
| | | | | |
| | | | $ | 5,783,175 |
| | | | | |
Natural Gas — Distribution — 1.4% |
Questar Corp. | | 28,180 | | $ | 1,524,538 |
Sempra Energy | | 41,370 | | | 2,559,976 |
| | | | | |
| | | | $ | 4,084,514 |
| | | | | |
Natural Gas — Pipeline — 0.6% |
Williams Cos., Inc. | | 50,530 | | $ | 1,807,963 |
| | | | | |
Network & Telecom — 2.2% |
Cisco Systems, Inc. (a) | | 106,790 | | $ | 2,890,805 |
Nokia Corp., ADR | | 54,630 | | | 2,097,246 |
Research In Motion Ltd. (a) | | 12,917 | | | 1,464,788 |
| | | | | |
| | | | $ | 6,452,839 |
| | | | | |
Oil Services — 1.9% |
Exterran Holdings, Inc. (a)(l) | | 15,590 | | $ | 1,275,262 |
Halliburton Co. | | 89,970 | | | 3,410,763 |
Noble Corp. | | 16,920 | | | 956,149 |
| | | | | |
| | | | $ | 5,642,174 |
| | | | | |
Other Banks & Diversified Financials — 0.8% |
American Express Co. | | 48,160 | | $ | 2,505,283 |
| | | | | |
Pharmaceuticals — 4.0% |
Abbott Laboratories | | 47,790 | | $ | 2,683,408 |
Merck & Co., Inc. | | 100,200 | | | 5,822,622 |
Roche Holding AG | | 19,010 | | | 3,274,498 |
| | | | | |
| | | | $ | 11,780,528 |
| | | | | |
Real Estate — 0.4% |
Equity Residential, REIT | | 34,000 | | $ | 1,239,980 |
| | | | | |
Specialty Chemicals — 1.2% | | | | | |
Air Products & Chemicals, Inc. | | 17,850 | | $ | 1,760,545 |
Praxair, Inc. | | 20,180 | | | 1,790,168 |
| | | | | |
| | | | $ | 3,550,713 |
| | | | | |
| | | | | | | |
| Issuer | | Shares/Par | | Value ($) | |
| | | | | | | |
Specialty Stores — 3.1% | | | | | | | |
CarMax, Inc. (a)(l) | | | 61,200 | | $ | 1,208,700 | |
Lowe’s Cos., Inc. (l) | | | 87,550 | | | 1,980,381 | |
Nordstrom, Inc. (l) | | | 63,590 | | | 2,335,661 | |
PetSmart, Inc. | | | 52,510 | | | 1,235,560 | |
Staples, Inc. | | | 103,200 | | | 2,380,824 | |
| | | | | | | |
| | | | | $ | 9,141,126 | |
| | | | | | | |
Telecommunications — Wireless — 0.8% | |
Rogers Communications, Inc., “B” | | | 51,080 | | $ | 2,319,863 | |
| | | | | | | |
Telephone Services — 2.6% | |
AT&T, Inc. | | | 138,980 | | $ | 5,776,009 | |
Embarq Corp. | | | 16,330 | | | 808,825 | |
Qwest Communications International, Inc. (l) | | | 150,470 | | | 1,054,795 | |
| | | | | | | |
| | | | | $ | 7,639,629 | |
| | | | | | | |
Tobacco — 2.5% | |
Altria Group, Inc. | | | 99,110 | | $ | 7,490,734 | |
| | | | | | | |
Utilities — Electric Power — 3.3% | | | | |
American Electric Power Co., Inc. | | | 52,410 | | $ | 2,440,210 | |
FPL Group, Inc. | | | 41,820 | | | 2,834,560 | |
NRG Energy, Inc. (a)(l) | | | 45,770 | | | 1,983,672 | |
PG&E Corp. | | | 58,360 | | | 2,514,732 | |
| | | | | | | |
| | | | | $ | 9,773,174 | |
| | | | | | | |
Total Common Stocks
(Identified Cost, $275,275,493) | | $ | 295,037,396 | |
| | | | | | | |
| |
Short-Term Obligations — 0.6% | | | | |
American Express Credit Corp., 4.12%, due 1/02/08, at
Amortized Cost and Value (y) | | $ | 1,698,000 | | $ | 1,697,806 | |
| | | | | | | |
|
Collateral for Securities Loaned — 8.4% | |
Navigator Securities Lending Prime Portfolio, at Cost and Net Asset Value | | | 24,985,769 | | $ | 24,985,769 | |
| | | | | | | |
Total Investments
(Identified Cost, $301,959,068) | | $ | 321,720,971 | |
| | | | | | | |
| |
Other Assets, Less
Liabilities — (8.3)% | | | (24,671,984 | ) |
| | | | | | | |
Net Assets — 100.0% | | $ | 297,048,987 | |
| | | | | | | |
See portfolio footnotes and notes to financial statements
47-REP
Portfolio of Investments — December 31, 2007
MFS Strategic Income Portfolio
Bonds — 95.4%
| | | | | | |
| Issuer | | Shares/Par | | Value ($) |
| | | | | | |
Aerospace — 0.4% | | | | | | |
Hawker Beechcraft Acquisition Co.,
9.75%, 2017 (n) | | $ | 115,000 | | $ | 114,425 |
TransDigm, Inc., 7.75%, 2014 | | | 55,000 | | | 55,825 |
Vought Aircraft Industries, Inc., 8%, 2011 | | | 130,000 | | | 123,175 |
| | | | | | |
| | | | | $ | 293,425 |
| | | | | | |
Airlines — 0.2% | | | | | | |
Continental Airlines, Inc., 7.566%, 2020 | | $ | 135,112 | | $ | 131,059 |
| | | | | | |
Asset Backed & Securitized — 5.8% |
Anthracite Ltd., CDO, 6%, 2037 (z) | | $ | 200,000 | | $ | 139,688 |
ARCap REIT, Inc., CDO, “H”,
6.1%, 2045 (n) | | | 200,000 | | | 80,000 |
Asset Securitization Corp., FRN, 8.335%, 2029 | | | 164,993 | | | 180,444 |
Asset Securitization Corp., FRN, 8.825%, 2029 (z) | | | 185,000 | | | 191,938 |
Bayview Financial Revolving Mortgage Loan Trust, FRN, 5.6%, 2040 (z) | | | 250,000 | | | 200,000 |
Brazilian Merchant Voucher Receivables Ltd., 5.911%, 2011 (z) | | | 243,982 | | | 241,542 |
Chase Commercial Mortgage Securities Corp., 6.6%, 2029 (z) | | | 206,533 | | | 215,929 |
Countrywide Asset-Backed Certificates, FRN, 4.575%, 2035 | | | 10,786 | | | 10,711 |
Crest Ltd., CDO, 7%, 2040 | | | 270,000 | | | 215,592 |
Deutsche Mortgage & Asset Receiving Corp., FRN, 7.5%, 2031 | | | 250,000 | | | 272,114 |
DLJ Commercial Mortgage Corp., 6.04%, 2031 (z) | | | 265,000 | | | 269,512 |
Falcon Franchise Loan LLC, 6.5%, 2014 (z) | | | 250,000 | | | 171,488 |
Falcon Franchise Loan LLC, FRN, 3.085%, 2023 (i)(n) | | | 669,590 | | | 59,024 |
Falcon Franchise Loan LLC, FRN, 3.614%, 2025 (i)(z) | | | 718,537 | | | 90,227 |
First Union-Lehman Brothers Bank of America, FRN, 0.478%, 2035 (i) | | | 6,616,332 | | | 80,572 |
First Union-Lehman Brothers Commercial Mortgage Trust, 7%, 2029 (n) | | | 120,970 | | | 129,108 |
GMAC Commercial Mortgage Securities, Inc., FRN, 6.02%, 2033 (z) | | | 350,000 | | | 354,045 |
Morgan Stanley Capital I, Inc., FRN, 1.453%, 2039 (i)(n) | | | 2,662,489 | | | 99,524 |
Prudential Securities Secured Financing Corp., FRN, 7.243%, 2013 (z) | | | 411,000 | | | 427,742 |
Salomon Brothers Mortgage Securities, Inc., FRN, 7.072%, 2032 (z) | | | 530,129 | | | 587,369 |
| | | | | | |
| | | | | $ | 4,016,569 |
| | | | | | |
Automotive — 1.3% | | | | | | |
Allison Transmission, Inc., 11%, 2015 (n) | | $ | 165,000 | | $ | 150,150 |
Ford Motor Credit Co. LLC,
9.75%, 2010 | | | 470,000 | | | 448,475 |
General Motors Corp., 8.375%, 2033 | | | 212,000 | | | 170,660 |
Johnson Controls, Inc., 5.25%, 2011 | | | 60,000 | | | 60,169 |
TRW Automotive, Inc., 7%, 2014 (n) | | | 60,000 | | | 55,200 |
| | | | | | |
| | | | | $ | 884,654 |
| | | | | | |
Broadcasting — 3.5% | | | | | | |
Allbritton Communications Co., 7.75%, 2012 | | $ | 265,000 | | $ | 262,350 |
CanWest MediaWorks LP, 9.25%, 2015 (n) | | | 120,000 | | | 117,450 |
Clear Channel Communications, Inc., 5.5%, 2014 | | | 145,000 | | | 110,524 |
| | | | | | |
| Issuer | | Shares/Par | | Value ($) |
| | | | | | |
Broadcasting — continued | | | | | | |
Grupo Televisa S.A., 8.5%, 2032 | | $ | 141,000 | | $ | 172,495 |
Intelsat Bermuda Ltd., 11.25%, 2016 | | | 175,000 | | | 180,688 |
Intelsat Ltd., FRN, 10.828%, 2013 | | | 45,000 | | | 46,125 |
Intelsat Subsidiary Holding Co. Ltd., 8.625%, 2015 | | | 230,000 | | | 231,150 |
ION Media Networks, Inc., FRN, 11.492%, 2013 (n) | | | 225,000 | | | 221,344 |
Lamar Media Corp., 6.625%, 2015 | | | 110,000 | | | 106,975 |
Lamar Media Corp., 6.625%, 2015 (n) | | | 70,000 | | | 68,075 |
LBI Media, Inc., 8.5%, 2017 (n) | | | 75,000 | | | 72,281 |
Liberty Media Corp., 5.7%, 2013 | | | 131,000 | | | 121,360 |
LIN TV Corp., 6.5%, 2013 | | | 165,000 | | | 155,306 |
Local TV Finance LLC, 9.25%, 2015 (n)(p) | | | 120,000 | | | 114,600 |
News America, Inc., 6.4%, 2035 | | | 220,000 | | | 222,562 |
Nexstar Broadcasting Group, Inc., 7%, 2014 | | | 85,000 | | | 79,156 |
Univision Communications, Inc., 9.75%, 2015 (n)(p) | | | 170,000 | | | 154,913 |
| | | | | | |
| | | | | $ | 2,437,354 |
| | | | | | |
Brokerage & Asset Managers — 0.6% |
Lehman Brothers Holdings, Inc., 6.5%, 2017 | | $ | 180,000 | | $ | 182,134 |
Merrill Lynch & Co., Inc., 6.4%, 2017 | | | 90,000 | | | 91,436 |
Nuveen Investments, Inc., 10.5%, 2015 (z) | | | 160,000 | | | 159,400 |
| | | | | | |
| | | | | $ | 432,970 |
| | | | | | |
Building — 1.3% | | | | | | |
American Standard Cos., Inc., 7.625%, 2010 | | $ | 225,000 | | $ | 236,265 |
Lafarge S.A., 6.15%, 2011 | | | 330,000 | | | 339,462 |
Nortek Holdings, Inc., 8.5%, 2014 | | | 120,000 | | | 96,000 |
Owens Corning, Inc., 6.5%, 2016 | | | 170,000 | | | 156,118 |
Ply Gem Industries, Inc., 9%, 2012 | | | 110,000 | | | 85,250 |
| | | | | | |
| | | | | $ | 913,095 |
| | | | | | |
Business Services — 0.3% | | | | | | |
SunGard Data Systems, Inc.,
10.25%, 2015 | | $ | 191,000 | | $ | 195,298 |
| | | | | | |
Cable TV — 1.4% | | | | | | |
CCH I Holdings LLC, 11%, 2015 | | $ | 150,000 | | $ | 122,250 |
CCO Holdings LLC, 8.75%, 2013 | | | 160,000 | | | 152,800 |
CSC Holdings, Inc., 6.75%, 2012 | | | 270,000 | | | 258,188 |
Mediacom LLC, 9.5%, 2013 | | | 80,000 | | | 74,300 |
TCI Communications, Inc., 9.8%, 2012 | | | 245,000 | | | 282,987 |
Videotron Ltee, 6.875%, 2014 | | | 70,000 | | | 68,513 |
| | | | | | |
| | | | | $ | 959,038 |
| | | | | | |
Chemicals — 1.6% | | | | | | |
Innophos, Inc., 8.875%, 2014 | | $ | 100,000 | | $ | 99,500 |
Koppers, Inc., 9.875%, 2013 | | | 90,000 | | | 94,725 |
Momentive Performance Materials, Inc., 9.75%, 2014 (n) | | | 135,000 | | | 124,200 |
Mosaic Co., 7.875%, 2016 (n) | | | 180,000 | | | 194,400 |
Nalco Co., 7.75%, 2011 | | | 35,000 | | | 35,438 |
Nalco Co., 8.875%, 2013 | | | 150,000 | | | 156,375 |
Nalco Finance Holdings, Inc.,
0% to 2009, 9% to 2014 | | | 115,000 | | | 105,800 |
Yara International A.S.A.,
5.25%, 2014 (n) | | | 310,000 | | | 300,972 |
| | | | | | |
| | | | | $ | 1,111,410 |
| | | | | | |
48-SIP
Portfolio of Investments — continued
Bonds — continued
| | | | | | |
| Issuer | | Shares/Par | | Value ($) |
| | | | | | |
Computer Software — 0.2% | | | | | | |
First Data Corp., 9.875%, 2015 (n) | | $ | 115,000 | | $ | 106,950 |
| | | | | | |
Construction — 0.5% | | | | | | |
Lennar Corp., 5.125%, 2010 | | $ | 270,000 | | $ | 231,686 |
Pulte Homes, Inc., 7.875%, 2011 | | | 80,000 | | | 76,965 |
| | | | | | |
| | | | | $ | 308,651 |
| | | | | | |
Consumer Goods & Services — 1.9 % |
Corrections Corp. of America,
6.25%, 2013 | | $ | 85,000 | | $ | 83,725 |
Fortune Brands, Inc., 5.125%, 2011 | | | 244,000 | | | 243,505 |
Jarden Corp., 7.5%, 2017 | | | 80,000 | | | 68,800 |
Kar Holdings, Inc., 10%, 2015 (n) | | | 60,000 | | | 53,550 |
Service Corp. International,
6.75%, 2015 | | | 30,000 | | | 29,625 |
Service Corp. International, 7%, 2017 | | | 135,000 | | | 129,263 |
Service Corp. International,
7.625%, 2018 | | | 175,000 | | | 175,875 |
Visant Holding Corp., 8.75%, 2013 | | | 94,000 | | | 94,470 |
Western Union Co., 5.4%, 2011 | | | 440,000 | | | 443,366 |
| | | | | | |
| | | | | $ | 1,322,179 |
| | | | | | |
Containers — 1.6% | | | | | | |
Crown Americas LLC, 7.625%, 2013 | | $ | 75,000 | | $ | 76,688 |
Crown Americas LLC, 7.75%, 2015 | | | 145,000 | | | 149,350 |
Graham Packaging Co. LP,
9.875%, 2014 | | | 80,000 | | | 73,600 |
Greif, Inc., 6.75%, 2017 | | | 430,000 | | | 420,325 |
Owens-Brockway Glass Container, Inc., 8.875%, 2009 | | | 97,000 | | | 97,364 |
Owens-Brockway Glass Container, Inc., 8.25%, 2013 | | | 295,000 | | | 306,063 |
| | | | | | |
| | | | | $ | 1,123,390 |
| | | | | | |
Defense Electronics — 0.9% | | | | | | |
BAE Systems Holdings, Inc.,
5.2%, 2015 (n) | | $ | 312,000 | | $ | 302,960 |
L-3 Communications Corp.,
6.125%, 2014 | | | 285,000 | | | 279,300 |
| | | | | | |
| | | | | $ | 582,260 |
| | | | | | |
Electronics — 0.4% | | | | | | |
Avago Technologies Finance,
11.875%, 2015 | | $ | 40,000 | | $ | 42,750 |
Flextronics International Ltd.,
6.25%, 2014 | | | 140,000 | | | 133,350 |
Spansion LLC, 11.25%, 2016 (n) | | | 90,000 | | | 76,500 |
| | | | | | |
| | | | | $ | 252,600 |
| | | | | | |
Emerging Market Quasi-Sovereign — 2.2% |
Gazprom International S.A.,
6.51%, 2022 (n) | | $ | 230,000 | | $ | 218,661 |
Majapahit Holding B.V., 7.25%, 2017 (n) | | | 148,000 | | | 141,710 |
OAO Gazprom, 6.212%, 2016 | | | 727,000 | | | 705,335 |
Pemex Project Funding Master Trust, 5.75%, 2018 (n) | | | 167,000 | | | 166,583 |
Ras Laffan Liquefied Natural Gas Co. Ltd., 5.832%, 2016 (n) | | | 250,000 | | | 254,045 |
| | | | | | |
| | | | | $ | 1,486,334 |
| | | | | | |
Emerging Market Sovereign — 4.3% |
Federative Republic of Brazil, 8%, 2018 | | $ | 32,000 | | $ | 35,808 |
Gabonese Republic, 8.2%, 2017 (z) | | | 225,000 | | | 232,875 |
Republic of Argentina, 7%, 2013 | | | 155,350 | | | 133,204 |
| | | | | | |
| Issuer | | Shares/Par | | Value ($) |
| | | | | | |
Emerging Market Sovereign — continued |
Republic of Argentina, FRN,
5.389%, 2012 | | $ | 436,250 | | $ | 387,941 |
Republic of Colombia, FRN,
6.677%, 2015 | | | 282,000 | | | 292,575 |
Republic of El Salvador, 7.65%, 2035 | | | 114,000 | | | 131,670 |
Republic of Indonesia, 6.625%, 2037 | | | 257,000 | | | 244,471 |
Republic of Panama, 9.375%, 2029 | | | 327,000 | | | 447,173 |
Republic of Panama, 6.7%, 2036 | | | 91,000 | | | 96,005 |
Republic of Peru, 6.55%, 2037 | | | 71,000 | | | 74,195 |
Republic of Philippines, 9.375%, 2017 | | | 66,000 | | | 81,675 |
Republic of Turkey, 6.75%, 2018 | | | 101,000 | | | 103,651 |
Republic of Uruguay, 8%, 2022 | | | 100,000 | | | 112,000 |
United Mexican States, 6.75%, 2034 | | | 512,000 | | | 565,504 |
| | | | | | |
| | | | | $ | 2,938,747 |
| | | | | | |
Energy—Independent — 2.1% | | | | | | |
Chaparral Energy, Inc.,
8.875%, 2017 (n) | | $ | 115,000 | | $ | 103,788 |
Chesapeake Energy Corp.,
6.375%, 2015 | | | 155,000 | | | 149,963 |
Forest Oil Corp., 7.25%, 2019 (n) | | | 70,000 | | | 70,350 |
Hilcorp Energy I LP, 7.75%, 2015 (n) | | | 45,000 | | | 44,213 |
Hilcorp Energy I LP, 9%, 2016 (n) | | | 135,000 | | | 139,725 |
Mariner Energy, Inc., 8%, 2017 | | | 95,000 | | | 90,369 |
Newfield Exploration Co.,
6.625%, 2014 | | | 130,000 | | | 128,700 |
Nexen, Inc., 6.4%, 2037 | | | 280,000 | | | 279,530 |
OPTI Canada, Inc., 8.25%, 2014 (n) | | | 115,000 | | | 113,850 |
Plains Exploration & Production Co.,
7%, 2017 | | | 210,000 | | | 200,813 |
Quicksilver Resources, Inc.,
7.125%, 2016 | | | 130,000 | | | 127,725 |
| | | | | | |
| | | | | $ | 1,449,026 |
| | | | | | |
Energy — Integrated — 0.2% | | | | | | |
TNK-BP Finance S.A., 7.5%, 2016 (n) | | $ | 113,000 | | $ | 109,469 |
| | | | | | |
Entertainment — 0.5% | | | | | | |
AMC Entertainment, Inc., 11%, 2016 | | $ | 105,000 | | $ | 110,513 |
Time Warner, Inc., 6.5%, 2036 | | | 20,000 | | | 19,460 |
Turner Broadcasting System, Inc.,
8.375%, 2013 | | | 185,000 | | | 207,740 |
| | | | | | |
| | | | | $ | 337,713 |
| | | | | | |
Financial Institutions — 2.6% | | | | | | |
American Express Centurion Bank,
5.2%, 2010 | | $ | 250,000 | | $ | 253,301 |
Capmark Financial Group, Inc.,
6.3%, 2017 (n) | | | 260,000 | | | 193,820 |
CIT Group, Inc., 6.1% to 2017,
FRN to 2067 | | | 20,000 | | | 14,522 |
Countrywide Financial Corp.,
6.25%, 2016 | | | 270,000 | | | 155,403 |
General Motors Acceptance Corp.,
5.85%, 2009 | | | 295,000 | | | 282,119 |
General Motors Acceptance Corp.,
6.875%, 2011 | | | 89,000 | | | 76,139 |
ILFC E-Capital Trust I, FRN,
5.9% to 2010, FRN to 2065 (n) | | | 300,000 | | | 296,173 |
ORIX Corp., 5.48%, 2011 | | | 380,000 | | | 379,988 |
Residential Capital LLC,
7.625%, 2008 | | | 125,000 | | | 99,375 |
Residential Capital LLC, 8%, 2012 | | | 15,000 | | | 9,225 |
| | | | | | |
| | | | | $ | 1,760,065 |
| | | | | | |
49-SIP
Portfolio of Investments — continued
Bonds — continued
| | | | | | |
| Issuer | | Shares/Par | | Value ($) |
| | | | | | |
Food & Beverages — 1.1% | | | | | | |
B&G Foods, Inc., 8%, 2011 | | $ | 80,000 | | $ | 78,400 |
Del Monte Corp., 6.75%, 2015 | | | 90,000 | | | 85,050 |
Michael Foods, Inc., 8%, 2013 | | | 110,000 | | | 108,900 |
Miller Brewing Co., 5.5%, 2013 (n) | | | 330,000 | | | 334,388 |
Tyson Foods, Inc., 6.85%, 2016 | | | 170,000 | | | 174,446 |
| | | | | | |
| | | | | $ | 781,184 |
| | | | | | |
Food & Drug Stores — 0.2% | | | | | | |
CVS Caremark Corp., 5.75%, 2017 | | $ | 160,000 | | $ | 161,030 |
| | | | | | |
Forest & Paper Products — 1.3% |
Buckeye Technologies, Inc.,
8%, 2010 | | $ | 26,000 | | $ | 25,740 |
Buckeye Technologies, Inc.,
8.5%, 2013 | | | 255,000 | | | 259,463 |
Catalyst Paper Corp., 8.625%, 2011 | | | 40,000 | | | 33,200 |
Jefferson Smurfit Corp., 8.25%, 2012 | | | 79,000 | | | 77,815 |
JSG Funding PLC, 7.75%, 2015 | | EUR | 130,000 | | | 181,514 |
Millar Western Forest Products Ltd., 7.75%, 2013 | | $ | 125,000 | | | 93,125 |
NewPage Holdings Corp.,
10%, 2012 (z) | | | 80,000 | | | 80,400 |
Stora Enso Oyj, 6.404%, 2016 (n) | | | 160,000 | | | 157,664 |
| | | | | | |
| | | | | $ | 908,921 |
| | | | | | |
Gaming & Lodging — 2.6% | | | | | | |
Fontainebleau Las Vegas Holdings LLC, 10.25%, 2015 (n) | | $ | 100,000 | | $ | 86,750 |
Harrah’s Operating Co., Inc.,
5.375%, 2013 | | | 25,000 | | | 19,000 |
Harrah’s Operating Co., Inc.,
5.75%, 2017 | | | 315,000 | | | 213,413 |
Isle of Capri Casinos, Inc., 7%, 2014 | | | 145,000 | | | 118,900 |
MGM Mirage, Inc., 8.375%, 2011 | | | 350,000 | | | 357,875 |
MGM Mirage, Inc., 6.75%, 2013 | | | 90,000 | | | 87,300 |
MGM Mirage, Inc., 7.5%, 2016 | | | 195,000 | | | 193,050 |
Scientific Games Corp., 6.25%, 2012 | | | 185,000 | | | 176,675 |
Station Casinos, Inc., 6.5%, 2014 | | | 215,000 | | | 161,250 |
Station Casinos, Inc., 6.875%, 2016 | | | 30,000 | | | 21,900 |
Tropicana Entertainment LLC,
9.625%, 2014 | | | 85,000 | | | 53,975 |
Wyndham Worldwide Corp.,
6%, 2016 | | | 90,000 | | | 85,356 |
Wynn Las Vegas LLC, 6.625%, 2014 | | | 205,000 | | | 201,413 |
| | | | | | |
| | | | | $ | 1,776,857 |
| | | | | | |
Industrial — 0.8% | | | | | | |
Blount, Inc., 8.875%, 2012 | | $ | 165,000 | | $ | 165,413 |
JohnsonDiversey Holdings, Inc., “B”, 9.625%, 2012 | | | 200,000 | | | 204,500 |
Steelcase, Inc., 6.5%, 2011 | | | 146,000 | | | 153,033 |
Wesco Distribution, Inc., 7.5%, 2017 | | | 30,000 | | | 27,900 |
| | | | | | |
| | | | | $ | 550,846 |
| | | | | | |
Insurance — 1.5% | | | | | | |
Allianz AG, 5.5% to 2014,
FRN to 2049 | | EUR | 248,000 | | $ | 348,643 |
American International Group, Inc., 6.25%, 2037 | | $ | 240,000 | | | 214,661 |
ING Groep N.V., 5.775% to 2015,
FRN to 2049 | | | 520,000 | | | 480,738 |
| | | | | | |
| | | | | $ | 1,044,042 |
| | | | | | |
| | | | | | |
| Issuer | | Shares/Par | | Value ($) |
| | | | | | |
Insurance — Health — 0.1% | | | | | | |
Centene Corp., 7.25%, 2014 | | $ | 90,000 | | $ | 87,750 |
| | | | | | |
Insurance — Property & Casualty — 0.9% |
AXIS Capital Holdings Ltd.,
5.75%, 2014 | | $ | 375,000 | | $ | 367,584 |
Chubb Corp., 6.375% to 2017,
FRN to 2037 | | | 150,000 | | | 146,312 |
USI Holdings Corp.,
9.75%, 2015 (n) | | | 100,000 | | | 80,500 |
| | | | | | |
| | | | | $ | 594,396 |
| | | | | | |
International Market Quasi-Sovereign — 4.4% |
Canada Housing Trust,
4.6%, 2011 | | CAD | 64,000 | | $ | 65,868 |
Development Bank of Japan,
1.75%, 2010 | | JPY | 30,000,000 | | | 274,604 |
Development Bank of Japan,
1.4%, 2012 | | JPY | 44,000,000 | | | 400,596 |
Development Bank of Japan,
1.05%, 2023 | | JPY | 53,000,000 | | | 419,872 |
Development Bank of Japan,
2.3%, 2026 | | JPY | 10,000,000 | | | 92,171 |
Eksportfinans A.S.A., 1.6%, 2014 | | JPY | 26,000,000 | | | 237,407 |
Japan Finance Corp. for Municipal Enterprises, 2%, 2016 | | JPY | 70,000,000 | | | 657,239 |
KfW Bankengruppe, 1.35%, 2014 | | JPY | 70,000,000 | | | 633,563 |
KfW Bankengruppe, 2.05%, 2026 | | JPY | 26,000,000 | | | 229,969 |
| | | | | | |
| | | | | $ | 3,011,289 |
| | | | | | |
International Market Sovereign — 9.4% |
Federal Republic of Germany,
5.25%, 2010 | | EUR | 318,000 | | $ | 477,606 |
Federal Republic of Germany,
3.75%, 2015 | | EUR | 79,000 | | | 112,066 |
Federal Republic of Germany,
6.25%, 2030 | | EUR | 191,000 | | | 339,991 |
Government of Canada,
5.5%, 2009 | | CAD | 136,000 | | | 141,016 |
Government of Canada,
4.5%, 2015 | | CAD | 109,000 | | | 114,295 |
Government of Canada,
5.75%, 2033 | | CAD | 38,000 | | | 48,425 |
Kingdom of Belgium, 5.5%, 2017 | | EUR | 142,000 | | | 224,487 |
Kingdom of Denmark, 4%, 2015 | | DKK | 648,000 | | | 123,870 |
Kingdom of Netherlands,
3.75%, 2009 | | EUR | 752,000 | | | 1,094,249 |
Kingdom of Netherlands,
3.75%, 2014 | | EUR | 68,000 | | | 96,726 |
Kingdom of Spain, 5.35%, 2011 | | EUR | 464,000 | | | 706,057 |
Kingdom of Sweden, 4.5%, 2015 | | SEK | 410,000 | | | 64,230 |
Republic of Austria, 4.65%, 2018 | | EUR | 334,000 | | | 497,255 |
Republic of France, 4.75%, 2012 | | EUR | 98,000 | | | 146,690 |
Republic of France, 5%, 2016 | | EUR | 168,000 | | | 256,882 |
Republic of France, 6%, 2025 | | EUR | 85,000 | | | 144,927 |
Republic of France, 4.75%, 2035 | | EUR | 365,000 | | | 540,038 |
Republic of Ireland, 4.6%, 2016 | | EUR | 344,000 | | | 511,093 |
United Kingdom Treasury,
8%, 2015 | | GBP | 171,000 | | | 417,202 |
United Kingdom Treasury,
8%, 2021 | | GBP | 52,000 | | | 138,871 |
United Kingdom Treasury,
4.25%, 2036 | | GBP | 131,000 | | | 257,770 |
| | | | | | |
| | | | | $ | 6,453,746 |
| | | | | | |
50-SIP
Portfolio of Investments — continued
Bonds — continued
| | | | | | |
| Issuer | | Shares/Par | | Value ($) |
| | | | | | |
Machinery & Tools — 0.7% |
Atlas Copco AB, 5.6%, 2017 (n) | | $ | 350,000 | | $ | 350,128 |
Case New Holland, Inc., 7.125%, 2014 | | | 125,000 | | | 124,688 |
| | | | | | |
| | | | | $ | 474,816 |
| | | | | | |
Major Banks — 2.1% |
BAC Capital Trust XIV, 5.63% to 2012,
FRN to 2049 | | $ | 460,000 | | $ | 408,209 |
BNP Paribas, 5.186% to 2015,
FRN to 2049 (n) | | | 232,000 | | | 211,149 |
BNP Paribas, 7.195% to 2037,
FRN to 2049 (n) | | | 100,000 | | | 98,591 |
Royal Bank of Scotland Group PLC, 9.118%, 2049 | | | 207,000 | | | 221,293 |
UniCredito Italiano Capital Trust II,
9.2% to 2010, FRN to 2049 (n) | | | 290,000 | | | 316,032 |
Wachovia Capital Trust III,
5.8% to 2011, FRN to 2042 | | | 230,000 | | | 205,517 |
| | | | | | |
| | | | | $ | 1,460,791 |
| | | | | | |
Medical & Health Technology & Services — 3.8% |
Cardinal Health, Inc., 6.3%, 2016 (n) | | $ | 201,000 | | $ | 206,011 |
Community Health Systems, Inc.,
8.875%, 2015 | | | 210,000 | | | 213,938 |
Cooper Cos., Inc., 7.125%, 2015 | | | 195,000 | | | 189,638 |
DaVita, Inc., 6.625%, 2013 | | | 65,000 | | | 64,675 |
DaVita, Inc., 7.25%, 2015 | | | 285,000 | | | 285,713 |
HCA, Inc., 6.375%, 2015 | | | 225,000 | | | 190,125 |
HCA, Inc., 9.25%, 2016 | | | 345,000 | | | 362,250 |
HealthSouth Corp., 10.75%, 2016 | | | 45,000 | | | 47,025 |
Hospira, Inc., 5.55%, 2012 | | | 110,000 | | | 111,856 |
Hospira, Inc., 6.05%, 2017 | | | 100,000 | | | 100,480 |
LVB Acquisition Merger Sub, Inc.,
10%, 2017 (n) | | | 130,000 | | | 132,600 |
LVB Acquisition Merger Sub, Inc.,
11.625%, 2017 (n) | | | 55,000 | | | 54,175 |
McKesson Corp., 5.7%, 2017 | | | 90,000 | | | 89,486 |
Owens & Minor, Inc., 6.35%, 2016 | | | 170,000 | | | 173,486 |
Psychiatric Solutions, Inc., 7.75%, 2015 | | | 135,000 | | | 134,663 |
U.S. Oncology, Inc., 10.75%, 2014 | | | 120,000 | | | 118,500 |
Universal Hospital Services, Inc.,
8.5%, 2015 (p) | | | 75,000 | | | 75,750 |
Universal Hospital Services, Inc.,
FRN, 8.287%, 2015 | | | 20,000 | | | 20,000 |
VWR Funding, Inc., 10.25%, 2015 (n) | | | 65,000 | | | 61,913 |
| | | | | | |
| | | | | $ | 2,632,284 |
| | | | | | |
Metals & Mining — 2.0% |
Arch Western Finance LLC,
6.75%, 2013 | | $ | 95,000 | | $ | 92,150 |
FMG Finance Ltd., 10.625%, 2016 (n) | | | 185,000 | | | 211,825 |
Foundation PA Coal Co., 7.25%, 2014 | | | 60,000 | | | 59,250 |
Freeport-McMoRan Copper & Gold, Inc., 8.25%, 2015 | | | 60,000 | | | 63,600 |
Freeport-McMoRan Copper & Gold, Inc., 8.375%, 2017 | | | 255,000 | | | 273,488 |
Freeport-McMoRan Copper & Gold, Inc., FRN, 8.394%, 2015 | | | 55,000 | | | 55,825 |
GTL Trade Finance, Inc.,
7.25%, 2017 (z) | | | 34,000 | | | 34,508 |
Peabody Energy Corp., 7.375%, 2016 | | | 40,000 | | | 41,000 |
Peabody Energy Corp., “B”,
6.875%, 2013 | | | 210,000 | | | 211,050 |
PNA Group, Inc., 10.75%, 2016 | | | 95,000 | | | 89,300 |
| | | | | | |
| Issuer | | Shares/Par | | Value ($) |
| | | | | | |
Metals & Mining — continued |
Ryerson, Inc., 12%, 2015 (n) | | $ | 50,000 | | $ | 49,375 |
Vale Overseas Ltd., 6.25%, 2017 | | | 210,000 | | | 210,652 |
| | | | | | |
| | | | | $ | 1,392,023 |
| | | | | | |
Mortgage Backed — 4.5% |
Fannie Mae, 5.5%, 2019 — 2035 | | $ | 2,067,951 | | $ | 2,077,148 |
Fannie Mae, 6.5%, 2032 | | | 240,721 | | | 248,859 |
Fannie Mae, 6%, 2034 | | | 778,271 | | | 791,883 |
| | | | | | |
| | | | | $ | 3,117,890 |
| | | | | | |
Natural Gas — Distribution — 0.3% |
AmeriGas Partners LP, 7.125%, 2016 | | $ | 135,000 | | $ | 130,950 |
Inergy LP, 6.875%, 2014 | | | 85,000 | | | 82,663 |
| | | | | | |
| | | | | $ | 213,613 |
| | | | | | |
Natural Gas — Pipeline — 3.3% |
Atlas Pipeline Partners LP,
8.125%, 2015 | | $ | 130,000 | | $ | 128,700 |
CenterPoint Energy Resources Corp., 7.875%, 2013 | | | 448,000 | | | 491,898 |
Deutsche Bank (El Paso Performance-Linked Trust, CLN), 7.75%, 2011 (n) | | | 240,000 | | | 246,295 |
El Paso Corp., 7.75%, 2032 | | | 75,000 | | | 76,131 |
Kinder Morgan Energy Partners LP,
6%, 2017 | | | 200,000 | | | 199,989 |
Kinder Morgan Finance, 5.35%, 2011 | | | 362,000 | | | 357,803 |
Knight Energy, Inc., 7.25%, 2028 | | | 70,000 | | | 65,692 |
Spectra Energy Capital LLC, 8%, 2019 | | | 164,000 | | | 188,934 |
Williams Cos., Inc., 7.125%, 2011 | | | 280,000 | | | 295,750 |
Williams Cos., Inc., 8.75%, 2032 | | | 125,000 | | | 152,813 |
Williams Partners LP, 7.25%, 2017 | | | 95,000 | | | 97,850 |
| | | | | | |
| | | | | $ | 2,301,855 |
| | | | | | |
Network & Telecom — 2.5% |
AT&T, Inc., 6.3%, 2038 | | $ | 230,000 | | $ | 233,678 |
Cincinnati Bell, Inc., 8.375%, 2014 | | | 120,000 | | | 117,000 |
Citizens Communications Co.,
9.25%, 2011 | | | 322,000 | | | 348,565 |
Citizens Communications Co.,
9%, 2031 | | | 155,000 | | | 154,613 |
Deutsche Telekom International Finance B.V., 8%, 2010 | | | 137,000 | | | 146,260 |
Nordic Telephone Co. Holdings,
8.875%, 2016 (n) | | | 115,000 | | | 117,875 |
Qwest Corp., 8.875%, 2012 | | | 70,000 | | | 74,900 |
Qwest Corp., 7.5%, 2014 | | | 140,000 | | | 142,100 |
Telecom Italia Capital, 4.875%, 2010 | | | 60,000 | | | 59,687 |
Telefonica Europe B.V., 7.75%, 2010 | | | 260,000 | | | 278,292 |
Time Warner Telecom Holdings, Inc.,
9.25%, 2014 | | | 55,000 | | | 56,238 |
| | | | | | |
| | | | | $ | 1,729,208 |
| | | | | | |
Oil Services — 0.4% |
Basic Energy Services, Inc.,
7.125%, 2016 | | $ | 150,000 | | $ | 141,000 |
Compagnie Generale de
Geophysique — Veritas,
7.75%, 2017 | | | 50,000 | | | 50,500 |
Weatherford International, Inc.,
6.35%, 2017 (n) | | | 80,000 | | | 82,692 |
| | | | | | |
| | | | | $ | 274,192 |
| | | | | | |
Oils — 0.5% |
Premcor Refining Group, Inc.,
7.5%, 2015 | | $ | 310,000 | | $ | 321,058 |
| | | | | | |
51-SIP
Portfolio of Investments — continued
Bonds — continued
| | | | | | |
| Issuer | | Shares/Par | | Value ($) |
| | | | | | |
Other Banks & Diversified Financials — 2.2% |
Alfa Diversified Payment Rights Finance Co., FRN, 6.89%, 2011 (n) | | $ | 200,000 | | $ | 192,760 |
Banco do Estado de Sao Paulo S.A.,
8.7%, 2049 (n) | | | 102,000 | | | 103,530 |
Banco Mercantil del Norte S.A.,
5.875% to 2009, FRN to 2014 (n) | | | 248,000 | | | 245,396 |
Bosphorus Financial Services Ltd.,
FRN, 6.668%, 2012 (z) | | | 200,000 | | | 198,046 |
Mizuho Capital Investment 1 Ltd.,
6.686% to 2016, FRN to 2049 (n) | | | 160,000 | | | 149,701 |
Resona Bank Ltd., 5.85% to 2016,
FRN to 2049 (n) | | | 100,000 | | | 92,965 |
UBS Preferred Funding Trust V,
6.243% to 2016, FRN to 2049 | | | 270,000 | | | 259,972 |
UFJ Finance Aruba AEC, 6.75%, 2013 | | | 159,000 | | | 172,733 |
VTB Capital S.A., 6.609%, 2012 (z) | | | 101,000 | | | 99,132 |
| | | | | | |
| | | | | $ | 1,514,235 |
| | | | | | |
Pharmaceuticals — 0.1% |
Teva Pharmaceutical Finance LLC,
5.55%, 2016 | | $ | 87,000 | | $ | 85,972 |
| | | | | | |
Precious Metals & Minerals — 0.7% |
Alrosa Finance S.A., 8.875%, 2014 | | $ | 432,000 | | $ | 464,577 |
| | | | | | |
Printing & Publishing — 1.8% |
American Media Operations, Inc.,
10.25%, 2009 | | $ | 105,000 | | $ | 89,644 |
Dex Media West LLC, 9.875%, 2013 | | | 283,000 | | | 294,320 |
Idearc, Inc., 8%, 2016 | | | 465,000 | | | 426,638 |
Nielsen Finance LLC, 10%, 2014 | | | 75,000 | | | 76,688 |
Nielsen Finance LLC, 0% to 2011,
12.5% to 2016 | | | 280,000 | | | 196,700 |
R.H. Donnelley Corp., 8.875%, 2016 | | | 140,000 | | | 130,900 |
| | | | | | |
| | | | | $ | 1,214,890 |
| | | | | | |
Railroad & Shipping — 0.1% | | | | | | |
Panama Canal Railway Co.,
7%, 2026 (n) | | $ | 100,000 | | $ | 97,000 |
| | | | | | |
Real Estate — 0.8% | | | | | | |
ERP Operating LP, REIT, 5.75%, 2017 | | $ | 150,000 | | $ | 142,838 |
Simon Property Group LP, REIT,
6.1%, 2016 | | | 430,000 | | | 424,995 |
| | | | | | |
| | | | | $ | 567,833 |
| | | | | | |
Restaurants — 0.7% | | | | | | |
McDonald’s Corp., 5.8%, 2017 | | $ | 470,000 | | $ | 486,627 |
| | | | | | |
Retailers — 0.8% | | | | | | |
Couche-Tard, Inc., 7.5%, 2013 | | $ | 165,000 | | $ | 164,588 |
Limited Brands, Inc., 5.25%, 2014 | | | 221,000 | | | 198,364 |
Rite Aid Corp., 7.5%, 2017 | | | 85,000 | | | 74,906 |
Rite Aid Corp., 9.5%, 2017 | | | 25,000 | | | 20,688 |
Target Corp., 6.5%, 2037 | | | 100,000 | | | 100,510 |
| | | | | | |
| | | | | $ | 559,056 |
| | | | | | |
Specialty Stores — 0.2% | | | | | | |
Michaels Stores, Inc., 10%, 2014 | | $ | 80,000 | | $ | 76,000 |
Payless ShoeSource, Inc.,
8.25%, 2013 | | | 85,000 | | | 79,900 |
| | | | | | |
| | | | | $ | 155,900 |
| | | | | | |
Supermarkets — 0.5% | | | | | | |
Safeway, Inc., 4.95%, 2010 | | $ | 112,000 | | $ | 112,588 |
Safeway, Inc., 6.5%, 2011 | | | 160,000 | | | 167,387 |
SUPERVALU, Inc., 7.5%, 2014 | | | 90,000 | | | 92,250 |
| | | | | | |
| | | | | $ | 372,225 |
| | | | | | |
| | | | | | |
| Issuer | | Shares/Par | | Value ($) |
| | | | | | |
Supranational — 0.5% | | | | | | |
Central American Bank,
4.875%, 2012 (n) | | $ | 305,000 | | $ | 306,390 |
| | | | | | |
Telecommunications — Wireless — 1.9% |
Alltel Corp., 7%, 2012 | | $ | 109,000 | | $ | 94,013 |
American Tower Corp., 7%, 2017 (n) | | | 50,000 | | | 50,250 |
Centennial Communications Corp., 10.125%, 2013 | | | 105,000 | | | 110,250 |
MetroPCS Communications Wireless, Inc., 9.25%, 2014 | | | 80,000 | | | 75,200 |
Nextel Communications, Inc.,
5.95%, 2014 | | | 380,000 | | | 357,188 |
OJSC Vimpel-Communications,
8.25%, 2016 | | | 198,000 | | | 198,000 |
Rogers Cable, Inc., 5.5%, 2014 | | | 164,000 | | | 161,588 |
Vodafone Group PLC, 5.375%, 2015 | | | 270,000 | | | 266,263 |
| | | | | | |
| | | | | $ | 1,312,752 |
| | | | | | |
Tobacco — 0.8% |
Reynolds American, Inc., 6.75%, 2017 | | $ | 520,000 | | $ | 535,600 |
| | | | | | |
Transportation — 0.2% |
IIRSA Norte Finance Ltd.,
8.75%, 2024 (p) | | $ | 132,919 | | $ | 150,531 |
| | | | | | |
Transportation — Services — 0.2% |
Hertz Corp., 8.875%, 2014 | | $ | 135,000 | | $ | 136,856 |
| | | | | | |
U.S. Government Agencies — 2.5% |
Small Business Administration,
4.34%, 2024 | | $ | 312,641 | | $ | 300,008 |
Small Business Administration,
4.77%, 2024 | | | 242,811 | | | 241,622 |
Small Business Administration,
5.18%, 2024 | | | 453,271 | | | 459,462 |
Small Business Administration,
4.625%, 2025 | | | 185,094 | | | 182,314 |
Small Business Administration,
4.86%, 2025 | | | 329,175 | | | 328,981 |
Small Business Administration,
5.11%, 2025 | | | 169,638 | | | 171,212 |
| | | | | | |
| | | | | $ | 1,683,599 |
| | | | | | |
U.S. Treasury Obligations — 0.6% |
U.S. Treasury Bonds, 5.375%, 2031 (f) | | $ | 96,000 | | $ | 108,158 |
U.S. Treasury Bonds, 4.5%, 2036 | | | 32,000 | | | 32,163 |
U.S. Treasury Notes, 4.5%, 2015 | | | 90,000 | | | 93,776 |
U.S. Treasury Notes, TIPS,
0.875%, 2010 | | | 189,683 | | | 189,046 |
| | | | | | |
| | | | | $ | 423,143 |
| | | | | | |
Utilities — Electric Power — 4.4% |
AES Corp., 9.375%, 2010 | | $ | 260,000 | | $ | 273,000 |
Beaver Valley Funding Corp., 9%, 2017 | | | 416,000 | | | 468,632 |
Dynegy Holdings, Inc., 7.5%, 2015 | | | 70,000 | | | 65,450 |
Edison Mission Energy, 7%, 2017 | | | 340,000 | | | 334,050 |
Empresa Nacional de Electricidad S.A., 8.35%, 2013 | | | 17,000 | | | 19,260 |
Enersis S.A., 7.375%, 2014 | | | 363,000 | | | 388,616 |
FirstEnergy Corp., 6.45%, 2011 | | | 207,000 | | | 213,752 |
HQI Transelec Chile S.A.,
7.875%, 2011 | | | 290,000 | | | 313,095 |
Intergen N.V., 9%, 2017 (n) | | | 65,000 | | | 68,413 |
ISA Capital do Brasil S.A.,
7.875%, 2012 (n) | | | 100,000 | | | 102,000 |
52-SIP
Portfolio of Investments — continued
Bonds — continued
| | | | | | |
| Issuer | | Shares/Par | | Value ($) |
| | | | | | |
Utilities — Electric Power — continued |
ISA Capital do Brasil S.A.,
8.8%, 2017 (n) | | $ | 134,000 | | $ | 138,020 |
Mirant North American LLC,
7.375%, 2013 | | | 145,000 | | | 145,363 |
NRG Energy, Inc., 7.375%, 2016 | | | 285,000 | | | 277,875 |
Reliant Energy, Inc., 7.875%, 2017 | | | 175,000 | | | 173,222 |
Sierra Pacific Resources,
8.625%, 2014 | | | 60,000 | | | 64,112 |
| | | | | | |
| | | | | $ | 3,044,860 |
| | | | | | |
Utilities — Gas — 0.2% |
TGI International Ltd., 9.5%, 2017 (n) | | $ | 103,000 | | $ | 107,635 |
| | | | | | |
Total Bonds
(Identified Cost, $65,831,446) | | $ | 65,659,728 |
| | | | | | |
|
Preferred Stocks — 0.0% |
Real Estate — 0.0% | | | | | | |
HRPT Properties Trust, “B”, REIT, 8.75% (Identified Cost, $9,955) | | | 364 | | $ | 9,085 |
| | | | | | |
|
Floating Rate Loans (g)(r) — 2.0% |
Aerospace — 0.1% | | | | | | |
Hawker Beechcraft Acquisition Co.,
Letter of Credit, 6.93%, 2014 | | $ | 3,152 | | $ | 2,989 |
Hawker Beechcraft Acquisition Co.,
Term Loan, 6.83%, 2014 | | | 76,871 | | | 72,899 |
| | | | | | |
| | | | | $ | 75,888 |
| | | | | | |
Automotive — 0.3% | | | | | | |
Allison Transmission, Inc., Term Loan B, 7.96%, 2014 | | $ | 43,145 | | $ | 40,244 |
Goodyear Tire & Rubber Co., Second Lien Term Loan, 6.43%, 2014 | | | 161,908 | | | 151,536 |
| | | | | | |
| | | | | $ | 191,780 |
| | | | | | |
Broadcasting — 0.3% | | | | | | |
Gray Television, Inc., Term Loan,
6.73%, 2014 | | $ | 49,478 | | $ | 45,952 |
Univision Communications, Inc., Term Loan B, 7.21%, 2014 (o) | | | 155,362 | | | 141,419 |
| | | | | | |
| | | | | $ | 187,371 |
| | | | | | |
Building — 0.1% | | | | | | |
Building Materials Corp. of America, Second Lien Term Loan,
10.69%, 2014 (o) | | $ | 48,702 | | $ | 35,126 |
| | | | | | |
Cable TV — 0.4% | | | | | | |
Charter Communications Operating LLC, Term Loan, 7.36%, 2013 | | $ | 72,725 | | $ | 67,882 |
CSC Holdings, Inc., Incremental Term Loan, 6.9%, 2013 | | | 94,310 | | | 89,015 |
Mediacom Illinois LLC, Term Loan A, 6.53%, 2011 | | | 85,337 | | | 79,150 |
| | | | | | |
| | | | | $ | 236,047 |
| | | | | | |
Chemicals — 0.1% | | | | | | |
Celanese AG, Dollar, Term Loan,
6.98%, 2014 | | $ | 86,745 | | $ | 83,570 |
| | | | | | |
Computer Software — 0.1% | | | | | | |
First Data Corp., Term Loan B-1,
7.63%, 2014 | | $ | 53,335 | | $ | 50,572 |
| | | | | | |
| | | | | | |
| Issuer | | Shares/Par | | Value ($) |
| | | | | | |
Food & Beverages — 0.1% | | | | | | |
Dean Foods Co., Term Loan B,
6.58%, 2014 | | $ | 69,626 | | $ | 65,622 |
| | | | | | |
Medical & Health Technology & Services — 0.2% |
Advanced Medical Optics, Inc., Term Loan, 6.66%, 2014 | | $ | 50,123 | | $ | 46,740 |
Community Health Systems, Inc., Term Loan B, 7.33%, 2014 | | | 56,687 | | | 54,504 |
HCA, Inc., Term Loan B, 7.08%, 2013 | | | 45,260 | | | 43,559 |
| | | | | | |
| | | | | $ | 144,803 |
| | | | | | |
Natural Gas — Pipeline — 0.0% | | | | | | |
Kinder Morgan, Term Loan,
6.35%, 2014 | | $ | 23,866 | | $ | 23,698 |
| | | | | | |
Pollution Control — 0.1% | | | | | | |
Allied Waste North America, Inc., Term Loan, 6.59%, 2012 | | $ | 59,244 | | $ | 56,595 |
Allied Waste North America, Inc., Term Loan A, Credit Linked Deposit,
6.62%, 2012 | | | 37,551 | | | 35,872 |
| | | | | | |
| | | | | $ | 92,467 |
| | | | | | |
Retailers — 0.1% | | | | | | |
Neiman-Marcus Group, Inc., Term Loan, 0%, 2013 (o) | | $ | 84,459 | | $ | 81,113 |
| | | | | | |
Specialty Stores — 0.1% | | | | | | |
Michaels Stores, Inc., Term Loan B, 7.61%, 2013 | | $ | 97,196 | | $ | 89,123 |
| | | | | | |
Total Floating Rate Loans
(Identified Cost, $1,418,756) | | $ | 1,357,180 |
| | | | | | |
|
Short-Term Obligations — 1.4% |
American Express Credit Corp.,
4.12%, due 1/02/08, at
Amortized Cost and Value (y) | | $ | 967,000 | | $ | 966,889 |
| | | | | | |
Total Investments
(Identified Cost, $68,227,046) (k) | | $ | 67,992,882 |
| | | | | | |
| |
Other Assets,
Less Liabilities — 1.2% | | | 820,801 |
| | | | | | |
Net Assets — 100.0% | | $ | 68,813,683 |
| | | | | | |
53-SIP
Portfolio of Investments — continued
Derivative contracts at 12/31/07
Futures contracts outstanding at 12/31/07
| | | | | | | | | | |
| Description | | Contracts | | Value | | Expiration
Date | | Unrealized
Appreciation
(Depreciation) | |
| U.S. Treasury Note 5 yr (Long) | | 4 | | $441,125 | | Mar-08 | | $ | 1,970 | |
| U.S. Treasury Note 10 yr (Short) | | 14 | | 1,587,469 | | Mar-08 | | | (1,799 | ) |
| U.S. Treasury Note 30 yr (Short) | | 9 | | 1,047,375 | | Mar-08 | | | 5,383 | |
| | | | | | | | | | |
| | | | | | | | $ | 5,554 | |
| | | | | | | | | | |
Forward Foreign Currency Exchange Contracts at 12/31/07
| | | | | | | | | | | | | | | | | | |
| | | Type | | Currency | | Contracts to
Deliver/Receive | | Settlement Date Range | | In Exchange For | | Contracts
at Value | | Net
Unrealized
Appreciation
(Depreciation) | |
Appreciation | | | | | | | | | | | | | | | | | | |
| | SELL | | CAD | | 347,927 | | 1/09/08 | | $ | 370,647 | | $ | 352,568 | | $ | 18,079 | |
| | BUY | | EUR | | 337,505 | | 2/13/08 | | | 487,165 | | | 493,768 | | | 6,603 | |
| | SELL | | EUR | | 1,397,801 | | 1/16/08-2/13/08 | | | 2,049,931 | | | 2,044,392 | | | 5,539 | |
| | SELL | | GBP | | 384,268 | | 2/14/08 | | | 774,976 | | | 763,968 | | | 11,008 | |
| | BUY | | PLN | | 323,444 | | 1/31/08 | | | 130,500 | | | 131,431 | | | 931 | |
| | SELL | | SEK | | 418,093 | | 1/15/08 | | | 66,378 | | | 64,698 | | | 1,680 | |
| | | | | | | | | | | | | | | | | | |
| | | | | | | | | | | | | | | | $ | 43,840 | |
| | | | | | | | | | | | | | | | | | |
Depreciation | | | | | | | | | | | | | | | | | | |
| | BUY | | AUD | | 118,367 | | 1/14/08 | | $ | 109,554 | | $ | 103,851 | | $ | (5,703 | ) |
| | SELL | | DKK | | 651,234 | | 2/07/08 | | | 127,567 | | | 127,760 | | | (193 | ) |
| | SELL | | JPY | | 44,798,225 | | 1/15/08-2/05/08 | | | 401,371 | | | 401,845 | | | (474 | ) |
| | BUY | | MXN | | 764,636 | | 1/18/08 | | | 70,430 | | | 69,972 | | | (458 | ) |
| | | | | | | | | | | | | | | | | | |
| | | | | | | | | | | | | | | | $ | (6,828 | ) |
| | | | | | | | | | | | | | | | | | |
Swap Agreements at 12/31/07
| | | | | | | | | | | | | | |
| Expiration | | Notional
Amount | | Counterparty | | Cash Flows
to Receive | | Cash Flows to Pay | | Value | |
| Credit Default Swaps | | | | | | | | |
| 6/20/09 | | USD | | 100,000 | | JPMorgan Chase Bank | | 4.1% (fixed rate) | | (1) | | $ | (6,647 | ) |
| 9/20/10 | | USD | | 270,000 | | Merrill Lynch International | | (2) | | 0.68% (fixed rate) | | | 37,542 | |
| 9/20/12 | | USD | | 290,000 | | JPMorgan Chase Bank | | 0.36% (fixed rate) | | (3) | | | (56 | )) |
| | | | | | | | | | | | | | |
| | | | | | | | | | | | $ | 30,839 | |
| | | | | | | | | | | | | | |
| (1) | Fund to pay notional amount upon a defined credit event by Abitibi Consolidated, 8.375%, 4/01/15. |
| (2) | Fund to receive notional amount upon a defined credit event by Lennar Corp., 5.95%, 3/01/13. |
| (3) | Fund to pay notional amount upon a defined credit event by FNMA., 5.5%, 6/09/33. |
At December 31, 2007, the fund had sufficient cash and/or other liquid securities to cover any commitments under these derivative contracts.
Unfunded Loan Commitments
As of December 31, 2007, the portfolio had the following unfunded loan commitments of $8,245, which could be extended at the option of the borrower:
| | | | | | | |
| Borrower | | Unfunded
Loan
Commitment | | Unrealized
Appreciation
(Depreciation) | |
| Community Health Systems, Inc., Term Loan Delayed Draw 2014 | | $ | 2,851 | | $ | (110 | ) |
| Univision Communications, Inc., Term Loan Delayed Draw 2014 | | | 5,394 | | | (65 | ) |
| | | | | | | |
| | $ | 8,245 | | $ | (175 | ) |
At December 31, 2007, the fund had sufficient cash and/or other liquid securities to cover any commitments under these contracts.
See portfolio footnotes and notes to financial statements.
54-SIP
Portfolio of Investments — December 31, 2007
MFS Strategic Value Portfolio
Common Stocks — 99.1%
| | | | | |
| Issuer | | Shares/Par | | Value ($) |
| | | | | |
Aerospace — 1.0% | | | | | |
Lockheed Martin Corp. | | 690 | | $ | 72,629 |
| | | | | |
Alcoholic Beverages—1.0% | | | | | |
Diageo PLC | | 3,380 | | $ | 72,350 |
| | | | | |
Automotive — 2.6% | | | | | |
Bayerische Motoren Werke AG | | 1,260 | | $ | 77,806 |
Harley-Davidson, Inc. | | 2,420 | | | 113,038 |
| | | | | |
| | | | $ | 190,844 |
| | | | | |
Biotechnology — 2.0% | | | | | |
Amgen, Inc. (a) | | 3,140 | | $ | 145,822 |
| | | | | |
Broadcasting — 1.3% | | | | | |
E.W. Scripps Co., “A” | | 2,150 | | $ | 96,771 |
| | | | | |
Brokerage & Asset Managers — 4.7% | | | |
Bear Stearns Cos., Inc. | | 1,240 | | $ | 109,430 |
E*TRADE Financial Corp. (a) | | 18,560 | | | 65,888 |
Legg Mason, Inc. | | 1,550 | | | 113,382 |
Lehman Brothers Holdings, Inc. | | 890 | | | 58,242 |
| | | | | |
| | | | $ | 346,942 |
| | | | | |
Business Services — 1.5% | | | | | |
Fidelity National Information Services, Inc. | | 2,640 | | $ | 109,798 |
| | | | | |
Computer Software — Systems — 1.1% | | | |
International Business Machines Corp. | | 740 | | $ | 79,994 |
| | | | | |
Construction — 2.6% | | | | | |
D.R. Horton, Inc. | | 11,130 | | $ | 146,582 |
Masco Corp. | | 2,100 | | | 45,381 |
| | | | | |
| | | | $ | 191,963 |
| | | | | |
Electrical Equipment — 1.5% | | | | | |
WESCO International, Inc. (a) | | 2,800 | | $ | 110,992 |
| | | | | |
Electronics—2.7% | | | | | |
Flextronics International Ltd. (a) | | 9,990 | | $ | 120,479 |
Samsung Electronics Co. Ltd., GDR | | 253 | | | 73,424 |
| | | | | |
| | | | $ | 193,903 |
| | | | | |
Energy — Independent — 5.2% | | | | | |
Anadarko Petroleum Corp. | | 1,990 | | $ | 130,723 |
Apache Corp. | | 760 | | | 81,730 |
CONSOL Energy, Inc. | | 630 | | | 45,058 |
Devon Energy Corp. | | 1,340 | | | 119,139 |
| | | | | |
| | | | $ | 376,650 |
| | | | | |
Energy — Integrated — 6.0% | | | | | |
Exxon Mobil Corp. | | 810 | | $ | 75,889 |
Hess Corp. | | 1,090 | | | 109,937 |
Marathon Oil Corp. | | 1,900 | | | 115,634 |
TOTAL S.A., ADR | | 1,660 | | | 137,116 |
| | | | | |
| | | | $ | 438,576 |
| | | | | |
Food & Beverages — 2.6% | | | | | |
General Mills, Inc. | | 2,050 | | $ | 116,850 |
Nestle S.A. | | 155 | | | 71,023 |
| | | | | |
| | | | $ | 187,873 |
| | | | | |
Food & Drug Stores — 1.0% | | | | | |
Safeway, Inc. | | 2,230 | | $ | 76,288 |
| | | | | |
Forest & Paper Products — 0.7% | | | |
AbitibiBowater, Inc. | | 2,395 | | $ | 49,361 |
| | | | | |
| | | | | |
| Issuer | | Shares/Par | | Value ($) |
| | | | | |
Furniture & Appliances — 2.5% | | | | | |
Jarden Corp. (a) | | 4,410 | | $ | 104,120 |
Whirlpool Corp. | | 920 | | | 75,100 |
| | | | | |
| | | | $ | 179,220 |
| | | | | |
Gaming & Lodging — 1.7% | | | | | |
Royal Caribbean Cruises Ltd. | | 2,980 | | $ | 126,471 |
| | | | | |
General Merchandise — 1.9% | | | | | |
Macy’s, Inc. | | 5,300 | | $ | 137,111 |
| | | | | |
Health Maintenance Organizations — 1.1% | | | |
WellPoint, Inc. (a) | | 910 | | $ | 79,834 |
| | | | | |
Insurance — 14.5% | | | | | |
Allstate Corp. | | 2,270 | | $ | 118,562 |
Ambac Financial Group, Inc. | | 2,600 | | | 67,002 |
American International Group, Inc. | | 1,620 | | | 94,446 |
Conseco, Inc. (a) | | 12,680 | | | 159,261 |
Genworth Financial, Inc., “A” | | 7,690 | | | 195,711 |
Hartford Financial Services Group, Inc. | | 850 | | | 74,112 |
Max Capital Group Ltd. | | 4,150 | | | 116,159 |
MBIA, Inc. | | 2,060 | | | 38,378 |
Travelers Cos., Inc. | | 3,720 | | | 200,136 |
| | | | | |
| | | | $ | 1,063,767 |
| | | | | |
Leisure & Toys — 1.1% | | | | | |
Polaris Industries, Inc. | | 1,690 | | $ | 80,731 |
| | | | | |
Machinery & Tools — 2.7% | | | | | |
Kennametal, Inc. | | 2,000 | | $ | 75,720 |
Timken Co. | | 3,680 | | | 120,888 |
| | | | | |
| | | | $ | 196,608 |
| | | | | |
Major Banks — 5.3% | | | | | |
Bank of America Corp. | | 2,686 | | $ | 110,824 |
Bank of New York Mellon Corp. | | 2,129 | | | 103,810 |
Huntington Bancshares, Inc. | | 4,310 | | | 63,616 |
JPMorgan Chase & Co. | | 2,570 | | | 112,181 |
| | | | | |
| | | | $ | 390,431 |
| | | | | |
Medical & Health Technology & Services — 1.4% |
DaVita, Inc. (a) | | 1,250 | | $ | 70,437 |
Omnicare, Inc. | | 1,550 | | | 35,355 |
| | | | | |
| | | | $ | 105,792 |
| | | | | |
Medical Equipment—5.1% | | | | | |
Advanced Medical Optics, Inc. (a) | | 3,130 | | $ | 76,779 |
Boston Scientific Corp. (a) | | 12,410 | | | 144,328 |
Cooper Cos., Inc. | | 1,380 | | | 52,440 |
Pall Corp. | | 2,470 | | | 99,590 |
| | | | | |
| | | | $ | 373,137 |
| | | | | |
Metals & Mining — 2.1% | | | | | |
Allegheny Technologies, Inc. | | 830 | | $ | 71,712 |
Century Aluminum Co. (a) | | 1,470 | | | 79,292 |
| | | | | |
| | | | $ | 151,004 |
| | | | | |
Natural Gas — Distribution — 1.0% | | | |
Sempra Energy | | 1,220 | | $ | 75,494 |
| | | | | |
Natural Gas — Pipeline — 1.6% | | | | | |
Williams Cos., Inc. | | 3,270 | | $ | 117,001 |
| | | | | |
Network & Telecom — 0.7% | | | | | |
Nortel Networks Corp. (a) | | 3,508 | | $ | 52,936 |
| | | | | |
55-SVP
Portfolio of Investments — continued
Common Stocks — continued
| | | | | |
| Issuer | | Shares/Par | | Value ($) |
| | | | | |
Other Banks & Diversified Financials — 2.7% |
Freddie Mac | | 2,350 | | $ | 80,065 |
New York Community Bancorp, Inc. | | 6,690 | | | 117,610 |
| | | | | |
| | | | $ | 197,675 |
| | | | | |
Pharmaceuticals — 2.8% | | | | | |
Warner Chilcott Ltd., “A” (a) | | 3,260 | | $ | 57,800 |
Wyeth | | 3,250 | | | 143,617 |
| | | | | |
| | | | $ | 201,417 |
| | | | | |
Specialty Stores — 1.8% | | | | | |
Staples, Inc. | | 5,680 | | $ | 131,038 |
| | | | | |
Telephone Services — 5.3% | | | | | |
Embarq Corp. | | 1,890 | | $ | 93,612 |
Qwest Communications International, Inc. | | 13,100 | | | 91,831 |
TELUS Corp. (non-voting shares) | | 2,410 | | | 117,234 |
Verizon Communications, Inc. | | 1,955 | | | 85,414 |
| | | | | |
| | | | $ | 388,091 |
| | | | | |
Tobacco — 1.6% | | | | | |
Altria Group, Inc. | | 1,570 | | $ | 118,661 |
| | | | | |
| | | | | | | |
| Issuer | | Shares/Par | | Value ($) | |
| | | | | | | |
Utilities — Electric Power — 4.7% | | | | |
American Electric Power Co., Inc. | | | 1,630 | | $ | 75,893 | |
DPL, Inc. | | | 1,760 | | | 52,184 | |
Pepco Holdings, Inc. | | | 3,170 | | | 92,976 | |
Public Service Enterprise Group, Inc. | | | 1,240 | | | 121,818 | |
| | | | | | | |
| | | | | $ | 342,871 | |
| | | | | | | |
Total Common Stocks
(Identified Cost, $7,400,161) | | $ | 7,250,046 | |
| | | | | | | |
|
Short-Term Obligations —3.4% | |
American Express Credit Corp.,
4.12%, due 1/02/08, at
Amortized Cost and Value (y) | | $ | 250,000 | | $ | 249,971 | |
| | | | | | | |
Total Investments
(Identified Cost, $7,650,132) | | $ | 7,500,017 | |
| | | | | | | |
| |
Other Assets,
Less Liabilities — (2.5)% | | | (181,119 | ) |
| | | | | | | |
Net Assets — 100.0% | | $ | 7,318,898 | |
| | | | | | | |
See portfolio footnotes and notes to financial statements.
56-SVP
Portfolio of Investments — December 31, 2007
MFS Technology Portfolio
Common Stocks — 97.3%
| | | | | |
| Issuer | | Shares/Par | | Value ($) |
| | | | | |
Broadcasting — 2.0% | | | | | |
XM Satellite Radio Holdings, Inc., “A” (a)(l) | | 40,906 | | $ | 500,689 |
| | | | | |
Computer Software — 20.6% | | | | | |
Microsoft Corp. | | 28,400 | | $ | 1,011,040 |
MicroStrategy, Inc., “A” (a)(l) | | 10,480 | | | 996,648 |
MSC Software Corp. (a)(l) | | 86,052 | | | 1,117,815 |
Salesforce.com, Inc. (a)(l) | | 17,624 | | | 1,104,849 |
VeriSign, Inc. (a) | | 23,144 | | | 870,446 |
| | | | | |
| | | | $ | 5,100,798 |
| | | | | |
Computer Software — Systems — 14.6% | | | |
Cray, Inc. (a)(l) | | 49,675 | | $ | 297,553 |
EMC Corp. (a)(l) | | 45,406 | | | 841,373 |
International Business Machines Corp. | | 14,900 | | | 1,610,690 |
Network Appliance, Inc. (a)(l) | | 16,541 | | | 412,863 |
Salary.com, Inc. (a)(l) | | 34,330 | | | 441,141 |
| | | | | |
| | | | $ | 3,603,620 |
| | | | | |
Consumer Goods & Services — 0.8% | | | |
Alibaba.com Corp. (a)(z) | | 54,500 | | $ | 193,260 |
| | | | | |
Electronics — 29.9% | | | | | |
Flextronics International Ltd. (a) | | 147,950 | | $ | 1,784,277 |
Intel Corp. | | 90,318 | | | 2,407,878 |
Marvell Technology Group Ltd. (a) | | 52,118 | | | 728,610 |
National Semiconductor Corp. (l) | | 32,950 | | | 745,988 |
Nintendo Co. Ltd. | | 700 | | | 425,003 |
Samsung Electronics Co. Ltd., GDR | | 1,998 | | | 579,849 |
SanDisk Corp. (a)(l) | | 13,790 | | | 457,414 |
Taiwan Semiconductor Manufacturing Co. Ltd., ADR | | 25,965 | | | 258,611 |
| | | | | |
| | | | $ | 7,387,630 |
| | | | | |
Internet — 7.3% | | | | | |
Google, Inc., “A” (a) | | 1,370 | | $ | 947,328 |
Omniture, Inc. (a)(l) | | 11,900 | | | 396,151 |
Tencent Holdings Ltd. | | 63,000 | | | 469,223 |
| | | | | |
| | | | $ | 1,812,702 |
| | | | | |
Leisure & Toys — 8.6% | | | | | |
Activision, Inc. (a) | | 13,300 | | $ | 395,010 |
Netdragon Websoft, Inc. (a) | | 120,000 | | | 255,162 |
Take-Two Interactive Software, Inc. (a)(l) | | 24,400 | | | 450,180 |
THQ, Inc. (a)(l) | | 23,460 | | | 661,337 |
Ubisoft Entertainment S.A. (a) | | 3,578 | | | 360,633 |
| | | | | |
| | | | $ | 2,122,322 |
| | | | | |
Network & Telecom — 9.6% | | | | | |
F5 Networks, Inc. (a)(l) | | 10,600 | | $ | 302,312 |
Nokia Corp., ADR (l) | | 19,150 | | | 735,169 |
Research In Motion Ltd. (a) | | 8,740 | | | 991,116 |
Sonus Networks, Inc. (a)(l) | | 60,550 | | | 353,007 |
| | | | | |
| | | | $ | 2,381,604 |
| | | | | |
Telecommunications — Wireless — 2.4% | | | |
NII Holdings, Inc. “B” (a)(l) | | 6,900 | | $ | 333,408 |
Rogers Communications, Inc., “B” | | 6,000 | | | 271,500 |
| | | | | |
| | | | $ | 604,908 |
| | | | | |
| | | | | | | |
| Issuer | | Shares/Par | | Value ($) | |
| | | | | | | |
Telephone Services — 1.5% | | | | |
AT&T, Inc. | | | 9,090 | | $ | 377,780 | |
| | | | | | | |
Total Common Stocks
(Identified Cost, $24,254,975) | | $ | 24,085,313 | |
| | | | | | | |
| | |
Issuer/Expiration Month/Strike
Price | | Number
of Contracts | | Value | |
PUT OPTIONS PURCHASED — 1.7% | | | | |
Adobe Systems, Inc. — January 2008 @ $40 (a) | | | 44,500 | | $ | 8,900 | |
International Business Machines Corp.—February 2008 @ $110 (a) | | | 14,100 | | | 70,500 | |
Nvidia Corp.—March 2008 @ $40 (a) | | | 7,100 | | | 72,420 | |
Sap Aktiengesellschaft—March 2008 @ $60 (a) | | | 28,900 | | | 260,100 | |
| | | | | | | |
Total Put Options Purchased
(Premiums paid, $438,524) | | | 411,920 | |
| | | | | | | |
| | |
| Issuer | | Shares/Par | | Value ($) | |
|
Short-Term Obligations — 1.3% | |
American Express Credit Corp.,
4.12%, due 1/02/08, at
Amortized Cost and Value (y) | | $ | 317,000 | | $ | 316,964 | |
| | | | | | | |
|
Collateral for Securities Loaned — 19.9% | |
Navigator Securities Lending
Prime Portfolio, at Cost and
Net Asset Value | | | 4,917,614 | | $ | 4,917,614 | |
| | | | | | | |
Total Investments
(Identified Cost, $29,928,077) (k) | | $ | 29,731,811 | |
| | | | | | | |
Issue/ Expiration Month/ Strike
Price | | Par Amount
of Contracts | | | |
|
Call Options Written — (0.5)% | |
Salesforce.com, Inc. — January 2009 @ $75 (a) | | | 13,000 | | $ | (99,190 | ) |
International Business Machines Corp. — April 2008 @ $125 (a) | | | 14,100 | | | (18,330 | ) |
| | | | | | | |
Total Call Options Written
(Premiums Received, $125,144) | | $ | (117,520 | ) |
| | | | | | | |
| |
Other Assets,
Less Liabilities—(19.7)% | | | (4,875,432 | ) |
| | | | | | | |
Net Assets—100.0% | | $ | 24,738,859 | |
| | | | | | | |
Portfolio Footnotes:
| (a) | Non-income producing security. |
| (f) | All or a portion of the security has been segregated as collateral for an open futures contract. |
| (g) | The rate shown represents a weighted average coupon rate on settled positions at period end. |
| (i) | Interest only security for which the fund receives interest on notional principal (Par amount). Par amount shown is the notional principal and does not reflect the cost of the security. |
57-TKP
Portfolio of Investments — continued
| (k) | Certain funds held securities that were fair valued in accordance with the policies adopted by the Board of Trustees. An independent pricing service provided an evaluated bid for certain funds. As of December 31, 2007, the following funds held securities that were fair valued: |
| | | | | | |
Fund | | Market
Value | | % of
Market Value | | % of Market Value
using Evaluated Bid |
| MFS Emerging Growth Portfolio | | 3,597,419 | | 1.13% | | — |
| MFS Global Governments Portfolio | | 33,008,013 | | 81.96% | | 80.80% |
| MFS New Discovery Portfolio | | 281,147 | | 0.07% | | — |
| MFS Strategic Income Portfolio | | 64,224,246 | | 94.46% | | 93.04% |
| MFS Technology Portfolio | | 1,226,746 | | 4.13% | | |
| (l) | All or a portion of this security is on loan. |
| (n) | Securities exempt from registration under Rule 144A of the Securities Act of 1933. These securities may be sold in the ordinary course of business in transactions exempt from registration, normally to qualified institutional buyers. At period end, the aggregate values and percentages of net assets of these securities were as follows for each fund: |
| | | | | |
Fund | | Market Value | | % of
Net Assets |
| Global Governments Portfolio | | $ | 1,584,714 | | 3.90% |
| Strategic Income Portfolio | | | 8,900,036 | | 12.93% |
| (o) | All or a portion of this position has not settled. Upon settlement date, interest rates will be determined. |
| (p) | Payment-in-kind security. |
| (r) | Remaining maturities of floating rate loans may be less than stated maturities shown as a result of contractual or optional prepayments by the borrower. Such prepayments cannot be predicted with certainty. These loans may be subject to restrictions on resale. Floating rate loans generally have rates of interest which are determined periodically by reference to a base lending rate plus a premium. |
| (t) | Security exempt from registration with the U.S. Securities and Exchange Commission under Section 4(2) of the Securities Act of 1933. |
| (y) | The rate shown represents an annualized yield at time of purchase. |
| (z) | Restricted securities are not registered under the Securities Act of 1933 and are subject to legal restrictions on resale. These securities generally may be resold in transactions exempt from registration or to the public if the securities are subsequently registered. Disposal of these securities may involve time consuming negotiations and prompt sale at an acceptable price may be difficult. The following funds hold restricted securities: |
| | | | | | | | | | | | |
| Fund | | Restricted Securities | | Acquisition
Date | | Acquisition Cost | | Current Market Value | | Total % of
Net Assets |
| Emerging Growth Portfolio | | Alibaba.com Corp. | | 10/29/07 - 11/07/07 | | $ | 216,142 | | $ | 255,316 | | 0.1% |
| New Discovery Portfolio | | Castle Brands, Inc. | | 4/19/07 | | | 681,977 | | $ | 279,942 | | |
| | Castle Brands, Inc. (Warrants) | | 4/18/07 | | | 1,205 | | | 1,205 | | |
| | | | | | | | | | | | |
| | Total Restricted Securities | | | | | | | $ | 281,147 | | 0.1% |
| | | | | | | | | | | | |
| | | | | | | | | | | | | |
| Strategic Income Portfolio | | Anthracite Ltd., CDO, 6%, 2037 | | 5/14/02 | | | 135,713 | | | 139,688 | | |
| | Asset Securitization Corp., FRN, 8.825%, 2029 | | 1/25/05 | | | 159,671 | | | 191,938 | | |
| | Bayview Financial Revolving Mortgage Loan Trust, FRN, 5.6%, 2040 | | 3/01/06 | | | 250,000 | | | 200,000 | | |
| | Bosphorus Financial Services Ltd., FRN, 6.668%, 2012 | | 3/08/05 | | | 200,000 | | | 198,046 | | |
| | Brazilian Merchant Voucher Receivables Ltd., 5.911%, 2011 | | 3/08/07 | | | 245,202 | | | 241,542 | | |
| | Chase Commercial Mortgage Securities Corp., 6.6%, 2012 | | 6/07/00 | | | 169,388 | | | 215,929 | | |
| | DLJ Commercial Mortgage Corp., 6.04%, 2031 | | 7/23/04 | | | 260,953 | | | 269,512 | | |
| | Falcon Franchise Loan LLC, 6.5%, 2014 | | 7/15/05 | | | 216,855 | | | 171,488 | | |
| | Falcon Franchise Loan LLC, FRN, 3.614%, 2023 | | 1/29/03 | | | 136,495 | | | 90,227 | | |
| | GMAC Commercial Mortgage Securities, Inc., FRN, 6.02%, 2033 | | 11/17/00 | | | 275,682 | | | 354,045 | | |
| | GTL Trade Finance, Inc., 7.25%, 2017 | | 10/17/07 | | | 33,704 | | | 34,508 | | |
| | Gabonese Republic, 8.2%, 2017 | | 12/05/07 - 12/06/07 | | | 227,270 | | | 232,875 | | |
| | NewPage Holdings Corp., 10%, 2012 | | 12/0707 - 12/11/07 | | | 80,775 | | | 80,400 | | |
| | Nuveen Investments, Inc., 10.5%, 2015 | | 10/31/07 - 11/21/07 | | | 159,275 | | | 159,400 | | |
| | Prudential Securities Secured Financing Corp., FRN, 7.243%, 2013 | | 12/06/04 | | | 456,290 | | | 427,742 | | |
| | Salomon Brothers Mortgage Securities, Inc., FRN, 7.072%, 2012 | | 1/07/05 | | | 609,047 | | | 587,369 | | |
| | VTB Capital S.A., 6.609%, 2012 | | 10/25/07 | | | 101,000 | | | 99,132 | | |
| | | | | | | | | | | | |
| | Total Restricted Securities | | | | | | | $ | 3,693,841 | | 5.4% |
| | | | | | | | | | | | |
| | | | | | | | | | | | | |
| Technology Portfolio | | Alibaba.com Corp. | | 10/29/07 - 11/14/07 | | | 199,685 | | $ | 193,260 | | 0.8% |
58
Portfolio of Investments – continued
The following abbreviations are used in this report and are defined:
| ADR | American Depository Receipt |
| CDO | Collateralized Debt Obligation |
| FRN | Floating Rate Note. Interest rate resets periodically and may not be the rate reported at period end. |
| GDR | Global Depository Receipt |
| REIT | Real Estate Investment Trust |
| TIPS | Treasury Inflation Protected Security |
Abbreviations indicate amounts shown in currencies other than the U.S. dollar. All amounts are stated in U.S. dollars unless otherwise indicated. A list of abbreviations is shown below:
See notes to financial statements.
59-TKP
MFS Variable Insurance Trust II
Statements of Assets and Liabilities — December 31, 2007
These statements represent each fund’s balance sheet, which details the assets and liabilities comprising the total value of each fund.
| | | | | | | | | | | | | | | | |
| | | MFS Capital
Appreciation
Portfolio | | | MFS Emerging
Growth
Portfolio | | | MFS Global
Governments
Portfolio | | | MFS Massachusetts
Investors
Growth Stock
Portfolio | |
Assets: | | | | | | | | | | | | | | | | |
Investments — | | | | | | | | | | | | | | | | |
At identified cost | | $ | 438,881,340 | | | $ | 277,413,842 | | | $ | 39,583,092 | | | $ | 417,064,550 | |
Unrealized appreciation (depreciation) | | | 40,771,776 | | | | 41,544,556 | | | | 689,964 | | | | 32,176,781 | |
| | | | | | | | | | | | | | | | |
Total investments, at value (including securities loaned of $—, $30,214,566, $—, and $26,493,676, respectively) | | $ | 479,653,116 | | | $ | 318,958,398 | | | $ | 40,273,056 | | | $ | 449,241,331 | |
Cash | | | — | | | | 3,278 | | | | 3,504 | | | | — | |
Foreign currency, at value (identified cost, $—, $243, $10,179, and $—, respectively) | | | — | | | | 243 | | | | 10,266 | | | | — | |
Receivable for forward foreign currency exchange contracts | | | — | | | | — | | | | 123,115 | | | | — | |
Receivable for daily variation margin on open futures contracts | | | — | | | | — | | | | 167 | | | | — | |
Receivable for investments sold | | | 4,447,703 | | | | 1,659,532 | | | | — | | | | 6,902,876 | |
Receivable for fund shares sold | | | 523 | | | | 1,119 | | | | 1,260 | | | | — | |
Interest and dividends receivable | | | 331,210 | | | | 283,003 | | | | 482,256 | | | | 294,058 | |
Receivable from investment adviser | | | — | | | | — | | | | 7,192 | | | | — | |
Other assets | | | 14,522 | | | | 9,706 | | | | 1,671 | | | | 13,927 | |
| | | | | | | | | | | | | | | | |
Total assets | | $ | 484,447,074 | | | $ | 320,915,279 | | | $ | 40,902,487 | | | $ | 456,452,192 | |
| | | | | | | | | | | | | | | | |
Liabilities: | | | | | | | | | | | | | | | | |
Payable to custodian | | $ | 9,933 | | | $ | — | | | $ | — | | | $ | 1,921,431 | |
Payable for forward foreign currency exchange contracts | | | — | | | | — | | | | 119,976 | | | | — | |
Payable for investments purchased | | | 420,329 | | | | 1,781,008 | | | | 81,606 | | | | 375,894 | |
Payable for fund shares reacquired | | | 329,125 | | | | 320,115 | | | | 12,334 | | | | 507,918 | |
Collateral for securities loaned, at value (c) | | | — | | | | 30,860,123 | | | | — | | | | 24,980,582 | |
Payable to affiliates | | | | | | | | | | | | | | | | |
Investment adviser | | | — | | | | — | | | | — | | | | 7,789 | |
Management fee | | | 39,996 | | | | 23,841 | | | | 3,309 | | | | 35,499 | |
Distribution fees | | | 758 | | | | 655 | | | | 110 | | | | 3,300 | |
Administrative services fee | | | 1,258 | | | | 741 | | | | 110 | | | | 1,114 | |
Payable for independent trustees’ compensation | | | 1,719 | | | | 901 | | | | 126 | | | | 1,508 | |
Accrued expenses and other liabilities | | | 84,175 | | | | 65,837 | | | | 63,354 | | | | 85,048 | |
| | | | | | | | | | | | | | | | |
Total liabilities | | $ | 887,293 | | | $ | 33,053,221 | | | $ | 280,925 | | | $ | 27,920,083 | |
| | | | | | | | | | | | | | | | |
Net assets | | $ | 483,559,781 | | | $ | 287,862,058 | | | $ | 40,621,562 | | | $ | 428,532,109 | |
| | | | | | | | | | | | | | | | |
Net assets consist of: | | | | | | | | | | | | | | | | |
Paid-in capital | | $ | 1,223,735,629 | | | $ | 589,910,793 | | | $ | 37,280,784 | | | $ | 778,522,320 | |
Unrealized appreciation (depreciation) on investments and translation of assets and liabilities in foreign currencies | | | 40,775,078 | | | | 41,549,618 | | | | 714,280 | | | | 32,176,797 | |
Accumulated net realized gain (loss) on investments and foreign currency transactions | | | (782,746,682 | ) | | | (344,096,011 | ) | | | (735,839 | ) | | | (383,934,872 | ) |
Undistributed net investment income | | | 1,795,756 | | | | 497,658 | | | | 3,362,337 | | | | 1,767,864 | |
| | | | | | | | | | | | | | | | |
Total | | $ | 483,559,781 | | | $ | 287,862,058 | | | $ | 40,621,562 | | | $ | 428,532,109 | |
| | | | | | | | | | | | | | | | |
Net Assets | | | | | | | | | | | | | | | | |
Initial Class | | $ | 456,005,876 | | | $ | 264,088,941 | | | $ | 36,558,882 | | | $ | 309,207,980 | |
Service Class | | | 27,553,905 | | | | 23,773,117 | | | | 4,062,680 | | | | 119,324,129 | |
| | | | | | | | | | | | | | | | |
Total | | $ | 483,559,781 | | | $ | 287,862,058 | | | $ | 40,621,562 | | | $ | 428,532,109 | |
| | | | | | | | | | | | | | | | |
Shares of beneficial interest outstanding | | | | | | | | | | | | | | | | |
Initial Class | | | 20,053,014 | | | | 11,805,013 | | | | 3,199,789 | | | | 26,450,383 | |
Service Class | | | 1,222,707 | | | | 1,080,297 | | | | 358,882 | | | | 10,296,273 | |
| | | | | | | | | | | | | | | | |
Total | | | 21,275,721 | | | | 12,885,310 | | | | 3,558,671 | | | | 36,746,656 | |
| | | | | | | | | | | | | | | | |
Net asset value per share (net assets ÷ shares of beneficial interest outstanding): | | | | | | | | | | | | | | | | |
Initial Class | | | $22.74 | | | | $22.37 | | | | $11.43 | | | | $11.69 | |
| | | | | | | | | | | | | | | | |
Service Class | | | $22.54 | | | | $22.01 | | | | $11.32 | | | | $11.59 | |
| | | | | | | | | | | | | | | | |
| (c) | Non-cash collateral not included. |
See notes to financial statements.
60
MFS Variable Insurance Trust II
Statements of Assets and Liabilities — December 31, 2007 — continued
| | | | | | | | | | | | | | | |
| | | MFS Mid Cap
Growth
Portfolio | | | MFS Mid Cap
Value
Portfolio | | MFS Money
Market
Portfolio | | | MFS New
Discovery
Portfolio | |
Assets: | | | | | | | | | | | | | | | |
Investments — | | | | | | | | | | | | | | | |
At identified cost | | $ | 87,360,583 | | | $ | 21,042,639 | | $ | 558,090,812 | | | $ | 392,370,396 | |
Unrealized appreciation (depreciation) | | | 7,011,949 | | | | 1,408,855 | | | — | | | | (3,828,239 | ) |
| | | | | | | | | | | | | | | |
Total investments, at value (including securities loaned of $16,884,308, $—, $—, and $70,884,557, respectively) | | $ | 94,372,532 | | | $ | 22,451,494 | | $ | 558,090,812 | | | $ | 388,542,157 | |
Cash | | | 139 | | | | 176 | | | — | | | | 1,414 | |
Receivable for investments sold | | | 787,437 | | | | — | | | — | | | | 957,271 | |
Receivable for fund shares sold | | | — | | | | — | | | 73,605 | | | | 20,054 | |
Interest and dividends receivable | | | 32,107 | | | | 35,950 | | | 787,171 | | | | 87,061 | |
Receivable from investment adviser | | | — | | | | 3,180 | | | — | | | | 22,600 | |
Other assets | | | 3,035 | | | | 1,187 | | | 17,533 | | | | 11,363 | |
| | | | | | | | | | | | | | | |
Total assets | | $ | 95,195,250 | | | $ | 22,491,987 | | $ | 558,969,121 | | | $ | 389,641,920 | |
| | | | | | | | | | | | | | | |
Liabilities: | | | | | | | | | | | | | | | |
Payable to custodian | | $ | — | | | $ | — | | $ | 1,338 | | | $ | — | |
Payable for investments purchased | | | 73,138 | | | | — | | | — | | | | 22,808 | |
Payable for fund shares reacquired | | | 136,109 | | | | 29,053 | | | 4,593,843 | | | | 290,998 | |
Collateral for securities loaned, at value (c) | | | 17,058,214 | | | | — | | | — | | | | 72,654,740 | |
Payable to affiliates | | | | | | | | | | | | | | | |
Management fee | | | 6,472 | | | | 1,866 | | | 30,496 | | | | 31,277 | |
Distribution fees | | | 913 | | | | 621 | | | 6,368 | | | | 5,115 | |
Administrative services fee | | | 185 | | | | 110 | | | 1,442 | | | | 812 | |
Payable for independent trustees’ compensation | | | 268 | | | | 70 | | | 934 | | | | 1,002 | |
Accrued expenses and other liabilities | | | 56,674 | | | | 50,243 | | | 5,187 | | | | 90,444 | |
| | | | | | | | | | | | | | | |
Total liabilities | | $ | 17,331,973 | | | $ | 81,963 | | $ | 4,639,608 | | | $ | 73,097,196 | |
| | | | | | | | | | | | | | | |
Net assets | | $ | 77,863,277 | | | $ | 22,410,024 | | $ | 554,329,513 | | | $ | 316,544,724 | |
| | | | | | | | | | | | | | | |
Net assets consist of: | | | | | | | | | | | | | | | |
Paid-in capital | | $ | 88,188,197 | | | $ | 18,858,254 | | $ | 554,360,322 | | | $ | 282,375,843 | |
Unrealized appreciation (depreciation) on investments and translation of assets and liabilities in foreign currencies | | | 7,011,949 | | | | 1,408,855 | | | — | | | | (3,828,245 | ) |
Accumulated net realized gain (loss) on investments and foreign currency transactions | | | (17,336,869 | ) | | | 1,952,217 | | | (32,047 | ) | | | 37,997,126 | |
Undistributed net investment income | | | — | | | | 190,698 | | | 1,238 | | | | — | |
| | | | | | | | | | | | | | | |
Total | | $ | 77,863,277 | | | $ | 22,410,024 | | $ | 554,329,513 | | | $ | 316,544,724 | |
| | | | | | | | | | | | | | | |
Net Assets | | | | | | | | | | | | | | | |
Initial Class | | $ | 44,943,986 | | | $ | 35,117 | | $ | 320,806,975 | | | $ | 130,029,159 | |
Service Class | | | 32,919,291 | | | | 22,374,907 | | | 233,522,538 | | | | 186,515,565 | |
| | | | | | | | | | | | | | | |
Total | | $ | 77,863,277 | | | $ | 22,410,024 | | $ | 554,329,513 | | | $ | 316,544,724 | |
| | | | | | | | | | | | | | | |
Shares of beneficial interest outstanding | | | | | | | | | | | | | | | |
Initial Class | | | 6,685,395 | | | | 3,122 | | | 320,826,266 | | | | 8,007,088 | |
Service Class | | | 4,965,657 | | | | 2,008,987 | | | 233,534,721 | | | | 11,676,118 | |
| | | | | | | | | | | | | | | |
Total | | | 11,651,052 | | | | 2,012,109 | | | 554,360,987 | | | | 19,683,206 | |
| | | | | | | | | | | | | | | |
Net asset value per share (net assets ÷ shares of beneficial interest outstanding): | | | | | | | | | | | | | | | |
Initial Class | | | $6.72 | | | | $11.25 | | | $1.00 | | | | $16.24 | |
| | | | | | | | | | | | | | | |
Service Class | | | $6.63 | | | | $11.14 | | | $1.00 | | | | $15.97 | |
| | | | | | | | | | | | | | | |
| (c) | Non-cash collateral not included. |
See notes to financial statements.
61
MFS Variable Insurance Trust II
Statements of Assets and Liabilities — December 31, 2007 — continued
| | | | | | | | | | | | | | | | |
| | | MFS
Research
Portfolio | | | MFS Strategic
Income
Portfolio | | | MFS Strategic
Value
Portfolio | | | MFS
Technology
Portfolio | |
Assets: | | | | | | | | | | | | | | | | |
Investments — | | | | | | | | | | | | | | | | |
Unaffiliated issuers, at identified cost | | $ | 301,959,068 | | | $ | 68,227,046 | | | $ | 7,650,132 | | | $ | 29,928,077 | |
Unrealized appreciation (depreciation) | | | 19,761,903 | | | | (234,164 | ) | | | (150,115 | ) | | | (196,266 | ) |
| | | | | | | | | | | | | | | | |
Total investments, at value (including securities loaned of $26,644,870, $—, $—, and $5,130,384, respectively) | | $ | 321,720,971 | | | $ | 67,992,882 | | | $ | 7,500,017 | | | $ | 29,731,811 | |
Cash | | | 1,958 | | | | 76,538 | | | | 245 | | | | 15,042 | |
Foreign currency, at value (identified cost, $378, $—, $—, and $30, respectively) | | | 405 | | | | — | | | | — | | | | 31 | |
Receivable for forward foreign currency exchange contracts | | | — | | | | 43,840 | | | | — | | | | — | |
Premium receivables on options written | | | — | | | | — | | | | — | | | | 4,464 | |
Receivable for investments sold | | | 404,984 | | | | 1,182 | | | | 40,067 | | | | 124,593 | |
Receivable for fund shares sold | | | 430 | | | | — | | | | — | | | | — | |
Interest and dividends receivable | | | 320,163 | | | | 1,079,664 | | | | 8,650 | | | | 5,456 | |
Receivable from investment adviser | | | — | | | | — | | | | 14,349 | | | | 13,248 | |
Swaps, at value | | | — | | | | 37,542 | | | | — | | | | — | |
Other assets | | | 168,292 | | | | 2,685 | | | | 564 | | | | 1,301 | |
| | | | | | | | | | | | | | | | |
Total assets | | $ | 322,617,203 | | | $ | 69,234,333 | | | $ | 7,563,892 | | | $ | 29,895,946 | |
| | | | | | | | | | | | | | | | |
Liabilities: | | | | | | | | | | | | | | | | |
Payable for forward foreign currency exchange contracts | | $ | — | | | $ | 6,828 | | | $ | — | | | $ | — | |
Payable for daily variation margin on open futures contracts | | | — | | | | 11,656 | | | | — | | | | — | |
Payable for investments purchased | | | 297,030 | | | | 271,085 | | | | 191,513 | | | | 29,246 | |
Payable for fund shares reacquired | | | 188,080 | | | | 62,533 | | | | 869 | | | | 44,124 | |
Unrealized depreciation on unfunded loan commitments | | | — | | | | 175 | | | | — | | | | — | |
Swaps, at value | | | — | | | | 6,703 | | | | — | | | | — | |
Collateral for securities loaned, at value (c) | | | 24,985,769 | | | | — | | | | — | | | | 4,917,614 | |
Written options outstanding, at value (premiums received, $—, $—, $—, and $125,144, respectively) | | | — | | | | — | | | | — | | | | 117,520 | |
Payable to affiliates | | | | | | | | | | | | | | | | |
Management fee | | | 24,563 | | | | 5,274 | | | | 606 | | | | 2,044 | |
Distribution fees | | | 794 | | | | 525 | | | | 202 | | | | 97 | |
Administrative services fee | | | 764 | | | | 159 | | | | 109 | | | | 110 | |
Payable for independent trustees’ compensation | | | 1,029 | | | | 223 | | | | 24 | | | | 47 | |
Accrued expenses and other liabilities | | | 70,187 | | | | 55,489 | | | | 51,671 | | | | 46,285 | |
| | | | | | | | | | | | | | | | |
Total liabilities | | $ | 25,568,216 | | | $ | 420,650 | | | $ | 244,994 | | | $ | 5,157,087 | |
| | | | | | | | | | | | | | | | |
Net assets | | $ | 297,048,987 | | | $ | 68,813,683 | | | $ | 7,318,898 | | | $ | 24,738,859 | |
| | | | | | | | | | | | | | | | |
Net assets consist of: | | | | | | | | | | | | | | | | |
Paid-in capital | | $ | 422,015,059 | | | $ | 65,811,818 | | | $ | 6,586,897 | | | $ | 51,221,507 | |
Unrealized appreciation (depreciation) on investments and translation of assets and liabilities in foreign currencies | | | 19,762,128 | | | | (154,249 | ) | | | (150,096 | ) | | | (188,641 | ) |
Accumulated net realized gain (loss) on investments and foreign currency transactions | | | (146,196,636 | ) | | | (988,798 | ) | | | 837,301 | | | | (26,294,007 | ) |
Undistributed net investment income | | | 1,468,436 | | | | 4,144,912 | | | | 44,796 | | | | — | |
| | | | | | | | | | | | | | | | |
Total | | $ | 297,048,987 | | | $ | 68,813,683 | | | $ | 7,318,898 | | | $ | 24,738,859 | |
| | | | | | | | | | | | | | | | |
Net Assets | | | | | | | | | | | | | | | | |
Initial Class | | $ | 268,217,432 | | | $ | 49,582,147 | | | $ | 9,909 | | | $ | 21,183,861 | |
Service Class | | | 28,831,555 | | | | 19,231,536 | | | | 7,308,989 | | | | 3,554,998 | |
| | | | | | | | | | | | | | | | |
Total | | $ | 297,048,987 | | | $ | 68,813,683 | | | $ | 7,318,898 | | | $ | 24,738,859 | |
| | | | | | | | | | | | | | | | |
Shares of beneficial interest outstanding | | | | | | | | | | | | | | | | |
Initial Class | | | 12,746,706 | | | | 4,769,519 | | | | 1,038 | | | | 3,237,117 | |
Service Class | | | 1,380,074 | | | | 1,862,428 | | | | 770,054 | | | | 553,399 | |
| | | | | | | | | | | | | | | | |
Total | | | 14,126,780 | | | | 6,631,947 | | | | 771,092 | | | | 3,790,516 | |
| | | | | | | | | | | | | | | | |
Net asset value per share (net assets ÷ shares of beneficial interest outstanding): | | | | | | | | | | | | | | | | |
Initial Class | | | $21.04 | | | | $10.40 | | | | $9.55 | | | | $6.54 | |
| | | | | | | | | | | | | | | | |
Service Class | | | $20.89 | | | | $10.33 | | | | $9.49 | | | | $6.42 | |
| | | | | | | | | | | | | | | | |
| (c) | Non-cash collateral not included. |
See notes to financial statements.
62
MFS Variable Insurance Trust II
Statements of Operations — Year Ended December 31, 2007
These statements describe how much each fund earned in investment income and accrued in expenses. It also describes any gains and/or losses generated by each fund’s operations.
| | | | | | | | | | | | | | | | |
| | | MFS Capital
Appreciation
Portfolio | | | MFS Emerging
Growth
Portfolio | | | MFS Global
Governments
Portfolio | | | MFS Massachusetts
Investors
Growth Stock
Portfolio | |
Net investment income | | | | | | | | | | | | | | | | |
Income | | | | | | | | | | | | | | | | |
Interest | | $ | 383,802 | | | $ | 418,688 | | | $ | 1,773,246 | | | $ | 516,381 | |
Dividends | | | 5,962,331 | | | | 2,736,726 | | | | — | | | | 5,221,615 | |
Income on securities loaned | | | — | | | | 77,667 | | | | — | | | | 63,669 | |
Foreign taxes withheld | | | (105,624 | ) | | | (94,805 | ) | | | — | | | | (139,736 | ) |
| | | | | | | | | | | | | | | | |
Total investment income | | $ | 6,240,509 | | | $ | 3,138,276 | | | $ | 1,773,246 | | | $ | 5,661,929 | |
| | | | | | | | | | | | | | | | |
Expenses | | | | | | | | | | | | | | | | |
Management fee | | $ | 3,946,357 | | | $ | 2,285,432 | | | $ | 308,939 | | | $ | 3,277,218 | |
Distribution fees | | | 73,492 | | | | 56,799 | | | | 9,405 | | | | 272,703 | |
Administrative services fee | | | 137,448 | | | | 80,247 | | | | 11,134 | | | | 114,176 | |
Independent trustees’ compensation | | | 51,889 | | | | 29,103 | | | | 3,816 | | | | 43,730 | |
Custodian fee | | | 100,326 | | | | 71,406 | | | | 46,065 | | | | 100,694 | |
Shareholder communications | | | 32,651 | | | | 25,729 | | | | 7,374 | | | | 34,909 | |
Auditing fees | | | 42,296 | | | | 42,957 | | | | 52,548 | | | | 42,026 | |
Legal fees | | | 5,953 | | | | 5,949 | | | | 5,950 | | | | 6,359 | |
Miscellaneous | | | 51,000 | | | | 31,682 | | | | 8,744 | | | | 41,053 | |
| | | | | | | | | | | | | | | | |
Total expenses | | $ | 4,441,412 | | | $ | 2,629,304 | | | $ | 453,975 | | | $ | 3,932,868 | |
Fees paid indirectly | | | (2,194 | ) | | | (2,603 | ) | | | (9,915 | ) | | | (4,968 | ) |
Reduction of expenses by investment adviser | | | — | | | | — | | | | (32,078 | ) | | | (47,147 | ) |
| | | | | | | | | | | | | | | | |
Net expenses | | $ | 4,439,218 | | | $ | 2,626,701 | | | $ | 411,982 | | | $ | 3,880,753 | |
| | | | | | | | | | | | | | | | |
Net investment income | | $ | 1,801,291 | | | $ | 511,575 | | | $ | 1,361,264 | | | $ | 1,781,176 | |
| | | | | | | | | | | | | | | | |
Realized and unrealized gain (loss) on investments and foreign currency transactions | | | | | | | | | | | | | | | | |
Realized gain (loss) (identified cost basis) | | | | | | | | | | | | | | | | |
Investment transactions | | $ | 52,057,502 | | | $ | 50,114,041 | | | $ | 1,965,113 | | | $ | 47,769,797 | |
Futures contracts | | | — | | | | — | | | | 82,960 | | | | — | |
Foreign currency transactions | | | (515 | ) | | | (13,917 | ) | | | 21,443 | | | | (8,297 | ) |
| | | | | | | | | | | | | | | | |
Net realized gain (loss) on investments and foreign currency transactions | | $ | 52,056,987 | | | $ | 50,100,124 | | | $ | 2,069,516 | | | $ | 47,761,500 | |
| | | | | | | | | | | | | | | | |
Change in unrealized appreciation (depreciation) | | | | | | | | | | | | | | | | |
Investments | | $ | 2,423,756 | | | $ | 8,139,655 | | | $ | (95,623 | ) | | $ | (2,694,666 | ) |
Futures contracts | | | — | | | | — | | | | 13,642 | | | | — | |
Translation of assets and liabilities in foreign currencies | | | 2,482 | | | | 3,557 | | | | 75,072 | | | | (215 | ) |
| | | | | | | | | | | | | | | | |
Net unrealized gain (loss) on investments and foreign currency translation | | $ | 2,426,238 | | | $ | 8,143,212 | | | $ | (6,909 | ) | | $ | (2,694,881 | ) |
| | | | | | | | | | | | | | | | |
Net realized and unrealized gain (loss) on investments and foreign currency | | $ | 54,483,225 | | | $ | 58,243,336 | | | $ | 2,062,607 | | | $ | 45,066,619 | |
| | | | | | | | | | | | | | | | |
Change in net assets from operations | | $ | 56,284,516 | | | $ | 58,754,911 | | | $ | 3,423,871 | | | $ | 46,847,795 | |
| | | | | | | | | | | | | | | | |
See notes to financial statements.
63
MFS Variable Insurance Trust II
Statements of Operations — Year Ended December 31, 2007 — continued
| | | | | | | | | | | | | | | | |
| | | MFS Mid Cap
Growth
Portfolio | | | MFS Mid Cap
Value
Portfolio | | | MFS Money
Market
Portfolio | | | MFS New
Discovery
Portfolio | |
Net investment income (loss) | | | | | | | | | | | | | | | | |
Income | | | | | | | | | | | | | | | | |
Interest | | $ | 33,545 | | | $ | 15,241 | | | $ | 26,325,469 | | | $ | 80,998 | |
Dividends | | | 600,167 | | | | 485,582 | | | | — | | | | 1,263,391 | |
Income on securities loaned | | | 32,853 | | | | — | | | | — | | | | 404,919 | |
Foreign taxes withheld | | | — | | | | — | | | | — | | | | (5,455 | ) |
| | | | | | | | | | | | | | | | |
Total investment income | | $ | 666,565 | | | $ | 500,823 | | | $ | 26,325,469 | | | $ | 1,743,853 | |
| | | | | | | | | | | | | | | | |
Expenses | | | | | | | | | | | | | | | | |
Management fee | | $ | 654,547 | | | $ | 186,089 | | | $ | 2,470,238 | | | $ | 3,142,045 | |
Distribution fees | | | 90,395 | | | | 61,938 | | | | 483,585 | | | | 486,110 | |
Administrative services fee | | | 22,486 | | | | 10,001 | | | | 109,709 | | | | 91,761 | |
Independent trustees’ compensation | | | 8,271 | | | | 2,258 | | | | 31,593 | | | | 32,241 | |
Custodian fee | | | 8,784 | | | | 11,799 | | | | 44,214 | | | | 76,745 | |
Shareholder communications | | | 9,214 | | | | 5,204 | | | | 28,242 | | | | 54,527 | |
Auditing fees | | | 40,293 | | | | 42,937 | | | | 27,810 | | | | 40,770 | |
Legal fees | | | 5,950 | | | | 5,950 | | | | 5,950 | | | | 5,950 | |
Miscellaneous | | | 19,197 | | | | 14,262 | | | | 26,293 | | | | 35,981 | |
| | | | | | | | | | | | | | | | |
Total expenses | | $ | 859,137 | | | $ | 340,438 | | | $ | 3,227,634 | | | $ | 3,966,130 | |
Fees paid indirectly | | | (296 | ) | | | (135 | ) | | | (4,877 | ) | | | (4,819 | ) |
Reduction of expenses by investment adviser | | | — | | | | (31,185 | ) | | | — | | | | (160,491 | ) |
| | | | | | | | | | | | | | | | |
Net expenses | | $ | 858,841 | | | $ | 309,118 | | | $ | 3,222,757 | | | $ | 3,800,820 | |
| | | | | | | | | | | | | | | | |
Net investment income (loss) | | $ | (192,276 | ) | | $ | 191,705 | | | $ | 23,102,712 | | | $ | (2,056,967 | ) |
| | | | | | | | | | | | | | | | |
Realized and unrealized gain (loss) on investments and foreign currency transactions | | | | | | | | | | | | | | | | |
Realized gain (loss) (identified cost basis) | | | | | | | | | | | | | | | | |
Investment transactions | | $ | 9,551,575 | | | $ | 1,976,358 | | | $ | (31,281 | ) | | $ | 40,593,407 | |
Foreign currency transactions | | | — | | | | — | | | | — | | | | (1,125 | ) |
| | | | | | | | | | | | | | | | |
Net realized gain (loss) on investments and foreign currency transactions | | $ | 9,551,575 | | | $ | 1,976,358 | | | $ | (31,281 | ) | | $ | 40,592,282 | |
| | | | | | | | | | | | | | | | |
Change in unrealized appreciation (depreciation) | | | | | | | | | | | | | | | | |
Investments | | $ | (943,630 | ) | | $ | (1,627,951 | ) | | $ | — | | | $ | (28,023,696 | ) |
Translation of assets and liabilities in foreign currencies | | | — | | | | — | | | | — | | | | (6 | ) |
| | | | | | | | | | | | | | | | |
Net unrealized gain (loss) on investments and foreign currency translation | | $ | (943,630 | ) | | $ | (1,627,951 | ) | | $ | — | | | $ | (28,023,702 | ) |
| | | | | | | | | | | | | | | | |
Net realized and unrealized gain (loss) on investments and foreign currency | | $ | 8,607,945 | | | $ | 348,407 | | | $ | (31,281 | ) | | $ | 12,568,580 | |
| | | | | | | | | | | | | | | | |
Change in net assets from operations | | $ | 8,415,669 | | | $ | 540,112 | | | $ | 23,071,431 | | | $ | 10,511,613 | |
| | | | | | | | | | | | | | | | |
See notes to financial statements.
64
MFS Variable Insurance Trust II
Statements of Operations — Year Ended December 31, 2007 — continued
| | | | | | | | | | | | | | | | |
| | | MFS
Research
Portfolio | | | MFS Strategic
Income
Portfolio | | | MFS Strategic
Value
Portfolio | | | MFS
Technology
Portfolio | |
Net investment income (loss) | | | | | | | | | | | | | | | | |
Income | | | | | | | | | | | | | | | | |
Interest | | $ | 60,236 | | | $ | 4,864,943 | | | $ | 7,951 | | | $ | 22,211 | |
Dividends | | | 4,186,068 | | | | 1,385 | | | | 143,877 | | | | 123,476 | |
Income on securities loaned | | | 50,254 | | | | — | | | | — | | | | 17,660 | |
Foreign taxes withheld | | | (32,564 | ) | | | (274 | ) | | | (522 | ) | | | (7,795 | ) |
| | | | | | | | | | | | | | | | |
Total investment income | | $ | 4,263,994 | | | $ | 4,866,054 | | | $ | 151,306 | | | $ | 155,552 | |
| | | | | | | | | | | | | | | | |
Expenses | | | | | | | | | | | | | | | | |
Management fee | | $ | 2,414,535 | | | $ | 553,643 | | | $ | 64,300 | | | $ | 168,649 | |
Distribution fees | | | 75,273 | | | | 51,533 | | | | 21,407 | | | | 8,057 | |
Administrative services fee | | | 85,295 | | | | 18,865 | | | | 10,001 | | | | 10,001 | |
Independent trustees’ compensation | | | 31,488 | | | | 6,916 | | | | 734 | | | | 1,958 | |
Custodian fee | | | 68,299 | | | | 52,162 | | | | 6,780 | | | | 18,434 | |
Shareholder communications | | | 21,558 | | | | 7,795 | | | | 2,537 | | | | 8,177 | |
Auditing fees | | | 40,954 | | | | 39,990 | | | | 42,937 | | | | 45,359 | |
Legal fees | | | 5,950 | | | | 6,350 | | | | 5,950 | | | | 6,254 | |
Miscellaneous | | | 38,887 | | | | 12,526 | | | | 8,899 | | | | 12,900 | |
| | | | | | | | | | | | | | | | |
Total expenses | | $ | 2,782,239 | | | $ | 749,780 | | | $ | 163,545 | | | $ | 279,789 | |
Fees paid indirectly | | | (3,534 | ) | | | (3,620 | ) | | | (106 | ) | | | (462 | ) |
Reduction of expenses by investment adviser | | | — | | | | (36,909 | ) | | | (57,960 | ) | | | (46,407 | ) |
| | | | | | | | | | | | | | | | |
Net expenses | | $ | 2,778,705 | | | $ | 709,251 | | | $ | 105,479 | | | $ | 232,920 | |
| | | | | | | | | | | | | | | | |
Net investment income (loss) | | $ | 1,485,289 | | | $ | 4,156,803 | | | $ | 45,827 | | | $ | (77,368 | ) |
| | | | | | | | | | | | | | | | |
Realized and unrealized gain (loss) on investments and foreign currency transactions | | | | | | | | | | | | | | | | |
Realized gain (loss) (identified cost basis) | | | | | | | | | | | | | | | | |
Investment transactions | | $ | 46,807,061 | | | $ | 386,256 | | | $ | 969,200 | | | $ | 5,259,342 | |
Written options transactions | | | (119,427 | ) | | | — | | | | — | | | | (189,011 | ) |
Futures contracts | | | — | | | | (214,321 | ) | | | — | | | | — | |
Swap transactions | | | — | | | | 21,233 | | | | — | | | | — | |
Foreign currency transactions | | | (11,905 | ) | | | (199,668 | ) | | | (33 | ) | | | (14,648 | ) |
| | | | | | | | | | | | | | | | |
Net realized gain (loss) on investments and foreign currency transactions | | $ | 46,675,729 | | | $ | (6,500 | ) | | $ | 969,167 | | | $ | 5,055,683 | |
| | | | | | | | | | | | | | | | |
Change in unrealized appreciation (depreciation) | | | | | | | | | | | | | | | | |
Investments | | $ | (7,248,080 | ) | | $ | (1,782,801 | ) | | $ | (1,133,883 | ) | | $ | (1,025,191 | ) |
Written options | | | — | | | | — | | | | — | | | | 7,624 | |
Futures contracts | | | — | | | | (30,177 | ) | | | — | | | | — | |
Swap transactions | | | — | | | | 35,053 | | | | — | | | | — | |
Translation of assets and liabilities in foreign currencies | | | 554 | | | | 46,574 | | | | 19 | | | | 6,963 | |
Unfunded loan commitments | | | — | | | | (175 | ) | | | — | | | | — | |
| | | | | | | | | | | | | | | | |
Net unrealized gain (loss) on investments and foreign currency translation | | $ | (7,247,526 | ) | | $ | (1,731,526 | ) | | $ | (1,133,864 | ) | | $ | (1,010,604 | ) |
| | | | | | | | | | | | | | | | |
Net realized and unrealized gain (loss) on investments and foreign currency | | $ | 39,428,203 | | | $ | (1,738,026 | ) | | $ | (164,697 | ) | | $ | 4,045,079 | |
| | | | | | | | | | | | | | | | |
Change in net assets from operations | | $ | 40,913,492 | | | $ | 2,418,777 | | | $ | (118,870 | ) | | $ | 3,967,711 | |
| | | | | | | | | | | | | | | | |
See notes to financial statements.
65
MFS Variable Insurance Trust II
Statements of Changes in Net Assets — Year Ended December 31, 2007
These statements describe the increases and/or decreases in net assets resulting from operations, any distributions, and any shareholder transactions.
| | | | | | | | | | | | | | | | |
| | | MFS Capital
Appreciation
Portfolio | | | MFS Emerging
Growth
Portfolio | | | MFS Global
Governments
Portfolio | | | MFS Massachusetts
Investors
Growth Stock
Portfolio | |
Change in net assets | | | | | | | | | | | | | | | | |
From operations | | | | | | | | | | | | | | | | |
Net investment income (loss) | | $ | 1,801,291 | | | $ | 511,575 | | | $ | 1,361,264 | | | $ | 1,781,176 | |
Net realized gain (loss) on investments and foreign currency transactions | | | 52,056,987 | | | | 50,100,124 | | | | 2,069,516 | | | | 47,761,500 | |
Net unrealized gain (loss) on investments and foreign currency translation | | | 2,426,238 | | | | 8,143,212 | | | | (6,909 | ) | | | (2,694,881 | ) |
| | | | | | | | | | | | | | | | |
Change in net assets from operations | | $ | 56,284,516 | | | $ | 58,754,911 | | | $ | 3,423,871 | | | $ | 46,847,795 | |
| | | | | | | | | | | | | | | | |
Distributions declared to shareholders | | | | | | | | | | | | | | | | |
From net investment income | | | | | | | | | | | | | | | | |
Initial Class | | $ | (981,066 | ) | | $ | — | | | $ | (767,617 | ) | | $ | (1,191,441 | ) |
Service Class | | | — | | | | — | | | | (65,103 | ) | | | (118,578 | ) |
| | | | | | | | | | | | | | | | |
Total distributions declared to shareholders | | $ | (981,066 | ) | | $ | — | | | $ | (832,720 | ) | | $ | (1,310,019 | ) |
| | | | | | | | | | | | | | | | |
Change in net assets from fund share transactions | | $ | (130,804,964 | ) | | $ | (84,395,640 | ) | | $ | (5,399,291 | ) | | $ | (42,085,103 | ) |
| | | | | | | | | | | | | | | | |
Total change in net assets | | $ | (75,501,514 | ) | | $ | (25,640,729 | ) | | $ | (2,808,140 | ) | | $ | 3,452,673 | |
Net assets | | | | | | | | | | | | | | | | |
At beginning of period | | | 559,061,295 | | | | 313,502,787 | | | | 43,429,702 | | | | 425,079,436 | |
| | | | | | | | | | | | | | | | |
At end of period | | $ | 483,559,781 | | | $ | 287,862,058 | | | $ | 40,621,562 | | | $ | 428,532,109 | |
| | | | | | | | | | | | | | | | |
Undistributed net investment income included in net assets at end of period | | $ | 1,795,756 | | | $ | 497,658 | | | $ | 3,362,337 | | | $ | 1,767,864 | |
| | | | | | | | | | | | | | | | |
| | | | |
| | | MFS Mid Cap
Growth
Portfolio | | | MFS Mid Cap
Value
Portfolio | | | MFS Money
Market
Portfolio | | | MFS New
Discovery
Portfolio | |
Change in net assets | | | | | | | | | | | | | | | | |
From operations | | | | | | | | | | | | | | | | |
Net investment income (loss) | | $ | (192,276 | ) | | $ | 191,705 | | | $ | 23,102,712 | | | $ | (2,056,967 | ) |
Net realized gain (loss) on investments and foreign currency transactions | | | 9,551,575 | | | | 1,976,358 | | | | (31,281 | ) | | | 40,592,282 | |
Net unrealized gain (loss) on investments and foreign currency translation | | | (943,630 | ) | | | (1,627,951 | ) | | | — | | | | (28,023,702 | ) |
| | | | | | | | | | | | | | | | |
Change in net assets from operations | | $ | 8,415,669 | | | $ | 540,112 | | | $ | 23,071,431 | | | $ | 10,511,613 | |
| | | | | | | | | | | | | | | | |
Distributions declared to shareholders | | | | | | | | | | | | | | | | |
From net investment income | | | | | | | | | | | | | | | | |
Initial Class | | $ | (19,627 | ) | | $ | (262 | ) | | $ | (14,441,278 | ) | | $ | — | |
Service Class | | | — | | | | (120,734 | ) | | | (8,661,434 | ) | | | — | |
From net realized gain on investments | | | | | | | | | | | | | | | | |
Initial Class | | | — | | | | (1,376 | ) | | | — | | | | (4,140,582 | ) |
Service Class | | | — | | | | (964,003 | ) | | | — | | | | (5,182,591 | ) |
| | | | | | | | | | | | | | | | |
Total distributions declared to shareholders | | $ | (19,627 | ) | | $ | (1,086,375 | ) | | $ | (23,102,712 | ) | | $ | (9,323,173 | ) |
| | | | | | | | | | | | | | | | |
Change in net assets from fund share transactions | | $ | (20,681,464 | ) | | $ | (2,029,552 | ) | | $ | 107,790,837 | | | $ | (29,936,615 | ) |
| | | | | | | | | | | | | | | | |
Total change in net assets | | $ | (12,285,422 | ) | | $ | (2,575,815 | ) | | $ | 107,759,556 | | | $ | (28,748,175 | ) |
Net assets | | | | | | | | | | | | | | | | |
At beginning of period | | | 90,148,699 | | | | 24,985,839 | | | | 446,569,957 | | | | 345,292,899 | |
| | | | | | | | | | | | | | | | |
At end of period | | $ | 77,863,277 | | | $ | 22,410,024 | | | $ | 554,329,513 | | | $ | 316,544,724 | |
| | | | | | | | | | | | | | | | |
Undistributed net investment income included in net assets at end of period | | $ | — | | | $ | 190,698 | | | $ | 1,238 | | | $ | — | |
| | | | | | | | | | | | | | | | |
See notes to financial statements.
66
MFS Variable Insurance Trust II
Statements of Changes in Net Assets — Year Ended December 31, 2007 — continued
| | | | | | | | | | | | | | | | |
| | | MFS
Research
Portfolio | | | MFS Strategic
Income
Portfolio | | | MFS Strategic
Value
Portfolio | | | MFS
Technology
Portfolio | |
Change in net assets | | | | | | | | | | | | | | | | |
From operations | | | | | | | | | | | | | | | | |
Net investment income (loss) | | $ | 1,485,289 | | | $ | 4,156,803 | | | $ | 45,827 | | | $ | (77,368 | ) |
Net realized gain (loss) on investments and foreign currency transactions | | | 46,675,729 | | | | (6,500 | ) | | | 969,167 | | | | 5,055,683 | |
Net unrealized gain (loss) on investments and foreign currency translation | | | (7,247,526 | ) | | | (1,731,526 | ) | | | (1,133,864 | ) | | | (1,010,604 | ) |
| | | | | | | | | | | | | | | | |
Change in net assets from operations | | $ | 40,913,492 | | | $ | 2,418,777 | | | $ | (118,870 | ) | | $ | 3,967,711 | |
| | | | | | | | | | | | | | | | |
Distributions declared to shareholders | | | | | | | | | | | | | | | | |
From net investment income | | | | | | | | | | | | | | | | |
Initial Class | | $ | (2,461,746 | ) | | $ | (2,912,294 | ) | | $ | (188 | ) | | $ | — | |
Service Class | | | (182,290 | ) | | | (1,051,166 | ) | | | (130,127 | ) | | | — | |
From net realized gain on investments | | | | | | | | | | | | | | | | |
Initial Class | | | — | | | | — | | | | (737 | ) | | | — | |
Service Class | | | — | | | | — | | | | (601,917 | ) | | | — | |
| | | | | | | | | | | | | | | | |
Total distributions declared to shareholders | | $ | (2,644,036 | ) | | $ | (3,963,460 | ) | | $ | (732,969 | ) | | $ | — | |
| | | | | | | | | | | | | | | | |
Change in net assets from fund share transactions | | $ | (80,293,145 | ) | | $ | (6,013,847 | ) | | $ | (929,353 | ) | | $ | (1,190,146 | ) |
| | | | | | | | | | | | | | | | |
Total change in net assets | | $ | (42,023,689 | ) | | $ | (7,558,530 | ) | | $ | (1,781,192 | ) | | $ | 2,777,565 | |
Net assets | | | | | | | | | | | | | | | | |
At beginning of period | | | 339,072,676 | | | | 76,372,213 | | | | 9,100,090 | | | | 21,961,294 | |
| | | | | | | | | | | | | | | | |
At end of period | | $ | 297,048,987 | | | $ | 68,813,683 | | | $ | 7,318,898 | | | $ | 24,738,859 | |
| | | | | | | | | | | | | | | | |
Undistributed net investment income included in net assets at end of period | | $ | 1,468,436 | | | $ | 4,144,912 | | | $ | 44,796 | | | $ | — | |
| | | | | | | | | | | | | | | | |
See notes to financial statements.
67
MFS Variable Insurance Trust II
Statements of Changes in Net Assets — Year Ended December 31, 2006
| | | | | | | | | | | | | | | | |
| | | MFS Capital
Appreciation
Portfolio | | | MFS Emerging
Growth
Portfolio | | | MFS Global
Governments
Portfolio | | | MFS Massachusetts
Investors
Growth Stock
Portfolio | |
Change in net assets | | | | | | | | | | | | | | | | |
From operations | | | | | | | | | | | | | | | | |
Net investment income (loss) | | $ | 985,293 | | | $ | (530,887 | ) | | $ | 1,500,304 | | | $ | 1,307,480 | |
Net realized gain (loss) on investments and foreign currency transactions | | | 16,660,358 | | | | 50,921,998 | | | | (623,540 | ) | | | 17,619,987 | |
Net unrealized gain (loss) on investments and foreign currency translation | | | 17,356,582 | | | | (25,393,557 | ) | | | 1,388,431 | | | | 12,890,735 | |
| | | | | | | | | | | | | | | | |
Change in net assets from operations | | $ | 35,002,233 | | | $ | 24,997,554 | | | $ | 2,265,195 | | | $ | 31,818,202 | |
| | | | | | | | | | | | | | | | |
Distributions declared to shareholders | | | | | | | | | | | | | | | | |
From net investment income | | | | | | | | | | | | | | | | |
Initial Class | | $ | (1,174,123 | ) | | $ | — | | | $ | — | | | $ | (344,988 | ) |
From net realized gain on investments | | | | | | | | | | | | | | | | |
Initial Class | | | — | | | | — | | | | (417,067 | ) | | | — | |
Service Class | | | — | | | | — | | | | (41,595 | ) | | | — | |
| | | | | | | | | | | | | | | | |
Total distributions declared to shareholders | | $ | (1,174,123 | ) | | $ | — | | | $ | (458,662 | ) | | $ | (344,988 | ) |
| | | | | | | | | | | | | | | | |
Change in net assets from fund share transactions | | $ | (159,725,494 | ) | | $ | (83,175,351 | ) | | $ | (10,817,955 | ) | | $ | (91,490,009 | ) |
| | | | | | | | | | | | | | | | |
Total change in net assets | | $ | (125,897,384 | ) | | $ | (58,177,797 | ) | | $ | (9,011,422 | ) | | $ | (60,016,795 | ) |
Net assets | | | | | | | | | | | | | | | | |
At beginning of period | | | 684,958,679 | | | | 371,680,584 | | | | 52,441,124 | | | | 485,096,231 | |
| | | | | | | | | | | | | | | | |
At end of period | | $ | 559,061,295 | | | $ | 313,502,787 | | | $ | 43,429,702 | | | $ | 425,079,436 | |
| | | | | | | | | | | | | | | | |
Undistributed net investment income included in net assets at end of period | | $ | 976,046 | | | $ | — | | | $ | 762,936 | | | $ | 1,305,004 | |
| | | | | | | | | | | | | | | | |
| | | | |
| | | MFS Mid Cap
Growth
Portfolio | | | MFS Mid Cap
Value
Portfolio | | | MFS Money
Market
Portfolio | | | MFS New
Discovery
Portfolio | |
Change in net assets | | | | | | | | | | | | | | | | |
From operations | | | | | | | | | | | | | | | | |
Net investment income (loss) | | $ | 24,713 | | | $ | 138,408 | | | $ | 17,603,606 | | | $ | (2,336,188 | ) |
Net realized gain (loss) on investments and foreign currency transactions | | | 7,362,311 | | | | 976,731 | | | | (199 | ) | | | 49,366,426 | |
Net unrealized gain (loss) on investments and foreign currency translation | | | (5,571,822 | ) | | | 1,525,854 | | | | — | | | | (5,555,717 | ) |
| | | | | | | | | | | | | | | | |
Change in net assets from operations | | $ | 1,815,202 | | | $ | 2,640,993 | | | $ | 17,603,407 | | | $ | 41,474,521 | |
| | | | | | | | | | | | | | | | |
Distributions declared to shareholders | | | | | | | | | | | | | | | | |
From net investment income | | | | | | | | | | | | | | | | |
Initial Class | | $ | — | | | $ | — | | | $ | (11,590,505 | ) | | $ | — | |
Service Class | | | — | | | | — | | | | (6,013,101 | ) | | | — | |
From net realized gain on investments | | | | | | | | | | | | | | | | |
Initial Class | | | — | | | | (3,796 | ) | | | — | | | | — | |
Service Class | | | — | | | | (3,082,304 | ) | | | — | | | | — | |
| | | | | | | | | | | | | | | | |
Total distributions declared to shareholders | | $ | — | | | $ | (3,086,100 | ) | | $ | (17,603,606 | ) | | $ | — | |
| | | | | | | | | | | | | | | | |
Change in net assets from fund share transactions | | $ | (22,016,463 | ) | | $ | (592,803 | ) | | $ | 81,654,487 | | | $ | (4,319,464 | ) |
| | | | | | | | | | | | | | | | |
Total change in net assets | | $ | (20,201,261 | ) | | $ | (1,037,910 | ) | | $ | 81,654,288 | | | $ | 37,155,057 | |
Net assets | | | | | | | | | | | | | | | | |
At beginning of period | | | 110,349,960 | | | | 26,023,749 | | | | 364,915,669 | | | | 308,137,842 | |
| | | | | | | | | | | | | | | | |
At end of period | | $ | 90,148,699 | | | $ | 24,985,839 | | | $ | 446,569,957 | | | $ | 345,292,899 | |
| | | | | | | | | | | | | | | | |
Undistributed net investment income included in net assets at end of period | | $ | 19,111 | | | $ | 119,989 | | | $ | 1,238 | | | $ | — | |
| | | | | | | | | | | | | | | | |
See notes to financial statements.
68
MFS Variable Insurance Trust II
Statements of Changes in Net Assets — Year Ended December 31, 2006 — continued
| | | | | | | | | | | | | | | | |
| | | MFS
Research
Portfolio | | | MFS Strategic
Income
Portfolio | | | MFS Strategic
Value
Portfolio | | | MFS
Technology
Portfolio | |
Change in net assets | | | | | | | | | | | | | | | | |
From operations | | | | | | | | | | | | | | | | |
Net investment income (loss) | | $ | 2,658,061 | | | $ | 4,178,707 | | | $ | 130,428 | | | $ | (127,519 | ) |
Net realized gain (loss) on investments and foreign currency transactions | | | 30,280,941 | | | | (286,201 | ) | | | 773,612 | | | | 5,581,304 | |
Net unrealized gain (loss) on investments and foreign currency translation | | | 2,220,028 | | | | 1,091,447 | | | | 312,085 | | | | (1,243,876 | ) |
| | | | | | | | | | | | | | | | |
Change in net assets from operations | | $ | 35,159,030 | | | $ | 4,983,953 | | | $ | 1,216,125 | | | $ | 4,209,909 | |
| | | | | | | | | | | | | | | | |
Distributions declared to shareholders | | | | | | | | | | | | | | | | |
From net investment income | | | | | | | | | | | | | | | | |
Initial Class | | $ | (2,194,925 | ) | | $ | (3,408,471 | ) | | $ | (73 | ) | | $ | — | |
Service Class | | | (117,575 | ) | | | (1,238,612 | ) | | | (52,423 | ) | | | — | |
From net realized gain on investments | | | | | | | | | | | | | | | | |
Initial Class | | | — | | | | (620,852 | ) | | | (743 | ) | | | — | |
Service Class | | | — | | | | (236,204 | ) | | | (808,934 | ) | | | — | |
| | | | | | | | | | | | | | | | |
Total distributions declared to shareholders | | $ | (2,312,500 | ) | | $ | (5,504,139 | ) | | $ | (862,173 | ) | | $ | — | |
| | | | | | | | | | | | | | | | |
Change in net assets from fund share transactions | | $ | (88,643,949 | ) | | $ | (5,457,996 | ) | | $ | (1,914,183 | ) | | $ | (4,601,314 | ) |
| | | | | | | | | | | | | | | | |
Total change in net assets | | $ | (55,797,419 | ) | | $ | (5,978,182 | ) | | $ | (1,560,231 | ) | | $ | (391,405 | ) |
Net assets | | | | | | | | | | | | | | | | |
At beginning of period | | | 394,870,095 | | | | 82,350,395 | | | | 10,660,321 | | | | 22,352,699 | |
| | | | | | | | | | | | | | | | |
At end of period | | $ | 339,072,676 | | | $ | 76,372,213 | | | $ | 9,100,090 | | | $ | 21,961,294 | |
| | | | | | | | | | | | | | | | |
Undistributed net investment income included in net assets at end of period | | $ | 2,639,088 | | | $ | 3,761,418 | | | $ | 129,317 | | | $ | — | |
| | | | | | | | | | | | | | | | |
See notes to financial statements.
69
MFS Variable Insurance Trust II
Financial Highlights
The financial highlights table is intended to help you understand the fund’s financial performance for the past 5 years. Certain information reflects financial results for a single fund share. The total returns in the table represent the rate by which an investor would have earned (or lost) on an investment in the fund share class (assuming reinvestment of all distributions) held for the entire period.
| | | | | | | | | | | | | | | | | | | | |
| | | MFS Capital Appreciation Portfolio | |
| | | Years Ended 12/31 | |
| Initial Class Shares | | 2007 | | | 2006 | | | 2005 | | | 2004 | | | 2003 | |
Net asset value, beginning of period | | $ | 20.50 | | | $ | 19.31 | | | $ | 19.25 | | | $ | 17.35 | | | $ | 13.48 | |
| | | | | | | | | | | | | | | | | | | | |
Income (loss) from investment operations | | | | | | | | | | | | | | | | | | | | |
Net investment income (d) | | $ | 0.08 | | | $ | 0.03 | | | $ | 0.03 | | | $ | 0.11 | | | $ | 0.01 | |
Net realized and unrealized gain (loss) on investments and foreign currency | | | 2.20 | | | | 1.20 | | | | 0.14 | | | | 1.80 | | | | 3.86 | |
| | | | | | | | | | | | | | | | | | | | |
Total from investment operations | | $ | 2.28 | | | $ | 1.23 | | | $ | 0.17 | | | $ | 1.91 | | | $ | 3.87 | |
| | | | | | | | | | | | | | | | | | | | |
Less distributions declared to shareholders | | | | | | | | | | | | | | | | | | | | |
From net investment income | | $ | (0.04 | ) | | $ | (0.04 | ) | | $ | (0.11 | ) | | $ | (0.01 | ) | | $ | — | |
| | | | | | | | | | | | | | | | | | | | |
Net asset value, end of period | | $ | 22.74 | | | $ | 20.50 | | | $ | 19.31 | | | $ | 19.25 | | | $ | 17.35 | |
| | | | | | | | | | | | | | | | | | | | |
Total return (%) (k)(s) | | | 11.14 | | | | 6.37 | | | | 0.92 | | | | 11.02 | (b) | | | 28.71 | (j) |
Ratios (%) (to average net assets) and Supplemental data: | | | | | | | | | | | | | | | | | | | | |
Expenses (f) | | | 0.83 | | | | 0.79 | | | | 0.85 | | | | 0.82 | | | | 0.82 | |
Net investment income | | | 0.36 | | | | 0.18 | | | | 0.18 | | | | 0.62 | | | | 0.07 | |
Portfolio turnover (%) | | | 61 | | | | 60 | | | | 153 | | | | 64 | | | | 100 | |
Net assets at end of period (000 Omitted) | | $ | 456,006 | | | $ | 528,522 | | | $ | 649,588 | | | $ | 672,246 | | | $ | 722,980 | |
| |
| | | MFS Capital Appreciation Portfolio | |
| | | Years Ended 12/31 | |
| Service Class Shares | | 2007 | | | 2006 | | | 2005 | | | 2004 | | | 2003 | |
Net asset value, beginning of period | | $ | 20.32 | | | $ | 19.16 | | | $ | 19.11 | | | $ | 17.25 | | | $ | 13.44 | |
| | | | | | | | | | | | | | | | | | | | |
Income (loss) from investment operations | | | | | | | | | | | | | | | | | | | | |
Net investment income (loss) (d) | | $ | 0.02 | | | $ | (0.01 | ) | | $ | (0.01 | ) | | $ | 0.07 | | | $ | (0.03 | ) |
Net realized and unrealized gain (loss) on investments and foreign currency | | | 2.20 | | | | 1.17 | | | | 0.13 | | | | 1.79 | | | | 3.84 | |
| | | | | | | | | | | | | | | | | | | | |
Total from investment operations | | $ | 2.22 | | | $ | 1.16 | | | $ | 0.12 | | | $ | 1.86 | | | $ | 3.81 | |
| | | | | | | | | | | | | | | | | | | | |
Less distributions declared to shareholders | | | | | | | | | | | | | | | | | | | | |
From net investment income | | $ | — | | | $ | — | | | $ | (0.07 | ) | | $ | — | | | $ | — | |
| | | | | | | | | | | | | | | | | | | | |
Net asset value, end of period | | $ | 22.54 | | | $ | 20.32 | | | $ | 19.16 | | | $ | 19.11 | | | $ | 17.25 | |
| | | | | | | | | | | | | | | | | | | | |
Total return (%) (k)(s) | | | 10.93 | | | | 6.05 | | | | 0.63 | | | | 10.78 | (b) | | | 28.35 | (j) |
Ratios (%) (to average net assets) and Supplemental data: | | | | | | | | | | | | | | | | | | | | |
Expenses (f) | | | 1.08 | | | | 1.04 | | | | 1.10 | | | | 1.07 | | | | 1.07 | |
Net investment income (loss) | | | 0.11 | | | | (0.07 | ) | | | (0.07 | ) | | | 0.40 | | | | (0.18 | ) |
Portfolio turnover (%) | | | 61 | | | | 60 | | | | 153 | | | | 64 | | | | 100 | |
Net assets at end of period (000 Omitted) | | $ | 27,554 | | | $ | 30,540 | | | $ | 35,371 | | | $ | 35,997 | | | $ | 32,177 | |
| (b) | The fund’s net asset value and total return calculation include a non-recurring accrual recorded as a result of an administrative proceeding regarding disclosure of brokerage allocation practices in connection with fund sales. The non-recurring accrual resulted in an increase in the net asset value of $0.02 per share based on shares outstanding on the day the proceeds were recorded. Excluding the effect of this accrual from the ending net asset value per share, the Initial and Service Class total returns for the year ended December 31, 2004 would have been lower by approximately 0.11%. |
| (d) | Per share data are based on average shares outstanding. |
| (f) | Ratios do not reflect reductions from fees paid indirectly, if applicable. |
| (j) | The fund’s net asset value and total return calculation include proceeds received on March 26, 2003 for the partial payment of a non-recurring litigation settlement from Cendant Corporation, recorded as a realized gain on investment transactions. The proceeds resulted in an increase in the net asset value of $0.28 per share based on shares outstanding on the day the proceeds were received. Excluding the effect of this payment from the ending net asset value per share, the Initial Class and Service Class total returns for the year ended December 31, 2003 would have been lower by approximately 2.08% and 2.09%, respectively. |
| (k) | The total return does not reflect expenses that apply to separate accounts. Inclusion of these charges would reduce the total return figures for all periods shown. |
| (s) | From time to time the fund may receive proceeds from litigation settlements, without which performance would be lower. |
See notes to financial statements.
70
MFS Variable Insurance Trust II
Financial Highlights — continued
The financial highlights table is intended to help you understand the fund’s financial performance for the past 5 years. Certain information reflects financial results for a single fund share. The total returns in the table represent the rate by which an investor would have earned (or lost) on an investment in the fund share class (assuming reinvestment of all distributions) held for the entire period.
| | | | | | | | | | | | | | | | | | | | |
| | | MFS Emerging Growth Portfolio | |
| | | Years Ended 12/31 | |
| Initial Class Shares | | 2007 | | | 2006 | | | 2005 | | | 2004 | | | 2003 | |
Net asset value, beginning of period | | $ | 18.45 | | | $ | 17.08 | | | $ | 15.65 | | | $ | 13.82 | | | $ | 10.51 | |
| | | | | | | | | | | | | | | | | | | | |
Income (loss) from investment operations | | | | | | | | | | | | | | | | | | | | |
Net investment income (loss) (d) | | $ | 0.04 | | | $ | (0.02 | ) | | $ | (0.04 | ) | | $ | (0.02 | ) | | $ | (0.02 | ) |
Net realized and unrealized gain (loss) on investments and foreign currency | | | 3.88 | | | | 1.39 | | | | 1.47 | | | | 1.85 | | | | 3.33 | |
| | | | | | | | | | | | | | | | | | | | |
Total from investment operations | | $ | 3.92 | | | $ | 1.37 | | | $ | 1.43 | | | $ | 1.83 | | | $ | 3.31 | |
| | | | | | | | | | | | | | | | | | | | |
Net asset value, end of period | | $ | 22.37 | | | $ | 18.45 | | | $ | 17.08 | | | $ | 15.65 | | | $ | 13.82 | |
| | | | | | | | | | | | | | | | | | | | |
Total return (%) (k)(s) | | | 21.25 | | | | 8.02 | | | | 9.14 | | | | 13.24 | (b) | | | 31.49 | (j) |
Ratios (%) (to average net assets) and Supplemental data: | | | | | | | | | | | | | | | | | | | | |
Expenses (f) | | | 0.84 | | | | 0.83 | | | | 0.84 | | | | 0.80 | | | | 0.81 | |
Net investment income (loss) | | | 0.19 | | | | (0.14 | ) | | | (0.26 | ) | | | (0.13 | ) | | | (0.17 | ) |
Portfolio turnover (%) | | | 76 | | | | 123 | | | | 88 | | | | 94 | | | | 100 | |
Net assets at end of period (000 Omitted) | | $ | 264,089 | | | $ | 291,965 | | | $ | 350,083 | | | $ | 414,811 | | | $ | 450,707 | |
| |
| | | MFS Emerging Growth Portfolio | |
| | | Years Ended 12/31 | |
| Service Class Shares | | 2007 | | | 2006 | | | 2005 | | | 2004 | | | 2003 | |
Net asset value, beginning of period | | $ | 18.19 | | | $ | 16.89 | | | $ | 15.51 | | | $ | 13.73 | | | $ | 10.47 | |
| | | | | | | | | | | | | | | | | | | | |
Income (loss) from investment operations | | | | | | | | | | | | | | | | | | | | |
Net investment loss (d) | | $ | (0.01 | ) | | $ | (0.07 | ) | | $ | (0.08 | ) | | $ | (0.05 | ) | | $ | (0.05 | ) |
Net realized and unrealized gain (loss) on investments and foreign currency | | | 3.83 | | | | 1.37 | | | | 1.46 | | | | 1.83 | | | | 3.31 | |
| | | | | | | | | | | | | | | | | | | | |
Total from investment operations | | $ | 3.82 | | | $ | 1.30 | | | $ | 1.38 | | | $ | 1.78 | | | $ | 3.26 | |
| | | | | | | | | | | | | | | | | | | | |
Net asset value, end of period | | $ | 22.01 | | | $ | 18.19 | | | $ | 16.89 | | | $ | 15.51 | | | $ | 13.73 | |
| | | | | | | | | | | | | | | | | | | | |
Total return (%) (k)(s) | | | 21.00 | | | | 7.70 | | | | 8.90 | | | | 12.96 | (b) | | | 31.14 | (j) |
Ratios (%) (to average net assets) and Supplemental data: | | | | | | | | | | | | | | | | | | | | |
Expenses (f) | | | 1.09 | | | | 1.08 | | | | 1.09 | | | | 1.06 | | | | 1.06 | |
Net investment loss | | | (0.06 | ) | | | (0.38 | ) | | | (0.51 | ) | | | (0.36 | ) | | | (0.42 | ) |
Portfolio turnover (%) | | | 76 | | | | 123 | | | | 88 | | | | 94 | | | | 100 | |
Net assets at end of period (000 Omitted) | | $ | 23,773 | | | $ | 21,538 | | | $ | 21,597 | | | $ | 22,139 | | | $ | 18,147 | |
| (b) | The fund’s net asset value and total return calculation include a non-recurring accrual recorded as a result of an administrative proceeding regarding disclosure of brokerage allocation practices in connection with fund sales. The non-recurring accrual resulted in an increase in the net asset value of $0.01 per share based on shares outstanding on the day the proceeds were recorded. |
| (d) | Per share data are based on average shares outstanding. |
| (f) | Ratios do not reflect reductions from fees paid indirectly, if applicable. |
| (j) | The fund’s net asset value and total return calculation include proceeds received on March 26, 2003 for the partial payment of a non-recurring litigation settlement from Cendant Corporation, recorded as a realized gain on investment transactions. The proceeds resulted in an increase in the net asset value of $0.16 per share based on shares outstanding on the day the proceeds were received. Excluding the effect of this payment from the ending net asset value per share, the Initial Class and Service Class total returns for the year ended December 31, 2003 would have been lower by approximately 1.48% and 1.50%, respectively. |
| (k) | The total return does not reflect expenses that apply to separate accounts. Inclusion of these charges would reduce the total return figures for all periods shown. |
| (s) | From time to time the fund may receive proceeds from litigation settlements, without which performance would be lower. |
See notes to financial statements.
71
MFS Variable Insurance Trust II
Financial Highlights — continued
The financial highlights table is intended to help you understand the fund’s financial performance for the past 5 years. Certain information reflects financial results for a single fund share. The total returns in the table represent the rate by which an investor would have earned (or lost) on an investment in the fund share class (assuming reinvestment of all distributions) held for the entire period.
| | | | | | | | | | | | | | | | | | | | |
| | | MFS Global Governments Portfolio | |
| | | Years Ended 12/31 | |
| Initial Class Shares | | 2007 | | | 2006 | | | 2005 | | | 2004 | | | 2003 | |
Net asset value, beginning of period | | $ | 10.70 | | | $ | 10.29 | | | $ | 12.40 | | | $ | 12.92 | | | $ | 11.75 | |
| | | | | | | | | | | | | | | | | | | | |
Income (loss) from investment operations | | | | | | | | | | | | | | | | | | | | |
Net investment income (d) | | $ | 0.36 | | | $ | 0.34 | | | $ | 0.29 | | | $ | 0.30 | | | $ | 0.34 | |
Net realized and unrealized gain (loss) on investments and foreign currency | | | 0.58 | | | | 0.17 | | | | (1.10 | ) | | | 0.76 | | | | 1.45 | |
| | | | | | | | | | | | | | | | | | | | |
Total from investment operations | | $ | 0.94 | | | $ | 0.51 | | | $ | (0.81 | ) | | $ | 1.06 | | | $ | 1.79 | |
| | | | | | | | | | | | | | | | | | | | |
Less distributions declared to shareholders | | | | | | | | | | | | | | | | | | | | |
From net investment income | | $ | (0.21 | ) | | $ | — | | | $ | (1.23 | ) | | $ | (1.58 | ) | | $ | (0.62 | ) |
From net realized gain on investments | | | — | | | | (0.10 | ) | | | (0.07 | ) | | | — | | | | — | |
| | | | | | | | | | | | | | | | | | | | |
Total distributions declared to shareholders | | $ | (0.21 | ) | | $ | (0.10 | ) | | $ | (1.30 | ) | | $ | (1.58 | ) | | $ | (0.62 | ) |
| | | | | | | | | | | | | | | | | | | | |
Net asset value, end of period | | $ | 11.43 | | | $ | 10.70 | | | $ | 10.29 | | | $ | 12.40 | | | $ | 12.92 | |
| | | | | | | | | | | | | | | | | | | | |
Total return (%) (k)(r)(s) | | | 8.99 | | | | 4.97 | | | | (7.20 | ) | | | 10.06 | | | | 15.60 | |
Ratios (%) (to average net assets) and Supplemental data: | | | | | | | | | | | | | | | | | | | | |
Expenses before expense reductions (f) | | | 1.08 | | | | 1.13 | | | | 1.03 | | | | 0.98 | | | | 0.95 | |
Expenses after expense reductions (f) | | | 1.00 | | | | 1.00 | | | | 1.00 | | | | N/A | | | | N/A | |
Net investment income | | | 3.33 | | | | 3.21 | | | | 2.64 | | | | 2.48 | | | | 2.75 | |
Portfolio turnover (%) | | | 134 | | | | 122 | | | | 137 | | | | 124 | | | | 143 | |
Net assets at end of period (000 Omitted) | | $ | 36,559 | | | $ | 39,637 | | | $ | 48,203 | | | $ | 62,107 | | | $ | 67,472 | |
| |
| | | MFS Global Governments Portfolio | |
| | | Years Ended 12/31 | |
| Service Class Shares | | 2007 | | | 2006 | | | 2005 | | | 2004 | | | 2003 | |
Net asset value, beginning of period | | $ | 10.60 | | | $ | 10.22 | | | $ | 12.33 | | | $ | 12.85 | | | $ | 11.71 | |
| | | | | | | | | | | | | | | | | | | | |
Income (loss) from investment operations | | | | | | | | | | | | | | | | | | | | |
Net investment income (d) | | $ | 0.33 | | | $ | 0.31 | | | $ | 0.27 | | | $ | 0.27 | | | $ | 0.30 | |
Net realized and unrealized gain (loss) on investments and foreign currency | | | 0.58 | | | | 0.17 | | | | (1.11 | ) | | | 0.75 | | | | 1.45 | |
| | | | | | | | | | | | | | | | | | | | |
Total from investment operations | | $ | 0.91 | | | $ | 0.48 | | | $ | (0.84 | ) | | $ | 1.02 | | | $ | 1.75 | |
| | | | | | | | | | | | | | | | | | | | |
Less distributions declared to shareholders | | | | | | | | | | | | | | | | | | | | |
From net investment income | | $ | (0.19 | ) | | $ | — | | | $ | (1.20 | ) | | $ | (1.54 | ) | | $ | (0.61 | ) |
From net realized gain on investments | | | — | | | | (0.10 | ) | | | (0.07 | ) | | | — | | | | — | |
| | | | | | | | | | | | | | | | | | | | |
Total distributions declared to shareholders | | $ | (0.19 | ) | | $ | (0.10 | ) | | $ | (1.27 | ) | | $ | (1.54 | ) | | $ | (0.61 | ) |
| | | | | | | | | | | | | | | | | | | | |
Net asset value, end of period | | $ | 11.32 | | | $ | 10.60 | | | $ | 10.22 | | | $ | 12.33 | | | $ | 12.85 | |
| | | | | | | | | | | | | | | | | | | | |
Total return (%) (k)(r)(s) | | | 8.67 | | | | 4.70 | | | | (7.49 | ) | | | 9.80 | | | | 15.30 | |
Ratios (%) (to average net assets) and Supplemental data: | | | | | | | | | | | | | | | | | | | | |
Expenses before expense reductions (f) | | | 1.33 | | | | 1.38 | | | | 1.28 | | | | 1.23 | | | | 1.20 | |
Expenses after expense reductions (f) | | | 1.25 | | | | 1.25 | | | | 1.25 | | | | N/A | | | | N/A | |
Net investment income | | | 3.08 | | | | 2.96 | | | | 2.39 | | | | 2.23 | | | | 2.50 | |
Portfolio turnover (%) | | | 134 | | | | 122 | | | | 137 | | | | 124 | | | | 143 | |
Net assets at end of period (000 Omitted) | | $ | 4,063 | | | $ | 3,793 | | | $ | 4,238 | | | $ | 4,832 | | | $ | 5,355 | |
| (d) | Per share data are based on average shares outstanding. |
| (f) | Ratios do not reflect reductions from fees paid indirectly, if applicable. |
| (k) | The total return does not reflect expenses that apply to separate accounts. Inclusion of these charges would reduce the total return figures for all periods shown. |
| (r) | Certain expenses have been reduced without which performance would have been lower. |
| (s) | From time to time the fund may receive proceeds from litigation settlements, without which performance would be lower. |
See notes to financial statements.
72
MFS Variable Insurance Trust II
Financial Highlights — continued
The financial highlights table is intended to help you understand the fund’s financial performance for the past 5 years. Certain information reflects financial results for a single fund share. The total returns in the table represent the rate by which an investor would have earned (or lost) on an investment in the fund share class (assuming reinvestment of all distributions) held for the entire period.
| | | | | | | | | | | | | | | | | | | | |
| | | MFS Massachusetts Investors Growth Stock Portfolio | |
| | | Years Ended 12/31 | |
| Initial Class Shares | | 2007 | | | 2006 | | | 2005 | | | 2004 | | | 2003 | |
Net asset value, beginning of period | | $ | 10.52 | | | $ | 9.78 | | | $ | 9.42 | | | $ | 8.60 | | | $ | 6.97 | |
| | | | | | | | | | | | | | | | | | | | |
Income (loss) from investment operations | | | | | | | | | | | | | | | | | | | | |
Net investment income (d) | | $ | 0.05 | | | $ | 0.03 | | | $ | 0.01 | | | $ | 0.04 | | | $ | 0.01 | |
Net realized and unrealized gain (loss) on investments and foreign currency | | | 1.16 | | | | 0.72 | | | | 0.40 | | | | 0.79 | | | | 1.62 | |
| | | | | | | | | | | | | | | | | | | | |
Total from investment operations | | $ | 1.21 | | | $ | 0.75 | | | $ | 0.41 | | | $ | 0.83 | | | $ | 1.63 | |
| | | | | | | | | | | | | | | | | | | | |
Less distributions declared to shareholders | | | | | | | | | | | | | | | | | | | | |
From net investment income | | $ | (0.04 | ) | | $ | (0.01 | ) | | $ | (0.05 | ) | | $ | (0.01 | ) | | $ | — | |
| | | | | | | | | | | | | | | | | | | | |
Net asset value, end of period | | $ | 11.69 | | | $ | 10.52 | | | $ | 9.78 | | | $ | 9.42 | | | $ | 8.60 | |
| | | | | | | | | | | | | | | | | | | | |
Total return (%) (k)(r)(s) | | | 11.53 | | | | 7.67 | | | | 4.37 | | | | 9.61 | (b) | | | 23.39 | |
Ratios (%) (to average net assets) and Supplemental data: | | | | | | | | | | | | | | | | | | | | |
Expenses before expense reductions (f) | | | 0.84 | | | | 0.82 | | | | 0.85 | | | | 0.83 | | | | 0.83 | |
Expenses after expense reductions (f) | | | 0.83 | | | | N/A | | | | N/A | | | | N/A | | | | N/A | |
Net investment income | | | 0.48 | | | | 0.34 | | | | 0.12 | | | | 0.47 | | | | 0.09 | |
Portfolio turnover (%) | | | 62 | | | | 72 | | | | 136 | | | | 139 | | | | 265 | |
Net assets at end of period (000 Omitted) | | $ | 309,208 | | | $ | 336,383 | | | $ | 395,782 | | | $ | 468,181 | | | $ | 504,123 | |
| |
| | | MFS Massachusetts Investors Growth Stock Portfolio | |
| | | Years Ended 12/31 | |
| Service Class Shares | | 2007 | | | 2006 | | | 2005 | | | 2004 | | | 2003 | |
Net asset value, beginning of period | | $ | 10.43 | | | $ | 9.71 | | | $ | 9.35 | | | $ | 8.55 | | | $ | 6.96 | |
| | | | | | | | | | | | | | | | | | | | |
Income (loss) from investment operations | | | | | | | | | | | | | | | | | | | | |
Net investment income (loss) (d) | | $ | 0.02 | | | $ | 0.01 | | | $ | (0.01 | ) | | $ | 0.02 | | | $ | (0.01 | ) |
Net realized and unrealized gain (loss) on investments and foreign currency | | | 1.15 | | | | 0.71 | | | | 0.40 | | | | 0.78 | | | | 1.60 | |
| | | | | | | | | | | | | | | | | | | | |
Total from investment operations | | $ | 1.17 | | | $ | 0.72 | | | $ | 0.39 | | | $ | 0.80 | | | $ | 1.59 | |
| | | | | | | | | | | | | | | | | | | | |
Less distributions declared to shareholders | | | | | | | | | | | | | | | | | | | | |
From net investment income | | $ | (0.01 | ) | | $ | — | | | $ | (0.03 | ) | | $ | — | | | $ | — | |
| | | | | | | | | | | | | | | | | | | | |
Net asset value, end of period | | $ | 11.59 | | | $ | 10.43 | | | $ | 9.71 | | | $ | 9.35 | | | $ | 8.55 | |
| | | | | | | | | | | | | | | | | | | | |
Total return (%) (k)(r)(s) | | | 11.26 | | | | 7.42 | | | | 4.15 | | | | 9.36 | (b) | | | 22.84 | |
Ratios (%) (to average net assets) and Supplemental data: | | | | | | | | | | | | | | | | | | | | |
Expenses before expense reductions (f) | | | 1.09 | | | | 1.07 | | | | 1.10 | | | | 1.08 | | | | 1.08 | |
Expenses after expense reductions (f) | | | 1.08 | | | | N/A | | | | N/A | | | | N/A | | | | N/A | |
Net investment income (loss) | | | 0.19 | | | | 0.09 | | | | (0.13 | ) | | | 0.25 | | | | (0.16 | ) |
Portfolio turnover (%) | | | 62 | | | | 72 | | | | 136 | | | | 139 | | | | 265 | |
Net assets at end of period (000 Omitted) | | $ | 119,324 | | | $ | 88,696 | | | $ | 89,314 | | | $ | 87,243 | | | $ | 73,697 | |
| (b) | The fund’s net asset value and total return calculation include a non-recurring accrual recorded as a result of an administrative proceeding regarding disclosure of brokerage allocation practices in connection with fund sales. The non-recurring accrual resulted in an increase in the net asset value of $0.01 per share based on shares outstanding on the day the proceeds were recorded. Excluding the effect of this accrual from the ending net asset value per share, the Initial Class and Service Class total returns for the year ended December 31, 2004 would have been lower by 0.13%. |
| (d) | Per share data are based on average shares outstanding. |
| (f) | Ratios do not reflect reductions from fees paid indirectly, if applicable. |
| (k) | The total return does not reflect expenses that apply to separate accounts. Inclusion of these charges would reduce the total return figures for all periods shown. |
| (r) | Certain expenses have been reduced without which performance would have been lower. |
| (s) | From time to time the fund may receive proceeds from litigation settlements, without which performance would be lower. |
See notes to financial statements.
73
MFS Variable Insurance Trust II
Financial Highlights — continued
The financial highlights table is intended to help you understand the fund’s financial performance for the past 5 years. Certain information reflects financial results for a single fund share. The total returns in the table represent the rate by which an investor would have earned (or lost) on an investment in the fund share class (assuming reinvestment of all distributions) held for the entire period.
| | | | | | | | | | | | | | | | | | | | |
| | | MFS Mid Cap Growth Portfolio | |
| | | Years Ended 12/31 | |
| Initial Class Shares | | 2007 | | | 2006 | | | 2005 | | | 2004 | | | 2003 | |
Net asset value, beginning of period | | $ | 6.12 | | | $ | 5.98 | | | $ | 5.80 | | | $ | 5.06 | | | $ | 3.67 | |
| | | | | | | | | | | | | | | | | | | | |
Income (loss) from investment operations | | | | | | | | | | | | | | | | | | | | |
Net investment income (loss) (d) | | $ | (0.01 | ) | | $ | 0.01 | | | $ | (0.02 | ) | | $ | (0.03 | ) | | $ | (0.02 | ) |
Net realized and unrealized gain (loss) on investments and foreign currency | | | 0.61 | | | | 0.13 | | | | 0.20 | | | | 0.77 | | | | 1.41 | |
| | | | | | | | | | | | | | | | | | | | |
Total from investment operations | | $ | 0.60 | | | $ | 0.14 | | | $ | 0.18 | | | $ | 0.74 | | | $ | 1.39 | |
| | | | | | | | | | | | | | | | | | | | |
Less distributions declared to shareholders | | | | | | | | | | | | | | | | | | | | |
From net investment income | | $ | (0.00 | )(w) | | $ | — | | | $ | — | | | $ | — | | | $ | — | |
| | | | | | | | | | | | | | | | | | | | |
Net asset value, end of period | | $ | 6.72 | | | $ | 6.12 | | | $ | 5.98 | | | $ | 5.80 | | | $ | 5.06 | |
| | | | | | | | | | | | | | | | | | | | |
Total return (%) (k)(r)(s) | | | 9.84 | | | | 2.34 | | | | 3.10 | | | | 14.62 | | | | 37.87 | |
Ratios (%) (to average net assets) and Supplemental data: | | | | | | | | | | | | | | | | | | | | |
Expenses before expense reductions (f) | | | 0.88 | | | | 0.93 | | | | 0.89 | | | | 0.85 | | | | 0.90 | |
Expenses after expense reductions (f) | | | 0.88 | | | | 0.91 | | | | N/A | | | | N/A | | | | N/A | |
Net investment income (loss) | | | (0.12 | ) | | | 0.11 | | | | (0.40 | ) | | | (0.56 | ) | | | (0.46 | ) |
Portfolio turnover (%) | | | 80 | | | | 139 | | | | 81 | | | | 84 | | | | 90 | |
Net assets at end of period (000 Omitted) | | $ | 44,944 | | | $ | 53,504 | | | $ | 68,637 | | | $ | 83,899 | | | $ | 76,159 | |
| |
| | | MFS Mid Cap Growth Portfolio | |
| | | Years Ended 12/31 | |
| Service Class Shares | | 2007 | | | 2006 | | | 2005 | | | 2004 | | | 2003 | |
Net asset value, beginning of period | | $ | 6.05 | | | $ | 5.92 | | | $ | 5.76 | | | $ | 5.04 | | | $ | 3.67 | |
| | | | | | | | | | | | | | | | | | | | |
Income (loss) from investment operations | | | | | | | | | | | | | | | | | | | | |
Net investment loss (d) | | $ | (0.02 | ) | | $ | (0.01 | ) | | $ | (0.04 | ) | | $ | (0.04 | ) | | $ | (0.03 | ) |
Net realized and unrealized gain (loss) on investments and foreign currency | | | 0.60 | | | | 0.14 | | | | 0.20 | | | | 0.76 | | | | 1.40 | |
| | | | | | | | | | | | | | | | | | | | |
Total from investment operations | | $ | 0.58 | | | $ | 0.13 | | | $ | 0.16 | | | $ | 0.72 | | | $ | 1.37 | |
| | | | | | | | | | | | | | | | | | | | |
Net asset value, end of period | | $ | 6.63 | | | $ | 6.05 | | | $ | 5.92 | | | $ | 5.76 | | | $ | 5.04 | |
| | | | | | | | | | | | | | | | | | | | |
Total return (%) (k)(r)(s) | | | 9.59 | | | | 2.20 | | | | 2.78 | | | | 14.29 | | | | 37.33 | |
Ratios (%) (to average net assets) and Supplemental data: | | | | | | | | | | | | | | | | | | | | |
Expenses before expense reductions (f) | | | 1.13 | | | | 1.18 | | | | 1.15 | | | | 1.10 | | | | 1.15 | |
Expenses after expense reductions (f) | | | 1.13 | | | | 1.16 | | | | N/A | | | | N/A | | | | N/A | |
Net investment loss | | | (0.37 | ) | | | (0.11 | ) | | | (0.65 | ) | | | (0.81 | ) | | | (0.72 | ) |
Portfolio turnover (%) | | | 80 | | | | 139 | | | | 81 | | | | 84 | | | | 90 | |
Net assets at end of period (000 Omitted) | | $ | 32,919 | | | $ | 36,645 | | | $ | 41,713 | | | $ | 45,443 | | | $ | 37,081 | |
| (d) | Per share data are based on average shares outstanding. |
| (f) | Ratios do not reflect reductions from fees paid indirectly, if applicable. |
| (k) | The total return does not reflect expenses that apply to separate accounts. Inclusion of these charges would reduce the total return figures for all periods shown. |
| (r) | Certain expenses have been reduced without which performance would have been lower. |
| (s) | From time to time the fund may receive proceeds from litigation settlements, without which performance would be lower. |
| (w) | Per share amount was less than $0.01. |
See notes to financial statements.
74
MFS Variable Insurance Trust II
Financial Highlights — continued
The financial highlights table is intended to help you understand the fund’s financial performance for the past 5 years. Certain information reflects financial results for a single fund share. The total returns in the table represent the rate by which an investor would have earned (or lost) on an investment in the fund share class (assuming reinvestment of all distributions) held for the entire period.
| | | | | | | | | | | | | | | | | | | | |
| | | MFS Mid Cap Value Portfolio | |
| | | Years Ended 12/31 | |
| Initial Class Shares | | 2007 | | | 2006 | | | 2005 | | | 2004 | | | 2003 | |
Net asset value, beginning of period | | $ | 11.54 | | | $ | 11.73 | | | $ | 12.46 | | | $ | 10.46 | | | $ | 7.92 | |
| | | | | | | | | | | | | | | | | | | | |
Income (loss) from investment operations | | | | | | | | | | | | | | | | | | | | |
Net investment income (d) | | $ | 0.12 | | | $ | 0.09 | | | $ | 0.04 | | | $ | 0.01 | | | $ | 0.02 | |
Net realized and unrealized gain (loss) on investments and foreign currency | | | 0.14 | | | | 1.16 | | | | 0.70 | | | | 2.25 | | | | 2.53 | |
| | | | | | | | | | | | | | | | | | | | |
Total from investment operations | | $ | 0.26 | | | $ | 1.25 | | | $ | 0.74 | | | $ | 2.26 | | | $ | 2.55 | |
| | | | | | | | | | | | | | | | | | | | |
Less distributions declared to shareholders | | | | | | | | | | | | | | | | | | | | |
From net investment income | | $ | (0.09 | ) | | $ | — | | | $ | — | | | $ | (0.01 | ) | | $ | (0.01 | ) |
From net realized gain on investments | | | (0.46 | ) | | | (1.44 | ) | | | (1.47 | ) | | | (0.25 | ) | | | — | |
| | | | | | | | | | | | | | | | | | | | |
Total distributions declared to shareholders | | $ | (0.55 | ) | | $ | (1.44 | ) | | $ | (1.47 | ) | | $ | (0.26 | ) | | $ | (0.01 | ) |
| | | | | | | | | | | | | | | | | | | | |
Net asset value, end of period | | $ | 11.25 | | | $ | 11.54 | | | $ | 11.73 | | | $ | 12.46 | | | $ | 10.46 | |
| | | | | | | | | | | | | | | | | | | | |
Total return (%) (k)(r)(s) | | | 1.84 | | | | 11.30 | | | | 7.63 | | | | 22.10 | | | | 32.24 | |
Ratios (%) (to average net assets) and Supplemental data: | | | | | | | | | | | | | | | | | | | | |
Expenses before expense reductions (f) | | | 1.13 | | | | 1.10 | | | | 1.11 | | | | 1.10 | | | | 1.81 | |
Expenses after expense reductions (f) | | | 1.00 | | | | 1.00 | | | | 1.00 | | | | 1.00 | | | | 0.99 | |
Net investment income | | | 0.98 | | | | 0.81 | �� | | | 0.31 | | | | 0.10 | | | | 0.26 | |
Portfolio turnover (%) | | | 63 | | | | 110 | | | | 142 | | | | 147 | | | | 109 | |
Net assets at end of period (000 Omitted) | | $ | 35 | | | $ | 34 | | | $ | 31 | | | $ | 29 | | | $ | 24 | |
| |
| | | MFS Mid Cap Value Portfolio | |
| | | Years Ended 12/31 | |
| Service Class Shares | | 2007 | | | 2006 | | | 2005 | | | 2004 | | | 2003 | |
Net asset value, beginning of period | | $ | 11.43 | | | $ | 11.66 | | | $ | 12.42 | | | $ | 10.44 | | | $ | 7.93 | |
| | | | | | | | | | | | | | | | | | | | |
Income (loss) from investment operations | | | | | | | | | | | | | | | | | | | | |
Net investment income (loss) (d) | | $ | 0.09 | | | $ | 0.06 | | | $ | 0.01 | | | $ | (0.02 | ) | | $ | 0.00 | (w) |
Net realized and unrealized gain (loss) on investments and foreign currency | | | 0.14 | | | | 1.15 | | | | 0.70 | | | | 2.25 | | | | 2.52 | |
| | | | | | | | | | | | | | | | | | | | |
Total from investment operations | | $ | 0.23 | | | $ | 1.21 | | | $ | 0.71 | | | $ | 2.23 | | | $ | 2.52 | |
| | | | | | | | | | | | | | | | | | | | |
Less distributions declared to shareholders | | | | | | | | | | | | | | | | | | | | |
From net investment income | | $ | (0.06 | ) | | $ | — | | | $ | — | | | $ | (0.00 | )(w) | | $ | (0.01 | ) |
From net realized gain on investments | | | (0.46 | ) | | | (1.44 | ) | | | (1.47 | ) | | | (0.25 | ) | | | — | |
| | | | | | | | | | | | | | | | | | | | |
Total distributions declared to shareholders | | $ | (0.52 | ) | | $ | (1.44 | ) | | $ | (1.47 | ) | | $ | (0.25 | ) | | $ | (0.01 | ) |
| | | | | | | | | | | | | | | | | | | | |
Net asset value, end of period | | $ | 11.14 | | | $ | 11.43 | | | $ | 11.66 | | | $ | 12.42 | | | $ | 10.44 | |
| | | | | | | | | | | | | | | | | | | | |
Total return (%) (k)(r)(s) | | | 1.61 | | | | 11.01 | | | | 7.40 | | | | 21.75 | | | | 31.90 | |
Ratios (%) (to average net assets) and Supplemental data: | | | | | | | | | | | | | | | | | | | | |
Expenses before expense reductions (f) | | | 1.37 | | | | 1.34 | | | | 1.36 | | | | 1.35 | | | | 2.07 | |
Expenses after expense reductions (f) | | | 1.25 | | | | 1.25 | | | | 1.25 | | | | 1.25 | | | | 1.25 | |
Net investment income (loss) | | | 0.77 | | | | 0.55 | | | | 0.06 | | | | (0.15 | ) | | | 0.04 | |
Portfolio turnover (%) | | | 63 | | | | 110 | | | | 142 | | | | 147 | | | | 109 | |
Net assets at end of period (000 Omitted) | | $ | 22,375 | | | $ | 24,951 | | | $ | 25,993 | | | $ | 24,479 | | | $ | 15,954 | |
| (d) | Per share data are based on average shares outstanding. |
| (f) | Ratios do not reflect reductions from fees paid indirectly, if applicable. |
| (k) | The total return does not reflect expenses that apply to separate accounts. Inclusion of these charges would reduce the total return figures for all periods shown. |
| (r) | Certain expenses have been reduced without which performance would have been lower. |
| (s) | From time to time the fund may receive proceeds from litigation settlements, without which performance would be lower. |
| (w) | Per share amount was less than $0.01. |
See notes to financial statements.
75
MFS Variable Insurance Trust II
Financial Highlights — continued
The financial highlights table is intended to help you understand the fund’s financial performance for the past 5 years. Certain information reflects financial results for a single fund share. The total returns in the table represent the rate by which an investor would have earned (or lost) on an investment in the fund share class (assuming reinvestment of all distributions) held for the entire period.
| | | | | | | | | | | | | | | | | | | | |
| | | MFS Money Market Portfolio | |
| | | Years Ended 12/31 | |
| Initial Class Shares | | 2007 | | | 2006 | | | 2005 | | | 2004 | | | 2003 | |
Net asset value, beginning of period | | $ | 1.00 | | | $ | 1.00 | | | $ | 1.00 | | | $ | 1.00 | | | $ | 1.00 | |
| | | | | | | | | | | | | | | | | | | | |
Income (loss) from investment operations | | | | | | | | | | | | | | | | | | | | |
Net investment income (d) | | $ | 0.05 | | | $ | 0.04 | | | $ | 0.03 | | | $ | 0.01 | | | $ | 0.01 | |
Net realized and unrealized gain (loss) on investments | | | (0.00 | )(w) | | | (0.00 | )(w) | | | (0.00 | )(w) | | | — | | | | — | |
| | | | | | | | | | | | | | | | | | | | |
Total from investment operations | | $ | 0.05 | | | $ | 0.04 | | | $ | 0.03 | | | $ | 0.01 | | | $ | 0.01 | |
| | | | | | | | | | | | | | | | | | | | |
Less distributions declared to shareholders | | | | | | | | | | | | | | | | | | | | |
From net investment income | | $ | (0.05 | ) | | $ | (0.04 | ) | | $ | (0.03 | ) | | $ | (0.01 | ) | | $ | (0.01 | ) |
| | | | | | | | | | | | | | | | | | | | |
Net asset value, end of period | | $ | 1.00 | | | $ | 1.00 | | | $ | 1.00 | | | $ | 1.00 | | | $ | 1.00 | |
| | | | | | | | | | | | | | | | | | | | |
Total return (%) (k)(r) | | | 4.84 | | | | 4.59 | | | | 2.72 | | | | 0.83 | | | | 0.63 | |
Ratios (%) (to average net assets) and Supplemental data: | | | | | | | | | | | | | | | | | | | | |
Expenses before expense reductions (f) | | | 0.55 | | | | 0.59 | | | | 0.60 | | | | 0.58 | | | | 0.57 | |
Expenses after expense reductions (f) | | | N/A | | | | N/A | | | | 0.60 | | | | N/A | | | | N/A | |
Net investment income | | | 4.73 | | | | 4.52 | | | | 2.65 | | | | 0.79 | | | | 0.64 | |
Net assets at end of period (000 Omitted) | | $ | 320,807 | | | $ | 283,055 | | | $ | 241,684 | | | $ | 282,595 | | | $ | 426,154 | |
| |
| | | MFS Money Market Portfolio | |
| | | Years Ended 12/31 | |
| Service Class Shares | | 2007 | | | 2006 | | | 2005 | | | 2004 | | | 2003 | |
Net asset value, beginning of period | | $ | 1.00 | | | $ | 1.00 | | | $ | 1.00 | | | $ | 1.00 | | | $ | 1.00 | |
| | | | | | | | | | | | | | | | | | | | |
Income (loss) from investment operations | | | | | | | | | | | | | | | | | | | | |
Net investment income (d) | | $ | 0.04 | | | $ | 0.04 | | | $ | 0.02 | | | $ | 0.01 | | | $ | 0.00 | (w) |
Net realized and unrealized gain (loss) on investments | | | (0.00 | )(w) | | | (0.00 | )(w) | | | (0.00 | ) (w) | | | — | | | | — | |
| | | | | | | | | | | | | | | | | | | | |
Total from investment operations | | $ | 0.04 | | | $ | 0.04 | | | $ | 0.02 | | | $ | 0.01 | | | $ | 0.00 | (w) |
| | | | | | | | | | | | | | | | | | | | |
Less distributions declared to shareholders | | | | | | | | | | | | | | | | | | | | |
From net investment income | | $ | (0.04 | ) | | $ | (0.04 | ) | | $ | (0.02 | ) | | $ | (0.01 | ) | | $ | (0.00) | (w) |
| | | | | | | | | | | | | | | | | | | | |
Net asset value, end of period | | $ | 1.00 | | | $ | 1.00 | | | $ | 1.00 | | | $ | 1.00 | | | $ | 1.00 | |
| | | | | | | | | | | | | | | | | | | | |
Total return (%) (k)(r) | | | 4.58 | | | | 4.33 | | | | 2.46 | | | | 0.57 | | | | 0.38 | |
Ratios (%) (to average net assets) and Supplemental data: | | | | | | | | | | | | | | | | | | | | |
Expenses before expense reductions (f) | | | 0.80 | | | | 0.84 | | | | 0.85 | | | | 0.82 | | | | 0.82 | |
Expenses after expense reductions (f) | | | N/A | | | | N/A | | | | 0.85 | | | | N/A | | | | N/A | |
Net investment income | | | 4.48 | | | | 4.28 | | | | 2.49 | | | | 0.63 | | | | 0.37 | |
Net assets at end of period (000 Omitted) | | $ | 233,523 | | | $ | 163,515 | | | $ | 123,232 | | | $ | 87,785 | | | $ | 49,380 | |
| (d) | Per share data are based on average shares outstanding. |
| (f) | Ratios do not reflect reductions from fees paid indirectly, if applicable. |
| (k) | The total return does not reflect expenses that apply to separate accounts. Inclusion of these charges would reduce the total return figures for all periods shown. |
| (r) | Certain expenses have been reduced without which performance would have been lower. |
| (w) | Per share amount was less than $0.01. |
See notes to financial statements.
76
MFS Variable Insurance Trust II
Financial Highlights — continued
The financial highlights table is intended to help you understand the fund’s financial performance for the past 5 years. Certain information reflects financial results for a single fund share. The total returns in the table represent the rate by which an investor would have earned (or lost) on an investment in the fund share class (assuming reinvestment of all distributions) held for the entire period.
| | | | | | | | | | | | | | | | | | | | |
| | | MFS New Discovery Portfolio | |
| | | Years Ended 12/31 | |
| Initial Class Shares | | 2007 | | | 2006 | | | 2005 | | | 2004 | | | 2003 | |
Net asset value, beginning of period | | $ | 16.24 | | | $ | 14.35 | | | $ | 13.64 | | | $ | 12.69 | | | $ | 9.38 | |
| | | | | | | | | | | | | | | | | | | | |
Income (loss) from investment operations | | | | | | | | | | | | | | | | | | | | |
Net investment loss (d) | | $ | (0.08 | ) | | $ | (0.09 | ) | | $ | (0.07 | ) | | $ | (0.08 | ) | | $ | (0.06 | ) |
Net realized and unrealized gain (loss) on investments and foreign currency | | | 0.52 | | | | 1.98 | | | | 0.78 | | | | 1.03 | | | | 3.37 | |
| | | | | | | | | | | | | | | | | | | | |
Total from investment operations | | $ | 0.44 | | | $ | 1.89 | | | $ | 0.71 | | | $ | 0.95 | | | $ | 3.31 | |
| | | | | | | | | | | | | | | | | | | | |
Less distributions declared to shareholders | | | | | | | | | | | | | | | | | | | | |
From net realized gain on investments | | $ | (0.44 | ) | | $ | — | | | $ | — | | | $ | — | | | $ | — | |
| | | | | | | | | | | | | | | | | | | | |
Net asset value, end of period | | $ | 16.24 | | | $ | 16.24 | | | $ | 14.35 | | | $ | 13.64 | | | $ | 12.69 | |
| | | | | | | | | | | | | | | | | | | | |
Total return (%) (k)(r)(s) | | | 2.56 | | | | 13.17 | | | | 5.21 | | | | 7.49 | (b) | | | 35.29 | |
Ratios (%) (to average net assets) and Supplemental data: | | | | | | | | | | | | | | | | | | | | |
Expenses before expense reductions (f) | | | 1.00 | | | | 1.00 | | | | 1.00 | | | | 0.99 | | | | 1.00 | |
Expenses after expense reductions (f) | | | 0.95 | | | | 0.98 | | | | N/A | | | | N/A | | | | N/A | |
Net investment loss | | | (0.45 | ) | | | (0.60 | ) | | | (0.56 | ) | | | (0.65 | ) | | | (0.59 | ) |
Portfolio turnover (%) | | | 95 | | | | 107 | | | | 127 | | | | 139 | | | | 100 | |
Net assets at end of period (000 Omitted) | | $ | 130,029 | | | $ | 163,825 | | | $ | 176,958 | | | $ | 209,503 | | | $ | 220,278 | |
| |
| | | MFS New Discovery Portfolio | |
| | | Years Ended 12/31 | |
| Service Class Shares | | 2007 | | | 2006 | | | 2005 | | | 2004 | | | 2003 | |
Net asset value, beginning of period | | $ | 16.02 | | | $ | 14.19 | | | $ | 13.52 | | | $ | 12.61 | | | $ | 9.34 | |
| | | | | | | | | | | | | | | | | | | | |
Income (loss) from investment operations | | | | | | | | | | | | | | | | | | | | |
Net investment loss (d) | | $ | (0.12 | ) | | $ | (0.13 | ) | | $ | (0.11 | ) | | $ | (0.11 | ) | | $ | (0.09 | ) |
Net realized and unrealized gain (loss) on investments and foreign currency | | | 0.51 | | | | 1.96 | | | | 0.78 | | | | 1.02 | | | | 3.36 | |
| | | | | | | | | | | | | | | | | | | | |
Total from investment operations | | $ | 0.39 | | | $ | 1.83 | | | $ | 0.67 | | | $ | 0.91 | | | $ | 3.27 | |
| | | | | | | | | | | | | | | | | | | | |
Less distributions declared to shareholders | | | | | | | | | | | | | | | | | | | | |
From net realized gain on investments | | $ | (0.44 | ) | | $ | — | | | $ | — | | | $ | — | | | $ | — | |
| | | | | | | | | | | | | | | | | | | | |
Net asset value, end of period | | $ | 15.97 | | | $ | 16.02 | | | $ | 14.19 | | | $ | 13.52 | | | $ | 12.61 | |
| | | | | | | | | | | | | | | | | | | | |
Total return (%) (k)(r)(s) | | | 2.28 | | | | 12.90 | | | | 4.96 | | | | 7.22 | (b) | | | 35.01 | |
Ratios (%) (to average net assets) and Supplemental data: | | | | | | | | | | | | | | | | | | | | |
Expenses before expense reductions (f) | | | 1.25 | | | | 1.26 | | | | 1.26 | | | | 1.24 | | | | 1.24 | |
Expenses after expense reductions (f) | | | 1.20 | | | | 1.23 | | | | N/A | | | | N/A | | | | N/A | |
Net investment loss | | | (0.70 | ) | | | (0.84 | ) | | | (0.81 | ) | | | (0.89 | ) | | | (0.84 | ) |
Portfolio turnover (%) | | | 95 | | | | 107 | | | | 127 | | | | 139 | | | | 100 | |
Net assets at end of period (000 Omitted) | | $ | 186,516 | | | $ | 181,468 | | | $ | 131,180 | | | $ | 104,256 | | | $ | 71,049 | |
| (b) | The fund’s net asset value and total return calculation include a non-recurring accrual recorded as a result of an administrative proceeding regarding disclosure of brokerage allocation practices in connection with fund sales. The non-recurring accrual did not have a material impact on the net asset value per share based on the shares outstanding on the day the proceeds were recorded. |
| (d) | Per share data are based on average shares outstanding. |
| (f) | Ratios do not reflect reductions from fees paid indirectly, if applicable. |
| (k) | The total return does not reflect expenses that apply to separate accounts. Inclusion of these charges would reduce the total return figures for all periods shown. |
| (r) | Certain expenses have been reduced without which performance would have been lower. |
| (s) | From time to time the fund may receive proceeds from litigation settlements, without which performance would be lower. |
See notes to financial statements.
77
MFS Variable Insurance Trust II
Financial Highlights — continued
The financial highlights table is intended to help you understand the fund’s financial performance for the past 5 years. Certain information reflects financial results for a single fund share. The total returns in the table represent the rate by which an investor would have earned (or lost) on an investment in the fund share class (assuming reinvestment of all distributions) held for the entire period.
| | | | | | | | | | | | | | | | | | | | |
| | | MFS Research Portfolio | |
| | | Years Ended 12/31 | |
| Initial Class Shares | | 2007 | | | 2006 | | | 2005 | | | 2004 | | | 2003 | |
Net asset value, beginning of period | | $ | 18.73 | | | $ | 17.04 | | | $ | 15.88 | | | $ | 13.84 | | | $ | 11.14 | |
| | | | | | | | | | | | | | | | | | | | |
Income (loss) from investment operations | | | | | | | | | | | | | | | | | | | | |
Net investment income (d) | | $ | 0.10 | | | $ | 0.13 | | | $ | 0.09 | | | $ | 0.08 | | | $ | 0.11 | |
Net realized and unrealized gain (loss) on investments and foreign currency | | | 2.37 | | | | 1.67 | | | | 1.16 | | | | 2.09 | | | | 2.69 | |
| | | | | | | | | | | | | | | | | | | | |
Total from investment operations | | $ | 2.47 | | | $ | 1.80 | | | $ | 1.25 | | | $ | 2.17 | | | $ | 2.80 | |
| | | | | | | | | | | | | | | | | | | | |
Less distributions declared to shareholders | | | | | | | | | | | | | | | | | | | | |
From net investment income | | $ | (0.16 | ) | | $ | (0.11 | ) | | $ | (0.09 | ) | | $ | (0.13 | ) | | $ | (0.10 | ) |
| | | | | | | | | | | | | | | | | | | | |
Net asset value, end of period | | $ | 21.04 | | | $ | 18.73 | | | $ | 17.04 | | | $ | 15.88 | | | $ | 13.84 | |
| | | | | | | | | | | | | | | | | | | | |
Total return (%) (k)(s) | | | 13.24 | | | | 10.62 | | | | 7.94 | | | | 15.83 | (b) | | | 25.32 | (j) |
Ratios (%) (to average net assets) and Supplemental data: | | | | | | | | | | | | | | | | | | | | |
Expenses (f) | | | 0.83 | | | | 0.82 | | | | 0.83 | | | | 0.80 | | | | 0.80 | |
Net investment income | | | 0.48 | | | | 0.76 | | | | 0.57 | | | | 0.53 | | | | 0.93 | |
Portfolio turnover (%) | | | 84 | | | | 87 | | | | 92 | | | | 118 | | | | 124 | |
Net assets at end of period (000 Omitted) | | $ | 268,217 | | | $ | 309,757 | | | $ | 366,831 | | | $ | 432,318 | | | $ | 466,139 | |
| |
| | | MFS Research Portfolio | |
| | | Years Ended 12/31 | |
| Service Class Shares | | 2007 | | | 2006 | | | 2005 | | | 2004 | | | 2003 | |
Net asset value, beginning of period | | $ | 18.60 | | | $ | 16.93 | | | $ | 15.78 | | | $ | 13.77 | | | $ | 11.09 | |
| | | | | | | | | | | | | | | | | | | | |
Income (loss) from investment operations | | | | | | | | | | | | | | | | | | | | |
Net investment income (d) | | $ | 0.05 | | | $ | 0.09 | | | $ | 0.05 | | | $ | 0.04 | | | $ | 0.08 | |
Net realized and unrealized gain (loss) on investments and foreign currency | | | 2.36 | | | | 1.65 | | | | 1.16 | | | | 2.08 | | | | 2.68 | |
| | | | | | | | | | | | | | | | | | | | |
Total from investment operations | | $ | 2.41 | | | $ | 1.74 | | | $ | 1.21 | | | $ | 2.12 | | | $ | 2.76 | |
| | | | | | | | | | | | | | | | | | | | |
Less distributions declared to shareholders | | | | | | | | | | | | | | | | | | | | |
From net investment income | | $ | (0.12 | ) | | $ | (0.07 | ) | | $ | (0.06 | ) | | $ | (0.11 | ) | | $ | (0.08 | ) |
| | | | | | | | | | | | | | | | | | | | |
Net asset value, end of period | | $ | 20.89 | | | $ | 18.60 | | | $ | 16.93 | | | $ | 15.78 | | | $ | 13.77 | |
| | | | | | | | | | | | | | | | | | | | |
Total return (%) (k)(s) | | | 12.97 | | | | 10.32 | | | | 7.71 | | | | 15.54 | (b) | | | 25.01 | (j) |
Ratios (%) (to average net assets) and Supplemental data: | | | | | | | | | | | | | | | | | | | | |
Expenses (f) | | | 1.08 | | | | 1.07 | | | | 1.09 | | | | 1.05 | | | | 1.05 | |
Net investment income | | | 0.23 | | | | 0.54 | | | | 0.33 | | | | 0.30 | | | | 0.67 | |
Portfolio turnover (%) | | | 84 | | | | 87 | | | | 92 | | | | 118 | | | | 124 | |
Net assets at end of period (000 Omitted) | | $ | 28,832 | | | $ | 29,316 | | | $ | 28,039 | | | $ | 25,315 | | | $ | 16,010 | |
| (b) | The fund’s net asset value and total return calculation include a non-recurring accrual recorded as a result of an administrative proceeding regarding disclosure of brokerage allocation practices in connection with fund sales. The non-recurring accrual resulted in an increase in the net asset value of $0.01 per share based on shares outstanding on the day the proceeds were recorded. |
| (d) | Per share data are based on average shares outstanding. |
| (f) | Ratios do not reflect reductions from fees paid indirectly, if applicable. |
| (j) | The fund’s net asset value and total return calculation include proceeds received on March 26, 2003 for the partial payment of a non-recurring litigation settlement from Cendant Corporation, recorded as a realized gain on investment transactions. The proceeds resulted in an increase in the net asset value of $0.06 per share based on shares outstanding on the day the proceeds were received. Excluding the effect of this payment from the ending net asset value per share, the Intial Class and Service Class total returns for the year ended December 31, 2003 would have each been lowered by approximately 0.52%. |
| (k) | The total return does not reflect expenses that apply to separate accounts. Inclusion of these charges would reduce the total return figures for all periods shown. |
| (s) | From time to time the fund may receive proceeds from litigation settlements, without which performance would be lower. |
See notes to financial statements.
78
MFS Variable Insurance Trust II
Financial Highlights — continued
The financial highlights table is intended to help you understand the fund’s financial performance for the past 5 years. Certain information reflects financial results for a single fund share. The total returns in the table represent the rate by which an investor would have earned (or lost) on an investment in the fund share class (assuming reinvestment of all distributions) held for the entire period.
| | | | | | | | | | | | | | | | | | | | |
| | | MFS Strategic Income Portfolio | |
| | | Years Ended 12/31 | |
| Initial Class Shares | | 2007 | | | 2006 | | | 2005 | | | 2004 | | | 2003 | |
Net asset value, beginning of period | | $ | 10.61 | | | $ | 10.71 | | | $ | 11.42 | | | $ | 11.12 | | | $ | 10.31 | |
| | | | | | | | | | | | | | | | | | | | |
Income (loss) from investment operations | | | | | | | | | | | | | | | | | | | | |
Net investment income (d) | | $ | 0.60 | | | $ | 0.57 | | | $ | 0.58 | | | $ | 0.61 | | | $ | 0.59 | |
Net realized and unrealized gain (loss) on investments and foreign currency | | | (0.23 | ) | | | 0.11 | | | | (0.39 | ) | | | 0.23 | | | | 0.71 | |
| | | | | | | | | | | | | | | | | | | | |
Total from investment operations | | $ | 0.37 | | | $ | 0.68 | | | $ | 0.19 | | | $ | 0.84 | | | $ | 1.30 | |
| | | | | | | | | | | | | | | | | | | | |
Less distributions declared to shareholders | | | | | | | | | | | | | | | | | | | | |
From net investment income | | $ | (0.58 | ) | | $ | (0.66 | ) | | $ | (0.80 | ) | | $ | (0.54 | ) | | $ | (0.49 | ) |
From net realized gain on investments | | | — | | | | (0.12 | ) | | | (0.10 | ) | | | — | | | | — | |
| | | | | | | | | | | | | | | | | | | | |
Total distributions declared to shareholders | | $ | (0.58 | ) | | $ | (0.78 | ) | | $ | (0.90 | ) | | $ | (0.54 | ) | | $ | (0.49 | ) |
| | | | | | | | | | | | | | | | | | | | |
Net asset value, end of period | | $ | 10.40 | | | $ | 10.61 | | | $ | 10.71 | | | $ | 11.42 | | | $ | 11.12 | |
| | | | | | | | | | | | | | | | | | | | |
Total return (%) (k)(r)(s) | | | 3.49 | | | | 6.71 | | | | 1.89 | | | | 8.04 | | | | 12.89 | |
Ratios (%) (to average net assets) and Supplemental data: | | | | | | | | | | | | | | | | | | | | |
Expenses before expense reductions (f) | | | 0.95 | | | | 0.97 | | | | 0.97 | | | | 0.91 | | | | 0.90 | |
Expenses after expense reductions (f) | | | 0.90 | | | | 0.95 | | | | N/A | | | | N/A | | | | N/A | |
Net investment income | | | 5.70 | | | | 5.44 | | | | 5.33 | | | | 5.55 | | | | 5.58 | |
Portfolio turnover (%) | | | 49 | | | | 64 | | | | 66 | | | | 74 | | | | 127 | |
Net assets at end of period (000 Omitted) | | $ | 49,582 | | | $ | 54,423 | | | $ | 59,707 | | | $ | 66,248 | | | $ | 67,547 | |
| |
| | | MFS Strategic Income Portfolio | |
| | | Years Ended 12/31 | |
| Service Class Shares | | 2007 | | | 2006 | | | 2005 | | | 2004 | | | 2003 | |
Net asset value, beginning of period | | $ | 10.54 | | | $ | 10.64 | | | $ | 11.35 | | | $ | 11.06 | | | $ | 10.28 | |
| | | | | | | | | | | | | | | | | | | | |
Income (loss) from investment operations | | | | | | | | | | | | | | | | | | | | |
Net investment income (d) | | $ | 0.57 | | | $ | 0.54 | | | $ | 0.55 | | | $ | 0.59 | | | $ | 0.57 | |
Net realized and unrealized gain (loss) on investments and foreign currency | | | (0.23 | ) | | | 0.11 | | | | (0.39 | ) | | | 0.22 | | | | 0.68 | |
| | | | | | | | | | | | | | | | | | | | |
Total from investment operations | | $ | 0.34 | | | $ | 0.65 | | | $ | 0.16 | | | $ | 0.81 | | | $ | 1.25 | |
| | | | | | | | | | | | | | | | | | | | |
Less distributions declared to shareholders | | | | | | | | | | | | | | | | | | | | |
From net investment income | | $ | (0.55 | ) | | $ | (0.63 | ) | | $ | (0.77 | ) | | $ | (0.52 | ) | | $ | (0.47 | ) |
From net realized gain on investments | | | — | | | | (0.12 | ) | | | (0.10 | ) | | | — | | | | — | |
| | | | | | | | | | | | | | | | | | | | |
Total distributions declared to shareholders | | $ | (0.55 | ) | | $ | (0.75 | ) | | $ | (0.87 | ) | | $ | (0.52 | ) | | $ | (0.47 | ) |
| | | | | | | | | | | | | | | | | | | | |
Net asset value, end of period | | $ | 10.33 | | | $ | 10.54 | | | $ | 10.64 | | | $ | 11.35 | | | $ | 11.06 | |
| | | | | | | | | | | | | | | | | | | | |
Total return (%) (k)(r)(s) | | | 3.24 | | | | 6.45 | | | | 1.61 | | | | 7.83 | | | | 12.48 | |
Ratios (%) (to average net assets) and Supplemental data: | | | | | | | | | | | | | | | | | | | | |
Expenses before expense reductions (f) | | | 1.20 | | | | 1.22 | | | | 1.22 | | | | 1.16 | | | | 1.15 | |
Expenses after expense reductions (f) | | | 1.15 | | | | 1.19 | | | | N/A | | | | N/A | | | | N/A | |
Net investment income | | | 5.45 | | | | 5.19 | | | | 5.08 | | | | 5.31 | | | | 5.36 | |
Portfolio turnover (%) | | | 49 | | | | 64 | | | | 66 | | | | 74 | | | | 127 | |
Net assets at end of period (000 Omitted) | | $ | 19,232 | | | $ | 21,949 | | | $ | 22,643 | | | $ | 24,184 | | | $ | 21,008 | |
| (d) | Per share data are based on average shares outstanding. |
| (f) | Ratios do not reflect reductions from fees paid indirectly, if applicable. |
| (k) | The total return does not reflect expenses that apply to separate accounts. Inclusion of these charges would reduce the total return figures for all periods shown. |
| (r) | Certain expenses have been reduced without which performance would have been lower. |
| (s) | From time to time the fund may receive proceeds from litigation settlements, without which performance would be lower. |
See notes to financial statements.
79
MFS Variable Insurance Trust II
Financial Highlights — continued
The financial highlights table is intended to help you understand the fund’s financial performance for the past 5 years. Certain information reflects financial results for a single fund share. The total returns in the table represent the rate by which an investor would have earned (or lost) on an investment in the fund share class (assuming reinvestment of all distributions) held for the entire period.
| | | | | | | | | | | | | | | | | | | | |
| | | MFS Strategic Value Portfolio | |
| | | Years Ended 12/31 | |
| Initial Class Shares | | 2007 | | | 2006 | | | 2005 | | | 2004 | | | 2003 | |
Net asset value, beginning of period | | $ | 10.66 | | | $ | 10.23 | | | $ | 11.57 | | | $ | 10.05 | | | $ | 7.90 | |
| | | | | | | | | | | | | | | | | | | | |
Income (loss) from investment operations | | | | | | | | | | | | | | | | | | | | |
Net investment income (d) | | $ | 0.08 | | | $ | 0.17 | | | $ | 0.08 | | | $ | 0.11 | | | $ | 0.07 | |
Net realized and unrealized gain (loss) on investments and foreign currency | | | (0.22 | ) | | | 1.19 | | | | (0.18 | ) | | | 1.63 | | | | 2.09 | |
| | | | | | | | | | | | | | | | | | | | |
Total from investment operations | | $ | (0.14 | ) | | $ | 1.36 | | | $ | (0.10 | ) | | $ | 1.74 | | | $ | 2.16 | |
| | | | | | | | | | | | | | | | | | | | |
Less distributions declared to shareholders | | | | | | | | | | | | | | | | | | | | |
From net investment income | | $ | (0.20 | ) | | $ | (0.08 | ) | | $ | (0.11 | ) | | $ | (0.04 | ) | | $ | (0.01 | ) |
From net realized gain on investments | | | (0.77 | ) | | | (0.85 | ) | | | (1.13 | ) | | | (0.18 | ) | | | — | |
| | | | | | | | | | | | | | | | | | | | |
Total distributions declared to shareholders | | $ | (0.97 | ) | | $ | (0.93 | ) | | $ | (1.24 | ) | | $ | (0.22 | ) | | $ | (0.01 | ) |
| | | | | | | | | | | | | | | | | | | | |
Net asset value, end of period | | $ | 9.55 | | | $ | 10.66 | | | $ | 10.23 | | | $ | 11.57 | | | $ | 10.05 | |
| | | | | | | | | | | | | | | | | | | | |
Total return (%) (k)(r)(s) | | | (2.33 | ) | | | 14.16 | | | | (0.39 | ) | | | 18.05 | | | | 27.44 | |
Ratios (%) (to average net assets) and Supplemental data: | | | | | | | | | | | | | | | | | | | | |
Expenses before expense reductions (f) | | | 1.65 | | | | 1.71 | | | | 1.44 | | | | 1.29 | | | | 1.59 | |
Expenses after expense reductions (f) | | | 0.98 | | | | 0.99 | | | | 1.00 | | | | 0.99 | | | | 1.00 | |
Net investment income | | | 0.78 | | | | 1.69 | | | | 0.74 | | | | 1.05 | | | | 0.80 | |
Portfolio turnover (%) | | | 102 | | | | 56 | | | | 60 | | | | 70 | | | | 38 | |
Net assets at end of period (000 Omitted) | | $ | 10 | | | $ | 10 | | | $ | 9 | | | $ | 9 | | | $ | 8 | |
| |
| | | MFS Strategic Value Portfolio | |
| | | Years Ended 12/31 | |
| Service Class Shares | | 2007 | | | 2006 | | | 2005 | | | 2004 | | | 2003 | |
Net asset value, beginning of period | | $ | 10.60 | | | $ | 10.17 | | | $ | 11.52 | | | $ | 10.02 | | | $ | 7.90 | |
| | | | | | | | | | | | | | | | | | | | |
Income (loss) from investment operations | | | | | | | | | | | | | | | | | | | | |
Net investment income (d) | | $ | 0.06 | | | $ | 0.14 | | | $ | 0.05 | | | $ | 0.09 | | | $ | 0.05 | |
Net realized and unrealized gain (loss) on investments and foreign currency | | | (0.23 | ) | | | 1.20 | | | | (0.19 | ) | | | 1.61 | | | | 2.08 | |
| | | | | | | | | | | | | | | | | | | | |
Total from investment operations | | $ | (0.17 | ) | | $ | 1.34 | | | $ | (0.14 | ) | | $ | 1.70 | | | $ | 2.13 | |
| | | | | | | | | | | | | | | | | | | | |
Less distributions declared to shareholders | | | | | | | | | | | | | | | | | | | | |
From net investment income | | $ | (0.17 | ) | | $ | (0.06 | ) | | $ | (0.08 | ) | | $ | (0.02 | ) | | $ | (0.01 | ) |
From net realized gain on investments | | | (0.77 | ) | | | (0.85 | ) | | | (1.13 | ) | | | (0.18 | ) | | | — | |
| | | | | | | | | | | | | | | | | | | | |
Total distributions declared to shareholders | | $ | (0.94 | ) | | $ | (0.91 | ) | | $ | (1.21 | ) | | $ | (0.20 | ) | | $ | (0.01 | ) |
| | | | | | | | | | | | | | | | | | | | |
Net asset value, end of period | | $ | 9.49 | | | $ | 10.60 | | | $ | 10.17 | | | $ | 11.52 | | | $ | 10.02 | |
| | | | | | | | | | | | | | | | | | | | |
Total return (%) (k)(r)(s) | | | (2.62 | ) | | | 13.92 | | | | (0.72 | ) | | | 17.77 | | | | 27.01 | |
Ratios (%) (to average net assets) and Supplemental data: | | | | | | | | | | | | | | | | | | | | |
Expenses before expense reductions (f) | | | 1.91 | | | | 1.94 | | | | 1.69 | | | | 1.55 | | | | 1.84 | |
Expenses after expense reductions (f) | | | 1.23 | | | | 1.24 | | | | 1.25 | | | | 1.25 | | | | 1.25 | |
Net investment income | | | 0.53 | | | | 1.37 | | | | 0.48 | | | | 0.82 | | | | 0.56 | |
Portfolio turnover (%) | | | 102 | | | | 56 | | | | 60 | | | | 70 | | | | 38 | |
Net assets at end of period (000 Omitted) | | $ | 7,309 | | | $ | 9,090 | | | $ | 10,651 | | | $ | 11,597 | | | $ | 8,199 | |
| (d) | Per share data are based on average shares outstanding. |
| (f) | Ratios do not reflect reductions from fees paid indirectly, if applicable. |
| (k) | The total return does not reflect expenses that apply to separate accounts. Inclusion of these charges would reduce the total return figures for all periods shown. |
| (r) | Certain expenses have been reduced without which performance would have been lower. |
| (s) | From time to time the fund may receive proceeds from litigation settlements, without which performance would be lower. |
See notes to financial statements.
80
MFS Variable Insurance Trust II
Financial Highlights — continued
The financial highlights table is intended to help you understand the fund’s financial performance for the past 5 years. Certain information reflects financial results for a single fund share. The total returns in the table represent the rate by which an investor would have earned (or lost) on an investment in the fund share class (assuming reinvestment of all distributions) held for the entire period.
| | | | | | | | | | | | | | | | | | | | |
| | | MFS Technology Portfolio | |
| | | Years Ended 12/31 | |
| Initial Class Shares | | 2007 | | | 2006 | | | 2005 | | | 2004 | | | 2003 | |
Net asset value, beginning of period | | $ | 5.44 | | | $ | 4.46 | | | $ | 4.20 | | | $ | 4.10 | | | $ | 2.82 | |
| | | | | | | | | | | | | | | | | | | | |
Income (loss) from investment operations | | | | | | | | | | | | | | | | | | | | |
Net investment loss (d) | | $ | (0.02 | ) | | $ | (0.03 | ) | | $ | (0.03 | ) | | $ | (0.01 | ) | | $ | (0.02 | ) |
Net realized and unrealized gain (loss) on investments and foreign currency | | | 1.12 | | | | 1.01 | | | | 0.29 | | | | 0.11 | | | | 1.30 | |
| | | | | | | | | | | | | | | | | | | | |
Total from investment operations | | $ | 1.10 | | | $ | 0.98 | | | $ | 0.26 | | | $ | 0.10 | | | $ | 1.28 | |
| | | | | | | | | | | | | | | | | | | | |
Net asset value, end of period | | $ | 6.54 | | | $ | 5.44 | | | $ | 4.46 | | | $ | 4.20 | | | $ | 4.10 | |
| | | | | | | | | | | | | | | | | | | | |
Total return (%) (k)(r)(s) | | | 20.22 | | | | 21.97 | | | | 6.19 | | | | 2.44 | (b) | | | 45.39 | |
Ratios (%) (to average net assets) and Supplemental data: | | | | | | | | | | | | | | | | | | | | |
Expenses before expense reductions (f) | | | 1.21 | | | | 1.34 | | | | 1.18 | | | | 1.11 | | | | 1.09 | |
Expenses after expense reductions (f) | | | 1.00 | | | | 1.00 | | | | 1.00 | | | | 1.01 | | | | 1.06 | |
Net investment loss | | | (0.31 | ) | | | (0.55 | ) | | | (0.66 | ) | | | (0.21 | ) | | | (0.65 | ) |
Portfolio turnover (%) | | | 249 | | | | 234 | | | | 196 | | | | 110 | | | | 191 | |
Net assets at end of period (000 Omitted) | | $ | 21,184 | | | $ | 18,813 | | | $ | 18,978 | | | $ | 23,069 | | | $ | 28,376 | |
| |
| | | MFS Technology Portfolio | |
| | | Years Ended 12/31 | |
| Service Class Shares | | 2007 | | | 2006 | | | 2005 | | | 2004 | | | 2003 | |
Net asset value, beginning of period | | $ | 5.35 | | | $ | 4.40 | | | $ | 4.15 | | | $ | 4.07 | | | $ | 2.80 | |
| | | | | | | | | | | | | | | | | | | | |
Income (loss) from investment operations | | | | | | | | | | | | | | | | | | | | |
Net investment loss (d) | | $ | (0.03 | ) | | $ | (0.04 | ) | | $ | (0.04 | ) | | $ | (0.02 | ) | | $ | (0.03 | ) |
Net realized and unrealized gain (loss) on investments and foreign currency | | | 1.10 | | | | 0.99 | | | | 0.29 | | | | 0.10 | | | | 1.30 | |
| | | | | | | | | | | | | | | | | | | | |
Total from investment operations | | $ | 1.07 | | | $ | 0.95 | | | $ | 0.25 | | | $ | 0.08 | | | $ | 1.27 | |
| | | | | | | | | | | | | | | | | | | | |
Net asset value, end of period | | $ | 6.42 | | | $ | 5.35 | | | $ | 4.40 | | | $ | 4.15 | | | $ | 4.07 | |
| | | | | | | | | | | | | | | | | | | | |
Total return (%) (k)(r)(s) | | | 20.00 | | | | 21.59 | | | | 6.02 | | | | 1.97 | (b) | | | 45.36 | |
Ratios (%) (to average net assets) and Supplemental data: | | | | | | | | | | | | | | | | | | | | |
Expenses before expense reductions (f) | | | 1.46 | | | | 1.59 | | | | 1.43 | | | | 1.36 | | | | 1.33 | |
Expenses after expense reductions (f) | | | 1.25 | | | | 1.25 | | | | 1.25 | | | | 1.26 | | | | 1.30 | |
Net investment loss | | | (0.56 | ) | | | (0.80 | ) | | | (0.92 | ) | | | (0.45 | ) | | | (0.91 | ) |
Portfolio turnover (%) | | | 249 | | | | 234 | | | | 196 | | | | 110 | | | | 191 | |
Net assets at end of period (000 Omitted) | | $ | 3,555 | | | $ | 3,148 | | | $ | 3,375 | | | $ | 3,636 | | | $ | 4,094 | |
| (b) | The fund’s net asset value and total return calculation include a non-recurring accrual recorded as a result of an administrative proceeding regarding disclosure of brokerage allocation practices in connection with fund sales. The non-recurring accrual did not have a material impact on the net asset value per share based on the shares outstanding on the day the proceeds were recorded. |
| (d) | Per share data are based on average shares outstanding. |
| (f) | Ratios do not reflect reductions from fees paid indirectly, if applicable. |
| (k) | The total return does not reflect expenses that apply to separate accounts. Inclusion of these charges would reduce the total return figures for all periods shown. |
| (r) | Certain expenses have been reduced without which performance would have been lower. |
| (s) | From time to time the fund may receive proceeds from litigation settlements, without which performance would be lower. |
See notes to financial statements.
81
MFS Variable Insurance Trust II
Notes to Financial Statements
(1) Business and Organization
The MFS Variable Insurance Trust II (formerly MFS/Sun Life Series Trust) (the trust) is organized as a Massachusetts business trust and is registered under the Investment Company Act of 1940, as amended (the “1940 Act”), as an open-end management investment company consisting of twenty-eight separate series (the funds):
| | |
Fund | | Formerly known as |
MFS Blended Research Core Equity Portfolio | | Massachusetts Investors Trust Series |
MFS Blended Research Growth Portfolio | | N/A |
MFS Blended Research Value Portfolio | | N/A |
MFS Bond Portfolio | | Bond Series |
MFS Capital Appreciation Portfolio* | | Capital Appreciation Series |
MFS Core Equity Portfolio | | Core Equity Series |
MFS Emerging Growth Portfolio* | | Emerging Growth Series |
MFS Emerging Markets Equity Portfolio | | Emerging Markets Equity Series |
MFS Global Governments Portfolio* | | Global Governments Series |
MFS Global Growth Portfolio | | Global Growth Series |
MFS Global Total Return Portfolio | | Global Total Return Series |
MFS Government Securities Portfolio | | Government Securities Series |
MFS High Yield Portfolio | | High Yield Series |
MFS International Growth Portfolio | | International Growth Series |
MFS International Value Portfolio | | International Value Series |
MFS Massachusetts Investor Growth Stock Portfolio* | | Massachusetts Investor Growth Stock Series |
MFS Mid Cap Growth Portfolio* | | Mid Cap Growth Series |
MFS Mid Cap Value Portfolio* | | Mid Cap Value Series |
MFS Money Market Portfolio* | | Money Market Series |
MFS New Discovery Portfolio* | | New Discovery Series |
MFS Research Portfolio* | | Research Series |
MFS Research International Portfolio | | Research International Series |
MFS Strategic Income Portfolio* | | Strategic Income Series |
MFS Strategic Value Portfolio* | | Strategic Value Series |
MFS Technology Portfolio* | | Technology Series |
MFS Total Return Portfolio | | Total Return Series |
MFS Utilities Portfolio | | Utilities Series |
MFS Value Portfolio | | Value Series |
The shares of each fund are sold to variable accounts established by insurance companies to fund benefits under variable contracts issued by such companies and qualified retirement and pension plans.
The funds denoted with an asterisk above are included within these financial statements.
(2) Significant Accounting Policies
General – The preparation of financial statements in conformity with U.S. generally accepted accounting principles requires management to make estimates and assumptions that affect the reported amounts of assets and liabilities, and disclosure of contingent assets and liabilities at the date of the financial statements and the reported amounts of revenues and expenses during the reporting period. Actual results could differ from those estimates. Each fund (except the MFS Money Market Portfolio) can invest in foreign securities, including securities of emerging market issuers. Investments in foreign securities are vulnerable to the effects of changes in the relative values of the local currency and the U.S. dollar and to the effects of changes in each country’s legal, political, and economic environment. The markets of emerging markets countries are generally more volatile than the markets of developed countries with more mature economies. All of the risks of investing in foreign securities previously described are heightened when investing in emerging markets countries.
Investment Valuations – Equity securities, including restricted equity securities, are generally valued at the last sale or official closing price as reported by an independent pricing service on the market or exchange on which they are primarily traded. For securities for which there were no sales reported that day, equity securities are generally valued at the last quoted daily bid quotation as reported by an independent pricing service on the market or exchange on which they are primarily traded. For securities held short for which there were no sales reported for the day, the position is generally valued at the last quoted daily ask quotation as reported by an independent pricing service on the market or exchange on which such securities are primarily traded. Debt instruments (other than short-term instruments), including restricted debt instruments, are generally valued at an evaluated or composite bid as reported by an independent pricing service. Short-term instruments with a maturity at issuance of 60 days or less may be valued at amortized cost, which approximates market value. Money market instruments are valued at amortized cost, which approximates
82
MFS Variable Insurance Trust II
Notes to Financial Statements — continued
market value. Amortized cost involves valuing an instrument at its cost as adjusted for amortization of premium or accretion of discount rather than its current market value. Each money market fund’s use of amortized cost is subject to the fund’s compliance with Rule 2a-7 under the Investment Company Act of 1940. The amortized cost value of an instrument can be different from the market value of an instrument. Exchange-traded options are generally valued at the last sale or official closing price as reported by an independent pricing service on the exchange on which such options are primarily traded. Exchange-traded options for which there were no sales reported that day are generally valued at the last daily bid quotation as reported by an independent pricing service on the exchange on which such options are primarily traded. Options not traded on an exchange are generally valued at a broker-dealer bid quotation. Foreign currency options are generally valued using an external pricing model that uses market data from an independent source. Futures contracts are generally valued at last posted settlement price as reported by an independent pricing service on the market on which they are primarily traded. Futures contracts for which there were no trades that day for a particular position are generally valued at the closing bid quotation as reported by an independent pricing service on the market on which such futures contracts are primarily traded. Forward foreign currency contracts are generally valued at the mean of bid and asked prices for the time period interpolated from rates reported by an independent pricing service for proximate time periods. Swaps are generally valued at an evaluated bid as reported by an independent pricing service. Open-end investment companies are generally valued at their net asset value per share. Securities and other assets generally valued on the basis of information from an independent pricing service may also be valued at a broker-dealer bid quotation. Values obtained from pricing services can utilize both dealer-supplied valuations and electronic data processing techniques, which take into account factors such as institutional-size trading in similar groups of securities, yield, quality, coupon rate, maturity, type of issue, trading characteristics, and other market data. The values of foreign securities and other assets and liabilities expressed in foreign currencies are converted to U.S. dollars using the mean of bid and asked prices for rates reported by an independent pricing service.
The Board of Trustees has delegated primary responsibility for determining or causing to be determined the value of the funds’ investments (including any fair valuation) to the adviser pursuant to valuation policies and procedures approved by the Board. If the adviser determines that reliable market quotations are not readily available, investments are valued at fair value as determined in good faith by the adviser in accordance with such procedures under the oversight of the Board of Trustees. Under the funds’ valuation policies and procedures, market quotations are not considered to be readily available for many types of debt instruments and certain types of derivatives. These investments are generally valued at fair value based on information from independent pricing services. In addition, investments may be valued at fair value if the adviser determines that an investment’s value has been materially affected by events occurring after the close of the exchange or market on which the investment is principally traded (such as foreign exchange or market) and prior to the determination of the fund’s net asset value, or after the halting of trading of a specific security where trading does not resume prior to the close of the exchange or market on which the security is principally traded. Events that occur on a frequent basis after foreign markets close (such as developments in foreign markets and significant movements in the U.S. markets) and prior to the determination of the fund’s net asset value may be deemed to have a material affect on the value of securities traded in foreign markets. Accordingly, the fund’s foreign equity securities may often be valued at fair value. The adviser may rely on independent pricing services or other information (such as the correlation with price movements of similar securities in the same or other markets; the type, cost and investment characteristics of the security; the business and financial condition of the issuer; and trading and other market data) to assist in determining whether to fair value and at what value to fair value an investment. The value of an investment for purposes of calculating the fund’s net asset value can differ depending on the source and method used to determine value. When fair valuation is used, the value of investments used to determine the fund’s net asset value may differ from quoted or published prices for the same investments.
In September 2006, FASB Statement No. 157, Fair Value Measurements (the “Statement”) was issued, and is effective for fiscal years beginning after November 15, 2007 and for all interim periods within those fiscal years. This Statement provides a single definition of fair value, a hierarchy for measuring fair value and expanded disclosures about fair value measurements. Management is evaluating the application of the Statement to the funds, and believes the impact will be limited to expanded disclosures resulting from the adoption of this Statement in the funds’ financial statements.
Repurchase Agreements – Each fund may enter into repurchase agreements with institutions that the funds’ investment adviser has determined are creditworthy. Each repurchase agreement is recorded at cost. Each fund requires that the securities collateral in a repurchase transaction be transferred to the custodian in a manner sufficient to enable the fund to obtain those securities in the event of a default under the repurchase agreement. Each fund monitors, on a daily basis, the value of the collateral to ensure that its value, including accrued interest, is greater than amounts owed to the fund under each such repurchase agreement. Each fund, along with other affiliated entities of Massachusetts Financial Services Company (MFS), may utilize a joint trading account for the purpose of entering into one or more repurchase agreements.
Inflation-Adjusted Debt Securities – Certain funds invest in inflation-adjusted debt securities issued by the U.S. Treasury. Certain funds may also invest in inflation-adjusted debt securities issued by U.S. Government agencies and instrumentalities other than the U.S. Treasury and by other entities such as U.S. and foreign corporations and foreign governments. The principal value of these debt securities is adjusted through income according to changes in the Consumer Price Index or another general price or wage index. These debt securities typically pay a fixed rate of interest, but this fixed rate is applied to the inflation-adjusted principal amount. The principal paid at maturity of the debt security is typically equal to the inflation-adjusted principal amount, or the security’s original par value, whichever is greater. Other types of inflation-adjusted securities may use other methods to adjust for other measures of inflation.
83
MFS Variable Insurance Trust II
Notes to Financial Statements — continued
Foreign Currency Translation – Purchases and sales of foreign investments, income, and expenses are converted into U.S. dollars based upon currency exchange rates prevailing on the respective dates of such transactions. Gains and losses attributable to foreign currency exchange rates on sales of securities are recorded for financial statement purposes as net realized gains and losses on investments. Gains and losses attributable to foreign exchange rate movements on income and expenses are recorded for financial statement purposes as foreign currency transaction gains and losses. That portion of both realized and unrealized gains and losses on investments that results from fluctuations in foreign currency exchange rates is not separately disclosed.
Derivative Risk – Certain funds may invest in derivatives for hedging or non-hedging purposes. While hedging can reduce or eliminate losses, it can also reduce or eliminate gains. When the fund uses derivatives as an investment to gain market exposure, or for hedging purposes, gains and losses from derivative instruments may be substantially greater than the derivative’s original cost. Derivative instruments include purchased options, written options, futures contracts, forward foreign currency exchange contracts, and swap agreements.
Written Options – Certain funds may write call or put options in exchange for a premium. The premium is initially recorded as a liability, which is subsequently adjusted to the current value of the option contract. When a written option expires, the fund realizes a gain equal to the amount of the premium received. The difference between the premium and the amount paid on effecting a closing transaction is considered a realized gain or loss. When a written call option is exercised, the premium received is offset against the proceeds to determine the realized gain or loss. When a written put option is exercised, the premium reduces the cost basis of the security purchased by the fund. The fund, as writer of an option, may have no control over whether the underlying securities may be sold (call) or purchased (put) and, as a result, bears the market risk of an unfavorable change in the price of the securities underlying the written option. In general, written call options may serve as a partial hedge against decreases in value in the underlying securities to the extent of the premium received.
Written Option Transactions
| | | | | | | |
| | | MFS Research Portfolio | |
| | | Number of
Contracts | | | Premiums
Received | |
Outstanding, beginning of period | | — | | | $ | — | |
Options written | | 164 | | | | 60,148 | |
Options closed | | (164 | ) | | | (60,148 | ) |
| | | | | | | |
Outstanding, end of period | | — | | | $ | — | |
| | | | | | | |
| | | MFS Technology Portfolio | |
| | | Number of
Contracts | | | Premiums
Received | |
Outstanding, beginning of period | | — | | | $ | — | |
Options written | | 1,111 | | | | 193,356 | |
Options closed | | (487 | ) | | | (47,511 | ) |
Options expired | | (353 | ) | | | (20,701 | ) |
| | | | | | | |
Outstanding, end of period | | 271 | | | $ | 125,144 | |
Purchased Options – Certain funds may purchase call or put options for a premium. Purchasing call options may be a hedge against an anticipated increase in the dollar cost of securities to be acquired or to increase the fund’s exposure to the underlying instrument. Purchasing put options may hedge against a decline in the value of portfolio securities. The premium paid is included as an investment in the Statements of Assets and Liabilities and is subsequently adjusted to the current value of the option. Premiums paid for purchased options which have expired are treated as realized losses on investments in the Statements of Operations. Premiums paid for purchased options which are exercised or closed are added to the amount paid or offset against the proceeds on the underlying security or financial instrument to determine the realized gain or loss. The risk of loss associated with purchased options is limited to the premium paid.
Futures Contracts – Certain funds may enter into futures contracts for the delayed delivery of securities or currency, or contracts based on financial indices at a fixed price on a future date. In entering such contracts, each fund is required to deposit with the broker either in cash or securities an amount equal to a certain percentage of the contract amount. Subsequent payments are made or received by each fund each day, depending on the daily fluctuations in the value of the contract, and are recorded for financial statement purposes as unrealized gains or losses by each fund. Upon entering into such contracts, each fund bears the risk of interest or exchange rates or securities prices moving unexpectedly, in which case, the fund may not achieve the anticipated benefits of the futures contracts and may realize a loss.
Forward Foreign Currency Exchange Contracts – Certain funds may enter into forward foreign currency exchange contracts for the purchase or sale of a specific foreign currency at a fixed price on a future date. Risks may arise upon entering into these contracts from the potential inability of counterparties to meet the terms of their contracts and from unanticipated movements in the value of the contract. Each fund may enter into forward foreign currency exchange contracts for hedging purposes as well as for non-hedging purposes. For hedging purposes, each fund may enter into contracts to deliver or receive foreign currency it will receive from or require for its normal investment activities. Each fund may also use contracts in
84
MFS Variable Insurance Trust II
Notes to Financial Statements — continued
a manner intended to protect foreign currency denominated securities from declines in value due to unfavorable exchange rate movements. For non-hedging purposes, each fund may enter into contracts with the intent of changing the relative exposure of the fund’s portfolio of securities to different currencies to take advantage of anticipated changes. The forward foreign currency exchange contracts are adjusted by the daily exchange rate of the underlying currency and any gains or losses are recorded as unrealized until the contract settlement date. On contract settlement date, the gains or losses are recorded as realized gains or losses on foreign currency transactions.
Swap Agreements – Certain funds may enter into swap agreements. A swap is an exchange of cash payments between the fund and another party. Net cash payments are exchanged at specified intervals and are recorded as a realized gain or loss in the Statements of Operations. The value of the swap is adjusted daily and the change in value, including accruals of periodic amounts of interest to be paid or received, is recorded as unrealized appreciation or depreciation in the Statements of Operations. Upfront payments received or made at the inception of the swap are reflected as premiums paid or received on the Statements of Assets and Liabilities and are amortized using the effective interest method over the term of the agreement. A liquidation payment received or made upon early termination is recorded as a realized gain or loss in the Statements of Operations. Collateral, in the form of cash or securities, may be required to be held in segregated accounts with each fund’s custodian in connection with these agreements. Risk of loss may exceed amounts recognized on the Statements of Assets and Liabilities. These risks include the possible lack of a liquid market, failure of the counterparty to perform under the terms of the agreements, and unfavorable market movement of the underlying instrument. All swap agreements entered into by each fund with the same counterparty are generally governed by a single master agreement, which provides for the netting of all amounts owed by the parties under the agreement upon the occurrence of an event of default, thereby reducing the credit risk to which such party is exposed.
MFS Strategic Income Portfolio holds credit default swaps in which one party makes a stream of payments based on a fixed percentage applied to the notional amount to another party in exchange for the right to receive a specified return in the event of a default by a third party, such as a corporate issuer or foreign issuer, on its obligation. MFS Strategic Income Portfolio may enter into credit default swaps to limit or to reduce its risk exposure to defaults of corporate and sovereign issuers or to create direct or synthetic short or long exposure to corporate debt securities or certain sovereign debt securities to which it is not otherwise exposed.
Hybrid Instruments – Certain funds may invest in indexed or hybrid securities on which any combination of interest payments, the principal or stated amount payable at maturity is determined by reference to prices of other securities, currencies, indexes, economic factors or other measures, including interest rates, currency exchange rates, or securities indices. The risks of investing in hybrid instruments reflect a combination of the risks of investing in securities, swaps, options, futures and currencies. Hybrid instruments are potentially more volatile and carry greater market risks than traditional debt instruments. Depending on the structure of the particular hybrid instrument, changes in a benchmark, underlying assets or economic indicator may be magnified by the terms of the hybrid instrument and have an even more dramatic and substantial effect upon the value of the hybrid instrument. Also, the prices of the hybrid instrument and the benchmark, underlying asset or economic indicator may not move in the same direction or at the same time.
Security Loans – State Street Bank and Trust Company (“State Street”), as lending agent, may loan the securities of the funds to certain qualified institutions (the “Borrowers”) approved by the funds. The loans are collateralized at all times by cash and/or U.S. Treasury securities in an amount at least equal to the market value of the securities loaned. State Street provides the funds with indemnification against Borrower default. Each fund bears the risk of loss with respect to the investment of cash collateral. On loans collateralized by cash, the cash collateral is invested in a money market fund or short-term securities. A portion of the income generated upon investment of the collateral is remitted to the Borrowers, and the remainder is allocated between the funds and the lending agents. On loans collateralized by U.S. Treasury securities, a fee is received from the Borrower, and is allocated between the funds and the lending agent. The dividend and interest income earned on the securities loaned is accounted for in the same manner as other dividend and interest income.
At December 31, 2007, the following funds had loans collateralized by cash and U.S. Treasury obligations:
| | | | | | | | | |
| | | Value of
Securities Loaned | | Cash | | U.S.
Treasury
Obligations |
MFS Emerging Growth Portfolio | | $ | 30,214,566 | | $ | 30,860,123 | | $ | 136,377 |
MFS Massachusetts Investors Growth Stock Portfolio | | | 26,493,676 | | | 24,980,582 | | | 2,140,178 |
MFS Mid Cap Growth Portfolio | | | 16,884,308 | | | 17,058,214 | | | 236,925 |
MFS New Discovery Portfolio | | | 70,884,557 | | | 72,654,740 | | | 164,661 |
MFS Research Portfolio | | | 26,644,870 | | | 24,985,769 | | | 2,296,456 |
MFS Technology Portfolio | | | 5,130,384 | | | 4,917,614 | | | 344,705 |
Loans and Other Direct Debt Instruments – Certain funds may invest in loans and loan participations or other receivables. These investments may include standby financing commitments, including revolving credit facilities, which obligate the funds to supply additional cash to the borrower on demand. At December 31, 2007, MFS Strategic Income Portfolio had unfunded loan commitments of $8,245, which could be extended at the option of the borrower and which are covered by sufficient cash and/or other liquid securities held by the fund. Loan participations involve a risk of insolvency of the lending bank or other financial intermediary.
85
MFS Variable Insurance Trust II
Notes to Financial Statements — continued
Indemnifications – Under each fund’s organizational documents, its officers and trustees may be indemnified against certain liabilities and expenses arising out of the performance of their duties to the fund. Additionally, in the normal course of business, each fund enters into agreements with service providers that may contain indemnification clauses. Each fund’s maximum exposure under these agreements is unknown as this would involve future claims that may be made against the fund that have not yet occurred.
Investment Transactions and Income – Investment transactions are recorded on the trade date. Some securities may be purchased on a “when-issued” or “forward delivery” basis, which means that the securities will be delivered to the fund at a future date, usually beyond customary settlement time. Interest income is recorded on the accrual basis. For MFS Money Market Portfolio, all premium and discount is amortized and accreted for financial statement purposes and tax reporting purposes in accordance with generally accepted accounting principles and federal tax regulations, respectively. For all other funds, all premium and discount is amortized or accreted for financial statement purposes in accordance with U.S. generally accepted accounting principles; and all discount is accreted for tax reporting purposes as required by federal income tax regulations. Certain funds earn certain fees in connection with their floating rate loan purchasing activities. These fees are in addition to interest payments earned and may include amendment fees, commitment fees, facility fees, consent fees, and prepayment fees. Commitment fees are recorded on an accrual basis as income in the accompanying financial statements. Dividends received in cash are recorded on the ex-dividend date. Certain dividends from foreign securities will be recorded when the fund is informed of the dividend if such information is obtained subsequent to the ex-dividend date. Dividend and interest payments received in additional securities are recorded on the ex-dividend or ex-interest date in an amount equal to the value of the security on such date.
Certain funds may receive proceeds from litigation settlements. Any proceeds from litigation involving portfolio holdings are reflected in the Statements of Operations in realized gain/loss if the security has been disposed of by the fund or in unrealized gain/loss if the security is still held by the fund. Any other proceeds from litigation not related to portfolio holdings are reflected as other income in the Statements of Operations.
Fees Paid Indirectly – Each fund’s custody fee may be reduced according to an arrangement that measures the value of cash deposited with the custodian by the funds. This amount, for the year ended December 31, 2007, is shown as a reduction of total expenses on the Statements of Operations.
Tax Matters and Distributions – The funds intend to qualify as regulated investment companies, as defined under Subchapter M of the Internal Revenue Code, and to distribute all of their taxable income, including realized capital gains. As a result, no provision for federal income taxes is required. Each fund adopted the provisions of FASB Interpretation No. 48, Accounting for Uncertainty in Income Taxes (“the Interpretation”) on January 1, 2007. The Interpretation prescribes a minimum threshold for financial statement recognition of the benefit of a tax position taken or expected to be taken in a tax return. There was no impact resulting from the adoption of this Interpretation on each fund’s financial statements. Each of the funds’ federal tax returns for the prior three fiscal years remain subject to examination by the Internal Revenue Service. It is each fund’s policy to record interest and penalty charges on underpaid taxes associated with its tax positions as interest expense and other expense, respectively. No such charges were recorded in the current financial statements. Foreign taxes, if any, have been accrued by certain funds in the accompanying financial statements.
Distributions to shareholders are recorded on the ex-dividend date. Income and capital gain distributions are determined in accordance with income tax regulations, which may differ from U.S. generally accepted accounting principles. Certain capital accounts in the financial statements are periodically adjusted for permanent differences in order to reflect their tax character. These adjustments have no impact on net assets or net asset value per share. Temporary differences which arise from recognizing certain items of income, expense, gain or loss in different periods for financial statement and tax purposes will reverse at some time in the future. Distributions in excess of net investment income or net realized gains are temporary overdistributions for financial statement purposes resulting from differences in the recognition or classification of income or distributions for financial statement and tax purposes.
Book/tax differences primarily relate to net operating losses, amortization and accretion of debt securities, real estate investment trusts, wash sale loss deferrals, straddle loss deferrals, foreign currency transactions, and derivative transactions.
86
MFS Variable Insurance Trust II
Notes to Financial Statements — continued
The tax character of distributions declared to shareholders is as follows:
| | | | | | | | | | | | | | | | | | | |
| | | MFS Capital Appreciation Portfolio | | MFS Emerging Growth Portfolio | | MFS Global Governments Portfolio |
| | | 12/31/07 | | 12/31/06 | | 12/31/07 | | | 12/31/06 | | 12/31/07 | | 12/31/06 |
Ordinary income (including any short-term capital gains) | | $ | 981,066 | | $ | 1,174,123 | | $ | — | | | $ | — | | $ | 832,720 | | $ | 458,662 |
| | | | | | | | | | | | | | | | | | | |
| | | |
| | | MFS Massachusetts
Investors Growth Stock Portfolio | | MFS Mid Cap Growth Portfolio | | MFS Mid Cap Value Portfolio |
| | | 12/31/07 | | 12/31/06 | | 12/31/07 | | | 12/31/06 | | 12/31/07 | | 12/31/06 |
Ordinary income (including any short-term capital gains) | | $ | 1,310,019 | | $ | 344,988 | | $ | 19,627 | (1) | | $ | — | | $ | 490,424 | | $ | 1,728,975 |
Long-term capital gain | | | — | | | — | | | — | | | | — | | | 595,951 | | | 1,357,125 |
| | | | | | | | | | | | | | | | | | | |
Total distributions | | $ | 1,310,019 | | $ | 344,988 | | $ | 19,627 | | | $ | — | | $ | 1,086,375 | | $ | 3,086,100 |
| | | | | | | | | | | | | | | | | | | |
| | | |
| | | MFS Money Market Portfolio | | MFS New Discovery Portfolio | | MFS Research Portfolio |
| | | 12/31/07 | | 12/31/06 | | 12/31/07 | | | 12/31/06 | | 12/31/07 | | 12/31/06 |
Ordinary income (including any short-term capital gains) | | $ | 23,102,712 | | $ | 17,603,606 | | $ | — | | | $ | — | | $ | 2,644,036 | | $ | 2,312,500 |
Long-term capital gain | | | — | | | — | | | 9,323,173 | | | | — | | | — | | | — |
| | | | | | | | | | | | | | | | | | | |
Total distributions | | $ | 23,102,712 | | $ | 17,603,606 | | $ | 9,323,173 | | | $ | — | | $ | 2,644,036 | | $ | 2,312,500 |
| | | | | | | | | | | | | | | | | | | |
| | | |
| | | MFS Strategic Income Portfolio | | MFS Strategic Value Portfolio | | MFS Technology Portfolio |
| | | 12/31/07 | | 12/31/06 | | 12/31/07 | | | 12/31/06 | | 12/31/07 | | 12/31/06 |
Ordinary income (including any short-term capital gains) | | $ | 3,963,460 | | $ | 4,885,515 | | $ | 231,994 | | | $ | 326,612 | | $ | — | | $ | — |
Long-term capital gain | | | — | | | 618,624 | | | 500,975 | | | | 535,561 | | | — | | | — |
| | | | | | | | | | | | | | | | | | | |
Total distributions | | $ | 3,963,460 | | $ | 5,504,139 | | $ | 732,969 | | | $ | 862,173 | | $ | — | | $ | — |
| | | | | | | | | | | | | | | | | | | |
| (1) | Included in the MFS Mid Cap Growth Fund’s distributions from ordinary income is $516 in excess of investment company taxable income. |
The federal tax cost and the tax basis components of distributable earnings were as follows:
| | | | | | | | | | | | | | | | |
| As of 12/31/07 | | MFS Capital
Appreciation
Portfolio | | | MFS Emerging
Growth Portfolio | | | MFS Global
Government
Portfolio | | | MFS Massachusetts
Investors Growth
Stock Portfolio | |
Cost of investments | | $ | 439,072,078 | | | $ | 277,552,904 | | | $ | 39,687,117 | | | $ | 420,337,225 | |
| | | | | | | | | | | | | | | | |
Gross appreciation | | $ | 59,598,811 | | | $ | 50,430,634 | | | $ | 737,010 | | | $ | 47,098,360 | |
Gross depreciation | | | (19,017,773 | ) | | | (9,025,140 | ) | | | (151,071 | ) | | | (18,194,254 | ) |
| | | | | | | | | | | | | | | | |
Net unrealized appreciation (depreciation) | | $ | 40,581,038 | | | $ | 41,405,494 | | | $ | 585,939 | | | $ | 28,904,106 | |
Undistributed ordinary income | | | 1,795,756 | | | | 497,658 | | | | 3,543,691 | | | | 1,767,864 | |
Capital loss carryforwards | | | (782,549,441 | ) | | | (343,795,488 | ) | | | (628,757 | ) | | | (380,655,872 | ) |
Other temporary differences | | | (3,201 | ) | | | (156,399 | ) | | | (160,095 | ) | | | (6,309 | ) |
| | | | |
| As of 12/31/07 | | MFS Mid Cap
Growth Portfolio | | | MFS Mid Cap
Value Portfolio | | | MFS Money
Market Portfolio | | | MFS New
Discovery Portfolio | |
Cost of investments | | $ | 87,372,365 | | | $ | 21,075,182 | | | $ | 558,090,812 | | | $ | 395,989,792 | |
| | | | | | | | | | | | | | | | |
Gross appreciation | | $ | 10,723,522 | | | $ | 3,124,435 | | | $ | — | | | $ | 32,948,122 | |
Gross depreciation | | | (3,723,355 | ) | | | (1,748,123 | ) | | | — | | | | (40,395,757 | ) |
| | | | | | | | | | | | | | | | |
Net unrealized appreciation (depreciation) | | $ | 7,000,167 | | | $ | 1,376,312 | | | $ | — | | | $ | (7,447,635 | ) |
Undistributed ordinary income | | | — | | | | 1,034,897 | | | | 1,238 | | | | 12,380,939 | |
Undistributed long-term capital gain | | | — | | | | 1,558,846 | | | | — | | | | 32,613,070 | |
Capital loss carryforwards | | | (17,325,087 | ) | | | — | | | | (32,047 | ) | | | — | |
Post-October capital loss deferral | | | — | | | | (418,285 | ) | | | — | | | | (2,995,930 | ) |
Other temporary differences | | | — | | | | — | | | | — | | | | (381,563 | ) |
| | | | |
| As of 12/31/2007 | | MFS Research
Portfolio | | | MFS Strategic
Income Portfolio | | | MFS Strategic
Value Portfolio | | | MFS Technology
Portfolio | |
Cost of investments | | $ | 302,405,445 | | | $ | 68,585,080 | | | $ | 7,733,946 | | | $ | 29,967,073 | |
| | | | | | | | | | | | | | | | |
Gross appreciation | | $ | 34,650,191 | | | $ | 1,561,445 | | | $ | 365,387 | | | $ | 1,554,344 | |
Gross depreciation | | | (15,334,665 | ) | | | (2,153,643 | ) | | | (599,316 | ) | | | (1,789,606 | ) |
| | | | | | | | | | | | | | | | |
Net unrealized appreciation (depreciation) | | $ | 19,315,526 | | | $ | (592,198 | ) | | $ | (233,929 | ) | | $ | (235,262 | ) |
Undistributed ordinary income | | | 1,468,436 | | | | 4,645,382 | | | | 151,408 | | | | — | |
Undistributed long-term capital gain | | | — | | | | — | | | | 823,681 | | | | — | |
Capital loss carryforwards | | | (145,735,638 | ) | | | (621,768 | ) | | | — | | | | (26,190,003 | ) |
Other temporary differences | | | (14,396 | ) | | | (429,551 | ) | | | (9,159 | ) | | | (57,383 | ) |
87
MFS Variable Insurance Trust II
Notes to Financial Statements — continued
As of December 31, 2007, the following funds had capital loss carryforwards available to offset future realized gains. Such losses expire as follows:
| | | | | | | | | | | | | | | | |
| Expiration Date | | MFS Capital
Appreciation
Portfolio (a) | | | MFS Emerging
Growth Portfolio | | | MFS Global
Governments
Portfolio | | | MFS Massachusetts
Investors Growth
Stock Portfolio (c) | |
12/31/08 | | $ | (119,795,065 | ) | | $ | — | | | $ | — | | | $ | (185,258,709 | ) |
12/31/09 | | | (282,399,140 | ) | | | (114,567,621 | ) | | | — | | | | (193,134,430 | ) |
12/31/10 | | | (348,269,974 | ) | | | (229,227,867 | ) | | | — | | | | (2,262,733 | ) |
12/31/11 | | | (32,085,262 | ) | | | — | | | | — | | | | — | |
12/31/14 | | | — | | | | — | | | | (535,220 | ) | | | — | |
12/31/15 | | | — | | | | — | | | | (93,537 | ) | | | — | |
| | | | | | | | | | | | | | | | |
Total | | $ | (782,549,441 | ) | | $ | (343,795,488 | ) | | $ | (628,757 | ) | | $ | (380,655,872 | ) |
| | | | | | | | | | | | | | | | |
| | | | | | | | | | | | | | | | | | | | |
| Expiration Date | | MFS Mid Cap
Growth Portfolio | | | MFS Money
Market Portfolio | | | MFS Research
Portfolio | | | MFS Strategic
Income Portfolio | | | MFS Technology
Portfolio (b) | |
12/31/08 | | $ | — | | | $ | — | | | $ | — | | | $ | — | | | $ | (1,084,080 | ) |
12/31/09 | | | — | | | | (429 | ) | | | — | | | | — | | | | (8,603,853 | ) |
12/31/10 | | | (17,325,087 | ) | | | — | | | | (145,735,638 | ) | | | — | | | | (16,502,070 | ) |
12/31/11 | | | — | | | | (271 | ) | | | — | | | | — | | | | — | |
12/31/12 | | | — | | | | (66 | ) | | | — | | | | — | | | | — | |
12/31/14 | | | — | | | | — | | | | — | | | | (500,150 | ) | | | — | |
12/31/15 | | | — | | | | (31,281 | ) | | | — | | | | (121,618 | ) | | | — | |
| | | | | | | | | | | | | | | | | | | | |
Total | | $ | (17,325,087 | ) | | $ | (32,047 | ) | | $ | (145,735,638 | ) | | $ | (621,768 | ) | | $ | (26,190,003 | ) |
| | | | | | | | | | | | | | | | | | | | |
| (a) | The availability of a portion of the capital loss carryforwards, which were acquired on April 25, 2005, in connection with the Managed Sectors Series merger, may be limited in a given year. |
| (b) | The availability of a portion of the capital loss carryforwards, which were acquired on September 5, 2003, in connection with the Global Telecommunications Series merger, may be limited in a given year. |
| (c) | The availability of a portion of the capital loss carryforwards, which were acquired on June 22, 2007, in connection with the Strategic Growth Series merger, may be limited in a given year. |
Multiple Classes of Shares of Beneficial Interest – Each fund offers multiple classes of shares, which differ in their respective distribution fees. All shareholders bear the common expenses of a fund based on daily net assets of each class, without distinction between share classes. Dividends are declared separately for each class. Differences in per share dividend rates are generally due to differences in separate class expenses.
(3) Transactions with Affiliates
Investment Adviser – Each fund has an investment advisory agreement with MFS to provide overall investment management and related administrative services and facilities. The management fee is computed daily and paid monthly at an annual rate based on a percentage of each fund’s average daily net assets as follows:
MFS Capital Appreciation Portfolio: The management fee is 0.75% of the first $1 billion of average daily net assets, 0.675% of the next $500 million of average daily net assets and 0.65% of average daily net assets in excess of $1.5 billion.
MFS Emerging Growth Portfolio: The management fee is 0.75% of the first $300 million of average daily net assets and 0.675% of average daily net assets in excess of $300 million.
MFS Global Governments Portfolio: The management fee is 0.75% of the first $300 million of average daily net assets and 0.675% of average daily net assets in excess of $300 million.
MFS Massachusetts Investors Growth Stock Portfolio: The management fee is 0.75% of average daily net assets. At the commencement of the period and until June 22, 2007, the investment adviser had agreed in writing to reduce its management fee to 0.70% of average daily net assets in excess of $1 billion. Effective June 23, 2007, the investment adviser has agreed in writing to reduce its management fee to 0.65% of average daily net assets in excess of $1 billion. This written agreement may be rescinded only upon consent of the fund’s Board of Trustees. For the year ended December 31, 2007, the fund’s average daily net assets did not exceed $1 billion and therefore, the management fee was not reduced.
MFS Mid Cap Growth Portfolio: The management fee is 0.75% of the first $1 billion of average daily net assets and 0.70% of average daily net assets in excess of $1 billion. The investment adviser has agreed in writing to reduce its management fee to 0.65% of average daily net assets in excess of $2.5 billion. This written agreement will continue through August 31, 2008, unless changed or rescinded by the fund’s Board of Trustees. For the year ended December 31, 2007, the fund’s’ average daily net assets did not exceed $2.5 billion and therefore, the management fee was not reduced.
MFS Mid Cap Value Portfolio: The management fee is 0.75% of the first $1 billion of average daily net assets and 0.70% of average daily net assets in excess of $1 billion.
88
MFS Variable Insurance Trust II
Notes to Financial Statements — continued
MFS Money Market Portfolio: The management fee is 0.50% of average daily net assets. The investment adviser has agreed in writing to reduce its management fee to 0.45% of average daily net assets in excess of $500 million. This written agreement may be rescinded only upon consent of the fund’s Board of Trustees. For the year ended December 31, 2007, the fund’s average daily net assets did not exceed $500 million and therefore, the management fee was not reduced.
MFS New Discovery Portfolio: The management fee is 0.90% of the first $1 billion of average daily net assets and 0.80% of average daily net assets in excess of $1 billion. The investment adviser has agreed in writing to reduce its management fee to 0.75% of average daily net assets in excess of $2.5 billion. This written agreement will continue through August 31, 2008 unless changed or rescinded by the fund’s Board of Trustees. For the year ended December 31, 2007, the fund’s average daily net assets did not exceed $2.5 billion and therefore, the management fee was not reduced.
MFS Research Portfolio: The management fee is 0.75% of the first $300 million of average daily net assets and 0.675% of average daily net assets in excess of $300 million.
MFS Strategic Income Portfolio: The management fee is 0.75% of the first $1 billion of average daily net assets and 0.65% of average daily net assets in excess of $1 billion. The investment adviser has agreed in writing to reduce its management fee to 0.70% of the first $1 billion of average daily net assets. This written agreement will continue through August 31, 2008 unless changed or rescinded by the fund’s Board of Trustees. This management fee reduction amounts to $36,909, which is shown as a reduction of total expense in the Statements of Operations.
MFS Strategic Value Portfolio: The management fee is 0.75% of the first $1 billion of average daily net assets and 0.65% of average daily net assets in excess of $1 billion.
MFS Technology Portfolio: The management fee is 0.75% of the first $1 billion of average daily net assets and 0.70% of average daily net assets in excess of $1 billion.
The investment adviser has agreed to pay a portion of certain fund’s operating expenses, exclusive of certain other fees and expenses, such that total annual fund operating expenses of these funds do not exceed the expense limitations indicated below, based on the average daily net assets of such funds. The management fees incurred for the year ended December 31, 2007 were equivalent to an annual effective rate of each fund’s average daily net assets as follows. In addition, the expense limitations incurred for the year ended December 31, 2007 were as follows:
| | | | | | | | | |
| | | Effective
Management
Fees | | | Initial Class
Expense
Limitation | | | Service Class
Expense
Limitation | |
MFS Capital Appreciation Portfolio | | 0.75 | % | | 1.00 | %(a) | | 1.25 | %(a) |
MFS Emerging Growth Portfolio | | 0.75 | % | | N/A | | | N/A | |
MFS Global Governments Portfolio | | 0.75 | % | | 1.00 | %(a) | | 1.25 | %(a) |
MFS Massachusetts Investors Growth Stock Portfolio | | 0.75 | % | | 0.82 | %(b) | | 1.07 | %(b) |
MFS Mid Cap Growth Portfolio | | 0.75 | % | | 0.95 | %(d) | | 1.20 | %(d) |
MFS Mid Cap Value Portfolio | | 0.75 | % | | 1.00 | %(c) | | 1.25 | %(c) |
MFS Money Market Portfolio | | 0.50 | % | | 0.57 | %(a)(c) | | 0.82 | %(a)(c) |
MFS New Discovery Portfolio | | 0.90 | % | | 0.95 | %(c) | | 1.20 | %(c) |
MFS Research Portfolio | | 0.74 | % | | N/A | | | N/A | |
MFS Strategic Income Portfolio | | 0.70 | % | | 0.90 | %(c) | | 1.15 | %(c) |
MFS Strategic Value Portfolio | | 0.75 | % | | 0.98 | %(c) | | 1.23 | %(c) |
MFS Technology Portfolio | | 0.75 | % | | 1.00 | %(c) | | 1.25 | %(c) |
| (a) | The investment adviser has agreed in writing to pay a portion of the fund’s operating expenses, exclusive of certain other fees and expenses, such that total annual fund operating expenses do not exceed 1.25% of the fund’s average daily net assets. MFS’ agreement to limit the fund’s operating expenses is contained in the investment advisory agreement between MFS and the fund and may not be rescinded without shareholder approval. In addition, the investment adviser voluntarily agreed to pay a portion of the fund’s operating expenses, exclusive of certain other fees and expenses, such that total annual operating expenses do not exceed 1.00% of the fund’s average daily net assets attributable to Initial Class shares (0.60% for MFS Money Market Portfolio Initial Class shares and 0.85% for MFS Money Market Portfolio Service Class shares). These voluntary agreements may be changed or rescinded at any time by MFS. Effective September 1, 2007, MFS rescinded the voluntary agreement with respect to the MFS Money Market Portfolio. |
| (b) | This written agreement commenced on June 23, 2007 and will continue through June 30, 2010, unless changed or rescinded by the fund’s Board of Trustees. |
| (c) | For the MFS Money Market Portfolio only, this agreement commenced on September 1, 2007. For the other funds, the agreement was in place throughout the period. This written agreement will continue through August 31, 2008, unless changed or rescinded by the fund’s Board of Trustees. |
| (d) | This written agreement expired on August 31, 2007. |
89
MFS Variable Insurance Trust II
Notes to Financial Statements — continued
For the year ended December 31, 2007, these reductions amounted to the following for each fund and are reflected as a reduction of total expenses in the Statements of Operations:
| | | |
| | | Expense
Reduction |
MFS Global Governments Portfolio | | $ | 32,078 |
MFS Massachusetts Investors Growth Stock Portfolio | | | 47,147 |
MFS Mid Cap Value Portfolio | | | 31,185 |
MFS New Discovery Portfolio | | | 160,491 |
MFS Strategic Value Portfolio | | | 57,960 |
MFS Technology Portfolio | | | 46,407 |
Distributor – MFS Fund Distributors, Inc. (MFD), a wholly-owned subsidiary of MFS, is distributor of shares of the funds. The Trustees have adopted a distribution plan for the Service Class shares pursuant to Rule 12b-1 under the Investment Act of 1940.
Each fund’s distribution plan provides that each fund will pay MFD distribution fees equal to 0.25% per annum of its average daily net assets attributable to Service Class shares as partial consideration for services performed and expenses incurred by MFD and financial intermediaries in connection with the sale and distribution of each fund’s Service Class shares and the sale and distribution of the variable annuity or variable life insurance contracts investing indirectly in Service Class shares. MFD may subsequently pay all, or a portion, of the distribution fees to financial intermediaries.
Shareholder Servicing Agent – MFS Service Center, Inc. (MFSC), a wholly-owned subsidiary of MFS, has contracted to provide transfer agent and recordkeeping functions in connection with the issuance, transfer, and redemption of each class of shares of each fund under a Shareholder Servicing Agent Agreement. During the year ended December 31, 2007, MFSC did not receive a fee for this service.
Administrator – MFS provides certain financial, legal, shareholder communications, compliance, and other administrative services to each fund. Under an administrative services agreement, each fund partially reimburses MFS the costs incurred to provide these services. Each fund is charged an annual fixed amount of $10,000 plus a fee based on average daily net assets.
The administrative services fee incurred for the year ended December 31, 2007 was equivalent to an annual effective rate of each fund’s average daily net assets as follows:
| | | |
| | | Percent of
Average Daily
Net Assets | |
MFS Capital Appreciation Portfolio | | 0.0261 | % |
MFS Emerging Growth Portfolio | | 0.0263 | % |
MFS Global Governments Portfolio | | 0.0270 | % |
MFS Massachusetts Investors Growth Stock Portfolio | | 0.0261 | % |
MFS Mid Cap Growth Portfolio | | 0.0258 | % |
MFS Mid Cap Value Portfolio | | 0.0403 | % |
MFS Money Market Portfolio | | 0.0220 | % |
MFS New Discovery Portfolio | | 0.0263 | % |
MFS Research Portfolio | | 0.0263 | % |
MFS Strategic Income Portfolio | | 0.0256 | % |
MFS Strategic Value Portfolio | | 0.1168 | % |
MFS Technology Portfolio | | 0.0445 | % |
Trustees’ and Officers’ Compensation – Each fund pays compensation to trustees in the form of a retainer, attendance fees, and additional compensation to the Board chairperson. Each fund does not pay compensation directly to officers of the funds who are also officers of the investment adviser, all of whom receive remuneration for their services to the funds from MFS. Certain officers of the funds are officers or directors of MFS, MFD, and MFSC.
90
MFS Variable Insurance Trust II
Notes to Financial Statements — continued
Other – These funds and certain other MFS funds (the funds) have entered into a services agreement (the Agreement) which provides for payment of fees by the funds to Tarantino LLC in return for the provision of services of an Independent Chief Compliance Officer (ICCO) for the funds. The ICCO is an officer of the funds and the sole member of Tarantino LLC. The funds can terminate the Agreement with Tarantino LLC at any time under the terms of the Agreement. MFS has agreed to bear all expenses associated with office space, other administrative support, and supplies provided to the ICCO. For the year ended December 31, 2007, payments made by the funds to Tarantino LLC amounted to the following and are included in the miscellaneous expense on the Statements of Operations:
| | | |
| | | ICCO Fee |
MFS Capital Appreciation Portfolio | | $ | 2,540 |
MFS Emerging Growth Portfolio | | | 1,492 |
MFS Global Governments Portfolio | | | 196 |
MFS Massachusetts Investors Growth Stock Portfolio | | | 2,137 |
MFS Mid Cap Growth Portfolio | | | 423 |
MFS Mid Cap Value Portfolio | | | 121 |
MFS Money Market Portfolio | | | 1,159 |
MFS New Discovery Portfolio | | | 1,733 |
MFS Research Portfolio | | | 1,572 |
MFS Strategic Income Portfolio | | | 354 |
MFS Strategic Value Portfolio | | | 42 |
MFS Technology Portfolio | | | 112 |
(4) Portfolio Securities
Purchases and sales of investments, other than purchased option transactions and short-term obligations, were as follows:
| | | | | | | | | |
| | | MFS Capital
Appreciation
Portfolio | | MFS Emerging
Growth Portfolio | | MFS Global
Governments
Portfolio |
| Purchases | | | | | | | | | |
U.S. government securities | | $ | — | | $ | — | | $ | 10,436,074 |
Investments (non-U.S. government securities) | | $ | 315,034,416 | | $ | 226,602,978 | | $ | 34,873,901 |
| | | |
| Sales | | | | | | | | | |
U.S. government securities | | $ | — | | $ | — | | $ | 9,604,279 |
Investments (non-U.S. government securities) | | $ | 446,071,519 | | $ | 308,738,485 | | $ | 41,366,842 |
| | | |
| | | MFS Massachusetts
Investors Growth
Stock Portfolio | | MFS Mid Cap
Growth Portfolio | | MFS Mid Cap
Value
Portfolio |
| Purchases | | | | | | | | | |
Investments (non-U.S. government securities) | | $ | 261,381,000 | | $ | 68,462,507 | | $ | 15,247,094 |
| | | |
| Sales | | | | | | | | | |
Investments (non-U.S. government securities) | | $ | 355,750,343 | | $ | 89,013,274 | | $ | 18,516,968 |
| | | |
| | | MFS New Discovery Portfolio | | MFS Research
Portfolio | | MFS Strategic
Income
Portfolio |
| Purchases | | | | | | | | | |
U.S. government securities | | $ | — | | $ | — | | $ | 113,400 |
Investments (non-U.S. government securities) | | $ | 326,555,981 | | $ | 269,659,634 | | $ | 33,965,556 |
| | | |
| Sales | | | | | | | | | |
U.S. government securities | | $ | — | | $ | — | | $ | 2,005,151 |
Investments (non-U.S. government securities) | | $ | 367,061,725 | | $ | 351,144,989 | | $ | 36,410,484 |
| | | |
| | | MFS Strategic Value Portfolio | | MFS Technology
Portfolio | | |
| Purchases | | | | | | | | | |
Investments (non-U.S. government securities) | | $ | 8,624,900 | | $ | 54,605,722 | | | |
| | | |
| Sales | | | | | | | | | |
Investments (non-U.S. government securities) | | $ | 10,220,191 | | $ | 56,204,789 | | | |
Purchases and sales of investments for the MFS Money Market Portfolio, which consist solely of short-term obligations, amounted to $7,542,954,351 and $7,496,566,687 respectively, excluding repurchase agreements.
91
MFS Variable Insurance Trust II
Notes to Financial Statements — continued
(5) Shares of Beneficial Interest
Each fund’s Declaration of Trust permits the Trustees to issue an unlimited number of full and fractional shares of beneficial interest. Transactions in fund shares were as follows:
| | | | | | | | | | | | | | |
| | | MFS Capital Appreciation Portfolio | |
| | | Year ended 12/31/07 | | | Year ended 12/31/06 | |
| | | Shares | | | Amount | | | Shares | | | Amount | |
| Shares sold | | | | | | | | | | | | | | |
Initial Class | | 169,097 | | | $ | 3,653,840 | | | 271,615 | | | $ | 5,292,910 | |
Service Class | | 58,373 | | | | 1,243,614 | | | 121,250 | | | | 2,323,766 | |
| | | | | | | | | | | | | | |
| | 227,470 | | | $ | 4,897,454 | | | 392,865 | | | $ | 7,616,676 | |
| | | | | | | | | | | | | | |
| Shares issued to shareholders in reinvestment of distributions | | | | | | | | | | | | | | |
Initial Class | | 44,941 | | | $ | 981,066 | | | 59,996 | | | $ | 1,174,123 | |
| | | | | | | | | | | | | | |
| | 44,941 | | | $ | 981,066 | | | 59,996 | | | $ | 1,174,123 | |
| | | | | | | | | | | | | | |
| Shares reacquired | | | | | | | | | | | | | | |
Initial Class | | (5,948,468 | ) | | $ | (129,379,348 | ) | | (8,182,315 | ) | | $ | (159,551,020 | ) |
Service Class | | (338,421 | ) | | | (7,304,136 | ) | | (464,788 | ) | | | (8,965,273 | ) |
| | | | | | | | | | | | | | |
| | (6,286,889 | ) | | $ | (136,683,484 | ) | | (8,647,103 | ) | | $ | (168,516,293 | ) |
| | | | | | | | | | | | | | |
| Net change | | | | | | | | | | | | | | |
Initial Class | | (5,734,430 | ) | | $ | (124,744,442 | ) | | (7,850,704 | ) | | $ | (153,083,987 | ) |
Service Class | | (280,048 | ) | | | (6,060,522 | ) | | (343,538 | ) | | | (6,641,507 | ) |
| | | | | | | | | | | | | | |
| | (6,014,478 | ) | | $ | (130,804,964 | ) | | (8,194,242 | ) | | $ | (159,725,494 | ) |
| | | | | | | | | | | | | | |
| |
| | | MFS Emerging Growth Portfolio | |
| | | Year ended 12/31/07 | | | Year ended 12/31/06 | |
| | | Shares | | | Amount | | | Shares | | | Amount | |
| Shares sold | | | | | | | | | | | | | | |
Initial Class | | 161,845 | | | $ | 3,489,291 | | | 164,213 | | | $ | 2,835,062 | |
Service Class | | 135,591 | | | | 2,781,765 | | | 206,919 | | | | 3,520,339 | |
| | | | | | | | | | | | | | |
| | 297,436 | | | $ | 6,271,056 | | | 371,132 | | | $ | 6,355,401 | |
| | | | | | | | | | | | | | |
| Shares reacquired | | | | | | | | | | | | | | |
Initial Class | | (4,183,471 | ) | | $ | (85,816,341 | ) | | (4,828,289 | ) | | $ | (84,376,461 | ) |
Service Class | | (239,255 | ) | | | (4,850,355 | ) | | (301,658 | ) | | | (5,154,291 | ) |
| | | | | | | | | | | | | | |
| | (4,422,726 | ) | | $ | (90,666,696 | ) | | (5,129,947 | ) | | $ | (89,530,752 | ) |
| | | | | | | | | | | | | | |
| Net change | | | | | | | | | | | | | | |
Initial Class | | (4,021,626 | ) | | $ | (82,327,050 | ) | | (4,664,076 | ) | | $ | (81,541,399 | ) |
Service Class | | (103,664 | ) | | | (2,068,590 | ) | | (94,739 | ) | | | (1,633,952 | ) |
| | | | | | | | | | | | | | |
| | (4,125,290 | ) | | $ | (84,395,640 | ) | | (4,758,815 | ) | | $ | (83,175,351 | ) |
| | | | | | | | | | | | | | |
| |
| | | MFS Global Governments Portfolio | |
| | | Year ended 12/31/07 | | | Year ended 12/31/06 | |
| | | Shares | | | Amount | | | Shares | | | Amount | |
| Shares sold | | | | | | | | | | | | | | |
Initial Class | | 358,978 | | | $ | 3,895,230 | | | 235,784 | | | $ | 2,493,032 | |
Service Class | | 71,703 | | | | 777,100 | | | 128,161 | | | | 1,333,249 | |
| | | | | | | | | | | | | | |
| | 430,681 | | | $ | 4,672,330 | | | 363,945 | | | $ | 3,826,281 | |
| | | | | | | | | | | | | | |
| Shares issued to shareholders in reinvestment of distributions | | | | | | | | | | | | | | |
Initial Class | | 72,417 | | | $ | 767,617 | | | 39,420 | | | $ | 417,067 | |
Service Class | | 6,188 | | | | 65,103 | | | 3,961 | | | | 41,595 | |
| | | | | | | | | | | | | | |
| | 78,605 | | | $ | 832,720 | | | 43,381 | | | $ | 458,662 | |
| | | | | | | | | | | | | | |
| Shares reacquired | | | | | | | | | | | | | | |
Initial Class | | (936,883 | ) | | $ | (10,085,772 | ) | | (1,256,568 | ) | | $ | (13,131,770 | ) |
Service Class | | (76,814 | ) | | | (818,569 | ) | | (189,097 | ) | | | (1,971,128 | ) |
| | | | | | | | | | | | | | |
| | (1,013,697 | ) | | $ | (10,904,341 | ) | | (1,445,665 | ) | | $ | (15,102,898 | ) |
| | | | | | | | | | | | | | |
| Net change | | | | | | | | | | | | | | |
Initial Class | | (505,488 | ) | | $ | (5,422,925 | ) | | (981,364 | ) | | $ | (10,221,671 | ) |
Service Class | | 1,077 | | | | 23,634 | | | (56,975 | ) | | | (596,284 | ) |
| | | | | | | | | | | | | | |
| | (504,411 | ) | | $ | (5,399,291 | ) | | (1,038,339 | ) | | $ | (10,817,955 | ) |
| | | | | | | | | | | | | | |
92
MFS Variable Insurance Trust II
Notes to Financial Statements — continued
| | | | | | | | | | | | | | |
| | | MFS Massachusetts Investors Growth Stock Portfolio | |
| | | Year ended 12/31/07 | | | Year ended 12/31/06 | |
| | | Shares | | | Amount | | | Shares | | | Amount | |
| Shares sold | | | | | | | | | | | | | | |
Initial Class | | 260,832 | | | $ | 2,982,601 | | | 359,234 | | | $ | 3,639,849 | |
Service Class | | 305,897 | | | | 3,242,891 | | | 776,618 | | | | 7,634,816 | |
| | | | | | | | | | | | | | |
| | 566,729 | | | $ | 6,225,492 | | | 1,135,852 | | | $ | 11,274,665 | |
| | | | | | | | | | | | | | |
| Shares issued in connection with acquisition of Strategic Growth Series | | | | | | | | | | | | | | |
Initial Class | | 2,598,220 | | | $ | 29,132,978 | | | | | | | | |
Service Class | | 3,576,586 | | | | 39,797,947 | | | | | | | | |
| | | | | | | | | | | | | | |
| | 6,174,806 | | | $ | 68,930,925 | | | | | | | | |
| | | | | | | | | | | | | | |
| Shares issued to shareholders in reinvestment of distributions | | | | | | | | | | | | | | |
Initial Class | | 106,664 | | | $ | 1,191,441 | | | 34,499 | | | $ | 344,988 | |
Service Class | | 10,692 | | | | 118,578 | | | — | | | | — | |
| | | | | | | | | | | | | | |
| | 117,356 | | | $ | 1,310,019 | | | 34,499 | | | $ | 344,988 | |
| | | | | | | | | | | | | | |
| Shares reacquired | | | | | | | | | | | | | | |
Initial Class | | (8,488,648 | ) | | $ | (94,925,383 | ) | | (8,891,386 | ) | | $ | (88,512,406 | ) |
Service Class | | (2,100,736 | ) | | | (23,626,156 | ) | | (1,470,699 | ) | | | (14,597,256 | ) |
| | | | | | | | | | | | | | |
| | (10,589,384 | ) | | $ | (118,551,539 | ) | | (10,362,085 | ) | | $ | (103,109,662 | ) |
| | | | | | | | | | | | | | |
| Net change | | | | | | | | | | | | | | |
Initial Class | | (5,522,932 | ) | | $ | (61,618,363 | ) | | (8,497,653 | ) | | $ | (84,527,569 | ) |
Service Class | | 1,792,439 | | | | 19,533,260 | | | (694,081 | ) | | | (6,962,440 | ) |
| | | | | | | | | | | | | | |
| | (3,730,493 | ) | | $ | (42,085,103 | ) | | (9,191,734 | ) | | $ | (91,490,009 | ) |
| | | | | | | | | | | | | | |
| | | MFS Mid Cap Growth Portfolio | |
| | | Year ended 12/31/07 | | | Year ended 12/31/06 | |
| | | Shares | | | Amount | | | Shares | | | Amount | |
| Shares sold | | | | | | | | | | | | | | |
Initial Class | | 389,149 | | | $ | 2,594,560 | | | 400,973 | | | $ | 2,426,001 | |
Service Class | | 149,937 | | | | 981,054 | | | 533,490 | | | | 3,078,905 | |
| | | | | | | | | | | | | | |
| | 539,086 | | | $ | 3,575,614 | | | 934,463 | | | $ | 5,504,906 | |
| | | | | | | | | | | | | | |
| Shares issued to shareholders in reinvestment of distributions | | | | | | | | | | | | | | |
Initial Class | | 2,899 | | | $ | 19,627 | | | — | | | $ | — | |
| | | | | | | | | | | | | | |
| Shares reacquired | | | | | | | | | | | | | | |
Initial Class | | (2,445,271 | ) | | $ | (16,132,853 | ) | | (3,144,946 | ) | | $ | (18,591,829 | ) |
Service Class | | (1,240,919 | ) | | | (8,143,852 | ) | | (1,521,208 | ) | | | (8,929,540 | ) |
| | | | | | | | | | | | | | |
| | (3,686,190 | ) | | $ | (24,276,705 | ) | | (4,666,154 | ) | | $ | (27,521,369 | ) |
| | | | | | | | | | | | | | |
| Net change | | | | | | | | | | | | | | |
Initial Class | | (2,053,223 | ) | | $ | (13,518,666 | ) | | (2,743,973 | ) | | $ | (16,165,828 | ) |
Service Class | | (1,090,982 | ) | | | (7,162,798 | ) | | (987,718 | ) | | | (5,850,635 | ) |
| | | | | | | | | | | | | | |
| | (3,144,205 | ) | | $ | (20,681,464 | ) | | (3,731,691 | ) | | $ | (22,016,463 | ) |
| | | | | | | | | | | | | | |
| | | MFS Mid Cap Value Portfolio | |
| | | Year ended 12/31/07 | | | Year ended 12/31/06 | |
| | | Shares | | | Amount | | | Shares | | | Amount | |
| Shares sold | | | | | | | | | | | | | | |
Initial Class | | — | | | $ | — | | | — | | | $ | — | |
Service Class | | 217,552 | | | | 2,503,318 | | | 183,028 | | | | 2,089,221 | |
| | | | | | | | | | | | | | |
| | 217,552 | | | $ | 2,503,318 | | | 183,028 | | | $ | 2,089,221 | |
| | | | | | | | | | | | | | |
| Shares issued to shareholders in reinvestment of distributions | | | | | | | | | | | | | | |
Initial Class | | 134 | | | $ | 1,638 | | | 347 | | | $ | 3,796 | |
Service Class | | 89,059 | | | | 1,084,737 | | | 284,083 | | | | 3,082,304 | |
| | | | | | | | | | | | | | |
| | 89,193 | | | $ | 1,086,375 | | | 284,430 | | | $ | 3,086,100 | |
| | | | | | | | | | | | | | |
| Shares reacquired | | | | | | | | | | | | | | |
Initial Class | | — | | | $ | — | | | — | | | $ | — | |
Service Class | | (480,463 | ) | | | (5,619,245 | ) | | (514,091 | ) | | | (5,768,124 | ) |
| | | | | | | | | | | | | | |
| | (480,463 | ) | | $ | (5,619,245 | ) | | (514,091 | ) | | $ | (5,768,124 | ) |
| | | | | | | | | | | | | | |
| Net change | | | | | | | | | | | | | | |
Initial Class | | 134 | | | $ | 1,638 | | | 347 | | | $ | 3,796 | |
Service Class | | (173,852 | ) | | | (2,031,190 | ) | | (46,980 | ) | | | (596,599 | ) |
| | | | | | | | | | | | | | |
| | (173,718 | ) | | $ | (2,029,552 | ) | | (46,633 | ) | | $ | (592,803 | ) |
| | | | | | | | | | | | | | |
93
MFS Variable Insurance Trust II
Notes to Financial Statements — continued
| | | | | | | | | | | | | | |
| | | MFS Money Market Portfolio | |
| | | Year ended 12/31/07 | | | Year ended 12/31/06 | |
| | | Shares | | | Amount | | | Shares | | | Amount | |
| Shares sold | | | | | | | | | | | | | | |
Initial Class | | 126,931,988 | | | $ | 126,932,032 | | | 131,247,795 | | | $ | 131,247,749 | |
Service Class | | 119,485,604 | | | | 119,485,687 | | | 84,823,109 | | | | 84,823,094 | |
| | | | | | | | | | | | | | |
| | 246,417,592 | | | $ | 246,417,719 | | | 216,070,904 | | | $ | 216,070,843 | |
| | | | | | | | | | | | | | |
| Shares issued to shareholders in reinvestment of distributions | | | | | | | | | | | | | | |
Initial Class | | 14,441,321 | | | $ | 14,441,278 | | | 11,590,459 | | | $ | 11,590,505 | |
Service Class | | 8,661,517 | | | | 8,661,434 | | | 6,013,081 | | | | 6,013,101 | |
| | | | | | | | | | | | | | |
| | 23,102,838 | | | $ | 23,102,712 | | | 17,603,540 | | | $ | 17,603,606 | |
| | | | | | | | | | | | | | |
| Shares reacquired | | | | | | | | | | | | | | |
Initial Class | | (103,602,263 | ) | | $ | (103,602,263 | ) | | (101,466,658 | ) | | $ | (101,466,658 | ) |
Service Class | | (58,127,331 | ) | | | (58,127,331 | ) | | (50,553,304 | ) | | | (50,553,304 | ) |
| | | | | | | | | | | | | | |
| | (161,729,594 | ) | | $ | (161,729,594 | ) | | (152,019,962 | ) | | $ | (152,019,962 | ) |
| | | | | | | | | | | | | | |
| Net change | | | | | | | | | | | | | | |
Initial Class | | 37,771,046 | | | $ | 37,771,047 | | | 41,371,596 | | | $ | 41,371,596 | |
Service Class | | 70,019,790 | | | | 70,019,790 | | | 40,282,886 | | | | 40,282,891 | |
| | | | | | | | | | | | | | |
| | 107,790,836 | | | $ | 107,790,837 | | | 81,654,482 | | | $ | 81,654,487 | |
| | | | | | | | | | | | | | |
| |
| | | MFS New Discovery Portfolio | |
| | | Year ended 12/31/07 | | | Year ended 12/31/06 | |
| | | Shares | | | Amount | | | Shares | | | Amount | |
| Shares sold | | | | | | | | | | | | | | |
Initial Class | | 334,611 | | | $ | 5,537,950 | | | 425,391 | | | $ | 6,275,390 | |
Service Class | | 1,437,743 | | | | 23,493,591 | | | 3,563,774 | | | | 52,684,200 | |
| | | | | | | | | | | | | | |
| | 1,772,354 | | | $ | 29,031,541 | | | 3,989,165 | | | $ | 58,959,590 | |
| | | | | | | | | | | | | | |
| Shares issued to shareholders in reinvestment of distributions | | | | | | | | | | | | | | |
Initial Class | | 239,064 | | | $ | 4,140,582 | | | — | | | $ | — | |
Service Class | | 303,786 | | | | 5,182,591 | | | — | | | | — | |
| | | | | | | | | | | | | | |
| | 542,850 | | | $ | 9,323,173 | | | — | | | $ | — | |
| | | | | | | | | | | | | | |
| Shares reacquired | | | | | | | | | | | | | | |
Initial Class | | (2,652,413 | ) | | $ | (45,045,710 | ) | | (2,675,264 | ) | | $ | (40,407,070 | ) |
Service Class | | (1,390,282 | ) | | | (23,245,619 | ) | | (1,485,598 | ) | | | (22,871,984 | ) |
| | | | | | | | | | | | | | |
| | (4,042,695 | ) | | $ | (68,291,329 | ) | | (4,160,862 | ) | | $ | (63,279,054 | ) |
| | | | | | | | | | | | | | |
| Net change | | | | | | | | | | | | | | |
Initial Class | | (2,078,738 | ) | | $ | (35,367,178 | ) | | (2,249,873 | ) | | $ | (34,131,680 | ) |
Service Class | | 351,247 | | | | 5,430,563 | | | 2,078,176 | | | | 29,812,216 | |
| | | | | | | | | | | | | | |
| | (1,727,491 | ) | | $ | (29,936,615 | ) | | (171,697 | ) | | $ | (4,319,464 | ) |
| | | | | | | | | | | | | | |
| |
| | | MFS Research Portfolio | |
| | | Year ended 12/31/07 | | | Year ended 12/31/06 | |
| | | Shares | | | Amount | | | Shares | | | Amount | |
| Shares sold | | | | | | | | | | | | | | |
Initial Class | | 53,557 | | | $ | 1,057,398 | | | 12,107 | | | $ | 210,821 | |
Service Class | | 97,661 | | | | 1,929,400 | | | 175,418 | | | | 3,037,598 | |
| | | | | | | | | | | | | | |
| | 151,218 | | | $ | 2,986,798 | | | 187,525 | | | $ | 3,248,419 | |
| | | | | | | | | | | | | | |
| Shares issued to shareholders in reinvestment of distributions | | | | | | | | | | | | | | |
Initial Class | | 121,149 | | | $ | 2,461,746 | | | 124,854 | | | $ | 2,194,925 | |
Service Class | | 9,020 | | | | 182,290 | | | 6,722 | | | | 117,575 | |
| | | | | | | | | | | | | | |
| | 130,169 | | | $ | 2,644,036 | | | 131,576 | | | $ | 2,312,500 | |
| | | | | | | | | | | | | | |
| Shares reacquired | | | | | | | | | | | | | | |
Initial Class | | (3,963,323 | ) | | $ | (79,821,096 | ) | | (5,123,179 | ) | | $ | (89,614,801 | ) |
Service Class | | (302,401 | ) | | | (6,102,883 | ) | | (262,350 | ) | | | (4,590,067 | ) |
| | | | | | | | | | | | | | |
| | (4,265,724 | ) | | $ | (85,923,979 | ) | | (5,385,529 | ) | | $ | (94,204,868 | ) |
| | | | | | | | | | | | | | |
| Net change | | | | | | | | | | | | | | |
Initial Class | | (3,788,617 | ) | | $ | (76,301,952 | ) | | (4,986,218 | ) | | $ | (87,209,055 | ) |
Service Class | | (195,720 | ) | | | (3,991,193 | ) | | (80,210 | ) | | | (1,434,894 | ) |
| | | | | | | | | | | | | | |
| | (3,984,337 | ) | | $ | (80,293,145 | ) | | (5,066,428 | ) | | $ | (88,643,949 | ) |
| | | | | | | | | | | | | | |
94
MFS Variable Insurance Trust II
Notes to Financial Statements — continued
| | | | | | | | | | | | | | |
| | | MFS Strategic Income Portfolio | |
| | | Year ended 12/31/07 | | | Year ended 12/31/06 | |
| | | Shares | | | Amount | | | Shares | | | Amount | |
| Shares sold | | | | | | | | | | | | | | |
Initial Class | | 431,832 | | | $ | 4,503,427 | | | 429,421 | | | $ | 4,446,481 | |
Service Class | | 135,110 | | | | 1,394,660 | | | 299,504 | | | | 3,094,181 | |
| | | | | | | | | | | | | | |
| | 566,942 | | | $ | 5,898,087 | | | 728,925 | | | $ | 7,540,662 | |
| | | | | | | | | | | | | | |
| Shares issued to shareholders in reinvestment of distributions | | | | | | | | | | | | | | |
Initial Class | | 281,653 | | | $ | 2,912,294 | | | 399,735 | | | $ | 4,029,323 | |
Service Class | | 102,254 | | | | 1,051,166 | | | 147,040 | | | | 1,474,816 | |
| | | | | | | | | | | | | | |
| | 383,907 | | | $ | 3,963,460 | | | 546,775 | | | $ | 5,504,139 | |
| | | | | | | | | | | | | | |
| Shares reacquired | | | | | | | | | | | | | | |
Initial Class | | (1,071,663 | ) | | $ | (11,113,051 | ) | | (1,276,321 | ) | | $ | (13,358,088 | ) |
Service Class | | (456,484 | ) | | �� | (4,762,343 | ) | | (492,786 | ) | | | (5,144,709 | ) |
| | | | | | | | | | | | | | |
| | (1,528,147 | ) | | $ | (15,875,394 | ) | | (1,769,107 | ) | | $ | (18,502,797 | ) |
| | | | | | | | | | | | | | |
| Net change | | | | | | | | | | | | | | |
Initial Class | | (358,178 | ) | | $ | (3,697,330 | ) | | (447,165 | ) | | $ | (4,882,284 | ) |
Service Class | | (219,120 | ) | | | (2,316,517 | ) | | (46,242 | ) | | | (575,712 | ) |
| | | | | | | | | | | | | | |
| | (577,298 | ) | | $ | (6,013,847 | ) | | (493,407 | ) | | $ | (5,457,996 | ) |
| | | | | | | | | | | | | | |
| |
| | | MFS Strategic Value Portfolio | |
| | | Year ended 12/31/07 | | | Year ended 12/31/06 | |
| | | Shares | | | Amount | | | Shares | | | Amount | |
| Shares sold | | | | | | | | | | | | | | |
Initial Class | | — | | | $ | — | | | — | | | $ | — | |
Service Class | | 61,021 | | | | 633,855 | | | 47,690 | | | | 470,541 | |
| | | | | | | | | | | | | | |
| | 61,021 | | | $ | 633,855 | | | 47,690 | | | $ | 470,541 | |
| | | | | | | | | | | | | | |
| Shares issued to shareholders in reinvestment of distributions | | | | | | | | | | | | | | |
Initial Class | | 86 | | | $ | 925 | | | 83 | | | $ | 816 | |
Service Class | | 68,224 | | | | 732,044 | | | 88,073 | | | | 861,357 | |
| | | | | | | | | | | | | | |
| | 68,310 | | | $ | 732,969 | | | 88,156 | | | $ | 862,173 | |
| | | | | | | | | | | | | | |
| Shares reacquired | | | | | | | | | | | | | | |
Service Class | | — | | | $ | — | | | — | | | $ | — | |
Service Class | | (216,477 | ) | | | (2,296,177 | ) | | (325,565 | ) | | | (3,246,897 | ) |
| | | | | | | | | | | | | | |
| | (216,477 | ) | | $ | (2,296,177 | ) | | (325,565 | ) | | $ | (3,246,897 | ) |
| | | | | | | | | | | | | | |
| Net change | | | | | | | | | | | | | | |
Initial Class | | 86 | | | $ | 925 | | | 83 | | | $ | 816 | |
Service Class | | (87,232 | ) | | | (930,278 | ) | | (189,802 | ) | | | (1,914,999 | ) |
| | | | | | | | | | | | | | |
| | (87,146 | ) | | $ | (929,353 | ) | | (189,719 | ) | | $ | (1,914,183 | ) |
| | | | | | | | | | | | | | |
| |
| | | MFS Technology Portfolio | |
| | | Year ended 12/31/07 | | | Year ended 12/31/06 | |
| | | Shares | | | Amount | | | Shares | | | Amount | |
| Shares sold | | | | | | | | | | | | | | |
Initial Class | | 613,355 | | | $ | 3,959,968 | | | 558,854 | | | $ | 2,736,403 | |
Service Class | | 106,567 | | | | 665,934 | | | 108,297 | | | | 493,805 | |
| | | | | | | | | | | | | | |
| | 719,922 | | | $ | 4,625,902 | | | 667,151 | | | $ | 3,230,208 | |
| | | | | | | | | | | | | | |
| Shares reacquired | | | | | | | | | | | | | | |
Initial Class | | (836,111 | ) | | $ | (4,988,422 | ) | | (1,356,989 | ) | | $ | (6,503,016 | ) |
Service Class | | (141,574 | ) | | | (827,626 | ) | | (287,427 | ) | | | (1,328,506 | ) |
| | | | | | | | | | | | | | |
| | (977,685 | ) | | $ | (5,816,048 | ) | | (1,644,416 | ) | | $ | (7,831,522 | ) |
| | | | | | | | | | | | | | |
| Net change | | | | | | | | | | | | | | |
Initial Class | | (222,756 | ) | | $ | (1,028,454 | ) | | (798,135 | ) | | $ | (3,766,613 | ) |
Service Class | | (35,007 | ) | | | (161,692 | ) | | (179,130 | ) | | | (834,701 | ) |
| | | | | | | | | | | | | | |
| | (257,763 | ) | | $ | (1,190,146 | ) | | (977,265 | ) | | $ | (4,601,314 | ) |
| | | | | | | | | | | | | | |
95
MFS Variable Insurance Trust II
Notes to Financial Statements — continued
(6) Line of Credit
Each fund and other funds managed by MFS participate in a $1 billion unsecured committed line of credit provided by a syndication of banks under a credit agreement. In addition, the funds and other funds managed by MFS have established uncommitted borrowing arrangements with certain banks. Borrowings may be made for temporary financing needs. Interest is charged to each fund, based on its borrowings, generally at a rate equal to the Federal Reserve funds rate plus 0.30%. In addition, a commitment fee, based on the average daily, unused portion of the committed line of credit, is allocated among the participating funds at the end of each calendar quarter. For the year ended December 31, 2007, each fund’s commitment fee and interest expense were as follows and are included in miscellaneous expense on the Statements of Operations:
| | | | | | |
| | | Commitment
Fee | | Interest
Expense |
MFS Capital Appreciation Portfolio | | $ | 2,289 | | $ | 591 |
MFS Emerging Growth Portfolio | | | 1,314 | | | — |
MFS Global Governments Portfolio | | | 180 | | | — |
MFS Massachusetts Investors Growth Stock Portfolio | | | 1,948 | | | 319 |
MFS Mid Cap Growth Portfolio | | | 367 | | | 613 |
MFS Mid Cap Value Portfolio | | | 117 | | | — |
MFS Money Market Portfolio | | | 1,150 | | | — |
MFS New Discovery Portfolio | | | 1,703 | | | 2,178 |
MFS Research Portfolio | | | 1,457 | | | 6,149 |
MFS Strategic Income Portfolio | | | 342 | | | — |
MFS Strategic Value Portfolio | | | 39 | | | — |
MFS Technology Portfolio | | | 96 | | | — |
(7) Acquisitions
At close of business on June 22, 2007, the MFS Massachusetts Investors Growth Stock Portfolio (the “fund”) acquired all of the assets and liabilities of Strategic Growth Series. The acquisition was accomplished by a tax-free exchange of 6,174,806 shares of the fund (valued at $68,930,925) for all of the assets and liabilities of Strategic Growth Series. Strategic Growth Series then distributed the shares of the fund that the Strategic Growth Series received from the fund to its shareholders. Strategic Growth Series’ net assets on that date were $68,930,925, including $7,565,896 of unrealized appreciation, $815 of accumulated net investment loss, and $39,999,752 of accumulated net realized loss on investments and foreign currency transactions. The aggregate net assets of the fund after the acquisition were $475,382,849.
96
Report of Independent Registered Public Accounting Firm
To the Board of Trustees and the Shareholders of MFS Variable Insurance Trust II (formerly known as MFS/Sun Life Series Trust):
We have audited the accompanying statements of assets and liabilities, including the portfolios of investments, of MFS Variable Insurance Trust II (formerly known as MFS/Sun Life Series Trust) (the “Trust”), comprising MFS Capital Appreciation Portfolio (formerly known as Capital Appreciation Series), MFS Emerging Growth Portfolio (formerly known as Emerging Growth Series), MFS Global Governments Portfolio (formerly known as Global Governments Series), MFS Massachusetts Investors Growth Stock Portfolio (formerly known as Massachusetts Investors Growth Stock Series), MFS Mid Cap Growth Portfolio (formerly known as Mid Cap Growth Series), MFS Mid Cap Value Portfolio (formerly known as Mid Cap Value Series), MFS Money Market Portfolio (formerly known as Money Market Series), MFS New Discovery Portfolio (formerly known as New Discovery Series), MFS Research Portfolio (formerly known as Research Series), MFS Strategic Income Portfolio (formerly known as Strategic Income Series), MFS Strategic Value Portfolio (formerly known as Strategic Value Series) and MFS Technology Portfolio (formerly known as Technology Series) as of December 31, 2007, and the related statements of operations for the year then ended, the statements of changes in net assets for each of the two years in the period then ended, and the financial highlights for each of the five years in the period then ended. These financial statements and financial highlights are the responsibility of the Trust’s management. Our responsibility is to express an opinion on these financial statements and financial highlights based on our audits.
We conducted our audits in accordance with the standards of the Public Company Accounting Oversight Board (United States). Those standards require that we plan and perform the audit to obtain reasonable assurance about whether the financial statements and financial highlights are free of material misstatement. The Trust is not required to have, nor were we engaged to perform, an audit of its internal control over financial reporting. Our audits included consideration of internal control over financial reporting as a basis for designing audit procedures that are appropriate in the circumstances, but not for the purpose of expressing an opinion on the effectiveness of the Trust’s internal control over financial reporting. Accordingly, we express no such opinion. An audit also includes examining, on a test basis, evidence supporting the amounts and disclosures in the financial statements, assessing the accounting principles used and significant estimates made by management, as well as evaluating the overall financial statement presentation. Our procedures included confirmation of securities owned as of December 31, 2007, by correspondence with the custodian and brokers; where replies were not received from brokers, we performed other auditing procedures. We believe that our audits provide a reasonable basis for our opinion.
In our opinion, such financial statements and financial highlights present fairly, in all material respects, the financial position of MFS Capital Appreciation Portfolio, MFS Emerging Growth Portfolio, MFS Global Governments Portfolio, MFS Massachusetts Investors Growth Stock Portfolio, MFS Mid Cap Growth Portfolio, MFS Mid Cap Value Portfolio, MFS Money Market Portfolio, MFS New Discovery Portfolio, MFS Research Portfolio, MFS Strategic Income Portfolio, MFS Strategic Value Portfolio and MFS Technology Portfolio as of December 31, 2007, the results of their operations for the year then ended, the changes in their net assets for each of the two years in the period then ended, and their financial highlights for each of the five years in the period then ended, in conformity with accounting principles generally accepted in the United States of America.
DELOITTE & TOUCHE LLP
Boston, Massachusetts
February 15, 2008
97
MFS Variable Insurance Trust II
Trustees and Officers — Identification and Background
The Trustees and officers of the Trust, as of February 1, 2008, are listed below, together with their principal occupations during the past five years. (Their titles may have varied during that period.) The address of each Trustee and officer is 500 Boylston Street, Boston, Massachusetts 02116.
| | | | | | |
| | | | |
| Name, Date of Birth | | Position(s) Held
with Fund | | Trustee/Officer
Since(1) | | Principal Occupations During the Past Five
Years and Other Directorships(2) |
| INTERESTED TRUSTEE | | | | | | |
David D. Horn(3) (born 06/07/41) | | Trustee | | April 1986 | | Private investor; Retired; Sun Life Assurance Company of Canada, Former Senior Vice President and General Manager for the United States (until 1997); Retired: Sun Life Assurance Company of Canada, Director (until March 2004) |
| | | | | | | |
| INDEPENDENT TRUSTEES | | | | | | |
J. Kermit Birchfield (born 01/08/40) | | Chairman | | May 1997 | | Consultant; Century Partners, Inc. (investments), Director (1988 to present); Displaytech, Inc. (technology), Director (1995 to present); Dessin Fournir LLC (furniture manufacturer), Director (2005 to present); Intermountain Gas Company, Inc. & Intermountain Industries, Inc. (oil & gas exploration and production) (1988 to present); Site Watch LLC (software to monitor oil tanks) Managing Director (2006 to present); Juridica Investments (fund investing in judicial matters) Director (2007 to present); Dairy Mart Convenience Stores, Inc. (convenience stores), Chairman (1997 to 2003) |
| | | | | | | |
Robert C. Bishop (born 01/13/43) | | Trustee | | May 2001 | | Autolmmune Inc. (pharmaceutical product licensing), Chairman, President and Chief Executive Officer (1992 to present); Caliper Life Sciences Corp. (laboratory analytical instruments), Director (2002 to present); Millipore Corporation ( biopharmaceutical/research laboratory products), Director (1997 to present); Optobionics Corporation (ophthalmic devices), Director (2002 to 2007); Quintiles Transnational Corp. (contract research services), Director (until 2003) |
| | | | | | | |
Frederick H. Dulles (born 03/12/42) | | Trustee | | May 2001 | | Ten State International Law PLLC (law firm), Of Counsel (since 2006); Prudential Carolina Real Estate, (real estate), Broker (since 2006); Free Enterprise Foundation, Inc. (research institute), Director & Secretary (until 2008); Disher, Hamrick & Myers Residential, Inc. (real estate) Broker (until 2006); Frederick H. Dulles law practice (until 2006); Ten State Street LLP (law firm), Member (until 2005); McFadden, Pilkington & Ward LLP (solicitors and registered foreign lawyers), Member & Of Counsel (until 2003) |
98
Trustees and Officers — Identification and Background — continued
| | | | | | |
| | | | |
| Name, Date of Birth | | Position(s) Held
with Fund | | Trustee/Officer
Since(1) | | Principal Occupations During the Past Five
Years and Other Directorships(2) |
| | | | | | | |
Marcia A. Kean (born 06/30/48) | | Trustee | | April 2005 | | Feinstein Kean Healthcare (consulting), Chief Executive Officer (since December 2002), Managing Director (prior to May 2001); Ardais Corporation (biotech products), Senior Vice President – Commercialization (February 2002 until November 2002) |
| | | | | | | |
Ronald G. Steinhart (born 06/15/40) | | Trustee | | May 2001 | | Private investor; Penske Automotive Group (automotive retailer), Director (2001 to present); Penson Worldwide, Inc. (securities clearance), Director (2006 to present); Animal Health International, Inc. (animal health products), Director (2007 to present); Texas Industries (concrete/aggregates/cement), Director (2007 to present); Carreker Corporation (technology consulting) Director (until 2005); Prentiss Properties Trust (real estate investment trust), Director (until 2006) |
| | | | | | | |
Haviland Wright (born 07/21/48) | | Trustee | | May 2001 | | Elixir Technologies Corporation (software) Director (2005 to present); Nano Loa Inc. (liquid crystal displays), Director (2003 to present); Silk Displays, Inc. (smart polymers) Director (2007 to present); Displaytech, Inc. (technology) Chairman and CEO (1995 – 2002) |
| | | | | | | |
| TRUSTEE EMERITUS | | | | | | |
Samuel Adams (born 10/19/25) | | Trustee Emeritus | | | | Retired; Kirkpatrick & Lockhart Preston Gates Ellis LLP (law firm), Of Counsel |
| | | | | | | |
| OFFICERS | | | | | | |
Maria F. Dwyer(4) (born 12/01/58) | | President | | November 2005 | | Massachusetts Financial Services Company, Executive Vice President and Chief Regulatory Officer (since March 2004); Fidelity Management & Research Company, Vice President (prior to March 2004); Fidelity Group of Funds, President and Treasurer (prior to March 2004) |
| | | | | | | |
Tracy Atkinson(4) (born 12/30/64) | | Treasurer | | September 2005 | | Massachusetts Financial Services Company, Senior Vice President (since September 2004); PricewaterhouseCoopers LLP, Partner (prior to September 2004) |
| | | | | | | |
Christopher R. Bohane(4) (born 01/18/74) | | Assistant Secretary and Assistant Clerk | | July 2005 | | Massachusetts Financial Services Company, Vice President and Senior Counsel (since April 2003); Kirkpatrick & Lockhart LLP (law firm), Associate (prior to April 2003) |
99
Trustees and Officers — Identification and Background — continued
| | | | | | |
| | | | |
| Name, Date of Birth | | Position(s) Held
with Fund | | Trustee/Officer
Since(1) | | Principal Occupations During the Past Five
Years and Other Directorships(2) |
| | | | | | | |
Ethan D. Corey(4) (born 11/21/63) | | Assistant Secretary and Assistant Clerk | | July 2005 | | Massachusetts Financial Services Company, Senior Vice President and Associate General Counsel (since April 2006); Special Counsel (prior to April 2006); Dechert LLP (law firm), Counsel (prior to December 2004) |
| | | | | | | |
David L. DiLorenzo(4) (born 08/10/68) | | Assistant Treasurer | | July 2005 | | Massachusetts Financial Services Company, Vice President (since June 2005); JP Morgan Investor Services, Vice President (January 2001 to June 2005) |
| | | | | | | |
Timothy M. Fagan(4) (born 07/10/68) | | Assistant Secretary and Assistant Clerk | | September 2005 | | Massachusetts Financial Services Company, Vice President and Senior Counsel (since September 2005); John Hancock Advisers, LLC, Vice President and Chief Compliance Officer (September 2004 to August 2005) Senior Attorney (prior to September 2004); John Hancock Group of Funds, Vice President and Chief Compliance Officer (September 2004 to December 2004) |
| | | | | | | |
Mark D. Fischer(4) (born 10/27/70) | | Assistant Treasurer | | July 2005 | | Massachusetts Financial Services Company, Vice President (since May 2005); JP Morgan Investment Management Company, Vice President (prior to May 2005) |
| | | | | | | |
Brian E. Langenfeld(4) (born 03/07/73) | | Assistant Secretary and Assistant Clerk | | May 2006 | | Massachusetts Financial Services Company, Assistant Vice President and Counsel (since May 2006); John Hancock Advisers, LLC, Assistant Vice President and Counsel (May 2005 to April 2006); John Hancock Advisers, LLC, Attorney and Assistant Secretary (prior to May 2005) |
| | | | | | | |
Ellen Moynihan(4) (born 11/13/57) | | Assistant Treasurer | | May 1997 | | Massachusetts Financial Services Company, Senior Vice President |
| | | | | | | |
Susan S. Newton(4) (born 03/07/50) | | Assistant Secretary and Assistant Clerk | | May 2005 | | Massachusetts Financial Services Company, Senior Vice President and Assistant General Counsel (since April 2005); John Hancock Advisers, LLC, Senior Vice President, Secretary and Chief Legal Officer (prior to April 2005); John Hancock Group of Funds, Senior Vice President, Secretary and Chief Legal Officer (prior to April 2005) |
100
Trustees and Officers — Identification and Background — continued
| | | | | | |
| | | | |
| Name, Date of Birth | | Position(s) Held
with Fund | | Trustee/Officer
Since(1) | | Principal Occupations During the Past Five
Years and Other Directorships(2) |
| | | | | | | |
Susan A. Pereira(4) (born 11/05/70) | | Assistant Secretary and Assistant Clerk | | July 2005 | | Massachusetts Financial Services Company, Vice President and Senior Counsel (since June 2004); Bingham McCutchen LLP (law firm), Associate (January 2001 to June 2004) |
| | | | | | | |
Mark N. Polebaum(4) (born 05/01/52) | | Secretary and Assistant Clerk | | February 2006 | | Massachusetts Financial Services Company, Executive Vice President, General Counsel and Secretary (since January 2006); Wilmer Cutler Pickering Hale and Dorr LLP (law firm), Partner (prior to January 2006) |
| | | | | | | |
Frank L. Tarantino (born 03/07/44) | | Independent Chief Compliance Officer | | September 2004 | | Tarantino LLC (provider of compliance services), Principal (since June 2004); CRA Business Strategies Group (consulting services), Executive Vice President (April 2003 to June 2004); David L. Babson & Co. (investment adviser), Managing Director, Chief Administrative Officer and Director (February 1997 to March 2003) |
| | | | | | | |
Richard S. Weitzel(4) (born 7/16/70) | | Assistant Secretary and Assistant Clerk | | October 2007 | | Massachusetts Financial Services Company, Vice President and Assistant General Counsel (since 2007); Vice President and Senior Counsel (since May 2004); Massachusetts Department of Business and Technology, General Counsel (February 2003 to April 2004); Massachusetts Office of the Attorney General, Assistant Attorney General ( April 2001 to February 2003); Ropes and Gray, Associate (prior to April 2001) |
| | | | | | | |
James O. Yost(4) (born 06/12/60) | | Assistant Treasurer | | April 1992 | | Massachusetts Financial Services Company, Senior Vice President |
| (1) | Date first appointed to serve as Trustee/Officer of a MFS fund or a Compass variable account. Each Trustee has served continuously since appointment. |
| (2) | Directorships or trusteeships of companies required to report to the Securities and Exchange Commission (i.e., “public companies”). |
| (3) | “Interested person” of the Sun Life of Canada (U.S.), within the meaning of the Investment Company Act of 1940 (referred to as the 1940 Act), which is the principal federal law governing investment companies like the Series. The address of Sun Life of Canada (U.S.) is One Sun Life Executive Park, Wellesley Hills, Massachusetts 02481. |
| (4) | “Interested person” of MFS within the meaning of the 1940 Act. The address of MFS is 500 Boylston Street, Boston, Massachusetts 02116. |
The Trust does not hold annual meetings for the purpose of electing Trustees, and Trustees are not elected for fixed terms. Each Trustee and officer holds office until his or her successor is chosen and qualified, or until his or her earlier death, resignation, retirement or removal.
All Trustees currently serve as Trustees of the Trust and have served in that capacity since originally elected or appointed. All of the Trustees are also Managers of the Compass Variable Accounts. The executive officers of the Trust hold similar offices for the Compass Variable Accounts and other funds in the MFS fund complex. As of January 1, 2008, each Trustee serves as a Trustee or Manager of 35 Accounts/Funds.
The Statement of Additional Information contains further information about the Trustees and is available without charge upon request by calling 1-800-752-7215.
101
MFS Variable Insurance Trust II
Board Review of Investment Advisory Agreement
The Investment Company Act of 1940 requires that both the full Board of Trustees and a majority of the non-interested (“independent”) Trustees, voting separately, annually approve the continuation of the Trust’s investment advisory agreements with Massachusetts Financial Services Company (MFS) on behalf of the Funds. The Trustees consider matters bearing on the Funds and their advisory arrangements at their meetings throughout the year, including a review of performance data at each regular meeting. In addition, the independent Trustees met several times over the course of three months beginning in May and ending in July 2007 (“contract review meetings”) for the specific purpose of considering whether to approve the continuation of the investment advisory agreements for the Funds. The independent Trustees were assisted in their evaluation of the investment advisory agreements by independent legal counsel, from whom they received separate legal advice and with whom they met separately from MFS management during various contract review meetings. The independent Trustees were also assisted in this process by the Funds’ Independent Chief Compliance Officer, a full-time senior officer appointed by and reporting to the independent Trustees.
In connection with their deliberations, the Trustees, including the independent Trustees, considered such information and factors as they believed, in light of the legal advice furnished to them and their own business judgment, to be relevant. The investment advisory agreements were considered separately for each Fund, although the Trustees also took into account the common interests of all Funds in their review. As described below, the Trustees considered the nature, quality, and extent of the various investment advisory, administrative, and shareholder services performed by MFS under the existing investment advisory agreements and other arrangements with the Trust.
In connection with their contract review meetings, the Trustees received and relied upon materials which included, among other items: (i) information provided by Lipper Inc. on the investment performance of each Fund for various time periods ended December 31, 2006, compared to the investment performance of a group of funds with substantially similar investment classifications/objectives (the “Lipper performance universe”), as well as the investment performance of a group of funds identified by objective criteria suggested by MFS (“peer funds”), (ii) information provided by Lipper Inc. on each Fund’s advisory fees and other expenses compared to the advisory fees and other expenses of comparable funds identified by Lipper (the “Lipper expense group”), as well as the advisory fees and other expenses of peer funds identified by objective criteria suggested by MFS, (iii) information provided by MFS on the advisory fees of comparable portfolios of its other clients, including institutional separate account and other clients, (iv) information as to whether, and to what extent applicable, expense waivers, reimbursements or fee “breakpoints” are observed for a Fund, (v) information regarding MFS’ financial results and financial condition, including MFS’ and certain of its affiliates’ estimated profitability from services performed for the Funds, (vi) MFS’ views regarding the outlook for the mutual fund industry and its strategic business plans, (vii) descriptions of various functions performed by MFS for the Trust, such as compliance monitoring and portfolio trading practices, and (viii) information regarding the overall organization of MFS, including information about MFS’ senior management and other personnel providing investment advisory, administrative and other services to the Funds. The comparative performance, fee and expense information prepared and provided by Lipper Inc. was not independently verified, and the independent Trustees did not independently verify any information provided to them by MFS.
The Trustees’ conclusions as to the continuation of the investment advisory agreements were based on comprehensive consideration of all information provided to the Trustees and not the result of any single factor. Some of the factors that figured particularly in the Trustees’ deliberations are described below for each Fund, while individual Trustees may have given different weight to various factors and evaluated the information presented as a whole differently than another Trustee. The Trustees recognized that the fee arrangements for the Funds reflect years of review and discussion between the independent Trustees and MFS, that certain aspects of such arrangements may receive greater scrutiny in some years than others, and that the Trustees’ conclusions may be based, in part, on their consideration of these same arrangements during the course of the year and in prior years.
Based on information provided by Lipper Inc. and MFS, the Trustees compared each Fund’s total return investment performance to the performance of peer groups of funds over various time periods. The Trustees placed particular emphasis on the total return performance of each Fund’s Initial Class shares in comparison to the performance of funds in its Lipper performance universe over the one-, three- and five-year periods. The Trustees did not rely on performance results for more recent periods, including those shown elsewhere in this report.
In the course of their deliberations, the Trustees took into account information provided by MFS during contract review meetings, as well as during investment review meetings conducted with portfolio management personnel during the course of the year. For Funds whose performance lagged their peer groups, they discussed the factors that contributed thereto and MFS’ efforts to improve such Fund’s performance. After reviewing this information, the Trustees concluded, within the context of their overall conclusions regarding the investment advisory agreements, that they were satisfied with MFS’ responses and efforts relating to investment performance.
In assessing the reasonableness of each Fund’s advisory fee, the Trustees considered, among other information, each Fund’s advisory fee and the total expense ratio of the Fund’s Initial Class shares as a percentage of average daily net assets, compared to the advisory fee and total expense ratios of peer groups of funds based on information provided by Lipper Inc. and MFS. The Trustees also considered the advisory fees charged by MFS to institutional accounts. In comparing these fees, the Trustees considered the generally broader scope of services provided by MFS to the Trust than those provided to institutional accounts. The Trustees also considered the higher demands placed on MFS’ investment personnel and trading infrastructure as a result of the daily cash in-flows and out-flows of the Funds, and the impact on MFS and related expenses due to the more extensive regulatory regime to which the Funds are subject, compared to institutional accounts.
102
The Trustees also considered whether a Fund is likely to benefit from any economies of scale due to future asset growth. In this regard, the Trustees reviewed the adequacy of breakpoints and discussed with MFS any adjustments necessary for the shareholders’ benefit.
The Trustees also considered information prepared by MFS relating to its costs and profits with respect to the Funds and other investment companies and accounts advised by MFS, as well as MFS’ methodologies used to determine and allocate its costs to the Funds and other accounts and products for purposes of estimating profitability.
After reviewing these and other factors described below, the Trustees concluded that the advisory fees charged to the Funds represent reasonable compensation in light of the nature and quality of the services being provided by MFS.
In addition, the Trustees considered MFS’ resources and related efforts to continue to retain, attract and motivate capable personnel to serve the Funds. The Trustees also considered the financial resources of MFS and its parent, Sun Life Financial Inc. The Trustees further considered any advantages and possible disadvantages of having an adviser which also serves other investment companies as well as institutional accounts.
The Trustees also considered the nature, quality, cost, and extent of administrative, transfer agency, and distribution services provided to the Funds by MFS and its affiliates under agreements and plans other than the investment advisory agreements, including the 12b-1 fees the Funds pay to MFS Fund Distributors, Inc., an affiliate of MFS. The Trustees also considered the nature, extent and quality of certain other services MFS performs or arranges on the Funds’ behalf, which may include securities lending programs, directed expense payment programs, class action recovery programs, and MFS’ interaction with third-party service providers, principally custodians and sub-custodians. The Trustees concluded that the various non-advisory services provided by MFS and its affiliates on behalf of the Funds were satisfactory. The Trustees also considered the benefits to MFS from the use of the Funds’ portfolio brokerage commissions to pay for research and other similar services (including MFS’ policy not to use “soft dollars” generated by Fund portfolio transactions to pay for third-party research), and various other factors. Additionally, the Trustees considered so-called “fall-out benefits” to MFS such as reputational value derived from serving as investment manager to the Trust, and determined that any such benefits derived by MFS were reasonable and fair.
Based on their evaluation of factors that they deemed to be material, including those factors described above, the Board of Trustees, including a majority of the independent Trustees, concluded that the investment advisory agreements should be continued for an additional one-year period, commencing September 1, 2007.
MFS Capital Appreciation Portfolio (Fund)
The Trustees noted the performance of the Fund’s Initial Class shares was in the 3rd quintile relative to the other funds in the Lipper Classification Index for the one-year period (the 1st quintile being the best performers and the 5th quintile being the worst performers). The total return performance of the Fund was in the 4th quintile for the three-year period and the 5th quintile for the five-year period ended December 31, 2006, relative to the Lipper performance universe. Based on the nature and quality of services provided by MFS and MFS’ explanation of steps taken to improve performance, the Board of Trustees concluded that the Fund’s performance was adequate.
In considering the fees, the Trustees noted from the Lipper data that the Fund’s effective advisory fee rate and total expense ratio were each approximately at the median of such fees and expenses of funds in the Lipper expense group. In addition, the Trustees accepted MFS’ offer to continue the expense limitation for the Fund. The Trustees further concluded that the existing breakpoints were sufficient to allow the Fund to benefit from economies of scale as its assets grow. The Trustees concluded that the fees were reasonable in light of the nature and quality of services provided.
MFS Emerging Growth Portfolio (Fund)
The Trustees noted the performance of the Fund’s Initial Class shares was in the 3rd quintile relative to the other funds in the Lipper Classification Index for the one-year period (the 1st quintile being the best performers and the 5th quintile being the worst performers). The total return performance of the Fund was in the 2nd quintile for the three-year period and the 4th quintile for the five-year period ended December 31, 2006, relative to the Lipper performance universe. Based on the nature and quality of services provided by MFS, the Board of Trustees concluded that the Fund’s performance was satisfactory.
In considering the fees, the Trustees noted from the Lipper data that the Fund’s effective advisory fee rate and total expense ratio were each above the median of such fees and expenses of funds in the Lipper expense group. The Trustees further concluded that the existing breakpoints were sufficient to allow the Fund to benefit from economies of scale as its assets grow. The Trustees concluded that the fees were reasonable in light of the nature and quality of services provided.
MFS Global Governments Portfolio (Fund)
The Trustees noted the performance of the Fund’s Initial Class shares was in the 3rd quintile relative to the other funds in the Lipper Classification Index for the one-year period (the 1st quintile being the best performers and the 5th quintile being the worst performers). The total return performance of the Fund was in the 5th quintile for the three-year period and the 3rd percentile for the five-year period ended December 31, 2006, relative to the Lipper performance universe. Based on the nature and quality of services provided by MFS, the Board of Trustees concluded that the Fund’s performance was satisfactory.
In considering the fees, the Trustees noted from the Lipper data that the Fund’s effective advisory fee rate was below the median and total expense ratio was approximately at the median of such fees and expenses of funds in the Lipper expense group. In addition, the Trustees accepted MFS’
103
offer to continue the expense limitation for the Fund. The Trustees further concluded that the existing breakpoints were sufficient to allow the Fund to benefit from economies of scale as its assets grow. The Trustees concluded that the fees were reasonable in light of the nature and quality of services provided.
MFS Massachusetts Investors Growth Stock Portfolio (Fund)
The Trustees noted the performance of the Fund’s Initial Class shares was in the 2nd quintile relative to the other funds in the Lipper Classification Index for the one-year period (the 1st quintile being the best performers and the 5th quintile being the worst performers). The total return performance of the Fund was in the 3rd quintile for the three-year period and the five-year period ended December 31, 2006, relative to the Lipper performance universe. Based on the nature and quality of services provided by MFS and MFS’ explanation of steps taken to improve performance, the Board of Trustees concluded that the Fund’s performance was satisfactory.
In considering the fees, the Trustees noted from the Lipper data that the Fund’s effective advisory fee rate and total expense ratio were each approximately at the median of such fees and expenses of funds in the Lipper expense group. In addition, the Trustees accepted MFS’ offer to continue its advisory fee waiver and implement an expense limitation for the Fund, and they determined that the waivers were sufficient to allow the Fund to benefit from economies of scale as its assets grow. The Trustees concluded that the fees were reasonable in light of the nature and quality of services provided.
MFS Mid Cap Growth Portfolio (Fund)
The Trustees noted the performance of the Fund’s Initial Class shares was in the 5th quintile relative to the other funds in the Lipper Classification Index for the one-year period (the 1st quintile being the best performers and the 5th quintile being the worst performers). The total return performance of the Fund was also in the 5th quintile for the three-year period and the five-year period December 31, 2006, relative to the Lipper performance universe. Based on the nature and quality of services provided by MFS and MFS’ explanation of steps taken to improve performance, the Board of Trustees concluded that the Fund’s performance was adequate.
In considering the fees, the Trustees noted from the Lipper data that the Fund’s effective advisory fee rate and total expense ratio were each approximately at the median of such fees and expenses of funds in the Lipper expense group. In addition, the Trustees accepted MFS’ offer to continue the management fee waiver for the Fund for the next year. The Trustees further concluded that the existing breakpoints were sufficient to allow the Fund to benefit from economies of scale as its assets grow. The Trustees concluded that the fees were reasonable in light of the nature and quality of services provided.
MFS Mid Cap Value Portfolio (Fund)
The Trustees noted the performance of the Fund’s Initial Class shares was in the 4th quintile relative to the other funds in the Lipper Classification Index for the one-year period (the 1st quintile being the best performers and the 5th quintile being the worst performers). The total return performance of the Fund was in the 3rd quintile for the three-year period ended December 31, 2006, relative to the Lipper performance universe. (The Fund has been in existence for less than five years.) Based on the nature and quality of services provided by MFS and MFS’ explanation of recent steps taken to improve performance, the Board of Trustees concluded that the Fund’s performance was adequate.
In considering the fees, the Trustees noted from the Lipper data that the Fund’s effective advisory fee rate was below the median and total expense ratio was approximately at the median of such fees and expenses of funds in the Lipper expense group. In addition, the Trustees accepted MFS’ offer to continue its expense limitation for the Fund for the next year. The Trustees further concluded that the existing breakpoints were sufficient to allow the Fund to benefit from economies of scale as its assets grow. The Trustees concluded that the fees were reasonable in light of the nature and quality of services provided.
MFS Money Market Portfolio (Fund)
The Trustees noted the performance of the Fund’s Initial Class shares was in the 3rd quintile relative to the other funds in the Lipper Classification Index for the one-year period (the 1st quintile being the best performers and the 5th quintile being the worst performers). The total return performance of the Fund was also in the 3rd quintile for the three-year period and the five-year period ended December 31, 2006, relative to the Lipper performance universe. Based on the nature and quality of services provided by MFS, the Board of Trustees concluded that the Fund’s performance was satisfactory.
In considering the fees, the Trustees noted from the Lipper data that the Fund’s effective advisory fee rate and total expense ratio were each above the median of such fees and expenses of funds in the Lipper expense group. In addition, the Trustees accepted MFS’ offer to continue its waiver to reduce its advisory fee, and noted the reduction of the total expense limitation for the Fund for the next year, and they determined that the waivers were sufficient to allow the Fund to benefit from economies of scale as its assets grow. The Trustees concluded that the fees were reasonable in light of the nature and quality of services provided.
MFS New Discovery Portfolio (Fund)
The Trustees noted the performance of the Fund’s Initial Class shares was in the 2nd quintile relative to the other funds in the Lipper Classification Index for the one-year period (the 1st quintile being the best performers and the 5th quintile being the worst performers). The total return performance of the Fund was in the 4th quintile for the three-year period and the five-year period ended December 31, 2006, relative to the Lipper performance universe. Based on the nature and quality of services provided by MFS and MFS’ explanation of steps taken to improve performance, the Board of Trustees concluded that the Fund’s performance was satisfactory.
104
In considering the fees, the Trustees noted from the Lipper data that the Fund’s effective advisory fee rate and total expense ratio were each approximately at the median of such fees and expenses of funds in the Lipper expense group. In addition, the Trustees accepted MFS’ offer to continue the management fee waiver and expense limitation for the Fund for the next year. The Trustees further concluded that the existing breakpoints were sufficient to allow the Fund to benefit from economies of scale as its assets grow. The Trustees concluded that the fees were reasonable in light of the nature and quality of services provided.
MFS Research Portfolio (Fund)
The Trustees noted the performance of the Fund’s Initial Class shares was in the 5th quintile relative to the other funds in the Lipper Classification Index for the one-year period (the 1st quintile being the best performers and the 5th quintile being the worst performers). The total return performance of the Fund was in the 2nd quintile for the three-year period and the 4th quintile for the five-year period ended December 31, 2006, relative to the Lipper performance universe. Based on the nature and quality of services provided by MFS, the Board of Trustees concluded that the Fund’s performance was adequate.
In considering the fees, the Trustees noted from the Lipper data that the Fund’s effective advisory fee rate and total expense ratio were each approximately at the median of such fees and expenses of funds in the Lipper expense group. The Trustees further concluded that the existing breakpoints were sufficient to allow the Fund to benefit from economies of scale as its assets grow. The Trustees concluded that the fees were reasonable in light of the nature and quality of services provided.
MFS Strategic Income Portfolio (Fund)
The Trustees noted the performance of the Fund’s Initial Class shares was in the 2nd quintile relative to the other funds in the Lipper Classification Index for the one-year period (the 1st quintile being the best performers and the 5th quintile being the worst performers). The total return performance of the Fund was in the 2nd quintile for the three-year period and the 3rd quintile for the five-year period ended December 31, 2006, relative to the Lipper performance universe. Based on the nature and quality of services provided by MFS, the Board of Trustees concluded that the Fund’s performance was satisfactory.
In considering the fees, the Trustees noted from the Lipper data that the Fund’s effective advisory fee rate and total expense ratio were each above the median of such fees and expenses of funds in the Lipper expense group. The Trustees noted that MFS agreed to continue its waiver to reduce its advisory fee, and accepted MFS’ offer to continue the total expense limitation for the Fund for the next year. The Trustees further concluded that the existing breakpoints were sufficient to allow the Fund to benefit from economies of scale as its assets grow. The Trustees concluded that the fees were reasonable in light of the nature and quality of services provided.
MFS Strategic Value Portfolio (Fund)
The Trustees noted the performance of the Fund’s Initial Class shares was in the 5th quintile relative to the other funds in the Lipper Classification Index for the one-year period (the 1st quintile being the best performers and the 5th quintile being the worst performers). The total return performance of the Fund was in the 5th quintile for the three-year period ended December 31, 2006, relative to the Lipper performance universe. (The Fund has been in existence for less than five years.) Based on the nature and quality of services provided by MFS and MFS’ explanation of recent steps taken to improve performance, the Board of Trustees concluded that the Fund’s performance was adequate.
In considering the fees, the Trustees noted from the Lipper data that the Fund’s effective advisory fee rate was below the median and total expense ratio was above the median of such fees and expenses of funds in the Lipper expense group. In addition, the Trustees accepted MFS’ offer to continue the expense limitation for the Fund for the next year. The Trustees further concluded that the existing breakpoints were sufficient to allow the Fund to benefit from economies of scale as its assets grow. The Trustees concluded that the fees were reasonable in light of the nature and quality of services provided.
MFS Technology Portfolio (Fund)
The Trustees noted the performance of the Fund’s Initial Class shares was in the 1st quintile relative to the other funds in the Lipper Classification Index for the one-year period (the 1st quintile being the best performers and the 5th quintile being the worst performers). The total return performance of the Fund was in the 1st quintile for the three-year period and the 3rd quintile for the five-year period ended December 31, 2006, relative to the Lipper performance universe. Based on the nature and quality of services provided by MFS, the Board of Trustees concluded that the Fund’s performance was satisfactory.
In considering the fees, the Trustees noted from the Lipper data that the Fund’s effective advisory fee rate was below the median and total expense ratio was approximately at the median of such fees and expenses of funds in the Lipper expense group. In addition, the Trustees accepted MFS’ offer to continue the expense limitation for the Fund for the next year. The Trustees further concluded that the existing breakpoints were sufficient to allow the Fund to benefit from economies of scale as its assets grow. The Trustees concluded that the fees were reasonable in light of the nature and quality of services provided.
A discussion regarding the Board’s most recent review and renewal of each fund’s investment advisory agreement is available by clicking on the fund’s name under “Variable Insurance Portfolios” on the “Products & Performance” page on the MFS Web site (mfs.com).
105
MFS® Privacy Notice
Privacy is a concern for every investor today. At MFS Investment Management® and the MFS funds, we take this concern very seriously. We want you to understand our policies about the investment products and services that we offer, and how we protect the nonpublic personal information of investors who have a direct relationship with us and our wholly owned subsidiaries.
Throughout our business relationship, you provide us with personal information. We maintain information and records about you, your investments, and the services you use. Examples of the nonpublic personal information we maintain include
| | • | | data from investment applications and other forms |
| | • | | share balances and transactional history with us, our affiliates, or others |
| | • | | facts from a consumer reporting agency |
We do not disclose any nonpublic personal information about our customers or former customers to anyone, except as permitted by law. We may share nonpublic personal information with third parties or certain of our affiliates in connection with servicing your account or processing your transactions. We may share information with companies or financial institutions that perform marketing services on our behalf or with other financial institutions with which we have joint marketing arrangements, subject to any legal requirements.
Authorization to access your nonpublic personal information is limited to appropriate personnel who provide products, services, or information to you. We maintain physical, electronic, and procedural safeguards to help protect the personal information we collect about you.
If you have any questions about the MFS privacy policy, please call 1-800-225-2606 any business day between 8 a.m. and 8 p.m. Eastern time.
Note: If you own MFS products or receive MFS services in the name of a third party such as a bank or broker-dealer, their privacy policy may apply to you instead of ours.
106
MFS Variable Insurance Trust II
Investment Adviser
Massachusetts Financial Services Company
500 Boylston Street, Boston, MA 02116-3741
Custodian and Dividend Disbursing Agent
State Street Bank and Trust Company
225 Franklin Street, Boston, MA 02110-2875
Proxy Voting Policies and Information
A general description of the funds’ proxy voting policies and procedures is available without charge, upon request, by calling 1-800-225-2606, by visiting the Proxy Voting section of mfs.com or by visiting the SEC’s Web site at http://www.sec.gov.
Information regarding how each fund voted proxies relating to portfolio securities during the most recent twelve month period ended June 30 is available without charge by visiting the Proxy Voting section of mfs.com or by visiting the SEC’s Web site at http://www.sec.gov.
Quarterly Portfolio Disclosure
Each fund will file a complete schedule of portfolio holdings with the Securities and Exchange Commission (the Commission) for the first and third quarters of each fiscal year on Form N-Q. Each fund’s Form N-Q may be reviewed and copied at the:
Public Reference Room
Securities and Exchange Commission
Washington, D.C. 20549-0102
Information on the operation of the Public Reference Room may be obtained by calling the Commission at 1-800-SEC-0330. Each fund’s Form N-Q is available on the EDGAR database on the Commission’s Internet Web site at http://www.sec.gov, and copies of this information may be obtained, upon payment of a duplicating fee, by electronic request at the following e-mail address: publicinfor@sec.gov or by writing the Public Reference Section at the above address.
Federal Tax Information (Unaudited)
The following information is provided pursuant to provisions of the Internal Revenue Code.
The following funds designate capital gain dividends paid during the fiscal year:
| | | |
| | | Capital
Gain
Dividends |
MFS Mid Cap Value Portfolio | | $ | 595,951 |
MFS New Discovery Portfolio | | | 9,323,173 |
MFS Strategic Value Portfolio | | | 500,975 |
For corporate shareholders, the percentages of the ordinary income dividends paid during the fiscal year that qualify for the corporate dividends received deduction are as follows:
| | | |
| | | Dividends
Received
Deductions | |
MFS Capital Appreciation Portfolio | | 100.00 | % |
MFS Massachusetts Investors Growth Stock Portfolio | | 100.00 | % |
MFS Mid Cap Growth Portfolio | | 100.00 | % |
MFS Mid Cap Value Portfolio | | 71.21 | % |
MFS Research Portfolio | | 100.00 | % |
MFS Strategic Value Portfolio | | 100.00 | % |
Sun Life Financial Distributors Inc.
VITII-ANN 2/08
The Registrant has adopted a Code of Ethics pursuant to Section 406 of the Sarbanes-Oxley Act and as defined in Form N-CSR that applies to the Registrant’s principal executive officer and principal financial and accounting officer. The Registrant has not amended any provision in its Code of Ethics (the “Code”) that relates to an element of the Code’s definitions enumerated in paragraph (b) of Item 2 of this Form N-CSR.
A copy of the Code of Ethics is filed as an exhibit to this Form N-CSR.
| ITEM 3. | AUDIT COMMITTEE FINANCIAL EXPERT. |
Messrs. J. Kermit Birchfield, Robert C. Bishop, Ronald G. Steinhart and Haviland Wright, members of the Audit Committee, have been determined by the Board of Trustees in their reasonable business judgment to meet the definition of “audit committee financial expert” as such term is defined in Form N-CSR. In addition, Messrs. J. Kermit Birchfield, Robert C. Bishop, Ronald G. Steinhart and Haviland Wright are “independent” members of the Audit Committee as defined in Form N-CSR.
| ITEM 4. | PRINCIPAL ACCOUNTANT FEES AND SERVICES. |
Items 4(a) through 4(d) and 4(g):
The Board of Trustees has appointed Deloitte & Touche LLP (“Deloitte”) to serve as independent accountants to each series of the Registrant (collectively, the “Funds”). The tables below set forth the audit fees billed to the Funds as well as fees for non-audit services provided to the Funds and/or to the Funds’ investment adviser, Massachusetts Financial Services Company (“MFS”) and to various entities either controlling, controlled by, or under common control with MFS that provide ongoing services to the Funds (“MFS Related Entities”).
For the fiscal years ended December 31, 2007 and 2006, audit fees billed to the Funds by Deloitte were as follows:
| | | | |
| | | Audit Fees |
| �� | | 2007 | | 2006 |
Fees billed by Deloitte: | | | | |
MFS Blended Research Core Equity Portfolio | | 34,762 | | 33,418 |
MFS Blended Research Growth Portfolio+ | | 12,600 | | 0 |
MFS Blended Research Value Portfolio+ | | 12,600 | | 0 |
MFS Bond Portfolio | | 47,319 | | 45,435 |
MFS Capital Appreciation Portfolio | | 34,762 | | 33,418 |
Capital Opportunities Series++ | | 608 | | 33,418 |
MFS Core Equity Portfolio | | 34,762 | | 33,418 |
MFS Emerging Growth Portfolio | | 35,422 | | 34,050 |
MFS Emerging Markets Equity Portfolio | | 36,744 | | 35,315 |
MFS Global Governments Portfolio | | 47,319 | | 45,435 |
MFS Global Growth Portfolio | | 45,337 | | 43,538 |
MFS Global Total Return Portfolio | | 45,337 | | 43,538 |
MFS Government Securities Portfolio | | 40,049 | | 38,478 |
MFS High Yield Portfolio | | 45,337 | | 43,538 |
MFS International Growth Portfolio | | 36,744 | | 35,315 |
MFS International Value Portfolio | | 37,406 | | 35,948 |
MFS Massachusetts Investors Growth Stock Portfolio | | 36,612 | | 33,418 |
MFS Mid Cap Growth Portfolio | | 34,762 | | 33,418 |
MFS Mid Cap Value Portfolio | | 37,406 | | 35,948 |
MFS Money Market Portfolio | | 20,881 | | 20,135 |
MFS New Discovery Portfolio | | 34,762 | | 33,418 |
MFS Research International Portfolio | | 34,762 | | 33,418 |
MFS Research Portfolio | | 35,422 | | 34,050 |
Strategic Growth Series++ | | 608 | | 33,418 |
MFS Strategic Income Portfolio | | 34,762 | | 33,418 |
MFS Strategic Value Portfolio | | 37,406 | | 35,948 |
MFS Technology Portfolio | | 34,762 | | 33,418 |
MFS Total Return Portfolio | | 47,319 | | 45,435 |
MFS Utilities Portfolio | | 34,762 | | 33,418 |
MFS Value Portfolio | | 34,761 | | 33,418 |
| | | | |
Total | | 1,006,095 | | 1,006,540 |
For the fiscal years ended December 31, 2007 and 2006, fees billed by Deloitte for audit-related, tax and other services provided to the Funds and for audit-related, tax and other services provided to MFS and MFS Related Entities were as follows:
| | | | | | | | | | | | |
| | | Audit-Related Fees1 | | Tax Fees2 | | All Other Fees4 |
| | | 2007 | | 2006 | | 2007 | | 2006 | | 2007 | | 2006 |
Fees billed by Deloitte: | | | | | | | | | | | | |
To MFS Blended Research Core Equity Portfolio | | 0 | | 0 | | 3,985 | | 4,450 | | 1,262 | | 379 |
To MFS Blended Research Growth Portfolio+ | | 0 | | 0 | | 2,400 | | 0 | | 2,012 | | 0 |
To MFS Blended Research Value Portfolio+ | | 0 | | 0 | | 2,400 | | 0 | | 2,012 | | 0 |
To MFS Bond Portfolio | | 0 | | 0 | | 3,985 | | 4,450 | | 1,262 | | 379 |
To MFS Capital Appreciation Portfolio | | 0 | | 0 | | 3,985 | | 4,450 | | 1,262 | | 379 |
To Capital Opportunities Series++ | | 0 | | 0 | | 0 | | 4,450 | | 1,262 | | 379 |
To MFS Core Equity Portfolio | | 0 | | 0 | | 3,985 | | 4,450 | | 1,262 | | 379 |
To MFS Emerging Growth Portfolio | | 0 | | 0 | | 3,985 | | 4,450 | | 1,262 | | 379 |
To MFS Emerging Markets Equity Portfolio | | 0 | | 0 | | 3,985 | | 4,450 | | 1,262 | | 379 |
To MFS Global Governments Portfolio | | 0 | | 0 | | 3,985 | | 4,450 | | 1,262 | | 379 |
To MFS Global Growth Portfolio | | 0 | | 0 | | 3,985 | | 4,450 | | 1,262 | | 379 |
To MFS Global Total Return Portfolio | | 0 | | 0 | | 3,985 | | 4,450 | | 1,262 | | 379 |
To MFS Government Securities Portfolio | | 0 | | 0 | | 3,985 | | 4,450 | | 1,262 | | 379 |
To MFS High Yield Portfolio | | 0 | | 0 | | 3,985 | | 4,450 | | 1,262 | | 379 |
To MFS International Growth Portfolio | | 0 | | 0 | | 3,985 | | 4,450 | | 1,262 | | 379 |
To MFS International Value Portfolio | | 0 | | 0 | | 3,985 | | 4,450 | | 1,262 | | 379 |
To MFS Massachusetts Investors Growth Stock Portfolio | | 0 | | 0 | | 3,985 | | 4,450 | | 1,262 | | 379 |
To MFS Mid Cap Growth Portfolio | | 0 | | 0 | | 3,985 | | 4,450 | | 1,262 | | 379 |
To MFS Mid Cap Value Portfolio | | 0 | | 0 | | 3,985 | | 4,450 | | 1,262 | | 379 |
To MFS Money Market Portfolio | | 0 | | 0 | | 3,985 | | 4,450 | | 1,262 | | 379 |
To MFS New Discovery Portfolio | | 0 | | 0 | | 3,985 | | 4,450 | | 1,262 | | 379 |
To MFS Research International Portfolio | | 0 | | 0 | | 3,985 | | 4,450 | | 1,262 | | 379 |
To MFS Research Portfolio | | 0 | | 0 | | 3,985 | | 4,450 | | 1,262 | | 379 |
To Strategic Growth Series++ | | 0 | | 0 | | 0 | | 4,450 | | 1,262 | | 379 |
To MFS Strategic Income Portfolio | | 0 | | 0 | | 3,985 | | 4,450 | | 1,262 | | 379 |
To MFS Strategic Value Portfolio | | 0 | | 0 | | 3,985 | | 4,450 | | 1,262 | | 379 |
To MFS Technology Portfolio | | 0 | | 0 | | 3,985 | | 4,450 | | 1,262 | | 379 |
To MFS Total Return Portfolio | | 0 | | 0 | | 3,985 | | 4,450 | | 1,262 | | 379 |
| | | | | | | | | | | | |
To MFS Utilities Portfolio | | 0 | | 0 | | 3,985 | | 4,450 | | 1,262 | | 379 |
To MFS Value Portfolio | | 0 | | 0 | | 3,985 | | 4,450 | | 1,262 | | 379 |
| | | | | | | | | | | | |
Total fees billed by Deloitte To above Funds: | | 0 | | 0 | | 108,410 | | 124,600 | | 39,360 | | 10,612 |
To MFS and MFS Related Entities of MFS Blended Research Core Equity Portfolio* | | 1,189,135 | | 981,825 | | 0 | | 0 | | 366,217 | | 418,092 |
To MFS and MFS Related Entities of MFS Blended Research Growth Portfolio+* | | 1,189,135 | | 0 | | 0 | | 0 | | 366,217 | | 0 |
To MFS and MFS Related Entities of MFS Blended Research Value Portfolio+* | | 1,189,135 | | 0 | | 0 | | 0 | | 366,217 | | 0 |
To MFS and MFS Related Entities of MFS Bond Portfolio* | | 1,189,135 | | 981,825 | | 0 | | 0 | | 366,217 | | 418,092 |
To MFS and MFS Related Entities of MFS Capital Appreciation Portfolio* | | 1,189,135 | | 981,825 | | 0 | | 0 | | 366,217 | | 418,092 |
To MFS and MFS Related Entities of Capital Opportunities Series++* | | 1,189,135 | | 981,825 | | 0 | | 0 | | 366,217 | | 418,092 |
To MFS and MFS Related Entities of MFS Core Equity Portfolio* | | 1,189,135 | | 981,825 | | 0 | | 0 | | 366,217 | | 418,092 |
To MFS and MFS Related Entities of MFS Emerging Growth Portfolio* | | 1,189,135 | | 981,825 | | 0 | | 0 | | 366,217 | | 418,092 |
To MFS and MFS Related Entities of MFS Emerging Markets Equity Portfolio* | | 1,189,135 | | 981,825 | | 0 | | 0 | | 366,217 | | 418,092 |
To MFS and MFS Related Entities of MFS Global Governments Portfolio* | | 1,189,135 | | 981,825 | | 0 | | 0 | | 366,217 | | 418,092 |
To MFS and MFS Related Entities of MFS Global Growth Portfolio* | | 1,189,135 | | 981,825 | | 0 | | 0 | | 366,217 | | 418,092 |
To MFS Global Total Return Portfolio, MFS and MFS Related Entities# | | 1,189,135 | | 981,825 | | 0 | | 0 | | 366,217 | | 418,092 |
To MFS and MFS Related Entities of MFS Government Securities Portfolio* | | 1,189,135 | | 981,825 | | 0 | | 0 | | 366,217 | | 418,092 |
To MFS and MFS Related Entities of MFS High Yield Portfolio* | | 1,189,135 | | 981,825 | | 0 | | 0 | | 366,217 | | 418,092 |
| | | | | | | | | | | | |
To MFS and MFS Related Entities of MFS International Growth Portfolio* | | 1,189,135 | | 981,825 | | 0 | | 0 | | 366,217 | | 418,092 |
To MFS and MFS Related Entities of MFS International Value Portfolio* | | 1,189,135 | | 981,825 | | 0 | | 0 | | 366,217 | | 418,092 |
To MFS and MFS Related Entities of MFS Massachusetts Investors Growth Stock Portfolio* | | 1,189,135 | | 981,825 | | 0 | | 0 | | 366,217 | | 418,092 |
To MFS and MFS Related Entities of MFS Mid Cap Growth Portfolio* | | 1,189,135 | | 981,825 | | 0 | | 0 | | 366,217 | | 418,092 |
To MFS and MFS Related Entities of MFS Mid Cap Value Portfolio* | | 1,189,135 | | 981,825 | | 0 | | 0 | | 366,217 | | 418,092 |
To MFS and MFS Related Entities of MFS Money Market Portfolio* | | 1,189,135 | | 981,825 | | 0 | | 0 | | 366,217 | | 418,092 |
To MFS and MFS Related Entities of MFS New Discovery Portfolio* | | 1,189,135 | | 981,825 | | 0 | | 0 | | 366,217 | | 418,092 |
To MFS and MFS Related Entities of MFS Research International Portfolio* | | 1,189,135 | | 981,825 | | 0 | | 0 | | 366,217 | | 418,092 |
To MFS and MFS Related Entities of MFS Research Portfolio* | | 1,189,135 | | 981,825 | | 0 | | 0 | | 366,217 | | 418,092 |
To MFS and MFS Related Entities of Strategic Growth Series++* | | 1,189,135 | | 981,825 | | 0 | | 0 | | 366,217 | | 418,092 |
To MFS and MFS Related Entities of MFS Strategic Income Portfolio* | | 1,189,135 | | 981,825 | | 0 | | 0 | | 366,217 | | 418,092 |
To MFS and MFS Related Entities of MFS Strategic Value Portfolio* | | 1,189,135 | | 981,825 | | 0 | | 0 | | 366,217 | | 418,092 |
To MFS and MFS Related Entities of MFS Technology Portfolio* | | 1,189,135 | | 981,825 | | 0 | | 0 | | 366,217 | | 418,092 |
To MFS and MFS Related Entities of MFS Total Return Portfolio* | | 1,189,135 | | 981,825 | | 0 | | 0 | | 366,217 | | 418,092 |
To MFS and MFS Related Entities of MFS Utilities Portfolio* | | 1,189,135 | | 981,825 | | 0 | | 0 | | 366,217 | | 418,092 |
To MFS and MFS Related Entities of MFS Value Portfolio* | | 1,189,135 | | 981,825 | | 0 | | 0 | | 366,217 | | 418,092 |
Aggregate fees for non-audit services:
| | | | |
| | | 2007 | | 2006 |
To MFS Blended Research Core Equity Portfolio, MFS and MFS Related Entities# | | 1,772,974 | | 1,547,931 |
To MFS Blended Research Growth Portfolio+, MFS and MFS Related Entities# | | 1,772,139 | | 0 |
To MFS Blended Research Value Portfolio+, MFS and MFS Related Entities# | | 1,772,139 | | 0 |
To MFS Bond Portfolio, MFS and MFS Related Entities# | | 1,772,974 | | 1,547,931 |
To MFS Capital Appreciation Portfolio, MFS and MFS Related Entities# | | 1,772,974 | | 1,547,931 |
To Capital Opportunities Series++, MFS and MFS Related Entities# | | 1,768,989 | | 1,547,931 |
To MFS Core Equity Portfolio, MFS and MFS Related Entities# | | 1,772,974 | | 1,547,931 |
To MFS Emerging Growth Portfolio, MFS and MFS Related Entities# | | 1,772,974 | | 1,547,931 |
To MFS Emerging Markets Equity Portfolio, MFS and MFS Related Entities# | | 1,772,974 | | 1,547,931 |
To MFS Global Governments Portfolio, MFS and MFS Related Entities# | | 1,772,974 | | 1,547,931 |
To MFS Global Growth Portfolio MFS and MFS Related Entities# | | 1,772,974 | | 1,547,931 |
To MFS Global Total Return Portfolio, MFS and MFS Related Entities# | | 1,772,974 | | 1,547,931 |
To MFS Government Securities Portfolio, MFS and MFS Related Entities# | | 1,772,974 | | 1,547,931 |
To MFS High Yield Portfolio, MFS and MFS ] Related Entities# | | 1,772,974 | | 1,547,931 |
| | | | |
To MFS International Growth Portfolio, MFS and MFS Related Entities# | | 1,772,974 | | 1,547,931 |
To MFS International Value Portfolio, MFS and MFS Related Entities# | | 1,772,974 | | 1,547,931 |
To MFS Massachusetts Investors Growth Stock Portfolio, MFS and MFS Related Entities# | | 1,772,974 | | 1,547,931 |
To MFS Mid Cap Growth Portfolio, MFS and MFS Related Entities# | | 1,772,974 | | 1,547,931 |
To MFS Mid Cap Value Portfolio, MFS and MFS Related Entities# | | 1,772,974 | | 1,547,931 |
To MFS Money Market Portfolio, MFS and MFS Related Entities# | | 1,772,974 | | 1,547,931 |
To MFS New Discovery Portfolio, MFS and MFS Related Entities# | | 1,772,974 | | 1,547,931 |
To MFS Research International Portfolio, MFS and MFS Related Entities# | | 1,772,974 | | 1,547,931 |
To MFS Research Portfolio, MFS and MFS Related Entities# | | 1,772,974 | | 1,547,931 |
To Strategic Growth Series++, MFS and MFS Related Entities# | | 1,768,989 | | 1,547,931 |
To MFS Strategic Income Portfolio, MFS and MFS Related Entities# | | 1,772,974 | | 1,547,931 |
To MFS Strategic Value Portfolio, MFS and MFS Related Entities# | | 1,772,974 | | 1,547,931 |
To MFS Technology Portfolio, MFS and MFS Related Entities# | | 1,772,974 | | 1,547,931 |
To MFS Total Return Portfolio, MFS and MFS Related Entities# | | 1,772,974 | | 1,547,931 |
To MFS Utilities Portfolio, MFS and MFS Related Entities# | | 1,772,974 | | 1,547,931 |
To MFS Value Portfolio, MFS and MFS Related Entities# | | 1,772,974 | | 1,547,931 |
| + | This Fund commenced investment operations on December 19, 2007. |
++ | The Strategic Growth Series was reorganized into the MFS Massachusetts Investors Growth Stock Portfolio, and Capital Opportunities Series was reorganized into MFS Core Equity Series, all series of the Registrant, as of June 22, 2007. |
* | This amount reflects the fees billed to MFS and MFS Related Entities for non-audit services relating directly to the operations and financial reporting of the Funds (portions of which services also related to the operations and financial reporting of other funds within the MFS Funds complex). |
# | This amount reflects the aggregate fees billed by Deloitte for non-audit services rendered to the Funds and for non-audit services rendered to MFS and the MFS Related Entities. |
1 | The fees included under “Audit-Related Fees” are fees related to assurance and related services that are reasonably related to the performance of the audit or review of financial statements, but not reported under “Audit Fees,” including accounting consultations, agreed-upon procedure reports, attestation reports, comfort letters and internal control reviews. |
2 | The fees included under “Tax Fees” are fees associated with tax compliance, tax advice and tax planning, including services relating to the filing or amendment of federal, state or local income tax returns, regulated investment company qualification reviews and tax distribution and analysis. |
3 | The fees included under “All Other Fees” are fees for products and services provided by Deloitte other than those reported under “Audit Fees,” “Audit-Related Fees” and “Tax Fees”, including fees for services related to sales tax refunds, consultation on internal cost allocations, consultation on allocation of monies pursuant to an administrative proceeding regarding disclosure of brokerage allocation practices in connection with fund sales, and analysis of certain portfolio holdings verses investment styles. |
Item 4(e)(1):
Set forth below are the policies and procedures established by the Audit Committee of the Board of Trustees relating to the pre-approval of audit and non-audit related services:
To the extent required by applicable law, pre-approval by the Audit Committee of the Board is needed for all audit and permissible non-audit services rendered to the Funds and all permissible non-audit services rendered to MFS or MFS Related Entities if the services relate directly to the operations and financial reporting of the Registrant. Pre-approval is currently on an engagement-by-engagement basis. In the event pre-approval of such services is necessary between regular meetings of the Audit Committee and it is not practical to wait to seek pre-approval at the next regular meeting of the Audit Committee, pre-approval of such services may be referred to the Chair of the Audit Committee for approval; provided that the Chair may not pre-approve any individual engagement for such services exceeding $50,000 or multiple engagements for such services in the aggregate exceeding $100,000 in each period between regular meetings of the Audit Committee. Any engagement pre-approved by the Chair between regular meetings of the Audit Committee shall be presented for ratification by the entire Audit Committee at its next regularly scheduled meeting.
Item 4(e)(2):
None, or 0%, of the services relating to the Audit-Related Fees, Tax Fees and All Other Fees paid by the Fund and MFS and MFS Related Entities relating directly to the operations and financial reporting of the Registrant disclosed above were approved by the audit committee pursuant to paragraphs (c)(7)(i)(C) of Rule 2-01 of Regulation S-X (which permits audit committee approval after the start of the engagement with respect to services other than audit, review or attest services, if certain conditions are satisfied).
Item 4(f): Not applicable.
Item 4(h): The Registrant’s Audit Committee has considered whether the provision by a Registrant’s independent registered public accounting firm of non-audit services to MFS and MFS Related Entities that were not pre-approved by the Committee (because such services did not relate directly to the operations and financial reporting of the Registrant) was compatible with maintaining the independence of the independent registered public accounting firm as the Registrant’s principal auditors.
| ITEM 5. | AUDIT COMMITTEE OF LISTED REGISTRANTS. |
Not applicable to the Registrant.
| ITEM 6. | SCHEDULE OF INVESTMENTS |
A schedule of investments of the Registrant is included as part of the report to shareholders of such series under Item 1 of this Form N-CSR.
| ITEM 7. | DISCLOSURE OF PROXY VOTING POLICIES AND PROCEDURES FOR CLOSED-END MANAGEMENT INVESTMENT COMPANIES. |
Not applicable to the Registrant.
| ITEM 8. | PORTFOLIO MANAGERS OF CLOSED-END MANAGEMENT INVESTMENT COMPANIES. |
Not applicable to the Registrant.
| ITEM 9. | PURCHASES OF EQUITY SECURITIES BY CLOSED-END MANAGEMENT INVESTMENT COMPANY AND AFFILIATED PURCHASERS. |
Not applicable to the Registrant.
| ITEM 10. | SUBMISSION OF MATTERS TO A VOTE OF SECURITY HOLDERS. |
There were no material changes to the procedures by which shareholders may send recommendations to the Board for nominees to the Registrant’s Board since the Registrant last provided disclosure as to such procedures in response to the requirements of Item 407(c)(2)(iv) of Regulation S-K (as required by Item 22(b)(15) of Schedule 14A), or this Item.
| ITEM 11. | CONTROLS AND PROCEDURES. |
| (a) | Based upon their evaluation of the effectiveness of the registrant’s disclosure controls and procedures (as defined in Rule 30a-3(c) under the Investment Company Act of 1940 (the “Act”)) as conducted within 90 days of the filing date of this report on Form N-CSR, the registrant’s principal financial officer and principal executive officer have concluded that those disclosure controls and procedures provide reasonable assurance that the material information required to be disclosed by the registrant on this report is recorded, processed, summarized and reported within the time periods specified in the Securities and Exchange Commission’s rules and forms. |
| (b) | There were no changes in the registrant’s internal controls over financial reporting (as defined in Rule 30a-3(d) under the Act) that occurred during the second fiscal quarter of the period covered by the report that have materially affected, or are reasonably likely to materially affect, the registrant’s internal control over financial reporting. |
| (a) | File the exhibits listed below as part of this form. Letter or number the exhibits in the sequence indicated. |
| | (1) | Any code of ethics, or amendment thereto, that is the subject of the disclosure required by Item 2, to the extent that the registrant intends to satisfy the Item 2 requirements through filing of an exhibit: Code of Ethics attached hereto. |
| | (2) | A separate certification for each principal executive officer and principal financial officer of the registrant as required by Rule 30a-2 under the Act (17 CFR 270.30a-2): Attached hereto. |
| (b) | If the report is filed under Section 13(a) or 15(d) of the Exchange Act, provide the certifications required by Rule 30a-2(b) under the Act (17 CFR 270.30a-2(b)), Rule 13a-14(b) or Rule 15d-14(b) under the Exchange Act (17 CFR 240.13a-14(b) or 240.15d-14(b)) and Section 1350 of Chapter 63 of Title 18 of the United States Code (18 U.S.C. 1350) as an exhibit. A certification furnished pursuant to this paragraph will not be deemed “filed” for the purposes of Section 18 of the Exchange Act (15 U.S.C. 78r), or otherwise subject to the liability of that section. Such certification will not be deemed to be incorporated by reference into any filing under the Securities Act of 1933 or the Exchange Act, except to the extent that the registrant specifically incorporates it by reference: Attached hereto. |
Notice
A copy of the Amended and Restated Declaration of Trust, as amended, of the Registrant is on file with the Secretary of State of The Commonwealth of Massachusetts and notice is hereby given that this instrument is executed on behalf of the Registrant by an officer of the Registrant as an officer and not individually and the obligations of or arising out of this instrument are not binding upon any of the Trustees or shareholders individually, but are binding only upon the assets and property of the respective constituent series of the Registrant.
SIGNATURES
Pursuant to the requirements of the Securities Exchange Act of 1934 and the Investment Company Act of 1940, the registrant has duly caused this report to be signed on its behalf by the undersigned, thereunto duly authorized.
| | |
| |
| (Registrant) | | MFS VARIABLE INSURANCE TRUST II |
| | |
|
| |
| By (Signature and Title)* | | MARIA F. DWYER |
| | Maria F. Dwyer, President |
Date: February 15, 2008
Pursuant to the requirements of the Securities Exchange Act of 1934 and the Investment Company Act of 1940, this report has been signed below by the following persons on behalf of the registrant and in the capacities and on the dates indicated.
| | |
| |
| By (Signature and Title)* | | MARIA F. DWYER |
| | Maria F. Dwyer, President (Principal Executive Officer) |
Date: February 15, 2008
| | |
|
| |
| By (Signature and Title)* | | TRACY ATKINSON |
| | Tracy Atkinson, Treasurer (Principal Financial Officer and Accounting Officer) |
Date: February 15, 2008
| * | Print name and title of each signing officer under his or her signature. |