UNITED STATES
SECURITIES AND EXCHANGE COMMISSION
Washington, D.C. 20549
FORM N-CSR
CERTIFIED SHAREHOLDER REPORT OF
REGISTERED MANAGEMENT INVESTMENT COMPANIES
Investment Company Act file number 811-3732
MFS VARIABLE INSURANCE TRUST II
(Exact name of registrant as specified in charter)
500 Boylston Street, Boston, Massachusetts 02116
(Address of principal executive offices) (Zip code)
Susan S. Newton
Massachusetts Financial Services Company
500 Boylston Street
Boston, Massachusetts 02116
(Name and address of agents for service)
Registrant’s telephone number, including area code: (617) 954-5000
Date of fiscal year end: December 31
Date of reporting period: December 31, 2008
| ITEM 1. | REPORTS TO STOCKHOLDERS. |
MFS® INTERNATIONAL GROWTH PORTFOLIO
The report is prepared for the general information of contract owners. It is authorized for distribution to prospective investors only when preceded or accompanied by a current prospectus.
NOT FDIC INSURED Ÿ MAY LOSE VALUE Ÿ NO BANK GUARANTEE Ÿ NOT A DEPOSIT Ÿ NOT INSURED BY ANY FEDERAL GOVERNMENT AGENCY OR NCUA/NCUSIF
LETTER FROM THE CEO

Dear Contract Owners:
The market downturns and economic setbacks of late probably rank among the worst financial declines most of us have experienced. Inevitably, people may be questioning their commitment to investing. Still, it is important to remember that downturns are an inescapable part of the business cycle. Such troughs have been seen before, and if we can use history as a guide, market recoveries typically have followed.
Recent events have clearly shown us the value of certain types of investments. In this environment, two of the hallmarks of mutual funds — transparency and liquidity — have become critically important. Unlike some other types of investments, the operations of mutual funds are relatively transparent to their shareholders. With their daily redemption feature, mutual funds also generally provide easy, convenient access to one’s money. Through these recent market upheavals, this level of liquidity enhanced the ability of mutual fund investors to respond and modify their investments as they and their advisors saw fit — a flexibility that those in less liquid investments simply did not have at their disposal.
At MFS® we take particular pride in how well mutual funds can serve investors because we invented the mutual fund in the United States. Established in 1924, Massachusetts Investors Trust was the nation’s first fund. Recent market events only reinforce what we have learned through 85 years — that mutual funds provide unique features that are important to investors in any type of market climate.
Respectfully,

Robert J. Manning
Chief Executive Officer and Chief Investment Officer
MFS Investment Management®
February 17, 2009
The opinions expressed in this letter are subject to change, may not be relied upon for investment advice, and no forecasts can be guaranteed.
Before investing, consider the fund’s investment objectives, risks, charges, and expenses. For a prospectus containing this and other information, contact your investment professional or view online. Read it carefully.
MFS Fund Distributors, Inc., 500 Boylston Street, Boston, MA 02116
1
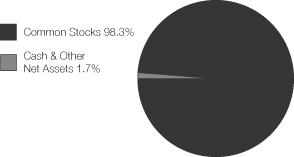
PORTFOLIO COMPOSITION
Portfolio structure
| | |
| Top ten holdings | | |
| Roche Holding AG | | 4.0% |
| Nestle S.A. | | 4.0% |
| TOTAL S.A. | | 3.6% |
| INPEX Holdings, Inc. | | 2.8% |
| Reckitt Benckiser Group PLC | | 2.5% |
LVMH Moet Hennessy Louis Vuitton S.A. | | 2.4% |
| Telefonica S.A. | | 2.2% |
| Novartis AG | | 1.9% |
| WPP Group PLC | | 1.9% |
| Novo Nordisk A/S, “B” | | 1.7% |
| | |
| Equity sectors | | |
| Health Care | | 15.9% |
| Consumer Staples | | 14.6% |
| Financial Services | | 12.1% |
| Technology | | 10.1% |
| Energy | | 10.0% |
| Basic Materials | | 9.3% |
| Retailing | | 8.5% |
| Utilities & Communications | | 7.7% |
| Special Products & Services | | 3.7% |
| Leisure | | 3.3% |
| Industrial Goods & Services | | 3.1% |
| |
| Country weightings | | |
| Japan | | 16.2% |
| Switzerland | | 15.5% |
| France | | 12.0% |
| United Kingdom | | 11.9% |
| Germany | | 9.1% |
| Spain | | 3.5% |
| Brazil | | 3.4% |
| India | | 2.8% |
| Mexico | | 2.4% |
| Other Countries | | 23.2% |
Percentages are based on net assets as of 12/31/08.
The portfolio is actively managed and current holdings may be different.
2
MANAGEMENT REVIEW
Summary of Results
For the twelve months ended December 31, 2008, Initial Class shares of the MFS International Growth Portfolio (the “fund”) provided a total return of –39.82%, while Service Class shares of the fund provided a total return of –39.96%. These compare with a return of –45.41% for the fund’s benchmark, the MSCI All Country World (ex-US) Growth Index.
Market Environment
The U.S. economy and financial markets experienced significant deterioration and extraordinary volatility over the reporting period. U.S. economic growth slowed significantly, despite the short-term bounce from the second quarter fiscal stimulus. Strong domestic headwinds included accelerated deterioration in the housing market, anemic corporate investment, a rapidly declining job market, and a much tighter credit environment. During the period, a seemingly continuous series of tumultuous financial events hammered markets, including: the distressed sale of failing Bear Stearns to JPMorgan, the conservatorship of Government Sponsored Enterprises (GSEs) Fannie Mae and Freddie Mac, the bankruptcy of investment bank Lehman Brothers, the Federal Reserve Bank’s complex intervention of insurance company American International Group (AIG), the nationalization of several large European banks, the failure of Washington Mutual, and the distressed sale of Wachovia. As a result of this barrage of turbulent news, global equity markets pushed significantly lower and credit markets witnessed the worst dislocation since the beginning of the credit crisis. Though conditions improved towards the end of the period, the state of financial and macroeconomic dislocation remained severe.
While reasonably resilient during the first half of the period, the global economy and financial system increasingly experienced considerable negative spillovers from the U.S. slowdown. Not only did Europe and Japan show obvious signs of economic softening, the more powerful engine of global growth – emerging markets – also displayed weakening dynamics.
During the reporting period, the U.S. Federal Reserve Board cut interest rates aggressively and introduced a multitude of new lending facilities to alleviate ever-tightening credit markets, while the U.S. federal government moved quickly to design and implement a meaningful fiscal stimulus package. Although several other global central banks also cut rates, the dilemma of rising energy and food prices heightened concerns among central bankers that inflationary expectations might become unhinged despite weaker growth. Only later in the reporting period did slowing global growth result in a very precipitous decline in commodity prices, which significantly eased inflation and inflationary expectations. As inflationary concerns diminished in the face of global deleveraging, and equity and credit markets deteriorated more sharply, a coordinated rate cut marked the beginning of much more aggressive easing by the major global central banks.
Contributors to Performance
The fund’s overweighted position in the health care sector aided performance relative to the MSCI All Country World (ex-US) Growth Index. Pharmaceutical companies Roche Holding, Hisamitsu Pharmaceuticals (Japan), and Astellas Pharma (aa) (Japan) were among the fund’s top relative contributors. In addition, our investment in biotechnology company Actelion (Switzerland) contributed to relative performance. Shares of Actelion delivered positive returns as the company’s revenue rose, in part, due to the robust sales growth of its pulmonary arterial hypertension drug Tracleer.
Our overweighted position in the consumer staples sector also had a positive impact on relative performance. Global food company Nestle (Switzerland) and personal care products maker Uni-Charm (Japan) were among the top relative contributors during this period. Uni-Charm provided positive returns during the period as the company posted strong first quarter results which were above expectations and its management increased their projections for full-year earnings.
Strong stock selection in the technology sector also aided relative returns. Our investment in electronic products manufacturer Hirose Electric (Japan) boosted results as the stock outperformed relative to the benchmark.
Elsewhere, the fund derived positive relative performance from holdings of integrated oil company TOTAL (France). Not owning mining operator Rio Tinto (United Kingdom) for most of the reporting period also bolstered relative results as the company’s shares fell during that time.
During the reporting period, currency exposure was a contributor to relative performance. All of MFS’ investment decisions are driven by the fundamentals of each individual opportunity and, as such, it is common for our funds to have different currency exposure than the benchmark.
The fund’s cash position also helped relative performance. The fund holds cash to buy new holdings and to provide liquidity. In a period when equity markets declined, as measured by the fund’s benchmark, holding cash helped performance versus the benchmark, which has no cash position.
3
Management Review – continued
Detractors from Performance
Our overweighted position and stock selection in the utilities and communications sector detracted from relative returns. Owning telecommunications company Orascom Telecom Holdings (g) (Egypt) for most of the reporting period held back relative results as the company’s stock price experienced a significant decline during that time.
An overweighted position in the financial services sector also dampened relative performance. Investments in housing financier Housing Development Finance (India) and in banking firms, Erste Group Bank (Austria), Unicredito Italiano (aa)(g) (Italy), and Raiffeisen International Bank Holding (Austria), were among the top detractors. Shares of Raiffeisen International Bank fell as the company reduced its earnings forecast, which resulted from the company’s decision to drastically reduce lending in the Central and Eastern European regions. Holdings of financial services firm UBS (g) (Switzerland) also held back results.
Elsewhere, natural gas producer OAO Gazprom (Russia) was a top relative detractor. In addition, not owning automobile manufacturer Volkswagen (Germany), pharmaceutical company GlaxoSmithKline (United Kingdom), and retail stores operator Seven & I Holdings (Japan) further hampered relative returns as these stocks outperformed the benchmark.
Respectfully,
Barry Dargan
Portfolio Manager
| (aa) | | Security is not a benchmark constituent. |
| (g) | | Security was not held in the portfolio at period end. |
The views expressed in this report are those of the portfolio manager only through the end of the period of the report as stated on the cover and do not necessarily reflect the views of MFS or any other person in the MFS organization. These views are subject to change at any time based on market or other conditions, and MFS disclaims any responsibility to update such views. These views may not be relied upon as investment advice or an indication of trading intent on behalf of any MFS portfolio. References to specific securities are not recommendations of such securities, and may not be representative of any MFS portfolio’s current or future investments.
4
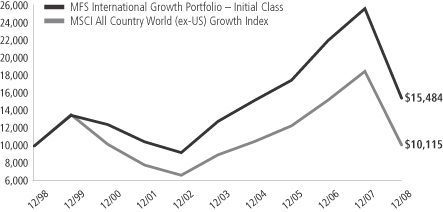
PERFORMANCE SUMMARY THROUGH 12/31/08
The following chart illustrates the historical performance of the fund in comparison to its benchmark(s). Benchmark comparisons are unmanaged; do not reflect any fees or expenses; and cannot be invested in directly. The performance of other share classes will be greater than or less than that of the class depicted below. (See Notes to Performance Summary.)
Performance data shown represents past performance and is no guarantee of future results. Investment return and principal value fluctuate so your units, when sold, may be worth more or less than the original cost; current performance may be lower or higher than quoted. The performance shown does not reflect the deduction of taxes, if any, that a contract holder would pay on fund distributions or the redemption of contract units. The returns for the fund shown also do not reflect the deduction of expenses associated with variable products, such as mortality and expense risk charges, separate account charges, and sales charges imposed by the insurance company separate accounts. Such expenses would reduce the overall returns shown.
Growth of a hypothetical $10,000 investment
Total rates of return through 12/31/08
Average Annual Total Returns
| | | | | | | | | | | | |
| | | Share class | | Class inception date | | 1-yr | | 5-yr | | 10-yr | | |
| | | Initial Class | | 6/03/96 | | (39.82)% | | 3.86% | | 4.47% | | |
| | | Service Class | | 8/24/01 | | (39.96)% | | 3.60% | | 4.29% | | |
Comparative Benchmark
| | | | | | | | | | | | |
| | | MSCI All Country World (ex-US) Growth Index (f) | | (45.41)% | | 2.40% | | 0.11% | | |
| (f) | Source: FactSet Research Systems Inc. |
Benchmark Definition
MSCI All Country World (ex-US) Growth Index – a market capitalization-weighted index that is designed to measure equity market performance for growth securities in the global developed and emerging markets, excluding the U.S.
It is not possible to invest directly in an index.
Notes to Performance Summary
Performance for the Service Class includes the performance of the fund’s Initial Class for periods prior to their offering. Because Service Class expenses are higher than those of Initial Class, performance shown for Service Class is higher than it would have been had it been offered for the entire period. Performance has not been adjusted to take into account differences in class specific operating expenses such as (Rule 12b-1 fees). Please see the prospectus for additional information about performance and expenses.
Performance results reflect any applicable expense subsidies and waivers in effect during the periods shown. Without such subsidies and waivers the fund’s performance results would be less favorable. Please see the prospectus for complete details. All results are historical and assume the reinvestment of any dividends and capital gains distributions.
From time to time the fund may receive proceeds from litigation settlements, without which performance would be lower.
5
EXPENSE TABLE
Fund Expenses Borne by the Contract Holders During the Period,
July 1, 2008 through December 31, 2008
As a contract holder of the fund, you incur ongoing costs, including management fees; distribution (12b-1) fees; and other fund expenses. This example is intended to help you understand your ongoing costs (in dollars) of investing in the fund and to compare these costs with the ongoing costs of investing in other mutual funds.
The example is based on an investment of $1,000 invested at the beginning of the period and held for the entire period July 1, 2008 through December 31, 2008.
Actual Expenses
The first line for each share class in the following table provides information about actual account values and actual expenses. You may use the information in this line, together with the amount you invested, to estimate the expenses that you paid over the period. Simply divide your account value by $1,000 (for example, an $8,600 account value divided by $1,000 = 8.6), then multiply the result by the number in the first line under the heading entitled “Expenses Paid During Period” to estimate the expenses you paid on your account during this period.
Hypothetical Example for Comparison Purposes
The second line for each share class in the following table provides information about hypothetical account values and hypothetical expenses based on the fund’s actual expense ratio and an assumed rate of return of 5% per year before expenses, which is not the fund’s actual return. The hypothetical account values and expenses may not be used to estimate the actual ending account balance or expenses you paid for the period. You may use this information to compare the ongoing costs of investing in the fund and other funds. To do so, compare this 5% hypothetical example with the 5% hypothetical examples that appear in the shareholder reports of the other funds.
Please note that the expenses shown in the table are meant to highlight the fund’s ongoing costs only and do not take into account the fees and expenses imposed under the variable contracts through which your investment in the fund is made. Therefore, the second line for each share class in the table is useful in comparing ongoing costs associated with an investment in vehicles (such as the fund) which fund benefits under variable annuity and variable life insurance contracts and to qualified pension and retirement plans only, and will not help you determine the relative total costs of investing in the fund through variable annuity and variable life insurance contracts. If the fees and expenses imposed under the variable contracts were included, your costs would have been higher.
| | | | | | | | | | |
| Share Class | | | | Annualized
Expense Ratio | | Beginning
Account Value
7/01/08 | | Ending
Account Value
12/31/08 | | Expenses Paid
During Period (p)
7/01/08-12/31/08 |
| Initial Class | | Actual | | 1.34% | | $1,000.00 | | $660.73 | | $5.59 |
| | Hypothetical (h) | | 1.34% | | $1,000.00 | | $1,018.40 | | $6.80 |
| Service Class | | Actual | | 1.59% | | $1,000.00 | | $660.19 | | $6.64 |
| | Hypothetical (h) | | 1.59% | | $1,000.00 | | $1,017.14 | | $8.06 |
| (h) | 5% class return per year before expenses. |
| (p) | Expenses paid is equal to each class’ annualized expense ratio, as shown above, multiplied by the average account value over the period, multiplied by the number of days in the period, divided by the number of days in the year. |
6
PORTFOLIO OF INVESTMENTS – 12/31/08
The Portfolio of Investments is a complete list of all securities owned by your fund. It is categorized by broad-based asset classes.
| | | | | |
| Issuer | | Shares/Par | | Value ($) |
| | | | | |
| COMMON STOCKS – 98.3% | | | | | |
| Alcoholic Beverages – 2.4% | | | | | |
| Companhia de Bebidas das Americas, ADR | | 26,390 | | $ | 1,169,341 |
| Pernod Ricard S.A. (l) | | 18,000 | | | 1,334,795 |
| | | | | |
| | | | $ | 2,504,136 |
| | | | | |
| Apparel Manufacturers – 4.7% | | | | | |
| Compagnie Financiere Richemont S.A. | | 29,872 | | $ | 579,952 |
| Li & Fung Ltd. | | 608,600 | | | 1,042,839 |
| LVMH Moet Hennessy Louis Vuitton S.A. | | 37,560 | | | 2,523,511 |
| Swatch Group Ltd. | | 5,962 | | | 832,805 |
| | | | | |
| | | | $ | 4,979,107 |
| | | | | |
| Biotechnology – 1.1% | | | | | |
| Actelion Ltd. (a)(l) | | 20,720 | | $ | 1,166,978 |
| | | | | |
| Broadcasting – 3.3% | | | | | |
| Grupo Televisa S.A., ADR | | 64,020 | | $ | 956,459 |
| Societe Television Francaise 1 (l) | | 32,861 | | | 480,466 |
| WPP Group PLC | | 348,159 | | | 2,029,503 |
| | | | | |
| | | | $ | 3,466,428 |
| | | | | |
| Brokerage & Asset Managers – 3.8% | | | | | |
| Daiwa Securities Group, Inc. | | 154,000 | | $ | 917,758 |
| Deutsche Boerse AG | | 15,880 | | | 1,156,577 |
| IG Group Holdings PLC | | 166,940 | | | 617,735 |
| Julius Baer Holding Ltd. | | 34,987 | | | 1,345,870 |
| | | | | |
| | | | $ | 4,037,940 |
| | | | | |
| Business Services – 2.6% | | | | | |
| Capita Group PLC | | 49,554 | | $ | 527,998 |
| Infosys Technologies Ltd., ADR | | 55,520 | | | 1,364,126 |
| Intertek Group PLC | | 76,200 | | | 863,134 |
| | | | | |
| | | | $ | 2,755,258 |
| | | | | |
| Computer Software – 1.1% | | | | | |
| SAP AG | | 33,570 | | $ | 1,203,120 |
| | | | | |
| Computer Software – Systems – 0.9% | | | | | |
| NTT Data Corp. | | 226 | | $ | 907,204 |
| | | | | |
| Conglomerates – 1.1% | | | | | |
| Siemens AG | | 15,330 | | $ | 1,148,224 |
| | | | | |
| Consumer Goods & Services – 6.6% | | | | | |
| AmorePacific Corp. (a) | | 1,116 | | $ | 583,451 |
| Hengan International Group Co. Ltd. | | 356,000 | | | 1,143,764 |
| Kao Corp. | | 24,000 | | | 726,791 |
| Reckitt Benckiser Group PLC | | 69,330 | | | 2,582,849 |
| Shiseido Co. Ltd. | | 46,000 | | | 941,664 |
| Uni-Charm Corp. | | 13,300 | | | 1,005,301 |
| | | | | |
| | | | $ | 6,983,820 |
| | | | | |
| Containers – 1.2% | | | | | |
| Brambles Ltd. | | 234,890 | | $ | 1,220,521 |
| | | | | |
| Electrical Equipment – 2.4% | | | | | |
| Keyence Corp. | | 5,900 | | $ | 1,208,061 |
| Schneider Electric S.A. | | 17,630 | | | 1,316,897 |
| | | | | |
| | | | $ | 2,524,958 |
| | | | | |
| | | | | |
| Issuer | | Shares/Par | | Value ($) |
| | | | | |
| COMMON STOCKS – continued | | | |
| Electronics – 6.2% | | | | | |
| Canon, Inc. | | 36,400 | | $ | 1,142,652 |
| Hirose Electric Co. Ltd. (l) | | 9,700 | | | 979,323 |
| Hoya Corp. | | 46,200 | | | 802,579 |
| Royal Philips Electronics N.V. | | 47,160 | | | 917,214 |
| Samsung Electronics Co. Ltd. | | 3,444 | | | 1,250,578 |
| Taiwan Semiconductor Manufacturing Co. Ltd., ADR | | 183,651 | | | 1,450,843 |
| | | | | |
| | | | $ | 6,543,189 |
| | | | | |
| Energy – Independent – 2.8% | | | | | |
| INPEX Corp. | | 378 | | $ | 2,986,408 |
| | | | | |
| Energy – Integrated – 6.1% | | | | | |
| OAO Gazprom, ADR | | 62,320 | | $ | 888,060 |
| Petroleo Brasileiro S.A., ADR | | 69,050 | | | 1,691,034 |
| TOTAL S.A. | | 69,320 | | | 3,779,165 |
| | | | | |
| | | | $ | 6,358,259 |
| | | | | |
| Food & Beverages – 5.6% | | | | | |
| Coca-Cola Hellenic Bottling Co. S.A. | | 33,906 | | $ | 494,607 |
| Groupe Danone | | 19,567 | | | 1,180,966 |
| Nestle S.A. | | 105,449 | | | 4,156,017 |
| | | | | |
| | | | $ | 5,831,590 |
| | | | | |
| Food & Drug Stores – 2.5% | | | | | |
| Dairy Farm International Holdings Ltd. | | 222,300 | | $ | 949,221 |
| Lawson, Inc. | | 8,200 | | | 472,911 |
| Tesco PLC | | 232,708 | | | 1,212,388 |
| | | | | |
| | | | $ | 2,634,520 |
| | | | | |
| Insurance – 0.7% | | | | | |
| QBE Insurance Group Ltd. | | 42,560 | | $ | 773,638 |
| | | | | |
| Machinery & Tools – 0.7% | | | | | |
| Assa Abloy AB, “B” (l) | | 64,420 | | $ | 730,940 |
| | | | | |
| Major Banks – 4.0% | | | | | |
Erste Group Bank AG | | 52,298 | | $ | 1,225,993 |
| HSBC Holdings PLC | | 118,509 | | | 1,134,277 |
| Raiffeisen International Bank Holding AG (l) | | 110 | | | 3,078 |
| Standard Chartered PLC | | 91,299 | | | 1,167,104 |
Unibanco – Uniao de Bancos Brasileiros
S.A., ADR | | 10,780 | | | 696,604 |
| | | | | |
| | | | $ | 4,227,056 |
| | | | | |
| Medical Equipment – 2.6% | | | | | |
| Essilor International S.A. | | 16,610 | | $ | 779,343 |
| Sonova Holding AG | | 12,190 | | | 735,411 |
| Straumann Holding AG | | 70 | | | 12,330 |
| Synthes, Inc. | | 9,350 | | | 1,181,898 |
| | | | | |
| | | | $ | 2,708,982 |
| | | | | |
| Metals & Mining – 2.2% | | | | | |
| BHP Billiton PLC | | 86,630 | | $ | 1,631,839 |
| Rio Tinto Ltd. | | 31,310 | | | 678,388 |
| | | | | |
| | | | $ | 2,310,227 |
| | | | | |
7
Portfolio of Investments – continued
| | | | | |
| Issuer | | Shares/Par | | Value ($) |
| | | | | |
| COMMON STOCKS – continued | | | |
| Network & Telecom – 1.9% | | | | | |
| Nokia Oyj | | 88,620 | | $ | 1,373,870 |
| Research in Motion Ltd. (a) | | 16,190 | | | 656,990 |
| | | | | |
| | | | $ | 2,030,860 |
| | | | | |
| Oil Services – 1.1% | | | | | |
| Saipem S.p.A. | | 67,350 | | $ | 1,130,898 |
| | | | | |
| Other Banks & Diversified Financials – 3.6% | | | |
| Aeon Credit Service Co. Ltd. | | 118,700 | | $ | 1,255,857 |
| Bank Rakyat Indonesia | | 2,042,000 | | | 902,597 |
| Housing Development Finance Corp. Ltd. | | 51,247 | | | 1,598,028 |
| | | | | |
| | | | $ | 3,756,482 |
| | | | | |
| Pharmaceuticals – 12.2% | | | | | |
| Astellas Pharma, Inc. | | 40,200 | | $ | 1,635,794 |
| Bayer AG | | 19,170 | | | 1,126,137 |
| Hisamitsu Pharmaceutical Co., Inc. | | 20,600 | | | 841,034 |
| Merck KGaA | | 13,430 | | | 1,221,022 |
| Novartis AG | | 40,590 | | | 2,033,741 |
| Novo Nordisk A/S, “B” | | 35,015 | | | 1,781,892 |
| Roche Holding AG | | 27,260 | | | 4,196,232 |
| | | | | |
| | | | $ | 12,835,852 |
| | | | | |
| Specialty Chemicals – 5.9% | | | | | |
| Akzo Nobel N.V. | | 31,470 | | $ | 1,297,739 |
| L’Air Liquide S.A. | | 13,520 | | | 1,237,008 |
| Linde AG | | 17,560 | | | 1,485,988 |
| Shin-Etsu Chemical Co. Ltd. | | 24,800 | | | 1,137,474 |
| Symrise AG | | 75,900 | | | 1,071,996 |
| | | | | |
| | | | $ | 6,230,205 |
| | | | | |
| Specialty Stores – 1.3% | | | | | |
| Industria de Diseno Textil S.A. | | 30,140 | | $ | 1,332,228 |
| | | | | |
| Telecommunications – Wireless – 3.4% | | | | | |
| America Movil S.A.B. de C.V., “L”, ADR | | 52,100 | | $ | 1,614,579 |
| MTN Group Ltd. | | 76,740 | | | 907,976 |
| Rogers Communications, Inc., “B” | | 34,680 | | | 1,027,899 |
| | | | | |
| | | | $ | 3,550,454 |
| | | | | |
| | | | | | | |
| Issuer | | Shares/Par | | Value ($) | |
| | | | | | | |
| COMMON STOCKS – continued | | | | |
| Telephone Services – 2.2% | | | | | | | |
| Telefonica S.A. | | | 102,340 | | $ | 2,293,999 | |
| | | | | | | |
| Utilities – Electric Power – 2.1% | | | | | | | |
| CEZ AS | | | 26,160 | | $ | 1,063,075 | |
| E.ON AG | | | 27,630 | | | 1,117,279 | |
| | | | | | | |
| | | | | $ | 2,180,354 | |
| | | | | | | |
Total Common Stocks
(Identified Cost, $122,243,821) | | | | | $ | 103,343,835 | |
| | | | | | | |
|
| REPURCHASE AGREEMENTS – 2.4% | |
| Goldman Sachs, 0.01%, dated 12/31/08, due 1/02/09, total to be received $2,493,001 (secured by U.S. Treasury and Federal Agency obligations and Mortgage Backed securities in a jointly traded account), at Cost | | $ | 2,493,000 | | $ | 2,493,000 | |
| | | | | | | |
|
| COLLATERAL FOR SECURITIES LOANED – 0.7% | |
| Navigator Securities Lending Prime Portfolio, at Cost and Net Asset Value | | | 773,931 | | $ | 773,931 | |
| | | | | | | |
Total Investments
(Identified Cost, $125,510,752) | | | | | $ | 106,610,766 | |
| | | | | | | |
OTHER ASSETS, LESS
LIABILITIES – (1.4)% | | | | | | (1,520,406 | ) |
| | | | | | | |
| Net Assets – 100.0% | | | | | $ | 105,090,360 | |
| | | | | | | |
| (a) | | Non-income producing security. |
| (l) | | All or a portion of this security is on loan. |
The following abbreviations are used in this report and are defined:
| ADR | | American Depository Receipt |
See Notes to Financial Statements
8
FINANCIAL STATEMENTS | STATEMENT OF ASSETS AND LIABILITIES
This statement represents your fund’s balance sheet, which details the assets and liabilities comprising the total value of the fund.
| | | | | |
At 12/31/08 | | | | | |
Assets | | | | | |
Investments, at value, including $728,241 of securities on loan (identified cost, $125,510,752) | | $106,610,766 | | | |
Cash | | 14,455 | | | |
Foreign currency, at value (identified cost, $21,691) | | 22,539 | | | |
Receivable for fund shares sold | | 312,616 | | | |
Interest and dividends receivable | | 147,041 | | | |
Other assets | | 5,579 | | | |
Total assets | | | | | $107,112,996 |
Liabilities | | | | | |
Payable for investments purchased | | $1,012,807 | | | |
Payable for fund shares reacquired | | 57,501 | | | |
Collateral for securities loaned, at value | | 773,931 | | | |
Payable to affiliates | | | | | |
Management fee | | 5,100 | | | |
Distribution fees | | 244 | | | |
Administrative services fee | | 278 | | | |
Payable for trustees’ compensation | | 110 | | | |
Accrued expenses and other liabilities | | 172,665 | | | |
Total liabilities | | | | | $2,022,636 |
Net assets | | | | | $105,090,360 |
Net assets consist of | | | | | |
Paid-in capital | | $135,055,887 | | | |
Unrealized appreciation (depreciation) on investments and translation of assets and liabilities in foreign currencies | | (18,901,669 | ) | | |
Accumulated net realized gain (loss) on investments and foreign currency transactions | | (12,475,552 | ) | | |
Undistributed net investment income | | 1,411,694 | | | |
Net assets | | | | | $105,090,360 |
Shares of beneficial interest outstanding | | | | | 11,815,597 |
Initial Class shares | | | | | |
Net assets | | $87,033,880 | | | |
Shares outstanding | | 9,773,846 | | | |
Net asset value per share | | | | | $8.90 |
Service Class shares | | | | | |
Net assets | | $18,056,480 | | | |
Shares outstanding | | 2,041,751 | | | |
Net asset value per share | | | | | $8.84 |
See Notes to Financial Statements
9
FINANCIAL STATEMENTS | STATEMENT OF OPERATIONS
This statement describes how much your fund earned in investment income and accrued in expenses. It also describes any gains and/or losses generated by fund operations.
| | | | | | |
| Year ended 12/31/08 | | | | | | |
| Net investment income | | | | | | |
Income | | | | | | |
Dividends | | $3,481,981 | | | | |
Interest | | 161,900 | | | | |
Foreign taxes withheld | | (320,148 | ) | | | |
Total investment income | | | | | $3,323,733 | |
Expenses | | | | | | |
Management fee | | $1,212,307 | | | | |
Distribution fees | | 62,490 | | | | |
Administrative services fee | | 40,631 | | | | |
Trustees’ compensation | | 17,849 | | | | |
Custodian fee | | 269,881 | | | | |
Shareholder communications | | 10,737 | | | | |
Auditing fees | | 61,526 | | | | |
Legal fees | | 7,128 | | | | |
Miscellaneous | | 15,904 | | | | |
Total expenses | | | | | $1,698,453 | |
Fees paid indirectly | | (342 | ) | | | |
Net expenses | | | | | $1,698,111 | |
Net investment income | | | | | $1,625,622 | |
Realized and unrealized gain (loss) on investments and foreign currency transactions | | | | | | |
Realized gain (loss) (identified cost basis) | | | | | | |
Investment transactions | | $(12,215,884 | ) | | | |
Foreign currency transactions | | (71,265 | ) | | | |
Net realized gain (loss) on investments and foreign currency transactions | | | | | $(12,287,149 | ) |
Change in unrealized appreciation (depreciation) | | | | | | |
Investments (net of $29,910 decrease in deferred country tax) | | $(54,924,792 | ) | | | |
Translation of assets and liabilities in foreign currencies | | (5,413 | ) | | | |
Net unrealized gain (loss) on investments and foreign currency translation | | | | | $(54,930,205 | ) |
Net realized and unrealized gain (loss) on investments and foreign currency | | | | | $(67,217,354 | ) |
Change in net assets from operations | | | | | $(65,591,732 | ) |
See Notes to Financial Statements
10
FINANCIAL STATEMENTS | STATEMENTS OF CHANGES IN NET ASSETS
These statements describe the increases and/or decreases in net assets resulting from operations, any distributions, and any shareholder transactions.
| | | | | | |
For years ended 12/31 | | 2008 | | | 2007 | |
Change in net assets | | | | | | |
From operations | | | | | | |
Net investment income | | $1,625,622 | | | $1,914,106 | |
Net realized gain (loss) on investments and foreign currency transactions | | (12,287,149 | ) | | 23,679,679 | |
Net unrealized gain (loss) on investments and foreign currency translation | | (54,930,205 | ) | | 89,870 | |
Change in net assets from operations | | $(65,591,732 | ) | | $25,683,655 | |
Distributions declared to shareholders | | | | | | |
From net investment income | | | | | | |
Initial Class | | $(1,388,984 | ) | | $(2,038,840 | ) |
Service Class | | (276,025 | ) | | (278,166 | ) |
From net realized gain on investments | | | | | | |
Initial Class | | (19,144,773 | ) | | (21,494,679 | ) |
Service Class | | (4,670,080 | ) | | (3,494,601 | ) |
Total distributions declared to shareholders | | $(25,479,862 | ) | | $(27,306,286 | ) |
Change in net assets from fund share transactions | | $27,839,758 | | | $6,723,672 | |
Total change in net assets | | $(63,231,836 | ) | | $5,101,041 | |
Net assets | | | | | | |
At beginning of period | | 168,322,196 | | | 163,221,155 | |
At end of period (including undistributed net investment income of $1,411,694 and
$1,525,104, respectively) | | $105,090,360 | | | $168,322,196 | |
See Notes to Financial Statements
11
FINANCIAL STATEMENTS | FINANCIAL HIGHLIGHTS
The financial highlights table is intended to help you understand the fund’s financial performance for the past 5 years. Certain information reflects financial results for a single fund share. The total returns in the table represent the rate by which an investor would have earned (or lost) on an investment in the fund share class (assuming reinvestment of all distributions) held for the entire period.
| | | | | | | | | | | | | | | |
| Initial Class | | Years ended 12/31 | |
| | | 2008 | | | 2007 | | | 2006 | | | 2005 | | | 2004 | |
Net asset value, beginning of period | | $17.63 | | | $17.93 | | | $15.42 | | | $13.55 | | | $11.46 | |
| Income (loss) from investment operations | | | | | | | | | | | | | | | |
Net investment income (d) | | $0.16 | | | $0.21 | | | $0.23 | | | $0.12 | | | $0.13 | |
Net realized and unrealized gain (loss) on investments
and foreign currency | | (6.04 | ) | | 2.57 | | | 3.70 | | | 1.88 | | | 2.03 | |
| Total from investment operations | | $(5.88 | ) | | $2.78 | | | $3.93 | | | $2.00 | | | $2.16 | |
| Less distributions declared to shareholders | | | | | | | | | | | | | | | |
From net investment income | | $(0.19 | ) | | $(0.27 | ) | | $(0.11 | ) | | $(0.13 | ) | | $(0.07 | ) |
From net realized gain on investments | | (2.66 | ) | | (2.81 | ) | | (1.31 | ) | | — | | | — | |
Total distributions declared to shareholders | | $(2.85 | ) | | $(3.08 | ) | | $(1.42 | ) | | $(0.13 | ) | | $(0.07 | ) |
Net asset value, end of period | | $8.90 | | | $17.63 | | | $17.93 | | | $15.42 | | | $13.55 | |
Total return (%) (k)(s) | | (39.82 | ) | | 16.58 | | | 26.04 | | | 14.91 | | | 18.94 | |
Ratios (%) (to average net assets)
and Supplemental data: | | | | | | | | | | | | | | | |
Expenses (f) | | 1.22 | | | 1.11 | | | 1.12 | | | 1.14 | | | 1.11 | |
Net investment income | | 1.25 | | | 1.16 | | | 1.40 | | | 0.85 | | | 1.09 | |
Portfolio turnover | | 73 | | | 56 | | | 86 | | | 80 | | | 93 | |
Net assets at end of period (000 Omitted) | | $87,034 | | | $139,633 | | | $140,242 | | | $121,147 | | | $120,913 | |
| |
| Service Class | | Years ended 12/31 | |
| | | 2008 | | | 2007 | | | 2006 | | | 2005 | | | 2004 | |
Net asset value, beginning of period | | $17.53 | | | $17.85 | | | $15.36 | | | $13.50 | | | $11.43 | |
| Income (loss) from investment operations | | | | | | | | | | | | | | | |
Net investment income (d) | | $0.13 | | | $0.15 | | | $0.19 | | | $0.08 | | | $0.10 | |
Net realized and unrealized gain (loss) on investments
and foreign currency | | (6.00 | ) | | 2.56 | | | 3.69 | | | 1.88 | | | 2.01 | |
| Total from investment operations | | $(5.87 | ) | | $2.71 | | | $3.88 | | | $1.96 | | | $2.11 | |
| Less distributions declared to shareholders | | | | | | | | | | | | | | | |
From net investment income | | $(0.16 | ) | | $(0.22 | ) | | $(0.08 | ) | | $(0.10 | ) | | $(0.04 | ) |
From net realized gain on investments | | (2.66 | ) | | (2.81 | ) | | (1.31 | ) | | — | | | — | |
Total distributions declared to shareholders | | $(2.82 | ) | | $(3.03 | ) | | $(1.39 | ) | | $(0.10 | ) | | $(0.04 | ) |
Net asset value, end of period | | $8.84 | | | $17.53 | | | $17.85 | | | $15.36 | | | $13.50 | |
Total return (%) (k)(s) | | (39.96 | ) | | 16.26 | | | 25.75 | | | 14.62 | | | 18.58 | |
Ratios (%) (to average net assets)
and Supplemental data: | | | | | | | | | | | | | | | |
Expenses (f) | | 1.46 | | | 1.37 | | | 1.37 | | | 1.39 | | | 1.36 | |
Net investment income | | 1.04 | | | 0.85 | | | 1.15 | | | 0.59 | | | 0.86 | |
Portfolio turnover | | 73 | | | 56 | | | 86 | | | 80 | | | 93 | |
Net assets at end of period (000 Omitted) | | $18,056 | | | $28,689 | | | $22,979 | | | $19,289 | | | $18,282 | |
| (d) | Per share data is based on average shares outstanding. |
| (f) | Ratios do not reflect reductions from fees paid indirectly, if applicable. |
| (k) | The total return does not reflect expenses that apply to separate accounts. Inclusion of these charges would reduce the total return figures for all periods shown. |
| (s) | From time to time the fund may receive proceeds from litigation settlements, without which performance would be lower. |
See Notes to Financial Statements
12
NOTES TO FINANCIAL STATEMENTS
| (1) | | Business and Organization |
MFS International Growth Portfolio (the fund) is a series of MFS Variable Insurance Trust II (the trust). The trust is organized as a Massachusetts business trust and is registered under the Investment Company Act of 1940, as amended, as an open-end management investment company. The shares of the fund are sold to variable accounts established by insurance companies to fund benefits under variable contracts issued by such companies, and qualified retirement and pension plans.
| (2) | | Significant Accounting Policies |
General – The preparation of financial statements in conformity with U.S. generally accepted accounting principles requires management to make estimates and assumptions that affect the reported amounts of assets and liabilities, and disclosure of contingent assets and liabilities at the date of the financial statements and the reported amounts of revenues and expenses during the reporting period. Actual results could differ from those estimates. The fund can invest in foreign securities, including securities of emerging market issuers. Investments in foreign securities are vulnerable to the effects of changes in the relative values of the local currency and the U.S. dollar and to the effects of changes in each country’s legal, political, and economic environment. The markets of emerging markets countries are generally more volatile than the markets of developed countries with more mature economies. All of the risks of investing in foreign securities previously described are heightened when investing in emerging markets countries.
In March 2008, FASB Statement No. 161, Disclosures about Derivative Instruments and Hedging Activities (the “Standard”) was issued, and is effective for financial statements issued for fiscal years and interim periods beginning after November 15, 2008. This Standard provides enhanced disclosures about the fund’s use of and accounting for derivative instruments and the effect of derivative instruments on the fund’s results of operations and financial position. Management is evaluating the application of the Standard to the fund, and has not at this time determined the impact, if any, resulting from the adoption of this Standard on the fund’s financial statements.
FASB Staff Position (FSP) 133-1 was implemented during the period. FSP 133-1 amends FAS 133 to require sellers of credit derivatives to make disclosures that will enable financial statement users to assess the potential effects of those credit derivatives on an entity’s financial position, financial performance and cash flows. There was no impact from implementing FSP 133-1 as the fund did not hold any of these credit derivatives at the period end.
Investment Valuations – Equity securities, including restricted equity securities, are generally valued at the last sale or official closing price as reported by a third party pricing service on the market or exchange on which they are primarily traded. For securities for which there were no sales reported that day, equity securities are generally valued at the last quoted daily bid quotation as reported by a third party pricing service on the market or exchange on which they are primarily traded. For securities held short for which there were no sales reported for the day, the position is generally valued at the last quoted daily ask quotation as reported by a third party pricing service on the market or exchange on which such securities are primarily traded. Short-term instruments with a maturity at issuance of 60 days or less may be valued at amortized cost, which approximates market value. Open-end investment companies are generally valued at net asset value per share. Securities and other assets generally valued on the basis of information from a third party pricing service may also be valued at a broker-dealer bid quotation. Values obtained from pricing services can utilize both dealer-supplied valuations and electronic data processing techniques, which take into account factors such as institutional-size trading in similar groups of securities, yield, quality, coupon rate, maturity, type of issue, trading characteristics, and other market data. The values of foreign securities and other assets and liabilities expressed in foreign currencies are converted to U.S. dollars using the mean of bid and asked prices for rates reported by a third party pricing service.
The Board of Trustees has delegated primary responsibility for determining or causing to be determined the value of the fund’s investments (including any fair valuation) to the adviser pursuant to valuation policies and procedures approved by the Board. If the adviser determines that reliable market quotations are not readily available, investments are valued at fair value as determined in good faith by the adviser in accordance with such procedures under the oversight of the Board of Trustees. Under the fund’s valuation policies and procedures, market quotations are not considered to be readily available for most types of debt instruments and floating rate loans and many types of derivatives. These investments are generally valued at fair value based on information from third party pricing services. In addition, investments may be valued at fair value if the adviser determines that an investment’s value has been materially affected by events occurring after the close of the exchange or market on which the investment is principally traded (such as foreign exchange or market) and prior to the determination of the fund’s net asset value, or after the halting of trading of a specific security where trading does not resume prior to the close of the exchange or market on which the security is principally traded. Events that occur on a frequent basis after foreign markets close (such as developments in foreign markets and significant movements in the U.S. markets) and prior to the determination of the fund’s net asset value may be deemed to have a material affect on the value of securities traded in foreign markets. Accordingly, the fund’s foreign equity securities may often be valued at fair value. The adviser may rely on third party pricing services or other information (such as the correlation with price movements of similar securities in the same or other
13
Notes to Financial Statements – continued
markets; the type, cost and investment characteristics of the security; the business and financial condition of the issuer; and trading and other market data) to assist in determining whether to fair value and at what value to fair value an investment. The value of an investment for purposes of calculating the fund’s net asset value can differ depending on the source and method used to determine value. When fair valuation is used, the value of investments used to determine the fund’s net asset value may differ from quoted or published prices for the same investments.
The fund adopted FASB Statement No. 157, Fair Value Measurements (the “Statement”). This Statement provides a single definition of fair value, a hierarchy for measuring fair value and expanded disclosures about fair value measurements.
Various inputs are used in determining the value of the fund’s assets or liabilities carried at market value. These inputs are categorized into three broad levels. Level 1 includes quoted prices in active markets for identical assets or liabilities. Level 2 includes other significant observable market-based inputs (including quoted prices for similar securities, interest rates, prepayment speed, and credit risk). Level 3 includes unobservable inputs, which may include the adviser’s own assumptions in determining the fair value of investments. Other financial instruments are derivative instruments not reflected in total investments, such as futures, forwards, swap contracts and written options. The following is a summary of the levels used as of December 31, 2008 in valuing the fund’s assets or liabilities carried at market value:
| | | | | | | | |
| | | Level 1 | | Level 2 | | Level 3 | | Total |
| Investments in Securities | | $16,488,765 | | $90,122,001 | | $— | | $106,610,766 |
| Other Financial Instruments | | $— | | $— | | $— | | $— |
Repurchase Agreements – The fund may enter into repurchase agreements with approved counterparties. Each repurchase agreement is recorded at cost. The fund requires that the securities collateral in a repurchase transaction be transferred to a custodian. The fund monitors, on a daily basis, the value of the collateral to ensure that its value, including accrued interest, is greater than amounts owed to the fund under each such repurchase agreement. The fund and other funds managed by Massachusetts Financial Services Company (MFS), may utilize a joint trading account for the purpose of entering into one or more repurchase agreements.
Foreign Currency Translation – Purchases and sales of foreign investments, income, and expenses are converted into U.S. dollars based upon currency exchange rates prevailing on the respective dates of such transactions or on the reporting date for foreign denominated receivables and payables. Gains and losses attributable to foreign currency exchange rates on sales of securities are recorded for financial statement purposes as net realized gains and losses on investments. Gains and losses attributable to foreign exchange rate movements on receivables, payables, income and expenses are recorded for financial statement purposes as foreign currency transaction gains and losses. That portion of both realized and unrealized gains and losses on investments that results from fluctuations in foreign currency exchange rates is not separately disclosed.
Security Loans – State Street Bank and Trust Company (“State Street”), as lending agent, may loan the securities of the fund to certain qualified institutions (the “Borrowers”) approved by the fund. The loans are collateralized by cash and/or U.S. Treasury and federal agency obligations in an amount typically at least equal to the market value of the securities loaned. State Street provides the fund with indemnification against Borrower default. The fund bears the risk of loss with respect to the investment of cash collateral. On loans collateralized by cash, the cash collateral is invested in a money market fund or short-term securities. A portion of the income generated upon investment of the collateral is remitted to the Borrowers, and the remainder is allocated between the fund and the lending agent. On loans collateralized by U.S. Treasury and/or federal agency obligations, a fee is received from the Borrower, and is allocated between the fund and the lending agent. Income from securities lending is included in interest income on the Statement of Operations. The dividend and interest income earned on the securities loaned is accounted for in the same manner as other dividend and interest income.
Indemnifications – Under the fund’s organizational documents, its officers and trustees may be indemnified against certain liabilities and expenses arising out of the performance of their duties to the fund. Additionally, in the normal course of business, the fund enters into agreements with service providers that may contain indemnification clauses. The fund’s maximum exposure under these agreements is unknown as this would involve future claims that may be made against the fund that have not yet occurred.
Investment Transactions and Income – Investment transactions are recorded on the trade date. Interest income is recorded on the accrual basis. All premium and discount is amortized or accreted for financial statement purposes in accordance with U.S. generally accepted accounting principles. Dividends received in cash are recorded on the ex-dividend date. Certain dividends from foreign securities will be recorded when the fund is informed of the dividend if such information is obtained subsequent to the ex-dividend date. Dividend and interest payments received in additional securities are recorded on the ex-dividend or ex-interest date in an amount equal to the value of the security on such date.
The fund may receive proceeds from litigation settlements. Any proceeds received from litigation involving portfolio holdings are reflected in the Statement of Operations in realized gain/loss if the security has been disposed of by the fund or in
14
Notes to Financial Statements – continued
unrealized gain/loss if the security is still held by the fund. Any other proceeds from litigation not related to portfolio holdings are reflected as other income in the Statement of Operations.
Fees Paid Indirectly – The fund’s custody fee may be reduced according to an arrangement that measures the value of cash deposited with the custodian by the fund. This amount, for the year ended December 31, 2008, is shown as a reduction of total expenses on the Statement of Operations.
Tax Matters and Distributions – The fund intends to qualify as a regulated investment company, as defined under Subchapter M of the Internal Revenue Code, and to distribute all of its taxable income, including realized capital gains. As a result, no provision for federal income tax is required. Each of the fund’s federal tax returns for the prior three fiscal years remains subject to examination by the Internal Revenue Service. Foreign taxes, if any, have been accrued by the fund in the accompanying financial statements.
Distributions to shareholders are recorded on the ex-dividend date. Income and capital gain distributions are determined in accordance with income tax regulations, which may differ from U.S. generally accepted accounting principles. Certain capital accounts in the financial statements are periodically adjusted for permanent differences in order to reflect their tax character. These adjustments have no impact on net assets or net asset value per share. Temporary differences which arise from recognizing certain items of income, expense, gain or loss in different periods for financial statement and tax purposes will reverse at some time in the future. Distributions in excess of net investment income or net realized gains are temporary overdistributions for financial statement purposes resulting from differences in the recognition or classification of income or distributions for financial statement and tax purposes.
Book/tax differences primarily relate to passive foreign investment companies, wash sale loss deferrals, foreign currency transactions, and foreign taxes.
The tax character of distributions declared to shareholders for the last two fiscal years is as follows:
| | | | |
| | | 12/31/08 | | 12/31/07 |
| Ordinary income (including any short-term capital gains) | | $6,081,577 | | $10,103,836 |
| Long-term capital gain | | 19,398,285 | | 17,202,450 |
| Total distributions | | $25,479,862 | | $27,306,286 |
The federal tax cost and the tax basis components of distributable earnings were as follows:
| | | |
| As of 12/31/08 | | | |
| Cost of investments | | $127,841,288 | |
| Gross appreciation | | 4,397,327 | |
| Gross depreciation | | (25,627,849 | ) |
| Net unrealized appreciation (depreciation) | | $(21,230,522 | ) |
| Undistributed ordinary income | | 1,416,746 | |
| Capital loss carryforwards | | (10,066,011 | ) |
| Other temporary differences | | (85,740 | ) |
As of December 31, 2008, the fund had capital loss carryforwards available to offset future realized gains. Such losses expire as follows:
Multiple Classes of Shares of Beneficial Interest – The fund offers multiple classes of shares, which differ in their respective distribution fees. The fund’s income, realized and unrealized gain (loss), and common expenses are allocated to shareholders based on the daily net assets of each class. Dividends are declared separately for each class. Differences in per share dividend rates are generally due to differences in separate class expenses.
| (3) | | Transactions with Affiliates |
Investment Adviser – The fund has an investment advisory agreement with MFS to provide overall investment management and related administrative services and facilities to the fund. The management fee is computed daily and paid monthly at the following annual rates:
| | |
| First $1 billion of average daily net assets | | 0.90% |
| Next $1 billion of average daily net assets | | 0.80% |
| Average daily net assets in excess of $2 billion | | 0.70% |
The management fee incurred for the year ended December 31, 2008 was equivalent to an annual effective rate of 0.90% of the fund’s average daily net assets.
Distributor – MFS Fund Distributors, Inc. (MFD), a wholly-owned subsidiary of MFS, is the distributor of shares of the fund. The Trustees have adopted a distribution plan for the Service Class shares pursuant to Rule 12b-1 under the Investment Company Act of 1940.
15
Notes to Financial Statements – continued
The fund’s distribution plan provides that the fund will pay MFD distribution fees equal to 0.25% per annum of its average daily net assets attributable to Service Class shares as partial consideration for services performed and expenses incurred by MFD and financial intermediaries in connection with the sale and distribution of the fund’s Service Class shares and the sale and distribution of the variable annuity or variable life insurance contracts investing indirectly in Service Class shares. MFD may subsequently pay all, or a portion, of the distribution fees to financial intermediaries.
Shareholder Servicing Agent – MFS Service Center, Inc. (MFSC), a wholly-owned subsidiary of MFS, has contracted to provide transfer agent and recordkeeping functions in connection with the issuance, transfer, and redemption of each class of shares of the fund under a Shareholder Servicing Agent Agreement. During the year ended December 31, 2008, the fund did not pay MFSC a fee for this service.
Administrator – MFS provides certain financial, legal, shareholder communications, compliance, and other administrative services to the fund. Under an administrative services agreement, the fund partially reimburses MFS the costs incurred to provide these services. The fund is charged an annual fixed amount of $10,000 plus a fee based on average daily net assets.
The administrative services fee incurred for the year ended December 31, 2008 was equivalent to an annual effective rate of 0.0302% of the fund’s average daily net assets.
Trustees’ and Officers’ Compensation – The fund pays compensation to trustees in the form of a retainer, attendance fees, and additional compensation to the Board chairperson. The fund does not pay compensation directly to officers of the fund who are also officers of the investment adviser, all of whom receive remuneration for their services to the fund from MFS. Certain officers of the fund are officers or directors of MFS, MFD, and MFSC.
Other – This fund and certain other MFS funds (the funds) have entered into services agreements (the Agreements) which provide for payment of fees by the funds to Tarantino LLC and Griffin Compliance LLC in return for the provision of services of an Independent Chief Compliance Officer (ICCO) and Assistant ICCO, respectively, for the funds. The ICCO and Assistant ICCO are officers of the funds and the sole members of Tarantino LLC and Griffin Compliance LLC, respectively. The funds can terminate the Agreements with Tarantino LLC and Griffin Compliance LLC at any time under the terms of the Agreements. MFS has agreed to bear all expenses associated with office space, other administrative support, and supplies provided to the ICCO and Assistant ICCO. For the year ended December 31, 2008, the aggregate fees paid by the fund to Tarantino LLC and Griffin Compliance LLC were $1,269 and are included in miscellaneous expense on the Statement of Operations.
Purchases and sales of investments, other than U.S. Government securities, purchased option transactions, and short-term obligations, aggregated $100,501,503 and $98,954,210, respectively.
| (5) | | Shares of Beneficial Interest |
The fund’s Declaration of Trust permits the Trustees to issue an unlimited number of full and fractional shares of beneficial interest. Transactions in fund shares were as follows:
| | | | | | | | | | | | |
| | | Year ended 12/31/08 | | | Year ended 12/31/07 | |
| | | Shares | | | Amount | | | Shares | | | Amount | |
| Shares sold | | | | | | | | | | | | |
Initial Class | | 2,955,692 | | | $33,019,673 | | | 592,082 | | | $10,559,446 | |
Service Class | | 512,349 | | | 6,524,407 | | | 372,212 | | | 6,445,439 | |
| | 3,468,041 | | | $39,544,080 | | | 964,294 | | | $17,004,885 | |
| Shares issued to shareholders in reinvestment of distributions | | | | | | | | | | | | |
Initial Class | | 1,382,745 | | | $20,533,757 | | | 1,418,537 | | | $23,533,519 | |
Service Class | | 334,875 | | | 4,946,105 | | | 228,376 | | | 3,772,767 | |
| | 1,717,620 | | | $25,479,862 | | | 1,646,913 | | | $27,306,286 | |
| Shares reacquired | | | | | | | | | | | | |
Initial Class | | (2,485,117 | ) | | $(32,252,847 | ) | | (1,911,799 | ) | | $(33,219,473 | ) |
Service Class | | (441,944 | ) | | (4,931,337 | ) | | (251,778 | ) | | (4,368,026 | ) |
| | (2,927,061 | ) | | $(37,184,184 | ) | | (2,163,577 | ) | | $(37,587,499 | ) |
| Net change | | | | | | | | | | | | |
Initial Class | | 1,853,320 | | | $21,300,583 | | | 98,820 | | | $873,492 | |
Service Class | | 405,280 | | | 6,539,175 | | | 348,810 | | | 5,850,180 | |
| | 2,258,600 | | | $27,839,758 | | | 447,630 | | | $6,723,672 | |
16
Notes to Financial Statements – continued
The fund and other funds managed by MFS participate in a $1 billion unsecured committed line of credit provided by a syndication of banks under a credit agreement. In addition, the fund and other funds managed by MFS have established uncommitted borrowing arrangements with certain banks. Borrowings may be made for temporary financing needs. Interest is charged to each fund, based on its borrowings, generally at a rate equal to the Federal Reserve funds rate plus 0.30%. In addition, a commitment fee, based on the average daily, unused portion of the committed line of credit, is allocated among the participating funds at the end of each calendar quarter. For the year ended December 31, 2008, the fund’s commitment fee and interest expense were $708 and $0, respectively, and are included in miscellaneous expense on the Statement of Operations.
17
REPORT OF INDEPENDENT REGISTERED PUBLIC ACCOUNTING FIRM
To the Board of Trustees of MFS Variable Insurance Trust II and the Shareholders of
MFS International Growth Portfolio:
We have audited the accompanying statement of assets and liabilities, including the portfolio of investments, of MFS International Growth Portfolio (the “Fund”) (one of the portfolios comprising MFS Variable Insurance Trust II) as of December 31, 2008, and the related statement of operations for the year then ended, the statements of changes in net assets for each of the two years in the period then ended, and the financial highlights for each of the five years in the period then ended. These financial statements and financial highlights are the responsibility of the Fund’s management. Our responsibility is to express an opinion on these financial statements and financial highlights based on our audits.
We conducted our audits in accordance with the standards of the Public Company Accounting Oversight Board (United States). Those standards require that we plan and perform the audit to obtain reasonable assurance about whether the financial statements and financial highlights are free of material misstatement. The Fund is not required to have, nor were we engaged to perform, an audit of its internal control over financial reporting. Our audits included consideration of internal control over financial reporting as a basis for designing audit procedures that are appropriate in the circumstances, but not for the purpose of expressing an opinion on the effectiveness of the Fund’s internal control over financial reporting. Accordingly, we express no such opinion. An audit also includes examining, on a test basis, evidence supporting the amounts and disclosures in the financial statements, assessing the accounting principles used and significant estimates made by management, as well as evaluating the overall financial statement presentation. Our procedures included confirmation of securities owned as of December 31, 2008, by correspondence with the custodian and brokers; where replies were not received from brokers, we performed other auditing procedures. We believe that our audits provide a reasonable basis for our opinion.
In our opinion, the financial statements and financial highlights referred to above present fairly, in all material respects, the financial position of MFS International Growth Portfolio as of December 31, 2008, the results of its operations for the year then ended, the changes in its net assets for each of the two years in the period then ended, and the financial highlights for each of the five years in the period then ended, in conformity with accounting principles generally accepted in the United States of America.
DELOITTE & TOUCHE LLP
Boston, Massachusetts
February 17, 2009
18
TRUSTEES AND OFFICERS – IDENTIFICATION AND BACKGROUND
The Trustees and officers of the Trust, as of February 1, 2009, are listed below, together with their principal occupations during the past five years. (Their titles may have varied during that period.) The address of each Trustee and officer is 500 Boylston Street, Boston, Massachusetts 02116.
| | | | | | |
Name, Date of Birth | | Position(s) Held
with Fund | | Trustee/Officer
Since (1) | | Principal Occupations During the Past Five Years and
Other Directorships (2) |
| INTERESTED TRUSTEE | | | | |
David D. Horn (3) (born 6/07/41) | | Trustee | | April 1986 | | Private investor; Sun Life Assurance Company of Canada, Senior Vice President and General Manager for the United States (until 1997); Director (until March 2004) |
| | |
| INDEPENDENT TRUSTEES | | | | |
J. Kermit Birchfield (born 1/08/40) | | Chairman | | May 1997 | | Consultant; Century Partners, Inc. (investments), Director; Displaytech, Inc. (technology), Director; Dessin Fournir LLC (furniture manufacturer), Director (2005 to present); Intermountain Gas Company, Inc. & Intermountain Industries, Inc. (oil & gas exploration and production), Director; Site Watch LLC (software to monitor oil tanks), Managing Director (2006 to present); Juridica Investments (fund investing in judicial matters), Director (2007 to present); HPSC, Inc. (medical financing), Director (until January 2004) |
| | | |
Robert C. Bishop (born 1/13/43) | | Trustee | | May 2001 | | AutoImmune, Inc. (pharmaceutical product development), Chairman, President and Chief Executive Officer; Caliper Life Sciences Corp. (laboratory analytical instruments), Director; Millipore Corporation (purification/filtration products), Director; Waterstreet Capital (leverage buyouts), Advisory Board (August 2006 to present); Optobionics Corporation (ophthalmic devices), Director (2002 to 2007) |
| | | |
Frederick H. Dulles (born 3/12/42) | | Trustee | | May 2001 | | Ten State International Law PLLC (law firm), Of Counsel (since 2006); Prudential Carolina Real Estate, (real estate), Broker (since 2006); Free Enterprise Foundation, Inc. (research institute), Director & Secretary (until 2008); Disher, Hamrick & Myers Residential, Inc. (real estate) Broker (2005 until 2006); Frederick H. Dulles law practice (until 2006); Ten State Street LLP (law firm), Member (until 2005) |
| | | |
Marcia A. Kean (born 6/30/48) | | Trustee | | April 2005 | | Feinstein Kean Healthcare (consulting), Chief Executive Officer |
| | | |
Ronald G. Steinhart (born 6/15/40) | | Trustee | | May 2001 | | Private investor; Penske Automotive Group (automotive retailer), Director; Animal Health International, Inc. (animal health products), Director (since 2007); Texas Industries (concrete/aggregates/cement), Director (since 2007); Penson Worldwide, Inc. (securities clearance), Director (since 2006); Carreker Corporation (technology consulting) Director (until 2005); Prentiss Properties Trust (real estate investment trust), Director (until 2006) |
| | | |
Haviland Wright (born 7/21/48) | | Trustee | | May 2001 | | Profitability of Hawaii (software), Chief Development Officer (since December 2008); Elixir Technologies Corporation (software) Director (since 2005); Nano Loa Inc. (liquid crystal displays), Director |
| | |
| TRUSTEE EMERITUS | | | | |
Samuel Adams (born 10/19/25) | | Trustee Emeritus | | | | Retired; K&L Gates LLP (law firm), Of Counsel |
| | |
| OFFICERS | | | | |
Maria F. Dwyer (4) (born 12/01/58) | | President | | November 2005 | | Massachusetts Financial Services Company, Executive Vice President and Chief Regulatory Officer (since March 2004) Chief Compliance Officer (since December 2006); Fidelity Management & Research Company, Vice President (prior to March 2004); Fidelity Group of Funds, President and Treasurer (until March 2004) |
| | | |
Christopher R. Bohane (4) (born 1/18/74) | | Assistant Secretary and Assistant Clerk | | July 2005 | | Massachusetts Financial Services Company, Vice President and Senior Counsel |
| | | |
John M. Corcoran (4) (born 4/13/65) | | Treasurer | | October 2008 | | Massachusetts Financial Services Company, Senior Vice President (since October 2008); State Street Bank and Trust (financial services provider), Senior Vice President, (until September 2008) |
| | | |
Ethan D. Corey (4) (born 11/21/63) | | Assistant Secretary and Assistant Clerk | | July 2005 | | Massachusetts Financial Services Company, Senior Vice President and Associate General Counsel (since 2004); Dechert LLP (law firm), Counsel (prior to December 2004) |
| | | |
David L. DiLorenzo (4) (born 8/10/68) | | Assistant Treasurer | | July 2005 | | Massachusetts Financial Services Company, Vice President (since June 2005); JP Morgan Investor Services, Vice President (until June 2005) |
| | | |
Timothy M. Fagan (4) (born 7/10/68) | | Assistant Secretary and Assistant Clerk | | September 2005 | | Massachusetts Financial Services Company, Vice President and Senior Counsel (since September 2005); John Hancock Advisers, LLC, Vice President, Senior Attorney and Chief Compliance Officer (until August 2005) |
19
Trustees and Officers – continued
| | | | | | |
Name, Date of Birth | | Position(s) Held
with Fund | | Trustee/Officer
Since (1) | | Principal Occupations During the Past Five Years and
Other Directorships (2) |
Mark D. Fischer (4) (born 10/27/70) | | Assistant Treasurer | | July 2005 | | Massachusetts Financial Services Company, Vice President (since May 2005); JP Morgan Investment Management Company, Vice President (until May 2005) |
| | | |
Robyn L. Griffin (born 7/04/75) | | Assistant Independent Chief Compliance Officer | | August 2008 | | Griffin Compliance LLC (provider of compliance services), Principal (since August 2008); State Street Corporation (financial services provider), Mutual Fund Administration Assistant Vice President (October 2006 – July 2008); Liberty Mutual Group (insurance), Personal Market Assistant Controller (April 2006 – October 2006); Deloitte & Touche LLP (professional services firm), Senior Manager (prior to April 2006) |
| | | |
Brian E. Langenfeld (4) (born 3/07/73) | | Assistant Secretary and Assistant Clerk | | May 2006 | | Massachusetts Financial Services Company, Vice President and Senior Counsel (since May 2006); John Hancock Advisers, LLC, Assistant Vice President and Counsel (until April 2006) |
| | | |
Ellen Moynihan (4) (born 11/13/57) | | Assistant Treasurer | | May 1997 | | Massachusetts Financial Services Company, Senior Vice President |
| | | |
Susan S. Newton (4) (born 3/07/50) | | Assistant Secretary and Assistant Clerk | | May 2005 | | Massachusetts Financial Services Company, Senior Vice President and Associate General Counsel (since April 2005); John Hancock Advisers, LLC, Senior Vice President, Secretary and Chief Legal Officer (until April 2005) |
| | | |
Susan A. Pereira (4) (born 11/05/70) | | Assistant Secretary and Assistant Clerk | | July 2005 | | Massachusetts Financial Services Company, Vice President and Senior Counsel (since June 2004); Bingham McCutchen LLP (law firm), Associate (until June 2004) |
| | | |
Mark N. Polebaum (4) (born 5/01/52) | | Secretary and Clerk | | February 2006 | | Massachusetts Financial Services Company, Executive Vice President, General Counsel and Secretary (since January 2006); Wilmer Cutler Pickering Hale and Dorr LLP (law firm), Partner (until January 2006) |
| | | |
Frank L. Tarantino (born 3/07/44) | | Independent Chief Compliance Officer | | September 2004 | | Tarantino LLC (provider of compliance services), Principal (since June 2004); CRA Business Strategies Group (consulting services), Executive Vice President (until June 2004) |
| | | |
Richard S. Weitzel (4) (born 7/16/70) | | Assistant Secretary and Assistant Clerk | | October 2007 | | Massachusetts Financial Services Company, Vice President and Assistant General Counsel (since 2004); Massachusetts Department of Business and Technology, General Counsel (until April 2004) |
| | | |
James O. Yost (4) (born 6/12/60) | | Assistant Treasurer | | April 1992 | | Massachusetts Financial Services Company, Senior Vice President |
| (1) | Date first appointed to serve as Trustee/Officer of an MFS fund or a Compass variable account. Each Trustee has served continuously since appointment. |
| (2) | Directorships or trusteeships of companies required to report to the Securities and Exchange Commission (i.e., “public companies”). |
| (3) | “Interested person” of the Trust, within the meaning of the Investment Company Act of 1940 (referred to as the 1940 Act), which is the principal federal law governing investment companies like the Trust, as a result of position with Sun Life of Canada (U.S.). The address of Sun Life of Canada (U.S.) is One Sun Life Executive Park, Wellesley Hills, Massachusetts 02481. |
| (4) | “Interested person” of MFS within the meaning of the 1940 Act. The address of MFS is 500 Boylston Street, Boston, Massachusetts 02116. |
The Trust does not hold annual meetings for the purpose of electing Trustees, and Trustees are not elected for fixed terms. Each Trustee and officer holds office until his or her successor is chosen and qualified, or until his or her earlier death, resignation, retirement or removal.
All Trustees currently serve as Trustees of the Trust and have served in that capacity since originally elected or appointed. All of the Trustees are also Managers of the Compass Variable Accounts. The executive officers of the Trust hold similar offices for the Compass Variable Accounts and other funds in the MFS fund complex. As of January 1, 2009, each Trustee serves as a Trustee or Manager of 35 Accounts/Funds.
The Statement of Additional Information contains further information about the Trustees and is available without charge upon request by calling 1-800-752-7215.
| | |
Investment Adviser
Massachusetts Financial Services Company 500 Boylston Street, Boston, MA 02116-3741 | | Custodian State Street Bank and Trust 1 Lincoln Street, Boston, MA 02111-2900 |
Distributor
MFS Fund Distributors, Inc. 500 Boylston Street, Boston, MA 02116-3741 | | Independent Registered Public Accounting Firm Deloitte & Touche LLP 200 Berkeley Street, Boston, MA 02116 |
Portfolio Manager Barry Dargan | | |
20
BOARD REVIEW OF INVESTMENT ADVISORY AGREEMENT
The Investment Company Act of 1940 requires that both the full Board of Trustees and a majority of the non-interested (“independent”) Trustees, voting separately, annually approve the continuation of the investment advisory agreement between MFS Variable Insurance Trust II (the “Trust”) and Massachusetts Financial Services Company (“MFS”) on behalf of the Fund. The Trustees consider matters bearing on the Fund and the advisory arrangements at their meetings throughout the year, including a review of performance data at each regular meeting. In addition, the independent Trustees met in May and again in July 2008 (“contract review meetings”) for the specific purpose of considering whether to approve the continuation of the investment advisory agreement for the Fund. The independent Trustees were assisted in their evaluation of the investment advisory agreement by independent legal counsel, from whom they received separate legal advice and with whom they met separately from MFS management during various contract review meetings. The independent Trustees were also assisted in this process by the Fund’s Independent Chief Compliance Officer, a full-time senior officer appointed by and reporting to the independent Trustees.
In connection with their deliberations, the Trustees, including the independent Trustees, considered such information and factors as they believed, in light of the legal advice furnished to them and their own business judgment, to be relevant. The investment advisory agreement was considered separately for the Fund, although the Trustees also took into account the common interests of all Funds in the Trust in their review. As described below, the Trustees considered the nature, quality, and extent of the various investment advisory, administrative, and shareholder services performed by MFS under the existing investment advisory agreement and other arrangements with the Trust.
In connection with their contract review meetings, the Trustees received and relied upon materials which included, among other items: (i) information provided by Lipper Inc. on the investment performance of the Fund for various time periods ended December 31, 2007, compared to the investment performance of a group of funds with substantially similar investment classifications/objectives (the “Lipper performance universe”), (ii) information provided by Lipper Inc. on the Fund’s advisory fees and other expenses compared to the advisory fees and other expenses of comparable funds identified by Lipper (the “Lipper expense group”), (iii) information provided by MFS on the advisory fees of comparable portfolios of its other clients, including institutional separate account and other clients, (iv) information as to whether expense waivers, reimbursements or fee “breakpoints” are observed for the Fund, (v) information regarding MFS’ financial results and financial condition, including MFS’ and certain of its affiliates’ estimated profitability from services performed for the Fund, (vi) MFS’ views regarding the outlook for the mutual fund industry and its strategic business plans, (vii) descriptions of various functions performed by MFS for the Trust, such as compliance monitoring and portfolio trading practices, and (viii) information regarding the overall organization of MFS, including information about MFS’ senior management and other personnel providing investment advisory, administrative and other services to the Fund. The comparative performance, fee and expense information prepared and provided by Lipper Inc. was not independently verified, and the independent Trustees did not independently verify any information provided to them by MFS.
The Trustees’ conclusion as to the continuation of the investment advisory agreement was based on comprehensive consideration of all information provided to the Trustees and not the result of any single factor. Some of the factors that figured particularly in the Trustees’ deliberations are described below for the Fund, while individual Trustees may have given different weight to various factors and evaluated the information presented as a whole differently than another Trustee. The Trustees recognized that the fee arrangements for the Fund reflect years of review and discussion between the independent Trustees and MFS, that certain aspects of such arrangements may receive greater scrutiny in some years than others, and that the Trustees’ conclusions may be based, in part, on their consideration of these same arrangements during the course of the year and in prior years.
Based on information provided by Lipper Inc., the Trustees compared the Fund’s total return investment performance to the performance of a peer group of funds over various time periods. The Trustees placed particular emphasis on the total return performance of the Fund’s Initial Class shares in comparison to the performance of funds in its Lipper performance universe over the one-, three- and five-year periods. The Trustees did not rely on performance results for more recent periods, including those shown elsewhere in this report.
The Trustees noted the performance of the Fund’s Initial Class shares was in the 2nd quintile relative to the other funds in the Lipper Classification Index for the one-year period (the 1st quintile being the best performers and the 5th quintile being the worst performers). The total return performance of the Fund was also in the 2nd quintile for the three-year period and the five-year period ended December 31, 2007, relative to the Lipper performance universe. Based on the nature and quality of services provided by MFS, the Board of Trustees concluded that the Fund’s performance was satisfactory.
In the course of their deliberations, the Trustees took into account information provided by MFS during contract review meetings, as well as during investment review meetings conducted with portfolio management personnel during the course of the year.
21
Board Review of Investment Advisory Agreement – continued
In assessing the reasonableness of the Fund’s advisory fee, the Trustees considered, among other information, the Fund’s advisory fee and the total expense ratio of the Fund’s Initial Class shares as a percentage of average daily net assets, compared to the advisory fee and total expense ratios of its peer group of funds based on information provided by Lipper Inc. The Trustees also considered the advisory fees charged by MFS to institutional accounts. In comparing these fees, the Trustees considered the generally broader scope of services provided by MFS to the Trust than those provided to institutional accounts. The Trustees also considered the higher demands placed on MFS’ investment personnel and trading infrastructure as a result of the daily cash in-flows and out-flows of the Fund, and the impact on MFS and related expenses due to the more extensive regulatory regime to which the Fund is subject, compared to institutional accounts.
In considering the fees, the Trustees noted from the Lipper data that the Fund’s effective advisory fee rate and total expense ratio were each approximately at the median of such fees and expenses of funds in the Lipper expense group. The Trustees further concluded that the existing breakpoints were sufficient to allow the Fund to benefit from economies of scale as its assets grow. The Trustees concluded that the fees were reasonable in light of the nature and quality of services provided.
The Trustees also considered information prepared by MFS relating to its costs and profits with respect to the Fund and other investment companies and accounts advised by MFS, as well as MFS’ methodologies used to determine and allocate its costs to the Fund and other accounts and products for purposes of estimating profitability.
After reviewing these and other factors described below, the Trustees concluded that the advisory fees charged to the Fund represent reasonable compensation in light of the nature and quality of the services being provided by MFS.
In addition, the Trustees considered MFS’ resources and related efforts to continue to retain, attract and motivate capable personnel to serve the Fund. The Trustees also considered the financial resources of MFS and its parent, Sun Life Financial Inc. The Trustees further considered any advantages and possible disadvantages of having an adviser which also serves other investment companies as well as institutional accounts.
The Trustees also considered the nature, quality, cost, and extent of administrative, transfer agency, and distribution services provided to the Fund by MFS and its affiliates under agreements and plans other than the investment advisory agreement, including the 12b-1 fees the Fund pays to MFS Fund Distributors, Inc., an affiliate of MFS. The Trustees also considered the nature, extent and quality of certain other services MFS performs or arranges on the Fund’s behalf, which may include securities lending programs, directed expense payment programs, class action recovery programs, and MFS’ interaction with third-party service providers, principally custodians and sub-custodians. The Trustees concluded that the various non-advisory services provided by MFS and its affiliates on behalf of the Fund were satisfactory. The Trustees also considered the benefits to MFS from the use of the Fund’s portfolio brokerage commissions to pay for research and other similar services and various other factors. Additionally, the Trustees considered so-called “fall-out benefits” to MFS such as reputational value derived from serving as investment manager to the Trust, and determined that any such benefits derived by MFS were reasonable and fair.
Based on their evaluation of factors that they deemed to be material, including those factors described above, the Board of Trustees, including a majority of the independent Trustees, concluded that the investment advisory agreement should be continued for an additional one-year period, commencing September 1, 2008.
A discussion regarding the Board’s most recent review and renewal of the fund’s Investment Advisory Agreement with MFS is available by clicking on the fund’s name under “Variable Insurance Portfolios-VIT II” in the “Products & Performance” section on the MFS Web site (mfs.com).
22
PROXY VOTING POLICIES AND INFORMATION
A general description of the MFS funds’ proxy voting policies and procedures is available without charge, upon request, by calling
1-800-225-2606, by visiting the Proxy Voting section of mfs.com or by visiting the SEC’s Web site at http://www.sec.gov.
Information regarding how the fund voted proxies relating to portfolio securities during the most recent twelve-month period ended June 30 is available without charge by visiting the Proxy Voting section of mfs.com or by visiting the SEC’s Web site at http://www.sec.gov.
QUARTERLY PORTFOLIO DISCLOSURE
The fund will file a complete schedule of portfolio holdings with the Securities and Exchange Commission (the Commission) for the first and third quarters of each fiscal year on Form N-Q. The fund’s Form N-Q may be reviewed and copied at the:
Public Reference Room
Securities and Exchange Commission
100 F Street, NE, Room 1580
Washington, D.C. 20549
Information on the operation of the Public Reference Room may be obtained by calling the Commission at 1-800-SEC-0330. The fund’s Form N-Q is available on the EDGAR database on the Commission’s Internet Web site at http://www.sec.gov, and copies of this information may be obtained, upon payment of a duplicating fee, by electronic request at the following e-mail address: publicinfo@sec.gov or by writing the Public Reference Section at the above address.
FEDERAL TAX INFORMATION (unaudited)
The following information is provided pursuant to provisions of the Internal Revenue Code.
The fund designates $19,398,285 as capital gain dividends paid during the fiscal year.
Income derived from foreign sources was $2,414,660. The fund intends to pass through foreign tax credits of $176,343 for the fiscal year.
23
MFS® PRIVACY NOTICE
Privacy is a concern for every investor today. At MFS Investment Management® and the MFS funds, we take this concern very seriously. We want you to understand our policies about the investment products and services that we offer, and how we protect the nonpublic personal information of investors who have a direct relationship with us and our wholly owned subsidiaries.
Throughout our business relationship, you provide us with personal information. We maintain information and records about you, your investments, and the services you use. Examples of the nonpublic personal information we maintain include
| | Ÿ | | data from investment applications and other forms |
| | Ÿ | | share balances and transactional history with us, our affiliates, or others |
| | Ÿ | | facts from a consumer reporting agency |
We do not disclose any nonpublic personal information about our customers or former customers to anyone, except as permitted by law. We may share nonpublic personal information with third parties or certain of our affiliates in connection with servicing your account or processing your transactions. We may share information with companies or financial institutions that perform marketing services on our behalf or with other financial institutions with which we have joint marketing arrangements, subject to any legal requirements.
Authorization to access your nonpublic personal information is limited to appropriate personnel who provide products, services, or information to you. We maintain physical, electronic, and procedural safeguards to help protect the personal information we collect about you.
If you have any questions about the MFS privacy policy, please call 1-800-225-2606 any business day between 8 a.m. and 8 p.m. Eastern time.
Note: If you own MFS products or receive MFS services in the name of a third party such as a bank or broker-dealer, their privacy policy may apply to you instead of ours.
24


MFS® BLENDED RESEARCHSM CORE EQUITY PORTFOLIO
The report is prepared for the general information of contract owners. It is authorized for distribution to prospective investors only when preceded or accompanied by a current prospectus.
NOT FDIC INSURED Ÿ MAY LOSE VALUE Ÿ NO BANK GUARANTEE Ÿ NOT A DEPOSIT Ÿ NOT INSURED BY ANY FEDERAL GOVERNMENT AGENCY OR NCUA/NCUSIF
LETTER FROM THE CEO

Dear Contract Owners:
The market downturns and economic setbacks of late probably rank among the worst financial declines most of us have experienced. Inevitably, people may be questioning their commitment to investing. Still, it is important to remember that downturns are an inescapable part of the business cycle. Such troughs have been seen before, and if we can use history as a guide, market recoveries typically have followed.
Recent events have clearly shown us the value of certain types of investments. In this environment, two of the hallmarks of mutual funds — transparency and liquidity — have become critically important. Unlike some other types of investments, the operations of mutual funds are relatively transparent to their shareholders. With their daily redemption feature, mutual funds also generally provide easy, convenient access to one’s money. Through these recent market upheavals, this level of liquidity enhanced the ability of mutual fund investors to respond and modify their investments as they and their advisors saw fit — a flexibility that those in less liquid investments simply did not have at their disposal.
At MFS® we take particular pride in how well mutual funds can serve investors because we invented the mutual fund in the United States. Established in 1924, Massachusetts Investors Trust was the nation’s first fund. Recent market events only reinforce what we have learned through 85 years — that mutual funds provide unique features that are important to investors in any type of market climate.
Respectfully,

Robert J. Manning
Chief Executive Officer and Chief Investment Officer
MFS Investment Management®
February 17, 2009
The opinions expressed in this letter are subject to change, may not be relied upon for investment advice, and no forecasts can be guaranteed.
Before investing, consider the fund’s investment objectives, risks, charges, and expenses. For a prospectus containing this and other information, contact your investment professional or view online. Read it carefully.
MFS Fund Distributors, Inc., 500 Boylston Street, Boston, MA 02116
1
PORTFOLIO COMPOSITION
Portfolio structure
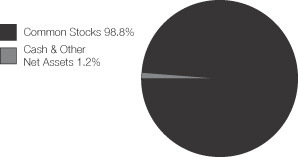
| | |
| Top ten holdings | | |
| Exxon Mobil Corp. | | 5.7% |
| Procter & Gamble Co. | | 2.6% |
| Wal-Mart Stores, Inc. | | 2.2% |
| General Electric Co. | | 2.1% |
| Johnson & Johnson | | 2.0% |
| JPMorgan Chase & Co. | | 2.0% |
| Intel Corp. | | 1.9% |
| International Business Machines Corp. | | 1.8% |
| Travelers Cos., Inc. | | 1.7% |
| AT&T, Inc. | | 1.6% |
| | |
| Equity sectors | | |
| Health Care | | 13.8% |
| Technology | | 13.2% |
| Financial Services | | 12.5% |
| Energy | | 11.8% |
| Consumer Staples | | 9.3% |
| Utilities & Communications | | 8.9% |
| Industrial Goods & Services | | 8.1% |
| Retailing | | 6.1% |
| Leisure | | 5.5% |
| Basic Materials | | 2.9% |
| Special Products & Services | | 2.6% |
| Transportation | | 2.4% |
| Autos & Housing | | 1.7% |
Percentages are based on net assets as of 12/31/08.
The portfolio is actively managed and current holdings may be different.
2
MANAGEMENT REVIEW
Summary of Results
For the twelve months ended December 31, 2008, Initial Class shares of the MFS Blended Research Core Equity Portfolio (the “fund”) provided a total return of –34.95%, while Service Class shares of the fund provided a total return of –35.12%. These returns compare with a return of –37.00% for the fund’s benchmark, the Standard & Poor’s 500 Stock Index (S&P 500 Index).
Market Environment
The U.S. economy and financial markets experienced significant deterioration and extraordinary volatility over the reporting period. U.S. economic growth slowed significantly, despite the short-term bounce from the second quarter fiscal stimulus. Strong domestic headwinds included accelerated deterioration in the housing market, anemic corporate investment, a rapidly declining job market, and a much tighter credit environment. During the period, a seemingly continuous series of tumultuous financial events hammered markets, including: the distressed sale of failing Bear Stearns to JPMorgan, the conservatorship of Government Sponsored Enterprises (GSEs) Fannie Mae and Freddie Mac, the bankruptcy of investment bank Lehman Brothers, the Federal Reserve Bank’s complex intervention of insurance company American International Group (AIG), the nationalization of several large European banks, the failure of Washington Mutual, and the distressed sale of Wachovia. As a result of this barrage of turbulent news, global equity markets pushed significantly lower and credit markets witnessed the worst dislocation since the beginning of the credit crisis. Though conditions improved towards the end of the period, the state of financial and macroeconomic dislocation remained severe.
While reasonably resilient during the first half of the period, the global economy and financial system increasingly experienced considerable negative spillovers from the U.S. slowdown. Not only did Europe and Japan show obvious signs of economic softening, the more powerful engine of global growth – emerging markets – also displayed weakening dynamics.
During the reporting period, the U.S. Federal Reserve Board cut interest rates aggressively and introduced a multitude of new lending facilities to alleviate ever-tightening credit markets, while the U.S. federal government moved quickly to design and implement a meaningful fiscal stimulus package. Although several other global central banks also cut rates, the dilemma of rising energy and food prices heightened concerns among central bankers that inflationary expectations might become unhinged despite weaker growth. Only later in the reporting period did slowing global growth result in a very precipitous decline in commodity prices, which significantly eased inflation and inflationary expectations. As inflationary concerns diminished in the face of global deleveraging, and equity and credit markets deteriorated more sharply, a coordinated rate cut marked the beginning of much more aggressive easing by the major global central banks.
Contributors to Performance
Stock selection and an underweighted position in the financial services sector contributed to the fund’s performance relative to the S&P 500 Index. The fund’s positioning in insurance company American International Group (AIG)(g) and diversified financial services firm Citigroup(g) aided results as we closed out of both positions prior to significant declines in their respective prices. Commercial property and casualty insurance provider Travelers Cos. was another relative contributor in this sector. Not owning weak-performing financial services firm Wachovia also had a positive impact on results.
Favorable security selection in the special products and services sector was another positive area of relative performance. The fund’s holdings of for-profit education company Apollo Group benefited relative returns within this sector. Shares of Apollo Group rose as the company reported strong quarterly results driven, in part, by growing enrollment and retention trends.
Positive stock selection in the retailing sector also aided relative returns, where retail giant Wal-Mart was a strong contributor. Wal-Mart delivered strong returns over the reporting period driven by the company’s significant growth from its proven business model. The stock was also aided by the company’s recent refocus on “price leadership” which led to significant improvement in sales.
Individual securities in other sectors that helped relative performance included Pharmaceutical company Bristol-Myers Squibb, biotechnology firm Amgen and integrated oil and gas company Exxon Mobil. The fund’s positioning in strong-performing casual dining restaurants operator Darden Restaurants also boosted relative results.
Detractors from Performance
Stock selection in the utilities and communications sector detracted from relative performance. Natural gas pipelines operator Williams Cos. was among the fund’s top relative detractors over the reporting period.
3
Management Review – continued
In the leisure sector, stock selection also hindered relative results. Holdings of cruise line operator Royal Caribbean Cruises (aa) dampened relative performance. Shares of Royal Caribbean suffered during the first part of the reporting period due to high fuel costs and more recently due to weak consumer spending.
A combination of security selection and an overweighted position in the industrial goods and services sector detracted from relative returns. Among the fund’s top relative detractors was wiring systems distributor Anixter International (aa)(g).
Although the financial services sector was the top contributing sector to relative performance overall, several individual securities within this sector hurt results. These included insurance and investment company Genworth Financial (g), life insurance provider Prudential Financial, and banking operator Bank of America. The fund’s positioning in financial services firm Morgan Stanley (g) and investment banking firm Lehman Brothers Holdings (g) also held back relative performance as we held both stocks while their respective prices significantly declined.
Elsewhere, health care provider Humana (g) dampened relative returns. Not owning strong-performing brewing giant Anheuser-Busch also had a negative impact on relative results.
Respectfully,
Matthew Krummell
Portfolio Manager
(aa) | | Security is not a benchmark constituent. |
| (g) | | Security was not held in the portfolio at period end. |
The views expressed in this report are those of the portfolio manager only through the end of the period of the report as stated on the cover and do not necessarily reflect the views of MFS or any other person in the MFS organization. These views are subject to change at any time based on market or other conditions, and MFS disclaims any responsibility to update such views. These views may not be relied upon as investment advice or an indication of trading intent on behalf of any MFS portfolio. References to specific securities are not recommendations of such securities, and may not be representative of any MFS portfolio’s current or future investments.
4
PERFORMANCE SUMMARY THROUGH 12/31/08
The following chart illustrates the historical performance of the fund in comparison to its benchmark(s). Benchmark comparisons are unmanaged; do not reflect any fees or expenses; and cannot be invested in directly. The performance of other share classes will be greater than or less than that of the class depicted below. (See Notes to Performance Summary.)
Performance data shown represents past performance and is no guarantee of future results. Investment return and principal value fluctuate so your units, when sold, may be worth more or less than the original cost; current performance may be lower or higher than quoted. The performance shown does not reflect the deduction of taxes, if any, that a contract holder would pay on fund distributions or the redemption of contract units. The returns for the fund shown also do not reflect the deduction of expenses associated with variable products, such as mortality and expense risk charges, separate account charges, and sales charges imposed by the insurance company separate accounts. Such expenses would reduce the overall returns shown.
Growth of a hypothetical $10,000 investment
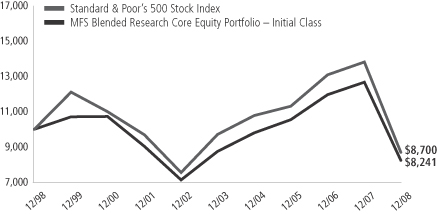
Total rates of return through 12/31/08
Average Annual Total Returns
| | | | | | | | | | | | |
| | | Share class | | Class inception date | | 1-yr | | 5-yr | | 10-yr | | |
| | | Initial Class | | 11/14/86 | | (34.95)% | | (1.19)% | | (1.92)% | | |
| | | Service Class | | 8/24/01 | | (35.12)% | | (1.43)% | | (2.10)% | | |
Comparative Benchmark
| | | | | | | | | | | | |
| | | Standard & Poor’s 500 Stock Index (f) | | (37.00)% | | (2.19)% | | (1.38)% | | |
| (f) | Source: FactSet Research Systems Inc. |
Benchmark Definition
Standard & Poor’s 500 Stock Index – a market capitalization-weighted index of 500 widely held equity securities, designed to measure broad U.S. equity performance.
It is not possible to invest directly in an index.
Notes to Performance Summary
Performance for the Service Class includes the performance of the fund’s Initial Class for periods prior to their offering. Because Service Class expenses are higher than those of Initial Class, performance shown for Service Class is higher than it would have been had it been offered for the entire period. Performance has not been adjusted to take into account differences in class specific operating expenses (such as Rule 12b-1 fees). Please see the prospectus for additional information about performance and expenses.
Performance results reflect any applicable expense subsidies and waivers in effect during the periods shown. Without such subsidies and waivers the fund’s performance results would be less favorable. Please see the prospectus for complete details. All results are historical and assume the reinvestment of any dividends and capital gains distributions.
Prior to June 22, 2007, the fund’s investments were primarily selected based on fundamental analysis. Beginning June 22, 2007, the fund’s investments are selected based on fundamental and quantitative analysis.
From time to time the fund may receive proceeds from litigation settlements, without which performance would be lower.
5
EXPENSE TABLE
Fund Expenses Borne by the Contract Holders During the Period,
July 1, 2008 through December 31, 2008
As a contract holder of the fund, you incur ongoing costs, including management fees; distribution (12b-1) fees; and other fund expenses. This example is intended to help you understand your ongoing costs (in dollars) of investing in the fund and to compare these costs with the ongoing costs of investing in other mutual funds.
The example is based on an investment of $1,000 invested at the beginning of the period and held for the entire period July 1, 2008 through December 31, 2008.
Actual Expenses
The first line for each share class in the following table provides information about actual account values and actual expenses. You may use the information in this line, together with the amount you invested, to estimate the expenses that you paid over the period. Simply divide your account value by $1,000 (for example, an $8,600 account value divided by $1,000 = 8.6), then multiply the result by the number in the first line under the heading entitled “Expenses Paid During Period” to estimate the expenses you paid on your account during this period.
Hypothetical Example for Comparison Purposes
The second line for each share class in the following table provides information about hypothetical account values and hypothetical expenses based on the fund’s actual expense ratio and an assumed rate of return of 5% per year before expenses, which is not the fund’s actual return. The hypothetical account values and expenses may not be used to estimate the actual ending account balance or expenses you paid for the period. You may use this information to compare the ongoing costs of investing in the fund and other funds. To do so, compare this 5% hypothetical example with the 5% hypothetical examples that appear in the shareholder reports of the other funds.
Please note that the expenses shown in the table are meant to highlight the fund’s ongoing costs only and do not take into account the fees and expenses imposed under the variable contracts through which your investment in the fund is made. Therefore, the second line for each share class in the table is useful in comparing ongoing costs associated with an investment in vehicles (such as the fund) which fund benefits under variable annuity and variable life insurance contracts and to qualified pension and retirement plans only, and will not help you determine the relative total costs of investing in the fund through variable annuity and variable life insurance contracts. If the fees and expenses imposed under the variable contracts were included, your costs would have been higher.
| | | | | | | | | | |
| Share Class | | | | Annualized
Expense Ratio | | Beginning
Account Value
7/01/08 | | Ending
Account Value
12/31/08 | | Expenses Paid
During Period (p)
7/01/08-12/31/08 |
| Initial Class | | Actual | | 0.60% | | $1,000.00 | | $719.70 | | $2.59 |
| | Hypothetical (h) | | 0.60% | | $1,000.00 | | $1,022.12 | | $3.05 |
| Service Class | | Actual | | 0.85% | | $1,000.00 | | $718.78 | | $3.67 |
| | Hypothetical (h) | | 0.85% | | $1,000.00 | | $1,020.86 | | $4.32 |
| (h) | 5% class return per year before expenses. |
| (p) | Expenses paid is equal to each class’ annualized expense ratio, as shown above, multiplied by the average account value over the period, multiplied by the number of days in the period, divided by the number of days in the year. |
6
PORTFOLIO OF INVESTMENTS – 12/31/08
The Portfolio of Investments is a complete list of all securities owned by your fund. It is categorized by broad-based asset classes.
| | | | | |
| Issuer | | Shares/Par | | Value ($) |
| | | | | |
| COMMON STOCKS – 98.8% | | | | | |
| Aerospace – 2.6% | | | | | |
| Boeing Co. | | 41,820 | | $ | 1,784,450 |
| Lockheed Martin Corp. | | 72,700 | | | 6,112,616 |
| Northrop Grumman Corp. | | 134,980 | | | 6,079,499 |
| | | | | |
| | | | $ | 13,976,565 |
| | | | | |
| Airlines – 0.3% | | | | | |
| AMR Corp. (a) | | 171,300 | | $ | 1,827,771 |
| | | | | |
| Apparel Manufacturers – 0.5% | | | | | |
| NIKE, Inc., “B” | | 47,620 | | $ | 2,428,620 |
| | | | | |
| Automotive – 0.8% | | | | | |
| Johnson Controls, Inc. | | 220,410 | | $ | 4,002,646 |
| | | | | |
| Biotechnology – 1.9% | | | | | |
| Amgen, Inc. (a) | | 112,040 | | $ | 6,470,310 |
| Genzyme Corp. (a) | | 11,880 | | | 788,476 |
| Gilead Sciences, Inc. (a) | | 53,020 | | | 2,711,443 |
| | | | | |
| | | | $ | 9,970,229 |
| | | | | |
| Broadcasting – 0.8% | | | | | |
| Time Warner, Inc. | | 280,840 | | $ | 2,825,250 |
| Walt Disney Co. | | 69,360 | | | 1,573,778 |
| | | | | |
| | | | $ | 4,399,028 |
| | | | | |
| Brokerage & Asset Managers – 0.4% | | | | | |
| CME Group, Inc. | | 10,350 | | $ | 2,153,939 |
| | | | | |
| Business Services – 1.7% | | | | | |
| Accenture Ltd., “A” | | 100,860 | | $ | 3,307,199 |
| Visa, Inc., “A” | | 59,590 | | | 3,125,496 |
| Western Union Co. | | 198,490 | | | 2,846,347 |
| | | | | |
| | | | $ | 9,279,042 |
| | | | | |
| Cable TV – 1.7% | | | | | |
| Comcast Corp., “A” | | 257,210 | | $ | 4,341,705 |
| Time Warner Cable, Inc., “A” (a) | | 230,970 | | | 4,954,307 |
| | | | | |
| | | | $ | 9,296,012 |
| | | | | |
| Chemicals – 1.5% | | | | | |
| 3M Co. | | 88,390 | | $ | 5,085,961 |
| Terra Nitrogen Co. LP (l) | | 31,900 | | | 3,022,844 |
| | | | | |
| | | | $ | 8,108,805 |
| | | | | |
| Computer Software – 3.3% | | | | | |
| Microsoft Corp. | | 343,360 | | $ | 6,674,918 |
| Oracle Corp. (a) | | 424,140 | | | 7,520,002 |
| Symantec Corp. (a) | | 129,340 | | | 1,748,677 |
| VeriSign, Inc. (a) | | 79,540 | | | 1,517,623 |
| | | | | |
| | | | $ | 17,461,220 |
| | | | | |
| Computer Software – Systems – 4.3% | | | | | |
| Apple, Inc. (a) | | 72,290 | | $ | 6,169,952 |
| Hewlett-Packard Co. | | 201,990 | | | 7,330,217 |
| International Business Machines Corp. | | 113,440 | | | 9,547,110 |
| | | | | |
| | | | $ | 23,047,279 |
| | | | | |
| | | | | |
| Issuer | | Shares/Par | | Value ($) |
| | | | | |
| COMMON STOCKS – continued |
| Construction – 0.9% | | | | | |
| NVR, Inc. (a) | | 6,980 | | $ | 3,184,625 |
| Sherwin-Williams Co. | | 25,550 | | | 1,526,613 |
| | | | | |
| | | | $ | 4,711,238 |
| | | | | |
| Consumer Goods & Services – 4.4% | | | | | |
| Apollo Group, Inc., “A” (a) | | 65,540 | | $ | 5,021,675 |
| Colgate-Palmolive Co. | | 29,600 | | | 2,028,784 |
| Fortune Brands, Inc. | | 71,430 | | | 2,948,630 |
| Procter & Gamble Co. | | 221,640 | | | 13,701,785 |
| | | | | |
| | | | $ | 23,700,874 |
| | | | | |
| Electrical Equipment – 2.5% | | | | | |
| General Electric Co. | | 709,260 | | $ | 11,490,012 |
| WESCO International, Inc. (a) | | 91,020 | | | 1,750,315 |
| | | | | |
| | | | $ | 13,240,327 |
| | | | | |
| Electronics – 2.6% | | | | | |
| Applied Materials, Inc. | | 169,040 | | $ | 1,712,375 |
| Intel Corp. | | 693,310 | | | 10,163,925 |
| National Semiconductor Corp. | | 207,140 | | | 2,085,900 |
| | | | | |
| | | | $ | 13,962,200 |
| | | | | |
| Energy – Independent – 0.8% | | | | | |
| Apache Corp. | | 60,760 | | $ | 4,528,443 |
| | | | | |
| Energy – Integrated – 8.9% | | | | | |
| Chevron Corp. | | 115,610 | | $ | 8,551,672 |
| ConocoPhillips | | 33,480 | | | 1,734,264 |
| Exxon Mobil Corp. | | 380,330 | | | 30,361,744 |
| Hess Corp. | | 65,220 | | | 3,498,401 |
| Marathon Oil Corp. | | 120,600 | | | 3,299,616 |
| | | | | |
| | | | $ | 47,445,697 |
| | | | | |
| Food & Beverages – 3.9% | | | | | |
| Archer Daniels Midland Co. | | 114,230 | | $ | 3,293,251 |
| Coca-Cola Co. | | 95,360 | | | 4,316,947 |
| Pepsi Bottling Group, Inc. | | 228,890 | | | 5,152,314 |
| PepsiCo, Inc. | | 147,040 | | | 8,053,381 |
| | | | | |
| | | | $ | 20,815,893 |
| | | | | |
| Food & Drug Stores – 1.8% | | | | | |
| CVS Caremark Corp. | | 183,590 | | $ | 5,276,377 |
| Kroger Co. | | 162,280 | | | 4,285,815 |
| | | | | |
| | | | $ | 9,562,192 |
| | | | | |
| Gaming & Lodging – 0.7% | | | | | |
| Royal Caribbean Cruises Ltd. | | 289,400 | | $ | 3,979,250 |
| | | | | |
| General Merchandise – 2.9% | | | | | |
| Dollar Tree, Inc. (a) | | 39,860 | | $ | 1,666,148 |
| Family Dollar Stores, Inc. | | 87,370 | | | 2,277,736 |
| Wal-Mart Stores, Inc. | | 207,690 | | | 11,643,101 |
| | | | | |
| | | | $ | 15,586,985 |
| | | | | |
7
Portfolio of Investments – continued
| | | | | |
| Issuer | | Shares/Par | | Value ($) |
| | | | | |
| COMMON STOCKS – continued |
| Health Maintenance Organizations – 1.3% | | | |
| UnitedHealth Group, Inc. | | 89,630 | | $ | 2,384,158 |
| WellPoint, Inc. (a) | | 110,630 | | | 4,660,842 |
| | | | | |
| | | | $ | 7,045,000 |
| | | | | |
| Insurance – 3.1% | | | | | |
| Aflac, Inc. | | 41,950 | | $ | 1,922,988 |
| MetLife, Inc. | | 69,740 | | | 2,431,136 |
| Prudential Financial, Inc. | | 111,120 | | | 3,362,491 |
| Travelers Cos., Inc. | | 197,440 | | | 8,924,288 |
| | | | | |
| | | | $ | 16,640,903 |
| | | | | |
| Internet – 1.1% | | | | | |
| Google, Inc., “A” (a) | | 18,360 | | $ | 5,648,454 |
| | | | | |
| Leisure & Toys – 1.0% | | | | | |
| Activision Blizzard, Inc. (a) | | 166,120 | | $ | 1,435,277 |
| Electronic Arts, Inc. (a) | | 125,750 | | | 2,017,030 |
| Hasbro, Inc. | | 69,060 | | | 2,014,480 |
| | | | | |
| | | | $ | 5,466,787 |
| | | | | |
| Machinery & Tools – 3.0% | | | | | |
| Cummins, Inc. | | 50,410 | | $ | 1,347,459 |
| Dover Corp. | | 142,690 | | | 4,697,355 |
| Eaton Corp. | | 121,060 | | | 6,017,893 |
| Timken Co. | | 207,570 | | | 4,074,599 |
| | | | | |
| | | | $ | 16,137,306 |
| | | | | |
| Major Banks – 8.0% | | | | | |
| Bank of America Corp. | | 524,540 | | $ | 7,385,523 |
| Bank of New York Mellon Corp. | | 239,438 | | | 6,783,279 |
| Goldman Sachs Group, Inc. | | 53,840 | | | 4,543,558 |
| JPMorgan Chase & Co. | | 334,030 | | | 10,531,966 |
| PNC Financial Services Group, Inc. | | 36,220 | | | 1,774,780 |
| State Street Corp. | | 87,750 | | | 3,451,208 |
| Wells Fargo & Co. | | 283,510 | | | 8,357,875 |
| | | | | |
| | | | $ | 42,828,189 |
| | | | | |
| Medical & Health Technology & Services – 0.5% | | | |
| Omnicare, Inc. | | 91,760 | | $ | 2,547,258 |
| | | | | |
| Medical Equipment – 2.0% | | | | | |
| Boston Scientific Corp. (a) | | 268,650 | | $ | 2,079,351 |
| Medtronic, Inc. | | 98,570 | | | 3,097,069 |
| Thermo Fisher Scientific, Inc. (a) | | 79,530 | | | 2,709,587 |
| Zimmer Holdings, Inc. (a) | | 74,190 | | | 2,998,760 |
| | | | | |
| | | | $ | 10,884,767 |
| | | | | |
| Natural Gas – Distribution – 0.7% | | | | | |
| Questar Corp. | | 116,910 | | $ | 3,821,788 |
| | | | | |
| Natural Gas – Pipeline – 0.9% | | | | | |
| Williams Cos., Inc. | | 325,900 | | $ | 4,719,032 |
| | | | | |
| Network & Telecom – 1.3% | | | | | |
| Cisco Systems, Inc. (a) | | 414,010 | | $ | 6,748,363 |
| | | | | |
| Oil Services – 2.1% | | | | | |
| Halliburton Co. | | 113,720 | | $ | 2,067,430 |
| Nabors Industries Ltd. (a) | | 118,520 | | | 1,418,684 |
| National Oilwell Varco, Inc. (a) | | 59,840 | | | 1,462,490 |
| | | | | |
| Issuer | | Shares/Par | | Value ($) |
| | | | | |
| COMMON STOCKS – continued |
| Oil Services – continued | | | | | |
| Noble Corp. | | 59,500 | | $ | 1,314,355 |
| Schlumberger Ltd. | | 86,320 | | | 3,653,926 |
| Transocean, Inc. (a) | | 31,090 | | | 1,469,003 |
| | | | | |
| | | | $ | 11,385,888 |
| | | | | |
| Other Banks & Diversified Financials – 0.3% | | | |
| Discover Financial Services | | 169,790 | | $ | 1,618,099 |
| | | | | |
| Personal Computers & Peripherals – 0.6% | | | |
| NetApp, Inc. (a) | | 221,650 | | $ | 3,096,451 |
| | | | | |
| Pharmaceuticals – 8.1% | | | | | |
| Abbott Laboratories | | 43,450 | | $ | 2,318,927 |
| Bristol-Myers Squibb Co. | | 281,240 | | | 6,538,830 |
| Eli Lilly & Co. | | 59,480 | | | 2,395,260 |
| Johnson & Johnson | | 177,010 | | | 10,590,508 |
| Merck & Co., Inc. | | 213,290 | | | 6,484,016 |
| Pfizer, Inc. | | 390,350 | | | 6,913,099 |
| Schering-Plough Corp. | | 198,190 | | | 3,375,176 |
| Wyeth | | 130,470 | | | 4,893,930 |
| | | | | |
| | | | $ | 43,509,746 |
| | | | | |
| Railroad & Shipping – 1.0% | | | | | |
| Union Pacific Corp. | | 106,510 | | $ | 5,091,178 |
| | | | | |
| Real Estate – 0.7% | | | | | |
| Equity Residential, REIT | | 118,220 | | $ | 3,525,320 |
| | | | | |
| Restaurants – 1.3% | | | | | |
| Darden Restaurants, Inc. | | 152,600 | | $ | 4,300,268 |
| YUM! Brands, Inc. | | 87,400 | | | 2,753,100 |
| | | | | |
| | | | $ | 7,053,368 |
| | | | | |
| Specialty Chemicals – 1.4% | | | | | |
| Air Products & Chemicals, Inc. | | 28,330 | | $ | 1,424,149 |
| Praxair, Inc. | | 105,590 | | | 6,267,822 |
| | | | | |
| | | | $ | 7,691,971 |
| | | | | |
| Specialty Stores – 0.9% | | | | | |
| Lowe’s Cos., Inc. | | 152,830 | | $ | 3,288,902 |
| Staples, Inc. | | 96,560 | | | 1,730,355 |
| | | | | |
| | | | $ | 5,019,257 |
| | | | | |
| Telephone Services – 3.4% | | | | | |
| AT&T, Inc. | | 308,980 | | $ | 8,805,930 |
| Qwest Communications International, Inc. | | 548,050 | | | 1,994,902 |
| Verizon Communications, Inc. | | 222,810 | | | 7,553,259 |
| | | | | |
| | | | $ | 18,354,091 |
| | | | | |
| Tobacco – 1.9% | | | | | |
| Altria Group, Inc. | | 221,120 | | $ | 3,330,067 |
| Philip Morris International, Inc. | | 157,380 | | | 6,847,604 |
| | | | | |
| | | | $ | 10,177,671 |
| | | | | |
| Trucking – 1.1% | | | | | |
| J.B. Hunt Transport Services, Inc. | | 84,070 | | $ | 2,208,519 |
| United Parcel Service, Inc., “B” | | 66,840 | | | 3,686,894 |
| | | | | |
| | | | $ | 5,895,413 |
| | | | | |
8
Portfolio of Investments – continued
| | | | | | |
| Issuer | | Shares/Par | | Value ($) |
| | | | | | |
| COMMON STOCKS – continued |
| Utilities – Electric Power – 3.9% | | | |
| Allegheny Energy, Inc. | | | 71,720 | | $ | 2,428,439 |
| American Electric Power Co., Inc. | | | 154,810 | | | 5,152,077 |
| Edison International | | | 171,790 | | | 5,517,895 |
| FirstEnergy Corp. | | | 39,570 | | | 1,922,311 |
| FPL Group, Inc. | | | 66,690 | | | 3,356,508 |
| PG&E Corp. | | | 46,420 | | | 1,796,918 |
| PPL Corp. | | | 24,100 | | | 739,629 |
| | | | | | |
| | | | | $ | 20,913,777 |
| | | | | | |
Total Common Stocks
(Identified Cost, $707,191,886) | | | | | $ | 529,304,332 |
| | | | | | |
| |
| REPURCHASE AGREEMENTS – 1.2% | | | |
| Goldman Sachs, 0.01%, dated 12/31/08, due 1/02/09, total to be received $5,194,003 (secured by U.S. Treasury and Federal Agency obligations and Mortgage Backed securities in a jointly traded account) | | $ | 5,194,000 | | $ | 5,194,000 |
| Morgan Stanley, 0.02%, dated 12/31/08, due 1/02/09, total to be received $1,324,001 (secured by various U.S. Treasury and Federal Agency obligations and Mortgage Backed securities in a jointly traded account) | | | 1,324,000 | | | 1,324,000 |
| | | | | | |
Total Repurchase Agreements,
at Cost | | | | | $ | 6,518,000 |
| | | | | | |
| | | | | | |
| Issuer | | Shares/Par | | Value ($) | |
| | | | | | |
| COLLATERAL FOR SECURITIES LOANED – 0.3% | |
| Navigator Securities Lending Prime Portfolio, at Cost and Net Asset Value | | 1,778,173 | | $ | 1,778,173 | |
| | | | | | |
Total Investments
(Identified Cost, $715,488,059) | | | | $ | 537,600,505 | |
| | | | | | |
OTHER ASSETS, LESS
LIABILITIES – (0.3)% | | | | | (1,701,602 | ) |
| | | | | | |
| Net Assets – 100.0% | | | | $ | 535,898,903 | |
| | | | | | |
| (a) | Non-income producing security. |
| (l) | All or a portion of this security is on loan. |
The following abbreviations are used in this report and are defined:
| REIT | | Real Estate Investment Trust |
See Notes to Financial Statements
9
FINANCIAL STATEMENTS | STATEMENT OF ASSETS AND LIABILITIES
This statement represents your fund’s balance sheet, which details the assets and liabilities comprising the total value of the fund.
| | | | | |
At 12/31/08 | | | | | |
Assets | | | | | |
Investments, at value, including $1,750,317 of securities on loan (identified cost, $715,488,059) | | $537,600,505 | | | |
Cash | | 605 | | | |
Receivable for fund shares sold | | 17,711 | | | |
Interest and dividends receivable | | 1,118,089 | | | |
Receivable from investment adviser | | 72,498 | | | |
Other assets | | 26,224 | | | |
Total assets | | | | | $538,835,632 |
Liabilities | | | | | |
Payable for fund shares reacquired | | $938,098 | | | |
Collateral for securities loaned, at value | | 1,778,173 | | | |
Payable to affiliates | | | | | |
Management fee | | 15,713 | | | |
Distribution fees | | 2,581 | | | |
Administrative services fee | | 1,641 | | | |
Payable for trustees’ compensation | | 871 | | | |
Accrued expenses and other liabilities | | 199,652 | | | |
Total liabilities | | | | | $2,936,729 |
Net assets | | | | | $535,898,903 |
Net assets consist of | | | | | |
Paid-in capital | | $813,183,144 | | | |
Unrealized appreciation (depreciation) on investments and translation of assets and liabilities in foreign currencies | | (177,887,546 | ) | | |
Accumulated net realized gain (loss) on investments and foreign currency transactions | | (111,107,412 | ) | | |
Undistributed net investment income | | 11,710,717 | | | |
Net assets | | | | | $535,898,903 |
Shares of beneficial interest outstanding | | | | | 23,573,660 |
Initial Class shares | | | | | |
Net assets | | $342,241,091 | | | |
Shares outstanding | | 15,012,463 | | | |
Net asset value per share | | | | | $22.80 |
Service Class shares | | | | | |
Net assets | | $193,657,812 | | | |
Shares outstanding | | 8,561,197 | | | |
Net asset value per share | | | | | $22.62 |
See Notes to Financial Statements
10
FINANCIAL STATEMENTS | STATEMENT OF OPERATIONS
This statement describes how much your fund earned in investment income and accrued in expenses. It also describes any gains and/or losses generated by fund operations.
| | | | | | |
| Year ended 12/31/08 | | | | | | |
| Net investment income | | | | | | |
Income | | | | | | |
Dividends | | $16,471,700 | | | | |
Interest | | 608,884 | | | | |
Total investment income | | | | | $17,080,584 | |
Expenses | | | | | | |
Management fee | | $4,273,980 | | | | |
Distribution fees | | 671,496 | | | | |
Administrative services fee | | 239,715 | | | | |
Trustees’ compensation | | 106,126 | | | | |
Custodian fee | | 143,417 | | | | |
Shareholder communications | | 129,132 | | | | |
Auditing fees | | 46,388 | | | | |
Legal fees | | 7,127 | | | | |
Miscellaneous | | 57,169 | | | | |
Total expenses | | | | | $5,674,550 | |
Fees paid indirectly | | (1,509 | ) | | | |
Reduction of expenses by investment adviser | | (340,602 | ) | | | |
Net expenses | | | | | $5,332,439 | |
Net investment income | | | | | $11,748,145 | |
Realized and unrealized gain (loss) on investments and foreign currency transactions | | | | | | |
Realized gain (loss) (identified cost basis) | | | | | | |
Investment transactions | | $(106,211,119 | ) | | | |
Foreign currency transactions | | 564 | | | | |
Net realized gain (loss) on investments and foreign currency transactions | | | | | $(106,210,555 | ) |
Change in unrealized appreciation (depreciation) | | | | | | |
Investments | | $(215,866,453 | ) | | | |
Translation of assets and liabilities in foreign currencies | | (533 | ) | | | |
Net unrealized gain (loss) on investments and foreign currency translation | | | | | $(215,866,986 | ) |
Net realized and unrealized gain (loss) on investments and foreign currency | | | | | $(322,077,541 | ) |
Change in net assets from operations | | | | | $(310,329,396 | ) |
See Notes to Financial Statements
11
FINANCIAL STATEMENTS | STATEMENTS OF CHANGES IN NET ASSETS
These statements describe the increases and/or decreases in net assets resulting from operations, any distributions, and any shareholder transactions.
| | | | | | |
For years ended 12/31 | | 2008 | | | 2007 | |
Change in net assets | | | | | | |
From operations | | | | | | |
Net investment income | | $11,748,145 | | | $11,134,237 | |
Net realized gain (loss) on investments and foreign currency transactions | | (106,210,555 | ) | | 191,459,526 | |
Net unrealized gain (loss) on investments and foreign currency translation | | (215,866,986 | ) | | (135,346,125 | ) |
Change in net assets from operations | | $(310,329,396 | ) | | $67,247,638 | |
Distributions declared to shareholders | | | | | | |
From net investment income | | | | | | |
Initial Class | | $(7,779,968 | ) | | $(9,003,386 | ) |
Service Class | | (3,316,106 | ) | | (3,474,027 | ) |
Total distributions declared to shareholders | | $(11,096,074 | ) | | $(12,477,413 | ) |
Change in net assets from fund share transactions | | $(154,331,243 | ) | | $(189,920,509 | ) |
Total change in net assets | | $(475,756,713 | ) | | $(135,150,284 | ) |
| Net assets | | | | | | |
At beginning of period | | 1,011,655,616 | | | 1,146,805,900 | |
At end of period (including undistributed net investment income of $11,710,717 and
$11,091,123, respectively) | | $535,898,903 | | | $1,011,655,616 | |
See Notes to Financial Statements
12
FINANCIAL STATEMENTS | FINANCIAL HIGHLIGHTS
The financial highlights table is intended to help you understand the fund’s financial performance for the past 5 years. Certain information reflects financial results for a single fund share. The total returns in the table represent the rate by which an investor would have earned (or lost) on an investment in the fund share class (assuming reinvestment of all distributions) held for the entire period.
| | | | | | | | | | | | | | | |
| Initial Class | | Years ended 12/31 | |
| | | 2008 | | | 2007 | | | 2006 | | | 2005 | | | 2004 | |
Net asset value, beginning of period | | $35.51 | | | $33.89 | | | $30.15 | | | $28.27 | | | $25.51 | |
| Income (loss) from investment operations | | | | | | | | | | | | | | | |
Net investment income (d) | | $0.48 | | | $0.38 | | | $0.37 | | | $0.23 | | | $0.25 | |
Net realized and unrealized gain (loss) on investments
and foreign currency | | (12.74 | ) | | 1.64 | | | 3.62 | | | 1.92 | | | 2.77 | |
Total from investment operations | | $(12.26 | ) | | $2.02 | | | $3.99 | | | $2.15 | | | $3.02 | |
| Less distributions declared to shareholders | | | | | | | | | | | | | | | |
From net investment income | | $(0.45 | ) | | $(0.40 | ) | | $(0.25 | ) | | $(0.27 | ) | | $(0.26 | ) |
Net asset value, end of period | | $22.80 | | | $35.51 | | | $33.89 | | | $30.15 | | | $28.27 | |
Total return (%) (k)(r)(s) | | (34.95 | ) | | 5.95 | | | 13.30 | | | 7.70 | | | 11.99 | (b) |
Ratios (%) (to average net assets)
and Supplemental data: | | | | | | | | | | | | | | | |
Expenses before expense reductions (f) | | 0.64 | | | 0.62 | | | 0.61 | | | 0.63 | | | 0.61 | |
Expenses after expense reductions (f) | | 0.60 | | | 0.61 | | | N/A | | | N/A | | | N/A | |
Net investment income | | 1.60 | | | 1.07 | | | 1.18 | | | 0.79 | | | 0.95 | |
Portfolio turnover | | 76 | | | 102 | | | 35 | | | 49 | | | 78 | |
Net assets at end of period (000 Omitted) | | $342,241 | | | $673,008 | | | $826,937 | | | $929,794 | | | $1,073,587 | |
| | | | | | | | | | | | | | | |
| Service Class | | Years ended 12/31 | |
| | | 2008 | | | 2007 | | | 2006 | | | 2005 | | | 2004 | |
Net asset value, beginning of period | | $35.23 | | | $33.65 | | | $29.96 | | | $28.13 | | | $25.39 | |
| Income (loss) from investment operations | | | | | | | | | | | | | | | |
Net investment income (d) | | $0.41 | | | $0.29 | | | $0.28 | | | $0.16 | | | $0.18 | |
Net realized and unrealized gain (loss) on investments
and foreign currency | | (12.66 | ) | | 1.63 | | | 3.61 | | | 1.90 | | | 2.77 | |
Total from investment operations | | $(12.25 | ) | | $1.92 | | | $3.89 | | | $2.06 | | | $2.95 | |
| Less distributions declared to shareholders | | | | | | | | | | | | | | | |
From net investment income | | $(0.36 | ) | | $(0.34 | ) | | $(0.20 | ) | | $(0.23 | ) | | $(0.21 | ) |
Net asset value, end of period | | $22.62 | | | $35.23 | | | $33.65 | | | $29.96 | | | $28.13 | |
Total return (%) (k)(r)(s) | | (35.12 | ) | | 5.69 | | | 13.04 | | | 7.42 | | | 11.74 | (b) |
Ratios (%) (to average net assets)
and Supplemental data: | | | | | | | | | | | | | | | |
Expenses before expense reductions (f) | | 0.90 | | | 0.87 | | | 0.86 | | | 0.88 | | | 0.86 | |
Expenses after expense reductions (f) | | 0.85 | | | 0.86 | | | N/A | | | N/A | | | N/A | |
Net investment income | | 1.35 | | | 0.84 | | | 0.88 | | | 0.54 | | | 0.70 | |
Portfolio turnover | | 76 | | | 102 | | | 35 | | | 49 | | | 78 | |
Net assets at end of period (000 Omitted) | | $193,658 | | | $338,647 | | | $319,869 | | | $198,705 | | | $82,053 | |
| (b) | The fund’s net asset value and total return calculation include a non-recurring accrual recorded as a result of an administrative proceeding regarding disclosure of brokerage allocation practices in connection with fund sales. The non-recurring accrual resulted in an increase in the net asset value of $0.01 per share based on shares outstanding on the day the accrual was recorded. |
| (d) | Per share data are based on average shares outstanding. |
| (f) | Ratios do not reflect reductions from fees paid indirectly, if applicable. |
| (k) | The total return does not reflect expenses that apply to separate accounts. Inclusion of these charges would reduce the total return figures for all periods shown. |
| (r) | Certain expenses have been reduced without which performance would have been lower. |
| (s) | From time to time the fund may receive proceeds from litigation settlements, without which performance would be lower. |
See Notes to Financial Statements
13
NOTES TO FINANCIAL STATEMENTS
| (1) | | Business and Organization |
MFS Blended Research Core Equity Portfolio (the fund) is a series of MFS Variable Insurance Trust II (the trust). The trust is organized as a Massachusetts business trust and is registered under the Investment Company Act of 1940, as amended, as an open-end management investment company. The shares of the fund are sold to variable accounts established by insurance companies to fund benefits under variable contracts issued by such companies, and qualified retirement and pension plans.
| (2) | | Significant Accounting Policies |
General – The preparation of financial statements in conformity with U.S. generally accepted accounting principles requires management to make estimates and assumptions that affect the reported amounts of assets and liabilities, and disclosure of contingent assets and liabilities at the date of the financial statements and the reported amounts of revenues and expenses during the reporting period. Actual results could differ from those estimates. The fund can invest in foreign securities. Investments in foreign securities are vulnerable to the effects of changes in the relative values of the local currency and the U.S. dollar and to the effects of changes in each country’s legal, political, and economic environment.
In March 2008, FASB Statement No. 161, Disclosures about Derivative Instruments and Hedging Activities (the “Standard”) was issued, and is effective for financial statements issued for fiscal years and interim periods beginning after November 15, 2008. This Standard provides enhanced disclosures about the fund’s use of and accounting for derivative instruments and the effect of derivative instruments on the fund’s results of operations and financial position. Management is evaluating the application of the Standard to the fund, and has not at this time determined the impact, if any, resulting from the adoption of this Standard on the fund’s financial statements.
FASB Staff Position (FSP) 133-1 was implemented during the period. FSP 133-1 amends FAS 133 to require sellers of credit derivatives to make disclosures that will enable financial statement users to assess the potential effects of those credit derivatives on an entity’s financial position, financial performance and cash flows. There was no impact from implementing FSP 133-1 as the fund did not hold any of these credit derivatives at period end.
Investment Valuations – Equity securities, including restricted equity securities, are generally valued at the last sale or official closing price as reported by a third party pricing service on the market or exchange on which they are primarily traded. For securities for which there were no sales reported that day, equity securities are generally valued at the last quoted daily bid quotation as reported by a third party pricing service on the market or exchange on which they are primarily traded. For securities held short for which there were no sales reported for the day, the position is generally valued at the last quoted daily ask quotation as reported by a third party pricing service on the market or exchange on which such securities are primarily traded. Short-term instruments with a maturity at issuance of 60 days or less may be valued at amortized cost, which approximates market value. Open-end investment companies are generally valued at net asset value per share. Securities and other assets generally valued on the basis of information from a third party pricing service may also be valued at a broker-dealer bid quotation. Values obtained from pricing services can utilize both dealer-supplied valuations and electronic data processing techniques, which take into account factors such as institutional-size trading in similar groups of securities, yield, quality, coupon rate, maturity, type of issue, trading characteristics, and other market data. The values of foreign securities and other assets and liabilities expressed in foreign currencies are converted to U.S. dollars using the mean of bid and asked prices for rates reported by a third party pricing service.
The Board of Trustees has delegated primary responsibility for determining or causing to be determined the value of the fund’s investments (including any fair valuation) to the adviser pursuant to valuation policies and procedures approved by the Board. If the adviser determines that reliable market quotations are not readily available, investments are valued at fair value as determined in good faith by the adviser in accordance with such procedures under the oversight of the Board of Trustees. Under the fund’s valuation policies and procedures, market quotations are not considered to be readily available for most types of debt instruments and floating rate loans and many types of derivatives. These investments are generally valued at fair value based on information from third party pricing services. In addition, investments may be valued at fair value if the adviser determines that an investment’s value has been materially affected by events occurring after the close of the exchange or market on which the investment is principally traded (such as foreign exchange or market) and prior to the determination of the fund’s net asset value, or after the halting of trading of a specific security where trading does not resume prior to the close of the exchange or market on which the security is principally traded. Events that occur on a frequent basis after foreign markets close (such as developments in foreign markets and significant movements in the U.S. markets) and prior to the determination of the fund’s net asset value may be deemed to have a material affect on the value of securities traded in foreign markets. Accordingly, the fund’s foreign equity securities may often be valued at fair value. The adviser may rely on third party pricing services or other information (such as the correlation with price movements of similar securities in the same or other markets; the type, cost and investment characteristics of the security; the business and financial condition of the issuer; and trading and other market data) to assist in determining whether to fair value and at what value to fair value an investment. The value of an investment for purposes of calculating the fund’s net asset value can differ depending on the source and method
14
Notes to Financial Statements – continued
used to determine value. When fair valuation is used, the value of investments used to determine the fund’s net asset value may differ from quoted or published prices for the same investments.
The fund adopted FASB Statement No. 157, Fair Value Measurements (the “Statement”). This Statement provides a single definition of fair value, a hierarchy for measuring fair value and expanded disclosures about fair value measurements.
Various inputs are used in determining the value of the fund’s assets or liabilities carried at market value. These inputs are categorized into three broad levels. Level 1 includes quoted prices in active markets for identical assets or liabilities. Level 2 includes other significant observable market-based inputs (including quoted prices for similar securities, interest rates, prepayment speed, and credit risk). Level 3 includes unobservable inputs, which may include the adviser’s own assumptions in determining the fair value of investments. Other financial instruments are derivative instruments not reflected in total investments, such as futures, forwards, swap contracts and written options. The following is a summary of the levels used as of December 31, 2008 in valuing the fund’s assets or liabilities carried at market value:
| | | | | | | | |
| | | Level 1 | | Level 2 | | Level 3 | | Total |
| Investments in Securities | | $531,082,505 | | $6,518,000 | | $— | | $537,600,505 |
| Other Financial Instruments | | $— | | $— | | $— | | $— |
Repurchase Agreements – The fund may enter into repurchase agreements with approved counterparties. Each repurchase agreement is recorded at cost. The fund requires that the securities collateral in a repurchase transaction be transferred to a custodian. The fund monitors, on a daily basis, the value of the collateral to ensure that its value, including accrued interest, is greater than amounts owed to the fund under each such repurchase agreement. The fund and other funds managed by Massachusetts Financial Services Company (MFS), may utilize a joint trading account for the purpose of entering into one or more repurchase agreements.
Foreign Currency Translation – Purchases and sales of foreign investments, income, and expenses are converted into U.S. dollars based upon currency exchange rates prevailing on the respective dates of such transactions or on the reporting date for foreign denominated receivables and payables. Gains and losses attributable to foreign currency exchange rates on sales of securities are recorded for financial statement purposes as net realized gains and losses on investments. Gains and losses attributable to foreign exchange rate movements on receivables, payables, income and expenses are recorded for financial statement purposes as foreign currency transaction gains and losses. That portion of both realized and unrealized gains and losses on investments that results from fluctuations in foreign currency exchange rates is not separately disclosed.
Security Loans – State Street Bank and Trust Company (“State Street”), as lending agent, may loan the securities of the fund to certain qualified institutions (the “Borrowers”) approved by the fund. The loans are collateralized by cash and/or U.S. Treasury and federal agency obligations in an amount typically at least equal to the market value of the securities loaned. State Street provides the fund with indemnification against Borrower default. The fund bears the risk of loss with respect to the investment of cash collateral. On loans collateralized by cash, the cash collateral is invested in a money market fund or short-term securities. A portion of the income generated upon investment of the collateral is remitted to the Borrowers, and the remainder is allocated between the fund and the lending agent. On loans collateralized by U.S. Treasury and/or federal agency obligations, a fee is received from the Borrower, and is allocated between the fund and the lending agent. Income from securities lending is included in interest income on the Statement of Operations. The dividend and interest income earned on the securities loaned is accounted for in the same manner as other dividend and interest income. Net income from securities lending is included in interest income on the Statement of Operations. The dividend and interest income earned on the securities loaned is accounted for in the same manner as other dividend and interest income.
Indemnifications – Under the fund’s organizational documents, its officers and trustees may be indemnified against certain liabilities and expenses arising out of the performance of their duties to the fund. Additionally, in the normal course of business, the fund enters into agreements with service providers that may contain indemnification clauses. The fund’s maximum exposure under these agreements is unknown as this would involve future claims that may be made against the fund that have not yet occurred.
Investment Transactions and Income – Investment transactions are recorded on the trade date. Interest income is recorded on the accrual basis. All premium and discount is amortized or accreted for financial statement purposes in accordance with U.S. generally accepted accounting principles. Dividends received in cash are recorded on the ex-dividend date. Certain dividends from foreign securities will be recorded when the fund is informed of the dividend if such information is obtained subsequent to the ex-dividend date. Dividend and interest payments received in additional securities are recorded on the ex-dividend or ex-interest date in an amount equal to the value of the security on such date.
The fund may receive proceeds from litigation settlements. Any proceeds received from litigation involving portfolio holdings are reflected in the Statement of Operations in realized gain/loss if the security has been disposed of by the fund or in
15
Notes to Financial Statements – continued
unrealized gain/loss if the security is still held by the fund. Any other proceeds from litigation not related to portfolio holdings are reflected as other income in the Statement of Operations.
Fees Paid Indirectly – The fund’s custody fee may be reduced according to an arrangement that measures the value of cash deposited with the custodian by the fund. This amount, for the year ended December 31, 2008, is shown as a reduction of total expenses on the Statement of Operations.
Tax Matters and Distributions – The fund intends to qualify as a regulated investment company, as defined under Subchapter M of the Internal Revenue Code, and to distribute all of its taxable income, including realized capital gains. As a result, no provision for federal income tax is required. Each of the fund’s federal tax returns for the prior three fiscal years remains subject to examination by the Internal Revenue Service. Foreign taxes, if any, have been accrued by the fund in the accompanying financial statements.
Distributions to shareholders are recorded on the ex-dividend date. Income and capital gain distributions are determined in accordance with income tax regulations, which may differ from U.S. generally accepted accounting principles. Certain capital accounts in the financial statements are periodically adjusted for permanent differences in order to reflect their tax character. These adjustments have no impact on net assets or net asset value per share. Temporary differences which arise from recognizing certain items of income, expense, gain or loss in different periods for financial statement and tax purposes will reverse at some time in the future. Distributions in excess of net investment income or net realized gains are temporary overdistributions for financial statement purposes resulting from differences in the recognition or classification of income or distributions for financial statement and tax purposes.
Book/tax differences primarily relate to wash sale loss deferrals.
The tax character of distributions declared to shareholders for the last two fiscal years is as follows:
| | | | |
| | | 12/31/08 | | 12/31/07 |
| Ordinary income (including any short-term capital gains) | | $11,096,074 | | $12,477,413 |
The federal tax cost and the tax basis components of distributable earnings were as follows:
| | | |
| As of 12/31/08 | | | |
| Cost of investments | | $720,214,326 | |
| Gross appreciation | | $9,187,081 | |
| Gross depreciation | | (191,800,902 | ) |
| Net unrealized appreciation (depreciation) | | $(182,613,821 | ) |
| Undistributed ordinary income | | 11,710,717 | |
| Capital loss carryforwards | | (106,381,145 | ) |
| Other temporary differences | | 8 | |
As of December 31, 2008, the fund had capital loss carryforwards available to offset future realized gains. Such losses expire as follows:
| | | |
| 12/31/11 | | $(3,630,846 | ) |
| 12/31/16 | | (102,750,299 | ) |
| | $(106,381,145 | ) |
Multiple Classes of Shares of Beneficial Interest – The fund offers multiple classes of shares, which differ in their respective distribution fees. The fund’s income, realized and unrealized gain (loss), and common expenses are allocated to shareholders based on the daily net assets of each class. Dividends are declared separately for each class. Differences in per share dividend rates are generally due to differences in separate class expenses.
| (3) | | Transactions with Affiliates |
Investment Adviser – The fund has an investment advisory agreement with MFS to provide overall investment management and related administrative services and facilities to the fund. The management fee is computed daily and paid monthly at an annual rate of 0.55% of the fund’s average daily net assets.
The investment adviser has agreed in writing to pay a portion of the fund’s total annual operating expenses, exclusive of interest, taxes, extraordinary expenses, and brokerage commissions such that the total annual operating expenses of the fund do not exceed 1.25% of the fund’s average daily net assets. MFS’ agreement to limit the fund’s operating expenses is contained in the investment advisory agreement between MFS and the fund and may not be rescinded without shareholder approval. In addition, the investment adviser has agreed to pay a portion of the fund’s total annual operating expenses, exclusive of interest, taxes, extraordinary expenses, brokerage and transaction costs and investment-related expenses, such that the total annual operating expenses of the fund do not exceed 0.60% for the Initial Class shares and 0.85% for the Service Class shares, based
16
Notes to Financial Statements – continued
on the average daily net assets of each share class. This written agreement will continue until April 30, 2010. For the year ended December 31, 2008, this reduction amounted to $340,602 and is reflected as a reduction of total expenses in the Statements of Operations.
Distributor – MFS Fund Distributors, Inc. (MFD), a wholly-owned subsidiary of MFS, is the distributor of shares of the fund. The Trustees have adopted a distribution plan for the Service Class shares pursuant to Rule 12b-1 under the Investment Company Act of 1940.
The fund’s distribution plan provides that the fund will pay MFD distribution fees equal to 0.25% per annum of its average daily net assets attributable to Service Class shares as partial consideration for services performed and expenses incurred by MFD and financial intermediaries in connection with the sale and distribution of the Service Class shares and the sale and distribution of the variable annuity or variable life insurance contracts investing in Service Class shares. MFD may subsequently pay all, or a portion, of the distribution fees to financial intermediaries.
Shareholder Servicing Agent – MFS Service Center, Inc. (MFSC), a wholly-owned subsidiary of MFS, has contracted to provide transfer agent and recordkeeping functions in connection with the issuance, transfer, and redemption of each class of shares of the fund under a Shareholder Servicing Agent Agreement. During the year ended December 31, 2008, the fund did not pay MFSC a fee for this service.
Administrator – MFS provides certain financial, legal, shareholder communications, compliance, and other administrative services to the fund. Under an administrative services agreement, the fund partially reimburses MFS the costs incurred to provide these services. The fund is charged an annual fixed amount of $10,000 plus a fee based on average daily net assets.
The administrative services fee incurred for the year ended December 31, 2008 was equivalent to an annual effective rate of 0.0309% of the fund’s average daily net assets.
Trustees’ and Officers’ Compensation – The fund pays compensation to trustees in the form of a retainer, attendance fees, and additional compensation to the Board chairperson. The fund does not pay compensation directly to officers of the fund who are also officers of the investment adviser, all of whom receive remuneration for their services to the fund from MFS. Certain officers of the fund are officers or directors of MFS, MFD, and MFSC.
Other – This fund and certain other MFS funds (the funds) have entered into services agreements (the Agreements) which provide for payment of fees by the funds to Tarantino LLC and Griffin Compliance LLC in return for the provision of services of an Independent Chief Compliance Officer (ICCO) and Assistant ICCO, respectively, for the funds. The ICCO and Assistant ICCO are officers of the funds and the sole members of Tarantino LLC and Griffin Compliance LLC, respectively. The funds can terminate the Agreements with Tarantino LLC and Griffin Compliance LLC at any time under the terms of the Agreements. MFS has agreed to bear all expenses associated with office space, other administrative support, and supplies provided to the ICCO and Assistant ICCO. For the year ended December 31, 2008, the aggregate fees paid by the fund to Tarantino LLC and Griffin Compliance LLC were $7,242 and are included in miscellaneous expense on the Statement of Operations.
Purchases and sales of investments, other than U.S. Government securities, purchased option transactions, and short-term obligations, aggregated $590,054,296 and $739,739,066, respectively.
17
Notes to Financial Statements – continued
| (5) | | Shares of Beneficial Interest |
The fund’s Declaration of Trust permits the Trustees to issue an unlimited number of full and fractional shares of beneficial interest. Transactions in fund shares were as follows:
| | | | | | | | | | | | |
| | | Year ended 12/31/08 | | | Year ended 12/31/07 | |
| | | Shares | | | Amount | | | Shares | | | Amount | |
| Shares sold | | | | | | | | | | | | |
Initial Class | | 303,713 | | | $7,906,299 | | | 86,672 | | | $3,059,054 | |
Service Class | | 1,031,457 | | | 25,940,649 | | | 1,042,843 | | | 35,700,919 | |
| | 1,335,170 | | | $33,846,948 | | | 1,129,515 | | | $38,759,973 | |
| Shares issued to shareholders in reinvestment of distributions | | | | | | | | | | | | |
Initial Class | | 225,965 | | | $7,779,968 | | | 250,233 | | | $9,003,386 | |
Service Class | | 96,934 | | | 3,316,106 | | | 97,176 | | | 3,474,027 | |
| | 322,899 | | | $11,096,074 | | | 347,409 | | | $12,477,413 | |
| Shares reacquired | | | | | | | | | | | | |
Initial Class | | (4,471,633 | ) | | $(135,201,637 | ) | | (5,784,415 | ) | | $(204,630,142 | ) |
Service Class | | (2,180,485 | ) | | (64,072,628 | ) | | (1,032,539 | ) | | (36,527,753 | ) |
| | (6,652,118 | ) | | $(199,274,265 | ) | | (6,816,954 | ) | | $(241,157,895 | ) |
| Net change | | | | | | | | | | | | |
Initial Class | | (3,941,955 | ) | | $(119,515,370 | ) | | (5,447,510 | ) | | $(192,567,702 | ) |
Service Class | | (1,052,094 | ) | | (34,815,873 | ) | | 107,480 | | | 2,647,193 | |
| | (4,994,049 | ) | | $(154,331,243 | ) | | (5,340,030 | ) | | $(189,920,509 | ) |
The fund and other funds managed by MFS participate in a $1 billion unsecured committed line of credit provided by a syndication of banks under a credit agreement. In addition, the fund and other funds managed by MFS have established uncommitted borrowing arrangements with certain banks. Borrowings may be made for temporary financing needs. Interest is charged to each fund, based on its borrowings, generally at a rate equal to the Federal Reserve funds rate plus 0.30%. In addition, a commitment fee, based on the average daily, unused portion of the committed line of credit, is allocated among the participating funds at the end of each calendar quarter. For the year ended December 31, 2008, the fund’s commitment fee and interest expense were $3,807 and $0, respectively, and are included in miscellaneous expense on the Statement of Operations.
18
REPORT OF INDEPENDENT REGISTERED PUBLIC ACCOUNTING FIRM
To the Board of Trustees of MFS Variable Insurance Trust II and the Shareholders of
MFS Blended Research Core Equity Portfolio:
We have audited the accompanying statement of assets and liabilities, including the portfolio of investments, of MFS Blended Research Core Equity Portfolio (the “Fund”) (one of the portfolios comprising MFS Variable Insurance Trust II) as of December 31, 2008, and the related statement of operations for the year then ended, the statements of changes in net assets for each of the two years in the period then ended, and the financial highlights for each of the five years in the period then ended. These financial statements and financial highlights are the responsibility of the Fund’s management. Our responsibility is to express an opinion on these financial statements and financial highlights based on our audits.
We conducted our audits in accordance with the standards of the Public Company Accounting Oversight Board (United States). Those standards require that we plan and perform the audit to obtain reasonable assurance about whether the financial statements and financial highlights are free of material misstatement. The Fund is not required to have, nor were we engaged to perform, an audit of its internal control over financial reporting. Our audits included consideration of internal control over financial reporting as a basis for designing audit procedures that are appropriate in the circumstances, but not for the purpose of expressing an opinion on the effectiveness of the Fund’s internal control over financial reporting. Accordingly, we express no such opinion. An audit also includes examining, on a test basis, evidence supporting the amounts and disclosures in the financial statements, assessing the accounting principles used and significant estimates made by management, as well as evaluating the overall financial statement presentation. Our procedures included confirmation of securities owned as of December 31, 2008, by correspondence with the custodian and brokers. We believe that our audits provide a reasonable basis for our opinion.
In our opinion, the financial statements and financial highlights referred to above present fairly, in all material respects, the financial position of MFS Blended Research Core Equity Portfolio as of December 31, 2008, the results of its operations for the year then ended, the changes in its net assets for each of the two years in the period then ended, and the financial highlights for each of the five years in the period then ended, in conformity with accounting principles generally accepted in the United States of America.
DELOITTE & TOUCHE LLP
Boston, Massachusetts
February 17, 2009
19
TRUSTEES AND OFFICERS – IDENTIFICATION AND BACKGROUND
The Trustees and officers of the Trust, as of February 1, 2009, are listed below, together with their principal occupations during the past five years. (Their titles may have varied during that period.) The address of each Trustee and officer is 500 Boylston Street, Boston, Massachusetts 02116.
| | | | | | |
Name, Date of Birth | | Position(s) Held
with Fund | | Trustee/Officer
Since (1) | | Principal Occupations During the Past Five Years and
Other Directorships (2) |
| INTERESTED TRUSTEE | | | | |
David D. Horn (3) (born 6/07/41) | | Trustee | | April 1986 | | Private investor; Sun Life Assurance Company of Canada, Senior Vice President and General Manager for the United States (until 1997); Director (until March 2004) |
| | |
| INDEPENDENT TRUSTEES | | | | |
J. Kermit Birchfield (born 1/08/40) | | Chairman | | May 1997 | | Consultant; Century Partners, Inc. (investments), Director; Displaytech, Inc. (technology), Director; Dessin Fournir LLC (furniture manufacturer), Director (2005 to present); Intermountain Gas Company, Inc. & Intermountain Industries, Inc. (oil & gas exploration and production), Director; Site Watch LLC (software to monitor oil tanks), Managing Director (2006 to present); Juridica Investments (fund investing in judicial matters), Director (2007 to present); HPSC, Inc. (medical financing), Director (until January 2004) |
| | | |
Robert C. Bishop (born 1/13/43) | | Trustee | | May 2001 | | AutoImmune, Inc. (pharmaceutical product development), Chairman, President and Chief Executive Officer; Caliper Life Sciences Corp. (laboratory analytical instruments), Director; Millipore Corporation (purification/filtration products), Director; Waterstreet Capital (leverage buyouts), Advisory Board (August 2006 to present); Optobionics Corporation (ophthalmic devices), Director (2002 to 2007) |
| | | |
Frederick H. Dulles (born 3/12/42) | | Trustee | | May 2001 | | Ten State International Law PLLC (law firm), Of Counsel (since 2006); Prudential Carolina Real Estate, (real estate), Broker (since 2006); Free Enterprise Foundation, Inc. (research institute), Director & Secretary (until 2008); Disher, Hamrick & Myers Residential, Inc. (real estate) Broker (2005 until 2006); Frederick H. Dulles law practice (until 2006); Ten State Street LLP (law firm), Member (until 2005) |
| | | |
Marcia A. Kean (born 6/30/48) | | Trustee | | April 2005 | | Feinstein Kean Healthcare (consulting), Chief Executive Officer |
| | | |
Ronald G. Steinhart (born 6/15/40) | | Trustee | | May 2001 | | Private investor; Penske Automotive Group (automotive retailer), Director; Animal Health International, Inc. (animal health products), Director (since 2007); Texas Industries (concrete/aggregates/cement), Director (since 2007); Penson Worldwide, Inc. (securities clearance), Director (since 2006); Carreker Corporation (technology consulting) Director (until 2005); Prentiss Properties Trust (real estate investment trust), Director (until 2006) |
| | | |
Haviland Wright (born 7/21/48) | | Trustee | | May 2001 | | Profitability of Hawaii (software), Chief Development Officer (since December 2008); Elixir Technologies Corporation (software) Director (since 2005); Nano Loa Inc. (liquid crystal displays), Director |
| | |
| TRUSTEE EMERITUS | | | | |
Samuel Adams (born 10/19/25) | | Trustee Emeritus | | | | Retired; K&L Gates LLP (law firm), Of Counsel |
| | |
| OFFICERS | | | | |
Maria F. Dwyer (4) (born 12/01/58) | | President | | November 2005 | | Massachusetts Financial Services Company, Executive Vice President and Chief Regulatory Officer (since March 2004) Chief Compliance Officer (since December 2006); Fidelity Management & Research Company, Vice President (prior to March 2004); Fidelity Group of Funds, President and Treasurer (until March 2004) |
| | | |
Christopher R. Bohane (4) (born 1/18/74) | | Assistant Secretary and Assistant Clerk | | July 2005 | | Massachusetts Financial Services Company, Vice President and Senior Counsel |
| | | |
John M. Corcoran (4) (born 4/13/65) | | Treasurer | | October 2008 | | Massachusetts Financial Services Company, Senior Vice President (since October 2008); State Street Bank and Trust (financial services provider), Senior Vice President, (until September 2008) |
| | | |
Ethan D. Corey (4) (born 11/21/63) | | Assistant Secretary and Assistant Clerk | | July 2005 | | Massachusetts Financial Services Company, Senior Vice President and Associate General Counsel (since 2004); Dechert LLP (law firm), Counsel (prior to December 2004) |
| | | |
David L. DiLorenzo (4) (born 8/10/68) | | Assistant Treasurer | | July 2005 | | Massachusetts Financial Services Company, Vice President (since June 2005); JP Morgan Investor Services, Vice President (until June 2005) |
| | | |
Timothy M. Fagan (4) (born 7/10/68) | | Assistant Secretary and Assistant Clerk | | September 2005 | | Massachusetts Financial Services Company, Vice President and Senior Counsel (since September 2005); John Hancock Advisers, LLC, Vice President, Senior Attorney and Chief Compliance Officer (until August 2005) |
20
Trustees and Officers – continued
| | | | | | |
Name, Date of Birth | | Position(s) Held
with Fund | | Trustee/Officer
Since (1) | | Principal Occupations During the Past Five Years and
Other Directorships (2) |
Mark D. Fischer (4) (born 10/27/70) | | Assistant Treasurer | | July 2005 | | Massachusetts Financial Services Company, Vice President (since May 2005); JP Morgan Investment Management Company, Vice President (until May 2005) |
| | | |
Robyn L. Griffin (born 7/04/75) | | Assistant Independent Chief Compliance Officer | | August 2008 | | Griffin Compliance LLC (provider of compliance services), Principal (since August 2008); State Street Corporation (financial services provider), Mutual Fund Administration Assistant Vice President (October 2006 – July 2008); Liberty Mutual Group (insurance), Personal Market Assistant Controller (April 2006 – October 2006); Deloitte & Touche LLP (professional services firm), Senior Manager (prior to April 2006)) |
| | | |
Brian E. Langenfeld (4) (born 3/07/73) | | Assistant Secretary and Assistant Clerk | | May 2006 | | Massachusetts Financial Services Company, Vice President and Senior Counsel (since May 2006); John Hancock Advisers, LLC, Assistant Vice President and Counsel (until April 2006) |
| | | |
Ellen Moynihan (4) (born 11/13/57) | | Assistant Treasurer | | May 1997 | | Massachusetts Financial Services Company, Senior Vice President |
| | | |
Susan S. Newton (4) (born 3/07/50) | | Assistant Secretary and Assistant Clerk | | May 2005 | | Massachusetts Financial Services Company, Senior Vice President and Associate General Counsel (since April 2005); John Hancock Advisers, LLC, Senior Vice President, Secretary and Chief Legal Officer (until April 2005) |
| | | |
Susan A. Pereira (4) (born 11/05/70) | | Assistant Secretary and Assistant Clerk | | July 2005 | | Massachusetts Financial Services Company, Vice President and Senior Counsel (since June 2004); Bingham McCutchen LLP (law firm), Associate (until June 2004) |
| | | |
Mark N. Polebaum (4) (born 5/01/52) | | Secretary and Clerk | | February 2006 | | Massachusetts Financial Services Company, Executive Vice President, General Counsel and Secretary (since January 2006); Wilmer Cutler Pickering Hale and Dorr LLP (law firm), Partner (until January 2006) |
| | | |
Frank L. Tarantino (born 3/07/44) | | Independent Chief Compliance Officer | | September 2004 | | Tarantino LLC (provider of compliance services), Principal (since June 2004); CRA Business Strategies Group (consulting services), Executive Vice President (until June 2004) |
| | | |
Richard S. Weitzel (4) (born 7/16/70) | | Assistant Secretary and Assistant Clerk | | October 2007 | | Massachusetts Financial Services Company, Vice President and Assistant General Counsel (since 2004); Massachusetts Department of Business and Technology, General Counsel (until April 2004) |
| | | |
James O. Yost (4) (born 6/12/60) | | Assistant Treasurer | | April 1992 | | Massachusetts Financial Services Company, Senior Vice President |
| (1) | Date first appointed to serve as Trustee/Officer of an MFS fund or a Compass variable account. Each Trustee has served continuously since appointment. |
| (2) | Directorships or trusteeships of companies required to report to the Securities and Exchange Commission (i.e., “public companies”). |
| (3) | “Interested person” of the Trust, within the meaning of the Investment Company Act of 1940 (referred to as the 1940 Act), which is the principal federal law governing investment companies like the Trust, as a result of position with Sun Life of Canada (U.S.). The address of Sun Life of Canada (U.S.) is One Sun Life Executive Park, Wellesley Hills, Massachusetts 02481. |
| (4) | “Interested person” of MFS within the meaning of the 1940 Act. The address of MFS is 500 Boylston Street, Boston, Massachusetts 02116. |
The Trust does not hold annual meetings for the purpose of electing Trustees, and Trustees are not elected for fixed terms. Each Trustee and officer holds office until his or her successor is chosen and qualified, or until his or her earlier death, resignation, retirement or removal.
All Trustees currently serve as Trustees of the Trust and have served in that capacity since originally elected or appointed. All of the Trustees are also Managers of the Compass Variable Accounts. The executive officers of the Trust hold similar offices for the Compass Variable Accounts and other funds in the MFS fund complex. As of January 1, 2009, each Trustee serves as a Trustee or Manager of 35 Accounts/Funds.
The Statement of Additional Information contains further information about the Trustees and is available without charge upon request by calling 1-800-752-7215.
| | |
Investment Adviser
Massachusetts Financial Services Company 500 Boylston Street, Boston, MA 02116-3741 | | Custodian State Street Bank and Trust 1 Lincoln Street, Boston, MA 02111-2900 |
Distributor
MFS Fund Distributors, Inc. 500 Boylston Street, Boston, MA 02116-3741 | | Independent Registered Public Accounting Firm Deloitte & Touche LLP 200 Berkeley Street, Boston, MA 02116 |
Portfolio Manager Matthew Krummell | | |
21
BOARD REVIEW OF INVESTMENT ADVISORY AGREEMENTS
The Investment Company Act of 1940 requires that both the full Board of Trustees and a majority of the non-interested (“independent”) Trustees, voting separately, annually approve the continuation of the investment advisory agreement between MFS Variable Insurance Trust II (the “Trust”) and Massachusetts Financial Services Company (“MFS”) on behalf of the Fund. The Trustees consider matters bearing on the Fund and the advisory arrangements at their meetings throughout the year, including a review of performance data at each regular meeting. In addition, the independent Trustees met in May and again in July 2008 (“contract review meetings”) for the specific purpose of considering whether to approve the continuation of the investment advisory agreement for the Fund. The independent Trustees were assisted in their evaluation of the investment advisory agreement by independent legal counsel, from whom they received separate legal advice and with whom they met separately from MFS management during various contract review meetings. The independent Trustees were also assisted in this process by the Fund’s Independent Chief Compliance Officer, a full-time senior officer appointed by and reporting to the independent Trustees.
In connection with their deliberations, the Trustees, including the independent Trustees, considered such information and factors as they believed, in light of the legal advice furnished to them and their own business judgment, to be relevant. The investment advisory agreement was considered separately for the Fund, although the Trustees also took into account the common interests of all Funds in the Trust in their review. As described below, the Trustees considered the nature, quality, and extent of the various investment advisory, administrative, and shareholder services performed by MFS under the existing investment advisory agreement and other arrangements with the Trust.
In connection with their contract review meetings, the Trustees received and relied upon materials which included, among other items: (i) information provided by Lipper Inc. on the investment performance of the Fund for various time periods ended December 31, 2007, compared to the investment performance of a group of funds with substantially similar investment classifications/objectives (the “Lipper performance universe”), (ii) information provided by Lipper Inc. on the Fund’s advisory fees and other expenses compared to the advisory fees and other expenses of comparable funds identified by Lipper (the “Lipper expense group”), (iii) information provided by MFS on the advisory fees of comparable portfolios of its other clients, including institutional separate account and other clients, (iv) information as to whether expense waivers, reimbursements or fee “breakpoints” are observed for the Fund, (v) information regarding MFS’ financial results and financial condition, including MFS’ and certain of its affiliates’ estimated profitability from services performed for the Fund, (vi) MFS’ views regarding the outlook for the mutual fund industry and its strategic business plans, (vii) descriptions of various functions performed by MFS for the Trust, such as compliance monitoring and portfolio trading practices, and (viii) information regarding the overall organization of MFS, including information about MFS’ senior management and other personnel providing investment advisory, administrative and other services to the Fund. The comparative performance, fee and expense information prepared and provided by Lipper Inc. was not independently verified, and the independent Trustees did not independently verify any information provided to them by MFS.
The Trustees’ conclusion as to the continuation of the investment advisory agreement was based on comprehensive consideration of all information provided to the Trustees and not the result of any single factor. Some of the factors that figured particularly in the Trustees’ deliberations are described below for the Fund, while individual Trustees may have given different weight to various factors and evaluated the information presented as a whole differently than another Trustee. The Trustees recognized that the fee arrangements for the Fund reflect years of review and discussion between the independent Trustees and MFS, that certain aspects of such arrangements may receive greater scrutiny in some years than others, and that the Trustees’ conclusions may be based, in part, on their consideration of these same arrangements during the course of the year and in prior years.
Based on information provided by Lipper Inc., the Trustees compared the Fund’s total return investment performance to the performance of a peer group of funds over various time periods. The Trustees placed particular emphasis on the total return performance of the Fund’s Initial Class shares in comparison to the performance of funds in its Lipper performance universe over the one-, three- and five-year periods. The Trustees did not rely on performance results for more recent periods, including those shown elsewhere in this report.
The Trustees noted the performance of the Fund’s Initial Class shares was in the 3rd quintile relative to the other funds in the Lipper Classification Index for the one-year period (the 1st quintile being the best performers and the 5th quintile being the worst performers). The total return performance of the Fund was in the 2nd quintile for the three-year period and the 3rd quintile for the five-year period ended December 31, 2007, relative to the Lipper performance universe. Based on the nature and quality of services provided by MFS, the Board of Trustees concluded that the Fund’s performance was satisfactory.
In the course of their deliberations, the Trustees took into account information provided by MFS during contract review meetings, as well as during investment review meetings conducted with portfolio management personnel during the course of the year.
22
Board Review of Investment Advisory Agreements – continued
In assessing the reasonableness of the Fund’s advisory fee, the Trustees considered, among other information, the Fund’s advisory fee and the total expense ratio of the Fund’s Initial Class shares as a percentage of average daily net assets, compared to the advisory fee and total expense ratios of its peer group of funds based on information provided by Lipper Inc. The Trustees also considered the advisory fees charged by MFS to institutional accounts. In comparing these fees, the Trustees considered the generally broader scope of services provided by MFS to the Trust than those provided to institutional accounts. The Trustees also considered the higher demands placed on MFS’ investment personnel and trading infrastructure as a result of the daily cash in-flows and out-flows of the Fund, and the impact on MFS and related expenses due to the more extensive regulatory regime to which the Fund is subject, compared to institutional accounts.
In considering the fees, the Trustees noted from the Lipper data that the Fund’s effective advisory fee rate and total expense ratio were each approximately at the median of such fees and expenses of funds in the Lipper expense group. In addition, the Trustees noted that MFS currently observes an expense limitation for the Fund. They noted that the Fund’s advisory fee rate schedule is not currently subject to any breakpoints. However, the Trustees concluded that the fees were reasonable in light of the nature and quality of services provided by MFS, and determined not to recommend any advisory fee breakpoints for the Fund at this time.
The Trustees also considered information prepared by MFS relating to its costs and profits with respect to the Fund and other investment companies and accounts advised by MFS, as well as MFS’ methodologies used to determine and allocate its costs to the Fund and other accounts and products for purposes of estimating profitability.
After reviewing these and other factors described below, the Trustees concluded that the advisory fees charged to the Fund represent reasonable compensation in light of the nature and quality of the services being provided by MFS.
In addition, the Trustees considered MFS’ resources and related efforts to continue to retain, attract and motivate capable personnel to serve the Fund. The Trustees also considered the financial resources of MFS and its parent, Sun Life Financial Inc. The Trustees further considered any advantages and possible disadvantages of having an adviser which also serves other investment companies as well as institutional accounts.
The Trustees also considered the nature, quality, cost, and extent of administrative, transfer agency, and distribution services provided to the Fund by MFS and its affiliates under agreements and plans other than the investment advisory agreement, including the 12b-1 fees the Fund pays to MFS Fund Distributors, Inc., an affiliate of MFS. The Trustees also considered the nature, extent and quality of certain other services MFS performs or arranges on the Fund’s behalf, which may include securities lending programs, directed expense payment programs, class action recovery programs, and MFS’ interaction with third-party service providers, principally custodians and sub-custodians. The Trustees concluded that the various non-advisory services provided by MFS and its affiliates on behalf of the Fund were satisfactory. The Trustees also considered the benefits to MFS from the use of the Fund’s portfolio brokerage commissions to pay for research and other similar services and various other factors. Additionally, the Trustees considered so-called “fall-out benefits” to MFS such as reputational value derived from serving as investment manager to the Trust, and determined that any such benefits derived by MFS were reasonable and fair.
Based on their evaluation of factors that they deemed to be material, including those factors described above, the Board of Trustees, including a majority of the independent Trustees, concluded that the investment advisory agreement should be continued for an additional one-year period, commencing September 1, 2008.
A discussion regarding the Board’s most recent review and renewal of the fund’s Investment Advisory Agreement with MFS is available by clicking on the fund’s name under “Variable Insurance Portfolios-VIT II” in the “Products & Performance” section on the MFS Web site (mfs.com).
23
PROXY VOTING POLICIES AND INFORMATION
A general description of the MFS funds’ proxy voting policies and procedures is available without charge, upon request, by calling 1-800-225-2606, by visiting the Proxy Voting section of mfs.com or by visiting the SEC’s Web site at http://www.sec.gov.
Information regarding how the fund voted proxies relating to portfolio securities during the most recent twelve-month period ended June 30 is available without charge by visiting the Proxy Voting section of mfs.com or by visiting the SEC’s Web site at http://www.sec.gov.
QUARTERLY PORTFOLIO DISCLOSURE
The fund will file a complete schedule of portfolio holdings with the Securities and Exchange Commission (the Commission) for the first and third quarters of each fiscal year on Form N-Q. The fund’s Form N-Q may be reviewed and copied at the:
Public Reference Room
Securities and Exchange Commission
100 F Street, NE, Room 1580
Washington, D.C. 20549
Information on the operation of the Public Reference Room may be obtained by calling the Commission at 1-800-SEC-0330. The fund’s Form N-Q is available on the EDGAR database on the Commission’s Internet Web site at http://www.sec.gov, and copies of this information may be obtained, upon payment of a duplicating fee, by electronic request at the following e-mail address: publicinfo@sec.gov or by writing the Public Reference Section at the above address.
FEDERAL TAX INFORMATION (unaudited)
The following information is provided pursuant to provisions of the Internal Revenue Code.
For corporate shareholders, 100% of the ordinary income dividends paid during the fiscal year qualify for the corporate dividends received deduction.
24
MFS® PRIVACY NOTICE
Privacy is a concern for every investor today. At MFS Investment Management® and the MFS funds, we take this concern very seriously. We want you to understand our policies about the investment products and services that we offer, and how we protect the nonpublic personal information of investors who have a direct relationship with us and our wholly owned subsidiaries.
Throughout our business relationship, you provide us with personal information. We maintain information and records about you, your investments, and the services you use. Examples of the nonpublic personal information we maintain include
| | Ÿ | | data from investment applications and other forms |
| | Ÿ | | share balances and transactional history with us, our affiliates, or others |
| | Ÿ | | facts from a consumer reporting agency |
We do not disclose any nonpublic personal information about our customers or former customers to anyone, except as permitted by law. We may share nonpublic personal information with third parties or certain of our affiliates in connection with servicing your account or processing your transactions. We may share information with companies or financial institutions that perform marketing services on our behalf or with other financial institutions with which we have joint marketing arrangements, subject to any legal requirements.
Authorization to access your nonpublic personal information is limited to appropriate personnel who provide products, services, or information to you. We maintain physical, electronic, and procedural safeguards to help protect the personal information we collect about you.
If you have any questions about the MFS privacy policy, please call 1-800-225-2606 any business day between 8 a.m. and 8 p.m. Eastern time.
Note: If you own MFS products or receive MFS services in the name of a third party such as a bank or broker-dealer, their privacy policy may apply to you instead of ours.
25

MFS® GLOBAL RESEARCH PORTFOLIO
(formerly MFS® Research Portfolio)
The report is prepared for the general information of contract owners. It is authorized for distribution to prospective investors only when preceded or accompanied by a current prospectus.
NOT FDIC INSURED Ÿ MAY LOSE VALUE Ÿ NO BANK GUARANTEE Ÿ NOT A DEPOSIT Ÿ NOT INSURED BY ANY FEDERAL GOVERNMENT AGENCY OR NCUA/NCUSIF
LETTER FROM THE CEO

Dear Contract Owners:
The market downturns and economic setbacks of late probably rank among the worst financial declines most of us have experienced. Inevitably, people may be questioning their commitment to investing. Still, it is important to remember that downturns are an inescapable part of the business cycle. Such troughs have been seen before, and if we can use history as a guide, market recoveries typically have followed.
Recent events have clearly shown us the value of certain types of investments. In this environment, two of the hallmarks of mutual funds — transparency and liquidity — have become critically important. Unlike some other types of investments, the operations of mutual funds are relatively transparent to their shareholders. With their daily redemption feature, mutual funds also generally provide easy, convenient access to one’s money. Through these recent market upheavals, this level of liquidity enhanced the ability of mutual fund investors to respond and modify their investments as they and their advisors saw fit — a flexibility that those in less liquid investments simply did not have at their disposal.
At MFS® we take particular pride in how well mutual funds can serve investors because we invented the mutual fund in the United States. Established in 1924, Massachusetts Investors Trust was the nation’s first fund. Recent market events only reinforce what we have learned through 85 years — that mutual funds provide unique features that are important to investors in any type of market climate.
Respectfully,

Robert J. Manning
Chief Executive Officer and Chief Investment Officer
MFS Investment Management®
February 17, 2009
The opinions expressed in this letter are subject to change, may not be relied upon for investment advice, and no forecasts can be guaranteed.
Before investing, consider the fund’s investment objectives, risks, charges, and expenses. For a prospectus containing this and other information, contact your investment professional or view online. Read it carefully.
MFS Fund Distributors, Inc., 500 Boylston Street, Boston, MA 02116
1
PORTFOLIO COMPOSITION
Portfolio structure
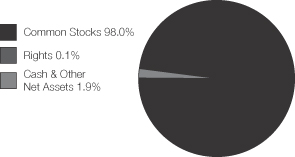
| | |
| Top ten holdings | | |
| Chevron Corp. | | 2.7% |
| TOTAL S.A. | | 2.2% |
| Royal Dutch Shell PLC, “A” | | 2.1% |
| Roche Holding AG | | 2.1% |
| Siemens AG | | 2.0% |
| Nestle S.A. | | 1.9% |
| Merck KGaA | | 1.9% |
| Danaher Corp. | | 1.8% |
| AT&T, Inc. | | 1.6% |
| Wal-Mart Stores, Inc. | | 1.5% |
| | |
| Equity sectors | | |
| Financial Services | | 18.7% |
| Energy | | 11.9% |
| Utilities & Communications | | 11.8% |
| Health Care | | 11.0% |
| Technology | | 10.4% |
| Consumer Staples | | 8.0% |
| Retailing | | 7.8% |
| Industrial Goods & Services | | 5.4% |
| Basic Materials | | 4.4% |
| Special Products & Services | | 3.3% |
| Transportation | | 2.6% |
| Autos & Housing | | 2.0% |
| Leisure | | 0.7% |
| |
| Country weightings | | |
| United States | | 46.7% |
| United Kingdom | | 7.2% |
| France | | 6.9% |
| Switzerland | | 6.8% |
| Germany | | 5.8% |
| Japan | | 4.9% |
| Italy | | 2.7% |
| Canada | | 2.3% |
| Taiwan | | 1.7% |
| Other Countries | | 15.0% |
Percentages are based on net assets as of 12/31/08.
The portfolio is actively managed and current holdings may be different.
2
MANAGEMENT REVIEW
Summary of Results
For the twelve months ended December 31, 2008, Initial Class shares of the MFS Global Research Portfolio (the “fund”) provided a total return of –36.43%, while Service Class shares of the fund provided a total return of –36.57%. These returns include the impact of a material class action settlement received by the fund during the reporting period (see Performance Summary for details). Prior to October 6, 2008, MFS primarily invested the fund’s assets in U.S. equity securities. Effective October 6, 2008, MFS primarily invests the fund’s assets in U.S. and foreign equity securities, including emerging market equity securities. Effective October 6, 2008, the fund also changed its name from the MFS Research Portfolio to the MFS Global Research Portfolio, and its benchmark from the S&P 500 Stock Index to the MSCI All Country World Index, to better reflect the fund’s new global investment strategy. For the twelve month reporting period, the MSCI All Country World Index generated a return of –41.85%, while the S&P 500 Stock Index generated a return of –37.00%.
Market Environment
The U.S. economy and financial markets experienced significant deterioration and extraordinary volatility over the reporting period. U.S. economic growth slowed significantly, despite the short-term bounce from the second quarter fiscal stimulus. Strong domestic headwinds included accelerated deterioration in the housing market, anemic corporate investment, a rapidly declining job market, and a much tighter credit environment. During the period, a seemingly continuous series of tumultuous financial events hammered markets, including: the distressed sale of failing Bear Stearns to JPMorgan, the conservatorship of Government Sponsored Enterprises (GSEs) Fannie Mae and Freddie Mac, the bankruptcy of investment bank Lehman Brothers, the Federal Reserve Bank’s complex intervention of insurance company American International Group (AIG), the nationalization of several large European banks, the failure of Washington Mutual, and the distressed sale of Wachovia. As a result of this barrage of turbulent news, global equity markets pushed significantly lower and credit markets witnessed the worst dislocation since the beginning of the credit crisis. Though conditions improved towards the end of the period, the state of financial and macroeconomic dislocation remained severe.
While reasonably resilient during the first half of the period, the global economy and financial system increasingly experienced considerable negative spillovers from the U.S. slowdown. Not only did Europe and Japan show obvious signs of economic softening, the more powerful engine of global growth – emerging markets – also displayed weakening dynamics.
During the reporting period, the U.S. Federal Reserve Board cut interest rates aggressively and introduced a multitude of new lending facilities to alleviate ever-tightening credit markets, while the U.S. federal government moved quickly to design and implement a meaningful fiscal stimulus package. Although several other global central banks also cut rates, the dilemma of rising energy and food prices heightened concerns among central bankers that inflationary expectations might become unhinged despite weaker growth. Only later in the reporting period did slowing global growth result in a very precipitous decline in commodity prices, which significantly eased inflation and inflationary expectations. As inflationary concerns diminished in the face of global deleveraging, and equity and credit markets deteriorated more sharply, a coordinated rate cut marked the beginning of much more aggressive easing by the major global central banks.
Contributors to Performance
Security selection in the financial services sector boosted performance relative to the MSCI All Country World Index. Financial services firm JPMorgan Chase and insurance company Chubb Corp. were among the fund’s top relative contributors. The fund’s positioning in banking operator Wells Fargo also benefited relative results as the stock outperformed the benchmark during the reporting period.
A combination of stock selection and an overweighted position in the retailing sector contributed to relative returns. Discount retailer Family Dollar Stores (g) and retail giant Wal-Mart were strong relative contributors in this sector. Wal-Mart delivered strong returns over the reporting period driven by the company’s significant growth from its proven business model. The stock was also aided by the firm’s recent refocus on “price leadership” which led to a significant improvement in sales.
In the consumer staples sector, a combination of stock selection and an overweighted position also had a positive impact on relative performance. Soft-drink maker PepsiCo was among the fund’s top relative contributors within this sector.
Stocks in other sectors that aided relative returns included integrated energy company Chevron, computer maker IBM (g), and biotechnology firm Genzyme. Shares of Genzyme fared better than the sector overall due to strong sales growth in its drug products, particularly a significant jump, in the latter part of the reporting period, in sales of its rare genetic disorder drug Myozyme. Elsewhere, the fund’s positioning in integrated oil company TOTAL (France) also aided relative results as the stock enabled the fund to capture a positive contribution during the period we held this position.
During the reporting period, the fund’s currency exposure was a contributor to relative performance. All of MFS’ investment decisions are driven by the fundamentals of each individual opportunity and as such, it is common for our portfolios to have different currency exposure than the benchmark.
3
Management Review – continued
Detractors from Performance
Stock selection in the health care sector was the principal detractor from the fund’s relative performance. No individual stocks within this sector were among the fund’s top relative detractors.
An underweighted position in the leisure sector also hindered relative returns. No individual stocks within this sector were top relative detractors for the reporting period.
Security selection in the special products and services sector held back relative results. Information technology services provider Satyam Computer Services (India) (g) had a negative impact on relative performance as the stock underperformed the benchmark.
Although the financial services sector was the top contributing sector to relative returns overall, several individual securities within this sector hurt results. These included financial services firms, BNP Paribas (France), Unicredito Italiano (Italy) (g), Barclays (United Kingdom), Erste Group Bank (Austria) (g), and Sumitomo Mitsui Financial Group (Japan).
Several individual securities in other sectors that negatively affected relative performance included mining company Teck Cominco (Canada) (g), integrated oil company Exxon Mobil (g), industrial machinery manufacturer Bucyrus International (aa), and flash memory storage products maker SanDisk. Shares of SanDisk declined as the economy worsened, resulting in softer sales. In addition, Samsung Electronics, which had bid for SanDisk, withdrew its offer after it was rejected by management as inadequate.
Respectfully,
| | |
| Michael Cantara | | Jose Luis Garcia |
| Portfolio Manager | | Portfolio Manager |
Note to Shareholders: Effective October 6, 2008, Michael Cantara became a co-manager of the fund and the fund name was changed from MFS Research Portfolio to MFS Global Research Portfolio.
(aa) | | Security is not a benchmark constituent. |
| (g) | | Security was not held in the portfolio at period end. |
The views expressed in this report are those of the portfolio managers only through the end of the period of the report as stated on the cover and do not necessarily reflect the views of MFS or any other person in the MFS organization. These views are subject to change at any time based on market or other conditions, and MFS disclaims any responsibility to update such views. These views may not be relied upon as investment advice or an indication of trading intent on behalf of any MFS portfolio. References to specific securities are not recommendations of such securities, and may not be representative of any MFS portfolio’s current or future investments.
4
PERFORMANCE SUMMARY THROUGH 12/31/08
The following chart illustrates the historical performance of the fund in comparison to its benchmark(s). Benchmark comparisons are unmanaged; do not reflect any fees or expenses; and cannot be invested in directly. The performance of other share classes will be greater than or less than that of the class depicted below. (See Notes to Performance Summary.)
Performance data shown represents past performance and is no guarantee of future results. Investment return and principal value fluctuate so your units, when sold, may be worth more or less than the original cost; current performance may be lower or higher than quoted. The performance shown does not reflect the deduction of taxes, if any, that a contract holder would pay on fund distributions or the redemption of contract units. The returns for the fund shown also do not reflect the deduction of expenses associated with variable products, such as mortality and expense risk charges, separate account charges, and sales charges imposed by the insurance company separate accounts. Such expenses would reduce the overall returns shown.
Growth of a hypothetical $10,000 investment
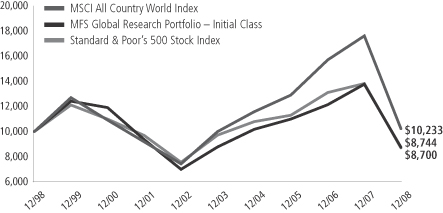
Total rates of return through 12/31/08
Average Annual Total Returns
| | | | | | | | | | | | |
| | | Share class | | Class inception date | | 1-yr | | 5-yr | | 10-yr | | |
| | | Initial Class | | 11/07/94 | | (36.43)% | | (0.09)% | | (1.33)% | | |
| | | Service Class | | 8/24/01 | | (36.57)% | | (0.33)% | | (1.52)% | | |
Comparative Benchmarks
| | | | | | | | | | | | |
| | | MSCI All Country World Index (f) | | (41.85)% | | 0.44% | | 0.23% | | |
| | | Standard & Poor’s 500 Stock Index (e)(f) | | (37.00)% | | (2.19)% | | (1.38)% | | |
| (e) | Effective October 6, 2008, the fund changed its benchmark from the Standard & Poor’s 500 Stock Index to the MSCI All Country World Index because it is believed that it more closely corresponds to the fund’s new global investment strategy. |
| (f) | Source: FactSet Research Systems, Inc. |
Included in the Initial Class and Service Class total returns for the year ended December 31, 2008 are proceeds received from a non-recurring litigation settlement with Enron Corp., had these proceeds not been included the 1-yr total returns would have each been lower by approximately 0.86%.
Benchmark Definitions
MSCI All Country World Index – a market capitalization-weighted index that is designed to measure equity market performance in the global developed and emerging markets.
Standard & Poor’s 500 Stock Index – a market capitalization-weighted index of 500 widely held equity securities, designed to measure broad U.S. equity performance.
It is not possible to invest directly in an index.
5
Performance Summary – continued
Notes to Performance Summary
Performance for the Service Class includes the performance of the fund’s Initial Class for periods prior to their offering. Because Service Class expenses are higher than those of Initial Class, performance shown for Service Class is higher than it would have been had it been offered for the entire period. Performance has not been adjusted to take into account differences in class specific operating expenses (such as Rule 12b-1 fees). Please see the prospectus for additional information about performance and expenses.
Performance results reflect any applicable expense subsidies and waivers in effect during the periods shown. Without such subsidies and waivers the fund’s performance results would be less favorable. Please see the prospectus for complete details. All results are historical and assume the reinvestment of any dividends and capital gains distributions.
Prior to October 6, 2008, MFS primarily invested the fund’s assets in U.S. equity securities. Effective October 6, 2008, MFS primarily invests the fund’s assets in U.S. and foreign equity securities, including emerging market equity securities.
From time to time the fund may receive proceeds from litigation settlements, without which performance would be lower.
6
EXPENSE TABLE
Fund Expenses Borne by the Contract Holders During the Period,
July 1, 2008 through December 31, 2008
As a contract holder of the fund, you incur ongoing costs, including management fees; distribution (12b-1) fees; and other fund expenses. This example is intended to help you understand your ongoing costs (in dollars) of investing in the fund and to compare these costs with the ongoing costs of investing in other mutual funds.
The example is based on an investment of $1,000 invested at the beginning of the period and held for the entire period July 1, 2008 through December 31, 2008.
Actual Expenses
The first line for each share class in the following table provides information about actual account values and actual expenses. You may use the information in this line, together with the amount you invested, to estimate the expenses that you paid over the period. Simply divide your account value by $1,000 (for example, an $8,600 account value divided by $1,000 = 8.6), then multiply the result by the number in the first line under the heading entitled “Expenses Paid During Period” to estimate the expenses you paid on your account during this period.
Hypothetical Example for Comparison Purposes
The second line for each share class in the following table provides information about hypothetical account values and hypothetical expenses based on the fund’s actual expense ratio and an assumed rate of return of 5% per year before expenses, which is not the fund’s actual return. The hypothetical account values and expenses may not be used to estimate the actual ending account balance or expenses you paid for the period. You may use this information to compare the ongoing costs of investing in the fund and other funds. To do so, compare this 5% hypothetical example with the 5% hypothetical examples that appear in the shareholder reports of the other funds.
Please note that the expenses shown in the table are meant to highlight the fund’s ongoing costs only and do not take into account the fees and expenses imposed under the variable contracts through which your investment in the fund is made. Therefore, the second line for each share class in the table is useful in comparing ongoing costs associated with an investment in vehicles (such as the fund) which fund benefits under variable annuity and variable life insurance contracts and to qualified pension and retirement plans only, and will not help you determine the relative total costs of investing in the fund through variable annuity and variable life insurance contracts. If the fees and expenses imposed under the variable contracts were included, your costs would have been higher.
| | | | | | | | | | |
| Share Class | | | | Annualized
Expense Ratio | | Beginning
Account Value
7/01/08 | | Ending
Account Value
12/31/08 | | Expenses Paid
During Period (p)
7/01/08-12/31/08 |
| Initial Class | | Actual | | 0.89% | | $1,000.00 | | $701.48 | | $3.81 |
| | Hypothetical (h) | | 0.89% | | $1,000.00 | | $1,020.66 | | $4.52 |
| Service Class | | Actual | | 1.14% | | $1,000.00 | | $700.80 | | $4.87 |
| | Hypothetical (h) | | 1.14% | | $1,000.00 | | $1,019.41 | | $5.79 |
| (h) | 5% class return per year before expenses. |
| (p) | Expenses paid is equal to each class’ annualized expense ratio, as shown above, multiplied by the average account value over the period, multiplied by the number of days in the period, divided by the number of days in the year. |
7
PORTFOLIO OF INVESTMENTS – 12/31/08
The Portfolio of Investments is a complete list of all securities owned by your fund. It is categorized by broad-based asset classes.
| | | | | |
| Issuer | | Shares/Par | | Value ($) |
| | | | | |
| COMMON STOCKS – 98.0% | | | | | |
| Aerospace – 0.9% | | | | | |
| Lockheed Martin Corp. | | 15,870 | | $ | 1,334,350 |
| | | | | |
| Apparel Manufacturers – 1.9% | | | | | |
| Li & Fung Ltd. | | 266,000 | | $ | 455,791 |
| LVMH Moet Hennessy Louis Vuitton S.A. | | 11,970 | | | 804,217 |
| NIKE, Inc., “B” | | 31,180 | | | 1,590,180 |
| | | | | |
| | | | $ | 2,850,188 |
| | | | | |
| Biotechnology – 1.7% | | | | | |
| Actelion Ltd. (a) | | 22,445 | | $ | 1,264,131 |
| Genzyme Corp. (a) | | 20,790 | | | 1,379,832 |
| | | | | |
| | | | $ | 2,643,963 |
| | | | | |
| Broadcasting – 0.7% | | | | | |
| WPP Group PLC | | 177,906 | | $ | 1,037,057 |
| | | | | |
| Brokerage & Asset Managers – 0.5% | | | | | |
| Invesco Ltd. | | 48,800 | | $ | 704,672 |
| | | | | |
| Business Services – 0.4% | | | | | |
| Mitsubishi Corp. | | 40,000 | | $ | 561,538 |
| | | | | |
| Chemicals – 0.4% | | | | | |
| PPG Industries, Inc. | | 14,460 | | $ | 613,538 |
| | | | | |
| Computer Software – 1.7% | | | | | |
| Oracle Corp. (a) | | 80,070 | | $ | 1,419,641 |
| VeriSign, Inc. (a) | | 59,470 | | | 1,134,688 |
| | | | | |
| | | | $ | 2,554,329 |
| | | | | |
| Computer Software – Systems – 3.1% | | | | | |
| Acer, Inc. | | 792,000 | | $ | 1,038,413 |
| Apple, Inc. (a) | | 24,860 | | | 2,121,801 |
| Hewlett-Packard Co. | | 44,670 | | | 1,621,074 |
| | | | | |
| | | | $ | 4,781,288 |
| | | | | |
| Conglomerates – 2.9% | | | | | |
| Keppel Corp. Ltd. | | 439,000 | | $ | 1,330,550 |
| Siemens AG | | 41,590 | | | 3,115,110 |
| | | | | |
| | | | $ | 4,445,660 |
| | | | | |
| Construction – 2.0% | | | | | |
| CRH PLC | | 19,840 | | $ | 500,715 |
| Geberit AG | | 7,202 | | | 775,880 |
| Pulte Homes, Inc. | | 89,930 | | | 982,935 |
| Stanley Works | | 25,250 | | | 861,025 |
| | | | | |
| | | | $ | 3,120,555 |
| | | | | |
| Consumer Goods & Services – 2.1% | | | | | |
| Colgate-Palmolive Co. | | 25,880 | | $ | 1,773,815 |
| Hengan International Group Co. Ltd. | | 166,000 | | | 533,328 |
| Kimberly-Clark de Mexico S.A. de C.V., “A” | | 272,240 | | | 895,442 |
| | | | | |
| | | | $ | 3,202,585 |
| | | | | |
| Containers – 1.2% | | | | | |
| Brambles Ltd. | | 339,980 | | $ | 1,766,584 |
| | | | | |
| | | | | |
| Issuer | | Shares/Par | | Value ($) |
| | | | | |
| COMMON STOCKS – continued | | | |
| Electrical Equipment – 1.8% | | | | | |
| Danaher Corp. | | 48,350 | | $ | 2,737,094 |
| | | | | |
| Electronics – 2.6% | | | | | |
| Intel Corp. | | 69,720 | | $ | 1,022,095 |
| Samsung Electronics Co. Ltd. | | 2,895 | | | 1,051,226 |
| SanDisk Corp. (a)(l) | | 99,060 | | | 950,976 |
| Taiwan Semiconductor Manufacturing Co. Ltd., ADR | | 112,690 | | | 890,251 |
| | | | | |
| | | | $ | 3,914,548 |
| | | | | |
| Energy – Independent – 1.0% | | | | | |
| Galp Energia SGPS S.A., “B” | | 61,520 | | $ | 619,324 |
| Tullow Oil PLC | | 97,415 | | | 932,202 |
| | | | | |
| | | | $ | 1,551,526 |
| | | | | |
| Energy – Integrated – 8.9% | | | | | |
| Chevron Corp. | | 55,870 | | $ | 4,132,704 |
| Hess Corp. | | 18,540 | | | 994,486 |
| Marathon Oil Corp. | | 67,020 | | | 1,833,667 |
| Royal Dutch Shell PLC, “A” | | 124,190 | | | 3,246,367 |
| TOTAL S.A. | | 62,080 | | | 3,384,457 |
| | | | | |
| | | | $ | 13,591,681 |
| | | | | |
| Engineering – Construction – 0.9% | | | | | |
| Fluor Corp. | | 31,950 | | $ | 1,433,597 |
| | | | | |
| Food & Beverages – 5.3% | | | | | |
| Coca-Cola Co. | | 42,510 | | $ | 1,924,428 |
| Groupe Danone | | 26,203 | | | 1,581,481 |
| Nestle S.A. | | 74,114 | | | 2,921,024 |
| PepsiCo, Inc. | | 29,960 | | | 1,640,909 |
| | | | | |
| | | | $ | 8,067,842 |
| | | | | |
| Food & Drug Stores – 1.7% | | | | | |
| CVS Caremark Corp. | | 56,570 | | $ | 1,625,822 |
| Lawson, Inc. | | 15,700 | | | 905,452 |
| | | | | |
| | | | $ | 2,531,274 |
| | | | | |
| General Merchandise – 1.5% | | | | | |
| Wal-Mart Stores, Inc. | | 41,460 | | $ | 2,324,248 |
| | | | | |
| Insurance – 4.5% | | | | | |
| ACE Ltd. | | 29,540 | | $ | 1,563,257 |
| AXA | | 78,490 | | | 1,749,911 |
| Chubb Corp. | | 31,230 | | | 1,592,730 |
| MetLife, Inc. | | 58,390 | | | 2,035,475 |
| | | | | |
| | | | $ | 6,941,373 |
| | | | | |
| Internet – 0.8% | | | | | |
| Google, Inc., “A” (a) | | 4,230 | | $ | 1,301,360 |
| | | | | |
| Machinery & Tools – 1.8% | | | | | |
| Assa Abloy AB, “B” | | 87,630 | | $ | 994,291 |
| Bucyrus International, Inc. | | 47,380 | | | 877,478 |
| Glory Ltd. | | 42,400 | | | 829,289 |
| | | | | |
| | | | $ | 2,701,058 |
| | | | | |
8
Portfolio of Investments – continued
| | | | | |
| Issuer | | Shares/Par | | Value ($) |
| | | | | |
| COMMON STOCKS – continued | | | | | |
| Major Banks – 11.4% | | | | | |
| Bank of America Corp. | | 57,030 | | $ | 802,982 |
| Bank of New York Mellon Corp. | | 65,556 | | | 1,857,201 |
| Barclays PLC | | 319,030 | | | 719,229 |
| BNP Paribas | | 26,150 | | | 1,099,581 |
| DBS Group Holdings Ltd. | | 173,000 | | | 1,011,043 |
| Hang Seng Bank Ltd. | | 52,500 | | | 693,397 |
| Intesa Sanpaolo S.p.A. | | 466,682 | | | 1,680,957 |
| JPMorgan Chase & Co. | | 53,600 | | | 1,690,008 |
| Standard Chartered PLC | | 111,107 | | | 1,420,315 |
| State Street Corp. | | 41,600 | | | 1,636,128 |
| Sumitomo Mitsui Financial Group, Inc. | | 373 | | | 1,615,747 |
| Unibanco-Uniao de Bancos Brasileiros S.A., ADR | | 31,290 | | | 2,021,960 |
| Wells Fargo & Co. | | 42,350 | | | 1,248,478 |
| | | | | |
| | | | $ | 17,497,026 |
| | | | | |
| Medical Equipment – 2.8% | | | | | |
| Medtronic, Inc. | | 55,510 | | $ | 1,744,124 |
| Straumann Holding AG | | 100 | | | 17,614 |
| Synthes, Inc. | | 6,160 | | | 778,662 |
| Waters Corp. (a) | | 20,900 | | | 765,985 |
| Zimmer Holdings, Inc. (a) | | 25,350 | | | 1,024,647 |
| | | | | |
| | | | $ | 4,331,032 |
| | | | | |
| Metals & Mining – 1.5% | | | | | |
| BHP Billiton PLC | | 69,220 | | $ | 1,303,889 |
| Cameco Corp. | | 40,600 | | | 700,350 |
| Rio Tinto Ltd. | | 11,700 | | | 253,502 |
| | | | | |
| | | | $ | 2,257,741 |
| | | | | |
| Natural Gas – Distribution – 1.3% | | | | | |
| Gaz de France | | 39,540 | | $ | 1,958,298 |
| | | | | |
| Network & Telecom – 2.2% | | | | | |
| High Tech Computer Corp. | | 68,000 | | $ | 685,933 |
| Nokia Corp., ADR | | 92,170 | | | 1,437,852 |
| Research in Motion Ltd. (a) | | 32,077 | | | 1,301,685 |
| | | | | |
| | | | $ | 3,425,470 |
| | | | | |
| Oil Services – 2.0% | | | | | |
| National Oilwell Varco, Inc. (a) | | 34,640 | | $ | 846,602 |
| Saipem S.p.A. | | 68,270 | | | 1,146,346 |
| Schlumberger Ltd. | | 24,340 | | | 1,030,312 |
| | | | | |
| | | | $ | 3,023,260 |
| | | | | |
| Other Banks & Diversified Financials – 2.3% | | | |
| China Construction Bank | | 1,402,000 | | $ | 775,850 |
| UBS AG (a) | | 101,075 | | | 1,465,971 |
| Unione di Banche Italiane ScpA | | 87,760 | | | 1,270,140 |
| | | | | |
| | | | $ | 3,511,961 |
| | | | | |
| Pharmaceuticals – 6.5% | | | | | |
| Allergan, Inc. | | 51,460 | | $ | 2,074,867 |
| Merck & Co., Inc. | | 59,130 | | | 1,797,552 |
| Merck KGaA | | 31,760 | | | 2,887,541 |
| Roche Holding AG | | 20,600 | | | 3,171,034 |
| | | | | |
| | | | $ | 9,930,994 |
| | | | | |
| | | | | |
| Issuer | | Shares/Par | | Value ($) |
| | | | | |
| COMMON STOCKS – continued | | | |
| Railroad & Shipping – 1.1% | | | | | |
| East Japan Railway Co. | | 209 | | $ | 1,632,253 |
| | | | | |
| Specialty Chemicals – 1.3% | | | | | |
| Akzo Nobel N.V. | | 21,640 | | $ | 892,376 |
| Linde AG | | 9,330 | | | 789,537 |
| Praxair, Inc. | | 6,420 | | | 381,091 |
| | | | | |
| | | | $ | 2,063,004 |
| | | | | |
| Specialty Stores – 2.7% | | | | | |
| Abercrombie & Fitch Co., “A” | | 38,500 | | $ | 888,195 |
| Esprit Holdings Ltd. | | 167,500 | | | 954,755 |
| Nordstrom, Inc. | | 52,900 | | | 704,099 |
| Staples, Inc. | | 47,090 | | | 843,853 |
| Tiffany & Co. | | 30,200 | | | 713,626 |
| | | | | |
| | | | $ | 4,104,528 |
| | | | | |
| Telecommunications – Wireless – 2.7% | | | | | |
| America Movil S.A.B. de C.V., “L”, ADR | | 30,620 | | $ | 948,914 |
| Rogers Communications, Inc., “B” | | 33,910 | | | 1,020,013 |
| Vodafone Group PLC | | 1,040,490 | | | 2,094,625 |
| | | | | |
| | | | $ | 4,063,552 |
| | | | | |
| Telephone Services – 3.8% | | | | | |
| AT&T, Inc. | | 84,330 | | $ | 2,403,405 |
| BCE, Inc. | | 26,100 | | | 534,789 |
| China Unicom Ltd. | | 588,000 | | | 715,300 |
| Telefonica S.A. | | 94,170 | | | 2,110,864 |
| | | | | |
| | | | $ | 5,764,358 |
| | | | | |
| Tobacco – 0.6% | | | | | |
| Japan Tobacco, Inc. | | 299 | | $ | 990,110 |
| | | | | |
| Trucking – 1.5% | | | | | |
| FedEx Corp. | | 21,370 | | $ | 1,370,886 |
| Yamato Holdings Co. Ltd. | | 74,000 | | | 964,908 |
| | | | | |
| | | | $ | 2,335,794 |
| | | | | |
| Utilities – Electric Power – 4.0% | | | | | |
| E.ON AG | | 51,826 | | $ | 2,095,696 |
| FirstEnergy Corp. | | 24,640 | | | 1,197,011 |
| PG&E Corp. | | 37,900 | | | 1,467,109 |
| PPL Corp. | | 46,590 | | | 1,429,847 |
| | | | | |
| | | | $ | 6,189,663 |
| | | | | |
Total Common Stocks
(Identified Cost, $193,230,451) | | | | $ | 149,790,952 |
| | | | | |
| | | | | | | | | | |
| | | Strike
Price | | First
Exercise | | | | |
| | | | | | | | | | |
| RIGHTS – 0.1% | | | | | | | | | | |
| Major Banks – 0.1% | | | | | | | | | | |
| DBS Group Holdings Ltd. (1 share for 1 right) (Identified Cost, $328,714) (a) | | $ | 5.42 | | 1/06/09 | | 86,500 | | $ | 187,732 |
| | | | | | | | | | |
9
Portfolio of Investments – continued
| | | | | | |
| Issuer | | Shares/Par | | Value ($) |
| | | | | | |
| |
| REPURCHASE AGREEMENTS – 1.9% | | | |
| Goldman Sachs, 0.01%, dated 12/31/08, due 1/02/09, total to be received $1,641,001 (secured by U.S. Treasury and Federal Agency obligations and Mortgage Backed securities in a jointly traded account) | | $ | 1,641,000 | | $ | 1,641,000 |
| Morgan Stanley, 0.02%, dated 12/31/08, due 1/02/09, total to be received $1,264,001 (secured by U.S. Treasury and Federal Agency obligations and Mortgage Backed securities in a jointly traded account) | | | 1,264,000 | | | 1,264,000 |
| | | | | | |
| Total Repurchase Agreements, at Cost | | | | | $ | 2,905,000 |
| | | | | | |
| | | | | | |
| Issuer | | Shares/Par | | Value ($) | |
| | | | | | |
|
| COLLATERAL FOR SECURITIES LOANED – 0.1% | |
| Navigator Securities Lending Prime Portfolio, at Cost and Net Asset Value | | 141,417 | | $ | 141,417 | |
| | | | | | |
Total Investments
(Identified Cost, $196,605,582) | | | | $ | 153,025,101 | |
| | | | | | |
OTHER ASSETS, LESS
LIABILITIES – (0.1)% | | | | | (154,436 | ) |
| | | | | | |
| Net Assets – 100.0% | | | | $ | 152,870,665 | |
| | | | | | |
| (a) | | Non-income producing security. |
| (l) | | All or a portion of this security is on loan. |
The following abbreviations are used in this report and are defined:
| ADR | | American Depository Receipt |
See Notes to Financial Statements
10
FINANCIAL STATEMENTS | STATEMENT OF ASSETS AND LIABILITIES
This statement represents your fund’s balance sheet, which details the assets and liabilities comprising the total value of the fund.
| | | | | |
At 12/31/08 | | | | | |
Assets | | | | | |
Investments, at value, including $142,906 of securities on loan (identified cost, $196,605,582) | | $153,025,101 | | | |
Cash | | 360 | | | |
Foreign currency, at value (identified cost, $58,034) | | 58,354 | | | |
Receivable for fund shares sold | | 13,394 | | | |
Interest and dividends receivable | | 238,607 | | | |
Other assets | | 8,409 | | | |
Total assets | | | | | $153,344,225 |
Liabilities | | | | | |
Payable for fund shares reacquired | | $239,292 | | | |
Collateral for securities loaned, at value | | 141,417 | | | |
Payable to affiliates | | | | | |
Management fee | | 6,149 | | | |
Distribution fees | | 244 | | | |
Administrative services fee | | 429 | | | |
Payable for trustees’ compensation | | 263 | | | |
Accrued expenses and other liabilities | | 85,766 | | | |
Total liabilities | | | | | $473,560 |
Net assets | | | | | $152,870,665 |
Net assets consist of | | | | | |
Paid-in capital | | $375,245,133 | | | |
Unrealized appreciation (depreciation) on investments and translation of assets and liabilities in foreign currencies | | (43,582,924 | ) | | |
Accumulated net realized gain (loss) on investments and foreign currency transactions | | (181,268,463 | ) | | |
Undistributed net investment income | | 2,476,919 | | | |
Net assets | | | | | $152,870,665 |
Shares of beneficial interest outstanding | | | | | 11,502,615 |
Initial Class shares | | | | | |
Net assets | | $134,671,867 | | | |
Shares outstanding | | 10,124,567 | | | |
Net asset value per share | | | | | $13.30 |
Service Class shares | | | | | |
Net assets | | $18,198,798 | | | |
Shares outstanding | | 1,378,048 | | | |
Net asset value per share | | | | | $13.21 |
See Notes to Financial Statements
11
FINANCIAL STATEMENTS | STATEMENT OF OPERATIONS
This statement describes how much your fund earned in investment income and accrued in expenses. It also describes any gains and/or losses generated by fund operations.
| | | | | | |
| Year ended 12/31/08 | | | | | | |
| Net investment income | | | | | | |
Income | | | | | | |
Dividends | | $4,348,668 | | | | |
Interest | | 146,576 | | | | |
Foreign taxes withheld | | (100,066 | ) | | | |
Total investment income | | | | | $4,395,178 | |
| Expenses | | | | | | |
Management fee | | $1,712,581 | | | | |
Distribution fees | | 60,898 | | | | |
Administrative services fee | | 69,222 | | | | |
Trustees’ compensation | | 31,168 | | | | |
Custodian fee | | 66,256 | | | | |
Shareholder communications | | 32,999 | | | | |
Auditing fees | | 42,911 | | | | |
Legal fees | | 7,128 | | | | |
Miscellaneous | | 21,685 | | | | |
Total expenses | | | | | $2,044,848 | |
Fees paid indirectly | | (607 | ) | | | |
Net expenses | | | | | $2,044,241 | |
Net investment income | | | | | $2,350,937 | |
Realized and unrealized gain (loss) on investments and foreign currency transactions | | | | | | |
| Realized gain (loss) (identified cost basis) | | | | | | |
Investment transactions (s) | | $(35,182,708 | ) | | | |
Written option transactions | | 92,348 | | | | |
Foreign currency transactions | | 149,455 | | | | |
Net realized gain (loss) on investments and foreign currency transactions | | | | | $(34,940,905 | ) |
| Change in unrealized appreciation (depreciation) | | | | | | |
Investments | | $(63,342,384 | ) | | | |
Translation of assets and liabilities in foreign currencies | | (2,668 | ) | | | |
Net unrealized gain (loss) on investments and foreign currency translation | | | | | $(63,345,052 | ) |
Net realized and unrealized gain (loss) on investments and foreign currency | | | | | $(98,285,957 | ) |
Change in net assets from operations | | | | | $(95,935,020 | ) |
| (s) | Includes proceeds received from a non-recurring cash settlement in the amount of $1,261,180 from a litigation settlement against Enron Corp. |
See Notes to Financial Statements
12
FINANCIAL STATEMENTS | STATEMENTS OF CHANGES IN NET ASSETS
These statements describe the increases and/or decreases in net assets resulting from operations, any distributions, and any shareholder transactions.
| | | | | | |
For years ended 12/31 | | 2008 | | | 2007 | |
Change in net assets | | | | | | |
From operations | | | | | | |
Net investment income | | $2,350,937 | | | $1,485,289 | |
Net realized gain (loss) on investments and foreign currency transactions | | (34,940,905 | ) | | 46,675,729 | |
Net unrealized gain (loss) on investments and foreign currency translation | | (63,345,052 | ) | | (7,247,526 | ) |
Change in net assets from operations | | $(95,935,020 | ) | | $40,913,492 | |
Distributions declared to shareholders | | | | | | |
From net investment income | | | | | | |
Initial Class | | $(1,382,002 | ) | | $(2,461,746 | ) |
Service Class | | (91,374 | ) | | (182,290 | ) |
Total distributions declared to shareholders | | $(1,473,376 | ) | | $(2,644,036 | ) |
Change in net assets from fund share transactions | | $(46,769,926 | ) | | $(80,293,145 | ) |
Total change in net assets | | $(144,178,322 | ) | | $(42,023,689 | ) |
Net assets | | | | | | |
At beginning of period | | 297,048,987 | | | 339,072,676 | |
At end of period (including undistributed net investment income of $2,476,919 and
$1,468,436, respectively) | | $152,870,665 | | | $297,048,987 | |
See Notes to Financial Statements
13
FINANCIAL STATEMENTS | FINANCIAL HIGHLIGHTS
The financial highlights table is intended to help you understand the fund’s financial performance for the past 5 years. Certain information reflects financial results for a single fund share. The total returns in the table represent the rate by which an investor would have earned (or lost) on an investment in the fund share class (assuming reinvestment of all distributions) held for the entire period.
| | | | | | | | | | | | | | | |
| Initial Class | | Years ended 12/31 | |
| | | 2008 | | | 2007 | | | 2006 | | | 2005 | | | 2004 | |
Net asset value, beginning of period | | $21.04 | | | $18.73 | | | $17.04 | | | $15.88 | | | $13.84 | |
| Income (loss) from investment operations | | | | | | | | | | | | | | | |
Net investment income (d) | | $0.19 | | | $0.10 | | | $0.13 | | | $0.09 | | | $0.08 | |
Net realized and unrealized gain (loss) on investments
and foreign currency | | (7.81 | ) | | 2.37 | | | 1.67 | | | 1.16 | | | 2.09 | |
Total from investment operations | | $(7.62 | ) | | $2.47 | | | $1.80 | | | $1.25 | | | $2.17 | |
| Less distributions declared to shareholders | | | | | | | | | | | | | | | |
From net investment income | | $(0.12 | ) | | $(0.16 | ) | | $(0.11 | ) | | $(0.09 | ) | | $(0.13 | ) |
Net asset value, end of period | | $13.30 | | | $21.04 | | | $18.73 | | | $17.04 | | | $15.88 | |
Total return (%) (k)(s) | | (36.43 | )(t) | | 13.24 | | | 10.62 | | | 7.94 | | | 15.83 | (b) |
Ratios (%) (to average net assets)
and Supplemental data: | | | | | | | | | | | | | | | |
Expenses (f) | | 0.87 | | | 0.83 | | | 0.82 | | | 0.83 | | | 0.80 | |
Net investment income | | 1.06 | | | 0.48 | | | 0.76 | | | 0.57 | | | 0.53 | |
Portfolio turnover | | 144 | | | 84 | | | 87 | | | 92 | | | 118 | |
Net assets at end of period (000 Omitted) | | $134,672 | | | $268,217 | | | $309,757 | | | $366,831 | | | $432,318 | |
| |
| Service Class | | Years ended 12/31 | |
| | | 2008 | | | 2007 | | | 2006 | | | 2005 | | | 2004 | |
Net asset value, beginning of period | | $20.89 | | | $18.60 | | | $16.93 | | | $15.78 | | | $13.77 | |
| Income (loss) from investment operations | | | | | | | | | | | | | | | |
Net investment income (d) | | $0.14 | | | $0.05 | | | $0.09 | | | $0.05 | | | $0.04 | |
Net realized and unrealized gain (loss) on investments
and foreign currency | | (7.76 | ) | | 2.36 | | | 1.65 | | | 1.16 | | | 2.08 | |
Total from investment operations | | $(7.62 | ) | | $2.41 | | | $1.74 | | | $1.21 | | | $2.12 | |
| Less distributions declared to shareholders | | | | | | | | | | | | | | | |
From net investment income | | $(0.06 | ) | | $(0.12 | ) | | $(0.07 | ) | | $(0.06 | ) | | $(0.11 | ) |
Net asset value, end of period | | $13.21 | | | $20.89 | | | $18.60 | | | $16.93 | | | $15.78 | |
Total return (%) (k)(s) | | (36.57 | )(t) | | 12.97 | | | 10.32 | | | 7.71 | | | 15.54 | (b) |
Ratios (%) (to average net assets)
and Supplemental data: | | | | | | | | | | | | | | | |
Expenses (f) | | 1.12 | | | 1.08 | | | 1.07 | | | 1.09 | | | 1.05 | |
Net investment income | | 0.81 | | | 0.23 | | | 0.54 | | | 0.33 | | | 0.30 | |
Portfolio turnover | | 144 | | | 84 | | | 87 | | | 92 | | | 118 | |
Net assets at end of period (000 Omitted) | | $18,199 | | | $28,832 | | | $29,316 | | | $28,039 | | | $25,315 | |
| (b) | The fund’s net asset value and total return calculation include a non-recurring accrual recorded as a result of an administrative proceeding regarding disclosure of brokerage allocation practices in connection with fund sales. The non-recurring accrual resulted in an increase in the net asset value of $0.01 per share based on shares outstanding on the day the accrual was recorded. |
| (d) | Per share data is based on average shares outstanding. |
| (f) | Ratios do not reflect reductions from fees paid indirectly, if applicable. |
| (k) | The total return does not reflect expenses that apply to separate accounts. Inclusion of these charges would reduce the total return figures for all periods shown. |
| (s) | From time to time the fund may receive proceeds from litigation settlements, without which performance would be lower. |
| (t) | Excluding the effect of the proceeds received from a non-recurring litigation settlement against Enron Corp., the Initial Class and Service Class total returns for the year ended December 31, 2008 would have each been lower by approximately 0.86%. |
See Notes to Financial Statements
14
NOTES TO FINANCIAL STATEMENTS
| (1) | | Business and Organization |
MFS Global Research Portfolio (the fund) is a series of MFS Variable Insurance Trust II (the trust). The trust is organized as a Massachusetts business trust and is registered under the Investment Company Act of 1940, as amended, as an open-end management investment company. The shares of the fund are sold to variable accounts established by insurance companies to fund benefits under variable contracts issued by such companies, and qualified retirement and pension plans.
| (2) | | Significant Accounting Policies |
General – The preparation of financial statements in conformity with U.S. generally accepted accounting principles requires management to make estimates and assumptions that affect the reported amounts of assets and liabilities, and disclosure of contingent assets and liabilities at the date of the financial statements and the reported amounts of revenues and expenses during the reporting period. Actual results could differ from those estimates. The fund can invest in foreign securities, including securities of emerging market issuers. Investments in foreign securities are vulnerable to the effects of changes in the relative values of the local currency and the U.S. dollar and to the effects of changes in each country’s legal, political, and economic environment. The markets of emerging markets countries are generally more volatile than the markets of developed countries with more mature economies. All of the risks of investing in foreign securities previously described are heightened when investing in emerging markets countries.
Investment Valuations – Equity securities, including restricted equity securities, are generally valued at the last sale or official closing price as reported by a third party pricing service on the market or exchange on which they are primarily traded. For securities for which there were no sales reported that day, equity securities are generally valued at the last quoted daily bid quotation as reported by a third party pricing service on the market or exchange on which they are primarily traded. For securities held short for which there were no sales reported for the day, the position is generally valued at the last quoted daily ask quotation as reported by a third party pricing service on the market or exchange on which such securities are primarily traded. Short-term instruments with a maturity at issuance of 60 days or less may be valued at amortized cost, which approximates market value. Exchange-traded options are generally valued at the last sale or official closing price as reported by a third party pricing service on the exchange on which such options are primarily traded. Exchange-traded options for which there were no sales reported that day are generally valued at the last daily bid quotation as reported by a third party pricing service on the exchange on which such options are primarily traded. Options not traded on an exchange are generally valued at a broker-dealer bid quotation. Foreign currency options are generally valued using an external pricing model that uses market data from a third party source. Open-end investment companies are generally valued at net asset value per share. Securities and other assets generally valued on the basis of information from a third party pricing service may also be valued at a broker-dealer bid quotation. Values obtained from pricing services can utilize both dealer-supplied valuations and electronic data processing techniques, which take into account factors such as institutional-size trading in similar groups of securities, yield, quality, coupon rate, maturity, type of issue, trading characteristics, and other market data. The values of foreign securities and other assets and liabilities expressed in foreign currencies are converted to U.S. dollars using the mean of bid and asked prices for rates reported by a third party pricing service.
The Board of Trustees has delegated primary responsibility for determining or causing to be determined the value of the fund’s investments (including any fair valuation) to the adviser pursuant to valuation policies and procedures approved by the Board. If the adviser determines that reliable market quotations are not readily available, investments are valued at fair value as determined in good faith by the adviser in accordance with such procedures under the oversight of the Board of Trustees. Under the fund’s valuation policies and procedures, market quotations are not considered to be readily available for most types of debt instruments and floating rate loans and many types of derivatives. These investments are generally valued at fair value based on information from third party pricing services. In addition, investments may be valued at fair value if the adviser determines that an investment’s value has been materially affected by events occurring after the close of the exchange or market on which the investment is principally traded (such as foreign exchange or market) and prior to the determination of the fund’s net asset value, or after the halting of trading of a specific security where trading does not resume prior to the close of the exchange or market on which the security is principally traded. Events that occur on a frequent basis after foreign markets close (such as developments in foreign markets and significant movements in the U.S. markets) and prior to the determination of the fund’s net asset value may be deemed to have a material affect on the value of securities traded in foreign markets. Accordingly, the fund’s foreign equity securities may often be valued at fair value. The adviser may rely on third party pricing services or other information (such as the correlation with price movements of similar securities in the same or other markets; the type, cost and investment characteristics of the security; the business and financial condition of the issuer; and trading and other market data) to assist in determining whether to fair value and at what value to fair value an investment. The value of an investment for purposes of calculating the fund’s net asset value can differ depending on the source and method used to determine value. When fair valuation is used, the value of investments used to determine the fund’s net asset value may differ from quoted or published prices for the same investments.
15
Notes to Financial Statements – continued
The fund adopted FASB Statement No. 157, Fair Value Measurements (the “Statement”). This Statement provides a single definition of fair value, a hierarchy for measuring fair value and expanded disclosures about fair value measurements.
Various inputs are used in determining the value of the fund’s assets or liabilities carried at market value. These inputs are categorized into three broad levels. Level 1 includes quoted prices in active markets for identical assets or liabilities. Level 2 includes other significant observable market-based inputs (including quoted prices for similar securities, interest rates, prepayment speed, and credit risk). Level 3 includes unobservable inputs, which may include the adviser’s own assumptions in determining the fair value of investments. Other financial instruments are derivative instruments not reflected in total investments, such as futures, forwards, swap contracts and written options. The following is a summary of the levels used as of December 31, 2008 in valuing the fund’s assets or liabilities carried at market value:
| | | | | | | | |
| | | Level 1 | | Level 2 | | Level 3 | | Total |
| Investments in Securities | | $87,874,032 | | $65,151,069 | | $— | | $153,025,101 |
| Other Financial Instruments | | $— | | $— | | $— | | $— |
Repurchase Agreements – The fund may enter into repurchase agreements with approved counterparties. Each repurchase agreement is recorded at cost. The fund requires that the securities collateral in a repurchase transaction be transferred to a custodian. The fund monitors, on a daily basis, the value of the collateral to ensure that its value, including accrued interest, is greater than amounts owed to the fund under each such repurchase agreement. The fund and other funds managed by Massachusetts Financial Services Company (MFS), may utilize a joint trading account for the purpose of entering into one or more repurchase agreements.
Foreign Currency Translation – Purchases and sales of foreign investments, income, and expenses are converted into U.S. dollars based upon currency exchange rates prevailing on the respective dates of such transactions or on the reporting date for foreign denominated receivables and payables. Gains and losses attributable to foreign currency exchange rates on sales of securities are recorded for financial statement purposes as net realized gains and losses on investments. Gains and losses attributable to foreign exchange rate movements on receivables, payables, income and expenses are recorded for financial statement purposes as foreign currency transaction gains and losses. That portion of both realized and unrealized gains and losses on investments that results from fluctuations in foreign currency exchange rates is not separately disclosed.
Derivative Risk – The fund may invest in derivatives for hedging or non-hedging purposes. While hedging can reduce or eliminate losses, it can also reduce or eliminate gains. When the fund uses derivatives as an investment to gain market exposure, or for hedging purposes, gains and losses from derivative instruments may be substantially greater than the derivative’s original cost. Cash that has been segregated on behalf of certain derivative contracts will be reported separately on the Statement of Assets and Liabilities as restricted cash. On some over-the-counter derivatives, the fund attempts to reduce its exposure to counterparty credit risk by entering into an ISDA Master Agreement on a bilateral basis with each of the counterparties with whom it undertakes a significant volume of transactions. The ISDA Master Agreement gives the fund the right, upon an event of default by the applicable counterparty, to close out all transactions traded under such agreement and to net amounts owed under each transaction to one net amount payable by one party to the other. This right to close out and net payments across all transactions traded under the ISDA Master Agreement could result in a reduction of the fund’s credit risk to such counterparty equal to any amounts payable by the fund under the applicable transactions, if any. However, absent an event of default by the counterparty, the ISDA Master Agreement does not result in an offset of reported balance sheet assets and liabilities across transactions between the fund and the applicable counterparty. Derivative instruments include written options and purchased options.
In March 2008, FASB Statement No. 161, Disclosures about Derivative Instruments and Hedging Activities (the “Standard”) was issued, and is effective for financial statements issued for fiscal years and interim periods beginning after November 15, 2008. This Standard provides enhanced disclosures about the fund’s use of and accounting for derivative instruments and the effect of derivative instruments on the fund’s results of operations and financial position. Management is evaluating the application of the Standard to the fund, and has not at this time determined the impact, if any, resulting from the adoption of this Standard on the fund’s financial statements.
FASB Staff Position (FSP) 133-1 was implemented during the period. FSP 133-1 amends FAS 133 to require sellers of credit derivatives to make disclosures that will enable financial statement users to assess the potential effects of those credit derivatives on an entity’s financial position, financial performance and cash flows. There was no impact from implementing FSP 133-1 as the fund did not hold any of these credit derivatives at period end.
Written Options – The fund may write call or put options in exchange for a premium. The premium is initially recorded as a liability, which is subsequently adjusted to the current value of the option contract. When a written option expires, the fund realizes a gain equal to the amount of the premium received. The difference between the premium and the amount paid on effecting a closing transaction is considered a realized gain or loss. When a written call option is exercised, the premium
16
Notes to Financial Statements – continued
received is offset against the proceeds to determine the realized gain or loss. When a written put option is exercised, the premium reduces the cost basis of the security purchased by the fund. The fund, as writer of an option, may have no control over whether the underlying securities may be sold (call) or purchased (put) and, as a result, bears the market risk of an unfavorable change in the price of the securities underlying the written option. In general, written call options may serve as a partial hedge against decreases in value in the underlying securities to the extent of the premium received. Collateral, in the form of cash or securities, may be required to be held in segregated accounts with the fund’s custodian in connection with these contracts.
Written Option Transactions
| | | | | | |
| | | Number of
contracts | | | Premiums
received | |
| Outstanding, beginning of period | | — | | | $— | |
| Options written | | 482 | | | 139,119 | |
| Options closed | | (482 | ) | | (139,119 | ) |
| Outstanding, end of period | | — | | | $— | |
Purchased Options – The fund may purchase call or put options for a premium. Purchasing call options may be a hedge against an anticipated increase in the dollar cost of securities to be acquired or to increase the fund’s exposure to the underlying instrument. Purchasing put options may hedge against a decline in the value of portfolio securities. The premium paid is included as an investment in the Statement of Assets and Liabilities and is subsequently adjusted to the current value of the option. Premiums paid for purchased options which have expired are treated as realized losses on investments in the Statement of Operations. Premiums paid for purchased options which are exercised or closed are added to the amount paid or offset against the proceeds on the underlying security or financial instrument to determine the realized gain or loss. The risk of loss associated with purchased options is limited to the premium paid.
Security Loans – State Street Bank and Trust Company (“State Street”), as lending agent, may loan the securities of the fund to certain qualified institutions (the “Borrowers”) approved by the fund. The loans are collateralized by cash and/or U.S. Treasury and federal agency obligations in an amount typically at least equal to the market value of the securities loaned. State Street provides the fund with indemnification against Borrower default. The fund bears the risk of loss with respect to the investment of cash collateral. On loans collateralized by cash, the cash collateral is invested in a money market fund or short-term securities. A portion of the income generated upon investment of the collateral is remitted to the Borrowers, and the remainder is allocated between the fund and the lending agent. On loans collateralized by U.S. Treasury and/or federal agency obligations, a fee is received from the Borrower, and is allocated between the fund and the lending agent. Income from securities lending is included in interest income on the Statement of Operations. The dividend and interest income earned on the securities loaned is accounted for in the same manner as other dividend and interest income.
Indemnifications – Under the fund’s organizational documents, its officers and trustees may be indemnified against certain liabilities and expenses arising out of the performance of their duties to the fund. Additionally, in the normal course of business, the fund enters into agreements with service providers that may contain indemnification clauses. The fund’s maximum exposure under these agreements is unknown as this would involve future claims that may be made against the fund that have not yet occurred.
Investment Transactions and Income – Investment transactions are recorded on the trade date. Interest income is recorded on the accrual basis. All premium and discount is amortized or accreted for financial statement purposes in accordance with U.S. generally accepted accounting principles. Dividends received in cash are recorded on the ex-dividend date. Certain dividends from foreign securities will be recorded when the fund is informed of the dividend if such information is obtained subsequent to the ex-dividend date. Dividend and interest payments received in additional securities are recorded on the ex-dividend or ex-interest date in an amount equal to the value of the security on such date.
The fund may receive proceeds from litigation settlements. Any proceeds received from litigation involving portfolio holdings are reflected in the Statement of Operations in realized gain/loss if the security has been disposed of by the fund or in unrealized gain/loss if the security is still held by the fund. Any other proceeds from litigation not related to portfolio holdings are reflected as other income in the Statement of Operations. The fund was a participant in litigation against Enron Corp. On December 26, 2008, the fund received a cash settlement in the amount of $1,261,180.
Fees Paid Indirectly – The fund’s custody fee may be reduced according to an arrangement that measures the value of cash deposited with the custodian by the fund. This amount, for the year ended December 31, 2008, is shown as a reduction of total expenses on the Statement of Operations.
Tax Matters and Distributions – The fund intends to qualify as a regulated investment company, as defined under Subchapter M of the Internal Revenue Code, and to distribute all of its taxable income, including realized capital gains. As a
17
Notes to Financial Statements – continued
result, no provision for federal income taxes is required. Each of the fund’s federal tax returns for the prior three fiscal years remains subject to examination by the Internal Revenue Service. Foreign taxes, if any, have been accrued by the fund in the accompanying financial statements.
Distributions to shareholders are recorded on the ex-dividend date. Income and capital gain distributions are determined in accordance with income tax regulations, which may differ from U.S. generally accepted accounting principles. Certain capital accounts in the financial statements are periodically adjusted for permanent differences in order to reflect their tax character. These adjustments have no impact on net assets or net asset value per share. Temporary differences which arise from recognizing certain items of income, expense, gain or loss in different periods for financial statement and tax purposes will reverse at some time in the future. Distributions in excess of net investment income or net realized gains are temporary overdistributions for financial statement purposes resulting from differences in the recognition or classification of income or distributions for financial statement and tax purposes.
Book/tax differences primarily relate to wash sale loss deferrals and foreign currency transactions.
The tax character of distributions declared to shareholders for the last two fiscal years is as follows:
| | | | |
| | | 12/31/08 | | 12/31/07 |
| Ordinary income (including any short-term capital gains) | | $1,473,376 | | $2,644,036 |
The federal tax cost and the tax basis components of distributable earnings were as follows:
| | | |
| As of 12/31/08 | | | |
| Cost of investments | | $197,872,681 | |
| Gross appreciation | | 3,130,966 | |
| Gross depreciation | | (47,978,546 | ) |
| Net unrealized appreciation (depreciation) | | $(44,847,580 | ) |
| Undistributed ordinary income | | 2,476,919 | |
| Capital loss carryforwards | | (180,001,364 | ) |
| Other temporary differences | | (2,443 | ) |
As of December 31, 2008, the fund had capital loss carryforwards available to offset future realized gains. Such losses expire as follows:
| | | |
| 12/31/10 | | $(145,735,638 | ) |
| 12/31/16 | | (34,265,726 | ) |
| | $(180,001,364 | ) |
Multiple Classes of Shares of Beneficial Interest – The fund offers multiple classes of shares, which differ in their respective distribution fees. The fund’s income, realized and unrealized gain (loss), and common expenses are allocated to shareholders based on the daily net assets of each class. Dividends are declared separately for each class. Differences in per share dividend rates are generally due to differences in separate class expenses.
| (3) | | Transactions with Affiliates |
Investment Adviser – The fund has an investment advisory agreement with MFS to provide overall investment management and related administrative services and facilities to the fund. The management fee is computed daily and paid monthly at the following annual rates:
| | |
| First $300 million of average daily net assets | | 0.75% |
| Average daily net assets in excess of $300 million | | 0.675% |
The management fee incurred for the year ended December 31, 2008 was equivalent to an annual effective rate of 0.75% of the fund’s average daily net assets.
Distributor – MFS Fund Distributors, Inc. (MFD), a wholly-owned subsidiary of MFS, is the distributor of shares of the fund. The Trustees have adopted a distribution plan for the Service Class shares pursuant to Rule 12b-1 under the Investment Company Act of 1940.
The fund’s distribution plan provides that the fund will pay MFD distribution fees equal to 0.25% per annum of its average daily net assets attributable to Service Class shares as partial consideration for services performed and expenses incurred by MFD and financial intermediaries in connection with the sale and distribution of the fund’s Service Class shares and the sale and distribution of the variable annuity or variable life insurance contracts investing indirectly in Service Class shares. MFD may subsequently pay all, or a portion, of the distribution fees to financial intermediaries.
18
Notes to Financial Statements – continued
Shareholder Servicing Agent – MFS Service Center, Inc. (MFSC), a wholly-owned subsidiary of MFS, has contracted to provide transfer agent and recordkeeping functions in connection with the issuance, transfer, and redemption of each class of shares of the fund under a Shareholder Servicing Agent Agreement. During the year ended December 31, 2008, the fund did not pay MFSC a fee for this service.
Administrator – MFS provides certain financial, legal, shareholder communications, compliance, and other administrative services to the fund. Under an administrative services agreement, the fund partially reimburses MFS the costs incurred to provide these services. The fund is charged an annual fixed amount of $10,000 plus a fee based on average daily net assets.
The administrative services fee incurred for the year ended December 31, 2008 was equivalent to an annual effective rate of 0.0303% of the fund’s average daily net assets.
Trustees’ and Officers’ Compensation – The fund pays compensation to trustees in the form of a retainer, attendance fees, and additional compensation to the Board chairperson. The fund does not pay compensation directly to officers of the fund who are also officers of the investment adviser, all of whom receive remuneration for their services to the fund from MFS. Certain officers of the fund are officers or directors of MFS, MFD, and MFSC.
Other – This fund and certain other MFS funds (the funds) have entered into services agreements (the Agreements) which provide for payment of fees by the funds to Tarantino LLC and Griffin Compliance LLC in return for the provision of services of an Independent Chief Compliance Officer (ICCO) and Assistant ICCO, respectively, for the funds. The ICCO and Assistant ICCO are officers of the funds and the sole members of Tarantino LLC and Griffin Compliance LLC, respectively. The funds can terminate the Agreements with Tarantino LLC and Griffin Compliance LLC at any time under the terms of the Agreements. MFS has agreed to bear all expenses associated with office space, other administrative support, and supplies provided to the ICCO and Assistant ICCO. For the year ended December 31, 2008, the aggregate fees paid by the fund to Tarantino LLC and Griffin Compliance LLC were $2,117 and are included in miscellaneous expense on the Statement of Operations.
Purchases and sales of investments, other than U.S. Government securities, purchased option transactions, and short-term obligations, aggregated $329,421,336 and $374,154,648, respectively.
| (5) | | Shares of Beneficial Interest |
The fund’s Declaration of Trust permits the Trustees to issue an unlimited number of full and fractional shares of beneficial interest. Transactions in fund shares were as follows:
| | | | | | | | | | | | |
| | | Year ended 12/31/08 | | | Year ended 12/31/07 | |
| | | Shares | | | Amount | | | Shares | | | Amount | |
| Shares sold | | | | | | | | | | | | |
Initial Class | | 67,768 | | | $1,131,700 | | | 53,557 | | | $1,057,398 | |
Service Class | | 277,614 | | | 4,343,879 | | | 97,661 | | | 1,929,400 | |
| | 345,382 | | | $5,475,579 | | | 151,218 | | | $2,986,798 | |
| Shares issued to shareholders in reinvestment of distributions | | | | | | | | | | | | |
Initial Class | | 66,506 | | | $1,382,002 | | | 121,149 | | | $2,461,746 | |
Service Class | | 4,421 | | | 91,374 | | | 9,020 | | | 182,290 | |
| | 70,927 | | | $1,473,376 | | | 130,169 | | | $2,644,036 | |
| Shares reacquired | | | | | | | | | | | | |
Initial Class | | (2,756,413 | ) | | $(48,915,273 | ) | | (3,963,323 | ) | | $(79,821,096 | ) |
Service Class | | (284,061 | ) | | (4,803,608 | ) | | (302,401 | ) | | (6,102,883 | ) |
| | (3,040,474 | ) | | $(53,718,881 | ) | | (4,265,724 | ) | | $(85,923,979 | ) |
| Net change | | | | | | | | | | | | |
Initial Class | | (2,622,139 | ) | | $(46,401,571 | ) | | (3,788,617 | ) | | $(76,301,952 | ) |
Service Class | | (2,026 | ) | | (368,355 | ) | | (195,720 | ) | | (3,991,193 | ) |
| | (2,624,165 | ) | | $(46,769,926 | ) | | (3,984,337 | ) | | $(80,293,145 | ) |
The fund and other funds managed by MFS participate in a $1 billion unsecured committed line of credit provided by a syndication of banks under a credit agreement. In addition, the fund and other funds managed by MFS have established uncommitted borrowing arrangements with certain banks. Borrowings may be made for temporary financing needs. Interest is charged to each fund, based on its borrowings, generally at a rate equal to the Federal Reserve funds rate plus 0.30%. In addition, a commitment fee, based on the average daily, unused portion of the committed line of credit, is allocated among the participating funds at the end of each calendar quarter. For the year ended December 31, 2008, the fund’s commitment fee and interest expense were $1,143 and $0, respectively, and are included in miscellaneous expense on the Statement of Operations.
19
REPORT OF INDEPENDENT REGISTERED PUBLIC ACCOUNTING FIRM
To the Board of Trustees of MFS Variable Insurance Trust II and the Shareholders of
MFS Global Research Portfolio (formerly MFS Research Portfolio):
We have audited the accompanying statement of assets and liabilities, including the portfolio of investments, of MFS Global Research Portfolio (the “Fund”) (one of the portfolios comprising MFS Variable Insurance Trust II) as of December 31, 2008, and the related statement of operations for the year then ended, the statements of changes in net assets for each of the two years in the period then ended, and the financial highlights for each of the five years in the period then ended. These financial statements and financial highlights are the responsibility of the Fund’s management. Our responsibility is to express an opinion on these financial statements and financial highlights based on our audits.
We conducted our audits in accordance with the standards of the Public Company Accounting Oversight Board (United States). Those standards require that we plan and perform the audit to obtain reasonable assurance about whether the financial statements and financial highlights are free of material misstatement. The Fund is not required to have, nor were we engaged to perform, an audit of its internal control over financial reporting. Our audits included consideration of internal control over financial reporting as a basis for designing audit procedures that are appropriate in the circumstances, but not for the purpose of expressing an opinion on the effectiveness of the Fund’s internal control over financial reporting. Accordingly, we express no such opinion. An audit also includes examining, on a test basis, evidence supporting the amounts and disclosures in the financial statements, assessing the accounting principles used and significant estimates made by management, as well as evaluating the overall financial statement presentation. Our procedures included confirmation of securities owned as of December 31, 2008, by correspondence with the custodian and brokers. We believe that our audits provide a reasonable basis for our opinion.
In our opinion, the financial statements and financial highlights referred to above present fairly, in all material respects, the financial position of MFS Global Research Portfolio as of December 31, 2008, the results of its operations for the year then ended, the changes in its net assets for each of the two years in the period then ended, and the financial highlights for each of the five years in the period then ended, in conformity with accounting principles generally accepted in the United States of America.
DELOITTE & TOUCHE LLP
Boston, Massachusetts
February 17, 2009
20
TRUSTEES AND OFFICERS – IDENTIFICATION AND BACKGROUND
The Trustees and officers of the Trust, as of February 1, 2009, are listed below, together with their principal occupations during the past five years. (Their titles may have varied during that period.) The address of each Trustee and officer is 500 Boylston Street, Boston, Massachusetts 02116.
| | | | | | |
Name, Date of Birth | | Position(s) Held
with Fund | | Trustee/Officer
Since (1) | | Principal Occupations During the Past Five Years and
Other Directorships (2) |
| INTERESTED TRUSTEE | | | | |
David D. Horn (3) (born 6/07/41) | | Trustee | | April 1986 | | Private investor; Sun Life Assurance Company of Canada, Senior Vice President and General Manager for the United States (until 1997); Director (until March 2004) |
| | |
| INDEPENDENT TRUSTEES | | | | |
J. Kermit Birchfield (born 1/08/40) | | Chairman | | May 1997 | | Consultant; Century Partners, Inc. (investments), Director; Displaytech, Inc. (technology), Director; Dessin Fournir LLC (furniture manufacturer), Director (2005 to present); Intermountain Gas Company, Inc. & Intermountain Industries, Inc. (oil & gas exploration and production), Director; Site Watch LLC (software to monitor oil tanks), Managing Director (2006 to present); Juridica Investments (fund investing in judicial matters), Director (2007 to present); HPSC, Inc. (medical financing), Director (until January 2004) |
| | | |
Robert C. Bishop (born 1/13/43) | | Trustee | | May 2001 | | AutoImmune, Inc. (pharmaceutical product development), Chairman, President and Chief Executive Officer; Caliper Life Sciences Corp. (laboratory analytical instruments), Director; Millipore Corporation (purification/filtration products), Director; Waterstreet Capital (leverage buyouts), Advisory Board (August 2006 to present); Optobionics Corporation (ophthalmic devices), Director (2002 to 2007) |
| | | |
Frederick H. Dulles (born 3/12/42) | | Trustee | | May 2001 | | Ten State International Law PLLC (law firm), Of Counsel (since 2006); Prudential Carolina Real Estate, (real estate), Broker (since 2006); Free Enterprise Foundation, Inc. (research institute), Director & Secretary (until 2008); Disher, Hamrick & Myers Residential, Inc. (real estate) Broker (2005 until 2006); Frederick H. Dulles law practice (until 2006); Ten State Street LLP (law firm), Member (until 2005) |
| | | |
Marcia A. Kean (born 6/30/48) | | Trustee | | April 2005 | | Feinstein Kean Healthcare (consulting), Chief Executive Officer |
| | | |
Ronald G. Steinhart (born 6/15/40) | | Trustee | | May 2001 | | Private investor; Penske Automotive Group (automotive retailer), Director; Animal Health International, Inc. (animal health products), Director (since 2007); Texas Industries (concrete/aggregates/cement), Director (since 2007); Penson Worldwide, Inc. (securities clearance), Director (since 2006); Carreker Corporation (technology consulting) Director (until 2005); Prentiss Properties Trust (real estate investment trust), Director (until 2006) |
| | | |
Haviland Wright (born 7/21/48) | | Trustee | | May 2001 | | Profitability of Hawaii (software), Chief Development Officer (since December 2008); Elixir Technologies Corporation (software) Director (since 2005); Nano Loa Inc. (liquid crystal displays), Director |
| | |
| TRUSTEE EMERITUS | | | | |
Samuel Adams (born 10/19/25) | | Trustee Emeritus | | | | Retired; K&L Gates LLP (law firm), Of Counsel |
| | |
| OFFICERS | | | | |
Maria F. Dwyer (4) (born 12/01/58) | | President | | November 2005 | | Massachusetts Financial Services Company, Executive Vice President and Chief Regulatory Officer (since March 2004) Chief Compliance Officer (since December 2006); Fidelity Management & Research Company, Vice President (prior to March 2004); Fidelity Group of Funds, President and Treasurer (until March 2004) |
| | | |
Christopher R. Bohane (4) (born 1/18/74) | | Assistant Secretary and Assistant Clerk | | July 2005 | | Massachusetts Financial Services Company, Vice President and Senior Counsel |
| | | |
John M. Corcoran (4) (born 4/13/65) | | Treasurer | | October 2008 | | Massachusetts Financial Services Company, Senior Vice President (since October 2008); State Street Bank and Trust (financial services provider), Senior Vice President, (until September 2008) |
| | | |
Ethan D. Corey (4) (born 11/21/63) | | Assistant Secretary and Assistant Clerk | | July 2005 | | Massachusetts Financial Services Company, Senior Vice President and Associate General Counsel (since 2004); Dechert LLP (law firm), Counsel (prior to December 2004) |
| | | |
David L. DiLorenzo (4) (born 8/10/68) | | Assistant Treasurer | | July 2005 | | Massachusetts Financial Services Company, Vice President (since June 2005); JP Morgan Investor Services, Vice President (until June 2005) |
| | | |
Timothy M. Fagan (4) (born 7/10/68) | | Assistant Secretary and Assistant Clerk | | September 2005 | | Massachusetts Financial Services Company, Vice President and Senior Counsel (since September 2005); John Hancock Advisers, LLC, Vice President, Senior Attorney and Chief Compliance Officer (until August 2005) |
21
Trustees and Officers – continued
| | | | | | |
Name, Date of Birth | | Position(s) Held
with Fund | | Trustee/Officer
Since (1) | | Principal Occupations During the Past Five Years and
Other Directorships (2) |
Mark D. Fischer (4) (born 10/27/70) | | Assistant Treasurer | | July 2005 | | Massachusetts Financial Services Company, Vice President (since May 2005); JP Morgan Investment Management Company, Vice President (until May 2005) |
| | | |
Robyn L. Griffin (born 7/04/75) | | Assistant Independent Chief Compliance Officer | | August 2008 | | Griffin Compliance LLC (provider of compliance services), Principal (since August 2008); State Street Corporation (financial services provider), Mutual Fund Administration Assistant Vice President (October 2006 – July 2008); Liberty Mutual Group (insurance), Personal Market Assistant Controller (April 2006 – October 2006); Deloitte & Touche LLP (professional services firm), Senior Manager (prior to April 2006) |
| | | |
Brian E. Langenfeld (4) (born 3/07/73) | | Assistant Secretary and Assistant Clerk | | May 2006 | | Massachusetts Financial Services Company, Vice President and Senior Counsel (since May 2006); John Hancock Advisers, LLC, Assistant Vice President and Counsel (until April 2006) |
| | | |
Ellen Moynihan (4) (born 11/13/57) | | Assistant Treasurer | | May 1997 | | Massachusetts Financial Services Company, Senior Vice President |
| | | |
Susan S. Newton (4) (born 3/07/50) | | Assistant Secretary and Assistant Clerk | | May 2005 | | Massachusetts Financial Services Company, Senior Vice President and Associate General Counsel (since April 2005); John Hancock Advisers, LLC, Senior Vice President, Secretary and Chief Legal Officer (until April 2005) |
| | | |
Susan A. Pereira (4) (born 11/05/70) | | Assistant Secretary and Assistant Clerk | | July 2005 | | Massachusetts Financial Services Company, Vice President and Senior Counsel (since June 2004); Bingham McCutchen LLP (law firm), Associate (until June 2004) |
| | | |
Mark N. Polebaum (4) (born 5/01/52) | | Secretary and Clerk | | February 2006 | | Massachusetts Financial Services Company, Executive Vice President, General Counsel and Secretary (since January 2006); Wilmer Cutler Pickering Hale and Dorr LLP (law firm), Partner (until January 2006) |
| | | |
Frank L. Tarantino (born 3/07/44) | | Independent Chief Compliance Officer | | September 2004 | | Tarantino LLC (provider of compliance services), Principal (since June 2004); CRA Business Strategies Group (consulting services), Executive Vice President (until June 2004) |
| | | |
Richard S. Weitzel (4) (born 7/16/70) | | Assistant Secretary and Assistant Clerk | | October 2007 | | Massachusetts Financial Services Company, Vice President and Assistant General Counsel (since 2004); Massachusetts Department of Business and Technology, General Counsel (until April 2004) |
| | | |
James O. Yost (4) (born 6/12/60) | | Assistant Treasurer | | April 1992 | | Massachusetts Financial Services Company, Senior Vice President |
| (1) | Date first appointed to serve as Trustee/Officer of an MFS fund or a Compass variable account. Each Trustee has served continuously since appointment. |
| (2) | Directorships or trusteeships of companies required to report to the Securities and Exchange Commission (i.e., “public companies”). |
| (3) | “Interested person” of the Trust, within the meaning of the Investment Company Act of 1940 (referred to as the 1940 Act), which is the principal federal law governing investment companies like the Trust, as a result of position with Sun Life of Canada (U.S.). The address of Sun Life of Canada (U.S.) is One Sun Life Executive Park, Wellesley Hills, Massachusetts 02481. |
| (4) | “Interested person” of MFS within the meaning of the 1940 Act. The address of MFS is 500 Boylston Street, Boston, Massachusetts 02116. |
The Trust does not hold annual meetings for the purpose of electing Trustees, and Trustees are not elected for fixed terms. Each Trustee and officer holds office until his or her successor is chosen and qualified, or until his or her earlier death, resignation, retirement or removal.
All Trustees currently serve as Trustees of the Trust and have served in that capacity since originally elected or appointed. All of the Trustees are also Managers of the Compass Variable Accounts. The executive officers of the Trust hold similar offices for the Compass Variable Accounts and other funds in the MFS fund complex. As of January 1, 2009, each Trustee serves as a Trustee or Manager of 35 Accounts/Funds.
The Statement of Additional Information contains further information about the Trustees and is available without charge upon request by calling 1-800-752-7215.
| | |
Investment Adviser
Massachusetts Financial Services Company 500 Boylston Street, Boston, MA 02116-3741 | | Custodian State Street Bank and Trust 1 Lincoln Street, Boston, MA 02111-2900 |
Distributor
MFS Fund Distributors, Inc. 500 Boylston Street, Boston, MA 02116-3741 | | Independent Registered Public Accounting Firm Deloitte & Touche LLP 200 Berkeley Street, Boston, MA 02116 |
Portfolio Managers Michael Cantara
Jose Luis Garcia | | |
22
BOARD REVIEW OF INVESTMENT ADVISORY AGREEMENT
The Investment Company Act of 1940 requires that both the full Board of Trustees and a majority of the non-interested (“independent”) Trustees, voting separately, annually approve the continuation of the investment advisory agreement between MFS Variable Insurance Trust II (the “Trust”) and Massachusetts Financial Services Company (“MFS”) on behalf of the Fund. The Trustees consider matters bearing on the Fund and the advisory arrangements at their meetings throughout the year, including a review of performance data at each regular meeting. In addition, the independent Trustees met in May and again in July 2008 (“contract review meetings”) for the specific purpose of considering whether to approve the continuation of the investment advisory agreement for the Fund. The independent Trustees were assisted in their evaluation of the investment advisory agreement by independent legal counsel, from whom they received separate legal advice and with whom they met separately from MFS management during various contract review meetings. The independent Trustees were also assisted in this process by the Fund’s Independent Chief Compliance Officer, a full-time senior officer appointed by and reporting to the independent Trustees.
In connection with their deliberations, the Trustees, including the independent Trustees, considered such information and factors as they believed, in light of the legal advice furnished to them and their own business judgment, to be relevant. The investment advisory agreement was considered separately for the Fund, although the Trustees also took into account the common interests of all Funds in the Trust in their review. As described below, the Trustees considered the nature, quality, and extent of the various investment advisory, administrative, and shareholder services performed by MFS under the existing investment advisory agreement and other arrangements with the Trust.
In connection with their contract review meetings, the Trustees received and relied upon materials which included, among other items: (i) information provided by Lipper Inc. on the investment performance of the Fund for various time periods ended December 31, 2007, compared to the investment performance of a group of funds with substantially similar investment classifications/objectives (the “Lipper performance universe”), (ii) information provided by Lipper Inc. on the Fund’s advisory fees and other expenses compared to the advisory fees and other expenses of comparable funds identified by Lipper (the “Lipper expense group”), (iii) information provided by MFS on the advisory fees of comparable portfolios of its other clients, including institutional separate account and other clients, (iv) information as to whether expense waivers, reimbursements or fee “breakpoints” are observed for the Fund, (v) information regarding MFS’ financial results and financial condition, including MFS’ and certain of its affiliates’ estimated profitability from services performed for the Fund, (vi) MFS’ views regarding the outlook for the mutual fund industry and its strategic business plans, (vii) descriptions of various functions performed by MFS for the Trust, such as compliance monitoring and portfolio trading practices, and (viii) information regarding the overall organization of MFS, including information about MFS’ senior management and other personnel providing investment advisory, administrative and other services to the Fund. The comparative performance, fee and expense information prepared and provided by Lipper Inc. was not independently verified, and the independent Trustees did not independently verify any information provided to them by MFS.
The Trustees’ conclusion as to the continuation of the investment advisory agreement was based on comprehensive consideration of all information provided to the Trustees and not the result of any single factor. Some of the factors that figured particularly in the Trustees’ deliberations are described below for the Fund, while individual Trustees may have given different weight to various factors and evaluated the information presented as a whole differently than another Trustee. The Trustees recognized that the fee arrangements for the Fund reflect years of review and discussion between the independent Trustees and MFS, that certain aspects of such arrangements may receive greater scrutiny in some years than others, and that the Trustees’ conclusions may be based, in part, on their consideration of these same arrangements during the course of the year and in prior years.
Based on information provided by Lipper Inc., the Trustees compared the Fund’s total return investment performance to the performance of a peer group of funds over various time periods. The Trustees placed particular emphasis on the total return performance of the Fund’s Initial Class shares in comparison to the performance of funds in its Lipper performance universe over the one-, three- and five-year periods. The Trustees did not rely on performance results for more recent periods, including those shown elsewhere in this report.
The Trustees noted the performance of the Fund’s Initial Class shares was in the 1st quintile relative to the other funds in the Lipper Classification Index for the one-year period (the 1st quintile being the best performers and the 5th quintile being the worst performers). The total return performance of the Fund was in the 2nd quintile for the three-year period and the five-year period ended December 31, 2007, relative to the Lipper performance universe. Based on the nature and quality of services provided by MFS, the Board of Trustees concluded that the Fund’s performance was satisfactory.
In the course of their deliberations, the Trustees took into account information provided by MFS during contract review meetings, as well as during investment review meetings conducted with portfolio management personnel during the course of the year.
23
Board Review of Investment Advisory Agreement – continued
In assessing the reasonableness of the Fund’s advisory fee, the Trustees considered, among other information, the Fund’s advisory fee and the total expense ratio of the Fund’s Initial Class shares as a percentage of average daily net assets, compared to the advisory fee and total expense ratios of its peer group of funds based on information provided by Lipper Inc. The Trustees also considered the advisory fees charged by MFS to institutional accounts. In comparing these fees, the Trustees considered the generally broader scope of services provided by MFS to the Trust than those provided to institutional accounts. The Trustees also considered the higher demands placed on MFS’ investment personnel and trading infrastructure as a result of the daily cash in-flows and out-flows of the Fund, and the impact on MFS and related expenses due to the more extensive regulatory regime to which the Fund is subject, compared to institutional accounts.
In considering the fees, the Trustees noted from the Lipper data that the Fund’s effective advisory fee rate and total expense ratio were each approximately at the median of such fees and expenses of funds in the Lipper expense group. The Trustees further concluded that the existing breakpoint was sufficient to allow the Fund to benefit from economies of scale as its assets grow. The Trustees concluded that the fees were reasonable in light of the nature and quality of services provided.
The Trustees also considered information prepared by MFS relating to its costs and profits with respect to the Fund and other investment companies and accounts advised by MFS, as well as MFS’ methodologies used to determine and allocate its costs to the Fund and other accounts and products for purposes of estimating profitability.
After reviewing these and other factors described below, the Trustees concluded that the advisory fees charged to the Fund represent reasonable compensation in light of the nature and quality of the services being provided by MFS.
In addition, the Trustees considered MFS’ resources and related efforts to continue to retain, attract and motivate capable personnel to serve the Fund. The Trustees also considered the financial resources of MFS and its parent, Sun Life Financial Inc. The Trustees further considered any advantages and possible disadvantages of having an adviser which also serves other investment companies as well as institutional accounts.
The Trustees also considered the nature, quality, cost, and extent of administrative, transfer agency, and distribution services provided to the Fund by MFS and its affiliates under agreements and plans other than the investment advisory agreement, including the 12b-1 fees the Fund pays to MFS Fund Distributors, Inc., an affiliate of MFS. The Trustees also considered the nature, extent and quality of certain other services MFS performs or arranges on the Fund’s behalf, which may include securities lending programs, directed expense payment programs, class action recovery programs, and MFS’ interaction with third-party service providers, principally custodians and sub-custodians. The Trustees concluded that the various non-advisory services provided by MFS and its affiliates on behalf of the Fund were satisfactory. The Trustees also considered the benefits to MFS from the use of the Fund’s portfolio brokerage commissions to pay for research and other similar services and various other factors. Additionally, the Trustees considered so-called “fall-out benefits” to MFS such as reputational value derived from serving as investment manager to the Trust, and determined that any such benefits derived by MFS were reasonable and fair.
Based on their evaluation of factors that they deemed to be material, including those factors described above, the Board of Trustees, including a majority of the independent Trustees, concluded that the investment advisory agreement should be continued for an additional one-year period, commencing September 1, 2008.
A discussion regarding the Board’s most recent review and renewal of the fund’s Investment Advisory Agreement with MFS is available by clicking on the fund’s name under “Variable Insurance Portfolios-VIT II” in the “Products & Performance” section on the MFS Web site (mfs.com).
24
PROXY VOTING POLICIES AND INFORMATION
A general description of the MFS funds’ proxy voting policies and procedures is available without charge, upon request, by calling 1-800-225-2606, by visiting the Proxy Voting section of mfs.com or by visiting the SEC’s Web site at http://www.sec.gov.
Information regarding how the fund voted proxies relating to portfolio securities during the most recent twelve-month period ended June 30 is available without charge by visiting the Proxy Voting section of mfs.com or by visiting the SEC’s Web site at http://www.sec.gov.
QUARTERLY PORTFOLIO DISCLOSURE
The fund will file a complete schedule of portfolio holdings with the Securities and Exchange Commission (the Commission) for the first and third quarters of each fiscal year on Form N-Q. The fund’s Form N-Q may be reviewed and copied at the:
Public Reference Room
Securities and Exchange Commission
100 F Street, NE, Room 1580
Washington, D.C. 20549
Information on the operation of the Public Reference Room may be obtained by calling the Commission at 1-800-SEC-0330. The fund’s Form N-Q is available on the EDGAR database on the Commission’s Internet Web site at http://www.sec.gov, and copies of this information may be obtained, upon payment of a duplicating fee, by electronic request at the following e-mail address: publicinfo@sec.gov or by writing the Public Reference Section at the above address.
FEDERAL TAX INFORMATION (unaudited)
The following information is provided pursuant to provisions of the Internal Revenue Code.
For corporate shareholders, 100.00% of the ordinary income dividends paid during the fiscal year qualify for the corporate dividends received deduction.
25
MFS® PRIVACY NOTICE
Privacy is a concern for every investor today. At MFS Investment Management® and the MFS funds, we take this concern very seriously. We want you to understand our policies about the investment products and services that we offer, and how we protect the nonpublic personal information of investors who have a direct relationship with us and our wholly owned subsidiaries.
Throughout our business relationship, you provide us with personal information. We maintain information and records about you, your investments, and the services you use. Examples of the nonpublic personal information we maintain include
| | Ÿ | | data from investment applications and other forms |
| | Ÿ | | share balances and transactional history with us, our affiliates, or others |
| | Ÿ | | facts from a consumer reporting agency |
We do not disclose any nonpublic personal information about our customers or former customers to anyone, except as permitted by law. We may share nonpublic personal information with third parties or certain of our affiliates in connection with servicing your account or processing your transactions. We may share information with companies or financial institutions that perform marketing services on our behalf or with other financial institutions with which we have joint marketing arrangements, subject to any legal requirements.
Authorization to access your nonpublic personal information is limited to appropriate personnel who provide products, services, or information to you. We maintain physical, electronic, and procedural safeguards to help protect the personal information we collect about you.
If you have any questions about the MFS privacy policy, please call 1-800-225-2606 any business day between 8 a.m. and 8 p.m. Eastern time.
Note: If you own MFS products or receive MFS services in the name of a third party such as a bank or broker-dealer, their privacy policy may apply to you instead of ours.
26


MFS® INTERNATIONAL VALUE PORTFOLIO
The report is prepared for the general information of contract owners. It is authorized for distribution to prospective investors only when preceded or accompanied by a current prospectus.
NOT FDIC INSURED Ÿ MAY LOSE VALUE Ÿ NO BANK GUARANTEE Ÿ NOT A DEPOSIT Ÿ NOT INSURED BY ANY FEDERAL GOVERNMENT AGENCY OR NCUA/NCUSIF
LETTER FROM THE CEO

Dear Contract Owners:
The market downturns and economic setbacks of late probably rank among the worst financial declines most of us have experienced. Inevitably, people may be questioning their commitment to investing. Still, it is important to remember that downturns are an inescapable part of the business cycle. Such troughs have been seen before, and if we can use history as a guide, market recoveries typically have followed.
Recent events have clearly shown us the value of certain types of investments. In this environment, two of the hallmarks of mutual funds — transparency and liquidity — have become critically important. Unlike some other types of investments, the operations of mutual funds are relatively transparent to their shareholders. With their daily redemption feature, mutual funds also generally provide easy, convenient access to one’s money. Through these recent market upheavals, this level of liquidity enhanced the ability of mutual fund investors to respond and modify their investments as they and their advisors saw fit — a flexibility that those in less liquid investments simply did not have at their disposal.
At MFS® we take particular pride in how well mutual funds can serve investors because we invented the mutual fund in the United States. Established in 1924, Massachusetts Investors Trust was the nation’s first fund. Recent market events only reinforce what we have learned through 85 years — that mutual funds provide unique features that are important to investors in any type of market climate.
Respectfully,

Robert J. Manning
Chief Executive Officer and Chief Investment Officer
MFS Investment Management®
February 17, 2009
The opinions expressed in this letter are subject to change, may not be relied upon for investment advice, and no forecasts can be guaranteed.
Before investing, consider the fund’s investment objectives, risks, charges, and expenses. For a prospectus containing this and other information, contact your investment professional or view online. Read it carefully.
MFS Fund Distributors, Inc., 500 Boylston Street, Boston, MA 02116
1
PORTFOLIO COMPOSITION
Portfolio structure
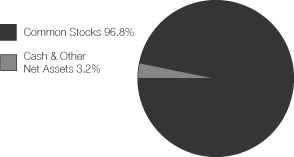
| | |
| Top ten holdings | | |
| Roche Holding AG | | 3.8% |
| Vodafone Group PLC | | 3.8% |
| TOTAL S.A. | | 3.7% |
| Nestle S.A. | | 3.6% |
| Royal Dutch Shell PLC, “A” | | 3.3% |
| Telefonica S.A. | | 2.5% |
| Brambles Ltd. | | 2.3% |
| KDDI Corp. | | 2.2% |
| Novartis AG | | 1.9% |
| Sumitomo Mitsui Financial Group, Inc. | | 1.9% |
| | |
| Equity sectors | | |
| Financial Services | | 18.7% |
| Utilities & Communications | | 12.4% |
| Consumer Staples | | 11.4% |
| Health Care | | 10.1% |
| Energy | | 9.8% |
| Leisure | | 6.9% |
| Technology | | 6.5% |
| Industrial Goods & Services | | 6.0% |
| Basic Materials | | 4.0% |
| Autos & Housing | | 3.7% |
| Transportation | | 3.2% |
| Retailing | | 2.3% |
| Special Products & Services | | 1.8% |
| |
| Country weightings | | |
| Japan | | 24.8% |
| United Kingdom | | 14.9% |
| Switzerland | | 11.5% |
| France | | 8.8% |
| Netherlands | | 8.0% |
| Germany | | 7.6% |
| Norway | | 2.5% |
| Spain | | 2.5% |
| Australia | | 2.3% |
| Other Countries | | 17.1% |
Percentages are based on net assets as of 12/31/08.
The portfolio is actively managed and current holdings may be different.
2
MANAGEMENT REVIEW
Summary of Results
For the twelve months ended December 31, 2008, Initial Class shares of the MFS International Value Portfolio (the “fund”) provided a total return of –31.41%, while Service Class shares of the fund provided a total return of –31.58%. These compare with a return of
–43.68% for the fund’s benchmark, the MSCI EAFE Value Index. Over the same period, the fund’s other benchmark, the MSCI EAFE Index, generated a return of –43.06%.
Market Environment
The U.S. economy and financial markets experienced significant deterioration and extraordinary volatility over the reporting period. U.S. economic growth slowed significantly, despite the short-term bounce from the second quarter fiscal stimulus. Strong domestic headwinds included accelerated deterioration in the housing market, anemic corporate investment, a rapidly declining job market, and a much tighter credit environment. During the period, a seemingly continuous series of tumultuous financial events hammered markets, including: the distressed sale of failing Bear Stearns to JPMorgan, the conservatorship of Government Sponsored Enterprises (GSEs) Fannie Mae and Freddie Mac, the bankruptcy of investment bank Lehman Brothers, the Federal Reserve Bank’s complex intervention of insurance company American International Group (AIG), the nationalization of several large European banks, the failure of Washington Mutual, and the distressed sale of Wachovia. As a result of this barrage of turbulent news, global equity markets pushed significantly lower and credit markets witnessed the worst dislocation since the beginning of the credit crisis. Though conditions improved towards the end of the period, the state of financial and macroeconomic dislocation remained severe.
While reasonably resilient during the first half of the period, the global economy and financial system increasingly experienced considerable negative spillovers from the U.S. slowdown. Not only did Europe and Japan show obvious signs of economic softening, the more powerful engine of global growth – emerging markets – also displayed weakening dynamics.
During the reporting period, the U.S. Federal Reserve Board cut interest rates aggressively and introduced a multitude of new lending facilities to alleviate ever-tightening credit markets, while the U.S. federal government moved quickly to design and implement a meaningful fiscal stimulus package. Although several other global central banks also cut rates, the dilemma of rising energy and food prices heightened concerns among central bankers that inflationary expectations might become unhinged despite weaker growth. Only later in the reporting period did slowing global growth result in a very precipitous decline in commodity prices, which significantly eased inflation and inflationary expectations. As inflationary concerns diminished in the face of global deleveraging, and equity and credit markets deteriorated more sharply, a coordinated rate cut marked the beginning of much more aggressive easing by the major global central banks.
Contributors to Performance
Relative to the MSCI EAFE Value Index, stock selection and an underweighted position in the financial services sector were the primary factors contributing to the fund’s outperformance. Not holding poor-performing banking and insurance services firm Fortis, a benchmark constituent, boosted relative performance.
An overweighted position in the health care sector also benefited relative returns. Strong relative contributors within this sector included Swiss pharmaceutical companies, Roche Holding (aa) and Novartis (aa), U.K.-based pharmaceutical firm GlaxoSmithKline (aa), and drug company Hisamitsu Pharmaceutical (aa) (Japan).
Overweighting the consumer staples sector was another positive area for relative performance. Our holdings of global food company Nestle (aa) (Switzerland) and household and industrial products manufacturer Kao Corp. (Japan) were top relative contributors within this sector. Shares of Nestle outpaced the benchmark as the company raised its 2008 annual sales forecast and reiterated its sales goal for 2009. The recent drop in commodity prices also aided the company’s results. Kao Corp. benefited from lower raw materials costs and their ability to maintain pricing in the domestic marketplace.
Stocks in other sectors that aided relative performance included telecommunications company KDDI Corp. (Japan) and express delivery giant Yamato Holdings (Japan).
The fund’s cash position was also a contributor to relative performance. The fund holds cash to buy new holdings and to provide liquidity. In a period when equity markets declined, as measured by the fund’s benchmark, holding cash helped performance versus the benchmark, which has no cash position.
During the reporting period, the fund’s currency exposure was a contributor to relative performance. All of MFS’ investment decisions are driven by the fundamentals of each individual opportunity and as such, it is common for our portfolios to have different currency exposure than the benchmark.
3
Management Review – continued
Detractors from Performance
Stock selection and an underweighted position in the utilities and communications sector detracted from performance relative to the benchmark. Not holding strong-performing Tokyo Electric Power Co. (Japan), France Telecom (France), and mobile telecommunications provider NTT DoCoMo (Japan) held back relative results.
Stock selection and an underweight in the energy sector also hindered relative performance. Not holding integrated oil company BP PLC (United Kingdom) hurt relative returns as the stock outperformed the benchmark over the reporting period.
Our holdings of several stocks within the financial services sector detracted from results. These included financial services group DNB Holding (Norway), French bank Credit Agricole, and financial services firm ING Groep (the Netherlands).
Elsewhere, not holding pharmaceutical firms, AstraZeneca (U.K.) and Sanofi-Aventis (France), and our investment in global zinc processor Nyrstar (aa) (Belgium) hurt relative performance.
Respectfully,
| | |
| Benjamin Stone | | Barnaby Wiener |
| Portfolio Manager | | Portfolio Manager |
Note to Shareholders: Effective November 20, 2008, Benjamin Stone became a co-manager of the fund.
| (aa) | | Security is not a benchmark constituent. |
| (g) | | Security was not held in the portfolio at period end. |
The views expressed in this report are those of the portfolio managers only through the end of the period of the report as stated on the cover and do not necessarily reflect the views of MFS or any other person in the MFS organization. These views are subject to change at any time based on market or other conditions, and MFS disclaims any responsibility to update such views. These views may not be relied upon as investment advice or an indication of trading intent on behalf of any MFS portfolio. References to specific securities are not recommendations of such securities, and may not be representative of any MFS portfolio’s current or future investments.
4
PERFORMANCE SUMMARY THROUGH 12/31/08
The following chart illustrates the historical performance of the fund in comparison to its benchmark(s). Benchmark comparisons are unmanaged; do not reflect any fees or expenses; and cannot be invested in directly. The performance of other share classes will be greater than or less than that of the class depicted below. (See Notes to Performance Summary.)
Performance data shown represents past performance and is no guarantee of future results. Investment return and principal value fluctuate so your units, when sold, may be worth more or less than the original cost; current performance may be lower or higher than quoted. The performance shown does not reflect the deduction of taxes, if any, that a contract holder would pay on fund distributions or the redemption of contract units. The returns for the fund shown also do not reflect the deduction of expenses associated with variable products, such as mortality and expense risk charges, separate account charges, and sales charges imposed by the insurance company separate accounts. Such expenses would reduce the overall returns shown.
Growth of a hypothetical $10,000 investment
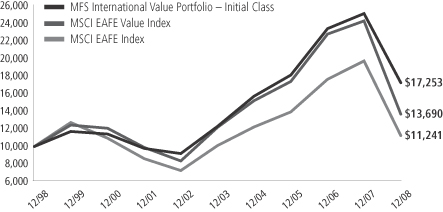
Total rates of return through 12/31/08
Average Annual Total Returns
| | | | | | | | | | | | |
| | | Share class | | Class inception date | | 1-yr | | 5-yr | | 10-yr | | |
| | | Initial Class | | 10/02/95 | | (31.41)% | | 7.01% | | 5.61% | | |
| | | Service Class | | 8/24/01 | | (31.58)% | | 6.76% | | 5.43% | | |
Comparative Benchmarks
| | | | | | | | | | | | |
| | | MSCI EAFE Value Index (f) | | (43.68)% | | 2.34% | | 3.19% | | |
| | | MSCI EAFE Index (f) | | (43.06)% | | 2.10% | | 1.18% | | |
| (f) | Source: FactSet Research Systems Inc. |
Benchmark Definitions
MSCI EAFE (Europe, Australasia, Far East) Value Index – a market capitalization-weighted index that is designed to measure equity market performance for value securities in the developed markets, excluding the U.S. and Canada.
MSCI EAFE (Europe, Australasia, Far East) Index – a market capitalization-weighted index that is designed to measure equity market performance in the developed markets, excluding the U.S. and Canada.
It is not possible to invest directly in an index.
Notes to Performance Summary
Performance for the Service Class includes the performance of the fund’s Initial Class for periods prior to their offering. Because Service Class expenses are higher than those of Initial Class, performance shown for Service Class is higher than it would have been had it been offered for the entire period. Performance has not been adjusted to take into account differences in class specific operating expenses (such as Rule 12b-1 fees). Please see the prospectus for additional information about performance and expenses.
Performance results reflect any applicable expense subsidies and waivers in effect during the periods shown. Without such subsidies and waivers the fund’s performance results would be less favorable. Please see the prospectus for complete details. All results are historical and assume the reinvestment of any dividends and capital gains distributions.
From time to time the fund may receive proceeds from litigation settlements, without which performance would be lower.
5
EXPENSE TABLE
Fund Expenses Borne by the Contract Holders During the Period,
July 1, 2008 through December 31, 2008
As a contract holder of the fund, you incur ongoing costs, including management fees; distribution (12b-1) fees; and other fund expenses. This example is intended to help you understand your ongoing costs (in dollars) of investing in the fund and to compare these costs with the ongoing costs of investing in other mutual funds.
The example is based on an investment of $1,000 invested at the beginning of the period and held for the entire period July 1, 2008 through December 31, 2008.
Actual Expenses
The first line for each share class in the following table provides information about actual account values and actual expenses. You may use the information in this line, together with the amount you invested, to estimate the expenses that you paid over the period. Simply divide your account value by $1,000 (for example, an $8,600 account value divided by $1,000 = 8.6), then multiply the result by the number in the first line under the heading entitled “Expenses Paid During Period” to estimate the expenses you paid on your account during this period.
Hypothetical Example for Comparison Purposes
The second line for each share class in the following table provides information about hypothetical account values and hypothetical expenses based on the fund’s actual expense ratio and an assumed rate of return of 5% per year before expenses, which is not the fund’s actual return. The hypothetical account values and expenses may not be used to estimate the actual ending account balance or expenses you paid for the period. You may use this information to compare the ongoing costs of investing in the fund and other funds. To do so, compare this 5% hypothetical example with the 5% hypothetical examples that appear in the shareholder reports of the other funds.
Please note that the expenses shown in the table are meant to highlight the fund’s ongoing costs only and do not take into account the fees and expenses imposed under the variable contracts through which your investment in the fund is made. Therefore, the second line for each share class in the table is useful in comparing ongoing costs associated with an investment in vehicles (such as the fund) which fund benefits under variable annuity and variable life insurance contracts and to qualified pension and retirement plans only, and will not help you determine the relative total costs of investing in the fund through variable annuity and variable life insurance contracts. If the fees and expenses imposed under the variable contracts were included, your costs would have been higher.
| | | | | | | | | | |
| Share Class | | | | Annualized
Expense Ratio | | Beginning
Account Value
7/01/08 | | Ending
Account Value
12/31/08 | | Expenses Paid
During Period (p)
7/01/08-12/31/08 |
| Initial Class | | Actual | | 1.07% | | $1,000.00 | | $732.64 | | $4.66 |
| | Hypothetical (h) | | 1.07% | | $1,000.00 | | $1,019.76 | | $5.43 |
| Service Class | | Actual | | 1.31% | | $1,000.00 | | $731.57 | | $5.70 |
| | Hypothetical (h) | | 1.31% | | $1,000.00 | | $1,018.55 | | $6.65 |
| (h) | 5% class return per year before expenses. |
| (p) | Expenses paid is equal to each class’ annualized expense ratio, as shown above, multiplied by the average account value over the period, multiplied by the number of days in the period, divided by the number of days in the year. |
6
PORTFOLIO OF INVESTMENTS – 12/31/08
The Portfolio of Investments is a complete list of all securities owned by your fund. It is categorized by broad-based asset classes.
| | | | | |
| Issuer | | Shares/Par | | Value ($) |
| | | | | |
| COMMON STOCKS – 96.8% | | | | | |
| Alcoholic Beverages – 1.8% | | | | | |
| Heineken N.V. | | 136,400 | | $ | 4,190,692 |
| | | | | |
| Apparel Manufacturers – 1.1% | | | | | |
| Compagnie Financiere Richemont S.A. | | 81,598 | | $ | 1,584,189 |
| Sanyo Shokai Ltd. (l) | | 232,400 | | | 923,063 |
| | | | | |
| | | | $ | 2,507,252 |
| | | | | |
| Broadcasting – 4.2% | | | | | |
| Fuji Television Network, Inc. | | 1,737 | | $ | 2,485,611 |
| Nippon Television Network Corp. | | 12,990 | | | 1,372,920 |
| Vivendi S.A. | | 115,840 | | | 3,771,479 |
| WPP Group PLC | | 381,790 | | | 2,225,547 |
| | | | | |
| | | | $ | 9,855,557 |
| | | | | |
| Brokerage & Asset Managers – 1.5% | | | | | |
| Daiwa Securities Group, Inc. | | 446,000 | | $ | 2,657,922 |
| Van Lanschot N.V. (l) | | 14,600 | | | 974,146 |
| | | | | |
| | | | $ | 3,632,068 |
| | | | | |
| Business Services – 1.8% | | | | | |
| Bunzl PLC | | 163,880 | | $ | 1,398,803 |
| USS Co. Ltd. | | 55,520 | | | 2,937,558 |
| | | | | |
| | | | $ | 4,336,361 |
| | | | | |
| Cable TV – 0.2% | | | | | |
| Premiere AG (a) | | 76,905 | | $ | 397,674 |
| | | | | |
| Computer Software – Systems – 1.0% | | | | | |
| Fujitsu Ltd. | | 503,000 | | $ | 2,431,233 |
| | | | | |
| Construction – 3.7% | | | | | |
| CRH PLC | | 115,520 | | $ | 2,915,455 |
| Fletcher Building Ltd. | | 261,568 | | | 882,620 |
| Geberit AG | | 28,690 | | | 3,090,809 |
| Nexity International | | 42,231 | | | 659,037 |
| Sekisui Chemical Co. Ltd. | | 211,000 | | | 1,317,942 |
| | | | | |
| | | | $ | 8,865,863 |
| | | | | |
| Consumer Goods & Services – 3.9% | | | | | |
| Henkel KGaA, IPS | | 95,990 | | $ | 3,077,561 |
| Kao Corp. | | 122,000 | | | 3,694,523 |
| KOSE Corp. | | 99,300 | | | 2,494,983 |
| | | | | |
| | | | $ | 9,267,067 |
| | | | | |
| Containers – 2.3% | | | | | |
| Brambles Ltd. | | 1,043,430 | | $ | 5,421,809 |
| | | | | |
| Electrical Equipment – 3.7% | | | | | |
| Legrand S.A. | | 215,510 | | $ | 4,141,012 |
| OMRON Corp. | | 154,800 | | | 2,077,736 |
| Spectris PLC | | 322,470 | | | 2,496,263 |
| | | | | |
| | | | $ | 8,715,011 |
| | | | | |
| Electronics – 4.2% | | | | | |
| Konica Minolta Holdings, Inc. | | 401,500 | | $ | 3,111,134 |
| Samsung Electronics Co. Ltd. | | 8,383 | | | 3,044,016 |
| | | | | |
| Issuer | | Shares/Par | | Value ($) |
| | | | | |
| COMMON STOCKS – continued | | | |
| Electronics – continued | | | | | |
| Taiwan Semiconductor Manufacturing Co. Ltd., ADR | | 367,780 | | $ | 2,905,462 |
| Venture Corp. Ltd. | | 293,000 | | | 896,235 |
| | | | | |
| | | | $ | 9,956,847 |
| | | | | |
| Energy – Independent – 0.9% | | | | | |
| INPEX Corp. | | 280 | | $ | 2,212,154 |
| | | | | |
| Energy – Integrated – 8.5% | | | | | |
| Royal Dutch Shell PLC, “A” | | 303,380 | | $ | 7,930,451 |
| Statoil A.S.A. | | 205,180 | | | 3,379,370 |
| TOTAL S.A. | | 160,880 | | | 8,770,803 |
| | | | | |
| | | | $ | 20,080,624 |
| | | | | |
| Food & Beverages – 4.6% | | | | | |
| Binggrae Co. Ltd. (a) | | 13,530 | | $ | 471,166 |
| Nestle S.A. | | 216,361 | | | 8,527,344 |
| Nong Shim Co. Ltd. (a) | | 9,659 | | | 1,885,127 |
| | | | | |
| | | | $ | 10,883,637 |
| | | | | |
| Forest & Paper Products – 0.9% | | | | | |
| M-real Oyj, “B” | | 353,020 | | $ | 344,183 |
| UPM-Kymmene Corp. | | 139,240 | | | 1,765,488 |
| | | | | |
| | | | $ | 2,109,671 |
| | | | | |
| General Merchandise – 0.5% | | | | | |
| Daiei, Inc. (a)(l) | | 176,500 | | $ | 1,130,244 |
| | | | | |
| Insurance – 4.9% | | | | | |
| Allianz SE | | 11,700 | | $ | 1,254,919 |
| Aviva PLC | | 362,190 | | | 2,050,161 |
| Catlin Group Ltd. | | 192,590 | | | 1,205,086 |
| Euler Hermes | | 14,464 | | | 708,419 |
| Hiscox Ltd. | | 272,305 | | | 1,337,033 |
| Jardine Lloyd Thompson Group PLC | | 235,370 | | | 1,486,693 |
| Muenchener Ruckvers AG | | 23,340 | | | 3,667,811 |
| | | | | |
| | | | $ | 11,710,122 |
| | | | | |
| Leisure & Toys – 1.2% | | | | | |
| Heiwa Corp. | | 72,600 | | $ | 731,304 |
| NAMCO BANDAI Holdings, Inc. (l) | | 101,500 | | | 1,112,495 |
| Sankyo Co. Ltd. | | 21,800 | | | 1,101,069 |
| | | | | |
| | | | $ | 2,944,868 |
| | | | | |
| Machinery & Tools – 2.3% | | | | | |
| Assa Abloy AB, “B” (l) | | 310,650 | | $ | 3,524,781 |
| Glory Ltd. | | 94,500 | | | 1,848,298 |
| | | | | |
| | | | $ | 5,373,079 |
| | | | | |
| Major Banks – 5.1% | | | | | |
| Credit Agricole S.A. | | 252,918 | | $ | 2,876,303 |
| Royal Bank of Scotland Group PLC | | 1,297,335 | | | 937,858 |
| Sumitomo Mitsui Financial Group, Inc. | | 1,019 | | | 4,414,064 |
Unibanco – Uniao de Bancos Brasileiros
S.A., ADR | | 22,400 | | | 1,447,488 |
| UniCredito Italiano S.p.A. | | 976,390 | | | 2,430,768 |
| | | | | |
| | | | $ | 12,106,481 |
| | | | | |
7
Portfolio of Investments – continued
| | | | | |
| Issuer | | Shares/Par | | Value ($) |
| | | | | |
| COMMON STOCKS – continued | | | |
| Medical Equipment – 0.0% | | | | | |
| Straumann Holding AG | | 100 | | $ | 17,614 |
| | | | | |
| Metals & Mining – 0.2% | | | | | |
| Nyrstar N.V. | | 118,299 | | $ | 363,142 |
| | | | | |
| Network & Telecom – 1.3% | | | | | |
| Nokia Oyj | | 204,430 | | $ | 3,169,264 |
| | | | | |
| Oil Services – 0.4% | | | | | |
| Fugro N.V. | | 30,662 | | $ | 880,287 |
| | | | | |
| Other Banks & Diversified Financials – 6.9% | | | |
| Anglo Irish Bank Corp. PLC | | 249,800 | | $ | 59,992 |
| Bangkok Bank Public Co. Ltd. | | 384,800 | | | 788,270 |
| Chiba Bank Ltd. | | 242,000 | | | 1,512,039 |
| Dah Sing Financial Holdings Ltd. | | 229,200 | | | 591,771 |
| DNB Holding A.S.A. | | 614,960 | | | 2,456,525 |
| Hachijuni Bank Ltd. | | 295,000 | | | 1,697,033 |
| ING Groep N.V. | | 384,080 | | | 4,014,858 |
| Joyo Bank Ltd. | | 319,000 | | | 1,817,388 |
| Sapporo Hokuyo Holdings, Inc. | | 220 | | | 891,459 |
| Siam City Bank Public Co. Ltd. (a) | | 3,192,800 | | | 647,189 |
| SNS REAAL Groep N.V. | | 118,680 | | | 653,063 |
| Unione di Banche Italiane ScpA | | 84,311 | | | 1,220,223 |
| | | | | |
| | | | $ | 16,349,810 |
| | | | | |
| Pharmaceuticals – 10.1% | | | | | |
| Daiichi Sankyo Co. Ltd. | | 103,100 | | $ | 2,450,647 |
| GlaxoSmithKline PLC | | 201,180 | | | 3,734,786 |
| Hisamitsu Pharmaceutical Co., Inc. | | 18,000 | | | 734,884 |
| Merck KGaA | | 38,320 | | | 3,483,960 |
| Novartis AG | | 89,400 | | | 4,479,341 |
| Roche Holding AG | | 58,100 | | | 8,943,548 |
| | | | | |
| | | | $ | 23,827,166 |
| | | | | |
| Printing & Publishing – 1.3% | | | | | |
| Reed Elsevier PLC | | 218,633 | | $ | 1,588,987 |
| Wolters Kluwer N.V. | | 77,530 | | | 1,464,224 |
| | | | | |
| | | | $ | 3,053,211 |
| | | | | |
| Real Estate – 0.3% | | | | | |
| Deutsche Wohnen AG (a) | | 60,750 | | $ | 816,166 |
| | | | | |
| Specialty Chemicals – 0.6% | | | | | |
| Clariant AG | | 105,023 | | $ | 718,482 |
| Symrise AG | | 56,272 | | | 794,775 |
| | | | | |
| | | | $ | 1,513,257 |
| | | | | |
| Specialty Stores – 0.7% | | | | | |
| Esprit Holdings Ltd. | | 181,800 | | $ | 1,036,266 |
| Praktiker Bau-und Heimwerkermaerkte Holding AG, “A” | | 62,190 | | | 684,716 |
| | | | | |
| | | | $ | 1,720,982 |
| | | | | |
| Telecommunications – Wireless – 6.5% | | | |
| America Movil S.A.B. de C.V., “L”, ADR | | 29,900 | | $ | 926,601 |
| KDDI Corp. | | 720 | | | 5,128,120 |
| SmarTone Telecommunications Holdings Ltd. | | 748,000 | | | 554,953 |
| Vodafone Group PLC | | 4,417,270 | | | 8,892,467 |
| | | | | |
| | | | $ | 15,502,141 |
| | | | | |
| | | | | |
| Issuer | | Shares/Par | | Value ($) |
| | | | | |
| COMMON STOCKS – continued | | | |
| Telephone Services – 4.3% | | | | | |
| China Unicom Ltd. | | 918,000 | | $ | 1,116,745 |
| Royal KPN N.V. | | 198,680 | | | 2,881,030 |
| Telefonica S.A. | | 260,270 | | | 5,834,073 |
| Virgin Media, Inc. | | 63,760 | | | 318,162 |
| | | | | |
| | | | $ | 10,150,010 |
| | | | | |
| Tobacco – 1.1% | | | | | |
| Japan Tobacco, Inc. | | 773 | | $ | 2,559,715 |
| | | | | |
| Trucking – 3.2% | | | | | |
| TNT N.V. | | 199,910 | | $ | 3,823,694 |
| Yamato Holdings Co. Ltd. | | 296,000 | | | 3,859,632 |
| | | | | |
| | | | $ | 7,683,326 |
| | | | | |
| Utilities – Electric Power – 1.6% | | | | | |
| E.ON AG | | 93,843 | | $ | 3,794,744 |
| | | | | |
Total Common Stocks
(Identified Cost, $321,426,211) | | | | $ | 229,529,149 |
| | | | | |
| | | | | | | | | |
| | | | |
| | | Strike
Price | | First
Exercise | | | | |
| | | | | | | | | |
| | | | |
| RIGHTS – 0.0% | | | | | | | | | |
| Broadcasting – 0.0% | | | | | | | | | |
Premiere Ag (1 share for 11 rights)
(Identified Cost, $0) (a) | | 3.76 EUR | | 12/30/08 | | 76,905 | | $ | 5,964 |
| | | | | | | | | |
| | | | | | |
| |
| REPURCHASE AGREEMENTS – 2.2% | | | |
| | | | | | |
Goldman Sachs, 0.01%, dated 12/31/08,
due 1/02/09, total to be received $5,214,003 (secured by U.S. Treasury and Federal Agency obligations and Mortgage Backed securities in a jointly traded account) | | $ | 5,214,000 | | $ | 5,214,000 |
Morgan Stanley, 0.02%, dated 12/31/08,
due 1/02/09, total to be received $7,000.01 (secured by U.S. Treasury and Federal Agency obligations and Mortgage Backed securities in a jointly traded account) | | | 7,000 | | | 7,000 |
| | | | | | |
| Total Repurchase Agreements, at Cost | | | | | $ | 5,221,000 |
| | | | | | |
|
| COLLATERAL FOR SECURITIES LOANED – 0.8% |
| Navigator Securities Lending Prime Portfolio, at Cost and Net Asset Value | | | 1,912,841 | | $ | 1,912,841 |
| | | | | | |
Total Investments
(Identified Cost, $328,560,052) | | | | | $ | 236,668,954 |
| | | | | | |
OTHER ASSETS, LESS LIABILITIES – 0.2% | | | | | | 366,329 |
| | | | | | |
| Net Assets – 100.0% | | | | | $ | 237,035,283 |
| | | | | | |
| (a) | | Non-income producing security. |
| (l) | | All or a portion of this security is on loan. |
The following abbreviations are used in this report and are defined:
| ADR | | American Depository Receipt |
| IPS | | International Preference Stock |
See Notes to Financial Statements
8
FINANCIAL STATEMENTS | STATEMENT OF ASSETS AND LIABILITIES
This statement represents your fund’s balance sheet, which details the assets and liabilities comprising the total value of the fund.
| | | | | |
At 12/31/08 | | | | | |
Assets | | | | | |
Investments, at value, including $1,799,851 of securities on loan (identified cost, $328,560,052) | | $236,668,954 | | | |
Cash | | 710 | | | |
Foreign currency, at value (identified cost, $2,137,952) | | 2,123,094 | | | |
Receivable for investments sold | | 4,103 | | | |
Receivable for fund shares sold | | 2,073 | | | |
Interest and dividends receivable | | 390,600 | | | |
Other assets | | 11,800 | | | |
Total assets | | | | | $239,201,334 |
Liabilities | | | | | |
Payable for fund shares reacquired | | $107,709 | | | |
Collateral for securities loaned, at value | | 1,912,841 | | | |
Payable to affiliates | | | | | |
Management fee | | 11,532 | | | |
Distribution fees | | 2,420 | | | |
Administrative services fee | | 703 | | | |
Payable for trustees’ compensation | | 84 | | | |
Accrued expenses and other liabilities | | 130,762 | | | |
Total liabilities | | | | | $2,166,051 |
Net assets | | | | | $237,035,283 |
Net assets consist of | | | | | |
Paid-in capital | | $331,276,994 | | | |
Unrealized appreciation (depreciation) on investments and translation of assets and liabilities in foreign currencies | | (91,926,194 | ) | | |
Accumulated net realized gain (loss) on investments and foreign currency transactions | | (9,966,697 | ) | | |
Undistributed net investment income | | 7,651,180 | | | |
Net assets | | | | | $237,035,283 |
Shares of beneficial interest outstanding | | | | | 19,855,402 |
Initial Class shares | | | | | |
Net assets | | $57,968,206 | | | |
Shares outstanding | | 4,819,790 | | | |
Net asset value per share | | | | | $12.03 |
Service Class shares | | | | | |
Net assets | | $179,067,077 | | | |
Shares outstanding | | 15,035,612 | | | |
Net asset value per share | | | | | $11.91 |
See Notes to Financial Statements
9
FINANCIAL STATEMENTS | STATEMENT OF OPERATIONS
This statement describes how much your fund earned in investment income and accrued in expenses. It also describes any gains and/or losses generated by fund operations.
| | | | | | |
| Year ended 12/31/08 | | | | | | |
| Net investment income | | | | | | |
Income | | | | | | |
Dividends | | $12,430,141 | | | | |
Interest | | 669,446 | | | | |
Foreign taxes withheld | | (1,265,320 | ) | | | |
Total investment income | | | | | $11,834,267 | |
Expenses | | | | | | |
Management fee | | $2,782,145 | | | | |
Distribution fees | | 556,150 | | | | |
Administrative services fee | | 95,823 | | | | |
Trustees’ compensation | | 37,400 | | | | |
Custodian fee | | 208,489 | | | | |
Shareholder communications | | 22,435 | | | | |
Auditing fees | | 56,876 | | | | |
Legal fees | | 7,127 | | | | |
Miscellaneous | | 22,389 | | | | |
Total expenses | | | | | $3,788,834 | |
Fees paid indirectly | | (273 | ) | | | |
Net expenses | | | | | $3,788,561 | |
Net investment income | | | | | $8,045,706 | |
Realized and unrealized gain (loss) on investments and foreign currency transactions | | | | | | |
Realized gain (loss) (identified cost basis) | | | | | | |
Investment transactions (net of $95,725 country tax) | | $(9,262,775 | ) | | | |
Foreign currency transactions | | (270,900 | ) | | | |
Net realized gain (loss) on investments and foreign currency transactions | | | | | $(9,533,675 | ) |
Change in unrealized appreciation (depreciation) | | | | | | |
Investments (net of $130,627 decrease in deferred country tax) | | $(111,632,217 | ) | | | |
Translation of assets and liabilities in foreign currencies | | (28,417 | ) | | | |
Net unrealized gain (loss) on investments and foreign currency translation | | | | | $(111,660,634 | ) |
Net realized and unrealized gain (loss) on investments and foreign currency | | | | | $(121,194,309 | ) |
Change in net assets from operations | | | | | $(113,148,603 | ) |
See Notes to Financial Statements
10
FINANCIAL STATEMENTS | STATEMENTS OF CHANGES IN NET ASSETS
These statements describe the increases and/or decreases in net assets resulting from operations, any distributions, and any shareholder transactions.
| | | | | | |
For years ended 12/31 | | 2008 | | | 2007 | |
Change in net assets | | | | | | |
From operations | | | | | | |
Net investment income | | $8,045,706 | | | $3,053,063 | |
Net realized gain (loss) on investments and foreign currency transactions | | (9,533,675 | ) | | 18,936,667 | |
Net unrealized gain (loss) on investments and foreign currency translation | | (111,660,634 | ) | | (10,499,804 | ) |
Change in net assets from operations | | $(113,148,603 | ) | | $11,489,926 | |
Distributions declared to shareholders | | | | | | |
From net investment income | | | | | | |
Initial Class | | $(918,018 | ) | | $(2,144,403 | ) |
Service Class | | (2,075,620 | ) | | (767,328 | ) |
From net realized gain on investments | | | | | | |
Initial Class | | (5,480,998 | ) | | (15,977,807 | ) |
Service Class | | (13,863,500 | ) | | (5,965,795 | ) |
Total distributions declared to shareholders | | $(22,338,136 | ) | | $(24,855,333 | ) |
Change in net assets from fund share transactions | | $31,082,596 | | | $205,823,373 | |
Total change in net assets | | $(104,404,143 | ) | | $192,457,966 | |
Net assets | | | | | | |
At beginning of period | | 341,439,426 | | | 148,981,460 | |
At end of period (including undistributed net investment income of $7,651,180 and
$2,975,812, respectively) | | $237,035,283 | | | $341,439,426 | |
See Notes to Financial Statements
11
FINANCIAL STATEMENTS | FINANCIAL HIGHLIGHTS
The financial highlights table is intended to help you understand the fund’s financial performance for the past 5 years. Certain information reflects financial results for a single fund share. The total returns in the table represent the rate by which an investor would have earned (or lost) on an investment in the fund share class (assuming reinvestment of all distributions) held for the entire period.
| | | | | | | | | | | | | | | |
| Initial Class | | Years ended 12/31 | |
| | | 2008 | | | 2007 | | | 2006 | | | 2005 | | | 2004 | |
Net asset value, beginning of period | | $18.68 | | | $20.02 | | | $17.39 | | | $15.58 | | | $12.27 | |
| Income (loss) from investment operations | | | | | | | | | | | | | | | |
Net investment income (d) | | $0.44 | | | $0.33 | | | $0.39 | | | $0.27 | | | $0.20 | |
Net realized and unrealized gain (loss) on investments
and foreign currency | | (5.94 | ) | | 1.13 | | | 4.54 | | | 2.03 | | | 3.21 | |
Total from investment operations | | $(5.50 | ) | | $1.46 | | | $4.93 | | | $2.30 | | | $3.41 | |
| Less distributions declared to shareholders | | | | | | | | | | | | | | | |
From net investment income | | $(0.16 | ) | | $(0.33 | ) | | $(0.24 | ) | | $(0.18 | ) | | $(0.10 | ) |
From net realized gain on investments | | (0.99 | ) | | (2.47 | ) | | (2.06 | ) | | (0.31 | ) | | — | |
Total distributions declared to shareholders | | $(1.15 | ) | | $(2.80 | ) | | $(2.30 | ) | | $(0.49 | ) | | $(0.10 | ) |
Net asset value, end of period | | $12.03 | | | $18.68 | | | $20.02 | | | $17.39 | | | $15.58 | |
Total return (%) (k)(s) | | (31.41 | ) | | 7.35 | | | 29.23 | | | 15.22 | | | 28.02 | (v) |
Ratios (%) (to average net assets)
and Supplemental data: | | | | | | | | | | | | | | | |
Expenses (f) | | 1.05 | | | 1.05 | | | 1.11 | | | 1.13 | | | 1.15 | |
Net investment income | | 2.82 | | | 1.67 | | | 2.09 | | | 1.67 | | | 1.52 | |
Portfolio turnover | | 44 | | | 44 | | | 55 | | | 46 | | | 65 | |
Net assets at end of period (000 Omitted) | | $57,968 | | | $117,100 | | | $134,008 | | | $108,418 | | | $84,996 | |
See Notes to Financial Statements
12
Financial Highlights – continued
| | | | | | | | | | | | | | | |
| Service Class | | Years ended 12/31 | |
| | | 2008 | | | 2007 | | | 2006 | | | 2005 | | | 2004 | |
Net asset value, beginning of period | | $18.53 | | | $19.92 | | | $17.32 | | | $15.54 | | | $12.24 | |
| Income (loss) from investment operations | | | | | | | | | | | | | | | |
Net investment income (d) | | $0.39 | | | $0.16 | | | $0.34 | | | $0.22 | | | $0.18 | |
Net realized and unrealized gain (loss) on investments
and foreign currency | | (5.87 | ) | | 1.24 | | | 4.53 | | | 2.02 | | | 3.20 | |
Total from investment operations | | $(5.48 | ) | | $1.40 | | | $4.87 | | | $2.24 | | | $3.38 | |
| Less distributions declared to shareholders | | | | | | | | | | | | | | | |
From net investment income | | $(0.15 | ) | | $(0.32 | ) | | $(0.21 | ) | | $(0.15 | ) | | $(0.08 | ) |
From net realized gain on investments | | (0.99 | ) | | (2.47 | ) | | (2.06 | ) | | (0.31 | ) | | — | |
Total distributions declared to shareholders | | $(1.14 | ) | | $(2.79 | ) | | $(2.27 | ) | | $(0.46 | ) | | $(0.08 | ) |
Net asset value, end of period | | $11.91 | | | $18.53 | | | $19.92 | | | $17.32 | | | $15.54 | |
Total return (%) (k)(s) | | (31.58 | ) | | 7.04 | | | 28.95 | | | 14.86 | | | 27.82 | (v) |
Ratios (%) (to average net assets)
and Supplemental data: | | | | | | | | | | | | | | | |
Expenses (f) | | 1.30 | | | 1.30 | | | 1.36 | | | 1.39 | | | 1.40 | |
Net investment income | | 2.52 | | | 0.87 | | | 1.84 | | | 1.37 | | | 1.31 | |
Portfolio turnover | | 44 | | | 44 | | | 55 | | | 46 | | | 65 | |
Net assets at end of period (000 Omitted) | | $179,067 | | | $224,339 | | | $14,973 | | | $10,994 | | | $6,805 | |
| (d) | Per share data is based on average shares outstanding. |
| (f) | Ratios do not reflect reductions from fees paid indirectly, if applicable. |
| (k) | The total return does not reflect expenses that apply to separate accounts. Inclusion of these charges would reduce the total return figures for all periods shown. |
| (s) | From time to time the fund may receive proceeds from litigation settlements, without which performance would be lower. |
| (v) | During the year ended December 31, 2004, the fund received a payment from the investment adviser to reimburse the fund for losses on investments not meeting the investment guidelines of the fund. If this loss had been incurred, the total returns would have been approximately 28.01% and 27.81% for the Initial Class and Service Class, respectively. |
See Notes to Financial Statements
13
NOTES TO FINANCIAL STATEMENTS
| (1) | | Business and Organization |
MFS International Value Portfolio (the fund) is a series of MFS Variable Insurance Trust II (the trust). The trust is organized as a Massachusetts business trust and is registered under the Investment Company Act of 1940, as amended, as an open-end management investment company. The shares of the fund are sold to variable accounts established by insurance companies to fund benefits under variable contracts issued by such companies, and qualified retirement and pension plans.
| (2) | | Significant Accounting Policies |
General – The preparation of financial statements in conformity with U.S. generally accepted accounting principles requires management to make estimates and assumptions that affect the reported amounts of assets and liabilities, and disclosure of contingent assets and liabilities at the date of the financial statements and the reported amounts of revenues and expenses during the reporting period. Actual results could differ from those estimates. The fund can invest in foreign securities, including securities of emerging market issuers. Investments in foreign securities are vulnerable to the effects of changes in the relative values of the local currency and the U.S. dollar and to the effects of changes in each country’s legal, political, and economic environment. The markets of emerging markets countries are generally more volatile than the markets of developed countries with more mature economies. All of the risks of investing in foreign securities previously described are heightened when investing in emerging markets countries.
In March 2008, FASB Statement No. 161, Disclosures about Derivative Instruments and Hedging Activities (the “Standard”) was issued, and is effective for financial statements issued for fiscal years and interim periods beginning after November 15, 2008. This Standard provides enhanced disclosures about the fund’s use of and accounting for derivative instruments and the effect of derivative instruments on the fund’s results of operations and financial position. Management is evaluating the application of the Standard to the fund, and has not at this time determined the impact, if any, resulting from the adoption of this Standard on the fund’s financial statements.
FASB Staff Position (FSP) 133-1 was implemented during the period. FSP 133-1 amends FAS 133 to require sellers of credit derivatives to make disclosures that will enable financial statement users to assess the potential effects of those credit derivatives on an entity’s financial position, financial performance and cash flows. There was no impact from implementing FSP 133-1 as the fund did not hold any of these credit derivatives at period end.
Investment Valuations – Equity securities, including restricted equity securities, are generally valued at the last sale or official closing price as reported by a third party pricing service on the market or exchange on which they are primarily traded. For securities for which there were no sales reported that day, equity securities are generally valued at the last quoted daily bid quotation as reported by a third party pricing service on the market or exchange on which they are primarily traded. For securities held short for which there were no sales reported for the day, the position is generally valued at the last quoted daily ask quotation as reported by a third party pricing service on the market or exchange on which such securities are primarily traded. Short-term instruments with a maturity at issuance of 60 days or less may be valued at amortized cost, which approximates market value. Open-end investment companies are generally valued at net asset value per share. Securities and other assets generally valued on the basis of information from a third party pricing service may also be valued at a broker-dealer bid quotation. Values obtained from pricing services can utilize both dealer-supplied valuations and electronic data processing techniques, which take into account factors such as institutional-size trading in similar groups of securities, yield, quality, coupon rate, maturity, type of issue, trading characteristics, and other market data. The values of foreign securities and other assets and liabilities expressed in foreign currencies are converted to U.S. dollars using the mean of bid and asked prices for rates reported by a third party pricing service.
The Board of Trustees has delegated primary responsibility for determining or causing to be determined the value of the fund’s investments (including any fair valuation) to the adviser pursuant to valuation policies and procedures approved by the Board. If the adviser determines that reliable market quotations are not readily available, investments are valued at fair value as determined in good faith by the adviser in accordance with such procedures under the oversight of the Board of Trustees. Under the fund’s valuation policies and procedures, market quotations are not considered to be readily available for most types of debt instruments and floating rate loans and many types of derivatives. These investments are generally valued at fair value based on information from third party pricing services. In addition, investments may be valued at fair value if the adviser determines that an investment’s value has been materially affected by events occurring after the close of the exchange or market on which the investment is principally traded (such as foreign exchange or market) and prior to the determination of the fund’s net asset value, or after the halting of trading of a specific security where trading does not resume prior to the close of the exchange or market on which the security is principally traded. Events that occur on a frequent basis after foreign markets close (such as developments in foreign markets and significant movements in the U.S. markets) and prior to the determination of the fund’s net asset value may be deemed to have a material affect on the value of securities traded in foreign markets. Accordingly, the fund’s foreign equity securities may often be valued at fair value. The adviser may rely on third party
14
Notes to Financial Statements – continued
pricing services or other information (such as the correlation with price movements of similar securities in the same or other markets; the type, cost and investment characteristics of the security; the business and financial condition of the issuer; and trading and other market data) to assist in determining whether to fair value and at what value to fair value an investment. The value of an investment for purposes of calculating the fund’s net asset value can differ depending on the source and method used to determine value. When fair valuation is used, the value of investments used to determine the fund’s net asset value may differ from quoted or published prices for the same investments.
The fund adopted FASB Statement No. 157, Fair Value Measurements (the “Statement”). This Statement provides a single definition of fair value, a hierarchy for measuring fair value and expanded disclosures about fair value measurements.
Various inputs are used in determining the value of the fund’s assets or liabilities carried at market value. These inputs are categorized into three broad levels. Level 1 includes quoted prices in active markets for identical assets or liabilities. Level 2 includes other significant observable market-based inputs (including quoted prices for similar securities, interest rates, prepayment speed, and credit risk). Level 3 includes unobservable inputs, which may include the adviser’s own assumptions in determining the fair value of investments. Other financial instruments are derivative instruments not reflected in total investments, such as futures, forwards, swap contracts and written options. The following is a summary of the levels used as of December 31, 2008 in valuing the fund’s assets or liabilities carried at market value:
| | | | | | | | |
| | | Level 1 | | Level 2 | | Level 3 | | Total |
| Investments in Securities | | $14,855,974 | | $221,812,980 | | $— | | $236,668,954 |
| Other Financial Instruments | | $— | | $— | | $— | | $— |
Repurchase Agreements – The fund may enter into repurchase agreements with approved counterparties. Each repurchase agreement is recorded at cost. The fund requires that the securities collateral in a repurchase transaction be transferred to a custodian. The fund monitors, on a daily basis, the value of the collateral to ensure that its value, including accrued interest, is greater than amounts owed to the fund under each such repurchase agreement. The fund and other funds managed by Massachusetts Financial Services Company (MFS), may utilize a joint trading account for the purpose of entering into one or more repurchase agreements.
Foreign Currency Translation – Purchases and sales of foreign investments, income, and expenses are converted into U.S. dollars based upon currency exchange rates prevailing on the respective dates of such transactions or on the reporting date for foreign denominated receivables and payables. Gains and losses attributable to foreign currency exchange rates on sales of securities are recorded for financial statement purposes as net realized gains and losses on investments. Gains and losses attributable to foreign exchange rate movements on receivables, payables, income and expenses are recorded for financial statement purposes as foreign currency transaction gains and losses. That portion of both realized and unrealized gains and losses on investments that results from fluctuations in foreign currency exchange rates is not separately disclosed.
Security Loans – State Street Bank and Trust Company (“State Street”), as lending agent, may loan the securities of the fund to certain qualified institutions (the “Borrowers”) approved by the fund. The loans are collateralized by cash and/or U.S. Treasury and federal agency obligations in an amount typically at least equal to the market value of the securities loaned. State Street provides the fund with indemnification against Borrower default. The fund bears the risk of loss with respect to the investment of cash collateral. On loans collateralized by cash, the cash collateral is invested in a money market fund or short-term securities. A portion of the income generated upon investment of the collateral is remitted to the Borrowers, and the remainder is allocated between the fund and the lending agent. On loans collateralized by U.S. Treasury and/or federal agency obligations, a fee is received from the Borrower, and is allocated between the fund and the lending agent. Income from securities lending is included in interest income on the Statement of Operations. The dividend and interest income earned on the securities loaned is accounted for in the same manner as other dividend and interest income.
Indemnifications – Under the fund’s organizational documents, its officers and trustees may be indemnified against certain liabilities and expenses arising out of the performance of their duties to the fund. Additionally, in the normal course of business, the fund enters into agreements with service providers that may contain indemnification clauses. The fund’s maximum exposure under these agreements is unknown as this would involve future claims that may be made against the fund that have not yet occurred.
Investment Transactions and Income – Investment transactions are recorded on the trade date. Interest income is recorded on the accrual basis. All premium and discount is amortized or accreted for financial statement purposes in accordance with U.S. generally accepted accounting principles. Dividends received in cash are recorded on the ex-dividend date. Certain dividends from foreign securities will be recorded when the fund is informed of the dividend if such information is obtained subsequent to the ex-dividend date. Dividend and interest payments received in additional securities are recorded on the ex-dividend or ex-interest date in an amount equal to the value of the security on such date.
15
Notes to Financial Statements – continued
The fund may receive proceeds from litigation settlements. Any proceeds received from litigation involving portfolio holdings are reflected in the Statement of Operations in realized gain/loss if the security has been disposed of by the fund or in unrealized gain/loss if the security is still held by the fund. Any other proceeds from litigation not related to portfolio holdings are reflected as other income in the Statement of Operations.
Fees Paid Indirectly – The fund’s custody fee may be reduced according to an arrangement that measures the value of cash deposited with the custodian by the fund. This amount, for the year ended December 31, 2008, is shown as a reduction of total expenses on the Statement of Operations.
Tax Matters and Distributions – The fund intends to qualify as a regulated investment company, as defined under Subchapter M of the Internal Revenue Code, and to distribute all of its taxable income, including realized capital gains. As a result, no provision for federal income tax is required. Each of the fund’s federal tax returns for the prior three fiscal years remains subject to examination by the Internal Revenue Service. Foreign taxes, if any, have been accrued by the fund in the accompanying financial statements.
Distributions to shareholders are recorded on the ex-dividend date. Income and capital gain distributions are determined in accordance with income tax regulations, which may differ from U.S. generally accepted accounting principles. Certain capital accounts in the financial statements are periodically adjusted for permanent differences in order to reflect their tax character. These adjustments have no impact on net assets or net asset value per share. Temporary differences which arise from recognizing certain items of income, expense, gain or loss in different periods for financial statement and tax purposes will reverse at some time in the future. Distributions in excess of net investment income or net realized gains are temporary overdistributions for financial statement purposes resulting from differences in the recognition or classification of income or distributions for financial statement and tax purposes.
Book/tax differences primarily relate to wash sale loss deferrals, foreign currency transactions, and foreign taxes.
The tax character of distributions declared to shareholders for the last two fiscal years is as follows:
| | | | |
| | | 12/31/08 | | 12/31/07 |
| Ordinary income (including any short-term capital gains) | | $7,394,194 | | $7,195,412 |
| Long-term capital gain | | 14,943,942 | | 17,659,921 |
| Total distributions | | $22,338,136 | | $24,855,333 |
The federal tax cost and the tax basis components of distributable earnings were as follows:
| | | |
| As of 12/31/08 | | | |
| Cost of investments | | $331,081,908 | |
| Gross appreciation | | 2,961,178 | |
| Gross depreciation | | (97,374,132 | ) |
| Net unrealized appreciation (depreciation) | | $(94,412,954 | ) |
| Undistributed ordinary income | | 7,653,874 | |
| Capital loss carryforwards | | (7,444,841 | ) |
| Other temporary differences | | (37,790 | ) |
As of December 31, 2008, the fund had capital loss carryforwards available to offset future realized gains. Such losses expire as follows:
Multiple Classes of Shares of Beneficial Interest – The fund offers multiple classes of shares, which differ in their respective distribution fees. The fund’s income, realized and unrealized gain (loss), and common expenses are allocated to shareholders based on the daily net assets of each class. Dividends are declared separately for each class. Differences in per share dividend rates are generally due to differences in separate class expenses.
| (3) | | Transactions with Affiliates |
Investment Adviser – The fund has an investment advisory agreement with MFS to provide overall investment management and related administrative services and facilities to the fund. The management fee is computed daily and paid monthly at the following annual rates:
| | |
| First $1 billion of average daily net assets | | 0.90% |
| Next $1 billion of average daily net assets | | 0.80% |
| Average daily net assets in excess of $2 billion | | 0.70% |
The management fee incurred for the year ended December 31, 2008 was equivalent to an annual effective rate of 0.90% of the fund’s average daily net assets.
16
Notes to Financial Statements – continued
Distributor – MFS Fund Distributors, Inc. (MFD), a wholly-owned subsidiary of MFS, is the distributor of shares of the fund. The Trustees have adopted a distribution plan for the Service Class shares pursuant to Rule 12b-1 under the Investment Company Act of 1940.
The fund’s distribution plan provides that the fund will pay MFD distribution fees equal to 0.25% per annum of its average daily net assets attributable to Service Class shares as partial consideration for services performed and expenses incurred by MFD and financial intermediaries in connection with the sale and distribution of the fund’s Service Class shares and the sale and distribution of the variable annuity or variable life insurance contracts investing indirectly in Service Class shares. MFD may subsequently pay all, or a portion, of the distribution fees to financial intermediaries.
Shareholder Servicing Agent – MFS Service Center, Inc. (MFSC), a wholly-owned subsidiary of MFS, has contracted to provide transfer agent and recordkeeping functions in connection with the issuance, transfer, and redemption of each class of shares of the fund under a Shareholder Servicing Agent Agreement. During the year ended December 31, 2008, the fund did not pay MFSC a fee for this service.
Administrator – MFS provides certain financial, legal, shareholder communications, compliance, and other administrative services to the fund. Under an administrative services agreement, the fund partially reimburses MFS the costs incurred to provide these services. The fund is charged an annual fixed amount of $10,000 plus a fee based on average daily net assets.
The administrative services fee incurred for the year ended December 31, 2008 was equivalent to an annual effective rate of 0.0310% of the fund’s average daily net assets.
Trustees’ and Officers’ Compensation – The fund pays compensation to trustees in the form of a retainer, attendance fees, and additional compensation to the Board chairperson. The fund does not pay compensation directly to officers of the fund who are also officers of the investment adviser, all of whom receive remuneration for their services to the fund from MFS. Certain officers of the fund are officers or directors of MFS, MFD, and MFSC.
Other – This fund and certain other MFS funds (the funds) have entered into services agreements (the Agreements) which provide for payment of fees by the funds to Tarantino LLC and Griffin Compliance LLC in return for the provision of services of an Independent Chief Compliance Officer (ICCO) and Assistant ICCO, respectively, for the funds. The ICCO and Assistant ICCO are officers of the funds and the sole members of Tarantino LLC and Griffin Compliance LLC, respectively. The funds can terminate the Agreements with Tarantino LLC and Griffin Compliance LLC at any time under the terms of the Agreements. MFS has agreed to bear all expenses associated with office space, other administrative support, and supplies provided to the ICCO and Assistant ICCO. For the year ended December 31, 2008, the aggregate fees paid by the fund to Tarantino LLC and Griffin Compliance LLC were $2,947 and are included in miscellaneous expense on the Statement of Operations.
Purchases and sales of investments, other than U.S. Government securities, purchased option transactions, and short-term obligations, aggregated $158,044,231 and $133,265,927, respectively.
| (5) | | Shares of Beneficial Interest |
The fund’s Declaration of Trust permits the Trustees to issue an unlimited number of full and fractional shares of beneficial interest. Transactions in fund shares were as follows:
| | | | | | | | | | | | |
| | | Year ended 12/31/08 | | | Year ended 12/31/07 | |
| | | Shares | | | Amount | | | Shares | | | Amount | |
| Shares sold | | | | | | | | | | | | |
Initial Class | | 26,115 | | | $403,755 | | | 225,865 | | | $4,442,766 | |
Service Class | | 3,341,977 | | | 55,071,189 | | | 11,033,820 | | | 208,319,338 | |
| | 3,368,092 | | | $55,474,944 | | | 11,259,685 | | | $212,762,104 | |
| Shares issued to shareholders in reinvestment of distributions | | | | | | | | | | | | |
Initial Class | | 360,711 | | | $6,399,016 | | | 972,743 | | | $18,122,210 | |
Service Class | | 905,632 | | | 15,939,120 | | | 363,560 | | | 6,733,123 | |
| | 1,266,343 | | | $22,338,136 | | | 1,336,303 | | | $24,855,333 | |
| Shares reacquired | | | | | | | | | | | | |
Initial Class | | (1,836,376 | ) | | $(28,618,120 | ) | | (1,621,370 | ) | | $(30,942,121 | ) |
Service Class | | (1,316,816 | ) | | (18,112,364 | ) | | (44,135 | ) | | (851,943 | ) |
| | (3,153,192 | ) | | $(46,730,484 | ) | | (1,665,505 | ) | | $(31,794,064 | ) |
| Net change | | | | | | | | | | | | |
Initial Class | | (1,449,550 | ) | | $(21,815,349 | ) | | (422,762 | ) | | $(8,377,145 | ) |
Service Class | | 2,930,793 | | | 52,897,945 | | | 11,353,245 | | | 214,200,518 | |
| | 1,481,243 | | | $31,082,596 | | | 10,930,483 | | | $205,823,373 | |
17
Notes to Financial Statements – continued
The fund and other funds managed by MFS participate in a $1 billion unsecured committed line of credit provided by a syndication of banks under a credit agreement. In addition, the fund and other funds managed by MFS have established uncommitted borrowing arrangements with certain banks. Borrowings may be made for temporary financing needs. Interest is charged to each fund, based on its borrowings, generally at a rate equal to the Federal Reserve funds rate plus 0.30%. In addition, a commitment fee, based on the average daily, unused portion of the committed line of credit, is allocated among the participating funds at the end of each calendar quarter. For the year ended December 31, 2008, the fund’s commitment fee and interest expense were $1,985 and $0, respectively, and are included in miscellaneous expense on the Statement of Operations.
18
REPORT OF INDEPENDENT REGISTERED PUBLIC ACCOUNTING FIRM
To the Board of Trustees of MFS Variable Insurance Trust II and the Shareholders of
MFS International Value Portfolio:
We have audited the accompanying statement of assets and liabilities, including the portfolio of investments, of MFS International Value Portfolio (the “Fund”) (one of the portfolios comprising MFS Variable Insurance Trust II) as of December 31, 2008, and the related statement of operations for the year then ended, the statements of changes in net assets for each of the two years in the period then ended, and the financial highlights for each of the five years in the period then ended. These financial statements and financial highlights are the responsibility of the Fund’s management. Our responsibility is to express an opinion on these financial statements and financial highlights based on our audits.
We conducted our audits in accordance with the standards of the Public Company Accounting Oversight Board (United States). Those standards require that we plan and perform the audit to obtain reasonable assurance about whether the financial statements and financial highlights are free of material misstatement. The Fund is not required to have, nor were we engaged to perform, an audit of its internal control over financial reporting. Our audits included consideration of internal control over financial reporting as a basis for designing audit procedures that are appropriate in the circumstances, but not for the purpose of expressing an opinion on the effectiveness of the Fund’s internal control over financial reporting. Accordingly, we express no such opinion. An audit also includes examining, on a test basis, evidence supporting the amounts and disclosures in the financial statements, assessing the accounting principles used and significant estimates made by management, as well as evaluating the overall financial statement presentation. Our procedures included confirmation of securities owned as of December 31, 2008, by correspondence with the custodian and brokers. We believe that our audits provide a reasonable basis for our opinion.
In our opinion, the financial statements and financial highlights referred to above present fairly, in all material respects, the financial position of MFS International Value Portfolio as of December 31, 2008, the results of its operations for the year then ended, the changes in its net assets for each of the two years in the period then ended, and the financial highlights for each of the five years in the period then ended, in conformity with accounting principles generally accepted in the United States of America.
DELOITTE & TOUCHE LLP
Boston, Massachusetts
February 17, 2009
19
TRUSTEES AND OFFICERS – IDENTIFICATION AND BACKGROUND
The Trustees and officers of the Trust, as of February 1, 2009, are listed below, together with their principal occupations during the past five years. (Their titles may have varied during that period.) The address of each Trustee and officer is 500 Boylston Street, Boston, Massachusetts 02116.
| | | | | | |
Name, Date of Birth | | Position(s) Held
with Fund | | Trustee/Officer
Since (1) | | Principal Occupations During the Past Five Years and
Other Directorships (2) |
| INTERESTED TRUSTEE | | | | |
David D. Horn (3) (born 6/07/41) | | Trustee | | April 1986 | | Private investor; Sun Life Assurance Company of Canada, Senior Vice President and General Manager for the United States (until 1997); Director (until March 2004) |
| | |
| INDEPENDENT TRUSTEES | | | | |
J. Kermit Birchfield (born 1/08/40) | | Chairman | | May 1997 | | Consultant; Century Partners, Inc. (investments), Director; Displaytech, Inc. (technology), Director; Dessin Fournir LLC (furniture manufacturer), Director (2005 to present); Intermountain Gas Company, Inc. & Intermountain Industries, Inc. (oil & gas exploration and production), Director; Site Watch LLC (software to monitor oil tanks), Managing Director (2006 to present); Juridica Investments (fund investing in judicial matters), Director (2007 to present); HPSC, Inc. (medical financing), Director (until January 2004) |
| | | |
Robert C. Bishop (born 1/13/43) | | Trustee | | May 2001 | | AutoImmune, Inc. (pharmaceutical product development), Chairman, President and Chief Executive Officer; Caliper Life Sciences Corp. (laboratory analytical instruments), Director; Millipore Corporation (purification/filtration products), Director; Waterstreet Capital (leverage buyouts), Advisory Board (August 2006 to present); Optobionics Corporation (ophthalmic devices), Director (2002 to 2007) |
| | | |
Frederick H. Dulles (born 3/12/42) | | Trustee | | May 2001 | | Ten State International Law PLLC (law firm), Of Counsel (since 2006); Prudential Carolina Real Estate, (real estate), Broker (since 2006); Free Enterprise Foundation, Inc. (research institute), Director & Secretary (until 2008); Disher, Hamrick & Myers Residential, Inc. (real estate) Broker (2005 until 2006); Frederick H. Dulles law practice (until 2006); Ten State Street LLP (law firm), Member (until 2005) |
| | | |
Marcia A. Kean (born 6/30/48) | | Trustee | | April 2005 | | Feinstein Kean Healthcare (consulting), Chief Executive Officer |
| | | |
Ronald G. Steinhart (born 6/15/40) | | Trustee | | May 2001 | | Private investor; Penske Automotive Group (automotive retailer), Director; Animal Health International, Inc. (animal health products), Director (since 2007); Texas Industries (concrete/aggregates/cement), Director (since 2007); Penson Worldwide, Inc. (securities clearance), Director (since 2006); Carreker Corporation (technology consulting) Director (until 2005); Prentiss Properties Trust (real estate investment trust), Director (until 2006) |
| | | |
Haviland Wright (born 7/21/48) | | Trustee | | May 2001 | | Profitability of Hawaii (software), Chief Development Officer (since December 2008); Elixir Technologies Corporation (software) Director (since 2005); Nano Loa Inc. (liquid crystal displays), Director |
| | |
| TRUSTEE EMERITUS | | | | |
Samuel Adams (born 10/19/25) | | Trustee Emeritus | | | | Retired; K&L Gates LLP (law firm), Of Counsel |
| | |
| OFFICERS | | | | |
Maria F. Dwyer (4) (born 12/01/58) | | President | | November 2005 | | Massachusetts Financial Services Company, Executive Vice President and Chief Regulatory Officer (since March 2004) Chief Compliance Officer (since December 2006); Fidelity Management & Research Company, Vice President (prior to March 2004); Fidelity Group of Funds, President and Treasurer (until March 2004) |
| | | |
Christopher R. Bohane (4) (born 1/18/74) | | Assistant Secretary and Assistant Clerk | | July 2005 | | Massachusetts Financial Services Company, Vice President and Senior Counsel |
| | | |
John M. Corcoran (4) (born 4/13/65) | | Treasurer | | October 2008 | | Massachusetts Financial Services Company, Senior Vice President (since October 2008); State Street Bank and Trust (financial services provider), Senior Vice President, (until September 2008) |
| | | |
Ethan D. Corey (4) (born 11/21/63) | | Assistant Secretary and Assistant Clerk | | July 2005 | | Massachusetts Financial Services Company, Senior Vice President and Associate General Counsel (since 2004); Dechert LLP (law firm), Counsel (prior to December 2004) |
| | | |
David L. DiLorenzo (4) (born 8/10/68) | | Assistant Treasurer | | July 2005 | | Massachusetts Financial Services Company, Vice President (since June 2005); JP Morgan Investor Services, Vice President (until June 2005) |
| | | |
Timothy M. Fagan (4) (born 7/10/68) | | Assistant Secretary and Assistant Clerk | | September 2005 | | Massachusetts Financial Services Company, Vice President and Senior Counsel (since September 2005); John Hancock Advisers, LLC, Vice President, Senior Attorney and Chief Compliance Officer (until August 2005) |
20
Trustees and Officers – continued
| | | | | | |
Name, Date of Birth | | Position(s) Held
with Fund | | Trustee/Officer
Since (1) | | Principal Occupations During the Past Five Years and
Other Directorships (2) |
Mark D. Fischer (4) (born 10/27/70) | | Assistant Treasurer | | July 2005 | | Massachusetts Financial Services Company, Vice President (since May 2005); JP Morgan Investment Management Company, Vice President (until May 2005) |
| | | |
Robyn L. Griffin (born 7/04/75) | | Assistant Independent Chief Compliance Officer | | August 2008 | | Griffin Compliance LLC (provider of compliance services), Principal (since August 2008); State Street Corporation (financial services provider), Mutual Fund Administration Assistant Vice President (October 2006 – July 2008); Liberty Mutual Group (insurance), Personal Market Assistant Controller (April 2006 – October 2006); Deloitte & Touche LLP (professional services firm), Senior Manager (prior to April 2006) |
| | | |
Brian E. Langenfeld (4) (born 3/07/73) | | Assistant Secretary and Assistant Clerk | | May 2006 | | Massachusetts Financial Services Company, Vice President and Senior Counsel (since May 2006); John Hancock Advisers, LLC, Assistant Vice President and Counsel (until April 2006) |
| | | |
Ellen Moynihan (4) (born 11/13/57) | | Assistant Treasurer | | May 1997 | | Massachusetts Financial Services Company, Senior Vice President |
| | | |
Susan S. Newton (4) (born 3/07/50) | | Assistant Secretary and Assistant Clerk | | May 2005 | | Massachusetts Financial Services Company, Senior Vice President and Associate General Counsel (since April 2005); John Hancock Advisers, LLC, Senior Vice President, Secretary and Chief Legal Officer (until April 2005) |
| | | |
Susan A. Pereira (4) (born 11/05/70) | | Assistant Secretary and Assistant Clerk | | July 2005 | | Massachusetts Financial Services Company, Vice President and Senior Counsel (since June 2004); Bingham McCutchen LLP (law firm), Associate (until June 2004) |
| | | |
Mark N. Polebaum (4) (born 5/01/52) | | Secretary and Clerk | | February 2006 | | Massachusetts Financial Services Company, Executive Vice President, General Counsel and Secretary (since January 2006); Wilmer Cutler Pickering Hale and Dorr LLP (law firm), Partner (until January 2006) |
| | | |
Frank L. Tarantino (born 3/07/44) | | Independent Chief Compliance Officer | | September 2004 | | Tarantino LLC (provider of compliance services), Principal (since June 2004); CRA Business Strategies Group (consulting services), Executive Vice President (until June 2004) |
| | | |
Richard S. Weitzel (4) (born 7/16/70) | | Assistant Secretary and Assistant Clerk | | October 2007 | | Massachusetts Financial Services Company, Vice President and Assistant General Counsel (since 2004); Massachusetts Department of Business and Technology, General Counsel (until April 2004) |
| | | |
James O. Yost (4) (born 6/12/60) | | Assistant Treasurer | | April 1992 | | Massachusetts Financial Services Company, Senior Vice President |
| (1) | Date first appointed to serve as Trustee/Officer of an MFS fund or a Compass variable account. Each Trustee has served continuously since appointment. |
| (2) | Directorships or trusteeships of companies required to report to the Securities and Exchange Commission (i.e., “public companies”). |
| (3) | “Interested person” of the Trust, within the meaning of the Investment Company Act of 1940 (referred to as the 1940 Act), which is the principal federal law governing investment companies like the Trust, as a result of position with Sun Life of Canada (U.S.). The address of Sun Life of Canada (U.S.) is One Sun Life Executive Park, Wellesley Hills, Massachusetts 02481. |
| (4) | “Interested person” of MFS within the meaning of the 1940 Act. The address of MFS is 500 Boylston Street, Boston, Massachusetts 02116. |
The Trust does not hold annual meetings for the purpose of electing Trustees, and Trustees are not elected for fixed terms. Each Trustee and officer holds office until his or her successor is chosen and qualified, or until his or her earlier death, resignation, retirement or removal.
All Trustees currently serve as Trustees of the Trust and have served in that capacity since originally elected or appointed. All of the Trustees are also Managers of the Compass Variable Accounts. The executive officers of the Trust hold similar offices for the Compass Variable Accounts and other funds in the MFS fund complex. As of January 1, 2009, each Trustee serves as a Trustee or Manager of 35 Accounts/Funds.
The Statement of Additional Information contains further information about the Trustees and is available without charge upon request by calling 1-800-752-7215.
| | |
Investment Adviser
Massachusetts Financial Services Company 500 Boylston Street, Boston, MA 02116-3741 | | Custodian State Street Bank and Trust 1 Lincoln Street, Boston, MA 02111-2900 |
Distributor
MFS Fund Distributors, Inc. 500 Boylston Street, Boston, MA 02116-3741 | | Independent Registered Public Accounting Firm Deloitte & Touche LLP 200 Berkeley Street, Boston, MA 02116 |
Portfolio Managers Benjamin Stone Barnaby Wiener | | |
21
BOARD REVIEW OF INVESTMENT ADVISORY AGREEMENT
The Investment Company Act of 1940 requires that both the full Board of Trustees and a majority of the non-interested (“independent”) Trustees, voting separately, annually approve the continuation of the investment advisory agreement between MFS Variable Insurance Trust II (the “Trust”) and Massachusetts Financial Services Company (“MFS”) on behalf of the Fund. The Trustees consider matters bearing on the Fund and the advisory arrangements at their meetings throughout the year, including a review of performance data at each regular meeting. In addition, the independent Trustees met in May and again in July 2008 (“contract review meetings”) for the specific purpose of considering whether to approve the continuation of the investment advisory agreement for the Fund. The independent Trustees were assisted in their evaluation of the investment advisory agreement by independent legal counsel, from whom they received separate legal advice and with whom they met separately from MFS management during various contract review meetings. The independent Trustees were also assisted in this process by the Fund’s Independent Chief Compliance Officer, a full-time senior officer appointed by and reporting to the independent Trustees.
In connection with their deliberations, the Trustees, including the independent Trustees, considered such information and factors as they believed, in light of the legal advice furnished to them and their own business judgment, to be relevant. The investment advisory agreement was considered separately for the Fund, although the Trustees also took into account the common interests of all Funds in the Trust in their review. As described below, the Trustees considered the nature, quality, and extent of the various investment advisory, administrative, and shareholder services performed by MFS under the existing investment advisory agreement and other arrangements with the Trust.
In connection with their contract review meetings, the Trustees received and relied upon materials which included, among other items: (i) information provided by Lipper Inc. on the investment performance of the Fund for various time periods ended December 31, 2007, compared to the investment performance of a group of funds with substantially similar investment classifications/objectives (the “Lipper performance universe”), (ii) information provided by Lipper Inc. on the Fund’s advisory fees and other expenses compared to the advisory fees and other expenses of comparable funds identified by Lipper (the “Lipper expense group”), (iii) information provided by MFS on the advisory fees of comparable portfolios of its other clients, including institutional separate account and other clients, (iv) information as to whether expense waivers, reimbursements or fee “breakpoints” are observed for the Fund, (v) information regarding MFS’ financial results and financial condition, including MFS’ and certain of its affiliates’ estimated profitability from services performed for the Fund, (vi) MFS’ views regarding the outlook for the mutual fund industry and its strategic business plans, (vii) descriptions of various functions performed by MFS for the Trust, such as compliance monitoring and portfolio trading practices, and (viii) information regarding the overall organization of MFS, including information about MFS’ senior management and other personnel providing investment advisory, administrative and other services to the Fund. The comparative performance, fee and expense information prepared and provided by Lipper Inc. was not independently verified, and the independent Trustees did not independently verify any information provided to them by MFS.
The Trustees’ conclusion as to the continuation of the investment advisory agreement was based on comprehensive consideration of all information provided to the Trustees and not the result of any single factor. Some of the factors that figured particularly in the Trustees’ deliberations are described below for the Fund, while individual Trustees may have given different weight to various factors and evaluated the information presented as a whole differently than another Trustee. The Trustees recognized that the fee arrangements for the Fund reflect years of review and discussion between the independent Trustees and MFS, that certain aspects of such arrangements may receive greater scrutiny in some years than others, and that the Trustees’ conclusions may be based, in part, on their consideration of these same arrangements during the course of the year and in prior years.
Based on information provided by Lipper Inc., the Trustees compared the Fund’s total return investment performance to the performance of a peer group of funds over various time periods. The Trustees placed particular emphasis on the total return performance of the Fund’s Initial Class shares in comparison to the performance of funds in its Lipper performance universe over the one-, three- and five-year periods. The Trustees did not rely on performance results for more recent periods, including those shown elsewhere in this report.
The Trustees noted the performance of the Fund’s Initial Class shares was in the 5th quintile relative to the other funds in the Lipper Classification Index for the one-year period (the 1st quintile being the best performers and the 5th quintile being the worst performers). The total return performance of the Fund was in the 3rd quintile for the three-year period and the 2nd quintile for the five-year period ended December 31, 2007, relative to the Lipper performance universe. Based on the nature and quality of services provided by MFS, the Board of Trustees concluded that the Fund’s performance was satisfactory.
In the course of their deliberations, the Trustees took into account information provided by MFS during contract review meetings, as well as during investment review meetings conducted with portfolio management personnel during the course of the year.
22
Board Review of Investment Advisory Agreement – continued
In assessing the reasonableness of the Fund’s advisory fee, the Trustees considered, among other information, the Fund’s advisory fee and the total expense ratio of the Fund’s Initial Class shares as a percentage of average daily net assets, compared to the advisory fee and total expense ratios of its peer group of funds based on information provided by Lipper Inc. The Trustees also considered the advisory fees charged by MFS to institutional accounts. In comparing these fees, the Trustees considered the generally broader scope of services provided by MFS to the Trust than those provided to institutional accounts. The Trustees also considered the higher demands placed on MFS’ investment personnel and trading infrastructure as a result of the daily cash in-flows and out-flows of the Fund, and the impact on MFS and related expenses due to the more extensive regulatory regime to which the Fund is subject, compared to institutional accounts.
In considering the fees, the Trustees noted from the Lipper data that the Fund’s effective advisory fee rate was above the median and total expense ratio was approximately at the median of such fees and expenses of funds in the Lipper expense group. The Trustees further concluded that the existing breakpoints were sufficient to allow the Fund to benefit from economies of scale as its assets grow. The Trustees concluded that the fees were reasonable in light of the nature and quality of services provided.
The Trustees also considered information prepared by MFS relating to its costs and profits with respect to the Fund and other investment companies and accounts advised by MFS, as well as MFS’ methodologies used to determine and allocate its costs to the Fund and other accounts and products for purposes of estimating profitability.
After reviewing these and other factors described below, the Trustees concluded that the advisory fees charged to the Fund represent reasonable compensation in light of the nature and quality of the services being provided by MFS.
In addition, the Trustees considered MFS’ resources and related efforts to continue to retain, attract and motivate capable personnel to serve the Fund. The Trustees also considered the financial resources of MFS and its parent, Sun Life Financial Inc. The Trustees further considered any advantages and possible disadvantages of having an adviser which also serves other investment companies as well as institutional accounts.
The Trustees also considered the nature, quality, cost, and extent of administrative, transfer agency, and distribution services provided to the Fund by MFS and its affiliates under agreements and plans other than the investment advisory agreement, including the 12b-1 fees the Fund pays to MFS Fund Distributors, Inc., an affiliate of MFS. The Trustees also considered the nature, extent and quality of certain other services MFS performs or arranges on the Fund’s behalf, which may include securities lending programs, directed expense payment programs, class action recovery programs, and MFS’ interaction with third-party service providers, principally custodians and sub-custodians. The Trustees concluded that the various non-advisory services provided by MFS and its affiliates on behalf of the Fund were satisfactory. The Trustees also considered the benefits to MFS from the use of the Fund’s portfolio brokerage commissions to pay for research and other similar services and various other factors. Additionally, the Trustees considered so-called “fall-out benefits” to MFS such as reputational value derived from serving as investment manager to the Trust, and determined that any such benefits derived by MFS were reasonable and fair.
Based on their evaluation of factors that they deemed to be material, including those factors described above, the Board of Trustees, including a majority of the independent Trustees, concluded that the investment advisory agreement should be continued for an additional one-year period, commencing September 1, 2008.
A discussion regarding the Board’s most recent review and renewal of the fund’s Investment Advisory Agreement with MFS is available by clicking on the fund’s name under “Variable Insurance Portfolios-VIT II” in the “Products & Performance” section on the MFS Web site (mfs.com).
23
PROXY VOTING POLICIES AND INFORMATION
A general description of the MFS funds’ proxy voting policies and procedures is available without charge, upon request, by calling
1-800-225-2606, by visiting the Proxy Voting section of mfs.com or by visiting the SEC’s Web site at http://www.sec.gov.
Information regarding how the fund voted proxies relating to portfolio securities during the most recent twelve-month period ended June 30 is available without charge by visiting the Proxy Voting section of mfs.com or by visiting the SEC’s Web site at http://www.sec.gov.
QUARTERLY PORTFOLIO DISCLOSURE
The fund will file a complete schedule of portfolio holdings with the Securities and Exchange Commission (the Commission) for the first and third quarters of each fiscal year on Form N-Q. The fund’s Form N-Q may be reviewed and copied at the:
Public Reference Room
Securities and Exchange Commission
100 F Street, NE, Room 1580
Washington, D.C. 20549
Information on the operation of the Public Reference Room may be obtained by calling the Commission at 1-800-SEC-0330. The fund’s Form N-Q is available on the EDGAR database on the Commission’s Internet Web site at http://www.sec.gov, and copies of this information may be obtained, upon payment of a duplicating fee, by electronic request at the following e-mail address: publicinfo@sec.gov or by writing the Public Reference Section at the above address.
FEDERAL TAX INFORMATION (unaudited)
The following information is provided pursuant to provisions of the Internal Revenue Code.
The fund designates $14,943,942 as capital gain dividends paid during the fiscal year.
Income derived from foreign sources was $7,404,042. The fund intends to pass through foreign tax credits of $631,137 for the fiscal year.
24
MFS® PRIVACY NOTICE
Privacy is a concern for every investor today. At MFS Investment Management® and the MFS funds, we take this concern very seriously. We want you to understand our policies about the investment products and services that we offer, and how we protect the nonpublic personal information of investors who have a direct relationship with us and our wholly owned subsidiaries.
Throughout our business relationship, you provide us with personal information. We maintain information and records about you, your investments, and the services you use. Examples of the nonpublic personal information we maintain include
| | Ÿ | | data from investment applications and other forms |
| | Ÿ | | share balances and transactional history with us, our affiliates, or others |
| | Ÿ | | facts from a consumer reporting agency |
We do not disclose any nonpublic personal information about our customers or former customers to anyone, except as permitted by law. We may share nonpublic personal information with third parties or certain of our affiliates in connection with servicing your account or processing your transactions. We may share information with companies or financial institutions that perform marketing services on our behalf or with other financial institutions with which we have joint marketing arrangements, subject to any legal requirements.
Authorization to access your nonpublic personal information is limited to appropriate personnel who provide products, services, or information to you. We maintain physical, electronic, and procedural safeguards to help protect the personal information we collect about you.
If you have any questions about the MFS privacy policy, please call 1-800-225-2606 any business day between 8 a.m. and 8 p.m. Eastern time.
Note: If you own MFS products or receive MFS services in the name of a third party such as a bank or broker-dealer, their privacy policy may apply to you instead of ours.
25

MFS® BLENDED RESEARCHSM GROWTH PORTFOLIO
The report is prepared for the general information of contract owners. It is authorized for distribution to prospective investors only when preceded or accompanied by a current prospectus.
NOT FDIC INSURED Ÿ MAY LOSE VALUE Ÿ NO BANK GUARANTEE Ÿ NOT A DEPOSIT Ÿ NOT INSURED BY ANY FEDERAL GOVERNMENT AGENCY OR NCUA/NCUSIF
LETTER FROM THE CEO

Dear Contract Owners:
The market downturns and economic setbacks of late probably rank among the worst financial declines most of us have experienced. Inevitably, people may be questioning their commitment to investing. Still, it is important to remember that downturns are an inescapable part of the business cycle. Such troughs have been seen before, and if we can use history as a guide, market recoveries typically have followed.
Recent events have clearly shown us the value of certain types of investments. In this environment, two of the hallmarks of mutual funds — transparency and liquidity — have become critically important. Unlike some other types of investments, the operations of mutual funds are relatively transparent to their shareholders. With their daily redemption feature, mutual funds also generally provide easy, convenient access to one’s money. Through these recent market upheavals, this level of liquidity enhanced the ability of mutual fund investors to respond and modify their investments as they and their advisors saw fit — a flexibility that those in less liquid investments simply did not have at their disposal.
At MFS® we take particular pride in how well mutual funds can serve investors because we invented the mutual fund in the United States. Established in 1924, Massachusetts Investors Trust was the nation’s first fund. Recent market events only reinforce what we have learned through 85 years — that mutual funds provide unique features that are important to investors in any type of market climate.
Respectfully,

Robert J. Manning
Chief Executive Officer and Chief Investment Officer
MFS Investment Management®
February 17, 2009
The opinions expressed in this letter are subject to change, may not be relied upon for investment advice, and no forecasts can be guaranteed.
Before investing, consider the fund’s investment objectives, risks, charges, and expenses. For a prospectus containing this and other information, contact your investment professional or view online. Read it carefully.
MFS Fund Distributors, Inc., 500 Boylston Street, Boston, MA 02116
1
PORTFOLIO COMPOSITION
Portfolio structure

| | |
| Top ten holdings | | |
| Microsoft Corp. | | 3.6% |
| Wal-Mart Stores, Inc. | | 3.1% |
| International Business Machines Corp. | | 2.6% |
| Oracle Corp. | | 2.4% |
| Cisco Systems, Inc. | | 2.4% |
| Intel Corp. | | 2.3% |
| Hewlett-Packard Co. | | 2.2% |
| Philip Morris International, Inc. | | 2.1% |
| Procter & Gamble Co. | | 2.1% |
| PepsiCo, Inc. | | 2.1% |
| | |
| Equity sectors | | |
| Technology | | 25.2% |
| Health Care | | 15.7% |
| Consumer Staples | | 9.4% |
| Industrial Goods & Services | | 8.4% |
| Retailing | | 7.1% |
| Energy | | 6.7% |
| Leisure | | 6.5% |
| Basic Materials | | 5.0% |
| Utilities & Communications | | 4.0% |
| Special Products & Services | | 3.6% |
| Transportation | | 3.2% |
| Financial Services | | 2.8% |
| Autos & Housing | | 0.3% |
Percentages are based on net assets as of 12/31/08.
The portfolio is actively managed and current holdings may be different.
2
MANAGEMENT REVIEW
Summary of Results
For the twelve months ended December 31, 2008, Initial Class shares of the MFS Blended Research Growth Portfolio (the “fund”) provided a total return of –39.84%, while Service Class shares of the fund provided a total return of –39.96%. These compare with a return of –38.44% for the fund’s benchmark, the Russell 1000 Growth Index.
Market Environment
The U.S. economy and financial markets experienced significant deterioration and extraordinary volatility over the reporting period. U.S. economic growth slowed significantly, despite the short-term bounce from the second quarter fiscal stimulus. Strong domestic headwinds included accelerated deterioration in the housing market, anemic corporate investment, a rapidly declining job market, and a much tighter credit environment. During the period, a seemingly continuous series of tumultuous financial events hammered markets, including: the distressed sale of failing Bear Stearns to JPMorgan, the conservatorship of Government Sponsored Enterprises (GSEs) Fannie Mae and Freddie Mac, the bankruptcy of investment bank Lehman Brothers, the Federal Reserve Bank’s complex intervention of insurance company American International Group (AIG), the nationalization of several large European banks, the failure of Washington Mutual, and the distressed sale of Wachovia. As a result of this barrage of turbulent news, global equity markets pushed significantly lower and credit markets witnessed the worst dislocation since the beginning of the credit crisis. Though conditions improved towards the end of the period, the state of financial and macroeconomic dislocation remained severe.
While reasonably resilient during the first half of the period, the global economy and financial system increasingly experienced considerable negative spillovers from the U.S. slowdown. Not only did Europe and Japan show obvious signs of economic softening, the more powerful engine of global growth – emerging markets – also displayed weakening dynamics.
During the reporting period, the U.S. Federal Reserve Board cut interest rates aggressively and introduced a multitude of new lending facilities to alleviate ever-tightening credit markets, while the U.S. federal government moved quickly to design and implement a meaningful fiscal stimulus package. Although several other global central banks also cut rates, the dilemma of rising energy and food prices heightened concerns among central bankers that inflationary expectations might become unhinged despite weaker growth. Only later in the reporting period did slowing global growth result in a very precipitous decline in commodity prices, which significantly eased inflation and inflationary expectations. As inflationary concerns diminished in the face of global deleveraging, and equity and credit markets deteriorated more sharply, a coordinated rate cut marked the beginning of much more aggressive easing by the major global central banks.
Detractors from Performance
Stock selection in the health care sector was the principal detractor from the fund’s performance relative to the Russell 1000 Growth Index. The fund’s positioning in biotech company Genentech held back relative results as the stock generated a strong return for the reporting period and we missed a significant run-up in the stock’s performance.
Security selection in the basic materials sector also dampened relative returns. Integrated steelmaker U.S. Steel (g) was among the fund’s top relative detractors. The fund’s positioning in mining operator Cliffs Natural Resources also negatively impacted relative performance as we held the stock while its respective price significantly declined.
In the industrial goods and services sector, stock selection also detracted from relative returns. Industrial machinery manufacturer Bucyrus International was a top relative detractor within this sector. Shares of Bucyrus International declined during the period due to negative earnings in the mining industry.
Individual securities in other sectors that hindered relative results included tire maker Goodyear and gas pipeline company El Paso. Shares of El Paso fell as the company was adversely affected by falling natural gas prices brought on by slowing demand and rising inventories during the current recession. The fund’s positioning in casino operator MGM Mirage (g) and car rental company Avis Budget (g) hurt relative performance as we held these stocks while their respective prices significantly declined. Our underweighted position in fast food giant McDonald’s also held back relative returns. Not owning strong-performing brewing giant Anheuser-Busch, which outperformed the benchmark, also had a negative impact on relative results.
Contributors to Performance
An underweighted position in the energy sector boosted relative returns. No individual securities within this sector were among the fund’s top relative contributors for the reporting period.
Stock selection in the retailing sector aided relative returns. Here, retailer Wal-Mart was a strong relative contributor. The retailing giant delivered strong returns over the reporting period driven by the company’s significant growth from its proven business model. The stock was also aided by the firm’s recent refocus on “price leadership” which led to significant improvement in sales.
3
Management Review – continued
Security selection in the leisure sector was another positive area of relative performance. The fund’s positioning in bakery-cafes operator Panera Bread(g) aided results as we closed out of its position prior to significant declines in its respective price. The fund’s holdings of fast food operator YUM! Brands and casual dining restaurant operator Darden Restaurants also benefited relative returns. Shares of Darden Restaurants rose as the company reported better-than-expected earnings. The company attributed this partly to increased same-store sales in its two largest brands, Olive Garden and Red Lobster.
Elsewhere, education services company Strayer Education, global pharmaceutical firm Bristol-Myers, food company General Mills, and enterprise software products maker Oracle were among the fund’s top relative contributors. Avoiding poor-performing health insurance and Medicare/Medicaid provider UnitedHealth Group also aided relative returns.
The fund’s cash position was also a contributor to relative performance. The fund holds cash to buy new holdings and to provide liquidity. In a period when equity markets declined, as measured by the fund’s benchmark, holding cash helped performance versus the benchmark, which has no cash position.
Respectfully,
Matthew Krummell
Portfolio Manager
Note to Shareholders: Effective November 20, 2008, Matthew Krummell became portfolio manager of the fund. Previously, the fund was managed by Eric Weigel.
| (g) | | Security was not held in the portfolio at period end. |
The views expressed in this report are those of the portfolio manager only through the end of the period of the report as stated on the cover and do not necessarily reflect the views of MFS or any other person in the MFS organization. These views are subject to change at any time based on market or other conditions, and MFS disclaims any responsibility to update such views. These views may not be relied upon as investment advice or an indication of trading intent on behalf of any MFS portfolio. References to specific securities are not recommendations of such securities, and may not be representative of any MFS portfolio’s current or future investments.
4
PERFORMANCE SUMMARY THROUGH 12/31/08
The following chart illustrates the historical performance of the fund in comparison to its benchmark(s). Benchmark comparisons are unmanaged; do not reflect any fees or expenses; and cannot be invested in directly. The performance of other share classes will be greater than or less than that of the class depicted below. (See Notes to Performance Summary.)
Performance data shown represents past performance and is no guarantee of future results. Investment return and principal value fluctuate so your units, when sold, may be worth more or less than the original cost; current performance may be lower or higher than quoted. The performance shown does not reflect the deduction of taxes, if any, that a contract holder would pay on fund distributions or the redemption of contract units. The returns for the fund shown also do not reflect the deduction of expenses associated with variable products, such as mortality and expense risk charges, separate account charges, and sales charges imposed by the insurance company separate accounts. Such expenses would reduce the overall returns shown.
Growth of a hypothetical $10,000 investment (t)
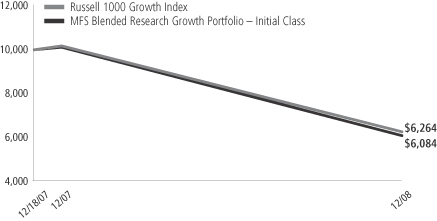
Total rates of return through 12/31/08
Average Annual Total Returns
| | | | | | | | | | | | |
| | | Share class | | Class inception date | | 1-yr | | Life (t) | | |
| | | Initial Class | | 12/18/07 | | (39.84)% | | (38.03)% | | |
| | | Service Class | | 12/18/07 | | (39.96)% | | (38.15)% | | |
Comparative Benchmark
| | | | | | | | | | | | |
| | | Russell 1000 Growth Index (f) | | | | (38.44)% | | (36.05)% | | |
| (f) | Source: FactSet Research Systems Inc. |
| (t) | For the period from the commencement of the fund’s investment operations, December 18, 2007 through the stated period end. |
Benchmark Definition
Russell 1000 Growth Index – constructed to provide a comprehensive barometer for growth securities in the large-cap segment of the U.S. equity universe. Companies in this index generally have higher price-to-book ratios and higher forecasted growth values.
It is not possible to invest directly in an index.
Notes to Performance Summary
Performance results reflect any applicable expense subsidies and waivers in effect during the periods shown. Without such subsidies and waivers the fund’s performance results would be less favorable. Please see the prospectus for complete details. All results are historical and assume the reinvestment of any dividends and capital gains distributions.
From time to time the fund may receive proceeds from litigation settlements, without which performance would be lower.
5
EXPENSE TABLE
Fund Expenses Borne by the Contract Holders During the Period,
July 1, 2008 through December 31, 2008
As a contract holder of the fund, you incur ongoing costs, including management fees; distribution (12b-1) fees; and other fund expenses. This example is intended to help you understand your ongoing costs (in dollars) of investing in the fund and to compare these costs with the ongoing costs of investing in other mutual funds.
The example is based on an investment of $1,000 invested at the beginning of the period and held for the entire period July 1, 2008 through December 31, 2008.
Actual Expenses
The first line for each share class in the following table provides information about actual account values and actual expenses. You may use the information in this line, together with the amount you invested, to estimate the expenses that you paid over the period. Simply divide your account value by $1,000 (for example, an $8,600 account value divided by $1,000 = 8.6), then multiply the result by the number in the first line under the heading entitled “Expenses Paid During Period” to estimate the expenses you paid on your account during this period.
Hypothetical Example for Comparison Purposes
The second line for each share class in the following table provides information about hypothetical account values and hypothetical expenses based on the fund’s actual expense ratio and an assumed rate of return of 5% per year before expenses, which is not the fund’s actual return. The hypothetical account values and expenses may not be used to estimate the actual ending account balance or expenses you paid for the period. You may use this information to compare the ongoing costs of investing in the fund and other funds. To do so, compare this 5% hypothetical example with the 5% hypothetical examples that appear in the shareholder reports of the other funds.
Please note that the expenses shown in the table are meant to highlight the fund’s ongoing costs only and do not take into account the fees and expenses imposed under the variable contracts through which your investment in the fund is made. Therefore, the second line for each share class in the table is useful in comparing ongoing costs associated with an investment in vehicles (such as the fund) which fund benefits under variable annuity and variable life insurance contracts and to qualified pension and retirement plans only, and will not help you determine the relative total costs of investing in the fund through variable annuity and variable life insurance contracts. If the fees and expenses imposed under the variable contracts were included, your costs would have been higher.
| | | | | | | | | | |
| Share Class | | | | Annualized
Expense Ratio | | Beginning
Account Value
7/01/08 | | Ending
Account Value
12/31/08 | | Expenses Paid
During Period (p)
7/01/08-12/31/08 |
| Initial Class | | Actual | | 0.60% | | $1,000.00 | | $668.33 | | $2.52 |
| | Hypothetical (h) | | 0.60% | | $1,000.00 | | $1,022.12 | | $3.05 |
| Service Class | | Actual | | 0.85% | | $1,000.00 | | $668.53 | | $3.57 |
| | Hypothetical (h) | | 0.85% | | $1,000.00 | | $1,020.86 | | $4.32 |
| (h) | 5% class return per year before expenses. |
| (p) | Expenses paid is equal to each class’ annualized expense ratio, as shown above, multiplied by the average account value over the period, multiplied by the number of days in the period, divided by the number of days in the year. |
6
PORTFOLIO OF INVESTMENTS – 12/31/08
The Portfolio of Investments is a complete list of all securities owned by your fund. It is categorized by broad-based asset classes.
| | | | | |
| Issuer | | Shares/Par | | Value ($) |
| | | | | |
| COMMON STOCKS – 97.9% |
| Aerospace – 3.4% | | | | | |
| Boeing Co. | | 886 | | $ | 37,806 |
| Lockheed Martin Corp. | | 400 | | | 33,632 |
| United Technologies Corp. | | 573 | | | 30,713 |
| | | | | |
| | $ | 102,151 |
| | | | | |
| Airlines – 0.5% | | | | | |
| Southwest Airlines Co. | | 1,796 | | $ | 15,482 |
| | | | | |
| Apparel Manufacturers – 1.0% | | | | | |
| NIKE, Inc., “B” | | 596 | | $ | 30,396 |
| | | | | |
| Automotive – 0.3% | | | | | |
| Goodyear Tire & Rubber Co. (a) | | 1,372 | | $ | 8,191 |
| | | | | |
| Biotechnology – 3.6% | | | | | |
| Biogen Idec, Inc. (a) | | 481 | | $ | 22,910 |
| Genentech, Inc. (a) | | 295 | | | 24,458 |
| Genzyme Corp. (a) | | 299 | | | 19,845 |
| Gilead Sciences, Inc. (a) | | 849 | | | 43,418 |
| | | | | |
| | $ | 110,631 |
| | | | | |
| Broadcasting – 1.2% | | | | | |
| Omnicom Group, Inc. | | 613 | | $ | 16,502 |
| Walt Disney Co. | | 848 | | | 19,241 |
| | | | | |
| | $ | 35,743 |
| | | | | |
| Brokerage & Asset Managers – 1.5% | | | | | |
| Affiliated Managers Group, Inc. (a) | | 281 | | $ | 11,780 |
| Charles Schwab Corp. | | 1,274 | | | 20,601 |
| CME Group, Inc. | | 65 | | | 13,527 |
| | | | | |
| | $ | 45,908 |
| | | | | |
| Business Services – 2.1% | | | | | |
| Global Payments, Inc. | | 578 | | $ | 18,953 |
| Visa, Inc. | | 489 | | | 25,648 |
| Western Union Co. | | 1,459 | | | 20,922 |
| | | | | |
| | $ | 65,523 |
| | | | | |
| Cable TV – 0.8% | | | | | |
| Time Warner Cable, Inc., “A” (a) | | 1,131 | | $ | 24,260 |
| | | | | |
| Chemicals – 2.6% | | | | | |
| 3M Co. | | 583 | | $ | 33,546 |
| Monsanto Co. | | 392 | | | 27,577 |
| Mosaic Co. | | 517 | | | 17,888 |
| | | | | |
| | $ | 79,011 |
| | | | | |
| Computer Software – 7.0% | | | | | |
| Adobe Systems, Inc. (a) | | 704 | | $ | 14,988 |
| Microsoft Corp. | | 5,581 | | | 108,495 |
| Oracle Corp. (a) | | 4,125 | | | 73,136 |
| Salesforce.com, Inc. (a) | | 463 | | | 14,821 |
| | | | | |
| | $ | 211,440 |
| | | | | |
| Computer Software – Systems – 7.5% | | | | | |
| Apple, Inc. (a) | | 730 | | $ | 62,306 |
| EMC Corp. (a) | | 2,219 | | | 23,233 |
| Hewlett-Packard Co. | | 1,803 | | | 65,431 |
| International Business Machines Corp. | | 930 | | $ | 78,269 |
| | | | | |
| | $ | 229,239 |
| | | | | |
| | | | | |
| Issuer | | Shares/Par | | Value ($) |
| | | | | |
| COMMON STOCKS – continued | | | | | |
| Consumer Goods & Services – 3.6% | | | | | |
| Apollo Group, Inc., “A” (a) | | 254 | | $ | 19,461 |
| Procter & Gamble Co. | | 1,049 | | | 64,849 |
| Strayer Education, Inc. | | 119 | | | 25,515 |
| | | | | |
| | $ | 109,825 |
| | | | | |
| Electrical Equipment – 1.6% | | | | | |
| Danaher Corp. | | 419 | | $ | 23,720 |
| Rockwell Automation, Inc. | | 748 | | | 24,116 |
| | | | | |
| | $ | 47,836 |
| | | | | |
| Electronics – 3.8% | | | | | |
| Intel Corp. | | 4,747 | | $ | 69,591 |
| Linear Technology Corp. | | 1,470 | | | 32,516 |
| National Semiconductor Corp. | | 1,406 | | | 14,158 |
| | | | | |
| | $ | 116,265 |
| | | | | |
| Energy – Independent – 1.4% | | | | | |
| CONSOL Energy, Inc. | | 429 | | $ | 12,261 |
| Occidental Petroleum Corp. | | 496 | | | 29,755 |
| | | | | |
| | $ | 42,016 |
| | | | | |
| Energy – Integrated – 1.8% | | | | | |
| Exxon Mobil Corp. | | 685 | | $ | 54,684 |
| | | | | |
| Engineering – Construction – 1.0% | | | | | |
| Foster Wheeler Ltd. (a) | | 649 | | $ | 15,174 |
| Shaw Group, Inc. (a) | | 685 | | | 14,022 |
| | | | | |
| | $ | 29,196 |
| | | | | |
| Food & Beverages – 4.4% | | | | | |
| Coca-Cola Co. | | 1,189 | | $ | 53,826 |
| General Mills, Inc. | | 259 | | | 15,734 |
| PepsiCo, Inc. | | 1,176 | | | 64,410 |
| | | | | |
| | $ | 133,970 |
| | | | | |
| Food & Drug Stores – 0.9% | | | | | |
| CVS Caremark Corp. | | 1,000 | | $ | 28,740 |
| | | | | |
| General Merchandise – 3.7% | | | | | |
| Kohl’s Corp. (a) | | 482 | | $ | 17,448 |
| Wal-Mart Stores, Inc. | | 1,685 | | | 94,461 |
| | | | | |
| | $ | 111,909 |
| | | | | |
| Health Maintenance Organizations – 0.5% | | | | | |
| Aetna, Inc. | | 515 | | $ | 14,677 |
| | | | | |
| Internet – 2.1% | | | | | |
| Google, Inc., “A” (a) | | 208 | | $ | 63,991 |
| | | | | |
| Leisure & Toys – 0.5% | | | | | |
| Activision Blizzard, Inc. (a) | | 1,743 | | $ | 15,060 |
| | | | | |
| Machinery & Tools – 2.4% | | | | | |
| Bucyrus International, Inc. | | 606 | | $ | 11,223 |
| Caterpillar, Inc. | | 666 | | | 29,750 |
| Eaton Corp. | | 669 | | $ | 33,256 |
| | | | | |
| | | | $ | 74,229 |
| | | | | |
7
Portfolio of Investments – continued
| | | | | |
| Issuer | | Shares/Par | | Value ($) |
| | | | | |
| COMMON STOCKS – continued | | | | | |
| Major Banks – 0.6% | | | | | |
| State Street Corp. | | 450 | | $ | 17,699 |
| | | | | |
| Medical & Health Technology & Services – 1.6% | | | |
| DaVita, Inc. (a) | | 300 | | $ | 14,871 |
| Lincare Holdings, Inc. (a) | | 642 | | | 17,289 |
| McKesson Corp. | | 429 | | | 16,615 |
| | | | | |
| | | | $ | 48,775 |
| | | | | |
| Medical Equipment – 4.1% | | | | | |
| Advanced Medical Optics, Inc. (a) | | 2,496 | | $ | 16,498 |
| Baxter International, Inc. | | 365 | | | 19,560 |
| C.R. Bard, Inc. | | 276 | | | 23,256 |
| Medtronic, Inc. | | 982 | | | 30,854 |
| St. Jude Medical, Inc. (a) | | 467 | | | 15,392 |
| Zimmer Holdings, Inc. (a) | | 451 | | | 18,229 |
| | | | | |
| | | | $ | 123,789 |
| | | | | |
| Metals & Mining – 0.6% | | | | | |
| Cliffs Natural Resources, Inc. | | 700 | | $ | 17,927 |
| | | | | |
| Natural Gas – Distribution – 0.7% | | | | | |
| Questar Corp. | | 617 | | $ | 20,170 |
| | | | | |
| Natural Gas – Pipeline – 1.7% | | | | | |
| El Paso Corp. | | 3,851 | | $ | 30,153 |
| Williams Cos., Inc. | | 1,416 | | | 20,504 |
| | | | | |
| | | | $ | 50,657 |
| | | | | |
| Network & Telecom – 4.8% | | | | | |
| Cisco Systems, Inc. (a) | | 4,411 | | $ | 71,899 |
| Corning, Inc. | | 1,819 | | | 17,335 |
| F5 Networks, Inc. (a) | | 700 | | | 16,002 |
| QUALCOMM, Inc. | | 1,177 | | | 42,172 |
| | | | | |
| | | | $ | 147,408 |
| | | | | |
| Oil Services – 3.5% | | | | | |
| Halliburton Co. | | 1,412 | | $ | 25,670 |
| National Oilwell Varco, Inc. (a) | | 729 | | | 17,817 |
| Noble Corp. | | 544 | | | 12,017 |
| Schlumberger Ltd. | | 854 | | | 36,150 |
| Transocean, Inc. (a) | | 297 | | | 14,033 |
| | | | | |
| | | | $ | 105,687 |
| | | | | |
| Other Banks & Diversified Financials – 0.7% | | | |
| Northern Trust Corp. | | 430 | | $ | 22,420 |
| | | | | |
| Pharmaceuticals – 5.9% | | | | | |
| Abbott Laboratories | | 1,115 | | $ | 59,508 |
| Bristol-Myers Squibb Co. | | 2,020 | | | 46,965 |
| Johnson & Johnson | | 333 | | | 19,923 |
| Merck & Co., Inc. | | 870 | | | 26,448 |
| Schering-Plough Corp. | | 1,601 | | | 27,265 |
| | | | | |
| | | | $ | 180,109 |
| | | | | |
| Railroad & Shipping – 1.5% | | | | | |
| CSX Corp. | | 461 | | $ | 14,969 |
| Union Pacific Corp. | | 634 | | | 30,305 |
| | | | | |
| | | | $ | 45,274 |
| | | | | |
| | | | | | | |
| Issuer | | Shares/Par | | Value ($) | |
| | | | | | | |
| COMMON STOCKS – continued | | | | | | | |
| Restaurants – 4.0% | | | | | | | |
| Darden Restaurants, Inc. | | | 979 | | $ | 27,588 | |
| McDonald’s Corp. | | | 634 | | | 39,428 | |
| SYSCO Corp. | | | 850 | | | 19,499 | |
| YUM! Brands, Inc. | | | 1,083 | | | 34,114 | |
| | | | | | | |
| | | | | $ | 120,629 | |
| | | | | | | |
| Specialty Chemicals – 1.8% | | | | | | | |
| Air Products & Chemicals, Inc. | | | 506 | | $ | 25,437 | |
| Praxair, Inc. | | | 522 | | | 30,986 | |
| | | | | | | |
| | | | | $ | 56,423 | |
| | | | | | | |
| Specialty Stores – 1.5% | | | | | | | |
| Staples, Inc. | | | 1,276 | | $ | 22,866 | |
| TJX Cos., Inc. | | | 1,068 | | | 21,969 | |
| | | | | | | |
| | | | | $ | 44,835 | |
| | | | | | | |
| Telecommunications – Wireless – 0.6% | | | | |
| SBA Communications Corp. (a) | | | 1,063 | | $ | 17,348 | |
| | | | | | | |
| Tobacco – 2.9% | | | | | | | |
| Lorillard, Inc. | | | 386 | | $ | 21,751 | |
| Philip Morris International, Inc. | | | 1,497 | | | 65,134 | |
| | | | | | | |
| | | | | $ | 86,885 | |
| | | | | | | |
| Trucking – 1.2% | | | | | | | |
| United Parcel Service, Inc., “B” | | | 669 | | $ | 36,902 | |
| | | | | | | |
| Utilities – Electric Power – 1.0% | | | | | | | |
| PPL Corp. | | | 983 | | $ | 30,168 | |
| | | | | | | |
Total Common Stocks
(Identified Cost, $4,386,127) | | | | | $ | 2,973,478 | |
| | | | | | | |
| | |
| REPURCHASE AGREEMENTS – 3.0% | | | | | | | |
| Goldman Sachs, 0.01%, dated 12/31/08, due 1/02/09, total to be received $92,000.05 (secured by U.S. Treasury and Federal Agency obligations and Mortgage Backed securities in a jointly traded account), at Cost | | $ | 92,000 | | $ | 92,000 | |
| | | | | | | |
Total Investments
(Identified Cost, $4,478,127) | | | | | $ | 3,065,478 | |
| | | | | | | |
OTHER ASSETS, LESS
LIABILITIES – (0.9)% | | | | | | (26,945 | ) |
| | | | | | | |
| Net Assets – 100.0% | | | | | $ | 3,038,533 | |
| | | | | | | |
| (a) | Non-income producing security. |
See notes to Financial Statements
8
FINANCIAL STATEMENTS | STATEMENT OF ASSETS AND LIABILITIES
This statement represents your fund’s balance sheet, which details the assets and liabilities comprising the total value of the fund.
| | | | | |
At 12/31/08 | | | | | |
Assets | | | | | |
Investments, at value (identified cost, $4,478,127) | | $3,065,478 | | | |
Cash | | 737 | | | |
Dividends receivable | | 5,685 | | | |
Receivable from investment adviser | �� | 14,655 | | | |
Other assets | | 469 | | | |
Total assets | | | | | $3,087,024 |
Liabilities | | | | | |
Payable to affiliates | | | | | |
Management fee | | $97 | | | |
Distribution fees | | 20 | | | |
Administrative services fee | | 55 | | | |
Payable for trustees’ compensation | | 2 | | | |
Accrued expenses and other liabilities | | 48,317 | | | |
Total liabilities | | | | | $48,491 |
Net assets | | | | | $3,038,533 |
Net assets consist of | | | | | |
Paid-in capital | | $5,030,693 | | | |
Unrealized appreciation (depreciation) on investments | | (1,412,649 | ) | | |
Accumulated net realized gain (loss) on investments | | (579,511 | ) | | |
Net assets | | | | | $3,038,533 |
Shares of beneficial interest outstanding | | | | | 505,224 |
Initial Class shares | | | | | |
Net assets | | $1,521,233 | | | |
Shares outstanding | | 253,074 | | | |
Net asset value per share | | | | | $6.01 |
Service Class shares | | | | | |
Net assets | | $1,517,300 | | | |
Shares outstanding | | 252,150 | | | |
Net asset value per share | | | | | $6.02 |
See Notes to Financial Statements
9
FINANCIAL STATEMENTS | STATEMENT OF OPERATIONS
This statement describes how much your fund earned in investment income and accrued in expenses. It also describes any gains and/or losses generated by fund operations.
| | | | | | |
| Year ended 12/31/08 | | | | | | |
| Net investment income | | | | | | |
Income | | | | | | |
Dividends | | $58,785 | | | | |
Interest | | 1,046 | | | | |
Total investment income | | | | | $59,831 | |
Expenses | | | | | | |
Management fee | | $25,145 | | | | |
Distribution fees | | 5,235 | | | | |
Administrative services fee | | 10,000 | | | | |
Trustees’ compensation | | 546 | | | | |
Custodian fee | | 6,641 | | | | |
Shareholder communications | | 16,563 | | | | |
Auditing fees | | 46,955 | | | | |
Legal fees | | 6,946 | | | | |
Miscellaneous | | 7,182 | | | | |
Total expenses | | | | | $125,213 | |
Fees paid indirectly | | (12 | ) | | | |
Reduction of expenses by investment adviser | | (94,817 | ) | | | |
Net expenses | | | | | $30,384 | |
Net investment income | | | | | $29,447 | |
Realized and unrealized gain (loss) on investments | | | | | | |
Realized gain (loss) on investment transactions (identified cost basis) | | | | | $(579,511 | ) |
Change in unrealized appreciation (depreciation) on investments | | | | | $(1,466,978 | ) |
Net realized and unrealized gain (loss) on investments | | | | | $(2,046,489 | ) |
Change in net assets from operations | | | | | $(2,017,042 | ) |
See Notes to Financial Statements
10
FINANCIAL STATEMENTS | STATEMENTS OF CHANGES IN NET ASSETS
These statements describe the increases and/or decreases in net assets resulting from operations, any distributions, and any shareholder transactions.
| | | | | | |
For years ended 12/31 | | 2008 | | | 2007 (c | ) |
Change in net assets | | | | | | |
From operations | | | | | | |
Net investment income | | $29,447 | | | $1,246 | |
Net realized gain (loss) on investments | | (579,511 | ) | | — | |
Net unrealized gain (loss) on investments | | (1,466,978 | ) | | 54,329 | |
Change in net assets from operations | | $(2,017,042 | ) | | $55,575 | |
Distributions declared to shareholders | | | | | | |
From net investment income | | | | | | |
Initial Class | | $(17,352 | ) | | $(716 | ) |
Service Class | | (12,095 | ) | | (530 | ) |
From tax return of capital | | | | | | |
Initial Class | | (11 | ) | | (146 | ) |
Service Class | | (31 | ) | | (108 | ) |
Total distributions declared to shareholders | | $(29,489 | ) | | $(1,500 | ) |
Change in net assets from fund share transactions | | $29,489 | | | $5,001,500 | |
Total change in net assets | | $(2,017,042 | ) | | $5,055,575 | |
Net assets | | | | | | |
At beginning of period | | 5,055,575 | | | — | |
At end of period | | $3,038,533 | | | $5,055,575 | |
| (c) | For the period from the commencement of the fund’s investment operations, December 18, 2007 through the stated period end. |
See Notes to Financial Statements
11
FINANCIAL STATEMENTS | FINANCIAL HIGHLIGHTS
The financial highlights table is intended to help you understand the fund’s financial performance for the past 5 years (or life of a particular share class, if shorter). Certain information reflects financial results for a single fund share. The total returns in the table represent the rate by which an investor would have earned (or lost) on an investment in the fund share class (assuming reinvestment of all distributions) held for the entire period.
| | | | | | |
| Initial Class | | Years ended 12/31 | |
| | | 2008 | | | 2007 (c) | |
Net asset value, beginning of period | | $10.11 | | | $10.00 | |
| Income (loss) from investment operations | | | | | | |
Net investment income (d) | | $0.07 | | | $0.00 | (w) |
Net realized and unrealized gain (loss) on investments | | (4.10 | ) | | 0.11 | |
Total from investment operations | | $(4.03 | ) | | $0.11 | |
| Less distributions declared to shareholders | | | | | | |
From net investment income | | $(0.07 | ) | | $(0.00 | )(w) |
From tax return of capital | | (0.00 | )(w) | | (0.00 | )(w) |
Total distributions declared to shareholders | | $(0.07 | ) | | $(0.00 | )(w) |
Net asset value, end of period | | $6.01 | | | $10.11 | |
Total return (%) (k)(r)(s) | | (39.84 | ) | | 1.13 | (n) |
Ratios (%) (to average net assets)
and Supplemental data: | | | | | | |
Expenses before expense reductions (f) | | 2.87 | | | 10.74 | (a) |
Expenses after expense reductions (f) | | 0.60 | | | 0.60 | (a) |
Net investment income | | 0.83 | | | 0.81 | (a) |
Portfolio turnover | | 50 | | | 0 | |
Net assets at end of period (000 Omitted) | | $1,521 | | | $2,528 | |
See Notes to Financial Statements
12
Financial Highlights – continued
| | | | | | |
| Service Class | | Years ended 12/31 | |
| | | 2008 | | | 2007 (c) | |
Net asset value, beginning of period | | $10.11 | | | $10.00 | |
| Income (loss) from investment operations | | | | | | |
Net investment income (d) | | $0.05 | | | $0.00 | (w) |
Net realized and unrealized gain (loss) on investments | | (4.09 | ) | | 0.11 | |
Total from investment operations | | $(4.04 | ) | | $0.11 | |
| Less distributions declared to shareholders | | | | | | |
From net investment income | | $(0.05 | ) | | $(0.00 | )(w) |
From tax return of capital | | (0.00 | )(w) | | (0.00 | )(w) |
Total distributions declared to shareholders | | $(0.05 | ) | | $(0.00 | )(w) |
Net asset value, end of period | | $6.02 | | | $10.11 | |
Total return (%) (k)(r)(s) | | (39.96 | ) | | 1.13 | (n) |
Ratios (%) (to average net assets)
and Supplemental data: | | | | | | |
Expenses before expense reductions (f) | | 3.12 | | | 10.99 | (a) |
Expenses after expense reductions (f) | | 0.85 | | | 0.85 | (a) |
Net investment income | | 0.58 | | | 0.56 | (a) |
Portfolio turnover | | 50 | | | 0 | |
Net assets at end of period (000 Omitted) | | $1,517 | | | $2,528 | |
| (c) | For the period from the commencement of the fund’s investment operations, December 18, 2007, through the stated period end. |
| (d) | Per share data are based on average shares outstanding. |
| (f) | Ratios do not reflect reductions from fees paid indirectly, if applicable. |
| (k) | The total return does not reflect expenses that apply to separate accounts. Inclusion of these charges would reduce the total return figures for all periods shown. |
| (r) | Certain expenses have been reduced without which performance would have been lower. |
| (s) | From time to time the fund may receive proceeds from litigation settlements, without which performance would be lower. |
| (w) | Per share amount was less than $0.01. |
See Notes to Financial Statements
13
NOTES TO FINANCIAL STATEMENTS
| (1) | | Business and Organization |
MFS Blended Research Growth Portfolio (the fund) is a series of MFS Variable Insurance Trust II (the trust). The trust is organized as a Massachusetts business trust and is registered under the Investment Company Act of 1940, as amended, as an open-end management investment company. The shares of the fund are sold to variable accounts established by insurance companies to fund benefits under variable contracts issued by such companies, and qualified retirement and pension plans.
| (2) | | Significant Accounting Policies |
General – The preparation of financial statements in conformity with U.S. generally accepted accounting principles requires management to make estimates and assumptions that affect the reported amounts of assets and liabilities, and disclosure of contingent assets and liabilities at the date of the financial statements and the reported amounts of revenues and expenses during the reporting period. Actual results could differ from those estimates. The fund can invest in foreign securities. Investments in foreign securities are vulnerable to the effects of changes in the relative values of the local currency and the U.S. dollar and to the effects of changes in each country’s legal, political, and economic environment.
In March 2008, FASB Statement No. 161, Disclosures about Derivative Instruments and Hedging Activities (the “Standard”) was issued, and is effective for financial statements issued for fiscal years and interim periods beginning after November 15, 2008. This Standard provides enhanced disclosures about the fund’s use of and accounting for derivative instruments and the effect of derivative instruments on the fund’s results of operations and financial position. Management is evaluating the application of the Standard to the fund, and has not at this time determined the impact, if any, resulting from the adoption of this Standard on the fund’s financial statements.
FASB Staff Position (FSP) 133-1 was implemented during the period. FSP 133-1 amends FAS 133 to require sellers of credit derivatives to make disclosures that will enable financial statement users to assess the potential effects of those credit derivatives on an entity’s financial position, financial performance and cash flows. There was no impact from implementing FSP 133-1 as the fund did not hold any of these credit derivatives at period end.
Investment Valuations – Equity securities, including restricted equity securities, are generally valued at the last sale or official closing price as reported by a third party pricing service on the market or exchange on which they are primarily traded. For securities for which there were no sales reported that day, equity securities are generally valued at the last quoted daily bid quotation as reported by a third party pricing service on the market or exchange on which they are primarily traded. For securities held short for which there were no sales reported for the day, the position is generally valued at the last quoted daily ask quotation as reported by a third party pricing service on the market or exchange on which such securities are primarily traded. Short-term instruments with a maturity at issuance of 60 days or less may be valued at amortized cost, which approximates market value. Securities and other assets generally valued on the basis of information from a third party pricing service may also be valued at a broker-dealer bid quotation. Values obtained from pricing services can utilize both dealer-supplied valuations and electronic data processing techniques, which take into account factors such as institutional-size trading in similar groups of securities, yield, quality, coupon rate, maturity, type of issue, trading characteristics, and other market data. The values of foreign securities and other assets and liabilities expressed in foreign currencies are converted to U.S. dollars using the mean of bid and asked prices for rates reported by a third party pricing service.
The Board of Trustees has delegated primary responsibility for determining or causing to be determined the value of the fund’s investments (including any fair valuation) to the adviser pursuant to valuation policies and procedures approved by the Board. If the adviser determines that reliable market quotations are not readily available, investments are valued at fair value as determined in good faith by the adviser in accordance with such procedures under the oversight of the Board of Trustees. Under the fund’s valuation policies and procedures, market quotations are not considered to be readily available for most types of debt instruments and floating rate loans and many types of derivatives. These investments are generally valued at fair value based on information from third party pricing services. In addition, investments may be valued at fair value if the adviser determines that an investment’s value has been materially affected by events occurring after the close of the exchange or market on which the investment is principally traded (such as foreign exchange or market) and prior to the determination of the fund’s net asset value, or after the halting of trading of a specific security where trading does not resume prior to the close of the exchange or market on which the security is principally traded. The adviser may rely on third party pricing services or other information (such as the correlation with price movements of similar securities in the same or other markets; the type, cost and investment characteristics of the security; the business and financial condition of the issuer; and trading and other market data) to assist in determining whether to fair value and at what value to fair value an investment. The value of an investment for purposes of calculating the fund’s net asset value can differ depending on the source and method used to determine value. When fair valuation is used, the value of investments used to determine the fund’s net asset value may differ from quoted or published prices for the same investments.
14
Notes to Financial Statements – continued
The fund adopted FASB Statement No. 157, Fair Value Measurements (the “Statement”). This Statement provides a single definition of fair value, a hierarchy for measuring fair value and expanded disclosures about fair value measurements.
Various inputs are used in determining the value of the fund’s assets or liabilities carried at market value. These inputs are categorized into three broad levels. Level 1 includes quoted prices in active markets for identical assets or liabilities. Level 2 includes other significant observable market-based inputs (including quoted prices for similar securities, interest rates, prepayment speed, and credit risk). Level 3 includes unobservable inputs, which may include the adviser’s own assumptions in determining the fair value of investments. Other financial instruments are derivative instruments not reflected in total investments, such as futures, forwards, swap contracts, and written options. The following is a summary of the levels used as of December 31, 2008 in valuing the fund’s assets or liabilities carried at market value:
| | | | | | | | |
| | | Level 1 | | Level 2 | | Level 3 | | Total |
| Investments in Securities | | $2,973,478 | | $92,000 | | $— | | $3,065,478 |
| Other Financial Instruments | | $— | | $— | | $— | | $— |
Repurchase Agreements – The fund may enter into repurchase agreements with approved counterparties. Each repurchase agreement is recorded at cost. The fund requires that the securities collateral in a repurchase transaction be transferred to a custodian. The fund monitors, on a daily basis, the value of the collateral to ensure that its value, including accrued interest, is greater than amounts owed to the fund under each such repurchase agreement. The fund and other funds managed by Massachusetts Financial Services Company (MFS), may utilize a joint trading account for the purpose of entering into one or more repurchase agreements.
Indemnifications – Under the fund’s organizational documents, its officers and trustees may be indemnified against certain liabilities and expenses arising out of the performance of their duties to the fund. Additionally, in the normal course of business, the fund enters into agreements with service providers that may contain indemnification clauses. The fund’s maximum exposure under these agreements is unknown as this would involve future claims that may be made against the fund that have not yet occurred.
Investment Transactions and Income – Investment transactions are recorded on the trade date. Interest income is recorded on the accrual basis. All premium and discount is amortized or accreted for financial statement purposes in accordance with U.S. generally accepted accounting principles. Dividends received in cash are recorded on the ex-dividend date. Certain dividends from foreign securities will be recorded when the fund is informed of the dividend if such information is obtained subsequent to the ex-dividend date. Dividend and interest payments received in additional securities are recorded on the ex-dividend or ex-interest date in an amount equal to the value of the security on such date.
The fund may receive proceeds from litigation settlements. Any proceeds received from litigation involving portfolio holdings are reflected in the Statement of Operations in realized gain/loss if the security has been disposed of by the fund or in unrealized gain/loss if the security is still held by the fund. Any other proceeds from litigation not related to portfolio holdings are reflected as other income in the Statement of Operations.
Fees Paid Indirectly – The fund’s custody fee may be reduced according to an arrangement that measures the value of cash deposited with the custodian by the fund. This amount, for the year ended December 31, 2008, is shown as a reduction of total expenses on the Statement of Operations.
Tax Matters and Distributions – The fund intends to qualify as a regulated investment company, as defined under Subchapter M of the Internal Revenue Code, and to distribute all of its taxable income, including realized capital gains. As a result, no provision for federal income tax is required. The fund’s federal tax return for the prior fiscal year remains subject to examination by the Internal Revenue Service. Foreign taxes, if any, have been accrued by the fund in the accompanying financial statements.
Distributions to shareholders are recorded on the ex-dividend date. Income and capital gain distributions are determined in accordance with income tax regulations, which may differ from U.S. generally accepted accounting principles. Certain capital accounts in the financial statements are periodically adjusted for permanent differences in order to reflect their tax character. These adjustments have no impact on net assets or net asset value per share. Temporary differences which arise from recognizing certain items of income, expense, gain or loss in different periods for financial statement and tax purposes will reverse at some time in the future. Distributions in excess of net investment income or net realized gains are temporary overdistributions for financial statement purposes resulting from differences in the recognition or classification of income or distributions for financial statement and tax purposes.
During the period ended December 31, 2008, there were no significant adjustments due to differences between book and tax accounting.
15
Notes to Financial Statements – continued
The tax character of distributions declared to shareholders for the last two fiscal years is as follows:
| | | | |
| | | 12/31/08 | | 12/31/07 |
| Ordinary income (including any short-term capital gains) | | $29,447 | | $1,246 |
| Tax return of capital (b) | | 42 | | 254 |
| Total distributions | | $29,489 | | $1,500 |
| | (b) | Distributions in excess of tax basis earnings and profits are reported in the financial statements as a tax return of capital. | |
The federal tax cost and the tax basis components of distributable earnings were as follows:
| | | |
| As of 12/31/08 | | | |
| Cost of investments | | $4,478,127 | |
| Gross appreciation | | 37,366 | |
| Gross depreciation | | (1,450,015 | ) |
| Net unrealized appreciation (depreciation) | | $(1,412,649 | ) |
| Capital loss carryforwards | | (255,285 | ) |
| Post-October capital loss deferral | | (324,226 | ) |
As of December 31, 2008, the fund had capital loss carryforwards available to offset future realized gains. Such losses expire as follows:
Multiple Classes of Shares of Beneficial Interest – The fund offers multiple classes of shares, which differ in their respective distribution fees. The fund’s income, realized and unrealized gain (loss), and common expenses are allocated to shareholders based on the daily net assets of each class. Dividends are declared separately for each class. Differences in per share dividend rates are generally due to differences in separate class expenses.
| (3) | | Transactions with Affiliates |
Investment Adviser – The fund has an investment advisory agreement with MFS to provide overall investment management and related administrative services and facilities to the fund. The management fee is computed daily and paid monthly at an annual rate of 0.60% of the fund’s average daily net assets.
The investment adviser has agreed in writing to pay a portion of the fund’s total annual operating expenses, exclusive of interest, taxes, extraordinary expenses, brokerage and transaction costs and investment-related expenses, such that the total annual operating expenses of the fund do not exceed 0.60% for the Initial Class shares and 0.85% for the Service Class shares, based on the average daily net assets of each share class. This written agreement will continue until April 30, 2010. For the year ended December 31, 2008, this reduction amounted to $94,817 and is reflected as a reduction of total expenses in the Statement of Operations.
Distributor – MFS Fund Distributors, Inc. (MFD), a wholly-owned subsidiary of MFS, is the distributor of shares of the fund. The Trustees have adopted a distribution plan for the Service Class shares pursuant to Rule 12b-1 under the Investment Company Act of 1940.
The fund’s distribution plan provides that the fund will pay MFD distribution fees equal to 0.25% per annum of its average daily net assets attributable to Service Class shares as partial consideration for services performed and expenses incurred by MFD and financial intermediaries in connection with the sale and distribution of the fund’s Service Class shares and the sale and distribution of the variable annuity or variable life insurance contracts investing indirectly in Service Class shares. MFD may subsequently pay all, or a portion, of the distribution fees to financial intermediaries.
Shareholder Servicing Agent – MFS Service Center, Inc. (MFSC), a wholly-owned subsidiary of MFS, has contracted to provide transfer agent and recordkeeping functions in connection with the issuance, transfer, and redemption of each class of shares of the fund under a Shareholder Servicing Agent Agreement. During the year ended December 31, 2008, the fund did not pay MFSC a fee for this service.
Administrator – MFS provides certain financial, legal, shareholder communications, compliance, and other administrative services to the fund. Under an administrative services agreement, the fund partially reimburses MFS the costs incurred to provide these services. The fund is charged an annual fixed amount of $10,000 plus a fee based on average daily net assets.
The administrative services fee incurred for the year ended December 31, 2008 was equivalent to an annual effective rate of 0.2388% of the fund’s average daily net assets.
16
Notes to Financial Statements – continued
Trustees’ and Officers’ Compensation – The fund pays compensation to trustees in the form of a retainer, attendance fees, and additional compensation to the Board chairperson. The fund does not pay compensation directly to officers of the fund who are also officers of the investment adviser, all of whom receive remuneration for their services to the fund from MFS. Certain officers of the fund are officers or directors of MFS, MFD, and MFSC.
Other – This fund and certain other MFS funds (the funds) have entered into services agreements (the Agreements) which provide for payment of fees by the funds to Tarantino LLC and Griffin Compliance LLC in return for the provision of services of an Independent Chief Compliance Officer (ICCO) and Assistant ICCO, respectively, for the funds. The ICCO and Assistant ICCO are officers of the funds and the sole members of Tarantino LLC and Griffin Compliance LLC, respectively. The funds can terminate the Agreements with Tarantino LLC and Griffin Compliance LLC at any time under the terms of the Agreements.
MFS has agreed to bear all expenses associated with office space, other administrative support, and supplies provided to the ICCO and Assistant ICCO. For the year ended December 31, 2008, the aggregate fees paid by the fund to Tarantino LLC and Griffin Compliance LLC were $42 and are included in miscellaneous expense on the Statement of Operations.
On December 18, 2007, MFS purchased 250,000 shares of both the Initial Class and Service Class for an aggregate amount of $5,000,000. At December 31, 2008, MFS was the sole shareholder of both classes.
Purchases and sales of investments, other than U.S. Government securities, purchased option transactions, and short-term obligations, aggregated $2,085,324 and $2,089,779, respectively.
| (5) | | Shares of Beneficial Interest |
The fund’s Declaration of Trust permits the Trustees to issue an unlimited number of full and fractional shares of beneficial interest. Transactions in fund shares were as follows:
| | | | | | | | |
| | | Year ended 12/31/08 | | Year ended 12/31/07 (c) |
| | | Shares | | Amount | | Shares | | Amount |
| Shares sold | | | | | | | | |
Initial Class | | — | | $— | | 250,000 | | $2,500,000 |
Service Class | | — | | — | | 250,000 | | 2,500,000 |
| | — | | $— | | 500,000 | | $5,000,000 |
| Shares issued to shareholders in reinvestment of distributions | | | | | | | | |
Initial Class | | 2,989 | | $17,363 | | 85 | | $862 |
Service Class | | 2,087 | | 12,126 | | 63 | | 638 |
| | 5,076 | | $29,489 | | 148 | | $1,500 |
| Net change | | | | | | | | |
Initial Class | | 2,989 | | $17,363 | | 250,085 | | $2,500,862 |
Service Class | | 2,087 | | 12,126 | | 250,063 | | 2,500,638 |
| | 5,076 | | $29,489 | | 500,148 | | $5,001,500 |
| (c) | For the period from the commencement of the fund’s investment operations, December 18, 2007, through the stated period end. |
The fund and other funds managed by MFS participate in a $1 billion unsecured committed line of credit provided by a syndication of banks under a credit agreement. In addition, the fund and other funds managed by MFS have established uncommitted borrowing arrangements with certain banks. Borrowings may be made for temporary financing needs. Interest is charged to each fund, based on its borrowings, generally at a rate equal to the Federal Reserve funds rate plus 0.30%. In addition, a commitment fee, based on the average daily, unused portion of the committed line of credit, is allocated among the participating funds at the end of each calendar quarter. For the year ended December 31, 2008, the fund’s commitment fee and interest expense were $15 and $0, respectively, and are included in miscellaneous expense on the Statement of Operations.
17
REPORT OF INDEPENDENT REGISTERED PUBLIC ACCOUNTING FIRM
To the Board of Trustees of MFS Variable Insurance Trust II and the Shareholders of
MFS Blended Research Growth Portfolio:
We have audited the accompanying statement of assets and liabilities, including the portfolio of investments, of MFS Blended Research Growth Portfolio (the “Fund”) (one of the portfolios comprising MFS Variable Insurance Trust II) as of December 31, 2008, and the related statement of operations for the year then ended, the statements of changes in net assets and financial highlights for the year then ended and for the period from December 18, 2007 (commencement of operations) through December 31, 2007. These financial statements and financial highlights are the responsibility of the Fund’s management. Our responsibility is to express an opinion on these financial statements and financial highlights based on our audits.
We conducted our audits in accordance with the standards of the Public Company Accounting Oversight Board (United States). Those standards require that we plan and perform the audit to obtain reasonable assurance about whether the financial statements and financial highlights are free of material misstatement. The Fund is not required to have, nor were we engaged to perform, an audit of its internal control over financial reporting. Our audits included consideration of internal control over financial reporting as a basis for designing audit procedures that are appropriate in the circumstances, but not for the purpose of expressing an opinion on the effectiveness of the Fund’s internal control over financial reporting. Accordingly, we express no such opinion. An audit also includes examining, on a test basis, evidence supporting the amounts and disclosures in the financial statements, assessing the accounting principles used and significant estimates made by management, as well as evaluating the overall financial statement presentation. Our procedures included confirmation of securities owned as of December 31, 2008, by correspondence with the custodian and brokers. We believe that our audits provide a reasonable basis for our opinion.
In our opinion, the financial statements and financial highlights referred to above present fairly, in all material respects, the financial position of MFS Blended Research Growth Portfolio as of December 31, 2008, the results of its operations for the year then ended, the changes in its net assets and the financial highlights for the year then ended and for the period from December 18, 2007 (commencement of operations) through December 31, 2007, in conformity with accounting principles generally accepted in the United States of America.
DELOITTE & TOUCHE LLP
Boston, Massachusetts
February 17, 2009
18
TRUSTEES AND OFFICERS – IDENTIFICATION AND BACKGROUND
The Trustees and officers of the Trust, as of February 1, 2009, are listed below, together with their principal occupations during the past five years. (Their titles may have varied during that period.) The address of each Trustee and officer is 500 Boylston Street, Boston, Massachusetts 02116.
| | | | | | |
Name, Date of Birth | | Position(s) Held
with Fund | | Trustee/Officer
Since (1) | | Principal Occupations During the Past Five Years and
Other Directorships (2) |
| INTERESTED TRUSTEE | | | | |
David D. Horn (3) (born 6/07/41) | | Trustee | | April 1986 | | Private investor; Sun Life Assurance Company of Canada, Senior Vice President and General Manager for the United States (until 1997); Director (until March 2004) |
| | |
| INDEPENDENT TRUSTEES | | | | |
J. Kermit Birchfield (born 1/08/40) | | Chairman | | May 1997 | | Consultant; Century Partners, Inc. (investments), Director; Displaytech, Inc. (technology), Director; Dessin Fournir LLC (furniture manufacturer), Director (2005 to present); Intermountain Gas Company, Inc. & Intermountain Industries, Inc. (oil & gas exploration and production), Director; Site Watch LLC (software to monitor oil tanks), Managing Director (2006 to present); Juridica Investments (fund investing in judicial matters), Director (2007 to present); HPSC, Inc. (medical financing), Director (until January 2004) |
| | | |
Robert C. Bishop (born 1/13/43) | | Trustee | | May 2001 | | AutoImmune, Inc. (pharmaceutical product development), Chairman, President and Chief Executive Officer; Caliper Life Sciences Corp. (laboratory analytical instruments), Director; Millipore Corporation (purification/filtration products), Director; Waterstreet Capital (leverage buyouts), Advisory Board (August 2006 to present); Optobionics Corporation (ophthalmic devices), Director (2002 to 2007) |
| | | |
Frederick H. Dulles (born 3/12/42) | | Trustee | | May 2001 | | Ten State International Law PLLC (law firm), Of Counsel (since 2006); Prudential Carolina Real Estate, (real estate), Broker (since 2006); Free Enterprise Foundation, Inc. (research institute), Director & Secretary (until 2008); Disher, Hamrick & Myers Residential, Inc. (real estate) Broker (2005 until 2006); Frederick H. Dulles law practice (until 2006); Ten State Street LLP (law firm), Member (until 2005) |
| | | |
Marcia A. Kean (born 6/30/48) | | Trustee | | April 2005 | | Feinstein Kean Healthcare (consulting), Chief Executive Officer |
| | | |
Ronald G. Steinhart (born 6/15/40) | | Trustee | | May 2001 | | Private investor; Penske Automotive Group (automotive retailer), Director; Animal Health International, Inc. (animal health products), Director (since 2007); Texas Industries (concrete/aggregates/cement), Director (since 2007); Penson Worldwide, Inc. (securities clearance), Director (since 2006); Carreker Corporation (technology consulting) Director (until 2005); Prentiss Properties Trust (real estate investment trust), Director (until 2006) |
| | | |
Haviland Wright (born 7/21/48) | | Trustee | | May 2001 | | Profitability of Hawaii (software), Chief Development Officer (since December 2008); Elixir Technologies Corporation (software) Director (since 2005); Nano Loa Inc. (liquid crystal displays), Director |
| | |
| TRUSTEE EMERITUS | | | | |
Samuel Adams (born 10/19/25) | | Trustee Emeritus | | | | Retired; K&L Gates LLP (law firm), Of Counsel |
| | |
| OFFICERS | | | | |
Maria F. Dwyer (4) (born 12/01/58) | | President | | November 2005 | | Massachusetts Financial Services Company, Executive Vice President and Chief Regulatory Officer (since March 2004) Chief Compliance Officer (since December 2006); Fidelity Management & Research Company, Vice President (prior to March 2004); Fidelity Group of Funds, President and Treasurer (until March 2004) |
| | | |
Christopher R. Bohane (4) (born 1/18/74) | | Assistant Secretary and Assistant Clerk | | July 2005 | | Massachusetts Financial Services Company, Vice President and Senior Counsel |
| | | |
John M. Corcoran (4) (born 4/13/65) | | Treasurer | | October 2008 | | Massachusetts Financial Services Company, Senior Vice President (since October 2008); State Street Bank and Trust (financial services provider), Senior Vice President, (until September 2008) |
| | | |
Ethan D. Corey (4) (born 11/21/63) | | Assistant Secretary and Assistant Clerk | | July 2005 | | Massachusetts Financial Services Company, Senior Vice President and Associate General Counsel (since 2004); Dechert LLP (law firm), Counsel (prior to December 2004) |
| | | |
David L. DiLorenzo (4) (born 8/10/68) | | Assistant Treasurer | | July 2005 | | Massachusetts Financial Services Company, Vice President (since June 2005); JP Morgan Investor Services, Vice President (until June 2005) |
| | | |
Timothy M. Fagan (4) (born 7/10/68) | | Assistant Secretary and Assistant Clerk | | September 2005 | | Massachusetts Financial Services Company, Vice President and Senior Counsel (since September 2005); John Hancock Advisers, LLC, Vice President, Senior Attorney and Chief Compliance Officer (until August 2005) |
19
Trustees and Officers – continued
| | | | | | |
Name, Date of Birth | | Position(s) Held
with Fund | | Trustee/Officer
Since (1) | | Principal Occupations During the Past Five Years and
Other Directorships (2) |
Mark D. Fischer (4) (born 10/27/70) | | Assistant Treasurer | | July 2005 | | Massachusetts Financial Services Company, Vice President (since May 2005); JP Morgan Investment Management Company, Vice President (until May 2005) |
| | | |
Robyn L. Griffin (born 7/04/75) | | Assistant Independent Chief Compliance Officer | | August 2008 | | Griffin Compliance LLC (provider of compliance services), Principal (since August 2008); State Street Corporation (financial services provider), Mutual Fund Administration Assistant Vice President (October 2006 – July 2008); Liberty Mutual Group (insurance), Personal Market Assistant Controller (April 2006 – October 2006); Deloitte & Touche LLP (professional services firm), Senior Manager (prior to April 2006) |
| | | |
Brian E. Langenfeld (4) (born 3/07/73) | | Assistant Secretary and Assistant Clerk | | May 2006 | | Massachusetts Financial Services Company, Vice President and Senior Counsel (since May 2006); John Hancock Advisers, LLC, Assistant Vice President and Counsel (until April 2006) |
| | | |
Ellen Moynihan (4) (born 11/13/57) | | Assistant Treasurer | | May 1997 | | Massachusetts Financial Services Company, Senior Vice President |
| | | |
Susan S. Newton (4) (born 3/07/50) | | Assistant Secretary and Assistant Clerk | | May 2005 | | Massachusetts Financial Services Company, Senior Vice President and Associate General Counsel (since April 2005); John Hancock Advisers, LLC, Senior Vice President, Secretary and Chief Legal Officer (until April 2005) |
| | | |
Susan A. Pereira (4) (born 11/05/70) | | Assistant Secretary and Assistant Clerk | | July 2005 | | Massachusetts Financial Services Company, Vice President and Senior Counsel (since June 2004); Bingham McCutchen LLP (law firm), Associate (until June 2004) |
| | | |
Mark N. Polebaum (4) (born 5/01/52) | | Secretary and Clerk | | February 2006 | | Massachusetts Financial Services Company, Executive Vice President, General Counsel and Secretary (since January 2006); Wilmer Cutler Pickering Hale and Dorr LLP (law firm), Partner (until January 2006) |
| | | |
Frank L. Tarantino (born 3/07/44) | | Independent Chief Compliance Officer | | September 2004 | | Tarantino LLC (provider of compliance services), Principal (since June 2004); CRA Business Strategies Group (consulting services), Executive Vice President (until June 2004) |
| | | |
Richard S. Weitzel (4) (born 7/16/70) | | Assistant Secretary and Assistant Clerk | | October 2007 | | Massachusetts Financial Services Company, Vice President and Assistant General Counsel (since 2004); Massachusetts Department of Business and Technology, General Counsel (until April 2004) |
| | | |
James O. Yost (4) (born 6/12/60) | | Assistant Treasurer | | April 1992 | | Massachusetts Financial Services Company, Senior Vice President |
| (1) | Date first appointed to serve as Trustee/Officer of an MFS fund or a Compass variable account. Each Trustee has served continuously since appointment. |
| (2) | Directorships or trusteeships of companies required to report to the Securities and Exchange Commission (i.e., “public companies”). |
| (3) | “Interested person” of the Trust, within the meaning of the Investment Company Act of 1940 (referred to as the 1940 Act), which is the principal federal law governing investment companies like the Trust, as a result of position with Sun Life of Canada (U.S.). The address of Sun Life of Canada (U.S.) is One Sun Life Executive Park, Wellesley Hills, Massachusetts 02481. |
| (4) | “Interested person” of MFS within the meaning of the 1940 Act. The address of MFS is 500 Boylston Street, Boston, Massachusetts 02116. |
The Trust does not hold annual meetings for the purpose of electing Trustees, and Trustees are not elected for fixed terms. Each Trustee and officer holds office until his or her successor is chosen and qualified, or until his or her earlier death, resignation, retirement or removal.
All Trustees currently serve as Trustees of the Trust and have served in that capacity since originally elected or appointed. All of the Trustees are also Managers of the Compass Variable Accounts. The executive officers of the Trust hold similar offices for the Compass Variable Accounts and other funds in the MFS fund complex. As of January 1, 2009, each Trustee serves as a Trustee or Manager of 35 Accounts/Funds.
The Statement of Additional Information contains further information about the Trustees and is available without charge upon request by calling 1-800-752-7215.
| | |
Investment Adviser
Massachusetts Financial Services Company 500 Boylston Street, Boston, MA 02116-3741 | | Custodian State Street Bank and Trust 1 Lincoln Street, Boston, MA 02111-2900 |
Distributor
MFS Fund Distributors, Inc. 500 Boylston Street, Boston, MA 02116-3741 | | Independent Registered Public Accounting Firm Deloitte & Touche LLP 200 Berkeley Street, Boston, MA 02116 |
Portfolio Manager Matthew Krummell | | |
20
BOARD REVIEW OF INVESTMENT ADVISORY AGREEMENT
A discussion regarding the Board’s most recent review and renewal of the fund’s Investment Advisory Agreement with MFS is available by clicking on the fund’s name under “Variable Insurance Portfolios – VIT II” in the “Products and Performance” section of the MFS Web site (mfs.com).
PROXY VOTING POLICIES AND INFORMATION
A general description of the MFS funds’ proxy voting policies and procedures is available without charge, upon request, by calling
1-800-225-2606, by visiting the Proxy Voting section of mfs.com or by visiting the SEC’s Web site at http://www.sec.gov.
Information regarding how the fund voted proxies relating to portfolio securities during the most recent twelve-month period ended June 30 is available without charge by visiting the Proxy Voting section of mfs.com or by visiting the SEC’s Web site at http://www.sec.gov.
QUARTERLY PORTFOLIO DISCLOSURE
The fund will file a complete schedule of portfolio holdings with the Securities and Exchange Commission (the Commission) for the first and third quarters of each fiscal year on Form N-Q. The fund’s Form N-Q may be reviewed and copied at the:
Public Reference Room
Securities and Exchange Commission
100 F Street, NE, Room 1580
Washington, D.C. 20549
Information on the operation of the Public Reference Room may be obtained by calling the Commission at 1-800-SEC-0330. The fund’s Form N-Q is available on the EDGAR database on the Commission’s Internet Web site at http://www.sec.gov, and copies of this information may be obtained, upon payment of a duplicating fee, by electronic request at the following e-mail address: publicinfo@sec.gov or by writing the Public Reference Section at the above address.
21
MFS® PRIVACY NOTICE
Privacy is a concern for every investor today. At MFS Investment Management® and the MFS funds, we take this concern very seriously. We want you to understand our policies about the investment products and services that we offer, and how we protect the nonpublic personal information of investors who have a direct relationship with us and our wholly owned subsidiaries.
Throughout our business relationship, you provide us with personal information. We maintain information and records about you, your investments, and the services you use. Examples of the nonpublic personal information we maintain include
| | Ÿ | | data from investment applications and other forms |
| | Ÿ | | share balances and transactional history with us, our affiliates, or others |
| | Ÿ | | facts from a consumer reporting agency |
We do not disclose any nonpublic personal information about our customers or former customers to anyone, except as permitted by law. We may share nonpublic personal information with third parties or certain of our affiliates in connection with servicing your account or processing your transactions. We may share information with companies or financial institutions that perform marketing services on our behalf or with other financial institutions with which we have joint marketing arrangements, subject to any legal requirements.
Authorization to access your nonpublic personal information is limited to appropriate personnel who provide products, services, or information to you. We maintain physical, electronic, and procedural safeguards to help protect the personal information we collect about you.
If you have any questions about the MFS privacy policy, please call 1-800-225-2606 any business day between 8 a.m. and 8 p.m. Eastern time.
Note: If you own MFS products or receive MFS services in the name of a third party such as a bank or broker-dealer, their privacy policy may apply to you instead of ours.
22


MFS® BLENDED RESEARCHSM VALUE PORTFOLIO
The report is prepared for the general information of contract owners. It is authorized for distribution to prospective investors only when preceded or accompanied by a current prospectus.
NOT FDIC INSURED Ÿ MAY LOSE VALUE Ÿ NO BANK GUARANTEE Ÿ NOT A DEPOSIT Ÿ NOT INSURED BY ANY FEDERAL GOVERNMENT AGENCY OR NCUA/NCUSIF
LETTER FROM THE CEO

Dear Contract Owners:
The market downturns and economic setbacks of late probably rank among the worst financial declines most of us have experienced. Inevitably, people may be questioning their commitment to investing. Still, it is important to remember that downturns are an inescapable part of the business cycle. Such troughs have been seen before, and if we can use history as a guide, market recoveries typically have followed.
Recent events have clearly shown us the value of certain types of investments. In this environment, two of the hallmarks of mutual funds — transparency and liquidity — have become critically important. Unlike some other types of investments, the operations of mutual funds are relatively transparent to their shareholders. With their daily redemption feature, mutual funds also generally provide easy, convenient access to one’s money. Through these recent market upheavals, this level of liquidity enhanced the ability of mutual fund investors to respond and modify their investments as they and their advisors saw fit — a flexibility that those in less liquid investments simply did not have at their disposal.
At MFS® we take particular pride in how well mutual funds can serve investors because we invented the mutual fund in the United States. Established in 1924, Massachusetts Investors Trust was the nation’s first fund. Recent market events only reinforce what we have learned through 85 years — that mutual funds provide unique features that are important to investors in any type of market climate.
Respectfully,

Robert J. Manning
Chief Executive Officer and Chief Investment Officer
MFS Investment Management®
February 17, 2009
The opinions expressed in this letter are subject to change, may not be relied upon for investment advice, and no forecasts can be guaranteed.
Before investing, consider the fund’s investment objectives, risks, charges, and expenses. For a prospectus containing this and other information, contact your investment professional or view online. Read it carefully.
MFS Fund Distributors, Inc., 500 Boylston Street, Boston, MA 02116
1
PORTFOLIO COMPOSITION
Portfolio structure

| | |
| Top ten holdings | | |
| Exxon Mobil Corp. | | 8.0% |
| AT&T, Inc. | | 3.7% |
| Procter & Gamble Co. | | 3.3% |
| JPMorgan Chase & Co. | | 3.3% |
| Chevron Corp. | | 2.9% |
| General Electric Co. | | 2.9% |
| Pfizer, Inc. | | 2.6% |
| Wells Fargo & Co. | | 2.4% |
| Bank of America Corp. | | 2.1% |
| Amgen, Inc. | | 1.8% |
| | |
| Equity sectors | | |
| Financial Services | | 22.6% |
| Energy | | 15.6% |
| Utilities & Communications | | 14.5% |
| Health Care | | 12.7% |
| Industrial Goods & Services | | 8.3% |
| Consumer Staples | | 7.9% |
| Leisure | | 4.6% |
| Retailing | | 4.5% |
| Basic Materials | | 2.7% |
| Technology | | 2.2% |
| Autos & Housing | | 0.9% |
| Transportation | | 0.8% |
| Special Products & Services | | 0.6% |
Percentages are based on net assets as of 12/31/08.
The portfolio is actively managed and current holdings may be different.
2
MANAGEMENT REVIEW
Summary of Results
For the twelve months ended December 31, 2008, Initial Class shares of the MFS Blended Research Value Portfolio (the “fund”) provided a total return of –34.44%, while Service Class shares of the fund provided a total return of –34.66%. These compare with a return of –36.85% for the fund’s benchmark, the Russell 1000 Value Index.
Market Environment
The U.S. economy and financial markets experienced significant deterioration and extraordinary volatility over the reporting period. U.S. economic growth slowed significantly, despite the short-term bounce from the second quarter fiscal stimulus. Strong domestic headwinds included accelerated deterioration in the housing market, anemic corporate investment, a rapidly declining job market, and a much tighter credit environment. During the period, a seemingly continuous series of tumultuous financial events hammered markets, including: the distressed sale of failing Bear Stearns to JPMorgan, the conservatorship of Government Sponsored Enterprises (GSEs) Fannie Mae and Freddie Mac, the bankruptcy of investment bank Lehman Brothers, the Federal Reserve Bank’s complex intervention of insurance company American International Group (AIG), the nationalization of several large European banks, the failure of Washington Mutual, and the distressed sale of Wachovia. As a result of this barrage of turbulent news, global equity markets pushed significantly lower and credit markets witnessed the worst dislocation since the beginning of the credit crisis. Though conditions improved towards the end of the period, the state of financial and macroeconomic dislocation remained severe.
While reasonably resilient during the first half of the period, the global economy and financial system increasingly experienced considerable negative spillovers from the U.S. slowdown. Not only did Europe and Japan show obvious signs of economic softening, the more powerful engine of global growth – emerging markets – also displayed weakening dynamics.
During the reporting period, the U.S. Federal Reserve Board cut interest rates aggressively and introduced a multitude of new lending facilities to alleviate ever-tightening credit markets, while the U.S. federal government moved quickly to design and implement a meaningful fiscal stimulus package. Although several other global central banks also cut rates, the dilemma of rising energy and food prices heightened concerns among central bankers that inflationary expectations might become unhinged despite weaker growth. Only later in the reporting period did slowing global growth result in a very precipitous decline in commodity prices, which significantly eased inflation and inflationary expectations. As inflationary concerns diminished in the face of global deleveraging, and equity and credit markets deteriorated more sharply, a coordinated rate cut marked the beginning of much more aggressive easing by the major global central banks.
Contributors to Performance
Strong stock selection and, to a lesser extent, an underweighted position in the financial services sector boosted performance relative to the Russell 1000 Value Index. Positioning in financial services firm Citigroup (g) and insurance firm American International Group (AIG) (g) helped as the fund was less impacted by the stock’s price decline, in the latter part of the reporting period, than the benchmark. Not holding poor-performing financial services firm Wachovia and mortgage financier Federal National Mortgage Association (Fannie Mae) also helped. Holdings of apartment owner Equity Residential and insurance company St. Paul Travelers bolstered relative performance.
Stock selection in the leisure sector also helped relative results. The fund’s holdings of casual dining restaurants operator Darden Restaurants (aa) aided relative performance over the reporting period. Shares of Darden Restaurants rose as the company reported better-than-expected earnings. The company attributed this partly to increased same-store sales in its two largest brands, Olive Garden and Red Lobster.
Top relative contributors in other sectors included global pharmaceutical company Bristol Myers Squibb and utilities company PG&E.
The fund’s cash position was also a contributor to relative performance. The fund holds cash to buy new holdings and to provide liquidity. In a period when equity markets declined, as measured by the fund’s benchmark, holding cash helped performance versus the benchmark, which has no cash position.
Detractors from Performance
Stock selection in the utilities and communications sector was the primary detractor from performance. Holdings of gas pipeline company Williams Cos. held back relative returns as the stock underperformed the benchmark over the period. Additionally, the fund’s overweighted position in gas pipeline company El Paso over the latter part of the period hurt relative results as the stock’s price declined.
3
Management Review – continued
Although the financial services sector was an area of relative strength overall, several stocks within this sector detracted from results. These included insurance company Genworth Financial and investment services firm Prudential Financial. Our underweighted position in financial services firm Wells Fargo detracted from relative performance as the stock outperformed the benchmark. Holdings of financial advisory firm Morgan Stanley (g), which was sold off in the latter part of the reporting period, also hindered relative returns.
Elsewhere, an underweighted position in diversified medical products maker Johnson & Johnson and an overweighted position in cruise line operator Royal Caribbean Cruises hindered relative results. Shares of Royal Caribbean suffered during the first part of the reporting period due to high fuel costs and more recently due to weak consumer spending. Additionally, the fund’s positioning in integrated steelmaker U.S. Steel (g) and employee benefits company Cigna, in the latter part of the reporting period, hurt relative performance as the prices of both stocks dropped precipitously during that time.
Respectfully,
Jonathan Sage
Portfolio Manager
(aa) | | Security is not a benchmark constituent. |
| (g) | | Security was not held in the portfolio at period end. |
The views expressed in this report are those of the portfolio manager only through the end of the period of the report as stated on the cover and do not necessarily reflect the views of MFS or any other person in the MFS organization. These views are subject to change at any time based on market or other conditions, and MFS disclaims any responsibility to update such views. These views may not be relied upon as investment advice or an indication of trading intent on behalf of any MFS portfolio. References to specific securities are not recommendations of such securities, and may not be representative of any MFS portfolio’s current or future investments.
4
PERFORMANCE SUMMARY THROUGH 12/31/08
The following chart illustrates the historical performance of the fund in comparison to its benchmark(s). Benchmark comparisons are unmanaged; do not reflect any fees or expenses; and cannot be invested in directly. The performance of other share classes will be greater than or less than that of the class depicted below. (See Notes to Performance Summary.)
Performance data shown represents past performance and is no guarantee of future results. Investment return and principal value fluctuate so your units, when sold, may be worth more or less than the original cost; current performance may be lower or higher than quoted. The performance shown does not reflect the deduction of taxes, if any, that a contract holder would pay on fund distributions or the redemption of contract units. The returns for the fund shown also do not reflect the deduction of expenses associated with variable products, such as mortality and expense risk charges, separate account charges, and sales charges imposed by the insurance company separate accounts. Such expenses would reduce the overall returns shown.
Growth of a hypothetical $10,000 investment (t)
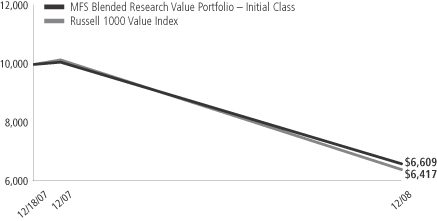
Total rates of return through 12/31/08
Average Annual Total Returns
| | | | | | | | | | | | |
| | | Share class | | Class inception date | | 1-yr | | Life (t) | | |
| | | Initial Class | | 12/18/07 | | (34.44)% | | (32.89)% | | |
| | | Service Class | | 12/18/07 | | (34.66)% | | (33.12)% | | |
Comparative Benchmark
| | | | | | | | | | | | |
| | | Russell 1000 Value Index (f) | | | | (36.85)% | | (34.56)% | | |
| (f) | Source: FactSet Research Systems Inc. |
| (t) | For the period from the commencement of the fund’s investment operations, December 18, 2007 through the stated period end. |
Benchmark Definition
Russell 1000 Value Index – constructed to provide a comprehensive barometer for the value securities in the large-cap segment of the U.S. equity universe. Companies in this index generally have lower price-to-book ratios and lower forecasted growth values.
It is not possible to invest directly in an index.
Notes to Performance Summary
Performance results reflect any applicable expense subsidies and waivers in effect during the periods shown. Without such subsidies and waivers the fund’s performance results would be less favorable. Please see the prospectus for complete details. All results are historical and assume the reinvestment of any dividends and capital gains distributions.
From time to time the fund may receive proceeds from litigation settlements, without which performance would be lower.
5
EXPENSE TABLE
Fund Expenses Borne by the Contract Holders During the Period,
July 1, 2008 through December 31, 2008
As a contract holder of the fund, you incur ongoing costs, including management fees; distribution (12b-1) fees; and other fund expenses. This example is intended to help you understand your ongoing costs (in dollars) of investing in the fund and to compare these costs with the ongoing costs of investing in other mutual funds.
The example is based on an investment of $1,000 invested at the beginning of the period and held for the entire period July 1, 2008 through December 31, 2008.
Actual Expenses
The first line for each share class in the following table provides information about actual account values and actual expenses. You may use the information in this line, together with the amount you invested, to estimate the expenses that you paid over the period. Simply divide your account value by $1,000 (for example, an $8,600 account value divided by $1,000 = 8.6), then multiply the result by the number in the first line under the heading entitled “Expenses Paid During Period” to estimate the expenses you paid on your account during this period.
Hypothetical Example for Comparison Purposes
The second line for each share class in the following table provides information about hypothetical account values and hypothetical expenses based on the fund’s actual expense ratio and an assumed rate of return of 5% per year before expenses, which is not the fund’s actual return. The hypothetical account values and expenses may not be used to estimate the actual ending account balance or expenses you paid for the period. You may use this information to compare the ongoing costs of investing in the fund and other funds. To do so, compare this 5% hypothetical example with the 5% hypothetical examples that appear in the shareholder reports of the other funds.
Please note that the expenses shown in the table are meant to highlight the fund’s ongoing costs only and do not take into account the fees and expenses imposed under the variable contracts through which your investment in the fund is made. Therefore, the second line for each share class in the table is useful in comparing ongoing costs associated with an investment in vehicles (such as the fund) which fund benefits under variable annuity and variable life insurance contracts and to qualified pension and retirement plans only, and will not help you determine the relative total costs of investing in the fund through variable annuity and variable life insurance contracts. If the fees and expenses imposed under the variable contracts were included, your costs would have been higher.
| | | | | | | | | | |
| Share Class | | | | Annualized
Expense Ratio | | Beginning
Account Value
7/01/08 | | Ending
Account Value
12/31/08 | | Expenses Paid
During Period (p)
7/01/08-12/31/08 |
| Initial Class | | Actual | | 0.60% | | $1,000.00 | | $756.25 | | $2.65 |
| | Hypothetical (h) | | 0.60% | | $1,000.00 | | $1,022.12 | | $3.05 |
| Service Class | | Actual | | 0.85% | | $1,000.00 | | $754.55 | | $3.75 |
| | Hypothetical (h) | | 0.85% | | $1,000.00 | | $1,020.86 | | $4.32 |
| (h) | 5% class return per year before expenses. |
| (p) | Expenses paid is equal to each class’ annualized expense ratio, as shown above, multiplied by the average account value over the period, multiplied by the number of days in the period, divided by the number of days in the year. |
6
PORTFOLIO OF INVESTMENTS – 12/31/08
The Portfolio of Investments is a complete list of all securities owned by your fund. It is categorized by broad-based asset classes.
| | | | | |
| Issuer | | Shares/Par | | Value ($) |
| | | | | |
| COMMON STOCKS – 97.9% | | | | | |
| Aerospace – 2.1% | | | | | |
| Boeing Co. | | 210 | | $ | 8,953 |
| Lockheed Martin Corp. | | 90 | | | 7,567 |
| Northrop Grumman Corp. | | 820 | | | 36,933 |
| Raytheon Co. | | 340 | | | 17,354 |
| | | | | |
| | | | $ | 70,807 |
| | | | | |
| Airlines – 0.5% | | | | | |
| Southwest Airlines Co. | | 1,780 | | $ | 15,344 |
| | | | | |
| Apparel Manufacturers – 0.4% | | | | | |
| Coach, Inc. (a) | | 570 | | $ | 11,839 |
| | | | | |
| Automotive – 0.4% | | | | | |
| Johnson Controls, Inc. | | 780 | | $ | 14,165 |
| | | | | |
| Biotechnology – 1.8% | | | | | |
| Amgen, Inc. (a) | | 1,050 | | $ | 60,638 |
| | | | | |
| Broadcasting – 1.1% | | | | | |
| Time Warner, Inc. | | 2,710 | | $ | 27,263 |
| Walt Disney Co. | | 350 | | | 7,942 |
| | | | | |
| | | | $ | 35,205 |
| | | | | |
| Brokerage & Asset Managers – 0.2% | | | | | |
| Merrill Lynch & Co., Inc. | | 550 | | $ | 6,402 |
| | | | | |
| Business Services – 0.3% | | | | | |
| Western Union Co. | | 730 | | $ | 10,468 |
| | | | | |
| Cable TV – 2.0% | | | | | |
| Comcast Corp., “A” | | 1,840 | | $ | 31,059 |
| Time Warner Cable, Inc., “A” (a) | | 1,580 | | | 33,891 |
| | | | | |
| | | | $ | 64,950 |
| | | | | |
| Chemicals – 2.5% | | | | | |
| 3M Co. | | 610 | | $ | 35,099 |
| Dow Chemical Co. | | 650 | | | 9,809 |
| PPG Industries, Inc. | | 860 | | | 36,490 |
| | | | | |
| | | | $ | 81,398 |
| | | | | |
| Computer Software – 0.3% | | | | | |
| Oracle Corp. (a) | | 650 | | $ | 11,525 |
| | | | | |
| Computer Software – Systems – 0.6% | | | | | |
| International Business Machines Corp. | | 250 | | $ | 21,040 |
| | | | | |
| Construction – 0.5% | | | | | |
| NVR, Inc. (a) | | 36 | | $ | 16,425 |
| | | | | |
| Consumer Goods & Services – 3.6% | | | | | |
| Apollo Group, Inc., “A” (a) | | 150 | | $ | 11,493 |
| Procter & Gamble Co. | | 1,750 | | | 108,185 |
| | | | | |
| | | | $ | 119,678 |
| | | | | |
| Electrical Equipment – 3.2% | | | | | |
| General Electric Co. | | 5,860 | | $ | 94,932 |
| WESCO International, Inc. (a) | | 530 | | | 10,192 |
| | | | | |
| | | | $ | 105,124 |
| | | | | |
| | | | | |
| Issuer | | Shares/Par | | Value ($) |
| | | | | |
| COMMON STOCKS – continued | | | | | |
| Electronics – 0.5% | | | | | |
| National Semiconductor Corp. | | 1,640 | | $ | 16,515 |
| | | | | |
| Energy – Independent – 2.2% | | | | | |
| Apache Corp. | | 430 | | $ | 32,048 |
| Devon Energy Corp. | | 250 | | | 16,428 |
| Valero Energy Corp. | | 420 | | | 9,089 |
| XTO Energy, Inc. | | 440 | | | 15,519 |
| | | | | |
| | | | $ | 73,084 |
| | | | | |
| Energy – Integrated – 13.1% | | | | | |
| Chevron Corp. | | 1,310 | | $ | 96,901 |
| ConocoPhillips | | 570 | | | 29,526 |
| Exxon Mobil Corp. | | 3,310 | | | 264,237 |
| Hess Corp. | | 390 | | | 20,920 |
| Marathon Oil Corp. | | 800 | | | 21,888 |
| | | | | |
| | | | $ | 433,472 |
| | | | | |
| Engineering – Construction – 0.2% | | | | | |
| Fluor Corp. | | 170 | | $ | 7,628 |
| | | | | |
| Food & Beverages – 3.5% | | | | | |
| Archer Daniels Midland Co. | | 780 | | $ | 22,487 |
| Coca-Cola Co. | | 950 | | | 43,007 |
| General Mills, Inc. | | 280 | | | 17,010 |
| Pepsi Bottling Group, Inc. | | 1,420 | | | 31,964 |
| | | | | |
| | | | $ | 114,468 |
| | | | | |
| Food & Drug Stores – 0.6% | | | | | |
| CVS Caremark Corp. | | 640 | | $ | 18,394 |
| | | | | |
| Gaming & Lodging – 0.4% | | | | | |
| Royal Caribbean Cruises Ltd. | | 1,080 | | $ | 14,850 |
| | | | | |
| General Merchandise – 1.8% | | | | | |
| Family Dollar Stores, Inc. | | 790 | | $ | 20,595 |
| Wal-Mart Stores, Inc. | | 720 | | | 40,363 |
| | | | | |
| | | | $ | 60,958 |
| | | | | |
| Health Maintenance Organizations – 1.2% | | | | | |
| CIGNA Corp. | | 920 | | $ | 15,502 |
| WellPoint, Inc. (a) | | 540 | | | 22,750 |
| | | | | |
| | | | $ | 38,252 |
| | | | | |
| Insurance – 6.0% | | | | | |
| Allied World Assurance Co. Holdings Ltd. | | 740 | | $ | 30,044 |
| Aon Corp. | | 710 | | | 32,433 |
| Chubb Corp. | | 630 | | | 32,130 |
| Genworth Financial, Inc. | | 2,790 | | | 7,896 |
| MetLife, Inc. | | 520 | | | 18,127 |
| Prudential Financial, Inc. | | 660 | | | 19,972 |
| Travelers Cos., Inc. | | 1,260 | | | 56,952 |
| | | | | |
| | | | $ | 197,554 |
| | | | | |
| Leisure & Toys – 0.4% | | | | | |
| Hasbro, Inc. | | 410 | | $ | 11,960 |
| | | | | |
7
Portfolio of Investments – continued
| | | | | |
| Issuer | | Shares/Par | | Value ($) |
| | | | | |
| COMMON STOCKS – continued | | | | | |
| Machinery & Tools – 2.2% | | | | | |
| Cummins, Inc. | | 310 | | $ | 8,286 |
| Eaton Corp. | | 740 | | | 36,785 |
| Timken Co. | | 860 | | | 16,882 |
| United Rentals, Inc. (a) | | 1,111 | | | 10,132 |
| | | | | |
| | | | $ | 72,085 |
| | | | | |
| Major Banks – 13.2% | | | | | |
| Bank of America Corp. | | 4,930 | | $ | 69,414 |
| Bank of New York Mellon Corp. | | 1,190 | | | 33,713 |
| Goldman Sachs Group, Inc. | | 420 | | | 35,444 |
| JPMorgan Chase & Co. | | 3,420 | | | 107,833 |
| PNC Financial Services Group, Inc. | | 1,020 | | | 49,980 |
| Regions Financial Corp. | | 1,550 | | | 12,338 |
| State Street Corp. | | 890 | | | 35,004 |
| SunTrust Banks, Inc. | | 450 | | | 13,293 |
| Wells Fargo & Co. | | 2,700 | | | 79,596 |
| | | | | |
| | | | $ | 436,615 |
| | | | | |
| Medical & Health Technology & Services – 1.3% | | | |
| AmerisourceBergen Corp. | | 670 | | $ | 23,892 |
| Omnicare, Inc. | | 640 | | | 17,766 |
| | | | | |
| | | | $ | 41,658 |
| | | | | |
| Medical Equipment – 0.9% | | | | | |
| Boston Scientific Corp. (a) | | 2,110 | | $ | 16,331 |
| Zimmer Holdings, Inc. (a) | | 340 | | | 13,743 |
| | | | | |
| | | | $ | 30,074 |
| | | | | |
| Metals & Mining – 0.2% | | | | | |
| Cliffs Natural Resources, Inc. | | 260 | | $ | 6,659 |
| | | | | |
| Natural Gas – Distribution – 0.8% | | | | | |
| Sempra Energy | | 600 | | $ | 25,578 |
| | | | | |
| Natural Gas – Pipeline – 1.4% | | | | | |
| El Paso Corp. | | 2,750 | | $ | 21,533 |
| Williams Cos., Inc. | | 1,640 | | | 23,747 |
| | | | | |
| | | | $ | 45,280 |
| | | | | |
| Network & Telecom – 0.5% | | | | | |
| Cisco Systems, Inc. (a) | | 990 | | $ | 16,137 |
| | | | | |
| Oil Services – 0.3% | | | | | |
| Exterran Holdings, Inc. (a) | | 450 | | $ | 9,585 |
| | | | | |
| Other Banks & Diversified Financials – 1.2% | | | |
| Discover Financial Services | | 1,160 | | $ | 11,055 |
| SLM Corp. (a) | | 860 | | | 7,654 |
| TCF Financial Corp. | | 880 | | | 12,021 |
| U.S. Bancorp | | 420 | | | 10,504 |
| | | | | |
| | | | $ | 41,234 |
| | | | | |
| Personal Computers & Peripherals – 0.3% | | | |
| Western Digital Corp. (a) | | 950 | | $ | 10,878 |
| | | | | |
| Pharmaceuticals – 7.5% | | | | | |
| Bristol-Myers Squibb Co. | | 830 | | $ | 19,298 |
| Johnson & Johnson | | 1,010 | | | 60,428 |
| Merck & Co., Inc. | | 1,440 | | | 43,776 |
| Pfizer, Inc. | | 4,780 | | | 84,654 |
| | | | | |
| Issuer | | Shares/Par | | Value ($) |
| | | | | |
| COMMON STOCKS – continued | | | | | |
| Pharmaceuticals – continued | | | | | |
| Schering-Plough Corp. | | 650 | | $ | 11,070 |
| Wyeth | | 720 | | | 27,007 |
| | | | | |
| | | | $ | 246,233 |
| | | | | |
| Pollution Control – 0.6% | | | | | |
| Republic Services, Inc. | | 742 | | $ | 18,394 |
| | | | | |
| Real Estate – 2.0% | | | | | |
Apartment Investment & Management,
“A”, REIT | | 790 | | $ | 9,125 |
| Equity Residential, REIT | | 1,330 | | | 39,661 |
| Mack-Cali Realty Corp., REIT | | 710 | | | 17,395 |
| | | | | |
| | | | $ | 66,181 |
| | | | | |
| Restaurants – 0.7% | | | | | |
| Darden Restaurants, Inc. | | 850 | | $ | 23,953 |
| | | | | |
| Specialty Stores – 1.7% | | | | | |
| Home Depot, Inc. | | 830 | | $ | 19,107 |
| Lowe’s Cos., Inc. | | 970 | | | 20,874 |
| Staples, Inc. | | 550 | | | 9,856 |
| Tiffany & Co. | | 310 | | | 7,325 |
| | | | | |
| | | | $ | 57,162 |
| | | | | |
| Telephone Services – 6.9% | | | | | |
| AT&T, Inc. | | 4,320 | | $ | 123,120 |
| Embarq Corp. | | 810 | | | 29,128 |
| Qwest Communications International, Inc. | | 3,030 | | | 11,029 |
| Verizon Communications, Inc. | | 1,460 | | | 49,494 |
| Virgin Media, Inc. | | 2,660 | | | 13,273 |
| | | | | |
| | | | $ | 226,044 |
| | | | | |
| Tobacco – 1.1% | | | | | |
| Altria Group, Inc. | | 1,280 | | $ | 19,277 |
| Philip Morris International, Inc. | | 400 | | | 17,404 |
| | | | | |
| | | | $ | 36,681 |
| | | | | |
| Trucking – 0.3% | | | | | |
| FedEx Corp. | | 140 | | $ | 8,981 |
| | | | | |
| Utilities – Electric Power – 5.4% | | | | | |
| American Electric Power Co., Inc. | | 1,370 | | $ | 45,594 |
| Dominion Resources, Inc. | | 790 | | | 28,314 |
| Edison International | | 1,070 | | | 34,368 |
| PG&E Corp. | | 1,360 | | | 52,646 |
| Public Service Enterprise Group, Inc. | | 550 | | | 16,044 |
| | | | | |
| | | | $ | 176,966 |
| | | | | |
Total Common Stocks (Identified Cost, $4,465,814) | | | | $ | 3,228,521 |
| | | | | |
8
Portfolio of Investments – continued
| | | | | | | |
| Issuer | | Shares/Par | | Value ($) | |
| | | | | | | |
| |
| REPURCHASE AGREEMENTS – 2.9% | | | | |
| Goldman Sachs, 0.01%, dated 12/31/08, due 1/02/09, total to be received $95,000.05 (secured by U.S. Treasury and Federal Agency obligations and Mortgage Backed securities in a jointly traded account), at Cost | | $ | 95,000 | | $ | 95,000 | |
| | | | | | | |
Total Investments (Identified Cost, $4,560,814) | | | | | $ | 3,323,521 | |
| | | | | | | |
OTHER ASSETS, LESS LIABILITIES – (0.8)% | | | | | | (25,148 | ) |
| | | | | | | |
| Net Assets – 100.0% | | | | | $ | 3,298,373 | |
| | | | | | | |
| (a) | Non-income producing security. |
The following abbreviations are used in this report and are defined:
| REIT | | Real Estate Investment Trust |
See Notes to Financial Statements
9
FINANCIAL STATEMENTS | STATEMENT OF ASSETS AND LIABILITIES
This statement represents your fund’s balance sheet, which details the assets and liabilities comprising the total value of the fund.
| | | | | |
At 12/31/08 | | | | | |
Assets | | | | | |
Investments, at value (identified cost, $4,560,814) | | $3,323,521 | | | |
Cash | | 126 | | | |
Dividends receivable | | 9,246 | | | |
Receivable from investment adviser | | 13,471 | | | |
Other assets | | 476 | | | |
Total assets | | | | | $3,346,840 |
Liabilities | | | | | |
Payable to affiliates | | | | | |
Management fee | | $105 | | | |
Distribution fees | | 22 | | | |
Administrative services fee | | 55 | | | |
Payable for trustees’ compensation | | 2 | | | |
Accrued expenses and other liabilities | | 48,283 | | | |
Total liabilities | | | | | $48,467 |
Net assets | | | | | $3,298,373 |
Net assets consist of | | | | | |
Paid-in capital | | $5,088,122 | | | |
Unrealized appreciation (depreciation) on investments | | (1,237,293 | ) | | |
Accumulated net realized gain (loss) on investments | | (552,456 | ) | | |
Net assets | | | | | $3,298,373 |
Shares of beneficial interest outstanding | | | | | 515,420 |
Initial Class shares | | | | | |
Net assets | | $1,651,322 | | | |
Shares outstanding | | 258,160 | | | |
Net asset value per share | | | | | $6.40 |
Service Class shares | | | | | |
Net assets | | $1,647,051 | | | |
Shares outstanding | | 257,260 | | | |
Net asset value per share | | | | | $6.40 |
See Notes to Financial Statements
10
FINANCIAL STATEMENTS | STATEMENT OF OPERATIONS
This statement describes how much your fund earned in investment income and accrued in expenses. It also describes any gains and/or losses generated by fund operations.
| | | | | | |
| Year ended 12/31/08 | | | | | | |
| Net investment income | | | | | | |
Income | | | | | | |
Dividends | | $112,552 | | | | |
Interest | | 1,703 | | | | |
Total investment income | | | | | $114,255 | |
Expenses | | | | | | |
Management fee | | $25,412 | | | | |
Distribution fees | | 5,293 | | | | |
Administrative services fee | | 10,000 | | | | |
Trustees’ compensation | | 545 | | | | |
Custodian fee | | 6,727 | | | | |
Shareholder communications | | 14,462 | | | | |
Auditing fees | | 46,955 | | | | |
Legal fees | | 6,946 | | | | |
Miscellaneous | | 7,184 | | | | |
Total expenses | | | | | $123,524 | |
Fees paid indirectly | | (30 | ) | | | |
Reduction of expenses by investment adviser | | (92,802 | ) | | | |
Net expenses | | | | | $30,692 | |
Net investment income | | | | | $83,563 | |
Realized and unrealized gain (loss) on investments | | | | | | |
Realized gain (loss) on investment transactions (identified cost basis) | | $(552,456 | ) | | | |
Change in unrealized appreciation (depreciation) on investments | | $(1,270,704 | ) | | | |
Net realized and unrealized gain (loss) on investments | | | | | $(1,823,160 | ) |
Change in net assets from operations | | | | | $(1,739,597 | ) |
See Notes to Financial Statements
11
FINANCIAL STATEMENTS | STATEMENTS OF CHANGES IN NET ASSETS
These statements describe the increases and/or decreases in net assets resulting from operations, any distributions, and any shareholder transactions.
| | | | | | |
For years ended 12/31 | | 2008 | | | 2007 (c) | |
Change in net assets | | | | | | |
From operations | | | | | | |
Net investment income | | $83,563 | | | $3,777 | |
Net realized gain (loss) on investments | | (552,456 | ) | | 782 | |
Net unrealized gain (loss) on investments | | (1,270,704 | ) | | 33,411 | |
Change in net assets from operations | | $(1,739,597 | ) | | $37,970 | |
Distributions declared to shareholders | | | | | | |
From net investment income | | | | | | |
Initial Class | | $(44,203 | ) | | $(1,973 | ) |
Service Class | | (39,360 | ) | | (1,804 | ) |
From net realized gain on investments | | | | | | |
Initial Class | | — | | | (409 | ) |
Service Class | | — | | | (373 | ) |
From tax return of capital | | | | | | |
Initial Class | | (4,147 | ) | | (230 | ) |
Service Class | | (3,693 | ) | | (211 | ) |
Total distributions declared to shareholders | | $(91,403 | ) | | $(5,000 | ) |
Change in net assets from fund share transactions | | $91,403 | | | $5,005,000 | |
Total change in net assets | | $(1,739,597 | ) | | $5,037,970 | |
Net assets | �� | | | | | |
At beginning of period | | 5,037,970 | | | — | |
At end of period | | $3,298,373 | | | $5,037,970 | |
| (c) | For the period from the commencement of the fund’s investment operations, December 18, 2007, through the stated period end. |
See Notes to Financial Statements
12
FINANCIAL STATEMENTS | FINANCIAL HIGHLIGHTS
The financial highlights table is intended to help you understand the fund’s financial performance for the past 5 years (or life of a particular share class, if shorter). Certain information reflects financial results for a single fund share. The total returns in the table represent the rate by which an investor would have earned (or lost) on an investment in the fund share class (assuming reinvestment of all distributions) held for the entire period.
| | | | | | |
| Initial Class | | Years ended 12/31 | |
| | | 2008 | | | 2007 (c) | |
Net asset value, beginning of period | | $10.07 | | | $10.00 | |
| Income (loss) from investment operations | | | | | | |
Net investment income (d) | | $0.18 | | | $0.01 | |
Net realized and unrealized gain (loss) on investments | | (3.66 | ) | | 0.07 | |
Total from investment operations | | $(3.48 | ) | | $0.08 | |
| Less distributions declared to shareholders | | | | | | |
From net investment income | | $(0.17 | ) | | $(0.01 | ) |
From net realized gain on investments | | — | | | (0.00 | )(w) |
From tax return of capital | | (0.02 | ) | | (0.00 | )(w) |
Total distributions declared to shareholders | | $(0.19 | ) | | $(0.01 | ) |
Net asset value, end of period | | $6.40 | | | $10.07 | |
Total return (%) (k)(r)(s) | | (34.44 | ) | | 0.80 | (n) |
Ratios (%) (to average net assets)
and Supplemental data: | | | | | | |
Expenses before expense reductions (f) | | 2.79 | | | 10.80 | (a) |
Expenses after expense reductions (f) | | 0.60 | | | 0.60 | (a) |
Net investment income | | 2.10 | | | 2.22 | (a) |
Portfolio turnover | | 49 | | | 0 | |
Net assets at end of period (000 Omitted) | | $1,651 | | | $2,519 | |
See Notes to Financial Statements
13
Financial Highlights – continued
| | | | | | |
| Service Class | | Years ended 12/31 | |
| | | 2008 | | | 2007 (c) | |
Net asset value, beginning of period | | $10.07 | | | $10.00 | |
| Income (loss) from investment operations | | | | | | |
Net investment income (d) | | $0.16 | | | $0.01 | |
Net realized and unrealized gain (loss) on investments | | (3.66 | ) | | 0.07 | |
Total from investment operations | | $(3.50 | ) | | $0.08 | |
| Less distributions declared to shareholders | | | | | | |
From net investment income | | $(0.16 | ) | | $(0.01 | ) |
From net realized gain on investments | | — | | | (0.00 | )(w) |
From tax return of capital | | (0.01 | ) | | (0.00 | )(w) |
Total distributions declared to shareholders | | $(0.17 | ) | | $(0.01 | ) |
Net asset value, end of period | | $6.40 | | | $10.07 | |
Total return (%) (k)(r)(s) | | (34.66 | ) | | 0.80 | (n) |
Ratios (%) (to average net assets)
and Supplemental data: | | | | | | |
Expenses before expense reductions (f) | | 3.04 | | | 11.05 | (a) |
Expenses after expense reductions (f) | | 0.85 | | | 0.85 | (a) |
Net investment income | | 1.85 | | | 1.97 | (a) |
Portfolio turnover | | 49 | | | 0 | |
Net assets at end of period (000 Omitted) | | $1,647 | | | $2,519 | |
| (c) | For the period from the commencement of the fund’s investment operations, December 18, 2007, through the stated period end. |
| (d) | Per share data is based on average shares outstanding. |
| (f) | Ratios do not reflect reductions from fees paid indirectly, if applicable. |
| (k) | The total return does not reflect expenses that apply to separate accounts. Inclusion of these charges would reduce the total return figures for all periods shown. |
| (r) | Certain expenses have been reduced without which performance would have been lower. |
| (s) | From time to time the fund may receive proceeds from litigation settlements, without which performance would be lower. |
| (w) | Per share amount was less than $0.01. |
See Notes to Financial Statements
14
NOTES TO FINANCIAL STATEMENTS
| (1) | | Business and Organization |
MFS Blended Research Value Portfolio (the fund) is a series of MFS Variable Insurance Trust II (the trust). The trust is organized as a Massachusetts business trust and is registered under the Investment Company Act of 1940, as amended, as an open-end management investment company. The shares of the fund are sold to variable accounts established by insurance companies to fund benefits under variable contracts issued by such companies, and qualified retirement and pension plans.
| (2) | | Significant Accounting Policies |
General – The preparation of financial statements in conformity with U.S. generally accepted accounting principles requires management to make estimates and assumptions that affect the reported amounts of assets and liabilities, and disclosure of contingent assets and liabilities at the date of the financial statements and the reported amounts of revenues and expenses during the reporting period. Actual results could differ from those estimates. The fund can invest in foreign securities, including securities of emerging market issuers. Investments in foreign securities are vulnerable to the effects of changes in the relative values of the local currency and the U.S. dollar and to the effects of changes in each country’s legal, political, and economic environment. The markets of emerging markets countries are generally more volatile than the markets of developed countries with more mature economies. All of the risks of investing in foreign securities previously described are heightened when investing in emerging markets countries.
In March 2008, FASB Statement No. 161, Disclosures about Derivative Instruments and Hedging Activities (the “Standard”) was issued, and is effective for financial statements issued for fiscal years and interim periods beginning after November 15, 2008. This Standard provides enhanced disclosures about the fund’s use of and accounting for derivative instruments and the effect of derivative instruments on the fund’s results of operations and financial position. Management is evaluating the application of the Standard to the fund, and has not at this time determined the impact, if any, resulting from the adoption of this Standard on the fund’s financial statements.
FASB Staff Position (FSP) 133-1 was implemented during the period. FSP 133-1 amends FAS 133 to require sellers of credit derivatives to make disclosures that will enable financial statement users to assess the potential effects of those credit derivatives on an entity’s financial position, financial performance and cash flows. There was no impact from implementing FSP 133-1 as the fund did not hold any of these credit derivatives at period end.
Investment Valuations – Equity securities, including restricted equity securities, are generally valued at the last sale or official closing price as reported by a third party pricing service on the market or exchange on which they are primarily traded. For securities for which there were no sales reported that day, equity securities are generally valued at the last quoted daily bid quotation as reported by a third party pricing service on the market or exchange on which they are primarily traded. For securities held short for which there were no sales reported for the day, the position is generally valued at the last quoted daily ask quotation as reported by a third party pricing service on the market or exchange on which such securities are primarily traded. Short-term instruments with a maturity at issuance of 60 days or less may be valued at amortized cost, which approximates market value. Securities and other assets generally valued on the basis of information from a third party pricing service may also be valued at a broker-dealer bid quotation. Values obtained from pricing services can utilize both dealer-supplied valuations and electronic data processing techniques, which take into account factors such as institutional-size trading in similar groups of securities, yield, quality, coupon rate, maturity, type of issue, trading characteristics, and other market data. The values of foreign securities and other assets and liabilities expressed in foreign currencies are converted to U.S. dollars using the mean of bid and asked prices for rates reported by a third party pricing service.
The Board of Trustees has delegated primary responsibility for determining or causing to be determined the value of the fund’s investments (including any fair valuation) to the adviser pursuant to valuation policies and procedures approved by the Board. If the adviser determines that reliable market quotations are not readily available, investments are valued at fair value as determined in good faith by the adviser in accordance with such procedures under the oversight of the Board of Trustees. Under the fund’s valuation policies and procedures, market quotations are not considered to be readily available for most types of debt instruments and floating rate loans and many types of derivatives. These investments are generally valued at fair value based on information from third party pricing services. In addition, investments may be valued at fair value if the adviser determines that an investment’s value has been materially affected by events occurring after the close of the exchange or market on which the investment is principally traded (such as foreign exchange or market) and prior to the determination of the fund’s net asset value, or after the halting of trading of a specific security where trading does not resume prior to the close of the exchange or market on which the security is principally traded. Events that occur on a frequent basis after foreign markets close (such as developments in foreign markets and significant movements in the U.S. markets) and prior to the determination of the fund’s net asset value may be deemed to have a material affect on the value of securities traded in foreign markets. Accordingly, the fund’s foreign equity securities may often be valued at fair value. The adviser may rely on third party pricing services or other information (such as the correlation with price movements of similar securities in the same or other markets; the type, cost and investment characteristics of the security; the business and financial condition of the issuer; and
15
Notes to Financial Statements – continued
trading and other market data) to assist in determining whether to fair value and at what value to fair value an investment. The value of an investment for purposes of calculating the fund’s net asset value can differ depending on the source and method used to determine value. When fair valuation is used, the value of investments used to determine the fund’s net asset value may differ from quoted or published prices for the same investments.
The fund adopted FASB Statement No. 157, Fair Value Measurements (the “Statement”). This Statement provides a single definition of fair value, a hierarchy for measuring fair value and expanded disclosures about fair value measurements.
Various inputs are used in determining the value of the fund’s assets or liabilities carried at market value. These inputs are categorized into three broad levels. Level 1 includes quoted prices in active markets for identical assets or liabilities. Level 2 includes other significant observable market-based inputs (including quoted prices for similar securities, interest rates, prepayment speed, and credit risk). Level 3 includes unobservable inputs, which may include the adviser’s own assumptions in determining the fair value of investments. Other financial instruments are derivative instruments not reflected in total investments, such as futures, forwards, swap contracts and written options. The following is a summary of the levels used as of December 31, 2008 in valuing the fund’s assets or liabilities carried at market value:
| | | | | | | | |
| | | Level 1 | | Level 2 | | Level 3 | | Total |
| Investments in Securities | | $3,228,521 | | $95,000 | | $— | | $3,323,521 |
| Other Financial Instruments | | $— | | $— | | $— | | $— |
Repurchase Agreements – The fund may enter into repurchase agreements with approved counterparties. Each repurchase agreement is recorded at cost. The fund requires that the securities collateral in a repurchase transaction be transferred to a custodian. The fund monitors, on a daily basis, the value of the collateral to ensure that its value, including accrued interest, is greater than amounts owed to the fund under each such repurchase agreement. The fund and other funds managed by Massachusetts Financial Services Company (MFS), may utilize a joint trading account for the purpose of entering into one or more repurchase agreements.
Indemnifications – Under the fund’s organizational documents, its officers and trustees may be indemnified against certain liabilities and expenses arising out of the performance of their duties to the fund. Additionally, in the normal course of business, the fund enters into agreements with service providers that may contain indemnification clauses. The fund’s maximum exposure under these agreements is unknown as this would involve future claims that may be made against the fund that have not yet occurred.
Investment Transactions and Income – Investment transactions are recorded on the trade date. Interest income is recorded on the accrual basis. All premium and discount is amortized or accreted for financial statement purposes in accordance with U.S. generally accepted accounting principles. Dividends received in cash are recorded on the ex-dividend date. Certain dividends from foreign securities will be recorded when the fund is informed of the dividend if such information is obtained subsequent to the ex-dividend date. Dividend and interest payments received in additional securities are recorded on the ex-dividend or ex-interest date in an amount equal to the value of the security on such date.
The fund may receive proceeds from litigation settlements. Any proceeds received from litigation involving portfolio holdings are reflected in the Statement of Operations in realized gain/loss if the security has been disposed of by the fund or in unrealized gain/loss if the security is still held by the fund. Any other proceeds from litigation not related to portfolio holdings are reflected as other income in the Statement of Operations.
Fees Paid Indirectly – The fund’s custody fee may be reduced according to an arrangement that measures the value of cash deposited with the custodian by the fund. This amount, for the year ended December 31, 2008, is shown as a reduction of total expenses on the Statement of Operations.
Tax Matters and Distributions – The fund intends to qualify as a regulated investment company, as defined under Subchapter M of the Internal Revenue Code, and to distribute all of its taxable income, including realized capital gains. As a result, no provision for federal income tax is required. The fund’s federal tax return for the prior fiscal year remains subject to examination by the Internal Revenue Service. Foreign taxes, if any, have been accrued by the fund in the accompanying financial statements.
Distributions to shareholders are recorded on the ex-dividend date. Income and capital gain distributions are determined in accordance with income tax regulations, which may differ from U.S. generally accepted accounting principles. Certain capital accounts in the financial statements are periodically adjusted for permanent differences in order to reflect their tax character. These adjustments have no impact on net assets or net asset value per share. Temporary differences which arise from recognizing certain items of income, expense, gain or loss in different periods for financial statement and tax purposes will reverse at some time in the future. Distributions in excess of net investment income or net realized gains are temporary overdistributions for financial statement purposes resulting from differences in the recognition or classification of income or distributions for financial statement and tax purposes.
16
Notes to Financial Statements – continued
Book/tax differences primarily relate to wash sale loss deferrals.
The tax character of distributions declared to shareholders for the last two fiscal years is as follows:
| | | | |
| | | 12/31/08 | | 12/31/07 (c) |
| Ordinary income (including any short-term capital gains) | | $83,563 | | $3,777 |
| Long-term capital gain | | — | | 782 |
| | $83,563 | | $4,559 |
| Tax return of capital (b) | | 7,840 | | 441 |
| Total distributions | | $91,403 | | $5,000 |
| | (b) | Distributions in excess of tax basis earnings and profits are reported in the financial statements as a tax return of capital. | |
| | (c) | For the period from the commencement of the fund’s investment operations, December 18, 2007, through the stated period end. | |
The federal tax cost and the tax basis components of distributable earnings were as follows:
| | | |
| As of 12/31/08 | | | |
| Cost of investments | | $4,566,995 | |
| Gross appreciation | | 26,087 | |
| Gross depreciation | | (1,269,561 | ) |
| Net unrealized appreciation (depreciation) | | $(1,243,474 | ) |
| Capital loss carryforwards | | (387,449 | ) |
| Post-October capital loss deferral | | (158,826 | ) |
As of December 31, 2008 the fund had capital loss carryforwards available to offset future realized gains. Such losses expire as follows:
Multiple Classes of Shares of Beneficial Interest – The fund offers multiple classes of shares, which differ in their respective distribution fees. The fund’s income, realized and unrealized gain (loss), and common expenses are allocated to shareholders based on the daily net assets of each class. Dividends are declared separately for each class. Differences in per share dividend rates are generally due to differences in separate class expenses.
| (3) | | Transactions with Affiliates |
Investment Adviser – The fund has an investment advisory agreement with MFS to provide overall investment management and related administrative services and facilities to the fund. The management fee is computed daily and paid monthly at an annual rate of 0.60% of the fund’s average daily net assets.
The investment adviser has agreed in writing to pay a portion of the fund’s total annual operating expenses, exclusive of interest, taxes, extraordinary expenses, brokerage and transaction costs and investment-related expenses, such that the total annual operating expenses of the fund do not exceed 0.60% for the Initial Class shares and 0.85% for the Service Class shares, based on the average daily net assets of each share class. This written agreement will continue until April 30, 2010. For the year ended December 31, 2008, this reduction amounted to $92,802 and is reflected as a reduction of total expenses in the Statements of Operations.
Distributor – MFS Fund Distributors, Inc. (MFD), a wholly-owned subsidiary of MFS, is the distributor of shares of the fund. The Trustees have adopted a distribution plan for the Service Class shares pursuant to Rule 12b-1 under the Investment Company Act of 1940.
The fund’s distribution plan provides that the fund will pay MFD distribution fees equal to 0.25% per annum of its average daily net assets attributable to Service Class shares as partial consideration for services performed and expenses incurred by MFD and financial intermediaries in connection with the sale and distribution of the Service Class shares and the sale and distribution of the variable annuity or variable life insurance contracts investing indirectly in Service class shares. MFD may subsequently pay all, or a portion, of the distribution fees to financial intermediaries.
Shareholder Servicing Agent – MFS Service Center, Inc. (MFSC), a wholly-owned subsidiary of MFS, has contracted to provide transfer agent and recordkeeping functions in connection with the issuance, transfer, and redemption of each class of shares of the fund under a Shareholder Servicing Agent Agreement. During the year ended December 31, 2008, the fund did not pay MFSC a fee for this service.
Administrator – MFS provides certain financial, legal, shareholder communications, compliance, and other administrative services to the fund. Under an administrative services agreement, the fund partially reimburses MFS the costs incurred to provide these services. The fund is charged an annual fixed amount of $10,000 plus a fee based on average daily net assets.
17
Notes to Financial Statements – continued
The administrative services fee incurred for the year ended December 31, 2008 was equivalent to an annual effective rate of 0.2361% of the fund’s average daily net assets.
Trustees’ and Officers’ Compensation – The fund pays compensation to trustees in the form of a retainer, attendance fees, and additional compensation to the Board chairperson. The fund does not pay compensation directly to officers of the fund who are also officers of the investment adviser, all of whom receive remuneration for their services to the fund from MFS. Certain officers of the fund are officers or directors of MFS, MFD, and MFSC.
Other – This fund and certain other MFS funds (the funds) have entered into services agreements (the Agreements) which provide for payment of fees by the funds to Tarantino LLC and Griffin Compliance LLC in return for the provision of services of an Independent Chief Compliance Officer (ICCO) and Assistant ICCO, respectively, for the funds. The ICCO and Assistant ICCO are officers of the funds and the sole members of Tarantino LLC and Griffin Compliance LLC, respectively. The funds can terminate the Agreements with Tarantino LLC and Griffin Compliance LLC at any time under the terms of the Agreements. MFS has agreed to bear all expenses associated with office space, other administrative support, and supplies provided to the ICCO and Assistant ICCO. For the year ended December 31, 2008, the aggregate fees paid by the fund to Tarantino LLC and Griffin Compliance LLC were $43 and are included in miscellaneous expense on the Statement of Operations.
On December 18, 2007, MFS purchased 250,000 shares of both the Initial Class and Service Class for an aggregate amount of $5,000,000. At December 31, 2008 MFS was the sole shareholder of both classes.
Purchases and sales of investments, other than U.S. Government securities, purchased option transactions, and short-term obligations, aggregated $2,184,972 and $2,076,348, respectively.
| (5) | | Shares of Beneficial Interest |
The fund’s Declaration of Trust permits the Trustees to issue an unlimited number of full and fractional shares of beneficial interest. Transactions in fund shares were as follows:
| | | | | | | | |
| | | Year ended 12/31/08 | | Period ended 12/31/07 (c) |
| | | Shares | | Amount | | Shares | | Amount |
| Shares sold | | | | | | | | |
Initial Class | | — | | $— | | 250,000 | | $2,500,000 |
Service Class | | — | | — | | 250,000 | | 2,500,000 |
| | — | | $— | | 500,000 | | $5,000,000 |
| Shares issued to shareholders in reinvestment of distributions | | | | | | | | |
Initial Class | | 7,901 | | $48,350 | | 259 | | $2,612 |
Service Class | | 7,023 | | 43,053 | | 237 | | 2,388 |
| | 14,924 | | $91,403 | | 496 | | $5,000 |
| Net change | | | | | | | | |
Initial Class | | 7,901 | | $48,350 | | 250,259 | | $2,502,612 |
Service Class | | 7,023 | | 43,053 | | 250,237 | | 2,502,388 |
| | 14,924 | | $91,403 | | 500,496 | | $5,005,000 |
| (c) | For the period from the commencement of the fund’s investment operations, December 18, 2007, through the stated period end. |
The fund and other funds managed by MFS participate in a $1 billion unsecured committed line of credit provided by a syndication of banks under a credit agreement. In addition, the fund and other funds managed by MFS have established uncommitted borrowing arrangements with certain banks. Borrowings may be made for temporary financing needs. Interest is charged to each fund, based on its borrowings, generally at a rate equal to the Federal Reserve funds rate plus 0.30%. In addition, a commitment fee, based on the average daily, unused portion of the committed line of credit, is allocated among the participating funds at the end of each calendar quarter. For the year ended December 31, 2008, the fund’s commitment fee and interest expense were $16 and $0, respectively, and are included in miscellaneous expense on the Statement of Operations.
18
REPORT OF INDEPENDENT REGISTERED PUBLIC ACCOUNTING FIRM
To the Board of Trustees of MFS Variable Insurance Trust II and the Shareholders of
MFS Blended Research Value Portfolio:
We have audited the accompanying statement of assets and liabilities, including the portfolio of investments, of MFS Blended Research Value Portfolio (the “Fund”) (one of the portfolios comprising MFS Variable Insurance Trust II) as of December 31, 2008, and the related statement of operations for the year then ended, the statements of changes in net assets and the financial highlights for the year then ended and for the period from December 18, 2007 (commencement of operations) through December 31, 2007. These financial statements and financial highlights are the responsibility of the Fund’s management. Our responsibility is to express an opinion on these financial statements and financial highlights based on our audits.
We conducted our audits in accordance with the standards of the Public Company Accounting Oversight Board (United States). Those standards require that we plan and perform the audit to obtain reasonable assurance about whether the financial statements and financial highlights are free of material misstatement. The Fund is not required to have, nor were we engaged to perform, an audit of its internal control over financial reporting. Our audits included consideration of internal control over financial reporting as a basis for designing audit procedures that are appropriate in the circumstances, but not for the purpose of expressing an opinion on the effectiveness of the Fund’s internal control over financial reporting. Accordingly, we express no such opinion. An audit also includes examining, on a test basis, evidence supporting the amounts and disclosures in the financial statements, assessing the accounting principles used and significant estimates made by management, as well as evaluating the overall financial statement presentation. Our procedures included confirmation of securities owned as of December 31, 2008, by correspondence with the custodian and brokers. We believe that our audits provide a reasonable basis for our opinion.
In our opinion, the financial statements and financial highlights referred to above present fairly, in all material respects, the financial position of MFS Blended Research Value Portfolio as of December 31, 2008, the results of its operations for the year ended, the changes in its net assets and the financial highlights for the year then ended and for the period from December 18, 2007 (commencement of operations) through December 31, 2007, in conformity with accounting principles generally accepted in the United States of America.
DELOITTE & TOUCHE LLP
Boston, Massachusetts
February 17, 2009
19
TRUSTEES AND OFFICERS – IDENTIFICATION AND BACKGROUND
The Trustees and officers of the Trust, as of February 1, 2009, are listed below, together with their principal occupations during the past five years. (Their titles may have varied during that period.) The address of each Trustee and officer is 500 Boylston Street, Boston, Massachusetts 02116.
| | | | | | |
Name, Date of Birth | | Position(s) Held
with Fund | | Trustee/Officer
Since (1) | | Principal Occupations During the Past Five Years and
Other Directorships (2) |
| INTERESTED TRUSTEE | | | | |
David D. Horn (3) (born 6/07/41) | | Trustee | | April 1986 | | Private investor; Sun Life Assurance Company of Canada, Senior Vice President and General Manager for the United States (until 1997); Director (until March 2004) |
| | |
| INDEPENDENT TRUSTEES | | | | |
J. Kermit Birchfield (born 1/08/40) | | Chairman | | May 1997 | | Consultant; Century Partners, Inc. (investments), Director; Displaytech, Inc. (technology), Director; Dessin Fournir LLC (furniture manufacturer), Director (2005 to present); Intermountain Gas Company, Inc. & Intermountain Industries, Inc. (oil & gas exploration and production), Director; Site Watch LLC (software to monitor oil tanks), Managing Director (2006 to present); Juridica Investments (fund investing in judicial matters), Director (2007 to present); HPSC, Inc. (medical financing), Director (until January 2004) |
| | | |
Robert C. Bishop (born 1/13/43) | | Trustee | | May 2001 | | AutoImmune, Inc. (pharmaceutical product development), Chairman, President and Chief Executive Officer; Caliper Life Sciences Corp. (laboratory analytical instruments), Director; Millipore Corporation (purification/filtration products), Director; Waterstreet Capital (leverage buyouts), Advisory Board (August 2006 to present); Optobionics Corporation (ophthalmic devices), Director (2002 to 2007) |
| | | |
Frederick H. Dulles (born 3/12/42) | | Trustee | | May 2001 | | Ten State International Law PLLC (law firm), Of Counsel (since 2006); Prudential Carolina Real Estate, (real estate), Broker (since 2006); Free Enterprise Foundation, Inc. (research institute), Director & Secretary (until 2008); Disher, Hamrick & Myers Residential, Inc. (real estate) Broker (2005 until 2006); Frederick H. Dulles law practice (until 2006); Ten State Street LLP (law firm), Member (until 2005) |
| | | |
Marcia A. Kean (born 6/30/48) | | Trustee | | April 2005 | | Feinstein Kean Healthcare (consulting), Chief Executive Officer |
| | | |
Ronald G. Steinhart (born 6/15/40) | | Trustee | | May 2001 | | Private investor; Penske Automotive Group (automotive retailer), Director; Animal Health International, Inc. (animal health products), Director (since 2007); Texas Industries (concrete/aggregates/cement), Director (since 2007); Penson Worldwide, Inc. (securities clearance), Director (since 2006); Carreker Corporation (technology consulting) Director (until 2005); Prentiss Properties Trust (real estate investment trust), Director (until 2006) |
| | | |
Haviland Wright (born 7/21/48) | | Trustee | | May 2001 | | Profitability of Hawaii (software), Chief Development Officer (since December 2008); Elixir Technologies Corporation (software) Director (since 2005); Nano Loa Inc. (liquid crystal displays), Director |
| | |
| TRUSTEE EMERITUS | | | | |
Samuel Adams (born 10/19/25) | | Trustee Emeritus | | | | Retired; K&L Gates LLP (law firm), Of Counsel |
| | |
| OFFICERS | | | | |
Maria F. Dwyer (4) (born 12/01/58) | | President | | November 2005 | | Massachusetts Financial Services Company, Executive Vice President and Chief Regulatory Officer (since March 2004) Chief Compliance Officer (since December 2006); Fidelity Management & Research Company, Vice President (prior to March 2004); Fidelity Group of Funds, President and Treasurer (until March 2004) |
| | | |
Christopher R. Bohane (4) (born 1/18/74) | | Assistant Secretary and Assistant Clerk | | July 2005 | | Massachusetts Financial Services Company, Vice President and Senior Counsel |
| | | |
John M. Corcoran (4) (born 4/13/65) | | Treasurer | | October 2008 | | Massachusetts Financial Services Company, Senior Vice President (since October 2008); State Street Bank and Trust (financial services provider), Senior Vice President, (until September 2008) |
| | | |
Ethan D. Corey (4) (born 11/21/63) | | Assistant Secretary and Assistant Clerk | | July 2005 | | Massachusetts Financial Services Company, Senior Vice President and Associate General Counsel (since 2004); Dechert LLP (law firm), Counsel (prior to December 2004) |
| | | |
David L. DiLorenzo (4) (born 8/10/68) | | Assistant Treasurer | | July 2005 | | Massachusetts Financial Services Company, Vice President (since June 2005); JP Morgan Investor Services, Vice President (until June 2005) |
| | | |
Timothy M. Fagan (4) (born 7/10/68) | | Assistant Secretary and Assistant Clerk | | September 2005 | | Massachusetts Financial Services Company, Vice President and Senior Counsel (since September 2005); John Hancock Advisers, LLC, Vice President, Senior Attorney and Chief Compliance Officer (until August 2005) |
20
Trustees and Officers – continued
| | | | | | |
Name, Date of Birth | | Position(s) Held
with Fund | | Trustee/Officer
Since (1) | | Principal Occupations During the Past Five Years and
Other Directorships (2) |
Mark D. Fischer (4) (born 10/27/70) | | Assistant Treasurer | | July 2005 | | Massachusetts Financial Services Company, Vice President (since May 2005); JP Morgan Investment Management Company, Vice President (until May 2005) |
| | | |
Robyn L. Griffin (born 7/04/75) | | Assistant Independent Chief Compliance Officer | | August 2008 | | Griffin Compliance LLC (provider of compliance services), Principal (since August 2008); State Street Corporation (financial services provider), Mutual Fund Administration Assistant Vice President (October 2006 – July 2008); Liberty Mutual Group (insurance), Personal Market Assistant Controller (April 2006 – October 2006); Deloitte & Touche LLP (professional services firm), Senior Manager (prior to April 2006) |
| | | |
Brian E. Langenfeld (4) (born 3/07/73) | | Assistant Secretary and Assistant Clerk | | May 2006 | | Massachusetts Financial Services Company, Vice President and Senior Counsel (since May 2006); John Hancock Advisers, LLC, Assistant Vice President and Counsel (until April 2006) |
| | | |
Ellen Moynihan (4) (born 11/13/57) | | Assistant Treasurer | | May 1997 | | Massachusetts Financial Services Company, Senior Vice President |
| | | |
Susan S. Newton (4) (born 3/07/50) | | Assistant Secretary and Assistant Clerk | | May 2005 | | Massachusetts Financial Services Company, Senior Vice President and Associate General Counsel (since April 2005); John Hancock Advisers, LLC, Senior Vice President, Secretary and Chief Legal Officer (until April 2005) |
| | | |
Susan A. Pereira (4) (born 11/05/70) | | Assistant Secretary and Assistant Clerk | | July 2005 | | Massachusetts Financial Services Company, Vice President and Senior Counsel (since June 2004); Bingham McCutchen LLP (law firm), Associate (until June 2004) |
| | | |
Mark N. Polebaum (4) (born 5/01/52) | | Secretary and Clerk | | February 2006 | | Massachusetts Financial Services Company, Executive Vice President, General Counsel and Secretary (since January 2006); Wilmer Cutler Pickering Hale and Dorr LLP (law firm), Partner (until January 2006) |
| | | |
Frank L. Tarantino (born 3/07/44) | | Independent Chief Compliance Officer | | September 2004 | | Tarantino LLC (provider of compliance services), Principal (since June 2004); CRA Business Strategies Group (consulting services), Executive Vice President (until June 2004) |
| | | |
Richard S. Weitzel (4) (born 7/16/70) | | Assistant Secretary and Assistant Clerk | | October 2007 | | Massachusetts Financial Services Company, Vice President and Assistant General Counsel (since 2004); Massachusetts Department of Business and Technology, General Counsel (until April 2004) |
| | | |
James O. Yost (4) (born 6/12/60) | | Assistant Treasurer | | April 1992 | | Massachusetts Financial Services Company, Senior Vice President |
| (1) | Date first appointed to serve as Trustee/Officer of an MFS fund or a Compass variable account. Each Trustee has served continuously since appointment. |
| (2) | Directorships or trusteeships of companies required to report to the Securities and Exchange Commission (i.e., “public companies”). |
| (3) | “Interested person” of the Trust, within the meaning of the Investment Company Act of 1940 (referred to as the 1940 Act), which is the principal federal law governing investment companies like the Trust, as a result of position with Sun Life of Canada (U.S.). The address of Sun Life of Canada (U.S.) is One Sun Life Executive Park, Wellesley Hills, Massachusetts 02481. |
| (4) | “Interested person” of MFS within the meaning of the 1940 Act. The address of MFS is 500 Boylston Street, Boston, Massachusetts 02116. |
The Trust does not hold annual meetings for the purpose of electing Trustees, and Trustees are not elected for fixed terms. Each Trustee and officer holds office until his or her successor is chosen and qualified, or until his or her earlier death, resignation, retirement or removal.
All Trustees currently serve as Trustees of the Trust and have served in that capacity since originally elected or appointed. All of the Trustees are also Managers of the Compass Variable Accounts. The executive officers of the Trust hold similar offices for the Compass Variable Accounts and other funds in the MFS fund complex. As of January 1, 2009, each Trustee serves as a Trustee or Manager of 35 Accounts/Funds.
The Statement of Additional Information contains further information about the Trustees and is available without charge upon request by calling 1-800-752-7215.
| | |
Investment Adviser
Massachusetts Financial Services Company 500 Boylston Street, Boston, MA 02116-3741 | | Custodian State Street Bank and Trust 1 Lincoln Street, Boston, MA 02111-2900 |
Distributor
MFS Fund Distributors, Inc. 500 Boylston Street, Boston, MA 02116-3741 | | Independent Registered Public Accounting Firm Deloitte & Touche LLP 200 Berkeley Street, Boston, MA 02116 |
Portfolio Manager Jonathan Sage | | |
21
BOARD REVIEW OF INVESTMENT ADVISORY AGREEMENT
A discussion regarding the Board’s most recent review and renewal of the fund’s Investment Advisory Agreement with MFS is available by clicking on the fund’s name under “Variable Insurance Portfolios – VIT II” in the “Products and Performance” section of the MFS Web site (mfs.com).
PROXY VOTING POLICIES AND INFORMATION
A general description of the MFS funds’ proxy voting policies and procedures is available without charge, upon request, by calling
1-800-225-2606, by visiting the Proxy Voting section of mfs.com or by visiting the SEC’s Web site at http://www.sec.gov.
Information regarding how the fund voted proxies relating to portfolio securities during the most recent twelve-month period ended June 30 is available without charge by visiting the Proxy Voting section of mfs.com or by visiting the SEC’s Web site at http://www.sec.gov.
QUARTERLY PORTFOLIO DISCLOSURE
The fund will file a complete schedule of portfolio holdings with the Securities and Exchange Commission (the Commission) for the first and third quarters of each fiscal year on Form N-Q. The fund’s Form N-Q may be reviewed and copied at the:
Public Reference Room
Securities and Exchange Commission
100 F Street, NE, Room 1580
Washington, D.C. 20549
Information on the operation of the Public Reference Room may be obtained by calling the Commission at 1-800-SEC-0330. The fund’s Form N-Q is available on the EDGAR database on the Commission’s Internet Web site at http://www.sec.gov, and copies of this information may be obtained, upon payment of a duplicating fee, by electronic request at the following e-mail address: publicinfo@sec.gov or by writing the Public Reference Section at the above address.
22
MFS® PRIVACY NOTICE
Privacy is a concern for every investor today. At MFS Investment Management® and the MFS funds, we take this concern very seriously. We want you to understand our policies about the investment products and services that we offer, and how we protect the nonpublic personal information of investors who have a direct relationship with us and our wholly owned subsidiaries.
Throughout our business relationship, you provide us with personal information. We maintain information and records about you, your investments, and the services you use. Examples of the nonpublic personal information we maintain include
| | Ÿ | | data from investment applications and other forms |
| | Ÿ | | share balances and transactional history with us, our affiliates, or others |
| | Ÿ | | facts from a consumer reporting agency |
We do not disclose any nonpublic personal information about our customers or former customers to anyone, except as permitted by law. We may share nonpublic personal information with third parties or certain of our affiliates in connection with servicing your account or processing your transactions. We may share information with companies or financial institutions that perform marketing services on our behalf or with other financial institutions with which we have joint marketing arrangements, subject to any legal requirements.
Authorization to access your nonpublic personal information is limited to appropriate personnel who provide products, services, or information to you. We maintain physical, electronic, and procedural safeguards to help protect the personal information we collect about you.
If you have any questions about the MFS privacy policy, please call 1-800-225-2606 any business day between 8 a.m. and 8 p.m. Eastern time.
Note: If you own MFS products or receive MFS services in the name of a third party such as a bank or broker-dealer, their privacy policy may apply to you instead of ours.
23

MFS® GLOBAL GROWTH PORTFOLIO
The report is prepared for the general information of contract owners. It is authorized for distribution to prospective investors only when preceded or accompanied by a current prospectus.
NOT FDIC INSURED Ÿ MAY LOSE VALUE Ÿ NO BANK GUARANTEE Ÿ NOT A DEPOSIT Ÿ NOT INSURED BY ANY FEDERAL GOVERNMENT AGENCY OR NCUA/NCUSIF
LETTER FROM THE CEO

Dear Contract Owners:
The market downturns and economic setbacks of late probably rank among the worst financial declines most of us have experienced. Inevitably, people may be questioning their commitment to investing. Still, it is important to remember that downturns are an inescapable part of the business cycle. Such troughs have been seen before, and if we can use history as a guide, market recoveries typically have followed.
Recent events have clearly shown us the value of certain types of investments. In this environment, two of the hallmarks of mutual funds — transparency and liquidity — have become critically important. Unlike some other types of investments, the operations of mutual funds are relatively transparent to their shareholders. With their daily redemption feature, mutual funds also generally provide easy, convenient access to one’s money. Through these recent market upheavals, this level of liquidity enhanced the ability of mutual fund investors to respond and modify their investments as they and their advisors saw fit — a flexibility that those in less liquid investments simply did not have at their disposal.
At MFS® we take particular pride in how well mutual funds can serve investors because we invented the mutual fund in the United States. Established in 1924, Massachusetts Investors Trust was the nation’s first fund. Recent market events only reinforce what we have learned through 85 years — that mutual funds provide unique features that are important to investors in any type of market climate.
Respectfully,

Robert J. Manning
Chief Executive Officer and Chief Investment Officer
MFS Investment Management®
February 17, 2009
The opinions expressed in this letter are subject to change, may not be relied upon for investment advice, and no forecasts can be guaranteed.
Before investing, consider the fund’s investment objectives, risks, charges, and expenses. For a prospectus containing this and other information, contact your investment professional or view online. Read it carefully.
MFS Fund Distributors, Inc., 500 Boylston Street, Boston, MA 02116
1
PORTFOLIO COMPOSITION
Portfolio structure
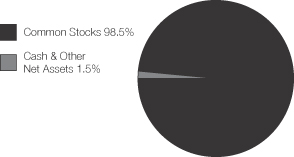
| | |
| Top ten holdings | | |
| Nestle S.A. | | 2.8% |
| INPEX Holdings, Inc. | | 2.5% |
| TOTAL S.A. | | 2.4% |
| Roche Holding AG | | 2.3% |
| Telefonica S.A. | | 1.7% |
| LVMH Moet Hennessy Louis Vuitton S.A. | | 1.6% |
| Novo Nordisk A/S, “B” | | 1.5% |
| WPP Group PLC | | 1.4% |
| 3M Co. | | 1.4% |
| Allergan, Inc. | | 1.3% |
| | |
| Equity sectors | | |
| Technology | | 16.9% |
| Health Care | | 13.7% |
| Consumer Staples | | 12.1% |
| Financial Services | | 9.8% |
| Basic Materials | | 9.6% |
| Retailing | | 8.4% |
| Energy | | 8.2% |
| Special Products & Services | | 5.6% |
| Utilities & Communications | | 5.1% |
| Leisure | | 5.1% |
| Industrial Goods & Services | | 4.0% |
| | |
| Country weightings | | |
| United States | | 31.2% |
| Switzerland | | 11.3% |
| Japan | | 10.2% |
| France | | 9.5% |
| United Kingdom | | 7.1% |
| Germany | | 6.2% |
| Spain | | 2.6% |
| Brazil | | 2.1% |
| Australia | | 1.9% |
| Other Countries | | 17.9% |
Percentages are based on net assets as of 12/31/08.
The portfolio is actively managed and current holdings may be different.
2
MANAGEMENT REVIEW
Summary of Results
For the twelve months ended December 31, 2008, Initial Class shares of the MFS Global Growth Portfolio (the “fund”) provided a total return of –38.93%, while Service Class shares of the fund provided a total return of –39.07%. These returns compare with a return of –42.71% for the fund’s benchmark, the MSCI All Country World Growth Index. Over the same period, the fund’s other benchmark, the MSCI World Growth Index, generated a return of –40.90%.
Market Environment
The U.S. economy and financial markets experienced significant deterioration and extraordinary volatility over the reporting period. U.S. economic growth slowed significantly, despite the short-term bounce from the second quarter fiscal stimulus. Strong domestic headwinds included accelerated deterioration in the housing market, anemic corporate investment, a rapidly declining job market, and a much tighter credit environment. During the period, a seemingly continuous series of tumultuous financial events hammered markets, including: the distressed sale of failing Bear Stearns to JPMorgan, the conservatorship of Government Sponsored Enterprises (GSEs) Fannie Mae and Freddie Mac, the bankruptcy of investment bank Lehman Brothers, the Federal Reserve Bank’s complex intervention of insurance company American International Group (AIG), the nationalization of several large European banks, the failure of Washington Mutual, and the distressed sale of Wachovia. As a result of this barrage of turbulent news, global equity markets pushed significantly lower and credit markets witnessed the worst dislocation since the beginning of the credit crisis. Though conditions improved towards the end of the period, the state of financial and macroeconomic dislocation remained severe.
While reasonably resilient during the first half of the period, the global economy and financial system increasingly experienced considerable negative spillovers from the U.S. slowdown. Not only did Europe and Japan show obvious signs of economic softening, the more powerful engine of global growth – emerging markets – also displayed weakening dynamics.
During the reporting period, the U.S. Federal Reserve Board cut interest rates aggressively and introduced a multitude of new lending facilities to alleviate ever-tightening credit markets, while the U.S. federal government moved quickly to design and implement a meaningful fiscal stimulus package. Although several other global central banks also cut rates, the dilemma of rising energy and food prices heightened concerns among central bankers that inflationary expectations might become unhinged despite weaker growth. Only later in the reporting period did slowing global growth result in a very precipitous decline in commodity prices, which significantly eased inflation and inflationary expectations. As inflationary concerns diminished in the face of global deleveraging, and equity and credit markets deteriorated more sharply, a coordinated rate cut marked the beginning of much more aggressive easing by the major global central banks.
Contributors to Performance
Relative to the MSCI All Country World Growth Index, stock selection and an underweighted position in the energy sector boosted the fund’s performance. Our investment in French integrated oil company Total was among the top relative contributors.
An overweighting in the consumer staples sector, which outperformed the benchmark over the reporting period, also helped relative returns. Personal hygiene products maker Hengan International Group (Hong Kong) and global food company Nestle (Switzerland) were among the top relative contributors within this sector. Shares of Nestle outpaced the benchmark as the company raised its 2008 annual sales forecast and reiterated its sales goal for 2009. The recent drop in commodity prices also aided the company’s results.
Stock selection and an underweighted position in the industrial goods and services sector were other positive factors in the fund’s relative performance, although no individual stocks within this sector were among the fund’s top contributors.
Elsewhere, our investments in credit card company Visa, electronic products manufacturer Hirose Electric (Japan), medical device manufacturer Synthes (Switzerland), and Swiss pharmaceutical and diagnostic company Roche Holding were among the top contributors over the reporting period. Additionally, our overweighted position in strong-performing biopharmaceutical company Actelion for the majority of the reporting period boosted relative returns. Not owning mining operator Rio Tinto (United Kingdom) for most of the fourth quarter bolstered relative results as the company’s shares experienced a significant decline during that period.
The fund’s cash position was also a contributor to relative performance. The fund holds cash to buy new holdings and to provide liquidity. In a period when equity markets declined, as measured by the fund’s benchmark, holding cash helped performance versus the benchmark, which has no cash position.
During the reporting period, the fund’s currency exposure contributed to relative performance. All of MFS’ investment decisions are driven by the fundamentals of each individual opportunity and as such, it is common for our portfolios to have different currency exposure than the benchmark.
3
Management Review – continued
Detractors from Performance
Stock selection and an overweighted position in the financial services sector were the primary factors detracting from relative performance. The fund’s investments in home financier Housing Development Finance Corp. (India), and banking firms, Erste Group Bank (Austria) and Raiffeisen International Bank Holding (Austria), all adversely impacted relative performance. Shares of Raiffeisen International Bank Holding fell as the company lowered its earnings forecast, subsequent to its decision to reduce lending in the Central and Eastern Europe regions. Additionally, the fund’s holdings of investment management and banking firm UBS(g), which was held in the first half of the reporting period, hindered relative returns as the stock underperformed the benchmark during that time.
Securities in other sectors that held back relative results included natural gas producer Gazprom (Russia), chemical producer Wacker Chemie (g) (Germany), and advertising and marketing firm WPP Group (U.K.). In addition, not owning retail giant Wal-Mart, German automobile manufacturer Volkswagen, and biotechnology firm Amgen also hurt relative performance, as these benchmark holdings outperformed the overall market during the reporting period.
Respectfully,
| | |
| Jeffrey Constantino | | Barry Dargan |
| Portfolio Manager | | Portfolio Manager |
Note to Shareholders: Effective July 1, 2008, Jeffrey Constantino became a co-manager of the fund. Previously, the fund was co-managed by Nicholas Smithie.
| (g) | Security was not held in the portfolio at period end. |
The views expressed in this report are those of the portfolio managers only through the end of the period of the report as stated on the cover and do not necessarily reflect the views of MFS or any other person in the MFS organization. These views are subject to change at any time based on market or other conditions, and MFS disclaims any responsibility to update such views. These views may not be relied upon as investment advice or an indication of trading intent on behalf of any MFS portfolio. References to specific securities are not recommendations of such securities, and may not be representative of any MFS portfolio’s current or future investments.
4
PERFORMANCE SUMMARY THROUGH 12/31/08
The following chart illustrates the historical performance of the fund in comparison to its benchmark(s). Benchmark comparisons are unmanaged; do not reflect any fees or expenses; and cannot be invested in directly. The performance of other share classes will be greater than or less than that of the class depicted below. (See Notes to Performance Summary.)
Performance data shown represents past performance and is no guarantee of future results. Investment return and principal value fluctuate so your units, when sold, may be worth more or less than the original cost; current performance may be lower or higher than quoted. The performance shown does not reflect the deduction of taxes, if any, that a contract holder would pay on fund distributions or the redemption of contract units. The returns for the fund shown also do not reflect the deduction of expenses associated with variable products, such as mortality and expense risk charges, separate account charges, and sales charges imposed by the insurance company separate accounts. Such expenses would reduce the overall returns shown.
Growth of a hypothetical $10,000 investment
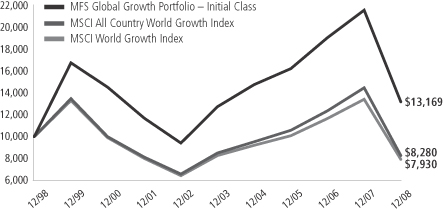
Total rates of return through 12/31/08
Average Annual Total Returns
| | | | | | | | | | | | |
| | | Share class | | Class inception date | | 1-yr | | 5-yr | | 10-yr | | |
| | | Initial Class | | 11/16/93 | | (38.93)% | | 0.65% | | 2.79% | | |
| | | Service Class | | 8/24/01 | | (39.07)% | | 0.41% | | 2.59% | | |
Comparative Benchmarks
| | | | | | | | | | | | |
| | | MSCI All Country World Growth Index (f) | | (42.71)% | | (0.57)% | | (1.87)% | | |
| | | MSCI World Growth Index (f) | | (40.90)% | | (0.84)% | | (2.29)% | | |
| (f) | Source: FactSet Research Systems Inc. |
Benchmark Definitions
MSCI All Country World Growth Index – a market capitalization-weighted index that is designed to measure equity market performance for growth securities in the global developed and emerging markets.
MSCI World Growth Index – a market capitalization-weighted index that is designed to measure equity market performance for growth securities in the global developed markets.
It is not possible to invest directly in an index.
Notes to Performance Summary
Performance for the Service Class includes the performance of the fund’s Initial Class for periods prior to their offering. Because Service Class expenses are higher than those of Initial Class, performance shown for Service Class is higher than it would have been had it been offered for the entire period. Performance has not been adjusted to take into account differences in class specific operating expenses (such as Rule 12b-1 fees). Please see the prospectus for additional information about performance and expenses.
Performance results reflect any applicable expense subsidies and waivers in effect during the periods shown. Without such subsidies and waivers the fund’s performance results would be less favorable. Please see the prospectus for complete details. All results are historical and assume the reinvestment of any dividends and capital gains distributions.
From time to time the fund may receive proceeds from litigation settlements, without which performance would be lower.
5
EXPENSE TABLE
Fund Expenses Borne by the Contract Holders During the Period,
July 1, 2008 through December 31, 2008
As a contract holder of the fund, you incur ongoing costs, including management fees; distribution (12b-1) fees; and other fund expenses. This example is intended to help you understand your ongoing costs (in dollars) of investing in the fund and to compare these costs with the ongoing costs of investing in other mutual funds.
The example is based on an investment of $1,000 invested at the beginning of the period and held for the entire period July 1, 2008 through December 31, 2008.
Actual Expenses
The first line for each share class in the following table provides information about actual account values and actual expenses. You may use the information in this line, together with the amount you invested, to estimate the expenses that you paid over the period. Simply divide your account value by $1,000 (for example, an $8,600 account value divided by $1,000 = 8.6), then multiply the result by the number in the first line under the heading entitled “Expenses Paid During Period” to estimate the expenses you paid on your account during this period.
Hypothetical Example for Comparison Purposes
The second line for each share class in the following table provides information about hypothetical account values and hypothetical expenses based on the fund’s actual expense ratio and an assumed rate of return of 5% per year before expenses, which is not the fund’s actual return. The hypothetical account values and expenses may not be used to estimate the actual ending account balance or expenses you paid for the period. You may use this information to compare the ongoing costs of investing in the fund and other funds. To do so, compare this 5% hypothetical example with the 5% hypothetical examples that appear in the shareholder reports of the other funds.
Please note that the expenses shown in the table are meant to highlight the fund’s ongoing costs only and do not take into account the fees and expenses imposed under the variable contracts through which your investment in the fund is made. Therefore, the second line for each share class in the table is useful in comparing ongoing costs associated with an investment in vehicles (such as the fund) which fund benefits under variable annuity and variable life insurance contracts and to qualified pension and retirement plans only, and will not help you determine the relative total costs of investing in the fund through variable annuity and variable life insurance contracts. If the fees and expenses imposed under the variable contracts were included, your costs would have been higher.
| | | | | | | | | | |
| Share Class | | | | Annualized
Expense Ratio | | Beginning
Account Value
7/01/08 | | Ending
Account Value
12/31/08 | | Expenses Paid
During Period (p)
7/01/08-12/31/08 |
| Initial Class | | Actual | | 1.31% | | $1,000.00 | | $669.61 | | $5.50 |
| | Hypothetical (h) | | 1.31% | | $1,000.00 | | $1,018.55 | | $6.65 |
| Service Class | | Actual | | 1.56% | | $1,000.00 | | $668.99 | | $6.54 |
| | Hypothetical (h) | | 1.56% | | $1,000.00 | | $1,017.29 | | $7.91 |
| (h) | 5% class return per year before expenses. |
| (p) | Expenses paid is equal to each class’ annualized expense ratio, as shown above, multiplied by the average account value over the period, multiplied by the number of days in the period, divided by the number of days in the year. |
6
PORTFOLIO OF INVESTMENTS – 12/31/08
The Portfolio of Investments is a complete list of all securities owned by your fund. It is categorized by broad-based asset classes.
| | | | | |
| Issuer | | Shares/Par | | Value ($) |
| | | | | |
| COMMON STOCKS – 98.5% | | | | | |
| Aerospace – 1.1% | | | | | |
| United Technologies Corp. | | 13,670 | | $ | 732,711 |
| | | | | |
| Alcoholic Beverages – 2.1% | | | | | |
| Companhia de Bebidas das Americas, ADR | | 15,040 | | $ | 666,422 |
| Pernod Ricard S.A. | | 9,708 | | | 719,900 |
| | | | | |
| | | | $ | 1,386,322 |
| | | | | |
| Apparel Manufacturers – 5.0% | | | | | |
| Compagnie Financiere Richemont S.A. | | 23,975 | | $ | 465,464 |
| Li & Fung Ltd. | | 389,800 | | | 667,924 |
| LVMH Moet Hennessy Louis Vuitton S.A. | | 16,160 | | | 1,085,728 |
| NIKE, Inc., “B” | | 11,630 | | | 593,130 |
| Swatch Group Ltd. | | 3,832 | | | 535,275 |
| | | | | |
| | | | $ | 3,347,521 |
| | | | | |
| Biotechnology – 2.0% | | | | | |
| Actelion Ltd. (a) | | 10,860 | | $ | 611,649 |
| Genzyme Corp. (a) | | 10,820 | | | 718,123 |
| | | | | |
| | | | $ | 1,329,772 |
| | | | | |
| Broadcasting – 3.5% | | | | | |
| Grupo Televisa S.A., ADR | | 38,510 | | $ | 575,339 |
| Societe Television Francaise 1 | | 20,938 | | | 306,138 |
| Walt Disney Co. | | 21,370 | | | 484,885 |
| WPP Group PLC | | 164,196 | | | 957,138 |
| | | | | |
| | | | $ | 2,323,500 |
| | | | | |
| Brokerage & Asset Managers – 3.0% | | | | | |
| Daiwa Securities Group, Inc. | | 95,000 | | $ | 566,149 |
| Deutsche Boerse AG | | 9,090 | | | 662,046 |
| Julius Baer Holding Ltd. | | 19,679 | | | 757,006 |
| | | | | |
| | | | $ | 1,985,201 |
| | | | | |
| Business Services – 4.8% | | | | | |
| Accenture Ltd., “A” | | 25,190 | | $ | 825,980 |
| Infosys Technologies Ltd., ADR | | 22,740 | | | 558,722 |
| Intertek Group PLC | | 35,870 | | | 406,307 |
| MasterCard, Inc. | | 3,950 | | | 564,574 |
| Visa, Inc. | | 16,000 | | | 839,200 |
| | | | | |
| | | | $ | 3,194,783 |
| | | | | |
| Chemicals – 1.4% | | | | | |
| 3M Co. | | 15,790 | | $ | 908,557 |
| | | | | |
| Computer Software – 2.8% | | | | | |
| Oracle Corp. (a) | | 47,280 | | $ | 838,274 |
| SAP AG | | 16,700 | | | 598,513 |
| VeriSign, Inc. (a) | | 23,700 | | | 452,196 |
| | | | | |
| | | | $ | 1,888,983 |
| | | | | |
| Computer Software – Systems – 3.6% | | | | | |
| Apple, Inc. (a) | | 6,830 | | $ | 582,941 |
| EMC Corp. (a) | | 60,620 | | | 634,691 |
| International Business Machines Corp. | | 7,160 | | | 602,586 |
| NTT Data Corp. | | 144 | | | 578,042 |
| | | | | |
| | | | $ | 2,398,260 |
| | | | | |
| | | | | |
| Issuer | | Shares/Par | | Value ($) |
| | | | | |
| COMMON STOCKS – continued | | | |
| Conglomerates – 0.8% | | | | | |
| Siemens AG | | 7,300 | | $ | 546,773 |
| | | | | |
| Consumer Goods & Services – 5.0% | | | | | |
| Colgate-Palmolive Co. | | 6,680 | | $ | 457,847 |
| Hengan International Group Co. Ltd. | | 228,000 | | | 732,523 |
| Procter & Gamble Co. | | 12,930 | | | 799,333 |
| Reckitt Benckiser Group PLC | | 19,650 | | | 732,049 |
| Shiseido Co. Ltd. | | 32,000 | | | 655,071 |
| | | | | |
| | | | $ | 3,376,823 |
| | | | | |
| Containers – 1.2% | | | | | |
| Brambles Ltd. | | 147,850 | | $ | 768,249 |
| | | | | |
| Electrical Equipment – 2.9% | | | | | |
| Danaher Corp. | | 7,830 | | $ | 443,256 |
| Keyence Corp. | | 3,200 | | | 655,220 |
| Schneider Electric S.A. | | 11,423 | | | 853,257 |
| | | | | |
| | | | $ | 1,951,733 |
| | | | | |
| Electronics – 6.5% | | | | | |
| Canon, Inc. | | 14,200 | | $ | 445,760 |
| Hirose Electric Co. Ltd. | | 6,200 | | | 625,959 |
| Hoya Corp. | | 21,900 | | | 380,443 |
| Intel Corp. | | 38,800 | | | 568,808 |
| National Semiconductor Corp. | | 45,500 | | | 458,185 |
| Royal Philips Electronics N.V. | | 19,960 | | | 388,202 |
| Samsung Electronics Co. Ltd. | | 2,142 | | | 777,798 |
| Taiwan Semiconductor Manufacturing Co. Ltd., ADR | | 92,446 | | | 730,323 |
| | | | | |
| | | | $ | 4,375,478 |
| | | | | |
| Energy – Independent – 2.5% | | | | | |
| INPEX Holdings, Inc. | | 215 | | $ | 1,698,619 |
| | | | | |
| Energy – Integrated – 4.4% | | | | | |
| OAO Gazprom, ADR | | 41,790 | | $ | 595,508 |
| Petroleo Brasileiro S.A., ADR | | 30,120 | | | 737,639 |
| TOTAL S.A. | | 30,040 | | | 1,637,711 |
| | | | | |
| | | | $ | 2,970,858 |
| | | | | |
| Food & Beverages – 5.0% | | | | | |
| Groupe Danone | | 11,390 | | $ | 687,443 |
| Nestle S.A. | | 47,288 | | | 1,863,742 |
| PepsiCo, Inc. | | 15,080 | | | 825,932 |
| | | | | |
| | | | $ | 3,377,117 |
| | | | | |
| Food & Drug Stores – 2.0% | | | | | |
| CVS Caremark Corp. | | 27,540 | | $ | 791,500 |
| Tesco PLC | | 108,079 | | | 563,082 |
| | | | | |
| | | | $ | 1,354,582 |
| | | | | |
| Gaming & Lodging – 0.5% | | | | | |
| International Game Technology | | 28,680 | | $ | 341,005 |
| | | | | |
| Insurance – 0.8% | | | | | |
| QBE Insurance Group Ltd. | | 27,410 | | $ | 498,248 |
| | | | | |
7
Portfolio of Investments – continued
| | | | | |
| Issuer | | Shares/Par | | Value ($) |
| | | | | |
| COMMON STOCKS – continued | | | |
| Internet – 1.1% | | | | | |
| Google, Inc., “A” (a) | | 2,400 | | $ | 738,360 |
| | | | | |
| Major Banks – 4.4% | | | | | |
| Bank of New York Mellon Corp. | | 16,260 | | $ | 460,646 |
| Erste Bank der oesterreichischen Sparkassen AG | | 33,530 | | | 786,025 |
| HSBC Holdings PLC | | 55,489 | | | 531,098 |
| Raiffeisen International Bank Holding AG | | 20 | | | 560 |
| Standard Chartered PLC | | 49,394 | | | 631,419 |
| State Street Corp. | | 13,000 | | | 511,290 |
| | | | | |
| | | | $ | 2,921,038 |
| | | | | |
| Medical Equipment – 4.6% | | | | | |
| Essilor International S.A. | | 8,820 | | $ | 413,835 |
| Medtronic, Inc. | | 20,980 | | | 659,192 |
| Sonova Holding AG | | 7,660 | | | 462,120 |
| Synthes, Inc. | | 5,070 | | | 640,879 |
| Waters Corp. (a) | | 7,490 | | | 274,509 |
| Zimmer Holdings, Inc. (a) | | 16,020 | | | 647,528 |
| | | | | |
| | | | $ | 3,098,063 |
| | | | | |
| Metals & Mining – 1.4% | | | | | |
| BHP Billiton PLC | | 27,690 | | $ | 521,593 |
| Rio Tinto Ltd. | | 20,170 | | | 437,020 |
| | | | | |
| | | | $ | 958,613 |
| | | | | |
| Network & Telecom – 2.9% | | | | | |
| Cisco Systems, Inc. (a) | | 46,240 | | $ | 753,712 |
| Nokia Oyj | | 46,980 | | | 728,328 |
| Research in Motion Ltd. (a) | | 11,430 | | | 463,829 |
| | | | | |
| | | | $ | 1,945,869 |
| | | | | |
| Oil Services – 1.3% | | | | | |
| Halliburton Co. | | 22,790 | | $ | 414,322 |
| Schlumberger Ltd. | | 10,700 | | | 452,931 |
| | | | | |
| | | | $ | 867,253 |
| | | | | |
| Other Banks & Diversified Financials – 1.6% | | | |
| Aeon Credit Service Co. Ltd. | | 49,900 | | $ | 527,947 |
| Housing Development Finance Corp. Ltd. | | 17,903 | | | 558,267 |
| | | | | |
| | | | $ | 1,086,214 |
| | | | | |
| Pharmaceuticals – 7.1% | | | | | |
| Allergan, Inc. | | 21,620 | | $ | 871,718 |
| Bayer AG | | 10,440 | | | 613,295 |
| Novartis AG | | 12,930 | | | 647,851 |
| Novo Nordisk A/S, “B” | | 20,370 | | | 1,036,617 |
| Roche Holding AG | | 10,120 | | | 1,557,809 |
| | | | | |
| | | | $ | 4,727,290 |
| | | | | |
| Restaurants – 1.1% | | | | | |
| YUM! Brands, Inc. | | 23,180 | | $ | 730,170 |
| | | | | |
| Specialty Chemicals – 5.6% | | | | | |
| Akzo Nobel N.V. | | 16,940 | | $ | 698,560 |
| L’Air Liquide S.A. | | 7,256 | | | 663,885 |
| Linde AG | | 8,030 | | | 679,527 |
| Praxair, Inc. | | 10,160 | | | 603,098 |
| | | | | | | |
| Issuer | | Shares/Par | | Value ($) | |
| | | | | | | |
| COMMON STOCKS – continued | | | | |
| Specialty Chemicals – continued | | | | | | | |
| Shin-Etsu Chemical Co. Ltd. | | | 15,300 | | $ | 701,748 | |
| Symrise AG | | | 29,858 | | | 421,708 | |
| | | | | | | |
| | | | | $ | 3,768,526 | |
| | | | | | | |
| Specialty Stores – 1.4% | | | | | | | |
| Industria de Diseno Textil S.A. | | | 13,780 | | $ | 609,094 | |
| Staples, Inc. | | | 18,210 | | | 326,323 | |
| | | | | | | |
| | | | | $ | 935,417 | |
| | | | | | | |
| Telecommunications – Wireless – 2.5% | | | | | | | |
| America Movil S.A.B. de C.V., “L”, ADR | | | 21,380 | | $ | 662,566 | |
| MTN Group Ltd. | | | 44,950 | | | 531,842 | |
| Rogers Communications, Inc., “B” | | | 16,170 | | | 479,271 | |
| | | | | | | |
| | | | | $ | 1,673,679 | |
| | | | | | | |
| Telephone Services – 1.7% | | | | | | | |
| Telefonica S.A. | | | 49,900 | | $ | 1,118,532 | |
| | | | | | | |
| Utilities – Electric Power – 0.9% | | | | | | | |
| E.ON AG | | | 15,417 | | $ | 623,420 | |
| | | | | | | |
Total Common Stocks
(Identified Cost, $90,963,422) | | | | | $ | 65,947,539 | |
| | | | | | | |
| |
| REPURCHASE AGREEMENTS – 1.6% | | | | |
| Goldman Sachs, 0.01%, dated 12/31/08, due 1/02/09, total to be received $1,072,001 (secured by U.S. Treasury and Federal Agency obligations and Mortgage Backed securities in a jointly traded account) | | $ | 1,072,000 | | $ | 1,072,000 | |
| Morgan Stanley, 0.02%, dated 12/31/08, due 1/02/09, total to be received $1,000.01 (secured by various U.S. Treasury and Federal Agency obligations and Mortgage Backed securities in a jointly traded account) | | | 1,000 | | | 1,000 | |
| | | | | | | |
| Total Repurchase Agreements, at Cost | | | | | $ | 1,073,000 | |
| | | | | | | |
Total Investments
(Identified Cost, $92,036,422) | | | | | $ | 67,020,539 | |
| | | | | | | |
OTHER ASSETS, LESS
LIABILITIES – (0.1)% | | | | | | (62,168 | ) |
| | | | | | | |
| Net Assets – 100.0% | | | | | $ | 66,958,371 | |
| | | | | | | |
| (a) | | Non-income producing security. |
The following abbreviations are used in this report and are defined:
| ADR | | American Depository Receipt |
See Notes to Financial Statements
8
FINANCIAL STATEMENTS | STATEMENT OF ASSETS AND LIABILITIES
This statement represents your fund’s balance sheet, which details the assets and liabilities comprising the total value of the fund.
| | | | | |
| At 12/31/08 | | | | | |
Assets | | | | | |
Investments, at value (identified cost, $92,036,422) | | $67,020,539 | | | |
Cash | | 779 | | | |
Receivable for investments sold | | 2,586 | | | |
Receivable for fund shares sold | | 9,214 | | | |
Interest and dividends receivable | | 110,778 | | | |
Other assets | | 4,186 | | | |
Total assets | | | | | $67,148,082 |
Liabilities | | | | | |
Payable to custodian | | $2,437 | | | |
Payable for fund shares reacquired | | 51,569 | | | |
Payable to affiliates | | | | | |
Management fee | | 3,244 | | | |
Distribution fees | | 63 | | | |
Administrative services fee | | 155 | | | |
Payable for trustees’ compensation | | 146 | | | |
Accrued expenses and other liabilities | | 132,097 | | | |
Total liabilities | | | | | $189,711 |
Net assets | | | | | $66,958,371 |
Net assets consist of | | | | | |
Paid-in capital | | $132,286,594 | | | |
Unrealized appreciation (depreciation) on investments and translation of assets and liabilities in foreign currencies | | (25,017,067 | ) | | |
Accumulated net realized gain (loss) on investments and foreign currency transactions | | (41,104,597 | ) | | |
Undistributed net investment income | | 793,441 | | | |
Net assets | | | | | $66,958,371 |
Shares of beneficial interest outstanding | | | | | 6,309,298 |
Initial Class shares | | | | | |
Net assets | | $62,288,651 | | | |
Shares outstanding | | 5,866,467 | | | |
Net asset value per share | | | | | $10.62 |
Service Class shares | | | | | |
Net assets | | $4,669,720 | | | |
Shares outstanding | | 442,831 | | | |
Net asset value per share | | | | | $10.55 |
See Notes to Financial Statements
9
FINANCIAL STATEMENTS | STATEMENT OF OPERATIONS
This statement describes how much your fund earned in investment income and accrued in expenses. It also describes any gains and/or losses generated by fund operations.
| | | | | | |
| Year ended 12/31/08 | | | | | | |
Net investment income | | | | | | |
Income | | | | | | |
Dividends | | $2,290,081 | | | | |
Interest | | 111,475 | | | | |
Foreign taxes withheld | | (158,881 | ) | | | |
Total investment income | | | | | $2,242,675 | |
Expenses | | | | | | |
Management fee | | $939,394 | | | | |
Distribution fees | | 17,307 | | | | |
Administrative services fee | | 30,502 | | | | |
Trustees’ compensation | | 14,760 | | | | |
Custodian fee | | 223,351 | | | | |
Shareholder communications | | 4,936 | | | | |
Auditing fees | | 67,059 | | | | |
Legal fees | | 7,128 | | | | |
Miscellaneous | | 12,390 | | | | |
Total expenses | | | | | $1,316,827 | |
Fees paid indirectly | | (256 | ) | | | |
Net expenses | | | | | $1,316,571 | |
Net investment income | | | | | $926,104 | |
Realized and unrealized gain (loss) on investments and foreign currency transactions | | | | | | |
Realized gain (loss) (identified cost basis) | | | | | | |
Investment transactions | | $(7,722,218 | ) | | | |
Foreign currency transactions | | (66,017 | ) | | | |
Net realized gain (loss) on investments and foreign currency transactions | | | | | $(7,788,235 | ) |
Change in unrealized appreciation (depreciation) | | | | | | |
Investments | | $(40,911,322 | ) | | | |
Translation of assets and liabilities in foreign currencies | | (1,578 | ) | | | |
Net unrealized gain (loss) on investments and foreign currency translation | | | | | $(40,912,900 | ) |
Net realized and unrealized gain (loss) on investments and foreign currency | | | | | $(48,701,135 | ) |
Change in net assets from operations | | | | | $(47,775,031 | ) |
See Notes to Financial Statements
10
FINANCIAL STATEMENTS | STATEMENTS OF CHANGES IN NET ASSETS
These statements describe the increases and/or decreases in net assets resulting from operations, any distributions, and any shareholder transactions.
| | | | | | |
For years ended 12/31 | | 2008 | | | 2007 | |
Change in net assets | | | | | | |
From operations | | | | | | |
Net investment income | | $926,104 | | | $1,230,209 | |
Net realized gain (loss) on investments and foreign currency transactions | | (7,788,235 | ) | | 27,684,999 | |
Net unrealized gain (loss) on investments and foreign currency translation | | (40,912,900 | ) | | (9,801,567 | ) |
Change in net assets from operations | | $(47,775,031 | ) | | $19,113,641 | |
Distributions declared to shareholders | | | | | | |
From net investment income | | | | | | |
Initial Class | | $(1,013,748 | ) | | $(2,413,626 | ) |
Service Class | | (52,890 | ) | | (124,151 | ) |
Total distributions declared to shareholders | | $(1,066,638 | ) | | $(2,537,777 | ) |
Change in net assets from fund share transactions | | $(24,786,548 | ) | | $(33,505,791 | ) |
Total change in net assets | | $(73,628,217 | ) | | $(16,929,927 | ) |
Net assets | | | | | | |
At beginning of period | | 140,586,588 | | | 157,516,515 | |
At end of period (including undistributed net investment income of $793,441 and
$997,616, respectively) | | $66,958,371 | | | $140,586,588 | |
See Notes to Financial Statements
11
FINANCIAL STATEMENTS | FINANCIAL HIGHLIGHTS
The financial highlights table is intended to help you understand the fund’s financial performance for the past 5 years Certain information reflects financial results for a single fund share. The total returns in the table represent the rate by which an investor would have earned (or lost) on an investment in the fund share class (assuming reinvestment of all distributions) held for the entire period.
| | | | | | | | | | | | | | | |
| Initial Class | | Years ended 12/31 | |
| | | 2008 | | | 2007 | | | 2006 | | | 2005 | | | 2004 | |
Net asset value, beginning of period | | $17.54 | | | $15.74 | | | $13.48 | | | $12.31 | | | $10.70 | |
| Income (loss) from investment operations | | | | | | | | | | | | | | | |
| Net investment income (d) | | $0.13 | | | $0.14 | | | $0.20 | | | $0.07 | | | $0.05 | |
Net realized and unrealized gain (loss) on investments
and foreign currency | | (6.90 | ) | | 1.94 | | | 2.14 | | | 1.16 | | | 1.61 | |
Total from investment operations | | $(6.77 | ) | | $2.08 | | | $2.34 | | | $1.23 | | | $1.66 | |
| Less distributions declared to shareholders | | | | | | | | | | | | | | | |
From net investment income | | $(0.15 | ) | | $(0.28 | ) | | $(0.08 | ) | | $(0.06 | ) | | $(0.05 | ) |
Net asset value, end of period | | $10.62 | | | $17.54 | | | $15.74 | | | $13.48 | | | $12.31 | |
Total return (%) (k)(s) | | (38.93 | ) | | 13.27 | | | 17.37 | | | 10.03 | | | 15.61 | (b) |
Ratios (%) (to average net assets)
and Supplemental data: | | | | | | | | | | | | | | | |
Expenses (f) | | 1.25 | | | 1.10 | | | 1.14 | | | 1.08 | | | 1.07 | |
Net investment income | | 0.90 | | | 0.83 | | | 1.39 | | | 0.59 | | | 0.48 | |
Portfolio turnover | | 81 | | | 76 | | | 92 | | | 87 | | | 115 | |
Net assets at end of period (000 Omitted) | | $62,289 | | | $131,870 | | | $148,793 | | | $155,375 | | | $175,146 | |
| |
| Service Class | | Years ended 12/31 | |
| | | 2008 | | | 2007 | | | 2006 | | | 2005 | | | 2004 | |
Net asset value, beginning of period | | $17.42 | | | $15.63 | | | $13.39 | | | $12.24 | | | $10.64 | |
| Income (loss) from investment operations | | | | | | | | | | | | | | | |
| Net investment income (d) | | $0.10 | | | $0.09 | | | $0.17 | | | $0.04 | | | $0.02 | |
Net realized and unrealized gain (loss) on investments
and foreign currency | | (6.86 | ) | | 1.94 | | | 2.12 | | | 1.14 | | | 1.61 | |
Total from investment operations | | $(6.76 | ) | | $2.03 | | | $2.29 | | | $1.18 | | | $1.63 | |
| Less distributions declared to shareholders | | | | | | | | | | | | | | | |
From net investment income | | $(0.11 | ) | | $(0.24 | ) | | $(0.05 | ) | | $(0.03 | ) | | $(0.03 | ) |
Net asset value, end of period | | $10.55 | | | $17.42 | | | $15.63 | | | $13.39 | | | $12.24 | |
Total return (%) (k)(s) | | (39.07 | ) | | 13.04 | | | 17.09 | | | 9.65 | | | 15.41 | (b) |
Ratios (%) (to average net assets)
and Supplemental data: | | | | | | | | | | | | | | | |
Expenses (f) | | 1.49 | | | 1.35 | | | 1.39 | | | 1.33 | | | 1.32 | |
Net investment income | | 0.67 | | | 0.56 | | | 1.16 | | | 0.34 | | | 0.23 | |
Portfolio turnover | | 81 | | | 76 | | | 92 | | | 87 | | | 115 | |
Net assets at end of period (000 Omitted) | | $4,670 | | | $8,716 | | | $8,723 | | | $7,599 | | | $7,785 | |
| (b) | The fund’s net asset value and total return calculation include a non-recurring accrual recorded as a result of an administrative proceeding regarding disclosure of brokerage allocation practices in connection with fund sales. The non-recurring accrual resulted in an increase in the net asset value of $0.01 per share based on shares outstanding on the day the accrual was recorded. |
| (d) | Per share data are based on average shares outstanding. |
| (f) | Ratios do not reflect reductions from fees paid indirectly, if applicable. |
| (k) | The total return does not reflect expenses that apply to separate accounts. Inclusion of these charges would reduce the total return figures for all periods shown. |
| (s) | From time to time the fund may receive proceeds from litigation settlements, without which performance would be lower. |
See Notes to Financial Statements
12
NOTES TO FINANCIAL STATEMENTS
| (1) | | Business and Organization |
MFS Global Growth Portfolio (the fund) is a series of MFS Variable Insurance Trust II (the trust). The trust is organized as a Massachusetts business trust and is registered under the Investment Company Act of 1940, as amended, as an open-end management investment company. The shares of the fund are sold to variable accounts established by insurance companies to fund benefits under variable contracts issued by such companies, and qualified retirement and pension plans.
General – The preparation of financial statements in conformity with U.S. generally accepted accounting principles requires management to make estimates and assumptions that affect the reported amounts of assets and liabilities, and disclosure of contingent assets and liabilities at the date of the financial statements and the reported amounts of revenues and expenses during the reporting period. Actual results could differ from those estimates. The fund can invest in foreign securities, including securities of emerging market issuers. Investments in foreign securities are vulnerable to the effects of changes in the relative values of the local currency and the U.S. dollar and to the effects of changes in each country’s legal, political, and economic environment. The markets of emerging markets countries are generally more volatile than the markets of developed countries with more mature economies. All of the risks of investing in foreign securities previously described are heightened when investing in emerging markets countries.
In March 2008, FASB Statement No. 161, Disclosures about Derivative Instruments and Hedging Activities (the “Standard”) was issued, and is effective for financial statements issued for fiscal years and interim periods beginning after November 15, 2008. This Standard provides enhanced disclosures about the fund’s use of and accounting for derivative instruments and the effect of derivative instruments on the fund’s results of operations and financial position. Management is evaluating the application of the Standard to the fund, and has not at this time determined the impact, if any, resulting from the adoption of this Standard on the fund’s financial statements.
FASB Staff Position (FSP) 133-1 was implemented during the period. FSP 133-1 amends FAS 133 to require sellers of credit derivatives to make disclosures that will enable financial statement users to assess the potential effects of those credit derivatives on an entity’s financial position, financial performance and cash flows. There was no impact from implementing FSP 133-1 as the fund did not hold any of these credit derivatives at period end.
Investment Valuations – Equity securities, including restricted equity securities, are generally valued at the last sale or official closing price as reported by a third party pricing service on the market or exchange on which they are primarily traded. For securities for which there were no sales reported that day, equity securities are generally valued at the last quoted daily bid quotation as reported by a third party pricing service on the market or exchange on which they are primarily traded. For securities held short for which there were no sales reported for the day, the position is generally valued at the last quoted daily ask quotation as reported by a third party pricing service on the market or exchange on which such securities are primarily traded. Short-term instruments with a maturity at issuance of 60 days or less may be valued at amortized cost, which approximates market value. Open-end investment companies are generally valued at net asset value per share. Securities and other assets generally valued on the basis of information from a third party pricing service may also be valued at a broker-dealer bid quotation. Values obtained from pricing services can utilize both dealer-supplied valuations and electronic data processing techniques, which take into account factors such as institutional-size trading in similar groups of securities, yield, quality, coupon rate, maturity, type of issue, trading characteristics, and other market data. The values of foreign securities and other assets and liabilities expressed in foreign currencies are converted to U.S. dollars using the mean of bid and asked prices for rates reported by a third party pricing service.
The Board of Trustees has delegated primary responsibility for determining or causing to be determined the value of the fund’s investments (including any fair valuation) to the adviser pursuant to valuation policies and procedures approved by the Board. If the adviser determines that reliable market quotations are not readily available, investments are valued at fair value as determined in good faith by the adviser in accordance with such procedures under the oversight of the Board of Trustees. Under the fund’s valuation policies and procedures, market quotations are not considered to be readily available for most types of debt instruments and floating rate loans and many types of derivatives. These investments are generally valued at fair value based on information from third party pricing services. In addition, investments may be valued at fair value if the adviser determines that an investment’s value has been materially affected by events occurring after the close of the exchange or market on which the investment is principally traded (such as foreign exchange or market) and prior to the determination of the fund’s net asset value, or after the halting of trading of a specific security where trading does not resume prior to the close of the exchange or market on which the security is principally traded. Events that occur on a frequent basis after foreign markets close (such as developments in foreign markets and significant movements in the U.S. markets) and prior to the determination of the fund’s net asset value may be deemed to have a material affect on the value of securities traded in foreign markets. Accordingly, the fund’s foreign equity securities may often be valued at fair value. The adviser may rely on third party pricing services or other information (such as the correlation with price movements of similar securities in the same or other
13
Notes to Financial Statements – continued
markets; the type, cost and investment characteristics of the security; the business and financial condition of the issuer; and trading and other market data) to assist in determining whether to fair value and at what value to fair value an investment. The value of an investment for purposes of calculating the fund’s net asset value can differ depending on the source and method used to determine value. When fair valuation is used, the value of investments used to determine the fund’s net asset value may differ from quoted or published prices for the same investments.
The fund adopted FASB Statement No. 157, Fair Value Measurements (the “Statement”). This Statement provides a single definition of fair value, a hierarchy for measuring fair value and expanded disclosures about fair value measurements.
Various inputs are used in determining the value of the fund’s assets or liabilities carried at market value. These inputs are categorized into three broad levels. Level 1 includes quoted prices in active markets for identical assets or liabilities. Level 2 includes other significant observable market-based inputs (including quoted prices for similar securities, interest rates, prepayment speed, and credit risk). Level 3 includes unobservable inputs, which may include the adviser’s own assumptions in determining the fair value of investments. Other financial instruments are derivative instruments not reflected in total investments, such as futures, forwards, swap contracts and written options. The following is a summary of the levels used as of December 31, 2008 in valuing the fund’s assets or liabilities carried at market value:
| | | | | | | | |
| | | Level 1 | | Level 2 | | Level 3 | | Total |
| Investments in Securities | | $27,777,580 | | $39,242,959 | | $— | | $67,020,539 |
| Other Financial Instruments | | $— | | $— | | $— | | $— |
Repurchase Agreements – The fund may enter into repurchase agreements with approved counterparties. Each repurchase agreement is recorded at cost. The fund requires that the securities collateral in a repurchase transaction be transferred to a custodian. The fund monitors, on a daily basis, the value of the collateral to ensure that its value, including accrued interest, is greater than amounts owed to the fund under each such repurchase agreement. The fund and other funds managed by Massachusetts Financial Services Company (MFS), may utilize a joint trading account for the purpose of entering into one or more repurchase agreements.
Foreign Currency Translation – Purchases and sales of foreign investments, income, and expenses are converted into U.S. dollars based upon currency exchange rates prevailing on the respective dates of such transactions or on the reporting date for foreign denominated receivables and payables. Gains and losses attributable to foreign currency exchange rates on sales of securities are recorded for financial statement purposes as net realized gains and losses on investments. Gains and losses attributable to foreign exchange rate movements on receivables, payables, income and expenses are recorded for financial statement purposes as foreign currency transaction gains and losses. That portion of both realized and unrealized gains and losses on investments that results from fluctuations in foreign currency exchange rates is not separately disclosed.
Security Loans – State Street Bank and Trust Company (“State Street”), as lending agent, may loan the securities of the fund to certain qualified institutions (the “Borrowers”) approved by the fund. The loans are collateralized at all times by cash and/or U.S. Treasury and federal agency obligations in an amount at least equal to the market value of the securities loaned. State Street provides the fund with indemnification against Borrower default. The fund bears the risk of loss with respect to the investment of cash collateral. On loans collateralized by cash, the cash collateral is invested in a money market fund or short-term securities. A portion of the income generated upon investment of the collateral is remitted to the Borrowers, and the remainder is allocated between the fund and the lending agent. On loans collateralized by U.S. Treasury and/or federal agency obligations, a fee is received from the Borrower, and is allocated between the fund and the lending agent. Net income from securities lending is included in interest income on the Statement of Operations. The dividend and interest income earned on the securities loaned is accounted for in the same manner as other dividend and interest income. At December 31, 2008, there were no securities on loan.
Indemnifications – Under the fund’s organizational documents, its officers and trustees may be indemnified against certain liabilities and expenses arising out of the performance of their duties to the fund. Additionally, in the normal course of business, the fund enters into agreements with service providers that may contain indemnification clauses. The fund’s maximum exposure under these agreements is unknown as this would involve future claims that may be made against the fund that have not yet occurred.
Investment Transactions and Income – Investment transactions are recorded on the trade date. Interest income is recorded on the accrual basis. All premium and discount is amortized or accreted for financial statement purposes in accordance with U.S. generally accepted accounting principles. Dividends received in cash are recorded on the ex-dividend date. Certain dividends from foreign securities will be recorded when the fund is informed of the dividend if such information is obtained subsequent to the ex-dividend date. Dividend and interest payments received in additional securities are recorded on the ex-dividend or ex-interest date in an amount equal to the value of the security on such date.
14
Notes to Financial Statements – continued
The fund may receive proceeds from litigation settlements. Any proceeds received from litigation involving portfolio holdings are reflected in the Statement of Operations in realized gain/loss if the security has been disposed of by the fund or in unrealized gain/loss if the security is still held by the fund. Any other proceeds from litigation not related to portfolio holdings are reflected as other income in the Statement of Operations.
Fees Paid Indirectly – The fund’s custody fee may be reduced according to an arrangement that measures the value of cash deposited with the custodian by the fund. This amount, for the year ended December 31, 2008, is shown as a reduction of total expenses on the Statement of Operations.
Tax Matters and Distributions – The fund intends to qualify as a regulated investment company, as defined under Subchapter M of the Internal Revenue Code, and to distribute all of its taxable income, including realized capital gains. As a result, no provision for federal income tax is required. Each of the fund’s federal tax returns for the prior three fiscal years remains subject to examination by the Internal Revenue Service. Foreign taxes, if any, have been accrued by the fund in the accompanying financial statements.
Distributions to shareholders are recorded on the ex-dividend date. Income and capital gain distributions are determined in accordance with income tax regulations, which may differ from U.S. generally accepted accounting principles. Certain capital accounts in the financial statements are periodically adjusted for permanent differences in order to reflect their tax character. These adjustments have no impact on net assets or net asset value per share. Temporary differences which arise from recognizing certain items of income, expense, gain or loss in different periods for financial statement and tax purposes will reverse at some time in the future. Distributions in excess of net investment income or net realized gains are temporary overdistributions for financial statement purposes resulting from differences in the recognition or classification of income or distributions for financial statement and tax purposes.
Book/tax differences primarily relate to wash sale loss deferrals, foreign currency transactions, and foreign taxes.
The tax character of distributions declared to shareholders for the last two fiscal years is as follows:
| | | | |
| | | 12/31/08 | | 12/31/07 |
| Ordinary income (including any short-term capital gains) | | $1,066,638 | | $2,537,777 |
The federal tax cost and the tax basis components of distributable earnings were as follows:
| | | |
| As of 12/31/08 | | | |
| Cost of investments | | $92,437,334 | |
| Gross appreciation | | 1,017,676 | |
| Gross depreciation | | (26,434,471 | ) |
| Net unrealized appreciation (depreciation) | | $(25,416,795 | ) |
| Undistributed ordinary income | | 796,729 | |
| Capital loss carryforwards | | (40,526,535 | ) |
| Other temporary differences | | (181,622 | ) |
As of December 31, 2008, the fund had capital loss carryforwards available to offset future realized gains. Such losses expire as follows:
| | | |
| 12/31/10 | | $(33,257,724 | ) |
| 12/31/16 | | (7,268,811 | ) |
| | $(40,526,535 | ) |
Multiple Classes of Shares of Beneficial Interest – The fund offers multiple classes of shares, which differ in their respective distribution fees. The fund’s income, realized and unrealized gain (loss), and common expenses are allocated to shareholders based on the daily net assets of each class. Dividends are declared separately for each class. Differences in per share dividend rates are generally due to differences in separate class expenses.
| (3) | | Transactions with Affiliates |
Investment Adviser – The fund has an investment advisory agreement with MFS to provide overall investment management and related administrative services and facilities to the fund.
The management fee is computed daily and paid monthly at the following annual rates:
| | |
| First $1 billion of average daily net assets | | 0.90% |
| Next $1 billion of average daily net assets | | 0.75% |
| Average daily net assets in excess of $2 billion | | 0.65% |
The management fee incurred for the year ended December 31, 2008 was equivalent to an annual effective rate of 0.90% of the fund’s average daily net assets.
15
Notes to Financial Statements – continued
Distributor – MFS Fund Distributors, Inc. (MFD), a wholly-owned subsidiary of MFS, is the distributor of shares of the fund. The Trustees have adopted a distribution plan for the Service Class shares pursuant to Rule 12b-1 under the Investment Company Act of 1940.
The fund’s distribution plan provides that the fund will pay MFD distribution fees equal to 0.25% per annum of its average daily net assets attributable to Service Class shares as partial consideration for services performed and expenses incurred by MFD and financial intermediaries in connection with the sale and distribution of the fund’s Service Class shares and the sale and distribution of the variable annuity or variable life insurance contracts investing indirectly in Service Class shares. MFD may subsequently pay all, or a portion, of the distribution fees to financial intermediaries.
Shareholder Servicing Agent – MFS Service Center, Inc. (MFSC), a wholly-owned subsidiary of MFS, has contracted to provide transfer agent and recordkeeping functions in connection with the issuance, transfer, and redemption of each class of shares of the fund under a Shareholder Servicing Agent Agreement. During the year ended December 31, 2008, the fund did not pay MFSC a fee for this service.
Administrator – MFS provides certain financial, legal, shareholder communications, compliance, and other administrative services to the fund. Under an administrative services agreement, the fund partially reimburses MFS the costs incurred to provide these services. The fund is charged an annual fixed amount of $10,000 plus a fee based on average daily net assets.
The administrative services fee incurred for the year ended December 31, 2008 was equivalent to an annual effective rate of 0.0292% of the fund’s average daily net assets.
Trustees’ and Officers’ Compensation – The fund pays compensation to trustees in the form of a retainer, attendance fees, and additional compensation to the Board chairperson. The fund does not pay compensation directly to officers of the fund who are also officers of the investment adviser, all of whom receive remuneration for their services to the fund from MFS. Certain officers and trustees of the fund are officers or directors of MFS, MFD, and MFSC.
Other – This fund and certain other MFS funds (the funds) have entered into services agreements (the Agreements) which provide for payment of fees by the funds to Tarantino LLC and Griffin Compliance LLC in return for the provision of services of an Independent Chief Compliance Officer (ICCO) and Assistant ICCO, respectively, for the funds. The ICCO and Assistant ICCO are officers of the funds and the sole members of Tarantino LLC and Griffin Compliance LLC, respectively. The funds can terminate the Agreements with Tarantino LLC and Griffin Compliance LLC at any time under the terms of the Agreements. MFS has agreed to bear all expenses associated with office space, other administrative support, and supplies provided to the ICCO and Assistant ICCO. For the year ended December 31, 2008, the aggregate fees paid by the fund to Tarantino LLC and Griffin Compliance LLC were $961 and are included in miscellaneous expense on the Statement of Operations.
Purchases and sales of investments, other than U.S. Government securities, purchased option transactions, and short-term obligations, aggregated $84,892,598 and $110,150,155, respectively.
| (5) | | Shares of Beneficial Interest |
The fund’s Declaration of Trust permits the Trustees to issue an unlimited number of full and fractional shares of beneficial interest. Transactions in fund shares were as follows:
| | | | | | | | | | | | |
| | | Year ended 12/31/08 | | | Year ended 12/31/07 | |
| | | Shares | | | Amount | | | Shares | | | Amount | |
| Shares sold | | | | | | | | | | | | |
Initial Class | | 87,834 | | | $1,322,408 | | | 118,766 | | | $2,002,516 | |
Service Class | | 123,966 | | | 1,528,855 | | | 38,253 | | | 655,319 | |
| | 211,800 | | | $2,851,263 | | | 157,019 | | | $2,657,835 | |
| Shares issued to shareholders in reinvestment of distributions | | | | | | | | | | | | |
Initial Class | | 58,362 | | | $1,013,748 | | | 144,269 | | | $2,413,626 | |
Service Class | | 3,061 | | | 52,890 | | | 7,461 | | | 124,151 | |
| | 61,423 | | | $1,066,638 | | | 151,730 | | | $2,537,777 | |
| Shares reacquired | | | | | | | | | | | | |
Initial Class | | (1,797,172 | ) | | $(26,303,369 | ) | | (2,201,427 | ) | | $(36,985,222 | ) |
Service Class | | (184,455 | ) | | (2,401,080 | ) | | (103,436 | ) | | (1,716,181 | ) |
| | (1,981,627 | ) | | $(28,704,449 | ) | | (2,304,863 | ) | | $(38,701,403 | ) |
| Net change | | | | | | | | | | | | |
Initial Class | | (1,650,976 | ) | | $(23,967,213 | ) | | (1,938,392 | ) | | $(32,569,080 | ) |
Service Class | | (57,428 | ) | | (819,335 | ) | | (57,722 | ) | | (936,711 | ) |
| | (1,708,404 | ) | | $(24,786,548 | ) | | (1,996,114 | ) | | $(33,505,791 | ) |
16
Notes to Financial Statements – continued
The fund and other funds managed by MFS participate in a $1 billion unsecured committed line of credit provided by a syndication of banks under a credit agreement. In addition, the fund and other funds managed by MFS have established uncommitted borrowing arrangements with certain banks. Borrowings may be made for temporary financing needs. Interest is charged to each fund, based on its borrowings, generally at a rate equal to the Federal Reserve funds rate plus 0.30%. In addition, a commitment fee, based on the average daily, unused portion of the committed line of credit, is allocated among the participating funds at the end of each calendar quarter. For the year ended December 31, 2008, the fund’s commitment fee and interest expense were $509 and $0, respectively, and are included in miscellaneous expense on the Statement of Operations.
17
REPORT OF INDEPENDENT REGISTERED PUBLIC ACCOUNTING FIRM
To the Board of Trustees of MFS Variable Insurance Trust II and the Shareholders of
MFS Global Growth Portfolio:
We have audited the accompanying statement of assets and liabilities, including the portfolio of investments, of MFS Global Growth Portfolio (the “Fund”) (one of the portfolios comprising MFS Variable Insurance Trust II) as of December 31, 2008, and the related statement of operations for the year then ended, the statements of changes in net assets for each of the two years in the period then ended, and the financial highlights for each of the five years in the period then ended. These financial statements and financial highlights are the responsibility of the Fund’s management. Our responsibility is to express an opinion on these financial statements and financial highlights based on our audits.
We conducted our audits in accordance with the standards of the Public Company Accounting Oversight Board (United States). Those standards require that we plan and perform the audit to obtain reasonable assurance about whether the financial statements and financial highlights are free of material misstatement. The Fund is not required to have, nor were we engaged to perform, an audit of its internal control over financial reporting. Our audits included consideration of internal control over financial reporting as a basis for designing audit procedures that are appropriate in the circumstances, but not for the purpose of expressing an opinion on the effectiveness of the Fund’s internal control over financial reporting. Accordingly, we express no such opinion. An audit also includes examining, on a test basis, evidence supporting the amounts and disclosures in the financial statements, assessing the accounting principles used and significant estimates made by management, as well as evaluating the overall financial statement presentation. Our procedures included confirmation of securities owned as of December 31, 2008, by correspondence with the custodian and brokers. We believe that our audits provide a reasonable basis for our opinion.
In our opinion, the financial statements and financial highlights referred to above present fairly, in all material respects, the financial position of MFS Global Growth Portfolio as of December 31, 2008, the results of its operations for the year then ended, the changes in its net assets for each of the two years in the period then ended, and the financial highlights for each of the five years in the period then ended, in conformity with accounting principles generally accepted in the United States of America.
DELOITTE & TOUCHE LLP
Boston, Massachusetts
February 17, 2009
18
TRUSTEES AND OFFICERS – IDENTIFICATION AND BACKGROUND
The Trustees and officers of the Trust, as of February 1, 2009, are listed below, together with their principal occupations during the past five years. (Their titles may have varied during that period.) The address of each Trustee and officer is 500 Boylston Street, Boston, Massachusetts 02116.
| | | | | | |
Name, Date of Birth | | Position(s) Held
with Fund | | Trustee/Officer
Since (1) | | Principal Occupations During the Past Five Years and
Other Directorships (2) |
| INTERESTED TRUSTEE | | | | |
David D. Horn (3) (born 6/07/41) | | Trustee | | April 1986 | | Private investor; Sun Life Assurance Company of Canada, Senior Vice President and General Manager for the United States (until 1997); Director (until March 2004) |
| | |
| INDEPENDENT TRUSTEES | | | | |
J. Kermit Birchfield (born 1/08/40) | | Chairman | | May 1997 | | Consultant; Century Partners, Inc. (investments), Director; Displaytech, Inc. (technology), Director; Dessin Fournir LLC (furniture manufacturer), Director (2005 to present); Intermountain Gas Company, Inc. & Intermountain Industries, Inc. (oil & gas exploration and production), Director; Site Watch LLC (software to monitor oil tanks), Managing Director (2006 to present); Juridica Investments (fund investing in judicial matters), Director (2007 to present); HPSC, Inc. (medical financing), Director (until January 2004) |
| | | |
Robert C. Bishop (born 1/13/43) | | Trustee | | May 2001 | | AutoImmune, Inc. (pharmaceutical product development), Chairman, President and Chief Executive Officer; Caliper Life Sciences Corp. (laboratory analytical instruments), Director; Millipore Corporation (purification/filtration products), Director; Waterstreet Capital (leverage buyouts), Advisory Board (August 2006 to present); Optobionics Corporation (ophthalmic devices), Director (2002 to 2007) |
| | | |
Frederick H. Dulles (born 3/12/42) | | Trustee | | May 2001 | | Ten State International Law PLLC (law firm), Of Counsel (since 2006); Prudential Carolina Real Estate, (real estate), Broker (since 2006); Free Enterprise Foundation, Inc. (research institute), Director & Secretary (until 2008); Disher, Hamrick & Myers Residential, Inc. (real estate) Broker (2005 until 2006); Frederick H. Dulles law practice (until 2006); Ten State Street LLP (law firm), Member (until 2005) |
| | | |
Marcia A. Kean (born 6/30/48) | | Trustee | | April 2005 | | Feinstein Kean Healthcare (consulting), Chief Executive Officer |
| | | |
Ronald G. Steinhart (born 6/15/40) | | Trustee | | May 2001 | | Private investor; Penske Automotive Group (automotive retailer), Director; Animal Health International, Inc. (animal health products), Director (since 2007); Texas Industries (concrete/aggregates/cement), Director (since 2007); Penson Worldwide, Inc. (securities clearance), Director (since 2006); Carreker Corporation (technology consulting) Director (until 2005); Prentiss Properties Trust (real estate investment trust), Director (until 2006) |
| | | |
Haviland Wright (born 7/21/48) | | Trustee | | May 2001 | | Profitability of Hawaii (software), Chief Development Officer (since December 2008); Elixir Technologies Corporation (software) Director (since 2005); Nano Loa Inc. (liquid crystal displays), Director |
| | |
| TRUSTEE EMERITUS | | | | |
Samuel Adams (born 10/19/25) | | Trustee Emeritus | | | | Retired; K&L Gates LLP (law firm), Of Counsel |
| | |
| OFFICERS | | | | |
Maria F. Dwyer (4) (born 12/01/58) | | President | | November 2005 | | Massachusetts Financial Services Company, Executive Vice President and Chief Regulatory Officer (since March 2004) Chief Compliance Officer (since December 2006); Fidelity Management & Research Company, Vice President (prior to March 2004); Fidelity Group of Funds, President and Treasurer (until March 2004) |
| | | |
Christopher R. Bohane (4) (born 1/18/74) | | Assistant Secretary and Assisstant Clerk | | July 2005 | | Massachusetts Financial Services Company, Vice President and Senior Counsel |
| | | |
John M. Corcoran (4) (born 4/13/65) | | Treasurer | | October 2008 | | Massachusetts Financial Services Company, Senior Vice President (since October 2008); State Street Bank and Trust (financial services provider), Senior Vice President, (until September 2008) |
| | | |
Ethan D. Corey (4) (born 11/21/63) | | Assistant Secretary and Assistant Clerk | | July 2005 | | Massachusetts Financial Services Company, Senior Vice President and Associate General Counsel (since 2004); Dechert LLP (law firm), Counsel (prior to December 2004) |
| | | |
David L. DiLorenzo (4) (born 8/10/68) | | Assistant Treasurer | | July 2005 | | Massachusetts Financial Services Company, Vice President (since June 2005); JP Morgan Investor Services, Vice President (until June 2005) |
| | | |
Timothy M. Fagan (4) (born 7/10/68) | | Assistant Secretary and Assistant Clerk | | September 2005 | | Massachusetts Financial Services Company, Vice President and Senior Counsel (since September 2005); John Hancock Advisers, LLC, Vice President, Senior Attorney and Chief Compliance Officer (until August 2005) |
19
Trustees and Officers – continued
| | | | | | |
Name, Date of Birth | | Position(s) Held
with Fund | | Trustee/Officer
Since (1) | | Principal Occupations During the Past Five Years and
Other Directorships (2) |
Mark D. Fischer (4) (born 10/27/70) | | Assistant Treasurer | | July 2005 | | Massachusetts Financial Services Company, Vice President (since May 2005); JP Morgan Investment Management Company, Vice President (until May 2005) |
| | | |
Robyn L. Griffin (born 7/04/75) | | Assistant Independent Chief Compliance Officer | | August 2008 | | Griffin Compliance LLC (provider of compliance services), Principal (since August 2008); State Street Corporation (financial services provider), Mutual Fund Administration Assistant Vice President (October 2006 – July 2008); Liberty Mutual Group (insurance), Personal Market Assistant Controller (April 2006 – October 2006); Deloitte & Touche LLP (professional services firm), Senior Manager (prior to April 2006) |
| | | |
Brian E. Langenfeld (4) (born 3/07/73) | | Assistant Secretary and Assistant Clerk | | May 2006 | | Massachusetts Financial Services Company, Vice President and Senior Counsel (since May 2006); John Hancock Advisers, LLC, Assistant Vice President and Counsel (until April 2006) |
| | | |
Ellen Moynihan (4) (born 11/13/57) | | Assistant Treasurer | | May 1997 | | Massachusetts Financial Services Company, Senior Vice President |
| | | |
Susan S. Newton (4) (born 3/07/50) | | Assistant Secretary and Assistant Clerk | | May 2005 | | Massachusetts Financial Services Company, Senior Vice President and Associate General Counsel (since April 2005); John Hancock Advisers, LLC, Senior Vice President, Secretary and Chief Legal Officer (until April 2005) |
| | | |
Susan A. Pereira (4) (born 11/05/70) | | Assistant Secretary and Assistant Clerk | | July 2005 | | Massachusetts Financial Services Company, Vice President and Senior Counsel (since June 2004); Bingham McCutchen LLP (law firm), Associate (until June 2004) |
| | | |
Mark N. Polebaum (4) (born 5/01/52) | | Secretary and Clerk | | February 2006 | | Massachusetts Financial Services Company, Executive Vice President, General Counsel and Secretary (since January 2006); Wilmer Cutler Pickering Hale and Dorr LLP (law firm), Partner (until January 2006) |
| | | |
Frank L. Tarantino (born 3/07/44) | | Independent Chief Compliance Officer | | September 2004 | | Tarantino LLC (provider of compliance services), Principal (since June 2004); CRA Business Strategies Group (consulting services), Executive Vice President (until June 2004) |
| | | |
Richard S. Weitzel (4) (born 7/16/70) | | Assistant Secretary and Assistant Clerk | | October 2007 | | Massachusetts Financial Services Company, Vice President and Assistant General Counsel (since 2004); Massachusetts Department of Business and Technology, General Counsel (until April 2004) |
| | | |
James O. Yost (4) (born 6/12/60) | | Assistant Treasurer | | April 1992 | | Massachusetts Financial Services Company, Senior Vice President |
| (1) | Date first appointed to serve as Trustee/Officer of an MFS fund or a Compass variable account. Each Trustee has served continuously since appointment. |
| (2) | Directorships or trusteeships of companies required to report to the Securities and Exchange Commission (i.e., “public companies”). |
| (3) | “Interested person” of the Trust, within the meaning of the Investment Company Act of 1940 (referred to as the 1940 Act), which is the principal federal law governing investment companies like the Trust, as a result of position with Sun Life of Canada (U.S.). The address of Sun Life of Canada (U.S.) is One Sun Life Executive Park, Wellesley Hills, Massachusetts 02481. |
| (4) | “Interested person” of MFS within the meaning of the 1940 Act. The address of MFS is 500 Boylston Street, Boston, Massachusetts 02116. |
The Trust does not hold annual meetings for the purpose of electing Trustees, and Trustees are not elected for fixed terms. Each Trustee and officer holds office until his or her successor is chosen and qualified, or until his or her earlier death, resignation, retirement or removal.
All Trustees currently serve as Trustees of the Trust and have served in that capacity since originally elected or appointed. All of the Trustees are also Managers of the Compass Variable Accounts. The executive officers of the Trust hold similar offices for the Compass Variable Accounts and other funds in the MFS fund complex. As of January 1, 2009, each Trustee serves as a Trustee or Manager of 35 Accounts/Funds.
The Statement of Additional Information contains further information about the Trustees and is available without charge upon request by calling 1-800-752-7215.
| | |
Investment Adviser
Massachusetts Financial Services Company 500 Boylston Street, Boston, MA 02116-3741 | | Custodian State Street Bank and Trust 1 Lincoln Street, Boston, MA 02111-2900 |
Distributor
MFS Fund Distributors, Inc. 500 Boylston Street, Boston, MA 02116-3741 | | Independent Registered Public Accounting Firm Deloitte & Touche LLP 200 Berkeley Street, Boston, MA 02116 |
Portfolio Managers Jeffrey Constantino Barry Dargan | | |
20
BOARD REVIEW OF INVESTMENT ADVISORY AGREEMENT
The Investment Company Act of 1940 requires that both the full Board of Trustees and a majority of the non-interested (“independent”) Trustees, voting separately, annually approve the continuation of the investment advisory agreement between MFS Variable Insurance Trust II (the “Trust”) and Massachusetts Financial Services Company (“MFS”) on behalf of the Fund. The Trustees consider matters bearing on the Fund and the advisory arrangements at their meetings throughout the year, including a review of performance data at each regular meeting. In addition, the independent Trustees met in May and again in July 2008 (“contract review meetings”) for the specific purpose of considering whether to approve the continuation of the investment advisory agreement for the Fund. The independent Trustees were assisted in their evaluation of the investment advisory agreement by independent legal counsel, from whom they received separate legal advice and with whom they met separately from MFS management during various contract review meetings. The independent Trustees were also assisted in this process by the Fund’s Independent Chief Compliance Officer, a full-time senior officer appointed by and reporting to the independent Trustees.
In connection with their deliberations, the Trustees, including the independent Trustees, considered such information and factors as they believed, in light of the legal advice furnished to them and their own business judgment, to be relevant. The investment advisory agreement was considered separately for the Fund, although the Trustees also took into account the common interests of all Funds in the Trust in their review. As described below, the Trustees considered the nature, quality, and extent of the various investment advisory, administrative, and shareholder services performed by MFS under the existing investment advisory agreement and other arrangements with the Trust.
In connection with their contract review meetings, the Trustees received and relied upon materials which included, among other items: (i) information provided by Lipper Inc. on the investment performance of the Fund for various time periods ended December 31, 2007, compared to the investment performance of a group of funds with substantially similar investment classifications/objectives (the “Lipper performance universe”), (ii) information provided by Lipper Inc. on the Fund’s advisory fees and other expenses compared to the advisory fees and other expenses of comparable funds identified by Lipper (the “Lipper expense group”), (iii) information provided by MFS on the advisory fees of comparable portfolios of its other clients, including institutional separate account and other clients, (iv) information as to whether expense waivers, reimbursements or fee “breakpoints” are observed for the Fund, (v) information regarding MFS’ financial results and financial condition, including MFS’ and certain of its affiliates’ estimated profitability from services performed for the Fund, (vi) MFS’ views regarding the outlook for the mutual fund industry and its strategic business plans, (vii) descriptions of various functions performed by MFS for the Trust, such as compliance monitoring and portfolio trading practices, and (viii) information regarding the overall organization of MFS, including information about MFS’ senior management and other personnel providing investment advisory, administrative and other services to the Fund. The comparative performance, fee and expense information prepared and provided by Lipper Inc. was not independently verified, and the independent Trustees did not independently verify any information provided to them by MFS.
The Trustees’ conclusion as to the continuation of the investment advisory agreement was based on comprehensive consideration of all information provided to the Trustees and not the result of any single factor. Some of the factors that figured particularly in the Trustees’ deliberations are described below for the Fund, while individual Trustees may have given different weight to various factors and evaluated the information presented as a whole differently than another Trustee. The Trustees recognized that the fee arrangements for the Fund reflect years of review and discussion between the independent Trustees and MFS, that certain aspects of such arrangements may receive greater scrutiny in some years than others, and that the Trustees’ conclusions may be based, in part, on their consideration of these same arrangements during the course of the year and in prior years.
Based on information provided by Lipper Inc., the Trustees compared the Fund’s total return investment performance to the performance of a peer group of funds over various time periods. The Trustees placed particular emphasis on the total return performance of the Fund’s Initial Class shares in comparison to the performance of funds in its Lipper performance universe over the one-, three- and five-year periods. The Trustees did not rely on performance results for more recent periods, including those shown elsewhere in this report.
The Trustees noted the performance of the Fund’s Initial Class shares was in the 2nd quintile relative to the other funds in the Lipper Classification Index for the one-year period (the 1st quintile being the best performers and the 5th quintile being the worst performers). The total return performance of the Fund was in the 3rd quintile for the three-year period and the five-year period ended December 31, 2007, relative to the Lipper performance universe. Based on the nature and quality of services provided by MFS, the Board of Trustees concluded that the Fund’s performance was satisfactory.
In the course of their deliberations, the Trustees took into account information provided by MFS during contract review meetings, as well as during investment review meetings conducted with portfolio management personnel during the course of the year.
21
Board Review of Investment Advisory Agreement – continued
In assessing the reasonableness of the Fund’s advisory fee, the Trustees considered, among other information, the Fund’s advisory fee and the total expense ratio of the Fund’s Initial Class shares as a percentage of average daily net assets, compared to the advisory fee and total expense ratios of its peer group of funds based on information provided by Lipper Inc. The Trustees also considered the advisory fees charged by MFS to institutional accounts. In comparing these fees, the Trustees considered the generally broader scope of services provided by MFS to the Trust than those provided to institutional accounts. The Trustees also considered the higher demands placed on MFS’ investment personnel and trading infrastructure as a result of the daily cash in-flows and out-flows of the Fund, and the impact on MFS and related expenses due to the more extensive regulatory regime to which the Fund is subject, compared to institutional accounts.
In considering the fees, the Trustees noted from the Lipper data that the Fund’s effective advisory fee rate and total expense ratio were each above the median of such fees and expenses of funds in the Lipper expense group. The Trustees further concluded that the existing breakpoints were sufficient to allow the Fund to benefit from economies of scale as its assets grow. The Trustees concluded that the fees were reasonable in light of the nature and quality of services provided.
The Trustees also considered information prepared by MFS relating to its costs and profits with respect to the Fund and other investment companies and accounts advised by MFS, as well as MFS’ methodologies used to determine and allocate its costs to the Fund and other accounts and products for purposes of estimating profitability.
After reviewing these and other factors described below, the Trustees concluded that the advisory fees charged to the Fund represent reasonable compensation in light of the nature and quality of the services being provided by MFS.
In addition, the Trustees considered MFS’ resources and related efforts to continue to retain, attract and motivate capable personnel to serve the Fund. The Trustees also considered the financial resources of MFS and its parent, Sun Life Financial Inc. The Trustees further considered any advantages and possible disadvantages of having an adviser which also serves other investment companies as well as institutional accounts.
The Trustees also considered the nature, quality, cost, and extent of administrative, transfer agency, and distribution services provided to the Fund by MFS and its affiliates under agreements and plans other than the investment advisory agreement, including the 12b-1 fees the Fund pays to MFS Fund Distributors, Inc., an affiliate of MFS. The Trustees also considered the nature, extent and quality of certain other services MFS performs or arranges on the Fund’s behalf, which may include securities lending programs, directed expense payment programs, class action recovery programs, and MFS’ interaction with third-party service providers, principally custodians and sub-custodians. The Trustees concluded that the various non-advisory services provided by MFS and its affiliates on behalf of the Fund were satisfactory. The Trustees also considered the benefits to MFS from the use of the Fund’s portfolio brokerage commissions to pay for research and other similar services and various other factors. Additionally, the Trustees considered so-called “fall-out benefits” to MFS such as reputational value derived from serving as investment manager to the Trust, and determined that any such benefits derived by MFS were reasonable and fair.
Based on their evaluation of factors that they deemed to be material, including those factors described above, the Board of Trustees, including a majority of the independent Trustees, concluded that the investment advisory agreement should be continued for an additional one-year period, commencing September 1, 2008.
A discussion regarding the Board’s most recent review and renewal of the fund’s Investment Advisory Agreement with MFS is available by clicking on the fund’s name under “Variable Insurance Portfolios-VIT II” in the “Products & Performance” section on the MFS Web site (mfs.com).
22
PROXY VOTING POLICIES AND INFORMATION
A general description of the MFS funds’ proxy voting policies and procedures is available without charge, upon request, by calling 1-800-225-2606, by visiting the Proxy Voting section of mfs.com or by visiting the SEC’s Web site at http://www.sec.gov.
Information regarding how the fund voted proxies relating to portfolio securities during the most recent twelve-month period ended June 30 is available without charge by visiting the Proxy Voting section of mfs.com or by visiting the SEC’s Web site at http://www.sec.gov.
QUARTERLY PORTFOLIO DISCLOSURE
The fund will file a complete schedule of portfolio holdings with the Securities and Exchange Commission (the Commission) for the first and third quarters of each fiscal year on Form N-Q. The fund’s Form N-Q may be reviewed and copied at the:
Public Reference Room
Securities and Exchange Commission
100 F Street, NE, Room 1580
Washington, D.C. 20549
Information on the operation of the Public Reference Room may be obtained by calling the Commission at 1-800-SEC-0330. The fund’s Form N-Q is available on the EDGAR database on the Commission’s Internet Web site at http://www.sec.gov, and copies of this information may be obtained, upon payment of a duplicating fee, by electronic request at the following e-mail address: publicinfo@sec.gov or by writing the Public Reference Section at the above address.
FEDERAL TAX INFORMATION (unaudited)
The following information is provided pursuant to provisions of the Internal Revenue Code.
For corporate shareholders, 36.55% of the ordinary income dividends paid during the fiscal year qualify for the corporate dividends received deduction.
Income derived from foreign sources was $1,370,566. The fund intends to pass through foreign tax credits of $82,986 for the fiscal year.
23
MFS® PRIVACY NOTICE
Privacy is a concern for every investor today. At MFS Investment Management® and the MFS funds, we take this concern very seriously. We want you to understand our policies about the investment products and services that we offer, and how we protect the nonpublic personal information of investors who have a direct relationship with us and our wholly owned subsidiaries.
Throughout our business relationship, you provide us with personal information. We maintain information and records about you, your investments, and the services you use. Examples of the nonpublic personal information we maintain include
| | Ÿ | | data from investment applications and other forms |
| | Ÿ | | share balances and transactional history with us, our affiliates, or others |
| | Ÿ | | facts from a consumer reporting agency |
We do not disclose any nonpublic personal information about our customers or former customers to anyone, except as permitted by law. We may share nonpublic personal information with third parties or certain of our affiliates in connection with servicing your account or processing your transactions. We may share information with companies or financial institutions that perform marketing services on our behalf or with other financial institutions with which we have joint marketing arrangements, subject to any legal requirements.
Authorization to access your nonpublic personal information is limited to appropriate personnel who provide products, services, or information to you. We maintain physical, electronic, and procedural safeguards to help protect the personal information we collect about you.
If you have any questions about the MFS privacy policy, please call 1-800-225-2606 any business day between 8 a.m. and 8 p.m. Eastern time.
Note: If you own MFS products or receive MFS services in the name of a third party such as a bank or broker-dealer, their privacy policy may apply to you instead of ours.
24


MFS® RESEARCH INTERNATIONAL PORTFOLIO
The report is prepared for the general information of contract owners. It is authorized for distribution to prospective investors only when preceded or accompanied by a current prospectus.
NOT FDIC INSURED Ÿ MAY LOSE VALUE Ÿ NO BANK GUARANTEE Ÿ NOT A DEPOSIT Ÿ NOT INSURED BY ANY FEDERAL GOVERNMENT AGENCY OR NCUA/NCUSIF
LETTER FROM THE CEO

Dear Contract Owners:
The market downturns and economic setbacks of late probably rank among the worst financial declines most of us have experienced. Inevitably, people may be questioning their commitment to investing. Still, it is important to remember that downturns are an inescapable part of the business cycle. Such troughs have been seen before, and if we can use history as a guide, market recoveries typically have followed.
Recent events have clearly shown us the value of certain types of investments. In this environment, two of the hallmarks of mutual funds — transparency and liquidity — have become critically important. Unlike some other types of investments, the operations of mutual funds are relatively transparent to their shareholders. With their daily redemption feature, mutual funds also generally provide easy, convenient access to one’s money. Through these recent market upheavals, this level of liquidity enhanced the ability of mutual fund investors to respond and modify their investments as they and their advisors saw fit — a flexibility that those in less liquid investments simply did not have at their disposal.
At MFS® we take particular pride in how well mutual funds can serve investors because we invented the mutual fund in the United States. Established in 1924, Massachusetts Investors Trust was the nation’s first fund. Recent market events only reinforce what we have learned through 85 years — that mutual funds provide unique features that are important to investors in any type of market climate.
Respectfully,

Robert J. Manning
Chief Executive Officer and Chief Investment Officer
MFS Investment Management®
February 17, 2009
The opinions expressed in this letter are subject to change, may not be relied upon for investment advice, and no forecasts can be guaranteed.
Before investing, consider the fund’s investment objectives, risks, charges, and expenses. For a prospectus containing this and other information, contact your investment professional or view online. Read it carefully.
MFS Fund Distributors, Inc., 500 Boylston Street, Boston, MA 02116
1
PORTFOLIO COMPOSITION
Portfolio structure

| | |
| Top ten holdings | | |
| Roche Holding AG | | 3.2% |
| Nestle S.A. | | 3.0% |
| E.ON AG | | 2.6% |
| TOTAL S.A. | | 2.4% |
| Royal Dutch Shell PLC, “A” | | 2.3% |
| Vodafone Group PLC | | 2.2% |
| Intesa Sanpaolo S.p.A. | | 2.1% |
| Akzo Nobel N.V. | | 2.0% |
| AXA | | 1.9% |
| Siemens AG | | 1.8% |
| | |
| Equity sectors | | |
| Financial Services | | 21.7% |
| Utilities & Communications | | 12.0% |
| Energy | | 10.9% |
| Health Care | | 9.7% |
| Consumer Staples | | 8.1% |
| Basic Materials | | 8.0% |
| Technology | | 7.1% |
| Retailing | | 5.1% |
| Industrial Goods & Services | | 4.4% |
| Transportation | | 3.4% |
| Special Products & Services | | 3.1% |
| Autos & Housing | | 3.1% |
| Leisure | | 2.4% |
| |
| Country weightings | | |
| Japan | | 18.0% |
| France | | 11.9% |
| United Kingdom | | 11.3% |
| Germany | | 10.8% |
| Switzerland | | 10.4% |
| Italy | | 5.7% |
| Netherlands | | 4.3% |
| Spain | | 3.0% |
| China | | 2.9% |
| Other Countries | | 21.7% |
Percentages are based on net assets as of 12/31/08.
The portfolio is actively managed and current holdings may be different.
2
MANAGEMENT REVIEW
Summary of Results
For the twelve months ended December 31, 2008, Initial Class shares of the MFS Research International Portfolio (the “fund”) provided a total return of –42.49%, while Service Class shares of the fund provided a total return of –42.60%. These compare with a return of –43.06% for the fund’s benchmark, the MSCI EAFE Index. The fund’s other benchmark, the MSCI All Country World
(ex-US) Index, generated a return of –45.24% over the reporting period.
Market Environment
The U.S. economy and financial markets experienced significant deterioration and extraordinary volatility over the reporting period. U.S. economic growth slowed significantly, despite the short-term bounce from the second quarter fiscal stimulus. Strong domestic headwinds included accelerated deterioration in the housing market, anemic corporate investment, a rapidly declining job market, and a much tighter credit environment. During the period, a seemingly continuous series of tumultuous financial events hammered markets, including: the distressed sale of failing Bear Stearns to JPMorgan, the conservatorship of Government Sponsored Enterprises (GSEs) Fannie Mae and Freddie Mac, the bankruptcy of investment bank Lehman Brothers, the Federal Reserve Bank’s complex intervention of insurance company American International Group (AIG), the nationalization of several large European banks, the failure of Washington Mutual, and the distressed sale of Wachovia. As a result of this barrage of turbulent news, global equity markets pushed significantly lower and credit markets witnessed the worst dislocation since the beginning of the credit crisis. Though conditions improved towards the end of the period, the state of financial and macroeconomic dislocation remained severe.
While reasonably resilient during the first half of the period, the global economy and financial system increasingly experienced considerable negative spillovers from the U.S. slowdown. Not only did Europe and Japan show obvious signs of economic softening, the more powerful engine of global growth – emerging markets – also displayed weakening dynamics.
During the reporting period, the U.S. Federal Reserve Board cut interest rates aggressively and introduced a multitude of new lending facilities to alleviate ever-tightening credit markets, while the U.S. federal government moved quickly to design and implement a meaningful fiscal stimulus package. Although several other global central banks also cut rates, the dilemma of rising energy and food prices heightened concerns among central bankers that inflationary expectations might become unhinged despite weaker growth. Only later in the reporting period did slowing global growth result in a very precipitous decline in commodity prices, which significantly eased inflation and inflationary expectations. As inflationary concerns diminished in the face of global deleveraging, and equity and credit markets deteriorated more sharply, a coordinated rate cut marked the beginning of much more aggressive easing by the major global central banks.
Contributors to Performance
Stock selection in the basic materials sector was a contributor to performance relative to the MSCI EAFE Index. Not owning mining operator Rio Tinto (United Kingdom) for most of the fourth quarter bolstered relative results as the company’s shares experienced significant decline during that period.
Although stock selection in the industrial goods and services sector also boosted relative performance, no individual stocks within this sector were among the fund’s top contributors for the reporting period.
Elsewhere, pharmaceutical company Roche Holding (Switzerland), parcel delivery service company Yamato Holdings (Japan), railway service operator East Japan Railway, and biopharmaceutical company Actelion (Switzerland) aided performance relative to the benchmark. Shares of Actelion delivered positive returns as the company’s revenue rose, in part, due to the robust sales growth of its pulmonary arterial hypertension drug Tracleer. The fund’s positioning in pharmaceutical company Astellas Pharma(g) (Japan), fashion distributor Industria de Diseno Textil (Spain), and telecommunications company KDDI Corp. (Japan) had a positive impact on relative performance. The fund held these securities for part of the reporting period, during which these stocks outperformed the benchmark. The fund also benefited from selling off banking firm Royal Bank of Scotland(g) prior to the stock’s precipitous decline.
During the reporting period, currency exposure contributed to the fund’s relative performance. All of MFS’ investment decisions are driven by the fundamentals of each individual opportunity and, as such, it is common for our funds to have different currency exposure than the benchmark.
The fund’s cash position also helped. The fund holds cash to buy new holdings and to provide liquidity. In a period when equity markets declined, as measured by the fund’s benchmark, holding cash helped performance versus the benchmark, which has no cash position.
Detractors from Performance
Stock selection in the financial services sector was a primary detractor from relative performance during the reporting period. In this sector, banking and financial services firms, Anglo Irish Bank (g), Barclays (United Kingdom), Bank of Cyprus (aa), and BNP Paribas (France), were among the top relative detractors as these companies underperformed the benchmark. Shares of
3
Management Review – continued
France’s largest bank, BNP Paribas, declined as the company lowered its earnings estimates because of losses in equity and fixed income derivatives. Our positions in banking firms, Erste Group Bank(g) (Germany), Intesa Sanpaolo (Italy), and BOC Hong Kong Holdings(g), held back relative performance as all three experienced declines during the periods in which the fund held them.
Although a combination of an underweighted position and stock selection in the utilities and communications sector hampered relative performance, no individual stocks within this sector were among the fund’s top detractors.
Holdings of information technology services provider Satyam Computer Services (aa)(g) (India) had a negative impact on relative results. Not owning automobile manufacturer Volkswagen (Germany) and integrated oil company BP PLC (United Kingdom) hurt relative performance as both companies outperformed the benchmark.
Respectfully,
| | |
| Jose Luis Garcia | | Thomas Melendez |
| Portfolio Manager | | Portfolio Manager |
| (aa) | | Security is not a benchmark constituent. |
| (g) | | Security was not held in the portfolio at period end. |
The views expressed in this report are those of the portfolio managers only through the end of the period of the report as stated on the cover and do not necessarily reflect the views of MFS or any other person in the MFS organization. These views are subject to change at any time based on market or other conditions, and MFS disclaims any responsibility to update such views. These views may not be relied upon as investment advice or an indication of trading intent on behalf of any MFS portfolio. References to specific securities are not recommendations of such securities, and may not be representative of any MFS portfolio’s current or future investments.
4
PERFORMANCE SUMMARY THROUGH 12/31/08
The following chart illustrates the historical performance of the fund in comparison to its benchmark(s). Benchmark comparisons are unmanaged; do not reflect any fees or expenses; and cannot be invested in directly. The performance of other share classes will be greater than or less than that of the class depicted below. (See Notes to Performance Summary.)
Performance data shown represents past performance and is no guarantee of future results. Investment return and principal value fluctuate so your units, when sold, may be worth more or less than the original cost; current performance may be lower or higher than quoted. The performance shown does not reflect the deduction of taxes, if any, that a contract holder would pay on fund distributions or the redemption of contract units. The returns for the fund shown also do not reflect the deduction of expenses associated with variable products, such as mortality and expense risk charges, separate account charges, and sales charges imposed by the insurance company separate accounts. Such expenses would reduce the overall returns shown.
Growth of a hypothetical $10,000 investment
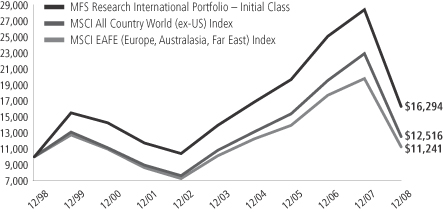
Total rates of return through 12/31/08
Average Annual Total Returns
| | | | | | | | | | | | |
| | | Share class | | Class inception date | | 1-yr | | 5-yr | | 10-yr | | |
| | | Initial Class | | 5/06/98 | | (42.49)% | | 3.22% | | 5.00% | | |
| | | Service Class | | 8/24/01 | | (42.60)% | | 2.98% | | 4.81% | | |
Comparative Benchmarks
| | | | | | | | | | | | |
| | | MSCI EAFE (Europe, Australasia, Far East) Index (f) | | (43.06)% | | 2.10% | | 1.18% | | |
| | | MSCI All Country World (ex-US) Index (f) | | (45.24)% | | 3.00% | | 2.27% | | |
| (f) | Source: FactSet Research Systems, Inc. |
Benchmark Definitions
MSCI EAFE (Europe, Australasia, Far East) Index – a market capitalization-weighted index that is designed to measure equity market performance in the developed markets, excluding the U.S. and Canada.
MSCI All Country World (ex-US) Index – a market capitalization-weighted index that is designed to measure equity market performance in the developed and emerging markets, excluding the U.S.
It is not possible to invest directly in an index.
Notes to Performance Summary
Performance for the Service Class includes the performance of the fund’s Initial Class for periods prior to their offering. Because Service Class expenses are higher than those of Initial Class, performance shown for Service Class is higher than it would have been had it been offered for the entire period. Performance has not been adjusted to take into account differences in class specific operating expenses (such as Rule 12b-1 fees). Please see the prospectus for additional information about performance and expenses.
Performance results reflect any applicable expense subsidies and waivers in effect during the periods shown. Without such subsidies and waivers the fund’s performance results would be less favorable. Please see the prospectus for complete details. All results are historical and assume the reinvestment of any dividends and capital gains distributions.
From time to time the fund may receive proceeds from litigation settlements, without which performance would be lower.
5
EXPENSE TABLE
Fund Expenses Borne by the Contract Holders During the Period,
July 1, 2008 through December 31, 2008
As a contract holder of the fund, you incur ongoing costs, including management fees; distribution (12b-1) fees; and other fund expenses. This example is intended to help you understand your ongoing costs (in dollars) of investing in the fund and to compare these costs with the ongoing costs of investing in other mutual funds.
The example is based on an investment of $1,000 invested at the beginning of the period and held for the entire period July 1, 2008 through December 31, 2008.
Actual Expenses
The first line for each share class in the following table provides information about actual account values and actual expenses. You may use the information in this line, together with the amount you invested, to estimate the expenses that you paid over the period. Simply divide your account value by $1,000 (for example, an $8,600 account value divided by $1,000 = 8.6), then multiply the result by the number in the first line under the heading entitled “Expenses Paid During Period” to estimate the expenses you paid on your account during this period.
Hypothetical Example for Comparison Purposes
The second line for each share class in the following table provides information about hypothetical account values and hypothetical expenses based on the fund’s actual expense ratio and an assumed rate of return of 5% per year before expenses, which is not the fund’s actual return. The hypothetical account values and expenses may not be used to estimate the actual ending account balance or expenses you paid for the period. You may use this information to compare the ongoing costs of investing in the fund and other funds. To do so, compare this 5% hypothetical example with the 5% hypothetical examples that appear in the shareholder reports of the other funds.
Please note that the expenses shown in the table are meant to highlight the fund’s ongoing costs only and do not take into account the fees and expenses imposed under the variable contracts through which your investment in the fund is made. Therefore, the second line for each share class in the table is useful in comparing ongoing costs associated with an investment in vehicles (such as the fund) which fund benefits under variable annuity and variable life insurance contracts and to qualified pension and retirement plans only, and will not help you determine the relative total costs of investing in the fund through variable annuity and variable life insurance contracts. If the fees and expenses imposed under the variable contracts were included, your costs would have been higher.
| | | | | | | | | | |
| Share Class | | | | Annualized
Expense Ratio | | Beginning
Account Value
7/01/08 | | Ending
Account Value
12/31/08 | | Expenses Paid
During Period (p)
7/01/08-12/31/08 |
| Initial Class | | Actual | | 1.11% | | $1,000.00 | | $633.93 | | $4.56 |
| | Hypothetical (h) | | 1.11% | | $1,000.00 | | $1,019.56 | | $5.63 |
| Service Class | | Actual | | 1.35% | | $1,000.00 | | $633.55 | | $5.54 |
| | Hypothetical (h) | | 1.35% | | $1,000.00 | | $1,018.35 | | $6.85 |
| (h) | 5% class return per year before expenses. |
| (p) | Expenses paid is equal to each class’ annualized expense ratio, as shown above, multiplied by the average account value over the period, multiplied by the number of days in the period, divided by the number of days in the year. |
6
PORTFOLIO OF INVESTMENTS – 12/31/08
The Portfolio of Investments is a complete list of all securities owned by your fund. It is categorized by broad-based asset classes.
| | | | | |
| Issuer | | Shares/Par | | Value ($) |
| | | | | |
| COMMON STOCKS – 99.0% | | | | | |
| Airlines – 0.1% | | | | | |
| Grupo Aeroportuario del Pacifico S.A. de C.V., ADR | | 10,140 | | $ | 233,423 |
| | | | | |
| Alcoholic Beverages – 0.8% | | | | | |
| Heineken N.V. | | 40,380 | | $ | 1,240,618 |
| | | | | |
| Apparel Manufacturers – 2.1% | | | | | |
| Li & Fung Ltd. | | 516,000 | | $ | 884,168 |
| LVMH Moet Hennessy Louis Vuitton S.A. | | 35,960 | | | 2,416,013 |
| | | | | |
| | | | $ | 3,300,181 |
| | | | | |
| Automotive – 0.9% | | | | | |
| Bridgestone Corp. | | 53,500 | | $ | 803,507 |
| Compagnie Generale des Etablissements Michelin | | 12,220 | | | 640,746 |
| | | | | |
| | | | $ | 1,444,253 |
| | | | | |
| Biotechnology – 0.8% | | | | | |
| Actelion Ltd. (a) | | 22,807 | | $ | 1,284,520 |
| | | | | |
| Broadcasting – 2.4% | | | | | |
| Grupo Televisa S.A., ADR | | 91,920 | | $ | 1,373,285 |
| WPP Group PLC | | 421,412 | | | 2,456,513 |
| | | | | |
| | | | $ | 3,829,798 |
| | | | | |
| Brokerage & Asset Managers – 1.8% | | | | | |
| Daiwa Securities Group, Inc. | | 367,000 | | $ | 2,187,124 |
| Deutsche Boerse AG | | 10,190 | | | 742,161 |
| | | | | |
| | | | $ | 2,929,285 |
| | | | | |
| Business Services – 0.7% | | | | | |
| Mitsubishi Corp. | | 83,900 | | $ | 1,177,825 |
| | | | | |
| Computer Software – 0.9% | | | | | |
| SAP AG | | 41,350 | | $ | 1,481,948 |
| | | | | |
| Computer Software – Systems – 1.1% | | | | | |
| Acer, Inc. | | 809,000 | | $ | 1,060,703 |
| Cap Gemini S.A. | | 18,620 | | | 717,677 |
| | | | | |
| | | | $ | 1,778,380 |
| | | | | |
| Conglomerates – 2.4% | | | | | |
| Keppel Corp. Ltd. | | 277,000 | | $ | 839,549 |
| Siemens AG | | 39,030 | | | 2,923,365 |
| | | | | |
| | | | $ | 3,762,914 |
| | | | | |
| Construction – 2.2% | | | | | |
| Corporacion Moctezuma S.A. de C.V. | | 72,700 | | $ | 112,868 |
| CRH PLC | | 51,170 | | | 1,291,411 |
| Duratex S.A., IPS | | 36,900 | | | 233,673 |
| Geberit AG | | 14,280 | | | 1,538,402 |
| Urbi Desarrollos Urbanos S.A. de C.V. (a) | | 200,450 | | | 275,160 |
| | | | | |
| | | | $ | 3,451,514 |
| | | | | |
| Consumer Goods & Services – 1.4% | | | | | |
| Beiersdorf AG | | 14,540 | | $ | 864,995 |
| Hengan International Group Co. Ltd. | | 218,000 | | | 700,395 |
| Kimberly-Clark de Mexico S.A. de C.V., “A” | | 200,940 | | | 660,925 |
| | | | | |
| | | | $ | 2,226,315 |
| | | | | |
| | | | | |
| Issuer | | Shares/Par | | Value ($) |
| | | | | |
| COMMON STOCKS – continued | | | |
| Containers – 1.5% | | | | | |
| Brambles Ltd. | | 445,980 | | $ | 2,317,375 |
| | | | | |
| Electrical Equipment – 1.5% | | | | | |
| LS Industrial Systems Co. Ltd. (a) | | 24,220 | | $ | 967,118 |
| Schneider Electric S.A. | | 18,804 | | | 1,404,590 |
| | | | | |
| | | | $ | 2,371,708 |
| | | | | |
| Electronics – 4.5% | | | | | |
| ASML Holding N.V. | | 55,294 | | $ | 986,727 |
| Konica Minolta Holdings, Inc. | | 152,000 | | | 1,177,814 |
| Ricoh Co. Ltd. | | 160,000 | | | 2,037,660 |
| Samsung Electronics Co. Ltd. | | 2,420 | | | 878,745 |
| Taiwan Semiconductor Manufacturing Co. Ltd. | | 924,000 | | | 1,264,707 |
| Tokyo Electron Ltd. | | 23,800 | | | 835,815 |
| | | | | |
| | | | $ | 7,181,468 |
| | | | | |
| Energy – Independent – 1.5% | | | | | |
| CNOOC Ltd. | | 585,000 | | $ | 555,920 |
| INPEX Corp. | | 159 | | | 1,256,188 |
| Tullow Oil PLC | | 60,417 | | | 578,154 |
| | | | | |
| | | | $ | 2,390,262 |
| | | | | |
| Energy – Integrated – 9.1% | | | | | |
| Chevron Corp. | | 9,780 | | $ | 723,427 |
| Eni S.p.A. | | 115,090 | | | 2,727,159 |
| Marathon Oil Corp. | | 21,920 | | | 599,731 |
| OAO Gazprom, ADR | | 31,740 | | | 452,295 |
| Petroleo Brasileiro S.A., ADR | | 31,670 | | | 775,598 |
| Royal Dutch Shell PLC, “A” | | 142,130 | | | 3,715,324 |
| Statoil A.S.A. (l) | | 99,100 | | | 1,632,204 |
| TOTAL S.A. | | 71,540 | | | 3,900,194 |
| | | | | |
| | | | $ | 14,525,932 |
| | | | | |
| Engineering – Construction – 0.4% | | | | | |
| JGC Corp. | | 45,000 | | $ | 677,041 |
| | | | | |
| Food & Beverages – 5.0% | | | | | |
| Groupe Danone | | 38,141 | | $ | 2,301,999 |
| Nestle S.A. | | 123,639 | | | 4,872,931 |
| Unilever N.V. | | 32,780 | | | 794,263 |
| | | | | |
| | | | $ | 7,969,193 |
| | | | | |
| Food & Drug Stores – 0.5% | | | | | |
| Lawson, Inc. | | 13,000 | | $ | 749,737 |
| | | | | |
| Insurance – 2.6% | | | | | |
| AXA (l) | | 134,050 | | $ | 2,988,604 |
| QBE Insurance Group Ltd. | | 66,030 | | | 1,200,266 |
| | | | | |
| | | | $ | 4,188,870 |
| | | | | |
| Internet – 0.0% | | | | | |
| Universo Online S.A., IPS | | 20,400 | | $ | 64,672 |
| | | | | |
7
Portfolio of Investments – continued
| | | | | |
| Issuer | | Shares/Par | | Value ($) |
| | | | | |
| COMMON STOCKS – continued | | | |
| Machinery & Tools – 2.5% | | | | | |
| Assa Abloy AB, “B” (l) | | 123,240 | | $ | 1,398,339 |
| Bucyrus International, Inc. | | 53,590 | | | 992,487 |
| Glory Ltd. | | 83,700 | | | 1,637,064 |
| | | | | |
| | | | $ | 4,027,890 |
| | | | | |
| Major Banks – 9.3% | | | | | |
| Barclays PLC | | 570,637 | | $ | 1,286,457 |
| BNP Paribas | | 53,669 | | | 2,256,727 |
| Hang Seng Bank Ltd. | | 54,000 | | | 713,208 |
| Intesa Sanpaolo S.p.A. | | 915,745 | | | 3,298,451 |
| Overseas-Chinese Banking Corp. Ltd. | | 227,000 | | | 790,897 |
| Standard Bank Group Ltd. | | 116,675 | | | 1,057,068 |
| Standard Chartered PLC | | 137,030 | | | 1,751,697 |
| Sumitomo Mitsui Financial Group, Inc. | | 474 | | | 2,053,255 |
| Unibanco-Uniao de Bancos Brasileiros S.A., ADR | | 25,700 | | | 1,660,734 |
| | | | | |
| | | | $ | 14,868,494 |
| | | | | |
| Metals & Mining – 2.4% | | | | | |
| BHP Billiton PLC | | 148,050 | | $ | 2,788,800 |
| Rio Tinto Ltd. | | 46,020 | | | 997,107 |
| | | | | |
| | | | $ | 3,785,907 |
| | | | | |
| Natural Gas – Distribution – 1.8% | | | | | |
| Gaz de France | | 48,462 | | $ | 2,400,178 |
| Tokyo Gas Co. Ltd. | | 103,000 | | | 521,950 |
| | | | | |
| | | | $ | 2,922,128 |
| | | | | |
| Network & Telecom – 0.6% | | | | | |
| Nokia Oyj | | 61,160 | | $ | 948,159 |
| | | | | |
| Oil Services – 0.3% | | | | | |
| Saipem S.p.A. | | 32,690 | | $ | 548,909 |
| | | | | |
| Other Banks & Diversified Financials – 8.0% | | | |
| Aeon Credit Service Co. Ltd. | | 125,900 | | $ | 1,332,034 |
| Bank of Cyprus Public Co. Ltd. | | 237,902 | | | 891,071 |
| Chiba Bank Ltd. | | 185,000 | | | 1,155,898 |
| China Construction Bank | | 4,661,000 | | | 2,579,340 |
| CSU Cardsystem S.A. (a) | | 76,120 | | | 75,076 |
| HDFC Bank Ltd., ADR | | 12,700 | | | 906,526 |
| Shizuoka Bank Ltd. | | 98,000 | | | 1,135,198 |
| UBS AG (a) | | 96,885 | | | 1,405,200 |
| Unione di Banche Italiane ScpA | | 171,531 | | | 2,482,547 |
| United Overseas Bank Ltd. | | 92,000 | | | 830,490 |
| | | | | |
| | | | $ | 12,793,380 |
| | | | | |
| Pharmaceuticals – 8.9% | | | | | |
| Bayer AG | | 34,410 | | $ | 2,021,407 |
| Daiichi Sankyo Co. Ltd. | | 96,200 | | | 2,286,637 |
| Merck KGaA | | 26,060 | | | 2,369,311 |
| Novartis AG | | 48,920 | | | 2,451,112 |
| Roche Holding AG | | 33,150 | | | 5,102,902 |
| | | | | |
| | | | $ | 14,231,369 |
| | | | | |
| Precious Metals & Minerals – 0.3% | | | | | |
| Paladin Resources Ltd. (a)(l) | | 259,774 | | $ | 455,824 |
| | | | | |
| Railroad & Shipping – 1.4% | | | | | |
| East Japan Railway Co. | | 288 | | $ | 2,249,229 |
| | | | | |
| | | | | | |
| Issuer | | Shares/Par | | Value ($) |
| | | | | | |
| COMMON STOCKS – continued | | | |
| Specialty Chemicals – 3.8% | | | | | | |
| Akzo Nobel N.V. | | | 78,670 | | $ | 3,244,141 |
| Linde AG | | | 26,680 | | | 2,257,754 |
| Symrise AG | | | 34,929 | | | 493,330 |
| | | | | | |
| | | | | $ | 5,995,225 |
| | | | | | |
| Specialty Stores – 2.5% | | | | | | |
| Esprit Holdings Ltd. | | | 132,800 | | $ | 756,964 |
| Industria de Diseno Textil S.A. | | | 49,850 | | | 2,203,436 |
| Kingfisher PLC | | | 408,140 | | | 798,211 |
| NEXT PLC | | | 14,430 | | | 225,918 |
| | | | | | |
| | | | | $ | 3,984,529 |
| | | | | | |
| Telecommunications – Wireless – 4.5% | | | |
| America Movil S.A.B. de C.V., “L”, ADR | | | 46,910 | | $ | 1,453,741 |
| KDDI Corp. | | | 226 | | | 1,609,660 |
| Rogers Communications, Inc., “B” | | | 24,610 | | | 729,429 |
| Vodafone Group PLC | | | 1,712,540 | | | 3,447,538 |
| | | | | | |
| | | | | $ | 7,240,368 |
| | | | | | |
| Telephone Services – 2.5% | | | | | | |
| BCE, Inc. | | | 27,560 | | $ | 561,023 |
| China Unicom Ltd. | | | 642,000 | | | 780,991 |
| Telefonica S.A. | | | 116,510 | | | 2,611,626 |
| | | | | | |
| | | | | $ | 3,953,640 |
| | | | | | |
| Tobacco – 0.9% | | | | | | |
| Japan Tobacco, Inc. | | | 438 | | $ | 1,450,395 |
| | | | | | |
| Trucking – 1.9% | | | | | | |
| TNT N.V. | | | 29,960 | | $ | 573,047 |
| Yamato Holdings Co. Ltd. | | | 193,000 | | | 2,516,584 |
| | | | | | |
| | | | | $ | 3,089,631 |
| | | | | | |
| Utilities – Electric Power – 3.2% | | | | | | |
| E.ON AG | | | 103,144 | | $ | 4,170,850 |
| NTPC Ltd. | | | 234,908 | | | 875,154 |
| | | | | | |
| | | | | $ | 5,046,004 |
| | | | | | |
Total Common Stocks (Identified Cost, $200,086,707) | | | | | $ | 158,168,313 |
| | | | | | |
| |
| REPURCHASE AGREEMENTS – 1.1% | | | |
| Goldman Sachs, 0.01%, dated 12/31/08, due 1/02/09, total to be received $1,749,001 (secured by U.S. Treasury and Federal Agency obligations and Mortgage Backed securities in a jointly traded account) | | $ | 1,749,000 | | $ | 1,749,000 |
| Morgan Stanley, 0.02%, dated 12/31/08, due 1/02/09, total to be received $7,000.01 (secured by U.S. Treasury and Federal Agency obligations and Mortgage Backed securities in a jointly traded account) | | | 7,000 | | | 7,000 |
| | | | | | |
| Total Repurchase Agreements, at Cost | | | | | $ | 1,756,000 |
| | | | | | |
8
Portfolio of Investments – continued
| | | | | | |
| Issuer | | Shares/Par | | Value ($) | |
| | | | | | |
| |
| COLLATERAL FOR SECURITIES LOANED – 0.4% | | | | |
Navigator Securities Lending Prime Portfolio,
at Cost and Net Asset Value | | 729,734 | | $ | 729,734 | |
| | | | | | |
Total Investments (Identified Cost, $202,572,441) | | | | $ | 160,654,047 | |
| | | | | | |
OTHER ASSETS, LESS LIABILITIES – (0.5)% | | | | | (852,570 | ) |
| | | | | | |
| Net Assets – 100.0% | | | | $ | 159,801,477 | |
| | | | | | |
| (a) | Non-income producing security. |
| (l) | All or a portion of this security is on loan. |
The following abbreviations are used in this report and are defined:
| ADR | | American Depository Receipt |
| IPS | | International Preference Stock |
See Notes to Financial Statements
9
FINANCIAL STATEMENTS | STATEMENT OF ASSETS AND LIABILITIES
This statement represents your fund’s balance sheet, which details the assets and liabilities comprising the total value of the fund.
| | | | | |
At 12/31/08 | | | | | |
Assets | | | | | |
Investments, at value, including $686,101 of securities on loan (identified cost, $202,572,441) | | $160,654,047 | | | |
Cash | | 10 | | | |
Foreign currency, at value (identified cost, $103,004) | | 103,062 | | | |
Receivable for investments sold | | 865,296 | | | |
Interest and dividends receivable | | 202,961 | | | |
Receivable from investment adviser | | 44,304 | | | |
Other assets | | 8,220 | | | |
Total assets | | | | | $161,877,900 |
Liabilities | | | | | |
Payable for investments purchased | | $963,588 | | | |
Payable for fund shares reacquired | | 166,626 | | | |
Collateral for securities loaned, at value | | 729,734 | | | |
Payable to affiliates | | | | | |
Management fee | | 7,757 | | | |
Distribution fees | | 1,536 | | | |
Administrative services fee | | 454 | | | |
Payable for trustees’ compensation | | 306 | | | |
Accrued expenses and other liabilities | | 206,422 | | | |
Total liabilities | | | | | $2,076,423 |
Net assets | | | | | $159,801,477 |
Net assets consist of | | | | | |
Paid-in capital | | $238,612,315 | | | |
Unrealized appreciation (depreciation) on investments and translation of assets and liabilities in foreign currencies | | (41,928,759 | ) | | |
Accumulated net realized gain (loss) on investments and foreign currency transactions | | (41,792,525 | ) | | |
Undistributed net investment income | | 4,910,446 | | | |
Net assets | | | | | $159,801,477 |
Shares of beneficial interest outstanding | | | | | 16,218,330 |
Initial Class shares | | | | | |
Net assets | | $45,835,099 | | | |
Shares outstanding | | 4,610,484 | | | |
Net asset value per share | | | | | $9.94 |
Service Class shares | | | | | |
Net assets | | $113,966,378 | | | |
Shares outstanding | | 11,607,846 | | | |
Net asset value per share | | | | | $9.82 |
See Notes to Financial Statements
10
FINANCIAL STATEMENTS | STATEMENT OF OPERATIONS
This statement describes how much your fund earned in investment income and accrued in expenses. It also describes any gains and/or losses generated by fund operations.
| | | | | | |
| Year ended 12/31/08 | | | | | | |
| Net investment income | | | | | | |
Income | | | | | | |
Dividends | | $8,743,587 | | | | |
Interest | | 364,703 | | | | |
Foreign taxes withheld | | (787,766 | ) | | | |
Total investment income | | | | | $8,320,524 | |
Expenses | | | | | | |
Management fee | | $2,123,790 | | | | |
Distribution fees | | 399,683 | | | | |
Administrative services fee | | 71,127 | | | | |
Trustees’ compensation | | 33,070 | | | | |
Custodian fee | | 360,361 | | | | |
Shareholder communications | | 75,092 | | | | |
Auditing fees | | 54,608 | | | | |
Legal fees | | 7,128 | | | | |
Miscellaneous | | 35,603 | | | | |
Total expenses | | | | | $3,160,462 | |
Fees paid indirectly | | (81 | ) | | | |
Reduction of expenses by investment adviser | | (151,075 | ) | | | |
Net expenses | | | | | $3,009,306 | |
Net investment income | | | | | $5,311,218 | |
Realized and unrealized gain (loss) on investments and foreign currency transactions | | | | | | |
Realized gain (loss) (identified cost basis) | | | | | | |
Investment transactions (net of $310,896 country tax) | | $(41,121,761 | ) | | | |
Foreign currency transactions | | (56,539 | ) | | | |
Net realized gain (loss) on investments and foreign currency transactions | | | | | $(41,178,300 | ) |
Change in unrealized appreciation (depreciation) | | | | | | |
Investments (net of $409,212 decrease in deferred country tax) | | $(87,251,123 | ) | | | |
Translation of assets and liabilities in foreign currencies | | (22,473 | ) | | | |
Net unrealized gain (loss) on investments and foreign currency translation | | | | | $(87,273,596 | ) |
Net realized and unrealized gain (loss) on investments and foreign currency | | | | | $(128,451,896 | ) |
Change in net assets from operations | | | | | $(123,140,678 | ) |
See Notes to Financial Statements
11
FINANCIAL STATEMENTS | STATEMENTS OF CHANGES IN NET ASSETS
These statements describe the increases and/or decreases in net assets resulting from operations, any distributions, and any shareholder transactions.
| | | | | | |
For years ended 12/31 | | 2008 | | | 2007 | |
Change in net assets | | | | | | |
From operations | | | | | | |
Net investment income | | $5,311,218 | | | $4,003,869 | |
Net realized gain (loss) on investments and foreign currency transactions | | (41,178,300 | ) | | 34,746,459 | |
Net unrealized gain (loss) on investments and foreign currency translation | | (87,273,596 | ) | | (2,095,000 | ) |
Change in net assets from operations | | $(123,140,678 | ) | | $36,655,328 | |
Distributions declared to shareholders | | | | | | |
From net investment income | | | | | | |
Initial Class | | $(1,388,519 | ) | | $(1,348,290 | ) |
Service Class | | (2,403,332 | ) | | (1,714,493 | ) |
From net realized gain on investments | | | | | | |
Initial Class | | (11,353,704 | ) | | (13,244,493 | ) |
Service Class | | (23,450,266 | ) | | (19,773,948 | ) |
Total distributions declared to shareholders | | $(38,595,821 | ) | | $(36,081,224 | ) |
Change in net assets from fund share transactions | | $10,804,008 | | | $34,657,431 | |
Total change in net assets | | $(150,932,491 | ) | | $35,231,535 | |
Net assets | | | | | | |
At beginning of period | | 310,733,968 | | | 275,502,433 | |
At end of period (including undistributed net investment income of $4,910,446 and
$3,768,641, respectively) | | $159,801,477 | | | $310,733,968 | |
See Notes to Financial Statements
12
FINANCIAL STATEMENTS | FINANCIAL HIGHLIGHTS
The financial highlights table is intended to help you understand the fund’s financial performance for the past 5 years. Certain information reflects financial results for a single fund share. The total returns in the table represent the rate by which an investor would have earned (or lost) on an investment in the fund share class (assuming reinvestment of all distributions) held for the entire period.
| | | | | | | | | | | | | | | |
| Initial Class | | Years ended 12/31 | |
| | | 2008 | | | 2007 | | | 2006 | | | 2005 | | | 2004 | |
Net asset value, beginning of period | | $19.92 | | | $19.94 | | | $16.74 | | | $14.48 | | | $12.01 | |
| Income (loss) from investment operations | | | | | | | | | | | | | | | |
Net investment income (d) | | $0.37 | | | $0.30 | | | $0.22 | | | $0.17 | | | $0.14 | |
Net realized and unrealized gain (loss) on investments
and foreign currency | | (7.71 | ) | | 2.21 | | | 4.30 | | | 2.21 | | | 2.39 | |
Total from investment operations | | $(7.34 | ) | | $2.51 | | | $4.52 | | | $2.38 | | | $2.53 | |
Less distributions declared to shareholders | | | | | | | | | | | | | | | |
From net investment income | | $(0.29 | ) | | $(0.23 | ) | | $(0.21 | ) | | $(0.12 | ) | | $(0.06 | ) |
From net realized gain on investments | | (2.35 | ) | | (2.30 | ) | | (1.11 | ) | | — | | | — | |
Total distributions declared to shareholders | | $(2.64 | ) | | $(2.53 | ) | | $(1.32 | ) | | $(0.12 | ) | | $(0.06 | ) |
Net asset value, end of period | | $9.94 | | | $19.92 | | | $19.94 | | | $16.74 | | | $14.48 | |
Total return (%) (k)(r)(s) | | (42.49 | ) | | 13.15 | | | 27.47 | | | 16.56 | | | 21.20 | |
Ratios (%) (to average net assets)
and Supplemental data: | | | | | | | | | | | | | | | |
Expenses before expense reductions (f) | | 1.17 | | | 1.06 | | | 1.13 | | | 1.12 | | | 1.10 | |
Expenses after expense reductions (f) | | 1.11 | | | 1.06 | | | 1.13 | | | 1.12 | | | 1.10 | |
Net investment income | | 2.43 | | | 1.51 | | | 1.23 | | | 1.11 | | | 1.11 | |
Portfolio turnover | | 82 | | | 68 | | | 80 | | | 83 | | | 102 | |
Net assets at end of period (000 Omitted) | | $45,835 | | | $108,167 | | | $119,534 | | | $95,752 | | | $86,526 | |
| |
| Service Class | | Years ended 12/31 | |
| | | 2008 | | | 2007 | | | 2006 | | | 2005 | | | 2004 | |
Net asset value, beginning of period | | $19.70 | | | $19.77 | | | $16.61 | | | $14.39 | | | $11.95 | |
| Income (loss) from investment operations | | | | | | | | | | | | | | | |
Net investment income (d) | | $0.32 | | | $0.23 | | | $0.16 | | | $0.12 | | | $0.10 | |
Net realized and unrealized gain (loss) on investments
and foreign currency | | (7.61 | ) | | 2.20 | | | 4.29 | | | 2.19 | | | 2.39 | |
Total from investment operations | | $(7.29 | ) | | $2.43 | | | $4.45 | | | $2.31 | | | $2.49 | |
Less distributions declared to shareholders | | | | | | | | | | | | | | | |
From net investment income | | $(0.24 | ) | | $(0.20 | ) | | $(0.18 | ) | | $(0.09 | ) | | $(0.05 | ) |
From net realized gain on investments | | (2.35 | ) | | (2.30 | ) | | (1.11 | ) | | — | | | — | |
Total distributions declared to shareholders | | $(2.59 | ) | | $(2.50 | ) | | $(1.29 | ) | | $(0.09 | ) | | $(0.05 | ) |
Net asset value, end of period | | $9.82 | | | $19.70 | | | $19.77 | | | $16.61 | | | $14.39 | |
Total return (%) (k)(r)(s) | | (42.60 | ) | | 12.81 | | | 27.25 | | | 16.19 | | | 20.96 | |
Ratios (%) (to average net assets)
and Supplemental data: | | | | | | | | | | | | | | | |
Expenses before expense reductions (f) | | 1.42 | | | 1.31 | | | 1.38 | | | 1.37 | | | 1.36 | |
Expenses after expense reductions (f) | | 1.36 | | | 1.31 | | | 1.38 | | | 1.37 | | | 1.36 | |
Net investment income | | 2.17 | | | 1.19 | | | 0.89 | | | 0.78 | | | 0.78 | |
Portfolio turnover | | 82 | | | 68 | | | 80 | | | 83 | | | 102 | |
Net assets at end of period (000 Omitted) | | $113,966 | | | $202,567 | | | $155,969 | | | $90,076 | | | $61,087 | |
| (d) | Per share data is based on average shares outstanding. |
| (f) | Ratios do not reflect reductions from fees paid indirectly, if applicable. |
| (k) | The total return does not reflect expenses that apply to separate accounts. Inclusion of these charges would reduce the total return figures for all periods shown. |
| (r) | Certain expenses have been reduced without which performance would have been lower. |
| (s) | From time to time the fund may receive proceeds from litigation settlements, without which performance would be lower. |
See Notes to Financial Statements
13
NOTES TO FINANCIAL STATEMENTS
| (1) | | Business and Organization |
MFS Research International Portfolio (the fund) is a series of MFS Variable Insurance Trust II (the trust). The trust is organized as a Massachusetts business trust and is registered under the Investment Company Act of 1940, as amended, as an open-end management investment company. The shares of the fund are sold to variable accounts established by insurance companies to fund benefits under variable contracts issued by such companies, and qualified retirement and pension plans.
| (2) | | Significant Accounting Policies |
General – The preparation of financial statements in conformity with U.S. generally accepted accounting principles requires management to make estimates and assumptions that affect the reported amounts of assets and liabilities, and disclosure of contingent assets and liabilities at the date of the financial statements and the reported amounts of revenues and expenses during the reporting period. Actual results could differ from those estimates. The fund can invest in foreign securities, including securities of emerging market issuers. Investments in foreign securities are vulnerable to the effects of changes in the relative values of the local currency and the U.S. dollar and to the effects of changes in each country’s legal, political, and economic environment. The markets of emerging markets countries are generally more volatile than the markets of developed countries with more mature economies. All of the risks of investing in foreign securities previously described are heightened when investing in emerging markets countries.
In March 2008, FASB Statement No. 161, Disclosures about Derivative Instruments and Hedging Activities (the “Standard”) was issued, and is effective for financial statements issued for fiscal years and interim periods beginning after November 15, 2008. This Standard provides enhanced disclosures about the fund’s use of and accounting for derivative instruments and the effect of derivative instruments on the fund’s results of operations and financial position. Management is evaluating the application of the Standard to the fund, and has not at this time determined the impact, if any, resulting from the adoption of this Standard on the fund’s financial statements.
FASB Staff Position (FSP) 133-1 was implemented during the period. FSP 133-1 amends FAS 133 to require sellers of credit derivatives to make disclosures that will enable financial statement users to assess the potential effects of those credit derivatives on an entity’s financial position, financial performance and cash flows. There was no impact from implementing FSP 133-1 as the fund did not hold any of these credit derivatives at period end.
Investment Valuations – Equity securities, including restricted equity securities, are generally valued at the last sale or official closing price as reported by a third party pricing service on the market or exchange on which they are primarily traded. For securities for which there were no sales reported that day, equity securities are generally valued at the last quoted daily bid quotation as reported by a third party pricing service on the market or exchange on which they are primarily traded. For securities held short for which there were no sales reported for the day, the position is generally valued at the last quoted daily ask quotation as reported by a third party pricing service on the market or exchange on which such securities are primarily traded. Short-term instruments with a maturity at issuance of 60 days or less may be valued at amortized cost, which approximates market value. Open-end investment companies are generally valued at net asset value per share. Securities and other assets generally valued on the basis of information from a third party pricing service may also be valued at a broker-dealer bid quotation. Values obtained from pricing services can utilize both dealer-supplied valuations and electronic data processing techniques, which take into account factors such as institutional-size trading in similar groups of securities, yield, quality, coupon rate, maturity, type of issue, trading characteristics, and other market data. The values of foreign securities and other assets and liabilities expressed in foreign currencies are converted to U.S. dollars using the mean of bid and asked prices for rates reported by a third party pricing service.
The Board of Trustees has delegated primary responsibility for determining or causing to be determined the value of the fund’s investments (including any fair valuation) to the adviser pursuant to valuation policies and procedures approved by the Board. If the adviser determines that reliable market quotations are not readily available, investments are valued at fair value as determined in good faith by the adviser in accordance with such procedures under the oversight of the Board of Trustees. Under the fund’s valuation policies and procedures, market quotations are not considered to be readily available for most types of debt instruments and floating rate loans and many types of derivatives. These investments are generally valued at fair value based on information from third party pricing services. In addition, investments may be valued at fair value if the adviser determines that an investment’s value has been materially affected by events occurring after the close of the exchange or market on which the investment is principally traded (such as foreign exchange or market) and prior to the determination of the fund’s net asset value, or after the halting of trading of a specific security where trading does not resume prior to the close of the exchange or market on which the security is principally traded. Events that occur on a frequent basis after foreign markets close (such as developments in foreign markets and significant movements in the U.S. markets) and prior to the determination of the fund’s net asset value may be deemed to have a material affect on the value of securities traded in foreign markets. Accordingly, the fund’s foreign equity securities may often be valued at fair value. The adviser may rely on third party
14
Notes to Financial Statements – continued
pricing services or other information (such as the correlation with price movements of similar securities in the same or other markets; the type, cost and investment characteristics of the security; the business and financial condition of the issuer; and trading and other market data) to assist in determining whether to fair value and at what value to fair value an investment. The value of an investment for purposes of calculating the fund’s net asset value can differ depending on the source and method used to determine value. When fair valuation is used, the value of investments used to determine the fund’s net asset value may differ from quoted or published prices for the same investments.
The fund adopted FASB Statement No. 157, Fair Value Measurements (the “Statement”). This Statement provides a single definition of fair value, a hierarchy for measuring fair value and expanded disclosures about fair value measurements.
Various inputs are used in determining the value of the fund’s assets or liabilities carried at market value. These inputs are categorized into three broad levels. Level 1 includes quoted prices in active markets for identical assets or liabilities. Level 2 includes other significant observable market-based inputs (including quoted prices for similar securities, interest rates, prepayment speed, and credit risk). Level 3 includes unobservable inputs, which may include the adviser’s own assumptions in determining the fair value of investments. Other financial instruments are derivative instruments not reflected in total investments, such as futures, forwards, swap contracts and written options. The following is a summary of the levels used as of December 31, 2008 in valuing the fund’s assets or liabilities carried at market value:
| | | | | | | | |
| | | Level 1 | | Level 2 | | Level 3 | | Total |
| Investments in Securities | | $16,729,798 | | $143,924,249 | | $— | | $160,654,047 |
| Other Financial Instruments | | $— | | $— | | $— | | $— |
Repurchase Agreements – The fund may enter into repurchase agreements with approved counterparties. Each repurchase agreement is recorded at cost. The fund requires that the securities collateral in a repurchase transaction be transferred to a custodian. The fund monitors, on a daily basis, the value of the collateral to ensure that its value, including accrued interest, is greater than amounts owed to the fund under each such repurchase agreement. The fund and other funds managed by Massachusetts Financial Services Company (MFS), may utilize a joint trading account for the purpose of entering into one or more repurchase agreements.
Foreign Currency Translation – Purchases and sales of foreign investments, income, and expenses are converted into U.S. dollars based upon currency exchange rates prevailing on the respective dates of such transactions or on the reporting date for foreign denominated receivables and payables. Gains and losses attributable to foreign currency exchange rates on sales of securities are recorded for financial statement purposes as net realized gains and losses on investments. Gains and losses attributable to foreign exchange rate movements on receivables, payables, income and expenses are recorded for financial statement purposes as foreign currency transaction gains and losses. That portion of both realized and unrealized gains and losses on investments that results from fluctuations in foreign currency exchange rates is not separately disclosed.
Security Loans – State Street Bank and Trust Company (“State Street”), as lending agent, may loan the securities of the fund to certain qualified institutions (the “Borrowers”) approved by the fund. The loans are collateralized by cash and/or U.S. Treasury and federal agency obligations in an amount typically at least equal to the market value of the securities loaned. State Street provides the fund with indemnification against Borrower default. The fund bears the risk of loss with respect to the investment of cash collateral. On loans collateralized by cash, the cash collateral is invested in a money market fund or short-term securities. A portion of the income generated upon investment of the collateral is remitted to the Borrowers, and the remainder is allocated between the fund and the lending agent. On loans collateralized by U.S. Treasury and/or federal agency obligations, a fee is received from the Borrower, and is allocated between the fund and the lending agent. Income from securities lending is included in interest income on the Statement of Operations. The dividend and interest income earned on the securities loaned is accounted for in the same manner as other dividend and interest income.
Indemnifications – Under the fund’s organizational documents, its officers and trustees may be indemnified against certain liabilities and expenses arising out of the performance of their duties to the fund. Additionally, in the normal course of business, the fund enters into agreements with service providers that may contain indemnification clauses. The fund’s maximum exposure under these agreements is unknown as this would involve future claims that may be made against the fund that have not yet occurred.
Investment Transactions and Income – Investment transactions are recorded on the trade date. Interest income is recorded on the accrual basis. All premium and discount is amortized or accreted for financial statement purposes in accordance with U.S. generally accepted accounting principles. Dividends received in cash are recorded on the ex-dividend date. Certain dividends from foreign securities will be recorded when the fund is informed of the dividend if such information is obtained subsequent to the ex-dividend date. Dividend and interest payments received in additional securities are recorded on the ex-dividend or ex-interest date in an amount equal to the value of the security on such date.
15
Notes to Financial Statements – continued
The fund may receive proceeds from litigation settlements. Any proceeds received from litigation involving portfolio holdings are reflected in the Statement of Operations in realized gain/loss if the security has been disposed of by the fund or in unrealized gain/loss if the security is still held by the fund. Any other proceeds from litigation not related to portfolio holdings are reflected as other income in the Statement of Operations.
Fees Paid Indirectly – The fund’s custody fee may be reduced according to an arrangement that measures the value of cash deposited with the custodian by the fund. This amount, for the year ended December 31, 2008, is shown as a reduction of total expenses on the Statement of Operations.
Tax Matters and Distributions – The fund intends to qualify as a regulated investment company, as defined under Subchapter M of the Internal Revenue Code, and to distribute all of its taxable income, including realized capital gains. As a result, no provision for federal income taxes is required. Each of the fund’s federal tax returns for the prior three fiscal years remain subject to examination by the Internal Revenue Service. Foreign taxes, if any, have been accrued by the fund in the accompanying financial statements.
Distributions to shareholders are recorded on the ex-dividend date. Income and capital gain distributions are determined in accordance with income tax regulations, which may differ from U.S. generally accepted accounting principles. Certain capital accounts in the financial statements are periodically adjusted for permanent differences in order to reflect their tax character. These adjustments have no impact on net assets or net asset value per share. Temporary differences which arise from recognizing certain items of income, expense, gain or loss in different periods for financial statement and tax purposes will reverse at some time in the future. Distributions in excess of net investment income or net realized gains are temporary overdistributions for financial statement purposes resulting from differences in the recognition or classification of income or distributions for financial statement and tax purposes.
Book/tax differences primarily relate to passive foreign investment companies, wash sale loss deferrals, and foreign taxes.
The tax character of distributions declared to shareholders for the last two fiscal years is as follows:
| | | | |
| | | 12/31/08 | | 12/31/07 |
| Ordinary income (including any short-term capital gains) | | $14,469,441 | | $16,507,896 |
| Long-term capital gain | | 24,126,380 | | 19,573,328 |
| | $38,595,821 | | $36,081,224 |
The federal tax cost and the tax basis components of distributable earnings were as follows:
| | | |
| As of 12/31/08 | | | |
| Cost of investments | | $210,904,277 | |
| Gross appreciation | | 6,526,886 | |
| Gross depreciation | | (56,777,116 | ) |
| Net unrealized appreciation (depreciation) | | $(50,250,230 | ) |
| Undistributed ordinary income | | 4,915,937 | |
| Capital loss carryforwards | | (33,329,009 | ) |
| Other temporary differences | | (147,536 | ) |
As of December 31, 2008, the fund had capital loss carryforwards available to offset future realized gains. Such losses expire as follows:
Multiple Classes of Shares of Beneficial Interest – The fund offers multiple classes of shares, which differ in their respective distribution fees. The fund’s income, realized and unrealized gain (loss), and common expenses are allocated to shareholders based on the daily net assets of each class. Dividends are declared separately for each class. Differences in per share dividend rates are generally due to differences in separate class expenses.
| (3) | | Transactions with Affiliates |
Investment Adviser – The fund has an investment advisory agreement with MFS to provide overall investment management and related administrative services and facilities to the fund. The management fee is computed daily and paid monthly at the following annual rates:
| | |
| First $1 billion of average daily net assets | | 0.90% |
| Next $1 billion of average daily net assets | | 0.80% |
| Average daily net assets in excess of $2 billion | | 0.70% |
16
Notes to Financial Statements – continued
The management fee incurred for the year ended December 31, 2008 was equivalent to an annual effective rate of 0.90% of the fund’s average daily net assets.
The investment adviser has agreed in writing to pay a portion of the fund’s total annual operating expenses, exclusive of interest, taxes, extraordinary expenses, brokerage and transaction costs and investment-related expenses, such that the total annual operating expenses of the fund do not exceed 1.10% for the Initial Class shares and 1.35% for the Service Class shares, based on the average daily net assets of each share class. This written agreement will continue until April 30, 2010. For the year ended December 31, 2008, this reduction amounted to $151,075 and is reflected as a reduction of total expenses in the Statements of Operations.
Distributor – MFS Fund Distributors, Inc. (MFD), a wholly-owned subsidiary of MFS, is the distributor of shares of the fund. The Trustees have adopted a distribution plan for the Service Class shares pursuant to Rule 12b-1 under the Investment Company Act of 1940.
The fund’s distribution plan provides that the fund will pay MFD distribution fees equal to 0.25% per annum of its average daily net assets attributable to Service Class shares as partial consideration for services performed and expenses incurred by MFD and financial intermediaries in connection with the sale and distribution of the fund’s Service Class shares and the sale and distribution of the variable annuity or variable life insurance contracts investing indirectly in Service Class shares. MFD may subsequently pay all, or a portion, of the distribution fees to financial intermediaries.
Shareholder Servicing Agent – MFS Service Center, Inc. (MFSC), a wholly-owned subsidiary of MFS, has contracted to provide transfer agent and recordkeeping functions in connection with the issuance, transfer, and redemption of each class of shares of the fund under a Shareholder Servicing Agent Agreement. During the year ended December 31, 2008, the fund did not pay MFSC a fee for this service.
Administrator – MFS provides certain financial, legal, shareholder communications, compliance, and other administrative services to the fund. Under an administrative services agreement, the fund partially reimburses MFS the costs incurred to provide these services. The fund is charged an annual fixed amount of $10,000 plus a fee based on average daily net assets.
The administrative services fee incurred for the year ended December 31, 2008 was equivalent to an annual effective rate of 0.0301% of the fund’s average daily net assets.
Trustees’ and Officers’ Compensation – The fund pays compensation to trustees in the form of a retainer, attendance fees, and additional compensation to the Board chairperson. The fund does not pay compensation directly to officers of the fund who are also officers of the investment adviser, all of whom receive remuneration for their services to the fund from MFS. Certain officers of the fund are officers or directors of MFS, MFD, and MFSC.
Other – This fund and certain other MFS funds (the funds) have entered into services agreements (the Agreements) which provide for payment of fees by the funds to Tarantino LLC and Griffin Compliance LLC in return for the provision of services of an Independent Chief Compliance Officer (ICCO) and Assistant ICCO, respectively, for the funds. The ICCO and Assistant ICCO are officers of the funds and the sole members of Tarantino LLC and Griffin Compliance LLC, respectively. The funds can terminate the Agreements with Tarantino LLC and Griffin Compliance LLC at any time under the terms of the Agreements. MFS has agreed to bear all expenses associated with office space, other administrative support, and supplies provided to the ICCO and Assistant ICCO. For the year ended December 31, 2008, the aggregate fees paid by the fund to Tarantino LLC and Griffin Compliance LLC were $2,166 and are included in miscellaneous expense on the Statement of Operations.
Purchases and sales of investments, other than U.S. Government securities, purchased option transactions, and short-term obligations, aggregated $195,166,241 and $215,219,025, respectively.
17
Notes to Financial Statements – continued
| (5) | | Shares of Beneficial Interest |
The fund’s Declaration of Trust permits the Trustees to issue an unlimited number of full and fractional shares of beneficial interest. Transactions in fund shares were as follows:
| | | | | | | | | | | | |
| | | Year ended 12/31/08 | | | Year ended 12/31/07 | |
| | | Shares | | | Amount | | | Shares | | | Amount | |
| Shares sold | | | | | | | | | | | | |
Initial Class | | 282,236 | | | $3,520,499 | | | 259,829 | | | $5,250,023 | |
Service Class | | 1,917,759 | | | 24,193,315 | | | 1,993,622 | | | 39,073,516 | |
| | 2,199,995 | | | $27,713,814 | | | 2,253,451 | | | $44,323,539 | |
| Shares issued to shareholders in reinvestment of distributions | | | | | | | | | | | | |
Initial Class | | 735,694 | | | $12,742,223 | | | 765,222 | | | $14,592,782 | |
Service Class | | 1,509,259 | | | 25,853,598 | | | 1,137,556 | | | 21,488,442 | |
| | 2,244,953 | | | $38,595,821 | | | 1,902,778 | | | $36,081,224 | |
| Shares reacquired | | | | | | | | | | | | |
Initial Class | | (1,837,185 | ) | | $(26,771,198 | ) | | (1,589,072 | ) | | $(31,360,976 | ) |
Service Class | | (2,099,241 | ) | | (28,734,429 | ) | | (742,158 | ) | | (14,386,356 | ) |
| | (3,936,426 | ) | | $(55,505,627 | ) | | (2,331,230 | ) | | $(45,747,332 | ) |
| Net change | | | | | | | | | | | | |
Initial Class | | (819,255 | ) | | $(10,508,476 | ) | | (564,021 | ) | | $(11,518,171 | ) |
Service Class | | 1,327,777 | | | 21,312,484 | | | 2,389,020 | | | 46,175,602 | |
| | 508,522 | | | $10,804,008 | | | 1,824,999 | | | $34,657,431 | |
The fund and other funds managed by MFS participate in a $1 billion unsecured committed line of credit provided by a syndication of banks under a credit agreement. In addition, the fund and other funds managed by MFS have established uncommitted borrowing arrangements with certain banks. Borrowings may be made for temporary financing needs. Interest is charged to each fund, based on its borrowings, generally at a rate equal to the Federal Reserve funds rate plus 0.30%. In addition, a commitment fee, based on the average daily, unused portion of the committed line of credit, is allocated among the participating funds at the end of each calendar quarter. For the year ended December 31, 2008, the fund’s commitment fee and interest expense were $1,281 and $0, respectively, and are included in miscellaneous expense on the Statement of Operations.
18
REPORT OF INDEPENDENT REGISTERED PUBLIC ACCOUNTING FIRM
To the Board of Trustees of MFS Variable Insurance Trust II and the Shareholders of
MFS Research International Portfolio:
We have audited the accompanying statement of assets and liabilities, including the portfolio of investments, of MFS Research International Portfolio (the “Fund”) (one of the portfolios comprising MFS Variable Insurance Trust II) as of December 31, 2008, and the related statement of operations for the year then ended, the statements of changes in net assets for each of the two years in the period then ended, and the financial highlights for each of the five years in the period then ended. These financial statements and financial highlights are the responsibility of the Fund’s management. Our responsibility is to express an opinion on these financial statements and financial highlights based on our audits.
We conducted our audits in accordance with the standards of the Public Company Accounting Oversight Board (United States). Those standards require that we plan and perform the audit to obtain reasonable assurance about whether the financial statements and financial highlights are free of material misstatement. The Fund is not required to have, nor were we engaged to perform, an audit of its internal control over financial reporting. Our audits included consideration of internal control over financial reporting as a basis for designing audit procedures that are appropriate in the circumstances, but not for the purpose of expressing an opinion on the effectiveness of the Fund’s internal control over financial reporting. Accordingly, we express no such opinion. An audit also includes examining, on a test basis, evidence supporting the amounts and disclosures in the financial statements, assessing the accounting principles used and significant estimates made by management, as well as evaluating the overall financial statement presentation. Our procedures included confirmation of securities owned as of December 31, 2008, by correspondence with the custodian and brokers; where replies were not received from brokers, we performed other auditing procedures. We believe that our audits provide a reasonable basis for our opinion.
In our opinion, the financial statements and financial highlights referred to above present fairly, in all material respects, the financial position of MFS Research International Portfolio as of December 31, 2008, the results of its operations for the year then ended, the changes in its net assets for each of the two years in the period then ended, and the financial highlights for each of the five years in the period then ended, in conformity with accounting principles generally accepted in the United States of America.
DELOITTE & TOUCHE LLP
Boston, Massachusetts
February 17, 2009
19
TRUSTEES AND OFFICERS – IDENTIFICATION AND BACKGROUND
The Trustees and officers of the Trust, as of February 1, 2009, are listed below, together with their principal occupations during the past five years. (Their titles may have varied during that period.) The address of each Trustee and officer is 500 Boylston Street, Boston, Massachusetts 02116.
| | | | | | |
Name, Date of Birth | | Position(s) Held
with Fund | | Trustee/Officer
Since (1) | | Principal Occupations During the Past Five Years and
Other Directorships (2) |
| INTERESTED TRUSTEE | | | | |
David D. Horn (3) (born 6/07/41) | | Trustee | | April 1986 | | Private investor; Sun Life Assurance Company of Canada, Senior Vice President and General Manager for the United States (until 1997); Director (until March 2004) |
| | |
| INDEPENDENT TRUSTEES | | | | |
J. Kermit Birchfield (born 1/08/40) | | Chairman | | May 1997 | | Consultant; Century Partners, Inc. (investments), Director; Displaytech, Inc. (technology), Director; Dessin Fournir LLC (furniture manufacturer), Director (2005 to present); Intermountain Gas Company, Inc. & Intermountain Industries, Inc. (oil & gas exploration and production), Director; Site Watch LLC (software to monitor oil tanks), Managing Director (2006 to present); Juridica Investments (fund investing in judicial matters), Director (2007 to present); HPSC, Inc. (medical financing), Director (until January 2004) |
| | | |
Robert C. Bishop (born 1/13/43) | | Trustee | | May 2001 | | AutoImmune, Inc. (pharmaceutical product development), Chairman, President and Chief Executive Officer; Caliper Life Sciences Corp. (laboratory analytical instruments), Director; Millipore Corporation (purification/filtration products), Director; Waterstreet Capital (leverage buyouts), Advisory Board (August 2006 to present); Optobionics Corporation (ophthalmic devices), Director (2002 to 2007) |
| | | |
Frederick H. Dulles (born 3/12/42) | | Trustee | | May 2001 | | Ten State International Law PLLC (law firm), Of Counsel (since 2006); Prudential Carolina Real Estate, (real estate), Broker (since 2006); Free Enterprise Foundation, Inc. (research institute), Director & Secretary (until 2008); Disher, Hamrick & Myers Residential, Inc. (real estate) Broker (2005 until 2006); Frederick H. Dulles law practice (until 2006); Ten State Street LLP (law firm), Member (until 2005) |
| | | |
Marcia A. Kean (born 6/30/48) | | Trustee | | April 2005 | | Feinstein Kean Healthcare (consulting), Chief Executive Officer |
| | | |
Ronald G. Steinhart (born 6/15/40) | | Trustee | | May 2001 | | Private investor; Penske Automotive Group (automotive retailer), Director; Animal Health International, Inc. (animal health products), Director (since 2007); Texas Industries (concrete/aggregates/cement), Director (since 2007); Penson Worldwide, Inc. (securities clearance), Director (since 2006); Carreker Corporation (technology consulting) Director (until 2005); Prentiss Properties Trust (real estate investment trust), Director (until 2006) |
| | | |
Haviland Wright (born 7/21/48) | | Trustee | | May 2001 | | Profitability of Hawaii (software), Chief Development Officer (since December 2008); Elixir Technologies Corporation (software) Director (since 2005); Nano Loa Inc. (liquid crystal displays), Director |
| | |
| TRUSTEE EMERITUS | | | | |
Samuel Adams (born 10/19/25) | | Trustee Emeritus | | | | Retired; K&L Gates LLP (law firm), Of Counsel |
| | |
| OFFICERS | | | | |
Maria F. Dwyer (4) (born 12/01/58) | | President | | November 2005 | | Massachusetts Financial Services Company, Executive Vice President and Chief Regulatory Officer (since March 2004) Chief Compliance Officer (since December 2006); Fidelity Management & Research Company, Vice President (prior to March 2004); Fidelity Group of Funds, President and Treasurer (until March 2004) |
| | | |
Christopher R. Bohane (4) (born 1/18/74) | | Assistant Secretary and Assistant Clerk | | July 2005 | | Massachusetts Financial Services Company, Vice President and Senior Counsel |
| | | |
John M. Corcoran (4) (born 4/13/65) | | Treasurer | | October 2008 | | Massachusetts Financial Services Company, Senior Vice President (since October 2008); State Street Bank and Trust (financial services provider), Senior Vice President, (until September 2008) |
| | | |
Ethan D. Corey (4) (born 11/21/63) | | Assistant Secretary and Assistant Clerk | | July 2005 | | Massachusetts Financial Services Company, Senior Vice President and Associate General Counsel (since 2004); Dechert LLP (law firm), Counsel (prior to December 2004) |
| | | |
David L. DiLorenzo (4) (born 8/10/68) | | Assistant Treasurer | | July 2005 | | Massachusetts Financial Services Company, Vice President (since June 2005); JP Morgan Investor Services, Vice President (until June 2005) |
| | | |
Timothy M. Fagan (4) (born 7/10/68) | | Assistant Secretary and Assistant Clerk | | September 2005 | | Massachusetts Financial Services Company, Vice President and Senior Counsel (since September 2005); John Hancock Advisers, LLC, Vice President, Senior Attorney and Chief Compliance Officer (until August 2005) |
20
Trustees and Officers – continued
| | | | | | |
Name, Date of Birth | | Position(s) Held
with Fund | | Trustee/Officer
Since (1) | | Principal Occupations During the Past Five Years and
Other Directorships (2) |
Mark D. Fischer (4) (born 10/27/70) | | Assistant Treasurer | | July 2005 | | Massachusetts Financial Services Company, Vice President (since May 2005); JP Morgan Investment Management Company, Vice President (until May 2005) |
| | | |
Robyn L. Griffin (born 7/04/75) | | Assistant Independent Chief Compliance Officer | | August 2008 | | Griffin Compliance LLC (provider of compliance services), Principal (since August 2008); State Street Corporation (financial services provider), Mutual Fund Administration Assistant Vice President (October 2006 – July 2008); Liberty Mutual Group (insurance), Personal Market Assistant Controller (April 2006 – October 2006); Deloitte & Touche LLP (professional services firm), Senior Manager (prior to April 2006) |
| | | |
Brian E. Langenfeld (4) (born 3/07/73) | | Assistant Secretary and Assistant Clerk | | May 2006 | | Massachusetts Financial Services Company, Vice President and Senior Counsel (since May 2006); John Hancock Advisers, LLC, Assistant Vice President and Counsel (until April 2006) |
| | | |
Ellen Moynihan (4) (born 11/13/57) | | Assistant Treasurer | | May 1997 | | Massachusetts Financial Services Company, Senior Vice President |
| | | |
Susan S. Newton (4) (born 3/07/50) | | Assistant Secretary and Assistant Clerk | | May 2005 | | Massachusetts Financial Services Company, Senior Vice President and Associate General Counsel (since April 2005); John Hancock Advisers, LLC, Senior Vice President, Secretary and Chief Legal Officer (until April 2005) |
| | | |
Susan A. Pereira (4) (born 11/05/70) | | Assistant Secretary and Assistant Clerk | | July 2005 | | Massachusetts Financial Services Company, Vice President and Senior Counsel (since June 2004); Bingham McCutchen LLP (law firm), Associate (until June 2004) |
| | | |
Mark N. Polebaum (4) (born 5/01/52) | | Secretary and Clerk | | February 2006 | | Massachusetts Financial Services Company, Executive Vice President, General Counsel and Secretary (since January 2006); Wilmer Cutler Pickering Hale and Dorr LLP (law firm), Partner (until January 2006) |
| | | |
Frank L. Tarantino (born 3/07/44) | | Independent Chief Compliance Officer | | September 2004 | | Tarantino LLC (provider of compliance services), Principal (since June 2004); CRA Business Strategies Group (consulting services), Executive Vice President (until June 2004) |
| | | |
Richard S. Weitzel (4) (born 7/16/70) | | Assistant Secretary and Assistant Clerk | | October 2007 | | Massachusetts Financial Services Company, Vice President and Assistant General Counsel (since 2004); Massachusetts Department of Business and Technology, General Counsel (until April 2004) |
| | | |
James O. Yost (4) (born 6/12/60) | | Assistant Treasurer | | April 1992 | | Massachusetts Financial Services Company, Senior Vice President |
| (1) | Date first appointed to serve as Trustee/Officer of an MFS fund or a Compass variable account. Each Trustee has served continuously since appointment. |
| (2) | Directorships or trusteeships of companies required to report to the Securities and Exchange Commission (i.e., “public companies”). |
| (3) | “Interested person” of the Trust, within the meaning of the Investment Company Act of 1940 (referred to as the 1940 Act), which is the principal federal law governing investment companies like the Trust, as a result of position with Sun Life of Canada (U.S.). The address of Sun Life of Canada (U.S.) is One Sun Life Executive Park, Wellesley Hills, Massachusetts 02481. |
| (4) | “Interested person” of MFS within the meaning of the 1940 Act. The address of MFS is 500 Boylston Street, Boston, Massachusetts 02116. |
The Trust does not hold annual meetings for the purpose of electing Trustees, and Trustees are not elected for fixed terms. Each Trustee and officer holds office until his or her successor is chosen and qualified, or until his or her earlier death, resignation, retirement or removal.
All Trustees currently serve as Trustees of the Trust and have served in that capacity since originally elected or appointed. All of the Trustees are also Managers of the Compass Variable Accounts. The executive officers of the Trust hold similar offices for the Compass Variable Accounts and other funds in the MFS fund complex. As of January 1, 2009, each Trustee serves as a Trustee or Manager of 35 Accounts/Funds.
The Statement of Additional Information contains further information about the Trustees and is available without charge upon request by calling 1-800-752-7215.
| | |
Investment Adviser
Massachusetts Financial Services Company 500 Boylston Street, Boston, MA 02116-3741 | | Custodian State Street Bank and Trust 1 Lincoln Street, Boston, MA 02111-2900 |
Distributor
MFS Fund Distributors, Inc. 500 Boylston Street, Boston, MA 02116-3741 | | Independent Registered Public Accounting Firm Deloitte & Touche LLP 200 Berkeley Street, Boston, MA 02116 |
Portfolio Managers Jose Luis Garcia Thomas Melendez | | |
21
BOARD REVIEW OF INVESTMENT ADVISORY AGREEMENTS
The Investment Company Act of 1940 requires that both the full Board of Trustees and a majority of the non-interested (“independent”) Trustees, voting separately, annually approve the continuation of the investment advisory agreement between MFS Variable Insurance Trust II (the “Trust”) and Massachusetts Financial Services Company (“MFS”) on behalf of the Fund. The Trustees consider matters bearing on the Fund and the advisory arrangements at their meetings throughout the year, including a review of performance data at each regular meeting. In addition, the independent Trustees met in May and again in July 2008 (“contract review meetings”) for the specific purpose of considering whether to approve the continuation of the investment advisory agreement for the Fund. The independent Trustees were assisted in their evaluation of the investment advisory agreement by independent legal counsel, from whom they received separate legal advice and with whom they met separately from MFS management during various contract review meetings. The independent Trustees were also assisted in this process by the Fund’s Independent Chief Compliance Officer, a full-time senior officer appointed by and reporting to the independent Trustees.
In connection with their deliberations, the Trustees, including the independent Trustees, considered such information and factors as they believed, in light of the legal advice furnished to them and their own business judgment, to be relevant. The investment advisory agreement was considered separately for the Fund, although the Trustees also took into account the common interests of all Funds in the Trust in their review. As described below, the Trustees considered the nature, quality, and extent of the various investment advisory, administrative, and shareholder services performed by MFS under the existing investment advisory agreement and other arrangements with the Trust.
In connection with their contract review meetings, the Trustees received and relied upon materials which included, among other items: (i) information provided by Lipper Inc. on the investment performance of the Fund for various time periods ended December 31, 2007, compared to the investment performance of a group of funds with substantially similar investment classifications/objectives (the “Lipper performance universe”), (ii) information provided by Lipper Inc. on the Fund’s advisory fees and other expenses compared to the advisory fees and other expenses of comparable funds identified by Lipper (the “Lipper expense group”), (iii) information provided by MFS on the advisory fees of comparable portfolios of its other clients, including institutional separate account and other clients, (iv) information as to whether expense waivers, reimbursements or fee “breakpoints” are observed for the Fund, (v) information regarding MFS’ financial results and financial condition, including MFS’ and certain of its affiliates’ estimated profitability from services performed for the Fund, (vi) MFS’ views regarding the outlook for the mutual fund industry and its strategic business plans, (vii) descriptions of various functions performed by MFS for the Trust, such as compliance monitoring and portfolio trading practices, and (viii) information regarding the overall organization of MFS, including information about MFS’ senior management and other personnel providing investment advisory, administrative and other services to the Fund. The comparative performance, fee and expense information prepared and provided by Lipper Inc. was not independently verified, and the independent Trustees did not independently verify any information provided to them by MFS.
The Trustees’ conclusion as to the continuation of the investment advisory agreement was based on comprehensive consideration of all information provided to the Trustees and not the result of any single factor. Some of the factors that figured particularly in the Trustees’ deliberations are described below for the Fund, while individual Trustees may have given different weight to various factors and evaluated the information presented as a whole differently than another Trustee. The Trustees recognized that the fee arrangements for the Fund reflect years of review and discussion between the independent Trustees and MFS, that certain aspects of such arrangements may receive greater scrutiny in some years than others, and that the Trustees’ conclusions may be based, in part, on their consideration of these same arrangements during the course of the year and in prior years.
Based on information provided by Lipper Inc., the Trustees compared the Fund’s total return investment performance to the performance of a peer group of funds over various time periods. The Trustees placed particular emphasis on the total return performance of the Fund’s Initial Class shares in comparison to the performance of funds in its Lipper performance universe over the one-, three- and five-year periods. The Trustees did not rely on performance results for more recent periods, including those shown elsewhere in this report.
The Trustees noted the performance of the Fund’s Initial Class shares was in the 3rd quintile relative to the other funds in the Lipper Classification Index for the one-year period (the 1st quintile being the best performers and the 5th quintile being the worst performers). The total return performance of the Fund was in the 2nd quintile for the three-year period and the five-year period ended December 31, 2007, relative to the Lipper performance universe. Based on the nature and quality of services provided by MFS, the Board of Trustees concluded that the Fund’s performance was satisfactory.
In the course of their deliberations, the Trustees took into account information provided by MFS during contract review meetings, as well as during investment review meetings conducted with portfolio management personnel during the course of the year.
22
Board Review of Investment Advisory Agreement – continued
In assessing the reasonableness of the Fund’s advisory fee, the Trustees considered, among other information, the Fund’s advisory fee and the total expense ratio of the Fund’s Initial Class shares as a percentage of average daily net assets, compared to the advisory fee and total expense ratios of its peer group of funds based on information provided by Lipper Inc. The Trustees also considered the advisory fees charged by MFS to institutional accounts. In comparing these fees, the Trustees considered the generally broader scope of services provided by MFS to the Trust than those provided to institutional accounts. The Trustees also considered the higher demands placed on MFS’ investment personnel and trading infrastructure as a result of the daily cash in-flows and out-flows of the Fund, and the impact on MFS and related expenses due to the more extensive regulatory regime to which the Fund is subject, compared to institutional accounts.
In considering the fees, the Trustees noted from the Lipper data that the Fund’s effective advisory fee rate and total expense ratio were each above the median of such fees and expenses of funds in the Lipper expense group. In addition, the Trustees accepted MFS’ offer to continue the expense limitation for the Fund. The Trustees further concluded that the existing breakpoints were sufficient to allow the Fund to benefit from economies of scale as its assets grow. The Trustees concluded that the fees were reasonable in light of the nature and quality of services provided.
The Trustees also considered information prepared by MFS relating to its costs and profits with respect to the Fund and other investment companies and accounts advised by MFS, as well as MFS’ methodologies used to determine and allocate its costs to the Fund and other accounts and products for purposes of estimating profitability.
After reviewing these and other factors described below, the Trustees concluded that the advisory fees charged to the Fund represent reasonable compensation in light of the nature and quality of the services being provided by MFS.
In addition, the Trustees considered MFS’ resources and related efforts to continue to retain, attract and motivate capable personnel to serve the Fund. The Trustees also considered the financial resources of MFS and its parent, Sun Life Financial Inc. The Trustees further considered any advantages and possible disadvantages of having an adviser which also serves other investment companies as well as institutional accounts.
The Trustees also considered the nature, quality, cost, and extent of administrative, transfer agency, and distribution services provided to the Fund by MFS and its affiliates under agreements and plans other than the investment advisory agreement, including the 12b-1 fees the Fund pays to MFS Fund Distributors, Inc., an affiliate of MFS. The Trustees also considered the nature, extent and quality of certain other services MFS performs or arranges on the Fund’s behalf, which may include securities lending programs, directed expense payment programs, class action recovery programs, and MFS’ interaction with third-party service providers, principally custodians and sub-custodians. The Trustees concluded that the various non-advisory services provided by MFS and its affiliates on behalf of the Fund were satisfactory. The Trustees also considered the benefits to MFS from the use of the Fund’s portfolio brokerage commissions to pay for research and other similar services and various other factors. Additionally, the Trustees considered so-called “fall-out benefits” to MFS such as reputational value derived from serving as investment manager to the Trust, and determined that any such benefits derived by MFS were reasonable and fair.
Based on their evaluation of factors that they deemed to be material, including those factors described above, the Board of Trustees, including a majority of the independent Trustees, concluded that the investment advisory agreement should be continued for an additional one-year period, commencing September 1, 2008.
A discussion regarding the Board’s most recent review and renewal of the fund’s Investment Advisory Agreement with MFS is available by clicking on the fund’s name under “Variable Insurance Portfolios-VIT II” in the “Products & Performance” section on the MFS Web site (mfs.com).
23
PROXY VOTING POLICIES AND INFORMATION
A general description of the MFS funds’ proxy voting policies and procedures is available without charge, upon request, by calling
1-800-225-2606, by visiting the Proxy Voting section of mfs.com or by visiting the SEC’s Web site at http://www.sec.gov.
Information regarding how the fund voted proxies relating to portfolio securities during the most recent twelve-month period ended June 30 is available without charge by visiting the Proxy Voting section of mfs.com or by visiting the SEC’s Web site at http://www.sec.gov.
QUARTERLY PORTFOLIO DISCLOSURE
The fund will file a complete schedule of portfolio holdings with the Securities and Exchange Commission (the Commission) for the first and third quarters of each fiscal year on Form N-Q. The fund’s Form N-Q may be reviewed and copied at the:
Public Reference Room
Securities and Exchange Commission
100 F Street, NE, Room 1580
Washington, D.C. 20549
Information on the operation of the Public Reference Room may be obtained by calling the Commission at 1-800-SEC-0330. The fund’s Form N-Q is available on the EDGAR database on the Commission’s Internet Web site at http://www.sec.gov, and copies of this information may be obtained, upon payment of a duplicating fee, by electronic request at the following e-mail address: publicinfo@sec.gov or by writing the Public Reference Section at the above address.
FEDERAL TAX INFORMATION (unaudited)
The following information is provided pursuant to provisions of the Internal Revenue Code.
The fund designates $24,126,380 as capital gain dividends paid during the fiscal year.
Income derived from foreign sources was $5,594,519. The fund intends to pass through foreign tax credits of $667,995 for the fiscal year.
24
MFS® PRIVACY NOTICE
Privacy is a concern for every investor today. At MFS Investment Management® and the MFS funds, we take this concern very seriously. We want you to understand our policies about the investment products and services that we offer, and how we protect the nonpublic personal information of investors who have a direct relationship with us and our wholly owned subsidiaries.
Throughout our business relationship, you provide us with personal information. We maintain information and records about you, your investments, and the services you use. Examples of the nonpublic personal information we maintain include
| | Ÿ | | data from investment applications and other forms |
| | Ÿ | | share balances and transactional history with us, our affiliates, or others |
| | Ÿ | | facts from a consumer reporting agency |
We do not disclose any nonpublic personal information about our customers or former customers to anyone, except as permitted by law. We may share nonpublic personal information with third parties or certain of our affiliates in connection with servicing your account or processing your transactions. We may share information with companies or financial institutions that perform marketing services on our behalf or with other financial institutions with which we have joint marketing arrangements, subject to any legal requirements.
Authorization to access your nonpublic personal information is limited to appropriate personnel who provide products, services, or information to you. We maintain physical, electronic, and procedural safeguards to help protect the personal information we collect about you.
If you have any questions about the MFS privacy policy, please call 1-800-225-2606 any business day between 8 a.m. and 8 p.m. Eastern time.
Note: If you own MFS products or receive MFS services in the name of a third party such as a bank or broker-dealer, their privacy policy may apply to you instead of ours.
25


MFS® EMERGING MARKETS EQUITY PORTFOLIO
The report is prepared for the general information of contract owners. It is authorized for distribution to prospective investors only when preceded or accompanied by a current prospectus.
NOT FDIC INSURED Ÿ MAY LOSE VALUE Ÿ NO BANK GUARANTEE Ÿ NOT A DEPOSIT Ÿ NOT INSURED BY ANY FEDERAL GOVERNMENT AGENCY OR NCUA/NCUSIF
LETTER FROM THE CEO

Dear Contract Owners:
The market downturns and economic setbacks of late probably rank among the worst financial declines most of us have experienced. Inevitably, people may be questioning their commitment to investing. Still, it is important to remember that downturns are an inescapable part of the business cycle. Such troughs have been seen before, and if we can use history as a guide, market recoveries typically have followed.
Recent events have clearly shown us the value of certain types of investments. In this environment, two of the hallmarks of mutual funds — transparency and liquidity — have become critically important. Unlike some other types of investments, the operations of mutual funds are relatively transparent to their shareholders. With their daily redemption feature, mutual funds also generally provide easy, convenient access to one’s money. Through these recent market upheavals, this level of liquidity enhanced the ability of mutual fund investors to respond and modify their investments as they and their advisors saw fit — a flexibility that those in less liquid investments simply did not have at their disposal.
At MFS® we take particular pride in how well mutual funds can serve investors because we invented the mutual fund in the United States. Established in 1924, Massachusetts Investors Trust was the nation’s first fund. Recent market events only reinforce what we have learned through 85 years — that mutual funds provide unique features that are important to investors in any type of market climate.
Respectfully,

Robert J. Manning
Chief Executive Officer and Chief Investment Officer
MFS Investment Management®
February 17, 2009
The opinions expressed in this letter are subject to change, may not be relied upon for investment advice, and no forecasts can be guaranteed.
Before investing, consider the fund’s investment objectives, risks, charges, and expenses. For a prospectus containing this and other information, contact your investment professional or view online. Read it carefully.
MFS Fund Distributors, Inc., 500 Boylston Street, Boston, MA 02116
1
PORTFOLIO COMPOSITION
Portfolio structure
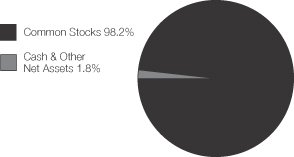
| | |
| Top ten holdings | | |
| China Mobile Ltd. (a) | | 6.1% |
| Samsung Electronics Co. Ltd. | | 4.4% |
| Teva Pharmaceutical Industries Ltd., ADR | | 3.8% |
| Petroleo Brasileiro S.A., ADR | | 3.7% |
| Taiwan Semiconductor Manufacturing Co. Ltd., ADR (a) | | 3.6% |
| Companhia Vale do Rio Doce, ADR | | 2.9% |
| OAO Gazprom, ADR | | 2.6% |
| Industrial & Commercial Bank of China, “H” | | 2.4% |
| MTN Group Ltd. | | 2.1% |
| America Movil S.A.B. de C.V., ”L”, ADR | | 1.9% |
| | |
| Equity sectors | | |
| Utilities & Communications | | 23.9% |
| Financial Services | | 18.4% |
| Energy | | 13.5% |
| Technology | | 12.0% |
| Basic Materials | | 8.5% |
| Health Care | | 5.3% |
| Consumer Staples | | 5.1% |
| Retailing | | 3.6% |
| Autos & Housing | | 3.3% |
| Special Products & Services | | 1.9% |
| Leisure | | 1.5% |
| Industrial Goods & Services | | 0.9% |
| Transportation | | 0.3% |
| |
| Country weightings | | |
| China | | 14.8% |
| Brazil | | 13.9% |
| Taiwan | | 9.5% |
| South Africa | | 9.3% |
| Russia | | 7.1% |
| Mexico | | 6.2% |
| South Korea | | 6.0% |
| Israel | | 5.4% |
| Indonesia | | 4.0% |
| Other Countries | | 23.8% |
| (a) | Top 10 Holdings are calculated by asset issuer combining both Ordinary Shares & Depository Receipts as one holding. |
Percentages are based on net assets as of 12/31/08.
The portfolio is actively managed and current holdings may be different.
2
MANAGEMENT REVIEW
Summary of Results
For the twelve months ended December 31, 2008, Initial Class shares of the MFS Emerging Markets Equity Portfolio (the “fund”) provided a total return of –55.11%, while Service Class shares of the fund provided a total return of –55.23%. This compares with a return of –53.18% for the fund’s benchmark, the MSCI Emerging Markets Index.
Market Environment
The U.S. economy and financial markets experienced significant deterioration and extraordinary volatility over the reporting period. U.S. economic growth slowed significantly, despite the short-term bounce from the second quarter fiscal stimulus. Strong domestic headwinds included accelerated deterioration in the housing market, anemic corporate investment, a rapidly declining job market, and a much tighter credit environment. During the period, a seemingly continuous series of tumultuous financial events hammered markets, including: the distressed sale of failing Bear Stearns to JPMorgan, the conservatorship of Government Sponsored Enterprises (GSEs) Fannie Mae and Freddie Mac, the bankruptcy of investment bank Lehman Brothers, the Federal Reserve Bank’s complex intervention of insurance company American International Group (AIG), the nationalization of several large European banks, the failure of Washington Mutual, and the distressed sale of Wachovia. As a result of this barrage of turbulent news, global equity markets pushed significantly lower and credit markets witnessed the worst dislocation since the beginning of the credit crisis. Though conditions improved towards the end of the period, the state of financial and macroeconomic dislocation remained severe.
While reasonably resilient during the first half of the period, the global economy and financial system increasingly experienced considerable negative spillovers from the U.S. slowdown. Not only did Europe and Japan show obvious signs of economic softening, the more powerful engine of global growth – emerging markets – also displayed weakening dynamics.
During the reporting period, the U.S. Federal Reserve Board cut interest rates aggressively and introduced a multitude of new lending facilities to alleviate ever-tightening credit markets, while the U.S. federal government moved quickly to design and implement a meaningful fiscal stimulus package. Although several other global central banks also cut rates, the dilemma of rising energy and food prices heightened concerns among central bankers that inflationary expectations might become unhinged despite weaker growth. Only later in the reporting period did slowing global growth result in a very precipitous decline in commodity prices, which significantly eased inflation and inflationary expectations. As inflationary concerns diminished in the face of global deleveraging, and equity and credit markets deteriorated more sharply, a coordinated rate cut marked the beginning of much more aggressive easing by the major global central banks.
Detractors from Performance
Security selection in the basic materials sector was the primary detractor from performance relative to the MSCI Emerging Markets Index. Holdings of mining and metal companies, Mechel Steel Group OAO (Russia) and Evraz Group (aa) (Russia) were among the fund’s top relative detractors over the reporting period.
Stock selection and, to a lesser extent, an underweighted position in the special products and services sector also hindered relative returns. Holdings of poor-performing real estate brokerage firm LPS Brasil – Consultoria de Imoveis S.A. (aa) held back relative results.
The fund’s underweighted positioning in the financial services sector hurt relative performance. Positioning in life insurance company China Life Insurance (g), which we sold out of early in the reporting period, and shares of Hungarian financial services company OTP Bank (aa)(g) were among the fund’s top detractors within this sector. Shares of OTP Bank fell on concerns that the economic slowdown would cut profits. Additionally, the company’s management reduced its earnings forecast due to the increased cost of financing.
Securities in other sectors that held back relative returns included meat production and processing company Cherkizovo Group (aa)(g) (Russia), integrated oil company LUKOIL (g) (Russia), mobile phone services provider Vimpel Communications (g) (Russia), homebuilder SARE Holding S.A. de C.V. (Mexico) (aa), and natural gas producer OAO Gazprom (Russia). Despite management announcing rising revenues and net income, shares of Gazprom declined due to a decrease in global oil demand and announced production cuts.
Contributors to Performance
Stock selection in the technology sector boosted relative performance. Our overweighted position in semiconductor manufacturer Taiwan Semiconductor Manufacturing, which outperformed the benchmark over the reporting period, was among the fund’s top relative contributors.
3
Management Review – continued
Stock selection in the retailing sector also aided relative returns. Positioning in credit retailer Lewis Group (South Africa) and women’s clothing retailer Foschini (South Africa) helped relative results over the reporting period. We established positions in these stocks late in the reporting period but in time to capture the significant price appreciation that they subsequently enjoyed.
Elsewhere, positioning in commercial bank Sberbank (g) (Russia), which we sold out of prior to the stock’s decline, and in cosmetics firm Natura Cosmeticos (Brazil) and Israeli generic drug manufacturer Teva Pharmaceutical Industries, both of which outperformed the benchmark over the reporting period, bolstered relative performance. A jump in earnings from the multiple sclerosis medicine, Copaxone, and a Parkinson’s Disease treatment, Azilect, boosted shares of Teva Pharmaceutical. An overweighted position in mobile phone services provider Egypt Mobile Phone (g) and telecommunications firms Chunghwa Telecom and MTN Group also helped as these stocks outperformed the benchmark. The fund’s holdings of state-owned telecom operator China Telecom Corp. (aa)(g) helped. China Telecom Corp.’s positive performance was due, in part, to year-over-year net profit growth and additional broadband subscribers, despite weakening fixed-line usage.
During the reporting period, the fund’s currency exposure was a contributor to relative performance. All of MFS’ investment decisions are driven by the fundamentals of each individual opportunity and as such, it is common for our portfolios to have different currency exposure than the benchmark.
Respectfully,
| | |
| Jose Luis Garcia | | Nicholas Smithie |
| Portfolio Manager | | Portfolio Manager |
Note to Shareholders: Effective October 10, 2008, Jose Luis Garcia became a co-manager of the fund.
| (aa) | | Security is not a benchmark constituent. |
| (g) | | Security was not held in the portfolio at period end. |
The views expressed in this report are those of the portfolio managers only through the end of the period of the report as stated on the cover and do not necessarily reflect the views of MFS or any other person in the MFS organization. These views are subject to change at any time based on market or other conditions, and MFS disclaims any responsibility to update such views. These views may not be relied upon as investment advice or an indication of trading intent on behalf of any MFS portfolio. References to specific securities are not recommendations of such securities, and may not be representative of any MFS portfolio’s current or future investments.
4
PERFORMANCE SUMMARY THROUGH 12/31/08
The following chart illustrates the historical performance of the fund in comparison to its benchmark(s). Benchmark comparisons are unmanaged; do not reflect any fees or expenses; and cannot be invested in directly. The performance of other share classes will be greater than or less than that of the class depicted below. (See Notes to Performance Summary.)
Performance data shown represents past performance and is no guarantee of future results. Investment return and principal value fluctuate so your units, when sold, may be worth more or less than the original cost; current performance may be lower or higher than quoted. The performance shown does not reflect the deduction of taxes, if any, that a contract holder would pay on fund distributions or the redemption of contract units. The returns for the fund shown also do not reflect the deduction of expenses associated with variable products, such as mortality and expense risk charges, separate account charges, and sales charges imposed by the insurance company separate accounts. Such expenses would reduce the overall returns shown.
Growth of a hypothetical $10,000 investment
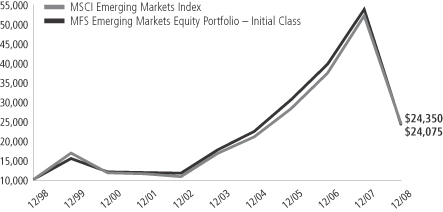
Total rates of return through 12/31/08
Average Annual Total Returns
| | | | | | | | | | | | |
| | | Share class | | Class inception date | | 1-yr | | 5-yr | | 10-yr | | |
| | | Initial Class | | 6/05/96 | | (55.11)% | | 6.64% | | 9.18% | | |
| | | Service Class | | 8/24/01 | | (55.23)% | | 6.39% | | 8.98% | | |
Comparative Benchmark
| | | | | | | | | | | | |
| | | MSCI Emerging Markets Index (f) | | (53.18)% | | 8.02% | | 9.31% | | |
| (f) | Source: FactSet Research Systems, Inc. |
Benchmark Definition
MSCI Emerging Markets Index – a market capitalization-weighted index that is designed to measure equity market performance in the global emerging markets.
It is not possible to invest directly in an index.
Notes to Performance Summary
Performance for the Service Class includes the performance of the fund’s Initial Class for periods prior to their offering. Because Service Class expenses are higher than those of Initial Class, performance shown for Service Class is higher than it would have been had it been offered for the entire period. Performance has not been adjusted to take into account differences in class specific operating expenses (such as Rule 12b-1 fees). Please see the prospectus for additional information about performance and expenses.
Performance results reflect any applicable expense subsidies and waivers in effect during the periods shown. Without such subsidies and waivers the fund’s performance results would be less favorable. Please see the prospectus for complete details. All results are historical and assume the reinvestment of any dividends and capital gains distributions.
From time to time the fund may receive proceeds from litigation settlements, without which performance would be lower.
5
EXPENSE TABLE
Fund Expenses Borne by the Contract Holders During the Period,
July 1, 2008 through December 31, 2008
As a contract holder of the fund, you incur ongoing costs, including management fees; distribution (12b-1) fees; and other fund expenses. This example is intended to help you understand your ongoing costs (in dollars) of investing in the fund and to compare these costs with the ongoing costs of investing in other mutual funds.
The example is based on an investment of $1,000 invested at the beginning of the period and held for the entire period July 1, 2008 through December 31, 2008.
Actual Expenses
The first line for each share class in the following table provides information about actual account values and actual expenses. You may use the information in this line, together with the amount you invested, to estimate the expenses that you paid over the period. Simply divide your account value by $1,000 (for example, an $8,600 account value divided by $1,000 = 8.6), then multiply the result by the number in the first line under the heading entitled “Expenses Paid During Period” to estimate the expenses you paid on your account during this period.
Hypothetical Example for Comparison Purposes
The second line for each share class in the following table provides information about hypothetical account values and hypothetical expenses based on the fund’s actual expense ratio and an assumed rate of return of 5% per year before expenses, which is not the fund’s actual return. The hypothetical account values and expenses may not be used to estimate the actual ending account balance or expenses you paid for the period. You may use this information to compare the ongoing costs of investing in the fund and other funds. To do so, compare this 5% hypothetical example with the 5% hypothetical examples that appear in the shareholder reports of the other funds.
Please note that the expenses shown in the table are meant to highlight the fund’s ongoing costs only and do not take into account the fees and expenses imposed under the variable contracts through which your investment in the fund is made. Therefore, the second line for each share class in the table is useful in comparing ongoing costs associated with an investment in vehicles (such as the fund) which fund benefits under variable annuity and variable life insurance contracts and to qualified pension and retirement plans only, and will not help you determine the relative total costs of investing in the fund through variable annuity and variable life insurance contracts. If the fees and expenses imposed under the variable contracts were included, your costs would have been higher.
| | | | | | | | | | |
| Share Class | | | | Annualized
Expense Ratio | | Beginning
Account Value
7/01/08 | | Ending
Account Value
12/31/08 | | Expenses Paid
During Period (p)
7/01/08-12/31/08 |
| Initial Class | | Actual | | 1.56% | | $1,000.00 | | $490.34 | | $5.84 |
| | Hypothetical (h) | | 1.56% | | $1,000.00 | | $1,017.29 | | $7.91 |
| Service Class | | Actual | | 1.81% | | $1,000.00 | | $489.66 | | $6.78 |
| | Hypothetical (h) | | 1.81% | | $1,000.00 | | $1,016.04 | | $9.17 |
| (h) | 5% class return per year before expenses. |
| (p) | Expenses paid is equal to each class’ annualized expense ratio, as shown above, multiplied by the average account value over the period, multiplied by the number of days in the period, divided by the number of days in the year. |
Expense Changes Impacting the Table
| | Changes to the fund’s fee arrangements occurred during the six month period. Had these fee changes been in effect throughout the entire six month period, the annualized expense ratios would have been 1.40% and 1.65% for the Initial Class and the Service Class, respectively; the actual expenses paid during the period would have been approximately $5.24 and $6.18 for the Initial Class and the Service Class, respectively; and the hypothetical expenses paid during the period would been approximately $7.10 and $8.36 for the Initial Class and the Service Class, respectively. For further information, about the fund’s fee arrangements and changes to those fee arrangements, please see Note 3 in the Notes to the Financial Statements. |
6
PORTFOLIO OF INVESTMENTS – 12/31/08
The Portfolio of Investments is a complete list of all securities owned by your fund. It is categorized by broad-based asset classes.
| | | | | |
| Issuer | | Shares/Par | | Value ($) |
| | | | | |
| COMMON STOCKS – 98.2% | | | | | |
| Aerospace – 0.2% | | | | | |
| Embraer-Empresa Brasileira de Aeronautica S.A., ADR | | 4,340 | | $ | 70,352 |
| | | | | |
| Airlines – 0.3% | | | | | |
| Copa Holdings S.A., “A” | | 4,380 | | $ | 132,802 |
| | | | | |
| Alcoholic Beverages – 0.9% | | | | | |
| Companhia de Bebidas das Americas, ADR | | 8,930 | | $ | 395,689 |
| | | | | |
| Automotive – 0.4% | | | | | |
| PT Astra International Tbk. | | 181,500 | | $ | 183,099 |
| | | | | |
| Broadcasting – 0.9% | | | | | |
| Grupo Televisa S.A., ADR | | 26,750 | | $ | 399,645 |
| | | | | |
| Brokerage & Asset Managers – 0.3% | | | | | |
| BM&F Bovespa S.A. | | 43,400 | | $ | 114,203 |
| Bolsa Mexicana de Valores S.A. (a) | | 23,900 | | | 17,500 |
| | | | | |
| | | | $ | 131,703 |
| | | | | |
| Business Services – 1.5% | | | | | |
| Infosys Technologies Ltd., ADR | | 21,160 | | $ | 519,901 |
| Kroton Educacional S.A., IEU (a) | | 13,500 | | | 72,073 |
| LPS Brasil-Consultoria de Imoveis S.A. | | 16,719 | | | 48,057 |
| | | | | |
| | | | $ | 640,031 |
| | | | | |
| Chemicals – 1.1% | | | | | |
| Israel Chemicals Ltd. | | 39,180 | | $ | 272,818 |
| Makhteshim-Agan Industries Ltd. | | 57,031 | | | 186,205 |
| | | | | |
| | | | $ | 459,023 |
| | | | | |
| Computer Software – 0.2% | | | | | |
| Totvs S.A. | | 5,000 | | $ | 79,310 |
| | | | | |
| Computer Software – Systems – 0.6% | | | | | |
| Acer, Inc. | | 205,000 | | $ | 268,781 |
| | | | | |
| Conglomerates – 0.4% | | | | | |
| Keppel Corp. Ltd. | | 64,000 | | $ | 193,975 |
| | | | | |
| Construction – 2.9% | | | | | |
| Corporacion Moctezuma S.A. de C.V. | | 155,600 | | $ | 241,571 |
| Desarrolladora Homex S.A. de C.V., ADR (a)(l) | | 3,890 | | | 88,809 |
| Duratex S.A., IPS | | 20,200 | | | 127,918 |
| Pretoria Portland Cement Co. Ltd. | | 86,571 | | | 295,276 |
| SARE Holding S.A. de C.V., “B” (a) | | 414,100 | | | 88,211 |
| Siam Cement Public Co. Ltd. | | 99,400 | | | 315,922 |
| Urbi Desarrollos Urbanos S.A. de C.V. (a) | | 60,040 | | | 82,418 |
| | | | | |
| | | | $ | 1,240,125 |
| | | | | |
| Consumer Goods & Services – 2.0% | | | | | |
| Hengan International Group Co. Ltd. | | 104,000 | | $ | 334,133 |
| Kimberly-Clark de Mexico S.A. de C.V., “A” | | 41,340 | | | 135,974 |
| Natura Cosmeticos S.A. | | 16,820 | | | 138,480 |
| Unilever PLC | | 314,500 | | | 228,462 |
| | | | | |
| | | | $ | 837,049 |
| | | | | |
| Electrical Equipment – 0.0% | | | | | |
| Bharat Heavy Electricals Ltd. | | 20 | | $ | 567 |
| | | | | |
| | | | | |
| Issuer | | Shares/Par | | Value ($) |
| | | | | |
| COMMON STOCKS – continued | | | | | |
| Electronics – 10.1% | | | | | |
| Delta Electronics | | 150,200 | | $ | 292,293 |
| MediaTek, Inc. | | 48,510 | | | 327,696 |
| Samsung Electronics Co. Ltd. | | 5,196 | | | 1,886,760 |
| Siliconware Precision Industries Co. Ltd., ADR | | 53,316 | | | 237,789 |
| Taiwan Semiconductor Manufacturing Co. Ltd. | | 534,919 | | | 732,160 |
| Taiwan Semiconductor Manufacturing Co. Ltd., ADR | | 104,315 | | | 824,089 |
| | | | | |
| | | | $ | 4,300,787 |
| | | | | |
| Energy – Independent – 4.0% | | | | | |
| CNOOC Ltd. | | 783,000 | | $ | 744,077 |
| OAO Rosneft Oil Co., GDR (a) | | 66,500 | | | 252,670 |
| Oil & Natural Gas Corp. Ltd. | | 12,507 | | | 172,097 |
| PT Bumi Resources Tbk. | | 850,500 | | | 73,388 |
| PTT Exploration & Production Ltd. | | 83,800 | | | 257,390 |
| Turkiye Petrol Rafinerileri AS | | 18,361 | | | 194,081 |
| | | | | |
| | | | $ | 1,693,703 |
| | | | | |
| Energy – Integrated – 8.6% | | | | | |
| LUKOIL, ADR | | 24,100 | | $ | 772,405 |
| NovaTek OAO, GDR | | 12,250 | | | 236,943 |
| OAO Gazprom, ADR | | 76,589 | | | 1,091,393 |
| Petroleo Brasileiro S.A., ADR | | 63,952 | | | 1,566,184 |
| | | | | |
| | | | $ | 3,666,925 |
| | | | | |
| Engineering – Construction – 0.2% | | | | | |
| Orascom Construction Industries | | 3,895 | | $ | 99,662 |
| | | | | |
| Food & Beverages – 1.1% | | | | | |
| Grupo Continental S.A. | | 118,503 | | $ | 195,958 |
| Tradewinds Berhad | | 341,200 | | | 295,838 |
| | | | | |
| | | | $ | 491,796 |
| | | | | |
| Forest & Paper Products – 0.2% | | | | | |
| Suzano Papel E Celulose S.A., IPS (a) | | 14,200 | | $ | 74,610 |
| | | | | |
| Gaming & Lodging – 0.6% | | | | | |
| Genting Berhad | | 239,300 | | $ | 257,108 |
| | | | | |
| General Merchandise – 1.2% | | | | | |
| Massmart Holdings Ltd. | | 25,840 | | $ | 237,168 |
| Woolworths Ltd. | | 206,061 | | | 285,015 |
| | | | | |
| | | | $ | 522,183 |
| | | | | |
| Health Maintenance Organizations – 0.4% | | | | | |
| OdontoPrev S.A. | | 17,800 | | $ | 177,240 |
| | | | | |
| Insurance – 0.7% | | | | | |
| Cathay Financial Holding Co. Ltd. | | 268,388 | | $ | 301,180 |
| | | | | |
| Internet – 0.4% | | | | | |
| Universo Online S.A., IPS | | 50,800 | | $ | 161,047 |
| | | | | |
| Machinery & Tools – 0.5% | | | | | |
| Larsen & Toubro Infotech Ltd. | | 12,424 | | $ | 198,687 |
| | | | | |
| Major Banks – 7.7% | | | | | |
| Banco Santander Chile, ADR (a) | | 8,403 | | $ | 294,357 |
| Bank of China Ltd. | | 1,314,000 | | | 362,337 |
7
Portfolio of Investments – continued
| | | | | |
| Issuer | | Shares/Par | | Value ($) |
| | | | | |
| COMMON STOCKS – continued | | | | | |
| Major Banks – continued | | | | | |
| Bank of Communications Co. Ltd. | | 324,000 | | $ | 235,993 |
| First Financial Holding Co. Ltd. | | 504,240 | | | 267,290 |
| Industrial & Commercial Bank of China, “H” | | 1,896,000 | | | 1,007,664 |
| Nedbank Group Ltd. | | 23,460 | | | 244,441 |
| Standard Bank Group Ltd. | | 55,927 | | | 506,695 |
| Unibanco-Uniao de Bancos Brasileiros S.A., ADR | | 5,526 | | | 357,090 |
| | | | | |
| | | | $ | 3,275,867 |
| | | | | |
| Medical & Health Technology & Services – 0.2% | | | |
| Diagnosticos da America S.A. | | 8,700 | | $ | 84,701 |
| | | | | |
| Metals & Mining – 4.4% | | | |
| Companhia Vale do Rio Doce, ADR | | 101,344 | | $ | 1,227,276 |
| Evraz Group S.A., GDR | | 4,480 | | | 38,528 |
| Grupo Mexico S.A.B. de C.V., “B” | | 314,429 | | | 200,030 |
| Mechel Steel Group OAO, ADR | | 13,390 | | | 53,560 |
| Novolipetsk Steel, GDR | | 9,350 | | | 96,673 |
| PT International Nickel Indonesia | | 586,500 | | | 106,129 |
| Usinas Siderurgicas de Minas Gerais S.A., IPS | | 13,975 | | | 163,151 |
| | | | | |
| | | | $ | 1,885,347 |
| | | | | |
| Natural Gas – Distribution – 0.7% | | | | | |
| GAIL India Ltd. | | 67,095 | | $ | 287,240 |
| | | | | |
| Network & Telecom – 0.7% | | | |
| High Tech Computer Corp. | | 28,226 | | $ | 284,723 |
| | | | | |
| Oil Services – 0.9% | | | |
| China Oilfield Services Ltd. | | 316,000 | | $ | 257,617 |
| Tenaris S.A., ADR | | 6,080 | | | 127,558 |
| | | | | |
| | | | $ | 385,175 |
| | | | | |
| Other Banks & Diversified Financials – 9.0% | | | |
| Bancolombia S.A., ADR | | 4,620 | | $ | 107,877 |
| Bank Polska Kasa Opieki S.A. | | 5,570 | | | 238,353 |
| Bank Rakyat Indonesia | | 480,000 | | | 212,168 |
| China Construction Bank | | 1,386,000 | | | 766,995 |
| China Merchants Bank Co. Ltd. | | 135,500 | | | 254,033 |
| Credicorp Ltd. | | 2,730 | | | 136,391 |
| CSU Cardsystem S.A. (a) | | 118,720 | | | 117,091 |
| Grupo Financiero Banorte S.A. de C.V. | | 96,400 | | | 173,191 |
| Komercni Banka A.S. | | 1,417 | | | 217,918 |
| Powszechna Kasa Oszczednosci Bank Polski S.A. | | 25,890 | | | 310,191 |
| PT Bank Central Asia Tbk. | | 985,000 | | | 298,038 |
| Public Bank Berhad | | 93,000 | | | 235,885 |
| Redecard S.A. | | 18,700 | | | 208,503 |
| Siam Commercial Bank Co. Ltd. | | 171,500 | | | 241,619 |
| Turkiye Garanti Bankasi A.S. (a) | | 183,466 | | | 313,269 |
| | | | | |
| | | | $ | 3,831,522 |
| | | | | |
| Pharmaceuticals – 4.7% | | | | | |
| Genomma Lab Internacional S.A., “B” (a) | | 304,800 | | $ | 213,273 |
| Ranbaxy Laboratories Ltd. | | 40,610 | | | 211,657 |
| Teva Pharmaceutical Industries Ltd., ADR | | 37,770 | | | 1,607,869 |
| | | | | |
| | | | $ | 2,032,799 |
| | | | | |
| Precious Metals & Minerals – 0.8% | | | |
| Impala Platinum Holdings Ltd. | | 24,144 | | $ | 356,239 |
| | | | | |
| | | | | |
| Issuer | | Shares/Par | | Value ($) |
| | | | | |
| COMMON STOCKS – continued | | | | | |
| Real Estate – 0.7% | | | |
| Ayala Land, Inc. | | 1,691,900 | | $ | 233,961 |
| Brasil Brokers Participacoes (a) | | 66,500 | | | 48,003 |
| | | | | |
| | | | $ | 281,964 |
| | | | | |
| Specialty Chemicals – 2.0% | | | |
| Asiatic Development Berhad | | 176,400 | | $ | 181,718 |
| Chaoda Modern Agriculture Holdings Ltd. | | 463,520 | | | 298,390 |
| LG Chemical Ltd. (a) | | 6,540 | | | 376,068 |
| | | | | |
| | | | $ | 856,176 |
| | | | | |
| Specialty Stores – 2.4% | | | |
| Dufry South America Ltd., BDR | | 18,750 | | $ | 133,680 |
| Foschini Ltd. | | 63,570 | | | 331,680 |
| Lewis Group Ltd. | | 61,486 | | | 321,170 |
| Truworths International Ltd. | | 66,840 | | | 248,168 |
| | | | | |
| | | | $ | 1,034,698 |
| | | | | |
| Telecommunications – Wireless – 13.7% | | | |
| America Movil S.A.B. de C.V., “L”, ADR | | 26,850 | | $ | 832,082 |
| China Mobile Ltd. | | 178,500 | | | 1,809,777 |
| China Mobile Ltd., ADR | | 15,900 | | | 808,515 |
| Egyptian Co. for Mobil Services (MobiNil) | | 12,427 | | | 331,146 |
| Globe Telecom, Inc. | | 12,390 | | | 201,299 |
| Mobile TeleSystems OJSC, ADR | | 13,112 | | | 349,828 |
| MTN Group Ltd. | | 76,450 | | | 904,545 |
| Philippine Long Distance Telephone Co. | | 4,780 | | | 219,585 |
| Turkcell Iletisim Hizmetleri A.S., ADR | | 16,580 | | | 241,736 |
| Vimpel-Communications, ADR | | 21,420 | | | 153,367 |
| | | | | |
| | | | $ | 5,851,880 |
| | | | | |
| Telephone Services – 5.0% | | | |
| AS Eesti Telekom, GDR | | 13,420 | | $ | 238,404 |
| Bezeq-The Israel Telecommunication Corp. Ltd. | | 136,980 | | | 224,855 |
| China Unicom Ltd., ADR | | 20,260 | | | 247,172 |
| Chunghwa Telecom Co. Ltd. | | 338,648 | | | 540,358 |
| Magyar Telekom Telecommunications PLC, ADR | | 14,220 | | | 199,649 |
| PT Telekomunikasi Indonesia Tbk. | | 669,000 | | | 435,125 |
| Telkom S.A. Ltd. | | 19,800 | | | 247,455 |
| | | | | |
| | | | $ | 2,133,018 |
| | | | | |
| Tobacco – 1.1% | | | |
| KT&G Corp. (a) | | 4,691 | | $ | 293,322 |
| PT Hanjaya Mandala Sampoerna Tbk. | | 259,000 | | | 194,207 |
| | | | | |
| | | | $ | 487,529 |
| | | | | |
| Utilities – Electric Power – 4.5% | | | |
| AES Tiete S.A., IPS | | 14,000 | | $ | 90,774 |
| CEZ AS | | 15,627 | | | 635,041 |
| Eletropaulo Metropolitana S.A., IPS | | 35,620 | | | 399,487 |
| Equatorial Energia S.A. | | 16,200 | | | 70,809 |
| Manila Water Co., Inc. | | 2,550,000 | | | 731,925 |
| | | | | |
| | | | $ | 1,928,036 |
| | | | | |
Total Common Stocks (Identified Cost, $57,751,042) | | $ | 41,973,993 |
| | | |
8
Portfolio of Investments – continued
| | | | | | | |
| Issuer | | Shares/Par | | Value ($) | |
| | | | | | | |
| |
| REPURCHASE AGREEMENTS – 2.7% | | | | |
| Goldman Sachs, 0.01%, dated 12/31/08, due 1/02/09, total to be received $1,166,001 (secured by U.S. Treasury and Federal Agency obligations and Mortgage Backed securities in a jointly traded account), at Cost | | $ | 1,166,000 | | $ | 1,166,000 | |
| | | | | | | |
|
| COLLATERAL FOR SECURITIES LOANED – 0.0% | |
| Navigator Securities Lending Prime Portfolio, at Cost and Net Asset Value | | | 11,815 | | $ | 11,815 | |
| | | | | | | |
Total Investments (Identified Cost, $58,928,857) | | | | | $ | 43,151,808 | |
| | | | | | | |
OTHER ASSETS, LESS LIABILITIES – (0.9)% | | | | | | (399,196 | ) |
| | | | | | | |
| Net Assets – 100.0% | | | | | $ | 42,752,612 | |
| | | | | | | |
| (a) | | Non-income producing security. |
| (l) | | All or a portion of this security is on loan. |
The following abbreviations are used in this report and are defined:
| ADR | | American Depository Receipt |
| BDR | | Brazilian Depository Receipt |
| GDR | | Global Depository Receipt |
| IEU | | International Equity Unit |
| IPS | | International Preference Stock |
See Notes to Financial Statements
9
FINANCIAL STATEMENTS | STATEMENT OF ASSETS AND LIABILITIES
This statement represents your fund’s balance sheet, which details the assets and liabilities comprising the total value of the fund.
| | | | | |
At 12/31/08 | | | | | |
Assets | | | | | |
Investments, at value, including $12,123 of securities on loan (identified cost, $58,928,857) | | $43,151,808 | | | |
Cash | | 39,405 | | | |
Foreign currency, at value (identified cost, $12,609) | | 12,529 | | | |
Receivable for investments sold | | 41,162 | | | |
Receivable for fund shares sold | | 67,892 | | | |
Interest and dividends receivable | | 130,661 | | | |
Receivable from investment adviser | | 70,937 | | | |
Other assets | | 2,850 | | | |
Total assets | | | | | $43,517,244 |
Liabilities | | | | | |
Payable for investments purchased | | $458,864 | | | |
Payable for fund shares reacquired | | 63,984 | | | |
Collateral for securities loaned, at value | | 11,815 | | | |
Payable to affiliates | | | | | |
Management fee | | 2,412 | | | |
Distribution fees | | 125 | | | |
Administrative services fee | | 78 | | | |
Payable for trustees’ compensation | | 183 | | | |
Accrued expenses and other liabilities | | 227,171 | | | |
Total liabilities | | | | | $764,632 |
Net assets | | | | | $42,752,612 |
Net assets consist of | | | | | |
Paid-in capital | | $63,298,019 | | | |
Unrealized appreciation (depreciation) on investments and translation of assets and liabilities in foreign currencies | | (15,776,365 | ) | | |
Accumulated net realized gain (loss) on investments and foreign currency transactions | | (6,099,872 | ) | | |
Undistributed net investment income | | 1,330,830 | | | |
Net assets | | | | | $42,752,612 |
Shares of beneficial interest outstanding | | | | | 4,827,846 |
Initial Class shares | | | | | |
Net assets | | $33,410,850 | | | |
Shares outstanding | | 3,761,691 | | | |
Net asset value per share | | | | | $8.88 |
Service Class shares | | | | | |
Net assets | | $9,341,762 | | | |
Shares outstanding | | 1,066,155 | | | |
Net asset value per share | | | | | $8.76 |
See Notes to Financial Statements
10
FINANCIAL STATEMENTS | STATEMENT OF OPERATIONS
This statement describes how much your fund earned in investment income and accrued in expenses. It also describes any gains and/or losses generated by fund operations.
| | | | | | |
| Year ended 12/31/08 | | | | | | |
| Net investment income | | | | | | |
Income | | | | | | |
Dividends | | $3,101,921 | | | | |
Interest | | 41,523 | | | | |
Foreign taxes withheld | | (292,584 | ) | | | |
Total investment income | | | | | $2,850,860 | |
Expenses | | | | | | |
Management fee | | $843,573 | | | | |
Distribution fees | | 42,452 | | | | |
Administrative services fee | | 22,343 | | | | |
Trustees’ compensation | | 12,479 | | | | |
Custodian fee | | 489,867 | | | | |
Shareholder communications | | 5,538 | | | | |
Auditing fees | | 87,442 | | | | |
Legal fees | | 7,128 | | | | |
Miscellaneous | | 18,682 | | | | |
Total expenses | | | | | $1,529,504 | |
Fees paid indirectly | | (1,486 | ) | | | |
Reduction of expenses by investment adviser | | (191,731 | ) | | | |
Net expenses | | | | | $1,336,287 | |
Net investment income | | | | | $1,514,573 | |
Realized and unrealized gain (loss) on investments and foreign currency transactions | | | | | | |
Realized gain (loss) (identified cost basis) | | | | | | |
Investment transactions (net of $19,259 country tax) | | $(5,930,270 | ) | | | |
Foreign currency transactions | | (141,308 | ) | | | |
Net realized gain (loss) on investments and foreign currency transactions | | | | | $(6,071,578 | ) |
Change in unrealized appreciation (depreciation) | | | | | | |
Investments (net of $243,318 decrease in deferred country tax) | | $(50,750,647 | ) | | | |
Translation of assets and liabilities in foreign currencies | | 790 | | | | |
Net unrealized gain (loss) on investments and foreign currency translation | | | | | $(50,749,857 | ) |
Net realized and unrealized gain (loss) on investments and foreign currency | | | | | $(56,821,435 | ) |
Change in net assets from operations | | | | | $(55,306,862 | ) |
See Notes to Financial Statements
11
FINANCIAL STATEMENTS | STATEMENTS OF CHANGES IN NET ASSETS
These statements describe the increases and/or decreases in net assets resulting from operations, any distributions, and any shareholder transactions.
| | | | | | |
For years ended 12/31 | | 2008 | | | 2007 | |
Change in net assets | | | | | | |
From operations | | | | | | |
Net investment income | | $1,514,573 | | | $1,331,002 | |
Net realized gain (loss) on investments and foreign currency transactions | | (6,071,578 | ) | | 24,933,539 | |
Net unrealized gain (loss) on investments and foreign currency translation | | (50,749,857 | ) | | 8,441,718 | |
Change in net assets from operations | | $(55,306,862 | ) | | $34,706,259 | |
Distributions declared to shareholders | | | | | | |
From net investment income | | | | | | |
Initial Class | | $(877,643 | ) | | $(1,854,835 | ) |
Service Class | | (184,427 | ) | | (404,084 | ) |
From net realized gain on investments | | | | | | |
Initial Class | | (19,613,637 | ) | | (17,838,286 | ) |
Service Class | | (5,344,734 | ) | | (4,249,384 | ) |
Total distributions declared to shareholders | | $(26,020,441 | ) | | $(24,346,589 | ) |
Change in net assets from fund share transactions | | $6,272,752 | | | $(1,147,671 | ) |
Total change in net assets | | $(75,054,551 | ) | | $9,211,999 | |
Net assets | | | | | | |
At beginning of period | | 117,807,163 | | | 108,595,164 | |
At end of period (including undistributed net investment income of $1,330,830 and
$1,048,919, respectively) | | $42,752,612 | | | $117,807,163 | |
See Notes to Financial Statements
12
FINANCIAL STATEMENTS | FINANCIAL HIGHLIGHTS
The financial highlights table is intended to help you understand the fund’s financial performance for the past 5 years. Certain information reflects financial results for a single fund share. The total returns in the table represent the rate by which an investor would have earned (or lost) on an investment in the fund share class (assuming reinvestment of all distributions) held for the entire period.
| | | | | | | | | | | | | | | |
| Initial Class | | Years ended 12/31 | |
| | | 2008 | | | 2007 | | | 2006 | | | 2005 | | | 2004 | |
Net asset value, beginning of period | | $26.15 | | | $24.52 | | | $21.84 | | | $16.16 | | | $12.85 | |
| Income (loss) from investment operations | | | | | | | | | | | | | | | |
Net investment income (d) | | $0.33 | | | $0.30 | | | $0.47 | | | $0.29 | | | $0.18 | |
Net realized and unrealized gain (loss) on investments
and foreign currency | | (11.19 | ) | | 7.13 | | | 5.92 | | | 5.59 | | | 3.27 | |
Total from investment operations | | $(10.86 | ) | | $7.43 | | | $6.39 | | | $5.88 | | | $3.45 | |
| Less distributions declared to shareholders | | | | | | | | | | | | | | | |
From net investment income | | $(0.27 | ) | | $(0.55 | ) | | $(0.25 | ) | | $(0.13 | ) | | $(0.14 | ) |
From net realized gain on investments | | (6.14 | ) | | (5.25 | ) | | (3.46 | ) | | (0.07 | ) | | — | |
Total distributions declared to shareholders | | $(6.41 | ) | | $(5.80 | ) | | $(3.71 | ) | | $(0.20 | ) | | $(0.14 | ) |
Net asset value, end of period | | $8.88 | | | $26.15 | | | $24.52 | | | $21.84 | | | $16.16 | |
Total return (%) (k)(r)(s) | | (55.11 | ) | | 35.71 | | | 30.16 | | | 36.76 | | | 27.18 | |
Ratios (%) (to average net assets)
and Supplemental data: | | | | | | | | | | | | | | | |
Expenses before expense reductions (f) | | 1.85 | | | 1.55 | | | 1.53 | | | 1.31 | | | 1.35 | |
Expenses after expense reductions (f) | | 1.61 | | | N/A | | | N/A | | | N/A | | | N/A | |
Net investment income | | 1.94 | | | 1.22 | | | 2.08 | | | 1.62 | | | 1.33 | |
Portfolio turnover | | 93 | | | 96 | | | 110 | | | 95 | | | 109 | |
Net assets at end of period (000 Omitted) | | $33,411 | | | $94,193 | | | $89,419 | | | $82,804 | | | $57,799 | |
| |
| Service Class | | Years ended 12/31 | |
| | | 2008 | | | 2007 | | | 2006 | | | 2005 | | | 2004 | |
Net asset value, beginning of period | | $25.88 | | | $24.33 | | | $21.71 | | | $16.08 | | | $12.80 | |
| Income (loss) from investment operations | | | | | | | | | | | | | | | |
Net investment income (d) | | $0.29 | | | $0.23 | | | $0.41 | | | $0.25 | | | $0.15 | |
Net realized and unrealized gain (loss) on investments
and foreign currency | | (11.06 | ) | | 7.07 | | | 5.89 | | | 5.54 | | | 3.25 | |
Total from investment operations | | $(10.77 | ) | | $7.30 | | | $6.30 | | | $5.79 | | | $3.40 | |
| Less distributions declared to shareholders | | | | | | | | | | | | | | | |
From net investment income | | $(0.21 | ) | | $(0.50 | ) | | $(0.22 | ) | | $(0.09 | ) | | $(0.12 | ) |
From net realized gain on investments | | (6.14 | ) | | (5.25 | ) | | (3.46 | ) | | (0.07 | ) | | — | |
Total distributions declared to shareholders | | $(6.35 | ) | | $(5.75 | ) | | $(3.68 | ) | | $(0.16 | ) | | $(0.12 | ) |
Net asset value, end of period | | $8.76 | | | $25.88 | | | $24.33 | | | $21.71 | | | $16.08 | |
Total return (%) (k)(r)(s) | | (55.23 | ) | | 35.38 | | | 29.90 | | | 36.36 | | | 26.96 | |
Ratios (%) (to average net assets)
and Supplemental data: | | | | | | | | | | | | | | | |
Expenses before expense reductions (f) | | 2.10 | | | 1.81 | | | 1.78 | | | 1.56 | | | 1.60 | |
Expenses after expense reductions (f) | | 1.86 | | | N/A | | �� | N/A | | | N/A | | | N/A | |
Net investment income | | 1.70 | | | 0.96 | | | 1.84 | | | 1.38 | | | 1.08 | |
Portfolio turnover | | 93 | | | 96 | | | 110 | | | 95 | | | 109 | |
Net assets at end of period (000 Omitted) | | $9,342 | | | $23,614 | | | $19,176 | | | $10,494 | | | $6,397 | |
| (d) | Per share data is based on average shares outstanding. |
| (f) | Ratios do not reflect reductions from fees paid indirectly, if applicable. |
| (k) | The total return does not reflect expenses that apply to separate accounts. Inclusion of these charges would reduce the total return figures for all periods shown. |
| (r) | Certain expenses have been reduced without which performance would have been lower. |
| (s) | From time to time the portfolio may receive proceeds from litigation settlements, without which performance would be lower. |
See Notes to Financial Statements
13
NOTES TO FINANCIAL STATEMENTS
| (1) | | Business and Organization |
MFS Emerging Markets Equity Portfolio (the fund) is a series of MFS Variable Insurance Trust II (the trust). The trust is organized as a Massachusetts business trust and is registered under the Investment Company Act of 1940, as amended, as an open-end management investment company. The shares of the fund are sold to variable accounts established by insurance companies to fund benefits under variable contracts issued by such companies, and qualified retirement and pension plans.
| (2) | | Significant Accounting Policies |
General – The preparation of financial statements in conformity with U.S. generally accepted accounting principles requires management to make estimates and assumptions that affect the reported amounts of assets and liabilities, and disclosure of contingent assets and liabilities at the date of the financial statements and the reported amounts of revenues and expenses during the reporting period. Actual results could differ from those estimates. The fund can invest in foreign securities, including securities of emerging market issuers. Investments in foreign securities are vulnerable to the effects of changes in the relative values of the local currency and the U.S. dollar and to the effects of changes in each country’s legal, political, and economic environment. The markets of emerging markets countries are generally more volatile than the markets of developed countries with more mature economies. All of the risks of investing in foreign securities previously described are heightened when investing in emerging markets countries.
In March 2008, FASB Statement No. 161, Disclosures about Derivative Instruments and Hedging Activities (the “Standard”) was issued, and is effective for financial statements issued for fiscal years and interim periods beginning after November 15, 2008. This Standard provides enhanced disclosures about the fund’s use of and accounting for derivative instruments and the effect of derivative instruments on the fund’s results of operations and financial position. Management is evaluating the application of the Standard to the fund, and has not at this time determined the impact, if any, resulting from the adoption of this Standard on the fund’s financial statements.
FASB Staff Position (FSP) 133-1 was implemented during the period. FSP 133-1 amends FAS 133 to require sellers of credit derivatives to make disclosures that will enable financial statement users to assess the potential effects of those credit derivatives on an entity’s financial position, financial performance and cash flows. There was no impact from implementing FSP 133-1 as the fund did not hold any of these credit derivatives at period end.
Investment Valuations – Equity securities, including restricted equity securities, are generally valued at the last sale or official closing price as reported by a third party pricing service on the market or exchange on which they are primarily traded. For securities for which there were no sales reported that day, equity securities are generally valued at the last quoted daily bid quotation as reported by a third party pricing service on the market or exchange on which they are primarily traded. For securities held short for which there were no sales reported for the day, the position is generally valued at the last quoted daily ask quotation as reported by a third party pricing service on the market or exchange on which such securities are primarily traded. Short-term instruments with a maturity at issuance of 60 days or less may be valued at amortized cost, which approximates market value. Open-end investment companies are generally valued at net asset value per share. Securities and other assets generally valued on the basis of information from a third party pricing service may also be valued at a broker-dealer bid quotation. Values obtained from pricing services can utilize both dealer-supplied valuations and electronic data processing techniques, which take into account factors such as institutional-size trading in similar groups of securities, yield, quality, coupon rate, maturity, type of issue, trading characteristics, and other market data. The values of foreign securities and other assets and liabilities expressed in foreign currencies are converted to U.S. dollars using the mean of bid and asked prices for rates reported by a third party pricing service.
The Board of Trustees has delegated primary responsibility for determining or causing to be determined the value of the fund’s investments (including any fair valuation) to the adviser pursuant to valuation policies and procedures approved by the Board. If the adviser determines that reliable market quotations are not readily available, investments are valued at fair value as determined in good faith by the adviser in accordance with such procedures under the oversight of the Board of Trustees. Under the fund’s valuation policies and procedures, market quotations are not considered to be readily available for most types of debt instruments and floating rate loans and many types of derivatives. These investments are generally valued at fair value based on information from third party pricing services. In addition, investments may be valued at fair value if the adviser determines that an investment’s value has been materially affected by events occurring after the close of the exchange or market on which the investment is principally traded (such as foreign exchange or market) and prior to the determination of the fund’s net asset value, or after the halting of trading of a specific security where trading does not resume prior to the close of the exchange or market on which the security is principally traded. Events that occur on a frequent basis after foreign markets close (such as developments in foreign markets and significant movements in the U.S. markets) and prior to the determination of the fund’s net asset value may be deemed to have a material affect on the value of securities traded in foreign markets. Accordingly, the fund’s foreign equity securities may often be valued at fair value. The adviser may rely on third party
14
Notes to Financial Statements – continued
pricing services or other information (such as the correlation with price movements of similar securities in the same or other markets; the type, cost and investment characteristics of the security; the business and financial condition of the issuer; and trading and other market data) to assist in determining whether to fair value and at what value to fair value an investment. The value of an investment for purposes of calculating the fund’s net asset value can differ depending on the source and method used to determine value. When fair valuation is used, the value of investments used to determine the fund’s net asset value may differ from quoted or published prices for the same investments.
The fund adopted FASB Statement No. 157, Fair Value Measurements (the “Statement”). This Statement provides a single definition of fair value, a hierarchy for measuring fair value and expanded disclosures about fair value measurements.
Various inputs are used in determining the value of the fund’s assets or liabilities carried at market value. These inputs are categorized into three broad levels. Level 1 includes quoted prices in active markets for identical assets or liabilities. Level 2 includes other significant observable market-based inputs (including quoted prices for similar securities, interest rates, prepayment speed, and credit risk). Level 3 includes unobservable inputs, which may include the adviser’s own assumptions in determining the fair value of investments. Other financial instruments are derivative instruments not reflected in total investments, such as futures, forwards, swap contracts and written options. The following is a summary of the levels used as of December 31, 2008 in valuing the fund’s assets or liabilities carried at market value:
| | | | | | | | |
| | | Level 1 | | Level 2 | | Level 3 | | Total |
| Investments in Securities | | $17,373,886 | | $25,777,922 | | $— | | $43,151,808 |
| Other Financial Instruments | | $— | | $— | | $— | | $— |
Repurchase Agreements – The fund may enter into repurchase agreements with approved counterparties. Each repurchase agreement is recorded at cost. The fund requires that the securities collateral in a repurchase transaction be transferred to a custodian. The fund monitors, on a daily basis, the value of the collateral to ensure that its value, including accrued interest, is greater than amounts owed to the fund under each such repurchase agreement. The fund and other funds managed by Massachusetts Financial Services Company (MFS), may utilize a joint trading account for the purpose of entering into one or more repurchase agreements.
Foreign Currency Translation – Purchases and sales of foreign investments, income, and expenses are converted into U.S. dollars based upon currency exchange rates prevailing on the respective dates of such transactions or on the reporting date for foreign denominated receivables and payables. Gains and losses attributable to foreign currency exchange rates on sales of securities are recorded for financial statement purposes as net realized gains and losses on investments. Gains and losses attributable to foreign exchange rate movements on receivables, payables, income and expenses are recorded for financial statement purposes as foreign currency transaction gains and losses. That portion of both realized and unrealized gains and losses on investments that results from fluctuations in foreign currency exchange rates is not separately disclosed.
Security Loans – State Street Bank and Trust Company (“State Street”), as lending agent, may loan the securities of the fund to certain qualified institutions (the “Borrowers”) approved by the fund. The loans are collateralized by cash and/or U.S. Treasury and federal agency obligations in an amount typically at least equal to the market value of the securities loaned. State Street provides the fund with indemnification against Borrower default. The fund bears the risk of loss with respect to the investment of cash collateral. On loans collateralized by cash, the cash collateral is invested in a money market fund or short-term securities. A portion of the income generated upon investment of the collateral is remitted to the Borrowers, and the remainder is allocated between the fund and the lending agent. On loans collateralized by U.S. Treasury and/or federal agency obligations, a fee is received from the Borrower, and is allocated between the fund and the lending agent. Income from securities lending is included in interest income on the Statement of Operations. The dividend and interest income earned on the securities loaned is accounted for in the same manner as other dividend and interest income.
Indemnifications – Under the fund’s organizational documents, its officers and trustees may be indemnified against certain liabilities and expenses arising out of the performance of their duties to the fund. Additionally, in the normal course of business, the fund enters into agreements with service providers that may contain indemnification clauses. The fund’s maximum exposure under these agreements is unknown as this would involve future claims that may be made against the fund that have not yet occurred.
Investment Transactions and Income – Investment transactions are recorded on the trade date. Interest income is recorded on the accrual basis. All premium and discount is amortized or accreted for financial statement purposes in accordance with U.S. generally accepted accounting principles. Dividends received in cash are recorded on the ex-dividend date. Certain dividends from foreign securities will be recorded when the fund is informed of the dividend if such information is obtained subsequent to the ex-dividend date. Dividend and interest payments received in additional securities are recorded on the ex-dividend or ex-interest date in an amount equal to the value of the security on such date.
15
Notes to Financial Statements – continued
The fund may receive proceeds from litigation settlements. Any proceeds received from litigation involving portfolio holdings are reflected in the Statement of Operations in realized gain/loss if the security has been disposed of by the fund or in unrealized gain/loss if the security is still held by the fund. Any other proceeds from litigation not related to portfolio holdings are reflected as other income in the Statement of Operations.
Fees Paid Indirectly – The fund’s custody fee may be reduced according to an arrangement that measures the value of cash deposited with the custodian by the fund. This amount, for the year ended December 31, 2008, is shown as a reduction of total expenses on the Statement of Operations.
Tax Matters and Distributions – The fund intends to qualify as a regulated investment company, as defined under Subchapter M of the Internal Revenue Code, and to distribute all of its taxable income, including realized capital gains. As a result, no provision for federal income taxes is required. Each of the fund’s federal tax returns for the prior three fiscal years remains subject to examination by the Internal Revenue Service. Foreign taxes, if any, have been accrued by the fund in the accompanying financial statements.
Distributions to shareholders are recorded on the ex-dividend date. Income and capital gain distributions are determined in accordance with income tax regulations, which may differ from U.S. generally accepted accounting principles. Certain capital accounts in the financial statements are periodically adjusted for permanent differences in order to reflect their tax character. These adjustments have no impact on net assets or net asset value per share. Temporary differences which arise from recognizing certain items of income, expense, gain or loss in different periods for financial statement and tax purposes will reverse at some time in the future. Distributions in excess of net investment income or net realized gains are temporary overdistributions for financial statement purposes resulting from differences in the recognition or classification of income or distributions for financial statement and tax purposes.
Book/tax differences primarily relate to wash sale loss deferrals, foreign currency transactions, and foreign taxes.
The tax character of distributions declared to shareholders for the last two fiscal years is as follows:
| | | | |
| | | 12/31/08 | | 12/31/07 |
| Ordinary income (including any short-term capital gains) | | $6,958,086 | | $5,681,971 |
| Long-term capital gain | | 19,062,355 | | 18,664,618 |
| Total distributions | | $26,020,441 | | $24,346,589 |
The federal tax cost and the tax basis components of distributable earnings were as follows:
| | | |
| As of 12/31/08 | | | |
| Cost of investments | | $59,798,500 | |
| Gross appreciation | | 3,498,307 | |
| Gross depreciation | | (20,144,999 | ) |
| Net unrealized appreciation (depreciation) | | $(16,646,692 | ) |
| Undistributed ordinary income | | 1,342,832 | |
| Capital loss carryforwards | | (5,228,580 | ) |
| Other temporary differences | | (12,967 | ) |
As of December 31, 2008, the fund had capital loss carryforwards available to offset future realized gains. Such losses expire as follows:
Multiple Classes of Shares of Beneficial Interest – The fund offers multiple classes of shares, which differ in their respective distribution fees. The fund’s income, realized and unrealized gain (loss), and common expenses are allocated to shareholders based on the daily net assets of each class. Dividends are declared separately for each class. Differences in per share dividend rates are generally due to differences in separate class expenses.
| (3) | | Transactions with Affiliates |
Investment Adviser – The fund has an investment advisory agreement with MFS to provide overall investment management and related administrative services and facilities to the fund.
The management fee is computed daily and paid monthly at the following annual rates:
| | |
| First $500 million of average daily net assets | | 1.05% |
| Average daily net assets in excess of $500 million | | 1.00% |
The management fee incurred for the year ended December 31, 2008 was equivalent to an annual effective rate of 1.05% of the fund’s average daily net assets.
16
Notes to Financial Statements – continued
Effective September 1, 2008, the investment adviser has agreed in writing to pay a portion of the fund’s total annual operating expenses, exclusive of interest, taxes, extraordinary expenses, brokerage and transaction costs, and investment-related expenses, such that total annual operating expenses do not exceed 1.40% annually of average daily net assets for the Initial Class shares and 1.65% annually of average daily net assets for the Service Class shares. This written agreement will continue until April 30, 2010. For the year ended December 31, 2008, this reduction amounted to $191,731 and is reflected as a reduction of total expenses in the Statement of Operations.
Distributor – MFS Fund Distributors, Inc. (MFD), a wholly-owned subsidiary of MFS, is the distributor of shares of the fund. The Trustees have adopted a distribution plan for the Service Class shares pursuant to Rule 12b-1 under the Investment Company Act of 1940.
The fund’s distribution plan provides that the fund will pay MFD distribution fees equal to 0.25% per annum of its average daily net assets attributable to Service Class shares as partial consideration for services performed and expenses incurred by MFD and financial intermediaries in connection with the sale and distribution of the fund’s Service Class shares and the sale and distribution of the variable annuity or variable life insurance contracts investing indirectly in Service Class shares. MFD may subsequently pay all, or a portion, of the distribution fees to financial intermediaries.
Shareholder Servicing Agent – MFS Service Center, Inc. (MFSC), a wholly-owned subsidiary of MFS, has contracted to provide transfer agent and recordkeeping functions in connection with the issuance, transfer, and redemption of each class of shares of the fund under a Shareholder Servicing Agent Agreement. During the year ended December 31, 2008, the fund did not pay MFSC a fee for this service.
Administrator – MFS provides certain financial, legal, shareholder communications, compliance, and other administrative services to the fund. Under an administrative services agreement, the fund partially reimburses MFS the costs incurred to provide these services. The fund is charged an annual fixed amount of $10,000 plus a fee based on average daily net assets.
The administrative services fee incurred for the year ended December 31, 2008 was equivalent to an annual effective rate of 0.0278% of the fund’s average daily net assets.
Trustees’ and Officers’ Compensation – The fund pays compensation to trustees in the form of a retainer, attendance fees, and additional compensation to the Board chairperson. The fund does not pay compensation directly to officers of the fund who are also officers of the investment adviser, all of whom receive remuneration for their services to the fund from MFS. Certain officers of the fund are officers or directors of MFS, MFD, and MFSC.
Other – This fund and certain other MFS funds (the funds) have entered into services agreements (the Agreements) which provide for payment of fees by the funds to Tarantino LLC and Griffin Compliance LLC in return for the provision of services of an Independent Chief Compliance Officer (ICCO) and Assistant ICCO, respectively, for the funds. The ICCO and Assistant ICCO are officers of the funds and the sole members of Tarantino LLC and Griffin Compliance LLC, respectively. The funds can terminate the Agreements with Tarantino LLC and Griffin Compliance LLC at any time under the terms of the Agreements. MFS has agreed to bear all expenses associated with office space, other administrative support, and supplies provided to the ICCO and Assistant ICCO. For the year ended December 31, 2008, the aggregate fees paid by the fund to Tarantino LLC and Griffin Compliance LLC were $698 and are included in miscellaneous expense on the Statement of Operations.
Purchases and sales of investments, other than U.S. Government securities, purchased option transactions, and short-term obligations, aggregated $75,515,643 and $94,306,310, respectively.
17
Notes to Financial Statements – continued
| (5) | | Shares of Beneficial Interest |
The fund’s Declaration of Trust permits the Trustees to issue an unlimited number of full and fractional shares of beneficial interest. Transactions in fund shares were as follows:
| | | | | | | | | | | | |
| | | Year ended 12/31/08 | | | Year ended 12/31/07 | |
| | | Shares | | | Amount | | | Shares | | | Amount | |
| Shares sold | | | | | | | | | | | | |
Initial Class | | 562,118 | | | $6,921,859 | | | 160,162 | | | $3,974,259 | |
Service Class | | 351,480 | | | 4,985,217 | | | 152,282 | | | 3,659,943 | |
| | 913,598 | | | $11,907,076 | | | 312,444 | | | $7,634,202 | |
| Shares issued to shareholders in reinvestment of distributions | | | | | | | | | | | | |
Initial Class | | 1,029,195 | | | $20,491,280 | | | 926,735 | | | $19,693,121 | |
Service Class | | 281,096 | | | 5,529,161 | | | 220,962 | | | 4,653,468 | |
| | 1,310,291 | | | $26,020,441 | | | 1,147,697 | | | $24,346,589 | |
| Shares reacquired | | | | | | | | | | | | |
Initial Class | | (1,431,692 | ) | | $(24,195,564 | ) | | (1,130,873 | ) | | $(27,255,257 | ) |
Service Class | | (478,998 | ) | | (7,459,201 | ) | | (248,851 | ) | | (5,873,205 | ) |
| | (1,910,690 | ) | | $(31,654,765 | ) | | (1,379,724 | ) | | $(33,128,462 | ) |
| Net change | | | | | | | | | | | | |
Initial Class | | 159,621 | | | $3,217,575 | | | (43,976 | ) | | $(3,587,877 | ) |
Service Class | | 153,578 | | | 3,055,177 | | | 124,393 | | | 2,440,206 | |
| | 313,199 | | | $6,272,752 | | | 80,417 | | | $(1,147,671 | ) |
The fund and other funds managed by MFS participate in a $1 billion unsecured committed line of credit provided by a syndication of banks under a credit agreement. In addition, the fund and other funds managed by MFS have established uncommitted borrowing arrangements with certain banks. Borrowings may be made for temporary financing needs. Interest is charged to each fund, based on its borrowings, generally at a rate equal to the Federal Reserve funds rate plus 0.30%. In addition, a commitment fee, based on the average daily, unused portion of the committed line of credit, is allocated among the participating funds at the end of each calendar quarter. For the year ended December 31, 2008, the fund’s commitment fee and interest expense were $422 and $0, respectively, and are included in miscellaneous expense on the Statement of Operations.
18
REPORT OF INDEPENDENT REGISTERED PUBLIC ACCOUNTING FIRM
To the Board of Trustees of MFS Variable Insurance Trust II and the Shareholders of
MFS Emerging Markets Equity Portfolio:
We have audited the accompanying statement of assets and liabilities, including the portfolio of investments, of MFS Emerging Markets Equity Portfolio (the “Fund”) (one of the portfolios comprising MFS Variable Insurance Trust II) as of December 31, 2008, and the related statement of operations for the year then ended, the statements of changes in net assets for each of the two years in the period then ended, and the financial highlights for each of the five years in the period then ended. These financial statements and financial highlights are the responsibility of the Fund’s management. Our responsibility is to express an opinion on these financial statements and financial highlights based on our audits.
We conducted our audits in accordance with the standards of the Public Company Accounting Oversight Board (United States). Those standards require that we plan and perform the audit to obtain reasonable assurance about whether the financial statements and financial highlights are free of material misstatement. The Fund is not required to have, nor were we engaged to perform, an audit of its internal control over financial reporting. Our audits included consideration of internal control over financial reporting as a basis for designing audit procedures that are appropriate in the circumstances, but not for the purpose of expressing an opinion on the effectiveness of the Fund’s internal control over financial reporting. Accordingly, we express no such opinion. An audit also includes examining, on a test basis, evidence supporting the amounts and disclosures in the financial statements, assessing the accounting principles used and significant estimates made by management, as well as evaluating the overall financial statement presentation. Our procedures included confirmation of securities owned as of December 31, 2008, by correspondence with the custodian and brokers; where replies were not received from brokers, we performed other auditing procedures. We believe that our audits provide a reasonable basis for our opinion.
In our opinion, the financial statements and financial highlights referred to above present fairly, in all material respects, the financial position of MFS Emerging Markets Equity Portfolio as of December 31, 2008, the results of its operations for the year then ended, the changes in its net assets for each of the two years in the period then ended, and the financial highlights for each of the five years in the period then ended, in conformity with accounting principles generally accepted in the United States of America.
DELOITTE & TOUCHE LLP
Boston, Massachusetts
February 17, 2009
19
TRUSTEES AND OFFICERS – IDENTIFICATION AND BACKGROUND
The Trustees and officers of the Trust, as of February 1, 2009, are listed below, together with their principal occupations during the past five years. (Their titles may have varied during that period.) The address of each Trustee and officer is 500 Boylston Street, Boston, Massachusetts 02116.
| | | | | | |
Name, Date of Birth | | Position(s) Held
with Fund | | Trustee/Officer
Since (1) | | Principal Occupations During the Past Five Years and
Other Directorships (2) |
| INTERESTED TRUSTEE | | | | |
David D. Horn (3) (born 6/07/41) | | Trustee | | April 1986 | | Private investor; Sun Life Assurance Company of Canada, Senior Vice President and General Manager for the United States (until 1997); Director (until March 2004) |
| | |
| INDEPENDENT TRUSTEES | | | | |
J. Kermit Birchfield (born 1/08/40) | | Chairman | | May 1997 | | Consultant; Century Partners, Inc. (investments), Director; Displaytech, Inc. (technology), Director; Dessin Fournir LLC (furniture manufacturer), Director (2005 to present); Intermountain Gas Company, Inc. & Intermountain Industries, Inc. (oil & gas exploration and production), Director; Site Watch LLC (software to monitor oil tanks), Managing Director (2006 to present); Juridica Investments (fund investing in judicial matters), Director (2007 to present); HPSC, Inc. (medical financing), Director (until January 2004) |
| | | |
Robert C. Bishop (born 1/13/43) | | Trustee | | May 2001 | | AutoImmune, Inc. (pharmaceutical product development), Chairman, President and Chief Executive Officer; Caliper Life Sciences Corp. (laboratory analytical instruments), Director; Millipore Corporation (purification/filtration products), Director; Waterstreet Capital (leverage buyouts), Advisory Board (August 2006 to present); Optobionics Corporation (ophthalmic devices), Director (2002 to 2007) |
| | | |
Frederick H. Dulles (born 3/12/42) | | Trustee | | May 2001 | | Ten State International Law PLLC (law firm), Of Counsel (since 2006); Prudential Carolina Real Estate, (real estate), Broker (since 2006); Free Enterprise Foundation, Inc. (research institute), Director & Secretary (until 2008); Disher, Hamrick & Myers Residential, Inc. (real estate) Broker (2005 until 2006); Frederick H. Dulles law practice (until 2006); Ten State Street LLP (law firm), Member (until 2005) |
| | | |
Marcia A. Kean (born 6/30/48) | | Trustee | | April 2005 | | Feinstein Kean Healthcare (consulting), Chief Executive Officer |
| | | |
Ronald G. Steinhart (born 6/15/40) | | Trustee | | May 2001 | | Private investor; Penske Automotive Group (automotive retailer), Director; Animal Health International, Inc. (animal health products), Director (since 2007); Texas Industries (concrete/aggregates/cement), Director (since 2007); Penson Worldwide, Inc. (securities clearance), Director (since 2006); Carreker Corporation (technology consulting) Director (until 2005); Prentiss Properties Trust (real estate investment trust), Director (until 2006) |
| | | |
Haviland Wright (born 7/21/48) | | Trustee | | May 2001 | | Profitability of Hawaii (software), Chief Development Officer (since December 2008); Elixir Technologies Corporation (software) Director (since 2005); Nano Loa Inc. (liquid crystal displays), Director |
| | |
| TRUSTEE EMERITUS | | | | |
Samuel Adams (born 10/19/25) | | Trustee Emeritus | | | | Retired; K&L Gates LLP (law firm), Of Counsel |
| | |
| OFFICERS | | | | |
Maria F. Dwyer (4) (born 12/01/58) | | President | | November 2005 | | Massachusetts Financial Services Company, Executive Vice President and Chief Regulatory Officer (since March 2004) Chief Compliance Officer (since December 2006); Fidelity Management & Research Company, Vice President (prior to March 2004); Fidelity Group of Funds, President and Treasurer (until March 2004) |
| | | |
Christopher R. Bohane (4) (born 1/18/74) | | Assistant Secretary and Assistant Clerk | | July 2005 | | Massachusetts Financial Services Company, Vice President and Senior Counsel |
| | | |
John M. Corcoran (4) (born 4/13/65) | | Treasurer | | October 2008 | | Massachusetts Financial Services Company, Senior Vice President (since October 2008); State Street Bank and Trust (financial services provider), Senior Vice President, (until September 2008) |
| | | |
Ethan D. Corey (4) (born 11/21/63) | | Assistant Secretary and Assistant Clerk | | July 2005 | | Massachusetts Financial Services Company, Senior Vice President and Associate General Counsel (since 2004); Dechert LLP (law firm), Counsel (prior to December 2004) |
| | | |
David L. DiLorenzo (4) (born 8/10/68) | | Assistant Treasurer | | July 2005 | | Massachusetts Financial Services Company, Vice President (since June 2005); JP Morgan Investor Services, Vice President (until June 2005) |
| | | |
Timothy M. Fagan (4) (born 7/10/68) | | Assistant Secretary and Assistant Clerk | | September 2005 | | Massachusetts Financial Services Company, Vice President and Senior Counsel (since September 2005); John Hancock Advisers, LLC, Vice President, Senior Attorney and Chief Compliance Officer (until August 2005) |
20
Trustees and Officers – continued
| | | | | | |
Name, Date of Birth | | Position(s) Held
with Fund | | Trustee/Officer
Since (1) | | Principal Occupations During the Past Five Years and
Other Directorships (2) |
Mark D. Fischer (4) (born 10/27/70) | | Assistant Treasurer | | July 2005 | | Massachusetts Financial Services Company, Vice President (since May 2005); JP Morgan Investment Management Company, Vice President (until May 2005) |
| | | |
Robyn L. Griffin (born 7/04/75) | | Assistant Independent Chief Compliance Officer | | August 2008 | | Griffin Compliance LLC (provider of compliance services), Principal (since August 2008); State Street Corporation (financial services provider), Mutual Fund Administration Assistant Vice President (October 2006 – July 2008); Liberty Mutual Group (insurance), Personal Market Assistant Controller (April 2006 – October 2006); Deloitte & Touche LLP (professional services firm), Senior Manager (prior to April 2006) |
| | | |
Brian E. Langenfeld (4) (born 3/07/73) | | Assistant Secretary and Assistant Clerk | | May 2006 | | Massachusetts Financial Services Company, Vice President and Senior Counsel (since May 2006); John Hancock Advisers, LLC, Assistant Vice President and Counsel (until April 2006) |
| | | |
Ellen Moynihan (4) (born 11/13/57) | | Assistant Treasurer | | May 1997 | | Massachusetts Financial Services Company, Senior Vice President |
| | | |
Susan S. Newton (4) (born 3/07/50) | | Assistant Secretary and Assistant Clerk | | May 2005 | | Massachusetts Financial Services Company, Senior Vice President and Associate General Counsel (since April 2005); John Hancock Advisers, LLC, Senior Vice President, Secretary and Chief Legal Officer (until April 2005) |
| | | |
Susan A. Pereira (4) (born 11/05/70) | | Assistant Secretary and Assistant Clerk | | July 2005 | | Massachusetts Financial Services Company, Vice President and Senior Counsel (since June 2004); Bingham McCutchen LLP (law firm), Associate (until June 2004) |
| | | |
Mark N. Polebaum (4) (born 5/01/52) | | Secretary and Clerk | | February 2006 | | Massachusetts Financial Services Company, Executive Vice President, General Counsel and Secretary (since January 2006); Wilmer Cutler Pickering Hale and Dorr LLP (law firm), Partner (until January 2006) |
| | | |
Frank L. Tarantino (born 3/07/44) | | Independent Chief Compliance Officer | | September 2004 | | Tarantino LLC (provider of compliance services), Principal (since June 2004); CRA Business Strategies Group (consulting services), Executive Vice President (until June 2004) |
| | | |
Richard S. Weitzel (4) (born 7/16/70) | | Assistant Secretary and Assistant Clerk | | October 2007 | | Massachusetts Financial Services Company, Vice President and Assistant General Counsel (since 2004); Massachusetts Department of Business and Technology, General Counsel (until April 2004) |
| | | |
James O. Yost (4) (born 6/12/60) | | Assistant Treasurer | | April 1992 | | Massachusetts Financial Services Company, Senior Vice President |
| (1) | Date first appointed to serve as Trustee/Officer of an MFS fund or a Compass variable account. Each Trustee has served continuously since appointment. |
| (2) | Directorships or trusteeships of companies required to report to the Securities and Exchange Commission (i.e., “public companies”). |
| (3) | “Interested person” of the Trust, within the meaning of the Investment Company Act of 1940 (referred to as the 1940 Act), which is the principal federal law governing investment companies like the Trust, as a result of position with Sun Life of Canada (U.S.). The address of Sun Life of Canada (U.S.) is One Sun Life Executive Park, Wellesley Hills, Massachusetts 02481. |
| (4) | “Interested person” of MFS within the meaning of the 1940 Act. The address of MFS is 500 Boylston Street, Boston, Massachusetts 02116. |
The Trust does not hold annual meetings for the purpose of electing Trustees, and Trustees are not elected for fixed terms. Each Trustee and officer holds office until his or her successor is chosen and qualified, or until his or her earlier death, resignation, retirement or removal.
All Trustees currently serve as Trustees of the Trust and have served in that capacity since originally elected or appointed. All of the Trustees are also Managers of the Compass Variable Accounts. The executive officers of the Trust hold similar offices for the Compass Variable Accounts and other funds in the MFS fund complex. As of January 1, 2009, each Trustee serves as a Trustee or Manager of 35 Accounts/Funds.
The Statement of Additional Information contains further information about the Trustees and is available without charge upon request by calling 1-800-752-7215.
| | |
Investment Adviser
Massachusetts Financial Services Company 500 Boylston Street, Boston, MA 02116-3741 | | Custodian State Street Bank and Trust 1 Lincoln Street, Boston, MA 02111-2900 |
Distributor
MFS Fund Distributors, Inc. 500 Boylston Street, Boston, MA 02116-3741 | | Independent Registered Public Accounting Firm Deloitte & Touche LLP 200 Berkeley Street, Boston, MA 02116 |
Portfolio Managers Jose Luis Garcia Nicholas Smithie | | |
21
BOARD REVIEW OF INVESTMENT ADVISORY AGREEMENT
The Investment Company Act of 1940 requires that both the full Board of Trustees and a majority of the non-interested (“independent”) Trustees, voting separately, annually approve the continuation of the investment advisory agreement between MFS Variable Insurance Trust II (the “Trust”) and Massachusetts Financial Services Company (“MFS”) on behalf of the Fund. The Trustees consider matters bearing on the Fund and the advisory arrangements at their meetings throughout the year, including a review of performance data at each regular meeting. In addition, the independent Trustees met in May and again in July 2008 (“contract review meetings”) for the specific purpose of considering whether to approve the continuation of the investment advisory agreement for the Fund. The independent Trustees were assisted in their evaluation of the investment advisory agreement by independent legal counsel, from whom they received separate legal advice and with whom they met separately from MFS management during various contract review meetings. The independent Trustees were also assisted in this process by the Fund’s Independent Chief Compliance Officer, a full-time senior officer appointed by and reporting to the independent Trustees.
In connection with their deliberations, the Trustees, including the independent Trustees, considered such information and factors as they believed, in light of the legal advice furnished to them and their own business judgment, to be relevant. The investment advisory agreement was considered separately for the Fund, although the Trustees also took into account the common interests of all Funds in the Trust in their review. As described below, the Trustees considered the nature, quality, and extent of the various investment advisory, administrative, and shareholder services performed by MFS under the existing investment advisory agreement and other arrangements with the Trust.
In connection with their contract review meetings, the Trustees received and relied upon materials which included, among other items: (i) information provided by Lipper Inc. on the investment performance of the Fund for various time periods ended December 31, 2007, compared to the investment performance of a group of funds with substantially similar investment classifications/objectives (the “Lipper performance universe”), (ii) information provided by Lipper Inc. on the Fund’s advisory fees and other expenses compared to the advisory fees and other expenses of comparable funds identified by Lipper (the “Lipper expense group”), (iii) information provided by MFS on the advisory fees of comparable portfolios of its other clients, including institutional separate account and other clients, (iv) information as to whether expense waivers, reimbursements or fee “breakpoints” are observed for the Fund, (v) information regarding MFS’ financial results and financial condition, including MFS’ and certain of its affiliates’ estimated profitability from services performed for the Fund, (vi) MFS’ views regarding the outlook for the mutual fund industry and its strategic business plans, (vii) descriptions of various functions performed by MFS for the Trust, such as compliance monitoring and portfolio trading practices, and (viii) information regarding the overall organization of MFS, including information about MFS’ senior management and other personnel providing investment advisory, administrative and other services to the Fund. The comparative performance, fee and expense information prepared and provided by Lipper Inc. was not independently verified, and the independent Trustees did not independently verify any information provided to them by MFS.
The Trustees’ conclusion as to the continuation of the investment advisory agreement was based on comprehensive consideration of all information provided to the Trustees and not the result of any single factor. Some of the factors that figured particularly in the Trustees’ deliberations are described below for the Fund, while individual Trustees may have given different weight to various factors and evaluated the information presented as a whole differently than another Trustee. The Trustees recognized that the fee arrangements for the Fund reflect years of review and discussion between the independent Trustees and MFS, that certain aspects of such arrangements may receive greater scrutiny in some years than others, and that the Trustees’ conclusions may be based, in part, on their consideration of these same arrangements during the course of the year and in prior years.
Based on information provided by Lipper Inc., the Trustees compared the Fund’s total return investment performance to the performance of a peer group of funds over various time periods. The Trustees placed particular emphasis on the total return performance of the Fund’s Initial Class shares in comparison to the performance of funds in its Lipper performance universe over the one-, three- and five-year periods. The Trustees did not rely on performance results for more recent periods, including those shown elsewhere in this report.
The Trustees noted the performance of the Fund’s Initial Class shares was in the 4th quintile relative to the other funds in the Lipper Classification Index for the one-year period (the 1st quintile being the best performers and the 5th quintile being the worst performers). The total return performance of the Fund was also in the 4th quintile for the three-year period and the five-year period ended December 31, 2007, relative to the Lipper performance universe. Based on the nature and quality of services provided by MFS, the Board of Trustees concluded that the Fund’s performance was adequate.
In the course of their deliberations, the Trustees took into account information provided by MFS during contract review meetings, as well as during investment review meetings conducted with portfolio management personnel during the course of the year.
22
Board Review of Investment Advisory Agreement – continued
In assessing the reasonableness of the Fund’s advisory fee, the Trustees considered, among other information, the Fund’s advisory fee and the total expense ratio of the Fund’s Initial Class shares as a percentage of average daily net assets, compared to the advisory fee and total expense ratios of its peer group of funds based on information provided by Lipper Inc. The Trustees also considered the advisory fees charged by MFS to institutional accounts. In comparing these fees, the Trustees considered the generally broader scope of services provided by MFS to the Trust than those provided to institutional accounts. The Trustees also considered the higher demands placed on MFS’ investment personnel and trading infrastructure as a result of the daily cash in-flows and out-flows of the Fund, and the impact on MFS and related expenses due to the more extensive regulatory regime to which the Fund is subject, compared to institutional accounts.
In considering the fees, the Trustees noted from the Lipper data that the Fund’s effective advisory fee rate was at the median and total expense ratio was above the median of such fees and expenses of funds in the Lipper expense group. In addition, the Trustees accepted MFS’ offer to observe an expense limitation for the Fund. The Trustees further concluded that the existing breakpoint was sufficient to allow the Fund to benefit from economies of scale as its assets grow. The Trustees concluded that the fees were reasonable in light of the nature and quality of services provided.
The Trustees also considered information prepared by MFS relating to its costs and profits with respect to the Fund and other investment companies and accounts advised by MFS, as well as MFS’ methodologies used to determine and allocate its costs to the Fund and other accounts and products for purposes of estimating profitability.
After reviewing these and other factors described below, the Trustees concluded that the advisory fees charged to the Fund represent reasonable compensation in light of the nature and quality of the services being provided by MFS.
In addition, the Trustees considered MFS’ resources and related efforts to continue to retain, attract and motivate capable personnel to serve the Fund. The Trustees also considered the financial resources of MFS and its parent, Sun Life Financial Inc. The Trustees further considered any advantages and possible disadvantages of having an adviser which also serves other investment companies as well as institutional accounts.
The Trustees also considered the nature, quality, cost, and extent of administrative, transfer agency, and distribution services provided to the Fund by MFS and its affiliates under agreements and plans other than the investment advisory agreement, including the 12b-1 fees the Fund pays to MFS Fund Distributors, Inc., an affiliate of MFS. The Trustees also considered the nature, extent and quality of certain other services MFS performs or arranges on the Fund’s behalf, which may include securities lending programs, directed expense payment programs, class action recovery programs, and MFS’ interaction with third-party service providers, principally custodians and sub-custodians. The Trustees concluded that the various non-advisory services provided by MFS and its affiliates on behalf of the Fund were satisfactory. The Trustees also considered the benefits to MFS from the use of the Fund’s portfolio brokerage commissions to pay for research and other similar services and various other factors. Additionally, the Trustees considered so-called “fall-out benefits” to MFS such as reputational value derived from serving as investment manager to the Trust, and determined that any such benefits derived by MFS were reasonable and fair.
Based on their evaluation of factors that they deemed to be material, including those factors described above, the Board of Trustees, including a majority of the independent Trustees, concluded that the investment advisory agreement should be continued for an additional one-year period, commencing September 1, 2008.
A discussion regarding the Board’s most recent review and renewal of the fund’s Investment Advisory Agreement with MFS is available by clicking on the fund’s name under “Variable Insurance Portfolios-VIT II” in the “Products & Performance” section on the MFS Web site (mfs.com).
23
PROXY VOTING POLICIES AND INFORMATION
A general description of the MFS funds’ proxy voting policies and procedures is available without charge, upon request, by calling
1-800-225-2606, by visiting the Proxy Voting section of mfs.com or by visiting the SEC’s Web site at http://www.sec.gov.
Information regarding how the fund voted proxies relating to portfolio securities during the most recent twelve-month period ended June 30 is available without charge by visiting the Proxy Voting section of mfs.com or by visiting the SEC’s Web site at http://www.sec.gov.
QUARTERLY PORTFOLIO DISCLOSURE
The fund will file a complete schedule of portfolio holdings with the Securities and Exchange Commission (the Commission) for the first and third quarters of each fiscal year on Form N-Q. The fund’s Form N-Q may be reviewed and copied at the:
Public Reference Room
Securities and Exchange Commission
100 F Street, NE, Room 1580
Washington, D.C. 20549
Information on the operation of the Public Reference Room may be obtained by calling the Commission at 1-800-SEC-0330. The fund’s Form N-Q is available on the EDGAR database on the Commission’s Internet Web site at http://www.sec.gov, and copies of this information may be obtained, upon payment of a duplicating fee, by electronic request at the following e-mail address: publicinfo@sec.gov or by writing the Public Reference Section at the above address.
FEDERAL TAX INFORMATION (unaudited)
The following information is provided pursuant to provisions of the Internal Revenue Code.
The fund designates $19,062,355 as capital gain dividends paid during the fiscal year.
Income derived from foreign sources was $3,036,579. The fund intends to pass through foreign tax credits of $307,301 for the fiscal year.
24
MFS® PRIVACY NOTICE
Privacy is a concern for every investor today. At MFS Investment Management® and the MFS funds, we take this concern very seriously. We want you to understand our policies about the investment products and services that we offer, and how we protect the nonpublic personal information of investors who have a direct relationship with us and our wholly owned subsidiaries.
Throughout our business relationship, you provide us with personal information. We maintain information and records about you, your investments, and the services you use. Examples of the nonpublic personal information we maintain include
| | Ÿ | | data from investment applications and other forms |
| | Ÿ | | share balances and transactional history with us, our affiliates, or others |
| | Ÿ | | facts from a consumer reporting agency |
We do not disclose any nonpublic personal information about our customers or former customers to anyone, except as permitted by law. We may share nonpublic personal information with third parties or certain of our affiliates in connection with servicing your account or processing your transactions. We may share information with companies or financial institutions that perform marketing services on our behalf or with other financial institutions with which we have joint marketing arrangements, subject to any legal requirements.
Authorization to access your nonpublic personal information is limited to appropriate personnel who provide products, services, or information to you. We maintain physical, electronic, and procedural safeguards to help protect the personal information we collect about you.
If you have any questions about the MFS privacy policy, please call 1-800-225-2606 any business day between 8 a.m. and 8 p.m. Eastern time.
Note: If you own MFS products or receive MFS services in the name of a third party such as a bank or broker-dealer, their privacy policy may apply to you instead of ours.
25


MFS® VALUE PORTFOLIO
Report is prepared for the general information of contract owners. It is authorized for distribution to prospective investors only when preceded or accompanied by a current prospectus.
NOT FDIC INSURED Ÿ MAY LOSE VALUE Ÿ NO BANK GUARANTEE Ÿ NOT A DEPOSIT Ÿ NOT INSURED BY ANY FEDERAL GOVERNMENT AGENCY OR NCUA/NCUSIF
LETTER FROM THE CEO

Dear Contract Owners:
The market downturns and economic setbacks of late probably rank among the worst financial declines most of us have experienced. Inevitably, people may be questioning their commitment to investing. Still, it is important to remember that downturns are an inescapable part of the business cycle. Such troughs have been seen before, and if we can use history as a guide, market recoveries typically have followed.
Recent events have clearly shown us the value of certain types of investments. In this environment, two of the hallmarks of mutual funds — transparency and liquidity — have become critically important. Unlike some other types of investments, the operations of mutual funds are relatively transparent to their shareholders. With their daily redemption feature, mutual funds also generally provide easy, convenient access to one’s money. Through these recent market upheavals, this level of liquidity enhanced the ability of mutual fund investors to respond and modify their investments as they and their advisors saw fit — a flexibility that those in less liquid investments simply did not have at their disposal.
At MFS® we take particular pride in how well mutual funds can serve investors because we invented the mutual fund in the United States. Established in 1924, Massachusetts Investors Trust was the nation’s first fund. Recent market events only reinforce what we have learned through 85 years — that mutual funds provide unique features that are important to investors in any type of market climate.
Respectfully,

Robert J. Manning
Chief Executive Officer and Chief Investment Officer
MFS Investment Management®
February 17, 2009
The opinions expressed in this letter are subject to change, may not be relied upon for investment advice, and no forecasts can be guaranteed.
Before investing, consider the fund’s investment objectives, risks, charges, and expenses. For a prospectus containing this and other information, contact your investment professional or view online. Read it carefully.
MFS Fund Distributors, Inc., 500 Boylston Street, Boston, MA 02116
1
PORTFOLIO COMPOSITION
Portfolio structure
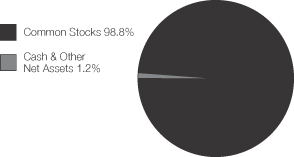
| | |
| Top ten holdings | | |
| Lockheed Martin Corp. | | 4.5% |
| Philip Morris International, Inc. | | 4.0% |
| AT&T, Inc. | | 3.7% |
| TOTAL S.A., ADR | | 3.2% |
| MetLife, Inc. | | 2.9% |
| Allstate Corp. | | 2.7% |
| Exxon Mobil Corp. | | 2.7% |
| Oracle Corp. | | 2.7% |
| Chevron Corp. | | 2.3% |
| Bank of New York Mellon Corp. | | 2.3% |
| | |
| Equity sectors | | |
| Financial Services | | 18.9% |
| Energy | | 14.9% |
| Utilities & Communications | | 11.7% |
| Consumer Staples | | 11.6% |
| Industrial Goods & Services | | 10.9% |
| Health Care | | 7.9% |
| Technology | | 7.1% |
| Leisure | | 3.9% |
| Retailing | | 3.7% |
| Basic Materials | | 3.4% |
| Special Products & Services | | 3.0% |
| Autos & Housing | | 1.5% |
| Transportation | | 0.3% |
Percentages are based on net assets as of 12/31/08.
The portfolio is actively managed and current holdings may be different.
2
MANAGEMENT REVIEW
Summary of Results
For the twelve months ended December 31, 2008, Initial Class shares of the MFS Value Portfolio (the “fund”) provided a total return of –32.64%, while Service Class shares of the fund provided a total return of –32.87%. These compare with a return of –36.85% for the fund’s benchmark, the Russell 1000 Value Index.
Market Environment
The U.S. economy and financial markets experienced significant deterioration and extraordinary volatility over the reporting period. U.S. economic growth slowed significantly, despite the short-term bounce from the second quarter fiscal stimulus. Strong domestic headwinds included accelerated deterioration in the housing market, anemic corporate investment, a rapidly declining job market, and a much tighter credit environment. During the period, a seemingly continuous series of tumultuous financial events hammered markets, including: the distressed sale of failing Bear Stearns to JPMorgan, the conservatorship of Government Sponsored Enterprises (GSEs) Fannie Mae and Freddie Mac, the bankruptcy of investment bank Lehman Brothers, the Federal Reserve Bank’s complex intervention of insurance company American International Group (AIG), the nationalization of several large European banks, the failure of Washington Mutual, and the distressed sale of Wachovia. As a result of this barrage of turbulent news, global equity markets pushed significantly lower and credit markets witnessed the worst dislocation since the beginning of the credit crisis. Though conditions improved towards the end of the period, the state of financial and macroeconomic dislocation remained severe.
While reasonably resilient during the first half of the period, the global economy and financial system increasingly experienced considerable negative spillovers from the U.S. slowdown. Not only did Europe and Japan show obvious signs of economic softening, the more powerful engine of global growth – emerging markets – also displayed weakening dynamics.
During the reporting period, the U.S. Federal Reserve Board cut interest rates aggressively and introduced a multitude of new lending facilities to alleviate ever-tightening credit markets, while the U.S. federal government moved quickly to design and implement a meaningful fiscal stimulus package. Although several other global central banks also cut rates, the dilemma of rising energy and food prices heightened concerns among central bankers that inflationary expectations might become unhinged despite weaker growth. Only later in the reporting period did slowing global growth result in a very precipitous decline in commodity prices, which significantly eased inflation and inflationary expectations. As inflationary concerns diminished in the face of global deleveraging, and equity and credit markets deteriorated more sharply, a coordinated rate cut marked the beginning of much more aggressive easing by the major global central banks.
Contributors to Performance
Strong stock selection in the industrial goods and services sector boosted performance relative to the Russell 1000 Value Index. Not holding poor-performing diversified industrial conglomerate General Electric and the fund’s position in defense contractor Lockheed Martin (aa), which is not a benchmark constituent, were key factors in this result.
The fund’s underweighted positioning in the financial services sector also aided relative performance. Not holding insurance firm American International Group (AIG) and financial services firm Wachovia helped as both securities underperformed the benchmark. Avoiding diversified financial services company Citigroup (g) for a majority of the period positively affected the fund’s relative performance.
Stock selection in the technology sector helped relative results. The fund’s holdings of enterprise software products maker Oracle (aa) was a key positive factor for relative performance in this sector.
Top relative contributors in other sectors included tobacco company Philip Morris, management consulting firm Accenture (aa), and paint producer Sherwin Williams (aa). Shares of Sherwin Williams rose, in part, due to the Rhode Island Supreme Court’s decision to overturn a lead paint verdict against the paint maker. Company earnings that were greater than expectations also helped the stock’s performance. Not holding poor-performing precious metals company Freeport-McMoran also strengthened relative performance.
Detractors from Performance
Stock selection and an underweighted position in the health care sector was the primary detractor from relative performance. Not holding biotechnology firm Amgen was a negative. The fund’s underweighted position in pharmaceutical giant Pfizer and positioning in health insurance provider UnitedHealth Group (g) also held back relative results. We closed out our position in UnitedHealth late in the reporting period, but not before experiencing significant declines. UnitedHealth became a benchmark constituent during the second half of the reporting period after the worst of these declines had already occurred.
3
Management Review – continued
Elsewhere, underweighted positions in integrated oil and gas company Exxon Mobil and telecommunications provider Verizon hindered relative results. Our avoidance of financial services firm Wells Fargo for a majority of the period and our ownership of financial services firm Goldman Sachs, insurance company Genworth Financial, investment management firm UBS (aa)(g), and cruise line operator Royal Caribbean also dampened relative results. Shares of Royal Caribbean suffered during the first part of the reporting period due to high fuel costs and more recently due to weak consumer spending.
During the reporting period, the fund’s currency exposure was a detractor from relative performance. All of MFS’ investment decisions are driven by the fundamentals of each individual opportunity and as such, it is common for our funds to have different currency exposure than the benchmark.
Respectfully,
| | |
| Nevin Chitkara | | Steven Gorham |
| Portfolio Manager | | Portfolio Manager |
| (aa) | | Security is not a benchmark constituent. |
| (g) | | Security was not held in the portfolio at period end. |
The views expressed in this report are those of the portfolio managers only through the end of the period of the report as stated on the cover and do not necessarily reflect the views of MFS or any other person in the MFS organization. These views are subject to change at any time based on market or other conditions, and MFS disclaims any responsibility to update such views. These views may not be relied upon as investment advice or an indication of trading intent on behalf of any MFS portfolio. References to specific securities are not recommendations of such securities, and may not be representative of any MFS portfolio’s current or future investments.
4
PERFORMANCE SUMMARY THROUGH 12/31/08
The following chart illustrates the historical performance of the fund in comparison to its benchmark(s). Benchmark comparisons are unmanaged; do not reflect any fees or expenses; and cannot be invested in directly. The performance of other share classes will be greater than or less than that of the class depicted below. (See Notes to Performance Summary.)
Performance data shown represents past performance and is no guarantee of future results. Investment return and principal value fluctuate so your units, when sold, may be worth more or less than the original cost; current performance may be lower or higher than quoted. The performance shown does not reflect the deduction of taxes, if any, that a contract holder would pay on fund distributions or the redemption of contract units. The returns for the fund shown also do not reflect the deduction of expenses associated with variable products, such as mortality and expense risk charges, separate account charges, and sales charges imposed by the insurance company separate accounts. Such expenses would reduce the overall returns shown.
Growth of a hypothetical $10,000 investment
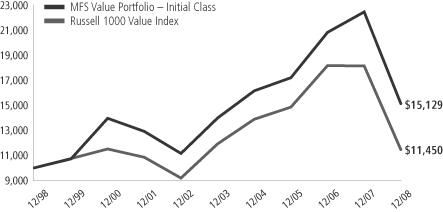
Total rates of return through 12/31/08
Average Annual Total Returns
| | | | | | | | | | | | |
| | | Share class | | Class inception date | | 1-yr | | 5-yr | | 10-yr | | |
| | | Initial Class | | 5/06/98 | | (32.64)% | | 1.60% | | 4.23% | | |
| | | Service Class | | 8/24/01 | | (32.87)% | | 1.33% | | 4.03% | | |
Comparative Benchmark
| | | | | | | | | | | | |
| | | Russell 1000 Value Index (f) | | (36.85)% | | (0.79)% | | 1.36% | | |
| (f) | Source: FactSet Research Systems Inc. |
Benchmark Definition
Russell 1000 Value Index – constructed to provide a comprehensive barometer for the value securities in the large-cap segment of the U.S. equity universe. Companies in this index generally have lower price-to-book ratios and lower forecasted growth values.
It is not possible to invest directly in an index.
Notes to Performance Summary
Performance for the Service Class includes the performance of the fund’s Initial Class for periods prior to their offering. Because Service Class expenses are higher than those of Initial Class, performance shown for Service Class is higher than it would have been had it been offered for the entire period. Performance has not been adjusted to take into account differences in class specific operating expenses (such as Rule 12b-1 fees). Please see the prospectus for additional information about performance and expenses.
Performance results reflect any applicable expense subsidies and waivers in effect during the periods shown. Without such subsidies and waivers the fund’s performance results would be less favorable. Please see the prospectus for complete details. All results are historical and assume the reinvestment of any dividends and capital gains distributions.
From time to time the fund may receive proceeds from litigation settlements, without which performance would be lower.
5
EXPENSE TABLE
Fund Expenses Borne by the Contract Holders During the Period,
July 1, 2008 through December 31, 2008
As a contract holder of the fund, you incur ongoing costs, including management fees; distribution (12b-1) fees; and other fund expenses. This example is intended to help you understand your ongoing costs (in dollars) of investing in the fund and to compare these costs with the ongoing costs of investing in other mutual funds.
The example is based on an investment of $1,000 invested at the beginning of the period and held for the entire period July 1, 2008 through December 31, 2008.
Actual Expenses
The first line for each share class in the following table provides information about actual account values and actual expenses. You may use the information in this line, together with the amount you invested, to estimate the expenses that you paid over the period. Simply divide your account value by $1,000 (for example, an $8,600 account value divided by $1,000 = 8.6), then multiply the result by the number in the first line under the heading entitled “Expenses Paid During Period” to estimate the expenses you paid on your account during this period.
Hypothetical Example for Comparison Purposes
The second line for each share class in the following table provides information about hypothetical account values and hypothetical expenses based on the fund’s actual expense ratio and an assumed rate of return of 5% per year before expenses, which is not the fund’s actual return. The hypothetical account values and expenses may not be used to estimate the actual ending account balance or expenses you paid for the period. You may use this information to compare the ongoing costs of investing in the fund and other funds. To do so, compare this 5% hypothetical example with the 5% hypothetical examples that appear in the shareholder reports of the other funds.
Please note that the expenses shown in the table are meant to highlight the fund’s ongoing costs only and do not take into account the fees and expenses imposed under the variable contracts through which your investment in the fund is made. Therefore, the second line for each share class in the table is useful in comparing ongoing costs associated with an investment in vehicles (such as the fund) which fund benefits under variable annuity and variable life insurance contracts and to qualified pension and retirement plans only, and will not help you determine the relative total costs of investing in the fund through variable annuity and variable life insurance contracts. If the fees and expenses imposed under the variable contracts were included, your costs would have been higher.
| | | | | | | | | | |
| Share Class | | | | Annualized
Expense Ratio | | Beginning
Account Value
7/01/08 | | Ending
Account Value
12/31/08 | | Expenses Paid
During Period (p)
7/01/08-12/31/08 |
| Initial Class | | Actual | | 0.84% | | $1,000.00 | | $754.58 | | $3.70 |
| | Hypothetical (h) | | 0.84% | | $1,000.00 | | $1,020.91 | | $4.27 |
| Service Class | | Actual | | 1.09% | | $1,000.00 | | $753.55 | | $4.80 |
| | Hypothetical (h) | | 1.09% | | $1,000.00 | | $1,019.66 | | $5.53 |
| (h) | 5% class return per year before expenses. |
| (p) | Expenses paid is equal to each class’ annualized expense ratio, as shown above, multiplied by the average account value over the period, multiplied by the number of days in the period, divided by the number of days in the year. |
6
PORTFOLIO OF INVESTMENTS – 12/31/08
The Portfolio of Investments is a complete list of all securities owned by your fund. It is categorized by broad-based asset classes.
| | | | | |
| Issuer | | Shares/Par | | Value ($) |
| | | | | |
| COMMON STOCKS – 98.8% | | | | | |
| Aerospace – 8.5% | | | | | |
| Lockheed Martin Corp. | | 168,270 | | $ | 14,148,142 |
| Northrop Grumman Corp. | | 152,840 | | | 6,883,914 |
| United Technologies Corp. | | 98,780 | | | 5,294,608 |
| | | | | |
| | | | $ | 26,326,664 |
| | | | | |
| Alcoholic Beverages – 1.8% | | | | | |
| Diageo PLC | | 288,509 | | $ | 4,013,313 |
| Molson Coors Brewing Co. | | 34,390 | | | 1,682,359 |
| | | | | |
| | | | $ | 5,695,672 |
| | | | | |
| Apparel Manufacturers – 1.3% | | | | | |
| NIKE, Inc., “B” | | 82,020 | | $ | 4,183,020 |
| | | | | |
| Automotive – 0.5% | | | | | |
| Johnson Controls, Inc. | | 85,260 | | $ | 1,548,322 |
| | | | | |
| Broadcasting – 3.1% | | | | | |
| Omnicom Group, Inc. | | 140,460 | | $ | 3,781,183 |
| Walt Disney Co. | | 190,640 | | | 4,325,622 |
| WPP Group PLC | | 267,418 | | | 1,558,844 |
| | | | | |
| | | | $ | 9,665,649 |
| | | | | |
| Brokerage & Asset Managers – 1.2% | | | | | |
| Franklin Resources, Inc. | | 32,140 | | $ | 2,049,889 |
| Invesco Ltd. | | 32,440 | | | 468,434 |
| Merrill Lynch & Co., Inc. | | 117,280 | | | 1,365,139 |
| | | | | |
| | | | $ | 3,883,462 |
| | | | | |
| Business Services – 3.0% | | | | | |
| Accenture Ltd. | | 174,570 | | $ | 5,724,150 |
| Automatic Data Processing, Inc. | | 27,600 | | | 1,085,784 |
| Visa, Inc. | | 22,690 | | | 1,190,090 |
| Western Union Co. | | 94,560 | | | 1,355,990 |
| | | | | |
| | | | $ | 9,356,014 |
| | | | | |
| Chemicals – 2.7% | | | | | |
| 3M Co. | | 56,330 | | $ | 3,241,228 |
| PPG Industries, Inc. | | 123,360 | | | 5,234,165 |
| | | | | |
| | | | $ | 8,475,393 |
| | | | | |
| Computer Software – 2.7% | | | | | |
| Oracle Corp. (a) | | 466,650 | | $ | 8,273,705 |
| | | | | |
| Computer Software – Systems – 2.2% | | | | | |
| Hewlett-Packard Co. | | 56,180 | | $ | 2,038,772 |
| International Business Machines Corp. | | 58,010 | | | 4,882,122 |
| | | | | |
| | | | $ | 6,920,894 |
| | | | | |
| Construction – 1.0% | | | | | |
| Sherwin-Williams Co. | | 49,570 | | $ | 2,961,807 |
| | | | | |
| Consumer Goods & Services – 1.2% | | | | | |
| Procter & Gamble Co. | | 59,181 | | $ | 3,658,569 |
| | | | | |
| Electrical Equipment – 1.6% | | | | | |
| Danaher Corp. | | 47,240 | | $ | 2,674,256 |
| W.W. Grainger, Inc. | | 29,680 | | | 2,339,971 |
| | | | | |
| | | | $ | 5,014,227 |
| | | | | |
| | | | | |
| Issuer | | Shares/Par | | Value ($) |
| | | | | |
| COMMON STOCKS – continued | | | |
| Electronics – 2.2% | | | | | |
| Agilent Technologies, Inc. (a) | | 47,610 | | $ | 744,144 |
| Intel Corp. | | 427,040 | | | 6,260,406 |
| | | | | |
| | | | $ | 7,004,550 |
| | | | | |
| Energy – Independent – 4.1% | | | | | |
| Apache Corp. | | 56,940 | | $ | 4,243,738 |
| Devon Energy Corp. | | 64,280 | | | 4,223,839 |
| EOG Resources, Inc. | | 40,110 | | | 2,670,524 |
| Occidental Petroleum Corp. | | 28,000 | | | 1,679,720 |
| | | | | |
| | | | $ | 12,817,821 |
| | | | | |
| Energy – Integrated – 10.3% | | | | | |
| Chevron Corp. | | 95,895 | | $ | 7,093,353 |
| ConocoPhillips | | 50,100 | | | 2,595,180 |
| Exxon Mobil Corp. | | 103,742 | | | 8,281,724 |
| Hess Corp. | | 63,650 | | | 3,414,186 |
| Marathon Oil Corp. | | 34,660 | | | 948,298 |
| TOTAL S.A., ADR | | 177,540 | | | 9,817,962 |
| | | | | |
| | | | $ | 32,150,703 |
| | | | | |
| Food & Beverages – 3.7% | | | | | |
| J.M. Smucker Co. | | 24,527 | | $ | 1,063,491 |
| Kellogg Co. | | 30,540 | | | 1,339,179 |
| Nestle S.A. | | 128,597 | | | 5,068,339 |
| Pepsi Bottling Group, Inc. | | 12,680 | | | 285,427 |
| PepsiCo, Inc. | | 67,358 | | | 3,689,198 |
| | | | | |
| | | | $ | 11,445,634 |
| | | | | |
| Food & Drug Stores – 1.5% | | | | | |
| CVS Caremark Corp. | | 128,108 | | $ | 3,681,824 |
| Kroger Co. | | 40,540 | | | 1,070,661 |
| | | | | |
| | | | $ | 4,752,485 |
| | | | | |
| Gaming & Lodging – 0.6% | | | | | |
| Royal Caribbean Cruises Ltd. | | 140,610 | | $ | 1,933,388 |
| | | | | |
| General Merchandise – 0.5% | | | | | |
| Macy’s, Inc. | | 135,260 | | $ | 1,399,941 |
| | | | | |
| Health Maintenance Organizations – 0.2% | | | |
| WellPoint, Inc. (a) | | 16,670 | | $ | 702,307 |
| | | | | |
| Insurance – 7.8% | | | | | |
| Allstate Corp. | | 256,370 | | $ | 8,398,681 |
| Aon Corp. | | 25,000 | | | 1,142,000 |
| Chubb Corp. | | 48,690 | | | 2,483,190 |
| Genworth Financial, Inc. | | 206,900 | | | 585,527 |
| MetLife, Inc. | | 263,220 | | | 9,175,849 |
| Prudential Financial, Inc. | | 61,300 | | | 1,854,938 |
| Travelers Cos., Inc. | | 15,140 | | | 684,328 |
| | | | | |
| | | | $ | 24,324,513 |
| | | | | |
| Leisure & Toys – 0.2% | | | | | |
| Hasbro, Inc. | | 22,860 | | $ | 666,826 |
| | | | | |
| Machinery & Tools – 0.8% | | | | | |
| Eaton Corp. | | 51,770 | | $ | 2,573,487 |
| | | | | |
7
Portfolio of Investments – continued
| | | | | |
| Issuer | | Shares/Par | | Value ($) |
| | | | | |
| COMMON STOCKS – continued | | | |
| Major Banks – 9.9% | | | | | |
| Bank of America Corp. | | 190,454 | | $ | 2,681,592 |
| Bank of New York Mellon Corp. | | 248,035 | | | 7,026,832 |
| Goldman Sachs Group, Inc. | | 67,190 | | | 5,670,164 |
| JPMorgan Chase & Co. | | 181,430 | | | 5,720,488 |
| PNC Financial Services Group, Inc. | | 51,910 | | | 2,543,590 |
| State Street Corp. | | 115,640 | | | 4,548,121 |
| SunTrust Banks, Inc. | | 21,130 | | | 624,180 |
| Wells Fargo & Co. | | 66,960 | | | 1,973,981 |
| | | | | |
| | | | $ | 30,788,948 |
| | | | | |
| Medical Equipment – 0.4% | | | | | |
| Waters Corp. (a) | | 34,870 | | $ | 1,277,985 |
| | | | | |
| Oil Services – 0.5% | | | | | |
| National Oilwell Varco, Inc. (a) | | 57,690 | | $ | 1,409,944 |
| | | | | |
| Pharmaceuticals – 7.3% | | | | | |
| Abbott Laboratories | | 35,140 | | $ | 1,875,422 |
| GlaxoSmithKline PLC | | 85,670 | | | 1,590,412 |
| Johnson & Johnson | | 78,540 | | | 4,699,048 |
| Merck & Co., Inc. | | 195,920 | | | 5,955,968 |
| Pfizer, Inc. | | 63,300 | | | 1,121,043 |
| Roche Holding AG | | 8,230 | | | 1,266,874 |
| Wyeth | | 167,720 | | | 6,291,177 |
| | | | | |
| | | | $ | 22,799,944 |
| | | | | |
| Railroad & Shipping – 0.3% | | | | | |
| Burlington Northern Santa Fe Corp. | | 10,420 | | $ | 788,898 |
| | | | | |
| Specialty Chemicals – 0.7% | | | | | |
| Air Products & Chemicals, Inc. | | 45,297 | | $ | 2,277,080 |
| | | | | |
| Specialty Stores – 0.4% | | | | | |
| Staples, Inc. | | 70,630 | | $ | 1,265,690 |
| | | | | |
| Telecommunications – Wireless – 1.9% | | | | | |
| America Movil S.A.B. de C.V., “L”, ADR | | 7,990 | | $ | 247,610 |
| Rogers Communications, Inc., “B” | | 52,810 | | | 1,565,264 |
| Vodafone Group PLC | | 1,964,197 | | | 3,954,152 |
| | | | | |
| | | | $ | 5,767,026 |
| | | | | |
| Telephone Services – 4.2% | | | | | |
| AT&T, Inc. | | 409,600 | | $ | 11,673,600 |
| Verizon Communications, Inc. | | 38,290 | | | 1,298,031 |
| | | | | |
| | | | $ | 12,971,631 |
| | | | | |
| | | | | | | |
| Issuer | | Shares/Par | | Value ($) | |
| | | | | | | |
| COMMON STOCKS – continued | | | | |
| Tobacco – 4.9% | | | | | | | |
| Altria Group, Inc. | | | 70,690 | | $ | 1,064,591 | |
| Lorillard, Inc. | | | 30,380 | | | 1,711,913 | |
| Philip Morris International, Inc. | | | 286,850 | | | 12,480,843 | |
| | | | | | | |
| | | | | $ | 15,257,347 | |
| | | | | | | |
| Utilities – Electric Power – 5.6% | | | | | | | |
| Dominion Resources, Inc. | | | 126,638 | | $ | 4,538,706 | |
| Entergy Corp. | | | 31,800 | | | 2,643,534 | |
| FPL Group, Inc. | | | 56,990 | | | 2,868,307 | |
| PG&E Corp. | | | 58,170 | | | 2,251,761 | |
| PPL Corp. | | | 90,810 | | | 2,786,959 | |
| Public Service Enterprise Group, Inc. | | | 80,870 | | | 2,358,978 | |
| | | | | | | |
| | | | | $ | 17,448,245 | |
| | | | | | | |
Total Common Stocks
(Identified Cost, $342,778,837) | | | | | $ | 307,787,791 | |
| | | | | | | |
|
| REPURCHASE AGREEMENTS – 1.3% | |
| Goldman Sachs, 0.01%, dated 12/31/08, due 1/02/09, total to be received $3,944,002 (secured by U.S. Treasury and Federal Agency obligations and Mortgage Backed securities in a jointly traded account), at Cost | | $ | 3,944,000 | | $ | 3,944,000 | |
| | | | | | | |
Total Investments
(Identified Cost, $346,722,837) | | | | | $ | 311,731,791 | |
| | | | | | | |
OTHER ASSETS, LESS
LIABILITIES – (0.1)% | | | | | | (201,865 | ) |
| | | | | | | |
| Net Assets – 100.0% | | | | | $ | 311,529,926 | |
| | | | | | | |
| (a) | | Non-income producing security. |
The following abbreviations are used in this report and are defined:
| ADR | | American Depository Receipt |
See Notes to Financial Statements
8
FINANCIAL STATEMENTS | STATEMENT OF ASSETS AND LIABILITIES
This statement represents your fund’s balance sheet, which details the assets and liabilities comprising the total value of the fund.
| | | | | |
At 12/31/08 | | | | | |
Assets | | | | | |
Investments, at value (identified cost, $346,722,837) | | $311,731,791 | | | |
Cash | | 80 | | | |
Foreign currency, at value (identified cost, $23) | | 23 | | | |
Receivable for fund shares sold | | 328,763 | | | |
Interest and dividends receivable | | 809,381 | | | |
Other assets | | 15,059 | | | |
Total assets | | | | | $312,885,097 |
Liabilities | | | | | |
Payable for investments purchased | | $984,601 | | | |
Payable for fund shares reacquired | | 223,932 | | | |
Payable to affiliates | | | | | |
Management fee | | 12,432 | | | |
Distribution fees | | 2,200 | | | |
Administrative services fee | | 927 | | | |
Payable for trustees’ compensation | | 37 | | | |
Accrued expenses and other liabilities | | 131,042 | | | |
Total liabilities | | | | | $1,355,171 |
Net assets | | | | | $311,529,926 |
Net assets consist of | | | | | |
Paid-in capital | | $350,526,625 | | | |
Unrealized appreciation (depreciation) on investments and translation of assets and liabilities in foreign currencies | | (34,998,328 | ) | | |
Accumulated net realized gain (loss) on investments and foreign currency transactions | | (9,892,432 | ) | | |
Undistributed net investment income | | 5,894,061 | | | |
Net assets | | | | | $311,529,926 |
Shares of beneficial interest outstanding | | | | | 29,246,325 |
Initial Class shares | | | | | |
Net assets | | $146,010,728 | | | |
Shares outstanding | | 13,650,398 | | | |
Net asset value per share | | | | | $10.70 |
Service Class shares | | | | | |
Net assets | | $165,519,198 | | | |
Shares outstanding | | 15,595,927 | | | |
Net asset value per share | | | | | $10.61 |
See Notes to Financial Statements
9
FINANCIAL STATEMENTS | STATEMENT OF OPERATIONS
This statement describes how much your fund earned in investment income and accrued in expenses. It also describes any gains and/or losses generated by fund operations.
| | | | | | |
| Year ended 12/31/08 | | | | | | |
Net investment income | | | | | | |
Income | | | | | | |
Dividends | | $9,178,602 | | | | |
Interest | | 194,707 | | | | |
Foreign taxes withheld | | (95,760 | ) | | | |
Total investment income | | | | | $9,277,549 | |
Expenses | | | | | | |
Management fee | | $2,629,069 | | | | |
Distribution fees | | 381,441 | | | | |
Administrative services fee | | 111,605 | | | | |
Trustees’ compensation | | 33,216 | | | | |
Custodian fee | | 85,589 | | | | |
Shareholder communications | | 10,613 | | | | |
Auditing fees | | 43,987 | | | | |
Legal fees | | 7,128 | | | | |
Miscellaneous | | 34,516 | | | | |
Total expenses | | | | | $3,337,164 | |
Fees paid indirectly | | (100 | ) | | | |
Net expenses | | | | | $3,337,064 | |
Net investment income | | | | | $5,940,485 | |
Realized and unrealized gain (loss) on investments and foreign currency transactions | | | | | | |
Realized gain (loss) (identified cost basis) | | | | | | |
Investment transactions | | $(8,640,071 | ) | | | |
Foreign currency transactions | | (4,298 | ) | | | |
Net realized gain (loss) on investments and foreign currency transactions | | | | | $(8,644,369 | ) |
Change in unrealized appreciation (depreciation) | | | | | | |
Investments | | $(136,651,068 | ) | | | |
Translation of assets and liabilities in foreign currencies | | (4,363 | ) | | | |
Net unrealized gain (loss) on investments and foreign currency translation | | | | | $(136,655,431 | ) |
Net realized and unrealized gain (loss) on investments and foreign currency | | | | | $(145,299,800 | ) |
Change in net assets from operations | | | | | $(139,359,315 | ) |
See Notes to Financial Statements
10
FINANCIAL STATEMENTS | STATEMENTS OF CHANGES IN NET ASSETS
These statements describe the increases and/or decreases in net assets resulting from operations, any distributions, and any shareholder transactions.
| | | | | | |
For years ended 12/31 | | 2008 | | | 2007 | |
Change in net assets | | | | | | |
From operations | | | | | | |
Net investment income | | $5,940,485 | | | $5,994,983 | |
Net realized gain (loss) on investments and foreign currency transactions | | (8,644,369 | ) | | 53,104,386 | |
Net unrealized gain (loss) on investments and foreign currency translation | | (136,655,431 | ) | | (23,653,970 | ) |
Change in net assets from operations | | $(139,359,315 | ) | | $35,445,399 | |
Distributions declared to shareholders | | | | | | |
From net investment income | | | | | | |
Initial Class | | $(3,747,705 | ) | | $(4,956,730 | ) |
Service Class | | (2,247,240 | ) | | (1,958,742 | ) |
From net realized gain on investments | | | | | | |
Initial Class | | (31,412,527 | ) | | (18,004,251 | ) |
Service Class | | (21,883,109 | ) | | (8,308,499 | ) |
Total distributions declared to shareholders | | $(59,290,581 | ) | | $(33,228,222 | ) |
Change in net assets from fund share transactions | | $100,628,291 | | | $(57,093,670 | ) |
Total change in net assets | | $(98,021,605 | ) | | $(54,876,493 | ) |
Net assets | | | | | | |
At beginning of period | | 409,551,531 | | | 464,428,024 | |
At end of period (including undistributed net investment income of $5,894,061 and
$5,989,992, respectively) | | $311,529,926 | | | $409,551,531 | |
See Notes to Financial Statements
11
FINANCIAL STATEMENTS | FINANCIAL HIGHLIGHTS
The financial highlights table is intended to help you understand the fund’s financial performance for the past 5 years. Certain information reflects financial results for a single fund share. The total returns in the table represent the rate by which an investor would have earned (or lost) on an investment in the fund share class (assuming reinvestment of all distributions) held for the entire period.
| | | | | | | | | | | | | | | |
| Initial Class | | Years ended 12/31 | |
| | | 2008 | | | 2007 | | | 2006 | | | 2005 | | | 2004 | |
Net asset value, beginning of period | | $18.78 | | | $18.70 | | | $16.30 | | | $15.51 | | | $13.61 | |
| Income (loss) from investment operations | | | | | | | | | | | | | | | |
Net investment income (d) | | $0.25 | | | $0.27 | | | $0.28 | | | $0.24 | | | $0.21 | |
Net realized and unrealized gain (loss) on investments
and foreign currency | | (5.50 | ) | | 1.22 | | | 3.04 | | | 0.77 | | | 1.87 | |
Total from investment operations | | $(5.25 | ) | | $1.49 | | | $3.32 | | | $1.01 | | | $2.08 | |
| Less distributions declared to shareholders | | | | | | | | | | | | | | | |
From net investment income | | $(0.30 | ) | | $(0.30 | ) | | $(0.27 | ) | | $(0.22 | ) | | $(0.18 | ) |
From net realized gain on investments | | (2.53 | ) | | (1.11 | ) | | (0.65 | ) | | — | | | — | |
Total distributions declared to shareholders | | $(2.83 | ) | | $(1.41 | ) | | $(0.92 | ) | | $(0.22 | ) | | $(0.18 | ) |
Net asset value, end of period | | $10.70 | | | $18.78 | | | $18.70 | | | $16.30 | | | $15.51 | |
Total return (%) (k)(s) | | (32.64 | ) | | 7.92 | | | 20.96 | | | 6.60 | | | 15.52 | (b) |
Ratios (%) (to average net assets)
and Supplemental data: | | | | | | | | | | | | | | | |
Expenses (f) | | 0.84 | | | 0.83 | | | 0.86 | | | 0.85 | | | 0.83 | |
Net investment income | | 1.75 | | | 1.40 | | | 1.62 | | | 1.51 | | | 1.53 | |
Portfolio turnover | | 44 | | | 25 | | | 26 | | | 22 | | | 36 | |
Net assets at end of period (000 Omitted) | | $146,011 | | | $267,967 | | | $323,094 | | | $319,952 | | | $339,705 | |
See Notes to Financial Statements
12
Financial Highlights – continued
| | | | | | | | | | | | | | | |
| Service Class | | Years ended 12/31 | |
| | | 2008 | | | 2007 | | | 2006 | | | 2005 | | | 2004 | |
Net asset value, beginning of period | | $18.66 | | | $18.59 | | | $16.21 | | | $15.43 | | | $13.56 | |
| Income (loss) from investment operations | | | | | | | | | | | | | | | |
Net investment income (d) | | $0.22 | | | $0.22 | | | $0.23 | | | $0.20 | | | $0.18 | |
Net realized and unrealized gain (loss) on investments
and foreign currency | | (5.48 | ) | | 1.22 | | | 3.02 | | | 0.77 | | | 1.85 | |
Total from investment operations | | $(5.26 | ) | | $1.44 | | | $3.25 | | | $0.97 | | | $2.03 | |
| Less distributions declared to shareholders | | | | | | | | | | | | | | | |
From net investment income | | $(0.26 | ) | | $(0.26 | ) | | $(0.22 | ) | | $(0.19 | ) | | $(0.16 | ) |
From net realized gain on investments | | (2.53 | ) | | (1.11 | ) | | (0.65 | ) | | — | | | — | |
Total distributions declared to shareholders | | $(2.79 | ) | | $(1.37 | ) | | $(0.87 | ) | | $(0.19 | ) | | $(0.16 | ) |
Net asset value, end of period | | $10.61 | | | $18.66 | | | $18.59 | | | $16.21 | | | $15.43 | |
Total return (%) (k)(s) | | (32.87 | ) | | 7.67 | | | 20.66 | | | 6.34 | | | 15.18 | (b) |
Ratios (%) (to average net assets)
and Supplemental data: | | | | | | | | | | | | | | | |
Expenses (f) | | 1.09 | | | 1.08 | | | 1.11 | | | 1.10 | | | 1.08 | |
Net investment income | | 1.62 | | | 1.16 | | | 1.37 | | | 1.27 | | | 1.28 | |
Portfolio turnover | | 44 | | | 25 | | | 26 | | | 22 | | | 36 | |
Net assets at end of period (000 Omitted) | | $165,519 | | | $141,584 | | | $141,334 | | | $126,809 | | | $119,496 | |
| (b) | The fund’s net asset value and total return calculation include a non-recurring accrual recorded as a result of an administrative proceeding regarding disclosure of brokerage allocation practices in connection with fund sales. The non-recurring accrual did not have a material impact on the net asset value per share based on the shares outstanding on the day the accrual was recorded. |
| (d) | Per share data is based on average shares outstanding. |
| (f) | Ratios do not reflect reductions from fees paid indirectly, if applicable. |
| (k) | The total return does not reflect expenses that apply to separate accounts. Inclusion of these charges would reduce the total return figures for all periods shown. |
| (s) | From time to time the fund may receive proceeds from litigation settlements, without which performance would be lower. |
See Notes to Financial Statements
13
NOTES TO FINANCIAL STATEMENTS
| (1) | | Business and Organization |
MFS Value Portfolio (the fund) is a series of MFS Variable Insurance Trust II (the trust). The trust is organized as a Massachusetts business trust and is registered under the Investment Company Act of 1940, as amended, as an open-end management investment company. The shares of the fund are sold to variable accounts established by insurance companies to fund benefits under variable contracts issued by such companies, and qualified retirement and pension plans.
| (2) | | Significant Accounting Policies |
General – The preparation of financial statements in conformity with U.S. generally accepted accounting principles requires management to make estimates and assumptions that affect the reported amounts of assets and liabilities, and disclosure of contingent assets and liabilities at the date of the financial statements and the reported amounts of revenues and expenses during the reporting period. Actual results could differ from those estimates. The fund can invest in foreign securities. Investments in foreign securities are vulnerable to the effects of changes in the relative values of the local currency and the U.S. dollar and to the effects of changes in each country’s legal, political, and economic environment.
In March 2008, FASB Statement No. 161, Disclosures about Derivative Instruments and Hedging Activities (the “Standard”) was issued, and is effective for financial statements issued for fiscal years and interim periods beginning after November 15, 2008. This Standard provides enhanced disclosures about the fund’s use of and accounting for derivative instruments and the effect of derivative instruments on the fund’s results of operations and financial position. Management is evaluating the application of the Standard to the fund, and has not at this time determined the impact, if any, resulting from the adoption of this Standard on the fund’s financial statements.
FASB Staff Position (FSP) 133-1 was implemented during the period. FSP 133-1 amends FAS 133 to require sellers of credit derivatives to make disclosures that will enable financial statement users to assess the potential effects of those credit derivatives on an entity’s financial position, financial performance and cash flows. There was no impact from implementing FSP 133-1 as the fund did not hold any of these credit derivatives at period end.
Investment Valuations – Equity securities, including restricted equity securities, are generally valued at the last sale or official closing price as reported by a third party pricing service on the market or exchange on which they are primarily traded. For securities for which there were no sales reported that day, equity securities are generally valued at the last quoted daily bid quotation as reported by a third party pricing service on the market or exchange on which they are primarily traded. For securities held short for which there were no sales reported for the day, the position is generally valued at the last quoted daily ask quotation as reported by a third party pricing service on the market or exchange on which such securities are primarily traded. Short-term instruments with a maturity at issuance of 60 days or less may be valued at amortized cost, which approximates market value. Securities and other assets generally valued on the basis of information from a third party pricing service may also be valued at a broker-dealer bid quotation. Values obtained from pricing services can utilize both dealer-supplied valuations and electronic data processing techniques, which take into account factors such as institutional-size trading in similar groups of securities, yield, quality, coupon rate, maturity, type of issue, trading characteristics, and other market data. The values of foreign securities and other assets and liabilities expressed in foreign currencies are converted to U.S. dollars using the mean of bid and asked prices for rates reported by a third party pricing service.
The Board of Trustees has delegated primary responsibility for determining or causing to be determined the value of the fund’s investments (including any fair valuation) to the adviser pursuant to valuation policies and procedures approved by the Board. If the adviser determines that reliable market quotations are not readily available, investments are valued at fair value as determined in good faith by the adviser in accordance with such procedures under the oversight of the Board of Trustees. Under the fund’s valuation policies and procedures, market quotations are not considered to be readily available for most types of debt instruments and floating rate loans and many types of derivatives. These investments are generally valued at fair value based on information from third party pricing services. In addition, investments may be valued at fair value if the adviser determines that an investment’s value has been materially affected by events occurring after the close of the exchange or market on which the investment is principally traded (such as foreign exchange or market) and prior to the determination of the fund’s net asset value, or after the halting of trading of a specific security where trading does not resume prior to the close of the exchange or market on which the security is principally traded. Events that occur on a frequent basis after foreign markets close (such as developments in foreign markets and significant movements in the U.S. markets) and prior to the determination of the fund’s net asset value may be deemed to have a material affect on the value of securities traded in foreign markets. Accordingly, the fund’s foreign equity securities may often be valued at fair value. The adviser may rely on third party pricing services or other information (such as the correlation with price movements of similar securities in the same or other markets; the type, cost and investment characteristics of the security; the business and financial condition of the issuer; and trading and other market data) to assist in determining whether to fair value and at what value to fair value an investment. The value of an investment for purposes of calculating the fund’s net asset value can differ depending on the source and method used to determine value. When fair valuation is used, the value of investments used to determine the fund’s net asset value may differ from quoted or published prices for the same investments.
14
Notes to Financial Statements – continued
The fund adopted FASB Statement No. 157, Fair Value Measurements (the “Statement”). This Statement provides a single definition of fair value, a hierarchy for measuring fair value and expanded disclosures about fair value measurements.
Various inputs are used in determining the value of the fund’s assets or liabilities carried at market value. These inputs are categorized into three broad levels. Level 1 includes quoted prices in active markets for identical assets or liabilities. Level 2 includes other significant observable market-based inputs (including quoted prices for similar securities, interest rates, prepayment speed, and credit risk). Level 3 includes unobservable inputs, which may include the adviser’s own assumptions in determining the fair value of investments. Other financial instruments are derivative instruments not reflected in total investments, such as futures, forwards, swap contracts, and written options. The following is a summary of the levels used as of December 31, 2008 in valuing the fund’s assets or liabilities carried at market value:
| | | | | | | | |
| | | Level 1 | | Level 2 | | Level 3 | | Total |
| Investments in Securities | | $290,335,857 | | $21,395,934 | | $— | | $311,731,791 |
| Other Financial Instruments | | $— | | $— | | $— | | $— |
Repurchase Agreements – The fund may enter into repurchase agreements with approved counterparties. Each repurchase agreement is recorded at cost. The fund requires that the securities collateral in a repurchase transaction be transferred to a custodian. The fund monitors, on a daily basis, the value of the collateral to ensure that its value, including accrued interest, is greater than amounts owed to the fund under each such repurchase agreement. The fund and other funds managed by Massachusetts Financial Services Company (MFS), may utilize a joint trading account for the purpose of entering into one or more repurchase agreements.
Foreign Currency Translation – Purchases and sales of foreign investments, income, and expenses are converted into U.S. dollars based upon currency exchange rates prevailing on the respective dates of such transactions or on the reporting date for foreign denominated receivables and payables. Gains and losses attributable to foreign currency exchange rates on sales of securities are recorded for financial statement purposes as net realized gains and losses on investments. Gains and losses attributable to foreign exchange rate movements on receivables, payables, income and expenses are recorded for financial statement purposes as foreign currency transaction gains and losses. That portion of both realized and unrealized gains and losses on investments that results from fluctuations in foreign currency exchange rates is not separately disclosed.
Security Loans – State Street Bank and Trust Company (“State Street”), as lending agent, may loan the securities of the fund to certain qualified institutions (the “Borrowers”) approved by the fund. The loans are collateralized by cash and/or U.S. Treasury and federal agency obligations in an amount typically at least equal to the market value of the securities loaned. State Street provides the fund with indemnification against Borrower default. The fund bears the risk of loss with respect to the investment of cash collateral. On loans collateralized by cash, the cash collateral is invested in a money market fund or short-term securities. A portion of the income generated upon investment of the collateral is remitted to the Borrowers, and the remainder is allocated between the fund and the lending agent. On loans collateralized by U.S. Treasury and/or federal agency obligations, a fee is received from the Borrower, and is allocated between the fund and the lending agent. Income from securities lending is included in interest income on the Statement of Operations. The dividend and interest income earned on the securities loaned is accounted for in the same manner as other dividend and interest income. At December 31, 2008, there were no securities on loan.
Indemnifications – Under the fund’s organizational documents, its officers and trustees may be indemnified against certain liabilities and expenses arising out of the performance of their duties to the fund. Additionally, in the normal course of business, the fund enters into agreements with service providers that may contain indemnification clauses. The fund’s maximum exposure under these agreements is unknown as this would involve future claims that may be made against the fund that have not yet occurred.
Investment Transactions and Income – Investment transactions are recorded on the trade date. Interest income is recorded on the accrual basis. All premium and discount is amortized or accreted for financial statement purposes in accordance with U.S. generally accepted accounting principles. Dividends received in cash are recorded on the ex-dividend date. Certain dividends from foreign securities will be recorded when the fund is informed of the dividend if such information is obtained subsequent to the ex-dividend date. Dividend and interest payments received in additional securities are recorded on the ex-dividend or ex-interest date in an amount equal to the value of the security on such date.
The fund may receive proceeds from litigation settlements. Any proceeds received from litigation involving portfolio holdings are reflected in the Statement of Operations in realized gain/loss if the security has been disposed of by the fund or in unrealized gain/loss if the security is still held by the fund. Any other proceeds from litigation not related to portfolio holdings are reflected as other income in the Statement of Operations.
15
Notes to Financial Statements – continued
Fees Paid Indirectly – The fund’s custody fee may be reduced according to an arrangement that measures the value of cash deposited with the custodian by the fund. This amount, for the year ended December 31, 2008, is shown as a reduction of total expenses on the Statement of Operations.
Tax Matters and Distributions – The fund intends to qualify as a regulated investment company, as defined under Subchapter M of the Internal Revenue Code, and to distribute all of its taxable income, including realized capital gains. As a result, no provision for federal income tax is required. Each of the fund’s federal tax returns for the prior three fiscal years remains subject to examination by the Internal Revenue Service. Foreign taxes, if any, have been accrued by the fund in the accompanying financial statements.
Distributions to shareholders are recorded on the ex-dividend date. Income and capital gain distributions are determined in accordance with income tax regulations, which may differ from U.S. generally accepted accounting principles. Certain capital accounts in the financial statements are periodically adjusted for permanent differences in order to reflect their tax character. These adjustments have no impact on net assets or net asset value per share. Temporary differences which arise from recognizing certain items of income, expense, gain or loss in different periods for financial statement and tax purposes will reverse at some time in the future. Distributions in excess of net investment income or net realized gains are temporary overdistributions for financial statement purposes resulting from differences in the recognition or classification of income or distributions for financial statement and tax purposes.
Book/tax differences primarily relate to wash sale loss deferrals.
The tax character of distributions declared to shareholders for the last two fiscal years is as follows:
| | | | |
| | | 12/31/08 | | 12/31/07 |
| Ordinary income (including any short-term capital gains) | | $8,698,851 | | $7,811,648 |
| Long-term capital gain | | 50,591,730 | | 25,416,574 |
| Total distributions | | $59,290,581 | | $33,228,222 |
The federal tax cost and the tax basis components of distributable earnings were as follows:
| | | |
| As of 12/31/08 | | | |
| Cost of investments | | $350,540,593 | |
| Gross appreciation | | 20,290,651 | |
| Gross depreciation | | (59,099,453 | ) |
| Net unrealized appreciation (depreciation) | | $(38,808,802 | ) |
| Undistributed ordinary income | | 5,894,061 | |
| Capital loss carryforwards | | (6,074,676 | ) |
| Other temporary differences | | (7,282 | ) |
As of December 31, 2008, the fund had capital loss carryforwards available to offset future realized gains. Such losses expire as follows:
Multiple Classes of Shares of Beneficial Interest – The fund offers multiple classes of shares, which differ in their respective distribution fees. The fund’s income, realized and unrealized gain (loss), and common expenses are allocated to shareholders based on the daily net assets of each class. Dividends are declared separately for each class. Differences in per share dividend rates are generally due to differences in separate class expenses.
| (3) | | Transactions with Affiliates |
Investment Adviser – The fund has an investment advisory agreement with MFS to provide overall investment management and related administrative services and facilities to the fund. The management fee is computed daily and paid monthly at the following annual rates:
| | |
| First $1 billion of average daily net assets | | 0.75% |
| Average daily net assets in excess of $1 billion | | 0.65% |
The management fee incurred for the year ended December 31, 2008 was equivalent to an annual effective rate of 0.75% of the fund’s average daily net assets.
The investment adviser has agreed in writing to pay a portion of the fund’s total annual operating expenses, exclusive of interest, taxes, extraordinary expenses, brokerage and transaction costs and investment-related expenses, such that the operating expenses of the fund do not exceed 0.90% for the Initial Class shares and 1.15% for the Service Class shares, based on the average daily net assets of each share class. This written agreement will continue until April 30, 2010. For the year ended December 31, 2008, the fund’s actual operating expenses did not exceed the limit and therefore, the investment adviser did not pay any portion of the fund’s expenses.
16
Notes to Financial Statements – continued
Distributor – MFS Fund Distributors, Inc. (MFD), a wholly-owned subsidiary of MFS, is the distributor of shares of the fund. The Trustees have adopted a distribution plan for the Service Class shares pursuant to Rule 12b-1 under the Investment Company Act of 1940.
The fund’s distribution plan provides that the fund will pay MFD distribution fees equal to 0.25% per annum of its average daily net assets attributable to Service Class shares as partial consideration for services performed and expenses incurred by MFD and financial intermediaries in connection with the sale and distribution of the fund’s Service Class shares and the sale and distribution of the variable annuity or variable life insurance contracts investing indirectly in Service Class shares. MFD may subsequently pay all, or a portion, of the distribution fees to financial intermediaries.
Shareholder Servicing Agent – MFS Service Center, Inc. (MFSC), a wholly-owned subsidiary of MFS, has contracted to provide transfer agent and recordkeeping functions in connection with the issuance, transfer, and redemption of each class of shares of the fund under a Shareholder Servicing Agent Agreement. During the year ended December 31, 2008, the fund did not pay MFSC a fee for this service.
Administrator – MFS provides certain financial, legal, shareholder communications, compliance, and other administrative services to the fund. Under an administrative services agreement, the fund partially reimburses MFS the costs incurred to provide these services. The fund is charged an annual fixed amount of $10,000 plus a fee based on average daily net assets.
The administrative services fee incurred for the year ended December 31, 2008 was equivalent to an annual effective rate of 0.0318% of the fund’s average daily net assets.
Trustees’ and Officers’ Compensation – The fund pays compensation to trustees in the form of a retainer, attendance fees, and additional compensation to the Board chairperson. The fund does not pay compensation directly to officers of the fund who are also officers of the investment adviser, all of whom receive remuneration for their services to the fund from MFS. Certain officers of the fund are officers or directors of MFS, MFD, and MFSC.
Other – This fund and certain other MFS funds (the funds) have entered into services agreements (the Agreements) which provide for payment of fees by the funds to Tarantino LLC and Griffin Compliance LLC in return for the provision of services of an Independent Chief Compliance Officer (ICCO) and Assistant ICCO, respectively, for the funds. The ICCO and Assistant ICCO are officers of the funds and the sole members of Tarantino LLC and Griffin Compliance LLC, respectively. The funds can terminate the Agreements with Tarantino LLC and Griffin Compliance LLC at any time under the terms of the Agreements. MFS has agreed to bear all expenses associated with office space, other administrative support, and supplies provided to the ICCO and Assistant ICCO. For the year ended December 31, 2008, the aggregate fees paid by the fund to Tarantino LLC and Griffin Compliance LLC were $3,445 and are included in miscellaneous expense on the Statement of Operations.
Purchases and sales of investments, other than U.S. Government securities, purchased option transactions, and short-term obligations, aggregated $200,072,353 and $156,377,634, respectively.
| (5) | | Shares of Beneficial Interest |
The fund’s Declaration of Trust permits the Trustees to issue an unlimited number of full and fractional shares of beneficial interest. Transactions in fund shares were as follows:
| | | | | | | | | | | | |
| | | Year ended 12/31/08 | | | Year ended 12/31/07 | |
| | | Shares | | | Amount | | | Shares | | | Amount | |
| Shares sold | | | | | | | | | | | | |
Initial Class | | 1,777,770 | | | $21,640,444 | | | 230,880 | | | $4,385,870 | |
Service Class | | 7,278,802 | | | 101,235,972 | | | 441,487 | | | 8,316,726 | |
| | 9,056,572 | | | $122,876,416 | | | 672,367 | | | $12,702,596 | |
| Shares issued to shareholders in reinvestment of distributions | | | | | | | | | | | | |
Initial Class | | 2,264,020 | | | $35,160,232 | | | 1,215,510 | | | $22,960,981 | |
Service Class | | 1,563,859 | | | 24,130,349 | | | 546,130 | | | 10,267,241 | |
| | 3,827,879 | | | $59,290,581 | | | 1,761,640 | | | $33,228,222 | |
| Shares reacquired | | | | | | | | | | | | |
Initial Class | | (4,660,114 | ) | | $(68,798,535 | ) | | (4,454,852 | ) | | $(84,197,974 | ) |
Service Class | | (835,834 | ) | | (12,740,171 | ) | | (1,001,443 | ) | | (18,826,514 | ) |
| | (5,495,948 | ) | | $(81,538,706 | ) | | (5,456,295 | ) | | $(103,024,488 | ) |
| Net change | | | | | | | | | | | | |
Initial Class | | (618,324 | ) | | $(11,997,859 | ) | | (3,008,462 | ) | | $(56,851,123 | ) |
Service Class | | 8,006,827 | | | 112,626,150 | | | (13,826 | ) | | (242,547 | ) |
| | 7,388,503 | | | $100,628,291 | | | (3,022,288 | ) | | $(57,093,670 | ) |
17
Notes to Financial Statements – continued
The fund and other funds managed by MFS participate in a $1 billion unsecured committed line of credit provided by a syndication of banks under a credit agreement. In addition, the fund and other funds managed by MFS have established uncommitted borrowing arrangements with certain banks. Borrowings may be made for temporary financing needs. Interest is charged to each fund, based on its borrowings, generally at a rate equal to the Federal Reserve funds rate plus 0.30%. In addition, a commitment fee, based on the average daily, unused portion of the committed line of credit, is allocated among the participating funds at the end of each calendar quarter. For the year ended December 31, 2008, the fund’s commitment fee and interest expense were $1,807 and $0, respectively, and are included in miscellaneous expense on the Statement of Operations.
18
REPORT OF INDEPENDENT REGISTERED PUBLIC ACCOUNTING FIRM
To the Board of Trustees of MFS Variable Insurance Trust II and the Shareholders of
MFS Value Portfolio:
We have audited the accompanying statement of assets and liabilities, including the portfolio of investments, of MFS Value Portfolio (the “Fund”) (one of the portfolios comprising MFS Variable Insurance Trust II) as of December 31, 2008, and the related statement of operations for the year then ended, the statements of changes in net assets for each of the two years in the period then ended, and the financial highlights for each of the five years in the period then ended. These financial statements and financial highlights are the responsibility of the Fund’s management. Our responsibility is to express an opinion on these financial statements and financial highlights based on our audits.
We conducted our audits in accordance with the standards of the Public Company Accounting Oversight Board (United States). Those standards require that we plan and perform the audit to obtain reasonable assurance about whether the financial statements and financial highlights are free of material misstatement. The Fund is not required to have, nor were we engaged to perform, an audit of its internal control over financial reporting. Our audits included consideration of internal control over financial reporting as a basis for designing audit procedures that are appropriate in the circumstances, but not for the purpose of expressing an opinion on the effectiveness of the Fund’s internal control over financial reporting. Accordingly, we express no such opinion. An audit also includes examining, on a test basis, evidence supporting the amounts and disclosures in the financial statements, assessing the accounting principles used and significant estimates made by management, as well as evaluating the overall financial statement presentation. Our procedures included confirmation of securities owned as of December 31, 2008, by correspondence with the custodian and brokers; where replies were not received from brokers, we performed other auditing procedures. We believe that our audits provide a reasonable basis for our opinion.
In our opinion, the financial statements and financial highlights referred to above present fairly, in all material respects, the financial position of MFS Value Portfolio as of December 31, 2008, the results of its operations for the year then ended, the changes in its net assets for each of the two years in the period then ended, and the financial highlights for each of the five years in the period then ended, in conformity with accounting principles generally accepted in the United States of America.
DELOITTE & TOUCHE LLP
Boston, Massachusetts
February 19, 2009
19
TRUSTEES AND OFFICERS – IDENTIFICATION AND BACKGROUND
The Trustees and officers of the Trust, as of February 1, 2009, are listed below, together with their principal occupations during the past five years. (Their titles may have varied during that period.) The address of each Trustee and officer is 500 Boylston Street, Boston, Massachusetts 02116.
| | | | | | |
Name, Date of Birth | | Position(s) Held
with Fund | | Trustee/Officer
Since (1) | | Principal Occupations During the Past Five Years and
Other Directorships (2) |
| INTERESTED TRUSTEE | | | | |
David D. Horn (3) (born 6/07/41) | | Trustee | | April 1986 | | Private investor; Sun Life Assurance Company of Canada, Senior Vice President and General Manager for the United States (until 1997); Director (until March 2004) |
| | |
| INDEPENDENT TRUSTEES | | | | |
J. Kermit Birchfield (born 1/08/40) | | Chairman | | May 1997 | | Consultant; Century Partners, Inc. (investments), Director; Displaytech, Inc. (technology), Director; Dessin Fournir LLC (furniture manufacturer), Director (2005 to present); Intermountain Gas Company, Inc. & Intermountain Industries, Inc. (oil & gas exploration and production), Director; Site Watch LLC (software to monitor oil tanks), Managing Director (2006 to present); Juridica Investments (fund investing in judicial matters), Director (2007 to present); HPSC, Inc. (medical financing), Director (until January 2004) |
| | | |
Robert C. Bishop (born 1/13/43) | | Trustee | | May 2001 | | AutoImmune, Inc. (pharmaceutical product development), Chairman, President and Chief Executive Officer; Caliper Life Sciences Corp. (laboratory analytical instruments), Director; Millipore Corporation (purification/filtration products), Director; Waterstreet Capital (leverage buyouts), Advisory Board (August 2006 to present); Optobionics Corporation (ophthalmic devices), Director (2002 to 2007) |
| | | |
Frederick H. Dulles (born 3/12/42) | | Trustee | | May 2001 | | Ten State International Law PLLC (law firm), Of Counsel (since 2006); Prudential Carolina Real Estate, (real estate), Broker (since 2006); Free Enterprise Foundation, Inc. (research institute), Director & Secretary (until 2008); Disher, Hamrick & Myers Residential, Inc. (real estate) Broker (2005 until 2006); Frederick H. Dulles law practice (until 2006); Ten State Street LLP (law firm), Member (until 2005) |
| | | |
Marcia A. Kean (born 6/30/48) | | Trustee | | April 2005 | | Feinstein Kean Healthcare (consulting), Chief Executive Officer |
| | | |
Ronald G. Steinhart (born 6/15/40) | | Trustee | | May 2001 | | Private investor; Penske Automotive Group (automotive retailer), Director; Animal Health International, Inc. (animal health products), Director (since 2007); Texas Industries (concrete/aggregates/cement), Director (since 2007); Penson Worldwide, Inc. (securities clearance), Director (since 2006); Carreker Corporation (technology consulting) Director (until 2005); Prentiss Properties Trust (real estate investment trust), Director (until 2006) |
| | | |
Haviland Wright (born 7/21/48) | | Trustee | | May 2001 | | Profitability of Hawaii (software), Chief Development Officer (since December 2008); Elixir Technologies Corporation (software) Director (since 2005); Nano Loa Inc. (liquid crystal displays), Director |
| | |
| TRUSTEE EMERITUS | | | | |
Samuel Adams (born 10/19/25) | | Trustee Emeritus | | | | Retired; K&L Gates LLP (law firm), Of Counsel |
| | |
| OFFICERS | | | | |
Maria F. Dwyer (4) (born 12/01/58) | | President | | November 2005 | | Massachusetts Financial Services Company, Executive Vice President and Chief Regulatory Officer (since March 2004) Chief Compliance Officer (since December 2006); Fidelity Management & Research Company, Vice President (prior to March 2004); Fidelity Group of Funds, President and Treasurer (until March 2004) |
| | | |
Christopher R. Bohane (4) (born 1/18/74) | | Assistant Secretary and Assistant Clerk | | July 2005 | | Massachusetts Financial Services Company, Vice President and Senior Counsel |
| | | |
John M. Corcoran (4) (born 4/13/65) | | Treasurer | | October 2008 | | Massachusetts Financial Services Company, Senior Vice President (since October 2008); State Street Bank and Trust (financial services provider), Senior Vice President, (until September 2008) |
| | | |
Ethan D. Corey (4) (born 11/21/63) | | Assistant Secretary and Assistant Clerk | | July 2005 | | Massachusetts Financial Services Company, Senior Vice President and Associate General Counsel (since 2004); Dechert LLP (law firm), Counsel (prior to December 2004) |
| | | |
David L. DiLorenzo (4) (born 8/10/68) | | Assistant Treasurer | | July 2005 | | Massachusetts Financial Services Company, Vice President (since June 2005); JP Morgan Investor Services, Vice President (until June 2005) |
| | | |
Timothy M. Fagan (4) (born 7/10/68) | | Assistant Secretary and Assistant Clerk | | September 2005 | | Massachusetts Financial Services Company, Vice President and Senior Counsel (since September 2005); John Hancock Advisers, LLC, Vice President, Senior Attorney and Chief Compliance Officer (until August 2005) |
20
Trustees and Officers – continued
| | | | | | |
Name, Date of Birth | | Position(s) Held
with Fund | | Trustee/Officer
Since (1) | | Principal Occupations During the Past Five Years and
Other Directorships (2) |
Mark D. Fischer (4) (born 10/27/70) | | Assistant Treasurer | | July 2005 | | Massachusetts Financial Services Company, Vice President (since May 2005); JP Morgan Investment Management Company, Vice President (until May 2005) |
| | | |
Robyn L. Griffin (born 7/04/75) | | Assistant Independent Chief Compliance Officer | | August 2008 | | Griffin Compliance LLC (provider of compliance services), Principal (since August 2008); State Street Corporation (financial services provider), Mutual Fund Administration Assistant Vice President (October 2006 – July 2008); Liberty Mutual Group (insurance), Personal Market Assistant Controller (April 2006 – October 2006); Deloitte & Touche LLP (professional services firm), Senior Manager (prior to April 2006) |
| | | |
Brian E. Langenfeld (4) (born 3/07/73) | | Assistant Secretary and Assistant Clerk | | May 2006 | | Massachusetts Financial Services Company, Vice President and Senior Counsel (since May 2006); John Hancock Advisers, LLC, Assistant Vice President and Counsel (until April 2006) |
| | | |
Ellen Moynihan (4) (born 11/13/57) | | Assistant Treasurer | | May 1997 | | Massachusetts Financial Services Company, Senior Vice President |
| | | |
Susan S. Newton (4) (born 3/07/50) | | Assistant Secretary and Assistant Clerk | | May 2005 | | Massachusetts Financial Services Company, Senior Vice President and Associate General Counsel (since April 2005); John Hancock Advisers, LLC, Senior Vice President, Secretary and Chief Legal Officer (until April 2005) |
| | | |
Susan A. Pereira (4) (born 11/05/70) | | Assistant Secretary and Assistant Clerk | | July 2005 | | Massachusetts Financial Services Company, Vice President and Senior Counsel (since June 2004); Bingham McCutchen LLP (law firm), Associate (until June 2004) |
| | | |
Mark N. Polebaum (4) (born 5/01/52) | | Secretary and Clerk | | February 2006 | | Massachusetts Financial Services Company, Executive Vice President, General Counsel and Secretary (since January 2006); Wilmer Cutler Pickering Hale and Dorr LLP (law firm), Partner (until January 2006) |
| | | |
Frank L. Tarantino (born 3/07/44) | | Independent Chief Compliance Officer | | September 2004 | | Tarantino LLC (provider of compliance services), Principal (since June 2004); CRA Business Strategies Group (consulting services), Executive Vice President (until June 2004) |
| | | |
Richard S. Weitzel (4) (born 7/16/70) | | Assistant Secretary and Assistant Clerk | | October 2007 | | Massachusetts Financial Services Company, Vice President and Assistant General Counsel (since 2004); Massachusetts Department of Business and Technology, General Counsel (until April 2004) |
| | | |
James O. Yost (4) (born 6/12/60) | | Assistant Treasurer | | April 1992 | | Massachusetts Financial Services Company, Senior Vice President |
| (1) | Date first appointed to serve as Trustee/Officer of an MFS fund or a Compass variable account. Each Trustee has served continuously since appointment. |
| (2) | Directorships or trusteeships of companies required to report to the Securities and Exchange Commission (i.e., “public companies”). |
| (3) | “Interested person” of the Trust, within the meaning of the Investment Company Act of 1940 (referred to as the 1940 Act), which is the principal federal law governing investment companies like the Trust, as a result of position with Sun Life of Canada (U.S.). The address of Sun Life of Canada (U.S.) is One Sun Life Executive Park, Wellesley Hills, Massachusetts 02481. |
| (4) | “Interested person” of MFS within the meaning of the 1940 Act. The address of MFS is 500 Boylston Street, Boston, Massachusetts 02116. |
The Trust does not hold annual meetings for the purpose of electing Trustees, and Trustees are not elected for fixed terms. Each Trustee and officer holds office until his or her successor is chosen and qualified, or until his or her earlier death, resignation, retirement or removal.
All Trustees currently serve as Trustees of the Trust and have served in that capacity since originally elected or appointed. All of the Trustees are also Managers of the Compass Variable Accounts. The executive officers of the Trust hold similar offices for the Compass Variable Accounts and other funds in the MFS fund complex. As of January 1, 2009, each Trustee serves as a Trustee or Manager of 35 Accounts/Funds.
The Statement of Additional Information contains further information about the Trustees and is available without charge upon request by calling 1-800-752-7215.
| | |
Investment Adviser
Massachusetts Financial Services Company 500 Boylston Street, Boston, MA 02116-3741 | | Custodian State Street Bank and Trust 1 Lincoln Street, Boston, MA 02111-2900 |
Distributor
MFS Fund Distributors, Inc. 500 Boylston Street, Boston, MA 02116-3741 | | Independent Registered Public Accounting Firm Deloitte & Touche LLP 200 Berkeley Street, Boston, MA 02116 |
Portfolio Managers Nevin Chitkara Steven Gorham | | |
21
BOARD REVIEW OF INVESTMENT ADVISORY AGREEMENT
The Investment Company Act of 1940 requires that both the full Board of Trustees and a majority of the non-interested (“independent”) Trustees, voting separately, annually approve the continuation of the investment advisory agreement between MFS Variable Insurance Trust II (the “Trust”) and Massachusetts Financial Services Company (“MFS”) on behalf of the Fund. The Trustees consider matters bearing on the Fund and the advisory arrangements at their meetings throughout the year, including a review of performance data at each regular meeting. In addition, the independent Trustees met in May and again in July 2008 (“contract review meetings”) for the specific purpose of considering whether to approve the continuation of the investment advisory agreement for the Fund. The independent Trustees were assisted in their evaluation of the investment advisory agreement by independent legal counsel, from whom they received separate legal advice and with whom they met separately from MFS management during various contract review meetings. The independent Trustees were also assisted in this process by the Fund’s Independent Chief Compliance Officer, a full-time senior officer appointed by and reporting to the independent Trustees.
In connection with their deliberations, the Trustees, including the independent Trustees, considered such information and factors as they believed, in light of the legal advice furnished to them and their own business judgment, to be relevant. The investment advisory agreement was considered separately for the Fund, although the Trustees also took into account the common interests of all Funds in the Trust in their review. As described below, the Trustees considered the nature, quality, and extent of the various investment advisory, administrative, and shareholder services performed by MFS under the existing investment advisory agreement and other arrangements with the Trust.
In connection with their contract review meetings, the Trustees received and relied upon materials which included, among other items: (i) information provided by Lipper Inc. on the investment performance of the Fund for various time periods ended December 31, 2007, compared to the investment performance of a group of funds with substantially similar investment classifications/objectives (the “Lipper performance universe”), (ii) information provided by Lipper Inc. on the Fund’s advisory fees and other expenses compared to the advisory fees and other expenses of comparable funds identified by Lipper (the “Lipper expense group”), (iii) information provided by MFS on the advisory fees of comparable portfolios of its other clients, including institutional separate account and other clients, (iv) information as to whether expense waivers, reimbursements or fee “breakpoints” are observed for the Fund, (v) information regarding MFS’ financial results and financial condition, including MFS’ and certain of its affiliates’ estimated profitability from services performed for the Fund, (vi) MFS’ views regarding the outlook for the mutual fund industry and its strategic business plans, (vii) descriptions of various functions performed by MFS for the Trust, such as compliance monitoring and portfolio trading practices, and (viii) information regarding the overall organization of MFS, including information about MFS’ senior management and other personnel providing investment advisory, administrative and other services to the Fund. The comparative performance, fee and expense information prepared and provided by Lipper Inc. was not independently verified, and the independent Trustees did not independently verify any information provided to them by MFS.
The Trustees’ conclusion as to the continuation of the investment advisory agreement was based on comprehensive consideration of all information provided to the Trustees and not the result of any single factor. Some of the factors that figured particularly in the Trustees’ deliberations are described below for the Fund, while individual Trustees may have given different weight to various factors and evaluated the information presented as a whole differently than another Trustee. The Trustees recognized that the fee arrangements for the Fund reflect years of review and discussion between the independent Trustees and MFS, that certain aspects of such arrangements may receive greater scrutiny in some years than others, and that the Trustees’ conclusions may be based, in part, on their consideration of these same arrangements during the course of the year and in prior years.
Based on information provided by Lipper Inc., the Trustees compared the Fund’s total return investment performance to the performance of a peer group of funds over various time periods. The Trustees placed particular emphasis on the total return performance of the Fund’s Initial Class shares in comparison to the performance of funds in its Lipper performance universe over the one-, three- and five-year periods. The Trustees did not rely on performance results for more recent periods, including those shown elsewhere in this report.
The Trustees noted the performance of the Fund’s Initial Class shares was in the 1st quintile relative to the other funds in the Lipper Classification Index for the one-year period (the 1st quintile being the best performers and the 5th quintile being the worst performers). The total return performance of the Fund was also in the 1st quintile for the three-year period and the five-year period ended December 31, 2007, relative to the Lipper performance universe. Based on the nature and quality of services provided by MFS, the Board of Trustees concluded that the Fund’s performance was satisfactory.
In the course of their deliberations, the Trustees took into account information provided by MFS during contract review meetings, as well as during investment review meetings conducted with portfolio management personnel during the course of the year.
22
Board Review of Investment Advisory Agreement – continued
In assessing the reasonableness of the Fund’s advisory fee, the Trustees considered, among other information, the Fund’s advisory fee and the total expense ratio of the Fund’s Initial Class shares as a percentage of average daily net assets, compared to the advisory fee and total expense ratios of its peer group of funds based on information provided by Lipper Inc. The Trustees also considered the advisory fees charged by MFS to institutional accounts. In comparing these fees, the Trustees considered the generally broader scope of services provided by MFS to the Trust than those provided to institutional accounts. The Trustees also considered the higher demands placed on MFS’ investment personnel and trading infrastructure as a result of the daily cash in-flows and out-flows of the Fund, and the impact on MFS and related expenses due to the more extensive regulatory regime to which the Fund is subject, compared to institutional accounts.
In considering the fees, the Trustees noted from the Lipper data that the Fund’s effective advisory fee rate and total expense ratio were each above the median of such fees and expenses of funds in the Lipper expense group. In addition, the Trustees accepted MFS’ offer to continue the expense limitation for the Fund. The Trustees further concluded that the existing breakpoint was sufficient to allow the Fund to benefit from economies of scale as its assets grow. The Trustees concluded that the fees were reasonable in light of the nature and quality of services provided.
The Trustees also considered information prepared by MFS relating to its costs and profits with respect to the Fund and other investment companies and accounts advised by MFS, as well as MFS’ methodologies used to determine and allocate its costs to the Fund and other accounts and products for purposes of estimating profitability.
After reviewing these and other factors described below, the Trustees concluded that the advisory fees charged to the Fund represent reasonable compensation in light of the nature and quality of the services being provided by MFS.
In addition, the Trustees considered MFS’ resources and related efforts to continue to retain, attract and motivate capable personnel to serve the Fund. The Trustees also considered the financial resources of MFS and its parent, Sun Life Financial Inc. The Trustees further considered any advantages and possible disadvantages of having an adviser which also serves other investment companies as well as institutional accounts.
The Trustees also considered the nature, quality, cost, and extent of administrative, transfer agency, and distribution services provided to the Fund by MFS and its affiliates under agreements and plans other than the investment advisory agreement, including the 12b-1 fees the Fund pays to MFS Fund Distributors, Inc., an affiliate of MFS. The Trustees also considered the nature, extent and quality of certain other services MFS performs or arranges on the Fund’s behalf, which may include securities lending programs, directed expense payment programs, class action recovery programs, and MFS’ interaction with third-party service providers, principally custodians and sub-custodians. The Trustees concluded that the various non-advisory services provided by MFS and its affiliates on behalf of the Fund were satisfactory. The Trustees also considered the benefits to MFS from the use of the Fund’s portfolio brokerage commissions to pay for research and other similar services and various other factors. Additionally, the Trustees considered so-called “fall-out benefits” to MFS such as reputational value derived from serving as investment manager to the Trust, and determined that any such benefits derived by MFS were reasonable and fair.
Based on their evaluation of factors that they deemed to be material, including those factors described above, the Board of Trustees, including a majority of the independent Trustees, concluded that the investment advisory agreement should be continued for an additional one-year period, commencing September 1, 2008.
A discussion regarding the Board’s most recent review and renewal of the fund’s Investment Advisory Agreement with MFS is available by clicking on the fund’s name under “Variable Insurance Portfolios-VIT II” in the “Products & Performance” section on the MFS Web site (mfs.com).
23
PROXY VOTING POLICIES AND INFORMATION
A general description of the MFS funds’ proxy voting policies and procedures is available without charge, upon request, by calling
1-800-225-2606, by visiting the Proxy Voting section of mfs.com or by visiting the SEC’s Web site at http://www.sec.gov.
Information regarding how the fund voted proxies relating to portfolio securities during the most recent twelve-month period ended June 30 is available without charge by visiting the Proxy Voting section of mfs.com or by visiting the SEC’s Web site at http://www.sec.gov.
QUARTERLY PORTFOLIO DISCLOSURE
The fund will file a complete schedule of portfolio holdings with the Securities and Exchange Commission (the Commission) for the first and third quarters of each fiscal year on Form N-Q. The fund’s Form N-Q may be reviewed and copied at the:
Public Reference Room
Securities and Exchange Commission
100 F Street, NE, Room 1580
Washington, D.C. 20549
Information on the operation of the Public Reference Room may be obtained by calling the Commission at 1-800-SEC-0330. The fund’s Form N-Q is available on the EDGAR database on the Commission’s Internet Web site at http://www.sec.gov, and copies of this information may be obtained, upon payment of a duplicating fee, by electronic request at the following e-mail address: publicinfo@sec.gov or by writing the Public Reference Section at the above address.
FEDERAL TAX INFORMATION (unaudited)
The following information is provided pursuant to provisions of the Internal Revenue Code.
The fund designates $50,591,730 as capital gain dividends paid during the fiscal year.
For corporate shareholders, 95.82% of the ordinary income dividends paid during the fiscal year qualify for the corporate dividends received deduction.
24
MFS® PRIVACY NOTICE
Privacy is a concern for every investor today. At MFS Investment Management® and the MFS funds, we take this concern very seriously. We want you to understand our policies about the investment products and services that we offer, and how we protect the nonpublic personal information of investors who have a direct relationship with us and our wholly owned subsidiaries.
Throughout our business relationship, you provide us with personal information. We maintain information and records about you, your investments, and the services you use. Examples of the nonpublic personal information we maintain include
| | Ÿ | | data from investment applications and other forms |
| | Ÿ | | share balances and transactional history with us, our affiliates, or others |
| | Ÿ | | facts from a consumer reporting agency |
We do not disclose any nonpublic personal information about our customers or former customers to anyone, except as permitted by law. We may share nonpublic personal information with third parties or certain of our affiliates in connection with servicing your account or processing your transactions. We may share information with companies or financial institutions that perform marketing services on our behalf or with other financial institutions with which we have joint marketing arrangements, subject to any legal requirements.
Authorization to access your nonpublic personal information is limited to appropriate personnel who provide products, services, or information to you. We maintain physical, electronic, and procedural safeguards to help protect the personal information we collect about you.
If you have any questions about the MFS privacy policy, please call 1-800-225-2606 any business day between 8 a.m. and 8 p.m. Eastern time.
Note: If you own MFS products or receive MFS services in the name of a third party such as a bank or broker-dealer, their privacy policy may apply to you instead of ours.
25


MFS® CORE EQUITY PORTFOLIO
Report is prepared for the general information of contract owners. It is authorized for distribution to prospective investors only when preceded or accompanied by a current prospectus.
NOT FDIC INSURED Ÿ MAY LOSE VALUE Ÿ NO BANK GUARANTEE Ÿ NOT A DEPOSIT Ÿ NOT INSURED BY ANY FEDERAL GOVERNMENT AGENCY OR NCUA/NCUSIF
LETTER FROM THE CEO

Dear Contract Owners:
The market downturns and economic setbacks of late probably rank among the worst financial declines most of us have experienced. Inevitably, people may be questioning their commitment to investing. Still, it is important to remember that downturns are an inescapable part of the business cycle. Such troughs have been seen before, and if we can use history as a guide, market recoveries typically have followed.
Recent events have clearly shown us the value of certain types of investments. In this environment, two of the hallmarks of mutual funds — transparency and liquidity — have become critically important. Unlike some other types of investments, the operations of mutual funds are relatively transparent to their shareholders. With their daily redemption feature, mutual funds also generally provide easy, convenient access to one’s money. Through these recent market upheavals, this level of liquidity enhanced the ability of mutual fund investors to respond and modify their investments as they and their advisors saw fit — a flexibility that those in less liquid investments simply did not have at their disposal.
At MFS® we take particular pride in how well mutual funds can serve investors because we invented the mutual fund in the United States. Established in 1924, Massachusetts Investors Trust was the nation’s first fund. Recent market events only reinforce what we have learned through 85 years — that mutual funds provide unique features that are important to investors in any type of market climate.
Respectfully,

Robert J. Manning
Chief Executive Officer and Chief Investment Officer
MFS Investment Management®
February 17, 2009
The opinions expressed in this letter are subject to change, may not be relied upon for investment advice, and no forecasts can be guaranteed.
Before investing, consider the fund’s investment objectives, risks, charges, and expenses. For a prospectus containing this and other information, contact your investment professional or view online. Read it carefully.
MFS Fund Distributors, Inc., 500 Boylston Street, Boston, MA 02116
1
PORTFOLIO COMPOSITION
Portfolio structure
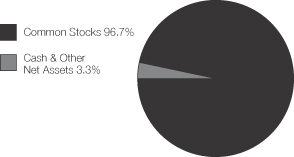
| | |
| Top ten holdings | | |
| Chevron Corp. | | 2.9% |
| Danaher Corp. | | 2.9% |
| Exxon Mobil Corp. | | 2.4% |
| AT&T, Inc. | | 2.3% |
| Merck & Co., Inc. | | 2.1% |
| JPMorgan Chase & Co. | | 1.8% |
| Apple, Inc. | | 1.8% |
| Procter & Gamble Co. | | 1.7% |
| MetLife, Inc. | | 1.7% |
| Coca-Cola Co. | | 1.7% |
| | |
| Equity sectors | | |
| Financial Services | | 15.2% |
| Health Care | | 13.4% |
| Technology | | 13.3% |
| Energy | | 11.9% |
| Consumer Staples | | 9.3% |
| Industrial Goods & Services | | 8.4% |
| Utilities & Communications | | 7.8% |
| Retailing | | 6.2% |
| Leisure | | 3.9% |
| Special Products & Services | | 2.7% |
| Basic Materials | | 2.3% |
| Transportation | | 1.6% |
| Autos & Housing | | 0.7% |
Percentages are based on net assets as of 12/31/08.
The portfolio is actively managed and current holdings may be different.
2
MANAGEMENT REVIEW
Summary of Results
For the twelve months ended December 31, 2008, Initial Class shares of the MFS Core Equity Portfolio (the “fund”) provided a total return of –38.63%, while Service Class shares of the fund provided a total return of –38.79%. These returns include the impact of a material class action settlement received by the fund during the reporting period (see Performance Summary for details). The fund’s returns compare with a return of –37.31% for the fund’s benchmark, the Russell 3000 Index.
Market Environment
The U.S. economy and financial markets experienced significant deterioration and extraordinary volatility over the reporting period. U.S. economic growth slowed significantly, despite the short-term bounce from the second quarter fiscal stimulus. Strong domestic headwinds included accelerated deterioration in the housing market, anemic corporate investment, a rapidly declining job market, and a much tighter credit environment. During the period, a seemingly continuous series of tumultuous financial events hammered markets, including: the distressed sale of failing Bear Stearns to JPMorgan, the conservatorship of Government Sponsored Enterprises (GSEs) Fannie Mae and Freddie Mac, the bankruptcy of investment bank Lehman Brothers, the Federal Reserve Bank’s complex intervention of insurance company American International Group (AIG), the nationalization of several large European banks, the failure of Washington Mutual, and the distressed sale of Wachovia. As a result of this barrage of turbulent news, global equity markets pushed significantly lower and credit markets witnessed the worst dislocation since the beginning of the credit crisis. Though conditions improved towards the end of the period, the state of financial and macroeconomic dislocation remained severe.
While reasonably resilient during the first half of the period, the global economy and financial system increasingly experienced considerable negative spillovers from the U.S. slowdown. Not only did Europe and Japan show obvious signs of economic softening, the more powerful engine of global growth – emerging markets – also displayed weakening dynamics.
During the reporting period, the U.S. Federal Reserve Board cut interest rates aggressively and introduced a multitude of new lending facilities to alleviate ever-tightening credit markets, while the U.S. federal government moved quickly to design and implement a meaningful fiscal stimulus package. Although several other global central banks also cut rates, the dilemma of rising energy and food prices heightened concerns among central bankers that inflationary expectations might become unhinged despite weaker growth. Only later in the reporting period did slowing global growth result in a very precipitous decline in commodity prices, which significantly eased inflation and inflationary expectations. As inflationary concerns diminished in the face of global deleveraging, and equity and credit markets deteriorated more sharply, a coordinated rate cut marked the beginning of much more aggressive easing by the major global central banks.
Detractors from Performance
Stock selection in the health care sector was the principal detractor from the fund’s performance relative to the Russell 3000 Index. The fund’s positioning in health insurance provider CIGNA (g) and eye care medical products maker Advanced Medical Optics (g) hindered relative results as we held these stocks while their respective prices significantly declined. Shares of Advanced Medical Optics suffered due to a weaker revenue outlook as a result of weakness in its U.S. Lasik procedures. Demand for this relatively costly elective procedure is expected to decline during this period of economic weakness. In addition, the stock was pressured by a previously announced recall of its lens solutions products. Our underweighted position in diversified medical products maker Johnson & Johnson was another relative detractor within this sector.
Security selection in the retailing sector also dampened relative returns. Not owning shares of retail giant Wal-Mart for the majority of the period negatively affected relative results as the stock significantly outperformed the market throughout the year. The fund’s holdings of women’s apparel company Ann Taylor (g) and home furnishings and décor retailer Pier 1 Imports (g) also negatively affected relative results. Shares of Pier 1 Imports declined after the company’s same-store sales fell more than expected.
Security selection in the energy sector also detracted from relative performance. Our underweighted position in integrated oil and gas giant Exxon Mobil, which outperformed the benchmark over the reporting period, was the most significant relative detractor in this sector.
Elsewhere, Canadian mining company Teck Cominco (aa), commercial banking firm Sovereign Bancorp, and specialty finance company Euro Dekania (aa) were among the fund’s top relative detractors.
During the reporting period, the fund’s currency exposure was a detractor from relative performance. All of MFS’ investment decisions are driven by the fundamentals of each individual opportunity and as such, it is common for our funds to have different currency exposure than the benchmark.
3
Management Review – continued
Contributors to Performance
Stock selection in the financial services sector contributed to the fund’s relative performance during the reporting period. Not owning insurance firm American International Group (AIG) and financial services firm Citigroup helped relative results as these firms’ stock prices suffered amid the current turmoil in the financial markets. Insurance company Chubb Corp., real estate investment trust firm Mack-Cali Realty, and Bermuda-based property and casualty insurance provider Allied World Assurance were also relative contributors within the sector as these firms outperformed the index. Shares of Allied World Assurance rose after the company reported strong earnings during the latter part of the reporting period. The fund’s holdings of global property and casualty insurance firm ACE Limited (Bermuda) and banking firm UnionBanCal (g) also benefited relative returns.
Security selection in the industrial goods and services sector aided relative performance. Not holding weak-performing diversified industrial conglomerate General Electric was one of the significant factors in this result.
Although stock selection in the autos and housing sector had a positive impact on relative performance, no individual stocks within this sector were among the fund’s top contributors for the reporting period.
Elsewhere, the fund’s overweighted position in global biotech company Genzyme had a positive impact on relative returns. The timing of our ownership of automotive parts retailer O’Reilly Automotive resulted in positive contribution to the fund’s relative results.
Respectfully,
| | |
| Joseph MacDougall | | Katrina Mead |
| Portfolio Manager | | Portfolio Manager |
Note to Shareholders: Effective May 1, 2008, Joseph MacDougall became a co-manager of the fund.
(aa) | | Security is not a benchmark constituent. |
| (g) | | Security was not held in the portfolio at period end. |
The views expressed in this report are those of the portfolio managers only through the end of the period of the report as stated on the cover and do not necessarily reflect the views of MFS or any other person in the MFS organization. These views are subject to change at any time based on market or other conditions, and MFS disclaims any responsibility to update such views. These views may not be relied upon as investment advice or an indication of trading intent on behalf of any MFS portfolio. References to specific securities are not recommendations of such securities, and may not be representative of any MFS portfolio’s current or future investments.
4
PERFORMANCE SUMMARY THROUGH 12/31/08
The following chart illustrates the historical performance of the fund in comparison to its benchmark(s). Benchmark comparisons are unmanaged; do not reflect any fees or expenses; and cannot be invested in directly. The performance of other share classes will be greater than or less than that of the class depicted below. (See Notes to Performance Summary.)
Performance data shown represents past performance and is no guarantee of future results. Investment return and principal value fluctuate so your units, when sold, may be worth more or less than the original cost; current performance may be lower or higher than quoted. The performance shown does not reflect the deduction of taxes, if any, that a contract holder would pay on fund distributions or the redemption of contract units. The returns for the fund shown also do not reflect the deduction of expenses associated with variable products, such as mortality and expense risk charges, separate account charges, and sales charges imposed by the insurance company separate accounts. Such expenses would reduce the overall returns shown.
Growth of a hypothetical $10,000 investment
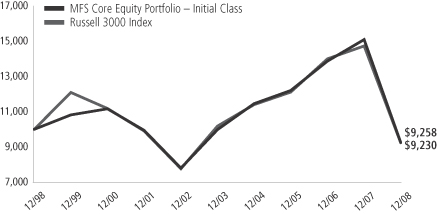
Total rates of return through 12/31/08
Average Annual Total Returns
| | | | | | | | | | | | |
| | | Share class | | Class inception date | | 1-yr | | 5-yr | | 10-yr | | |
| | | Initial Class | | 5/12/97 | | (38.63)% | | (1.51)% | | (0.77)% | | |
| | | Service Class | | 8/24/01 | | (38.79)% | | (1.76)% | | (0.95)% | | |
Comparative Benchmark
| | | | | | | | | | | | |
| | | Russell 3000 Index (f) | | (37.31)% | | (1.95)% | | (0.80)% | | |
| (f) | Source: FactSet Research Systems Inc. |
Included in the Initial Class and Service Class total returns for the year ended December 31, 2008 are proceeds received from a non-recurring litigation settlement with Enron Corp., had these proceeds not been included the 1-yr total returns would have each been lower by approximately 1.32%.
Benchmark Definition
Russell 3000 Index – constructed to provide a comprehensive barometer for the 3,000 largest U.S. companies based on total market capitalization, which represents approximately 98% of the investable U.S. equity market.
It is not possible to invest directly in an index.
Notes to Performance Summary
Performance for the Service Class includes the performance of the fund’s Initial Class for periods prior to their offering. Because Service Class expenses are higher than those of Initial Class, performance shown for Service Class is higher than it would have been had it been offered for the entire period. Performance has not been adjusted to take into account differences in class specific operating expenses (such as Rule 12b-1 fees). Please see the prospectus for additional information about performance and expenses.
Performance results reflect any applicable expense subsidies and waivers in effect during the periods shown. Without such subsidies and waivers the fund’s performance results would be less favorable. Please see the prospectus for complete details. All results are historical and assume the reinvestment of any dividends and capital gains distributions.
From time to time the fund may receive proceeds from litigation settlements, without which performance would be lower.
5
EXPENSE TABLE
Fund Expenses Borne by the Contract Holders During the Period,
July 1, 2008 through December 31, 2008
As a contract holder of the fund, you incur ongoing costs, including management fees; distribution (12b-1) fees; and other fund expenses. This example is intended to help you understand your ongoing costs (in dollars) of investing in the fund and to compare these costs with the ongoing costs of investing in other mutual funds.
The example is based on an investment of $1,000 invested at the beginning of the period and held for the entire period July 1, 2008 through December 31, 2008.
Actual Expenses
The first line for each share class in the following table provides information about actual account values and actual expenses. You may use the information in this line, together with the amount you invested, to estimate the expenses that you paid over the period. Simply divide your account value by $1,000 (for example, an $8,600 account value divided by $1,000 = 8.6), then multiply the result by the number in the first line under the heading entitled “Expenses Paid During Period” to estimate the expenses you paid on your account during this period.
Hypothetical Example for Comparison Purposes
The second line for each share class in the following table provides information about hypothetical account values and hypothetical expenses based on the fund’s actual expense ratio and an assumed rate of return of 5% per year before expenses, which is not the fund’s actual return. The hypothetical account values and expenses may not be used to estimate the actual ending account balance or expenses you paid for the period. You may use this information to compare the ongoing costs of investing in the fund and other funds. To do so, compare this 5% hypothetical example with the 5% hypothetical examples that appear in the shareholder reports of the other funds.
Please note that the expenses shown in the table are meant to highlight the fund’s ongoing costs only and do not take into account the fees and expenses imposed under the variable contracts through which your investment in the fund is made. Therefore, the second line for each share class in the table is useful in comparing ongoing costs associated with an investment in vehicles (such as the fund) which fund benefits under variable annuity and variable life insurance contracts and to qualified pension and retirement plans only, and will not help you determine the relative total costs of investing in the fund through variable annuity and variable life insurance contracts. If the fees and expenses imposed under the variable contracts were included, your costs would have been higher.
| | | | | | | | | | |
| Share Class | | | | Annualized
Expense Ratio | | Beginning
Account Value
7/01/08 | | Ending
Account Value
12/31/08 | | Expenses Paid
During Period (p)
7/01/08-12/31/08 |
| Initial Class | | Actual | | 0.85% | | $1,000.00 | | $688.32 | | $3.61 |
| | Hypothetical (h) | | 0.85% | | $1,000.00 | | $1,020.86 | | $4.32 |
| Service Class | | Actual | | 1.10% | | $1,000.00 | | $687.73 | | $4.67 |
| | Hypothetical (h) | | 1.10% | | $1,000.00 | | $1,019.61 | | $5.58 |
| (h) | 5% class return per year before expenses. |
| (p) | Expenses paid is equal to each class’ annualized expense ratio, as shown above, multiplied by the average account value over the period, multiplied by the number of days in the period, divided by the number of days in the year. |
6
PORTFOLIO OF INVESTMENTS – 12/31/08
The Portfolio of Investments is a complete list of all securities owned by your fund. It is categorized by broad-based asset classes.
| | | | | |
| Issuer | | Shares/Par | | Value ($) |
| | | | | |
| COMMON STOCKS – 96.7% | | | | | |
| Aerospace – 2.8% | | | | | |
| Lockheed Martin Corp. | | 20,980 | | $ | 1,763,998 |
| Northrop Grumman Corp. | | 11,880 | | | 535,075 |
| United Technologies Corp. | | 19,550 | | | 1,047,880 |
| | | | | |
| | | | $ | 3,346,953 |
| | | | | |
| Airlines – 0.3% | | | | | |
| Copa Holdings S.A., “A” | | 7,530 | | $ | 228,310 |
| UAL Corp. | | 8,740 | | | 96,315 |
| | | | | |
| | | | $ | 324,625 |
| | | | | |
| Alcoholic Beverages – 0.3% | | | | | |
| Molson Coors Brewing Co. | | 7,010 | | $ | 342,929 |
| | | | | |
| Apparel Manufacturers – 0.7% | | | | | |
| NIKE, Inc., “B” | | 16,240 | | $ | 828,240 |
| | | | | |
| Biotechnology – 2.0% | | | | | |
| Affymetrix, Inc. (a) | | 29,850 | | $ | 89,252 |
| Genzyme Corp. (a) | | 24,811 | | | 1,646,706 |
| Gilead Sciences, Inc. (a) | | 12,240 | | | 625,954 |
| | | | | |
| | | | $ | 2,361,912 |
| | | | | |
| Broadcasting – 1.5% | | | | | |
| Omnicom Group, Inc. | | 17,360 | | $ | 467,331 |
| Time Warner, Inc. | | 50,300 | | | 506,018 |
| Walt Disney Co. | | 36,650 | | | 831,589 |
| | | | | |
| | | | $ | 1,804,938 |
| | | | | |
| Brokerage & Asset Managers – 1.8% | | | | | |
| Affiliated Managers Group, Inc. (a) | | 8,330 | | $ | 349,194 |
| Deutsche Boerse AG | | 6,910 | | | 503,271 |
| GFI Group, Inc. | | 52,290 | | | 185,107 |
| Invesco Ltd. | | 31,090 | | | 448,940 |
| MarketAxess Holdings, Inc. (a) | | 24,300 | | | 198,288 |
| TD AMERITRADE Holding Corp. (a) | | 30,010 | | | 427,642 |
| | | | | |
| | | | $ | 2,112,442 |
| | | | | |
| Business Services – 1.8% | | | | | |
| Accenture Ltd. | | 20,050 | | $ | 657,440 |
| Amdocs Ltd. (a) | | 27,820 | | | 508,828 |
| MasterCard, Inc., “A” | | 2,890 | | | 413,068 |
| Visa, Inc. | | 4,330 | | | 227,108 |
| Western Union Co. | | 27,200 | | | 390,048 |
| | | | | |
| | | | $ | 2,196,492 |
| | | | | |
| Cable TV – 0.8% | | | | | |
| Comcast Corp., “Special A” | | 35,250 | | $ | 569,287 |
| Time Warner Cable, Inc., “A” (a) | | 16,750 | | | 359,287 |
| | | | | |
| | | | $ | 928,574 |
| | | | | |
| Chemicals – 1.1% | | | | | |
| 3M Co. | | 11,170 | | $ | 642,722 |
| Celanese Corp. | | 12,600 | | | 156,618 |
| Ecolab, Inc. | | 7,680 | | | 269,952 |
| PPG Industries, Inc. | | 4,730 | | | 200,694 |
| | | | | |
| | | | $ | 1,269,986 |
| | | | | |
| | | | | |
| Issuer | | Shares/Par | | Value ($) |
| | | | | |
| COMMON STOCKS – continued | | | | | |
| Computer Software – 3.3% | | | | | |
| MicroStrategy, Inc., “A” (a) | | 33,670 | | $ | 1,250,167 |
| MSC. Software Corp. (a) | | 79,396 | | | 530,365 |
| Oracle Corp. (a) | | 80,100 | | | 1,420,173 |
| VeriSign, Inc. (a) | | 35,650 | | | 680,202 |
| | | | | |
| | | | $ | 3,880,907 |
| | | | | |
| Computer Software – Systems – 3.6% | | | | | |
| Apple, Inc. (a) | | 24,930 | | $ | 2,127,776 |
| Hewlett-Packard Co. | | 44,420 | | | 1,612,002 |
| Solera Holdings, Inc. (a) | | 21,450 | | | 516,945 |
| | | | | |
| | | | $ | 4,256,723 |
| | | | | |
| Construction – 0.7% | | | | | |
| Pulte Homes, Inc. | | 56,520 | | $ | 617,764 |
| Sherwin-Williams Co. | | 3,080 | | | 184,030 |
| | | | | |
| | | | $ | 801,794 |
| | | | | |
| Consumer Goods & Services – 3.9% | | | | | |
| Capella Education Co. (a) | | 5,730 | | $ | 336,695 |
| Colgate-Palmolive Co. | | 22,830 | | | 1,564,768 |
| New Oriental Education & Technology Group, Inc., ADR (a) | | 12,810 | | | 703,397 |
| Procter & Gamble Co. | | 33,510 | | | 2,071,588 |
| | | | | |
| | | | $ | 4,676,448 |
| | | | | |
| Containers – 0.2% | | | | | |
| Crown Holdings, Inc. (a) | | 12,120 | | $ | 232,704 |
| | | | | |
| Electrical Equipment – 3.4% | | | | | |
| Danaher Corp. | | 60,310 | | $ | 3,414,149 |
| Rockwell Automation, Inc. | | 18,630 | | | 600,631 |
| | | | | |
| | | | $ | 4,014,780 |
| | | | | |
| Electronics – 2.8% | | | | | |
| Applied Materials, Inc. | | 18,430 | | $ | 186,696 |
| Atheros Communications, Inc. (a) | | 10,600 | | | 151,686 |
| Flextronics International Ltd. (a) | | 76,749 | | | 196,477 |
| Hittite Microwave Corp. (a) | | 12,300 | | | 362,358 |
| Intel Corp. | | 69,980 | | | 1,025,907 |
| Marvell Technology Group Ltd. (a) | | 54,740 | | | 365,116 |
| National Semiconductor Corp. | | 32,760 | | | 329,893 |
| SanDisk Corp. (a)(l) | | 51,660 | | | 495,936 |
| Silicon Laboratories, Inc. (a) | | 11,390 | | | 282,244 |
| | | | | |
| | | | $ | 3,396,313 |
| | | | | |
| Energy – Independent – 2.9% | | | | | |
| Apache Corp. | | 6,050 | | $ | 450,907 |
| CONSOL Energy, Inc. | | 6,300 | | | 180,054 |
| Devon Energy Corp. | | 6,570 | | | 431,715 |
| EOG Resources, Inc. | | 8,520 | | | 567,262 |
| Occidental Petroleum Corp. | | 9,900 | | | 593,901 |
| Ultra Petroleum Corp. (a) | | 7,700 | | | 265,727 |
| XTO Energy, Inc. | | 26,770 | | | 944,178 |
| | | | | |
| | | | $ | 3,433,744 |
| | | | | |
7
Portfolio of Investments – continued
| | | | | |
| Issuer | | Shares/Par | | Value ($) |
| | | | | |
| COMMON STOCKS – continued | | | | | |
| Energy – Integrated – 7.3% | | | | | |
| BP PLC | | 55,190 | | $ | 422,882 |
| Chevron Corp. | | 46,350 | | | 3,428,509 |
| Exxon Mobil Corp. | | 36,246 | | | 2,893,518 |
| Hess Corp. | | 12,540 | | | 672,646 |
| Royal Dutch Shell PLC, “A” | | 33,770 | | | 882,759 |
| TOTAL S.A. | | 8,170 | | | 445,409 |
| | | | | |
| | | | $ | 8,745,723 |
| | | | | |
| Engineering – Construction – 1.0% | | | | | |
| Fluor Corp. | | 23,410 | | $ | 1,050,407 |
| North American Energy Partners, Inc. (a) | | 42,280 | | | 141,215 |
| | | | | |
| | | | $ | 1,191,622 |
| | | | | |
| Food & Beverages – 4.1% | | | | | |
| Coca-Cola Co. | | 43,510 | | $ | 1,969,698 |
| Hain Celestial Group, Inc. (a) | | 14,630 | | | 279,287 |
| J.M. Smucker Co. | | 9,670 | | | 419,291 |
| Pepsi Bottling Group, Inc. | | 14,250 | | | 320,768 |
| PepsiCo, Inc. | | 34,597 | | | 1,894,878 |
| | | | | |
| | | | $ | 4,883,922 |
| | | | | |
| Food & Drug Stores – 1.1% | | | | | |
| CVS Caremark Corp. | | 32,330 | | $ | 929,164 |
| Kroger Co. | | 15,870 | | | 419,127 |
| | | | | |
| | | | $ | 1,348,291 |
| | | | | |
| Gaming & Lodging – 0.5% | | | | | |
| International Game Technology | | 14,220 | | $ | 169,076 |
| Las Vegas Sands Corp. (a) | | 8,480 | | | 50,286 |
| Pinnacle Entertainment, Inc. (a) | | 18,280 | | | 140,390 |
| Royal Caribbean Cruises Ltd. | | 13,900 | | | 191,125 |
| | | | | |
| | | | $ | 550,877 |
| | | | | |
| General Merchandise – 1.2% | | | | | |
| Kohl’s Corp. (a) | | 16,410 | | $ | 594,042 |
| Wal-Mart Stores, Inc. | | 15,470 | | | 867,248 |
| | | | | |
| | | | $ | 1,461,290 |
| | | | | |
| Health Maintenance Organizations – 0.6% | | | |
| WellPoint, Inc. (a) | | 18,010 | | $ | 758,761 |
| | | | | |
| Insurance – 4.4% | | | | | |
| ACE Ltd. | | 19,050 | | $ | 1,008,126 |
| Allied World Assurance Co. Holdings Ltd. | | 25,170 | | | 1,021,902 |
| Chubb Corp. | | 23,930 | | | 1,220,430 |
| MetLife, Inc. | | 57,600 | | | 2,007,936 |
| | | | | |
| | | | $ | 5,258,394 |
| | | | | |
| Internet – 1.2% | | | | | |
| Google, Inc., “A” (a) | | 4,480 | | $ | 1,378,272 |
| | | | | |
| Leisure & Toys – 0.7% | | | | | |
| Hasbro, Inc. | | 15,780 | | $ | 460,303 |
| Ubisoft Entertainment S.A. (a) | | 21,981 | | | 429,761 |
| | | | | |
| | | | $ | 890,064 |
| | | | | |
| | | | | |
| Issuer | | Shares/Par | | Value ($) |
| | | | | |
| COMMON STOCKS – continued | | | | | |
| Machinery & Tools – 1.0% | | | | | |
| Bucyrus International, Inc. | | 10,930 | | $ | 202,424 |
| Eaton Corp. | | 13,260 | | | 659,155 |
| Roper Industries, Inc. | | 7,440 | | | 322,970 |
| | | | | |
| | | | $ | 1,184,549 |
| | | | | |
| Major Banks – 5.3% | | | | | |
| Bank of America Corp. | | 70,386 | | $ | 991,035 |
| Bank of New York Mellon Corp. | | 25,275 | | | 716,041 |
| JPMorgan Chase & Co. | | 69,710 | | | 2,197,956 |
| State Street Corp. | | 16,580 | | | 652,091 |
| Wells Fargo & Co. | | 61,390 | | | 1,809,777 |
| | | | | |
| | | | $ | 6,366,900 |
| | | | | |
| Medical & Health Technology & Services – 1.4% | | | |
| DaVita, Inc. (a) | | 8,180 | | $ | 405,483 |
| MWI Veterinary Supply, Inc. (a) | | 19,000 | | | 512,240 |
| Patterson Cos., Inc. (a) | | 41,000 | | | 768,750 |
| | | | | |
| | | | $ | 1,686,473 |
| | | | | |
| Medical Equipment – 2.4% | | | | | |
| Medtronic, Inc. | | 45,330 | | $ | 1,424,269 |
| NxStage Medical, Inc. (a) | | 17,270 | | | 46,111 |
| NxStage Medical, Inc. (a)(z) | | 68,214 | | | 182,131 |
| Waters Corp. (a) | | 20,600 | | | 754,990 |
| Zimmer Holdings, Inc. (a) | | 11,510 | | | 465,234 |
| | | | | |
| | | | $ | 2,872,735 |
| | | | | |
| Metals & Mining – 0.1% | | | | | |
| Cameco Corp. | | 4,740 | | $ | 81,765 |
| | | | | |
| Natural Gas – Pipeline – 0.4% | | | | | |
| Williams Cos., Inc. | | 30,510 | | $ | 441,785 |
| | | | | |
| Network & Telecom – 1.6% | | | | | |
| Ciena Corp. (a) | | 17,640 | | $ | 118,188 |
| Cisco Systems, Inc. (a) | | 70,100 | | | 1,142,630 |
| F5 Networks, Inc. (a) | | 7,370 | | | 168,478 |
| Research in Motion Ltd. (a) | | 11,600 | | | 470,728 |
| | | | | |
| | | | $ | 1,900,024 |
| | | | | |
| Oil Services – 1.7% | | | | | |
| Exterran Holdings, Inc. (a)(l) | | 9,290 | | $ | 197,877 |
| Halliburton Co. | | 36,640 | | | 666,115 |
| Helix Energy Solutions Group, Inc. (a) | | 14,390 | | | 104,184 |
| Nabors Industries Ltd. (a) | | 7,920 | | | 94,802 |
| Noble Corp. | | 33,100 | | | 731,179 |
| Transocean, Inc. (a) | | 5,450 | | | 257,512 |
| | | | | |
| | | | $ | 2,051,669 |
| | | | | |
| Other Banks & Diversified Financials – 1.9% | | | |
| Discover Financial Services | | 21,250 | | $ | 202,512 |
| Euro Dekania Ltd. (a)(z) | | 100,530 | | | 291,503 |
| New York Community Bancorp, Inc. | | 63,490 | | | 759,340 |
| Sovereign Bancorp, Inc. (a) | | 345,000 | | | 1,028,100 |
| | | | | |
| | | | $ | 2,281,455 |
| | | | | |
| Personal Computers & Peripherals – 0.8% | | | | | |
| NetApp, Inc. (a) | | 66,990 | | $ | 935,850 |
| | | | | |
8
Portfolio of Investments – continued
| | | | | |
| Issuer | | Shares/Par | | Value ($) |
| | | | | |
| COMMON STOCKS – continued | | | | | |
| Pharmaceuticals – 7.0% | | | | | |
| Allergan, Inc. | | 33,240 | | $ | 1,340,237 |
| Johnson & Johnson | | 22,300 | | | 1,334,209 |
| Merck & Co., Inc. | | 81,170 | | | 2,467,568 |
| Schering-Plough Corp. | | 75,990 | | | 1,294,110 |
| Teva Pharmaceutical Industries Ltd., ADR | | 12,270 | | | 522,334 |
| Wyeth | | 37,310 | | | 1,399,498 |
| | | | | |
| | | | $ | 8,357,956 |
| | | | | |
| Pollution Control – 0.2% | | | | | |
| Republic Services, Inc. | | 11,400 | | $ | 282,606 |
| | | | | |
| Precious Metals & Minerals – 0.1% | | | | | |
| Teck Cominco Ltd., “B” | | 24,930 | | $ | 121,570 |
| | | | | |
| Railroad & Shipping – 0.3% | | | | | |
| Canadian National Railway Co. | | 9,600 | | $ | 352,896 |
| | | | | |
| Real Estate – 1.8% | | | | | |
| Apartment Investment & Management, “A”, REIT | | 31,193 | | $ | 360,279 |
| Kilroy Realty Corp., REIT | | 5,370 | | | 179,680 |
| Mack-Cali Realty Corp., REIT | | 67,140 | | | 1,644,930 |
| | | | | |
| | | | $ | 2,184,889 |
| | | | | |
| Restaurants – 0.4% | | | | | |
| Red Robin Gourmet Burgers, Inc. (a) | | 31,710 | | $ | 533,679 |
| | | | | |
| Specialty Chemicals – 0.8% | | | | | |
| Praxair, Inc. | | 15,720 | | $ | 933,139 |
| | | | | |
| Specialty Stores – 3.2% | | | | | |
| Abercrombie & Fitch Co., “A” | | 22,000 | | $ | 507,540 |
| Dick’s Sporting Goods, Inc. (a) | | 68,670 | | | 968,934 |
| Nordstrom, Inc. | | 34,410 | | | 457,997 |
| O’Reilly Automotive, Inc. (a) | | 29,430 | | | 904,678 |
| Staples, Inc. | | 30,460 | | | 545,843 |
| Tiffany & Co. | | 17,370 | | | 410,453 |
| | | | | |
| | | | $ | 3,795,445 |
| | | | | |
| Telecommunications – Wireless – 0.5% | | | | | |
| Cellcom Israel Ltd. | | 3,500 | | $ | 77,350 |
| Rogers Communications, Inc., “B” | | 18,010 | | | 533,808 |
| | | | | |
| | | | $ | 611,158 |
| | | | | |
| Telephone Services – 3.1% | | | | | |
| AT&T, Inc. | | 96,390 | | $ | 2,747,115 |
| BCE, Inc. | | 15,800 | | | 323,742 |
| Verizon Communications, Inc. | | 19,200 | | | 650,880 |
| | | | | |
| | | | $ | 3,721,737 |
| | | | | |
| Tobacco – 1.9% | | | | | |
| Lorillard, Inc. | | 13,450 | | $ | 757,907 |
| Philip Morris International, Inc. | | 35,520 | | | 1,545,475 |
| | | | | |
| | | | $ | 2,303,382 |
| | | | | |
| | | | | |
| Issuer | | Shares/Par | | Value ($) |
| | | | | |
| COMMON STOCKS – continued | | | | | |
| Trucking – 1.0% | | | | | |
| FedEx Corp. | | 7,270 | | $ | 466,371 |
| J.B. Hunt Transport Services, Inc. | | 16,810 | | | 441,599 |
| United Parcel Service, Inc., “B” | | 4,400 | | | 242,704 |
| | | | | |
| | | | $ | 1,150,674 |
| | | | | |
| Utilities – Electric Power – 3.8% | | | | | |
| CMS Energy Corp. | | 39,400 | | $ | 398,334 |
| Dominion Resources, Inc. | | 19,860 | | | 711,782 |
| Exelon Corp. | | 9,530 | | | 529,963 |
| FirstEnergy Corp. | | 9,120 | | | 443,050 |
| NRG Energy, Inc. (a) | | 27,350 | | | 638,075 |
| PG&E Corp. | | 13,040 | | | 504,778 |
| PPL Corp. | | 19,610 | | | 601,831 |
| Public Service Enterprise Group, Inc. | | 23,000 | | | 670,910 |
| | | | | |
| | | | $ | 4,498,723 |
| | | | | |
Total Common Stocks (Identified Cost, $160,013,854) | | | | $ | 115,328,779 |
| | | | | |
| | | | | | | | | | |
| | | Strike
Price | | First
Exercise | | | | |
| | | | | | | | | | |
| | | |
| WARRANTS – 0.0% | | | | | | | |
| Medical Equipment – 0.0% | | | | | | | |
| NxStage Medical, Inc. (1 share for 1 warrant) (Identified Cost, $37,441) (a)(z) | | $ | 5.50 | | 8/01/08 | | 13,643 | | $ | 21,638 |
| | | | | | | | | | |
| | | | | | | |
| | | | | | | |
|
| REPURCHASE AGREEMENTS – 3.1% | |
| Goldman Sachs, 0.01%, dated 12/31/08, due 1/02/09, total to be received $2,233,001 (secured by various U.S. Treasury and Federal Agency obligations and Mortgage Backed securities in a jointly traded account) | | $ | 2,233,000 | | $ | 2,233,000 | |
| Morgan Stanley, 0.02%, dated 12/31/08, due 1/02/09, total to be received $1,500,002 (secured by various U.S. Treasury and Federal Agency obligations and Mortgage Backed securities in a jointly traded account) | | | 1,500,000 | | | 1,500,000 | |
| | | | | | | |
| Total Repurchase Agreements, at Cost | | | | | $ | 3,733,000 | |
| | | | | | | |
|
| COLLATERAL FOR SECURITIES LOANED – 0.5% | |
| Navigator Securities Lending Prime Portfolio, at Cost and Net Asset Value | | | 573,817 | | $ | 573,817 | |
| | | | | | | |
Total Investments (Identified Cost, $164,358,112) | | | | | $ | 119,657,234 | |
| | | | | | | |
OTHER ASSETS, LESS LIABILITIES – (0.3)% | | | | | | (325,149 | ) |
| | | | | | | |
| Net Assets – 100.0% | | | | | $ | 119,332,085 | |
| | | | | | | |
9
Portfolio of Investments – continued
| (a) | Non-income producing security. |
| (l) | All or a portion of this security is on loan. |
| (z) | Restricted securities are not registered under the Securities Act of 1933 and are subject to legal restrictions on resale. These securities generally may be resold in transactions exempt from registration or to the public if the securities are subsequently registered. Disposal of these securities may involve time-consuming negotiations and prompt sale at an acceptable price may be difficult. The fund holds the following restricted securities: |
| | | | | | |
| Restricted Securities | | Acquisition
Date | | Cost | | Current
Market Value |
| Euro Dekania Ltd. | | 3/08/07-6/25/07 | | $1,412,164 | | $291,503 |
| NxStage Medical, Inc. | | 5/22/08 | | 269,523 | | 182,131 |
| NxStage Medical, Inc. (Warrants) | | 5/22/08 | | 37,441 | | 21,638 |
| Total Restricted Securities | | | | | | $495,272 |
| % of Net Assets | | | | | | 0.4% |
The following abbreviations are used in this report and are defined:
| ADR | | American Depository Receipt |
| REIT | | Real Estate Investment Trust |
See Notes to Financial Statements
10
FINANCIAL STATEMENTS | STATEMENT OF ASSETS AND LIABILITIES
This statement represents your fund’s balance sheet, which details the assets and liabilities comprising the total value of the fund.
| | | | | |
At 12/31/08 | | | | | |
Assets | | | | | |
Investments, at value, including $580,591 of securities on loan (identified cost, $164,358,112) | | $119,657,234 | | | |
Cash | | 570 | | | |
Receivable for investments sold | | 369,082 | | | |
Receivable for fund shares sold | | 10,699 | | | |
Interest and dividends receivable | | 230,112 | | | |
Receivable from investment adviser | | 18,571 | | | |
Other assets | | 7,032 | | | |
Total assets | | | | | $120,293,300 |
Liabilities | | | | | |
Payable for investments purchased | | $169,263 | | | |
Payable for fund shares reacquired | | 113,404 | | | |
Collateral for securities loaned, at value | | 573,817 | | | |
Payable to affiliates | | | | | |
Management fee | | 4,755 | | | |
Distribution and service fees | | 287 | | | |
Administrative services fee | | 318 | | | |
Payable for trustees’ compensation | | 248 | | | |
Accrued expenses and other liabilities | | 99,123 | | | |
Total liabilities | | | | | $961,215 |
Net assets | | | | | $119,332,085 |
Net assets consist of | | | | | |
Paid-in capital | | $340,958,573 | | | |
Unrealized appreciation (depreciation) on investments and translation of assets and liabilities in foreign currencies | | (44,700,388 | ) | | |
Accumulated net realized gain (loss) on investments and foreign currency transactions | | (179,069,784 | ) | | |
Undistributed net investment income | | 2,143,684 | | | |
Net assets | | | | | $119,332,085 |
Shares of beneficial interest outstanding | | | | | 12,668,384 |
Initial Class shares | | | | | |
Net assets | | $97,648,220 | | | |
Shares outstanding | | 10,352,516 | | | |
Net asset value per share | | | | | $9.43 |
Service Class shares | | | | | |
Net assets | | $21,683,865 | | | |
Shares outstanding | | 2,315,868 | | | |
Net asset value per share | | | | | $9.36 |
See Notes to Financial Statements
11
FINANCIAL STATEMENTS | STATEMENT OF OPERATIONS
This statement describes how much your fund earned in investment income and accrued in expenses. It also describes any gains and/or losses generated by fund operations.
| | | | | | |
| Year ended 12/31/08 | | | | | | |
| Net investment income | | | | | | |
Income | | | | | | |
Dividends | | $3,633,073 | | | | |
Interest | | 205,716 | | | | |
Foreign taxes withheld | | (14,700 | ) | | | |
Total investment income | | | | | $3,824,089 | |
Expenses | | | | | | |
Management fee | | $1,380,447 | | | | |
Distribution fees | | 73,816 | | | | |
Administrative services fee | | 55,193 | | | | |
Trustees’ compensation | | 25,909 | | | | |
Custodian fee | | 39,475 | | | | |
Shareholder communications | | 44,895 | | | | |
Auditing fees | | 46,559 | | | | |
Legal fees | | 7,364 | | | | |
Miscellaneous | | 22,792 | | | | |
Total expenses | | | | | $1,696,450 | |
Fees paid indirectly | | (436 | ) | | | |
Reduction of expenses by investment adviser | | (56,279 | ) | | | |
Net expenses | | | | | $1,639,735 | |
Net investment income | | | | | $2,184,354 | |
Realized and unrealized gain (loss) on investments and foreign currency transactions | | | | | | |
Realized gain (loss) (identified cost basis) | | | | | | |
Investment transactions (s) | | $(27,967,838 | ) | | | |
Foreign currency transactions | | (4,916 | ) | | | |
Net realized gain (loss) on investments and foreign currency transactions | | | | | $(27,972,754 | ) |
Change in unrealized appreciation (depreciation) | | | | | | |
Investments | | $(57,522,757 | ) | | | |
Translation of assets and liabilities in foreign currencies | | (31 | ) | | | |
Net unrealized gain (loss) on investments and foreign currency translation | | | | | $(57,522,788 | ) |
Net realized and unrealized gain (loss) on investments and foreign currency | | | | | $(85,495,542 | ) |
Change in net assets from operations | | | | | $(83,311,188 | ) |
| (s) | Includes proceeds received from a non-recurring cash settlement in the amount of $1,500,134 from a litigation settlement against Enron Corp. |
See Notes to Financial Statements
12
FINANCIAL STATEMENTS | STATEMENTS OF CHANGES IN NET ASSETS
These statements describe the increases and/or decreases in net assets resulting from operations, any distributions, and any shareholder transactions.
| | | | | | |
For years ended 12/31 | | 2008 | | | 2007 | |
Change in net assets | | | | | | |
From operations | | | | | | |
Net investment income | | $2,184,354 | | | $1,137,949 | |
Net realized gain (loss) on investments and foreign currency transactions | | (27,972,754 | ) | | 21,846,838 | |
Net unrealized gain (loss) on investments and foreign currency translation | | (57,522,788 | ) | | (15,614,431 | ) |
Change in net assets from operations | | $(83,311,188 | ) | | $7,370,356 | |
Distributions declared to shareholders | | | | | | |
From net investment income | | | | | | |
Initial Class | | $(1,011,464 | ) | | $(379,068 | ) |
Service Class | | (130,810 | ) | | (40,124 | ) |
From net realized gain on investments | | | | | | |
Initial Class | | (12,075,166 | ) | | (9,027,459 | ) |
Service Class | | (2,290,710 | ) | | (1,660,780 | ) |
Total distributions declared to shareholders | | $(15,508,150 | ) | | $(11,107,431 | ) |
Change in net assets from fund share transactions | | $(28,843,221 | ) | | $158,033,591 | |
Total change in net assets | | $(127,662,559 | ) | | $154,296,516 | |
Net assets | | | | | | |
At beginning of period | | 246,994,644 | | | 92,698,128 | |
At end of period (including undistributed net investment income of $2,143,684 and
$1,137,326, respectively) | | $119,332,085 | | | $246,994,644 | |
See Notes to Financial Statements
13
FINANCIAL STATEMENTS | FINANCIAL HIGHLIGHTS
The financial highlights table is intended to help you understand the fund’s financial performance for the past 5 years. Certain information reflects financial results for a single fund share. The total returns in the table represent the rate by which an investor would have earned (or lost) on an investment in the fund share class (assuming reinvestment of all distributions) held for the entire period.
| | | | | | | | | | | | | | | |
| Initial Class | | Years ended 12/31 | |
| | | 2008 | | | 2007 | | | 2006 | | | 2005 | | | 2004 | |
Net asset value, beginning of period | | $16.52 | | | $17.13 | | | $15.15 | | | $14.32 | | | $12.58 | |
| Income (loss) from investment operations | | | | | | | | | | | | | | | |
Net investment income (d) | | $0.16 | | | $0.11 | | | $0.08 | | | $0.09 | | | $0.09 | |
Net realized and unrealized gain (loss) on investments
and foreign currency | | (6.11 | ) | | 1.41 | | | 1.99 | | | 0.84 | | | 1.74 | |
Total from investment operations | | $(5.95 | ) | | $1.52 | | | $2.07 | | | $0.93 | | | $1.83 | |
| Less distributions declared to shareholders | | | | | | | | | | | | | | | |
From net investment income | | $(0.09 | ) | | $(0.09 | ) | | $(0.09 | ) | | $(0.10 | ) | | $(0.09 | ) |
From net realized gain on investments | | (1.05 | ) | | (2.04 | ) | | — | | | — | | | — | |
Total distributions declared to shareholders | | $(1.14 | ) | | $(2.13 | ) | | $(0.09 | ) | | $(0.10 | ) | | $(0.09 | ) |
Net asset value, end of period | | $9.43 | | | $16.52 | | | $17.13 | | | $15.15 | | | $14.32 | |
Total return (%) (k)(r)(s) | | (38.63 | )(x) | | 8.71 | | | 13.74 | | | 6.56 | | | 14.63 | (b) |
Ratios (%) (to average net assets)
and Supplemental data: | | | | | | | | | | | | | | | |
Expenses before expense reductions (f) | | 0.88 | | | 0.86 | | | 0.91 | | | 0.90 | | | 0.88 | |
Expenses after expense reductions (f) | | 0.85 | | | N/A | | | 0.91 | | | N/A | | | N/A | |
Net investment income | | 1.22 | | | 0.65 | | | 0.53 | | | 0.64 | | | 0.70 | |
Portfolio turnover | | 109 | | | 156 | | | 122 | | | 92 | | | 97 | |
Net assets at end of period (000 Omitted) | | $97,648 | | | $212,063 | | | $80,024 | | | $80,710 | | | $83,219 | |
See Notes to Financial Statements
14
Financial Highlights – continued
| | | | | | | | | | | | | | | |
| Service Class | | Years ended 12/31 | |
| | | 2008 | | | 2007 | | | 2006 | | | 2005 | | | 2004 | |
Net asset value, beginning of period | | $16.42 | | | $17.05 | | | $15.09 | | | $14.25 | | | $12.53 | |
| Income (loss) from investment operations | | | | | | | | | | | | | | | |
Net investment income (d) | | $0.13 | | | $0.07 | | | $0.04 | | | $0.06 | | | $0.06 | |
Net realized and unrealized gain (loss) on investments
and foreign currency | | (6.08 | ) | | 1.39 | | | 1.98 | | | 0.84 | | | 1.72 | |
Total from investment operations | | $(5.95 | ) | | $1.46 | | | $2.02 | | | $0.90 | | | $1.78 | |
| Less distributions declared to shareholders | | | | | | | | | | | | | | | |
From net investment income | | $(0.06 | ) | | $(0.05 | ) | | $(0.06 | ) | | $(0.06 | ) | | $(0.06 | ) |
From net realized gain on investments | | (1.05 | ) | | (2.04 | ) | | — | | | — | | | — | |
Total distributions declared to shareholders | | $(1.11 | ) | | $(2.09 | ) | | $(0.06 | ) | | $(0.06 | ) | | $(0.06 | ) |
Net asset value, end of period | | $9.36 | | | $16.42 | | | $17.05 | | | $15.09 | | | $14.25 | |
Total return (%) (k)(r)(s) | | (38.79 | )(x) | | 8.40 | | | 13.44 | | | 6.39 | | | 14.29 | (b) |
Ratios (%) (to average net assets)
and Supplemental data: | | | | | | | | | | | | | | | |
Expenses before expense reductions (f) | | 1.13 | | | 1.11 | | | 1.16 | | | 1.15 | | | 1.13 | |
Expenses after expense reductions (f) | | 1.10 | | | N/A | | | 1.16 | | | N/A | | | N/A | |
Net investment income | | 1.00 | | | 0.41 | | | 0.29 | | | 0.39 | | | 0.45 | |
Portfolio turnover | | 109 | | | 156 | | | 122 | | | 92 | | | 97 | |
Net assets at end of period (000 Omitted) | | $21,684 | | | $34,932 | | | $12,675 | | | $9,990 | | | $9,916 | |
| (b) | The fund’s net asset value and total return calculation include a non-recurring accrual recorded as a result of an administrative proceeding regarding disclosure of brokerage allocation practices in connection with fund sales. The non-recurring accrual did not have a material impact on the net asset value per share based on the shares outstanding on the day the accrual was recorded. |
| (d) | Per share data is based on average shares outstanding. |
| (f) | Ratios do not reflect reductions from fees paid indirectly, if applicable. |
| (k) | The total return does not reflect expenses that apply to separate accounts. Inclusion of these charges would reduce the total return figures for all periods shown. |
| (r) | Certain expenses have been reduced without which performance would have been lower. |
| (s) | From time to time the fund may receive proceeds from litigation settlements, without which performance would be lower. |
| (x) | Excluding the effect of the proceeds received from a non-recurring litigation settlement against Enron Corp., the total return for the year ended December 31, 2008 would have been lower by approximately 1.32%. |
See Notes to Financial Statements
15
NOTES TO FINANCIAL STATEMENTS
| (1) | | Business and Organization |
MFS Core Equity Portfolio (the fund) is a series of MFS Variable Insurance Trust II (the trust). The trust is organized as a Massachusetts business trust and is registered under the Investment Company Act of 1940, as amended, as an open-end management investment company. The shares of the fund are sold to variable accounts established by insurance companies to fund benefits under variable contracts issued by such companies, and qualified retirement and pension plans.
| (2) | | Significant Accounting Policies |
General – The preparation of financial statements in conformity with U.S. generally accepted accounting principles requires management to make estimates and assumptions that affect the reported amounts of assets and liabilities, and disclosure of contingent assets and liabilities at the date of the financial statements and the reported amounts of revenues and expenses during the reporting period. Actual results could differ from those estimates. The fund can invest in foreign securities, including securities of emerging market issuers. Investments in foreign securities are vulnerable to the effects of changes in the relative values of the local currency and the U.S. dollar and to the effects of changes in each country’s legal, political, and economic environment. The markets of emerging markets countries are generally more volatile than the markets of developed countries with more mature economies. All of the risks of investing in foreign securities previously described are heightened when investing in emerging markets countries.
In March 2008, FASB Statement No. 161, Disclosures about Derivative Instruments and Hedging Activities (the “Standard”) was issued, and is effective for financial statements issued for fiscal years and interim periods beginning after November 15, 2008. This Standard provides enhanced disclosures about the fund’s use of and accounting for derivative instruments and the effect of derivative instruments on the fund’s results of operations and financial position. Management is evaluating the application of the Standard to the fund, and has not at this time determined the impact, if any, resulting from the adoption of this Standard on the fund’s financial statements.
FASB Staff Position (FSP) 133-1 was implemented during the period. FSP 133-1 amends FAS 133 to require sellers of credit derivatives to make disclosures that will enable financial statement users to assess the potential effects of those credit derivatives on an entity’s financial position, financial performance and cash flows. There was no impact from implementing FSP 133-1 as the fund did not hold any of these credit derivatives at period end.
Investment Valuations – Equity securities, including restricted equity securities, are generally valued at the last sale or official closing price as reported by a third party pricing service on the market or exchange on which they are primarily traded. For securities for which there were no sales reported that day, equity securities are generally valued at the last quoted daily bid quotation as reported by a third party pricing service on the market or exchange on which they are primarily traded. For securities held short for which there were no sales reported for the day, the position is generally valued at the last quoted daily ask quotation as reported by a third party pricing service on the market or exchange on which such securities are primarily traded. Short-term instruments with a maturity at issuance of 60 days or less may be valued at amortized cost, which approximates market value. Open-end investment companies are generally valued at net asset value per share. Securities and other assets generally valued on the basis of information from a third party pricing service may also be valued at a broker-dealer bid quotation. Values obtained from pricing services can utilize both dealer-supplied valuations and electronic data processing techniques, which take into account factors such as institutional-size trading in similar groups of securities, yield, quality, coupon rate, maturity, type of issue, trading characteristics, and other market data. The values of foreign securities and other assets and liabilities expressed in foreign currencies are converted to U.S. dollars using the mean of bid and asked prices for rates reported by a third party pricing service.
The Board of Trustees has delegated primary responsibility for determining or causing to be determined the value of the fund’s investments (including any fair valuation) to the adviser pursuant to valuation policies and procedures approved by the Board. If the adviser determines that reliable market quotations are not readily available, investments are valued at fair value as determined in good faith by the adviser in accordance with such procedures under the oversight of the Board of Trustees. Under the fund’s valuation policies and procedures, market quotations are not considered to be readily available for most types of debt instruments and floating rate loans and many types of derivatives. These investments are generally valued at fair value based on information from third party pricing services. In addition, investments may be valued at fair value if the adviser determines that an investment’s value has been materially affected by events occurring after the close of the exchange or market on which the investment is principally traded (such as foreign exchange or market) and prior to the determination of the fund’s net asset value, or after the halting of trading of a specific security where trading does not resume prior to the close of the exchange or market on which the security is principally traded. Events that occur on a frequent basis after foreign markets close (such as developments in foreign markets and significant movements in the U.S. markets) and prior to the determination of the fund’s net asset value may be deemed to have a material affect on the value of securities traded in foreign markets. Accordingly, the fund’s foreign equity securities may often be valued at fair value. The adviser may rely on third party
16
Notes to Financial Statements – continued
pricing services or other information (such as the correlation with price movements of similar securities in the same or other markets; the type, cost and investment characteristics of the security; the business and financial condition of the issuer; and trading and other market data) to assist in determining whether to fair value and at what value to fair value an investment. The value of an investment for purposes of calculating the fund’s net asset value can differ depending on the source and method used to determine value. When fair valuation is used, the value of investments used to determine the fund’s net asset value may differ from quoted or published prices for the same investments.
The fund adopted FASB Statement No. 157, Fair Value Measurements (the “Statement”). This Statement provides a single definition of fair value, a hierarchy for measuring fair value and expanded disclosures about fair value measurements.
Various inputs are used in determining the value of the fund’s assets or liabilities carried at market value. These inputs are categorized into three broad levels. Level 1 includes quoted prices in active markets for identical assets or liabilities. Level 2 includes other significant observable market-based inputs (including quoted prices for similar securities, interest rates, prepayment speed, and credit risk). Level 3 includes unobservable inputs, which may include the adviser’s own assumptions in determining the fair value of investments. Other financial instruments are derivative instruments not reflected in total investments, such as futures, forwards, swap contracts and written options. The following is a summary of the levels used as of December 31, 2008 in valuing the fund’s assets or liabilities carried at market value:
| | | | | | | | |
| | | Level 1 | | Level 2 | | Level 3 | | Total |
| Investments in Securities | | $112,744,880 | | $6,620,851 | | $291,503 | | $119,657,234 |
| Other Financial Instruments | | $— | | $— | | $— | | $— |
Following is a reconciliation of Level 3 assets for which significant unobservable inputs were used to determine fair value. The table presents the activity of Level 3 securities held at the beginning and the end of the period.
| | | | | |
| | | Investments in
Securities | | | Other Financial
Instruments |
| Balance as of 12/31/07 | | $1,388,960 | | | $— |
| Accrued discounts/premiums | | — | | | — |
| Realized gain (loss) | | — | | | — |
| Change in unrealized appreciation (depreciation) | | (1,097,457 | ) | | — |
| Net purchases (sales) | | — | | | — |
| Transfers in and/or out of Level 3 | | — | | | — |
| Balance as of 12/31/08 | | $291,503 | | | $— |
Repurchase Agreements – The fund may enter into repurchase agreements with approved counterparties. Each repurchase agreement is recorded at cost. The fund requires that the securities collateral in a repurchase transaction be transferred to a custodian. The fund monitors, on a daily basis, the value of the collateral to ensure that its value, including accrued interest, is greater than amounts owed to the fund under each such repurchase agreement. The fund and other funds managed by Massachusetts Financial Services Company (MFS), may utilize a joint trading account for the purpose of entering into one or more repurchase agreements.
Foreign Currency Translation – Purchases and sales of foreign investments, income, and expenses are converted into U.S. dollars based upon currency exchange rates prevailing on the respective dates of such transactions or on the reporting date for foreign denominated receivables and payables. Gains and losses attributable to foreign currency exchange rates on sales of securities are recorded for financial statement purposes as net realized gains and losses on investments. Gains and losses attributable to foreign exchange rate movements on receivables, payables, income and expenses are recorded for financial statement purposes as foreign currency transaction gains and losses. That portion of both realized and unrealized gains and losses on investments that results from fluctuations in foreign currency exchange rates is not separately disclosed.
Security Loans – State Street Bank and Trust Company (“State Street”), as lending agent, may loan the securities of the fund to certain qualified institutions (the “Borrowers”) approved by the fund. The loans are collateralized by cash and/or U.S. Treasury and federal agency obligations in an amount typically at least equal to the market value of the securities loaned. State Street provides the fund with indemnification against Borrower default. The fund bears the risk of loss with respect to the investment of cash collateral. On loans collateralized by cash, the cash collateral is invested in a money market fund or short-term securities. A portion of the income generated upon investment of the collateral is remitted to the Borrowers, and the remainder is allocated between the fund and the lending agent. On loans collateralized by U.S. Treasury and/or federal agency obligations, a fee is received from the Borrower, and is allocated between the fund and the lending agent. Income from securities lending is included in interest income on the Statement of Operations. The dividend and interest income earned on the securities loaned is accounted for in the same manner as other dividend and interest income.
Indemnifications – Under the fund’s organizational documents, its officers and trustees may be indemnified against certain liabilities and expenses arising out of the performance of their duties to the fund. Additionally, in the normal course of
17
Notes to Financial Statements – continued
business, the fund enters into agreements with service providers that may contain indemnification clauses. The fund’s maximum exposure under these agreements is unknown as this would involve future claims that may be made against the fund that have not yet occurred.
Investment Transactions and Income – Investment transactions are recorded on the trade date. Interest income is recorded on the accrual basis. All premium and discount is amortized or accreted for financial statement purposes in accordance with U.S. generally accepted accounting principles. Dividends received in cash are recorded on the ex-dividend date. Certain dividends from foreign securities will be recorded when the fund is informed of the dividend if such information is obtained subsequent to the ex-dividend date. Dividend and interest payments received in additional securities are recorded on the ex-dividend or ex-interest date in an amount equal to the value of the security on such date.
The fund may receive proceeds from litigation settlements. Any proceeds received from litigation involving portfolio holdings are reflected in the Statement of Operations in realized gain/loss if the security has been disposed of by the fund or in unrealized gain/loss if the security is still held by the fund. Any other proceeds from litigation not related to portfolio holdings are reflected as other income in the Statement of Operations. The fund was a participant in litigation against Enron Corp. On December 26, 2008, the fund received a cash settlement in the amount of $1,500,134.
Fees Paid Indirectly – The fund’s custody fee may be reduced according to an arrangement that measures the value of cash deposited with the custodian by the fund. This amount, for the year ended December 31, 2008, is shown as a reduction of total expenses on the Statement of Operations.
Tax Matters and Distributions – The fund intends to qualify as a regulated investment company, as defined under Subchapter M of the Internal Revenue Code, and to distribute all of its taxable income, including realized capital gains. As a result, no provision for federal income taxes is required. Each of the fund’s federal tax returns for the prior three fiscal years remains subject to examination by the Internal Revenue Service. Foreign taxes, if any, have been accrued by the fund in the accompanying financial statements.
Distributions to shareholders are recorded on the ex-dividend date. Income and capital gain distributions are determined in accordance with income tax regulations, which may differ from U.S. generally accepted accounting principles. Certain capital accounts in the financial statements are periodically adjusted for permanent differences in order to reflect their tax character. These adjustments have no impact on net assets or net asset value per share. Temporary differences which arise from recognizing certain items of income, expense, gain or loss in different periods for financial statement and tax purposes will reverse at some time in the future. Distributions in excess of net investment income or net realized gains are temporary overdistributions for financial statement purposes resulting from differences in the recognition or classification of income or distributions for financial statement and tax purposes.
Book/tax differences primarily relate to expiration of capital loss carryforwards and wash sale loss deferrals.
The tax character of distributions declared to shareholders for the last two fiscal years is as follows:
| | | | |
| | | 12/31/08 | | 12/31/07 |
| Ordinary income (including any short-term capital gains) | | $1,147,300 | | $2,802,701 |
| Long-term capital gain | | 14,360,850 | | 8,304,730 |
| Total distributions | | $15,508,150 | | $11,107,431 |
The federal tax cost and the tax basis components of distributable earnings were as follows:
| | | |
| As of 12/31/08 | | | |
| Cost of investments | | $165,395,385 | |
| Gross appreciation | | 1,249,647 | |
| Gross depreciation | | (46,987,798 | ) |
| Net unrealized appreciation (depreciation) | | $(45,738,151 | ) |
| Undistributed ordinary income | | 2,143,684 | |
| Capital loss carryforwards | | (177,915,459 | ) |
| Other temporary differences | | (116,562 | ) |
As of December 31, 2008, the fund had capital loss carryforwards available to offset future realized gains. Such losses expire as follows:
| | | |
| 12/31/09 | | $(146,360,552 | ) |
| 12/31/16 | | (31,554,907 | ) |
| Total | | $(177,915,459 | ) |
18
Notes to Financial Statements – continued
Multiple Classes of Shares of Beneficial Interest – The fund offers multiple classes of shares, which differ in their respective distribution fees. The fund’s income, realized and unrealized gain (loss), and common expenses are allocated to shareholders based on the daily net assets of each class. Dividends are declared separately for each class. Differences in per share dividend rates are generally due to differences in separate class expenses.
| (3) | | Transactions with Affiliates |
Investment Adviser – The fund has an investment advisory agreement with MFS to provide overall investment management and related administrative services and facilities to the fund.
The management fee is computed daily and paid monthly at the following annual rates:
| | |
| First $1 billion of average daily net assets | | 0.75% |
| Average daily net assets in excess of $1 billion | | 0.65% |
The investment adviser has agreed in writing to reduce its management fee to 0.60% of average daily net assets in excess of $2.5 billion. This written agreement will continue until modified by the fund’s Board of Trustees, but such agreement will continue at least until April 30, 2010. For the year ended December 31, 2008, the fund’s average daily net assets did not exceed $2.5 billion and therefore, the management fee was not reduced. The management fee incurred for the year ended December 31, 2008 was equivalent to an annual effective rate of 0.75% of the fund’s average daily net assets.
The investment adviser has agreed in writing to pay a portion of the fund’s total annual operating expenses, exclusive of interest, taxes, extraordinary expenses, brokerage and transaction costs and investment-related expenses, such that the total annual operating expenses of the fund do not exceed 0.85% for the Initial Class shares and 1.10% for the Service Class shares, based on the average daily net assets of each share class. This written agreement will continue until June 30, 2010. For the year ended December 31, 2008, this reduction amounted to $56,279 and is reflected as a reduction of total expenses in the Statements of Operations.
Distributor – MFS Fund Distributors, Inc. (MFD), a wholly-owned subsidiary of MFS, is the distributor of shares of the fund. The Trustees have adopted a distribution plan for the Service Class shares pursuant to Rule 12b-1 under the Investment Company Act of 1940.
The fund’s distribution plan provides that the fund will pay MFD distribution fees equal to 0.25% per annum of its average daily net assets attributable to Service Class shares as partial consideration for services performed and expenses incurred by MFD and financial intermediaries in connection with the sale and distribution of the fund’s Service Class shares and the sale and distribution of the variable annuity or variable life insurance contracts investing indirectly in Service Class shares. MFD may subsequently pay all, or a portion, of the distribution fees to financial intermediaries.
Shareholder Servicing Agent – MFS Service Center, Inc. (MFSC), a wholly-owned subsidiary of MFS, has contracted to provide transfer agent and recordkeeping functions in connection with the issuance, transfer, and redemption of each class of shares of the fund under a Shareholder Servicing Agent Agreement. During the year ended December 31, 2008, the fund did not pay MFSC a fee for this service.
Administrator – MFS provides certain financial, legal, shareholder communications, compliance, and other administrative services to the fund. Under an administrative services agreement, the fund partially reimburses MFS the costs incurred to provide these services. The fund is charged an annual fixed amount of $10,000 plus a fee based on average daily net assets.
The administrative services fee incurred for the year ended December 31, 2008 was equivalent to an annual effective rate of 0.0300% of the fund’s average daily net assets.
Trustees’ and Officers’ Compensation – The fund pays compensation to trustees in the form of a retainer, attendance fees, and additional compensation to the Board chairperson. The fund does not pay compensation directly to officers of the fund who are also officers of the investment adviser, all of whom receive remuneration for their services to the fund from MFS. Certain officers of the fund are officers or directors of MFS, MFD, and MFSC.
Other – This fund and certain other MFS funds (the funds) have entered into services agreements (the Agreements) which provide for payment of fees by the funds to Tarantino LLC and Griffin Compliance LLC in return for the provision of services of an Independent Chief Compliance Officer (ICCO) and Assistant ICCO, respectively, for the funds. The ICCO and Assistant ICCO are officers of the funds and the sole members of Tarantino LLC and Griffin Compliance LLC, respectively. The funds can terminate the Agreements with Tarantino LLC and Griffin Compliance LLC at any time under the terms of the Agreements. MFS has agreed to bear all expenses associated with office space, other administrative support, and supplies provided to the ICCO and Assistant ICCO. For the year ended December 31, 2008, the aggregate fees paid by the fund to Tarantino LLC and Griffin Compliance LLC were $1,702 and are included in miscellaneous expense on the Statement of Operations.
19
Notes to Financial Statements – continued
Purchases and sales of investments, other than U.S. Government securities, purchased option transactions, and short-term obligations, aggregated $201,129,951 and $244,042,592, respectively.
| (5) | | Shares of Beneficial Interest |
The fund’s Declaration of Trust permits the Trustees to issue an unlimited number of full and fractional shares of beneficial interest. Transactions in fund shares were as follows:
| | | | | | | | | | | | |
| | | Year ended 12/31/08 | | | Year ended 12/31/07 | |
| | | Shares | | | Amount | | | Shares | | | Amount | |
| Shares sold | | | | | | | | | | | | |
Initial Class | | 87,028 | | | $913,713 | | | 135,706 | | | $2,321,182 | |
Service Class | | 563,165 | | | 6,995,439 | | | 444,330 | | | 7,505,564 | |
| | 650,193 | | | $7,909,152 | | | 580,036 | | | $9,826,746 | |
| Shares issued in connection with acquisition of Capital Opportunities Series | | | | | | | | | | | | |
Initial Class | | | | | | | | 10,188,505 | | | $168,851,898 | |
Service Class | | | | | | | | 1,066,978 | | | 17,592,510 | |
| | | | | | | | 11,255,483 | | | $186,444,408 | |
| Shares issued to shareholders in reinvestment of distributions | | | | | | | | | | | | |
Initial Class | | 865,518 | | | $13,086,630 | | | 564,617 | | | $9,406,527 | |
Service Class | | 161,113 | | | 2,421,520 | | | 102,526 | | | 1,700,904 | |
| | 1,026,631 | | | $15,508,150 | | | 667,143 | | | $11,107,431 | |
| Shares reacquired | | | | | | | | | | | | |
Initial Class | | (3,434,646 | ) | | $(45,796,150 | ) | | (2,725,655 | ) | | $(45,522,176 | ) |
Service Class | | (535,610 | ) | | (6,464,373 | ) | | (230,166 | ) | | (3,822,818 | ) |
| | (3,970,256 | ) | | $(52,260,523 | ) | | (2,955,821 | ) | | $(49,344,994 | ) |
| Net change | | | | | | | | | | | | |
Initial Class | | (2,482,100 | ) | | $(31,795,807 | ) | | 8,163,173 | | | $135,057,431 | |
Service Class | | 188,668 | | | 2,952,586 | | | 1,383,668 | | | 22,976,160 | |
| | (2,293,432 | ) | | $(28,843,221 | ) | | 9,546,841 | | | $158,033,591 | |
The fund and other funds managed by MFS participate in a $1 billion unsecured committed line of credit provided by a syndication of banks under a credit agreement. In addition, the fund and other funds managed by MFS have established uncommitted borrowing arrangements with certain banks. Borrowings may be made for temporary financing needs. Interest is charged to each fund, based on its borrowings, generally at a rate equal to the Federal Reserve funds rate plus 0.30%. In addition, a commitment fee, based on the average daily, unused portion of the committed line of credit, is allocated among the participating funds at the end of each calendar quarter. For the year ended December 31, 2008, the fund’s commitment fee and interest expense were $905 and $0, respectively, and are included in miscellaneous expense on the Statement of Operations.
At close of business on June 22, 2007, the fund acquired all of the assets and liabilities of Capital Opportunities Series. The acquisition was accomplished by a tax-free exchange of 11,255,483 shares of the fund (valued at $186,444,408) for all of the assets and liabilities of Capital Opportunities Series. Capital Opportunities Series then distributed the shares of the fund that Capital Opportunities Series received from the fund to its shareholders. Capital Opportunities Series net assets on that date were $186,444,408, including $19,738,552 of unrealized appreciation, $6,367 of accumulated net investment loss, and $262,544,692 of accumulated net realized loss on investments and foreign currency transactions. The aggregate net assets of the fund after the acquisition were $281,997,884.
20
REPORT OF INDEPENDENT REGISTERED PUBLIC ACCOUNTING FIRM
To the Board of Trustees of MFS Variable Insurance Trust II and the Shareholders of
MFS Core Equity Portfolio:
We have audited the accompanying statement of assets and liabilities, including the portfolio of investments, of MFS Core Equity Portfolio (the “Fund”) (one of the portfolios comprising MFS Variable Insurance Trust II) as of December 31, 2008, and the related statement of operations for the year then ended, the statements of changes in net assets for each of the two years in the period then ended, and the financial highlights for each of the five years in the period then ended. These financial statements and financial highlights are the responsibility of the Fund’s management. Our responsibility is to express an opinion on these financial statements and financial highlights based on our audits.
We conducted our audits in accordance with the standards of the Public Company Accounting Oversight Board (United States). Those standards require that we plan and perform the audit to obtain reasonable assurance about whether the financial statements and financial highlights are free of material misstatement. The Fund is not required to have, nor were we engaged to perform, an audit of its internal control over financial reporting. Our audits included consideration of internal control over financial reporting as a basis for designing audit procedures that are appropriate in the circumstances, but not for the purpose of expressing an opinion on the effectiveness of the Fund’s internal control over financial reporting. Accordingly, we express no such opinion. An audit also includes examining, on a test basis, evidence supporting the amounts and disclosures in the financial statements, assessing the accounting principles used and significant estimates made by management, as well as evaluating the overall financial statement presentation. Our procedures included confirmation of securities owned as of December 31, 2008, by correspondence with the custodian and brokers; where replies were not received from brokers, we performed other auditing procedures. We believe that our audits provide a reasonable basis for our opinion.
In our opinion, the financial statements and financial highlights referred to above present fairly, in all material respects, the financial position of MFS Core Equity Portfolio as of December 31, 2008, the results of its operations for the year then ended, the changes in its net assets for each of the two years in the period then ended, and the financial highlights for each of the five years in the period then ended, in conformity with accounting principles generally accepted in the United States of America.
DELOITTE & TOUCHE LLP
Boston, Massachusetts
February 19, 2009
21
TRUSTEES AND OFFICERS – IDENTIFICATION AND BACKGROUND
The Trustees and officers of the Trust, as of February 1, 2009, are listed below, together with their principal occupations during the past five years. (Their titles may have varied during that period.) The address of each Trustee and officer is 500 Boylston Street, Boston, Massachusetts 02116.
| | | | | | |
Name, Date of Birth | | Position(s) Held
with Fund | | Trustee/Officer
Since (1) | | Principal Occupations During the Past Five Years and
Other Directorships (2) |
| INTERESTED TRUSTEE | | | | |
David D. Horn (3) (born 6/07/41) | | Trustee | | April 1986 | | Private investor; Sun Life Assurance Company of Canada, Senior Vice President and General Manager for the United States (until 1997); Director (until March 2004) |
| | |
| INDEPENDENT TRUSTEES | | | | |
J. Kermit Birchfield (born 1/08/40) | | Chairman | | May 1997 | | Consultant; Century Partners, Inc. (investments), Director; Displaytech, Inc. (technology), Director; Dessin Fournir LLC (furniture manufacturer), Director (2005 to present); Intermountain Gas Company, Inc. & Intermountain Industries, Inc. (oil & gas exploration and production), Director; Site Watch LLC (software to monitor oil tanks), Managing Director (2006 to present); Juridica Investments (fund investing in judicial matters), Director (2007 to present); HPSC, Inc. (medical financing), Director (until January 2004) |
| | | |
Robert C. Bishop (born 1/13/43) | | Trustee | | May 2001 | | AutoImmune, Inc. (pharmaceutical product development), Chairman, President and Chief Executive Officer; Caliper Life Sciences Corp. (laboratory analytical instruments), Director; Millipore Corporation (purification/filtration products), Director; Waterstreet Capital (leverage buyouts), Advisory Board (August 2006 to present); Optobionics Corporation (ophthalmic devices), Director (2002 to 2007) |
| | | |
Frederick H. Dulles (born 3/12/42) | | Trustee | | May 2001 | | Ten State International Law PLLC (law firm), Of Counsel (since 2006); Prudential Carolina Real Estate, (real estate), Broker (since 2006); Free Enterprise Foundation, Inc. (research institute), Director & Secretary (until 2008); Disher, Hamrick & Myers Residential, Inc. (real estate) Broker (2005 until 2006); Frederick H. Dulles law practice (until 2006); Ten State Street LLP (law firm), Member (until 2005) |
| | | |
Marcia A. Kean (born 6/30/48) | | Trustee | | April 2005 | | Feinstein Kean Healthcare (consulting), Chief Executive Officer |
| | | |
Ronald G. Steinhart (born 6/15/40) | | Trustee | | May 2001 | | Private investor; Penske Automotive Group (automotive retailer), Director; Animal Health International, Inc. (animal health products), Director (since 2007); Texas Industries (concrete/aggregates/cement), Director (since 2007); Penson Worldwide, Inc. (securities clearance), Director (since 2006); Carreker Corporation (technology consulting) Director (until 2005); Prentiss Properties Trust (real estate investment trust), Director (until 2006) |
| | | |
Haviland Wright (born 7/21/48) | | Trustee | | May 2001 | | Profitability of Hawaii (software), Chief Development Officer (since December 2008); Elixir Technologies Corporation (software) Director (since 2005); Nano Loa Inc. (liquid crystal displays), Director |
| | |
| TRUSTEE EMERITUS | | | | |
Samuel Adams (born 10/19/25) | | Trustee Emeritus | | | | Retired; K&L Gates LLP (law firm), Of Counsel |
| | |
| OFFICERS | | | | |
Maria F. Dwyer (4) (born 12/01/58) | | President | | November 2005 | | Massachusetts Financial Services Company, Executive Vice President and Chief Regulatory Officer (since March 2004) Chief Compliance Officer (since December 2006); Fidelity Management & Research Company, Vice President (prior to March 2004); Fidelity Group of Funds, President and Treasurer (until March 2004) |
| | | |
Christopher R. Bohane (4) (born 1/18/74) | | Assistant Secretary and Assistant Clerk | | July 2005 | | Massachusetts Financial Services Company, Vice President and Senior Counsel |
| | | |
John M. Corcoran (4) (born 4/13/65) | | Treasurer | | October 2008 | | Massachusetts Financial Services Company, Senior Vice President (since October 2008); State Street Bank and Trust (financial services provider), Senior Vice President, (until September 2008) |
| | | |
Ethan D. Corey (4) (born 11/21/63) | | Assistant Secretary and Assistant Clerk | | July 2005 | | Massachusetts Financial Services Company, Senior Vice President and Associate General Counsel (since 2004); Dechert LLP (law firm), Counsel (prior to December 2004) |
| | | |
David L. DiLorenzo (4) (born 8/10/68) | | Assistant Treasurer | | July 2005 | | Massachusetts Financial Services Company, Vice President (since June 2005); JP Morgan Investor Services, Vice President (until June 2005) |
| | | |
Timothy M. Fagan (4) (born 7/10/68) | | Assistant Secretary and Assistant Clerk | | September 2005 | | Massachusetts Financial Services Company, Vice President and Senior Counsel (since September 2005); John Hancock Advisers, LLC, Vice President, Senior Attorney and Chief Compliance Officer (until August 2005) |
22
Trustees and Officers – continued
| | | | | | |
Name, Date of Birth | | Position(s) Held
with Fund | | Trustee/Officer
Since (1) | | Principal Occupations During the Past Five Years and
Other Directorships (2) |
Mark D. Fischer (4) (born 10/27/70) | | Assistant Treasurer | | July 2005 | | Massachusetts Financial Services Company, Vice President (since May 2005); JP Morgan Investment Management Company, Vice President (until May 2005) |
| | | |
Robyn L. Griffin (born 7/04/75) | | Assistant Independent Chief Compliance Officer | | August 2008 | | Griffin Compliance LLC (provider of compliance services), Principal (since August 2008); State Street Corporation (financial services provider), Mutual Fund Administration Assistant Vice President (October 2006 – July 2008); Liberty Mutual Group (insurance), Personal Market Assistant Controller (April 2006 – October 2006); Deloitte & Touche LLP (professional services firm), Senior Manager (prior to April 2006) |
| | | |
Brian E. Langenfeld (4) (born 3/07/73) | | Assistant Secretary and Assistant Clerk | | May 2006 | | Massachusetts Financial Services Company, Vice President and Senior Counsel (since May 2006); John Hancock Advisers, LLC, Assistant Vice President and Counsel (until April 2006) |
| | | |
Ellen Moynihan (4) (born 11/13/57) | | Assistant Treasurer | | May 1997 | | Massachusetts Financial Services Company, Senior Vice President |
| | | |
Susan S. Newton (4) (born 3/07/50) | | Assistant Secretary and Assistant Clerk | | May 2005 | | Massachusetts Financial Services Company, Senior Vice President and Associate General Counsel (since April 2005); John Hancock Advisers, LLC, Senior Vice President, Secretary and Chief Legal Officer (until April 2005) |
| | | |
Susan A. Pereira (4) (born 11/05/70) | | Assistant Secretary and Assistant Clerk | | July 2005 | | Massachusetts Financial Services Company, Vice President and Senior Counsel (since June 2004); Bingham McCutchen LLP (law firm), Associate (until June 2004) |
| | | |
Mark N. Polebaum (4) (born 5/01/52) | | Secretary and Clerk | | February 2006 | | Massachusetts Financial Services Company, Executive Vice President, General Counsel and Secretary (since January 2006); Wilmer Cutler Pickering Hale and Dorr LLP (law firm), Partner (until January 2006) |
| | | |
Frank L. Tarantino (born 3/07/44) | | Independent Chief Compliance Officer | | September 2004 | | Tarantino LLC (provider of compliance services), Principal (since June 2004); CRA Business Strategies Group (consulting services), Executive Vice President (until June 2004) |
| | | |
Richard S. Weitzel (4) (born 7/16/70) | | Assistant Secretary and Assistant Clerk | | October 2007 | | Massachusetts Financial Services Company, Vice President and Assistant General Counsel (since 2004); Massachusetts Department of Business and Technology, General Counsel (until April 2004) |
| | | |
James O. Yost (4) (born 6/12/60) | | Assistant Treasurer | | April 1992 | | Massachusetts Financial Services Company, Senior Vice President |
| (1) | Date first appointed to serve as Trustee/Officer of an MFS fund or a Compass variable account. Each Trustee has served continuously since appointment. |
| (2) | Directorships or trusteeships of companies required to report to the Securities and Exchange Commission (i.e., “public companies”). |
| (3) | “Interested person” of the Trust, within the meaning of the Investment Company Act of 1940 (referred to as the 1940 Act), which is the principal federal law governing investment companies like the Trust, as a result of position with Sun Life of Canada (U.S.). The address of Sun Life of Canada (U.S.) is One Sun Life Executive Park, Wellesley Hills, Massachusetts 02481. |
| (4) | “Interested person” of MFS within the meaning of the 1940 Act. The address of MFS is 500 Boylston Street, Boston, Massachusetts 02116. |
The Trust does not hold annual meetings for the purpose of electing Trustees, and Trustees are not elected for fixed terms. Each Trustee and officer holds office until his or her successor is chosen and qualified, or until his or her earlier death, resignation, retirement or removal.
All Trustees currently serve as Trustees of the Trust and have served in that capacity since originally elected or appointed. All of the Trustees are also Managers of the Compass Variable Accounts. The executive officers of the Trust hold similar offices for the Compass Variable Accounts and other funds in the MFS fund complex. As of January 1, 2009, each Trustee serves as a Trustee or Manager of 35 Accounts/Funds.
The Statement of Additional Information contains further information about the Trustees and is available without charge upon request by calling 1-800-752-7215.
| | |
Investment Adviser
Massachusetts Financial Services Company 500 Boylston Street, Boston, MA 02116-3741 | | Custodian State Street Bank and Trust 1 Lincoln Street, Boston, MA 02111-2900 |
Distributor
MFS Fund Distributors, Inc. 500 Boylston Street, Boston, MA 02116-3741 | | Independent Registered Public Accounting Firm Deloitte & Touche LLP 200 Berkeley Street, Boston, MA 02116 |
Portfolio Managers Joseph MacDougall Katrina Mead | | |
23
BOARD REVIEW OF INVESTMENT ADVISORY AGREEMENT
The Investment Company Act of 1940 requires that both the full Board of Trustees and a majority of the non-interested (“independent”) Trustees, voting separately, annually approve the continuation of the investment advisory agreement between MFS Variable Insurance Trust II (the “Trust”) and Massachusetts Financial Services Company (“MFS”) on behalf of the Fund. The Trustees consider matters bearing on the Fund and the advisory arrangements at their meetings throughout the year, including a review of performance data at each regular meeting. In addition, the independent Trustees met in May and again in July 2008 (“contract review meetings”) for the specific purpose of considering whether to approve the continuation of the investment advisory agreement for the Fund. The independent Trustees were assisted in their evaluation of the investment advisory agreement by independent legal counsel, from whom they received separate legal advice and with whom they met separately from MFS management during various contract review meetings. The independent Trustees were also assisted in this process by the Fund’s Independent Chief Compliance Officer, a full-time senior officer appointed by and reporting to the independent Trustees.
In connection with their deliberations, the Trustees, including the independent Trustees, considered such information and factors as they believed, in light of the legal advice furnished to them and their own business judgment, to be relevant. The investment advisory agreement was considered separately for the Fund, although the Trustees also took into account the common interests of all Funds in the Trust in their review. As described below, the Trustees considered the nature, quality, and extent of the various investment advisory, administrative, and shareholder services performed by MFS under the existing investment advisory agreement and other arrangements with the Trust.
In connection with their contract review meetings, the Trustees received and relied upon materials which included, among other items: (i) information provided by Lipper Inc. on the investment performance of the Fund for various time periods ended December 31, 2007, compared to the investment performance of a group of funds with substantially similar investment classifications/objectives (the “Lipper performance universe”), (ii) information provided by Lipper Inc. on the Fund’s advisory fees and other expenses compared to the advisory fees and other expenses of comparable funds identified by Lipper (the “Lipper expense group”), (iii) information provided by MFS on the advisory fees of comparable portfolios of its other clients, including institutional separate account and other clients, (iv) information as to whether expense waivers, reimbursements or fee “breakpoints” are observed for the Fund, (v) information regarding MFS’ financial results and financial condition, including MFS’ and certain of its affiliates’ estimated profitability from services performed for the Fund, (vi) MFS’ views regarding the outlook for the mutual fund industry and its strategic business plans, (vii) descriptions of various functions performed by MFS for the Trust, such as compliance monitoring and portfolio trading practices, and (viii) information regarding the overall organization of MFS, including information about MFS’ senior management and other personnel providing investment advisory, administrative and other services to the Fund. The comparative performance, fee and expense information prepared and provided by Lipper Inc. was not independently verified, and the independent Trustees did not independently verify any information provided to them by MFS.
The Trustees’ conclusion as to the continuation of the investment advisory agreement was based on comprehensive consideration of all information provided to the Trustees and not the result of any single factor. Some of the factors that figured particularly in the Trustees’ deliberations are described below for the Fund, while individual Trustees may have given different weight to various factors and evaluated the information presented as a whole differently than another Trustee. The Trustees recognized that the fee arrangements for the Fund reflect years of review and discussion between the independent Trustees and MFS, that certain aspects of such arrangements may receive greater scrutiny in some years than others, and that the Trustees’ conclusions may be based, in part, on their consideration of these same arrangements during the course of the year and in prior years.
Based on information provided by Lipper Inc., the Trustees compared the Fund’s total return investment performance to the performance of a peer group of funds over various time periods. The Trustees placed particular emphasis on the total return performance of the Fund’s Initial Class shares in comparison to the performance of funds in its Lipper performance universe over the one-, three- and five-year periods. The Trustees did not rely on performance results for more recent periods, including those shown elsewhere in this report.
The Trustees noted the performance of the Fund’s Initial Class shares was in the 2nd quintile relative to the other funds in the Lipper Classification Index for the one-year period (the 1st quintile being the best performers and the 5th quintile being the worst performers). The total return performance of the Fund was in the 2nd quintile for the three-year period and the 3rd quintile for the five-year period ended December 31, 2007, relative to the Lipper performance universe. Based on the nature and quality of services provided by MFS, the Board of Trustees concluded that the Fund’s performance was satisfactory.
In the course of their deliberations, the Trustees took into account information provided by MFS during contract review meetings, as well as during investment review meetings conducted with portfolio management personnel during the course of the year.
24
Board Review of Investment Advisory Agreement – continued
In assessing the reasonableness of the Fund’s advisory fee, the Trustees considered, among other information, the Fund’s advisory fee and the total expense ratio of the Fund’s Initial Class shares as a percentage of average daily net assets, compared to the advisory fee and total expense ratios of its peer group of funds based on information provided by Lipper Inc. The Trustees also considered the advisory fees charged by MFS to institutional accounts. In comparing these fees, the Trustees considered the generally broader scope of services provided by MFS to the Trust than those provided to institutional accounts. The Trustees also considered the higher demands placed on MFS’ investment personnel and trading infrastructure as a result of the daily cash in-flows and out-flows of the Fund, and the impact on MFS and related expenses due to the more extensive regulatory regime to which the Fund is subject, compared to institutional accounts.
In considering the fees, the Trustees noted from the Lipper data that the Fund’s effective advisory fee rate and total expense ratio were each approximately at the median of such fees and expenses of funds in the Lipper expense group. In addition, the Trustees noted that MFS agreed to continue to reduce its advisory fee on average daily net assets over $2.5 billion, and they accepted MFS’ offer to continue the expense limitation for the Fund. The Trustees further concluded that the existing breakpoints were sufficient to allow the Fund to benefit from economies of scale as its assets grow. The Trustees concluded that the fees were reasonable in light of the nature and quality of services provided.
The Trustees also considered information prepared by MFS relating to its costs and profits with respect to the Fund and other investment companies and accounts advised by MFS, as well as MFS’ methodologies used to determine and allocate its costs to the Fund and other accounts and products for purposes of estimating profitability.
After reviewing these and other factors described below, the Trustees concluded that the advisory fees charged to the Fund represent reasonable compensation in light of the nature and quality of the services being provided by MFS.
In addition, the Trustees considered MFS’ resources and related efforts to continue to retain, attract and motivate capable personnel to serve the Fund. The Trustees also considered the financial resources of MFS and its parent, Sun Life Financial Inc. The Trustees further considered any advantages and possible disadvantages of having an adviser which also serves other investment companies as well as institutional accounts.
The Trustees also considered the nature, quality, cost, and extent of administrative, transfer agency, and distribution services provided to the Fund by MFS and its affiliates under agreements and plans other than the investment advisory agreement, including the 12b-1 fees the Fund pays to MFS Fund Distributors, Inc., an affiliate of MFS. The Trustees also considered the nature, extent and quality of certain other services MFS performs or arranges on the Fund’s behalf, which may include securities lending programs, directed expense payment programs, class action recovery programs, and MFS’ interaction with third-party service providers, principally custodians and sub-custodians. The Trustees concluded that the various non-advisory services provided by MFS and its affiliates on behalf of the Fund were satisfactory. The Trustees also considered the benefits to MFS from the use of the Fund’s portfolio brokerage commissions to pay for research and other similar services and various other factors. Additionally, the Trustees considered so-called “fall-out benefits” to MFS such as reputational value derived from serving as investment manager to the Trust, and determined that any such benefits derived by MFS were reasonable and fair.
Based on their evaluation of factors that they deemed to be material, including those factors described above, the Board of Trustees, including a majority of the independent Trustees, concluded that the investment advisory agreement should be continued for an additional one-year period, commencing September 1, 2008.
A discussion regarding the Board’s most recent review and renewal of the fund’s Investment Advisory Agreement with MFS is available by clicking on the fund’s name under “Variable Insurance Portfolios-VIT II” in the “Products & Performance” section on the MFS Web site (mfs.com).
25
PROXY VOTING POLICIES AND INFORMATION
A general description of the MFS funds’ proxy voting policies and procedures is available without charge, upon request, by calling
1-800-225-2606, by visiting the Proxy Voting section of mfs.com or by visiting the SEC’s Web site at http://www.sec.gov.
Information regarding how the fund voted proxies relating to portfolio securities during the most recent twelve-month period ended June 30 is available without charge by visiting the Proxy Voting section of mfs.com or by visiting the SEC’s Web site at http://www.sec.gov.
QUARTERLY PORTFOLIO DISCLOSURE
The fund will file a complete schedule of portfolio holdings with the Securities and Exchange Commission (the Commission) for the first and third quarters of each fiscal year on Form N-Q. The fund’s Form N-Q may be reviewed and copied at the:
Public Reference Room
Securities and Exchange Commission
100 F Street, NE, Room 1580
Washington, D.C. 20549
Information on the operation of the Public Reference Room may be obtained by calling the Commission at 1-800-SEC-0330. The fund’s Form N-Q is available on the EDGAR database on the Commission’s Internet Web site at http://www.sec.gov, and copies of this information may be obtained, upon payment of a duplicating fee, by electronic request at the following e-mail address: publicinfo@sec.gov or by writing the Public Reference Section at the above address.
FEDERAL TAX INFORMATION (unaudited)
The following information is provided pursuant to provisions of the Internal Revenue Code.
The fund designates $14,360,850 as capital gain dividends paid during the fiscal year.
For corporate shareholders, 100.00% of the ordinary income dividends paid during the fiscal year qualify for the corporate dividends received deduction.
26
MFS® PRIVACY NOTICE
Privacy is a concern for every investor today. At MFS Investment Management® and the MFS funds, we take this concern very seriously. We want you to understand our policies about the investment products and services that we offer, and how we protect the nonpublic personal information of investors who have a direct relationship with us and our wholly owned subsidiaries.
Throughout our business relationship, you provide us with personal information. We maintain information and records about you, your investments, and the services you use. Examples of the nonpublic personal information we maintain include
| | Ÿ | | data from investment applications and other forms |
| | Ÿ | | share balances and transactional history with us, our affiliates, or others |
| | Ÿ | | facts from a consumer reporting agency |
We do not disclose any nonpublic personal information about our customers or former customers to anyone, except as permitted by law. We may share nonpublic personal information with third parties or certain of our affiliates in connection with servicing your account or processing your transactions. We may share information with companies or financial institutions that perform marketing services on our behalf or with other financial institutions with which we have joint marketing arrangements, subject to any legal requirements.
Authorization to access your nonpublic personal information is limited to appropriate personnel who provide products, services, or information to you. We maintain physical, electronic, and procedural safeguards to help protect the personal information we collect about you.
If you have any questions about the MFS privacy policy, please call 1-800-225-2606 any business day between 8 a.m. and 8 p.m. Eastern time.
Note: If you own MFS products or receive MFS services in the name of a third party such as a bank or broker-dealer, their privacy policy may apply to you instead of ours.
27


MFS® GLOBAL TOTAL RETURN PORTFOLIO
The report is prepared for the general information of contract owners. It is authorized for distribution to prospective investors only when preceded or accompanied by a current prospectus.
NOT FDIC INSURED Ÿ MAY LOSE VALUE Ÿ NO BANK GUARANTEE Ÿ NOT A DEPOSIT Ÿ NOT INSURED BY ANY FEDERAL GOVERNMENT AGENCY OR NCUA/NCUSIF
LETTER FROM THE CEO

Dear Contract Owners:
The market downturns and economic setbacks of late probably rank among the worst financial declines most of us have experienced. Inevitably, people may be questioning their commitment to investing. Still, it is important to remember that downturns are an inescapable part of the business cycle. Such troughs have been seen before, and if we can use history as a guide, market recoveries typically have followed.
Recent events have clearly shown us the value of certain types of investments. In this environment, two of the hallmarks of mutual funds — transparency and liquidity — have become critically important. Unlike some other types of investments, the operations of mutual funds are relatively transparent to their shareholders. With their daily redemption feature, mutual funds also generally provide easy, convenient access to one’s money. Through these recent market upheavals, this level of liquidity enhanced the ability of mutual fund investors to respond and modify their investments as they and their advisors saw fit — a flexibility that those in less liquid investments simply did not have at their disposal.
At MFS® we take particular pride in how well mutual funds can serve investors because we invented the mutual fund in the United States. Established in 1924, Massachusetts Investors Trust was the nation’s first fund. Recent market events only reinforce what we have learned through 85 years — that mutual funds provide unique features that are important to investors in any type of market climate.
Respectfully,

Robert J. Manning
Chief Executive Officer and Chief Investment Officer
MFS Investment Management®
February 17, 2009
The opinions expressed in this letter are subject to change, may not be relied upon for investment advice, and no forecasts can be guaranteed.
Before investing, consider the fund’s investment objectives, risks, charges, and expenses. For a prospectus containing this and other information, contact your investment professional or view online. Read it carefully.
MFS Fund Distributors, Inc., 500 Boylston Street, Boston, MA 02116
1
PORTFOLIO COMPOSITION
Portfolio structure (i)
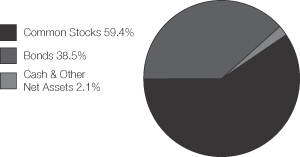
| | |
| Top ten holdings (i) | | |
Nestle S.A. | | 1.9% |
Kingdom of Netherlands, 3.75%, 2014 | | 1.8% |
| Republic of France, 6%, 2025 | | 1.8% |
Roche Holding AG | | 1.7% |
| TOTAL S.A. | | 1.7% |
| Kingdom of Spain, 5%, 2012 | | 1.7% |
Vodafone Group PLC | | 1.6% |
| Republic of Italy, 4.75%, 2013 | | 1.6% |
| Federal Republic of Germany, 6.25%, 2030 | | 1.5% |
| Kingdom of Belgium, 5.5%, 2017 | | 1.4% |
| | |
| Equity sectors | | |
| Financial Services | | 10.5% |
| Consumer Staples | | 7.7% |
| Utilities & Communications | | 7.4% |
| Energy | | 7.3% |
| Health Care | | 6.4% |
| Technology | | 5.1% |
| Industrial Goods & Services | | 4.6% |
| Leisure | | 3.0% |
| Basic Materials | | 2.1% |
| Autos & Housing | | 1.6% |
| Transportation | | 1.3% |
| Retailing | | 1.2% |
| Special Products & Services | | 1.2% |
| | |
| Fixed income sectors (i) | | |
| Non-U.S. Government Bonds | | 30.0% |
| U.S. Treasury Securities | | 4.2% |
| Mortgage-Backed Securities | | 1.5% |
| U.S. Government Agencies | | 1.2% |
| Commercial Mortgage-Backed Securities | | 1.0% |
| Municipal Bonds | | 0.6% |
| | |
| Country weightings (i) | | |
| United States | | 35.3% |
| Japan | | 16.9% |
| United Kingdom | | 9.0% |
| Germany | | 8.6% |
| France | | 5.7% |
| Switzerland | | 5.1% |
| Netherlands | | 4.6% |
| Spain | | 2.7% |
| Italy | | 2.3% |
| Other Countries | | 9.8% |
| (i) | For purposes of this presentation, the bond component includes accrued interest amounts and may be positively or negatively impacted by the equivalent exposure from any derivative holdings, if applicable. |
Percentages are based on net assets as of 12/31/08, unless otherwise noted.
The portfolio is actively managed and current holdings may be different.
2
MANAGEMENT REVIEW
Summary of Results
For the twelve months ended December 31, 2008, Initial Class shares of the MFS Global Total Return Portfolio (the “fund”) provided a total return of –15.42%, while Service Class shares of the fund provided a total return of –15.59%. These compare with a return of –40.33% for the fund’s benchmark, the MSCI World Index. The fund’s other benchmarks, the JPMorgan Global Government Bond Index Unhedged, and a hybrid benchmark comprised of 60% of the MSCI World Index and 40% of the JPMorgan Global Government Bond Index Unhedged, generated returns of 12.00% and –22.34%, respectively, over the same period.
Market Environment
The U.S. economy and financial markets experienced significant deterioration and extraordinary volatility over the reporting period. U.S. economic growth slowed significantly, despite the short-term bounce from the second quarter fiscal stimulus. Strong domestic headwinds included accelerated deterioration in the housing market, anemic corporate investment, a rapidly declining job market, and a much tighter credit environment. During the period, a seemingly continuous series of tumultuous financial events hammered markets, including: the distressed sale of failing Bear Stearns to JPMorgan, the conservatorship of Government Sponsored Enterprises (GSEs) Fannie Mae and Freddie Mac, the bankruptcy of investment bank Lehman Brothers, the Federal Reserve Bank’s complex intervention of insurance company American International Group (AIG), the nationalization of several large European banks, the failure of Washington Mutual, and the distressed sale of Wachovia. As a result of this barrage of turbulent news, global equity markets pushed significantly lower and credit markets witnessed the worst dislocation since the beginning of the credit crisis. Though conditions improved towards the end of the period, the state of financial and macroeconomic dislocation remained severe.
While reasonably resilient during the first half of the period, the global economy and financial system increasingly experienced considerable negative spillovers from the U.S. slowdown. Not only did Europe and Japan show obvious signs of economic softening, the more powerful engine of global growth – emerging markets – also displayed weakening dynamics.
During the reporting period, the U.S. Federal Reserve Board cut interest rates aggressively and introduced a multitude of new lending facilities to alleviate ever-tightening credit markets, while the U.S. federal government moved quickly to design and implement a meaningful fiscal stimulus package. Although several other global central banks also cut rates, the dilemma of rising energy and food prices heightened concerns among central bankers that inflationary expectations might become unhinged despite weaker growth. Only later in the reporting period did slowing global growth result in a very precipitous decline in commodity prices, which significantly eased inflation and inflationary expectations. As inflationary concerns diminished in the face of global deleveraging, and equity and credit markets deteriorated more sharply, a coordinated rate cut marked the beginning of much more aggressive easing by the major global central banks.
Contributors to Performance
Within the equity portion of the fund, stock selection in the financial services sector boosted performance relative to the MSCI World Index, although no individual securities within this sector were among the fund’s top contributors for the reporting period.
The fund’s overweighted position in the consumer staples sector also had a positive impact on relative results. Holdings of global food company Nestle (Switzerland), tobacco company Philip Morris and household and industrial products manufacturer Kao Corp. helped relative performance as all three stocks outperformed the benchmark. Kao Corp. aided relative performance as the company benefited from lower raw materials costs and their ability to maintain pricing in the domestic marketplace.
Strong stock selection in the technology sector was another positive factor for relative returns. The fund’s overweighted position in enterprise software products maker Oracle aided performance as the stock fared better than the benchmark during the reporting period.
Stocks in other sectors that helped relative performance included defense contractor Lockheed Martin, telecommunications company KDDI Corp. (Japan), pharmaceutical company Roche Holding (Switzerland), integrated oil company TOTAL (France), pharmaceutical company Hisamitsu Pharmaceutical (Japan) and parcel delivery services company Yamato Holdings (Japan). Yamato Holdings’ shares gained during the period as parcel volumes rose, particularly in the latter part of the reporting period, and as the cost of diesel fuel declined.
During the reporting period, currency exposure in the equity portion of the fund contributed to relative performance. All of MFS’ investment decisions are driven by the fundamentals of each individual opportunity and, as such, it is common for our portfolios to have different currency exposure than the benchmark.
Within the fixed income portion of the fund, an underweighted exposure to Italian sovereign bonds contributed to performance relative to the JPMorgan Global Government Bond Index Unhedged. The fund’s overall currency allocation also helped. During the reporting period, the fund’s return from yield, which was greater than that of the benchmark, was a key
3
Management Review – continued
contributor to performance. Additionally, the fund’s longer duration (d) stance in the Eurozone, United Kingdom, and Australia also aided relative performance.
Detractors from Performance
Within the equity portion of the fund, an underweighted position in the retailing sector held back relative performance. Not owning discount retailer Wal-Mart Stores had a negative impact on relative returns as the stock significantly outperformed the benchmark over the reporting period.
Although the financial services sector was an overall contributor to relative performance, several banking and financial stocks were among the fund’s top detractors. These included ING Groep (Netherlands), Credit Agricole (France), Royal Bank of Scotland (g), DNB Holding (Norway), Unicredito Italiano (Italy) and Goldman Sachs. Shares of Goldman Sachs tumbled amid the worsening financial crisis. The company reported the worst drop in profits since the company became a publicly-traded firm.
Elsewhere, an underweighted position in integrated oil company Exxon Mobil and the fund’s ownership of health insurer Wellpoint (g) and postal system operator TNT had a negative impact on relative returns.
Within the fixed income portion of the fund, a greater exposure to bonds in the financial sector and to commercial mortgage-backed securities (CMBS) held back relative performance as these securities suffered amid the global credit crisis. The fund’s overweight in Norwegian krone and U.S. Treasury Inflation-Protected Securities (TIPS) also detracted from relative performance.
Respectfully,
| | | | | | | | |
| Nevin Chitkara | | Steven Gorham | | Matthew Ryan | | Erik Weisman | | Barnaby Wiener |
| Portfolio Manager | | Portfolio Manager | | Portfolio Manager | | Portfolio Manager | | Portfolio Manager |
| (d) | Duration is a measure of how much a bond’s price is likely to fluctuate with general changes in interest rates, e.g., if rates rise 1.00%, a bond with a 5-year duration is likely to lose about 5.00% of its value. |
| (g) | Security was not held in the portfolio at period end. |
The views expressed in this report are those of the portfolio managers only through the end of the period of the report as stated on the cover and do not necessarily reflect the views of MFS or any other person in the MFS organization. These views are subject to change at any time based on market or other conditions, and MFS disclaims any responsibility to update such views. These views may not be relied upon as investment advice or an indication of trading intent on behalf of any MFS portfolio. References to specific securities are not recommendations of such securities, and may not be representative of any MFS portfolio’s current or future investments.
4
PERFORMANCE SUMMARY THROUGH 12/31/08
The following chart illustrates the historical performance of the fund in comparison to its benchmark(s). Benchmark comparisons are unmanaged; do not reflect any fees or expenses; and cannot be invested in directly. The performance of other share classes will be greater than or less than that of the class depicted below. (See Notes to Performance Summary.)
Performance data shown represents past performance and is no guarantee of future results. Investment return and principal value fluctuate so your units, when sold, may be worth more or less than the original cost; current performance may be lower or higher than quoted. The performance shown does not reflect the deduction of taxes, if any, that a contract holder would pay on fund distributions or the redemption of contract units. The returns for the fund shown also do not reflect the deduction of expenses associated with variable products, such as mortality and expense risk charges, separate account charges, and sales charges imposed by the insurance company separate accounts. Such expenses would reduce the overall returns shown.
Growth of a hypothetical $10,000 investment
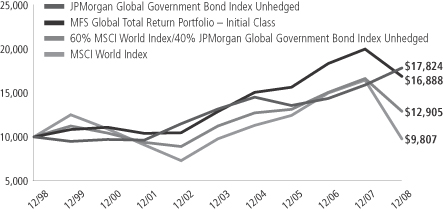
Total rates of return through 12/31/08
Average Annual Total Returns
| | | | | | | | | | | | |
| | | Share class | | Class inception date | | 1-yr | | 5-yr | | 10-yr | | |
| | | Initial Class | | 11/07/94 | | (15.42)% | | 5.59% | | 5.38% | | |
| | | Service Class | | 8/24/01 | | (15.59)% | | 5.34% | | 5.20% | | |
Comparative Benchmarks
| | | | | | | | | | | | |
| | | MSCI World Index (f) | | (40.33)% | | 0.00% | | (0.19)% | | |
| | | JPMorgan Global Government Bond Index Unhedged (f) | | 12.00% | | 6.23% | | 5.95% | | |
| | | 60% MSCI World Index/40% JPMorgan Global Government Bond Index Unhedged (f) | | (22.34)% | | 2.78% | | 2.58% | | |
| (f) | Source: FactSet Research Systems Inc. |
Benchmark Definitions
MSCI World Index – a market capitalization index that is designed to measure global developed market equity performance.
JPMorgan Global Government Bond Index Unhedged – measures developed government bond markets around the world.
It is not possible to invest directly in an index.
Notes to Performance Summary
Performance for the Service Class includes the performance of the fund’s Initial Class for periods prior to their offering. Because Service Class expenses are higher than those of Initial Class, performance shown for Service Class is higher than it would have been had it been offered for the entire period. Performance has not been adjusted to take into account differences in class specific operating expenses (such as Rule 12b-1 fees). Please see the prospectus for additional information about performance and expenses.
Performance results reflect any applicable expense subsidies and waivers in effect during the periods shown. Without such subsidies and waivers the fund’s performance results would be less favorable. Please see the prospectus for complete details. All results are historical and assume the reinvestment of any dividends and capital gains distributions.
From time to time the fund may receive proceeds from litigation settlements, without which performance would be lower.
5
EXPENSE TABLE
Fund Expenses Borne by the Contract Holders During the Period,
July 1, 2008 through December 31, 2008
As a contract holder of the fund, you incur ongoing costs, including management fees; distribution (12b-1) fees; and other fund expenses. This example is intended to help you understand your ongoing costs (in dollars) of investing in the fund and to compare these costs with the ongoing costs of investing in other mutual funds.
The example is based on an investment of $1,000 invested at the beginning of the period and held for the entire period July 1, 2008 through December 31, 2008.
Actual Expenses
The first line for each share class in the following table provides information about actual account values and actual expenses. You may use the information in this line, together with the amount you invested, to estimate the expenses that you paid over the period. Simply divide your account value by $1,000 (for example, an $8,600 account value divided by $1,000 = 8.6), then multiply the result by the number in the first line under the heading entitled “Expenses Paid During Period” to estimate the expenses you paid on your account during this period.
Hypothetical Example for Comparison Purposes
The second line for each share class in the following table provides information about hypothetical account values and hypothetical expenses based on the fund’s actual expense ratio and an assumed rate of return of 5% per year before expenses, which is not the fund’s actual return. The hypothetical account values and expenses may not be used to estimate the actual ending account balance or expenses you paid for the period. You may use this information to compare the ongoing costs of investing in the fund and other funds. To do so, compare this 5% hypothetical example with the 5% hypothetical examples that appear in the shareholder reports of the other funds.
Please note that the expenses shown in the table are meant to highlight the fund’s ongoing costs only and do not take into account the fees and expenses imposed under the variable contracts through which your investment in the fund is made. Therefore, the second line for each share class in the table is useful in comparing ongoing costs associated with an investment in vehicles (such as the fund) which fund benefits under variable annuity and variable life insurance contracts and to qualified pension and retirement plans only, and will not help you determine the relative total costs of investing in the fund through variable annuity and variable life insurance contracts. If the fees and expenses imposed under the variable contracts were included, your costs would have been higher.
| | | | | | | | | | |
| Share Class | | | | Annualized
Expense Ratio | | Beginning
Account Value 7/01/08 | | Ending
Account Value 12/31/08 | | Expenses Paid
During Period (p)
7/01/08-12/31/08 |
| Initial Class | | Actual | | 0.90% | | $1,000.00 | | $875.68 | | $4.24 |
| | Hypothetical (h) | | 0.90% | | $1,000.00 | | $1,020.61 | | $4.57 |
| Service Class | | Actual | | 1.15% | | $1,000.00 | | $874.83 | | $5.42 |
| | Hypothetical (h) | | 1.15% | | $1,000.00 | | $1,019.36 | | $5.84 |
| (h) | 5% class return per year before expenses. |
| (p) | Expenses paid is equal to each class’ annualized expense ratio, as shown above, multiplied by the average account value over the period, multiplied by the number of days in the period, divided by the number of days in the year. |
6
PORTFOLIO OF INVESTMENTS – 12/31/08
The Portfolio of Investments is a complete list of all securities owned by your fund. It is categorized by broad-based asset classes.
| | | | | |
| Issuer | | Shares/Par | | Value ($) |
| | | | | |
| COMMON STOCKS – 59.4% | | | | | |
| Aerospace – 2.6% | | | | | |
| Lockheed Martin Corp. | | 17,660 | | $ | 1,484,853 |
| Northrop Grumman Corp. | | 16,220 | | | 730,549 |
| United Technologies Corp. | | 10,630 | | | 569,768 |
| | | | | |
| | | | $ | 2,785,170 |
| | | | | |
| Alcoholic Beverages – 0.8% | | | | | |
| Heineken N.V. | | 26,070 | | $ | 800,964 |
| | | | | |
| Apparel Manufacturers – 0.6% | | | | | |
| Compagnie Financiere Richemont S.A. | | 12,239 | | $ | 237,615 |
| NIKE, Inc., “B” | | 7,490 | | | 381,990 |
| | | | | |
| | | | $ | 619,605 |
| | | | | |
| Automotive – 0.1% | | | | | |
| Johnson Controls, Inc. | | 7,520 | | $ | 136,563 |
| | | | | |
| Broadcasting – 2.3% | | | | | |
| Fuji Television Network, Inc. | | 254 | | $ | 363,469 |
| Nippon Television Network Corp. | | 2,330 | | | 246,259 |
| Omnicom Group, Inc. | | 14,830 | | | 399,224 |
| Vivendi S.A. | | 20,730 | | | 674,920 |
| Walt Disney Co. | | 18,930 | | | 429,522 |
| WPP Group PLC | | 58,628 | | | 341,757 |
| | | | | |
| | | | $ | 2,455,151 |
| | | | | |
| Brokerage & Asset Managers – 1.0% | | | | | |
| Daiwa Securities Group, Inc. | | 84,000 | | $ | 500,595 |
| Franklin Resources, Inc. | | 3,260 | | | 207,923 |
| Merrill Lynch & Co., Inc. | | 27,200 | | | 316,608 |
| | | | | |
| | | | $ | 1,025,126 |
| | | | | |
| Business Services – 1.2% | | | | | |
| Accenture Ltd., “A” | | 18,990 | | $ | 622,682 |
| Bunzl PLC | | 28,910 | | | 246,762 |
| USS Co. Ltd. | | 7,530 | | | 398,412 |
| | | | | |
| | | | $ | 1,267,856 |
| | | | | |
| Chemicals – 0.9% | | | | | |
| 3M Co. | | 5,710 | | $ | 328,553 |
| PPG Industries, Inc. | | 14,560 | | | 617,781 |
| | | | | |
| | | | $ | 946,334 |
| | | | | |
| Computer Software – 1.1% | | | | | |
| Oracle Corp. (a) | | 68,050 | | $ | 1,206,527 |
| | | | | |
| Computer Software – Systems – 1.0% | | | | | |
| Fujitsu Ltd. | | 102,000 | | $ | 493,013 |
| International Business Machines Corp. | | 6,280 | | | 528,525 |
| | | | | |
| | | | $ | 1,021,538 |
| | | | | |
| Construction – 1.5% | | | | | |
| CRH PLC | | 21,700 | | $ | 547,657 |
| Geberit AG | | 4,532 | | | 488,238 |
| Sekisui Chemical Co. Ltd. | | 31,000 | | | 193,631 |
| Sherwin-Williams Co. | | 5,030 | | | 300,543 |
| | | | | |
| | | | $ | 1,530,069 |
| | | | | |
| | | | | |
| Issuer | | Shares/Par | | Value ($) |
| | | | | |
| COMMON STOCKS – continued | | | |
| Consumer Goods & Services – 1.9% | | | | | |
| Henkel KGaA, IPS | | 18,030 | | $ | 578,065 |
| Kao Corp. | | 21,000 | | | 635,942 |
| KOSE Corp. | | 16,000 | | | 402,011 |
| Procter & Gamble Co. | | 6,674 | | | 412,587 |
| | | | | |
| | | | $ | 2,028,605 |
| | | | | |
| Containers – 0.9% | | | | | |
| Brambles Ltd. | | 189,450 | | $ | 984,409 |
| | | | | |
| Electrical Equipment – 1.5% | | | | | |
| Legrand S.A. | | 30,660 | | $ | 589,130 |
| OMRON Corp. | | 22,800 | | | 306,023 |
| Spectris PLC | | 45,170 | | | 349,664 |
| W.W. Grainger, Inc. | | 4,200 | | | 331,128 |
| | | | | |
| | | | $ | 1,575,945 |
| | | | | |
| Electronics – 2.4% | | | | | |
| Intel Corp. | | 47,870 | | $ | 701,774 |
| Konica Minolta Holdings, Inc. | | 85,000 | | | 658,646 |
| Samsung Electronics Co. Ltd. | | 1,762 | | | 639,813 |
Taiwan Semiconductor Manufacturing
Co. Ltd., ADR | | 72,786 | | | 575,009 |
| | | | | |
| | | | $ | 2,575,242 |
| | | | | |
| Energy – Independent – 1.2% | | | | | |
| Apache Corp. | | 5,940 | | $ | 442,708 |
| Devon Energy Corp. | | 7,640 | | | 502,024 |
| EOG Resources, Inc. | | 4,850 | | | 322,913 |
| | | | | |
| | | | $ | 1,267,645 |
| | | | | |
| Energy – Integrated – 5.8% | | | | | |
| Chevron Corp. | | 14,100 | | $ | 1,042,977 |
| Exxon Mobil Corp. | | 10,470 | | | 835,820 |
| Hess Corp. | | 6,970 | | | 373,871 |
| Royal Dutch Shell PLC, “A” | | 51,160 | | | 1,337,339 |
| Statoil A.S.A. | | 42,980 | | | 707,892 |
| TOTAL S.A. | | 32,650 | | | 1,780,002 |
| | | | | |
| | | | $ | 6,077,901 |
| | | | | |
| Food & Beverages – 2.9% | | | | | |
| J.M. Smucker Co. | | 4,088 | | $ | 177,256 |
| Kellogg Co. | | 3,680 | | | 161,368 |
| Nestle S.A. | | 51,044 | | | 2,011,775 |
| Nong Shim Co. Ltd. (a) | | 1,361 | | | 265,624 |
| PepsiCo, Inc. | | 8,840 | | | 484,167 |
| | | | | |
| | | | $ | 3,100,190 |
| | | | | |
| Food & Drug Stores – 0.5% | | | | | |
| CVS Caremark Corp. | | 19,910 | | $ | 572,213 |
| | | | | |
| Forest & Paper Products – 0.3% | | | | | |
| UPM-Kymmene Corp. | | 23,590 | | $ | 299,108 |
| | | | | |
| Gaming & Lodging – 0.2% | | | | | |
| Royal Caribbean Cruises Ltd. | | 14,660 | | $ | 201,575 |
| | | | | |
7
Portfolio of Investments – continued
| | | | | |
| Issuer | | Shares/Par | | Value ($) |
| | | | | |
| COMMON STOCKS – continued | | | |
| Insurance – 3.0% | | | | | |
| Allstate Corp. | | 26,630 | | $ | 872,399 |
| Aviva PLC | | 54,680 | | | 309,514 |
| Jardine Lloyd Thompson Group PLC | | 35,910 | | | 226,822 |
| MetLife, Inc. | | 28,160 | | | 981,658 |
| Muenchener Ruckvers AG | | 4,120 | | | 647,446 |
| Prudential Financial, Inc. | | 5,510 | | | 166,733 |
| | | | | |
| | | | $ | 3,204,572 |
| | | | | |
| Leisure & Toys – 0.2% | | | | | |
| NAMCO BANDAI Holdings, Inc. (l) | | 19,500 | | $ | 213,730 |
| | | | | |
| Machinery & Tools – 0.5% | | | | | |
| Assa Abloy AB, “B” (l) | | 48,660 | | $ | 552,119 |
| | | | | |
| Major Banks – 4.6% | | | | | |
| Bank of New York Mellon Corp. | | 30,321 | | $ | 858,994 |
| Credit Agricole S.A. | | 43,609 | | | 495,942 |
| Goldman Sachs Group, Inc. | | 6,640 | | | 560,350 |
| JPMorgan Chase & Co. | | 16,420 | | | 517,723 |
| PNC Financial Services Group, Inc. | | 6,070 | | | 297,430 |
| State Street Corp. | | 10,830 | | | 425,944 |
| Sumitomo Mitsui Financial Group, Inc. | | 175 | | | 758,058 |
Unibanco-Uniao de Bancos Brasileiros
S.A., ADR | | 4,100 | | | 264,942 |
| UniCredito Italiano S.p.A. | | 183,284 | | | 456,294 |
| Wells Fargo & Co. | | 5,880 | | | 173,342 |
| | | | | |
| | | | $ | 4,809,019 |
| | | | | |
| Network & Telecom – 0.6% | | | | | |
| Nokia Oyj | | 40,150 | | $ | 622,443 |
| | | | | |
| Oil Services – 0.3% | | | | | |
| Fugro N.V. | | 5,440 | | $ | 156,179 |
| National Oilwell Varco, Inc. (a) | | 4,360 | | | 106,558 |
| | | | | |
| | | | $ | 262,737 |
| | | | | |
| Other Banks & Diversified Financials – 1.9% | | | |
| Bangkok Bank Public Co. Ltd. | | 81,800 | | $ | 167,569 |
| DNB Holding A.S.A. | | 106,200 | | | 424,228 |
| Hachijuni Bank Ltd. | | 46,000 | | | 264,622 |
| ING Groep N.V. | | 74,360 | | | 777,299 |
| Sapporo Hokuyo Holdings, Inc. | | 40 | | | 162,084 |
| Unione di Banche Italiane ScpA | | 16,306 | | | 235,995 |
| | | | | |
| | | | $ | 2,031,797 |
| | | | | |
| Pharmaceuticals – 6.4% | | | | | |
| Daiichi Sankyo Co. Ltd. | | 19,800 | | $ | 470,638 |
| GlaxoSmithKline PLC | | 40,100 | | | 744,432 |
| Hisamitsu Pharmaceutical Co., Inc. | | 3,100 | | | 126,563 |
| Johnson & Johnson | | 10,490 | | | 627,617 |
| Merck & Co., Inc. | | 23,030 | | | 700,112 |
| Merck KGaA | | 5,050 | | | 459,134 |
| Novartis AG | | 18,330 | | | 918,415 |
| Pfizer, Inc. | | 9,020 | | | 159,744 |
| Roche Holding AG | | 11,780 | | | 1,813,339 |
| Wyeth | | 20,080 | | | 753,201 |
| | | | | |
| | | | $ | 6,773,195 |
| | | | | |
| | | | | | |
| Issuer | | Shares/Par | | Value ($) |
| | | | | | |
| COMMON STOCKS – continued | | | |
| Printing & Publishing – 0.3% | | | | | | |
| Reed Elsevier PLC | | | 40,302 | | $ | 292,908 |
| | | | | | |
| Specialty Stores – 0.1% | | | | | | |
| Praktiker Bau-und Heimwerkermaerkte Holding AG, “A” | | | 10,790 | | $ | 118,799 |
| | | | | | |
| Telecommunications – Wireless – 3.0% | | | |
| America Movil S.A.B. de C.V., “L”, ADR | | | 7,460 | | $ | 231,185 |
| KDDI Corp. | | | 121 | | | 861,809 |
| Rogers Communications, Inc., “B” | | | 11,060 | | | 327,813 |
| Vodafone Group PLC | | | 864,520 | | | 1,740,377 |
| | | | | | |
| | | | | $ | 3,161,184 |
| | | | | | |
| Telephone Services – 2.7% | | | | | | |
| AT&T, Inc. | | | 41,130 | | $ | 1,172,205 |
| China Unicom Ltd. | | | 146,000 | | | 177,609 |
| Royal KPN N.V. | | | 36,090 | | | 523,336 |
| Telefonica S.A. | | | 45,980 | | | 1,030,663 |
| | | | | | |
| | | | | $ | 2,903,813 |
| | | | | | |
| Tobacco – 2.1% | | | | | | |
| Japan Tobacco, Inc. | | | 112 | | $ | 370,877 |
| Lorillard, Inc. | | | 5,290 | | | 298,092 |
| Philip Morris International, Inc. | | | 34,446 | | | 1,498,746 |
| | | | | | |
| | | | | $ | 2,167,715 |
| | | | | | |
| Trucking – 1.3% | | | | | | |
| TNT N.V. | | | 35,600 | | $ | 680,924 |
| Yamato Holdings Co. Ltd. | | | 55,000 | | | 717,161 |
| | | | | | |
| | | | | $ | 1,398,085 |
| | | | | | |
| Utilities – Electric Power – 1.7% | | | | | | |
| Dominion Resources, Inc. | | | 13,830 | | $ | 495,667 |
| E.ON AG | | | 18,283 | | | 739,313 |
| FPL Group, Inc. | | | 6,840 | | | 344,257 |
| PPL Corp. | | | 7,360 | | | 225,878 |
| | | | | | |
| | | | | $ | 1,805,115 |
| | | | | | |
Total Common Stocks
(Identified Cost, $79,490,252) | | | | | $ | 62,794,967 |
| | | | | | |
| | |
| BONDS – 32.2% | | | | | | |
| Asset Backed & Securitized – 1.0% | | | | | | |
Bayview Commercial Asset Trust, FRN,
2.137%, 2023 (n) | | CAD | 170,000 | | $ | 93,710 |
Commercial Mortgage Asset Trust, FRN,
0.896%, 2032 (n)(i) | | $ | 2,933,307 | | | 64,684 |
| Commercial Mortgage Pass-Through Certificates, FRN, 1.385%, 2017 (n) | | | 360,000 | | | 297,875 |
| Commercial Mortgage Pass-Through Certificates, FRN, 1.395%, 2017 (n) | | | 606,527 | | | 519,127 |
| First Union National Bank Commercial Mortgage Trust, FRN, 0.896%, 2043 (n)(i) | | | 7,241,630 | | | 102,381 |
| | | | | | |
| | | | | $ | 1,077,777 |
| | | | | | |
| International Market Quasi-Sovereign – 0.2% | | | |
| Canada Housing Trust, 4.6%, 2011 (n) | | CAD | 263,000 | | $ | 228,986 |
| | | | | | |
8
Portfolio of Investments – continued
| | | | | | |
| Issuer | | Shares/Par | | Value ($) |
| | | | | | |
| BONDS – continued | | | | | | |
| International Market Sovereign – 23.6% | | | |
Bundesrepublik Deutschland,
5%, 2011 | | EUR | 339,000 | | $ | 506,135 |
Bundesrepublik Deutschland,
4.25%, 2018 | | | 619,000 | | | 950,701 |
Commonwealth of Australia,
6%, 2017 | | AUD | 750,000 | | | 599,693 |
Federal Republic of Germany,
5.25%, 2010 | | EUR | 852,000 | | | 1,240,269 |
Federal Republic of Germany,
3.75%, 2013 | | | 457,000 | | | 673,164 |
Federal Republic of Germany,
3.75%, 2015 | | | 990,000 | | | 1,466,809 |
Federal Republic of Germany,
6.25%, 2030 | | | 824,000 | | | 1,533,199 |
| Government of Canada, 4.5%, 2015 | | CAD | 586,000 | | | 541,560 |
| Government of Canada, 5.75%, 2033 | | | 83,000 | | | 91,469 |
| Government of Japan, 1.5%, 2012 | | JPY | 60,000,000 | | | 683,146 |
| Government of Japan, 2.1%, 2024 | | | 104,000,000 | | | 1,219,541 |
| Government of Japan, 2.2%, 2027 | | | 109,950,000 | | | 1,306,407 |
| Government of Japan, 2.4%, 2037 | | | 25,000,000 | | | 311,620 |
| Kingdom of Belgium, 5.5%, 2017 | | EUR | 957,000 | | | 1,502,726 |
| Kingdom of Denmark, 4%, 2015 | | DKK | 1,404,000 | | | 273,860 |
Kingdom of Netherlands,
3.75%, 2014 | | EUR | 1,337,000 | | | 1,922,502 |
| Kingdom of Spain, 5%, 2012 | | | 1,195,000 | | | 1,767,901 |
| Kingdom of Sweden, 4.5%, 2015 | | SEK | 1,970,000 | | | 283,780 |
| Republic of France, 6%, 2025 | | EUR | 1,051,000 | | | 1,869,266 |
| Republic of France, 4.75%, 2035 | | | 371,000 | | | 594,324 |
| Republic of Italy, 4.75%, 2013 | | | 1,153,000 | | | 1,667,637 |
| United Kingdom Treasury, 9%, 2011 | | GBP | 615,000 | | | 1,039,954 |
| United Kingdom Treasury, 8%, 2015 | | | 752,000 | | | 1,401,609 |
| United Kingdom Treasury, 8%, 2021 | | | 340,000 | | | 714,188 |
United Kingdom Treasury,
4.25%, 2036 | | | 465,000 | | | 719,899 |
| | | | | | |
| | | | | $ | 24,881,359 |
| | | | | | |
| Mortgage Backed – 1.5% | | | | | | |
| Fannie Mae, 5.37%, 2013 | | $ | 144,781 | | $ | 148,182 |
| Fannie Mae, 4.78%, 2015 | | | 96,995 | | | 98,232 |
| Fannie Mae, 4.856%, 2015 | | | 77,100 | | | 77,773 |
| Fannie Mae, 5.09%, 2016 | | | 99,000 | | | 101,551 |
| Fannie Mae, 5.424%, 2016 | | | 104,218 | | | 109,187 |
| Fannie Mae, 4.995%, 2017 | | | 43,265 | | | 44,099 |
| Fannie Mae, 5.05%, 2017 | | | 90,000 | | | 92,103 |
| | | | | | |
| Issuer | | Shares/Par | | Value ($) |
| | | | | | |
| BONDS – continued | | | | | | |
| Mortgage Backed – continued | | | | | | |
| Fannie Mae, 5.32%, 2017 | | $ | 71,930 | | $ | 74,749 |
| Fannie Mae, 5.5%, 2024 | | | 83,114 | | | 83,849 |
| Freddie Mac, 5%, 2022-2025 | | | 634,264 | | | 639,242 |
| Freddie Mac, 4%, 2024 | | | 90,683 | | | 90,928 |
| | | | | | |
| | | | | $ | 1,559,895 |
| | | | | | |
| Municipals – 0.6% | | | | | | |
| Minnesota Public Facilities Authority, Water Pollution Control Rev., “B”, 5%, 2018 | | $ | 355,000 | | $ | 394,909 |
| New York, Dormitory Authority Rev. (New York University), BHAC, 5.5%, 2031 | | | 220,000 | | | 223,707 |
| | | | | | |
| | | | | $ | 618,616 |
| | | | | | |
| U.S. Government Agencies – 1.2% | | | |
| Aid-Egypt, 4.45%, 2015 | | $ | 349,000 | | $ | 377,042 |
| Small Business Administration, 5.09%, 2025 | | | 59,226 | | | 60,033 |
| Small Business Administration, 5.21%, 2026 | | | 730,557 | | | 743,417 |
| Small Business Administration, 5.36%, 2026 | | | 85,534 | | | 88,040 |
| | | | | | |
| | | | | $ | 1,268,532 |
| | | | | | |
| U.S. Treasury Obligations – 4.1% | | | | | | |
| U.S. Treasury Bonds, 2.375%, 2010 | | $ | 293,000 | | $ | 301,893 |
| U.S. Treasury Bonds, 8%, 2021 | | | 541,000 | | | 820,291 |
| U.S. Treasury Bonds, 5.375%, 2031 | | | 152,000 | | | 208,857 |
| U.S. Treasury Notes, 4.75%, 2012 (f) | | | 1,095,000 | | | 1,217,846 |
| U.S. Treasury Notes, 4.125%, 2015 | | | 749,000 | | | 859,009 |
| U.S. Treasury Notes, TIPS, 2%, 2016 | | | 1,004,207 | | | 961,685 |
| | | | | | |
| | | | | $ | 4,369,581 |
| | | | | | |
Total Bonds
(Identified Cost, $34,309,814) | | | | | $ | 34,004,746 |
| | | | | | |
| |
| MONEY MARKET FUNDS (v) – 7.4% | | | |
| MFS Institutional Money Market Portfolio, 0.37%, at Cost and Net Asset Value | | | 7,871,531 | | $ | 7,871,531 |
| | | | | | |
|
| COLLATERAL FOR SECURITIES LOANED – 0.0% |
| Navigator Securities Lending Prime Portfolio, at Cost and Net Asset Value | | | 17,936 | | $ | 17,936 |
| | | | | | |
Total Investments
(Identified Cost, $121,689,533) | | | | | $ | 104,689,180 |
| | | | | | |
OTHER ASSETS, LESS
LIABILITIES – 1.0% | | | | | | 1,016,459 |
| | | | | | |
| Net Assets – 100.0% | | | | | $ | 105,705,639 |
| | | | | | |
9
Portfolio of Investments – continued
| (a) | | Non-income producing security. |
| (f) | | All or a portion of the security has been segregated as collateral for open futures contracts. |
| (i) | | Interest only security for which the fund receives interest on notional principal (Par amount). Par amount shown is the notional principal and does not reflect the cost of the security. |
| (l) | | All or a portion of this security is on loan. |
| (n) | | Securities exempt from registration under Rule 144A of the Securities Act of 1933. These securities may be sold in the ordinary course of business in transactions exempt from registration, normally to qualified institutional buyers. At period end, the aggregate value of these securities was $1,306,763, representing 1.2% of net assets. |
| (v) | | Underlying fund that is available only to investment companies managed by MFS. The rate quoted is the annualized seven-day yield of the fund at period end. |
The following abbreviations are used in this report and are defined:
| ADR | | American Depository Receipt |
| FRN | | Floating Rate Note. Interest rate resets periodically and may not be the rate reported at period end. |
| IPS | | International Preference Stock |
| TIPS | | Treasury Inflation Protected Security |
| | |
| Insurers |
| BHAC | | Berkshire Hathaway Assurance Corp. |
Abbreviations indicate amounts shown in currencies other than the U.S. dollar. All amounts are stated in U.S. dollars unless otherwise indicated. A list of abbreviations is shown below:
Derivative Contracts at 12/31/08
Forward Foreign Currency Exchange Contracts at 12/31/08
| | | | | | | | | | | | | | | | | | |
Type | | Currency | | Contracts to
Deliver/Receive | | Settlement Date
Range | | In Exchange For | | Contracts
at Value | | Net Unrealized
Appreciation
(Depreciation) | |
| Appreciation | | | | | | | | | | | | | | | | |
| BUY | | AUD | | 95,805 | | 1/07/09 | | $ | 63,913 | | $ | 66,781 | | $ | 2,868 | |
| SELL | | CAD | | 307,402 | | 2/19/09 | | | 256,371 | | | 248,947 | | | 7,424 | |
| BUY | | CHF | | 114,958 | | 1/20/09 | | | 97,018 | | | 108,026 | | | 11,008 | |
| BUY | | DKK | | 219,507 | | 1/07/09 | | | 37,472 | | | 40,987 | | | 3,515 | |
| SELL | | EUR | | 6,659,428 | | 2/19/09 | | | 9,539,134 | | | 9,240,249 | | | 298,885 | |
| SELL | | GBP | | 1,332,673 | | 2/17/09 | | | 1,980,102 | | | 1,913,905 | | | 66,197 | |
| BUY | | JPY | | 1,064,322,377 | | 2/17/09-2/18/09 | | | 11,710,527 | | | 11,751,359 | | | 40,832 | |
| SELL | | JPY | | 55,615,507 | | 2/17/09-2/18/09 | | | 624,000 | | | 614,065 | | | 9,935 | |
| SELL | | SEK | | 411,901 | | 1/30/09 | | | 52,515 | | | 52,062 | | | 453 | |
| | | | | | | | | | | | | | | | | | |
| | | | | | | | | | | | | | | | $ | 441,117 | |
| | | | | | | | | | | | | | | | | | |
| Depreciation | | | | | | | | | | | | | | | | |
| SELL | | AUD | | 754,770 | | 1/07/09 | | $ | 503,624 | | $ | 526,107 | | $ | (22,483 | ) |
| SELL | | DKK | | 291,326 | | 1/07/09 | | | 49,000 | | | 54,397 | | | (5,397 | ) |
| BUY | | EUR | | 5,283,536 | | 2/19/09 | | | 7,549,667 | | | 7,331,139 | | | (218,528 | ) |
| SELL | | EUR | | 74,440 | | 2/19/09 | | | 102,969 | | | 103,289 | | | (320 | ) |
| BUY | | GBP | | 135,130 | | 2/17/09 | | | 207,333 | | | 194,065 | | | (13,268 | ) |
| BUY | | JPY | | 17,537,089 | | 2/18/09 | | | 195,672 | | | 193,634 | | | (2,038 | ) |
| SELL | | JPY | | 23,349,163 | | 2/18/09 | | | 257,359 | | | 257,807 | | | (448 | ) |
| SELL | | NOK | | 37,138 | | 1/14/09 | | | 5,188 | | | 5,300 | | | (112 | ) |
| SELL | | SEK | | 215,440 | | 1/30/09 | | | 27,000 | | | 27,230 | | | (230 | ) |
| | | | | | | | | | | | | | | | | | |
| | | | | | | | | | | | | | | | $ | (262,824 | ) |
| | | | | | | | | | | | | | | | | | |
10
Portfolio of Investments – continued
Futures contracts outstanding at 12/31/08
| | | | | | | | |
| Description | | Contracts | | Value | | Expiration
Date | | Unrealized
Appreciation
(Depreciation) |
| Japan Government Bonds 10 yr (Long) | | 4 | | $6,182,901 | | Mar-09 | | $34,699 |
At December 31, 2008, the fund had sufficient cash and/or other liquid securities to cover any commitments under these derivative contracts.
See Notes to Financial Statements
11
FINANCIAL STATEMENTS | STATEMENT OF ASSETS AND LIABILITIES
This statement represents your fund’s balance sheet, which details the assets and liabilities comprising the total value of the fund.
| | | | | |
At 12/31/08 | | | | | |
Assets | | | | | |
Investments - | | | | | |
Non-affiliated issuers, at value (identified cost, $113,818,002) | | $96,817,649 | | | |
Underlying funds, at cost and value | | 7,871,531 | | | |
Total investments, at value, including $16,823 of securities on loan (identified cost, $121,689,533) | | | | | $104,689,180 |
Foreign currency, at value (identified cost, $266,176) | | $260,878 | | | |
Receivable for forward foreign currency exchange contracts | | 441,117 | | | |
Receivable for investments sold | | 87,137 | | | |
Receivable for fund shares sold | | 16,917 | | | |
Interest and dividends receivable | | 675,530 | | | |
Receivable from investment adviser | | 20,219 | | | |
Other assets | | 5,973 | | | |
Total assets | | | | | $106,196,951 |
Liabilities | | | | | |
Payable for forward foreign currency exchange contracts | | $262,824 | | | |
Payable for daily variation margin on open futures contracts | | 164 | | | |
Payable for investments purchased | | 3,415 | | | |
Payable for fund shares reacquired | | 80,090 | | | |
Collateral for securities loaned, at value | | 17,936 | | | |
Payable to affiliates | | | | | |
Management fee | | 4,298 | | | |
Distribution fees | | 169 | | | |
Administrative services fee | | 282 | | | |
Payable for trustees’ compensation | | 66 | | | |
Accrued expenses and other liabilities | | 122,068 | | | |
Total liabilities | | | | | $491,312 |
Net assets | | | | | $105,705,639 |
Net assets consist of | | | | | |
Paid-in capital | | $118,198,221 | | | |
Unrealized appreciation (depreciation) on investments and translation of assets and liabilities in foreign currencies | | (16,809,750 | ) | | |
Accumulated net realized gain (loss) on investments and foreign currency transactions | | (2,981,010 | ) | | |
Undistributed net investment income | | 7,298,178 | | | |
Net assets | | | | | $105,705,639 |
Shares of beneficial interest outstanding | | | | | 8,205,547 |
Initial Class shares | | | | | |
Net assets | | $93,254,410 | | | |
Shares outstanding | | 7,231,898 | | | |
Net asset value per share | | | | | $12.89 |
Service Class shares | | | | | |
Net assets | | $12,451,229 | | | |
Shares outstanding | | 973,649 | | | |
Net asset value per share | | | | | $12.79 |
See Notes to Financial Statements
12
FINANCIAL STATEMENTS | STATEMENT OF OPERATIONS
This statement describes how much your fund earned in investment income and accrued in expenses. It also describes any gains and/or losses generated by fund operations.
| | | | | | |
| Year ended 12/31/08 | | | | | | |
| Net investment income | | | | | | |
Income | | | | | | |
Dividends | | $2,807,634 | | | | |
Interest | | 2,043,015 | | | | |
Dividends from underlying funds | | 8,750 | | | | |
Foreign taxes withheld | | (201,655 | ) | | | |
Total investment income | | | | | $4,657,744 | |
Expenses | | | | | | |
Management fee | | $1,032,979 | | | | |
Distribution fees | | 43,215 | | | | |
Administrative services fee | | 41,979 | | | | |
Trustees’ compensation | | 17,450 | | | | |
Custodian fee | | 167,842 | | | | |
Shareholder communications | | 9,576 | | | | |
Auditing fees | | 57,332 | | | | |
Legal fees | | 7,127 | | | | |
Miscellaneous | | 13,471 | | | | |
Total expenses | | | | | $1,390,971 | |
Fees paid indirectly | | (239 | ) | | | |
Reduction of expenses by investment adviser | | (108,222 | ) | | | |
Net expenses | | | | | $1,282,510 | |
Net investment income | | | | | $3,375,234 | |
Realized and unrealized gain (loss) on investments and foreign currency transactions | | | | | | |
Realized gain (loss) (identified cost basis) | | | | | | |
Investment transactions (net of $5,151 country tax) | | $2,291,259 | | | | |
Futures contracts | | 130,266 | | | | |
Foreign currency transactions | | 2,505,944 | | | | |
Net realized gain (loss) on investments and foreign currency transactions | | | | | $4,927,469 | |
Change in unrealized appreciation (depreciation) | | | | | | |
Investments (net of $2,905 decrease in deferred country tax) | | $(31,290,293 | ) | | | |
Futures contracts | | 11,634 | | | | |
Translation of assets and liabilities in foreign currencies | | 163,958 | | | | |
Net unrealized gain (loss) on investments and foreign currency translation | | | | | $(31,114,701 | ) |
Net realized and unrealized gain (loss) on investments and foreign currency | | | | | $(26,187,232 | ) |
Change in net assets from operations | | | | | $(22,811,998 | ) |
See Notes to Financial Statements
13
FINANCIAL STATEMENTS | STATEMENTS OF CHANGES IN NET ASSETS
These statements describe the increases and/or decreases in net assets resulting from operations, any distributions, and any shareholder transactions.
| | | | | | |
For years ended 12/31 | | 2008 | | | 2007 | |
Change in net assets | | | | | | |
From operations | | | | | | |
Net investment income | | $3,375,234 | | | $3,855,046 | |
Net realized gain (loss) on investments and foreign currency transactions | | 4,927,469 | | | 19,687,758 | |
Net unrealized gain (loss) on investments and foreign currency translation | | (31,114,701 | ) | | (8,738,762 | ) |
Change in net assets from operations | | $(22,811,998 | ) | | $14,804,042 | |
Distributions declared to shareholders | | | | | | |
From net investment income | | | | | | |
Initial Class | | $(6,516,244 | ) | | $(3,400,940 | ) |
Service Class | | (910,178 | ) | | (389,718 | ) |
From net realized gain on investments | | | | | | |
Initial Class | | (11,568,828 | ) | | (13,963,818 | ) |
Service Class | | (1,702,617 | ) | | (1,777,176 | ) |
Total distributions declared to shareholders | | $(20,697,867 | ) | | $(19,531,652 | ) |
Change in net assets from fund share transactions | | $(16,007,014 | ) | | $(9,895,179 | ) |
Total change in net assets | | $(59,516,879 | ) | | $(14,622,789 | ) |
Net assets | | | | | | |
At beginning of period | | 165,222,518 | | | 179,845,307 | |
At end of period (including undistributed net investment income of $7,298,178 and
$7,235,068, respectively) | | $105,705,639 | | | $165,222,518 | |
See Notes to Financial Statements
14
FINANCIAL STATEMENTS | FINANCIAL HIGHLIGHTS
The financial highlights table is intended to help you understand the fund’s financial performance for the past 5 years. Certain information reflects financial results for a single fund share. The total returns in the table represent the rate by which an investor would have earned (or lost) on an investment in the fund share class (assuming reinvestment of all distributions) held for the entire period.
| | | | | | | | | | | | | | | |
| Initial Class | | Years ended 12/31 | |
| | | 2008 | | | 2007 | | | 2006 | | | 2005 | | | 2004 | |
Net asset value, beginning of period | | $17.59 | | | $18.11 | | | $16.66 | | | $17.91 | | | $15.70 | |
| Income (loss) from investment operations | | | | | | | | | | | | | | | |
Net investment income (d) | | $0.37 | | | $0.40 | | | $0.41 | | | $0.37 | | | $0.32 | |
Net realized and unrealized gain (loss) on investments
and foreign currency | | (2.68 | ) | | 1.13 | | | 2.38 | | | 0.23 | | | 2.29 | |
Total from investment operations | | $(2.31 | ) | | $1.53 | | | $2.79 | | | $0.60 | | | $2.61 | |
| Less distributions declared to shareholders | | | | | | | | | | | | | | | |
From net investment income | | $(0.86 | ) | | $(0.40 | ) | | $(0.16 | ) | | $(0.75 | ) | | $(0.40 | ) |
From net realized gain on investments | | (1.53 | ) | | (1.65 | ) | | (1.18 | ) | | (1.10 | ) | | — | |
Total distributions declared to shareholders | | $(2.39 | ) | | $(2.05 | ) | | $(1.34 | ) | | $(1.85 | ) | | $(0.40 | ) |
Net asset value, end of period | | $12.89 | | | $17.59 | | | $18.11 | | | $16.66 | | | $17.91 | |
Total return (%) (k)(r)(s) | | (15.42 | ) | | 8.87 | | | 17.20 | | | 3.83 | | | 17.12 | |
Ratios (%) (to average net assets)
and Supplemental data: | | | | | | | | | | | | | | | |
Expenses before expense reductions (f) | | 0.98 | | | 0.95 | | | 0.93 | | | 0.92 | | | 0.89 | |
Expenses after expense reductions (f) | | 0.90 | | | 0.93 | | | N/A | | | N/A | | | N/A | |
Net investment income | | 2.48 | | | 2.24 | | | 2.41 | | | 2.18 | | | 1.97 | |
Portfolio turnover | | 75 | | | 78 | | | 76 | | | 78 | | | 86 | |
Net assets at end of period (000 Omitted) | | $93,254 | | | $145,113 | | | $161,209 | | | $161,143 | | | $166,034 | |
See Notes to Financial Statements
15
Financial Highlights – continued
| | | | | | | | | | | | | | | |
| |
| Service Class | | Years ended 12/31 | |
| | | 2008 | | | 2007 | | | 2006 | | | 2005 | | | 2004 | |
Net asset value, beginning of period | | $17.46 | | | $17.99 | | | $16.56 | | | $17.82 | | | $15.63 | |
| Income (loss) from investment operations | | | | | | | | | | | | | | | |
Net investment income (d) | | $0.34 | | | $0.35 | | | $0.37 | | | $0.32 | | | $0.28 | |
Net realized and unrealized gain (loss) on investments
and foreign currency | | (2.66 | ) | | 1.13 | | | 2.36 | | | 0.23 | | | 2.29 | |
Total from investment operations | | $(2.32 | ) | | $1.48 | | | $2.73 | | | $0.55 | | | $2.57 | |
| Less distributions declared to shareholders | | | | | | | | | | | | | | | |
From net investment income | | $(0.82 | ) | | $(0.36 | ) | | $(0.12 | ) | | $(0.71 | ) | | $(0.38 | ) |
From net realized gain on investments | | (1.53 | ) | | (1.65 | ) | | (1.18 | ) | | (1.10 | ) | | — | |
Total distributions declared to shareholders | | $(2.35 | ) | | $(2.01 | ) | | $(1.30 | ) | | $(1.81 | ) | | $(0.38 | ) |
Net asset value, end of period | | $12.79 | | | $17.46 | | | $17.99 | | | $16.56 | | | $17.82 | |
Total return (%) (k)(r)(s) | | (15.59 | ) | | 8.62 | | | 16.91 | | | 3.54 | | | 16.88 | |
Ratios (%) (to average net assets)
and Supplemental data: | | | | | | | | | | | | | | | |
Expenses before expense reductions (f) | | 1.23 | | | 1.20 | | | 1.18 | | | 1.17 | | | 1.14 | |
Expenses after expense reductions (f) | | 1.15 | | | 1.18 | | | N/A | | | N/A | | | N/A | |
Net investment income | | 2.25 | | | 1.99 | | | 2.15 | | | 1.91 | | | 1.72 | |
Portfolio turnover | | 75 | | | 78 | | | 76 | | | 78 | | | 86 | |
Net assets at end of period (000 Omitted) | | $12,451 | | | $20,109 | | | $18,637 | | | $16,797 | | | $14,460 | |
| (d) | Per share data are based on average shares outstanding. |
| (f) | Ratios do not reflect reductions from fees paid indirectly, if applicable. |
| (k) | The total return does not reflect expenses that apply to separate accounts. Inclusion of these charges would reduce the total return figures for all periods shown. |
| (r) | Certain expenses have been reduced without which performance would have been lower. |
| (s) | From time to time the fund may receive proceeds from litigation settlements, without which performance would be lower. |
See Notes to Financial Statements
16
NOTES TO FINANCIAL STATEMENTS
| (1) | | Business and Organization |
MFS Global Total Return Portfolio (the fund) is a series of MFS Variable Insurance Trust II (the trust). The trust is organized as a Massachusetts business trust and is registered under the Investment Company Act of 1940, as amended, as an open-end management investment company. The shares of the fund are sold to variable accounts established by insurance companies to fund benefits under variable contracts issued by such companies, and qualified retirement and pension plans.
| (2) | | Significant Accounting Policies |
General – The preparation of financial statements in conformity with U.S. generally accepted accounting principles requires management to make estimates and assumptions that affect the reported amounts of assets and liabilities, and disclosure of contingent assets and liabilities at the date of the financial statements and the reported amounts of revenues and expenses during the reporting period. Actual results could differ from those estimates. The fund can invest in foreign securities, including securities of emerging market issuers. Investments in foreign securities are vulnerable to the effects of changes in the relative values of the local currency and the U.S. dollar and to the effects of changes in each country’s legal, political, and economic environment. The markets of emerging markets countries are generally more volatile than the markets of developed countries with more mature economies. All of the risks of investing in foreign securities previously described are heightened when investing in emerging markets countries.
Investment Valuations – Equity securities, including restricted equity securities, are generally valued at the last sale or official closing price as reported by a third party pricing service on the market or exchange on which they are primarily traded. For securities for which there were no sales reported that day, equity securities are generally valued at the last quoted daily bid quotation as reported by a third party pricing service on the market or exchange on which they are primarily traded. For securities held short for which there were no sales reported for the day, the position is generally valued at the last quoted daily ask quotation as reported by a third party pricing service on the market or exchange on which such securities are primarily traded. Debt instruments and floating rate loans (other than short-term instruments), including restricted debt instruments, are generally valued at an evaluated or composite bid as reported by a third party pricing service. Short-term instruments with a maturity at issuance of 60 days or less may be valued at amortized cost, which approximates market value. Futures contracts are generally valued at last posted settlement price as reported by a third party pricing service on the market on which they are primarily traded. Futures contracts for which there were no trades that day for a particular position are generally valued at the closing bid quotation as reported by a third party pricing service on the market on which such futures contracts are primarily traded. Forward foreign currency contracts are generally valued at the mean of bid and asked prices for the time period interpolated from rates reported by a third party pricing service for proximate time periods. Open-end investment companies are generally valued at net asset value per share. Securities and other assets generally valued on the basis of information from a third party pricing service may also be valued at a broker-dealer bid quotation. Values obtained from pricing services can utilize both dealer-supplied valuations and electronic data processing techniques, which take into account factors such as institutional-size trading in similar groups of securities, yield, quality, coupon rate, maturity, type of issue, trading characteristics, and other market data. The values of foreign securities and other assets and liabilities expressed in foreign currencies are converted to U.S. dollars using the mean of bid and asked prices for rates reported by a third party pricing service.
The Board of Trustees has delegated primary responsibility for determining or causing to be determined the value of the fund’s investments (including any fair valuation) to the adviser pursuant to valuation policies and procedures approved by the Board. If the adviser determines that reliable market quotations are not readily available, investments are valued at fair value as determined in good faith by the adviser in accordance with such procedures under the oversight of the Board of Trustees. Under the fund’s valuation policies and procedures, market quotations are not considered to be readily available for most types of debt instruments and floating rate loans and many types of derivatives. These investments are generally valued at fair value based on information from third party pricing services. In addition, investments may be valued at fair value if the adviser determines that an investment’s value has been materially affected by events occurring after the close of the exchange or market on which the investment is principally traded (such as foreign exchange or market) and prior to the determination of the fund’s net asset value, or after the halting of trading of a specific security where trading does not resume prior to the close of the exchange or market on which the security is principally traded. Events that occur on a frequent basis after foreign markets close (such as developments in foreign markets and significant movements in the U.S. markets) and prior to the determination of the fund’s net asset value may be deemed to have a material affect on the value of securities traded in foreign markets. Accordingly, the fund’s foreign equity securities may often be valued at fair value. The adviser may rely on third party pricing services or other information (such as the correlation with price movements of similar securities in the same or other markets; the type, cost and investment characteristics of the security; the business and financial condition of the issuer; and trading and other market data) to assist in determining whether to fair value and at what value to fair value an investment. The
value of an investment for purposes of calculating the fund’s net asset value can differ depending on the source and method
17
Notes to Financial Statements – continued
used to determine value. When fair valuation is used, the value of investments used to determine the fund’s net asset value may differ from quoted or published prices for the same investments.
The fund adopted FASB Statement No. 157, Fair Value Measurements (the “Statement”). This Statement provides a single definition of fair value, a hierarchy for measuring fair value and expanded disclosures about fair value measurements.
Various inputs are used in determining the value of the fund’s assets or liabilities carried at market value. These inputs are categorized into three broad levels. Level 1 includes quoted prices in active markets for identical assets or liabilities. Level 2 includes other significant observable market-based inputs (including quoted prices for similar securities, interest rates, prepayment speed, and credit risk). Level 3 includes unobservable inputs, which may include the adviser’s own assumptions in determining the fair value of investments. Other financial instruments are derivative instruments not reflected in total investments, such as futures, forwards, swap contracts and written options. The following is a summary of the levels used as of December 31, 2008 in valuing the fund’s assets or liabilities carried at market value:
| | | | | | | | |
| | | Level 1 | | Level 2 | | Level 3 | | Total |
| Investments in Securities | | $36,322,888 | | $68,366,292 | | $— | | $104,689,180 |
| Other Financial Instruments | | $34,699 | | $178,293 | | $— | | $212,992 |
Repurchase Agreements – The fund may enter into repurchase agreements with approved counterparties. Each repurchase agreement is recorded at cost. The fund requires that the securities collateral in a repurchase transaction be transferred to a custodian. The fund monitors, on a daily basis, the value of the collateral to ensure that its value, including accrued interest, is greater than amounts owed to the fund under each such repurchase agreement. The fund and other funds managed by Massachusetts Financial Services Company (MFS), may utilize a joint trading account for the purpose of entering into one or more repurchase agreements.
Inflation-Adjusted Debt Securities – The fund invests in inflation-adjusted debt securities issued by the U.S. Treasury. The fund may also invest in inflation-adjusted debt securities issued by U.S. Government agencies and instrumentalities other than the U.S. Treasury and by other entities such as U.S. and foreign corporations and foreign governments. The principal value of these debt securities is adjusted through income according to changes in the Consumer Price Index or another general price or wage index. These debt securities typically pay a fixed rate of interest, but this fixed rate is applied to the inflation-adjusted principal amount. The principal paid at maturity of the debt security is typically equal to the inflation-adjusted principal amount, or the security’s original par value, whichever is greater. Other types of inflation-adjusted securities may use other methods to adjust for other measures of inflation.
Foreign Currency Translation – Purchases and sales of foreign investments, income, and expenses are converted into U.S. dollars based upon currency exchange rates prevailing on the respective dates of such transactions or on the reporting date for foreign denominated receivables and payables. Gains and losses attributable to foreign currency exchange rates on sales of securities are recorded for financial statement purposes as net realized gains and losses on investments. Gains and losses attributable to foreign exchange rate movements on receivables, payables, income and expenses are recorded for financial statement purposes as foreign currency transaction gains and losses. That portion of both realized and unrealized gains and losses on investments that results from fluctuations in foreign currency exchange rates is not separately disclosed.
Derivative Risk – The fund may invest in derivatives for hedging or non-hedging purposes. While hedging can reduce or eliminate losses, it can also reduce or eliminate gains. When the fund uses derivatives as an investment to gain market exposure, or for hedging purposes, gains and losses from derivative instruments may be substantially greater than the derivative’s original cost. Cash that has been segregated on behalf of certain derivative contracts will be reported separately on the Statement of Assets and Liabilities as restricted cash. On some over-the-counter derivatives, the fund attempts to reduce its exposure to counterparty credit risk by entering into an ISDA Master Agreement on a bilateral basis with each of the counterparties with whom it undertakes a significant volume of transactions. The ISDA Master Agreement gives the fund the right, upon an event of default by the applicable counterparty, to close out all transactions traded under such agreement and to net amounts owed under each transaction to one net amount payable by one party to the other. This right to close out and net payments across all transactions traded under the ISDA Master Agreement could result in a reduction of the fund’s credit risk to such counterparty equal to any amounts payable by the fund under the applicable transactions, if any. However, absent an event of default by the counterparty, the ISDA Master Agreement does not result in an offset of reported balance sheet assets and liabilities across transactions between the fund and the applicable counterparty. Derivative instruments include futures contracts and forward foreign currency exchange contracts.
In March 2008, FASB Statement No. 161, Disclosures about Derivative Instruments and Hedging Activities (the “Standard”) was issued, and is effective for financial statements issued for fiscal years and interim periods beginning after November 15, 2008. This Standard provides enhanced disclosures about the fund’s use of and accounting for derivative instruments and the effect of derivative instruments on the fund’s results of operations and financial position. Management is evaluating the application
18
Notes to Financial Statements – continued
of the Standard to the fund, and has not at this time determined the impact, if any, resulting from the adoption of this Standard on the fund’s financial statements.
FASB Staff Position (FSP) 133-1 was implemented during the period. FSP 133-1 amends FAS 133 to require sellers of credit derivatives to make disclosures that will enable financial statement users to assess the potential effects of those credit derivatives on an entity’s financial position, financial performance and cash flows. There was no impact from implementing FSP 133-1 as the fund did not hold any of these credit derivatives at period end.
Futures Contracts – The fund may enter into futures contracts for the delayed delivery of securities or currency, or contracts based on financial indices at a fixed price on a future date. In entering such contracts, the fund is required to deposit with the broker either in cash or securities an amount equal to a certain percentage of the contract amount. Subsequent payments are made or received by the fund each day, depending on the daily fluctuations in the value of the contract, and are recorded for financial statement purposes as unrealized gains or losses by the fund. Upon entering into such contracts, the fund bears the risk of interest or exchange rates or securities prices moving unexpectedly, in which case, the fund may not achieve the anticipated benefits of the futures contracts and may realize a loss.
Forward Foreign Currency Exchange Contracts – The fund may enter into forward foreign currency exchange contracts for the purchase or sale of a specific foreign currency at a fixed price on a future date. Risks may arise upon entering into these contracts from the potential inability of counterparties to meet the terms of their contracts and from unanticipated movements in the value of the contract. The fund may enter into forward foreign currency exchange contracts for hedging purposes as well as for non-hedging purposes. For hedging purposes, the fund may enter into contracts to deliver or receive foreign currency it will receive from or require for its normal investment activities. The fund may also use contracts in a manner intended to protect foreign currency denominated securities from declines in value due to unfavorable exchange rate movements. For non-hedging purposes, the fund may enter into contracts with the intent of changing the relative exposure of the fund’s portfolio of securities to different currencies to take advantage of anticipated changes. The forward foreign currency exchange contracts are adjusted by the daily exchange rate of the underlying currency and any gains or losses are recorded as unrealized until the contract settlement date. On contract settlement date, the gains or losses are recorded as realized gains or losses on foreign currency transactions.
Security Loans – State Street Bank and Trust Company (“State Street”), as lending agent, may loan the securities of the fund to certain qualified institutions (the “Borrowers”) approved by the fund. The loans are collateralized by cash and/or U.S. Treasury and federal agency obligations in an amount typically at least equal to the market value of the securities loaned. State Street provides the fund with indemnification against Borrower default. The fund bears the risk of loss with respect to the investment of cash collateral. On loans collateralized by cash, the cash collateral is invested in a money market fund or short-term securities. A portion of the income generated upon investment of the collateral is remitted to the Borrowers, and the remainder is allocated between the fund and the lending agent. On loans collateralized by U.S. Treasury and/or federal agency obligations, a fee is received from the Borrower, and is allocated between the fund and the lending agent. Income from securities lending is included in interest income on the Statement of Operations. The dividend and interest income earned on the securities loaned is accounted for in the same manner as other dividend and interest income.
Indemnifications – Under the fund’s organizational documents, its officers and trustees may be indemnified against certain liabilities and expenses arising out of the performance of their duties to the fund. Additionally, in the normal course of business, the fund enters into agreements with service providers that may contain indemnification clauses. The fund’s maximum exposure under these agreements is unknown as this would involve future claims that may be made against the fund that have not yet occurred.
Investment Transactions and Income – Investment transactions are recorded on the trade date. Interest income is recorded on the accrual basis. All premium and discount is amortized or accreted for financial statement purposes in accordance with U.S. generally accepted accounting principles. Dividends received in cash are recorded on the ex-dividend date. Certain dividends from foreign securities will be recorded when the fund is informed of the dividend if such information is obtained subsequent to the ex-dividend date. Dividend and interest payments received in additional securities are recorded on the ex-dividend or ex-interest date in an amount equal to the value of the security on such date.
The fund may receive proceeds from litigation settlements. Any proceeds received from litigation involving portfolio holdings are reflected in the Statement of Operations in realized gain/loss if the security has been disposed of by the fund or in unrealized gain/loss if the security is still held by the fund. Any other proceeds from litigation not related to portfolio holdings are reflected as other income in the Statement of Operations.
Fees Paid Indirectly – The fund’s custody fee may be reduced according to an arrangement that measures the value of cash deposited with the custodian by the fund. This amount, for the year ended December 31, 2008, is shown as a reduction of total expenses on the Statement of Operations.
19
Notes to Financial Statements – continued
Tax Matters and Distributions – The fund intends to qualify as a regulated investment company, as defined under Subchapter M of the Internal Revenue Code, and to distribute all of its taxable income, including realized capital gains. As a result, no provision for federal income tax is required. Each of the fund’s federal tax returns for the prior three fiscal years remains subject to examination by the Internal Revenue Service. Foreign taxes, if any, have been accrued by the fund in the accompanying financial statements.
Distributions to shareholders are recorded on the ex-dividend date. Income and capital gain distributions are determined in accordance with income tax regulations, which may differ from U.S. generally accepted accounting principles. Certain capital accounts in the financial statements are periodically adjusted for permanent differences in order to reflect their tax character. These adjustments have no impact on net assets or net asset value per share. Temporary differences which arise from recognizing certain items of income, expense, gain or loss in different periods for financial statement and tax purposes will reverse at some time in the future. Distributions in excess of net investment income or net realized gains are temporary overdistributions for financial statement purposes resulting from differences in the recognition or classification of income or distributions for financial statement and tax purposes.
Book/tax differences primarily relate to amortization and accretion of debt securities, wash sale loss deferrals, straddle loss deferrals, foreign currency transactions, and derivative transactions.
The tax character of distributions declared to shareholders for the last two fiscal years is as follows:
| | | | |
| | | 12/31/08 | | 12/31/07 |
| Ordinary income (including any short-term capital gains) | | $7,619,350 | | $4,471,676 |
| Long-term capital gain | | 13,078,517 | | 15,059,976 |
| Total distributions | | $20,697,867 | | $19,531,652 |
The federal tax cost and the tax basis components of distributable earnings were as follows:
| | | |
| As of 12/31/08 | | | |
| Cost of investments | | $122,301,957 | |
| Gross appreciation | | 2,365,079 | |
| Gross depreciation | | (19,977,856 | ) |
| Net unrealized appreciation (depreciation) | | $(17,612,777 | ) |
| Undistributed ordinary income | | 7,792,670 | |
| Capital loss carryforwards | | (2,271,532 | ) |
| Other temporary differences | | (400,943 | ) |
As of December 31, 2008, the fund had capital loss carryforwards available to offset future realized gains. Such losses expire as follows:
The availability of a portion of the capital loss carryforwards, which were acquired on September 5, 2003 in connection with the Global Asset Allocation fund merger, may be limited in a given year.
Multiple Classes of Shares of Beneficial Interest – The fund offers multiple classes of shares, which differ in their respective distribution fees. The fund’s income, realized and unrealized gain (loss), and common expenses are allocated to shareholders based on the daily net assets of each class. Dividends are declared separately for each class. Differences in per share dividend rates are generally due to differences in separate class expenses.
| (3) | | Transactions with Affiliates |
Investment Adviser – The fund has an investment advisory agreement with MFS to provide overall investment management and related administrative services and facilities to the fund.
The management fee is computed daily and paid monthly at the following annual rates:
| | |
| First $300 million of average daily net assets | | 0.75% |
| Average daily net assets in excess of $300 million | | 0.675% |
The management fee incurred for the year ended December 31, 2008 was equivalent to an annual effective rate of 0.75% of the fund’s average daily net assets.
The investment adviser has agreed in writing to pay a portion of the fund’s total annual operating expenses, exclusive of interest, taxes, extraordinary expenses, brokerage and transaction costs and investment-related expenses, such that the total annual operating expenses of the fund do not exceed 0.90% annually of average daily net assets for the Initial Class shares and 1.15% annually of average daily net assets for the Service Class shares. This written agreement will continue until April 30, 2010. For the year ended December 31, 2008, this reduction amounted to $108,222 and is reflected as a reduction of total expenses in the Statement of Operations.
20
Notes to Financial Statements – continued
Distributor – MFS Fund Distributors, Inc. (MFD), a wholly-owned subsidiary of MFS, is the distributor of shares of the fund. The Trustees have adopted a distribution plan for the Service Class shares pursuant to Rule 12b-1 under the Investment Company Act of 1940.
The fund’s distribution plan provides that the fund will pay MFD distribution fees equal to 0.25% per annum of its average daily net assets attributable to Service Class shares as partial consideration for services performed and expenses incurred by MFD and financial intermediaries in connection with the sale and distribution of the fund’s Service Class shares and the sale and distribution of the variable annuity or variable life insurance contracts investing indirectly in Service Class shares. MFD may subsequently pay all, or a portion, of the distribution fees to financial intermediaries.
Shareholder Servicing Agent – MFS Service Center, Inc. (MFSC), a wholly-owned subsidiary of MFS, has contracted to provide transfer agent and recordkeeping functions in connection with the issuance, transfer, and redemption of each class of shares of the fund under a Shareholder Servicing Agent Agreement. During the year ended December 31, 2008, the fund did not pay MFSC a fee for this service.
Administrator – MFS provides certain financial, legal, shareholder communications, compliance, and other administrative services to the fund. Under an administrative services agreement, the fund partially reimburses MFS the costs incurred to provide these services. The fund is charged an annual fixed amount of $10,000 plus a fee based on average daily net assets.
The administrative services fee incurred for the year ended December 31, 2008 was equivalent to an annual effective rate of 0.0305% of the fund’s average daily net assets.
Trustees’ and Officers’ Compensation – The fund pays compensation to trustees in the form of a retainer, attendance fees, and additional compensation to the Board chairperson. The fund does not pay compensation directly to officers of the fund who are also officers of the investment adviser, all of whom receive remuneration for their services to the fund from MFS. Certain officers of the fund are officers or directors of MFS, MFD, and MFSC.
Other – This fund and certain other MFS funds (the funds) have entered into services agreements (the Agreements) which provide for payment of fees by the funds to Tarantino LLC and Griffin Compliance LLC in return for the provision of services of an Independent Chief Compliance Officer (ICCO) and Assistant ICCO, respectively, for the funds. The ICCO and Assistant ICCO are officers of the funds and the sole members of Tarantino LLC and Griffin Compliance LLC, respectively. The funds can terminate the Agreements with Tarantino LLC and Griffin Compliance LLC at any time under the terms of the Agreements. MFS has agreed to bear all expenses associated with office space, other administrative support, and supplies provided to the ICCO and Assistant ICCO. For the year ended December 31, 2008, the aggregate fees paid by the fund to Tarantino LLC and Griffin Compliance LLC were $1,312 and are included in miscellaneous expense on the Statement of Operations.
The fund may invest in a money market fund managed by MFS which seeks a high level of current income consistent with preservation of capital and liquidity. Income earned on this investment is included in dividends from underlying funds on the Statement of Operations. This money market fund does not pay a management fee to MFS.
Purchases and sales of investments, other than purchased option transactions and short-term obligations, were as follows:
| | | | |
| | | Purchases | | Sales |
| U.S. Government securities | | $20,809,980 | | $29,063,287 |
| Investments (non-U.S. Government securities) | | $75,849,033 | | $96,028,750 |
21
Notes to Financial Statements – continued
| (5) | | Shares of Beneficial Interest |
The fund’s Declaration of Trust permits the Trustees to issue an unlimited number of full and fractional shares of beneficial interest. Transactions in fund shares were as follows:
| | | | | | | | | | | | |
| | | Year ended 12/31/08 | | | Year ended 12/31/07 | |
| | | Shares | | | Amount | | | Shares | | | Amount | |
| Shares sold | | | | | | | | | | | | |
Initial Class | | 120,242 | | | $1,873,174 | | | 104,489 | | | $1,868,162 | |
Service Class | | 117,833 | | | 1,759,042 | | | 165,602 | | | 2,999,239 | |
| | 238,075 | | | $3,632,216 | | | 270,091 | | | $4,867,401 | |
| Shares issued to shareholders in reinvestment of distributions | | | | | | | | | | | | |
Initial Class | | 1,166,779 | | | $18,085,072 | | | 1,023,262 | | | $17,364,758 | |
Service Class | | 169,662 | | | 2,612,795 | | | 128,447 | | | 2,166,894 | |
| | 1,336,441 | | | $20,697,867 | | | 1,151,709 | | | $19,531,652 | |
| Shares reacquired | | | | | | | | | | | | |
Initial Class | | (2,303,648 | ) | | $(33,896,488 | ) | | (1,783,093 | ) | | $(31,189,719 | ) |
Service Class | | (465,400 | ) | | (6,440,609 | ) | | (178,422 | ) | | (3,104,513 | ) |
| | (2,769,048 | ) | | $(40,337,097 | ) | | (1,961,515 | ) | | $(34,294,232 | ) |
| Net change | | | | | | | | | | | | |
Initial Class | | (1,016,627 | ) | | $(13,938,242 | ) | | (655,342 | ) | | $(11,956,799 | ) |
Service Class | | (177,905 | ) | | (2,068,772 | ) | | 115,627 | | | 2,061,620 | |
| | (1,194,532 | ) | | $(16,007,014 | ) | | (539,715 | ) | | $(9,895,179 | ) |
The fund and other funds managed by MFS participate in a $1 billion unsecured committed line of credit provided by a syndication of banks under a credit agreement. In addition, the fund and other funds managed by MFS have established uncommitted borrowing arrangements with certain banks. Borrowings may be made for temporary financing needs. Interest is charged to each fund, based on its borrowings, generally at a rate equal to the Federal Reserve funds rate plus 0.30%. In addition, a commitment fee, based on the average daily, unused portion of the committed line of credit, is allocated among the participating funds at the end of each calendar quarter. For the year ended December 31, 2008, the fund’s commitment fee and interest expense were $694 and $0, respectively, and are included in miscellaneous expense on the Statement of Operations.
| (7) | | Transactions in Underlying Funds – Affiliated Issuers |
An affiliated issuer may be considered one in which the fund owns 5% or more of the outstanding voting securities, or a company which is under common control. For the purposes of this report, the fund assumes the following to be affiliated issuers:
| | | | | | | | | |
| Underlying Funds | | Beginning
Shares/Par
Amount | | Acquisitions
Shares/Par
Amount | | Dispositions
Shares/Par
Amount | | | Ending
Shares/Par
Amount |
| MFS Institutional Money Market Portfolio | | — | | 26,191,456 | | (18,319,925 | ) | | 7,871,531 |
| | | | |
| Underlying Funds | | Realized
Gain (Loss) | | Capital Gain
Distributions | | Dividend
Income | | | Ending
Value |
| MFS Institutional Money Market Portfolio | | $— | | $— | | $8,750 | | | $7,871,531 |
22
REPORT OF INDEPENDENT REGISTERED PUBLIC ACCOUNTING FIRM
To the Board of Trustees of MFS Variable Insurance Trust II and the Shareholders of
MFS Global Total Return Portfolio:
We have audited the accompanying statement of assets and liabilities, including the portfolio of investments, of MFS Global Total Return Portfolio (the “Fund”) (one of the portfolios comprising MFS Variable Insurance Trust II) as of December 31, 2008, and the related statement of operations for the year then ended, the statements of changes in net assets for each of the two years in the period then ended, and the financial highlights for each of the five years in the period then ended. These financial statements and financial highlights are the responsibility of the Fund’s management. Our responsibility is to express an opinion on these financial statements and financial highlights based on our audits.
We conducted our audits in accordance with the standards of the Public Company Accounting Oversight Board (United States). Those standards require that we plan and perform the audit to obtain reasonable assurance about whether the financial statements and financial highlights are free of material misstatement. The Fund is not required to have, nor were we engaged to perform, an audit of its internal control over financial reporting. Our audits included consideration of internal control over financial reporting as a basis for designing audit procedures that are appropriate in the circumstances, but not for the purpose of expressing an opinion on the effectiveness of the Fund’s internal control over financial reporting. Accordingly, we express no such opinion. An audit also includes examining, on a test basis, evidence supporting the amounts and disclosures in the financial statements, assessing the accounting principles used and significant estimates made by management, as well as evaluating the overall financial statement presentation. Our procedures included confirmation of securities owned as of December 31, 2008, by correspondence with the custodian and brokers; where replies were not received from brokers, we performed other auditing procedures. We believe that our audits provide a reasonable basis for our opinion.
In our opinion, the financial statements and financial highlights referred to above present fairly, in all material respects, the financial position of MFS Global Total Return Portfolio as of December 31, 2008, the results of its operations for the year then ended, the changes in its net assets for each of the two years in the period then ended, and the financial highlights for each of the five years in the period then ended, in conformity with accounting principles generally accepted in the United States of America.
DELOITTE & TOUCHE LLP
Boston, Massachusetts
February 17, 2009
23
TRUSTEES AND OFFICERS – IDENTIFICATION AND BACKGROUND
The Trustees and officers of the Trust, as of February 1, 2009, are listed below, together with their principal occupations during the past five years. (Their titles may have varied during that period.) The address of each Trustee and officer is 500 Boylston Street, Boston, Massachusetts 02116.
| | | | | | |
Name, Date of Birth | | Position(s) Held
with Fund | | Trustee/Officer
Since (1) | | Principal Occupations During the Past Five Years and
Other Directorships (2) |
| INTERESTED TRUSTEE | | | | |
David D. Horn (3) (born 6/07/41) | | Trustee | | April 1986 | | Private investor; Sun Life Assurance Company of Canada, Senior Vice President and General Manager for the United States (until 1997); Director (until March 2004) |
| | |
| INDEPENDENT TRUSTEES | | | | |
J. Kermit Birchfield (born 1/08/40) | | Chairman | | May 1997 | | Consultant; Century Partners, Inc. (investments), Director; Displaytech, Inc. (technology), Director; Dessin Fournir LLC (furniture manufacturer), Director (2005 to present); Intermountain Gas Company, Inc. & Intermountain Industries, Inc. (oil & gas exploration and production), Director; Site Watch LLC (software to monitor oil tanks), Managing Director (2006 to present); Juridica Investments (fund investing in judicial matters), Director (2007 to present); HPSC, Inc. (medical financing), Director (until January 2004) |
| | | |
Robert C. Bishop (born 1/13/43) | | Trustee | | May 2001 | | AutoImmune, Inc. (pharmaceutical product development), Chairman, President and Chief Executive Officer; Caliper Life Sciences Corp. (laboratory analytical instruments), Director; Millipore Corporation (purification/filtration products), Director; Waterstreet Capital (leverage buyouts), Advisory Board (August 2006 to present); Optobionics Corporation (ophthalmic devices), Director (2002 to 2007) |
| | | |
Frederick H. Dulles (born 3/12/42) | | Trustee | | May 2001 | | Ten State International Law PLLC (law firm), Of Counsel (since 2006); Prudential Carolina Real Estate, (real estate), Broker (since 2006); Free Enterprise Foundation, Inc. (research institute), Director & Secretary (until 2008); Disher, Hamrick & Myers Residential, Inc. (real estate) Broker (2005 until 2006); Frederick H. Dulles law practice (until 2006); Ten State Street LLP (law firm), Member (until 2005) |
| | | |
Marcia A. Kean (born 6/30/48) | | Trustee | | April 2005 | | Feinstein Kean Healthcare (consulting), Chief Executive Officer |
| | | |
Ronald G. Steinhart (born 6/15/40) | | Trustee | | May 2001 | | Private investor; Penske Automotive Group (automotive retailer), Director; Animal Health International, Inc. (animal health products), Director (since 2007); Texas Industries (concrete/aggregates/cement), Director (since 2007); Penson Worldwide, Inc. (securities clearance), Director (since 2006); Carreker Corporation (technology consulting) Director (until 2005); Prentiss Properties Trust (real estate investment trust), Director (until 2006) |
| | | |
Haviland Wright (born 7/21/48) | | Trustee | | May 2001 | | Profitability of Hawaii (software), Chief Development Officer (since December 2008); Elixir Technologies Corporation (software) Director (since 2005); Nano Loa Inc. (liquid crystal displays), Director |
| | |
| TRUSTEE EMERITUS | | | | |
Samuel Adams (born 10/19/25) | | Trustee Emeritus | | | | Retired; K&L Gates LLP (law firm), Of Counsel |
| | |
| OFFICERS | | | | |
Maria F. Dwyer (4) (born 12/01/58) | | President | | November 2005 | | Massachusetts Financial Services Company, Executive Vice President and Chief Regulatory Officer (since March 2004) Chief Compliance Officer (since December 2006); Fidelity Management & Research Company, Vice President (prior to March 2004); Fidelity Group of Funds, President and Treasurer (until March 2004) |
| | | |
Christopher R. Bohane (4) (born 1/18/74) | | Assistant Secretary and Assistant Clerk | | July 2005 | | Massachusetts Financial Services Company, Vice President and Senior Counsel |
| | | |
John M. Corcoran (4) (born 4/13/65) | | Treasurer | | October 2008 | | Massachusetts Financial Services Company, Senior Vice President (since October 2008); State Street Bank and Trust (financial services provider), Senior Vice President, (until September 2008) |
| | | |
Ethan D. Corey (4) (born 11/21/63) | | Assistant Secretary and Assistant Clerk | | July 2005 | | Massachusetts Financial Services Company, Senior Vice President and Associate General Counsel (since 2004); Dechert LLP (law firm), Counsel (prior to December 2004) |
| | | |
David L. DiLorenzo (4) (born 8/10/68) | | Assistant Treasurer | | July 2005 | | Massachusetts Financial Services Company, Vice President (since June 2005); JP Morgan Investor Services, Vice President (until June 2005) |
| | | |
Timothy M. Fagan (4) (born 7/10/68) | | Assistant Secretary and Assistant Clerk | | September 2005 | | Massachusetts Financial Services Company, Vice President and Senior Counsel (since September 2005); John Hancock Advisers, LLC, Vice President, Senior Attorney and Chief Compliance Officer (until August 2005) |
24
Trustees and Officers – continued
| | | | | | |
Name, Date of Birth | | Position(s) Held
with Fund | | Trustee/Officer
Since (1) | | Principal Occupations During the Past Five Years and
Other Directorships (2) |
Mark D. Fischer (4) (born 10/27/70) | | Assistant Treasurer | | July 2005 | | Massachusetts Financial Services Company, Vice President (since May 2005); JP Morgan Investment Management Company, Vice President (until May 2005) |
| | | |
Robyn L. Griffin (born 7/04/75) | | Assistant Independent Chief Compliance Officer | | August 2008 | | Griffin Compliance LLC (provider of compliance services), Principal (since August 2008); State Street Corporation (financial services provider), Mutual Fund Administration Assistant Vice President (October 2006 – July 2008); Liberty Mutual Group (insurance), Personal Market Assistant Controller (April 2006 – October 2006); Deloitte & Touche LLP (professional services firm), Senior Manager (prior to April 2006) |
| | | |
Brian E. Langenfeld (4) (born 3/07/73) | | Assistant Secretary and Assistant Clerk | | May 2006 | | Massachusetts Financial Services Company, Vice President and Senior Counsel (since May 2006); John Hancock Advisers, LLC, Assistant Vice President and Counsel (until April 2006) |
| | | |
Ellen Moynihan (4) (born 11/13/57) | | Assistant Treasurer | | May 1997 | | Massachusetts Financial Services Company, Senior Vice President |
| | | |
Susan S. Newton (4) (born 3/07/50) | | Assistant Secretary and Assistant Clerk | | May 2005 | | Massachusetts Financial Services Company, Senior Vice President and Associate General Counsel (since April 2005); John Hancock Advisers, LLC, Senior Vice President, Secretary and Chief Legal Officer (until April 2005) |
| | | |
Susan A. Pereira (4) (born 11/05/70) | | Assistant Secretary and Assistant Clerk | | July 2005 | | Massachusetts Financial Services Company, Vice President and Senior Counsel (since June 2004); Bingham McCutchen LLP (law firm), Associate (until June 2004) |
| | | |
Mark N. Polebaum (4) (born 5/01/52) | | Secretary and Clerk | | February 2006 | | Massachusetts Financial Services Company, Executive Vice President, General Counsel and Secretary (since January 2006); Wilmer Cutler Pickering Hale and Dorr LLP (law firm), Partner (until January 2006) |
| | | |
Frank L. Tarantino (born 3/07/44) | | Independent Chief Compliance Officer | | September 2004 | | Tarantino LLC (provider of compliance services), Principal (since June 2004); CRA Business Strategies Group (consulting services), Executive Vice President (until June 2004) |
| | | |
Richard S. Weitzel (4) (born 7/16/70) | | Assistant Secretary and Assistant Clerk | | October 2007 | | Massachusetts Financial Services Company, Vice President and Assistant General Counsel (since 2004); Massachusetts Department of Business and Technology, General Counsel (until April 2004) |
| | | |
James O. Yost (4) (born 6/12/60) | | Assistant Treasurer | | April 1992 | | Massachusetts Financial Services Company, Senior Vice President |
| (1) | Date first appointed to serve as Trustee/Officer of an MFS fund or a Compass variable account. Each Trustee has served continuously since appointment. |
| (2) | Directorships or trusteeships of companies required to report to the Securities and Exchange Commission (i.e., “public companies”). |
| (3) | “Interested person” of the Trust, within the meaning of the Investment Company Act of 1940 (referred to as the 1940 Act), which is the principal federal law governing investment companies like the Trust, as a result of position with Sun Life of Canada (U.S.). The address of Sun Life of Canada (U.S.) is One Sun Life Executive Park, Wellesley Hills, Massachusetts 02481. |
| (4) | “Interested person” of MFS within the meaning of the 1940 Act. The address of MFS is 500 Boylston Street, Boston, Massachusetts 02116. |
The Trust does not hold annual meetings for the purpose of electing Trustees, and Trustees are not elected for fixed terms. Each Trustee and officer holds office until his or her successor is chosen and qualified, or until his or her earlier death, resignation, retirement or removal.
All Trustees currently serve as Trustees of the Trust and have served in that capacity since originally elected or appointed. All of the Trustees are also Managers of the Compass Variable Accounts. The executive officers of the Trust hold similar offices for the Compass Variable Accounts and other funds in the MFS fund complex. As of January 1, 2009, each Trustee serves as a Trustee or Manager of 35 Accounts/Funds.
The Statement of Additional Information contains further information about the Trustees and is available without charge upon request by calling 1-800-752-7215.
| | |
Investment Adviser
Massachusetts Financial Services Company 500 Boylston Street, Boston, MA 02116-3741 | | Custodian State Street Bank and Trust 1 Lincoln Street, Boston, MA 02111-2900 |
Distributor
MFS Fund Distributors, Inc. 500 Boylston Street, Boston, MA 02116-3741 | | Independent Registered Public Accounting Firm Deloitte & Touche LLP 200 Berkeley Street, Boston, MA 02116 |
Portfolio Managers Nevin Chitkara Steven Gorham Matthew Ryan Erik Weisman Barnaby Wiener | | |
25
BOARD REVIEW OF INVESTMENT ADVISORY AGREEMENT
The Investment Company Act of 1940 requires that both the full Board of Trustees and a majority of the non-interested (“independent”) Trustees, voting separately, annually approve the continuation of the investment advisory agreement between MFS Variable Insurance Trust II (the “Trust”) and Massachusetts Financial Services Company (“MFS”) on behalf of the Fund. The Trustees consider matters bearing on the Fund and the advisory arrangements at their meetings throughout the year, including a review of performance data at each regular meeting. In addition, the independent Trustees met in May and again in July 2008 (“contract review meetings”) for the specific purpose of considering whether to approve the continuation of the investment advisory agreement for the Fund. The independent Trustees were assisted in their evaluation of the investment advisory agreement by independent legal counsel, from whom they received separate legal advice and with whom they met separately from MFS management during various contract review meetings. The independent Trustees were also assisted in this process by the Fund’s Independent Chief Compliance Officer, a full-time senior officer appointed by and reporting to the independent Trustees.
In connection with their deliberations, the Trustees, including the independent Trustees, considered such information and factors as they believed, in light of the legal advice furnished to them and their own business judgment, to be relevant. The investment advisory agreement was considered separately for the Fund, although the Trustees also took into account the common interests of all Funds in the Trust in their review. As described below, the Trustees considered the nature, quality, and extent of the various investment advisory, administrative, and shareholder services performed by MFS under the existing investment advisory agreement and other arrangements with the Trust.
In connection with their contract review meetings, the Trustees received and relied upon materials which included, among other items: (i) information provided by Lipper Inc. on the investment performance of the Fund for various time periods ended December 31, 2007, compared to the investment performance of a group of funds with substantially similar investment classifications/objectives (the “Lipper performance universe”), (ii) information provided by Lipper Inc. on the Fund’s advisory fees and other expenses compared to the advisory fees and other expenses of comparable funds identified by Lipper (the “Lipper expense group”), (iii) information provided by MFS on the advisory fees of comparable portfolios of its other clients, including institutional separate account and other clients, (iv) information as to whether expense waivers, reimbursements or fee “breakpoints” are observed for the Fund, (v) information regarding MFS’ financial results and financial condition, including MFS’ and certain of its affiliates’ estimated profitability from services performed for the Fund, (vi) MFS’ views regarding the outlook for the mutual fund industry and its strategic business plans, (vii) descriptions of various functions performed by MFS for the Trust, such as compliance monitoring and portfolio trading practices, and (viii) information regarding the overall organization of MFS, including information about MFS’ senior management and other personnel providing investment advisory, administrative and other services to the Fund. The comparative performance, fee and expense information prepared and provided by Lipper Inc. was not independently verified, and the independent Trustees did not independently verify any information provided to them by MFS.
The Trustees’ conclusion as to the continuation of the investment advisory agreement was based on comprehensive consideration of all information provided to the Trustees and not the result of any single factor. Some of the factors that figured particularly in the Trustees’ deliberations are described below for the Fund, while individual Trustees may have given different weight to various factors and evaluated the information presented as a whole differently than another Trustee. The Trustees recognized that the fee arrangements for the Fund reflect years of review and discussion between the independent Trustees and MFS, that certain aspects of such arrangements may receive greater scrutiny in some years than others, and that the Trustees’ conclusions may be based, in part, on their consideration of these same arrangements during the course of the year and in prior years.
Based on information provided by Lipper Inc., the Trustees compared the Fund’s total return investment performance to the performance of a peer group of funds over various time periods. The Trustees placed particular emphasis on the total return performance of the Fund’s Initial Class shares in comparison to the performance of funds in its Lipper performance universe over the one-, three- and five-year periods. The Trustees did not rely on performance results for more recent periods, including those shown elsewhere in this report.
The Trustees noted the performance of the Fund’s Initial Class shares was in the 1st quintile relative to the other funds in the Lipper Classification Index for the one-year period (the 1st quintile being the best performers and the 5th quintile being the worst performers). The total return performance of the Fund was also in the 1st quintile for the three-year period and the five-year period ended December 31, 2007, relative to the Lipper performance universe. Based on the nature and quality of services provided by MFS, the Board of Trustees concluded that the Fund’s performance was satisfactory.
In the course of their deliberations, the Trustees took into account information provided by MFS during contract review meetings, as well as during investment review meetings conducted with portfolio management personnel during the course of the year.
26
Board Review of Investment Advisory Agreement – continued
In assessing the reasonableness of the Fund’s advisory fee, the Trustees considered, among other information, the Fund’s advisory fee and the total expense ratio of the Fund’s Initial Class shares as a percentage of average daily net assets, compared to the advisory fee and total expense ratios of its peer group of funds based on information provided by Lipper Inc. The Trustees also considered the advisory fees charged by MFS to institutional accounts. In comparing these fees, the Trustees considered the generally broader scope of services provided by MFS to the Trust than those provided to institutional accounts. The Trustees also considered the higher demands placed on MFS’ investment personnel and trading infrastructure as a result of the daily cash in-flows and out-flows of the Fund, and the impact on MFS and related expenses due to the more extensive regulatory regime to which the Fund is subject, compared to institutional accounts.
In considering the fees, the Trustees noted from the Lipper data that the Fund’s effective advisory fee rate and total expense ratio were each above the median of such fees and expenses of funds in the Lipper expense group. In addition, the Trustees accepted MFS’ offer to continue the expense limitation for the Fund. The Trustees further concluded that the existing breakpoint was sufficient to allow the Fund to benefit from economies of scale as its assets grow. The Trustees concluded that the fees were reasonable in light of the nature and quality of services provided.
The Trustees also considered information prepared by MFS relating to its costs and profits with respect to the Fund and other investment companies and accounts advised by MFS, as well as MFS’ methodologies used to determine and allocate its costs to the Fund and other accounts and products for purposes of estimating profitability.
After reviewing these and other factors described below, the Trustees concluded that the advisory fees charged to the Fund represent reasonable compensation in light of the nature and quality of the services being provided by MFS.
In addition, the Trustees considered MFS’ resources and related efforts to continue to retain, attract and motivate capable personnel to serve the Fund. The Trustees also considered the financial resources of MFS and its parent, Sun Life Financial Inc. The Trustees further considered any advantages and possible disadvantages of having an adviser which also serves other investment companies as well as institutional accounts.
The Trustees also considered the nature, quality, cost, and extent of administrative, transfer agency, and distribution services provided to the Fund by MFS and its affiliates under agreements and plans other than the investment advisory agreement, including the 12b-1 fees the Fund pays to MFS Fund Distributors, Inc., an affiliate of MFS. The Trustees also considered the nature, extent and quality of certain other services MFS performs or arranges on the Fund’s behalf, which may include securities lending programs, directed expense payment programs, class action recovery programs, and MFS’ interaction with third-party service providers, principally custodians and sub-custodians. The Trustees concluded that the various non-advisory services provided by MFS and its affiliates on behalf of the Fund were satisfactory. The Trustees also considered the benefits to MFS from the use of the Fund’s portfolio brokerage commissions to pay for research and other similar services and various other factors. Additionally, the Trustees considered so-called “fall-out benefits” to MFS such as reputational value derived from serving as investment manager to the Trust, and determined that any such benefits derived by MFS were reasonable and fair.
Based on their evaluation of factors that they deemed to be material, including those factors described above, the Board of Trustees, including a majority of the independent Trustees, concluded that the investment advisory agreement should be continued for an additional one-year period, commencing September 1, 2008.
A discussion regarding the Board’s most recent review and renewal of the fund’s Investment Advisory Agreement with MFS is available by clicking on the fund’s name under “Variable Insurance Portfolios-VIT II” in the “Products & Performance” section on the MFS Web site (mfs.com).
27
PROXY VOTING POLICIES AND INFORMATION
A general description of the MFS funds’ proxy voting policies and procedures is available without charge, upon request, by calling
1-800-225-2606, by visiting the Proxy Voting section of mfs.com or by visiting the SEC’s Web site at http://www.sec.gov.
Information regarding how the fund voted proxies relating to portfolio securities during the most recent twelve-month period ended June 30 is available without charge by visiting the Proxy Voting section of mfs.com or by visiting the SEC’s Web site at http://www.sec.gov.
QUARTERLY PORTFOLIO DISCLOSURE
The fund will file a complete schedule of portfolio holdings with the Securities and Exchange Commission (the Commission) for the first and third quarters of each fiscal year on Form N-Q. The fund’s Form N-Q may be reviewed and copied at the:
Public Reference Room
Securities and Exchange Commission
100 F Street, NE, Room 1580
Washington, D.C. 20549
Information on the operation of the Public Reference Room may be obtained by calling the Commission at 1-800-SEC-0330. The fund’s Form N-Q is available on the EDGAR database on the Commission’s Internet Web site at http://www.sec.gov, and copies of this information may be obtained, upon payment of a duplicating fee, by electronic request at the following e-mail address: publicinfo@sec.gov or by writing the Public Reference Section at the above address.
FEDERAL TAX INFORMATION (unaudited)
The following information is provided pursuant to provisions of the Internal Revenue Code.
The fund designates $13,078,517 as capital gain dividends paid during the fiscal year.
For corporate shareholders, 9.54% of the ordinary income dividends paid during the fiscal year qualify for the corporate dividends received deduction.
28
MFS® PRIVACY NOTICE
Privacy is a concern for every investor today. At MFS Investment Management® and the MFS funds, we take this concern very seriously. We want you to understand our policies about the investment products and services that we offer, and how we protect the nonpublic personal information of investors who have a direct relationship with us and our wholly owned subsidiaries.
Throughout our business relationship, you provide us with personal information. We maintain information and records about you, your investments, and the services you use. Examples of the nonpublic personal information we maintain include
| | Ÿ | | data from investment applications and other forms |
| | Ÿ | | share balances and transactional history with us, our affiliates, or others |
| | Ÿ | | facts from a consumer reporting agency |
We do not disclose any nonpublic personal information about our customers or former customers to anyone, except as permitted by law. We may share nonpublic personal information with third parties or certain of our affiliates in connection with servicing your account or processing your transactions. We may share information with companies or financial institutions that perform marketing services on our behalf or with other financial institutions with which we have joint marketing arrangements, subject to any legal requirements.
Authorization to access your nonpublic personal information is limited to appropriate personnel who provide products, services, or information to you. We maintain physical, electronic, and procedural safeguards to help protect the personal information we collect about you.
If you have any questions about the MFS privacy policy, please call 1-800-225-2606 any business day between 8 a.m. and 8 p.m. Eastern time.
Note: If you own MFS products or receive MFS services in the name of a third party such as a bank or broker-dealer, their privacy policy may apply to you instead of ours.
29


MFS® MONEY MARKET PORTFOLIO
The report is prepared for the general information of contract owners. It is authorized for distribution to prospective investors only when preceded or accompanied by a current prospectus.
NOT FDIC INSURED Ÿ MAY LOSE VALUE Ÿ NO BANK GUARANTEE Ÿ NOT A DEPOSIT Ÿ NOT INSURED BY ANY FEDERAL GOVERNMENT AGENCY OR NCUA/NCUSIF
LETTER FROM THE CEO

Dear Contract Owners:
The market downturns and economic setbacks of late probably rank among the worst financial declines most of us have experienced. Inevitably, people may be questioning their commitment to investing. Still, it is important to remember that downturns are an inescapable part of the business cycle. Such troughs have been seen before, and if we can use history as a guide, market recoveries typically have followed.
Recent events have clearly shown us the value of certain types of investments. In this environment, two of the hallmarks of mutual funds — transparency and liquidity — have become critically important. Unlike some other types of investments, the operations of mutual funds are relatively transparent to their shareholders. With their daily redemption feature, mutual funds also generally provide easy, convenient access to one’s money. Through these recent market upheavals, this level of liquidity enhanced the ability of mutual fund investors to respond and modify their investments as they and their advisors saw fit — a flexibility that those in less liquid investments simply did not have at their disposal.
At MFS® we take particular pride in how well mutual funds can serve investors because we invented the mutual fund in the United States. Established in 1924, Massachusetts Investors Trust was the nation’s first fund. Recent market events only reinforce what we have learned through 85 years — that mutual funds provide unique features that are important to investors in any type of market climate.
Respectfully,

Robert J. Manning
Chief Executive Officer and Chief Investment Officer
MFS Investment Management®
February 17, 2009
The opinions expressed in this letter are subject to change, may not be relied upon for investment advice, and no forecasts can be guaranteed.
Before investing, consider the fund’s investment objectives, risks, charges, and expenses. For a prospectus containing this and other information, contact your investment professional or view online. Read it carefully.
MFS Fund Distributors, Inc., 500 Boylston Street, Boston, MA 02116
1
PORTFOLIO COMPOSITION
Portfolio structure (u)
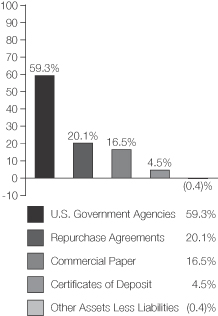
| | |
| Short term credit quality (q) | | |
| Average Credit Quality Short-Term Bonds (a) | | A-1 |
| All holdings are rated A-1 | | |
| | |
| Maturity breakdown (u) | | |
| 0 - 29 days | | 90.5% |
| 30 - 59 days | | 3.5% |
| 60 - 89 days | | 6.5% |
| Other Assets Less Liabilities | | (0.5)% |
| (a) | The average credit quality is based upon a market weighted average of portfolio holdings that are rated by public rating agencies. |
| (q) | Each security is assigned a rating from Moody’s Investors Service. If not rated by Moody’s, the rating will be that assigned by Standard & Poor’s. Likewise, if not assigned a rating by Standard & Poor’s, it will be based on the rating assigned by Fitch, Inc. If not rated by any of the three agencies, the security is considered Not Rated. U.S. Treasuries and U.S. Agency securities are included in the “A-1”-rating category. Percentages are based on the total market value of investments as of 12/31/08. |
| (u) | For purposes of this presentation, accrued interest, where applicable, is included. |
From time to time “Other Assets Less Liabilities” may be negative due to timing of cash receipts.
Percentages are based on net assets as of 12/31/08, unless otherwise noted.
The portfolio is actively managed and current holdings may be different.
2
PERFORMANCE SUMMARY THROUGH 12/31/08
Total returns as well as the current 7-day yield have been provided for the applicable time periods. Performance results reflect the percentage change in net asset value, including the reinvestment of any dividends and capital gains distributions. (See Notes to Performance Summary.) An investment in the portfolio is not insured or guaranteed by the Federal Deposit Insurance Corporation or any other government agency. Although the fund seeks to preserve the value of your investment at $1.00 per unit, it is possible to lose money by investing in the fund.
Performance data shown represents past performance and is no guarantee of future results. Investment return and principal value fluctuate so your units, when sold, may be worth more or less than the original cost; current performance may be lower or higher than quoted. The performance shown does not reflect the deduction of taxes, if any, that a contract holder would pay on fund distributions or the redemption of contract units. The returns for the fund shown also do not reflect the deduction of expenses associated with variable products, such as mortality and expense risk charges, separate account charges, and sales charges imposed by the insurance company separate accounts. Such expenses would reduce the overall returns shown.
| | | | | | | | | | | | |
| | | Share class | | Inception | | 1 year total
return | | Current 7-day
yield (w) | | Current 7-day yield
without waiver | | |
| | | Initial Class | | 7/19/85 | | 2.03% | | 0.00% | | (0.14)% | | |
| | | Service Class | | 8/24/01 | | 1.80% | | 0.00% | | (0.39)% | | |
| (w) | Yield was less than 0.01% |
Notes to Performance Summary
Yields quoted are based on the latest seven days ended as of December 31, 2008, with dividends annualized. The yield quotations more closely reflect the current earnings of the fund than the total return quotations.
Performance results reflect any applicable expense subsidies, waivers and adjustments in effect during the periods shown. Subsidies and fee waivers may be imposed to enhance a fund’s yield or to avoid a negative yield during periods when the fund’s operating expenses have a significant impact on the fund’s yield due to lower interest rates. Without such subsidies and waivers the fund’s performance results would be less favorable. Please see the prospectus for complete details. All results are historical and assume the reinvestment of any dividends and capital gains distributions.
From time to time the funds may receive proceeds from litigation settlements, without which performance would be lower.
3
EXPENSE TABLE
Fund Expenses Borne by the Contract Holders During the Period,
July 1, 2008 through December 31, 2008
As a contract holder of the fund, you incur ongoing costs, including management fees; distribution (12b-1) fees; and other fund expenses. This example is intended to help you understand your ongoing costs (in dollars) of investing in the fund and to compare these costs with the ongoing costs of investing in other mutual funds.
The example is based on an investment of $1,000 invested at the beginning of the period and held for the entire period July 1, 2008 through December 31, 2008.
Actual Expenses
The first line for each share class in the following table provides information about actual account values and actual expenses. You may use the information in this line, together with the amount you invested, to estimate the expenses that you paid over the period. Simply divide your account value by $1,000 (for example, an $8,600 account value divided by $1,000 = 8.6), then multiply the result by the number in the first line under the heading entitled “Expenses Paid During Period” to estimate the expenses you paid on your account during this period.
Hypothetical Example for Comparison Purposes
The second line for each share class in the following table provides information about hypothetical account values and hypothetical expenses based on the fund’s actual expense ratio and an assumed rate of return of 5% per year before expenses, which is not the fund’s actual return. The hypothetical account values and expenses may not be used to estimate the actual ending account balance or expenses you paid for the period. You may use this information to compare the ongoing costs of investing in the fund and other funds. To do so, compare this 5% hypothetical example with the 5% hypothetical examples that appear in the shareholder reports of the other funds.
Please note that the expenses shown in the table are meant to highlight the fund’s ongoing costs only and do not take into account the fees and expenses imposed under the variable contracts through which your investment in the fund is made. Therefore, the second line for each share class in the table is useful in comparing ongoing costs associated with an investment in vehicles (such as the fund) which fund benefits under variable annuity and variable life insurance contracts and to qualified pension and retirement plans only, and will not help you determine the relative total costs of investing in the fund through variable annuity and variable life insurance contracts. If the fees and expenses imposed under the variable contracts were included, your costs would have been higher.
| | | | | | | | | | |
| Share Class | | | | Annualized Expense Ratio | | Beginning
Account Value
7/01/08 | | Ending
Account Value
12/31/08 | | Expenses Paid During Period (p) 7/01/08-12/31/08 |
| Initial Class | | Actual | | 0.58% | | $1,000.00 | | $1,006.22 | | $2.92 |
| | Hypothetical (h) | | 0.58% | | $1,000.00 | | $1,022.22 | | $2.95 |
| Service Class | | Actual | | 0.80% | | $1,000.00 | | $1,005.13 | | $4.03 |
| | Hypothetical (h) | | 0.80% | | $1,000.00 | | $1,021.11 | | $4.06 |
| (h) | 5% class return per year before expenses. |
| (p) | Expenses paid is equal to each class’ annualized expense ratio, as shown above, multiplied by the average account value over the period, multiplied by the number of days in the period, divided by the number of days in the year. |
4
PORTFOLIO OF INVESTMENTS – 12/31/08
The Portfolio of Investments is a complete list of all securities owned by your fund. It is categorized by broad-based asset classes.
| | | | | | |
| Issuer | | Shares/Par | | Value ($) |
| | | | | | |
| U.S. GOVERNMENT AGENCIES (y) – 59.3% |
| Fannie Mae, 0.001%, due 1/27/09 | | $ | 15,544,000 | | $ | 15,543,988 |
Federal Home Loan Bank,
0.01%, due 1/05/09 | | | 38,000,000 | | | 37,999,958 |
Federal Home Loan Bank,
0.01%, due 1/07/09 | | | 4,836,000 | | | 4,835,992 |
Federal Home Loan Bank,
0.03%, due 1/07/09 | | | 23,279,000 | | | 23,278,884 |
Federal Home Loan Bank,
0.001%, due 1/14/09 | | | 5,419,000 | | | 5,418,998 |
Federal Home Loan Bank,
0.005%, due 1/15/09 | | | 47,944,000 | | | 47,943,907 |
Federal Home Loan Bank,
0.005%, due 1/16/09 | | | 10,569,000 | | | 10,568,978 |
Federal Home Loan Bank, 0.01%, due 1/20/09 | | | 43,076,000 | | | 43,075,773 |
Federal Home Loan Bank,
0.001%, due 1/22/09 | | | 40,971,000 | | | 40,970,976 |
Federal Home Loan Bank,
0.01%, due 1/28/09 | | | 81,179,000 | | | 81,178,391 |
| Freddie Mac, 0.01%, due 1/28/09 | | | 24,287,000 | | | 24,286,818 |
| | | | | | |
| Total U.S. Government Agencies, at Amortized Cost and Value | | | | | $ | 335,102,663 |
| | | | | | |
| COMMERCIAL PAPER (y) – 16.5% |
| Automotive – 1.8% | | | | | | |
Toyota Motor Credit Corp.,
1.45%, due 1/09/09 | | $ | 10,151,000 | | $ | 10,147,729 |
| | | | | | |
| Major Banks – 8.5% | | | | | | |
| ABN-AMRO North America Finance, Inc., 3%, due 3/05/09 | | $ | 3,200,000 | | $ | 3,183,200 |
| ABN-AMRO North America Finance, Inc., 2.99%, due 3/12/09 | | | 19,860,000 | | | 19,744,536 |
Goldman Sachs Group, Inc.,
2.65%, due 3/02/09 | | | 7,800,000 | | | 7,765,550 |
JPMorgan Chase & Co.,
0.01%, due 1/30/09 | | | 17,010,000 | | | 17,009,863 |
| | | | | | |
| | | | | $ | 47,703,149 |
| | | | | | |
| Other Banks & Diversified Financials – 6.2% | | | |
Citigroup Funding, Inc.,
0.35%, due 1/12/09 | | $ | 10,897,000 | | $ | 10,895,835 |
| Citigroup Funding, Inc., 3.1%, due 2/24/09 | | | 7,338,000 | | | 7,303,878 |
| HSBC USA, Inc., 0.05%, due 1/02/09 | | | 17,010,000 | | | 17,009,976 |
| | | | | | |
| | | | | $ | 35,209,689 |
| | | | | | |
Total Commercial Paper, at
Amortized Cost and Value | | | | | $ | 93,060,567 |
| | | | | | |
| | | | | | | |
| Issuer | | Shares/Par | | Value ($) | |
| | | | | | | |
| CERTIFICATES OF DEPOSIT – 4.5% | |
| Major Banks – 3.2% | | | | | | | |
| BNP Paribas, NY, 3.08%, due 2/26/09 | | $ | 12,000,000 | | $ | 12,000,000 | |
| BNP Paribas, NY, 2.02%, due 3/04/09 | | | 6,079,000 | | | 6,079,000 | |
| | | | | | | |
| | | | | $ | 18,079,000 | |
| | | | | | | |
| Other Banks & Diversified Financials – 1.3% | | | | |
| DEPFA Bank PLC, NY, 3.09%, due 1/06/09 | | $ | 7,214,000 | | $ | 7,214,000 | |
| | | | | | | |
| Total Certificates of Deposit, at Amortized Cost and Value | | | | | $ | 25,293,000 | |
| | | | | | | |
|
| REPURCHASE AGREEMENTS – 20.1% | |
| Goldman Sachs, 0.01%, dated 12/31/08, due 1/02/09, total to be received $56,700,032 (secured by U.S. Treasury and Federal Agency obligations and Mortgage Backed securities in a jointly traded account) | | $ | 56,700,000 | | $ | 56,700,000 | |
| Morgan Stanley, 0.02%, dated 12/31/08, due 1/02/09, total to be received $56,700,063 (secured by U.S. Treasury and Federal Agency obligations and Mortgage Backed securities in a jointly traded account) | | | 56,700,000 | | | 56,700,000 | |
| | | | | | | |
| Total Repurchase Agreements, at Cost | | $ | 113,400,000 | |
| | | | | | | |
Total Investments, at
Amortized Cost and Value | | | | | $ | 566,856,230 | |
| | | | | | | |
OTHER ASSETS, LESS
LIABILITIES – (0.4)% | | | | | | (2,472,486 | ) |
| | | | | | | |
| Net Assets – 100.0% | | | | | $ | 564,383,744 | |
| | | | | | | |
| (y) | The rate shown represents an annualized yield at time of purchase. |
See Notes to Financial Statements
5
FINANCIAL STATEMENTS | STATEMENT OF ASSETS AND LIABILITIES
This statement represents your fund’s balance sheet, which details the assets and liabilities comprising the total value of the fund.
| | | | | |
At 12/31/08 | | | | | |
Assets | | | | | |
Investments, at amortized cost and value | | $453,456,230 | | | |
Repurchase agreements, at value | | 113,400,000 | | | |
Total investments, at amortized cost and value | | | | | $566,856,230 |
Cash | | 163 | | | |
Receivable for fund shares sold | | 22,301 | | | |
Interest receivable | | 249,372 | | | |
Receivable from investment adviser | | 59,891 | | | |
| Other assets | | 106,569 | | | |
| Total assets | | | | | $567,294,526 |
Liabilities | | | | | |
Payable for fund shares reacquired | | $2,810,315 | | | |
Payable to affiliates | | | | | |
Management fee | | 9,999 | | | |
Administrative services fee | | 1,783 | | | |
Payable for trustees’ compensation | | 76 | | | |
Accrued expenses and other liabilities | | 88,609 | | | |
Total liabilities | | | | | $2,910,782 |
Net assets | | | | | $564,383,744 |
Net assets consist of | | | | | |
Paid-in capital | | $564,607,478 | | | |
Accumulated net realized gain (loss) on investments | | (224,972 | ) | | |
Undistributed net investment income | | 1,238 | | | |
Net assets | | | | | $564,383,744 |
Shares of beneficial interest outstanding | | | | | 564,608,144 |
Initial Class shares | | | | | |
Net assets | | $322,979,844 | | | |
Shares outstanding | | 323,105,104 | | | |
Net asset value per share | | | | | $1.00 |
Service Class shares | | | | | |
Net assets | | $241,403,900 | | | |
Shares outstanding | | 241,503,040 | | | |
Net asset value per share | | | | | $1.00 |
See Notes to Financial Statements
6
FINANCIAL STATEMENTS | STATEMENT OF OPERATIONS
This statement describes how much your fund earned in investment income and accrued in expenses. It also describes any gains and/or losses generated by fund operations.
| | | | | | |
Year ended 12/31/08 | | | | | | |
Net investment income | | | | | | |
Interest income | | | | | $15,046,149 | |
Expenses | | | | | | |
Management fee | | $2,922,210 | | | | |
Distribution fees | | 651,502 | | | | |
Administrative services fee | | 193,688 | | | | |
Trustees’ compensation | | 60,239 | | | | |
Custodian fee | | 66,472 | | | | |
Shareholder communications | | 95,627 | | | | |
Auditing fees | | 27,243 | | | | |
Legal fees | | 7,127 | | | | |
Miscellaneous | | 99,540 | | | | |
Total expenses | | | | | $4,123,648 | |
Fees paid indirectly | | (206 | ) | | | |
Reduction of expenses by investment adviser and distributor | | (199,462 | ) | | | |
Net expenses | | | | | $3,923,980 | |
Net investment income | | | | | $11,122,169 | |
Net realized gain (loss) on investments | | | | | $(192,925 | ) |
Change in net assets from operations | | | | | $10,929,244 | |
See Notes to Financial Statements
7
FINANCIAL STATEMENTS | STATEMENTS OF CHANGES IN NET ASSETS
These statements describe the increases and/or decreases in net assets resulting from operations, any distributions, and any shareholder transactions.
| | | | | | |
| For years ended 12/31 | | 2008 | | | 2007 | |
Change in net assets | | | | | | |
From operations | | | | | | |
Net investment income | | $11,122,169 | | | $23,102,712 | |
Net realized gain (loss) on investments | | (192,925 | ) | | (31,281 | ) |
Change in net assets from operations | | $10,929,244 | | | $23,071,431 | |
Distributions declared to shareholders | | | | | | |
From net investment income | | | | | | |
Initial Class | | $(6,531,076 | ) | | $(14,441,278 | ) |
Service Class | | (4,591,093 | ) | | (8,661,434 | ) |
Total distributions declared to shareholders | | $(11,122,169 | ) | | $(23,102,712 | ) |
Change in net assets from fund share transactions | | $10,247,156 | | | $107,790,837 | |
Total change in net assets | | $10,054,231 | | | $107,759,556 | |
Net assets | | | | | | |
At beginning of period | | 554,329,513 | | | 446,569,957 | |
At end of period (including undistributed net investment income of $1,238 and
$1,238, respectively) | | $564,383,744 | | | $554,329,513 | |
See Notes to Financial Statements
8
FINANCIAL STATEMENTS | FINANCIAL HIGHLIGHTS
The financial highlights table is intended to help you understand the fund’s financial performance for the past 5 years. Certain information reflects financial results for a single fund share. The total returns in the table represent the rate by which an investor would have earned (or lost) on an investment in the fund share class (assuming reinvestment of all distributions) held for the entire period.
| | | | | | | | | | | | | | | |
| Initial Class | | Years ended 12/31 | |
| | | 2008 | | | 2007 | | | 2006 | | | 2005 | | | 2004 | |
Net asset value, beginning of period | | $1.00 | | | $1.00 | | | $1.00 | | | $1.00 | | | $1.00 | |
| Income (loss) from investment operations | | | | | | | | | | | | | | | |
Net investment income (d) | | $0.02 | | | $0.05 | | | $0.04 | | | $0.03 | | | $0.01 | |
Net realized and unrealized gain (loss) on investments | | (0.00 | )(w) | | (0.00 | )(w) | | (0.00 | )(w) | | (0.00 | )(w) | | — | |
Total from investment operations | | $0.02 | | | $0.05 | | | $0.04 | | | $0.03 | | | $0.01 | |
| Less distributions declared to shareholders | | | | | | | | | | | | | | | |
From net investment income | | $(0.02 | ) | | $(0.05 | ) | | $(0.04 | ) | | $(0.03 | ) | | $(0.01 | ) |
Net asset value, end of period | | $1.00 | | | $1.00 | | | $1.00 | | | $1.00 | | | $1.00 | |
Total return (%) (k)(r)(s) | | 2.03 | | | 4.84 | | | 4.59 | | | 2.72 | | | 0.83 | |
Ratios (%) (to average net assets)
and Supplemental data: | | | | | | | | | | | | | | | |
Expenses before expense reductions (f) | | 0.59 | | | 0.55 | | | 0.59 | | | 0.60 | | | 0.58 | |
Expenses after expense reductions (f) | | 0.57 | | | N/A | | | N/A | | | 0.60 | | | N/A | |
Net investment income | | 2.02 | | | 4.73 | | | 4.52 | | | 2.65 | | | 0.79 | |
Net assets at end of period (000 Omitted) | | $322,980 | | | $320,807 | | | $283,055 | | | $241,684 | | | $282,595 | |
| |
| Service Class | | Years ended 12/31 | |
| | | 2008 | | | 2007 | | | 2006 | | | 2005 | | | 2004 | |
Net asset value, beginning of period | | $1.00 | | | $1.00 | | | $1.00 | | | $1.00 | | | $1.00 | |
| Income (loss) from investment operations | | | | | | | | | | | | | | | |
Net investment income (d) | | $0.02 | | | $0.04 | | | $0.04 | | | $0.02 | | | $0.01 | |
Net realized and unrealized gain (loss) on investments | | (0.00 | )(w) | | (0.00 | )(w) | | (0.00 | )(w) | | (0.00 | )(w) | | — | |
Total from investment operations | | $0.02 | | | $0.04 | | | $0.04 | | | $0.02 | | | $0.01 | |
| Less distributions declared to shareholders | | | | | | | | | | | | | | | |
From net investment income | | $(0.02 | ) | | $(0.04 | ) | | $(0.04 | ) | | $(0.02 | ) | | $(0.01 | ) |
Net asset value, end of period | | $1.00 | | | $1.00 | | | $1.00 | | | $1.00 | | | $1.00 | |
Total return (%)(k)(r)(s) | | 1.80 | | | 4.58 | | | 4.33 | | | 2.46 | | | 0.57 | |
Ratios (%) (to average net assets)
and Supplemental data: | | | | | | | | | | | | | | | |
Expenses before expense reductions (f) | | 0.84 | | | 0.80 | | | 0.84 | | | 0.85 | | | 0.82 | |
Expenses after expense reductions (f) | | 0.80 | | | N/A | | | N/A | | | 0.85 | | | N/A | |
Net investment income | | 1.76 | | | 4.48 | | | 4.28 | | | 2.49 | | | 0.63 | |
Net assets at end of period (000 Omitted) | | $241,404 | | | $233,523 | | | $163,515 | | | $123,232 | | | $87,785 | |
| (d) | Per share data is based on average shares outstanding. |
| (f) | Ratios do not reflect reductions from fees paid indirectly, if applicable. |
| (k) | The total return does not reflect expenses that apply to separate accounts. Inclusion of these charges would reduce the total return figures for all periods shown. |
| (r) | Certain expenses have been reduced without which performance would have been lower. |
| (s) | From time to time the fund may receive proceeds from litigation settlements, without which performance would be lower. |
| (w) | Per share amount was less than $0.01. |
See Notes to Financial Statements
9
NOTES TO FINANCIAL STATEMENTS
| (1) | | Business and Organization |
MFS Money Market Portfolio (the fund) is a series of MFS Variable Insurance Trust II (the trust). The trust is organized as a Massachusetts business trust and is registered under the Investment Company Act of 1940, as amended, as an open-end management investment company. The shares of the fund are sold to variable accounts established by insurance companies to fund benefits under variable contracts issued by such companies, and qualified retirement and pension plans.
| (2) | | Significant Accounting Policies |
General – The preparation of financial statements in conformity with U.S. generally accepted accounting principles requires management to make estimates and assumptions that affect the reported amounts of assets and liabilities, and disclosure of contingent assets and liabilities at the date of the financial statements and the reported amounts of revenues and expenses during the reporting period. Actual results could differ from those estimates.
Investment Valuations – Money market instruments are valued at amortized cost, which approximates market value. Amortized cost involves valuing an instrument at its cost as adjusted for amortization of premium or accretion of discount rather than its current market value. Each money market fund’s use of amortized cost is subject to the fund’s compliance with Rule 2a-7 under the Investment Company Act of 1940. The amortized cost value of an instrument can be different from the market value of an instrument.
The fund adopted FASB Statement No. 157, Fair Value Measurements (the “Statement”). This Statement provides a single definition of fair value, a hierarchy for measuring fair value and expanded disclosures about fair value measurements.
Various inputs are used in determining the value of the fund’s assets or liabilities carried at market value. These inputs are categorized into three broad levels. Level 1 includes quoted prices in active markets for identical assets or liabilities. Level 2 includes other significant observable market-based inputs (including quoted prices for similar securities, interest rates, prepayment speed, and credit risk). Level 3 includes unobservable inputs, which may include the adviser’s own assumptions in determining the fair value of investments. Other financial instruments are derivative instruments not reflected in total investments, such as futures, forwards, swap contracts and written options. The following is a summary of the levels used as of December 31, 2008 in valuing the fund’s assets or liabilities carried at market value:
| | | | | | | | |
| | | Level 1 | | Level 2 | | Level 3 | | Total |
| Investments in Securities | | $— | | $566,856,230 | | $— | | $566,856,230 |
| Other Financial Instruments | | $— | | $— | | $— | | $— |
Repurchase Agreements – The fund may enter into repurchase agreements with approved counterparties. Each repurchase agreement is recorded at cost. The fund requires that the securities collateral in a repurchase transaction be transferred to a custodian. The fund monitors, on a daily basis, the value of the collateral to ensure that its value, including accrued interest, is greater than amounts owed to the fund under each such repurchase agreement. The fund and other funds managed by Massachusetts Financial Services Company (MFS), may utilize a joint trading account for the purpose of entering into one or more repurchase agreements.
Indemnifications – Under the fund’s organizational documents, its officers and trustees may be indemnified against certain liabilities and expenses arising out of the performance of their duties to the fund. Additionally, in the normal course of business, the fund enters into agreements with service providers that may contain indemnification clauses. The fund’s maximum exposure under these agreements is unknown as this would involve future claims that may be made against the fund that have not yet occurred.
Investment Transactions and Income – Investment transactions are recorded on the trade date. Interest income is recorded on the accrual basis. All premium and discount is amortized or accreted for financial statement purposes in accordance with U.S. generally accepted accounting principles.
The fund may receive proceeds from litigation settlements. Any proceeds received from litigation involving portfolio holdings are reflected in the Statement of Operations in realized gain/loss if the security has been disposed of by the fund or in unrealized gain/loss if the security is still held by the fund. Any other proceeds from litigation not related to portfolio holdings are reflected as other income in the Statement of Operations.
Fees Paid Indirectly – The fund’s custody fee may be reduced according to an arrangement that measures the value of cash deposited with the custodian by the fund. This amount, for the year ended December 31, 2008, is shown as a reduction of total expenses on the Statement of Operations.
Treasury Temporary Guarantee Program – On October 1, 2008, the Trustees of the fund approved the fund’s participation in the initial term of the United States Department of Treasury’s Temporary Guarantee Program (the Program) through December 18, 2008. On December 3, 2008, the Trustees approved the fund’s participation in the Program’s extension through
10
Notes to Financial Statements – continued
April 30, 2009. The Program provides coverage to shareholders for amounts held in participating funds as of the close of business September 19, 2008, subject to certain conditions and limitations (but does not guarantee a $1.00 net asset value upon redemption or liquidation of shares). Under the Program, if the fund’s market value per share falls below $0.995, shareholders of record on that date may be eligible to receive payment (applicable only up to their share balances as of September 19, 2008) from the Treasury in the event of the fund’s liquidation. The costs of the Program, which are borne by the fund, are 0.01% of the fund’s net assets as of September 19, 2008 for the initial term of the Program (September 19, 2008 through December 18, 2008), and 0.015% of the fund’s net assets as of September 19, 2008 for the Program’s extension period (December 19, 2008 through April 30, 2009). This fee is recognized ratably over the period of participation in the Program and is included in miscellaneous expense on the fund’s Statement of Operations. This fee, incurred for the year ended December 31, 2008, was equivalent to an annual effective rate of 0.0113% of the fund’s average daily net assets. The Treasury may elect to extend the program beyond April 30, 2009, but to no later than September 18, 2009, at which time the fund will determine whether to continue to participate in the Program.
Tax Matters and Distributions – The fund intends to qualify as a regulated investment company, as defined under Subchapter M of the Internal Revenue Code, and to distribute all of its taxable income, including realized capital gains. As a result, no provision for federal income tax is required. Each of the fund’s federal tax returns for the prior three fiscal years remains subject to examination by the Internal Revenue Service. Foreign taxes, if any, have been accrued by the fund in the accompanying financial statements.
Distributions to shareholders are recorded on the ex-dividend date. Income and capital gain distributions are determined in accordance with income tax regulations, which may differ from U.S. generally accepted accounting principles. Certain capital accounts in the financial statements are periodically adjusted for permanent differences in order to reflect their tax character. These adjustments have no impact on net assets or net asset value per share. Temporary differences which arise from recognizing certain items of income, expense, gain or loss in different periods for financial statement and tax purposes will reverse at some time in the future. Distributions in excess of net investment income or net realized gains are temporary overdistributions for financial statement purposes resulting from differences in the recognition or classification of income or distributions for financial statement and tax purposes.
During the year ended December 31, 2008, there were no significant adjustments due to differences between book and tax accounting.
The tax character of distributions declared to shareholders for the last two fiscal years is as follows:
| | | | |
| | | 12/31/08 | | 12/31/07 |
| Ordinary income (including any short-term capital gains) | | $11,122,169 | | $23,102,712 |
The federal tax cost and the tax basis components of distributable earnings were as follows:
| | | |
| As of 12/31/08 | | | |
| Cost of investments | | $566,856,230 | |
| Undistributed ordinary income | | 1,238 | |
| Capital loss carryforwards | | (224,972 | ) |
As of December 31, 2008 the fund had capital loss carryforwards available to offset future realized gains. Such losses expire as follows:
| | | |
| 12/31/09 | | $(429 | ) |
| 12/31/11 | | (271 | ) |
| 12/31/12 | | (66 | ) |
| 12/31/15 | | (31,281 | ) |
| 12/31/16 | | (192,925 | ) |
| | $(224,972 | ) |
Multiple Classes of Shares of Beneficial Interest – The fund offers multiple classes of shares, which differ in their respective distribution fees. The fund’s income and common expenses are allocated to shareholders based on the value of settled shares outstanding of each class. The fund’s realized and unrealized gain (loss) are allocated to shareholders based on the daily net assets of each class. Dividends are declared separately for each class. Differences in per share dividend rates are generally due to differences in separate class expenses.
| (3) | | Transactions with Affiliates |
Investment Adviser – The fund has an investment advisory agreement with MFS to provide overall investment management and related administrative services and facilities to the fund. The management fee is computed daily and paid monthly at an annual rate of 0.50% of the fund’s average daily net assets. The investment adviser has agreed in writing to reduce its management fee to 0.45% of average daily net assets in excess of $500 million. This written agreement will continue until modified by the fund’s Board of Trustees. This management fee reduction amounted to $42,185, which is shown as a reduction
11
Notes to Financial Statements – continued
of total expenses in the Statement of Operations. During the year ended December 31, 2008, MFS voluntarily waived receipt of $17,670 of the fund’s management fee in order to avoid a negative yield. For the year ended December 31, 2008, this voluntary waiver had the effect of reducing the management fee by 0.003% of average daily net assets on an annualized basis. The management fee incurred for the year ended December 31, 2008 was equivalent to an annual effective rate of 0.49% of the fund’s average daily net assets.
The investment adviser has agreed in writing to pay a portion of the fund’s total annual operating expenses, exclusive of interest, taxes, extraordinary expenses, and brokerage commissions, such that total annual fund operating expenses do not exceed 1.25% of the fund’s average daily net assets. MFS’ agreement to limit the fund’s total annual operating expenses is contained in the investment advisory agreement between MFS and the fund and may not be rescinded without shareholder approval.
The investment adviser has agreed in writing to pay a portion of the fund’s total annual operating expenses, exclusive of interest, taxes, extraordinary expenses, brokerage and transaction costs, and investment-related expenses, such that total annual operating expenses do not exceed 0.57% annually of average daily net assets for the Initial Class shares and 0.82% annually of average daily net assets for the Service Class shares. This written agreement will continue until April 30, 2010. For the year ended December 31, 2008, this reduction amounted to $95,104 and is reflected as a reduction of total expenses in the Statement of Operations.
Distributor – MFS Fund Distributors, Inc. (MFD), a wholly-owned subsidiary of MFS, is the distributor of shares of the fund. The Trustees have adopted a distribution plan for the Service Class shares pursuant to Rule 12b-1 under the Investment Company Act of 1940.
The fund’s distribution plan provides that the fund will pay MFD distribution fees equal to 0.25% per annum of its average daily net assets attributable to Service Class shares as partial consideration for services performed and expenses incurred by MFD and financial intermediaries in connection with the sale and distribution of the fund’s Service Class shares and the sale and distribution of the variable annuity or variable life insurance contracts investing indirectly in Service Class shares. MFD may subsequently pay all, or a portion, of the distribution fees to financial intermediaries. During the year ended December 31, 2008, MFD voluntarily waived receipt of $44,503 of the fund’s distribution fee in order to avoid a negative yield. For the year ended December 31, 2008, this voluntary waiver had the effect of reducing the distribution fee by 0.0171% of average daily net assets attributable to Service Class shares on an annualized basis. The distribution fee incurred for the year ended December 31, 2008 was equivalent to an annual effective rate of 0.23% of the average daily net assets attributable to Service Class shares.
Shareholder Servicing Agent – MFS Service Center, Inc. (MFSC), a wholly-owned subsidiary of MFS, has contracted to provide transfer agent and recordkeeping functions in connection with the issuance, transfer, and redemption of each class of shares of the fund under a Shareholder Servicing Agent Agreement. During the year ended December 31, 2008, the fund did not pay MFSC a fee for this service.
Administrator – MFS provides certain financial, legal, shareholder communications, compliance, and other administrative services to the fund. Under an administrative services agreement, the fund partially reimburses MFS the costs incurred to provide these services. The fund is charged an annual fixed amount of $10,000 plus a fee based on average daily net assets.
The administrative services fee incurred for the year ended December 31, 2008 was equivalent to an annual effective rate of 0.0331% of the fund’s average daily net assets.
Trustees’ and Officers’ Compensation – The fund pays compensation to trustees in the form of a retainer, attendance fees, and additional compensation to the Board chairperson. The fund does not pay compensation directly to officers of the fund who are also officers of the investment adviser, all of whom receive remuneration for their services to the fund from MFS. Certain officers of the fund are officers or directors of MFS, MFD, and MFSC.
Other – This fund and certain other MFS funds (the funds) have entered into services agreements (the Agreements) which provide for payment of fees by the funds to Tarantino LLC and Griffin Compliance LLC in return for the provision of services of an Independent Chief Compliance Officer (ICCO) and Assistant ICCO, respectively, for the funds. The ICCO and Assistant ICCO are officers of the funds and the sole members of Tarantino LLC and Griffin Compliance LLC, respectively. The funds can terminate the Agreements with Tarantino LLC and Griffin Compliance LLC at any time under the terms of the Agreements. MFS has agreed to bear all expenses associated with office space, other administrative support, and supplies provided to the ICCO and Assistant ICCO. For the year ended December 31, 2008, the aggregate fees paid by the fund to Tarantino LLC and Griffin Compliance LLC were $6,044 and are included in miscellaneous expense on the Statement of Operations.
Purchases and sales of money market securities, exclusive of securities subject to repurchase agreements, aggregated $13,398,097,250 and $13,383,745,325, respectively.
12
Notes to Financial Statements – continued
| (5) | | Shares of Beneficial Interest |
The fund’s Declaration of Trust permits the Trustees to issue an unlimited number of full and fractional shares of beneficial interest. Transactions in fund shares were as follows:
| | | | | | | | | | | | |
| | | Year ended 12/31/08 | | | Year ended 12/31/07 | |
| | | Shares | | | Amount | | | Shares | | | Amount | |
| Shares sold | | | | | | | | | | | | |
Initial Class | | 99,394,222 | | | $99,394,326 | | | 126,931,988 | | | $126,932,032 | |
Service Class | | 122,510,431 | | | 122,510,435 | | | 119,485,604 | | | 119,485,687 | |
| | 221,904,653 | | | $221,904,761 | | | 246,417,592 | | | $246,417,719 | |
| Shares issued to shareholders in reinvestment of distributions | | | | | | | | | | | | |
Initial Class | | 6,531,184 | | | $6,531,076 | | | 14,441,321 | | | $14,441,278 | |
Service Class | | 4,591,094 | | | 4,591,093 | | | 8,661,517 | | | 8,661,434 | |
| | 11,122,278 | | | $11,122,169 | | | 23,102,838 | | | $23,102,712 | |
| Shares reacquired | | | | | | | | | | | | |
Initial Class | | (103,646,568 | ) | | $(103,646,568 | ) | | (103,602,263 | ) | | $(103,602,263 | ) |
Service Class | | (119,133,206 | ) | | (119,133,206 | ) | | (58,127,331 | ) | | (58,127,331 | ) |
| | (222,779,774 | ) | | $(222,779,774 | ) | | (161,729,594 | ) | | $(161,729,594 | ) |
| Net change | | | | | | | | | | | | |
Initial Class | | 2,278,838 | | | $2,278,834 | | | 37,771,046 | | | $37,771,047 | |
Service Class | | 7,968,319 | | | 7,968,322 | | | 70,019,790 | | | 70,019,790 | |
| | 10,247,157 | | | $10,247,156 | | | 107,790,836 | | | $107,790,837 | |
The fund and other funds managed by MFS participate in a $1 billion unsecured committed line of credit provided by a syndication of banks under a credit agreement. In addition, the fund and other funds managed by MFS have established uncommitted borrowing arrangements with certain banks. Borrowings may be made for temporary financing needs. Interest is charged to each fund, based on its borrowings, generally at a rate equal to the Federal Reserve funds rate plus 0.30%. In addition, a commitment fee, based on the average daily, unused portion of the committed line of credit, is allocated among the participating funds at the end of each calendar quarter. For the year ended December 31, 2008, the fund’s commitment fee and interest expense were $3,293 and $0, respectively, and are included in miscellaneous expense on the Statement of Operations.
13
REPORT OF INDEPENDENT REGISTERED PUBLIC ACCOUNTING FIRM
To the Board of Trustees of MFS Variable Insurance Trust II and the Shareholders of
MFS Money Market Portfolio:
We have audited the accompanying statement of assets and liabilities, including the portfolio of investments, of MFS Money Market Portfolio (the “Fund”) (one of the portfolios comprising MFS Variable Insurance Trust II) as of December 31, 2008, and the related statement of operations for the year then ended, the statements of changes in net assets for each of the two years in the period then ended, and the financial highlights for each of the five years in the period then ended. These financial statements and financial highlights are the responsibility of the Fund’s management. Our responsibility is to express an opinion on these financial statements and financial highlights based on our audits.
We conducted our audits in accordance with the standards of the Public Company Accounting Oversight Board (United States). Those standards require that we plan and perform the audit to obtain reasonable assurance about whether the financial statements and financial highlights are free of material misstatement. The Fund is not required to have, nor were we engaged to perform, an audit of its internal control over financial reporting. Our audits included consideration of internal control over financial reporting as a basis for designing audit procedures that are appropriate in the circumstances, but not for the purpose of expressing an opinion on the effectiveness of the Fund’s internal control over financial reporting. Accordingly, we express no such opinion. An audit also includes examining, on a test basis, evidence supporting the amounts and disclosures in the financial statements, assessing the accounting principles used and significant estimates made by management, as well as evaluating the overall financial statement presentation. Our procedures included confirmation of securities owned as of December 31, 2008, by correspondence with the custodian and brokers. We believe that our audits provide a reasonable basis for our opinion.
In our opinion, the financial statements and financial highlights referred to above present fairly, in all material respects, the financial position of MFS Money Market Portfolio as of December 31, 2008, the results of its operations for the year then ended, the changes in its net assets for each of the two years in the period then ended, and the financial highlights for each of the five years in the period then ended, in conformity with accounting principles generally accepted in the United States of America.
DELOITTE & TOUCHE LLP
Boston, Massachusetts
February 19, 2009
14
TRUSTEES AND OFFICERS – IDENTIFICATION AND BACKGROUND
The Trustees and officers of the Trust, as of February 1, 2009, are listed below, together with their principal occupations during the past five years. (Their titles may have varied during that period.) The address of each Trustee and officer is 500 Boylston Street, Boston, Massachusetts 02116.
| | | | | | |
Name, Date of Birth | | Position(s) Held
with Fund | | Trustee/Officer
Since (1) | | Principal Occupations During the Past Five Years and
Other Directorships (2) |
| INTERESTED TRUSTEE | | | | |
David D. Horn (3) (born 6/07/41) | | Trustee | | April 1986 | | Private investor; Sun Life Assurance Company of Canada, Senior Vice President and General Manager for the United States (until 1997); Director (until March 2004) |
| | |
| INDEPENDENT TRUSTEES | | | | |
J. Kermit Birchfield (born 1/08/40) | | Chairman | | May 1997 | | Consultant; Century Partners, Inc. (investments), Director; Displaytech, Inc. (technology), Director; Dessin Fournir LLC (furniture manufacturer), Director (2005 to present); Intermountain Gas Company, Inc. & Intermountain Industries, Inc. (oil & gas exploration and production), Director; Site Watch LLC (software to monitor oil tanks), Managing Director (2006 to present); Juridica Investments (fund investing in judicial matters), Director (2007 to present); HPSC, Inc. (medical financing), Director (until January 2004) |
| | | |
Robert C. Bishop (born 1/13/43) | | Trustee | | May 2001 | | AutoImmune, Inc. (pharmaceutical product development), Chairman, President and Chief Executive Officer; Caliper Life Sciences Corp. (laboratory analytical instruments), Director; Millipore Corporation (purification/filtration products), Director; Waterstreet Capital (leverage buyouts), Advisory Board (August 2006 to present); Optobionics Corporation (ophthalmic devices), Director (2002 to 2007) |
| | | |
Frederick H. Dulles (born 3/12/42) | | Trustee | | May 2001 | | Ten State International Law PLLC (law firm), Of Counsel (since 2006); Prudential Carolina Real Estate, (real estate), Broker (since 2006); Free Enterprise Foundation, Inc. (research institute), Director & Secretary (until 2008); Disher, Hamrick & Myers Residential, Inc. (real estate) Broker (2005 until 2006); Frederick H. Dulles law practice (until 2006); Ten State Street LLP (law firm), Member (until 2005) |
| | | |
Marcia A. Kean (born 6/30/48) | | Trustee | | April 2005 | | Feinstein Kean Healthcare (consulting), Chief Executive Officer |
| | | |
Ronald G. Steinhart (born 6/15/40) | | Trustee | | May 2001 | | Private investor; Penske Automotive Group (automotive retailer), Director; Animal Health International, Inc. (animal health products), Director (since 2007); Texas Industries (concrete/aggregates/cement), Director (since 2007); Penson Worldwide, Inc. (securities clearance), Director (since 2006); Carreker Corporation (technology consulting) Director (until 2005); Prentiss Properties Trust (real estate investment trust), Director (until 2006) |
| | | |
Haviland Wright (born 7/21/48) | | Trustee | | May 2001 | | Profitability of Hawaii (software), Chief Development Officer (since December 2008); Elixir Technologies Corporation (software) Director (since 2005); Nano Loa Inc. (liquid crystal displays), Director |
| | |
| TRUSTEE EMERITUS | | | | |
Samuel Adams (born 10/19/25) | | Trustee Emeritus | | | | Retired; K&L Gates LLP (law firm), Of Counsel |
| | |
| OFFICERS | | | | |
Maria F. Dwyer (4) (born 12/01/58) | | President | | November 2005 | | Massachusetts Financial Services Company, Executive Vice President and Chief Regulatory Officer (since March 2004) Chief Compliance Officer (since December 2006); Fidelity Management & Research Company, Vice President (prior to March 2004); Fidelity Group of Funds, President and Treasurer (until March 2004) |
| | | |
Christopher R. Bohane (4) (born 1/18/74) | | Assistant Secretary and Assistant Clerk | | July 2005 | | Massachusetts Financial Services Company, Vice President and Senior Counsel |
| | | |
John M. Corcoran (4) (born 4/13/65) | | Treasurer | | October 2008 | | Massachusetts Financial Services Company, Senior Vice President (since October 2008); State Street Bank and Trust (financial services provider), Senior Vice President, (until September 2008) |
| | | |
Ethan D. Corey (4) (born 11/21/63) | | Assistant Secretary and Assistant Clerk | | July 2005 | | Massachusetts Financial Services Company, Senior Vice President and Associate General Counsel (since 2004); Dechert LLP (law firm), Counsel (prior to December 2004) |
| | | |
David L. DiLorenzo (4) (born 8/10/68) | | Assistant Treasurer | | July 2005 | | Massachusetts Financial Services Company, Vice President (since June 2005); JP Morgan Investor Services, Vice President (until June 2005) |
| | | |
Timothy M. Fagan (4) (born 7/10/68) | | Assistant Secretary and Assistant Clerk | | September 2005 | | Massachusetts Financial Services Company, Vice President and Senior Counsel (since September 2005); John Hancock Advisers, LLC, Vice President, Senior Attorney and Chief Compliance Officer (until August 2005) |
15
Trustees and Officers – continued
| | | | | | |
Name, Date of Birth | | Position(s) Held
with Fund | | Trustee/Officer
Since (1) | | Principal Occupations During the Past Five Years and
Other Directorships (2) |
Mark D. Fischer (4) (born 10/27/70) | | Assistant Treasurer | | July 2005 | | Massachusetts Financial Services Company, Vice President (since May 2005); JP Morgan Investment Management Company, Vice President (until May 2005) |
| | | |
Robyn L. Griffin (born 7/04/75) | | Assistant Independent Chief Compliance Officer | | August 2008 | | Griffin Compliance LLC (provider of compliance services), Principal (since August 2008); State Street Corporation (financial services provider), Mutual Fund Administration Assistant Vice President (October 2006 – July 2008); Liberty Mutual Group (insurance), Personal Market Assistant Controller (April 2006 – October 2006); Deloitte & Touche LLP (professional services firm), Senior Manager (prior to April 2006) |
| | | |
Brian E. Langenfeld (4) (born 3/07/73) | | Assistant Secretary and Assistant Clerk | | May 2006 | | Massachusetts Financial Services Company, Vice President and Senior Counsel (since May 2006); John Hancock Advisers, LLC, Assistant Vice President and Counsel (until April 2006) |
| | | |
Ellen Moynihan (4) (born 11/13/57) | | Assistant Treasurer | | May 1997 | | Massachusetts Financial Services Company, Senior Vice President |
| | | |
Susan S. Newton (4) (born 3/07/50) | | Assistant Secretary and Assistant Clerk | | May 2005 | | Massachusetts Financial Services Company, Senior Vice President and Associate General Counsel (since April 2005); John Hancock Advisers, LLC, Senior Vice President, Secretary and Chief Legal Officer (until April 2005) |
| | | |
Susan A. Pereira (4) (born 11/05/70) | | Assistant Secretary and Assistant Clerk | | July 2005 | | Massachusetts Financial Services Company, Vice President and Senior Counsel (since June 2004); Bingham McCutchen LLP (law firm), Associate (until June 2004) |
| | | |
Mark N. Polebaum (4) (born 5/01/52) | | Secretary and Clerk | | February 2006 | | Massachusetts Financial Services Company, Executive Vice President, General Counsel and Secretary (since January 2006); Wilmer Cutler Pickering Hale and Dorr LLP (law firm), Partner (until January 2006) |
| | | |
Frank L. Tarantino (born 3/07/44) | | Independent Chief Compliance Officer | | September 2004 | | Tarantino LLC (provider of compliance services), Principal (since June 2004); CRA Business Strategies Group (consulting services), Executive Vice President (until June 2004) |
| | | |
Richard S. Weitzel (4) (born 7/16/70) | | Assistant Secretary and Assistant Clerk | | October 2007 | | Massachusetts Financial Services Company, Vice President and Assistant General Counsel (since 2004); Massachusetts Department of Business and Technology, General Counsel (until April 2004) |
| | | |
James O. Yost (4) (born 6/12/60) | | Assistant Treasurer | | April 1992 | | Massachusetts Financial Services Company, Senior Vice President |
| (1) | Date first appointed to serve as Trustee/Officer of an MFS fund or a Compass variable account. Each Trustee has served continuously since appointment. |
| (2) | Directorships or trusteeships of companies required to report to the Securities and Exchange Commission (i.e., “public companies”). |
| (3) | “Interested person” of the Trust, within the meaning of the Investment Company Act of 1940 (referred to as the 1940 Act), which is the principal federal law governing investment companies like the Trust, as a result of position with Sun Life of Canada (U.S.). The address of Sun Life of Canada (U.S.) is One Sun Life Executive Park, Wellesley Hills, Massachusetts 02481. |
| (4) | “Interested person” of MFS within the meaning of the 1940 Act. The address of MFS is 500 Boylston Street, Boston, Massachusetts 02116. |
The Trust does not hold annual meetings for the purpose of electing Trustees, and Trustees are not elected for fixed terms. Each Trustee and officer holds office until his or her successor is chosen and qualified, or until his or her earlier death, resignation, retirement or removal.
All Trustees currently serve as Trustees of the Trust and have served in that capacity since originally elected or appointed. All of the Trustees are also Managers of the Compass Variable Accounts. The executive officers of the Trust hold similar offices for the Compass Variable Accounts and other funds in the MFS fund complex. As of January 1, 2009, each Trustee serves as a Trustee or Manager of 35 Accounts/Funds.
The Statement of Additional Information contains further information about the Trustees and is available without charge upon request by calling 1-800-752-7215.
| | |
Investment Adviser
Massachusetts Financial Services Company 500 Boylston Street, Boston, MA 02116-3741 | | Custodian State Street Bank and Trust 1 Lincoln Street, Boston, MA 02111-2900 |
Distributor
MFS Fund Distributors, Inc. 500 Boylston Street, Boston, MA 02116-3741 | | Independent Registered Public Accounting Firm Deloitte & Touche LLP 200 Berkeley Street, Boston, MA 02116 |
Portfolio Manager Edward O’Dette | | |
16
BOARD REVIEW OF INVESTMENT ADVISORY AGREEMENT
The Investment Company Act of 1940 requires that both the full Board of Trustees and a majority of the non-interested (“independent”) Trustees, voting separately, annually approve the continuation of the investment advisory agreement between MFS Variable Insurance Trust II (the “Trust”) and Massachusetts Financial Services Company (“MFS”) on behalf of the Fund. The Trustees consider matters bearing on the Fund and the advisory arrangements at their meetings throughout the year, including a review of performance data at each regular meeting. In addition, the independent Trustees met in May and again in July 2008 (“contract review meetings”) for the specific purpose of considering whether to approve the continuation of the investment advisory agreement for the Fund. The independent Trustees were assisted in their evaluation of the investment advisory agreement by independent legal counsel, from whom they received separate legal advice and with whom they met separately from MFS management during various contract review meetings. The independent Trustees were also assisted in this process by the Fund’s Independent Chief Compliance Officer, a full-time senior officer appointed by and reporting to the independent Trustees.
In connection with their deliberations, the Trustees, including the independent Trustees, considered such information and factors as they believed, in light of the legal advice furnished to them and their own business judgment, to be relevant. The investment advisory agreement was considered separately for the Fund, although the Trustees also took into account the common interests of all Funds in the Trust in their review. As described below, the Trustees considered the nature, quality, and extent of the various investment advisory, administrative, and shareholder services performed by MFS under the existing investment advisory agreement and other arrangements with the Trust.
In connection with their contract review meetings, the Trustees received and relied upon materials which included, among other items: (i) information provided by Lipper Inc. on the investment performance of the Fund for various time periods ended December 31, 2007, compared to the investment performance of a group of funds with substantially similar investment classifications/objectives (the “Lipper performance universe”), (ii) information provided by Lipper Inc. on the Fund’s advisory fees and other expenses compared to the advisory fees and other expenses of comparable funds identified by Lipper (the “Lipper expense group”), (iii) information provided by MFS on the advisory fees of comparable portfolios of its other clients, including institutional separate account and other clients, (iv) information as to whether expense waivers, reimbursements or fee “breakpoints” are observed for the Fund, (v) information regarding MFS’ financial results and financial condition, including MFS’ and certain of its affiliates’ estimated profitability from services performed for the Fund, (vi) MFS’ views regarding the outlook for the mutual fund industry and its strategic business plans, (vii) descriptions of various functions performed by MFS for the Trust, such as compliance monitoring and portfolio trading practices, and (viii) information regarding the overall organization of MFS, including information about MFS’ senior management and other personnel providing investment advisory, administrative and other services to the Fund. The comparative performance, fee and expense information prepared and provided by Lipper Inc. was not independently verified, and the independent Trustees did not independently verify any information provided to them by MFS.
The Trustees’ conclusion as to the continuation of the investment advisory agreement was based on comprehensive consideration of all information provided to the Trustees and not the result of any single factor. Some of the factors that figured particularly in the Trustees’ deliberations are described below for the Fund, while individual Trustees may have given different weight to various factors and evaluated the information presented as a whole differently than another Trustee. The Trustees recognized that the fee arrangements for the Fund reflect years of review and discussion between the independent Trustees and MFS, that certain aspects of such arrangements may receive greater scrutiny in some years than others, and that the Trustees’ conclusions may be based, in part, on their consideration of these same arrangements during the course of the year and in prior years.
Based on information provided by Lipper Inc., the Trustees compared the Fund’s total return investment performance to the performance of a peer group of funds over various time periods. The Trustees placed particular emphasis on the total return performance of the Fund’s Initial Class shares in comparison to the performance of funds in its Lipper performance universe over the one-, three- and five-year periods. The Trustees did not rely on performance results for more recent periods, including those shown elsewhere in this report.
The Trustees noted the performance of the Fund’s Initial Class shares was in the 3rd quintile relative to the other funds in the Lipper Classification Index for the one-year period (the 1st quintile being the best performers and the 5th quintile being the worst performers). The total return performance of the Fund was also in the 3rd quintile for the three-year period and the five-year period ended December 31, 2007, relative to the Lipper performance universe. Based on the nature and quality of services provided by MFS, the Board of Trustees concluded that the Fund’s performance was satisfactory.
In the course of their deliberations, the Trustees took into account information provided by MFS during contract review meetings, as well as during investment review meetings conducted with portfolio management personnel during the course of the year.
17
Board Review of Investment Advisory Agreement – continued
In assessing the reasonableness of the Fund’s advisory fee, the Trustees considered, among other information, the Fund’s advisory fee and the total expense ratio of the Fund’s Initial Class shares as a percentage of average daily net assets, compared to the advisory fee and total expense ratios of its peer group of funds based on information provided by Lipper Inc. The Trustees also considered the advisory fees charged by MFS to institutional accounts. In comparing these fees, the Trustees considered the generally broader scope of services provided by MFS to the Trust than those provided to institutional accounts. The Trustees also considered the higher demands placed on MFS’ investment personnel and trading infrastructure as a result of the daily cash in-flows and out-flows of the Fund, and the impact on MFS and related expenses due to the more extensive regulatory regime to which the Fund is subject, compared to institutional accounts.
In considering the fees, the Trustees noted from the Lipper data that the Fund’s effective advisory fee rate and total expense ratio were each above the median of such fees and expenses of funds in the Lipper expense group. The Trustees further noted that MFS agreed to continue to reduce its advisory fee on average daily net assets over $500 million, and they accepted MFS’ offer to continue the total expense limitation for the next year. The Trustees further concluded that the existing breakpoint was sufficient to allow the Fund to benefit from economies of scale as its assets grow. The Trustees concluded that the fees were reasonable in light of the nature and quality of services provided.
The Trustees also considered information prepared by MFS relating to its costs and profits with respect to the Fund and other investment companies and accounts advised by MFS, as well as MFS’ methodologies used to determine and allocate its costs to the Fund and other accounts and products for purposes of estimating profitability.
After reviewing these and other factors described below, the Trustees concluded that the advisory fees charged to the Fund represent reasonable compensation in light of the nature and quality of the services being provided by MFS.
In addition, the Trustees considered MFS’ resources and related efforts to continue to retain, attract and motivate capable personnel to serve the Fund. The Trustees also considered the financial resources of MFS and its parent, Sun Life Financial Inc. The Trustees further considered any advantages and possible disadvantages of having an adviser which also serves other investment companies as well as institutional accounts.
The Trustees also considered the nature, quality, cost, and extent of administrative, transfer agency, and distribution services provided to the Fund by MFS and its affiliates under agreements and plans other than the investment advisory agreement, including the 12b-1 fees the Fund pays to MFS Fund Distributors, Inc., an affiliate of MFS. The Trustees also considered the nature, extent and quality of certain other services MFS performs or arranges on the Fund’s behalf, which may include securities lending programs, directed expense payment programs, class action recovery programs, and MFS’ interaction with third-party service providers, principally custodians and sub-custodians. The Trustees concluded that the various non-advisory services provided by MFS and its affiliates on behalf of the Fund were satisfactory. The Trustees also considered the benefits to MFS from the use of the Fund’s portfolio brokerage commissions to pay for research and other similar services and various other factors. Additionally, the Trustees considered so-called “fall-out benefits” to MFS such as reputational value derived from serving as investment manager to the Trust, and determined that any such benefits derived by MFS were reasonable and fair.
Based on their evaluation of factors that they deemed to be material, including those factors described above, the Board of Trustees, including a majority of the independent Trustees, concluded that the investment advisory agreement should be continued for an additional one-year period, commencing September 1, 2008.
A discussion regarding the Board’s most recent review and renewal of the fund’s Investment Advisory Agreement with MFS is available by clicking on the fund’s name under “Variable Insurance Portfolios-VIT II” in the “Products & Performance” section on the MFS Web site (mfs.com).
18
PROXY VOTING POLICIES AND INFORMATION
A general description of the MFS funds’ proxy voting policies and procedures is available without charge, upon request, by calling
1-800-225-2606, by visiting the Proxy Voting section of mfs.com or by visiting the SEC’s Web site at http://www.sec.gov.
Information regarding how the fund voted proxies relating to portfolio securities during the most recent twelve-month period ended June 30 is available without charge by visiting the Proxy Voting section of mfs.com or by visiting the SEC’s Web site at http://www.sec.gov.
QUARTERLY PORTFOLIO DISCLOSURE
The fund will file a complete schedule of portfolio holdings with the Securities and Exchange Commission (the Commission) for the first and third quarters of each fiscal year on Form N-Q. The fund’s Form N-Q may be reviewed and copied at the:
Public Reference Room
Securities and Exchange Commission
100 F Street, NE, Room 1580
Washington, D.C. 20549
Information on the operation of the Public Reference Room may be obtained by calling the Commission at 1-800-SEC-0330. The fund’s Form N-Q is available on the EDGAR database on the Commission’s Internet Web site at http://www.sec.gov, and copies of this information may be obtained, upon payment of a duplicating fee, by electronic request at the following e-mail address: publicinfo@sec.gov or by writing the Public Reference Section at the above address.
19
MFS® PRIVACY NOTICE
Privacy is a concern for every investor today. At MFS Investment Management® and the MFS funds, we take this concern very seriously. We want you to understand our policies about the investment products and services that we offer, and how we protect the nonpublic personal information of investors who have a direct relationship with us and our wholly owned subsidiaries.
Throughout our business relationship, you provide us with personal information. We maintain information and records about you, your investments, and the services you use. Examples of the nonpublic personal information we maintain include
| | Ÿ | | data from investment applications and other forms |
| | Ÿ | | share balances and transactional history with us, our affiliates, or others |
| | Ÿ | | facts from a consumer reporting agency |
We do not disclose any nonpublic personal information about our customers or former customers to anyone, except as permitted by law. We may share nonpublic personal information with third parties or certain of our affiliates in connection with servicing your account or processing your transactions. We may share information with companies or financial institutions that perform marketing services on our behalf or with other financial institutions with which we have joint marketing arrangements, subject to any legal requirements.
Authorization to access your nonpublic personal information is limited to appropriate personnel who provide products, services, or information to you. We maintain physical, electronic, and procedural safeguards to help protect the personal information we collect about you.
If you have any questions about the MFS privacy policy, please call 1-800-225-2606 any business day between 8 a.m. and 8 p.m. Eastern time.
Note: If you own MFS products or receive MFS services in the name of a third party such as a bank or broker-dealer, their privacy policy may apply to you instead of ours.
20


MFS® TECHNOLOGY PORTFOLIO
The report is prepared for the general information of contract owners. It is authorized for distribution to prospective investors only when preceded or accompanied by a current prospectus.
NOT FDIC INSURED Ÿ MAY LOSE VALUE Ÿ NO BANK GUARANTEE Ÿ NOT A DEPOSIT Ÿ NOT INSURED BY ANY FEDERAL GOVERNMENT AGENCY OR NCUA/NCUSIF
LETTER FROM THE CEO

Dear Contract Owners:
The market downturns and economic setbacks of late probably rank among the worst financial declines most of us have experienced. Inevitably, people may be questioning their commitment to investing. Still, it is important to remember that downturns are an inescapable part of the business cycle. Such troughs have been seen before, and if we can use history as a guide, market recoveries typically have followed.
Recent events have clearly shown us the value of certain types of investments. In this environment, two of the hallmarks of mutual funds — transparency and liquidity — have become critically important. Unlike some other types of investments, the operations of mutual funds are relatively transparent to their shareholders. With their daily redemption feature, mutual funds also generally provide easy, convenient access to one’s money. Through these recent market upheavals, this level of liquidity enhanced the ability of mutual fund investors to respond and modify their investments as they and their advisors saw fit — a flexibility that those in less liquid investments simply did not have at their disposal.
At MFS® we take particular pride in how well mutual funds can serve investors because we invented the mutual fund in the United States. Established in 1924, Massachusetts Investors Trust was the nation’s first fund. Recent market events only reinforce what we have learned through 85 years — that mutual funds provide unique features that are important to investors in any type of market climate.
Respectfully,

Robert J. Manning
Chief Executive Officer and Chief Investment Officer
MFS Investment Management®
February 17, 2009
The opinions expressed in this letter are subject to change, may not be relied upon for investment advice, and no forecasts can be guaranteed.
Before investing, consider the fund’s investment objectives, risks, charges, and expenses. For a prospectus containing this and other information, contact your investment professional or view online. Read it carefully.
MFS Fund Distributors, Inc., 500 Boylston Street, Boston, MA 02116
1
PORTFOLIO COMPOSITION
Portfolio structure (i)
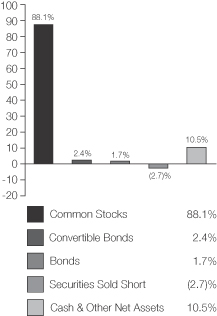
| | |
| Top ten holdings (i) | | |
| MicroStrategy, Inc., “A” | | 7.3% |
| Hewlett-Packard Co. | | 6.5% |
| Apple, Inc. | | 6.3% |
| VeriSign, Inc. | | 5.7% |
| Marvell Technology Group Ltd. | | 5.4% |
| Flextronics International Ltd. | | 5.1% |
| SanDisk Corp. | | 4.7% |
| Samsung Electronics Co. Ltd., GDR | | 4.2% |
| Oracle Corp. | | 3.7% |
| National Semiconductor Corp. | | 3.6% |
| | |
| Top five industries (i) | | |
| Electronics(s) | | 29.6% |
| Computer Software | | 22.5% |
| Computer Software – Systems | | 12.8% |
| Network & Telecom | | 9.9% |
Internet | | 6.1% |
| (s) | Top Five Industry combines both Common Stocks & Securities Sold Short. |
| (i) | For purposes of this presentation, the bond component includes accrued interest amounts and both the bond and equity component may be positively or negatively impacted by the equivalent exposure from any derivative holdings, if applicable. |
Percentages are based on net assets as of 12/31/08.
The portfolio is actively managed and current holdings may be different.
2
MANAGEMENT REVIEW
Summary of Results
For the twelve months ended December 31, 2008, Initial Class shares of the MFS Technology Portfolio (the “fund”) provided a total return of –50.92%, while Service Class shares of the fund provided a total return of –51.09%. These returns include the impact of a material class action settlement received by the fund during the reporting period (see Performance Summary for details). The fund’s returns compare with a return of –37.00% for the fund’s benchmark, the Standard & Poor’s 500 Stock Index, and a return of
–43.33% for the fund’s other benchmark, the Standard & Poor’s North American Technology Sector Index.
Market Environment
The U.S. economy and financial markets experienced significant deterioration and extraordinary volatility over the reporting period. U.S. economic growth slowed significantly, despite the short-term bounce from the second quarter fiscal stimulus. Strong domestic headwinds included accelerated deterioration in the housing market, anemic corporate investment, a rapidly declining job market, and a much tighter credit environment. During the period, a seemingly continuous series of tumultuous financial events hammered markets, including: the distressed sale of failing Bear Stearns to JPMorgan, the conservatorship of Government Sponsored Enterprises (GSEs) Fannie Mae and Freddie Mac, the bankruptcy of investment bank Lehman Brothers, the Federal Reserve Bank’s complex intervention of insurance company American International Group (AIG), the nationalization of several large European banks, the failure of Washington Mutual, and the distressed sale of Wachovia. As a result of this barrage of turbulent news, global equity markets pushed significantly lower and credit markets witnessed the worst dislocation since the beginning of the credit crisis. Though conditions improved towards the end of the period, the state of financial and macroeconomic dislocation remained severe.
While reasonably resilient during the first half of the period, the global economy and financial system increasingly experienced considerable negative spillovers from the U.S. slowdown. Not only did Europe and Japan show obvious signs of economic softening, the more powerful engine of global growth – emerging markets – also displayed weakening dynamics.
During the reporting period, the U.S. Federal Reserve Board cut interest rates aggressively and introduced a multitude of new lending facilities to alleviate ever-tightening credit markets, while the U.S. federal government moved quickly to design and implement a meaningful fiscal stimulus package. Although several other global central banks also cut rates, the dilemma of rising energy and food prices heightened concerns among central bankers that inflationary expectations might become unhinged despite weaker growth. Only later in the reporting period did slowing global growth result in a very precipitous decline in commodity prices, which significantly eased inflation and inflationary expectations. As inflationary concerns diminished in the face of global deleveraging, and equity and credit markets deteriorated more sharply, a coordinated rate cut marked the beginning of much more aggressive easing by the major global central banks.
Detractors from Performance
Relative to the S&P North American Technology Sector Index, stock selection and, to a lesser extent, an overweighted position in the electronics industry held back performance. The fund’s holdings of electronic device manufacturer RF Micro Devices, flash memory storage products maker SanDisk, solar power equipment company GT Solar International (aa)(g), and electronics assembly service provider Flextronics International (aa) (Singapore) were top relative detractors for the reporting period. We feel that shares of Flextronics fell as the market became concerned about weak industry demand and how potential funding constraints could impair the company.
The fund’s allocation to the broadcasting industry, which is not represented in the index, also hindered relative returns. Our positioning in poor-performing satellite radio provider Sirius XM Radio (aa), which is not a benchmark constituent, was a top relative detractor within this industry. During a period where credit markets tightened and discretionary consumer spending slowed significantly, businesses such as Sirius performed poorly. The company also struggled with a high debt load.
Security selection in the network and telecom industry was another area of relative weakness. Top detractors within this industry included wireless telecommunications companies Nokia (aa) (Finland), Research In Motion (Canada), and QUALCOMM (g). Our holdings of QUALCOMM consisted of a number of put options and a short position in the underlying security positioned as a hedge to reduce our exposure to the network and telecom industry. We believe that shares of Research In Motion suffered during the latter part of the reporting period due to concerns that the company spent too heavily to push a new slate of sleek BlackBerry devices into the marketplace.
Stocks in other industries that held back relative performance included business intelligence software company MicroStrategy and interactive entertainment software company THQ, Inc.
3
Management Review – continued
Contributors to Performance
The fund held put options and short positions in certain stocks in order to hedge exposure to certain industries relative to the benchmark. Several of these hedge positions, including financial data and software provider FactSet Research Systems (aa), publishing software company Adobe Systems (g), video game maker Activision Blizzard, and direct-sale computer vendor Dell (g), positively contributed to our relative results during the reporting period. In addition, holding a long position and call options in Internet search company Google, and not owning poor-performing wireless and broadband communications firm Motorola, also aided relative results.
Other top contributors in the fund included customer information software manager Salesforce.com (g), credit card company VISA, and access infrastructure products manufacturer Citrix Systems (g). Shares of Citrix rose, in part, due to an increase in profits that were driven by tight cost controls and strong sales of the company’s XenApp virtualization technology.
The fund’s cash position was also a contributor to relative performance. The fund holds cash to buy new holdings and to provide liquidity. In a period when equity markets declined, as measured by the fund’s benchmark, holding cash helped performance versus the benchmark, which has no cash position.
Respectfully,
Telis Bertsekas
Portfolio Manager
| (aa) | | Security is not a benchmark constituent. |
| (g) | | Security was not held in the portfolio at period end. |
The views expressed in this report are those of the portfolio manager only through the end of the period of the report as stated on the cover and do not necessarily reflect the views of MFS or any other person in the MFS organization. These views are subject to change at any time based on market or other conditions, and MFS disclaims any responsibility to update such views. These views may not be relied upon as investment advice or an indication of trading intent on behalf of any MFS portfolio. References to specific securities are not recommendations of such securities, and may not be representative of any MFS portfolio’s current or future investments.
4
PERFORMANCE SUMMARY THROUGH 12/31/08
The following chart illustrates the historical performance of the fund in comparison to its benchmark(s). Benchmark comparisons are unmanaged; do not reflect any fees or expenses; and cannot be invested in directly. The performance of other share classes will be greater than or less than that of the class depicted below. (See Notes to Performance Summary.)
Performance data shown represents past performance and is no guarantee of future results. Investment return and principal value fluctuate so your units, when sold, may be worth more or less than the original cost; current performance may be lower or higher than quoted. The performance shown does not reflect the deduction of taxes, if any, that a contract holder would pay on fund distributions or the redemption of contract units. The returns for the fund shown also do not reflect the deduction of expenses associated with variable products, such as mortality and expense risk charges, separate account charges, and sales charges imposed by the insurance company separate accounts. Such expenses would reduce the overall returns shown.
Growth of a hypothetical $10,000 investment (t)
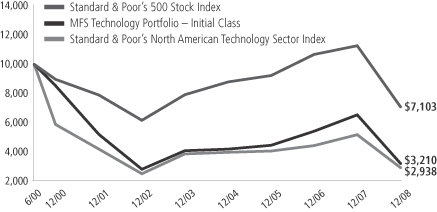
Total rates of return through 12/31/08
Average Annual Total Returns
| | | | | | | | | | | | |
| | | Share class | | Class inception date | | 1-yr | | 5-yr | | Life (t) | | |
| | | Initial Class | | 6/16/00 | | (50.92)% | | (4.78)% | | (12.45)% | | |
| | | Service Class | | 8/24/01 | | (51.09)% | | (5.06)% | | (12.68)% | | |
Comparative Benchmarks
| | | | | | | | | | | | |
| | | Standard & Poor’s 500 Stock Index (f) | | (37.00)% | | (2.19)% | | (3.91)% | | |
| | | Standard & Poor’s North American Technology Sector Index (f) | | (43.33)% | | (5.38)% | | (13.31)% | | |
| (f) | Source: FactSet Research Systems, Inc. |
| (t) | For the period from the commencement of the fund’s investment operations, June 16, 2000, through the stated period end. |
Included in the Initial Class and Service Class total returns for the year ended December 31, 2008 are proceeds received from a non-recurring litigation settlement with Nortel Networks Corp., had these proceeds not been included the 1-yr total returns would have each been lower by approximately 0.58%.
Benchmark Definitions
Standard & Poor’s 500 Stock Index – a market capitalization-weighted index of 500 widely held equity securities, designed to measure broad U.S. equity performance.
Standard & Poor’s North American Technology Sector Index (formerly the Goldman Sachs Technology Industry Composite Index) – a modified market capitalization-weighted index that measures the performance of selected technology stocks.
It is not possible to invest directly in an index.
Notes to Performance Summary
Performance for the Service Class includes the performance of the fund’s Initial Class for periods prior to their offering. Because Service Class expenses are higher than those of Initial Class, performance shown for Service Class is higher than it
5
Performance Summary – continued
would have been had it been offered for the entire period. Performance has not been adjusted to take into account differences in class specific operating expenses (such as Rule 12b-1 fees). Please see the prospectus for additional information about performance and expenses.
Performance results reflect any applicable expense subsidies and waivers in effect during the periods shown. Without such subsidies and waivers the fund’s performance results would be less favorable. Please see the prospectus for complete details. All results are historical and assume the reinvestment of any dividends and capital gains distributions.
From time to time the fund may receive proceeds from litigation settlements, without which performance would be lower.
6
EXPENSE TABLE
Fund Expenses Borne by the Contract Holders During the Period,
July 1, 2008 through December 31, 2008
As a contract holder of the fund, you incur ongoing costs, including management fees; distribution (12b-1) fees; and other fund expenses. This example is intended to help you understand your ongoing costs (in dollars) of investing in the fund and to compare these costs with the ongoing costs of investing in other mutual funds.
The example is based on an investment of $1,000 invested at the beginning of the period and held for the entire period July 1, 2008 through December 31, 2008.
Actual Expenses
The first line for each share class in the following table provides information about actual account values and actual expenses. You may use the information in this line, together with the amount you invested, to estimate the expenses that you paid over the period. Simply divide your account value by $1,000 (for example, an $8,600 account value divided by $1,000 = 8.6), then multiply the result by the number in the first line under the heading entitled “Expenses Paid During Period” to estimate the expenses you paid on your account during this period.
Hypothetical Example for Comparison Purposes
The second line for each share class in the following table provides information about hypothetical account values and hypothetical expenses based on the fund’s actual expense ratio and an assumed rate of return of 5% per year before expenses, which is not the fund’s actual return. The hypothetical account values and expenses may not be used to estimate the actual ending account balance or expenses you paid for the period. You may use this information to compare the ongoing costs of investing in the fund and other funds. To do so, compare this 5% hypothetical example with the 5% hypothetical examples that appear in the shareholder reports of the other funds.
Please note that the expenses shown in the table are meant to highlight the fund’s ongoing costs only and do not take into account the fees and expenses imposed under the variable contracts through which your investment in the fund is made. Therefore, the second line for each share class in the table is useful in comparing ongoing costs associated with an investment in vehicles (such as the fund) which fund benefits under variable annuity and variable life insurance contracts and to qualified pension and retirement plans only, and will not help you determine the relative total costs of investing in the fund through variable annuity and variable life insurance contracts. If the fees and expenses imposed under the variable contracts were included, your costs would have been higher.
| | | | | | | | | | |
| Share Class | | | | Annualized
Expense Ratio | | Beginning
Account Value
7/01/08 | | Ending
Account Value 12/31/08 | | Expenses Paid
During Period (p)
7/01/08-12/31/08 |
| Initial Class | | Actual | | 1.04% | | $1,000.00 | | $551.55 | | $4.06 |
| | Hypothetical (h) | | 1.04% | | $1,000.00 | | $1,019.91 | | $5.28 |
| Service Class | | Actual | | 1.29% | | $1,000.00 | | $550.88 | | $5.03 |
| | Hypothetical (h) | | 1.29% | | $1,000.00 | | $1,018.65 | | $6.55 |
| (h) | 5% class return per year before expenses. |
| (p) | Expenses paid is equal to each class’ annualized expense ratio, as shown above, multiplied by the average account value over the period, multiplied by the number of days in the period, divided by the number of days in the year. |
7
PORTFOLIO OF INVESTMENTS – 12/31/08
The Portfolio of Investments is a complete list of all securities owned by your fund. It is categorized by broad-based asset classes.
| | | | | |
| Issuer | | Shares/Par | | Value ($) |
| | | | | |
| COMMON STOCKS – 95.2% | | | | | |
| Business Services – 3.3% | | | | | |
| MasterCard, Inc., “A” | | 1,310 | | $ | 187,238 |
| Visa, Inc. | | 2,100 | | | 110,145 |
| | | | | |
| | | | $ | 297,383 |
| | | | | |
| Computer Software – 24.9% | | | | | |
| Akamai Technologies, Inc. (a)(p) | �� | 18,600 | | $ | 280,674 |
| McAfee, Inc. (a) | | 4,500 | | | 155,565 |
| MicroStrategy, Inc., “A” (a)(s) | | 17,780 | | | 660,171 |
| MSC Software Corp. (a) | | 46,486 | | | 310,526 |
| Oracle Corp. (a) | | 18,630 | | | 330,310 |
| VeriSign, Inc. (a) | | 26,992 | | | 515,007 |
| | | | | |
| | | | $ | 2,252,253 |
| | | | | |
| Computer Software – Systems – 12.8% | | | | | |
| Apple, Inc. (a)(s) | | 6,690 | | $ | 570,992 |
| Hewlett-Packard Co. (s) | | 16,200 | | | 587,898 |
| | | | | |
| | | | $ | 1,158,890 |
| | | | | |
| Electronics – 31.8% | | | | | |
| ASML Holding N.V. | | 7,000 | | $ | 126,490 |
| Entegris, Inc. (a) | | 26,300 | | | 57,597 |
| Flextronics International Ltd. (a) | | 179,270 | | | 458,931 |
| Intel Corp. | | 12,438 | | | 182,341 |
| Marvell Technology Group Ltd. (a) | | 72,548 | | | 483,895 |
| MEMC Electronic Materials, Inc. (a) | | 10,100 | | | 144,228 |
| National Semiconductor Corp. | | 31,900 | | | 321,233 |
| Nintendo Co. Ltd. | | 770 | | | 295,830 |
| Samsung Electronics Co. Ltd., GDR | | 2,147 | | | 375,725 |
| SanDisk Corp. (a) | | 44,200 | | | 424,320 |
| | | | | |
| | | | $ | 2,870,590 |
| | | | | |
| Internet – 6.1% | | | | | |
| Baidu.com, Inc., ADR (a) | | 1,370 | | $ | 178,881 |
| Google, Inc., “A” (a) | | 790 | | | 243,044 |
| Tencent Holdings Ltd. | | 20,200 | | | 131,507 |
| | | | | |
| | | | $ | 553,432 |
| | | | | |
| Leisure & Toys – 5.6% | | | | | |
| Electronic Arts, Inc. (a) | | 9,400 | | $ | 150,776 |
| Take-Two Interactive Software, Inc. | | 24,470 | | | 184,993 |
| THQ, Inc. (a) | | 41,000 | | | 171,790 |
| | | | | |
| | | | $ | 507,559 |
| | | | | |
| Network & Telecom – 8.5% | | | | | |
| Ciena Corp. (a)(p) | | 31,800 | | $ | 213,060 |
| High Tech Computer Corp. | | 11,000 | | | 110,960 |
| Nokia Corp., ADR | | 7,950 | | | 124,020 |
| Research in Motion Ltd. (a) | | 7,828 | | | 317,660 |
| | | | | |
| | | | $ | 765,700 |
| | | | | |
| Personal Computers & Peripherals – 2.2% | | | | | |
| NetApp, Inc. (a) | | 14,500 | | $ | 202,565 |
| | | | | |
Total Common Stocks (Identified Cost, $15,892,914) | | | | $ | 8,608,372 |
| | | | | |
| | | | | | | | |
| Issuer | | Shares/Par | | | Value ($) | |
| | | | | | | | |
| BONDS – 1.4% | | | | | | | | |
| Broadcasting – 1.4% | | | | | | | | |
| Sirius Satellite Radio, Inc., 9.625%, 2013 (Identified Cost, $341,992) | | $ | 675,000 | | | $ | 125,719 | |
| | | | | | | | |
|
| CONVERTIBLE BONDS – 2.3% | |
| Computer Software – 1.2% | | | | | | | | |
| Verisign, Inc., 3.25%, 2037 | | $ | 180,000 | | | $ | 113,175 | |
| | | | | | | | |
| Electronics – 1.1% | | | | | | | | |
| RF Micro Devices, Inc., 1%, 2014 | | $ | 329,000 | | | $ | 98,289 | |
| | | | | | | | |
Total Convertible Bonds (Identified Cost, $219,440) | | | | | | $ | 211,464 | |
| | | | | | | | |
| Issuer/Expiration Date/Strike Price | | Number of
Contracts | | | | |
|
| CALL OPTIONS PURCHASED – 0.6% | |
| Baidu.com, Inc. – January 2009 @ $180 (a) | | | 9 | | | $ | 234 | |
| Electronic Arts, Inc. – January 2009 @ $25 (a) | | | 27 | | | | 54 | |
| Research In Motion Ltd. – June 2009 @ $55 (a) | | | 83 | | | | 24,900 | |
| Research In Motion Ltd. – March 2009 @ $45 (a) | | | 76 | | | | 25,080 | |
| | | | | | | | |
Total Call Options Purchased (Premiums Paid, $96,225) | | | | | | $ | 50,268 | |
| | | | | | | | |
|
| PUT OPTIONS PURCHASED – 1.1% | |
| Activision Blizzard, Inc. – January 2009 @ $10 (a) | | | 332 | | | $ | 46,480 | |
| Altera Corp. – January 2009 @ $17.5 (a) | | | 158 | | | | 17,380 | |
| Juniper Networks, Inc. – February 2009 @ $17 (a) | | | 161 | | | | 20,125 | |
| SAP Aktiengesellschaft – January 2009 @ $35 (a) | | | 163 | | | | 15,485 | |
| | | | | | | | |
Total Put Options Purchased (Premiums Paid, $130,296) | | | | | | $ | 99,470 | |
| | | | | | | | |
Total Investments (Identified Cost, $16,680,867) | | | | | | $ | 9,095,293 | |
| | | | | | | | |
|
| CALL OPTIONS WRITTEN – (0.3)% | |
| Akamai Technologies, Inc. – February 2009 @ $15 (Premiums Received, $14,414) (a) | | | (145 | ) | | $ | (23,200 | ) |
| | | | | | | | |
| Issuer | | Shares/Par | | | | |
|
| SECURITIES SOLD SHORT – (2.7)% | |
| FactSet Research Systems, Inc. | | | (2,900 | ) | | $ | (128,296 | ) |
| Xilinx, Inc. | | | (6,600 | ) | | | (117,612 | ) |
| | | | | | | | |
Total Securities Sold Short (Proceeds Received, $228,363) | | | | | | $ | (245,908 | ) |
| | | | | | | | |
OTHER ASSETS, LESS LIABILITIES – 2.4% | | | | | | | 214,485 | |
| | | | | | | | |
| Net Assets – 100.0% | | | | | | $ | 9,040,670 | |
| | | | | | | | |
8
Portfolio of Investments – continued
| (a) | | Non-income producing security. |
| (p) | | Security or a portion of the security was pledged to cover collateral requirements for written options. At December 31, 2008, the value of securities pledged amounted to $224,165. |
| (s) | | Security or a portion of the security was pledged to cover collateral requirements for securities sold short. At December 31, 2008, the value of securities pledged amounted to $178,951. |
The following abbreviations are used in this report and are defined:
| ADR | | American Depository Receipt |
| GDR | | Global Depository Receipt |
See Notes to Financial Statements
9
FINANCIAL STATEMENTS | STATEMENT OF ASSETS AND LIABILITIES
This statement represents your fund’s balance sheet, which details the assets and liabilities comprising the total value of the fund.
| | | | | |
At 12/31/08 | | | | | |
Assets | | | | | |
Investments, at value (identified cost, $16,680,867) | | $9,095,293 | | | |
Deposits with brokers for securities sold short | | 228,363 | | | |
Foreign currency, at value (identified cost, $72,028) | | 72,925 | | | |
Receivable for investments sold | | 106,767 | | | |
Receivable for fund shares sold | | 9,266 | | | |
Interest and dividends receivable | | 33,759 | | | |
Receivable from investment adviser | | 9,422 | | | |
Other assets | | 1,049 | | | |
Total assets | | | | | $9,556,844 |
Liabilities | | | | | |
Payable to custodian | | $111,324 | | | |
Securities sold short, at value (proceeds received, $228,363) | | 245,908 | | | |
Payable for investments purchased | | 78,095 | | | |
Payable for fund shares reacquired | | 3,363 | | | |
Written options outstanding, at value (premiums received, $14,414) | | 23,200 | | | |
Payable to affiliates | | | | | |
Management fee | | 360 | | | |
Distribution fees | | 13 | | | |
Administrative services fee | | 55 | | | |
Payable for trustees’ compensation | | 33 | | | |
Accrued expenses and other liabilities | | 53,823 | | | |
Total liabilities | | | | | $516,174 |
Net assets | | | | | $9,040,670 |
Net assets consist of | | | | | |
Paid-in capital | | $44,998,294 | | | |
Unrealized appreciation (depreciation) on investments and translation of assets and liabilities in foreign currencies | | (7,611,003 | ) | | |
Accumulated net realized gain (loss) on investments and foreign currency transactions | | (28,346,621 | ) | | |
Net assets | | | | | $9,040,670 |
Shares of beneficial interest outstanding | | | | | 2,825,282 |
Initial Class shares | | | | | |
Net assets | | $8,051,042 | | | |
Shares outstanding | | 2,510,249 | | | |
Net asset value per share | | | | | $3.21 |
Service Class shares | | | | | |
Net assets | | $989,628 | | | |
Shares outstanding | | 315,033 | | | |
Net asset value per share | | | | | $3.14 |
See Notes to Financial Statements
10
FINANCIAL STATEMENTS | STATEMENT OF OPERATIONS
This statement describes how much your fund earned in investment income and accrued in expenses. It also describes any gains and/or losses generated by fund operations.
| | | | | | |
| Year ended 12/31/08 | | | | | | |
| Net investment loss | | | | | | |
Income | | | | | | |
Dividends | | $159,900 | | | | |
Interest | | 34,098 | | | | |
Foreign taxes withheld | | (15,659 | ) | | | |
Total investment income | | | | | $178,339 | |
Expenses | | | | | | |
Management fee | | $132,524 | | | | |
Distribution fees | | 6,008 | | | | |
Administrative services fee | | 9,999 | | | | |
Trustees’ compensation | | 2,630 | | | | |
Custodian fee | | 24,421 | | | | |
Shareholder communications | | 15,266 | | | | |
Auditing fees | | 42,228 | | | | |
Legal fees | | 7,127 | | | | |
Dividend and interest expense on securities sold short | | 2,692 | | | | |
Miscellaneous | | 7,537 | | | | |
Total expenses | | | | | $250,432 | |
Fees paid indirectly | | (343 | ) | | | |
Reduction of expenses by investment adviser | | (64,540 | ) | | | |
Net expenses | | | | | $185,549 | |
Net investment loss | | | | | $(7,210 | ) |
Realized and unrealized gain (loss) on investments and foreign currency transactions | | | | | | |
Realized gain (loss) (identified cost basis) | | | | | | |
Investment transactions (s) | | $(3,697,031 | ) | | | |
Written option transactions | | 362,147 | | | | |
Securities sold short | | 198,190 | | | | |
Foreign currency transactions | | (11,043 | ) | | | |
Net realized gain (loss) on investments and foreign currency transactions | | | | | $(3,147,737 | ) |
Change in unrealized appreciation (depreciation) | | | | | | |
Investments | | $(7,389,308 | ) | | | |
Written options | | (16,410 | ) | | | |
Securities sold short | | (17,545 | ) | | | |
Translation of assets and liabilities in foreign currencies | | 901 | | | | |
Net unrealized gain (loss) on investments and foreign currency translation | | | | | $(7,422,362 | ) |
Net realized and unrealized gain (loss) on investments and foreign currency | | | | | $(10,570,099 | ) |
Change in net assets from operations | | | | | $(10,577,309 | ) |
| (s) | Includes proceeds received from a non-recurring cash and shares settlement in the amount of $130,425 from a litigation settlement against Nortel Networks Corp. |
See Notes to Financial Statements
11
FINANCIAL STATEMENTS | STATEMENTS OF CHANGES IN NET ASSETS
These statements describe the increases and/or decreases in net assets resulting from operations, any distributions, and any shareholder transactions.
| | | | | | |
For years ended 12/31 | | 2008 | | | 2007 | |
Change in net assets | | | | | | |
From operations | | | | | | |
Net investment loss | | $(7,210 | ) | | $(77,368 | ) |
Net realized gain (loss) on investments and foreign currency transactions | | (3,147,737 | ) | | 5,055,683 | |
Net unrealized gain (loss) on investments and foreign currency translation | | (7,422,362 | ) | | (1,010,604 | ) |
Change in net assets from operations | | $(10,577,309 | ) | | $3,967,711 | |
Change in net assets from fund share transactions | | $(5,120,880 | ) | | $(1,190,146 | ) |
Total change in net assets | | $(15,698,189 | ) | | $2,777,565 | |
Net assets | | | | | | |
At beginning of period | | 24,738,859 | | | 21,961,294 | |
At end of period | | $9,040,670 | | | $24,738,859 | |
See Notes to Financial Statements
12
FINANCIAL STATEMENTS | FINANCIAL HIGHLIGHTS
The financial highlights table is intended to help you understand the fund’s financial performance for the past 5 years. Certain information reflects financial results for a single fund share. The total returns in the table represent the rate by which an investor would have earned (or lost) on an investment in the fund share class (assuming reinvestment of all distributions) held for the entire period.
| | | | | | | | | | | | | | | |
| Initial Class | | Years ended 12/31 | |
| | | 2008 | | | 2007 | | | 2006 | | | 2005 | | | 2004 | |
Net asset value, beginning of period | | $6.54 | | | $5.44 | | | $4.46 | | | $4.20 | | | $4.10 | |
| Income (loss) from investment operations | | | | | | | | | | | | | | | |
Net investment income (loss) (d) | | $(0.00 | )(w) | | $(0.02 | ) | | $(0.03 | ) | | $(0.03 | ) | | $(0.01 | ) |
Net realized and unrealized gain (loss) on investments
and foreign currency | | (3.33 | ) | | 1.12 | | | 1.01 | | | 0.29 | | | 0.11 | |
Total from investment operations | | $(3.33 | ) | | $1.10 | | | $0.98 | | | $0.26 | | | $0.10 | |
Net asset value, end of period | | $3.21 | | | $6.54 | | | $5.44 | | | $4.46 | | | $4.20 | |
Total return (%) (k)(r)(s) | | (50.92 | )(x) | | 20.22 | | | 21.97 | | | 6.19 | | | 2.44 | (b) |
Ratios (%) (to average net assets)
and Supplemental data: | | | | | | | | | | | | | | | |
Expenses before expense reductions (f) | | 1.39 | | | 1.21 | | | 1.34 | | | 1.18 | | | 1.11 | |
Expenses after expense reductions (f) | | 1.02 | | | 1.00 | | | 1.00 | | | 1.00 | | | 1.01 | |
Expenses after expense reductions excluding short sale
dividend and interest expense (f) | | 1.00 | | | N/A | | | N/A | | | N/A | | | N/A | |
Net investment loss | | (0.00 | )(w) | | (0.31 | ) | | (0.55 | ) | | (0.66 | ) | | (0.21 | ) |
Portfolio turnover | | 244 | | | 249 | | | 234 | | | 196 | | | 110 | |
Net assets at end of period (000 Omitted) | | $8,051 | | | $21,184 | | | $18,813 | | | $18,978 | | | $23,069 | |
See Notes to Financial Statements
13
Financial Highlights – continued
| | | | | | | | | | | | | | | |
| Service Class | | Years ended 12/31 | |
| | | 2008 | | | 2007 | | | 2006 | | | 2005 | | | 2004 | |
Net asset value, beginning of period | | $6.42 | | | $5.35 | | | $4.40 | | | $4.15 | | | $4.07 | |
| Income (loss) from investment operations | | | | | | | | | | | | | | | |
Net investment loss (d) | | $(0.02 | ) | | $(0.03 | ) | | $(0.04 | ) | | $(0.04 | ) | | $(0.02 | ) |
Net realized and unrealized gain (loss) on investments
and foreign currency | | (3.26 | ) | | 1.10 | | | 0.99 | | | 0.29 | | | 0.10 | |
Total from investment operations | | $(3.28 | ) | | $1.07 | | | $0.95 | | | $0.25 | | | $0.08 | |
Net asset value, end of period | | $3.14 | | | $6.42 | | | $5.35 | | | $4.40 | | | $4.15 | |
Total return (%) (k)(r)(s) | | (51.09 | )(x) | | 20.00 | | | 21.59 | | | 6.02 | | | 1.97 | (b) |
Ratios (%) (to average net assets)
and Supplemental data: | | | | | | | | | | | | | | | |
Expenses before expense reductions (f) | | 1.62 | | | 1.46 | | | 1.59 | | | 1.43 | | | 1.36 | |
Expenses after expense reductions (f) | | 1.27 | | | 1.25 | | | 1.25 | | | 1.25 | | | 1.26 | |
Expenses after expense reductions excluding short sale
dividend and interest expense (f) | | 1.25 | | | N/A | | | N/A | | | N/A | | | N/A | |
Net investment loss | | (0.29 | ) | | (0.56 | ) | | (0.80 | ) | | (0.92 | ) | | (0.45 | ) |
Portfolio turnover | | 244 | | | 249 | | | 234 | | | 196 | | | 110 | |
Net assets at end of period (000 Omitted) | | $990 | | | $3,555 | | | $3,148 | | | $3,375 | | | $3,636 | |
| (b) | The fund’s net asset value and total return calculation include a non-recurring accrual recorded as a result of an administrative proceeding regarding disclosure of brokerage allocation practices in connection with fund sales. The non-recurring accrual did not have a material impact on the net asset value per share based on the shares outstanding on the day the accrual was recorded. |
| (d) | Per share data is based on average shares outstanding. |
| (f) | Ratios do not reflect reductions from fees paid indirectly, if applicable. |
| (k) | The total return does not reflect expenses that apply to separate accounts. Inclusion of these charges would reduce the total return figures for all periods shown. |
| (r) | Certain expenses have been reduced without which performance would have been lower. |
| (s) | From time to time the fund may receive proceeds from litigation settlements, without which performance would be lower. |
| (w) | Per share amount and ratio was less than 0.01. |
| (x) | Excluding the effect of the proceeds received from a non-recurring litigation settlement against Nortel Networks Corp., the total returns for the year ended December 31, 2008 would have been lower by approximately 0.58%. |
See Notes to Financial Statements
14
NOTES TO FINANCIAL STATEMENTS
| (1) | | Business and Organization |
MFS Technology Portfolio (the fund) is a series of MFS Variable Insurance Trust II (the trust). The trust is organized as a Massachusetts business trust and is registered under the Investment Company Act of 1940, as amended, as an open-end management investment company. The shares of the fund are sold to variable accounts established by insurance companies to fund benefits under variable contracts issued by such companies, and qualified retirement and pension plans.
| (2) | | Significant Accounting Policies |
General – The preparation of financial statements in conformity with U.S. generally accepted accounting principles requires management to make estimates and assumptions that affect the reported amounts of assets and liabilities, and disclosure of contingent assets and liabilities at the date of the financial statements and the reported amounts of revenues and expenses during the reporting period. Actual results could differ from those estimates. The fund can invest in foreign securities, including securities of emerging market issuers. Investments in foreign securities are vulnerable to the effects of changes in the relative values of the local currency and the U.S. dollar and to the effects of changes in each country’s legal, political, and economic environment. The markets of emerging markets countries are generally more volatile than the markets of developed countries with more mature economies. All of the risks of investing in foreign securities previously described are heightened when investing in emerging markets countries.
Investment Valuations – Equity securities, including restricted equity securities, are generally valued at the last sale or official closing price as reported by a third party pricing service on the market or exchange on which they are primarily traded. For securities for which there were no sales reported that day, equity securities are generally valued at the last quoted daily bid quotation as reported by a third party pricing service on the market or exchange on which they are primarily traded. For securities held short for which there were no sales reported for the day, the position is generally valued at the last quoted daily ask quotation as reported by a third party pricing service on the market or exchange on which such securities are primarily traded. Debt instruments and floating rate loans (other than short-term instruments), including restricted debt instruments, are generally valued at an evaluated or composite bid as reported by a third party pricing service. Exchange-traded options are generally valued at the last sale or official closing price as reported by a third party pricing service on the exchange on which such options are primarily traded. Exchange-traded options for which there were no sales reported that day are generally valued at the last daily bid quotation as reported by a third party pricing service on the exchange on which such options are primarily traded. Options not traded on an exchange are generally valued at a broker-dealer bid quotation. Foreign currency options are generally valued using an external pricing model that uses market data from a third party source. Securities and other assets generally valued on the basis of information from a third party pricing service may also be valued at a broker-dealer bid quotation. Values obtained from pricing services can utilize both dealer-supplied valuations and electronic data processing techniques, which take into account factors such as institutional-size trading in similar groups of securities, yield, quality, coupon rate, maturity, type of issue, trading characteristics, and other market data. The values of foreign securities and other assets and liabilities expressed in foreign currencies are converted to U.S. dollars using the mean of bid and asked prices for rates reported by a third party pricing service.
The Board of Trustees has delegated primary responsibility for determining or causing to be determined the value of the fund’s investments (including any fair valuation) to the adviser pursuant to valuation policies and procedures approved by the Board. If the adviser determines that reliable market quotations are not readily available, investments are valued at fair value as determined in good faith by the adviser in accordance with such procedures under the oversight of the Board of Trustees. Under the fund’s valuation policies and procedures, market quotations are not considered to be readily available for most types of debt instruments and floating rate loans and many types of derivatives. These investments are generally valued at fair value based on information from third party pricing services. In addition, investments may be valued at fair value if the adviser determines that an investment’s value has been materially affected by events occurring after the close of the exchange or market on which the investment is principally traded (such as foreign exchange or market) and prior to the determination of the fund’s net asset value, or after the halting of trading of a specific security where trading does not resume prior to the close of the exchange or market on which the security is principally traded. Events that occur on a frequent basis after foreign markets close (such as developments in foreign markets and significant movements in the U.S. markets) and prior to the determination of the fund’s net asset value may be deemed to have a material affect on the value of securities traded in foreign markets. Accordingly, the fund’s foreign equity securities may often be valued at fair value. The adviser may rely on third party pricing services or other information (such as the correlation with price movements of similar securities in the same or other markets; the type, cost and investment characteristics of the security; the business and financial condition of the issuer; and trading and other market data) to assist in determining whether to fair value and at what value to fair value an investment. The value of an investment for purposes of calculating the fund’s net asset value can differ depending on the source and method used to determine value. When fair valuation is used, the value of investments used to determine the fund’s net asset value may differ from quoted or published prices for the same investments.
15
Notes to Financial Statements – continued
The fund adopted FASB Statement No. 157, Fair Value Measurements (the “Statement”). This Statement provides a single definition of fair value, a hierarchy for measuring fair value and expanded disclosures about fair value measurements.
Various inputs are used in determining the value of the fund’s assets or liabilities carried at market value. These inputs are categorized into three broad levels. Level 1 includes quoted prices in active markets for identical assets or liabilities. Level 2 includes other significant observable market-based inputs (including quoted prices for similar securities, interest rates, prepayment speed, and credit risk). Level 3 includes unobservable inputs, which may include the adviser’s own assumptions in determining the fair value of investments. Other financial instruments are derivative instruments not reflected in total investments, such as futures, forwards, swap contracts and written options. The following is a summary of the levels used as of December 31, 2008 in valuing the fund’s assets or liabilities carried at market value:
| | | | | | | | | | |
| | | Level 1 | | | Level 2 | | Level 3 | | Total | |
| Investments in Securities * | | $7,973,906 | | | $875,479 | | $— | | $8,849,385 | |
| Other Financial Instruments | | $(23,200 | ) | | $— | | $— | | $(23,200 | ) |
| | * | Level 1 is net of securities sold short, at value in the amount of $245,908 | |
Foreign Currency Translation – Purchases and sales of foreign investments, income, and expenses are converted into U.S. dollars based upon currency exchange rates prevailing on the respective dates of such transactions or on the reporting date for foreign denominated receivables and payables. Gains and losses attributable to foreign currency exchange rates on sales of securities are recorded for financial statement purposes as net realized gains and losses on investments. Gains and losses attributable to foreign exchange rate movements on receivables, payables, income and expenses are recorded for financial statement purposes as foreign currency transaction gains and losses. That portion of both realized and unrealized gains and losses on investments that results from fluctuations in foreign currency exchange rates is not separately disclosed.
Derivative Risk – The fund may invest in derivatives for hedging or non-hedging purposes. While hedging can reduce or eliminate losses, it can also reduce or eliminate gains. When the fund uses derivatives as an investment to gain market exposure, or for hedging purposes, gains and losses from derivative instruments may be substantially greater than the derivative’s original cost. Cash that has been segregated on behalf of certain derivative contracts will be reported separately on the Statement of Assets and Liabilities as restricted cash. On some over-the-counter derivatives, the fund attempts to reduce its exposure to counterparty credit risk by entering into an ISDA Master Agreement on a bilateral basis with each of the counterparties with whom it undertakes a significant volume of transactions. The ISDA Master Agreement gives the fund the right, upon an event of default by the applicable counterparty, to close out all transactions traded under such agreement and to net amounts owed under each transaction to one net amount payable by one party to the other. This right to close out and net payments across all transactions traded under the ISDA Master Agreement could result in a reduction of the fund’s credit risk to such counterparty equal to any amounts payable by the fund under the applicable transactions, if any. However, absent an event of default by the counterparty, the ISDA Master Agreement does not result in an offset of reported balance sheet assets and liabilities across transactions between the fund and the applicable counterparty. Derivative instruments include written options and purchased options.
In March 2008, FASB Statement No. 161, Disclosures about Derivative Instruments and Hedging Activities (the “Standard”) was issued, and is effective for financial statements issued for fiscal years and interim periods beginning after November 15, 2008. This Standard provides enhanced disclosures about the fund’s use of and accounting for derivative instruments and the effect of derivative instruments on the fund’s results of operations and financial position. Management is evaluating the application of the Standard to the fund, and has not at this time determined the impact, if any, resulting from the adoption of this Standard on the fund’s financial statements.
FASB Staff Position (FSP) 133-1 was implemented during the period. FSP 133-1 amends FAS 133 to require sellers of credit derivatives to make disclosures that will enable financial statement users to assess the potential effects of those credit derivatives on an entity’s financial position, financial performance and cash flows. There was no impact from implementing FSP 133-1 as the fund did not hold any of these credit derivatives at period end.
Written Options – The fund may write call or put options in exchange for a premium. The premium is initially recorded as a liability, which is subsequently adjusted to the current value of the option contract. When a written option expires, the fund realizes a gain equal to the amount of the premium received. The difference between the premium and the amount paid on effecting a closing transaction is considered a realized gain or loss. When a written call option is exercised, the premium received is offset against the proceeds to determine the realized gain or loss. When a written put option is exercised, the premium reduces the cost basis of the security purchased by the fund. The fund, as writer of an option, may have no control over whether the underlying securities may be sold (call) or purchased (put) and, as a result, bears the market risk of an unfavorable change in the price of the securities underlying the written option. In general, written call options may serve as a
16
Notes to Financial Statements – continued
partial hedge against decreases in value in the underlying securities to the extent of the premium received. Collateral, in the form of cash or securities, may be required to be held in segregated accounts with the fund’s custodian in connection with these contracts.
Written Option Transactions
| | | | | | |
| | | Number of
contracts | | | Premiums
received | |
| Outstanding, beginning of period | | 271 | | | $125,144 | |
| Options written | | 5,060 | | | 409,132 | |
| Options closed | | (1,844 | ) | | (326,007 | ) |
| Options expired | | (3,342 | ) | | (193,855 | ) |
| Outstanding, end of period | | 145 | | | $14,414 | |
Purchased Options – The fund may purchase call or put options for a premium. Purchasing call options may be a hedge against an anticipated increase in the dollar cost of securities to be acquired or to increase the fund’s exposure to the underlying instrument. Purchasing put options may hedge against a decline in the value of portfolio securities. The premium paid is included as an investment in the Statement of Assets and Liabilities and is subsequently adjusted to the current value of the option. Premiums paid for purchased options which have expired are treated as realized losses on investments in the Statement of Operations. Premiums paid for purchased options which are exercised or closed are added to the amount paid or offset against the proceeds on the underlying security or financial instrument to determine the realized gain or loss. The risk of loss associated with purchased options is limited to the premium paid.
Short Sales – The fund may enter into short sales whereby it sells a security it does not own in anticipation of a decline in the value of that security. The fund will realize a gain if the security price decreases and a loss if the security price increases between the date of the short sale and the date on which the fund replaces the borrowed security. Losses from short sales can exceed the proceeds of the security sold; and they can also exceed the potential loss from an ordinary buy and sell transaction. The amount of any premium, dividends, or interest the fund may be required to pay in connection with a short sale will be recognized as a fund expense. The fund segregates cash or marketable securities in an amount that, when combined with the amount of proceeds from the short sale deposited with the broker, at least equals the current market value of the security sold short.
Security Loans – State Street Bank and Trust Company (“State Street”), as lending agent, may loan the securities of the fund to certain qualified institutions (the “Borrowers”) approved by the fund. The loans are collateralized by cash and/or U.S. Treasury and federal agency obligations in an amount typically at least equal to the market value of the securities loaned. State Street provides the fund with indemnification against Borrower default. The fund bears the risk of loss with respect to the investment of cash collateral. On loans collateralized by cash, the cash collateral is invested in a money market fund or short-term securities. A portion of the income generated upon investment of the collateral is remitted to the Borrowers, and the remainder is allocated between the fund and the lending agent. On loans collateralized by U.S. Treasury and/or federal agency obligations, a fee is received from the Borrower, and is allocated between the fund and the lending agent. Income from securities lending is included in interest income on the Statement of Operations. The dividend and interest income earned on the securities loaned is accounted for in the same manner as other dividend and interest income. At December 31, 2008, there were no securities on loan.
Indemnifications – Under the fund’s organizational documents, its officers and trustees may be indemnified against certain liabilities and expenses arising out of the performance of their duties to the fund. Additionally, in the normal course of business, the fund enters into agreements with service providers that may contain indemnification clauses. The fund’s maximum exposure under these agreements is unknown as this would involve future claims that may be made against the fund that have not yet occurred.
Investment Transactions and Income – Investment transactions are recorded on the trade date. Interest income is recorded on the accrual basis. All premium and discount is amortized or accreted for financial statement purposes in accordance with U.S. generally accepted accounting principles. Dividends received in cash are recorded on the ex-dividend date. Certain dividends from foreign securities will be recorded when the fund is informed of the dividend if such information is obtained subsequent to the ex-dividend date. Dividend and interest payments received in additional securities are recorded on the ex-dividend or ex-interest date in an amount equal to the value of the security on such date.
The fund may receive proceeds from litigation settlements. Any proceeds received from litigation involving portfolio holdings are reflected in the Statement of Operations in realized gain/loss if the security has been disposed of by the fund or in unrealized gain/loss if the security is still held by the fund. Any other proceeds from litigation not related to portfolio holdings are reflected as other income in the Statement of Operations. The fund was a participant in litigation against Nortel Networks Corp. On May 6, 2008, May 13, 2008, and May 19, 2008, the fund received cash and share settlements aggregating $130,425.
17
Notes to Financial Statements – continued
Fees Paid Indirectly – The fund’s custody fee may be reduced according to an arrangement that measures the value of cash deposited with the custodian by the fund. This amount, for the year ended December 31, 2008, is shown as a reduction of total expenses on the Statement of Operations.
Tax Matters and Distributions – The fund intends to qualify as a regulated investment company, as defined under Subchapter M of the Internal Revenue Code, and to distribute all of its taxable income, including realized capital gains. As a result, no provision for federal income taxes is required. Each of the fund’s federal tax returns for the prior three fiscal years remains subject to examination by the Internal Revenue Service. Foreign taxes, if any, have been accrued by the fund in the accompanying financial statements.
Distributions to shareholders are recorded on the ex-dividend date. Income and capital gain distributions are determined in accordance with income tax regulations, which may differ from U.S. generally accepted accounting principles. Certain capital accounts in the financial statements are periodically adjusted for permanent differences in order to reflect their tax character. These adjustments have no impact on net assets or net asset value per share. Temporary differences which arise from recognizing certain items of income, expense, gain or loss in different periods for financial statement and tax purposes will reverse at some time in the future. Distributions in excess of net investment income or net realized gains are temporary overdistributions for financial statement purposes resulting from differences in the recognition or classification of income or distributions for financial statement and tax purposes.
Book/tax differences primarily relate to net operating losses, expiration of capital loss carryforwards and wash sale loss deferrals.
The fund declared no distributions for the years ended December 31, 2008 and 2007.
The federal tax cost and the tax basis components of distributable earnings were as follows:
| | | |
| As of 12/31/08 | | | |
| Cost of investments | | $17,019,726 | |
| Gross appreciation | | 82,120 | |
| Gross depreciation | | (8,006,553 | ) |
| Net unrealized appreciation (depreciation) | | $(7,924,433 | ) |
| Capital loss carryforwards | | (27,959,549 | ) |
| Other temporary differences | | (73,642 | ) |
As of December 31, 2008, the fund had capital loss carryforwards available to offset future realized gains. Such losses expire as follows:
| | | |
| 12/31/09 | | $(8,603,853 | ) |
| 12/31/10 | | (16,502,070 | ) |
| 12/31/16 | | (2,853,626 | ) |
| Total | | $(27,959,549 | ) |
The availability of a portion of the capital loss carryforwards, which were acquired on September 5, 2003, in connection with the Global Telecommunications Series merger, may be limited in a given year.
Multiple Classes of Shares of Beneficial Interest – The fund offers multiple classes of shares, which differ in their respective distribution fees. The fund’s income, realized and unrealized gain (loss), and common expenses are allocated to shareholders based on the daily net assets of each class. Dividends are declared separately for each class. Differences in per share dividend rates are generally due to differences in separate class expenses.
| (3) | | Transactions with Affiliates |
Investment Adviser – The fund has an investment advisory agreement with Massachusetts Financial Services Company (MFS) to provide overall investment management and related administrative services and facilities to the fund. The management fee is computed daily and paid monthly at the following annual rates:
| | |
| First $1 billion of average daily net assets | | 0.75% |
| Average daily net assets in excess of $1 billion | | 0.70% |
The management fee incurred for the year ended December 31, 2008 was equivalent to an annual effective rate of 0.75% of the fund’s average daily net assets.
The investment adviser has agreed in writing to pay a portion of the fund’s total operating expenses, exclusive of interest, taxes, extraordinary expenses, brokerage and transaction costs and investment-related expenses, such that the total annual operating expenses of the fund do not exceed 1.00% for the Initial Class shares and 1.25% for the Service Class shares, based on the average
18
Notes to Financial Statements – continued
daily net assets of each share class. This written agreement will continue until April 30, 2010. For the year ended December 31, 2008, this reduction amounted to $64,540 and is reflected as a reduction of total expenses in the Statements of Operations.
Distributor – MFS Fund Distributors, Inc. (MFD), a wholly-owned subsidiary of MFS, is the distributor of shares of the fund. The Trustees have adopted a distribution plan for the Service Class shares pursuant to Rule 12b-1 under the Investment Company Act of 1940.
The fund’s distribution plan provides that the fund will pay MFD distribution fees equal to 0.25% per annum of its average daily net assets attributable to Service Class shares as partial consideration for services performed and expenses incurred by MFD and financial intermediaries in connection with the sale and distribution of the fund’s Service Class shares and the sale and distribution of the variable annuity or variable life insurance contracts investing indirectly in Service Class shares. MFD may subsequently pay all, or a portion, of the distribution fees to financial intermediaries.
Shareholder Servicing Agent – MFS Service Center, Inc. (MFSC), a wholly-owned subsidiary of MFS, has contracted to provide transfer agent and recordkeeping functions in connection with the issuance, transfer, and redemption of each class of shares of the fund under a Shareholder Servicing Agent Agreement. During the year ended December 31, 2008, the fund did not pay MFSC a fee for this service.
Administrator – MFS provides certain financial, legal, shareholder communications, compliance, and other administrative services to the fund. Under an administrative services agreement, the fund partially reimburses MFS the costs incurred to provide these services. The fund is charged an annual fixed amount of $10,000 plus a fee based on average daily net assets.
The administrative services fee incurred for the year ended December 31, 2008 was equivalent to an annual effective rate of 0.0566% of the fund’s average daily net assets.
Trustees’ and Officers’ Compensation – The fund pays compensation to trustees in the form of a retainer, attendance fees, and additional compensation to the Board chairperson. The fund does not pay compensation directly to officers of the fund who are also officers of the investment adviser, all of whom receive remuneration for their services to the fund from MFS. Certain officers of the fund are officers or directors of MFS, MFD, and MFSC.
Other – This fund and certain other MFS funds (the funds) have entered into services agreements (the Agreements) which provide for payment of fees by the funds to Tarantino LLC and Griffin Compliance LLC in return for the provision of services of an Independent Chief Compliance Officer (ICCO) and Assistant ICCO, respectively, for the funds. The ICCO and Assistant ICCO are officers of the funds and the sole members of Tarantino LLC and Griffin Compliance LLC, respectively. The funds can terminate the Agreements with Tarantino LLC and Griffin Compliance LLC at any time under the terms of the Agreements. MFS has agreed to bear all expenses associated with office space, other administrative support, and supplies provided to the ICCO and Assistant ICCO. For the year ended December 31, 2008, the aggregate fees paid by the fund to Tarantino LLC and Griffin Compliance LLC were $158 and are included in miscellaneous expense on the Statement of Operations.
Purchases and sales of investments, other than U.S. Government securities, purchased option transactions, and short-term obligations, aggregated $42,875,886 and $46,459,815, respectively.
| (5) | | Shares of Beneficial Interest |
The fund’s Declaration of Trust permits the Trustees to issue an unlimited number of full and fractional shares of beneficial interest. Transactions in fund shares were as follows:
| | | | | | | | | | | | |
| | | Year ended 12/31/08 | | | Year ended 12/31/07 | |
| | | Shares | | | Amount | | | Shares | | | Amount | |
| Shares sold | | | | | | | | | | | | |
Initial Class | | 351,513 | | | $1,843,162 | | | 613,355 | | | $3,959,968 | |
Service Class | | 76,290 | | | 414,007 | | | 106,567 | | | 665,934 | |
| | 427,803 | | | $2,257,169 | | | 719,922 | | | $4,625,902 | |
| Shares reacquired | | | | | | | | | | | | |
Initial Class | | (1,078,381 | ) | | $(5,843,498 | ) | | (836,111 | ) | | $(4,988,422 | ) |
Service Class | | (314,656 | ) | | (1,534,551 | ) | | (141,574 | ) | | (827,626 | ) |
| | (1,393,037 | ) | | $(7,378,049 | ) | | (977,685 | ) | | $(5,816,048 | ) |
| Net change | | | | | | | | | | | | |
Initial Class | | (726,868 | ) | | $(4,000,336 | ) | | (222,756 | ) | | $(1,028,454 | ) |
Service Class | | (238,366 | ) | | (1,120,544 | ) | | (35,007 | ) | | (161,692 | ) |
| | (965,234 | ) | | $(5,120,880 | ) | | (257,763 | ) | | $(1,190,146 | ) |
19
Notes to Financial Statements – continued
The fund and other funds managed by MFS participate in a $1 billion unsecured committed line of credit provided by a syndication of banks under a credit agreement. In addition, the fund and other funds managed by MFS have established uncommitted borrowing arrangements with certain banks. Borrowings may be made for temporary financing needs. Interest is charged to each fund, based on its borrowings, generally at a rate equal to the Federal Reserve funds rate plus 0.30%. In addition, a commitment fee, based on the average daily, unused portion of the committed line of credit, is allocated among the participating funds at the end of each calendar quarter. For the year ended December 31, 2008, the fund’s commitment fee and interest expense were $93 and $0, respectively, and are included in miscellaneous expense on the Statement of Operations.
20
REPORT OF INDEPENDENT REGISTERED PUBLIC ACCOUNTING FIRM
To the Board of Trustees of MFS Variable Insurance Trust II and the Shareholders of
MFS Technology Portfolio:
We have audited the accompanying statement of assets and liabilities, including the portfolio of investments, of MFS Technology Portfolio (the “Fund”) (one of the portfolios comprising MFS Variable Insurance Trust II) as of December 31, 2008, and the related statement of operations for the year then ended, the statements of changes in net assets for each of the two years in the period then ended, and the financial highlights for each of the five years in the period then ended. These financial statements and financial highlights are the responsibility of the Fund’s management. Our responsibility is to express an opinion on these financial statements and financial highlights based on our audits.
We conducted our audits in accordance with the standards of the Public Company Accounting Oversight Board (United States). Those standards require that we plan and perform the audit to obtain reasonable assurance about whether the financial statements and financial highlights are free of material misstatement. The Fund is not required to have, nor were we engaged to perform, an audit of its internal control over financial reporting. Our audits included consideration of internal control over financial reporting as a basis for designing audit procedures that are appropriate in the circumstances, but not for the purpose of expressing an opinion on the effectiveness of the Fund’s internal control over financial reporting. Accordingly, we express no such opinion. An audit also includes examining, on a test basis, evidence supporting the amounts and disclosures in the financial statements, assessing the accounting principles used and significant estimates made by management, as well as evaluating the overall financial statement presentation. Our procedures included confirmation of securities owned as of December 31, 2008, by correspondence with the custodian and brokers; where replies were not received from brokers, we performed other auditing procedures. We believe that our audits provide a reasonable basis for our opinion.
In our opinion, the financial statements and financial highlights referred to above present fairly, in all material respects, the financial position of MFS Technology Portfolio as of December 31, 2008, the results of its operations for the year then ended, the changes in its net assets for each of the two years in the period then ended, and the financial highlights for each of the five years in the period then ended, in conformity with accounting principles generally accepted in the United States of America.
DELOITTE & TOUCHE LLP
Boston, Massachusetts
February 19, 2009
21
TRUSTEES AND OFFICERS – IDENTIFICATION AND BACKGROUND
The Trustees and officers of the Trust, as of February 1, 2009, are listed below, together with their principal occupations during the past five years. (Their titles may have varied during that period.) The address of each Trustee and officer is 500 Boylston Street, Boston, Massachusetts 02116.
| | | | | | |
Name, Date of Birth | | Position(s) Held
with Fund | | Trustee/Officer
Since (1) | | Principal Occupations During the Past Five Years and
Other Directorships (2) |
| INTERESTED TRUSTEE | | | | |
David D. Horn (3) (born 6/07/41) | | Trustee | | April 1986 | | Private investor; Sun Life Assurance Company of Canada, Senior Vice President and General Manager for the United States (until 1997); Director (until March 2004) |
| | |
| INDEPENDENT TRUSTEES | | | | |
J. Kermit Birchfield (born 1/08/40) | | Chairman | | May 1997 | | Consultant; Century Partners, Inc. (investments), Director; Displaytech, Inc. (technology), Director; Dessin Fournir LLC (furniture manufacturer), Director (2005 to present); Intermountain Gas Company, Inc. & Intermountain Industries, Inc. (oil & gas exploration and production), Director; Site Watch LLC (software to monitor oil tanks), Managing Director (2006 to present); Juridica Investments (fund investing in judicial matters), Director (2007 to present); HPSC, Inc. (medical financing), Director (until January 2004) |
| | | |
Robert C. Bishop (born 1/13/43) | | Trustee | | May 2001 | | AutoImmune, Inc. (pharmaceutical product development), Chairman, President and Chief Executive Officer; Caliper Life Sciences Corp. (laboratory analytical instruments), Director; Millipore Corporation (purification/filtration products), Director; Waterstreet Capital (leverage buyouts), Advisory Board (August 2006 to present); Optobionics Corporation (ophthalmic devices), Director (2002 to 2007) |
| | | |
Frederick H. Dulles (born 3/12/42) | | Trustee | | May 2001 | | Ten State International Law PLLC (law firm), Of Counsel (since 2006); Prudential Carolina Real Estate, (real estate), Broker (since 2006); Free Enterprise Foundation, Inc. (research institute), Director & Secretary (until 2008); Disher, Hamrick & Myers Residential, Inc. (real estate) Broker (2005 until 2006); Frederick H. Dulles law practice (until 2006); Ten State Street LLP (law firm), Member (until 2005) |
| | | |
Marcia A. Kean (born 6/30/48) | | Trustee | | April 2005 | | Feinstein Kean Healthcare (consulting), Chief Executive Officer |
| | | |
Ronald G. Steinhart (born 6/15/40) | | Trustee | | May 2001 | | Private investor; Penske Automotive Group (automotive retailer), Director; Animal Health International, Inc. (animal health products), Director (since 2007); Texas Industries (concrete/aggregates/cement), Director (since 2007); Penson Worldwide, Inc. (securities clearance), Director (since 2006); Carreker Corporation (technology consulting) Director (until 2005); Prentiss Properties Trust (real estate investment trust), Director (until 2006) |
| | | |
Haviland Wright (born 7/21/48) | | Trustee | | May 2001 | | Profitability of Hawaii (software), Chief Development Officer (since December 2008); Elixir Technologies Corporation (software) Director (since 2005); Nano Loa Inc. (liquid crystal displays), Director |
| | |
| TRUSTEE EMERITUS | | | | |
Samuel Adams (born 10/19/25) | | Trustee Emeritus | | | | Retired; K&L Gates LLP (law firm), Of Counsel |
| | |
| OFFICERS | | | | |
Maria F. Dwyer (4) (born 12/01/58) | | President | | November 2005 | | Massachusetts Financial Services Company, Executive Vice President and Chief Regulatory Officer (since March 2004) Chief Compliance Officer (since December 2006); Fidelity Management & Research Company, Vice President (prior to March 2004); Fidelity Group of Funds, President and Treasurer (until March 2004) |
| | | |
Christopher R. Bohane (4) (born 1/18/74) | | Assistant Secretary and Assistant Clerk | | July 2005 | | Massachusetts Financial Services Company, Vice President and Senior Counsel |
| | | |
John M. Corcoran (4) (born 4/13/65) | | Treasurer | | October 2008 | | Massachusetts Financial Services Company, Senior Vice President (since October 2008); State Street Bank and Trust (financial services provider), Senior Vice President, (until September 2008) |
| | | |
Ethan D. Corey (4) (born 11/21/63) | | Assistant Secretary and Assistant Clerk | | July 2005 | | Massachusetts Financial Services Company, Senior Vice President and Associate General Counsel (since 2004); Dechert LLP (law firm), Counsel (prior to December 2004) |
| | | |
David L. DiLorenzo (4) (born 8/10/68) | | Assistant Treasurer | | July 2005 | | Massachusetts Financial Services Company, Vice President (since June 2005); JP Morgan Investor Services, Vice President (until June 2005) |
| | | |
Timothy M. Fagan (4) (born 7/10/68) | | Assistant Secretary and Assistant Clerk | | September 2005 | | Massachusetts Financial Services Company, Vice President and Senior Counsel (since September 2005); John Hancock Advisers, LLC, Vice President, Senior Attorney and Chief Compliance Officer (until August 2005) |
22
Trustees and Officers – continued
| | | | | | |
Name, Date of Birth | | Position(s) Held
with Fund | | Trustee/Officer
Since (1) | | Principal Occupations During the Past Five Years and
Other Directorships (2) |
Mark D. Fischer (4) (born 10/27/70) | | Assistant Treasurer | | July 2005 | | Massachusetts Financial Services Company, Vice President (since May 2005); JP Morgan Investment Management Company, Vice President (until May 2005) |
| | | |
Robyn L. Griffin (born 7/04/75) | | Assistant Independent Chief Compliance Officer | | August 2008 | | Griffin Compliance LLC (provider of compliance services), Principal (since August 2008); State Street Corporation (financial services provider), Mutual Fund Administration Assistant Vice President (October 2006 – July 2008); Liberty Mutual Group (insurance), Personal Market Assistant Controller (April 2006 – October 2006); Deloitte & Touche LLP (professional services firm), Senior Manager (prior to April 2006) |
| | | |
Brian E. Langenfeld (4) (born 3/07/73) | | Assistant Secretary and Assistant Clerk | | May 2006 | | Massachusetts Financial Services Company, Vice President and Senior Counsel (since May 2006); John Hancock Advisers, LLC, Assistant Vice President and Counsel (until April 2006) |
| | | |
Ellen Moynihan (4) (born 11/13/57) | | Assistant Treasurer | | May 1997 | | Massachusetts Financial Services Company, Senior Vice President |
| | | |
Susan S. Newton (4) (born 3/07/50) | | Assistant Secretary and Assistant Clerk | | May 2005 | | Massachusetts Financial Services Company, Senior Vice President and Associate General Counsel (since April 2005); John Hancock Advisers, LLC, Senior Vice President, Secretary and Chief Legal Officer (until April 2005) |
| | | |
Susan A. Pereira (4) (born 11/05/70) | | Assistant Secretary and Assistant Clerk | | July 2005 | | Massachusetts Financial Services Company, Vice President and Senior Counsel (since June 2004); Bingham McCutchen LLP (law firm), Associate (until June 2004) |
| | | |
Mark N. Polebaum (4) (born 5/01/52) | | Secretary and Clerk | | February 2006 | | Massachusetts Financial Services Company, Executive Vice President, General Counsel and Secretary (since January 2006); Wilmer Cutler Pickering Hale and Dorr LLP (law firm), Partner (until January 2006) |
| | | |
Frank L. Tarantino (born 3/07/44) | | Independent Chief Compliance Officer | | September 2004 | | Tarantino LLC (provider of compliance services), Principal (since June 2004); CRA Business Strategies Group (consulting services), Executive Vice President (until June 2004) |
| | | |
Richard S. Weitzel (4) (born 7/16/70) | | Assistant Secretary and Assistant Clerk | | October 2007 | | Massachusetts Financial Services Company, Vice President and Assistant General Counsel (since 2004); Massachusetts Department of Business and Technology, General Counsel (until April 2004) |
| | | |
James O. Yost (4) (born 6/12/60) | | Assistant Treasurer | | April 1992 | | Massachusetts Financial Services Company, Senior Vice President |
| (1) | Date first appointed to serve as Trustee/Officer of an MFS fund or a Compass variable account. Each Trustee has served continuously since appointment. |
| (2) | Directorships or trusteeships of companies required to report to the Securities and Exchange Commission (i.e., “public companies”). |
| (3) | “Interested person” of the Trust, within the meaning of the Investment Company Act of 1940 (referred to as the 1940 Act), which is the principal federal law governing investment companies like the Trust, as a result of position with Sun Life of Canada (U.S.). The address of Sun Life of Canada (U.S.) is One Sun Life Executive Park, Wellesley Hills, Massachusetts 02481. |
| (4) | “Interested person” of MFS within the meaning of the 1940 Act. The address of MFS is 500 Boylston Street, Boston, Massachusetts 02116. |
The Trust does not hold annual meetings for the purpose of electing Trustees, and Trustees are not elected for fixed terms. Each Trustee and officer holds office until his or her successor is chosen and qualified, or until his or her earlier death, resignation, retirement or removal.
All Trustees currently serve as Trustees of the Trust and have served in that capacity since originally elected or appointed. All of the Trustees are also Managers of the Compass Variable Accounts. The executive officers of the Trust hold similar offices for the Compass Variable Accounts and other funds in the MFS fund complex. As of January 1, 2009, each Trustee serves as a Trustee or Manager of 35 Accounts/Funds.
The Statement of Additional Information contains further information about the Trustees and is available without charge upon request by calling 1-800-752-7215.
| | |
Investment Adviser
Massachusetts Financial Services Company 500 Boylston Street, Boston, MA 02116-3741 | | Custodian State Street Bank and Trust 1 Lincoln Street, Boston, MA 02111-2900 |
Distributor
MFS Fund Distributors, Inc. 500 Boylston Street, Boston, MA 02116-3741 | | Independent Registered Public Accounting Firm Deloitte & Touche LLP 200 Berkeley Street, Boston, MA 02116 |
Portfolio Manager Telis Bertsekas | | |
23
BOARD REVIEW OF INVESTMENT ADVISORY AGREEMENT
The Investment Company Act of 1940 requires that both the full Board of Trustees and a majority of the non-interested (“independent”) Trustees, voting separately, annually approve the continuation of the investment advisory agreement between MFS Variable Insurance Trust II (the “Trust”) and Massachusetts Financial Services Company (“MFS”) on behalf of the Fund. The Trustees consider matters bearing on the Fund and the advisory arrangements at their meetings throughout the year, including a review of performance data at each regular meeting. In addition, the independent Trustees met in May and again in July 2008 (“contract review meetings”) for the specific purpose of considering whether to approve the continuation of the investment advisory agreement for the Fund. The independent Trustees were assisted in their evaluation of the investment advisory agreement by independent legal counsel, from whom they received separate legal advice and with whom they met separately from MFS management during various contract review meetings. The independent Trustees were also assisted in this process by the Fund’s Independent Chief Compliance Officer, a full-time senior officer appointed by and reporting to the independent Trustees.
In connection with their deliberations, the Trustees, including the independent Trustees, considered such information and factors as they believed, in light of the legal advice furnished to them and their own business judgment, to be relevant. The investment advisory agreement was considered separately for the Fund, although the Trustees also took into account the common interests of all Funds in the Trust in their review. As described below, the Trustees considered the nature, quality, and extent of the various investment advisory, administrative, and shareholder services performed by MFS under the existing investment advisory agreement and other arrangements with the Trust.
In connection with their contract review meetings, the Trustees received and relied upon materials which included, among other items: (i) information provided by Lipper Inc. on the investment performance of the Fund for various time periods ended December 31, 2007, compared to the investment performance of a group of funds with substantially similar investment classifications/objectives (the “Lipper performance universe”), (ii) information provided by Lipper Inc. on the Fund’s advisory fees and other expenses compared to the advisory fees and other expenses of comparable funds identified by Lipper (the “Lipper expense group”), (iii) information provided by MFS on the advisory fees of comparable portfolios of its other clients, including institutional separate account and other clients, (iv) information as to whether expense waivers, reimbursements or fee “breakpoints” are observed for the Fund, (v) information regarding MFS’ financial results and financial condition, including MFS’ and certain of its affiliates’ estimated profitability from services performed for the Fund, (vi) MFS’ views regarding the outlook for the mutual fund industry and its strategic business plans, (vii) descriptions of various functions performed by MFS for the Trust, such as compliance monitoring and portfolio trading practices, and (viii) information regarding the overall organization of MFS, including information about MFS’ senior management and other personnel providing investment advisory, administrative and other services to the Fund. The comparative performance, fee and expense information prepared and provided by Lipper Inc. was not independently verified, and the independent Trustees did not independently verify any information provided to them by MFS.
The Trustees’ conclusion as to the continuation of the investment advisory agreement was based on comprehensive consideration of all information provided to the Trustees and not the result of any single factor. Some of the factors that figured particularly in the Trustees’ deliberations are described below for the Fund, while individual Trustees may have given different weight to various factors and evaluated the information presented as a whole differently than another Trustee. The Trustees recognized that the fee arrangements for the Fund reflect years of review and discussion between the independent Trustees and MFS, that certain aspects of such arrangements may receive greater scrutiny in some years than others, and that the Trustees’ conclusions may be based, in part, on their consideration of these same arrangements during the course of the year and in prior years.
Based on information provided by Lipper Inc., the Trustees compared the Fund’s total return investment performance to the performance of a peer group of funds over various time periods. The Trustees placed particular emphasis on the total return performance of the Fund’s Initial Class shares in comparison to the performance of funds in its Lipper performance universe over the one-, three- and five-year periods. The Trustees did not rely on performance results for more recent periods, including those shown elsewhere in this report.
The Trustees noted the performance of the Fund’s Initial Class shares was in the 2nd quintile relative to the other funds in the Lipper Classification Index for the one-year period (the 1st quintile being the best performers and the 5th quintile being the worst performers). The total return performance of the Fund was in the 1st quintile for the three-year period and in the 2nd quintile for the five-year period ended December 31, 2007, relative to the Lipper performance universe. Based on the nature and quality of services provided by MFS, the Board of Trustees concluded that the Fund’s performance was satisfactory.
In the course of their deliberations, the Trustees took into account information provided by MFS during contract review meetings, as well as during investment review meetings conducted with portfolio management personnel during the course of the year.
24
Board Review of Investment Advisory Agreement – continued
In assessing the reasonableness of the Fund’s advisory fee, the Trustees considered, among other information, the Fund’s advisory fee and the total expense ratio of the Fund’s Initial Class shares as a percentage of average daily net assets, compared to the advisory fee and total expense ratios of its peer group of funds based on information provided by Lipper Inc. The Trustees also considered the advisory fees charged by MFS to institutional accounts. In comparing these fees, the Trustees considered the generally broader scope of services provided by MFS to the Trust than those provided to institutional accounts. The Trustees also considered the higher demands placed on MFS’ investment personnel and trading infrastructure as a result of the daily cash in-flows and out-flows of the Fund, and the impact on MFS and related expenses due to the more extensive regulatory regime to which the Fund is subject, compared to institutional accounts.
In considering the fees, the Trustees noted from the Lipper data that the Fund’s effective advisory fee rate was below the median and total expense ratio was at the median of such fees and expenses of funds in the Lipper expense group. In addition, the Trustees accepted MFS’ offer to continue the expense limitation for the Fund. The Trustees further concluded that the existing breakpoint was sufficient to allow the Fund to benefit from economies of scale as its assets grow. The Trustees concluded that the fees were reasonable in light of the nature and quality of services provided.
The Trustees also considered information prepared by MFS relating to its costs and profits with respect to the Fund and other investment companies and accounts advised by MFS, as well as MFS’ methodologies used to determine and allocate its costs to the Fund and other accounts and products for purposes of estimating profitability.
After reviewing these and other factors described below, the Trustees concluded that the advisory fees charged to the Fund represent reasonable compensation in light of the nature and quality of the services being provided by MFS.
In addition, the Trustees considered MFS’ resources and related efforts to continue to retain, attract and motivate capable personnel to serve the Fund. The Trustees also considered the financial resources of MFS and its parent, Sun Life Financial Inc. The Trustees further considered any advantages and possible disadvantages of having an adviser which also serves other investment companies as well as institutional accounts.
The Trustees also considered the nature, quality, cost, and extent of administrative, transfer agency, and distribution services provided to the Fund by MFS and its affiliates under agreements and plans other than the investment advisory agreement, including the 12b-1 fees the Fund pays to MFS Fund Distributors, Inc., an affiliate of MFS. The Trustees also considered the nature, extent and quality of certain other services MFS performs or arranges on the Fund’s behalf, which may include securities lending programs, directed expense payment programs, class action recovery programs, and MFS’ interaction with third-party service providers, principally custodians and sub-custodians. The Trustees concluded that the various non-advisory services provided by MFS and its affiliates on behalf of the Fund were satisfactory. The Trustees also considered the benefits to MFS from the use of the Fund’s portfolio brokerage commissions to pay for research and other similar services and various other factors. Additionally, the Trustees considered so-called “fall-out benefits” to MFS such as reputational value derived from serving as investment manager to the Trust, and determined that any such benefits derived by MFS were reasonable and fair.
Based on their evaluation of factors that they deemed to be material, including those factors described above, the Board of Trustees, including a majority of the independent Trustees, concluded that the investment advisory agreement should be continued for an additional one-year period, commencing September 1, 2008.
A discussion regarding the Board’s most recent review and renewal of the fund’s Investment Advisory Agreement with MFS is available by clicking on the fund’s name under “Variable Insurance Portfolios-VIT II” in the “Products & Performance” section on the MFS Web site (mfs.com).
25
PROXY VOTING POLICIES AND INFORMATION
A general description of the MFS funds’ proxy voting policies and procedures is available without charge, upon request, by calling
1-800-225-2606, by visiting the Proxy Voting section of mfs.com or by visiting the SEC’s Web site at http://www.sec.gov.
Information regarding how the fund voted proxies relating to portfolio securities during the most recent twelve-month period ended June 30 is available without charge by visiting the Proxy Voting section of mfs.com or by visiting the SEC’s Web site at http://www.sec.gov.
QUARTERLY PORTFOLIO DISCLOSURE
The fund will file a complete schedule of portfolio holdings with the Securities and Exchange Commission (the Commission) for the first and third quarters of each fiscal year on Form N-Q. The fund’s Form N-Q may be reviewed and copied at the:
Public Reference Room
Securities and Exchange Commission
100 F Street, NE, Room 1580
Washington, D.C. 20549
Information on the operation of the Public Reference Room may be obtained by calling the Commission at 1-800-SEC-0330. The fund’s Form N-Q is available on the EDGAR database on the Commission’s Internet Web site at http://www.sec.gov, and copies of this information may be obtained, upon payment of a duplicating fee, by electronic request at the following e-mail address: publicinfo@sec.gov or by writing the Public Reference Section at the above address.
26
MFS® PRIVACY NOTICE
Privacy is a concern for every investor today. At MFS Investment Management® and the MFS funds, we take this concern very seriously. We want you to understand our policies about the investment products and services that we offer, and how we protect the nonpublic personal information of investors who have a direct relationship with us and our wholly owned subsidiaries.
Throughout our business relationship, you provide us with personal information. We maintain information and records about you, your investments, and the services you use. Examples of the nonpublic personal information we maintain include
| | Ÿ | | data from investment applications and other forms |
| | Ÿ | | share balances and transactional history with us, our affiliates, or others |
| | Ÿ | | facts from a consumer reporting agency |
We do not disclose any nonpublic personal information about our customers or former customers to anyone, except as permitted by law. We may share nonpublic personal information with third parties or certain of our affiliates in connection with servicing your account or processing your transactions. We may share information with companies or financial institutions that perform marketing services on our behalf or with other financial institutions with which we have joint marketing arrangements, subject to any legal requirements.
Authorization to access your nonpublic personal information is limited to appropriate personnel who provide products, services, or information to you. We maintain physical, electronic, and procedural safeguards to help protect the personal information we collect about you.
If you have any questions about the MFS privacy policy, please call 1-800-225-2606 any business day between 8 a.m. and 8 p.m. Eastern time.
Note: If you own MFS products or receive MFS services in the name of a third party such as a bank or broker-dealer, their privacy policy may apply to you instead of ours.
27


MFS® MASSACHUSETTS INVESTORS GROWTH STOCK PORTFOLIO
The report is prepared for the general information of contract owners. It is authorized for distribution to prospective investors only when preceded or accompanied by a current prospectus.
NOT FDIC INSURED Ÿ MAY LOSE VALUE Ÿ NO BANK GUARANTEE Ÿ NOT A DEPOSIT Ÿ NOT INSURED BY ANY FEDERAL GOVERNMENT AGENCY OR NCUA/NCUSIF
LETTER FROM THE CEO

Dear Contract Owners:
The market downturns and economic setbacks of late probably rank among the worst financial declines most of us have experienced. Inevitably, people may be questioning their commitment to investing. Still, it is important to remember that downturns are an inescapable part of the business cycle. Such troughs have been seen before, and if we can use history as a guide, market recoveries typically have followed.
Recent events have clearly shown us the value of certain types of investments. In this environment, two of the hallmarks of mutual funds — transparency and liquidity — have become critically important. Unlike some other types of investments, the operations of mutual funds are relatively transparent to their shareholders. With their daily redemption feature, mutual funds also generally provide easy, convenient access to one’s money. Through these recent market upheavals, this level of liquidity enhanced the ability of mutual fund investors to respond and modify their investments as they and their advisors saw fit — a flexibility that those in less liquid investments simply did not have at their disposal.
At MFS® we take particular pride in how well mutual funds can serve investors because we invented the mutual fund in the United States. Established in 1924, Massachusetts Investors Trust was the nation’s first fund. Recent market events only reinforce what we have learned through 85 years — that mutual funds provide unique features that are important to investors in any type of market climate.
Respectfully,

Robert J. Manning
Chief Executive Officer and Chief Investment Officer
MFS Investment Management®
February 17, 2009
The opinions expressed in this letter are subject to change, may not be relied upon for investment advice, and no forecasts can be guaranteed.
Before investing, consider the fund’s investment objectives, risks, charges, and expenses. For a prospectus containing this and other information, contact your investment professional or view online. Read it carefully.
MFS Fund Distributors, Inc., 500 Boylston Street, Boston, MA 02116
1
PORTFOLIO COMPOSITION
Portfolio structure

| | |
| Top ten holdings | | |
| Oracle Corp. | | 4.1% |
| Cisco Systems Inc. | | 3.1% |
| CVS Caremark Corp. | | 3.0% |
| Accenture Ltd. | | 2.8% |
| United Technologies Corp. | | 2.8% |
| Danaher Corp. | | 2.8% |
| PepsiCo, Inc. | | 2.7% |
| Google, Inc., ”A” | | 2.6% |
| Genzyme Corp. | | 2.6% |
| MasterCard, Inc., ”A” | | 2.3% |
| | |
| Equity sectors | | |
| Technology | | 23.6% |
| Health Care | | 18.9% |
| Special Products & Services | | 10.1% |
| Consumer Staples | | 9.7% |
| Energy | | 8.1% |
| Retailing | | 7.6% |
| Industrial Goods & Services | | 7.0% |
| Financial Services | | 4.3% |
| Leisure | | 3.5% |
| Basic Materials | | 3.4% |
| Utilities & Communications | | 1.4% |
| Transportation | | 0.5% |
Percentages are based on net assets as of 12/31/08.
The portfolio is actively managed and current holdings may be different.
2
MANAGEMENT REVIEW
Summary of Results
For the twelve months ended December 31, 2008, Initial Class shares of the MFS Massachusetts Investors Growth Stock Portfolio (the “fund”) provided a total return of –37.22%, while Service Class shares of the fund provided a total return of –37.35%. These compare with a return of –38.44% for the fund’s benchmark, the Russell 1000 Growth Index.
Market Environment
The U.S. economy and financial markets experienced significant deterioration and extraordinary volatility over the reporting period. U.S. economic growth slowed significantly, despite the short-term bounce from the second quarter fiscal stimulus. Strong domestic headwinds included accelerated deterioration in the housing market, anemic corporate investment, a rapidly declining job market, and a much tighter credit environment. During the period, a seemingly continuous series of tumultuous financial events hammered markets, including: the distressed sale of failing Bear Stearns to JPMorgan, the conservatorship of Government Sponsored Enterprises (GSEs) Fannie Mae and Freddie Mac, the bankruptcy of investment bank Lehman Brothers, the Federal Reserve Bank’s complex intervention of insurance company American International Group (AIG), the nationalization of several large European banks, the failure of Washington Mutual, and the distressed sale of Wachovia. As a result of this barrage of turbulent news, global equity markets pushed significantly lower and credit markets witnessed the worst dislocation since the beginning of the credit crisis. Though conditions improved towards the end of the period, the state of financial and macroeconomic dislocation remained severe.
While reasonably resilient during the first half of the period, the global economy and financial system increasingly experienced considerable negative spillovers from the U.S. slowdown. Not only did Europe and Japan show obvious signs of economic softening, the more powerful engine of global growth – emerging markets – also displayed weakening dynamics.
During the reporting period, the U.S. Federal Reserve Board cut interest rates aggressively and introduced a multitude of new lending facilities to alleviate ever-tightening credit markets, while the U.S. federal government moved quickly to design and implement a meaningful fiscal stimulus package. Although several other global central banks also cut rates, the dilemma of rising energy and food prices heightened concerns among central bankers that inflationary expectations might become unhinged despite weaker growth. Only later in the reporting period did slowing global growth result in a very precipitous decline in commodity prices, which significantly eased inflation and inflationary expectations. As inflationary concerns diminished in the face of global deleveraging, and equity and credit markets deteriorated more sharply, a coordinated rate cut marked the beginning of much more aggressive easing by the major global central banks.
Contributors to Performance
Security selection in the industrial goods and services sector contributed to the fund’s performance relative to the Russell 1000 Growth Index. Holdings of facilities maintenance products supplier W.W. Grainger were among the fund’s top relative contributors. The company benefited from its positive quarterly results which exceeded expectations as well as continued strength in the growth of the maintenance, repair, and operations market despite weakness in the industrial economy.
A combination of stock selection and an underweighted position in the energy sector also boosted relative results. No individual securities within this sector were among the fund’s top relative contributors for the reporting period.
The fund’s holdings of several individual securities in the health care sector had a positive impact on relative performance. These included pharmaceutical and diagnostic company Roche Holding (aa), diversified medical products maker Johnson & Johnson, and global biotech company Genzyme. Shares of Genzyme fared better than the sector overall due to strong sales growth in its drug products, particularly a significant jump in the latter part of the reporting period in sales of its rare genetic disorder drug Myozyme. The fund’s positioning in pharmaceutical company Wyeth, which outperformed the benchmark over the period, also benefited relative results.
Elsewhere, the fund’s holdings of food companies, General Mills (g) and Nestle (Switzerland) (aa), enterprise software products maker Oracle, and contract semiconductor manufacturer Taiwan Semiconductor (aa) aided relative returns.
The fund’s cash position was also a contributor to relative performance. The fund holds cash to buy new holdings and to provide liquidity. In a period when equity markets declined, as measured by the fund’s benchmark, holding cash helped performance versus the benchmark, which has no cash position.
Detractors from Performance
Stock selection in the leisure sector held back relative performance. Within this sector, cruise line operator Royal Caribbean Cruises (aa)(g) was the top relative detractor. Shares of Royal Caribbean suffered as the company continued to deal with the impact of high fuel costs. Not owning strong-performing fast food giant McDonald’s also hindered relative results.
In the retailing sector, security selection dampened relative returns. Not owning strong-performing retail giant Wal-Mart hurt relative performance as the stock turned in strong performance over the reporting period.
3
Management Review – continued
Security selection in the health care sector also hurt relative results. The fund’s positioning in eye care products maker Advanced Medical Optics (g), whose stock price significantly declined in the latter part of the reporting period, detracted from relative performance. Shares of Advanced Medical Optics suffered due to a weaker revenue outlook as a result of weakness in its U.S. Lasik procedures. Demand for this relatively costly elective procedure is expected to decline during this period of economic weakness. In addition, the stock was pressured by a previously announced recall of its lens solutions products. Not holding medical products maker Abbott Laboratories and strong-performing biotech firm Gilead Sciences also held back relative returns.
Elsewhere, oilfield services provider Weatherford International (g), Canadian wireless solutions provider Research In Motion (aa), and German stock exchange Deutsche Boerse (aa) were among the fund’s top relative detractors. Not owning tobacco company Philip Morris International, which outperformed the benchmark over the reporting period, also dampened relative results.
Respectfully,
Jeffrey Constantino
Portfolio Manager
Note to Shareholders: Effective November 20, 2008, Stephen Pesek and Maureen Pettirossi are no longer portfolio managers of the fund.
| (aa) | | Security is not a benchmark constituent. |
| (g) | | Security was not held in the portfolio at period end. |
The views expressed in this report are those of the portfolio manager only through the end of the period of the report as stated on the cover and do not necessarily reflect the views of MFS or any other person in the MFS organization. These views are subject to change at any time based on market or other conditions, and MFS disclaims any responsibility to update such views. These views may not be relied upon as investment advice or an indication of trading intent on behalf of any MFS portfolio. References to specific securities are not recommendations of such securities, and may not be representative of any MFS portfolio’s current or future investments.
4
PERFORMANCE SUMMARY THROUGH 12/31/08
The following chart illustrates the historical performance of the fund in comparison to its benchmark(s). Benchmark comparisons are unmanaged; do not reflect any fees or expenses; and cannot be invested in directly. The performance of other share classes will be greater than or less than that of the class depicted below. (See Notes to Performance Summary.)
Performance data shown represents past performance and is no guarantee of future results. Investment return and principal value fluctuate so your units, when sold, may be worth more or less than the original cost; current performance may be lower or higher than quoted. The performance shown does not reflect the deduction of taxes, if any, that a contract holder would pay on fund distributions or the redemption of contract units. The returns for the fund shown also do not reflect the deduction of expenses associated with variable products, such as mortality and expense risk charges, separate account charges, and sales charges imposed by the insurance company separate accounts. Such expenses would reduce the overall returns shown.
Growth of a hypothetical $10,000 investment
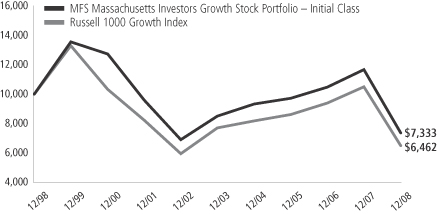
Total rates of return through 12/31/08
Average Annual Total Returns
| | | | | | | | | | | | |
| | | Share class | | Class inception date | | 1-yr | | 5-yr | | 10-yr | | |
| | | Initial Class | | 5/06/98 | | (37.22)% | | (2.92)% | | (3.06)% | | |
| | | Service Class | | 8/24/01 | | (37.35)% | | (3.13)% | | (3.22)% | | |
Comparative Benchmark
| | | | | | | | | | | | |
| | | Russell 1000 Growth Index (f) | | (38.44)% | | (3.42)% | | (4.27)% | | |
| (f) | Source: FactSet Research Systems Inc. |
Benchmark Definition
Russell 1000 Growth Index – constructed to provide a comprehensive barometer for growth securities in the large-cap segment of the U.S. equity universe. Companies in this index generally have higher price-to-book ratios and higher forecasted growth values.
It is not possible to invest directly in an index.
Notes to Performance Summary
Performance for the Service Class includes the performance of the fund’s Initial Class for periods prior to their offering. Because Service Class expenses are higher than those of Initial Class, performance shown for Service Class is higher than it would have been had it been offered for the entire period. Performance has not been adjusted to take into account differences in class specific operating expenses (such as Rule 12b-1 fees). Please see the prospectus for additional information about performance and expenses.
Performance results reflect any applicable expense subsidies and waivers in effect during the periods shown. Without such subsidies and waivers the fund’s performance results would be less favorable. Please see the prospectus for complete details. All results are historical and assume the reinvestment of any dividends and capital gains distributions.
From time to time the fund may receive proceeds from litigation settlements, without which performance would be lower.
5
EXPENSE TABLE
Fund Expenses Borne by the Contract Holders During the Period,
July 1, 2008 through December 31, 2008
As a contract holder of the fund, you incur ongoing costs, including management fees; distribution (12b-1) fees; and other fund expenses. This example is intended to help you understand your ongoing costs (in dollars) of investing in the fund and to compare these costs with the ongoing costs of investing in other mutual funds.
The example is based on an investment of $1,000 invested at the beginning of the period and held for the entire period July 1, 2008 through December 31, 2008.
Actual Expenses
The first line for each share class in the following table provides information about actual account values and actual expenses. You may use the information in this line, together with the amount you invested, to estimate the expenses that you paid over the period. Simply divide your account value by $1,000 (for example, an $8,600 account value divided by $1,000 = 8.6), then multiply the result by the number in the first line under the heading entitled “Expenses Paid During Period” to estimate the expenses you paid on your account during this period.
Hypothetical Example for Comparison Purposes
The second line for each share class in the following table provides information about hypothetical account values and hypothetical expenses based on the fund’s actual expense ratio and an assumed rate of return of 5% per year before expenses, which is not the fund’s actual return. The hypothetical account values and expenses may not be used to estimate the actual ending account balance or expenses you paid for the period. You may use this information to compare the ongoing costs of investing in the fund and other funds. To do so, compare this 5% hypothetical example with the 5% hypothetical examples that appear in the shareholder reports of the other funds.
Please note that the expenses shown in the table are meant to highlight the fund’s ongoing costs only and do not take into account the fees and expenses imposed under the variable contracts through which your investment in the fund is made. Therefore, the second line for each share class in the table is useful in comparing ongoing costs associated with an investment in vehicles (such as the fund) which fund benefits under variable annuity and variable life insurance contracts and to qualified pension and retirement plans only, and will not help you determine the relative total costs of investing in the fund through variable annuity and variable life insurance contracts. If the fees and expenses imposed under the variable contracts were included, your costs would have been higher.
| | | | | | | | | | |
| Share Class | | | | Annualized
Expense Ratio | | Beginning
Account Value
7/01/08 | | Ending
Account Value
12/31/08 | | Expenses Paid
During Period (p)
7/01/08-12/31/08 |
| Initial Class | | Actual | | 0.83% | | $1,000.00 | | $693.92 | | $3.53 |
| | Hypothetical (h) | | 0.83% | | $1,000.00 | | $1,020.96 | | $4.22 |
| Service Class | | Actual | | 1.08% | | $1,000.00 | | $693.49 | | $4.60 |
| | Hypothetical (h) | | 1.08% | | $1,000.00 | | $1,019.71 | | $5.48 |
| (h) | 5% class return per year before expenses. |
| (p) | Expenses paid is equal to each class’ annualized expense ratio, as shown above, multiplied by the average account value over the period, multiplied by the number of days in the period, divided by the number of days in the year. |
6
PORTFOLIO OF INVESTMENTS – 12/31/08
The Portfolio of Investments is a complete list of all securities owned by your fund. It is categorized by broad-based asset classes.
| | | | | |
| Issuer | | Shares/Par | | Value ($) |
| | | | | |
| COMMON STOCKS – 98.1% | | | | | |
| Aerospace – 2.8% | | | | | |
| United Technologies Corp. | | 107,190 | | $ | 5,745,384 |
| | | | | |
| Alcoholic Beverages – 1.3% | | | | | |
| Diageo PLC | | 186,680 | | $ | 2,596,818 |
| | | | | |
| Apparel Manufacturers – 2.8% | | | | | |
| LVMH Moet Hennessy Louis Vuitton S.A. | | 39,490 | | $ | 2,653,180 |
| NIKE, Inc., “B” | | 59,670 | | | 3,043,170 |
| | | | | |
| | | | $ | 5,696,350 |
| | | | | |
| Biotechnology – 2.6% | | | | | |
| Genzyme Corp. (a) | | 79,560 | | $ | 5,280,397 |
| | | | | |
| Broadcasting – 2.7% | | | | | |
| Grupo Televisa S.A., ADR | | 95,690 | | $ | 1,429,609 |
| Omnicom Group, Inc. | | 152,260 | | | 4,098,839 |
| | | | | |
| | | | $ | 5,528,448 |
| | | | | |
| Brokerage & Asset Managers – 1.3% | | | | | |
| Charles Schwab Corp. | | 67,900 | | $ | 1,097,943 |
| Deutsche Boerse AG | | 22,120 | | | 1,611,050 |
| | | | | |
| | | | $ | 2,708,993 |
| | | | | |
| Business Services – 10.1% | | | | | |
| Accenture Ltd. | | 175,470 | | $ | 5,753,661 |
| Amdocs Ltd. (a) | | 146,680 | | | 2,682,777 |
| Automatic Data Processing, Inc. | | 37,480 | | | 1,474,463 |
| Fidelity National Information Services, Inc. | | 60,530 | | | 984,823 |
| MasterCard, Inc., “A” | | 32,700 | | | 4,673,811 |
| Visa, Inc. | | 22,130 | | | 1,160,719 |
| Western Union Co. | | 283,090 | | | 4,059,511 |
| | | | | |
| | | | $ | 20,789,765 |
| | | | | |
| Cable TV – 0.8% | | | | | |
| Comcast Corp., “A” | | 98,440 | | $ | 1,661,667 |
| | | | | |
| Chemicals – 1.4% | | | | | |
| 3M Co. | | 51,160 | | $ | 2,943,746 |
| | | | | |
| Computer Software – 6.2% | | | | | |
| Microsoft Corp. | | 160,214 | | $ | 3,114,560 |
| Oracle Corp. (a) | | 476,490 | | | 8,448,168 |
| VeriSign, Inc. (a) | | 62,880 | | | 1,199,750 |
| | | | | |
| | | | $ | 12,762,478 |
| | | | | |
| Computer Software – Systems – 4.5% | | | | | |
| Apple, Inc. (a) | | 27,880 | | $ | 2,379,558 |
| EMC Corp. (a) | | 167,330 | | | 1,751,945 |
| Hewlett-Packard Co. | | 70,050 | | | 2,542,115 |
| International Business Machines Corp. | | 31,070 | | | 2,614,851 |
| | | | | |
| | | | $ | 9,288,469 |
| | | | | |
| Consumer Goods & Services – 3.8% | | | | | |
| Colgate-Palmolive Co. | | 53,290 | | $ | 3,652,497 |
| Procter & Gamble Co. | | 65,831 | | | 4,069,672 |
| | | | | |
| | | | $ | 7,722,169 |
| | | | | |
| | | | | |
| Issuer | | Shares/Par | | Value ($) |
| | | | | |
| COMMON STOCKS – continued | | | |
| Electrical Equipment – 4.2% | | | | | |
| Danaher Corp. | | 100,730 | | $ | 5,702,325 |
| W.W. Grainger, Inc. | | 36,570 | | | 2,883,179 |
| | | | | |
| | | | $ | 8,585,504 |
| | | | | |
| Electronics – 5.1% | | | | | |
| Intersil Corp., “A” | | 132,470 | | $ | 1,217,399 |
| KLA-Tencor Corp. | | 121,780 | | | 2,653,586 |
| National Semiconductor Corp. | | 254,170 | | | 2,559,492 |
| Samsung Electronics Co. Ltd., GDR | | 10,336 | | | 1,808,800 |
| Taiwan Semiconductor Manufacturing Co. Ltd., ADR | | 286,781 | | | 2,265,570 |
| | | | | |
| | | | $ | 10,504,847 |
| | | | | |
| Energy – Integrated – 5.5% | | | | | |
| Chevron Corp. | | 47,850 | | $ | 3,539,465 |
| Exxon Mobil Corp. | | 30,110 | | | 2,403,681 |
| Hess Corp. | | 47,510 | | | 2,548,436 |
| Marathon Oil Corp. | | 100,760 | | | 2,756,794 |
| | | | | |
| | | | $ | 11,248,376 |
| | | | | |
| Food & Beverages – 4.6% | | | | | |
| Groupe Danone | | 28,504 | | $ | 1,720,358 |
| Nestle S.A. | | 52,946 | | | 2,086,738 |
| PepsiCo, Inc. | | 102,160 | | | 5,595,303 |
| | | | | |
| | | | $ | 9,402,399 |
| | | | | |
| Food & Drug Stores – 3.0% | | | | | |
| CVS Caremark Corp. | | 212,725 | | $ | 6,113,717 |
| | | | | |
| General Merchandise – 0.5% | | | | | |
| Kohl’s Corp. (a) | | 30,780 | | $ | 1,114,236 |
| | | | | |
| Internet – 3.2% | | | | | |
| eBay, Inc. (a) | | 92,700 | | $ | 1,294,092 |
| Google, Inc., “A” (a) | | 17,490 | | | 5,380,799 |
| | | | | |
| | | | $ | 6,674,891 |
| | | | | |
| Major Banks – 3.0% | | | | | |
| Bank of New York Mellon Corp. | | 88,984 | | $ | 2,520,917 |
| State Street Corp. | | 95,080 | | | 3,739,496 |
| | | | | |
| | | | $ | 6,260,413 |
| | | | | |
| Medical & Health Technology & Services – 2.5% | | | |
| Medco Health Solutions, Inc. (a) | | 31,610 | | $ | 1,324,775 |
| Patterson Cos., Inc. (a) | | 120,850 | | | 2,265,938 |
| VCA Antech, Inc. (a) | | 76,040 | | | 1,511,675 |
| | | | | |
| | | | $ | 5,102,388 |
| | | | | |
| Medical Equipment – 7.8% | | | | | |
| DENTSPLY International, Inc. | | 49,100 | | $ | 1,386,584 |
| Medtronic, Inc. | | 145,230 | | | 4,563,127 |
| Stryker Corp. | | 46,940 | | | 1,875,253 |
| Thermo Fisher Scientific, Inc. (a) | | 99,860 | | | 3,402,230 |
| Waters Corp. (a) | | 73,500 | | | 2,693,775 |
| Zimmer Holdings, Inc. (a) | | 49,890 | | | 2,016,554 |
| | | | | |
| | | | $ | 15,937,523 |
| | | | | |
7
Portfolio of Investments – continued
| | | | | |
| Issuer | | Shares/Par | | Value ($) |
| | | | | |
| COMMON STOCKS – continued | | | |
| Metals & Mining – 0.8% | | | | | |
| BHP Billiton Ltd., ADR | | 38,590 | | $ | 1,655,511 |
| | | | | |
| Network & Telecom – 3.7% | | | | | |
| Cisco Systems, Inc. (a) | | 387,927 | | $ | 6,323,210 |
| Research in Motion Ltd. (a) | | 32,670 | | | 1,325,749 |
| | | | | |
| | | | $ | 7,648,959 |
| | | | | |
| Oil Services – 2.6% | | | | | |
| Halliburton Co. | | 150,550 | | $ | 2,736,999 |
| Noble Corp. | | 74,430 | | | 1,644,159 |
| Schlumberger Ltd. | | 23,940 | | | 1,013,380 |
| | | | | |
| | | | $ | 5,394,538 |
| | | | | |
| Personal Computers & Peripherals – 0.9% | | | |
| NetApp, Inc. (a) | | 126,230 | | $ | 1,763,433 |
| | | | | |
| Pharmaceuticals – 6.0% | | | | | |
| Allergan, Inc. | | 91,030 | | $ | 3,670,330 |
| Johnson & Johnson | | 49,500 | | | 2,961,585 |
| Merck KGaA | | 23,380 | | | 2,125,652 |
| Roche Holding AG | | 15,620 | | | 2,404,444 |
| Wyeth | | 32,990 | | | 1,237,455 |
| | | | | |
| | | | $ | 12,399,466 |
| | | | | |
| Specialty Chemicals – 1.2% | | | | | |
| Praxair, Inc. | | 42,190 | | $ | 2,504,398 |
| | | | | |
| Specialty Stores – 1.3% | | | | | |
| Staples, Inc. | | 147,510 | | $ | 2,643,379 |
| | | | | |
| | | | | |
| Issuer | | Shares/Par | | Value ($) |
| | | | | |
| COMMON STOCKS – continued | | | |
| Telecommunications – Wireless – 1.4% | | | |
| America Movil S.A.B. de C.V., “L”, ADR | | 50,110 | | $ | 1,552,909 |
| Rogers Communications, Inc., “B” | | 42,480 | | | 1,277,798 |
| | | | | |
| | | | $ | 2,830,707 |
| | | | | |
| Trucking – 0.5% | | | | | |
| United Parcel Service, Inc., “B” | | 18,400 | | $ | 1,014,944 |
| | | | | |
Total Common Stocks
(Identified Cost, $266,943,072) | | | | $ | 201,524,313 |
| | | | | |
| |
| MONEY MARKET FUNDS (v) – 1.4% | | | |
| MFS Institutional Money Market Portfolio, 0.37%, at Cost and Net Asset Value | | 2,901,808 | | $ | 2,901,808 |
| | | | | |
Total Investments
(Identified Cost, $269,844,880) | | | | $ | 204,426,121 |
| | | | | |
OTHER ASSETS, LESS
LIABILITIES – 0.5% | | | | | 1,010,551 |
| | | | | |
| Net Assets – 100.0% | | | | $ | 205,436,672 |
| | | | | |
| (a) | Non-income producing security. |
| (v) | Underlying fund that is available only to investment companies managed by MFS. The rate quoted is the annualized seven-day yield of the fund at period end. |
The following abbreviations are used in this report and are defined:
| ADR | | American Depository Receipt |
| GDR | | Global Depository Receipt |
See Notes to Financial Statements
8
FINANCIAL STATEMENTS | STATEMENT OF ASSETS AND LIABILITIES
This statement represents your fund’s balance sheet, which details the assets and liabilities comprising the total value of the fund.
| | | | | |
At 12/31/08 | | | | | |
Assets | | | | | |
Investments – | | | | | |
Non-affiliated issuers, at value (identified cost, $266,943,072) | | $201,524,313 | | | |
Underlying funds, at cost and value | | 2,901,808 | | | |
Total investments, at value (identified cost, $269,844,880) | | | | | $204,426,121 |
Receivable for investments sold | | $7,049,343 | | | |
Receivable for fund shares sold | | 9 | | | |
Interest and dividends receivable | | 255,347 | | | |
Receivable from investment adviser | | 16,990 | | | |
Other assets | | 11,556 | | | |
Total assets | | | | | $211,759,366 |
Liabilities | | | | | |
Payable for investments purchased | | $5,837,649 | | | |
Payable for fund shares reacquired | | 365,209 | | | |
Payable to affiliates | | | | | |
Management fee | | 8,248 | | | |
Distribution fees | | 798 | | | |
Administrative services fee | | 595 | | | |
Payable for trustees’ compensation | | 416 | | | |
Accrued expenses and other liabilities | | 109,779 | | | |
Total liabilities | | | | | $6,322,694 |
Net assets | | | | | $205,436,672 |
Net assets consist of | | | | | |
Paid-in capital | | $673,526,169 | | | |
Unrealized appreciation (depreciation) on investments and translation of assets and liabilities in foreign currencies | | (65,420,508 | ) | | |
Accumulated net realized gain (loss) on investments and foreign currency transactions | | (404,386,538 | ) | | |
Undistributed net investment income | | 1,717,549 | | | |
Net assets | | | | | $205,436,672 |
Shares of beneficial interest outstanding | | | | | 28,200,383 |
Initial Class shares | | | | | |
Net assets | | $145,857,762 | | | |
Shares outstanding | | 19,971,344 | | | |
Net asset value per share | | | | | $7.30 |
Service Class shares | | | | | |
Net assets | | $59,578,910 | | | |
Shares outstanding | | 8,229,039 | | | |
Net asset value per share | | | | | $7.24 |
See Notes to Financial Statements
9
FINANCIAL STATEMENTS | STATEMENT OF OPERATIONS
This statement describes how much your fund earned in investment income and accrued in expenses. It also describes any gains and/or losses generated by fund operations.
| | | | | | |
| Year ended 12/31/08 | | | | | | |
| Net investment income | | | | | | |
Income | | | | | | |
Dividends | | $4,610,079 | | | | |
Dividends from underlying funds | | 7,842 | | | | |
Interest | | 177,475 | | | | |
Foreign taxes withheld | | (183,649 | ) | | | |
Total investment income | | | | | $4,611,747 | |
Expenses | | | | | | |
Management fee | | $2,390,926 | | | | |
Distribution fees | | 225,740 | | | | |
Administrative services fee | | 97,041 | | | | |
Trustees’ compensation | | 44,860 | | | | |
Custodian fee | | 74,000 | | | | |
Shareholder communications | | 41,812 | | | | |
Auditing fees | | 48,357 | | | | |
Legal fees | | 6,717 | | | | |
Miscellaneous | | 42,910 | | | | |
Total expenses | | | | | $2,972,363 | |
Fees paid indirectly | | (364 | ) | | | |
Reduction of expenses by investment adviser | | (115,141 | ) | | | |
Net expenses | | | | | $2,856,858 | |
Net investment income | | | | | $1,754,889 | |
Realized and unrealized gain (loss) on investments and foreign currency transactions | | | | | | |
Realized gain (loss) (identified cost basis) | | | | | | |
Investment transactions: | | | | | | |
Non-affiliated issuers | | $(38,913,579 | ) | | | |
Foreign currency transactions | | (32,286 | ) | | | |
Net realized gain (loss) on investments and foreign currency transactions | | | | | $(38,945,865 | ) |
Change in unrealized appreciation (depreciation) | | | | | | |
Investments | | $(97,595,540 | ) | | | |
Translation of assets and liabilities in foreign currencies | | (1,765 | ) | | | |
Net unrealized gain (loss) on investments and foreign currency translation | | | | | $(97,597,305 | ) |
Net realized and unrealized gain (loss) on investments and foreign currency | | | | | $(136,543,170 | ) |
Change in net assets from operations | | | | | $(134,788,281 | ) |
See Notes to Financial Statements
10
FINANCIAL STATEMENTS | STATEMENTS OF CHANGES IN NET ASSETS
These statements describe the increases and/or decreases in net assets resulting from operations, any distributions, and any shareholder transactions.
| | | | | | |
For years ended 12/31 | | 2008 | | | 2007 | |
Change in net assets | | | | | | |
From operations | | | | | | |
Net investment income | | $1,754,889 | | | $1,781,176 | |
Net realized gain (loss) on investments and foreign currency transactions | | (38,945,865 | ) | | 47,761,500 | |
Net unrealized gain (loss) on investments and foreign currency translation | | (97,597,305 | ) | | (2,694,881 | ) |
Change in net assets from operations | | $(134,788,281 | ) | | $46,847,795 | |
Distributions declared to shareholders | | | | | | |
From net investment income | | | | | | |
Initial Class | | $(1,460,223 | ) | | $(1,191,441 | ) |
Service Class | | (312,695 | ) | | (118,578 | ) |
Total distributions declared to shareholders | | $(1,772,918 | ) | | $(1,310,019 | ) |
Change in net assets from fund share transactions | | $(86,534,238 | ) | | $(42,085,103 | ) |
Total change in net assets | | $(223,095,437 | ) | | $3,452,673 | |
Net assets | | | | | | |
At beginning of period | | 428,532,109 | | | 425,079,436 | |
At end of period (including undistributed net investment income of $1,717,549 and
$1,767,864, respectively) | | $205,436,672 | | | $428,532,109 | |
See Notes to Financial Statements
11
FINANCIAL STATEMENTS | FINANCIAL HIGHLIGHTS
The financial highlights table is intended to help you understand the fund’s financial performance for the past 5 years. Certain information reflects financial results for a single fund share. The total returns in the table represent the rate by which an investor would have earned (or lost) on an investment in the fund share class (assuming reinvestment of all distributions) held for the entire period.
| | | | | | | | | | | | | | | |
| Initial Class | | Years ended 12/31 | |
| | | 2008 | | | 2007 | | | 2006 | | | 2005 | | | 2004 | |
Net asset value, beginning of period | | $11.69 | | | $10.52 | | | $9.78 | | | $9.42 | | | $8.60 | |
| Income (loss) from investment operations | | | | | | | | | | | | | | | |
Net investment income (d) | | $0.06 | | | $0.05 | | | $0.03 | | | $0.01 | | | $0.04 | |
Net realized and unrealized gain (loss) on investments
and foreign currency | | (4.39 | ) | | 1.16 | | | 0.72 | | | 0.40 | | | 0.79 | |
Total from investment operations | | $(4.33 | ) | | $1.21 | | | $0.75 | | | $0.41 | | | $0.83 | |
Less distributions declared to shareholders | | | | | | | | | | | | | | | |
From net investment income | | $(0.06 | ) | | $(0.04 | ) | | $(0.01 | ) | | $(0.05 | ) | | $(0.01 | ) |
Net asset value, end of period | | $7.30 | | | $11.69 | | | $10.52 | | | $9.78 | | | $9.42 | |
Total return (%) (k)(r)(s) | | (37.22 | ) | | 11.53 | | | 7.67 | | | 4.37 | | | 9.61 | (b) |
Ratios (%) (to average net assets)
and Supplemental data: | | | | | | | | | | | | | | | |
Expenses before expense reductions (f) | | 0.86 | | | 0.84 | | | 0.82 | | | 0.85 | | | 0.83 | |
Expenses after expense reductions (f) | | 0.83 | | | 0.83 | | | N/A | | | N/A | | | N/A | |
Net investment income | | 0.62 | | | 0.48 | | | 0.34 | | | 0.12 | | | 0.47 | |
Portfolio turnover | | 42 | | | 62 | | | 72 | | | 136 | | | 139 | |
Net assets at end of period (000 Omitted) | | $145,858 | | | $309,208 | | | $336,383 | | | $395,782 | | | $468,181 | |
| |
| Service Class | | Years ended 12/31 | |
| | | 2008 | | | 2007 | | | 2006 | | | 2005 | | | 2004 | |
Net asset value, beginning of period | | $11.59 | | | $10.43 | | | $9.71 | | | $9.35 | | | $8.55 | |
| Income (loss) from investment operations | | | | | | | | | | | | | | | |
Net investment income (loss) (d) | | $0.04 | | | $0.02 | | | $0.01 | | | $(0.01 | ) | | $0.02 | |
Net realized and unrealized gain (loss) on investments
and foreign currency | | (4.36 | ) | | 1.15 | | | 0.71 | | | 0.40 | | | 0.78 | |
Total from investment operations | | $(4.32 | ) | | $1.17 | | | $0.72 | | | $0.39 | | | $0.80 | |
Less distributions declared to shareholders | | | | | | | | | | | | | | | |
From net investment income | | $(0.03 | ) | | $(0.01 | ) | | $— | | | $(0.03 | ) | | $— | |
Net asset value, end of period | | $7.24 | | | $11.59 | | | $10.43 | | | $9.71 | | | $9.35 | |
Total return (%) (k)(r)(s) | | (37.35 | ) | | 11.26 | | | 7.42 | | | 4.15 | | | 9.36 | (b) |
Ratios (%) (to average net assets)
and Supplemental data: | | | | | | | | | | | | | | | |
Expenses before expense reductions (f) | | 1.11 | | | 1.09 | | | 1.07 | | | 1.10 | | | 1.08 | |
Expenses after expense reductions (f) | | 1.08 | | | 1.08 | | | N/A | | | N/A | | | N/A | |
Net investment income (loss) | | 0.37 | | | 0.19 | | | 0.09 | | | (0.13 | ) | | 0.25 | |
Portfolio turnover | | 42 | | | 62 | | | 72 | | | 136 | | | 139 | |
Net assets at end of period (000 Omitted) | | $59,579 | | | $119,324 | | | $88,696 | | | $89,314 | | | $87,243 | |
| (b) | The fund’s net asset value and total return calculation include a non-recurring accrual recorded as a result of an administrative proceeding regarding disclosure of brokerage allocation practices in connection with fund sales. The non-recurring accrual resulted in an increase in the net asset value of $0.01 per share based on shares outstanding on the day the accrual was recorded. Excluding the effect of this accrual from the ending net asset value per share, the Initial Class and Service Class total returns for the year ended December 31, 2004 would have been lower by 0.13%. |
| (d) | Per share data is based on average shares outstanding. |
| (f) | Ratios do not reflect reductions from fees paid indirectly, if applicable. |
| (k) | The total return does not reflect expenses that apply to separate accounts. Inclusion of these charges would reduce the total return figures for all periods shown. |
| (r) | Certain expenses have been reduced without which performance would have been lower. |
| (s) | From time to time the fund may receive proceeds from litigation settlements, without which performance would be lower. |
See Notes to Financial Statements
12
NOTES TO FINANCIAL STATEMENTS
| (1) | | Business and Organization |
MFS Massachusetts Investors Growth Stock Portfolio (the fund) is a series of MFS Variable Insurance Trust II (the trust). The trust is organized as a Massachusetts business trust and is registered under the Investment Company Act of 1940, as amended, as an open-end management investment company. The shares of the fund are sold to variable accounts established by insurance companies to fund benefits under variable contracts issued by such companies, and qualified retirement and pension plans.
| (2) | | Significant Accounting Policies |
General – The preparation of financial statements in conformity with U.S. generally accepted accounting principles requires management to make estimates and assumptions that affect the reported amounts of assets and liabilities, and disclosure of contingent assets and liabilities at the date of the financial statements and the reported amounts of revenues and expenses during the reporting period. Actual results could differ from those estimates. The fund can invest in foreign securities, including securities of emerging market issuers. Investments in foreign securities are vulnerable to the effects of changes in the relative values of the local currency and the U.S. dollar and to the effects of changes in each country’s legal, political, and economic environment. The markets of emerging markets countries are generally more volatile than the markets of developed countries with more mature economies. All of the risks of investing in foreign securities previously described are heightened when investing in emerging markets countries.
In March 2008, FASB Statement No. 161, Disclosures about Derivative Instruments and Hedging Activities (the “Standard”) was issued, and is effective for financial statements issued for fiscal years and interim periods beginning after November 15, 2008. This Standard provides enhanced disclosures about the fund’s use of and accounting for derivative instruments and the effect of derivative instruments on the fund’s results of operations and financial position. Management is evaluating the application of the Standard to the fund, and has not at this time determined the impact, if any, resulting from the adoption of this Standard on the fund’s financial statements.
FASB Staff Position (FSP) 133-1 was implemented during the period. FSP 133-1 amends FAS 133 to require sellers of credit derivatives to make disclosures that will enable financial statement users to assess the potential effects of those credit derivatives on an entity’s financial position, financial performance and cash flows. There was no impact from implementing FSP 133-1 as the fund did not hold any of these credit derivatives at period end.
Investment Valuations – Equity securities, including restricted equity securities, are generally valued at the last sale or official closing price as reported by a third party pricing service on the market or exchange on which they are primarily traded. For securities for which there were no sales reported that day, equity securities are generally valued at the last quoted daily bid quotation as reported by a third party pricing service on the market or exchange on which they are primarily traded. For securities held short for which there were no sales reported for the day, the position is generally valued at the last quoted daily ask quotation as reported by a third party pricing service on the market or exchange on which such securities are primarily traded. Short-term instruments with a maturity at issuance of 60 days or less may be valued at amortized cost, which approximates market value. Open-end investment companies are generally valued at net asset value per share. Securities and other assets generally valued on the basis of information from a third party pricing service may also be valued at a broker-dealer bid quotation. Values obtained from pricing services can utilize both dealer-supplied valuations and electronic data processing techniques, which take into account factors such as institutional-size trading in similar groups of securities, yield, quality, coupon rate, maturity, type of issue, trading characteristics, and other market data. The values of foreign securities and other assets and liabilities expressed in foreign currencies are converted to U.S. dollars using the mean of bid and asked prices for rates reported by a third party pricing service.
The Board of Trustees has delegated primary responsibility for determining or causing to be determined the value of the fund’s investments (including any fair valuation) to the adviser pursuant to valuation policies and procedures approved by the Board. If the adviser determines that reliable market quotations are not readily available, investments are valued at fair value as determined in good faith by the adviser in accordance with such procedures under the oversight of the Board of Trustees. Under the fund’s valuation policies and procedures, market quotations are not considered to be readily available for most types of debt instruments and floating rate loans and many types of derivatives. These investments are generally valued at fair value based on information from third party pricing services. In addition, investments may be valued at fair value if the adviser determines that an investment’s value has been materially affected by events occurring after the close of the exchange or market on which the investment is principally traded (such as foreign exchange or market) and prior to the determination of the fund’s net asset value, or after the halting of trading of a specific security where trading does not resume prior to the close of the exchange or market on which the security is principally traded. Events that occur on a frequent basis after foreign markets close (such as developments in foreign markets and significant movements in the U.S. markets) and prior to the determination of the fund’s net asset value may be deemed to have a material affect on the value of securities traded in foreign
13
Notes to Financial Statements – continued
markets. Accordingly, the fund’s foreign equity securities may often be valued at fair value. The adviser may rely on third party pricing services or other information (such as the correlation with price movements of similar securities in the same or other markets; the type, cost and investment characteristics of the security; the business and financial condition of the issuer; and trading and other market data) to assist in determining whether to fair value and at what value to fair value an investment. The value of an investment for purposes of calculating the fund’s net asset value can differ depending on the source and method used to determine value. When fair valuation is used, the value of investments used to determine the fund’s net asset value may differ from quoted or published prices for the same investments.
The fund adopted FASB Statement No. 157, Fair Value Measurements (the “Statement”). This Statement provides a single definition of fair value, a hierarchy for measuring fair value and expanded disclosures about fair value measurements.
Various inputs are used in determining the value of the fund’s assets or liabilities carried at market value. These inputs are categorized into three broad levels. Level 1 includes quoted prices in active markets for identical assets or liabilities. Level 2 includes other significant observable market-based inputs (including quoted prices for similar securities, interest rates, prepayment speed, and credit risk). Level 3 includes unobservable inputs, which may include the adviser’s own assumptions in determining the fair value of investments. Other financial instruments are derivative instruments not reflected in total investments, such as futures, forwards, swap contracts and written options. The following is a summary of the levels used as of December 31, 2008 in valuing the fund’s assets or liabilities carried at market value:
| | | | | | | | |
| | | Level 1 | | Level 2 | | Level 3 | | Total |
| Investments in Securities | | $189,227,881 | | $15,198,240 | | $— | | $204,426,121 |
| Other Financial Instruments | | $— | | $— | | $— | | $— |
Repurchase Agreements – The fund may enter into repurchase agreements with approved counterparties. Each repurchase agreement is recorded at cost. The fund requires that the securities collateral in a repurchase transaction be transferred to a custodian. The fund monitors, on a daily basis, the value of the collateral to ensure that its value, including accrued interest, is greater than amounts owed to the fund under each such repurchase agreement. The fund and other funds managed by Massachusetts Financial Services Company (MFS), may utilize a joint trading account for the purpose of entering into one or more repurchase agreements.
Foreign Currency Translation – Purchases and sales of foreign investments, income, and expenses are converted into U.S. dollars based upon currency exchange rates prevailing on the respective dates of such transactions or on the reporting date for foreign denominated receivables and payables. Gains and losses attributable to foreign currency exchange rates on sales of securities are recorded for financial statement purposes as net realized gains and losses on investments. Gains and losses attributable to foreign exchange rate movements on receivables, payables, income and expenses are recorded for financial statement purposes as foreign currency transaction gains and losses. That portion of both realized and unrealized gains and losses on investments that results from fluctuations in foreign currency exchange rates is not separately disclosed.
Security Loans – State Street Bank and Trust Company (“State Street”), as lending agent, may loan the securities of the fund to certain qualified institutions (the “Borrowers”) approved by the fund. The loans are collateralized by cash and/or U.S. Treasury and federal agency obligations in an amount typically at least equal to the market value of the securities loaned. State Street provides the fund with indemnification against Borrower default. The fund bears the risk of loss with respect to the investment of cash collateral. On loans collateralized by cash, the cash collateral is invested in a money market fund or short-term securities. A portion of the income generated upon investment of the collateral is remitted to the Borrowers, and the remainder is allocated between the fund and the lending agent. On loans collateralized by U.S. Treasury and/or federal agency obligations, a fee is received from the Borrower, and is allocated between the fund and the lending agent. Income from securities lending is included in interest income on the Statement of Operations. The dividend and interest income earned on the securities loaned is accounted for in the same manner as other dividend and interest income. At December 31, 2008, there were no securities on loan.
Indemnifications – Under the fund’s organizational documents, its officers and trustees may be indemnified against certain liabilities and expenses arising out of the performance of their duties to the fund. Additionally, in the normal course of business, the fund enters into agreements with service providers that may contain indemnification clauses. The fund’s maximum exposure under these agreements is unknown as this would involve future claims that may be made against the fund that have not yet occurred.
Investment Transactions and Income – Investment transactions are recorded on the trade date. Interest income is recorded on the accrual basis. All premium and discount is amortized or accreted for financial statement purposes in accordance with U.S. generally accepted accounting principles. Dividends received in cash are recorded on the ex-dividend date. Certain dividends from foreign securities will be recorded when the fund is informed of the dividend if such information is obtained subsequent to the ex-dividend date. Dividend and interest payments received in additional securities are recorded on the ex-dividend or ex-interest date in an amount equal to the value of the security on such date.
14
Notes to Financial Statements – continued
The fund may receive proceeds from litigation settlements. Any proceeds received from litigation involving portfolio holdings are reflected in the Statement of Operations in realized gain/loss if the security has been disposed of by the fund or in unrealized gain/loss if the security is still held by the fund. Any other proceeds from litigation not related to portfolio holdings are reflected as other income in the Statement of Operations.
Fees Paid Indirectly – The fund’s custody fee may be reduced according to an arrangement that measures the value of cash deposited with the custodian by the fund. This amount, for the year ended December 31, 2008, is shown as a reduction of total expenses on the Statement of Operations.
Tax Matters and Distributions – The fund intends to qualify as a regulated investment company, as defined under Subchapter M of the Internal Revenue Code, and to distribute all of its taxable income, including realized capital gains. As a result, no provision for federal income tax is required. Each of the fund’s federal tax returns for the prior three fiscal years remains subject to examination by the Internal Revenue Service. Foreign taxes, if any, have been accrued by the fund in the accompanying financial statements.
Distributions to shareholders are recorded on the ex-dividend date. Income and capital gain distributions are determined in accordance with income tax regulations, which may differ from U.S. generally accepted accounting principles. Certain capital accounts in the financial statements are periodically adjusted for permanent differences in order to reflect their tax character. These adjustments have no impact on net assets or net asset value per share. Temporary differences which arise from recognizing certain items of income, expense, gain or loss in different periods for financial statement and tax purposes will reverse at some time in the future. Distributions in excess of net investment income or net realized gains are temporary overdistributions for financial statement purposes resulting from differences in the recognition or classification of income or distributions for financial statement and tax purposes.
Book/tax differences primarily relate to wash sale loss deferrals and expiration of capital loss carryforwards.
The tax character of distributions declared to shareholders for the last two fiscal years is as follows:
| | | | |
| | | 12/31/08 | | 12/31/07 |
| Ordinary income (including any short-term capital gains) | | $1,772,918 | | $1,310,019 |
The federal tax cost and the tax basis components of distributable earnings were as follows:
| | | |
| As of 12/31/08 | | | |
| Cost of investments | | $272,700,161 | |
| Gross appreciation | | 1,289,617 | |
| Gross depreciation | | (69,563,657 | ) |
| Net unrealized appreciation (depreciation) | | $(68,274,040 | ) |
| Undistributed ordinary income | | 1,717,549 | |
| Capital loss carryforwards | | (401,531,257 | ) |
| Other temporary differences | | (1,749 | ) |
As of December 31, 2008, the fund had capital loss carryforwards available to offset future realized gains. Such losses expire as follows:
| | | |
| 12/31/09 | | $(184,423,276 | ) |
| 12/31/10 | | (177,770,682 | ) |
| 12/31/16 | | (39,337,299 | ) |
| | $(401,531,257 | ) |
The availability of a portion of the capital loss carryforwards, which were acquired on June 22, 2007 in connection with the MFS Strategic Growth Series merger, may be limited in a given year.
Multiple Classes of Shares of Beneficial Interest – The fund offers multiple classes of shares, which differ in their respective distribution fees. The fund’s income, realized and unrealized gain (loss), and common expenses are allocated to shareholders based on the daily net assets of each class. Dividends are declared separately for each class. Differences in per share dividend rates are generally due to differences in separate class expenses.
| (3) | | Transactions with Affiliates |
Investment Adviser – The fund has an investment advisory agreement with MFS to provide overall investment management and related administrative services and facilities to the fund. The management fee is computed daily and paid monthly at an annual rate of 0.75% of the fund’s average daily net assets. The investment adviser has agreed in writing to reduce its management fee to 0.65% of average daily net assets in excess of $1 billion. This written agreement will continue until modified by the fund’s Board of Trustees. For the year ended December 31, 2008, the fund’s average daily net assets did not
15
Notes to Financial Statements – continued
exceed $1 billion and therefore, the management fee was not reduced. The management fee incurred for the year ended December 31, 2008 was equivalent to an annual effective rate of 0.75% of the fund’s average daily net assets.
The investment adviser has agreed in writing to pay a portion of the fund’s total annual operating expenses, exclusive of interest, taxes, extraordinary expenses, brokerage and transaction costs, and investment-related expenses, such that total annual operating expenses do not exceed 0.82% annually of average daily net assets for the Initial Class shares and 1.07% annually of average daily net assets for the Service Class shares. This written agreement will continue until June 30, 2010. For the year ended December 31, 2008, this reduction amounted to $115,141 and is reflected as a reduction of total expenses in the Statement of Operations.
Distributor – MFS Fund Distributors, Inc. (MFD), a wholly-owned subsidiary of MFS, is the distributor of shares of the fund. The Trustees have adopted a distribution plan for the Service Class shares pursuant to Rule 12b-1 under the Investment Company Act of 1940.
The fund’s distribution plan provides that the fund will pay MFD distribution fees equal to 0.25% per annum of its average daily net assets attributable to Service Class shares as partial consideration for services performed and expenses incurred by MFD and financial intermediaries in connection with the sale and distribution of the fund’s Service Class shares and the sale and distribution of the variable annuity or variable life insurance contracts investing indirectly in Service Class shares. MFD may subsequently pay all, or a portion, of the distribution fees to financial intermediaries.
Shareholder Servicing Agent – MFS Service Center, Inc. (MFSC), a wholly-owned subsidiary of MFS, has contracted to provide transfer agent and recordkeeping functions in connection with the issuance, transfer, and redemption of each class of shares of the fund under a Shareholder Servicing Agent Agreement. During the year ended December 31, 2008, the fund did not pay MFSC a fee for this service.
Administrator – MFS provides certain financial, legal, shareholder communications, compliance, and other administrative services to the fund. Under an administrative services agreement, the fund partially reimburses MFS the costs incurred to provide these services. The fund is charged an annual fixed amount of $10,000 plus a fee based on average daily net assets.
The administrative services fee incurred for the year ended December 31, 2008 was equivalent to an annual effective rate of 0.0304% of the fund’s average daily net assets.
Trustees’ and Officers’ Compensation – The fund pays compensation to trustees in the form of a retainer, attendance fees, and additional compensation to Board chairpersons. The fund does not pay compensation directly to officers of the fund who are also officers of the investment adviser, all of whom receive remuneration for their services to the fund from MFS. Certain officers of the fund are officers or directors of MFS, MFD, and MFSC.
Other – This fund and certain other MFS funds (the funds) have entered into services agreements (the Agreements) which provide for payment of fees by the funds to Tarantino LLC and Griffin Compliance LLC in return for the provision of services of an Independent Chief Compliance Officer (ICCO) and Assistant ICCO, respectively, for the funds. The ICCO and Assistant ICCO are officers of the funds and the sole members of Tarantino LLC and Griffin Compliance LLC, respectively. The funds can terminate the Agreements with Tarantino LLC and Griffin Compliance LLC at any time under the terms of the Agreements. MFS has agreed to bear all expenses associated with office space, other administrative support, and supplies provided to the ICCO and Assistant ICCO. For the year ended December 31, 2008, the aggregate fees paid by the fund to Tarantino LLC and Griffin Compliance LLC were $2,962 and are included in miscellaneous expense on the Statement of Operations.
The fund may invest in a money market fund managed by MFS which seeks a high level of current income consistent with preservation of capital and liquidity. Income earned on this investment is included in dividends from underlying funds on the Statement of Operations. This money market fund does not pay a management fee to MFS.
Purchases and sales of investments, other than U.S. Government securities, purchased option transactions, and short-term obligations, aggregated $135,693,425 and $221,345,301, respectively.
16
Notes to Financial Statements – continued
| (5) | | Shares of Beneficial Interest |
The fund’s Declaration of Trust permits the Trustees to issue an unlimited number of full and fractional shares of beneficial interest. Transactions in fund shares were as follows:
| | | | | | | | | | | | |
| | | Year ended 12/31/08 | | | Year ended 12/31/07 | |
| | | Shares | | | Amount | | | Shares | | | Amount | |
| Shares sold | | | | | | | | | | | | |
Initial Class | | 286,691 | | | $2,363,737 | | | 260,832 | | | $2,982,601 | |
Service Class | | 690,767 | | | 5,621,814 | | | 305,897 | | | 3,242,891 | |
| | 977,458 | | | $7,985,551 | | | 566,729 | | | $6,225,492 | |
| Shares issued in connection with acquisition of Strategic Growth Series | | | | | | | | | | | | |
Initial Class | | | | | | | | 2,598,220 | | | $29,132,978 | |
Service Class | | | | | | | | 3,576,586 | | | 39,797,947 | |
| | | | | | | | 6,174,806 | | | $68,930,925 | |
| Shares issued to shareholders in reinvestment of distributions | | | | | | | | | | | | |
Initial Class | | 127,419 | | | $1,460,223 | | | 106,664 | | | $1,191,441 | |
Service Class | | 27,502 | | | 312,695 | | | 10,692 | | | 118,578 | |
| | 154,921 | | | $1,772,918 | | | 117,356 | | | $1,310,019 | |
| Shares reacquired | | | | | | | | | | | | |
Initial Class | | (6,893,149 | ) | | $(69,151,636 | ) | | (8,488,648 | ) | | $(94,925,383 | ) |
Service Class | | (2,785,503 | ) | | (27,141,071 | ) | | (2,100,736 | ) | | (23,626,156 | ) |
| | (9,678,652 | ) | | $(96,292,707 | ) | | (10,589,384 | ) | | $(118,551,539 | ) |
| Net change | | | | | | | | | | | | |
Initial Class | | (6,479,039 | ) | | $(65,327,676 | ) | | (5,522,932 | ) | | $(61,618,363 | ) |
Service Class | | (2,067,234 | ) | | (21,206,562 | ) | | 1,792,439 | | | 19,533,260 | |
| | (8,546,273 | ) | | $(86,534,238 | ) | | (3,730,493 | ) | | $(42,085,103 | ) |
The fund and other funds managed by MFS participate in a $1 billion unsecured committed line of credit provided by a syndication of banks under a credit agreement. In addition, the fund and other funds managed by MFS have established uncommitted borrowing arrangements with certain banks. Borrowings may be made for temporary financing needs. Interest is charged to each fund, based on its borrowings, generally at a rate equal to the Federal Reserve funds rate plus 0.30%. In addition, a commitment fee, based on the average daily, unused portion of the committed line of credit, is allocated among the participating funds at the end of each calendar quarter. For the year ended December 31, 2008, the fund’s commitment fee and interest expense were $1,578 and $0, respectively, and are included in miscellaneous expense on the Statement of Operations.
| (7) | | Transactions in Underlying Funds – Affiliated Issuers |
An affiliated issuer may be considered one in which the fund owns 5% or more of the outstanding voting securities, or a company which is under common control. For the purposes of this report, the fund assumes the following to be affiliated issuers:
| | | | | | | | |
| Underlying Funds | | Beginning
Shares/Par
Amount | | Acquisitions
Shares/Par
Amount | | Dispositions
Shares/Par
Amount | | Ending
Shares/Par
Amount |
| MFS Institutional Money Market Portfolio | | — | | 28,550,776 | | 25,648,968 | | 2,901,808 |
| | | | |
| Underlying Funds | | Realized
Gain (Loss) | | Capital Gain
Distributions | | Dividend
Income | | Ending
Value |
| MFS Institutional Money Market Portfolio | | $— | | $— | | $7,842 | | $2,901,808 |
At close of business on June 22, 2007, the fund acquired all of the assets and liabilities of Strategic Growth Series. The acquisition was accomplished by a tax-free exchange of 6,174,806 shares of the fund (valued at $68,930,925) for all of the assets and liabilities of Strategic Growth Series. Strategic Growth Series then distributed the shares of the fund that the Strategic Growth Series received from the fund to its shareholders. Strategic Growth Series’ net assets on that date were $68,930,925, including $7,565,896 of unrealized appreciation, $815 of accumulated net investment loss, and $39,999,752 of accumulated net realized loss on investments and foreign currency transactions. The aggregate net assets of the fund after the acquisition were $475,382,849.
17
REPORT OF INDEPENDENT REGISTERED PUBLIC ACCOUNTING FIRM
To the Board of Trustees of MFS Variable Insurance Trust II and the Shareholders of
MFS Massachusetts Investors Growth Stock Portfolio:
We have audited the accompanying statement of assets and liabilities, including the portfolio of investments, of MFS Massachusetts Investors Growth Stock Portfolio (the “Fund”) (one of the portfolios comprising MFS Variable Insurance Trust II) as of December 31, 2008, and the related statement of operations for the year then ended, the statements of changes in net assets for each of the two years in the period then ended, and the financial highlights for each of the five years in the period then ended. These financial statements and financial highlights are the responsibility of the Fund’s management. Our responsibility is to express an opinion on these financial statements and financial highlights based on our audits.
We conducted our audits in accordance with the standards of the Public Company Accounting Oversight Board (United States). Those standards require that we plan and perform the audit to obtain reasonable assurance about whether the financial statements and financial highlights are free of material misstatement. The Fund is not required to have, nor were we engaged to perform, an audit of its internal control over financial reporting. Our audits included consideration of internal control over financial reporting as a basis for designing audit procedures that are appropriate in the circumstances, but not for the purpose of expressing an opinion on the effectiveness of the Fund’s internal control over financial reporting. Accordingly, we express no such opinion. An audit also includes examining, on a test basis, evidence supporting the amounts and disclosures in the financial statements, assessing the accounting principles used and significant estimates made by management, as well as evaluating the overall financial statement presentation. Our procedures included confirmation of securities owned as of December 31, 2008, by correspondence with the custodian and brokers; where replies were not received from brokers, we performed other auditing procedures. We believe that our audits provide a reasonable basis for our opinion.
In our opinion, the financial statements and financial highlights referred to above present fairly, in all material respects, the financial position of MFS Massachusetts Investors Growth Stock Portfolio as of December 31, 2008, the results of its operations for the year then ended, the changes in its net assets for each of the two years in the period then ended, and the financial highlights for each of the five years in the period then ended, in conformity with accounting principles generally accepted in the United States of America.
DELOITTE & TOUCHE LLP
Boston, Massachusetts
February 19, 2009
18
TRUSTEES AND OFFICERS – IDENTIFICATION AND BACKGROUND
The Trustees and officers of the Trust, as of February 1, 2009, are listed below, together with their principal occupations during the past five years. (Their titles may have varied during that period.) The address of each Trustee and officer is 500 Boylston Street, Boston, Massachusetts 02116.
| | | | | | |
Name, Date of Birth | | Position(s) Held
with Fund | | Trustee/Officer
Since (1) | | Principal Occupations During the Past Five Years and
Other Directorships (2) |
| INTERESTED TRUSTEE | | | | |
David D. Horn (3) (born 6/07/41) | | Trustee | | April 1986 | | Private investor; Sun Life Assurance Company of Canada, Senior Vice President and General Manager for the United States (until 1997); Director (until March 2004) |
| | |
| INDEPENDENT TRUSTEES | | | | |
J. Kermit Birchfield (born 1/08/40) | | Chairman | | May 1997 | | Consultant; Century Partners, Inc. (investments), Director; Displaytech, Inc. (technology), Director; Dessin Fournir LLC (furniture manufacturer), Director (2005 to present); Intermountain Gas Company, Inc. & Intermountain Industries, Inc. (oil & gas exploration and production), Director; Site Watch LLC (software to monitor oil tanks), Managing Director (2006 to present); Juridica Investments (fund investing in judicial matters), Director (2007 to present); HPSC, Inc. (medical financing), Director (until January 2004) |
| | | |
Robert C. Bishop (born 1/13/43) | | Trustee | | May 2001 | | AutoImmune, Inc. (pharmaceutical product development), Chairman, President and Chief Executive Officer; Caliper Life Sciences Corp. (laboratory analytical instruments), Director; Millipore Corporation (purification/filtration products), Director; Waterstreet Capital (leverage buyouts), Advisory Board (August 2006 to present); Optobionics Corporation (ophthalmic devices), Director (2002 to 2007) |
| | | |
Frederick H. Dulles (born 3/12/42) | | Trustee | | May 2001 | | Ten State International Law PLLC (law firm), Of Counsel (since 2006); Prudential Carolina Real Estate, (real estate), Broker (since 2006); Free Enterprise Foundation, Inc. (research institute), Director & Secretary (until 2008); Disher, Hamrick & Myers Residential, Inc. (real estate) Broker (2005 until 2006); Frederick H. Dulles law practice (until 2006); Ten State Street LLP (law firm), Member (until 2005) |
| | | |
Marcia A. Kean (born 6/30/48) | | Trustee | | April 2005 | | Feinstein Kean Healthcare (consulting), Chief Executive Officer |
| | | |
Ronald G. Steinhart (born 6/15/40) | | Trustee | | May 2001 | | Private investor; Penske Automotive Group (automotive retailer), Director; Animal Health International, Inc. (animal health products), Director (since 2007); Texas Industries (concrete/aggregates/cement), Director (since 2007); Penson Worldwide, Inc. (securities clearance), Director (since 2006); Carreker Corporation (technology consulting) Director (until 2005); Prentiss Properties Trust (real estate investment trust), Director (until 2006) |
| | | |
Haviland Wright (born 7/21/48) | | Trustee | | May 2001 | | Profitability of Hawaii (software), Chief Development Officer (since December 2008); Elixir Technologies Corporation (software) Director (since 2005); Nano Loa Inc. (liquid crystal displays), Director |
| | |
| TRUSTEE EMERITUS | | | | |
Samuel Adams (born 10/19/25) | | Trustee Emeritus | | | | Retired; K&L Gates LLP (law firm), Of Counsel |
| | |
| OFFICERS | | | | |
Maria F. Dwyer (4) (born 12/01/58) | | President | | November 2005 | | Massachusetts Financial Services Company, Executive Vice President and Chief Regulatory Officer (since March 2004) Chief Compliance Officer (since December 2006); Fidelity Management & Research Company, Vice President (prior to March 2004); Fidelity Group of Funds, President and Treasurer (until March 2004) |
| | | |
Christopher R. Bohane (4) (born 1/18/74) | | Assistant Secretary and Assistant Clerk | | July 2005 | | Massachusetts Financial Services Company, Vice President and Senior Counsel |
| | | |
John M. Corcoran (4) (born 4/13/65) | | Treasurer | | October 2008 | | Massachusetts Financial Services Company, Senior Vice President (since October 2008); State Street Bank and Trust (financial services provider), Senior Vice President, (until September 2008) |
| | | |
Ethan D. Corey (4) (born 11/21/63) | | Assistant Secretary and Assistant Clerk | | July 2005 | | Massachusetts Financial Services Company, Senior Vice President and Associate General Counsel (since 2004); Dechert LLP (law firm), Counsel (prior to December 2004) |
| | | |
David L. DiLorenzo (4) (born 8/10/68) | | Assistant Treasurer | | July 2005 | | Massachusetts Financial Services Company, Vice President (since June 2005); JP Morgan Investor Services, Vice President (until June 2005) |
| | | |
Timothy M. Fagan (4) (born 7/10/68) | | Assistant Secretary and Assistant Clerk | | September 2005 | | Massachusetts Financial Services Company, Vice President and Senior Counsel (since September 2005); John Hancock Advisers, LLC, Vice President, Senior Attorney and Chief Compliance Officer (until August 2005) |
19
Trustees and Officers – continued
| | | | | | |
Name, Date of Birth | | Position(s) Held
with Fund | | Trustee/Officer
Since (1) | | Principal Occupations During the Past Five Years and
Other Directorships (2) |
Mark D. Fischer (4) (born 10/27/70) | | Assistant Treasurer | | July 2005 | | Massachusetts Financial Services Company, Vice President (since May 2005); JP Morgan Investment Management Company, Vice President (until May 2005) |
| | | |
Robyn L. Griffin (born 7/04/75) | | Assistant Independent Chief Compliance Officer | | August 2008 | | Griffin Compliance LLC (provider of compliance services), Principal (since August 2008); State Street Corporation (financial services provider), Mutual Fund Administration Assistant Vice President (October 2006 – July 2008); Liberty Mutual Group (insurance), Personal Market Assistant Controller (April 2006 – October 2006); Deloitte & Touche LLP (professional services firm), Senior Manager (prior to April 2006) |
| | | |
Brian E. Langenfeld (4) (born 3/07/73) | | Assistant Secretary and Assistant Clerk | | May 2006 | | Massachusetts Financial Services Company, Vice President and Senior Counsel (since May 2006); John Hancock Advisers, LLC, Assistant Vice President and Counsel (until April 2006) |
| | | |
Ellen Moynihan (4) (born 11/13/57) | | Assistant Treasurer | | May 1997 | | Massachusetts Financial Services Company, Senior Vice President |
| | | |
Susan S. Newton (4) (born 3/07/50) | | Assistant Secretary and Assistant Clerk | | May 2005 | | Massachusetts Financial Services Company, Senior Vice President and Associate General Counsel (since April 2005); John Hancock Advisers, LLC, Senior Vice President, Secretary and Chief Legal Officer (until April 2005) |
| | | |
Susan A. Pereira (4) (born 11/05/70) | | Assistant Secretary and Assistant Clerk | | July 2005 | | Massachusetts Financial Services Company, Vice President and Senior Counsel (since June 2004); Bingham McCutchen LLP (law firm), Associate (until June 2004) |
| | | |
Mark N. Polebaum (4) (born 5/01/52) | | Secretary and Clerk | | February 2006 | | Massachusetts Financial Services Company, Executive Vice President, General Counsel and Secretary (since January 2006); Wilmer Cutler Pickering Hale and Dorr LLP (law firm), Partner (until January 2006) |
| | | |
Frank L. Tarantino (born 3/07/44) | | Independent Chief Compliance Officer | | September 2004 | | Tarantino LLC (provider of compliance services), Principal (since June 2004); CRA Business Strategies Group (consulting services), Executive Vice President (until June 2004) |
| | | |
Richard S. Weitzel (4) (born 7/16/70) | | Assistant Secretary and Assistant Clerk | | October 2007 | | Massachusetts Financial Services Company, Vice President and Assistant General Counsel (since 2004); Massachusetts Department of Business and Technology, General Counsel (until April 2004) |
| | | |
James O. Yost (4) (born 6/12/60) | | Assistant Treasurer | | April 1992 | | Massachusetts Financial Services Company, Senior Vice President |
| (1) | Date first appointed to serve as Trustee/Officer of an MFS fund or a Compass variable account. Each Trustee has served continuously since appointment. |
| (2) | Directorships or trusteeships of companies required to report to the Securities and Exchange Commission (i.e., “public companies”). |
| (3) | “Interested person” of the Trust, within the meaning of the Investment Company Act of 1940 (referred to as the 1940 Act), which is the principal federal law governing investment companies like the Trust, as a result of position with Sun Life of Canada (U.S.). The address of Sun Life of Canada (U.S.) is One Sun Life Executive Park, Wellesley Hills, Massachusetts 02481. |
| (4) | “Interested person” of MFS within the meaning of the 1940 Act. The address of MFS is 500 Boylston Street, Boston, Massachusetts 02116. |
The Trust does not hold annual meetings for the purpose of electing Trustees, and Trustees are not elected for fixed terms. Each Trustee and officer holds office until his or her successor is chosen and qualified, or until his or her earlier death, resignation, retirement or removal.
All Trustees currently serve as Trustees of the Trust and have served in that capacity since originally elected or appointed. All of the Trustees are also Managers of the Compass Variable Accounts. The executive officers of the Trust hold similar offices for the Compass Variable Accounts and other funds in the MFS fund complex. As of January 1, 2009, each Trustee serves as a Trustee or Manager of 35 Accounts/Funds.
The Statement of Additional Information contains further information about the Trustees and is available without charge upon request by calling 1-800-752-7215.
| | |
Investment Adviser
Massachusetts Financial Services Company 500 Boylston Street, Boston, MA 02116-3741 | | Custodian State Street Bank and Trust 1 Lincoln Street, Boston, MA 02111-2900 |
Distributor
MFS Fund Distributors, Inc. 500 Boylston Street, Boston, MA 02116-3741 | | Independent Registered Public Accounting Firm Deloitte & Touche LLP 200 Berkeley Street, Boston, MA 02116 |
Portfolio Manager Jeffrey Constantino | | |
20
BOARD REVIEW OF INVESTMENT ADVISORY AGREEMENT
The Investment Company Act of 1940 requires that both the full Board of Trustees and a majority of the non-interested (“independent”) Trustees, voting separately, annually approve the continuation of the investment advisory agreement between MFS Variable Insurance Trust II (the “Trust”) and Massachusetts Financial Services Company (“MFS”) on behalf of the Fund. The Trustees consider matters bearing on the Fund and the advisory arrangements at their meetings throughout the year, including a review of performance data at each regular meeting. In addition, the independent Trustees met in May and again in July 2008 (“contract review meetings”) for the specific purpose of considering whether to approve the continuation of the investment advisory agreement for the Fund. The independent Trustees were assisted in their evaluation of the investment advisory agreement by independent legal counsel, from whom they received separate legal advice and with whom they met separately from MFS management during various contract review meetings. The independent Trustees were also assisted in this process by the Fund’s Independent Chief Compliance Officer, a full-time senior officer appointed by and reporting to the independent Trustees.
In connection with their deliberations, the Trustees, including the independent Trustees, considered such information and factors as they believed, in light of the legal advice furnished to them and their own business judgment, to be relevant. The investment advisory agreement was considered separately for the Fund, although the Trustees also took into account the common interests of all Funds in the Trust in their review. As described below, the Trustees considered the nature, quality, and extent of the various investment advisory, administrative, and shareholder services performed by MFS under the existing investment advisory agreement and other arrangements with the Trust.
In connection with their contract review meetings, the Trustees received and relied upon materials which included, among other items: (i) information provided by Lipper Inc. on the investment performance of the Fund for various time periods ended December 31, 2007, compared to the investment performance of a group of funds with substantially similar investment classifications/objectives (the “Lipper performance universe”), (ii) information provided by Lipper Inc. on the Fund’s advisory fees and other expenses compared to the advisory fees and other expenses of comparable funds identified by Lipper (the “Lipper expense group”), (iii) information provided by MFS on the advisory fees of comparable portfolios of its other clients, including institutional separate account and other clients, (iv) information as to whether expense waivers, reimbursements or fee “breakpoints” are observed for the Fund, (v) information regarding MFS’ financial results and financial condition, including MFS’ and certain of its affiliates’ estimated profitability from services performed for the Fund, (vi) MFS’ views regarding the outlook for the mutual fund industry and its strategic business plans, (vii) descriptions of various functions performed by MFS for the Trust, such as compliance monitoring and portfolio trading practices, and (viii) information regarding the overall organization of MFS, including information about MFS’ senior management and other personnel providing investment advisory, administrative and other services to the Fund. The comparative performance, fee and expense information prepared and provided by Lipper Inc. was not independently verified, and the independent Trustees did not independently verify any information provided to them by MFS.
The Trustees’ conclusion as to the continuation of the investment advisory agreement was based on comprehensive consideration of all information provided to the Trustees and not the result of any single factor. Some of the factors that figured particularly in the Trustees’ deliberations are described below for the Fund, while individual Trustees may have given different weight to various factors and evaluated the information presented as a whole differently than another Trustee. The Trustees recognized that the fee arrangements for the Fund reflect years of review and discussion between the independent Trustees and MFS, that certain aspects of such arrangements may receive greater scrutiny in some years than others, and that the Trustees’ conclusions may be based, in part, on their consideration of these same arrangements during the course of the year and in prior years.
Based on information provided by Lipper Inc., the Trustees compared the Fund’s total return investment performance to the performance of a peer group of funds over various time periods. The Trustees placed particular emphasis on the total return performance of the Fund’s Initial Class shares in comparison to the performance of funds in its Lipper performance universe over the one-, three- and five-year periods. The Trustees did not rely on performance results for more recent periods, including those shown elsewhere in this report.
The Trustees noted the performance of the Fund’s Initial Class shares was in the 3rd quintile relative to the other funds in the Lipper Classification Index for the one-year period (the 1st quintile being the best performers and the 5th quintile being the worst performers). The total return performance of the Fund was in the 4th quintile for the three-year period and the five-year period ended December 31, 2007, relative to the Lipper performance universe. Based on the nature and quality of services provided by MFS, the Board of Trustees concluded that the Fund’s performance was adequate.
In the course of their deliberations, the Trustees took into account information provided by MFS during contract review meetings, as well as during investment review meetings conducted with portfolio management personnel during the course of the year.
21
Board Review of Investment Advisory Agreement – continued
In assessing the reasonableness of the Fund’s advisory fee, the Trustees considered, among other information, the Fund’s advisory fee and the total expense ratio of the Fund’s Initial Class shares as a percentage of average daily net assets, compared to the advisory fee and total expense ratios of its peer group of funds based on information provided by Lipper Inc. The Trustees also considered the advisory fees charged by MFS to institutional accounts. In comparing these fees, the Trustees considered the generally broader scope of services provided by MFS to the Trust than those provided to institutional accounts. The Trustees also considered the higher demands placed on MFS’ investment personnel and trading infrastructure as a result of the daily cash in-flows and out-flows of the Fund, and the impact on MFS and related expenses due to the more extensive regulatory regime to which the Fund is subject, compared to institutional accounts.
In considering the fees, the Trustees noted from the Lipper data that the Fund’s effective advisory fee rate was approximately at the median and total expense ratio was at the median of such fees and expenses of funds in the Lipper expense group. The Trustees further noted that MFS agreed to continue to reduce its advisory fee on average daily net assets over $1 billion, and they accepted MFS’ offer to continue the total expense limitation for the next year. The Trustees further concluded that the existing breakpoint was sufficient to allow the Fund to benefit from economies of scale as its assets grow. The Trustees concluded that the fees were reasonable in light of the nature and quality of services provided.
The Trustees also considered information prepared by MFS relating to its costs and profits with respect to the Fund and other investment companies and accounts advised by MFS, as well as MFS’ methodologies used to determine and allocate its costs to the Fund and other accounts and products for purposes of estimating profitability.
After reviewing these and other factors described below, the Trustees concluded that the advisory fees charged to the Fund represent reasonable compensation in light of the nature and quality of the services being provided by MFS.
In addition, the Trustees considered MFS’ resources and related efforts to continue to retain, attract and motivate capable personnel to serve the Fund. The Trustees also considered the financial resources of MFS and its parent, Sun Life Financial Inc. The Trustees further considered any advantages and possible disadvantages of having an adviser which also serves other investment companies as well as institutional accounts.
The Trustees also considered the nature, quality, cost, and extent of administrative, transfer agency, and distribution services provided to the Fund by MFS and its affiliates under agreements and plans other than the investment advisory agreement, including the 12b-1 fees the Fund pays to MFS Fund Distributors, Inc., an affiliate of MFS. The Trustees also considered the nature, extent and quality of certain other services MFS performs or arranges on the Fund’s behalf, which may include securities lending programs, directed expense payment programs, class action recovery programs, and MFS’ interaction with third-party service providers, principally custodians and sub-custodians. The Trustees concluded that the various non-advisory services provided by MFS and its affiliates on behalf of the Fund were satisfactory. The Trustees also considered the benefits to MFS from the use of the Fund’s portfolio brokerage commissions to pay for research and other similar services and various other factors. Additionally, the Trustees considered so-called “fall-out benefits” to MFS such as reputational value derived from serving as investment manager to the Trust, and determined that any such benefits derived by MFS were reasonable and fair.
Based on their evaluation of factors that they deemed to be material, including those factors described above, the Board of Trustees, including a majority of the independent Trustees, concluded that the investment advisory agreement should be continued for an additional one-year period, commencing September 1, 2008.
A discussion regarding the Board’s most recent review and renewal of the fund’s Investment Advisory Agreement with MFS is available by clicking on the fund’s name under “Variable Insurance Portfolios-VIT II” in the “Products & Performance” section on the MFS Web site (mfs.com).
22
PROXY VOTING POLICIES AND INFORMATION
A general description of the MFS funds’ proxy voting policies and procedures is available without charge, upon request, by calling
1-800-225-2606, by visiting the Proxy Voting section of mfs.com or by visiting the SEC’s Web site at http://www.sec.gov.
Information regarding how the fund voted proxies relating to portfolio securities during the most recent twelve-month period ended June 30 is available without charge by visiting the Proxy Voting section of mfs.com or by visiting the SEC’s Web site at http://www.sec.gov.
QUARTERLY PORTFOLIO DISCLOSURE
The fund will file a complete schedule of portfolio holdings with the Securities and Exchange Commission (the Commission) for the first and third quarters of each fiscal year on Form N-Q. The fund’s Form N-Q may be reviewed and copied at the:
Public Reference Room
Securities and Exchange Commission
100 F Street, NE, Room 1580
Washington, D.C. 20549
Information on the operation of the Public Reference Room may be obtained by calling the Commission at 1-800-SEC-0330. The fund’s Form N-Q is available on the EDGAR database on the Commission’s Internet Web site at http://www.sec.gov, and copies of this information may be obtained, upon payment of a duplicating fee, by electronic request at the following e-mail address: publicinfo@sec.gov or by writing the Public Reference Section at the above address.
FEDERAL TAX INFORMATION (unaudited)
The following information is provided pursuant to provisions of the Internal Revenue Code.
For corporate shareholders, 100.00% of the ordinary income dividends paid during the fiscal year qualify for the corporate dividends received deduction.
23
MFS® PRIVACY NOTICE
Privacy is a concern for every investor today. At MFS Investment Management® and the MFS funds, we take this concern very seriously. We want you to understand our policies about the investment products and services that we offer, and how we protect the nonpublic personal information of investors who have a direct relationship with us and our wholly owned subsidiaries.
Throughout our business relationship, you provide us with personal information. We maintain information and records about you, your investments, and the services you use. Examples of the nonpublic personal information we maintain include
| | Ÿ | | data from investment applications and other forms |
| | Ÿ | | share balances and transactional history with us, our affiliates, or others |
| | Ÿ | | facts from a consumer reporting agency |
We do not disclose any nonpublic personal information about our customers or former customers to anyone, except as permitted by law. We may share nonpublic personal information with third parties or certain of our affiliates in connection with servicing your account or processing your transactions. We may share information with companies or financial institutions that perform marketing services on our behalf or with other financial institutions with which we have joint marketing arrangements, subject to any legal requirements.
Authorization to access your nonpublic personal information is limited to appropriate personnel who provide products, services, or information to you. We maintain physical, electronic, and procedural safeguards to help protect the personal information we collect about you.
If you have any questions about the MFS privacy policy, please call 1-800-225-2606 any business day between 8 a.m. and 8 p.m. Eastern time.
Note: If you own MFS products or receive MFS services in the name of a third party such as a bank or broker-dealer, their privacy policy may apply to you instead of ours.
24


MFS® MID CAP VALUE PORTFOLIO
The report is prepared for the general information of contract owners. It is authorized for distribution to prospective investors only when preceded or accompanied by a current prospectus.
NOT FDIC INSURED Ÿ MAY LOSE VALUE Ÿ NO BANK GUARANTEE Ÿ NOT A DEPOSIT Ÿ NOT INSURED BY ANY FEDERAL GOVERNMENT AGENCY OR NCUA/NCUSIF
LETTER FROM THE CEO

Dear Contract Owners:
The market downturns and economic setbacks of late probably rank among the worst financial declines most of us have experienced. Inevitably, people may be questioning their commitment to investing. Still, it is important to remember that downturns are an inescapable part of the business cycle. Such troughs have been seen before, and if we can use history as a guide, market recoveries typically have followed.
Recent events have clearly shown us the value of certain types of investments. In this environment, two of the hallmarks of mutual funds — transparency and liquidity — have become critically important. Unlike some other types of investments, the operations of mutual funds are relatively transparent to their shareholders. With their daily redemption feature, mutual funds also generally provide easy, convenient access to one’s money. Through these recent market upheavals, this level of liquidity enhanced the ability of mutual fund investors to respond and modify their investments as they and their advisors saw fit — a flexibility that those in less liquid investments simply did not have at their disposal.
At MFS® we take particular pride in how well mutual funds can serve investors because we invented the mutual fund in the United States. Established in 1924, Massachusetts Investors Trust was the nation’s first fund. Recent market events only reinforce what we have learned through 85 years — that mutual funds provide unique features that are important to investors in any type of market climate.
Respectfully,

Robert J. Manning
Chief Executive Officer and Chief Investment Officer
MFS Investment Management®
February 17, 2009
The opinions expressed in this letter are subject to change, may not be relied upon for investment advice, and no forecasts can be guaranteed.
Before investing, consider the fund’s investment objectives, risks, charges, and expenses. For a prospectus containing this and other information, contact your investment professional or view online. Read it carefully.
MFS Fund Distributors, Inc., 500 Boylston Street, Boston, MA 02116
1
PORTFOLIO COMPOSITION
Portfolio structure
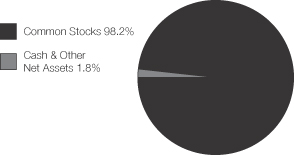
| | |
| Top ten holdings | | |
| Aspen Insurance Holdings Ltd. | | 3.1% |
| Allied World Assurance Co. Holdings Ltd. | | 2.8% |
| Lorillard, Inc. | | 2.7% |
| PPG Industries, Inc. | | 2.5% |
| PNC Financial Services Group, Inc. | | 2.3% |
| Endurance Specialty Holdings Ltd. | | 2.2% |
| Darden Restaurants, Inc. | | 2.2% |
| NVR, Inc. | | 2.0% |
| J.M. Smucker Co. | | 1.9% |
| Mack-Cali Realty Corp., REIT | | 1.8% |
| | |
| Equity sectors | | |
| Financial Services | | 23.9% |
| Utilities & Communications | | 17.3% |
| Consumer Staples | | 8.5% |
| Industrial Goods & Services | | 7.1% |
| Technology | | 6.8% |
| Leisure | | 6.5% |
| Retailing | | 6.0% |
| Health Care | | 6.0% |
| Autos & Housing | | 4.5% |
| Basic Materials | | 4.3% |
| Energy | | 4.0% |
| Special Products & Services | | 2.6% |
| Transportation | | 0.7% |
Percentages are based on net assets as of 12/31/08.
The portfolio is actively managed and current holdings may be different.
2
MANAGEMENT REVIEW
Summary of Results
For the twelve months ended December 31, 2008, Initial Class shares of the MFS Mid Cap Value Portfolio (the “fund”) provided a total return of –42.16%, while Service Class shares of the fund provided a total return of –42.32%. These compare with a return of
–38.44% for the fund’s benchmark, the Russell Midcap Value Index.
Market Environment
The U.S. economy and financial markets experienced significant deterioration and extraordinary volatility over the reporting period. U.S. economic growth slowed significantly, despite the short-term bounce from the second quarter fiscal stimulus. Strong domestic headwinds included accelerated deterioration in the housing market, anemic corporate investment, a rapidly declining job market, and a much tighter credit environment. During the period, a seemingly continuous series of tumultuous financial events hammered markets, including: the distressed sale of failing Bear Stearns to JPMorgan, the conservatorship of Government Sponsored Enterprises (GSEs) Fannie Mae and Freddie Mac, the bankruptcy of investment bank Lehman Brothers, the Federal Reserve Bank’s complex intervention of insurance company American International Group (AIG), the nationalization of several large European banks, the failure of Washington Mutual, and the distressed sale of Wachovia. As a result of this barrage of turbulent news, global equity markets pushed significantly lower and credit markets witnessed the worst dislocation since the beginning of the credit crisis. Though conditions improved towards the end of the period, the state of financial and macroeconomic dislocation remained severe.
While reasonably resilient during the first half of the period, the global economy and financial system increasingly experienced considerable negative spillovers from the U.S. slowdown. Not only did Europe and Japan show obvious signs of economic softening, the more powerful engine of global growth – emerging markets – also displayed weakening dynamics.
During the reporting period, the U.S. Federal Reserve Board cut interest rates aggressively and introduced a multitude of new lending facilities to alleviate ever-tightening credit markets, while the U.S. federal government moved quickly to design and implement a meaningful fiscal stimulus package. Although several other global central banks also cut rates, the dilemma of rising energy and food prices heightened concerns among central bankers that inflationary expectations might become unhinged despite weaker growth. Only later in the reporting period did slowing global growth result in a very precipitous decline in commodity prices, which significantly eased inflation and inflationary expectations. As inflationary concerns diminished in the face of global deleveraging, and equity and credit markets deteriorated more sharply, a coordinated rate cut marked the beginning of much more aggressive easing by the major global central banks.
Detractors from Performance
Stock selection in the industrial goods and services sector was a primary detractor from the fund’s performance relative to the Russell Midcap Value Index. Positioning in integrated supply services provider Wesco International (g) and bearings manufacturer Timken (g) were among the fund’s top detractors as both securities underperformed the index.
In the utilities and communications sector, stock selection also hindered results. The fund’s investment in natural gas pipelines operator Willliams Cos. hurt relative results.
The consumer staples sector was another area of relative weakness, although no individual stocks within this sector were among the fund’s top detractors.
Elsewhere in the fund, our positioning in insurance company Genworth Financial (g), integrated steelmaker U.S. Steel (g), and computer hard drive maker Western Digital (g), all of which underperformed the benchmark, detracted from relative performance. Holdings of cruise line operator Royal Caribbean Cruises, real estate investment trust Apartment Investment and Management (g), commercial banking firm Sovereign (g), and offshore oil and gas exploration company Helix Energy Solutions Group (g) also hindered returns as these four stocks underperformed the benchmark. Shares of Helix declined on concerns of lower production due to Gulf Coast storms.
Contributors to Performance
Stock selection in the retailing sector was one of the positive factors for relative returns during the reporting period. The fund’s positioning in discount retailer Family Dollar Stores, which we held during the stock’s price increase, was among the top relative contributors within this sector.
Stock selection in the financial services sector also aided relative results. The fund’s positioning in banking firm TCF Financial (g), which outperformed the benchmark, and in full service commercial bank East West Bancorp (g), both bolstered relative results. East West Bancorp was a benchmark constituent for the first half of the period, in which the stock’s price hit its low for the reporting period. We held the security for the majority of the period and thus were able to take advantage of the stock’s price rebound. Holdings of insurance companies Allied World Assurance Holdings, Aspen Insurance Holdings (aa), and MetLife (aa), and real estate investment trust Mack-Cali Realty also helped.
3
Management Review – continued
Top relative contributors in other sectors included utility company PG&E Corp., pharmaceutical services company Omnicare (g), and casual dining restaurants operator Darden Restaurants (aa). Shares of Darden Restaurants rose as the company reported better-than-expected earnings. The company attributed this partly to increased same-store sales in its two largest brands, Olive Garden and Red Lobster.
Respectfully,
| | |
| Kevin Schmitz | | Brooks Taylor |
| Portfolio Manager | | Portfolio Manager |
Note to Shareholders: Effective November 20, 2008, Kevin Schmitz and Brooks Taylor became co-managers of the fund. Previously, the fund was managed by Jonathan Sage.
| (aa) | | Security is not a benchmark constituent. |
| (g) | | Security was not held in the portfolio at period end. |
The views expressed in this report are those of the portfolio managers only through the end of the period of the report as stated on the cover and do not necessarily reflect the views of MFS or any other person in the MFS organization. These views are subject to change at any time based on market or other conditions, and MFS disclaims any responsibility to update such views. These views may not be relied upon as investment advice or an indication of trading intent on behalf of any MFS portfolio. References to specific securities are not recommendations of such securities, and may not be representative of any MFS portfolio’s current or future investments.
4
PERFORMANCE SUMMARY THROUGH 12/31/08
The following chart illustrates the historical performance of the fund in comparison to its benchmark(s). Benchmark comparisons are unmanaged; do not reflect any fees or expenses; and cannot be invested in directly. The performance of other share classes will be greater than or less than that of the class depicted below. (See Notes to Performance Summary.)
Performance data shown represents past performance and is no guarantee of future results. Investment return and principal value fluctuate so your units, when sold, may be worth more or less than the original cost; current performance may be lower or higher than quoted. The performance shown does not reflect the deduction of taxes, if any, that a contract holder would pay on fund distributions or the redemption of contract units. The returns for the fund shown also do not reflect the deduction of expenses associated with variable products, such as mortality and expense risk charges, separate account charges, and sales charges imposed by the insurance company separate accounts. Such expenses would reduce the overall returns shown.
Growth of a hypothetical $10,000 investment (t)
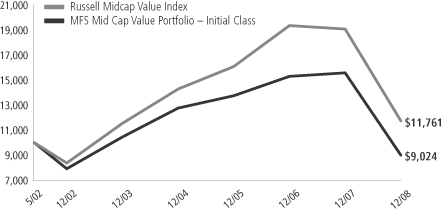
Total rates of return through 12/31/08
Average Annual Total Returns
| | | | | | | | | | | | |
| | | Share class | | Class inception date | | 1-yr | | 5-yr | | Life (t) | | |
| | | Initial Class | | 5/01/02 | | (42.16)% | | (2.94)% | | (1.53)% | | |
| | | Service Class | | 5/01/02 | | (42.32)% | | (3.18)% | | (1.73)% | | |
Comparative Benchmark
| | | | | | | | | | | | |
| | | Russell Midcap Value Index (f) | | (38.44)% | | 0.33% | | 2.45% | | |
| (f) | Source: FactSet Research Systems Inc. |
| (t) | For the period from the commencement of the fund’s investment operations, May 1, 2002, through the stated period end. |
Benchmark Definition
Russell Midcap Value Index – constructed to provide a comprehensive barometer for value securities in the mid-cap segment of the U.S. equity universe. Companies in this index generally have lower price-to-book ratios and lower forecasted growth values.
It is not possible to invest directly in an index.
Notes to Performance Summary
Performance results reflect any applicable expense subsidies and waivers in effect during the periods shown. Without such subsidies and waivers the fund’s performance results would be less favorable. Please see the prospectus for complete details. All results are historical and assume the reinvestment of any dividends and capital gains distributions.
From time to time the fund may receive proceeds from litigation settlements, without which performance would be lower.
5
EXPENSE TABLE
Fund Expenses Borne by the Contract Holders During the Period,
July 1, 2008 through December 31, 2008
As a contract holder of the fund, you incur ongoing costs, including management fees; distribution (12b-1) fees; and other fund expenses. This example is intended to help you understand your ongoing costs (in dollars) of investing in the fund and to compare these costs with the ongoing costs of investing in other mutual funds.
The example is based on an investment of $1,000 invested at the beginning of the period and held for the entire period July 1, 2008 through December 31, 2008.
Actual Expenses
The first line for each share class in the following table provides information about actual account values and actual expenses. You may use the information in this line, together with the amount you invested, to estimate the expenses that you paid over the period. Simply divide your account value by $1,000 (for example, an $8,600 account value divided by $1,000 = 8.6), then multiply the result by the number in the first line under the heading entitled “Expenses Paid During Period” to estimate the expenses you paid on your account during this period.
Hypothetical Example for Comparison Purposes
The second line for each share class in the following table provides information about hypothetical account values and hypothetical expenses based on the fund’s actual expense ratio and an assumed rate of return of 5% per year before expenses, which is not the fund’s actual return. The hypothetical account values and expenses may not be used to estimate the actual ending account balance or expenses you paid for the period. You may use this information to compare the ongoing costs of investing in the fund and other funds. To do so, compare this 5% hypothetical example with the 5% hypothetical examples that appear in the shareholder reports of the other funds.
Please note that the expenses shown in the table are meant to highlight the fund’s ongoing costs only and do not take into account the fees and expenses imposed under the variable contracts through which your investment in the fund is made. Therefore, the second line for each share class in the table is useful in comparing ongoing costs associated with an investment in vehicles (such as the fund) which fund benefits under variable annuity and variable life insurance contracts and to qualified pension and retirement plans only, and will not help you determine the relative total costs of investing in the fund through variable annuity and variable life insurance contracts. If the fees and expenses imposed under the variable contracts were included, your costs would have been higher.
| | | | | | | | | | |
| Share Class | | | | Annualized
Expense Ratio | | Beginning
Account Value
7/01/08 | | Ending
Account Value
12/31/08 | | Expenses Paid
During Period (p)
7/01/08-12/31/08 |
| Initial Class | | Actual | | 1.00% | | $1,000.00 | | $632.40 | | $4.10 |
| | Hypothetical (h) | | 1.00% | | $1,000.00 | | $1,020.11 | | $5.08 |
| Service Class | | Actual | | 1.25% | | $1,000.00 | | $632.05 | | $5.13 |
| | Hypothetical (h) | | 1.25% | | $1,000.00 | | $1,018.85 | | $6.34 |
| (h) | 5% class return per year before expenses. |
| (p) | Expenses paid is equal to each class’ annualized expense ratio, as shown above, multiplied by the average account value over the period, multiplied by the number of days in the period, divided by the number of days in the year. |
6
PORTFOLIO OF INVESTMENTS – 12/31/08
The Portfolio of Investments is a complete list of all securities owned by your fund. It is categorized by broad-based asset classes.
| | | | | |
| Issuer | | Shares/Par | | Value ($) |
| | | | | |
| COMMON STOCKS – 98.2% | | | | | |
| Aerospace – 1.0% | | | |
| Northrop Grumman Corp. | | 2,660 | | $ | 119,806 |
| | | | | |
| Airlines – 0.7% | | | |
| UAL Corp. | | 7,156 | | $ | 78,859 |
| | | | | |
| Alcoholic Beverages – 0.7% | | | |
| Molson Coors Brewing Co. | | 1,730 | | $ | 84,632 |
| | | | | |
| Automotive – 0.7% | | | |
| Johnson Controls, Inc. | | 4,430 | | $ | 80,449 |
| | | | | |
| Broadcasting – 1.0% | | | |
| Omnicom Group, Inc. | | 4,340 | | $ | 116,833 |
| | | | | |
| Brokerage & Asset Managers – 1.0% | | | |
| Deutsche Boerse AG | | 810 | | $ | 58,994 |
| Invesco Ltd. | | 3,960 | | | 57,182 |
| | | | | |
| | | | $ | 116,176 |
| | | | | |
| Business Services – 2.6% | | | |
| Amdocs Ltd. (a) | | 2,000 | | $ | 36,580 |
| MasterCard, Inc., “A” | | 920 | | | 131,496 |
| Watson Wyatt & Co. Holdings | | 600 | | | 28,692 |
| Western Union Co. | | 6,850 | | | 98,229 |
| | | | | |
| | | | $ | 294,997 |
| | | | | |
| Chemicals – 2.5% | | | |
| PPG Industries, Inc. | | 6,670 | | $ | 283,008 |
| | | | | |
| Computer Software – 2.8% | | | |
| Citrix Systems, Inc. (a) | | 1,150 | | $ | 27,105 |
| McAfee, Inc. (a) | | 3,310 | | | 114,427 |
| MicroStrategy, Inc., “A” (a) | | 2,400 | | | 89,112 |
| VeriSign, Inc. (a) | | 4,350 | | | 82,998 |
| | | | | |
| | | | $ | 313,642 |
| | | | | |
| Construction – 3.8% | | | |
| NVR, Inc. (a) | | 510 | | $ | 232,688 |
| Sherwin-Williams Co. | | 2,300 | | | 137,425 |
| Stanley Works | | 1,740 | | | 59,334 |
| | | | | |
| | | | $ | 429,447 |
| | | | | |
| Consumer Goods & Services – 1.3% | | | |
| Avon Products, Inc. | | 2,022 | | $ | 48,589 |
| Clorox Co. | | 1,720 | | | 95,563 |
| | | | | |
| | | | $ | 144,152 |
| | | | | |
| Containers – 0.5% | | | |
| Crown Holdings, Inc. (a) | | 3,000 | | $ | 57,600 |
| | | | | |
| Electrical Equipment – 2.9% | | | |
| Danaher Corp. | | 1,960 | | $ | 110,956 |
| Rockwell Automation, Inc. | | 1,960 | | | 63,190 |
| W.W. Grainger, Inc. | | 2,000 | | | 157,680 |
| | | | | |
| | | | $ | 331,826 |
| | | | | |
| | | | | |
| Issuer | | Shares/Par | | Value ($) |
| | | | | |
| COMMON STOCKS – continued | | | |
| Electronics – 2.2% | | | |
| Agilent Technologies, Inc. (a) | | 6,930 | | $ | 108,316 |
| ASML Holding N.V. | | 1,600 | | | 28,912 |
| National Semiconductor Corp. | | 11,730 | | | 118,121 |
| | | | | |
| | | | $ | 255,349 |
| | | | | |
| Energy – Independent – 2.2% | | | |
| CONSOL Energy, Inc. | | 1,200 | | $ | 34,296 |
| Noble Energy, Inc. | | 1,620 | | | 79,736 |
| Plains Exploration & Production Co. (a) | | 2,320 | | | 53,917 |
| Ultra Petroleum Corp. (a) | | 2,410 | | | 83,169 |
| | | | | |
| | | | $ | 251,118 |
| | | | | |
| Energy – Integrated – 0.5% | | | |
| Hess Corp. | | 970 | | $ | 52,031 |
| | | | | |
| Food & Beverages – 3.8% | | | |
| H.J. Heinz Co. | | 2,420 | | $ | 90,992 |
| J.M. Smucker Co. | | 5,030 | | | 218,101 |
| Pepsi Bottling Group, Inc. | | 5,540 | | | 124,705 |
| | | | | |
| | | | $ | 433,798 |
| | | | | |
| Gaming & Lodging – 0.8% | | | |
| Royal Caribbean Cruises Ltd. | | 6,300 | | $ | 86,625 |
| | | | | |
| General Merchandise – 1.7% | | | |
| Family Dollar Stores, Inc. | | 3,870 | | $ | 100,891 |
| Macy’s, Inc. | | 8,850 | | | 91,597 |
| | | | | |
| | | | $ | 192,488 |
| | | | | |
| Health Maintenance Organizations – 0.7% | | | |
| CIGNA Corp. | | 4,630 | | $ | 78,016 |
| | | | | |
| Insurance – 13.9% | | | |
| Allied World Assurance Co. Holdings Ltd. | | 8,000 | | $ | 324,800 |
| Aon Corp. | | 2,720 | | | 124,250 |
| Aspen Insurance Holdings Ltd. | | 14,740 | | | 357,445 |
| Employers Holdings, Inc. | | 3,810 | | | 62,865 |
| Endurance Specialty Holdings Ltd. | | 8,260 | | | 252,178 |
| MetLife, Inc. | | 3,660 | | | 127,588 |
| PartnerRe Ltd. | | 1,850 | | | 131,849 |
| Prudential Financial, Inc. | | 2,300 | | | 69,598 |
| RenaissanceRe Holdings Ltd. | | 1,100 | | | 56,716 |
| W.R. Berkley Corp. | | 2,560 | | | 79,360 |
| | | | | |
| | | | $ | 1,586,649 |
| | | | | |
| Leisure & Toys – 2.5% | | | |
| Electronic Arts, Inc. (a) | | 5,620 | | $ | 90,145 |
| Hasbro, Inc. | | 6,840 | | | 199,523 |
| | | | | |
| | | | $ | 289,668 |
| | | | | |
| Machinery & Tools – 2.1% | | | |
| Eaton Corp. | | 3,650 | | $ | 181,442 |
| Kennametal, Inc. | | 2,670 | | | 59,247 |
| | | | | |
| | | | $ | 240,689 |
| | | | | |
7
Portfolio of Investments – continued
| | | | | |
| Issuer | | Shares/Par | | Value ($) |
| | | | | |
| COMMON STOCKS – continued |
| Major Banks – 2.3% | | | |
| PNC Financial Services Group, Inc. | | 5,260 | | $ | 257,740 |
| | | | | |
| Medical Equipment – 4.0% | | | |
| Becton, Dickinson & Co. | | 1,600 | | $ | 109,424 |
| Covidien Ltd. | | 3,550 | | | 128,652 |
| Waters Corp. (a) | | 4,250 | | | 155,763 |
| Zimmer Holdings, Inc. (a) | | 1,430 | | | 57,801 |
| | | | | |
| | | | $ | 451,640 |
| | | | | |
| Natural Gas – Distribution – 3.1% | | | |
| Equitable Resources, Inc. | | 2,410 | | $ | 80,856 |
| Questar Corp. | | 5,360 | | | 175,218 |
| Sempra Energy | | 2,230 | | | 95,065 |
| | | | | |
| | | | $ | 351,139 |
| | | | | |
| Natural Gas – Pipeline – 1.4% | | | |
| Williams Cos., Inc. | | 11,310 | | $ | 163,769 |
| | | | | |
| Network & Telecom – 0.8% | | | |
| Ciena Corp. (a) | | 13,200 | | $ | 88,440 |
| | | | | |
| Oil Services – 1.3% | | | |
| Exterran Holdings, Inc. (a) | | 3,770 | | $ | 80,301 |
| Noble Corp. | | 2,980 | | | 65,828 |
| | | | | |
| | | | $ | 146,129 |
| | | | | |
| Other Banks & Diversified Financials – 2.7% | | | |
| Discover Financial Services | | 5,440 | | $ | 51,843 |
| New York Community Bancorp, Inc. | | 14,830 | | | 177,367 |
| People’s United Financial, Inc. | | 4,470 | | | 79,700 |
| | | | | |
| | | | $ | 308,910 |
| | | | | |
| Personal Computers & Peripherals – 1.0% | | | |
| NetApp, Inc. (a) | | 8,450 | | $ | 118,047 |
| | | | | |
| Pharmaceuticals – 1.3% | | | |
| Allergan, Inc. | | 3,670 | | $ | 147,973 |
| | | | | |
| Pollution Control – 1.1% | | | |
| Republic Services, Inc. | | 5,004 | | $ | 124,049 |
| | | | | |
| Real Estate – 4.0% | | | |
| Host Hotels & Resorts, Inc., REIT | | 12,930 | | $ | 97,880 |
| Kilroy Realty Corp., REIT | | 4,380 | | | 146,555 |
| Mack-Cali Realty Corp., REIT | | 8,450 | | | 207,025 |
| | | | | |
| | | | $ | 451,460 |
| | | | | |
| Restaurants – 2.2% | | | |
| Darden Restaurants, Inc. | | 8,890 | | $ | 250,520 |
| | | | | |
| Specialty Chemicals – 1.3% | | | |
| Air Products & Chemicals, Inc. | | 2,370 | | $ | 119,140 |
| RPM International, Inc. | | 2,540 | | | 33,757 |
| | | | | |
| | | | $ | 152,897 |
| | | | | |
| | | | | | | |
| Issuer | | Shares/Par | | Value ($) | |
| | | | | | | |
| COMMON STOCKS – continued | |
| Specialty Stores – 4.3% | | | | |
| Abercrombie & Fitch Co., “A” | | | 2,790 | | $ | 64,365 | |
| O’Reilly Automotive, Inc. (a) | | | 5,520 | | | 169,685 | |
| PetSmart, Inc. | | | 4,670 | | | 86,162 | |
| Staples, Inc. | | | 6,530 | | | 117,018 | |
| Tiffany & Co. | | | 2,370 | | | 56,003 | |
| | | | | | | |
| | | | | $ | 493,233 | |
| | | | | | | |
| Telecommunications – Wireless – 1.4% | | | | |
| Rogers Communications, Inc., “B” | | | 5,540 | | $ | 164,203 | |
| | | | | | | |
| Telephone Services – 1.8% | | | | |
| Embarq Corp. | | | 5,625 | | $ | 202,275 | |
| | | | | | | |
| Tobacco – 2.7% | | | | |
| Lorillard, Inc. | | | 5,530 | | $ | 311,615 | |
| | | | | | | |
| Utilities – Electric Power – 9.6% | | | | |
| Allegheny Energy, Inc. | | | 2,890 | | $ | 97,855 | |
| American Electric Power Co., Inc. | | | 3,580 | | | 119,142 | |
| CMS Energy Corp. | | | 12,250 | | | 123,848 | |
| DPL, Inc. | | | 2,230 | | | 50,933 | |
| Northeast Utilities | | | 6,640 | | | 159,758 | |
| NRG Energy, Inc. (a) | | | 7,250 | | | 169,142 | |
| PG&E Corp. | | | 3,580 | | | 138,582 | |
| Public Service Enterprise Group, Inc. | | | 3,560 | | | 103,845 | |
| Xcel Energy, Inc. | | | 6,820 | | | 126,511 | |
| | | | | | | |
| | | | | $ | 1,089,616 | |
| | | | | | | |
Total Common Stocks
(Identified Cost, $11,910,219) | | | | | $ | 11,191,513 | |
| | | | | | | |
| |
| REPURCHASE AGREEMENTS – 2.5% | | | | |
| Goldman Sachs, 0.01%, dated 12/31/08, due 1/02/09, total to be received $284,000.16 (secured by U.S. Treasury and Federal Agency obligations and Mortgage Backed securities in a jointly traded account), at Cost | | $ | 284,000 | | $ | 284,000 | |
| | | | | | | |
Total Investments
(Identified Cost, $12,194,219) | | | | | $ | 11,475,513 | |
| | | | | | | |
OTHER ASSETS, LESS
LIABILITIES – (0.7)% | | | | | | (74,143 | ) |
| | | | | | | |
| Net Assets – 100.0% | | | | | $ | 11,401,370 | |
| | | | | | | |
| (a) | | Non-income producing security. |
The following abbreviations are used in this report and are defined:
| REIT | | Real Estate Investment Trust |
See Notes to Financial Statements
8
FINANCIAL STATEMENTS | STATEMENT OF ASSETS AND LIABILITIES
This statement represents your fund’s balance sheet, which details the assets and liabilities comprising the total value of the fund.
| | | | | |
At 12/31/08 | | | | | |
Assets | | | | | |
Investments, at value (identified cost, $12,194,219) | | $11,475,513 | | | |
Cash | | 835 | | | |
Receivable for investments sold | | 173,973 | | | |
Interest and dividends receivable | | 20,228 | | | |
Receivable from investment adviser | | 9,576 | | | |
Other assets | | 1,003 | | | |
Total assets | | | | | $11,681,128 |
Liabilities | | | | | |
Payable for investments purchased | | $210,517 | | | |
Payable for fund shares reacquired | | 8,119 | | | |
Payable to affiliates | | | | | |
Management fee | | 451 | | | |
Distribution fees | | 61 | | | |
Administrative services fee | | 55 | | | |
Payable for trustees’ compensation | | 25 | | | |
Accrued expenses and other liabilities | | 60,530 | | | |
Total liabilities | | | | | $279,758 |
Net assets | | | | | $11,401,370 |
Net assets consist of | | | | | |
Paid-in capital | | $18,469,704 | | | |
Unrealized appreciation (depreciation) on investments and translation of assets and liabilities in foreign currencies | | (718,693 | ) | | |
Accumulated net realized gain (loss) on investments and foreign currency transactions | | (6,481,923 | ) | | |
Undistributed net investment income | | 132,282 | | | |
Net assets | | | | | $11,401,370 |
Shares of beneficial interest outstanding | | | | | 2,036,463 |
Initial Class shares | | | | | |
Net assets | | $20,309 | | | |
Shares outstanding | | 3,589 | | | |
Net asset value per share | | | | | $5.66 |
Service Class shares | | | | | |
Net assets | | $11,381,061 | | | |
Shares outstanding | | 2,032,874 | | | |
Net asset value per share | | | | | $5.60 |
See Notes to Financial Statements
9
FINANCIAL STATEMENTS | STATEMENT OF OPERATIONS
This statement describes how much your fund earned in investment income and accrued in expenses. It also describes any gains and/or losses generated by fund operations.
| | | | | | |
Year ended 12/31/08 | | | | | | |
Net investment income | | | | | | |
Income | | | | | | |
Dividends | | $345,621 | | | | |
Interest | | 3,813 | | | | |
Foreign taxes withheld | | (58 | ) | | | |
Total investment income | | | | | $349,376 | |
Expenses | | | | | | |
Management fee | | $125,231 | | | | |
Distribution fees | | 41,676 | | | | |
Administrative services fee | | 10,000 | | | | |
Trustees’ compensation | | 2,356 | | | | |
Custodian fee | | 13,369 | | | | |
Shareholder communications | | 21,034 | | | | |
Auditing fees | | 44,964 | | | | |
Legal fees | | 7,129 | | | | |
Miscellaneous | | 5,280 | | | | |
Total expenses | | | | | $271,039 | |
Fees paid indirectly | | (11 | ) | | | |
Reduction of expenses by investment adviser | | (62,274 | ) | | | |
Net expenses | | | | | $208,754 | |
Net investment income | | | | | $140,622 | |
Realized and unrealized gain (loss) on investments and foreign currency transactions | | | | | | |
Realized gain (loss) (identified cost basis) | | | | | | |
Investment transactions | | $(6,031,876 | ) | | | |
Foreign currency transactions | | (558 | ) | | | |
Net realized gain (loss) on investments and foreign currency transactions | | | | | $(6,032,434 | ) |
Change in unrealized appreciation (depreciation) | | | | | | |
Investments | | $(2,127,561 | ) | | | |
Translation of assets and liabilities in foreign currencies | | 13 | | | | |
Net unrealized gain (loss) on investments and foreign currency translation | | | | | $(2,127,548 | ) |
Net realized and unrealized gain (loss) on investments and foreign currency | | | | | $(8,159,982 | ) |
Change in net assets from operations | | | | | $(8,019,360 | ) |
See Notes to Financial Statements
10
FINANCIAL STATEMENTS | STATEMENTS OF CHANGES IN NET ASSETS
These statements describe the increases and/or decreases in net assets resulting from operations, any distributions, and any shareholder transactions.
| | | | | | |
For years ended 12/31 | | 2008 | | | 2007 | |
Change in net assets | | | | | | |
From operations | | | | | | |
Net investment income | | $140,622 | | | $191,705 | |
Net realized gain (loss) on investments and foreign currency transactions | | (6,032,434 | ) | | 1,976,358 | |
Net unrealized gain (loss) on investments and foreign currency translation | | (2,127,548 | ) | | (1,627,951 | ) |
Change in net assets from operations | | $(8,019,360 | ) | | $540,112 | |
| Distributions declared to shareholders | | | | | | |
From net investment income | | | | | | |
Initial Class | | $(435 | ) | | $(262 | ) |
Service Class | | (191,262 | ) | | (120,734 | ) |
From net realized gain on investments | | | | | | |
Initial Class | | (4,128 | ) | | (1,376 | ) |
Service Class | | (2,404,919 | ) | | (964,003 | ) |
Total distributions declared to shareholders | | $(2,600,744 | ) | | $(1,086,375 | ) |
Change in net assets from fund share transactions | | $(388,550 | ) | | $(2,029,552 | ) |
Total change in net assets | | $(11,008,654 | ) | | $(2,575,815 | ) |
| Net assets | | | | | | |
At beginning of period | | 22,410,024 | | | 24,985,839 | |
At end of period (including undistributed net investment income of $132,282 and
$190,698, respectively) | | $11,401,370 | | | $22,410,024 | |
See Notes to Financial Statements
11
FINANCIAL STATEMENTS | FINANCIAL HIGHLIGHTS
The financial highlights table is intended to help you understand the fund’s financial performance for the past 5 years. Certain information reflects financial results for a single fund share. The total returns in the table represent the rate by which an investor would have earned (or lost) on an investment in the fund share class (assuming reinvestment of all distributions) held for the entire period.
| | | | | | | | | | | | | | | |
| Initial Class | | Years ended 12/31 | |
| | | 2008 | | | 2007 | | | 2006 | | | 2005 | | | 2004 | |
Net asset value, beginning of period | | $11.25 | | | $11.54 | | | $11.73 | | | $12.46 | | | $10.46 | |
| Income (loss) from investment operations | | | | | | | | | | | | | | | |
Net investment income (d) | | $0.10 | | | $0.12 | | | $0.09 | | | $0.04 | | | $0.01 | |
Net realized and unrealized gain (loss) on investments
and foreign currency | | (4.23 | ) | | 0.14 | | | 1.16 | | | 0.70 | | | 2.25 | |
Total from investment operations | | $(4.13 | ) | | $0.26 | | | $1.25 | | | $0.74 | | | $2.26 | |
| Less distributions declared to shareholders | | | | | | | | | | | | | | | |
From net investment income | | $(0.14 | ) | | $(0.09 | ) | | $— | | | $— | | | $(0.01 | ) |
From net realized gain on investments | | (1.32 | ) | | (0.46 | ) | | (1.44 | ) | | (1.47 | ) | | (0.25 | ) |
Total distributions declared to shareholders | | $(1.46 | ) | | $(0.55 | ) | | $(1.44 | ) | | $(1.47 | ) | | $(0.26 | ) |
Net asset value, end of period | | $5.66 | | | $11.25 | | | $11.54 | | | $11.73 | | | $12.46 | |
Total return (%) (k)(r)(s) | | (42.16 | ) | | 1.84 | | | 11.30 | | | 7.63 | | | 22.10 | |
Ratios (%) (to average net assets)
and Supplemental data: | | | | | | | | | | | | | | | |
Expenses before expense reductions (f) | | 1.39 | | | 1.13 | | | 1.10 | | | 1.11 | | | 1.10 | |
Expenses after expense reductions (f) | | 1.00 | | | 1.00 | | | 1.00 | | | 1.00 | | | 1.00 | |
Net investment income | | 1.13 | | | 0.98 | | | 0.81 | | | 0.31 | | | 0.10 | |
Portfolio turnover | | 94 | | | 63 | | | 110 | | | 142 | | | 147 | |
Net assets at end of period (000 Omitted) | | $20 | | | $35 | | | $34 | | | $31 | | | $29 | |
See Notes to Financial Statements
12
Financial Highlights – continued
| | | | | | | | | | | | | | | |
| Service Class | | Years ended 12/31 | |
| | | 2008 | | | 2007 | | | 2006 | | | 2005 | | | 2004 | |
Net asset value, beginning of period | | $11.14 | | | $11.43 | | | $11.66 | | | $12.42 | | | $10.44 | |
| Income (loss) from investment operations | | | | | | | | | | | | | | | |
Net investment income (loss) (d) | | $0.07 | | | $0.09 | | | $0.06 | | | $0.01 | | | $(0.02 | ) |
Net realized and unrealized gain (loss) on investments
and foreign currency | | (4.18 | ) | | 0.14 | | | 1.15 | | | 0.70 | | | 2.25 | |
Total from investment operations | | $(4.11 | ) | | $0.23 | | | $1.21 | | | $0.71 | | | $2.23 | |
| Less distributions declared to shareholders | | | | | | | | | | | | | | | |
From net investment income | | $(0.11 | ) | | $(0.06 | ) | | $— | | | $— | | | $(0.00 | )(w) |
From net realized gain on investments | | (1.32 | ) | | (0.46 | ) | | (1.44 | ) | | (1.47 | ) | | (0.25 | ) |
Total distributions declared to shareholders | | $(1.43 | ) | | $(0.52 | ) | | $(1.44 | ) | | $(1.47 | ) | | $(0.25 | ) |
Net asset value, end of period | | $5.60 | | | $11.14 | | | $11.43 | | | $11.66 | | | $12.42 | |
Total return (%) (k)(r)(s) | | (42.32 | ) | | 1.61 | | | 11.01 | | | 7.40 | | | 21.75 | |
Ratios (%) (to average net assets)
and Supplemental data: | | | | | | | | | | | | | | | |
Expenses before expense reductions (f) | | 1.62 | | | 1.37 | | | 1.34 | | | 1.36 | | | 1.35 | |
Expenses after expense reductions (f) | | 1.25 | | | 1.25 | | | 1.25 | | | 1.25 | | | 1.25 | |
Net investment income (loss) | | 0.84 | | | 0.77 | | | 0.55 | | | 0.06 | | | (0.15 | ) |
Portfolio turnover | | 94 | | | 63 | | | 110 | | | 142 | | | 147 | |
Net assets at end of period (000 Omitted) | | $11,381 | | | $22,375 | | | $24,951 | | | $25,993 | | | $24,479 | |
| (d) | Per share data are based on average shares outstanding. |
| (f) | Ratios do not reflect reductions from fees paid indirectly, if applicable. |
| (k) | The total return does not reflect expenses that apply to separate accounts. Inclusion of these charges would reduce the total return figures for all periods shown. |
| (r) | Certain expenses have been reduced without which performance would have been lower. |
| (s) | From time to time the fund may receive proceeds from litigation settlements, without which performance would be lower. |
| (w) | Per share amount was less than $0.01. |
See Notes to Financial Statements
13
NOTES TO FINANCIAL STATEMENTS
| (1) | | Business and Organization |
MFS Mid Cap Value Portfolio (the fund) is a series of MFS Variable Insurance Trust II (the trust). The trust is organized as a Massachusetts business trust and is registered under the Investment Company Act of 1940, as amended, as an open-end management investment company. The shares of the fund are sold to variable accounts established by insurance companies to fund benefits under variable contracts issued by such companies, and qualified retirement and pension plans.
| (2) | | Significant Accounting Policies |
General – The preparation of financial statements in conformity with U.S. generally accepted accounting principles requires management to make estimates and assumptions that affect the reported amounts of assets and liabilities, and disclosure of contingent assets and liabilities at the date of the financial statements and the reported amounts of revenues and expenses during the reporting period. Actual results could differ from those estimates. The fund can invest in foreign securities. Investments in foreign securities are vulnerable to the effects of changes in the relative values of the local currency and the U.S. dollar and to the effects of changes in each country’s legal, political, and economic environment.
In March 2008, FASB Statement No. 161, Disclosures about Derivative Instruments and Hedging Activities (the “Standard”) was issued, and is effective for financial statements issued for fiscal years and interim periods beginning after November 15, 2008. This Standard provides enhanced disclosures about the fund’s use of and accounting for derivative instruments and the effect of derivative instruments on the fund’s results of operations and financial position. Management is evaluating the application of the Standard to the fund, and has not at this time determined the impact, if any, resulting from the adoption of this Standard on the fund’s financial statements.
FASB Staff Position (FSP) 133-1 was implemented during the period. FSP 133-1 amends FAS 133 to require sellers of credit derivatives to make disclosures that will enable financial statement users to assess the potential effects of those credit derivatives on an entity’s financial position, financial performance and cash flows. There was no impact from implementing FSP 133-1 as the fund did not hold any of these credit derivatives at period end.
Investment Valuations – Equity securities, including restricted equity securities, are generally valued at the last sale or official closing price as reported by a third party pricing service on the market or exchange on which they are primarily traded. For securities for which there were no sales reported that day, equity securities are generally valued at the last quoted daily bid quotation as reported by a third party pricing service on the market or exchange on which they are primarily traded. For securities held short for which there were no sales reported for the day, the position is generally valued at the last quoted daily ask quotation as reported by a third party pricing service on the market or exchange on which such securities are primarily traded. Short-term instruments with a maturity at issuance of 60 days or less may be valued at amortized cost, which approximates market value. Securities and other assets generally valued on the basis of information from a third party pricing service may also be valued at a broker-dealer bid quotation. Values obtained from pricing services can utilize both dealer-supplied valuations and electronic data processing techniques, which take into account factors such as institutional-size trading in similar groups of securities, yield, quality, coupon rate, maturity, type of issue, trading characteristics, and other market data. The values of foreign securities and other assets and liabilities expressed in foreign currencies are converted to U.S. dollars using the mean of bid and asked prices for rates reported by a third party pricing service.
The Board of Trustees has delegated primary responsibility for determining or causing to be determined the value of the fund’s investments (including any fair valuation) to the adviser pursuant to valuation policies and procedures approved by the Board. If the adviser determines that reliable market quotations are not readily available, investments are valued at fair value as determined in good faith by the adviser in accordance with such procedures under the oversight of the Board of Trustees. Under the fund’s valuation policies and procedures, market quotations are not considered to be readily available for most types of debt instruments and floating rate loans and many types of derivatives. These investments are generally valued at fair value based on information from third party pricing services. In addition, investments may be valued at fair value if the adviser determines that an investment’s value has been materially affected by events occurring after the close of the exchange or market on which the investment is principally traded (such as foreign exchange or market) and prior to the determination of the fund’s net asset value, or after the halting of trading of a specific security where trading does not resume prior to the close of the exchange or market on which the security is principally traded. Events that occur on a frequent basis after foreign markets close (such as developments in foreign markets and significant movements in the U.S. markets) and prior to the determination of the fund’s net asset value may be deemed to have a material affect on the value of securities traded in foreign markets. Accordingly, the fund’s foreign equity securities may often be valued at fair value. The adviser may rely on third party pricing services or other information (such as the correlation with price movements of similar securities in the same or other markets; the type, cost and investment characteristics of the security; the business and financial condition of the issuer; and trading and other market data) to assist in determining whether to fair value and at what value to fair value an investment. The value of an investment for purposes of calculating the fund’s net asset value can differ depending on the source and method used to determine value. When fair valuation is used, the value of investments used to determine the fund’s net asset value may differ from quoted or published prices for the same investments.
14
Notes to Financial Statements – continued
The fund adopted FASB Statement No. 157, Fair Value Measurements (the “Statement”). This Statement provides a single definition of fair value, a hierarchy for measuring fair value and expanded disclosures about fair value measurements.
Various inputs are used in determining the value of the fund’s assets or liabilities carried at market value. These inputs are categorized into three broad levels. Level 1 includes quoted prices in active markets for identical assets or liabilities. Level 2 includes other significant observable market-based inputs (including quoted prices for similar securities, interest rates, prepayment speed, and credit risk). Level 3 includes unobservable inputs, which may include the adviser’s own assumptions in determining the fair value of investments. Other financial instruments are derivative instruments not reflected in total investments, such as futures, forwards, swap contracts, and written options. The following is a summary of the levels used as of December 31, 2008 in valuing the fund’s assets or liabilities carried at market value:
| | | | | | | | |
| | | Level 1 | | Level 2 | | Level 3 | | Total |
| Investments in Securities | | $11,132,519 | | $342,994 | | $— | | $11,475,513 |
| Other Financial Instruments | | $— | | $— | | $— | | $— |
Repurchase Agreements – The fund may enter into repurchase agreements with approved counterparties. Each repurchase agreement is recorded at cost. The fund requires that the securities collateral in a repurchase transaction be transferred to a custodian. The fund monitors, on a daily basis, the value of the collateral to ensure that its value, including accrued interest, is greater than amounts owed to the fund under each such repurchase agreement. The fund and other funds managed by Massachusetts Financial Services Company (MFS), may utilize a joint trading account for the purpose of entering into one or more repurchase agreements.
Foreign Currency Translation – Purchases and sales of foreign investments, income, and expenses are converted into U.S. dollars based upon currency exchange rates prevailing on the respective dates of such transactions or on the reporting date for foreign denominated receivables and payables. Gains and losses attributable to foreign currency exchange rates on sales of securities are recorded for financial statement purposes as net realized gains and losses on investments. Gains and losses attributable to foreign exchange rate movements on receivables, payables, income and expenses are recorded for financial statement purposes as foreign currency transaction gains and losses. That portion of both realized and unrealized gains and losses on investments that results from fluctuations in foreign currency exchange rates is not separately disclosed.
Indemnifications – Under the fund’s organizational documents, its officers and trustees may be indemnified against certain liabilities and expenses arising out of the performance of their duties to the fund. Additionally, in the normal course of business, the fund enters into agreements with service providers that may contain indemnification clauses. The fund’s maximum exposure under these agreements is unknown as this would involve future claims that may be made against the fund that have not yet occurred.
Investment Transactions and Income – Investment transactions are recorded on the trade date. Interest income is recorded on the accrual basis. All premium and discount is amortized or accreted for financial statement purposes in accordance with U.S. generally accepted accounting principles. Dividends received in cash are recorded on the ex-dividend date. Certain dividends from foreign securities will be recorded when the fund is informed of the dividend if such information is obtained subsequent to the ex-dividend date. Dividend and interest payments received in additional securities are recorded on the ex-dividend or ex-interest date in an amount equal to the value of the security on such date.
The fund may receive proceeds from litigation settlements. Any proceeds received from litigation involving portfolio holdings are reflected in the Statement of Operations in realized gain/loss if the security has been disposed of by the fund or in unrealized gain/loss if the security is still held by the fund. Any other proceeds from litigation not related to portfolio holdings are reflected as other income in the Statement of Operations.
Fees Paid Indirectly – The fund’s custody fee may be reduced according to an arrangement that measures the value of cash deposited with the custodian by the fund. This amount, for the year ended December 31, 2008, is shown as a reduction of total expenses on the Statement of Operations.
Tax Matters and Distributions – The fund intends to qualify as a regulated investment company, as defined under Subchapter M of the Internal Revenue Code, and to distribute all of its taxable income, including realized capital gains. As a result, no provision for federal income tax is required. Each of the fund’s federal tax returns for the prior three fiscal years remains subject to examination by the Internal Revenue Service. Foreign taxes, if any, have been accrued by the fund in the accompanying financial statements.
Distributions to shareholders are recorded on the ex-dividend date. Income and capital gain distributions are determined in accordance with income tax regulations, which may differ from U.S. generally accepted accounting principles. Certain capital accounts in the financial statements are periodically adjusted for permanent differences in order to reflect their tax character.
15
Notes to Financial Statements – continued
These adjustments have no impact on net assets or net asset value per share. Temporary differences which arise from recognizing certain items of income, expense, gain or loss in different periods for financial statement and tax purposes will reverse at some time in the future. Distributions in excess of net investment income or net realized gains are temporary overdistributions for financial statement purposes resulting from differences in the recognition or classification of income or distributions for financial statement and tax purposes.
Book/tax differences primarily relate to wash sale loss deferrals.
The tax character of distributions declared to shareholders for the last two fiscal years is as follows:
| | | | |
| | | 12/31/08 | | 12/31/07 |
| Ordinary income (including any short-term capital gains) | | $1,041,898 | | $490,424 |
| Long-term capital gain | | 1,558,846 | | 595,951 |
| Total distributions | | $2,600,744 | | $1,086,375 |
The federal tax cost and the tax basis components of distributable earnings were as follows:
| | | |
| As of 12/31/08 | | | |
| Cost of investments | | $12,451,914 | |
| Gross appreciation | | 617,124 | |
| Gross depreciation | | (1,593,525 | ) |
| Net unrealized appreciation (depreciation) | | $(976,401 | ) |
| Undistributed ordinary income | | 132,282 | |
| Capital loss carryforwards | | (6,208,328 | ) |
| Other temporary differences | | (15,887 | ) |
As of December 31, 2008, the fund had capital loss carryforwards available to offset future realized gains. Such losses expire as follows:
Multiple Classes of Shares of Beneficial Interest – The fund offers multiple classes of shares, which differ in their respective distribution fees. The fund’s income, realized and unrealized gain (loss), and common expenses are allocated to shareholders based on the daily net assets of each class. Dividends are declared separately for each class. Differences in per share dividend rates are generally due to differences in separate class expenses.
| (3) | | Transactions with Affiliates |
Investment Adviser – The fund has an investment advisory agreement with MFS to provide overall investment management and related administrative services and facilities to the fund.
The management fee is computed daily and paid monthly at the following annual rates:
| | |
| First $1 billion of average daily net assets | | 0.75% |
| Average daily net assets in excess of $1 billion | | 0.70% |
The management fee incurred for the year ended December 31, 2008 was equivalent to an annual effective rate of 0.75% of the fund’s average daily net assets.
The investment adviser has agreed in writing to pay a portion of the fund’s total annual operating expenses, exclusive of interest, taxes, extraordinary expenses, brokerage and transaction costs and investment-related expenses, such that the total annual operating expenses of the fund do not exceed 1.00% for the Initial Class shares and 1.25% for the Service Class shares, based on the average daily net assets of each share class. This written agreement will continue until April 30, 2010. For the year ended December 31, 2008, this reduction amounted to $62,274 and is reflected as a reduction of total expenses in the Statements of Operations.
Distributor – MFS Fund Distributors, Inc. (MFD), a wholly-owned subsidiary of MFS, is the distributor of shares of the fund. The Trustees have adopted a distribution plan for the Service Class shares pursuant to Rule 12b-1 under the Investment Company Act of 1940.
The fund’s distribution plan provides that the fund will pay MFD distribution fees equal to 0.25% per annum of its average daily net assets attributable to Service Class shares as partial consideration for services performed and expenses incurred by MFD and financial intermediaries in connection with the sale and distribution of the fund’s Service Class shares and the sale and distribution of the variable annuity or variable life insurance contracts investing indirectly in Service Class shares. MFD may subsequently pay all, or a portion, of the distribution fees to financial intermediaries.
16
Notes to Financial Statements – continued
Shareholder Servicing Agent – MFS Service Center, Inc. (MFSC), a wholly-owned subsidiary of MFS, has contracted to provide transfer agent and recordkeeping functions in connection with the issuance, transfer, and redemption of each class of shares of the fund under a Shareholder Servicing Agent Agreement. During the year ended December 31, 2008, the fund did not pay MFSC a fee for this service.
Administrator – MFS provides certain financial, legal, shareholder communications, compliance, and other administrative services to the fund. Under an administrative services agreement, the fund partially reimburses MFS the costs incurred to provide these services. The fund is charged an annual fixed amount of $10,000 plus a fee based on average daily net assets.
The administrative services fee incurred for the year ended December 31, 2008 was equivalent to an annual effective rate of 0.0599% of the fund’s average daily net assets.
Trustees’ and Officers’ Compensation – The fund pays compensation to trustees in the form of a retainer, attendance fees, and additional compensation to the Board chairperson. The fund does not pay compensation directly to officers of the fund who are also officers of the investment adviser, all of whom receive remuneration for their services to the fund from MFS. Certain officers of the fund are officers or directors of MFS, MFD, and MFSC.
Other – This fund and certain other MFS funds (the funds) have entered into services agreements (the Agreements) which provide for payment of fees by the funds to Tarantino LLC and Griffin Compliance LLC in return for the provision of services of an Independent Chief Compliance Officer (ICCO) and Assistant ICCO, respectively, for the funds. The ICCO and Assistant ICCO are officers of the funds and the sole members of Tarantino LLC and Griffin Compliance LLC, respectively. The funds can terminate the Agreements with Tarantino LLC and Griffin Compliance LLC at any time under the terms of the Agreements. MFS has agreed to bear all expenses associated with office space, other administrative support, and supplies provided to the ICCO and Assistant ICCO. For the year ended December 31, 2008, the aggregate fees paid by the fund to Tarantino LLC and Griffin Compliance LLC were $153 and are included in miscellaneous expense on the Statement of Operations.
Purchases and sales of investments, other than U.S. Government securities, purchased option transactions, and short-term obligations, aggregated $15,691,723 and $ 18,035,614, respectively.
| (5) | | Shares of Beneficial Interest |
The fund’s Declaration of Trust permits the Trustees to issue an unlimited number of full and fractional shares of beneficial interest. Transactions in fund shares were as follows:
| | | | | | | | | | | | |
| | | Year ended 12/31/08 | | | Year ended 12/31/07 | |
| | | Shares | | | Amount | | | Shares | | | Amount | |
| Shares sold | | | | | | | | | | | | |
Initial Class | | — | | | $— | | | — | | | $— | |
Service Class | | 363,512 | | | 2,210,771 | | | 217,552 | | | 2,503,318 | |
| | 363,512 | | | $2,210,771 | | | 217,552 | | | $2,503,318 | |
| Shares issued to shareholders in reinvestment of distributions | | | | | | | | | | | | |
Initial Class | | 467 | | | $4,563 | | | 134 | | | $1,638 | |
Service Class | | 268,200 | | | 2,596,181 | | | 89,059 | | | 1,084,737 | |
| | 268,667 | | | $2,600,744 | | | 89,193 | | | $1,086,375 | |
| Shares reacquired | | | | | | | | | | | | |
Initial Class | | — | | | $— | | | — | | | $— | |
Service Class | | (607,825 | ) | | (5,200,065 | ) | | (480,463 | ) | | (5,619,245 | ) |
| | (607,825 | ) | | $(5,200,065 | ) | | (480,463 | ) | | $(5,619,245 | ) |
| Net change | | | | | | | | | | | | |
Initial Class | | 467 | | | $4,563 | | | 134 | | | $1,638 | |
Service Class | | 23,887 | | | (393,113 | ) | | (173,852 | ) | | (2,031,190 | ) |
| | 24,354 | | | $(388,550 | ) | | (173,718 | ) | | $(2,029,552 | ) |
The fund and other funds managed by MFS participate in a $1 billion unsecured committed line of credit provided by a syndication of banks under a credit agreement. In addition, the fund and other funds managed by MFS have established uncommitted borrowing arrangements with certain banks. Borrowings may be made for temporary financing needs. Interest is charged to each fund, based on its borrowings, generally at a rate equal to the Federal Reserve funds rate plus 0.30%. In addition, a commitment fee, based on the average daily, unused portion of the committed line of credit, is allocated among the participating funds at the end of each calendar quarter. For the year ended December 31, 2008, the fund’s commitment fee and interest expense were $82 and $0, respectively, and are included in miscellaneous expense on the Statement of Operations.
17
REPORT OF INDEPENDENT REGISTERED PUBLIC ACCOUNTING FIRM
To the Board of Trustees of MFS Variable Insurance Trust II and the Shareholders of
MFS Mid Cap Value Portfolio:
We have audited the accompanying statement of assets and liabilities, including the portfolio of investments, of MFS Mid Cap Value Portfolio (the “Fund”) (one of the portfolios comprising MFS Variable Insurance Trust II) as of December 31, 2008, and the related statement of operations for the year then ended, the statements of changes in net assets for each of the two years in the period then ended, and the financial highlights for each of the five years in the period then ended. These financial statements and financial highlights are the responsibility of the Fund’s management. Our responsibility is to express an opinion on these financial statements and financial highlights based on our audits.
We conducted our audits in accordance with the standards of the Public Company Accounting Oversight Board (United States). Those standards require that we plan and perform the audit to obtain reasonable assurance about whether the financial statements and financial highlights are free of material misstatement. The Fund is not required to have, nor were we engaged to perform, an audit of its internal control over financial reporting. Our audits included consideration of internal control over financial reporting as a basis for designing audit procedures that are appropriate in the circumstances, but not for the purpose of expressing an opinion on the effectiveness of the Fund’s internal control over financial reporting. Accordingly, we express no such opinion. An audit also includes examining, on a test basis, evidence supporting the amounts and disclosures in the financial statements, assessing the accounting principles used and significant estimates made by management, as well as evaluating the overall financial statement presentation. Our procedures included confirmation of securities owned as of December 31, 2008, by correspondence with the custodian and brokers; where replies were not received from brokers, we performed other auditing procedures. We believe that our audits provide a reasonable basis for our opinion.
In our opinion, the financial statements and financial highlights referred to above present fairly, in all material respects, the financial position of MFS Mid Cap Value Portfolio as of December 31, 2008, the results of its operations for the year then ended, the changes in its net assets for each of the two years in the period then ended, and the financial highlights for each of the five years in the period then ended, in conformity with accounting principles generally accepted in the United States of America.
DELOITTE & TOUCHE LLP
Boston, Massachusetts
February 19, 2009
18
TRUSTEES AND OFFICERS – IDENTIFICATION AND BACKGROUND
The Trustees and officers of the Trust, as of February 1, 2009, are listed below, together with their principal occupations during the past five years. (Their titles may have varied during that period.) The address of each Trustee and officer is 500 Boylston Street, Boston, Massachusetts 02116.
| | | | | | |
Name, Date of Birth | | Position(s) Held
with Fund | | Trustee/Officer
Since (1) | | Principal Occupations During the Past Five Years and
Other Directorships (2) |
| INTERESTED TRUSTEE | | | | |
David D. Horn (3) (born 6/07/41) | | Trustee | | April 1986 | | Private investor; Sun Life Assurance Company of Canada, Senior Vice President and General Manager for the United States (until 1997); Director (until March 2004) |
| | |
| INDEPENDENT TRUSTEES | | | | |
J. Kermit Birchfield (born 1/08/40) | | Chairman | | May 1997 | | Consultant; Century Partners, Inc. (investments), Director; Displaytech, Inc. (technology), Director; Dessin Fournir LLC (furniture manufacturer), Director (2005 to present); Intermountain Gas Company, Inc. & Intermountain Industries, Inc. (oil & gas exploration and production), Director; Site Watch LLC (software to monitor oil tanks), Managing Director (2006 to present); Juridica Investments (fund investing in judicial matters), Director (2007 to present); HPSC, Inc. (medical financing), Director (until January 2004) |
| | | |
Robert C. Bishop (born 1/13/43) | | Trustee | | May 2001 | | AutoImmune, Inc. (pharmaceutical product development), Chairman, President and Chief Executive Officer; Caliper Life Sciences Corp. (laboratory analytical instruments), Director; Millipore Corporation (purification/filtration products), Director; Waterstreet Capital (leverage buyouts), Advisory Board (August 2006 to present); Optobionics Corporation (ophthalmic devices), Director (2002 to 2007) |
| | | |
Frederick H. Dulles (born 3/12/42) | | Trustee | | May 2001 | | Ten State International Law PLLC (law firm), Of Counsel (since 2006); Prudential Carolina Real Estate, (real estate), Broker (since 2006); Free Enterprise Foundation, Inc. (research institute), Director & Secretary (until 2008); Disher, Hamrick & Myers Residential, Inc. (real estate) Broker (2005 until 2006); Frederick H. Dulles law practice (until 2006); Ten State Street LLP (law firm), Member (until 2005) |
| | | |
Marcia A. Kean (born 6/30/48) | | Trustee | | April 2005 | | Feinstein Kean Healthcare (consulting), Chief Executive Officer |
| | | |
Ronald G. Steinhart (born 6/15/40) | | Trustee | | May 2001 | | Private investor; Penske Automotive Group (automotive retailer), Director; Animal Health International, Inc. (animal health products), Director (since 2007); Texas Industries (concrete/aggregates/cement), Director (since 2007); Penson Worldwide, Inc. (securities clearance), Director (since 2006); Carreker Corporation (technology consulting) Director (until 2005); Prentiss Properties Trust (real estate investment trust), Director (until 2006) |
| | | |
Haviland Wright (born 7/21/48) | | Trustee | | May 2001 | | Profitability of Hawaii (software), Chief Development Officer (since December 2008); Elixir Technologies Corporation (software) Director (since 2005); Nano Loa Inc. (liquid crystal displays), Director |
| | |
| TRUSTEE EMERITUS | | | | |
Samuel Adams (born 10/19/25) | | Trustee Emeritus | | | | Retired; K&L Gates LLP (law firm), Of Counsel |
| | |
| OFFICERS | | | | |
Maria F. Dwyer (4) (born 12/01/58) | | President | | November 2005 | | Massachusetts Financial Services Company, Executive Vice President and Chief Regulatory Officer (since March 2004) Chief Compliance Officer (since December 2006); Fidelity Management & Research Company, Vice President (prior to March 2004); Fidelity Group of Funds, President and Treasurer (until March 2004) |
| | | |
Christopher R. Bohane (4) (born 1/18/74) | | Assistant Secretary and Assistant Clerk | | July 2005 | | Massachusetts Financial Services Company, Vice President and Senior Counsel |
| | | |
John M. Corcoran (4) (born 4/13/65) | | Treasurer | | October 2008 | | Massachusetts Financial Services Company, Senior Vice President (since October 2008); State Street Bank and Trust (financial services provider), Senior Vice President, (until September 2008) |
| | | |
Ethan D. Corey (4) (born 11/21/63) | | Assistant Secretary and Assistant Clerk | | July 2005 | | Massachusetts Financial Services Company, Senior Vice President and Associate General Counsel (since 2004); Dechert LLP (law firm), Counsel (prior to December 2004) |
| | | |
David L. DiLorenzo (4) (born 8/10/68) | | Assistant Treasurer | | July 2005 | | Massachusetts Financial Services Company, Vice President (since June 2005); JP Morgan Investor Services, Vice President (until June 2005) |
| | | |
Timothy M. Fagan (4) (born 7/10/68) | | Assistant Secretary and Assistant Clerk | | September 2005 | | Massachusetts Financial Services Company, Vice President and Senior Counsel (since September 2005); John Hancock Advisers, LLC, Vice President, Senior Attorney and Chief Compliance Officer (until August 2005) |
19
Trustees and Officers – continued
| | | | | | |
Name, Date of Birth | | Position(s) Held
with Fund | | Trustee/Officer
Since (1) | | Principal Occupations During the Past Five Years and
Other Directorships (2) |
Mark D. Fischer (4) (born 10/27/70) | | Assistant Treasurer | | July 2005 | | Massachusetts Financial Services Company, Vice President (since May 2005); JP Morgan Investment Management Company, Vice President (until May 2005) |
| | | |
Robyn L. Griffin (born 7/04/75) | | Assistant Independent Chief Compliance Officer | | August 2008 | | Griffin Compliance LLC (provider of compliance services), Principal (since August 2008); State Street Corporation (financial services provider), Mutual Fund Administration Assistant Vice President (October 2006 – July 2008); Liberty Mutual Group (insurance), Personal Market Assistant Controller (April 2006 – October 2006); Deloitte & Touche LLP (professional services firm), Senior Manager (prior to April 2006) |
| | | |
Brian E. Langenfeld (4) (born 3/07/73) | | Assistant Secretary and Assistant Clerk | | May 2006 | | Massachusetts Financial Services Company, Vice President and Senior Counsel (since May 2006); John Hancock Advisers, LLC, Assistant Vice President and Counsel (until April 2006) |
| | | |
Ellen Moynihan (4) (born 11/13/57) | | Assistant Treasurer | | May 1997 | | Massachusetts Financial Services Company, Senior Vice President |
| | | |
Susan S. Newton (4) (born 3/07/50) | | Assistant Secretary and Assistant Clerk | | May 2005 | | Massachusetts Financial Services Company, Senior Vice President and Associate General Counsel (since April 2005); John Hancock Advisers, LLC, Senior Vice President, Secretary and Chief Legal Officer (until April 2005) |
| | | |
Susan A. Pereira (4) (born 11/05/70) | | Assistant Secretary and Assistant Clerk | | July 2005 | | Massachusetts Financial Services Company, Vice President and Senior Counsel (since June 2004); Bingham McCutchen LLP (law firm), Associate (until June 2004) |
| | | |
Mark N. Polebaum (4) (born 5/01/52) | | Secretary and Clerk | | February 2006 | | Massachusetts Financial Services Company, Executive Vice President, General Counsel and Secretary (since January 2006); Wilmer Cutler Pickering Hale and Dorr LLP (law firm), Partner (until January 2006) |
| | | |
Frank L. Tarantino (born 3/07/44) | | Independent Chief Compliance Officer | | September 2004 | | Tarantino LLC (provider of compliance services), Principal (since June 2004); CRA Business Strategies Group (consulting services), Executive Vice President (until June 2004) |
| | | |
Richard S. Weitzel (4) (born 7/16/70) | | Assistant Secretary and Assistant Clerk | | October 2007 | | Massachusetts Financial Services Company, Vice President and Assistant General Counsel (since 2004); Massachusetts Department of Business and Technology, General Counsel (until April 2004) |
| | | |
James O. Yost (4) (born 6/12/60) | | Assistant Treasurer | | April 1992 | | Massachusetts Financial Services Company, Senior Vice President |
| (1) | Date first appointed to serve as Trustee/Officer of an MFS fund or a Compass variable account. Each Trustee has served continuously since appointment. |
| (2) | Directorships or trusteeships of companies required to report to the Securities and Exchange Commission (i.e., “public companies”). |
| (3) | “Interested person” of the Trust, within the meaning of the Investment Company Act of 1940 (referred to as the 1940 Act), which is the principal federal law governing investment companies like the Trust, as a result of position with Sun Life of Canada (U.S.). The address of Sun Life of Canada (U.S.) is One Sun Life Executive Park, Wellesley Hills, Massachusetts 02481. |
| (4) | “Interested person” of MFS within the meaning of the 1940 Act. The address of MFS is 500 Boylston Street, Boston, Massachusetts 02116. |
The Trust does not hold annual meetings for the purpose of electing Trustees, and Trustees are not elected for fixed terms. Each Trustee and officer holds office until his or her successor is chosen and qualified, or until his or her earlier death, resignation, retirement or removal.
All Trustees currently serve as Trustees of the Trust and have served in that capacity since originally elected or appointed. All of the Trustees are also Managers of the Compass Variable Accounts. The executive officers of the Trust hold similar offices for the Compass Variable Accounts and other funds in the MFS fund complex. As of January 1, 2009, each Trustee serves as a Trustee or Manager of 35 Accounts/Funds.
The Statement of Additional Information contains further information about the Trustees and is available without charge upon request by calling 1-800-752-7215.
| | |
Investment Adviser
Massachusetts Financial Services Company 500 Boylston Street, Boston, MA 02116-3741 | | Custodian State Street Bank and Trust 1 Lincoln Street, Boston, MA 02111-2900 |
Distributor
MFS Fund Distributors, Inc. 500 Boylston Street, Boston, MA 02116-3741 | | Independent Registered Public Accounting Firm Deloitte & Touche LLP 200 Berkeley Street, Boston, MA 02116 |
Portfolio Managers Kevin Schmitz Brooks Taylor | | |
20
BOARD REVIEW OF INVESTMENT ADVISORY AGREEMENT
The Investment Company Act of 1940 requires that both the full Board of Trustees and a majority of the non-interested (“independent”) Trustees, voting separately, annually approve the continuation of the investment advisory agreement between MFS Variable Insurance Trust II (the “Trust”) and Massachusetts Financial Services Company (“MFS”) on behalf of the Fund. The Trustees consider matters bearing on the Fund and the advisory arrangements at their meetings throughout the year, including a review of performance data at each regular meeting. In addition, the independent Trustees met in May and again in July 2008 (“contract review meetings”) for the specific purpose of considering whether to approve the continuation of the investment advisory agreement for the Fund. The independent Trustees were assisted in their evaluation of the investment advisory agreement by independent legal counsel, from whom they received separate legal advice and with whom they met separately from MFS management during various contract review meetings. The independent Trustees were also assisted in this process by the Fund’s Independent Chief Compliance Officer, a full-time senior officer appointed by and reporting to the independent Trustees.
In connection with their deliberations, the Trustees, including the independent Trustees, considered such information and factors as they believed, in light of the legal advice furnished to them and their own business judgment, to be relevant. The investment advisory agreement was considered separately for the Fund, although the Trustees also took into account the common interests of all Funds in the Trust in their review. As described below, the Trustees considered the nature, quality, and extent of the various investment advisory, administrative, and shareholder services performed by MFS under the existing investment advisory agreement and other arrangements with the Trust.
In connection with their contract review meetings, the Trustees received and relied upon materials which included, among other items: (i) information provided by Lipper Inc. on the investment performance of the Fund for various time periods ended December 31, 2007, compared to the investment performance of a group of funds with substantially similar investment classifications/objectives (the “Lipper performance universe”), (ii) information provided by Lipper Inc. on the Fund’s advisory fees and other expenses compared to the advisory fees and other expenses of comparable funds identified by Lipper (the “Lipper expense group”), (iii) information provided by MFS on the advisory fees of comparable portfolios of its other clients, including institutional separate account and other clients, (iv) information as to whether expense waivers, reimbursements or fee “breakpoints” are observed for the Fund, (v) information regarding MFS’ financial results and financial condition, including MFS’ and certain of its affiliates’ estimated profitability from services performed for the Fund, (vi) MFS’ views regarding the outlook for the mutual fund industry and its strategic business plans, (vii) descriptions of various functions performed by MFS for the Trust, such as compliance monitoring and portfolio trading practices, and (viii) information regarding the overall organization of MFS, including information about MFS’ senior management and other personnel providing investment advisory, administrative and other services to the Fund. The comparative performance, fee and expense information prepared and provided by Lipper Inc. was not independently verified, and the independent Trustees did not independently verify any information provided to them by MFS.
The Trustees’ conclusion as to the continuation of the investment advisory agreement was based on comprehensive consideration of all information provided to the Trustees and not the result of any single factor. Some of the factors that figured particularly in the Trustees’ deliberations are described below for the Fund, while individual Trustees may have given different weight to various factors and evaluated the information presented as a whole differently than another Trustee. The Trustees recognized that the fee arrangements for the Fund reflect years of review and discussion between the independent Trustees and MFS, that certain aspects of such arrangements may receive greater scrutiny in some years than others, and that the Trustees’ conclusions may be based, in part, on their consideration of these same arrangements during the course of the year and in prior years.
Based on information provided by Lipper Inc., the Trustees compared the Fund’s total return investment performance to the performance of a peer group of funds over various time periods. The Trustees placed particular emphasis on the total return performance of the Fund’s Initial Class shares in comparison to the performance of funds in its Lipper performance universe over the one-, three- and five-year periods. The Trustees did not rely on performance results for more recent periods, including those shown elsewhere in this report.
The Trustees noted the performance of the Fund’s Initial Class shares was in the 3rd quintile relative to the other funds in the Lipper Classification Index for the one-year period (the 1st quintile being the best performers and the 5th quintile being the worst performers). The total return performance of the Fund was in the 5th quintile for the three-year period and the 4th quintile for the five-year period ended December 31, 2007, relative to the Lipper performance universe. Based on the nature and quality of services provided by MFS, the Board of Trustees concluded that the Fund’s performance was adequate.
In the course of their deliberations, the Trustees took into account information provided by MFS during contract review meetings, as well as during investment review meetings conducted with portfolio management personnel during the course of the year.
21
Board Review of Investment Advisory Agreement – continued
In assessing the reasonableness of the Fund’s advisory fee, the Trustees considered, among other information, the Fund’s advisory fee and the total expense ratio of the Fund’s Initial Class shares as a percentage of average daily net assets, compared to the advisory fee and total expense ratios of its peer group of funds based on information provided by Lipper Inc. The Trustees also considered the advisory fees charged by MFS to institutional accounts. In comparing these fees, the Trustees considered the generally broader scope of services provided by MFS to the Trust than those provided to institutional accounts. The Trustees also considered the higher demands placed on MFS’ investment personnel and trading infrastructure as a result of the daily cash in-flows and out-flows of the Fund, and the impact on MFS and related expenses due to the more extensive regulatory regime to which the Fund is subject, compared to institutional accounts.
In considering the fees, the Trustees noted from the Lipper data that the Fund’s effective advisory fee rate was below the median and total expense ratio was approximately at the median of such fees and expenses of funds in the Lipper expense group. In addition, the Trustees accepted MFS’ offer to continue the expense limitation for the Fund. The Trustees further concluded that the existing breakpoint was sufficient to allow the Fund to benefit from economies of scale as its assets grow. The Trustees concluded that the fees were reasonable in light of the nature and quality of services provided.
The Trustees also considered information prepared by MFS relating to its costs and profits with respect to the Fund and other investment companies and accounts advised by MFS, as well as MFS’ methodologies used to determine and allocate its costs to the Fund and other accounts and products for purposes of estimating profitability.
After reviewing these and other factors described below, the Trustees concluded that the advisory fees charged to the Fund represent reasonable compensation in light of the nature and quality of the services being provided by MFS.
In addition, the Trustees considered MFS’ resources and related efforts to continue to retain, attract and motivate capable personnel to serve the Fund. The Trustees also considered the financial resources of MFS and its parent, Sun Life Financial Inc. The Trustees further considered any advantages and possible disadvantages of having an adviser which also serves other investment companies as well as institutional accounts.
The Trustees also considered the nature, quality, cost, and extent of administrative, transfer agency, and distribution services provided to the Fund by MFS and its affiliates under agreements and plans other than the investment advisory agreement, including the 12b-1 fees the Fund pays to MFS Fund Distributors, Inc., an affiliate of MFS. The Trustees also considered the nature, extent and quality of certain other services MFS performs or arranges on the Fund’s behalf, which may include securities lending programs, directed expense payment programs, class action recovery programs, and MFS’ interaction with third-party service providers, principally custodians and sub-custodians. The Trustees concluded that the various non-advisory services provided by MFS and its affiliates on behalf of the Fund were satisfactory. The Trustees also considered the benefits to MFS from the use of the Fund’s portfolio brokerage commissions to pay for research and other similar services and various other factors. Additionally, the Trustees considered so-called “fall-out benefits” to MFS such as reputational value derived from serving as investment manager to the Trust, and determined that any such benefits derived by MFS were reasonable and fair.
Based on their evaluation of factors that they deemed to be material, including those factors described above, the Board of Trustees, including a majority of the independent Trustees, concluded that the investment advisory agreement should be continued for an additional one-year period, commencing September 1, 2008.
A discussion regarding the Board’s most recent review and renewal of the fund’s Investment Advisory Agreement with MFS is available by clicking on the fund’s name under “Variable Insurance Portfolios-VIT II” in the “Products & Performance” section on the MFS Web site (mfs.com).
22
PROXY VOTING POLICIES AND INFORMATION
A general description of the MFS funds’ proxy voting policies and procedures is available without charge, upon request, by calling
1-800-225-2606, by visiting the Proxy Voting section of mfs.com or by visiting the SEC’s Web site at http://www.sec.gov.
Information regarding how the fund voted proxies relating to portfolio securities during the most recent twelve-month period ended June 30 is available without charge by visiting the Proxy Voting section of mfs.com or by visiting the SEC’s Web site at http://www.sec.gov.
QUARTERLY PORTFOLIO DISCLOSURE
The fund will file a complete schedule of portfolio holdings with the Securities and Exchange Commission (the Commission) for the first and third quarters of each fiscal year on Form N-Q. The fund’s Form N-Q may be reviewed and copied at the:
Public Reference Room
Securities and Exchange Commission
100 F Street, NE, Room 1580
Washington, D.C. 20549
Information on the operation of the Public Reference Room may be obtained by calling the Commission at 1-800-SEC-0330. The fund’s Form N-Q is available on the EDGAR database on the Commission’s Internet Web site at http://www.sec.gov, and copies of this information may be obtained, upon payment of a duplicating fee, by electronic request at the following e-mail address: publicinfo@sec.gov or by writing the Public Reference Section at the above address.
FEDERAL TAX INFORMATION (unaudited)
The following information is provided pursuant to provisions of the Internal Revenue Code.
The fund designates $1,558,846 as capital gain dividends paid during the fiscal year.
For corporate shareholders, 39.21% of the ordinary income dividends paid during the fiscal year qualify for the corporate dividends received deduction.
23
MFS® PRIVACY NOTICE
Privacy is a concern for every investor today. At MFS Investment Management® and the MFS funds, we take this concern very seriously. We want you to understand our policies about the investment products and services that we offer, and how we protect the nonpublic personal information of investors who have a direct relationship with us and our wholly owned subsidiaries.
Throughout our business relationship, you provide us with personal information. We maintain information and records about you, your investments, and the services you use. Examples of the nonpublic personal information we maintain include
| | Ÿ | | data from investment applications and other forms |
| | Ÿ | | share balances and transactional history with us, our affiliates, or others |
| | Ÿ | | facts from a consumer reporting agency |
We do not disclose any nonpublic personal information about our customers or former customers to anyone, except as permitted by law. We may share nonpublic personal information with third parties or certain of our affiliates in connection with servicing your account or processing your transactions. We may share information with companies or financial institutions that perform marketing services on our behalf or with other financial institutions with which we have joint marketing arrangements, subject to any legal requirements.
Authorization to access your nonpublic personal information is limited to appropriate personnel who provide products, services, or information to you. We maintain physical, electronic, and procedural safeguards to help protect the personal information we collect about you.
If you have any questions about the MFS privacy policy, please call 1-800-225-2606 any business day between 8 a.m. and 8 p.m. Eastern time.
Note: If you own MFS products or receive MFS services in the name of a third party such as a bank or broker-dealer, their privacy policy may apply to you instead of ours.
24


MFS® NEW DISCOVERY PORTFOLIO
The report is prepared for the general information of contract owners. It is authorized for distribution to prospective investors only when preceded or accompanied by a current prospectus.
NOT FDIC INSURED Ÿ MAY LOSE VALUE Ÿ NO BANK GUARANTEE Ÿ NOT A DEPOSIT Ÿ NOT INSURED BY ANY FEDERAL GOVERNMENT AGENCY OR NCUA/NCUSIF
LETTER FROM THE CEO

Dear Contract Owners:
The market downturns and economic setbacks of late probably rank among the worst financial declines most of us have experienced. Inevitably, people may be questioning their commitment to investing. Still, it is important to remember that downturns are an inescapable part of the business cycle. Such troughs have been seen before, and if we can use history as a guide, market recoveries typically have followed.
Recent events have clearly shown us the value of certain types of investments. In this environment, two of the hallmarks of mutual funds — transparency and liquidity — have become critically important. Unlike some other types of investments, the operations of mutual funds are relatively transparent to their shareholders. With their daily redemption feature, mutual funds also generally provide easy, convenient access to one’s money. Through these recent market upheavals, this level of liquidity enhanced the ability of mutual fund investors to respond and modify their investments as they and their advisors saw fit — a flexibility that those in less liquid investments simply did not have at their disposal.
At MFS® we take particular pride in how well mutual funds can serve investors because we invented the mutual fund in the United States. Established in 1924, Massachusetts Investors Trust was the nation’s first fund. Recent market events only reinforce what we have learned through 85 years — that mutual funds provide unique features that are important to investors in any type of market climate.
Respectfully,

Robert J. Manning
Chief Executive Officer and Chief Investment Officer
MFS Investment Management®
February 17, 2009
The opinions expressed in this letter are subject to change, may not be relied upon for investment advice, and no forecasts can be guaranteed.
Before investing, consider the fund’s investment objectives, risks, charges, and expenses. For a prospectus containing this and other information, contact your investment professional or view online. Read it carefully.
MFS Fund Distributors, Inc., 500 Boylston Street, Boston, MA 02116
1
PORTFOLIO COMPOSITION
Portfolio structure
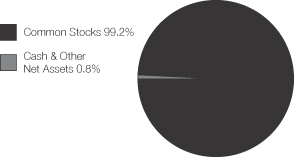
| | |
| Top ten holdings | | |
| IDEXX Laboratories, Inc. | | 2.7% |
| MWI Veterinary Supply, Inc. | | 2.3% |
| Quanta Services, Inc. | | 2.0% |
| Concur Technologies, Inc. | | 2.0% |
| New Oriental Education & Technology Group, Inc., ADR | | 1.9% |
| ABIOMED, Inc. | | 1.7% |
| Dresser-Rand Group, Inc. | | 1.7% |
| International Game Technology | | 1.6% |
| Exterran Holdings, Inc. | | 1.6% |
| Hittite Microwave Corp. | | 1.6% |
| | |
| Equity sectors | | |
| Health Care | | 23.6% |
| Technology | | 21.1% |
| Special Products & Services | | 11.0% |
| Energy | | 9.3% |
| Leisure | | 9.3% |
| Industrial Goods & Services | | 6.8% |
| Retailing | | 5.6% |
| Basic Materials | | 4.0% |
| Transportation | | 3.3% |
| Autos & Housing | | 2.1% |
| Financial Services | | 1.9% |
| Consumer Staples | | 1.2% |
Percentages are based on net assets as of 12/31/08.
The portfolio is actively managed and current holdings may be different.
2
MANAGEMENT REVIEW
Summary of Results
For the twelve months ended December 31, 2008, Initial Class shares of the MFS New Discovery Portfolio (the “fund”) provided a total return of –39.57%, while Service Class shares of the fund provided a total return of –39.76%. These compare with a return of –38.54% for the fund’s benchmark, the Russell 2000 Growth Index.
Market Environment
The U.S. economy and financial markets experienced significant deterioration and extraordinary volatility over the reporting period. U.S. economic growth slowed significantly, despite the short-term bounce from the second quarter fiscal stimulus. Strong domestic headwinds included accelerated deterioration in the housing market, anemic corporate investment, a rapidly declining job market, and a much tighter credit environment. During the period, a seemingly continuous series of tumultuous financial events hammered markets, including: the distressed sale of failing Bear Stearns to JPMorgan, the conservatorship of Government Sponsored Enterprises (GSEs) Fannie Mae and Freddie Mac, the bankruptcy of investment bank Lehman Brothers, the Federal Reserve Bank’s complex intervention of insurance company American International Group (AIG), the nationalization of several large European banks, the failure of Washington Mutual, and the distressed sale of Wachovia. As a result of this barrage of turbulent news, global equity markets pushed significantly lower and credit markets witnessed the worst dislocation since the beginning of the credit crisis. Though conditions improved towards the end of the period, the state of financial and macroeconomic dislocation remained severe.
While reasonably resilient during the first half of the period, the global economy and financial system increasingly experienced considerable negative spillovers from the U.S. slowdown. Not only did Europe and Japan show obvious signs of economic softening, the more powerful engine of global growth – emerging markets – also displayed weakening dynamics.
During the reporting period, the U.S. Federal Reserve Board cut interest rates aggressively and introduced a multitude of new lending facilities to alleviate ever-tightening credit markets, while the U.S. federal government moved quickly to design and implement a meaningful fiscal stimulus package. Although several other global central banks also cut rates, the dilemma of rising energy and food prices heightened concerns among central bankers that inflationary expectations might become unhinged despite weaker growth. Only later in the reporting period did slowing global growth result in a very precipitous decline in commodity prices, which significantly eased inflation and inflationary expectations. As inflationary concerns diminished in the face of global deleveraging, and equity and credit markets deteriorated more sharply, a coordinated rate cut marked the beginning of much more aggressive easing by the major global central banks.
Detractors from Performance
Relative to the Russell 2000 Growth Index, stock selection in the health care sector was the key factor that held back performance. Within this sector, the fund’s holdings of poor-performing medical device manufacturers NxStage Medical and Mindray Medical International (aa) were among the top relative detractors. Shares of Mindray were under some pressure, we believe, due to concerns that a slowdown in hospital spending on capital equipment, such as Mindray’s imaging and diagnostic system, would impact the company’s revenues.
In the industrial goods and services sector, security selection also dampened relative performance. Within this sector, oil and natural resource infrastructure provider North American Energy Partners (aa) was a top relative detractor.
Stock selection and an overweighted position in the energy sector hurt relative performance. The fund’s holdings of offshore oil and gas exploration company Helix Energy Solutions Group (aa) and oil and gas services company Exterran Holdings (aa) hindered relative results as both stocks underperformed the benchmark over the reporting period.
A combination of stock selection and an underweighted position in the financial services sector was another negative factor in the fund’s relative performance. No individual securities within this sector were among the fund’s top relative detractors for the period.
Elsewhere, holdings of aluminum producer Century Aluminum, interactive entertainment software company THQ, Inc., business research provider Corporate Executive Board (aa), McCormick & Schmicks Seafood Restaurant, and homebuilder Lennar
Corp. (aa)(g), held back relative returns. Like most U.S. homebuilders, Lennar’s shares are well off their 2005 highs. We believe that the company’s stock was further pressured by investor’s scrutiny over its extensive use of the joint venture land-buying structure, which requires a relatively low level of official disclosure. We sold the stock late in the period on concerns about its liquidity situation given the company’s relatively high debt load, declining cash balance and weakening free cash flow generation.
During the reporting period, the fund’s currency exposure was also a relative detractor. All of MFS’ investment decisions are driven by the fundamentals of each individual opportunity and as such, it is common for our portfolios to have different currency exposure than the benchmark.
3
Management Review – continued
Contributors to Performance
Stock selection in the retailing sector was the primary contributor to performance relative to the benchmark. An overweighted position in urban fashion apparel retailer Citi Trends was among the fund’s top contributors. Citi Trends benefited from efforts to improve the management of its inventory levels, which led to a higher gross margin. The fund’s positioning in strong-performing discount retailer 99 Cents Only Stores (g), which outperformed the benchmark over the reporting period, also helped.
A combination of stock selection and an overweighted position in the special products and services sector benefited relative performance. Within this sector, the fund’s holdings of strong-performing online university Capella Education Company boosted relative results. Capella’s positive performance was due, in part, to robust revenue growth, primarily from strong demand and by offering new programs and specializations. Positioning in expense management software company Concur Technologies was another positive factor as the fund increased its holdings prior to the stock’s run-up in the latter part of the reporting period.
Stock selection in the transportation sector also aided relative performance. Within this sector, holdings of strong-performing airline carrier Allegiant Travel contributed to relative returns.
Elsewhere, the fund’s holdings of electric and gas infrastructure services provider Quanta Services (aa), oil and gas exploration and production company EXCO Resources, retail bakery-cafes operator Panera Bread (aa)(g), medical device maker ABIOMED, and homebuilder Pulte Homes (aa) were top relative contributors.
Respectfully,
Thomas Wetherald
Portfolio Manager
| (aa) | | Security is not a benchmark constituent. |
| (g) | | Security was not held in the portfolio at period end. |
The views expressed in this report are those of the portfolio manager only through the end of the period of the report as stated on the cover and do not necessarily reflect the views of MFS or any other person in the MFS organization. These views are subject to change at any time based on market or other conditions, and MFS disclaims any responsibility to update such views. These views may not be relied upon as investment advice or an indication of trading intent on behalf of any MFS portfolio. References to specific securities are not recommendations of such securities, and may not be representative of any MFS portfolio’s current or future investments.
4
PERFORMANCE SUMMARY THROUGH 12/31/08
The following chart illustrates the historical performance of the fund in comparison to its benchmark(s). Benchmark comparisons are unmanaged; do not reflect any fees or expenses; and cannot be invested in directly. The performance of other share classes will be greater than or less than that of the class depicted below. (See Notes to Performance Summary.)
Performance data shown represents past performance and is no guarantee of future results. Investment return and principal value fluctuate so your units, when sold, may be worth more or less than the original cost; current performance may be lower or higher than quoted. The performance shown does not reflect the deduction of taxes, if any, that a contract holder would pay on fund distributions or the redemption of contract units. The returns for the fund shown also do not reflect the deduction of expenses associated with variable products, such as mortality and expense risk charges, separate account charges, and sales charges imposed by the insurance company separate accounts. Such expenses would reduce the overall returns shown.
Growth of a hypothetical $10,000 investment
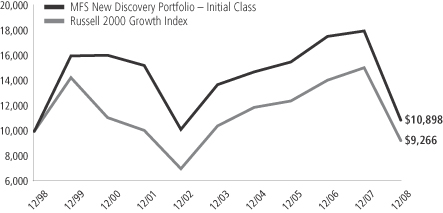
Total rates of return through 12/31/08
Average Annual Total Returns
| | | | | | | | | | | | |
| | | Share class | | Class inception date | | 1-yr | | 5-yr | | 10-yr | | |
| | | Initial Class | | 5/06/98 | | (39.57)% | | (4.53)% | | 0.86% | | |
| | | Service Class | | 8/24/01 | | (39.76)% | | (4.78)% | | 0.67% | | |
Comparative Benchmark
| | | | | | | | | | | | |
| | | Russell 2000 Growth Index (f) | | (38.54)% | | (2.35)% | | (0.76)% | | |
| (f) | Source: FactSet Research Systems, Inc. |
Benchmark Definition
Russell 2000 Growth Index – constructed to provide a comprehensive barometer for growth securities in the small-cap segment of the U.S. equity universe. Companies in this index generally have higher price-to-book ratios and higher forecasted growth values.
It is not possible to invest directly in an index.
Notes to Performance Summary
Performance for the Service Class includes the performance of the fund’s Initial Class for periods prior to their offering. Because Service Class expenses are higher than those of Initial Class, performance shown for Service Class is higher than it would have been had it been offered for the entire period. Performance has not been adjusted to take into account differences in class specific operating expenses (such as Rule 12b-1 fees). Please see the prospectus for additional information about performance and expenses.
Performance results reflect any applicable expense subsidies and waivers in effect during the periods shown. Without such subsidies and waivers the fund’s performance results would be less favorable. Please see the prospectus for complete details. All results are historical and assume the reinvestment of any dividends and capital gains distributions.
From time to time the fund may receive proceeds from litigation settlements, without which performance would be lower.
5
EXPENSE TABLE
Fund Expenses Borne by the Contract Holders During the Period,
July 1, 2008 through December 31, 2008
As a contract holder of the fund, you incur ongoing costs, including management fees; distribution (12b-1) fees; and other fund expenses. This example is intended to help you understand your ongoing costs (in dollars) of investing in the fund and to compare these costs with the ongoing costs of investing in other mutual funds.
The example is based on an investment of $1,000 invested at the beginning of the period and held for the entire period July 1, 2008 through December 31, 2008.
Actual Expenses
The first line for each share class in the following table provides information about actual account values and actual expenses. You may use the information in this line, together with the amount you invested, to estimate the expenses that you paid over the period. Simply divide your account value by $1,000 (for example, an $8,600 account value divided by $1,000 = 8.6), then multiply the result by the number in the first line under the heading entitled “Expenses Paid During Period” to estimate the expenses you paid on your account during this period.
Hypothetical Example for Comparison Purposes
The second line for each share class in the following table provides information about hypothetical account values and hypothetical expenses based on the fund’s actual expense ratio and an assumed rate of return of 5% per year before expenses, which is not the fund’s actual return. The hypothetical account values and expenses may not be used to estimate the actual ending account balance or expenses you paid for the period. You may use this information to compare the ongoing costs of investing in the fund and other funds. To do so, compare this 5% hypothetical example with the 5% hypothetical examples that appear in the shareholder reports of the other funds.
Please note that the expenses shown in the table are meant to highlight the fund’s ongoing costs only and do not take into account the fees and expenses imposed under the variable contracts through which your investment in the fund is made. Therefore, the second line for each share class in the table is useful in comparing ongoing costs associated with an investment in vehicles (such as the fund) which fund benefits under variable annuity and variable life insurance contracts and to qualified pension and retirement plans only, and will not help you determine the relative total costs of investing in the fund through variable annuity and variable life insurance contracts. If the fees and expenses imposed under the variable contracts were included, your costs would have been higher.
| | | | | | | | | | |
| Share Class | | | | Annualized
Expense Ratio | | Beginning
Account Value
7/01/08 | | Ending
Account Value
12/31/08 | | Expenses Paid
During Period (p)
7/01/08-12/31/08 |
| Initial Class | | Actual | | 0.95% | | $1,000.00 | | $658.02 | | $3.96 |
| | Hypothetical (h) | | 0.95% | | $1,000.00 | | $1,020.36 | | $4.82 |
| Service Class | | Actual | | 1.21% | | $1,000.00 | | $657.03 | | $5.04 |
| | Hypothetical (h) | | 1.21% | | $1,000.00 | | $1,019.05 | | $6.14 |
| (h) | 5% class return per year before expenses. |
| (p) | Expenses paid is equal to each class’ annualized expense ratio, as shown above, multiplied by the average account value over the period, multiplied by the number of days in the period, divided by the number of days in the year. |
6
PORTFOLIO OF INVESTMENTS – 12/31/08
The Portfolio of Investments is a complete list of all securities owned by your fund. It is categorized by broad-based asset classes.
| | | | | |
| Issuer | | Shares/Par | | Value ($) |
| | | | | |
| COMMON STOCKS – 99.2% | | | | | |
| Airlines – 0.8% | | | | | |
| Allegiant Travel Co. (a) | | 27,190 | | $ | 1,320,617 |
| | | | | |
| Biotechnology – 0.5% | | | | | |
| Nanosphere, Inc. (a) | | 76,360 | | $ | 363,473 |
| SEQUENOM, Inc. (a) | | 24,910 | | | 494,214 |
| | | | | |
| | | | $ | 857,687 |
| | | | | |
| Brokerage & Asset Managers – 0.6% | | | | | |
| KBW, Inc. (a)(l) | | 23,440 | | $ | 539,120 |
| Thomas Weisel Partners Group (a) | | 91,890 | | | 433,720 |
| | | | | |
| | | | $ | 972,840 |
| | | | | |
| Business Services – 5.5% | | | | | |
| ATA, Inc., ADR (a) | | 71,220 | | $ | 362,510 |
| Concur Technologies, Inc. (a) | | 100,370 | | | 3,294,142 |
| Constant Contact, Inc. (a)(l) | | 65,030 | | | 861,647 |
| Corporate Executive Board Co. | | 76,050 | | | 1,677,662 |
| CoStar Group, Inc. (a) | | 37,260 | | | 1,227,344 |
| Ultimate Software Group, Inc. (a) | | 106,450 | | | 1,554,170 |
| | | | | |
| | | | $ | 8,977,475 |
| | | | | |
| Chemicals – 1.0% | | | | | |
| Nalco Holding Co. | | 143,380 | | $ | 1,654,605 |
| | | | | |
| Computer Software – 4.1% | | | | | |
| ANSYS, Inc. (a) | | 27,630 | | $ | 770,601 |
| Blackboard, Inc. (a) | | 31,560 | | | 827,819 |
| CommVault Systems, Inc. (a) | | 107,830 | | | 1,446,000 |
| Guidance Software, Inc. (a) | | 121,430 | | | 495,434 |
| Salesforce.com, Inc. (a) | | 44,820 | | | 1,434,688 |
| SPSS, Inc. (a) | | 64,090 | | | 1,727,866 |
| | | | | |
| | | | $ | 6,702,408 |
| | | | | |
| Computer Software – Systems – 1.5% | | | |
| Deltek, Inc. (a) | | 98,300 | | $ | 456,112 |
| PROS Holdings, Inc. (a) | | 176,230 | | | 1,013,323 |
| Solera Holdings, Inc. (a) | | 44,740 | | | 1,078,234 |
| | | | | |
| | | | $ | 2,547,669 |
| | | | | |
| Construction – 2.1% | | | | | |
| Pulte Homes, Inc. | | 212,300 | | $ | 2,320,439 |
| Toll Brothers, Inc. (a) | | 34,710 | | | 743,835 |
| Urbi Desarrollos Urbanos S.A. de C.V. (a) | | 310,380 | | | 426,062 |
| | | | | |
| | | | $ | 3,490,336 |
| | | | | |
| Consumer Goods & Services – 4.9% | | | | | |
| Capella Education Co. (a) | | 41,410 | | $ | 2,433,252 |
| Central Garden & Pet Co., “A” (a) | | 109,790 | | | 647,761 |
| New Oriental Education & Technology Group, Inc., ADR (a) | | 58,080 | | | 3,189,173 |
| Sotheby’s | | 74,990 | | | 666,661 |
| Strayer Education, Inc. | | 5,650 | | | 1,211,417 |
| | | | | |
| | | | $ | 8,148,264 |
| | | | | |
| Electrical Equipment – 0.4% | | | | | |
| Itron, Inc. (a) | | 10,670 | | $ | 680,106 |
| | | | | |
| | | | | |
| Issuer | | Shares/Par | | Value ($) |
| | | | | |
| COMMON STOCKS – continued | | | |
| Electronics – 8.1% | | | | | |
| ARM Holdings PLC | | 2,001,070 | | $ | 2,504,037 |
| ASML Holding N.V. | | 140,690 | | | 2,542,268 |
| Atheros Communications, Inc. (a) | | 80,430 | | | 1,150,953 |
| Hittite Microwave Corp. (a) | | 91,000 | | | 2,680,860 |
| Mellanox Technologies Ltd. (a) | | 136,700 | | | 1,074,462 |
| MEMC Electronic Materials, Inc. (a) | | 86,350 | | | 1,233,078 |
| Monolithic Power Systems, Inc. (a) | | 47,880 | | | 603,767 |
| Silicon Laboratories, Inc. (a) | | 62,420 | | | 1,546,768 |
| | | | | |
| | | | $ | 13,336,193 |
| | | | | |
| Energy – Independent – 2.9% | | | | | |
| Continental Resources, Inc. (a) | | 65,080 | | $ | 1,347,807 |
| Denbury Resources, Inc. (a) | | 130,740 | | | 1,427,681 |
| EXCO Resources, Inc. (a) | | 216,150 | | | 1,958,319 |
| | | | | |
| | | | $ | 4,733,807 |
| | | | | |
| Engineering – Construction – 4.2% | | | | | |
| North American Energy Partners, Inc. (a) | | 439,630 | | $ | 1,468,364 |
| Quanta Services, Inc. (a) | | 168,414 | | | 3,334,597 |
| Team, Inc. (a) | | 77,350 | | | 2,142,595 |
| | | | | |
| | | | $ | 6,945,556 |
| | | | | |
| Entertainment – 0.6% | | | | | |
| TiVo, Inc. (a) | | 147,660 | | $ | 1,057,246 |
| | | | | |
| Food & Beverages – 0.8% | | | | | |
| Hain Celestial Group, Inc. (a) | | 67,510 | | $ | 1,288,766 |
| | | | | |
| Forest & Paper Products – 1.4% | | | | | |
| Universal Forest Products, Inc. (l) | | 83,800 | | $ | 2,255,058 |
| | | | | |
| Gaming & Lodging – 3.7% | | | | | |
| International Game Technology | | 228,260 | | $ | 2,714,011 |
| Morgans Hotel Group Co. (a)(l) | | 163,810 | | | 763,355 |
| Pinnacle Entertainment, Inc. (a)(l) | | 172,930 | | | 1,328,102 |
| WMS Industries, Inc. (a) | | 50,845 | | | 1,367,731 |
| | | | | |
| | | | $ | 6,173,199 |
| | | | | |
| Health Maintenance Organizations – 1.3% | | | |
| Ehealth, Inc. (a)(l) | | 139,470 | | $ | 1,852,162 |
| OdontoPrev S.A. | | 20,300 | | | 202,133 |
| | | | | |
| | | | $ | 2,054,295 |
| | | | | |
| Internet – 4.1% | | | | | |
| comScore, Inc. (a) | | 56,890 | | $ | 725,348 |
| Dealertrack Holdings, Inc. (a) | | 108,280 | | | 1,287,449 |
| Omniture, Inc. (a)(l) | | 188,080 | | | 2,001,171 |
| TechTarget, Inc. (a) | | 383,760 | | | 1,657,843 |
| Vocus, Inc. (a) | | 61,250 | | | 1,115,363 |
| | | | | |
| | | | $ | 6,787,174 |
| | | | | |
| Leisure & Toys – 0.8% | | | | | |
| THQ, Inc. (a) | | 296,329 | | $ | 1,241,619 |
| | | | | |
7
Portfolio of Investments – continued
| | | | | |
| Issuer | | Shares/Par | | Value ($) |
| | | | | |
| COMMON STOCKS – continued | | | |
| Machinery & Tools – 2.2% | | | | | |
| Polypore International, Inc. (a) | | 286,780 | | $ | 2,168,057 |
| Ritchie Bros. Auctioneers, Inc. | | 70,830 | | | 1,517,179 |
| | | | | |
| | | | $ | 3,685,236 |
| | | | | |
| Medical & Health Technology & Services – 9.6% | | | |
| Athena Health, Inc. (a) | | 36,360 | | $ | 1,367,863 |
| Diagnosticos da America S.A. | | 43,600 | | | 424,480 |
| Genoptix, Inc. (a) | | 19,620 | | | 668,650 |
| Healthcare Services Group, Inc. | | 125,795 | | | 2,003,914 |
| IDEXX Laboratories, Inc. (a) | | 122,606 | | | 4,423,624 |
| IPC The Hospitalist Co., Inc. (a) | | 82,460 | | | 1,387,802 |
| Medassets, Inc. (a) | | 127,890 | | | 1,867,194 |
| MWI Veterinary Supply, Inc. (a) | | 137,610 | | | 3,709,966 |
| | | | | |
| | | | $ | 15,853,493 |
| | | | | |
| Medical Equipment – 11.0% | | | | | |
| ABIOMED, Inc. (a) | | 173,490 | | $ | 2,848,706 |
| AtriCure, Inc. (a) | | 67,900 | | | 150,738 |
| Conceptus, Inc. (a)(l) | | 162,960 | | | 2,480,251 |
| DENTSPLY International, Inc. | | 86,250 | | | 2,435,700 |
| Dexcom, Inc. (a)(l) | | 235,030 | | | 648,683 |
| Edwards Lifesciences Corp. (a) | | 22,610 | | | 1,242,420 |
| Insulet Corp. (a)(l) | | 111,040 | | | 857,229 |
| Masimo Corp. (a) | | 20,050 | | | 598,092 |
| Mindray Medical International Ltd., ADR | | 125,220 | | | 2,253,960 |
| NxStage Medical, Inc. (a) | | 513,740 | | | 1,371,686 |
| ResMed, Inc. (a) | | 55,780 | | | 2,090,634 |
| Thoratec Corp. (a) | | 17,880 | | | 580,921 |
| Volcano Corp. (a) | | 36,740 | | | 551,100 |
| | | | | |
| | | | $ | 18,110,120 |
| | | | | |
| Metals & Mining – 1.6% | | | | | |
| Century Aluminum Co. (a) | | 184,620 | | $ | 1,846,200 |
| Freeport-McMoRan Copper & Gold, Inc. | | 34,420 | | | 841,225 |
| | | | | |
| | | | $ | 2,687,425 |
| | | | | |
| Network & Telecom – 1.8% | | | | | |
| Cavium Networks, Inc. (a)(l) | | 65,460 | | $ | 687,985 |
| NICE Systems Ltd., ADR (a) | | 57,370 | | | 1,289,104 |
| Polycom, Inc. (a) | | 69,520 | | | 939,215 |
| | | | | |
| | | | $ | 2,916,304 |
| | | | | |
| Oil Services – 6.4% | | | | | |
| Dresser-Rand Group, Inc. (a) | | 159,270 | | $ | 2,747,408 |
| Exterran Holdings, Inc. (a) | | 127,090 | | | 2,707,017 |
| Helix Energy Solutions Group, Inc. (a) | | 247,900 | | | 1,794,796 |
| Helmerich & Payne, Inc. | | 63,460 | | | 1,443,715 |
| Natural Gas Services Group, Inc. (a) | | 43,830 | | | 443,998 |
| Oceaneering International, Inc. (a) | | 49,240 | | | 1,434,854 |
| | | | | |
| | | | $ | 10,571,788 |
| | | | | |
| Other Banks & Diversified Financials – 1.3% | | | |
| City National Corp. | | 17,600 | | $ | 857,120 |
| Signature Bank (a) | | 46,280 | | | 1,327,773 |
| | | | | |
| | | | $ | 2,184,893 |
| | | | | |
| Personal Computers & Peripherals – 1.5% | | | |
| Nuance Communications, Inc. (a) | | 244,435 | | $ | 2,532,347 |
| | | | | |
| | | | | |
| Issuer | | Shares/Par | | Value ($) |
| | | | | |
| COMMON STOCKS – continued | | | |
| Pharmaceuticals – 1.2% | | | | | |
| Cadence Pharmaceuticals, Inc. (a)(l) | | 113,710 | | $ | 822,123 |
| Genomma Lab Internacional S.A., “B” (a) | | 524,500 | | | 367,000 |
| Inspire Pharmaceuticals, Inc. (a) | | 119,960 | | | 431,856 |
| Synta Pharmaceuticals Corp. (a)(l) | | 59,800 | | | 365,976 |
| | | | | |
| | | | $ | 1,986,955 |
| | | | | |
| Printing & Publishing – 1.8% | | | | | |
| Morningstar, Inc. (a) | | 35,210 | | $ | 1,249,955 |
| MSCI, Inc., “A” (a) | | 93,760 | | | 1,665,178 |
| | | | | |
| | | | $ | 2,915,133 |
| | | | | |
| Railroad & Shipping – 0.4% | | | | | |
| Diana Shipping, Inc. | | 45,090 | | $ | 575,348 |
| | | | | |
| Restaurants – 2.4% | | | | | |
| McCormick & Schmick’s Seafood Restaurant, Inc. (a) | | 303,350 | | $ | 1,219,467 |
| Red Robin Gourmet Burgers, Inc. (a) | | 111,200 | | | 1,871,496 |
| Texas Roadhouse, Inc., “A” (a) | | 103,740 | | | 803,985 |
| | | | | |
| | | | $ | 3,894,948 |
| | | | | |
| Special Products & Services – 1.0% | | | | | |
| Heckmann Corp. (a)(l) | | 293,200 | | $ | 1,656,580 |
| | | | | |
| Specialty Stores – 5.6% | | | | | |
| Abercrombie & Fitch Co., “A” | | 52,380 | | $ | 1,208,407 |
| Citi Trends, Inc. (a) | | 124,430 | | | 1,831,610 |
| Ctrip.com International Ltd., ADR | | 50,380 | | | 1,199,044 |
| Dufry South America Ltd., BDR | | 52,650 | | | 375,375 |
| J. Crew Group, Inc. (a) | | 32,710 | | | 399,062 |
| Lumber Liquidators, Inc. (a) | | 149,750 | | | 1,581,360 |
| Monro Muffler Brake, Inc. | | 47,455 | | | 1,210,103 |
| Zumiez, Inc. (a) | | 183,640 | | | 1,368,118 |
| | | | | |
| | | | $ | 9,173,079 |
| | | | | |
| Trucking – 2.1% | | | | | |
| J.B. Hunt Transport Services, Inc. | | 65,270 | | $ | 1,714,643 |
| Old Dominion Freight Lines, Inc. (a) | | 63,030 | | | 1,793,834 |
| | | | | |
| | | | $ | 3,508,477 |
| | | | | |
Total Common Stocks
(Identified Cost, $207,608,094) | | | | $ | 163,477,046 |
| | | | | |
| | | | | | | | | | |
| | | Strike
Price | | First
Exercise | | | | |
| | | | | | | | | | |
| | | |
| WARRANTS – 0.0% | | | | | | | |
| Alcoholic Beverages – 0.0% | | | | | | | |
| Castle Brands, Inc. (1 share for 1 warrant) (Identified Cost, $70,840) (a)(z) | | $ | 6.57 | | 5/08/07 | | 50,440 | | $ | 7,445 |
| | | | | | | | | | |
| | | | | | |
| | | | | | |
|
| REPURCHASE AGREEMENTS – 0.6% |
| Goldman Sachs, 0.01%, dated 12/31/08, due 1/02/09, total to be received $984,001 (secured by U.S. Treasury and Federal Agency obligations and Mortgage Backed securities in a jointly traded account), at Cost | | $ | 984,000 | | $ | 984,000 |
| | | | | | |
8
Portfolio of Investments – continued
| | | | | | | |
| Issuer | | Shares/Par | | Value ($) | |
| | | | | | | |
| |
| COLLATERAL FOR SECURITIES LOANED – 1.7% | | | | |
| Navigator Securities Lending Prime Portfolio, at Cost and Net Asset Value | | $ | 2,733,501 | | $ | 2,733,501 | |
| | | | | | | |
Total Investments
(Identified Cost, $211,396,435) | | | | | $ | 167,201,992 | |
| | | | | | | |
OTHER ASSETS, LESS
LIABILITIES – (1.5)% | | | | | | (2,404,241 | ) |
| | | | | | | |
| Net Assets – 100.0% | | | | | $ | 164,797,751 | |
| | | | | | | |
| (a) | Non-income producing security. |
| (l) | All or a portion of this security is on loan. |
| (z) | Restricted securities are not registered under the Securities Act of 1933 and are subject to legal restrictions on resale. These securities generally may be resold in transactions exempt from registration or to the public if the securities are subsequently registered. Disposal of these securities may involve time-consuming negotiations and prompt sale at an acceptable price may be difficult. The fund holds the following restricted security: |
| | | | | | |
| Restricted Security | | Acquisition
Date | | Cost | | Current
Market Value |
| Castle Brands, Inc. (Warrants) | | 4/18/07 | | $70,840 | | $7,445 |
| % of Net Assets | | | | | | 0.0% |
The following abbreviations are used in this report and are defined:
| ADR | | American Depository Receipt |
| BDR | | Brazilian Depository Receipt |
See Notes to Financial Statements
9
FINANCIAL STATEMENTS | STATEMENT OF ASSETS AND LIABILITIES
This statement represents your fund’s balance sheet, which details the assets and liabilities comprising the total value of the fund.
| | | | | |
At 12/31/08 | | | | | |
Assets | | | | | |
Investments, at value, including $2,768,029 of securities on loan (identified cost, $211,396,435) | | $167,201,992 | | | |
Cash | | 791 | | | |
Receivable for investments sold | | 643,098 | | | |
Interest and dividends receivable | | 57,948 | | | |
Receivable from investment adviser | | 11,715 | | | |
Other assets | | 8,188 | | | |
Total assets | | | | | $167,923,732 |
Liabilities | | | | | |
Payable for fund shares reacquired | | $258,350 | | | |
Collateral for securities loaned, at value | | 2,733,501 | | | |
Payable to affiliates | | | | | |
Management fee | | 7,733 | | | |
Distribution fees | | 1,368 | | | |
Administrative services fee | | 452 | | | |
Payable for trustees’ compensation | | 356 | | | |
Accrued expenses and other liabilities | | 124,221 | | | |
Total liabilities | | | | | $3,125,981 |
Net assets | | | | | $164,797,751 |
Net assets consist of | | | | | |
Paid-in capital | | $280,778,024 | | | |
Unrealized appreciation (depreciation) on investments and translation of assets and liabilities in foreign currencies | | (44,194,433 | ) | | |
Accumulated net realized gain (loss) on investments and foreign currency transactions | | (71,785,840 | ) | | |
Net assets | | | | | $164,797,751 |
Shares of beneficial interest outstanding | | | | | 19,981,025 |
Initial Class shares | | | | | |
Net assets | | $59,860,891 | | | |
Shares outstanding | | 7,155,946 | | | |
Net asset value per share | | | | | $8.37 |
Service Class shares | | | | | |
Net assets | | $104,936,860 | | | |
Shares outstanding | | 12,825,079 | | | |
Net asset value per share | | | | | $8.18 |
See Notes to Financial Statements
10
FINANCIAL STATEMENTS | STATEMENT OF OPERATIONS
This statement describes how much your fund earned in investment income and accrued in expenses. It also describes any gains and/or losses generated by fund operations.
| | | | | | |
| Year ended 12/31/08 | | | | | | |
Net investment loss | | | | | | |
Income | | | | | | |
Dividends | | $920,063 | | | | |
Income on securities loaned | | 668,852 | | | | |
Interest | | 17,377 | | | | |
Foreign taxes withheld | | (4,357 | ) | | | |
Total investment income | | | | | $1,601,935 | |
| Expenses | | | | | | |
Management fee | | $2,156,428 | | | | |
Distribution fees | | 365,037 | | | | |
Administrative services fee | | 71,919 | | | | |
Trustees’ compensation | | 33,305 | | | | |
Custodian fee | | 53,799 | | | | |
Shareholder communications | | 48,351 | | | | |
Auditing fees | | 42,228 | | | | |
Legal fees | | 7,128 | | | | |
Miscellaneous | | 31,584 | | | | |
Total expenses | | | | | $2,809,779 | |
Fees paid indirectly | | (1,230 | ) | | | |
Reduction of expenses by investment adviser | | (159,225 | ) | | | |
Net expenses | | | | | $2,649,324 | |
Net investment loss | | | | | $(1,047,389 | ) |
Realized and unrealized gain (loss) on investments and foreign currency transactions | | | | | | |
Realized gain (loss) (identified cost basis) | | | | | | |
Investment transactions | | $(64,788,957 | ) | | | |
Foreign currency transactions | | (11,896 | ) | | | |
Net realized gain (loss) on investments and foreign currency transactions | | | | | $(64,800,853 | ) |
Change in unrealized appreciation (depreciation) | | | | | | |
Investments | | $(40,366,204 | ) | | | |
Translation of assets and liabilities in foreign currencies | | 16 | | | | |
Net unrealized gain (loss) on investments and foreign currency translation | | | | | $(40,366,188 | ) |
Net realized and unrealized gain (loss) on investments and foreign currency | | | | | $(105,167,041 | ) |
Change in net assets from operations | | | | | $(106,214,430 | ) |
See Notes to Financial Statements
11
FINANCIAL STATEMENTS | STATEMENTS OF CHANGES IN NET ASSETS
These statements describe the increases and/or decreases in net assets resulting from operations, any distributions, and any shareholder transactions.
| | | | | | |
For years ended 12/31 | | 2008 | | | 2007 | |
Change in net assets | | | | | | |
From operations | | | | | | |
Net investment loss | | $(1,047,389 | ) | | $(2,056,967 | ) |
Net realized gain (loss) on investments and foreign currency transactions | | (64,800,853 | ) | | 40,592,282 | |
Net unrealized gain (loss) on investments and foreign currency translation | | (40,366,188 | ) | | (28,023,702 | ) |
Change in net assets from operations | | $(106,214,430 | ) | | $10,511,613 | |
Distributions declared to shareholders | | | | | | |
From net realized gain on investments | | | | | | |
Initial Class | | $(17,250,961 | ) | | $(4,140,582 | ) |
Service Class | | (27,753,068 | ) | | (5,182,591 | ) |
Total distributions declared to shareholders | | $(45,004,029 | ) | | $(9,323,173 | ) |
Change in net assets from fund share transactions | | $(528,514 | ) | | $(29,936,615 | ) |
Total change in net assets | | $(151,746,973 | ) | | $(28,748,175 | ) |
Net assets | | | | | | |
At beginning of period | | 316,544,724 | | | 345,292,899 | |
At end of period | | $164,797,751 | | | $316,544,724 | |
See Notes to Financial Statements
12
FINANCIAL STATEMENTS | FINANCIAL HIGHLIGHTS
The financial highlights table is intended to help you understand the fund’s financial performance for the past 5 years. Certain information reflects financial results for a single fund share. The total returns in the table represent the rate by which an investor would have earned (or lost) on an investment in the fund share class (assuming reinvestment of all distributions) held for the entire period.
| | | | | | | | | | | | | | | |
| Initial Class | | Years ended 12/31 | |
| | | 2008 | | | 2007 | | | 2006 | | | 2005 | | | 2004 | |
Net asset value, beginning of period | | $16.24 | | | $16.24 | | | $14.35 | | | $13.64 | | | $12.69 | |
| Income (loss) from investment operations | | | | | | | | | | | | | | | |
Net investment loss (d) | | $(0.04 | ) | | $(0.08 | ) | | $(0.09 | ) | | $(0.07 | ) | | $(0.08 | ) |
Net realized and unrealized gain (loss) on investments
and foreign currency | | (5.42 | ) | | 0.52 | | | 1.98 | | | 0.78 | | | 1.03 | |
Total from investment operations | | $(5.46 | ) | | $0.44 | | | $1.89 | | | $0.71 | | | $0.95 | |
| Less distributions declared to shareholders | | | | | | | | | | | | | | | |
From net realized gain on investments | | $(2.41 | ) | | $(0.44 | ) | | $— | | | $— | | | $— | |
Net asset value, end of period | | $8.37 | | | $16.24 | | | $16.24 | | | $14.35 | | | $13.64 | |
Total return (%) (k)(r)(s) | | (39.57 | ) | | 2.56 | | | 13.17 | | | 5.21 | | | 7.49 | (b) |
Ratios (%) (to average net assets)
and Supplemental data: | | | | | | | | | | | | | | | |
Expenses before expense reductions (f) | | 1.02 | | | 1.00 | | | 1.00 | | | 1.00 | | | 0.99 | |
Expenses after expense reductions (f) | | 0.95 | | | 0.95 | | | 0.98 | | | N/A | | | N/A | |
Net investment loss | | (0.28 | ) | | (0.45 | ) | | (0.60 | ) | | (0.56 | ) | | (0.65 | ) |
Portfolio turnover | | 127 | | | 95 | | | 107 | | | 127 | | | 139 | |
Net assets at end of period (000 Omitted) | | $59,861 | | | $130,029 | | | $163,825 | | | $176,958 | | | $209,503 | |
| |
| Service Class | | Years ended 12/31 | |
| | | 2008 | | | 2007 | | | 2006 | | | 2005 | | | 2004 | |
Net asset value, beginning of period | | $15.97 | | | $16.02 | | | $14.19 | | | $13.52 | | | $12.61 | |
| Income (loss) from investment operations | | | | | | | | | | | | | | | |
Net investment loss (d) | | $(0.07 | ) | | $(0.12 | ) | | $(0.13 | ) | | $(0.11 | ) | | $(0.11 | ) |
Net realized and unrealized gain (loss) on investments
and foreign currency | | (5.31 | ) | | 0.51 | | | 1.96 | | | 0.78 | | | 1.02 | |
Total from investment operations | | $(5.38 | ) | | $0.39 | | | $1.83 | | | $0.67 | | | $0.91 | |
| Less distributions declared to shareholders | | | | | | | | | | | | | | | |
From net realized gain on investments | | $(2.41 | ) | | $(0.44 | ) | | $— | | | $— | | | $— | |
Net asset value, end of period | | $8.18 | | | $15.97 | | | $16.02 | | | $14.19 | | | $13.52 | |
Total return (%) (k)(r)(s) | | (39.76 | ) | | 2.28 | | | 12.90 | | | 4.96 | | | 7.22 | (b) |
Ratios (%) (to average net assets) and Supplemental data: | | | | | | | | | | | | | | | |
Expenses before expense reductions (f) | | 1.27 | | | 1.25 | | | 1.26 | | | 1.26 | | | 1.24 | |
Expenses after expense reductions (f) | | 1.20 | | | 1.20 | | | 1.23 | | | N/A | | | N/A | |
Net investment loss | | (0.54 | ) | | (0.70 | ) | | (0.84 | ) | | (0.81 | ) | | (0.89 | ) |
Portfolio turnover | | 127 | | | 95 | | | 107 | | | 127 | | | 139 | |
Net assets at end of period (000 Omitted) | | $104,937 | | | $186,516 | | | $181,468 | | | $131,180 | | | $104,256 | |
| (b) | | The fund’s net asset value and total return calculation include a non-recurring accrual recorded as a result of an administrative proceeding regarding disclosure of brokerage allocation practices in connection with fund sales. The non-recurring accrual did not have a material impact on the net asset value per share based on the shares outstanding on the day the accrual was recorded. |
| (d) | | Per share data is based on average shares outstanding. |
| (f) | | Ratios do not reflect reductions from fees paid indirectly, if applicable. |
| (k) | | The total return does not reflect expenses that apply to separate accounts. Inclusion of these charges would reduce the total return figures for all periods shown. |
| (r) | | Certain expenses have been reduced without which performance would have been lower. |
| (s) | | From time to time the fund may receive proceeds from litigation settlements, without which performance would be lower. |
See Notes to Financial Statements
13
NOTES TO FINANCIAL STATEMENTS
| (1) | | Business and Organization |
MFS New Discovery Portfolio (the fund) is a series of MFS Variable Insurance Trust II (the trust). The trust is organized as a Massachusetts business trust and is registered under the Investment Company Act of 1940, as amended, as an open-end management investment company. The shares of the fund are sold to variable accounts established by insurance companies to fund benefits under variable contracts issued by such companies, and qualified retirement and pension plans.
| (2) | | Significant Accounting Policies |
General – The preparation of financial statements in conformity with U.S. generally accepted accounting principles requires management to make estimates and assumptions that affect the reported amounts of assets and liabilities, and disclosure of contingent assets and liabilities at the date of the financial statements and the reported amounts of revenues and expenses during the reporting period. Actual results could differ from those estimates. The fund can invest in foreign securities, including securities of emerging market issuers. Investments in foreign securities are vulnerable to the effects of changes in the relative values of the local currency and the U.S. dollar and to the effects of changes in each country’s legal, political, and economic environment. The markets of emerging markets countries are generally more volatile than the markets of developed countries with more mature economies. All of the risks of investing in foreign securities previously described are heightened when investing in emerging markets countries.
In March 2008, FASB Statement No. 161, Disclosures about Derivative Instruments and Hedging Activities (the “Standard”) was issued, and is effective for financial statements issued for fiscal years and interim periods beginning after November 15, 2008. This Standard provides enhanced disclosures about the fund’s use of and accounting for derivative instruments and the effect of derivative instruments on the fund’s results of operations and financial position. Management is evaluating the application of the Standard to the fund, and has not at this time determined the impact, if any, resulting from the adoption of this Standard on the fund’s financial statements.
FASB Staff Position (FSP) 133-1 was implemented during the period. FSP 133-1 amends FAS 133 to require sellers of credit derivatives to make disclosures that will enable financial statement users to assess the potential effects of those credit derivatives on an entity’s financial position, financial performance and cash flows. There was no impact from implementing FSP 133-1 as the fund did not hold any of these credit derivatives at period end.
Investment Valuations – Equity securities, including restricted equity securities, are generally valued at the last sale or official closing price as reported by a third party pricing service on the market or exchange on which they are primarily traded. For securities for which there were no sales reported that day, equity securities are generally valued at the last quoted daily bid quotation as reported by a third party pricing service on the market or exchange on which they are primarily traded. For securities held short for which there were no sales reported for the day, the position is generally valued at the last quoted daily ask quotation as reported by a third party pricing service on the market or exchange on which such securities are primarily traded. Short-term instruments with a maturity at issuance of 60 days or less may be valued at amortized cost, which approximates market value. Open-end investment companies are generally valued at net asset value per share. Securities and other assets generally valued on the basis of information from a third party pricing service may also be valued at a broker-dealer bid quotation. Values obtained from pricing services can utilize both dealer-supplied valuations and electronic data processing techniques, which take into account factors such as institutional-size trading in similar groups of securities, yield, quality, coupon rate, maturity, type of issue, trading characteristics, and other market data. The values of foreign securities and other assets and liabilities expressed in foreign currencies are converted to U.S. dollars using the mean of bid and asked prices for rates reported by a third party pricing service.
The Board of Trustees has delegated primary responsibility for determining or causing to be determined the value of the fund’s investments (including any fair valuation) to the adviser pursuant to valuation policies and procedures approved by the Board. If the adviser determines that reliable market quotations are not readily available, investments are valued at fair value as determined in good faith by the adviser in accordance with such procedures under the oversight of the Board of Trustees. Under the fund’s valuation policies and procedures, market quotations are not considered to be readily available for most types of debt instruments and floating rate loans and many types of derivatives. These investments are generally valued at fair value based on information from third party pricing services. In addition, investments may be valued at fair value if the adviser determines that an investment’s value has been materially affected by events occurring after the close of the exchange or market on which the investment is principally traded (such as foreign exchange or market) and prior to the determination of the fund’s net asset value, or after the halting of trading of a specific security where trading does not resume prior to the close of the exchange or market on which the security is principally traded. Events that occur on a frequent basis after foreign markets close (such as developments in foreign markets and significant movements in the U.S. markets) and prior to the determination of the fund’s net asset value may be deemed to have a material affect on the value of securities traded in foreign markets. Accordingly, the fund’s foreign equity securities may often be valued at fair value. The adviser may rely on third party
14
Notes to Financial Statements – continued
pricing services or other information (such as the correlation with price movements of similar securities in the same or other markets; the type, cost and investment characteristics of the security; the business and financial condition of the issuer; and trading and other market data) to assist in determining whether to fair value and at what value to fair value an investment. The value of an investment for purposes of calculating the fund’s net asset value can differ depending on the source and method used to determine value. When fair valuation is used, the value of investments used to determine the fund’s net asset value may differ from quoted or published prices for the same investments.
The fund adopted FASB Statement No. 157, Fair Value Measurements (the “Statement”). This Statement provides a single definition of fair value, a hierarchy for measuring fair value and expanded disclosures about fair value measurements.
Various inputs are used in determining the value of the fund’s assets or liabilities carried at market value. These inputs are categorized into three broad levels. Level 1 includes quoted prices in active markets for identical assets or liabilities. Level 2 includes other significant observable market-based inputs (including quoted prices for similar securities, interest rates, prepayment speed, and credit risk). Level 3 includes unobservable inputs, which may include the adviser’s own assumptions in determining the fair value of investments. Other financial instruments are derivative instruments not reflected in total investments, such as futures, forwards, swap contracts and written options. The following is a summary of the levels used as of December 31, 2008 in valuing the fund’s assets or liabilities carried at market value:
| | | | | | | | |
| | | Level 1 | | Level 2 | | Level 3 | | Total |
| Investments in Securities | | $162,704,522 | | $4,497,470 | | $— | | $167,201,992 |
| Other Financial Instruments | | $— | | $— | | $— | | $— |
Repurchase Agreements – The fund may enter into repurchase agreements with approved counterparties. Each repurchase agreement is recorded at cost. The fund requires that the securities collateral in a repurchase transaction be transferred to a custodian. The fund monitors, on a daily basis, the value of the collateral to ensure that its value, including accrued interest, is greater than amounts owed to the fund under each such repurchase agreement. The fund and other funds managed by Massachusetts Financial Services Company (MFS), may utilize a joint trading account for the purpose of entering into one or more repurchase agreements.
Foreign Currency Translation – Purchases and sales of foreign investments, income, and expenses are converted into U.S. dollars based upon currency exchange rates prevailing on the respective dates of such transactions or on the reporting date for foreign denominated receivables and payables. Gains and losses attributable to foreign currency exchange rates on sales of securities are recorded for financial statement purposes as net realized gains and losses on investments. Gains and losses attributable to foreign exchange rate movements on receivables, payables, income and expenses are recorded for financial statement purposes as foreign currency transaction gains and losses. That portion of both realized and unrealized gains and losses on investments that results from fluctuations in foreign currency exchange rates is not separately disclosed.
Security Loans – State Street Bank and Trust Company (“State Street”), as lending agent, may loan the securities of the fund to certain qualified institutions (the “Borrowers”) approved by the fund. The loans are collateralized by cash and/or U.S. Treasury and federal agency obligations in an amount typically at least equal to the market value of the securities loaned. State Street provides the fund with indemnification against Borrower default. The fund bears the risk of loss with respect to the investment of cash collateral. On loans collateralized by cash, the cash collateral is invested in a money market fund or short-term securities. A portion of the income generated upon investment of the collateral is remitted to the Borrowers, and the remainder is allocated between the fund and the lending agent. On loans collateralized by U.S. Treasury and/or federal agency obligations, a fee is received from the Borrower, and is allocated between the fund and the lending agent. Income from securities lending is separately reported on the Statement of Operations. The dividend and interest income earned on the securities loaned is accounted for in the same manner as other dividend and interest income.
Indemnifications – Under the fund’s organizational documents, its officers and trustees may be indemnified against certain liabilities and expenses arising out of the performance of their duties to the fund. Additionally, in the normal course of business, the fund enters into agreements with service providers that may contain indemnification clauses. The fund’s maximum exposure under these agreements is unknown as this would involve future claims that may be made against the fund that have not yet occurred.
Investment Transactions and Income – Investment transactions are recorded on the trade date. Interest income is recorded on the accrual basis. All premium and discount is amortized or accreted for financial statement purposes in accordance with U.S. generally accepted accounting principles. Dividends received in cash are recorded on the ex-dividend date. Certain dividends from foreign securities will be recorded when the fund is informed of the dividend if such information is obtained subsequent to the ex-dividend date. Dividend and interest payments received in additional securities are recorded on the ex-dividend or ex-interest date in an amount equal to the value of the security on such date.
15
Notes to Financial Statements – continued
The fund may receive proceeds from litigation settlements. Any proceeds received from litigation involving portfolio holdings are reflected in the Statement of Operations in realized gain/loss if the security has been disposed of by the fund or in unrealized gain/loss if the security is still held by the fund. Any other proceeds from litigation not related to portfolio holdings are reflected as other income in the Statement of Operations.
Fees Paid Indirectly – The fund’s custody fee may be reduced according to an arrangement that measures the value of cash deposited with the custodian by the fund. This amount, for the year ended December 31, 2008, is shown as a reduction of total expenses on the Statement of Operations.
Tax Matters and Distributions – The fund intends to qualify as a regulated investment company, as defined under Subchapter M of the Internal Revenue Code, and to distribute all of its taxable income, including realized capital gains. As a result, no provision for federal income taxes is required. Each of the fund’s federal tax returns for the prior three fiscal years remains subject to examination by the Internal Revenue Service. Foreign taxes, if any, have been accrued by the fund in the accompanying financial statements.
Distributions to shareholders are recorded on the ex-dividend date. Income and capital gain distributions are determined in accordance with income tax regulations, which may differ from U.S. generally accepted accounting principles. Certain capital accounts in the financial statements are periodically adjusted for permanent differences in order to reflect their tax character. These adjustments have no impact on net assets or net asset value per share. Temporary differences which arise from recognizing certain items of income, expense, gain or loss in different periods for financial statement and tax purposes will reverse at some time in the future. Distributions in excess of net investment income or net realized gains are temporary overdistributions for financial statement purposes resulting from differences in the recognition or classification of income or distributions for financial statement and tax purposes.
Book/tax differences primarily relate to net operating losses and wash sale loss deferrals.
The tax character of distributions declared to shareholders for the last two fiscal years is as follows:
| | | | |
| | | 12/31/08 | | 12/31/07 |
| Ordinary income (including any short-term capital gains) | | $12,386,029 | | $— |
| Long-term capital gain | | 32,618,000 | | 9,323,173 |
| Total distributions | | $45,004,029 | | $9,323,173 |
The federal tax cost and the tax basis components of distributable earnings were as follows:
| | | |
| As of 12/31/08 | | | |
| Cost of investments | | $231,329,465 | |
| Gross appreciation | | 7,108,193 | |
| Gross depreciation | | (71,235,666 | ) |
| Net unrealized appreciation (depreciation) | | $(64,127,473 | ) |
| Capital loss carryforwards | | (51,844,153 | ) |
| Other temporary differences | | (8,647 | ) |
As of December 31, 2008, the fund had capital loss carryforwards available to offset future realized gains. Such losses expire as follows:
Multiple Classes of Shares of Beneficial Interest – The fund offers multiple classes of shares, which differ in their respective distribution fees. The fund’s income, realized and unrealized gain (loss), and common expenses are allocated to shareholders based on the daily net assets of each class. Dividends are declared separately for each class. Differences in per share dividend rates are generally due to differences in separate class expenses.
| (3) | | Transactions with Affiliates |
Investment Adviser – The fund has an investment advisory agreement with MFS to provide overall investment management and related administrative services and facilities to the fund.
The management fee is computed daily and paid monthly at the following annual rates:
| | |
| First $1 billion of average daily net assets | | 0.90% |
| Average daily net assets in excess of $1 billion | | 0.80% |
The investment adviser has agreed in writing to reduce its management fee to 0.75% of average daily net assets in excess of $2.5 billion. This written agreement will continue until April 30, 2010. For the year ended December 31, 2008, the fund’s
16
Notes to Financial Statements – continued
average daily net assets did not exceed $2.5 billion and therefore, the management fee was not reduced. The management fee incurred for the year ended December 31, 2008 was equivalent to an annual effective rate of 0.90% of the fund’s average daily net assets.
The investment adviser has agreed in writing to pay a portion of the fund’s total annual operating expenses, exclusive of interest, taxes, extraordinary expenses, brokerage and transaction costs, and investment-related expenses, such that total annual operating expenses do not exceed 0.95% annually of average daily net assets for the Initial Class shares and 1.20% annually of average daily net assets for the Service Class shares. This written agreement will continue until April 30, 2010. For the year ended December 31, 2008, this reduction amounted to $159,225 and is reflected as a reduction of total expenses in the Statement of Operations.
Distributor – MFS Fund Distributors, Inc. (MFD), a wholly-owned subsidiary of MFS, is the distributor of shares of the fund. The Trustees have adopted a distribution plan for the Service Class shares pursuant to Rule 12b-1 under the Investment Company Act of 1940.
The fund’s distribution plan provides that the fund will pay MFD distribution fees equal to 0.25% per annum of its average daily net assets attributable to Service Class shares as partial consideration for services performed and expenses incurred by MFD and financial intermediaries in connection with the sale and distribution of the fund’s Service Class shares and the sale and distribution of the variable annuity or variable life insurance contracts investing indirectly in Service Class shares. MFD may subsequently pay all, or a portion, of the distribution fees to financial intermediaries.
Shareholder Servicing Agent – MFS Service Center, Inc. (MFSC), a wholly-owned subsidiary of MFS, has contracted to provide transfer agent and recordkeeping functions in connection with the issuance, transfer, and redemption of each class of shares of the fund under a Shareholder Servicing Agent Agreement. During the year ended December 31, 2008, the fund did not pay MFSC a fee for this service.
Administrator – MFS provides certain financial, legal, shareholder communications, compliance, and other administrative services to the fund. Under an administrative services agreement, the fund partially reimburses MFS the costs incurred to provide these services. The fund is charged an annual fixed amount of $10,000 plus a fee based on average daily net assets.
The administrative services fee incurred for the year ended December 31, 2008 was equivalent to an annual effective rate of 0.0300% of the fund’s average daily net assets.
Trustees’ and Officers’ Compensation – The fund pays compensation to trustees in the form of a retainer, attendance fees, and additional compensation to the Board chairperson. The fund does not pay compensation directly to officers of the fund who are also officers of the investment adviser, all of whom receive remuneration for their services to the fund from MFS. Certain officers of the fund are officers or directors of MFS, MFD, and MFSC.
Other – This fund and certain other MFS funds (the funds) have entered into services agreements (the Agreements) which provide for payment of fees by the funds to Tarantino LLC and Griffin Compliance LLC in return for the provision of services of an Independent Chief Compliance Officer (ICCO) and Assistant ICCO, respectively, for the funds. The ICCO and Assistant ICCO are officers of the funds and the sole members of Tarantino LLC and Griffin Compliance LLC, respectively. The funds can terminate the Agreements with Tarantino LLC and Griffin Compliance LLC at any time under the terms of the Agreements. MFS has agreed to bear all expenses associated with office space, other administrative support, and supplies provided to the ICCO and Assistant ICCO. For the year ended December 31, 2008, the aggregate fees paid by the fund to Tarantino LLC and Griffin Compliance LLC were $2,181 and are included in miscellaneous expense on the Statement of Operations.
Purchases and sales of investments, other than U.S. Government securities, purchased option transactions, and short-term obligations, aggregated $307,191,195 and $353,245,211, respectively.
17
Notes to Financial Statements – continued
| (5) | | Shares of Beneficial Interest |
The fund’s Declaration of Trust permits the Trustees to issue an unlimited number of full and fractional shares of beneficial interest. Transactions in fund shares were as follows:
| | | | | | | | | | | | |
| | | Year ended 12/31/08 | | | Year ended 12/31/07 | |
| | | Shares | | | Amount | | | Shares | | | Amount | |
| Shares sold | | | | | | | | | | | | |
Initial Class | | 680,507 | | | $6,730,272 | | | 334,611 | | | $5,537,950 | |
Service Class | | 2,767,379 | | | 26,015,964 | | | 1,437,743 | | | 23,493,591 | |
| | 3,447,886 | | | $32,746,236 | | | 1,772,354 | | | $29,031,541 | |
| Shares issued to shareholders in reinvestment of distributions | | | | | | | | | | | | |
Initial Class | | 1,235,742 | | | $17,250,961 | | | 239,064 | | | $4,140,582 | |
Service Class | | 2,028,733 | | | 27,753,068 | | | 303,786 | | | 5,182,591 | |
| | 3,264,475 | | | $45,004,029 | | | 542,850 | | | $9,323,173 | |
| Shares reacquired | | | | | | | | | | | | |
Initial Class | | (2,767,391 | ) | | $(34,988,647 | ) | | (2,652,413 | ) | | $(45,045,710 | ) |
Service Class | | (3,647,151 | ) | | (43,290,132 | ) | | (1,390,282 | ) | | (23,245,619 | ) |
| | (6,414,542 | ) | | $(78,278,779 | ) | | (4,042,695 | ) | | $(68,291,329 | ) |
| Net change | | | | | | | | | | | | |
Initial Class | | (851,142 | ) | | $(11,007,414 | ) | | (2,078,738 | ) | | $(35,367,178 | ) |
Service Class | | 1,148,961 | | | 10,478,900 | | | 351,247 | | | 5,430,563 | |
| | 297,819 | | | $(528,514 | ) | | (1,727,491 | ) | | $(29,936,615 | ) |
The fund and other funds managed by MFS participate in a $1 billion unsecured committed line of credit provided by a syndication of banks under a credit agreement. In addition, the fund and other funds managed by MFS have established uncommitted borrowing arrangements with certain banks. Borrowings may be made for temporary financing needs. Interest is charged to each fund, based on its borrowings, generally at a rate equal to the Federal Reserve funds rate plus 0.30%. In addition, a commitment fee, based on the average daily, unused portion of the committed line of credit, is allocated among the participating funds at the end of each calendar quarter. For the year ended December 31, 2008, the fund’s commitment fee and interest expense were $1,183 and $0, respectively, and are included in miscellaneous expense on the Statement of Operations.
18
REPORT OF INDEPENDENT REGISTERED PUBLIC ACCOUNTING FIRM
To the Board of Trustees of MFS Variable Insurance Trust II and the Shareholders of
MFS New Discovery Portfolio:
We have audited the accompanying statement of assets and liabilities, including the portfolio of investments, of MFS New Discovery Portfolio (the “Fund”) (one of the portfolios comprising MFS Variable Insurance Trust II) as of December 31, 2008, and the related statement of operations for the year then ended, the statements of changes in net assets for each of the two years in the period then ended, and the financial highlights for each of the five years in the period then ended. These financial statements and financial highlights are the responsibility of the Fund’s management. Our responsibility is to express an opinion on these financial statements and financial highlights based on our audits.
We conducted our audits in accordance with the standards of the Public Company Accounting Oversight Board (United States). Those standards require that we plan and perform the audit to obtain reasonable assurance about whether the financial statements and financial highlights are free of material misstatement. The Fund is not required to have, nor were we engaged to perform, an audit of its internal control over financial reporting. Our audits included consideration of internal control over financial reporting as a basis for designing audit procedures that are appropriate in the circumstances, but not for the purpose of expressing an opinion on the effectiveness of the Fund’s internal control over financial reporting. Accordingly, we express no such opinion. An audit also includes examining, on a test basis, evidence supporting the amounts and disclosures in the financial statements, assessing the accounting principles used and significant estimates made by management, as well as evaluating the overall financial statement presentation. Our procedures included confirmation of securities owned as of December 31, 2008, by correspondence with the custodian and brokers. We believe that our audits provide a reasonable basis for our opinion.
In our opinion, the financial statements and financial highlights referred to above present fairly, in all material respects, the financial position of MFS New Discovery Portfolio as of December 31, 2008, the results of its operations for the year then ended, the changes in its net assets for each of the two years in the period then ended, and the financial highlights for each of the five years in the period then ended, in conformity with accounting principles generally accepted in the United States of America.
DELOITTE & TOUCHE LLP
Boston, Massachusetts
February 19, 2009
19
TRUSTEES AND OFFICERS – IDENTIFICATION AND BACKGROUND
The Trustees and officers of the Trust, as of February 1, 2009, are listed below, together with their principal occupations during the past five years. (Their titles may have varied during that period.) The address of each Trustee and officer is 500 Boylston Street, Boston, Massachusetts 02116.
| | | | | | |
Name, Date of Birth | | Position(s) Held
with Fund | | Trustee/Officer
Since (1) | | Principal Occupations During the Past Five Years and
Other Directorships (2) |
| INTERESTED TRUSTEE | | | | |
David D. Horn (3) (born 6/07/41) | | Trustee | | April 1986 | | Private investor; Sun Life Assurance Company of Canada, Senior Vice President and General Manager for the United States (until 1997); Director (until March 2004) |
| | |
| INDEPENDENT TRUSTEES | | | | |
J. Kermit Birchfield (born 1/08/40) | | Chairman | | May 1997 | | Consultant; Century Partners, Inc. (investments), Director; Displaytech, Inc. (technology), Director; Dessin Fournir LLC (furniture manufacturer), Director (2005 to present); Intermountain Gas Company, Inc. & Intermountain Industries, Inc. (oil & gas exploration and production), Director; Site Watch LLC (software to monitor oil tanks), Managing Director (2006 to present); Juridica Investments (fund investing in judicial matters), Director (2007 to present); HPSC, Inc. (medical financing), Director (until January 2004) |
| | | |
Robert C. Bishop (born 1/13/43) | | Trustee | | May 2001 | | AutoImmune, Inc. (pharmaceutical product development), Chairman, President and Chief Executive Officer; Caliper Life Sciences Corp. (laboratory analytical instruments), Director; Millipore Corporation (purification/filtration products), Director; Waterstreet Capital (leverage buyouts), Advisory Board (August 2006 to present); Optobionics Corporation (ophthalmic devices), Director (2002 to 2007) |
| | | |
Frederick H. Dulles (born 3/12/42) | | Trustee | | May 2001 | | Ten State International Law PLLC (law firm), Of Counsel (since 2006); Prudential Carolina Real Estate, (real estate), Broker (since 2006); Free Enterprise Foundation, Inc. (research institute), Director & Secretary (until 2008); Disher, Hamrick & Myers Residential, Inc. (real estate) Broker (2005 until 2006); Frederick H. Dulles law practice (until 2006); Ten State Street LLP (law firm), Member (until 2005) |
| | | |
Marcia A. Kean (born 6/30/48) | | Trustee | | April 2005 | | Feinstein Kean Healthcare (consulting), Chief Executive Officer |
| | | |
Ronald G. Steinhart (born 6/15/40) | | Trustee | | May 2001 | | Private investor; Penske Automotive Group (automotive retailer), Director; Animal Health International, Inc. (animal health products), Director (since 2007); Texas Industries (concrete/aggregates/cement), Director (since 2007); Penson Worldwide, Inc. (securities clearance), Director (since 2006); Carreker Corporation (technology consulting) Director (until 2005); Prentiss Properties Trust (real estate investment trust), Director (until 2006) |
| | | |
Haviland Wright (born 7/21/48) | | Trustee | | May 2001 | | Profitability of Hawaii (software), Chief Development Officer (since December 2008); Elixir Technologies Corporation (software) Director (since 2005); Nano Loa Inc. (liquid crystal displays), Director |
| | |
| TRUSTEE EMERITUS | | | | |
Samuel Adams (born 10/19/25) | | Trustee Emeritus | | | | Retired; K&L Gates LLP (law firm), Of Counsel |
| | |
| OFFICERS | | | | |
Maria F. Dwyer (4) (born 12/01/58) | | President | | November 2005 | | Massachusetts Financial Services Company, Executive Vice President and Chief Regulatory Officer (since March 2004) Chief Compliance Officer (since December 2006); Fidelity Management & Research Company, Vice President (prior to March 2004); Fidelity Group of Funds, President and Treasurer (until March 2004) |
| | | |
Christopher R. Bohane (4) (born 1/18/74) | | Assistant Secretary and Assistant Clerk | | July 2005 | | Massachusetts Financial Services Company, Vice President and Senior Counsel |
| | | |
John M. Corcoran (4) (born 4/13/65) | | Treasurer | | October 2008 | | Massachusetts Financial Services Company, Senior Vice President (since October 2008); State Street Bank and Trust (financial services provider), Senior Vice President, (until September 2008) |
| | | |
Ethan D. Corey (4) (born 11/21/63) | | Assistant Secretary and Assistant Clerk | | July 2005 | | Massachusetts Financial Services Company, Senior Vice President and Associate General Counsel (since 2004); Dechert LLP (law firm), Counsel (prior to December 2004) |
| | | |
David L. DiLorenzo (4) (born 8/10/68) | | Assistant Treasurer | | July 2005 | | Massachusetts Financial Services Company, Vice President (since June 2005); JP Morgan Investor Services, Vice President (until June 2005) |
| | | |
Timothy M. Fagan (4) (born 7/10/68) | | Assistant Secretary and Assistant Clerk | | September 2005 | | Massachusetts Financial Services Company, Vice President and Senior Counsel (since September 2005); John Hancock Advisers, LLC, Vice President, Senior Attorney and Chief Compliance Officer (until August 2005) |
20
Trustees and Officers – continued
| | | | | | |
Name, Date of Birth | | Position(s) Held
with Fund | | Trustee/Officer
Since (1) | | Principal Occupations During the Past Five Years and
Other Directorships (2) |
Mark D. Fischer (4) (born 10/27/70) | | Assistant Treasurer | | July 2005 | | Massachusetts Financial Services Company, Vice President (since May 2005); JP Morgan Investment Management Company, Vice President (until May 2005) |
| | | |
Robyn L. Griffin (born 7/04/75) | | Assistant Independent Chief Compliance Officer | | August 2008 | | Griffin Compliance LLC (provider of compliance services), Principal (since August 2008); State Street Corporation (financial services provider), Mutual Fund Administration Assistant Vice President (October 2006 – July 2008); Liberty Mutual Group (insurance), Personal Market Assistant Controller (April 2006 – October 2006); Deloitte & Touche LLP (professional services firm), Senior Manager (prior to April 2006) |
| | | |
Brian E. Langenfeld (4) (born 3/07/73) | | Assistant Secretary and Assistant Clerk | | May 2006 | | Massachusetts Financial Services Company, Vice President and Senior Counsel (since May 2006); John Hancock Advisers, LLC, Assistant Vice President and Counsel (until April 2006) |
| | | |
Ellen Moynihan (4) (born 11/13/57) | | Assistant Treasurer | | May 1997 | | Massachusetts Financial Services Company, Senior Vice President |
| | | |
Susan S. Newton (4) (born 3/07/50) | | Assistant Secretary and Assistant Clerk | | May 2005 | | Massachusetts Financial Services Company, Senior Vice President and Associate General Counsel (since April 2005); John Hancock Advisers, LLC, Senior Vice President, Secretary and Chief Legal Officer (until April 2005) |
| | | |
Susan A. Pereira (4) (born 11/05/70) | | Assistant Secretary and Assistant Clerk | | July 2005 | | Massachusetts Financial Services Company, Vice President and Senior Counsel (since June 2004); Bingham McCutchen LLP (law firm), Associate (until June 2004) |
| | | |
Mark N. Polebaum (4) (born 5/01/52) | | Secretary and Clerk | | February 2006 | | Massachusetts Financial Services Company, Executive Vice President, General Counsel and Secretary (since January 2006); Wilmer Cutler Pickering Hale and Dorr LLP (law firm), Partner (until January 2006) |
| | | |
Frank L. Tarantino (born 3/07/44) | | Independent Chief Compliance Officer | | September 2004 | | Tarantino LLC (provider of compliance services), Principal (since June 2004); CRA Business Strategies Group (consulting services), Executive Vice President (until June 2004) |
| | | |
Richard S. Weitzel (4) (born 7/16/70) | | Assistant Secretary and Assistant Clerk | | October 2007 | | Massachusetts Financial Services Company, Vice President and Assistant General Counsel (since 2004); Massachusetts Department of Business and Technology, General Counsel (until April 2004) |
| | | |
James O. Yost (4) (born 6/12/60) | | Assistant Treasurer | | April 1992 | | Massachusetts Financial Services Company, Senior Vice President |
| (1) | Date first appointed to serve as Trustee/Officer of an MFS fund or a Compass variable account. Each Trustee has served continuously since appointment. |
| (2) | Directorships or trusteeships of companies required to report to the Securities and Exchange Commission (i.e., “public companies”). |
| (3) | “Interested person” of the Trust, within the meaning of the Investment Company Act of 1940 (referred to as the 1940 Act), which is the principal federal law governing investment companies like the Trust, as a result of position with Sun Life of Canada (U.S.). The address of Sun Life of Canada (U.S.) is One Sun Life Executive Park, Wellesley Hills, Massachusetts 02481. |
| (4) | “Interested person” of MFS within the meaning of the 1940 Act. The address of MFS is 500 Boylston Street, Boston, Massachusetts 02116. |
The Trust does not hold annual meetings for the purpose of electing Trustees, and Trustees are not elected for fixed terms. Each Trustee and officer holds office until his or her successor is chosen and qualified, or until his or her earlier death, resignation, retirement or removal.
All Trustees currently serve as Trustees of the Trust and have served in that capacity since originally elected or appointed. All of the Trustees are also Managers of the Compass Variable Accounts. The executive officers of the Trust hold similar offices for the Compass Variable Accounts and other funds in the MFS fund complex. As of January 1, 2009, each Trustee serves as a Trustee or Manager of 35 Accounts/Funds.
The Statement of Additional Information contains further information about the Trustees and is available without charge upon request by calling 1-800-752-7215.
| | |
Investment Adviser
Massachusetts Financial Services Company 500 Boylston Street, Boston, MA 02116-3741 | | Custodian State Street Bank and Trust 1 Lincoln Street, Boston, MA 02111-2900 |
Distributor
MFS Fund Distributors, Inc. 500 Boylston Street, Boston, MA 02116-3741 | | Independent Registered Public Accounting Firm Deloitte & Touche LLP 200 Berkeley Street, Boston, MA 02116 |
Portfolio Manager Thomas Wetherald | | |
21
BOARD REVIEW OF INVESTMENT ADVISORY AGREEMENT
The Investment Company Act of 1940 requires that both the full Board of Trustees and a majority of the non-interested (“independent”) Trustees, voting separately, annually approve the continuation of the investment advisory agreement between MFS Variable Insurance Trust II (the “Trust”) and Massachusetts Financial Services Company (“MFS”) on behalf of the Fund. The Trustees consider matters bearing on the Fund and the advisory arrangements at their meetings throughout the year, including a review of performance data at each regular meeting. In addition, the independent Trustees met in May and again in July 2008 (“contract review meetings”) for the specific purpose of considering whether to approve the continuation of the investment advisory agreement for the Fund. The independent Trustees were assisted in their evaluation of the investment advisory agreement by independent legal counsel, from whom they received separate legal advice and with whom they met separately from MFS management during various contract review meetings. The independent Trustees were also assisted in this process by the Fund’s Independent Chief Compliance Officer, a full-time senior officer appointed by and reporting to the independent Trustees.
In connection with their deliberations, the Trustees, including the independent Trustees, considered such information and factors as they believed, in light of the legal advice furnished to them and their own business judgment, to be relevant. The investment advisory agreement was considered separately for the Fund, although the Trustees also took into account the common interests of all Funds in the Trust in their review. As described below, the Trustees considered the nature, quality, and extent of the various investment advisory, administrative, and shareholder services performed by MFS under the existing investment advisory agreement and other arrangements with the Trust.
In connection with their contract review meetings, the Trustees received and relied upon materials which included, among other items: (i) information provided by Lipper Inc. on the investment performance of the Fund for various time periods ended December 31, 2007, compared to the investment performance of a group of funds with substantially similar investment classifications/objectives (the “Lipper performance universe”), (ii) information provided by Lipper Inc. on the Fund’s advisory fees and other expenses compared to the advisory fees and other expenses of comparable funds identified by Lipper (the “Lipper expense group”), (iii) information provided by MFS on the advisory fees of comparable portfolios of its other clients, including institutional separate account and other clients, (iv) information as to whether expense waivers, reimbursements or fee “breakpoints” are observed for the Fund, (v) information regarding MFS’ financial results and financial condition, including MFS’ and certain of its affiliates’ estimated profitability from services performed for the Fund, (vi) MFS’ views regarding the outlook for the mutual fund industry and its strategic business plans, (vii) descriptions of various functions performed by MFS for the Trust, such as compliance monitoring and portfolio trading practices, and (viii) information regarding the overall organization of MFS, including information about MFS’ senior management and other personnel providing investment advisory, administrative and other services to the Fund. The comparative performance, fee and expense information prepared and provided by Lipper Inc. was not independently verified, and the independent Trustees did not independently verify any information provided to them by MFS.
The Trustees’ conclusion as to the continuation of the investment advisory agreement was based on comprehensive consideration of all information provided to the Trustees and not the result of any single factor. Some of the factors that figured particularly in the Trustees’ deliberations are described below for the Fund, while individual Trustees may have given different weight to various factors and evaluated the information presented as a whole differently than another Trustee. The Trustees recognized that the fee arrangements for the Fund reflect years of review and discussion between the independent Trustees and MFS, that certain aspects of such arrangements may receive greater scrutiny in some years than others, and that the Trustees’ conclusions may be based, in part, on their consideration of these same arrangements during the course of the year and in prior years.
Based on information provided by Lipper Inc., the Trustees compared the Fund’s total return investment performance to the performance of a peer group of funds over various time periods. The Trustees placed particular emphasis on the total return performance of the Fund’s Initial Class shares in comparison to the performance of funds in its Lipper performance universe over the one-, three- and five-year periods. The Trustees did not rely on performance results for more recent periods, including those shown elsewhere in this report.
The Trustees noted the performance of the Fund’s Initial Class shares was in the 5th quintile relative to the other funds in the Lipper Classification Index for the one-year period (the 1st quintile being the best performers and the 5th quintile being the worst performers). The total return performance of the Fund was in the 4th quintile for the three-year period and the 5th quintile for the five-year period ended December 31, 2007, relative to the Lipper performance universe. Based on the nature and quality of services provided by MFS and MFS’ explanation of steps taken to improve performance, the Board of Trustees concluded that the Fund’s performance was adequate.
In the course of their deliberations, the Trustees took into account information provided by MFS during contract review meetings, as well as during investment review meetings conducted with portfolio management personnel during the course of the year.
22
Board Review of Investment Advisory Agreement – continued
In assessing the reasonableness of the Fund’s advisory fee, the Trustees considered, among other information, the Fund’s advisory fee and the total expense ratio of the Fund’s Initial Class shares as a percentage of average daily net assets, compared to the advisory fee and total expense ratios of its peer group of funds based on information provided by Lipper Inc. The Trustees also considered the advisory fees charged by MFS to institutional accounts. In comparing these fees, the Trustees considered the generally broader scope of services provided by MFS to the Trust than those provided to institutional accounts. The Trustees also considered the higher demands placed on MFS’ investment personnel and trading infrastructure as a result of the daily cash in-flows and out-flows of the Fund, and the impact on MFS and related expenses due to the more extensive regulatory regime to which the Fund is subject, compared to institutional accounts.
In considering the fees, the Trustees noted from the Lipper data that the Fund’s effective advisory fee rate was at the median and total expense ratio was approximately at the median of such fees and expenses of funds in the Lipper expense group. In addition, the Trustees noted that MFS agreed to continue to reduce its advisory fee on average daily net assets over $2.5 billion, and they accepted MFS’ offer to continue the expense limitation for the Fund. The Trustees further concluded that the existing breakpoints were sufficient to allow the Fund to benefit from economies of scale as its assets grow. The Trustees concluded that the fees were reasonable in light of the nature and quality of services provided.
The Trustees also considered information prepared by MFS relating to its costs and profits with respect to the Fund and other investment companies and accounts advised by MFS, as well as MFS’ methodologies used to determine and allocate its costs to the Fund and other accounts and products for purposes of estimating profitability.
After reviewing these and other factors described below, the Trustees concluded that the advisory fees charged to the Fund represent reasonable compensation in light of the nature and quality of the services being provided by MFS.
In addition, the Trustees considered MFS’ resources and related efforts to continue to retain, attract and motivate capable personnel to serve the Fund. The Trustees also considered the financial resources of MFS and its parent, Sun Life Financial Inc. The Trustees further considered any advantages and possible disadvantages of having an adviser which also serves other investment companies as well as institutional accounts.
The Trustees also considered the nature, quality, cost, and extent of administrative, transfer agency, and distribution services provided to the Fund by MFS and its affiliates under agreements and plans other than the investment advisory agreement, including the 12b-1 fees the Fund pays to MFS Fund Distributors, Inc., an affiliate of MFS. The Trustees also considered the nature, extent and quality of certain other services MFS performs or arranges on the Fund’s behalf, which may include securities lending programs, directed expense payment programs, class action recovery programs, and MFS’ interaction with third-party service providers, principally custodians and sub-custodians. The Trustees concluded that the various non-advisory services provided by MFS and its affiliates on behalf of the Fund were satisfactory. The Trustees also considered the benefits to MFS from the use of the Fund’s portfolio brokerage commissions to pay for research and other similar services and various other factors. Additionally, the Trustees considered so-called “fall-out benefits” to MFS such as reputational value derived from serving as investment manager to the Trust, and determined that any such benefits derived by MFS were reasonable and fair.
Based on their evaluation of factors that they deemed to be material, including those factors described above, the Board of Trustees, including a majority of the independent Trustees, concluded that the investment advisory agreement should be continued for an additional one-year period, commencing September 1, 2008.
A discussion regarding the Board’s most recent review and renewal of the fund’s Investment Advisory Agreement with MFS is available by clicking on the fund’s name under “Variable Insurance Portfolios-VIT II” in the “Products & Performance” section on the MFS Web site (mfs.com).
23
PROXY VOTING POLICIES AND INFORMATION
A general description of the MFS funds’ proxy voting policies and procedures is available without charge, upon request, by calling
1-800-225-2606, by visiting the Proxy Voting section of mfs.com or by visiting the SEC’s Web site at http://www.sec.gov.
Information regarding how the fund voted proxies relating to portfolio securities during the most recent twelve-month period ended June 30 is available without charge by visiting the Proxy Voting section of mfs.com or by visiting the SEC’s Web site at http://www.sec.gov.
QUARTERLY PORTFOLIO DISCLOSURE
The fund will file a complete schedule of portfolio holdings with the Securities and Exchange Commission (the Commission) for the first and third quarters of each fiscal year on Form N-Q. The fund’s Form N-Q may be reviewed and copied at the:
Public Reference Room
Securities and Exchange Commission
100 F Street, NE, Room 1580
Washington, D.C. 20549
Information on the operation of the Public Reference Room may be obtained by calling the Commission at 1-800-SEC-0330. The fund’s Form N-Q is available on the EDGAR database on the Commission’s Internet Web site at http://www.sec.gov, and copies of this information may be obtained, upon payment of a duplicating fee, by electronic request at the following e-mail address: publicinfo@sec.gov or by writing the Public Reference Section at the above address.
FEDERAL TAX INFORMATION (unaudited)
The following information is provided pursuant to provisions of the Internal Revenue Code.
The fund designates $32,618,000 as capital gain dividends paid during the fiscal year.
For corporate shareholders, 5.68% of the ordinary income dividends paid during the fiscal year qualify for the corporate dividends received deduction.
24
MFS® PRIVACY NOTICE
Privacy is a concern for every investor today. At MFS Investment Management® and the MFS funds, we take this concern very seriously. We want you to understand our policies about the investment products and services that we offer, and how we protect the nonpublic personal information of investors who have a direct relationship with us and our wholly owned subsidiaries.
Throughout our business relationship, you provide us with personal information. We maintain information and records about you, your investments, and the services you use. Examples of the nonpublic personal information we maintain include
| | Ÿ | | data from investment applications and other forms |
| | Ÿ | | share balances and transactional history with us, our affiliates, or others |
| | Ÿ | | facts from a consumer reporting agency |
We do not disclose any nonpublic personal information about our customers or former customers to anyone, except as permitted by law. We may share nonpublic personal information with third parties or certain of our affiliates in connection with servicing your account or processing your transactions. We may share information with companies or financial institutions that perform marketing services on our behalf or with other financial institutions with which we have joint marketing arrangements, subject to any legal requirements.
Authorization to access your nonpublic personal information is limited to appropriate personnel who provide products, services, or information to you. We maintain physical, electronic, and procedural safeguards to help protect the personal information we collect about you.
If you have any questions about the MFS privacy policy, please call 1-800-225-2606 any business day between 8 a.m. and 8 p.m. Eastern time.
Note: If you own MFS products or receive MFS services in the name of a third party such as a bank or broker-dealer, their privacy policy may apply to you instead of ours.
25


MFS® STRATEGIC VALUE PORTFOLIO
The report is prepared for the general information of contract owners. It is authorized for distribution to prospective investors only when preceded or accompanied by a current prospectus.
NOT FDIC INSURED Ÿ MAY LOSE VALUE Ÿ NO BANK GUARANTEE Ÿ NOT A DEPOSIT Ÿ NOT INSURED BY ANY FEDERAL GOVERNMENT AGENCY OR NCUA/NCUSIF
LETTER FROM THE CEO

Dear Contract Owners:
The market downturns and economic setbacks of late probably rank among the worst financial declines most of us have experienced. Inevitably, people may be questioning their commitment to investing. Still, it is important to remember that downturns are an inescapable part of the business cycle. Such troughs have been seen before, and if we can use history as a guide, market recoveries typically have followed.
Recent events have clearly shown us the value of certain types of investments. In this environment, two of the hallmarks of mutual funds — transparency and liquidity — have become critically important. Unlike some other types of investments, the operations of mutual funds are relatively transparent to their shareholders. With their daily redemption feature, mutual funds also generally provide easy, convenient access to one’s money. Through these recent market upheavals, this level of liquidity enhanced the ability of mutual fund investors to respond and modify their investments as they and their advisors saw fit — a flexibility that those in less liquid investments simply did not have at their disposal.
At MFS® we take particular pride in how well mutual funds can serve investors because we invented the mutual fund in the United States. Established in 1924, Massachusetts Investors Trust was the nation’s first fund. Recent market events only reinforce what we have learned through 85 years — that mutual funds provide unique features that are important to investors in any type of market climate.
Respectfully,

Robert J. Manning
Chief Executive Officer and Chief Investment Officer
MFS Investment Management®
February 17, 2009
The opinions expressed in this letter are subject to change, may not be relied upon for investment advice, and no forecasts can be guaranteed.
Before investing, consider the fund’s investment objectives, risks, charges, and expenses. For a prospectus containing this and other information, contact your investment professional or view online. Read it carefully.
MFS Fund Distributors, Inc., 500 Boylston Street, Boston, MA 02116
1
PORTFOLIO COMPOSITION
Portfolio structure
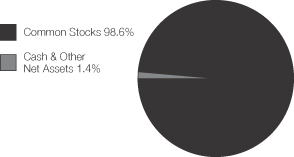
| | |
| Top ten holdings | | |
| Lockheed Martin Corp. | | 3.8% |
| Philip Morris International, Inc. | | 3.2% |
| MetLife, Inc. | | 3.1% |
| TOTAL S.A., ADR | | 2.8% |
| Chevron Corp. | | 2.7% |
| Oracle Corp. | | 2.3% |
| Nestle S.A. | | 2.2% |
| 3M Co. | | 2.1% |
| NRG Energy, Inc. | | 2.1% |
| Roche Holding AG | | 2.1% |
| | |
| Equity sectors | | |
| Financial Services | | 20.0% |
| Utilities & Communications | | 14.9% |
| Energy | | 13.1% |
| Health Care | | 12.9% |
| Consumer Staples | | 8.6% |
| Industrial Goods & Services | | 8.6% |
| Technology | | 5.5% |
| Leisure | | 4.6% |
| Basic Materials | | 3.4% |
| Retailing | | 2.5% |
| Special Products & Services | | 2.4% |
| Autos & Housing | | 2.1% |
Percentages are based on net assets as of 12/31/08.
The portfolio is actively managed and current holdings may be different.
2
MANAGEMENT REVIEW
Summary of Results
For the twelve months ended December 31, 2008, Initial Class shares of the MFS Strategic Value Portfolio (the “fund”) provided a total return of –42.69%, while Service Class shares of the fund provided a total return of –42.79%. This compares with a return of
–36.25% for the fund’s benchmark, the Russell 3000 Value Index.
Market Environment
The U.S. economy and financial markets experienced significant deterioration and extraordinary volatility over the reporting period. U.S. economic growth slowed significantly, despite the short-term bounce from the second quarter fiscal stimulus. Strong domestic headwinds included accelerated deterioration in the housing market, anemic corporate investment, a rapidly declining job market, and a much tighter credit environment. During the period, a seemingly continuous series of tumultuous financial events hammered markets, including: the distressed sale of failing Bear Stearns to JPMorgan, the conservatorship of Government Sponsored Enterprises (GSEs) Fannie Mae and Freddie Mac, the bankruptcy of investment bank Lehman Brothers, the Federal Reserve Bank’s complex intervention of insurance company American International Group (AIG), the nationalization of several large European banks, the failure of Washington Mutual, and the distressed sale of Wachovia. As a result of this barrage of turbulent news, global equity markets pushed significantly lower and credit markets witnessed the worst dislocation since the beginning of the credit crisis. Though conditions improved towards the end of the period, the state of financial and macroeconomic dislocation remained severe.
While reasonably resilient during the first half of the period, the global economy and financial system increasingly experienced considerable negative spillovers from the U.S. slowdown. Not only did Europe and Japan show obvious signs of economic softening, the more powerful engine of global growth – emerging markets – also displayed weakening dynamics.
During the reporting period, the U.S. Federal Reserve Board cut interest rates aggressively and introduced a multitude of new lending facilities to alleviate ever-tightening credit markets, while the U.S. federal government moved quickly to design and implement a meaningful fiscal stimulus package. Although several other global central banks also cut rates, the dilemma of rising energy and food prices heightened concerns among central bankers that inflationary expectations might become unhinged despite weaker growth. Only later in the reporting period did slowing global growth result in a very precipitous decline in commodity prices, which significantly eased inflation and inflationary expectations. As inflationary concerns diminished in the face of global deleveraging, and equity and credit markets deteriorated more sharply, a coordinated rate cut marked the beginning of much more aggressive easing by the major global central banks.
Detractors from Performance
During the reporting period, stock selection was the principal factor detracting from the fund’s performance relative to the Russell 3000 Value Index. Particularly hard hit were the energy, leisure, health care, and technology sectors.
In the energy sector, the fund’s positioning in integrated oil and gas company Exxon Mobil (g) hurt relative performance. Although shares of Exxon outperformed the benchmark, the fund’s underweighting of the stock detracted. Timing was also an issue as we missed a run up in the stock price in the latter part of the reporting period. In addition, the fund’s position in offshore oil and gas exploration company Helix Energy Solutions Group(g) weighed on relative results, as shares of Helix declined on concerns of lower production due to the Gulf Coast storms. In the leisure sector, positioning in hospitalities company Wyndham Worldwide (g), which underperformed the benchmark, also hurt.
In the health care sector, the fund’s positioning in eye care medical products maker Advanced Medical Optics (g), which we held as the stock’s price declined, was among the fund’s top detractors. Holdings of electronics services provider Flextronics (aa)(g) (Singapore), in the technology sector, also hindered relative performance as this security underperformed the benchmark over the reporting period. We feel that shares of Flextronics fell as the market became concerned about weak industry demand and how potential funding constraints could impair the company.
The retailing sector was another area of relative weakness, although no individual stocks within the sector were among the fund’s top detractors.
Elsewhere in the fund, positioning in insurance companies Genworth Financial (g) and Hartford Financial Services (g), distributor of electrical construction products Wesco (g), and manufacturer and distributor of consumer products Jarden (g) detracted from relative returns as these securities underperformed the benchmark. Our ownership of Bear Stearns, which was eventually acquired by JPMorgan Chase, also had a negative impact on performance.
Contributors to Performance
An underweighted position in the poor-performing financial services sector boosted relative performance. The fund’s holdings of investment banking firm Goldman Sachs, financial services firm UnionBanCal (g), and insurance companies MetLife, St. Paul Travelers (g), and American International Group (AIG) (g) were key factors in this result over the reporting period. Not holding poor-performing financial services firm Citigroup also helped.
3
Management Review – continued
Top relative contributors in other sectors included homebuilder D.R. Horton (g) and biotechnology firm Amgen. Approval from the Food and Drug Administration for the company’s drug Nplate boosted shares of Amgen. Nplate treats a disease which causes the body to attack its own platelets. Not holding poor-performing diversified industrial conglomerate General Electric also helped.
The fund’s cash position was also a contributor to relative performance. The fund holds cash to buy new holdings and to provide liquidity. In a period when equity markets declined, as measured by the fund’s benchmark, holding cash helped performance versus the benchmark, which has no cash position.
Respectfully,
Brooks Taylor
Portfolio Manager
Note to Shareholders: Effective November 20, 2008, Brooks Taylor became portfolio manager of the fund. Previously, the fund was managed by Gregory Locraft.
(aa) | | Security is not a benchmark constituent. |
| (g) | | Security was not held in the portfolio at period end. |
The views expressed in this report are those of the portfolio manager only through the end of the period of the report as stated on the cover and do not necessarily reflect the views of MFS or any other person in the MFS organization. These views are subject to change at any time based on market or other conditions, and MFS disclaims any responsibility to update such views. These views may not be relied upon as investment advice or an indication of trading intent on behalf of any MFS portfolio. References to specific securities are not recommendations of such securities, and may not be representative of any MFS portfolio’s current or future investments.
4
PERFORMANCE SUMMARY THROUGH 12/31/08
The following chart illustrates the historical performance of the fund in comparison to its benchmark(s). Benchmark comparisons are unmanaged; do not reflect any fees or expenses; and cannot be invested in directly. The performance of other share classes will be greater than or less than that of the class depicted below. (See Notes to Performance Summary.)
Performance data shown represents past performance and is no guarantee of future results. Investment return and principal value fluctuate so your units, when sold, may be worth more or less than the original cost; current performance may be lower or higher than quoted. The performance shown does not reflect the deduction of taxes, if any, that a contract holder would pay on fund distributions or the redemption of contract units. The returns for the fund shown also do not reflect the deduction of expenses associated with variable products, such as mortality and expense risk charges, separate account charges, and sales charges imposed by the insurance company separate accounts. Such expenses would reduce the overall returns shown.
Growth of a hypothetical $10,000 investment (t)
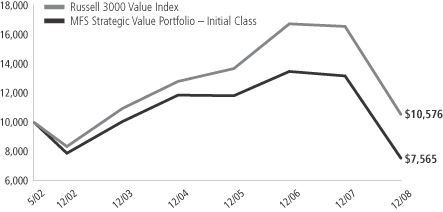
Total rates of return through 12/31/08
Average Annual Total Returns
| | | | | | | | | | | | |
| | | Share class | | Class inception date | | 1-yr | | 5-yr | | Life (t) | | |
| | | Initial Class | | 5/01/02 | | (42.69)% | | (5.56)% | | (4.10)% | | |
| | | Service Class | | 5/01/02 | | (42.79)% | | (5.79)% | | (4.32)% | | |
Comparative Benchmark
| | | | | | | | | | | | |
| | | Russell 3000 Value Index (f) | | (36.25)% | | (0.72)% | | 0.84% | | |
| (f) | Source: FactSet Research Systems Inc. |
| (t) | For the period from the commencement of the fund’s investment operations May 1, 2002 through the stated period end. |
Benchmark Definition
Russell 3000 Value Index – constructed to provide a comprehensive barometer for the value securities in the small to large-cap segment of the U.S. equity universe. Companies in this index generally have lower price-to-book ratios and lower forecasted growth values.
It is not possible to invest directly in an index.
Notes to Performance Summary
Performance results reflect any applicable expense subsidies and waivers in effect during the periods shown. Without such subsidies and waivers the fund’s performance results would be less favorable. Please see the prospectus for complete details. All results are historical and assume the reinvestment of any dividends and capital gains distributions.
From time to time the fund may receive proceeds from litigation settlements, without which performance would be lower.
5
EXPENSE TABLE
Fund Expenses Borne by the Contract Holders During the Period,
July 1, 2008 through December 31, 2008
As a contract holder of the fund, you incur ongoing costs, including management fees; distribution (12b-1) fees; and other fund expenses. This example is intended to help you understand your ongoing costs (in dollars) of investing in the fund and to compare these costs with the ongoing costs of investing in other mutual funds.
The example is based on an investment of $1,000 invested at the beginning of the period and held for the entire period July 1, 2008 through December 31, 2008.
Actual Expenses
The first line for each share class in the following table provides information about actual account values and actual expenses. You may use the information in this line, together with the amount you invested, to estimate the expenses that you paid over the period. Simply divide your account value by $1,000 (for example, an $8,600 account value divided by $1,000 = 8.6), then multiply the result by the number in the first line under the heading entitled “Expenses Paid During Period” to estimate the expenses you paid on your account during this period.
Hypothetical Example for Comparison Purposes
The second line for each share class in the following table provides information about hypothetical account values and hypothetical expenses based on the fund’s actual expense ratio and an assumed rate of return of 5% per year before expenses, which is not the fund’s actual return. The hypothetical account values and expenses may not be used to estimate the actual ending account balance or expenses you paid for the period. You may use this information to compare the ongoing costs of investing in the fund and other funds. To do so, compare this 5% hypothetical example with the 5% hypothetical examples that appear in the shareholder reports of the other funds.
Please note that the expenses shown in the table are meant to highlight the fund’s ongoing costs only and do not take into account the fees and expenses imposed under the variable contracts through which your investment in the fund is made. Therefore, the second line for each share class in the table is useful in comparing ongoing costs associated with an investment in vehicles (such as the fund) which fund benefits under variable annuity and variable life insurance contracts and to qualified pension and retirement plans only, and will not help you determine the relative total costs of investing in the fund through variable annuity and variable life insurance contracts. If the fees and expenses imposed under the variable contracts were included, your costs would have been higher.
| | | | | | | | | | |
| Share Class | | | | Annualized
Expense Ratio | | Beginning
Account Value
7/01/08 | | Ending
Account Value
12/31/08 | | Expenses Paid
During Period (p)
7/01/08-12/31/08 |
| Initial Class | | Actual | | 1.01% | | $1,000.00 | | $656.85 | | $4.21 |
| | Hypothetical (h) | | 1.01% | | $1,000.00 | | $1,020.06 | | $5.13 |
| Service Class | | Actual | | 1.25% | | $1,000.00 | | $655.84 | | $5.20 |
| | Hypothetical (h) | | 1.25% | | $1,000.00 | | $1,018.85 | | $6.34 |
| (h) | 5% class return per year before expenses. |
| (p) | Expenses paid is equal to each class’ annualized expense ratio, as shown above, multiplied by the average account value over the period, multiplied by the number of days in the period, divided by the number of days in the year. |
6
PORTFOLIO OF INVESTMENTS – 12/31/08
The Portfolio of Investments is a complete list of all securities owned by your fund. It is categorized by broad-based asset classes.
| | | | | |
| Issuer | | Shares/Par | | Value ($) |
| | | | | |
| COMMON STOCKS – 98.6% | | | | | |
| Aerospace – 4.4% | | | | | |
| Lockheed Martin Corp. | | 1,190 | | $ | 100,055 |
| Northrop Grumman Corp. | | 320 | | | 14,413 |
| | | | | |
| | | | $ | 114,468 |
| | | | | |
| Alcoholic Beverages – 0.4% | | | | | |
| Molson Coors Brewing Co. | | 210 | | $ | 10,273 |
| | | | | |
| Automotive – 0.8% | | | | | |
| Johnson Controls, Inc. | | 1,120 | | $ | 20,339 |
| | | | | |
| Biotechnology – 1.2% | | | | | |
| Amgen, Inc. (a) | | 560 | | $ | 32,340 |
| | | | | |
| Broadcasting – 2.7% | | | | | |
| Omnicom Group, Inc. | | 1,270 | | $ | 34,188 |
| Walt Disney Co. | | 1,570 | | | 35,623 |
| | | | | |
| | | | $ | 69,811 |
| | | | | |
| Brokerage & Asset Managers – 0.9% | | | | | |
| Deutsche Boerse AG | | 330 | | $ | 24,035 |
| | | | | |
| Business Services – 2.4% | | | | | |
| Accenture Ltd. | | 820 | | $ | 26,888 |
| MasterCard, Inc., “A” | | 100 | | | 14,293 |
| Visa, Inc. | | 410 | | | 21,505 |
| | | | | |
| | | | $ | 62,686 |
| | | | | |
| Chemicals – 3.4% | | | | | |
| 3M Co. | | 970 | | $ | 55,814 |
| PPG Industries, Inc. | | 740 | | | 31,398 |
| | | | | |
| | | | $ | 87,212 |
| | | | | |
| Computer Software – 2.6% | | | | | |
| Oracle Corp. (a) | | 3,410 | | $ | 60,459 |
| VeriSign, Inc. (a) | | 410 | | | 7,823 |
| | | | | |
| | | | $ | 68,282 |
| | | | | |
| Computer Software – Systems – 1.7% | | | | | |
| International Business Machines Corp. | | 520 | | $ | 43,763 |
| | | | | |
| Construction – 1.3% | | | | | |
| Pulte Homes, Inc. | | 3,100 | | $ | 33,883 |
| | | | | |
| Electrical Equipment – 2.4% | | | | | |
| Danaher Corp. | | 410 | | $ | 23,210 |
| W.W. Grainger, Inc. | | 510 | | | 40,208 |
| | | | | |
| | | | $ | 63,418 |
| | | | | |
| Electronics – 1.2% | | | | | |
| Agilent Technologies, Inc. (a) | | 310 | | $ | 4,845 |
| Intel Corp. | | 1,840 | | | 26,974 |
| | | | | |
| | | | $ | 31,819 |
| | | | | |
| Energy – Independent – 2.5% | | | | | |
| Apache Corp. | | 430 | | $ | 32,048 |
| Devon Energy Corp. | | 510 | | | 33,512 |
| | | | | |
| | | | $ | 65,560 |
| | | | | |
| | | | | |
| Issuer | | Shares/Par | | Value ($) |
| | | | | |
| COMMON STOCKS – continued | | | | | |
| Energy – Integrated – 8.4% | | | | | |
| Chevron Corp. | | 950 | | $ | 70,272 |
| Hess Corp. | | 530 | | | 28,429 |
| Marathon Oil Corp. | | 1,780 | | | 48,701 |
| TOTAL S.A., ADR | | 1,310 | | | 72,443 |
| | | | | |
| | | | $ | 219,845 |
| | | | | |
| Food & Beverages – 3.7% | | | | | |
| Hain Celestial Group, Inc. (a) | | 410 | | $ | 7,827 |
| J.M. Smucker Co. | | 310 | | | 13,442 |
| Nestle S.A. | | 1,477 | | | 58,212 |
| PepsiCo, Inc. | | 310 | | | 16,979 |
| | | | | |
| | | | $ | 96,460 |
| | | | | |
| Gaming & Lodging – 0.8% | | | | | |
| Royal Caribbean Cruises Ltd. | | 1,460 | | $ | 20,075 |
| | | | | |
| General Merchandise – 1.5% | | | | | |
| Macy’s, Inc. | | 3,890 | | $ | 40,262 |
| | | | | |
| Insurance – 10.6% | | | | | |
| ACE Ltd. | | 310 | | $ | 16,405 |
| Allied World Assurance Co. Holdings Ltd. | | 310 | | | 12,586 |
| Allstate Corp. | | 1,270 | | | 41,605 |
| Aspen Insurance Holdings Ltd. | | 1,890 | | | 45,832 |
| MetLife, Inc. | | 2,350 | | | 81,921 |
| PartnerRe Ltd. | | 390 | | | 27,795 |
| Travelers Cos., Inc. | | 1,100 | | | 49,720 |
| | | | | |
| | | | $ | 275,864 |
| | | | | |
| Leisure & Toys – 1.1% | | | | | |
| Hasbro, Inc. | | 1,020 | | $ | 29,753 |
| | | | | |
| Machinery & Tools – 1.8% | | | | | |
| Kennametal, Inc. | | 2,070 | | $ | 45,933 |
| | | | | |
| Major Banks – 7.5% | | | | | |
| Bank of America Corp. | | 2,736 | | $ | 38,523 |
| Bank of New York Mellon Corp. | | 1,370 | | | 38,812 |
| Goldman Sachs Group, Inc. | | 410 | | | 34,600 |
| JPMorgan Chase & Co. | | 1,410 | | | 44,457 |
| State Street Corp. | | 980 | | | 38,543 |
| | | | | |
| | | | $ | 194,935 |
| | | | | |
| Medical & Health Technology & Services – 2.2% | | | |
| DaVita, Inc. (a) | | 470 | | $ | 23,298 |
| IMS Health, Inc. | | 1,540 | | | 23,346 |
| Patterson Cos., Inc. (a) | | 510 | | | 9,563 |
| | | | | |
| | | | $ | 56,207 |
| | | | | |
| Medical Equipment – 3.3% | | | | | |
| Covidien Ltd. | | 510 | | $ | 18,482 |
| Medtronic, Inc. | | 310 | | | 9,740 |
| Waters Corp. (a) | | 930 | | | 34,085 |
| Zimmer Holdings, Inc. (a) | | 610 | | | 24,656 |
| | | | | |
| | | | $ | 86,963 |
| | | | | |
7
Portfolio of Investments – continued
| | | | | |
| Issuer | | Shares/Par | | Value ($) |
| | | | | |
| COMMON STOCKS – continued | | | | | |
| Natural Gas – Pipeline – 1.0% | | | | | |
| Williams Cos., Inc. | | 1,760 | | $ | 25,485 |
| | | | | |
| Oil Services – 2.2% | | | | | |
| Exterran Holdings, Inc. (a) | | 850 | | $ | 18,105 |
| Halliburton Co. | | 450 | | | 8,181 |
| Noble Corp. | | 1,390 | | | 30,705 |
| | | | | |
| | | | $ | 56,991 |
| | | | | |
| Other Banks & Diversified Financials – 0.3% | | | |
| New York Community Bancorp, Inc. | | 610 | | $ | 7,296 |
| | | | | |
| Pharmaceuticals – 6.2% | | | | | |
| Allergan, Inc. | | 210 | | $ | 8,467 |
| Merck & Co., Inc. | | 1,230 | | | 37,392 |
| Merck KGaA | | 100 | | | 9,092 |
| Roche Holding AG | | 360 | | | 55,416 |
| Wyeth | | 1,380 | | | 51,764 |
| | | | | |
| | | | $ | 162,131 |
| | | | | |
| Real Estate – 0.7% | | | | | |
| Equity Residential, REIT | | 620 | | $ | 18,488 |
| | | | | |
| Specialty Stores – 1.0% | | | | | |
| Nordstrom, Inc. | | 680 | | $ | 9,051 |
| Staples, Inc. | | 930 | | | 16,666 |
| | | | | |
| | | | $ | 25,717 |
| | | | | |
| Telecommunications – Wireless – 1.0% | | | | | |
| America Movil S.A.B. de C.V., “L”, ADR | | 420 | | $ | 13,016 |
| Rogers Communications, Inc., “B” | | 410 | | | 12,333 |
| | | | | |
| | | | $ | 25,349 |
| | | | | |
| Telephone Services – 4.0% | | | | | |
| AT&T, Inc. | | 1,890 | | $ | 53,865 |
| Embarq Corp. | | 1,020 | | | 36,679 |
| Verizon Communications, Inc. | | 415 | | | 14,068 |
| | | | | |
| | | | $ | 104,612 |
| | | | | |
| | | | | | | |
| Issuer | | Shares/Par | | Value ($) | |
| | | | | | | |
| COMMON STOCKS – continued | | | | | | | |
| Tobacco – 4.5% | | | | | | | |
| Lorillard, Inc. | | | 630 | | $ | 35,501 | |
| Philip Morris International, Inc. | | | 1,890 | | | 82,234 | |
| | | | | | | |
| | | | | $ | 117,735 | |
| | | | | | | |
| Utilities – Electric Power – 8.9% | | | | | | | |
| Allegheny Energy, Inc. | | | 610 | | $ | 20,655 | |
| American Electric Power Co., Inc. | | | 1,260 | | | 41,933 | |
| CMS Energy Corp. | | | 3,270 | | | 33,060 | |
| DPL, Inc. | | | 1,220 | | | 27,865 | |
| NRG Energy, Inc. (a) | | | 2,390 | | | 55,759 | |
| PG&E Corp. | | | 850 | | | 32,904 | |
| Public Service Enterprise Group, Inc. | | | 720 | | | 21,002 | |
| | | | | | | |
| | | | | $ | 233,178 | |
| | | | | | | |
Total Common Stocks
(Identified Cost, $3,099,486) | | | | | $ | 2,571,168 | |
| | | | | | | |
|
| REPURCHASE AGREEMENTS – 3.4% | |
| Goldman Sachs, 0.01%, dated 12/31/08, due 1/02/09, total to be received $87,000.05 (secured by U.S. Treasury and Federal Agency obligations and Mortgage Backed securities in a jointly traded account), at Cost | | $ | 87,000 | | $ | 87,000 | |
| | | | | | | |
Total Investments (Identified Cost, $3,186,486) | | | | | $ | 2,658,168 | |
| | | | | | | |
OTHER ASSETS, LESS LIABILITIES – (2.0)% | | | | | | (51,135 | ) |
| | | | | | | |
| Net Assets – 100.0% | | | | | $ | 2,607,033 | |
| | | | | | | |
| (a) | | Non-income producing security. |
The following abbreviations are used in this report and are defined:
| ADR | | American Depository Receipt |
| REIT | | Real Estate Investment Trust |
See Notes to Financial Statements
8
FINANCIAL STATEMENTS | STATEMENT OF ASSETS AND LIABILITIES
This statement represents your fund’s balance sheet, which details the assets and liabilities comprising the total value of the fund.
| | | | | |
At 12/31/08 | | | | | |
Assets | | | | | |
Investments, at value (identified cost, $3,186,486) | | $2,658,168 | | | |
Cash | | 465 | | | |
Interest and dividends receivable | | 5,097 | | | |
Receivable from investment adviser | | 9,067 | | | |
Other assets | | 453 | | | |
Total assets | | | | | $2,673,250 |
Liabilities | | | | | |
Payable for fund shares reacquired | | $13,215 | | | |
Payable to affiliates | | | | | |
Management fee | | 104 | | | |
Distribution fees | | 37 | | | |
Administrative services fee | | 55 | | | |
| Payable for trustees’ compensation | | 11 | | | |
Accrued expenses and other liabilities | | 52,795 | | | |
Total liabilities | | | | | $66,217 |
Net assets | | | | | $2,607,033 |
Net assets consist of | | | | | |
Paid-in capital | | $5,251,039 | | | |
Unrealized appreciation (depreciation) on investments and translation of assets and liabilities in foreign currencies | | (528,337 | ) | | |
Accumulated net realized gain (loss) on investments and foreign currency transactions | | (2,149,970 | ) | | |
Undistributed net investment income | | 34,301 | | | |
Net assets | | | | | $2,607,033 |
Shares of beneficial interest outstanding | | | | | 586,730 |
Initial Class shares | | | | | |
Net assets | | $5,686 | | | |
Shares outstanding | | 1,274 | | | |
Net asset value per share | | | | | $4.46 |
Service Class shares | | | | | |
Net assets | | $2,601,347 | | | |
Shares outstanding | | 585,456 | | | |
Net asset value per share | | | | | $4.44 |
See Notes to Financial Statements
9
FINANCIAL STATEMENTS | STATEMENT OF OPERATIONS
This statement describes how much your fund earned in investment income and accrued in expenses. It also describes any gains and/or losses generated by fund operations.
| | | | | | |
| Year ended 12/31/08 | | | | | | |
| Net investment income | | | | | | |
Income | | | | | | |
Dividends | | $92,139 | | | | |
Interest | | 2,615 | | | | |
Foreign taxes withheld | | (1,360 | ) | | | |
Total investment income | | | | | $93,394 | |
Expenses | | | | | | |
Management fee | | $34,017 | | | | |
Distribution fees | | 11,320 | | | | |
Administrative services fee | | 10,000 | | | | |
Trustees’ compensation | | 760 | | | | |
Custodian fee | | 16,963 | | | | |
Shareholder communications | | 8,524 | | | | |
Auditing fees | | 44,964 | | | | |
Legal fees | | 7,128 | | | | |
Miscellaneous | | 7,419 | | | | |
Total expenses | | | | | $141,095 | |
Fees paid indirectly | | (15 | ) | | | |
Reduction of expenses by investment adviser | | (84,784 | ) | | | |
Net expenses | | | | | $56,296 | |
Net investment income | | | | | $37,098 | |
Realized and unrealized gain (loss) on investments and foreign currency transactions | | | | | | |
Realized gain (loss) (identified cost basis) | | | | | | |
Investment transactions | | $(2,056,978 | ) | | | |
Foreign currency transactions | | (297 | ) | | | |
Net realized gain (loss) on investments and foreign currency transactions | | | | | $(2,057,275 | ) |
Change in unrealized appreciation (depreciation) | | | | | | |
Investments | | $(378,203 | ) | | | |
Translation of assets and liabilities in foreign currencies | | (38 | ) | | | |
Net unrealized gain (loss) on investments and foreign currency translation | | | | | $(378,241 | ) |
Net realized and unrealized gain (loss) on investments and foreign currency | | | | | $(2,435,516 | ) |
Change in net assets from operations | | | | | $(2,398,418 | ) |
See Notes to Financial Statements
10
FINANCIAL STATEMENTS | STATEMENTS OF CHANGES IN NET ASSETS
These statements describe the increases and/or decreases in net assets resulting from operations, any distributions, and any shareholder transactions.
| | | | | | |
For years ended 12/31 | | 2008 | | | 2007 | |
Change in net assets | | | | | | |
From operations | | | | | | |
Net investment income | | $37,098 | | | $45,827 | |
Net realized gain (loss) on investments and foreign currency transactions | | (2,057,275 | ) | | 969,167 | |
Net unrealized gain (loss) on investments and foreign currency translation | | (378,241 | ) | | (1,133,864 | ) |
Change in net assets from operations | | $(2,398,418 | ) | | $(118,870 | ) |
Distributions declared to shareholders | | | | | | |
From net investment income | | | | | | |
Initial Class | | $(118 | ) | | $(188 | ) |
Service Class | | (45,181 | ) | | (130,127 | ) |
From net realized gain on investments | | | | | | |
Initial Class | | (1,643 | ) | | (737 | ) |
Service Class | | (930,647 | ) | | (601,917 | ) |
Total distributions declared to shareholders | | $(977,589 | ) | | $(732,969 | ) |
Change in net assets from fund share transactions | | $(1,335,858 | ) | | $(929,353 | ) |
Total change in net assets | | $(4,711,865 | ) | | $(1,781,192 | ) |
Net assets | | | | | | |
At beginning of period | | 7,318,898 | | | 9,100,090 | |
At end of period (including undistributed net investment income of $34,301 and
$44,796, respectively) | | $2,607,033 | | | $7,318,898 | |
See Notes to Financial Statements
11
FINANCIAL STATEMENTS | FINANCIAL HIGHLIGHTS
The financial highlights table is intended to help you understand the fund’s financial performance for the past 5 years. Certain information reflects financial results for a single fund share. The total returns in the table represent the rate by which an investor would have earned (or lost) on an investment in the fund share class (assuming reinvestment of all distributions) held for the entire period.
| | | | | | | | | | | | | | | |
| Initial Class | | Years ended 12/31 | |
| | | 2008 | | | 2007 | | | 2006 | | | 2005 | | | 2004 | |
Net asset value, beginning of period | | $9.55 | | | $10.66 | | | $10.23 | | | $11.57 | | | $10.05 | |
| Income (loss) from investment operations | | | | | | | | | | | | | | | |
Net investment income (d) | | $0.08 | | | $0.08 | | | $0.17 | | | $0.08 | | | $0.11 | |
Net realized and unrealized gain (loss) on investments
and foreign currency | | (3.48 | ) | | (0.22 | ) | | 1.19 | | | (0.18 | ) | | 1.63 | |
Total from investment operations | | $(3.40 | ) | | $(0.14 | ) | | $1.36 | | | $(0.10 | ) | | $1.74 | |
| Less distributions declared to shareholders | | | | | | | | | | | | | | | |
From net investment income | | $(0.11 | ) | | $(0.20 | ) | | $(0.08 | ) | | $(0.11 | ) | | $(0.04 | ) |
From net realized gain on investments | | (1.58 | ) | | (0.77 | ) | | (0.85 | ) | | (1.13 | ) | | (0.18 | ) |
Total distributions declared to shareholders | | $(1.69 | ) | | $(0.97 | ) | | $(0.93 | ) | | $(1.24 | ) | | $(0.22 | ) |
Net asset value, end of period | | $4.46 | | | $9.55 | | | $10.66 | | | $10.23 | | | $11.57 | |
Total return (%) (k)(r)(s) | | (42.69 | ) | | (2.33 | ) | | 14.16 | | | (0.39 | ) | | 18.05 | |
Ratios (%) (to average net assets)
and Supplemental data: | | | | | | | | | | | | | | | |
Expenses before expense reductions (f) | | 2.93 | | | 1.65 | | | 1.71 | | | 1.44 | | | 1.29 | |
Expenses after expense reductions (f) | | 0.99 | | | 0.98 | | | 0.99 | | | 1.00 | | | 0.99 | |
Net investment income | | 1.12 | | | 0.78 | | | 1.69 | | | 0.74 | | | 1.05 | |
Portfolio turnover | | 108 | | | 102 | | | 56 | | | 60 | | | 70 | |
Net assets at end of period (000 Omitted) | | $6 | | | $10 | | | $10 | | | $9 | | | $9 | |
See Notes to Financial Statements
12
Financial Highlights – continued
| | | | | | | | | | | | | | | |
| Service Class | | Years ended 12/31 | |
| | | 2008 | | | 2007 | | | 2006 | | | 2005 | | | 2004 | |
Net asset value, beginning of period | | $9.49 | | | $10.60 | | | $10.17 | | | $11.52 | | | $10.02 | |
| Income (loss) from investment operations | | | | | | | | | | | | | | | |
Net investment income (d) | | $0.06 | | | $0.06 | | | $0.14 | | | $0.05 | | | $0.09 | |
Net realized and unrealized gain (loss) on investments
and foreign currency | | (3.45 | ) | | (0.23 | ) | | 1.20 | | | (0.19 | ) | | 1.61 | |
Total from investment operations | | $(3.39 | ) | | $(0.17 | ) | | $1.34 | | | $(0.14 | ) | | $1.70 | |
| Less distributions declared to shareholders | | | | | | | | | | | | | | | |
From net investment income | | $(0.08 | ) | | $(0.17 | ) | | $(0.06 | ) | | $(0.08 | ) | | $(0.02 | ) |
From net realized gain on investments | | (1.58 | ) | | (0.77 | ) | | (0.85 | ) | | (1.13 | ) | | (0.18 | ) |
Total distributions declared to shareholders | | $(1.66 | ) | | $(0.94 | ) | | $(0.91 | ) | | $(1.21 | ) | | $(0.20 | ) |
Net asset value, end of period | | $4.44 | | | $9.49 | | | $10.60 | | | $10.17 | | | $11.52 | |
Total return (%) (k)(r)(s) | | (42.79 | ) | | (2.62 | ) | | 13.92 | | | (0.72 | ) | | 17.77 | |
Ratios (%) (to average net assets)
and Supplemental data: | | | | | | | | | | | | | | | |
Expenses before expense reductions (f) | | 3.11 | | | 1.91 | | | 1.94 | | | 1.69 | | | 1.55 | |
Expenses after expense reductions (f) | | 1.24 | | | 1.23 | | | 1.24 | | | 1.25 | | | 1.25 | |
Net investment income | | 0.82 | | | 0.53 | | | 1.37 | | | 0.48 | | | 0.82 | |
Portfolio turnover | | 108 | | | 102 | | | 56 | | | 60 | | | 70 | |
Net assets at end of period (000 Omitted) | | $2,601 | | | $7,309 | | | $9,090 | | | $10,651 | | | $11,597 | |
| (d) | Per share data is based on average shares outstanding. |
| (f) | Ratios do not reflect reductions from fees paid indirectly, if applicable. |
| (k) | The total return does not reflect expenses that apply to separate accounts. Inclusion of these charges would reduce the total return figures for all periods shown. |
| (r) | Certain expenses have been reduced without which performance would have been lower. |
| (s) | From time to time the fund may receive proceeds from litigation settlements, without which performance would be lower. |
See Notes to Financial Statements
13
NOTES TO FINANCIAL STATEMENTS
| (1) | | Business and Organization |
MFS Strategic Value Portfolio (the fund) is a series of MFS Variable Insurance Trust II (the trust). The trust is organized as a Massachusetts business trust and is registered under the Investment Company Act of 1940, as amended, as an open-end management investment company. The shares of the fund are sold to variable accounts established by insurance companies to fund benefits under variable contracts issued by such companies, and qualified retirement and pension plans.
| (2) | | Significant Accounting Policies |
General – The preparation of financial statements in conformity with U.S. generally accepted accounting principles requires management to make estimates and assumptions that affect the reported amounts of assets and liabilities, and disclosure of contingent assets and liabilities at the date of the financial statements and the reported amounts of revenues and expenses during the reporting period. Actual results could differ from those estimates. The fund can invest in foreign securities, including securities of emerging market issuers. Investments in foreign securities are vulnerable to the effects of changes in the relative values of the local currency and the U.S. dollar and to the effects of changes in each country’s legal, political, and economic environment. The markets of emerging markets countries are generally more volatile than the markets of developed countries with more mature economies. All of the risks of investing in foreign securities previously described are heightened when investing in emerging markets countries.
In March 2008, FASB Statement No. 161, Disclosures about Derivative Instruments and Hedging Activities (the “Standard”) was issued, and is effective for financial statements issued for fiscal years and interim periods beginning after November 15, 2008. This Standard provides enhanced disclosures about the fund’s use of and accounting for derivative instruments and the effect of derivative instruments on the fund’s results of operations and financial position. Management is evaluating the application of the Standard to the fund, and has not at this time determined the impact, if any, resulting from the adoption of this Standard on the fund’s financial statements.
FASB Staff Position (FSP) 133-1 was implemented during the period. FSP 133-1 amends FAS 133 to require sellers of credit derivatives to make disclosures that will enable financial statement users to assess the potential effects of those credit derivatives on an entity’s financial position, financial performance and cash flows. There was no impact from implementing FSP 133-1 as the fund did not hold any of these credit derivatives at period end.
Investment Valuations – Equity securities, including restricted equity securities, are generally valued at the last sale or official closing price as reported by a third party pricing service on the market or exchange on which they are primarily traded. For securities for which there were no sales reported that day, equity securities are generally valued at the last quoted daily bid quotation as reported by a third party pricing service on the market or exchange on which they are primarily traded. For securities held short for which there were no sales reported for the day, the position is generally valued at the last quoted daily ask quotation as reported by a third party pricing service on the market or exchange on which such securities are primarily traded. Short-term instruments with a maturity at issuance of 60 days or less may be valued at amortized cost, which approximates market value. Securities and other assets generally valued on the basis of information from a third party pricing service may also be valued at a broker-dealer bid quotation. Values obtained from pricing services can utilize both dealer-supplied valuations and electronic data processing techniques, which take into account factors such as institutional-size trading in similar groups of securities, yield, quality, coupon rate, maturity, type of issue, trading characteristics, and other market data. The values of foreign securities and other assets and liabilities expressed in foreign currencies are converted to U.S. dollars using the mean of bid and asked prices for rates reported by a third party pricing service.
The Board of Trustees has delegated primary responsibility for determining or causing to be determined the value of the fund’s investments (including any fair valuation) to the adviser pursuant to valuation policies and procedures approved by the Board. If the adviser determines that reliable market quotations are not readily available, investments are valued at fair value as determined in good faith by the adviser in accordance with such procedures under the oversight of the Board of Trustees. Under the fund’s valuation policies and procedures, market quotations are not considered to be readily available for most types of debt instruments and floating rate loans and many types of derivatives. These investments are generally valued at fair value based on information from third party pricing services. In addition, investments may be valued at fair value if the adviser determines that an investment’s value has been materially affected by events occurring after the close of the exchange or market on which the investment is principally traded (such as foreign exchange or market) and prior to the determination of the fund’s net asset value, or after the halting of trading of a specific security where trading does not resume prior to the close of the exchange or market on which the security is principally traded. Events that occur on a frequent basis after foreign markets close (such as developments in foreign markets and significant movements in the U.S. markets) and prior to the determination of the fund’s net asset value may be deemed to have a material affect on the value of securities traded in foreign markets. Accordingly, the fund’s foreign equity securities may often be valued at fair value. The adviser may rely on third party pricing services or other information (such as the correlation with price movements of similar securities in the same or other
14
Notes to Financial Statements – continued
markets; the type, cost and investment characteristics of the security; the business and financial condition of the issuer; and trading and other market data) to assist in determining whether to fair value and at what value to fair value an investment. The value of an investment for purposes of calculating the fund’s net asset value can differ depending on the source and method used to determine value. When fair valuation is used, the value of investments used to determine the fund’s net asset value may differ from quoted or published prices for the same investments.
The fund adopted FASB Statement No. 157, Fair Value Measurements (the “Statement”). This Statement provides a single definition of fair value, a hierarchy for measuring fair value and expanded disclosures about fair value measurements.
Various inputs are used in determining the value of the fund’s assets or liabilities carried at market value. These inputs are categorized into three broad levels. Level 1 includes quoted prices in active markets for identical assets or liabilities. Level 2 includes other significant observable market-based inputs (including quoted prices for similar securities, interest rates, prepayment speed, and credit risk). Level 3 includes unobservable inputs, which may include the adviser’s own assumptions in determining the fair value of investments. Other financial instruments are derivative instruments not reflected in total investments, such as futures, forwards, swap contracts, and written options. The following is a summary of the levels used as of December 31, 2008 in valuing the fund’s assets or liabilities carried at market value:
| | | | | | | | |
| | | Level 1 | | Level 2 | | Level 3 | | Total |
| Investments in Securities | | $2,424,413 | | $233,755 | | $— | | $2,658,168 |
| Other Financial Instruments | | $— | | $— | | $— | | $— |
Repurchase Agreements – The fund may enter into repurchase agreements with approved counterparties. Each repurchase agreement is recorded at cost. The fund requires that the securities collateral in a repurchase transaction be transferred to a custodian. The fund monitors, on a daily basis, the value of the collateral to ensure that its value, including accrued interest, is greater than amounts owed to the fund under each such repurchase agreement. The fund and other funds managed by Massachusetts Financial Services Company (MFS), may utilize a joint trading account for the purpose of entering into one or more repurchase agreements.
Foreign Currency Translation – Purchases and sales of foreign investments, income, and expenses are converted into U.S. dollars based upon currency exchange rates prevailing on the respective dates of such transactions or on the reporting date for foreign denominated receivables and payables. Gains and losses attributable to foreign currency exchange rates on sales of securities are recorded for financial statement purposes as net realized gains and losses on investments. Gains and losses attributable to foreign exchange rate movements on receivables, payables, income and expenses are recorded for financial statement purposes as foreign currency transaction gains and losses. That portion of both realized and unrealized gains and losses on investments that results from fluctuations in foreign currency exchange rates is not separately disclosed.
Indemnifications – Under the fund’s organizational documents, its officers and trustees may be indemnified against certain liabilities and expenses arising out of the performance of their duties to the fund. Additionally, in the normal course of business, the fund enters into agreements with service providers that may contain indemnification clauses. The fund’s maximum exposure under these agreements is unknown as this would involve future claims that may be made against the fund that have not yet occurred.
Investment Transactions and Income – Investment transactions are recorded on the trade date. Interest income is recorded on the accrual basis. All premium and discount is amortized or accreted for financial statement purposes in accordance with U.S. generally accepted accounting principles. Dividends received in cash are recorded on the ex-dividend date. Certain dividends from foreign securities will be recorded when the fund is informed of the dividend if such information is obtained subsequent to the ex-dividend date. Dividend and interest payments received in additional securities are recorded on the ex-dividend or ex-interest date in an amount equal to the value of the security on such date.
The fund may receive proceeds from litigation settlements. Any proceeds received from litigation involving portfolio holdings are reflected in the Statement of Operations in realized gain/loss if the security has been disposed of by the fund or in unrealized gain/loss if the security is still held by the fund. Any other proceeds from litigation not related to portfolio holdings are reflected as other income in the Statement of Operations.
Fees Paid Indirectly – The fund’s custody fee may be reduced according to an arrangement that measures the value of cash deposited with the custodian by the fund. This amount, for the year ended December 31, 2008, is shown as a reduction of total expenses on the Statement of Operations.
Tax Matters and Distributions – The fund intends to qualify as a regulated investment company, as defined under Subchapter M of the Internal Revenue Code, and to distribute all of its taxable income, including realized capital gains. As a result, no provision for federal income tax is required. Each of the fund’s federal tax returns for the prior three fiscal years remains subject to examination by the Internal Revenue Service. Foreign taxes, if any, have been accrued by the fund in the accompanying financial statements.
15
Notes to Financial Statements – continued
Distributions to shareholders are recorded on the ex-dividend date. Income and capital gain distributions are determined in accordance with income tax regulations, which may differ from U.S. generally accepted accounting principles. Certain capital accounts in the financial statements are periodically adjusted for permanent differences in order to reflect their tax character. These adjustments have no impact on net assets or net asset value per share. Temporary differences which arise from recognizing certain items of income, expense, gain or loss in different periods for financial statement and tax purposes will reverse at some time in the future. Distributions in excess of net investment income or net realized gains are temporary overdistributions for financial statement purposes resulting from differences in the recognition or classification of income or distributions for financial statement and tax purposes.
Book/tax differences primarily relate to wash sale loss deferrals.
The tax character of distributions declared to shareholders for the last two fiscal years is as follows:
| | | | |
| | | 12/31/08 | | 12/31/07 |
| Ordinary income (including any short-term capital gains) | | $153,908 | | $231,994 |
| Long-term capital gain | | 823,681 | | 500,975 |
| Total distributions | | $977,589 | | $732,969 |
The federal tax cost and the tax basis components of distributable earnings were as follows:
| | | |
| As of 12/31/08 | | | |
| Cost of investments | | $3,326,978 | |
| Gross appreciation | | 112,951 | |
| Gross depreciation | | (781,761 | ) |
| Net unrealized appreciation (depreciation) | | $(668,810 | ) |
| Undistributed ordinary income | | 34,301 | |
| Capital loss carryforwards | | (2,009,478 | ) |
| Other temporary differences | | (19 | ) |
As of December 31, 2008, the fund had capital loss carryforwards available to offset future realized gains. Such losses expire as follows:
Multiple Classes of Shares of Beneficial Interest – The fund offers multiple classes of shares, which differ in their respective distribution fees. The fund’s income, realized and unrealized gain (loss), and common expenses are allocated to shareholders based on the daily net assets of each class. Dividends are declared separately for each class. Differences in per share dividend rates are generally due to differences in separate class expenses.
| (3) | | Transactions with Affiliates |
Investment Adviser – The fund has an investment advisory agreement with MFS to provide overall investment management and related administrative services and facilities to the fund.
The management fee is computed daily and paid monthly at the following annual rates:
| | |
| First $1 billion of average daily net assets | | 0.75% |
| Average daily net assets in excess of $1 billion | | 0.65% |
The management fee incurred for the year ended December 31, 2008 was equivalent to an annual effective rate of 0.75% of the fund’s average daily net assets.
The investment adviser has agreed in writing to pay a portion of the fund’s total annual operating expenses, exclusive of interest, taxes, extraordinary expenses, brokerage and transaction costs and investment-related expenses, such that the total annual operating expenses of the fund do not exceed 0.98% for the Initial Class shares and 1.23% for the Service Class shares, based on the average daily net assets of each share class. This written agreement will continue until April 30, 2010. For the year ended December 31, 2008, this reduction amounted to $84,784 and is reflected as a reduction of total expenses in the Statement of Operations.
Distributor – MFS Fund Distributors, Inc. (MFD), a wholly-owned subsidiary of MFS, is the distributor of shares of the fund. The Trustees have adopted a distribution plan for the Service Class shares pursuant to Rule 12b-1 under the Investment Company Act of 1940.
The fund’s distribution plan provides that the fund will pay MFD distribution fees equal to 0.25% per annum of its average daily net assets attributable to Service Class shares as partial consideration for services performed and expenses incurred by MFD and financial intermediaries in connection with the sale and distribution of the fund’s Service Class shares and the sale and distribution of the variable annuity or variable life insurance contracts investing indirectly in Service Class shares. MFD may subsequently pay all, or a portion, of the distribution fees to financial intermediaries.
16
Notes to Financial Statements – continued
Shareholder Servicing Agent – MFS Service Center, Inc. (MFSC), a wholly-owned subsidiary of MFS, has contracted to provide transfer agent and recordkeeping functions in connection with the issuance, transfer, and redemption of each class of shares of the fund under a Shareholder Servicing Agent Agreement. During the year ended December 31, 2008, the fund did not pay MFSC a fee for this service.
Administrator – MFS provides certain financial, legal, shareholder communications, compliance, and other administrative services to the fund. Under an administrative services agreement, the fund partially reimburses MFS the costs incurred to provide these services. The fund is charged an annual fixed amount of $10,000 plus a fee based on average daily net assets.
The administrative services fee incurred for the year ended December 31, 2008 was equivalent to an annual effective rate of 0.2204% of the fund’s average daily net assets.
Trustees’ and Officers’ Compensation – The fund pays compensation to trustees in the form of a retainer, attendance fees, and additional compensation to the Board chairperson. The fund does not pay compensation directly to officers of the fund who are also officers of the investment adviser, all of whom receive remuneration for their services to the fund from MFS. Certain officers of the fund are officers or directors of MFS, MFD, and MFSC.
Other – This fund and certain other MFS funds (the funds) have entered into services agreements (the Agreements) which provide for payment of fees by the funds to Tarantino LLC and Griffin Compliance LLC in return for the provision of services of an Independent Chief Compliance Officer (ICCO) and Assistant ICCO, respectively, for the funds. The ICCO and Assistant ICCO are officers of the funds and the sole members of Tarantino LLC and Griffin Compliance LLC, respectively. The funds can terminate the Agreements with Tarantino LLC and Griffin Compliance LLC at any time under the terms of the Agreements. MFS has agreed to bear all expenses associated with office space, other administrative support, and supplies provided to the ICCO and Assistant ICCO. For the year ended December 31, 2008, the aggregate fees paid by the fund to Tarantino LLC and Griffin Compliance LLC were $41 and are included in miscellaneous expense on the Statement of Operations.
Purchases and sales of investments, other than U.S. Government securities, purchased option transactions, and short-term obligations, aggregated $4,878,450 and $7,112,805, respectively.
| (5) | | Shares of Beneficial Interest |
The fund’s Declaration of Trust permits the Trustees to issue an unlimited number of full and fractional shares of beneficial interest. Transactions in fund shares were as follows:
| | | | | | | | | | | | |
| | | Year ended 12/31/08 | | | Year ended 12/31/07 | |
| | | Shares | | | Amount | | | Shares | | | Amount | |
| Shares sold | | | | | | | | | | | | |
Initial Class | | — | | | $— | | | — | | | $— | |
Service Class | | 78,493 | | | 469,600 | | | 61,021 | | | 633,855 | |
| | 78,493 | | | $469,600 | | | 61,021 | | | $633,855 | |
| Shares issued to shareholders in reinvestment of distributions | | | | | | | | | | | | |
Initial Class | | 236 | | | $1,761 | | | 86 | | | $925 | |
Service Class | | 130,984 | | | 975,828 | | | 68,224 | | | 732,044 | |
| | 131,220 | | | $977,589 | | | 68,310 | | | $732,969 | |
| Shares reacquired | | | | | | | | | | | | |
Initial Class | | — | | | $— | | | — | | | $— | |
Service Class | | (394,075 | ) | | (2,783,047 | ) | | (216,477 | ) | | (2,296,177 | ) |
| | (394,075 | ) | | $(2,783,047 | ) | | (216,477 | ) | | $(2,296,177 | ) |
| Net change | | | | | | | | | | | | |
Initial Class | | 236 | | | $1,761 | | | 86 | | | $925 | |
Service Class | | (184,598 | ) | | (1,337,619 | ) | | (87,232 | ) | | (930,278 | ) |
| | (184,362 | ) | | $(1,335,858 | ) | | (87,146 | ) | | $(929,353 | ) |
The fund and other funds managed by MFS participate in a $1 billion unsecured committed line of credit provided by a syndication of banks under a credit agreement. In addition, the fund and other funds managed by MFS have established uncommitted borrowing arrangements with certain banks. Borrowings may be made for temporary financing needs. Interest is charged to each fund, based on its borrowings, generally at a rate equal to the Federal Reserve funds rate plus 0.30%. In addition, a commitment fee, based on the average daily, unused portion of the committed line of credit, is allocated among the participating funds at the end of each calendar quarter. For the year ended December 31, 2008, the fund’s commitment fee and interest expense were $20 and $0, respectively, and are included in miscellaneous expense on the Statement of Operations.
17
REPORT OF INDEPENDENT REGISTERED PUBLIC ACCOUNTING FIRM
To the Board of Trustees of MFS Variable Insurance Trust II and the Shareholders of
MFS Strategic Value Portfolio:
We have audited the accompanying statement of assets and liabilities, including the portfolio of investments, of MFS Strategic Value Portfolio (the “Fund”) (one of the portfolios comprising MFS Variable Insurance Trust II) as of December 31, 2008, and the related statement of operations for the year then ended, the statements of changes in net assets for each of the two years in the period then ended, and the financial highlights for each of the five years in the period then ended. These financial statements and financial highlights are the responsibility of the Fund’s management. Our responsibility is to express an opinion on these financial statements and financial highlights based on our audits.
We conducted our audits in accordance with the standards of the Public Company Accounting Oversight Board (United States). Those standards require that we plan and perform the audit to obtain reasonable assurance about whether the financial statements and financial highlights are free of material misstatement. The Fund is not required to have, nor were we engaged to perform, an audit of its internal control over financial reporting. Our audits included consideration of internal control over financial reporting as a basis for designing audit procedures that are appropriate in the circumstances, but not for the purpose of expressing an opinion on the effectiveness of the Fund’s internal control over financial reporting. Accordingly, we express no such opinion. An audit also includes examining, on a test basis, evidence supporting the amounts and disclosures in the financial statements, assessing the accounting principles used and significant estimates made by management, as well as evaluating the overall financial statement presentation. Our procedures included confirmation of securities owned as of December 31, 2008, by correspondence with the custodian and brokers. We believe that our audits provide a reasonable basis for our opinion.
In our opinion, the financial statements and financial highlights referred to above present fairly, in all material respects, the financial position of MFS Strategic Value Portfolio as of December 31, 2008, the results of its operations for the year then ended, the changes in its net assets for each of the two years in the period then ended, and the financial highlights for each of the five years in the period then ended, in conformity with accounting principles generally accepted in the United States of America.
DELOITTE & TOUCHE LLP
Boston, Massachusetts
February 19, 2009
18
TRUSTEES AND OFFICERS – IDENTIFICATION AND BACKGROUND
The Trustees and officers of the Trust, as of February 1, 2009, are listed below, together with their principal occupations during the past five years. (Their titles may have varied during that period.) The address of each Trustee and officer is 500 Boylston Street, Boston, Massachusetts 02116.
| | | | | | |
Name, Date of Birth | | Position(s) Held
with Fund | | Trustee/Officer
Since (1) | | Principal Occupations During the Past Five Years and
Other Directorships (2) |
| INTERESTED TRUSTEE | | | | |
David D. Horn (3) (born 6/07/41) | | Trustee | | April 1986 | | Private investor; Sun Life Assurance Company of Canada, Senior Vice President and General Manager for the United States (until 1997); Director (until March 2004) |
| | |
| INDEPENDENT TRUSTEES | | | | |
J. Kermit Birchfield (born 1/08/40) | | Chairman | | May 1997 | | Consultant; Century Partners, Inc. (investments), Director; Displaytech, Inc. (technology), Director; Dessin Fournir LLC (furniture manufacturer), Director (2005 to present); Intermountain Gas Company, Inc. & Intermountain Industries, Inc. (oil & gas exploration and production), Director; Site Watch LLC (software to monitor oil tanks), Managing Director (2006 to present); Juridica Investments (fund investing in judicial matters), Director (2007 to present); HPSC, Inc. (medical financing), Director (until January 2004) |
| | | |
Robert C. Bishop (born 1/13/43) | | Trustee | | May 2001 | | AutoImmune, Inc. (pharmaceutical product development), Chairman, President and Chief Executive Officer; Caliper Life Sciences Corp. (laboratory analytical instruments), Director; Millipore Corporation (purification/filtration products), Director; Waterstreet Capital (leverage buyouts), Advisory Board (August 2006 to present); Optobionics Corporation (ophthalmic devices), Director (2002 to 2007) |
| | | |
Frederick H. Dulles (born 3/12/42) | | Trustee | | May 2001 | | Ten State International Law PLLC (law firm), Of Counsel (since 2006); Prudential Carolina Real Estate, (real estate), Broker (since 2006); Free Enterprise Foundation, Inc. (research institute), Director & Secretary (until 2008); Disher, Hamrick & Myers Residential, Inc. (real estate) Broker (2005 until 2006); Frederick H. Dulles law practice (until 2006); Ten State Street LLP (law firm), Member (until 2005) |
| | | |
Marcia A. Kean (born 6/30/48) | | Trustee | | April 2005 | | Feinstein Kean Healthcare (consulting), Chief Executive Officer |
| | | |
Ronald G. Steinhart (born 6/15/40) | | Trustee | | May 2001 | | Private investor; Penske Automotive Group (automotive retailer), Director; Animal Health International, Inc. (animal health products), Director (since 2007); Texas Industries (concrete/aggregates/cement), Director (since 2007); Penson Worldwide, Inc. (securities clearance), Director (since 2006); Carreker Corporation (technology consulting) Director (until 2005); Prentiss Properties Trust (real estate investment trust), Director (until 2006) |
| | | |
Haviland Wright (born 7/21/48) | | Trustee | | May 2001 | | Profitability of Hawaii (software), Chief Development Officer (since December 2008); Elixir Technologies Corporation (software) Director (since 2005); Nano Loa Inc. (liquid crystal displays), Director |
| | |
| TRUSTEE EMERITUS | | | | |
Samuel Adams (born 10/19/25) | | Trustee Emeritus | | | | Retired; K&L Gates LLP (law firm), Of Counsel |
| | |
| OFFICERS | | | | |
Maria F. Dwyer (4) (born 12/01/58) | | President | | November 2005 | | Massachusetts Financial Services Company, Executive Vice President and Chief Regulatory Officer (since March 2004) Chief Compliance Officer (since December 2006); Fidelity Management & Research Company, Vice President (prior to March 2004); Fidelity Group of Funds, President and Treasurer (until March 2004) |
| | | |
Christopher R. Bohane (4) (born 1/18/74) | | Assistant Secretary and Assistant Clerk | | July 2005 | | Massachusetts Financial Services Company, Vice President and Senior Counsel |
| | | |
John M. Corcoran (4) (born 4/13/65) | | Treasurer | | October 2008 | | Massachusetts Financial Services Company, Senior Vice President (since October 2008); State Street Bank and Trust (financial services provider), Senior Vice President, (until September 2008) |
| | | |
Ethan D. Corey (4) (born 11/21/63) | | Assistant Secretary and Assistant Clerk | | July 2005 | | Massachusetts Financial Services Company, Senior Vice President and Associate General Counsel (since 2004); Dechert LLP (law firm), Counsel (prior to December 2004) |
| | | |
David L. DiLorenzo (4) (born 8/10/68) | | Assistant Treasurer | | July 2005 | | Massachusetts Financial Services Company, Vice President (since June 2005); JP Morgan Investor Services, Vice President (until June 2005) |
| | | |
Timothy M. Fagan (4) (born 7/10/68) | | Assistant Secretary and Assistant Clerk | | September 2005 | | Massachusetts Financial Services Company, Vice President and Senior Counsel (since September 2005); John Hancock Advisers, LLC, Vice President, Senior Attorney and Chief Compliance Officer (until August 2005) |
19
Trustees and Officers – continued
| | | | | | |
Name, Date of Birth | | Position(s) Held
with Fund | | Trustee/Officer
Since (1) | | Principal Occupations During the Past Five Years and
Other Directorships (2) |
Mark D. Fischer (4) (born 10/27/70) | | Assistant Treasurer | | July 2005 | | Massachusetts Financial Services Company, Vice President (since May 2005); JP Morgan Investment Management Company, Vice President (until May 2005) |
| | | |
Robyn L. Griffin (born 7/04/75) | | Assistant Independent Chief Compliance Officer | | August 2008 | | Griffin Compliance LLC (provider of compliance services), Principal (since August 2008); State Street Corporation (financial services provider), Mutual Fund Administration Assistant Vice President (October 2006 – July 2008); Liberty Mutual Group (insurance), Personal Market Assistant Controller (April 2006 – October 2006); Deloitte & Touche LLP (professional services firm), Senior Manager (prior to April 2006) |
| | | |
Brian E. Langenfeld (4) (born 3/07/73) | | Assistant Secretary and Assistant Clerk | | May 2006 | | Massachusetts Financial Services Company, Vice President and Senior Counsel (since May 2006); John Hancock Advisers, LLC, Assistant Vice President and Counsel (until April 2006) |
| | | |
Ellen Moynihan (4) (born 11/13/57) | | Assistant Treasurer | | May 1997 | | Massachusetts Financial Services Company, Senior Vice President |
| | | |
Susan S. Newton (4) (born 3/07/50) | | Assistant Secretary and Assistant Clerk | | May 2005 | | Massachusetts Financial Services Company, Senior Vice President and Associate General Counsel (since April 2005); John Hancock Advisers, LLC, Senior Vice President, Secretary and Chief Legal Officer (until April 2005) |
| | | |
Susan A. Pereira (4) (born 11/05/70) | | Assistant Secretary and Assistant Clerk | | July 2005 | | Massachusetts Financial Services Company, Vice President and Senior Counsel (since June 2004); Bingham McCutchen LLP (law firm), Associate (until June 2004) |
| | | |
Mark N. Polebaum (4) (born 5/01/52) | | Secretary and Clerk | | February 2006 | | Massachusetts Financial Services Company, Executive Vice President, General Counsel and Secretary (since January 2006); Wilmer Cutler Pickering Hale and Dorr LLP (law firm), Partner (until January 2006) |
| | | |
Frank L. Tarantino (born 3/07/44) | | Independent Chief Compliance Officer | | September 2004 | | Tarantino LLC (provider of compliance services), Principal (since June 2004); CRA Business Strategies Group (consulting services), Executive Vice President (until June 2004) |
| | | |
Richard S. Weitzel (4) (born 7/16/70) | | Assistant Secretary and Assistant Clerk | | October 2007 | | Massachusetts Financial Services Company, Vice President and Assistant General Counsel (since 2004); Massachusetts Department of Business and Technology, General Counsel (until April 2004) |
| | | |
James O. Yost (4) (born 6/12/60) | | Assistant Treasurer | | April 1992 | | Massachusetts Financial Services Company, Senior Vice President |
| (1) | Date first appointed to serve as Trustee/Officer of an MFS fund or a Compass variable account. Each Trustee has served continuously since appointment. |
| (2) | Directorships or trusteeships of companies required to report to the Securities and Exchange Commission (i.e., “public companies”). |
| (3) | “Interested person” of the Trust, within the meaning of the Investment Company Act of 1940 (referred to as the 1940 Act), which is the principal federal law governing investment companies like the Trust, as a result of position with Sun Life of Canada (U.S.). The address of Sun Life of Canada (U.S.) is One Sun Life Executive Park, Wellesley Hills, Massachusetts 02481. |
| (4) | “Interested person” of MFS within the meaning of the 1940 Act. The address of MFS is 500 Boylston Street, Boston, Massachusetts 02116. |
The Trust does not hold annual meetings for the purpose of electing Trustees, and Trustees are not elected for fixed terms. Each Trustee and officer holds office until his or her successor is chosen and qualified, or until his or her earlier death, resignation, retirement or removal.
All Trustees currently serve as Trustees of the Trust and have served in that capacity since originally elected or appointed. All of the Trustees are also Managers of the Compass Variable Accounts. The executive officers of the Trust hold similar offices for the Compass Variable Accounts and other funds in the MFS fund complex. As of January 1, 2009, each Trustee serves as a Trustee or Manager of 35 Accounts/Funds.
The Statement of Additional Information contains further information about the Trustees and is available without charge upon request by calling 1-800-752-7215.
| | |
Investment Adviser
Massachusetts Financial Services Company 500 Boylston Street, Boston, MA 02116-3741 | | Custodian State Street Bank and Trust 1 Lincoln Street, Boston, MA 02111-2900 |
Distributor
MFS Fund Distributors, Inc. 500 Boylston Street, Boston, MA 02116-3741 | | Independent Registered Public Accounting Firm Deloitte & Touche LLP 200 Berkeley Street, Boston, MA 02116 |
Portfolio Manager Brooks Taylor | | |
20
BOARD REVIEW OF INVESTMENT ADVISORY AGREEMENT
The Investment Company Act of 1940 requires that both the full Board of Trustees and a majority of the non-interested (“independent”) Trustees, voting separately, annually approve the continuation of the investment advisory agreement between MFS Variable Insurance Trust II (the “Trust”) and Massachusetts Financial Services Company (“MFS”) on behalf of the Fund. The Trustees consider matters bearing on the Fund and the advisory arrangements at their meetings throughout the year, including a review of performance data at each regular meeting. In addition, the independent Trustees met in May and again in July 2008 (“contract review meetings”) for the specific purpose of considering whether to approve the continuation of the investment advisory agreement for the Fund. The independent Trustees were assisted in their evaluation of the investment advisory agreement by independent legal counsel, from whom they received separate legal advice and with whom they met separately from MFS management during various contract review meetings. The independent Trustees were also assisted in this process by the Fund’s Independent Chief Compliance Officer, a full-time senior officer appointed by and reporting to the independent Trustees.
In connection with their deliberations, the Trustees, including the independent Trustees, considered such information and factors as they believed, in light of the legal advice furnished to them and their own business judgment, to be relevant. The investment advisory agreement was considered separately for the Fund, although the Trustees also took into account the common interests of all Funds in the Trust in their review. As described below, the Trustees considered the nature, quality, and extent of the various investment advisory, administrative, and shareholder services performed by MFS under the existing investment advisory agreement and other arrangements with the Trust.
In connection with their contract review meetings, the Trustees received and relied upon materials which included, among other items: (i) information provided by Lipper Inc. on the investment performance of the Fund for various time periods ended December 31, 2007, compared to the investment performance of a group of funds with substantially similar investment classifications/objectives (the “Lipper performance universe”), (ii) information provided by Lipper Inc. on the Fund’s advisory fees and other expenses compared to the advisory fees and other expenses of comparable funds identified by Lipper (the “Lipper expense group”), (iii) information provided by MFS on the advisory fees of comparable portfolios of its other clients, including institutional separate account and other clients, (iv) information as to whether expense waivers, reimbursements or fee “breakpoints” are observed for the Fund, (v) information regarding MFS’ financial results and financial condition, including MFS’ and certain of its affiliates’ estimated profitability from services performed for the Fund, (vi) MFS’ views regarding the outlook for the mutual fund industry and its strategic business plans, (vii) descriptions of various functions performed by MFS for the Trust, such as compliance monitoring and portfolio trading practices, and (viii) information regarding the overall organization of MFS, including information about MFS’ senior management and other personnel providing investment advisory, administrative and other services to the Fund. The comparative performance, fee and expense information prepared and provided by Lipper Inc. was not independently verified, and the independent Trustees did not independently verify any information provided to them by MFS.
The Trustees’ conclusion as to the continuation of the investment advisory agreement was based on comprehensive consideration of all information provided to the Trustees and not the result of any single factor. Some of the factors that figured particularly in the Trustees’ deliberations are described below for the Fund, while individual Trustees may have given different weight to various factors and evaluated the information presented as a whole differently than another Trustee. The Trustees recognized that the fee arrangements for the Fund reflect years of review and discussion between the independent Trustees and MFS, that certain aspects of such arrangements may receive greater scrutiny in some years than others, and that the Trustees’ conclusions may be based, in part, on their consideration of these same arrangements during the course of the year and in prior years.
Based on information provided by Lipper Inc., the Trustees compared the Fund’s total return investment performance to the performance of a peer group of funds over various time periods. The Trustees placed particular emphasis on the total return performance of the Fund’s Initial Class shares in comparison to the performance of funds in its Lipper performance universe over the one-, three- and five-year periods. The Trustees did not rely on performance results for more recent periods, including those shown elsewhere in this report.
The Trustees noted the performance of the Fund’s Initial Class shares was in the 4th quintile relative to the other funds in the Lipper Classification Index for the one-year period (the 1st quintile being the best performers and the 5th quintile being the worst performers). The total return performance of the Fund was in the 5th quintile for the three-year period and the five-year period ended December 31, 2007, relative to the Lipper performance universe. Based on the nature and quality of services provided by MFS and MFS’ explanation of steps taken to improve performance, the Board of Trustees concluded that the Fund’s performance was adequate.
In the course of their deliberations, the Trustees took into account information provided by MFS during contract review meetings, as well as during investment review meetings conducted with portfolio management personnel during the course of the year.
21
Board Review of Investment Advisory Agreement – continued
In assessing the reasonableness of the Fund’s advisory fee, the Trustees considered, among other information, the Fund’s advisory fee and the total expense ratio of the Fund’s Initial Class shares as a percentage of average daily net assets, compared to the advisory fee and total expense ratios of its peer group of funds based on information provided by Lipper Inc. The Trustees also considered the advisory fees charged by MFS to institutional accounts. In comparing these fees, the Trustees considered the generally broader scope of services provided by MFS to the Trust than those provided to institutional accounts. The Trustees also considered the higher demands placed on MFS’ investment personnel and trading infrastructure as a result of the daily cash in-flows and out-flows of the Fund, and the impact on MFS and related expenses due to the more extensive regulatory regime to which the Fund is subject, compared to institutional accounts.
In considering the fees, the Trustees noted from the Lipper data that the Fund’s effective advisory fee rate was below the median and total expense ratio was above the median of such fees and expenses of funds in the Lipper expense group. In addition, the Trustees accepted MFS’ offer to continue the expense limitation for the Fund. The Trustees further concluded that the existing breakpoint was sufficient to allow the Fund to benefit from economies of scale as its assets grow. The Trustees concluded that the fees were reasonable in light of the nature and quality of services provided.
The Trustees also considered information prepared by MFS relating to its costs and profits with respect to the Fund and other investment companies and accounts advised by MFS, as well as MFS’ methodologies used to determine and allocate its costs to the Fund and other accounts and products for purposes of estimating profitability.
After reviewing these and other factors described below, the Trustees concluded that the advisory fees charged to the Fund represent reasonable compensation in light of the nature and quality of the services being provided by MFS.
In addition, the Trustees considered MFS’ resources and related efforts to continue to retain, attract and motivate capable personnel to serve the Fund. The Trustees also considered the financial resources of MFS and its parent, Sun Life Financial Inc. The Trustees further considered any advantages and possible disadvantages of having an adviser which also serves other investment companies as well as institutional accounts.
The Trustees also considered the nature, quality, cost, and extent of administrative, transfer agency, and distribution services provided to the Fund by MFS and its affiliates under agreements and plans other than the investment advisory agreement, including the 12b-1 fees the Fund pays to MFS Fund Distributors, Inc., an affiliate of MFS. The Trustees also considered the nature, extent and quality of certain other services MFS performs or arranges on the Fund’s behalf, which may include securities lending programs, directed expense payment programs, class action recovery programs, and MFS’ interaction with third-party service providers, principally custodians and sub-custodians. The Trustees concluded that the various non-advisory services provided by MFS and its affiliates on behalf of the Fund were satisfactory. The Trustees also considered the benefits to MFS from the use of the Fund’s portfolio brokerage commissions to pay for research and other similar services and various other factors. Additionally, the Trustees considered so-called “fall-out benefits” to MFS such as reputational value derived from serving as investment manager to the Trust, and determined that any such benefits derived by MFS were reasonable and fair.
Based on their evaluation of factors that they deemed to be material, including those factors described above, the Board of Trustees, including a majority of the independent Trustees, concluded that the investment advisory agreement should be continued for an additional one-year period, commencing September 1, 2008.
A discussion regarding the Board’s most recent review and renewal of the fund’s Investment Advisory Agreement with MFS is available by clicking on the fund’s name under “Variable Insurance Portfolios-VIT II” in the “Products & Performance” section on the MFS Web site (mfs.com).
22
PROXY VOTING POLICIES AND INFORMATION
A general description of the MFS funds’ proxy voting policies and procedures is available without charge, upon request, by calling
1-800-225-2606, by visiting the Proxy Voting section of mfs.com or by visiting the SEC’s Web site at http://www.sec.gov.
Information regarding how the fund voted proxies relating to portfolio securities during the most recent twelve-month period ended June 30 is available without charge by visiting the Proxy Voting section of mfs.com or by visiting the SEC’s Web site at http://www.sec.gov.
QUARTERLY PORTFOLIO DISCLOSURE
The fund will file a complete schedule of portfolio holdings with the Securities and Exchange Commission (the Commission) for the first and third quarters of each fiscal year on Form N-Q. The fund’s Form N-Q may be reviewed and copied at the:
Public Reference Room
Securities and Exchange Commission
100 F Street, NE, Room 1580
Washington, D.C. 20549
Information on the operation of the Public Reference Room may be obtained by calling the Commission at 1-800-SEC-0330. The fund’s Form N-Q is available on the EDGAR database on the Commission’s Internet Web site at http://www.sec.gov, and copies of this information may be obtained, upon payment of a duplicating fee, by electronic request at the following e-mail address: publicinfo@sec.gov or by writing the Public Reference Section at the above address.
FEDERAL TAX INFORMATION (unaudited)
The following information is provided pursuant to provisions of the Internal Revenue Code.
The fund designates $823,681 as capital gain dividends paid during the fiscal year.
For corporate shareholders, 85.92% of the ordinary income dividends paid during the fiscal year qualify for the corporate dividends received deduction.
23
MFS® PRIVACY NOTICE
Privacy is a concern for every investor today. At MFS Investment Management® and the MFS funds, we take this concern very seriously. We want you to understand our policies about the investment products and services that we offer, and how we protect the nonpublic personal information of investors who have a direct relationship with us and our wholly owned subsidiaries.
Throughout our business relationship, you provide us with personal information. We maintain information and records about you, your investments, and the services you use. Examples of the nonpublic personal information we maintain include
| | Ÿ | | data from investment applications and other forms |
| | Ÿ | | share balances and transactional history with us, our affiliates, or others |
| | Ÿ | | facts from a consumer reporting agency |
We do not disclose any nonpublic personal information about our customers or former customers to anyone, except as permitted by law. We may share nonpublic personal information with third parties or certain of our affiliates in connection with servicing your account or processing your transactions. We may share information with companies or financial institutions that perform marketing services on our behalf or with other financial institutions with which we have joint marketing arrangements, subject to any legal requirements.
Authorization to access your nonpublic personal information is limited to appropriate personnel who provide products, services, or information to you. We maintain physical, electronic, and procedural safeguards to help protect the personal information we collect about you.
If you have any questions about the MFS privacy policy, please call 1-800-225-2606 any business day between 8 a.m. and 8 p.m. Eastern time.
Note: If you own MFS products or receive MFS services in the name of a third party such as a bank or broker-dealer, their privacy policy may apply to you instead of ours.
24


MFS® GROWTH PORTFOLIO
(formerly MFS® Emerging Growth Portfolio)
The report is prepared for the general information of contract owners. It is authorized for distribution to prospective investors only when preceded or accompanied by a current prospectus.
NOT FDIC INSURED Ÿ MAY LOSE VALUE Ÿ NO BANK GUARANTEE Ÿ NOT A DEPOSIT Ÿ NOT INSURED BY ANY FEDERAL GOVERNMENT AGENCY OR NCUA/NCUSIF
LETTER FROM THE CEO

Dear Contract Owners:
The market downturns and economic setbacks of late probably rank among the worst financial declines most of us have experienced. Inevitably, people may be questioning their commitment to investing. Still, it is important to remember that downturns are an inescapable part of the business cycle. Such troughs have been seen before, and if we can use history as a guide, market recoveries typically have followed.
Recent events have clearly shown us the value of certain types of investments. In this environment, two of the hallmarks of mutual funds — transparency and liquidity — have become critically important. Unlike some other types of investments, the operations of mutual funds are relatively transparent to their shareholders. With their daily redemption feature, mutual funds also generally provide easy, convenient access to one’s money. Through these recent market upheavals, this level of liquidity enhanced the ability of mutual fund investors to respond and modify their investments as they and their advisors saw fit — a flexibility that those in less liquid investments simply did not have at their disposal.
At MFS® we take particular pride in how well mutual funds can serve investors because we invented the mutual fund in the United States. Established in 1924, Massachusetts Investors Trust was the nation’s first fund. Recent market events only reinforce what we have learned through 85 years — that mutual funds provide unique features that are important to investors in any type of market climate.
Respectfully,

Robert J. Manning
Chief Executive Officer and Chief Investment Officer
MFS Investment Management®
February 17, 2009
The opinions expressed in this letter are subject to change, may not be relied upon for investment advice, and no forecasts can be guaranteed.
Before investing, consider the fund’s investment objectives, risks, charges, and expenses. For a prospectus containing this and other information, contact your investment professional or view online. Read it carefully.
MFS Fund Distributors, Inc., 500 Boylston Street, Boston, MA 02116
1
PORTFOLIO COMPOSITION
Portfolio structure

| | |
| Top ten holdings | | |
| Danaher Corp. | | 2.6% |
| Genzyme Corp. | | 2.3% |
| VeriSign, Inc. | | 2.2% |
| Google, Inc., ”A” | | 2.1% |
| Hewlett-Packard Co. | | 2.1% |
| Apple, Inc. | | 2.1% |
| Gilead Sciences, Inc. | | 2.1% |
| Lockheed Martin Corp. | | 2.1% |
| PepsiCo, Inc. | | 2.1% |
| Philip Morris International, Inc. | | 1.9% |
| | |
| Equity sectors | | |
| Health Care | | 18.8% |
| Technology | | 18.7% |
| Consumer Staples | | 11.1% |
| Retailing | | 8.5% |
| Energy | | 8.4% |
| Special Products & Services | | 7.8% |
| Industrial Goods & Services | | 5.4% |
| Financial Services | | 4.7% |
| Utilities & Communications | | 4.0% |
| Leisure | | 4.0% |
| Transportation | | 2.8% |
| Basic Materials | | 1.8% |
| Autos & Housing | | 0.4% |
Percentages are based on net assets as of 12/31/08.
The portfolio is actively managed and current holdings may be different.
2
MANAGEMENT REVIEW
Summary of Results
For the twelve months ended December 31, 2008, Initial Class shares of the MFS Growth Portfolio (formerly MFS Emerging Growth Portfolio) (the “fund”) provided a total return of –37.33%, while Service Class shares of the fund provided a total return of –37.53%. These compare with a return of –38.44% for the fund’s benchmark, the Russell 3000 Growth Index.
Market Environment
The U.S. economy and financial markets experienced significant deterioration and extraordinary volatility over the reporting period. U.S. economic growth slowed significantly, despite the short-term bounce from the second quarter fiscal stimulus. Strong domestic headwinds included accelerated deterioration in the housing market, anemic corporate investment, a rapidly declining job market, and a much tighter credit environment. During the period, a seemingly continuous series of tumultuous financial events hammered markets, including: the distressed sale of failing Bear Stearns to JPMorgan, the conservatorship of Government Sponsored Enterprises (GSEs) Fannie Mae and Freddie Mac, the bankruptcy of investment bank Lehman Brothers, the Federal Reserve Bank’s complex intervention of insurance company American International Group (AIG), the nationalization of several large European banks, the failure of Washington Mutual, and the distressed sale of Wachovia. As a result of this barrage of turbulent news, global equity markets pushed significantly lower and credit markets witnessed the worst dislocation since the beginning of the credit crisis. Though conditions improved towards the end of the period, the state of financial and macroeconomic dislocation remained severe.
While reasonably resilient during the first half of the period, the global economy and financial system increasingly experienced considerable negative spillovers from the U.S. slowdown. Not only did Europe and Japan show obvious signs of economic softening, the more powerful engine of global growth – emerging markets – also displayed weakening dynamics.
During the reporting period, the U.S. Federal Reserve Board cut interest rates aggressively and introduced a multitude of new lending facilities to alleviate ever-tightening credit markets, while the U.S. federal government moved quickly to design and implement a meaningful fiscal stimulus package. Although several other global central banks also cut rates, the dilemma of rising energy and food prices heightened concerns among central bankers that inflationary expectations might become unhinged despite weaker growth. Only later in the reporting period did slowing global growth result in a very precipitous decline in commodity prices, which significantly eased inflation and inflationary expectations. As inflationary concerns diminished in the face of global deleveraging, and equity and credit markets deteriorated more sharply, a coordinated rate cut marked the beginning of much more aggressive easing by the major global central banks.
Contributors to Performance
Stock selection in the industrial goods and services sector boosted performance relative to the Russell 3000 Growth Index. No individual stocks within this sector were among the fund’s top contributors for the reporting period. Stock selection and, to a lesser extent, the fund’s overweighted position in the special products and services sector also aided relative performance. Education services company Strayer Education was a relative contributor. The company reported earnings each quarter that exceeded analyst expectations, driven in part by strong enrollment trends.
Stock selection also had a positive impact on relative performance in the health care sector. Biotechnology companies Gilead Sciences and Genzyme were among the fund’s top relative contributors. Shares of Genzyme fared better than the sector overall due to strong sales growth in its drug products, particularly a significant jump in the latter part of the reporting period in sales of its rare genetic disorder drug Myozyme.
Stocks in other sectors that contributed to relative results included home improvement retailer Lowe’s Cos., alcoholic beverage producer Molson Coors Brewing Company (aa), and animation film developer DreamWorks Animation. An underweighted position in oil field services company Schlumberger (g) aided relative performance as the company’s stock price underperformed the benchmark. The fund’s positioning in discount retailer Family Dollar Stores and automotive parts retailer O’Reilly Automotive also helped relative returns. The fund held these two stocks for part of the reporting period, during which both stocks generated positive relative returns.
The fund’s cash position was also a contributor to relative performance. The fund holds cash to buy new holdings and to provide liquidity. In a period when equity markets declined, as measured by the fund’s benchmark, holding cash helped performance versus the benchmark, which has no cash position.
Detractors from Performance
Stock selection in the technology sector was the principal detractor from relative performance. Analog semiconductor manufacturer Intersil Holding and wireless solutions provider Research In Motion (aa) were among the top detractors. We believe
3
Management Review – continued
that shares of Research In Motion suffered during the latter part of the reporting period due to concern that the company spent too heavily to push a new slate of sleek BlackBerry devices into the marketplace. Not owning wireless communications software company QUALCOMM also dampened results as the company performed better than the benchmark over the period.
Stock selection in the leisure sector also hindered relative performance. Our investment in cruise line operator Royal Caribbean Cruises (aa)(g) had a negative impact on relative returns. Shares of Royal Caribbean suffered during the first part of the reporting period due to high fuel costs and more recently due to weak consumer spending. Not owning fast food chain McDonald’s was also a negative factor as the company significantly outperformed the benchmark.
Elsewhere, financial services firm Bank of America (aa) and offshore drilling company Noble Corp. were among the fund’s top relative detractors. Not owning discount retailer Wal-Mart Stores for most of the reporting period held back relative results as the company’s stock price outperformed the benchmark during that period. The fund’s underweighted positioning in pharmaceutical and medical products maker Abbott Laboratories and integrated oil company Exxon Mobil also detracted from returns relative to the benchmark.
Respectfully,
Eric Fischman
Portfolio Manager
Note to Shareholders: Effective May 1, 2008, the fund name changed from MFS Emerging Growth Portfolio to MFS Growth Portfolio.
| (aa) | | Security is not a benchmark constituent. |
| (g) | | Security was not held in the portfolio at period end. |
The views expressed in this report are those of the portfolio manager only through the end of the period of the report as stated on the cover and do not necessarily reflect the views of MFS or any other person in the MFS organization. These views are subject to change at any time based on market or other conditions, and MFS disclaims any responsibility to update such views. These views may not be relied upon as investment advice or an indication of trading intent on behalf of any MFS portfolio. References to specific securities are not recommendations of such securities, and may not be representative of any MFS portfolio’s current or future investments.
4
PERFORMANCE SUMMARY THROUGH 12/31/08
The following chart illustrates the historical performance of the fund in comparison to its benchmark(s). Benchmark comparisons are unmanaged; do not reflect any fees or expenses; and cannot be invested in directly. The performance of other share classes will be greater than or less than that of the class depicted below. (See Notes to Performance Summary.)
Performance data shown represents past performance and is no guarantee of future results. Investment return and principal value fluctuate so your units, when sold, may be worth more or less than the original cost; current performance may be lower or higher than quoted. The performance shown does not reflect the deduction of taxes, if any, that a contract holder would pay on fund distributions or the redemption of contract units. The returns for the fund shown also do not reflect the deduction of expenses associated with variable products, such as mortality and expense risk charges, separate account charges, and sales charges imposed by the insurance company separate accounts. Such expenses would reduce the overall returns shown.
Growth of a hypothetical $10,000 investment
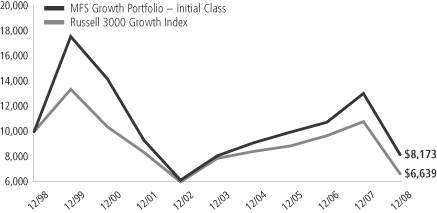
Total rates of return through 12/31/08
Average Annual Total Returns
| | | | | | | | | | | | |
| | | Share class | | Class inception date | | 1-yr | | 5-yr | | 10-yr | | |
| | | Initial Class | | 5/01/95 | | (37.33)% | | 0.29% | | (2.00)% | | |
| | | Service Class | | 8/24/01 | | (37.53)% | | 0.03% | | (2.19)% | | |
Comparative Benchmark
| | | | | | | | | | | | |
| | | Russell 3000 Growth Index (f) | | (38.44)% | | (3.33)% | | (4.01)% | | |
| (f) | Source: FactSet Research Systems Inc. |
Benchmark Definition
Russell 3000 Growth Index – constructed to provide a comprehensive barometer for growth securities in the small to large-cap segment of the U.S. equity universe. Companies in this index generally have higher price-to-book ratios and higher forecasted growth values.
It is not possible to invest directly in an index.
Notes to Performance Summary
Performance for the Service Class includes the performance of the fund’s Initial Class for periods prior to their offering. Because Service Class expenses are higher than those of Initial Class, performance shown for Service Class is higher than it would have been had it been offered for the entire period. Performance has not been adjusted to take into account differences in class specific operating expenses (such as Rule 12b-1 fees). Please see the prospectus for additional information about performance and expenses.
Performance results reflect any applicable expense subsidies and waivers in effect during the periods shown. Without such subsidies and waivers the fund’s performance results would be less favorable. Please see the prospectus for complete details. All results are historical and assume the reinvestment of any dividends and capital gains distributions.
From time to time the fund may receive proceeds from litigation settlements, without which performance would be lower.
5
EXPENSE TABLE
Fund Expenses Borne by the Contract Holders During the Period,
July 1, 2008 through December 31, 2008
As a contract holder of the fund, you incur ongoing costs, including management fees; distribution (12b-1) fees; and other fund expenses. This example is intended to help you understand your ongoing costs (in dollars) of investing in the fund and to compare these costs with the ongoing costs of investing in other mutual funds.
The example is based on an investment of $1,000 invested at the beginning of the period and held for the entire period July 1, 2008 through December 31, 2008.
Actual Expenses
The first line for each share class in the following table provides information about actual account values and actual expenses. You may use the information in this line, together with the amount you invested, to estimate the expenses that you paid over the period. Simply divide your account value by $1,000 (for example, an $8,600 account value divided by $1,000 = 8.6), then multiply the result by the number in the first line under the heading entitled “Expenses Paid During Period” to estimate the expenses you paid on your account during this period.
Hypothetical Example for Comparison Purposes
The second line for each share class in the following table provides information about hypothetical account values and hypothetical expenses based on the fund’s actual expense ratio and an assumed rate of return of 5% per year before expenses, which is not the fund’s actual return. The hypothetical account values and expenses may not be used to estimate the actual ending account balance or expenses you paid for the period. You may use this information to compare the ongoing costs of investing in the fund and other funds. To do so, compare this 5% hypothetical example with the 5% hypothetical examples that appear in the shareholder reports of the other funds.
Please note that the expenses shown in the table are meant to highlight the fund’s ongoing costs only and do not take into account the fees and expenses imposed under the variable contracts through which your investment in the fund is made. Therefore, the second line for each share class in the table is useful in comparing ongoing costs associated with an investment in vehicles (such as the fund) which fund benefits under variable annuity and variable life insurance contracts and to qualified pension and retirement plans only, and will not help you determine the relative total costs of investing in the fund through variable annuity and variable life insurance contracts. If the fees and expenses imposed under the variable contracts were included, your costs would have been higher.
| | | | | | | | | | |
| Share Class | | | | Annualized
Expense Ratio | | Beginning
Account Value
7/01/08 | | Ending
Account Value
12/31/08 | | Expenses Paid
During Period (p)
7/01/08-12/31/08 |
| Initial Class | | Actual | | 0.91% | | $1,000.00 | | $658.35 | | $3.79 |
| | Hypothetical (h) | | 0.91% | | $1,000.00 | | $1,020.56 | | $4.62 |
| Service Class | | Actual | | 1.16% | | $1,000.00 | | $657.27 | | $4.83 |
| | Hypothetical (h) | | 1.16% | | $1,000.00 | | $1,019.30 | | $5.89 |
| (h) | 5% class return per year before expenses. |
| (p) | Expenses paid is equal to each class’ annualized expense ratio, as shown above, multiplied by the average account value over the period, multiplied by the number of days in the period, divided by the number of days in the year. |
6
PORTFOLIO OF INVESTMENTS – 12/31/08
The Portfolio of Investments is a complete list of all securities owned by your fund. It is categorized by broad-based asset classes.
| | | | | |
| Issuer | | Shares/Par | | Value ($) |
| | | | | |
| COMMON STOCKS – 96.4% | | | | | |
| Aerospace – 2.1% | | | |
| Lockheed Martin Corp. | | 36,110 | | $ | 3,036,124 |
| | | | | |
| Airlines – 0.1% | | | |
| UAL Corp. | | 13,500 | | $ | 148,770 |
| | | | | |
| Alcoholic Beverages – 1.8% | | | |
| Molson Coors Brewing Co. | | 52,580 | | $ | 2,572,214 |
| | | | | |
| Apparel Manufacturers – 0.4% | | | |
| NIKE, Inc., “B” | | 11,680 | | $ | 595,680 |
| | | | | |
| Biotechnology – 6.7% | | | |
| Biogen Idec, Inc. (a) | | 5,910 | | $ | 281,493 |
| Celgene Corp. (a) | | 13,240 | | | 731,907 |
| Genentech, Inc. (a) | | 27,930 | | | 2,315,676 |
| Genzyme Corp. (a) | | 49,640 | | | 3,294,607 |
| Gilead Sciences, Inc. (a) | | 60,110 | | | 3,074,025 |
| | | | | |
| | | | $ | 9,697,708 |
| | | | | |
| Brokerage & Asset Managers – 0.8% | | | |
| Charles Schwab Corp. | | 48,960 | | $ | 791,683 |
| Deutsche Boerse AG | | 4,920 | | | 358,335 |
| | | | | |
| | | | $ | 1,150,018 |
| | | | | |
| Business Services – 3.2% | | | |
| Amdocs Ltd. (a) | | 17,800 | | $ | 325,562 |
| MasterCard, Inc., “A” | | 7,990 | | | 1,142,011 |
| Visa, Inc. | | 39,920 | | | 2,093,804 |
| Western Union Co. | | 72,060 | | | 1,033,340 |
| | | | | |
| | | | $ | 4,594,717 |
| | | | | |
| Chemicals – 0.7% | | | |
| Ecolab, Inc. | | 14,880 | | $ | 523,032 |
| Monsanto Co. | | 6,460 | | | 454,461 |
| | | | | |
| | | | $ | 977,493 |
| | | | | |
| Computer Software – 5.1% | | | |
| Akamai Technologies, Inc. (a) | | 35,520 | | $ | 535,997 |
| McAfee, Inc. (a) | | 36,140 | | | 1,249,360 |
| Oracle Corp. (a) | | 137,660 | | | 2,440,712 |
| VeriSign, Inc. (a) | | 165,208 | | | 3,152,169 |
| | | | | |
| | | | $ | 7,378,238 |
| | | | | |
| Computer Software – Systems – 4.3% | | | |
| Apple, Inc. (a) | | 36,140 | | $ | 3,084,549 |
| Hewlett-Packard Co. | | 85,290 | | | 3,095,174 |
| | | | | |
| | | | $ | 6,179,723 |
| | | | | |
| Construction – 0.4% | | | |
| Sherwin-Williams Co. | | 10,110 | | $ | 604,073 |
| | | | | |
| Consumer Goods & Services – 5.9% | | | |
| Apollo Group, Inc., “A” (a) | | 13,300 | | $ | 1,019,046 |
| Capella Education Co. (a) | | 11,960 | | | 702,770 |
| Colgate-Palmolive Co. | | 28,760 | | | 1,971,210 |
| DeVry, Inc. | | 18,030 | | | 1,035,102 |
| New Oriental Education & Technology Group, Inc., ADR (a) | | 23,590 | | | 1,295,327 |
| | | | | |
| Issuer | | Shares/Par | | Value ($) |
| | | | | |
| COMMON STOCKS – continued | | | |
| Consumer Goods & Services – continued | | | |
| Priceline.com, Inc. (a) | | 10,350 | | $ | 762,278 |
| Strayer Education, Inc. | | 7,970 | | | 1,708,848 |
| | | | | |
| | | | $ | 8,494,581 |
| | | | | |
| Electrical Equipment – 2.6% | | | |
| Danaher Corp. | | 67,700 | | $ | 3,832,497 |
| | | | | |
| Electronics – 5.2% | | | |
| ARM Holdings PLC | | 212,430 | | $ | 265,824 |
| Broadcom Corp., “A” (a) | | 15,640 | | | 265,411 |
| Flextronics International Ltd. (a) | | 67,310 | | | 172,314 |
| Hittite Microwave Corp. (a) | | 23,110 | | | 680,821 |
| Intel Corp. | | 109,880 | | | 1,610,841 |
| Intersil Corp., “A” | | 57,290 | | | 526,495 |
| Linear Technology Corp. | | 45,480 | | | 1,006,018 |
| Marvell Technology Group Ltd. (a) | | 130,000 | | | 867,100 |
| National Semiconductor Corp. | | 73,750 | | | 742,663 |
| Nintendo Co. Ltd. | | 900 | | | 345,775 |
| Samsung Electronics Co. Ltd. | | 1,053 | | | 382,363 |
| SanDisk Corp. (a) | | 23,480 | | | 225,408 |
| Silicon Laboratories, Inc. (a) | | 18,060 | | | 447,527 |
| | | | | |
| | | | $ | 7,538,560 |
| | | | | |
| Energy – Independent – 4.1% | | | |
| Apache Corp. | | 10,220 | | $ | 761,697 |
| Devon Energy Corp. | | 4,280 | | | 281,239 |
| EOG Resources, Inc. | | 15,480 | | | 1,030,658 |
| Noble Energy, Inc. | | 7,070 | | | 347,985 |
| Occidental Petroleum Corp. | | 19,000 | | | 1,139,810 |
| Plains Exploration & Production Co. (a) | | 23,130 | | | 537,541 |
| Ultra Petroleum Corp. (a) | | 23,630 | | | 815,471 |
| XTO Energy, Inc. | | 29,005 | | | 1,023,006 |
| | | | | |
| | | | $ | 5,937,407 |
| | | | | |
| Energy – Integrated – 3.3% | | | |
| Chevron Corp. | | 28,180 | | $ | 2,084,475 |
| Exxon Mobil Corp. | | 26,550 | | | 2,119,487 |
| Petroleo Brasileiro S.A., ADR | | 25,400 | | | 622,046 |
| | | | | |
| | | | $ | 4,826,008 |
| | | | | |
| Engineering – Construction – 0.7% | | | |
| Fluor Corp. | | 22,860 | | $ | 1,025,728 |
| | | | | |
| Entertainment – 2.5% | | | |
| DreamWorks Animation, Inc., “A” (a) | | 88,920 | | $ | 2,246,119 |
| TiVo, Inc. (a) | | 192,430 | | | 1,377,799 |
| | | | | |
| | | | $ | 3,623,918 |
| | | | | |
| Food & Beverages – 6.0% | | | |
| Coca-Cola Co. | | 53,390 | | $ | 2,416,965 |
| Groupe Danone | | 15,129 | | | 913,110 |
| Nestle S.A. | | 50,472 | | | 1,989,231 |
| Pepsi Bottling Group, Inc. | | 16,080 | | | 361,961 |
| PepsiCo, Inc. | | 54,320 | | | 2,975,106 |
| | | | | |
| | | | $ | 8,656,373 |
| | | | | |
7
Portfolio of Investments – continued
| | | | | |
| Issuer | | Shares/Par | | Value ($) |
| | | | | |
| COMMON STOCKS – continued | | | |
| Food & Drug Stores – 1.9% | | | |
| CVS Caremark Corp. | | 94,650 | | $ | 2,720,241 |
| | | | | |
| Gaming & Lodging – 0.6% | | | |
| International Game Technology | | 52,110 | | $ | 619,588 |
| Penn National Gaming, Inc. (a) | | 11,340 | | | 242,449 |
| | | | | |
| | | | $ | 862,037 |
| | | | | |
| General Merchandise – 3.0% | | | |
| Family Dollar Stores, Inc. | | 19,860 | | $ | 517,750 |
| Kohl’s Corp. (a) | | 32,910 | | | 1,191,342 |
| Target Corp. | | 11,000 | | | 379,830 |
| Wal-Mart Stores, Inc. | | 40,230 | | | 2,255,294 |
| | | | | |
| | | | $ | 4,344,216 |
| | | | | |
| Insurance – 1.3% | | | |
| ACE Ltd. | | 22,490 | | $ | 1,190,171 |
| Berkshire Hathaway, Inc., “B” (a) | | 100 | | | 321,400 |
| Chubb Corp. | | 8,490 | | | 432,990 |
| | | | | |
| | | | $ | 1,944,561 |
| | | | | |
| Internet – 2.3% | | | |
| Google, Inc., “A” (a) | | 10,090 | | $ | 3,104,189 |
| Tencent Holdings Ltd. | | 33,800 | | | 220,046 |
| | | | | |
| | | | $ | 3,324,235 |
| | | | | |
| Leisure & Toys – 0.9% | | | |
| Electronic Arts, Inc. (a) | | 55,380 | | $ | 888,295 |
| THQ, Inc. (a) | | 113,670 | | | 476,277 |
| | | | | |
| | | | $ | 1,364,572 |
| | | | | |
| Major Banks – 2.6% | | | |
| Bank of America Corp. | | 20,900 | | $ | 294,272 |
| Bank of New York Mellon Corp. | | 25,840 | | | 732,047 |
| JPMorgan Chase & Co. | | 30,760 | | | 969,863 |
| State Street Corp. | | 17,070 | | | 671,363 |
| Wells Fargo & Co. | | 35,980 | | | 1,060,690 |
| | | | | |
| | | | $ | 3,728,235 |
| | | | | |
| Medical & Health Technology & Services – 3.3% | | | |
| Express Scripts, Inc. (a) | | 7,200 | | $ | 395,856 |
| IDEXX Laboratories, Inc. (a) | | 50,120 | | | 1,808,330 |
| Medco Health Solutions, Inc. (a) | | 50,200 | | | 2,103,882 |
| VCA Antech, Inc. (a) | | 25,850 | | | 513,898 |
| | | | | |
| | | | $ | 4,821,966 |
| | | | | |
| Medical Equipment – 6.1% | | | |
| Baxter International, Inc. | | 45,320 | | $ | 2,428,699 |
| Becton, Dickinson & Co. | | 13,490 | | | 922,581 |
| C.R. Bard, Inc. | | 25,200 | | | 2,123,352 |
| Conceptus, Inc. (a)(l) | | 97,270 | | | 1,480,449 |
| DENTSPLY International, Inc. | | 13,200 | | | 372,768 |
| St. Jude Medical, Inc. (a) | | 18,000 | | | 593,280 |
| Stryker Corp. | | 24,590 | | | 982,371 |
| | | | | |
| | | | $ | 8,903,500 |
| | | | | |
| Network & Telecom – 1.8% | | | |
| Cisco Systems, Inc. (a) | | 111,090 | | $ | 1,810,767 |
| Research in Motion Ltd. (a) | | 18,541 | | | 752,394 |
| | | | | |
| | | | $ | 2,563,161 |
| | | | | |
| | | | | |
| Issuer | | Shares/Par | | Value ($) |
| | | | | |
| COMMON STOCKS – continued | | | |
| Oil Services – 1.0% | | | |
| Noble Corp. | | 39,428 | | $ | 870,965 |
| Transocean, Inc. (a) | | 10,710 | | | 506,048 |
| | | | | |
| | | | $ | 1,377,013 |
| | | | | |
| Pharmaceuticals – 2.7% | | | |
| Abbott Laboratories | | 49,520 | | $ | 2,642,882 |
| Wyeth | | 33,280 | | | 1,248,333 |
| | | | | |
| | | | $ | 3,891,215 |
| | | | | |
| Precious Metals & Minerals – 0.3% | | | |
| Goldcorp, Inc. | | 13,840 | | $ | 436,375 |
| | | | | |
| Railroad & Shipping – 0.7% | | | |
| Norfolk Southern Corp. | | 14,690 | | $ | 691,165 |
| Union Pacific Corp. | | 7,570 | | | 361,846 |
| | | | | |
| | | | $ | 1,053,011 |
| | | | | |
| Special Products & Services – 0.1% | | | |
| Heckmann Corp. (a)(l) | | 29,130 | | $ | 164,585 |
| | | | | |
| Specialty Chemicals – 0.8% | | | |
| Praxair, Inc. | | 20,050 | | $ | 1,190,168 |
| | | | | |
| Specialty Stores – 3.2% | | | |
| Abercrombie & Fitch Co., “A” | | 13,080 | | $ | 301,756 |
| Amazon.com, Inc. (a) | | 14,480 | | | 742,534 |
| Lowe’s Cos., Inc. | | 63,000 | | | 1,355,760 |
| Nordstrom, Inc. | | 34,360 | | | 457,332 |
| O’Reilly Automotive, Inc. (a) | | 31,800 | | | 977,532 |
| PetSmart, Inc. | | 20,430 | | | 376,934 |
| Staples, Inc. | | 19,600 | | | 351,232 |
| | | | | |
| | | | $ | 4,563,080 |
| | | | | |
| Telecommunications – Wireless – 1.8% | | | |
| America Movil S.A.B. de C.V., “L”, ADR | | 29,120 | | $ | 902,429 |
| Rogers Communications, Inc., “B” | | 58,980 | | | 1,748,139 |
| | | | | |
| | | | $ | 2,650,568 |
| | | | | |
| Telephone Services – 1.7% | | | |
| American Tower Corp., “A” (a) | | 30,375 | | $ | 890,595 |
| AT&T, Inc. | | 57,640 | | | 1,642,740 |
| | | | | |
| | | | $ | 2,533,335 |
| | | | | |
| Tobacco – 1.9% | | | |
| Philip Morris International, Inc. | | 62,700 | | $ | 2,728,077 |
| | | | | |
| Trucking – 2.0% | | | |
| J.B. Hunt Transport Services, Inc. | | 44,210 | | $ | 1,161,397 |
| Landstar System, Inc. | | 32,770 | | | 1,259,351 |
| United Parcel Service, Inc., “B” | | 9,010 | | | 496,992 |
| | | | | |
| | | | $ | 2,917,740 |
| | | | | |
| Utilities – Electric Power – 0.5% | | | |
| Allegheny Energy, Inc. | | 21,510 | | $ | 728,329 |
| | | | | |
Total Common Stocks
(Identified Cost, $173,577,820) | | | | $ | 139,680,050 |
| | | | | |
8
Portfolio of Investments – continued
| | | | | | | |
| Issuer | | Shares/Par | | Value ($) | |
| | | | | | | |
| |
| REPURCHASE AGREEMENTS – 4.3% | | | | |
| Goldman Sachs, 0.01%, dated 12/31/08, due 1/02/09, total to be received $6,243,003 (secured by U.S. Treasury and Federal Agency obligations and Mortgage Backed securities in a jointly traded account), at Cost | | $ | 6,243,000 | | $ | 6,243,000 | |
| | | | | | | |
|
| COLLATERAL FOR SECURITIES LOANED – 0.1% | |
| Navigator Securities Lending Prime Portfolio, at Cost and Net Asset Value | | | 229,161 | | $ | 229,161 | |
| | | | | | | |
Total Investments
(Identified Cost, $180,049,981) | | | | | $ | 146,152,211 | |
| | | | | | | |
OTHER ASSETS, LESS
LIABILITIES – (0.8)% | | | | | | (1,204,616 | ) |
| | | | | | | |
| Net Assets – 100.0% | | | | | $ | 144,947,595 | |
| | | | | | | |
| (a) | Non-income producing security. |
| (l) | All or a portion of this security is on loan. |
The following abbreviations are used in this report and are defined:
| ADR | | American Depository Receipt |
See Notes to Financial Statements
9
FINANCIAL STATEMENTS | STATEMENT OF ASSETS AND LIABILITIES
This statement represents your fund’s balance sheet, which details the assets and liabilities comprising the total value of the fund.
| | | | | |
At 12/31/08 | | | | | |
Assets | | | | | |
Investments, at value, including $225,074 of securities on loan (identified cost, $180,049,981) | | $146,152,211 | | | |
Cash | | 643 | | | |
Receivable for fund shares sold | | 22,363 | | | |
Interest and dividends receivable | | 208,266 | | | |
Other assets | | 8,352 | | | |
Total assets | | | | | $146,391,835 |
Liabilities | | | | | |
Payable for investments purchased | | $1,012,246 | | | |
Payable for fund shares reacquired | | 98,989 | | | |
Collateral for securities loaned, at value | | 229,161 | | | |
Payable to affiliates | | | | | |
Management fee | | 5,818 | | | |
Distribution fees | | 177 | | | |
Administrative services fee | | 402 | | | |
Payable for trustees’ compensation | | 253 | | | |
Accrued expenses and other liabilities | | 97,194 | | | |
Total liabilities | | | | | $1,444,240 |
Net assets | | | | | $144,947,595 |
Net assets consist of | | | | | |
Paid-in capital | | $540,917,114 | | | |
Unrealized appreciation (depreciation) on investments and translation of assets and liabilities in foreign currencies | | (33,898,723 | ) | | |
Accumulated net realized gain (loss) on investments and foreign currency transactions | | (362,451,979 | ) | | |
Undistributed net investment income | | 381,183 | | | |
Net assets | | | | | $144,947,595 |
Shares of beneficial interest outstanding | | | | | 10,378,386 |
Initial Class shares | | | | | |
Net assets | | $131,691,812 | | | |
Shares outstanding | | 9,414,594 | | | |
Net asset value per share | | | | | $13.99 |
Service Class shares | | | | | |
Net assets | | $13,255,783 | | | |
Shares outstanding | | 963,792 | | | |
Net asset value per share | | | | | $13.75 |
See Notes to Financial Statements
10
FINANCIAL STATEMENTS | STATEMENT OF OPERATIONS
This statement describes how much your fund earned in investment income and accrued in expenses. It also describes any gains and/or losses generated by fund operations.
| | | | | | |
| Year ended 12/31/08 | | | | | | |
| Net investment income | | | | | | |
Income | | | | | | |
Dividends | | $2,133,700 | | | | |
Income on securities loaned | | 166,557 | | | | |
Interest | | 148,357 | | | | |
Foreign taxes withheld | | (64,246 | ) | | | |
Total investment income | | | | | $2,384,368 | |
Expenses | | | | | | |
Management fee | | $1,643,971 | | | | |
Distribution fees | | 46,844 | | | | |
Administrative services fee | | 66,514 | | | | |
Trustees’ compensation | | 30,298 | | | | |
Custodian fee | | 75,017 | | | | |
Shareholder communications | | 37,635 | | | | |
Auditing fees | | 46,468 | | | | |
Legal fees | | 7,128 | | | | |
Miscellaneous | | 19,273 | | | | |
Total expenses | | | | | $1,973,148 | |
Fees paid indirectly | | (1,238 | ) | | | |
Net expenses | | | | | $1,971,910 | |
Net investment income | | | | | $412,458 | |
Realized and unrealized gain (loss) on investments and foreign currency transactions | | | | | | |
Realized gain (loss) (identified cost basis) | | | | | | |
Investment transactions | | $(18,355,968 | ) | | | |
Foreign currency transactions | | (30,280 | ) | | | |
Net realized gain (loss) on investments and foreign currency transactions | | | | | $(18,386,248 | ) |
Change in unrealized appreciation (depreciation) | | | | | | |
Investments | | $(75,442,326 | ) | | | |
Translation of assets and liabilities in foreign currencies | | (6,015 | ) | | | |
Net unrealized gain (loss) on investments and foreign currency translation | | | | | $(75,448,341 | ) |
Net realized and unrealized gain (loss) on investments and foreign currency | | | | | $(93,834,589 | ) |
Change in net assets from operations | | | | | $(93,422,131 | ) |
See Notes to Financial Statements
11
FINANCIAL STATEMENTS | STATEMENTS OF CHANGES IN NET ASSETS
These statements describe the increases and/or decreases in net assets resulting from operations, any distributions, and any shareholder transactions.
| | | | | | |
For years ended 12/31 | | 2008 | | | 2007 | |
Change in net assets | | | | | | |
From operations | | | | | | |
Net investment income | | $412,458 | | | $511,575 | |
Net realized gain (loss) on investments and foreign currency transactions | | (18,386,248 | ) | | 50,100,124 | |
Net unrealized gain (loss) on investments and foreign currency translation | | (75,448,341 | ) | | 8,143,212 | |
Change in net assets from operations | | $(93,422,131 | ) | | $58,754,911 | |
Distributions declared to shareholders | | | | | | |
From net investment income | | | | | | |
Initial Class | | $(498,653 | ) | | $— | |
Change in net assets from fund share transactions | | $(48,993,679 | ) | | $(84,395,640 | ) |
Total change in net assets | | $(142,914,463 | ) | | $(25,640,729 | ) |
Net assets | | | | | | |
At beginning of period | | 287,862,058 | | | 313,502,787 | |
At end of period (including undistributed net investment income of $381,183 and
$497,658, respectively) | | $144,947,595 | | | $287,862,058 | |
See Notes to Financial Statements
12
FINANCIAL STATEMENTS | FINANCIAL HIGHLIGHTS
The financial highlights table is intended to help you understand the fund’s financial performance for the past 5 years. Certain information reflects financial results for a single fund share. The total returns in the table represent the rate by which an investor would have earned (or lost) on an investment in the fund share class (assuming reinvestment of all distributions) held for the entire period.
| | | | | | | | | | | | | | | |
| Initial Class | | Years ended 12/31 | |
| | | 2008 | | | 2007 | | | 2006 | | | 2005 | | | 2004 | |
Net asset value, beginning of period | | $22.37 | | | $18.45 | | | $17.08 | | | $15.65 | | | $13.82 | |
| Income (loss) from investment operations | | | | | | | | | | | | | | | |
Net investment income (loss) (d) | | $0.04 | | | $0.04 | | | $(0.02 | ) | | $(0.04 | ) | | $(0.02 | ) |
Net realized and unrealized gain (loss) on investments
and foreign currency | | (8.37 | ) | | 3.88 | | | 1.39 | | | 1.47 | | | 1.85 | |
Total from investment operations | | $(8.33 | ) | | $3.92 | | | $1.37 | | | $1.43 | | | $1.83 | |
| Less distributions declared to shareholders | | | | | | | | | | | | | | | |
From net investment income | | $(0.05 | ) | | $— | | | $— | | | $— | | | $— | |
Net asset value, end of period | | $13.99 | | | $22.37 | | | $18.45 | | | $17.08 | | | $15.65 | |
Total return (%) (k)(s) | | (37.33 | ) | | 21.25 | | | 8.02 | | | 9.14 | | | 13.24 | (b) |
Ratios (%) (to average net assets)
and Supplemental data: | | | | | | | | | | | | | | | |
Expenses (f) | | 0.88 | | | 0.84 | | | 0.83 | | | 0.84 | | | 0.80 | |
Net investment income (loss) | | 0.21 | | | 0.19 | | | (0.14 | ) | | (0.26 | ) | | (0.13 | ) |
Portfolio turnover | | 120 | | | 76 | | | 123 | | | 88 | | | 94 | |
Net assets at end of period (000 Omitted) | | $131,692 | | | $264,089 | | | $291,965 | | | $350,083 | | | $414,811 | |
| |
| Service Class | | Years ended 12/31 | |
| | | 2008 | | | 2007 | | | 2006 | | | 2005 | | | 2004 | |
Net asset value, beginning of period | | $22.01 | | | $18.19 | | | $16.89 | | | $15.51 | | | $13.73 | |
| Income (loss) from investment operations | | | | | | | | | | | | | | | |
Net investment loss (d) | | $(0.01 | ) | | $(0.01 | ) | | $(0.07 | ) | | $(0.08 | ) | | $(0.05 | ) |
Net realized and unrealized gain (loss) on investments
and foreign currency | | (8.25 | ) | | 3.83 | | | 1.37 | | | 1.46 | | | 1.83 | |
Total from investment operations | | $(8.26 | ) | | $3.82 | | | $1.30 | | | $1.38 | | | $1.78 | |
Net asset value, end of period | | $13.75 | | | $22.01 | | | $18.19 | | | $16.89 | | | $15.51 | |
Total return (%) (k)(s) | | (37.53 | ) | | 21.00 | | | 7.70 | | | 8.90 | | | 12.96 | (b) |
Ratios (%) (to average net assets)
and Supplemental data: | | | | | | | | | | | | | | | |
Expenses (f) | | 1.13 | | | 1.09 | | | 1.08 | | | 1.09 | | | 1.06 | |
Net investment loss | | (0.04 | ) | | (0.06 | ) | | (0.38 | ) | | (0.51 | ) | | (0.36 | ) |
Portfolio turnover | | 120 | | | 76 | | | 123 | | | 88 | | | 94 | |
Net assets at end of period (000 Omitted) | | $13,256 | | | $23,773 | | | $21,538 | | | $21,597 | | | $22,139 | |
| (b) | The fund’s net asset value and total return calculation include a non-recurring accrual recorded as a result of an administrative proceeding regarding disclosure of brokerage allocation practices in connection with fund sales. The non-recurring accrual resulted in an increase in the net asset value of $0.01 per share based on shares outstanding on the day the accrual was recorded. |
| (d) | Per share data is based on average shares outstanding. |
| (f) | Ratios do not reflect reductions from fees paid indirectly, if applicable. |
| (k) | The total return does not reflect expenses that apply to separate accounts. Inclusion of these charges would reduce the total return figures for all periods shown. |
| (s) | From time to time the fund may receive proceeds from litigation settlements, without which performance would be lower. |
See Notes to Financial Statements
13
NOTES TO FINANCIAL STATEMENTS
| (1) | | Business and Organization |
MFS Growth Portfolio (formerly MFS Emerging Growth Portfolio) (the fund) is a series of MFS Variable Insurance Trust II (the trust). The trust is organized as a Massachusetts business trust and is registered under the Investment Company Act of 1940, as amended, as an open-end management investment company. The shares of the fund are sold to variable accounts established by insurance companies to fund benefits under variable contracts issued by such companies, and qualified retirement and pension plans.
| (2) | | Significant Accounting Policies |
General – The preparation of financial statements in conformity with U.S. generally accepted accounting principles requires management to make estimates and assumptions that affect the reported amounts of assets and liabilities, and disclosure of contingent assets and liabilities at the date of the financial statements and the reported amounts of revenues and expenses during the reporting period. Actual results could differ from those estimates. The fund can invest in foreign securities, including securities of emerging market issuers. Investments in foreign securities are vulnerable to the effects of changes in the relative values of the local currency and the U.S. dollar and to the effects of changes in each country’s legal, political, and economic environment. The markets of emerging markets countries are generally more volatile than the markets of developed countries with more mature economies. All of the risks of investing in foreign securities previously described are heightened when investing in emerging markets countries.
Investment Valuations – Equity securities, including restricted equity securities, are generally valued at the last sale or official closing price as reported by a third party pricing service on the market or exchange on which they are primarily traded. For securities for which there were no sales reported that day, equity securities are generally valued at the last quoted daily bid quotation as reported by a third party pricing service on the market or exchange on which they are primarily traded. For securities held short for which there were no sales reported for the day, the position is generally valued at the last quoted daily ask quotation as reported by a third party pricing service on the market or exchange on which such securities are primarily traded. Short-term instruments with a maturity at issuance of 60 days or less may be valued at amortized cost, which approximates market value. Exchange-traded options are generally valued at the last sale or official closing price as reported by a third party pricing service on the exchange on which such options are primarily traded. Exchange-traded options for which there were no sales reported that day are generally valued at the last daily bid quotation as reported by a third party pricing service on the exchange on which such options are primarily traded. Options not traded on an exchange are generally valued at a broker-dealer bid quotation. Foreign currency options are generally valued using an external pricing model that uses market data from a third party source. Open-end investment companies are generally valued at net asset value per share. Securities and other assets generally valued on the basis of information from a third party pricing service may also be valued at a broker-dealer bid quotation. Values obtained from pricing services can utilize both dealer-supplied valuations and electronic data processing techniques, which take into account factors such as institutional-size trading in similar groups of securities, yield, quality, coupon rate, maturity, type of issue, trading characteristics, and other market data. The values of foreign securities and other assets and liabilities expressed in foreign currencies are converted to U.S. dollars using the mean of bid and asked prices for rates reported by a third party pricing service.
The Board of Trustees has delegated primary responsibility for determining or causing to be determined the value of the fund’s investments (including any fair valuation) to the adviser pursuant to valuation policies and procedures approved by the Board. If the adviser determines that reliable market quotations are not readily available, investments are valued at fair value as determined in good faith by the adviser in accordance with such procedures under the oversight of the Board of Trustees. Under the fund’s valuation policies and procedures, market quotations are not considered to be readily available for most types of debt instruments and floating rate loans and many types of derivatives. These investments are generally valued at fair value based on information from third party pricing services. In addition, investments may be valued at fair value if the adviser determines that an investment’s value has been materially affected by events occurring after the close of the exchange or market on which the investment is principally traded (such as foreign exchange or market) and prior to the determination of the fund’s net asset value, or after the halting of trading of a specific security where trading does not resume prior to the close of the exchange or market on which the security is principally traded. Events that occur on a frequent basis after foreign markets close (such as developments in foreign markets and significant movements in the U.S. markets) and prior to the determination of the fund’s net asset value may be deemed to have a material affect on the value of securities traded in foreign markets. Accordingly, the fund’s foreign equity securities may often be valued at fair value. The adviser may rely on third party pricing services or other information (such as the correlation with price movements of similar securities in the same or other markets; the type, cost and investment characteristics of the security; the business and financial condition of the issuer; and trading and other market data) to assist in determining whether to fair value and at what value to fair value an investment. The value of an investment for purposes of calculating the fund’s net asset value can differ depending on the source and method used to determine value. When fair valuation is used, the value of investments used to determine the fund’s net asset value may differ from quoted or published prices for the same investments.
14
Notes to Financial Statements – continued
The fund adopted FASB Statement No. 157, Fair Value Measurements (the “Statement”). This Statement provides a single definition of fair value, a hierarchy for measuring fair value and expanded disclosures about fair value measurements.
Various inputs are used in determining the value of the fund’s assets or liabilities carried at market value. These inputs are categorized into three broad levels. Level 1 includes quoted prices in active markets for identical assets or liabilities. Level 2 includes other significant observable market-based inputs (including quoted prices for similar securities, interest rates, prepayment speed, and credit risk). Level 3 includes unobservable inputs, which may include the adviser’s own assumptions in determining the fair value of investments. Other financial instruments are derivative instruments not reflected in total investments, such as futures, forwards, swap contracts and written options. The following is a summary of the levels used as of December 31, 2008 in valuing the fund’s assets or liabilities carried at market value:
| | | | | | | | |
| | | Level 1 | | Level 2 | | Level 3 | | Total |
| Investments in Securities | | $135,434,526 | | $10,717,685 | | $— | | $146,152,211 |
| Other Financial Instruments | | $— | | $— | | $— | | $— |
Repurchase Agreements – The fund may enter into repurchase agreements with approved counterparties. Each repurchase agreement is recorded at cost. The fund requires that the securities collateral in a repurchase transaction be transferred to a custodian. The fund monitors, on a daily basis, the value of the collateral to ensure that its value, including accrued interest, is greater than amounts owed to the fund under each such repurchase agreement. The fund and other funds managed by Massachusetts Financial Services Company (MFS), may utilize a joint trading account for the purpose of entering into one or more repurchase agreements.
Foreign Currency Translation – Purchases and sales of foreign investments, income, and expenses are converted into U.S. dollars based upon currency exchange rates prevailing on the respective dates of such transactions or on the reporting date for foreign denominated receivables and payables. Gains and losses attributable to foreign currency exchange rates on sales of securities are recorded for financial statement purposes as net realized gains and losses on investments. Gains and losses attributable to foreign exchange rate movements on receivables, payables, income and expenses are recorded for financial statement purposes as foreign currency transaction gains and losses. That portion of both realized and unrealized gains and losses on investments that results from fluctuations in foreign currency exchange rates is not separately disclosed.
Derivative Risk – The fund may invest in derivatives for hedging or non-hedging purposes. While hedging can reduce or eliminate losses, it can also reduce or eliminate gains. When the fund uses derivatives as an investment to gain market exposure, or for hedging purposes, gains and losses from derivative instruments may be substantially greater than the derivative’s original cost. Cash that has been segregated on behalf of certain derivative contracts will be reported separately on the Statement of Assets and Liabilities as restricted cash. On some over-the-counter derivatives, the fund attempts to reduce its exposure to counterparty credit risk by entering into an ISDA Master Agreement on a bilateral basis with each of the counterparties with whom it undertakes a significant volume of transactions. The ISDA Master Agreement gives the fund the right, upon an event of default by the applicable counterparty, to close out all transactions traded under such agreement and to net amounts owed under each transaction to one net amount payable by one party to the other. This right to close out and net payments across all transactions traded under the ISDA Master Agreement could result in a reduction of the fund’s credit risk to such counterparty equal to any amounts payable by the fund under the applicable transactions, if any. However, absent an event of default by the counterparty, the ISDA Master Agreement does not result in an offset of reported balance sheet assets and liabilities across transactions between the fund and the applicable counterparty. Derivative instruments include purchased options.
In March 2008, FASB Statement No. 161, Disclosures about Derivative Instruments and Hedging Activities (the “Standard”) was issued, and is effective for financial statements issued for fiscal years and interim periods beginning after November 15, 2008. This Standard provides enhanced disclosures about the fund’s use of and accounting for derivative instruments and the effect of derivative instruments on the fund’s results of operations and financial position. Management is evaluating the application of the Standard to the fund, and has not at this time determined the impact, if any, resulting from the adoption of this Standard on the fund’s financial statements.
FASB Staff Position (FSP) 133-1 was implemented during the period. FSP 133-1 amends FAS 133 to require sellers of credit derivatives to make disclosures that will enable financial statement users to assess the potential effects of those credit derivatives on an entity’s financial position, financial performance and cash flows. There was no impact from implementing FSP 133-1 as the fund did not hold any of these credit derivatives at period end.
Purchased Options – The fund may purchase call or put options for a premium. Purchasing call options may be a hedge against an anticipated increase in the dollar cost of securities to be acquired or to increase the fund’s exposure to the underlying instrument. Purchasing put options may hedge against a decline in the value of portfolio securities. The premium paid is included as an investment in the Statement of Assets and Liabilities and is subsequently adjusted to the current value of the option. Premiums paid for purchased options which have expired are treated as realized losses on investments in the
15
Notes to Financial Statements – continued
Statement of Operations. Premiums paid for purchased options which are exercised or closed are added to the amount paid or offset against the proceeds on the underlying security or financial instrument to determine the realized gain or loss. The risk of loss associated with purchased options is limited to the premium paid.
Security Loans – State Street Bank and Trust Company (“State Street”), as lending agent, may loan the securities of the fund to certain qualified institutions (the “Borrowers”) approved by the fund. The loans are collateralized by cash and/or U.S. Treasury and federal agency obligations in an amount typically at least equal to the market value of the securities loaned. State Street provides the fund with indemnification against Borrower default. The fund bears the risk of loss with respect to the investment of cash collateral. On loans collateralized by cash, the cash collateral is invested in a money market fund or short-term securities. A portion of the income generated upon investment of the collateral is remitted to the Borrowers, and the remainder is allocated between the fund and the lending agent. On loans collateralized by U.S. Treasury and/or federal agency obligations, a fee is received from the Borrower, and is allocated between the fund and the lending agent. Income from securities lending is separately reported on the Statement of Operations. The dividend and interest income earned on the securities loaned is accounted for in the same manner as other dividend and interest income.
Indemnifications – Under the fund’s organizational documents, its officers and trustees may be indemnified against certain liabilities and expenses arising out of the performance of their duties to the fund. Additionally, in the normal course of business, the fund enters into agreements with service providers that may contain indemnification clauses. The fund’s maximum exposure under these agreements is unknown as this would involve future claims that may be made against the fund that have not yet occurred.
Investment Transactions and Income – Investment transactions are recorded on the trade date. Interest income is recorded on the accrual basis. All premium and discount is amortized or accreted for financial statement purposes in accordance with U.S. generally accepted accounting principles. Dividends received in cash are recorded on the ex-dividend date. Certain dividends from foreign securities will be recorded when the fund is informed of the dividend if such information is obtained subsequent to the ex-dividend date. Dividend and interest payments received in additional securities are recorded on the ex-dividend or ex-interest date in an amount equal to the value of the security on such date.
The fund may receive proceeds from litigation settlements. Any proceeds received from litigation involving portfolio holdings are reflected in the Statement of Operations in realized gain/loss if the security has been disposed of by the fund or in unrealized gain/loss if the security is still held by the fund. Any other proceeds from litigation not related to portfolio holdings are reflected as other income in the Statement of Operations.
Fees Paid Indirectly – The fund’s custody fee may be reduced according to an arrangement that measures the value of cash deposited with the custodian by the fund. This amount, for the year ended December 31, 2008, is shown as a reduction of total expenses on the Statement of Operations.
Tax Matters and Distributions – The fund intends to qualify as a regulated investment company, as defined under Subchapter M of the Internal Revenue Code, and to distribute all of its taxable income, including realized capital gains. As a result, no provision for federal income tax is required. Each of the fund’s federal tax returns for the prior three fiscal years remains subject to examination by the Internal Revenue Service. Foreign taxes, if any, have been accrued by the fund in the accompanying financial statements.
Distributions to shareholders are recorded on the ex-dividend date. Income and capital gain distributions are determined in accordance with income tax regulations, which may differ from U.S. generally accepted accounting principles. Certain capital accounts in the financial statements are periodically adjusted for permanent differences in order to reflect their tax character. These adjustments have no impact on net assets or net asset value per share. Temporary differences which arise from recognizing certain items of income, expense, gain or loss in different periods for financial statement and tax purposes will reverse at some time in the future. Distributions in excess of net investment income or net realized gains are temporary overdistributions for financial statement purposes resulting from differences in the recognition or classification of income or distributions for financial statement and tax purposes.
Book/tax differences primarily relate to wash sale loss deferrals.
The tax character of distributions declared to shareholders for the last fiscal year is as follows:
| | |
| | | 12/31/08 |
| Ordinary income (including any short-term capital gains) | | $498,653 |
16
Notes to Financial Statements – continued
The federal tax cost and the tax basis components of distributable earnings were as follows:
| | | |
| As of 12/31/08 | | | |
| Cost of investments | | $182,094,819 | |
| Gross appreciation | | 3,782,011 | |
| Gross depreciation | | (39,724,619 | ) |
| Net unrealized appreciation (depreciation) | | $(35,942,608 | ) |
| Undistributed ordinary income | | 381,183 | |
| Capital loss carryforwards | | (360,134,345 | ) |
| Other temporary differences | | (273,749 | ) |
As of December 31, 2008, the fund had capital loss carryforwards available to offset future realized gains. Such losses expire as follows:
| | | |
| 12/31/09 | | $(114,567,621 | ) |
| 12/31/10 | | (229,227,867 | ) |
| 12/31/16 | | (16,338,857 | ) |
| | $(360,134,345 | ) |
Multiple Classes of Shares of Beneficial Interest – The fund offers multiple classes of shares, which differ in their respective distribution fees. The fund’s income, realized and unrealized gain (loss), and common expenses are allocated to shareholders based on the daily net assets of each class. Dividends are declared separately for each class. Differences in per share dividend rates are generally due to differences in separate class expenses.
| (3) | | Transactions with Affiliates |
Investment Adviser – The fund has an investment advisory agreement with MFS to provide overall investment management and related administrative services and facilities to the fund.
The management fee is computed daily and paid monthly at the following annual rates:
| | |
| First $300 million of average daily net assets | | 0.75% |
| Average daily net assets in excess of $300 million | | 0.675% |
The management fee incurred for the year ended December 31, 2008 was equivalent to an annual effective rate of 0.75% of the fund’s average daily net assets.
Distributor – MFS Fund Distributors, Inc. (MFD), a wholly-owned subsidiary of MFS, is the distributor of shares of the fund. The Trustees have adopted a distribution plan for the Service Class shares pursuant to Rule 12b-1 under the Investment Company Act of 1940.
The fund’s distribution plan provides that the fund will pay MFD distribution fees equal to 0.25% per annum of its average daily net assets attributable to Service Class shares as partial consideration for services performed and expenses incurred by MFD and financial intermediaries in connection with the sale and distribution of the fund’s Service Class shares and the sale and distribution of the variable annuity or variable life insurance contracts investing indirectly in Service Class shares. MFD may subsequently pay all, or a portion, of the distribution fees to financial intermediaries.
Shareholder Servicing Agent – MFS Service Center, Inc. (MFSC), a wholly-owned subsidiary of MFS, has contracted to provide transfer agent and recordkeeping functions in connection with the issuance, transfer, and redemption of each class of shares of the fund under a Shareholder Servicing Agent Agreement. During the year ended December 31, 2008, the fund did not pay MFSC a fee for this service.
Administrator – MFS provides certain financial, legal, shareholder communications, compliance, and other administrative services to the fund. Under an administrative services agreement, the fund partially reimburses MFS the costs incurred to provide these services. The fund is charged an annual fixed amount of $10,000 plus a fee based on average daily net assets.
The administrative services fee incurred for the year ended December 31, 2008 was equivalent to an annual effective rate of 0.0303% of the fund’s average daily net assets.
Trustees’ and Officers’ Compensation – The fund pays compensation to trustees in the form of a retainer, attendance fees, and additional compensation to the Board chairperson. The fund does not pay compensation directly to officers of the fund who are also officers of the investment adviser, all of whom receive remuneration for their services to the fund from MFS. Certain officers of the fund are officers or directors of MFS, MFD, and MFSC.
Other – This fund and certain other MFS funds (the funds) have entered into services agreements (the Agreements) which provide for payment of fees by the funds to Tarantino LLC and Griffin Compliance LLC in return for the provision of services
17
Notes to Financial Statements – continued
of an Independent Chief Compliance Officer (ICCO) and Assistant ICCO, respectively, for the funds. The ICCO and Assistant ICCO are officers of the funds and the sole members of Tarantino LLC and Griffin Compliance LLC, respectively. The funds can terminate the Agreements with Tarantino LLC and Griffin Compliance LLC at any time under the terms of the Agreements. MFS has agreed to bear all expenses associated with office space, other administrative support, and supplies provided to the ICCO and Assistant ICCO. For the year ended December 31, 2008, the aggregate fees paid by the fund to Tarantino LLC and Griffin Compliance LLC were $2,049 and are included in miscellaneous expense on the Statement of Operations.
Purchases and sales of investments, other than U.S. Government securities, purchased option transactions, and short-term obligations, aggregated $257,123,662 and $303,803,050, respectively.
| (5) | | Shares of Beneficial Interest |
The fund’s Declaration of Trust permits the Trustees to issue an unlimited number of full and fractional shares of beneficial interest. Transactions in fund shares were as follows:
| | | | | | | | | | | | |
| | | Year ended 12/31/08 | | | Year ended 12/31/07 | |
| | | Shares | | | Amount | | | Shares | | | Amount | |
| Shares sold | | | | | | | | | | | | |
Initial Class | | 231,630 | | | $3,957,438 | | | 161,845 | | | $3,489,291 | |
Service Class | | 157,569 | | | 2,631,563 | | | 135,591 | | | 2,781,765 | |
| | 389,199 | | | $6,589,001 | | | 297,436 | | | $6,271,056 | |
| Shares issued to shareholders in reinvestment of distributions | | | | | | | | | | | | |
Initial Class | | 22,143 | | | $498,653 | | | — | | | $— | |
| Shares reacquired | | | | | | | | | | | | |
Initial Class | | (2,644,192 | ) | | $(51,102,967 | ) | | (4,183,471 | ) | | $(85,816,341 | ) |
Service Class | | (274,074 | ) | | (4,978,366 | ) | | (239,255 | ) | | (4,850,355 | ) |
| | (2,918,266 | ) | | $(56,081,333 | ) | | (4,422,726 | ) | | $(90,666,696 | ) |
| Net change | | | | | | | | | | | | |
Initial Class | | (2,390,419 | ) | | $(46,646,876 | ) | | (4,021,626 | ) | | $(82,327,050 | ) |
Service Class | | (116,505 | ) | | (2,346,803 | ) | | (103,664 | ) | | (2,068,590 | ) |
| | (2,506,924 | ) | | $(48,993,679 | ) | | (4,125,290 | ) | | $(84,395,640 | ) |
The fund and other funds managed by MFS participate in a $1 billion unsecured committed line of credit provided by a syndication of banks under a credit agreement. In addition, the fund and other funds managed by MFS have established uncommitted borrowing arrangements with certain banks. Borrowings may be made for temporary financing needs. Interest is charged to each fund, based on its borrowings, generally at a rate equal to the Federal Reserve funds rate plus 0.30%. In addition, a commitment fee, based on the average daily, unused portion of the committed line of credit, is allocated among the participating funds at the end of each calendar quarter. For the year ended December 31, 2008, the fund’s commitment fee and interest expense were $1,107 and $0, respectively, and are included in miscellaneous expense on the Statement of Operations.
18
REPORT OF INDEPENDENT REGISTERED PUBLIC ACCOUNTING FIRM
To the Board of Trustees of MFS Variable Insurance Trust II and the Shareholders of
MFS Growth Portfolio (formerly MFS Emerging Growth Portfolio):
We have audited the accompanying statement of assets and liabilities, including the portfolio of investments, of MFS Growth Portfolio (the “Fund”) (one of the portfolios comprising MFS Variable Insurance Trust II) as of December 31, 2008, and the related statement of operations for the year then ended, the statements of changes in net assets for each of the two years in the period then ended, and the financial highlights for each of the five years in the period then ended. These financial statements and financial highlights are the responsibility of the Fund’s management. Our responsibility is to express an opinion on these financial statements and financial highlights based on our audits.
We conducted our audits in accordance with the standards of the Public Company Accounting Oversight Board (United States). Those standards require that we plan and perform the audit to obtain reasonable assurance about whether the financial statements and financial highlights are free of material misstatement. The Fund is not required to have, nor were we engaged to perform, an audit of its internal control over financial reporting. Our audits included consideration of internal control over financial reporting as a basis for designing audit procedures that are appropriate in the circumstances, but not for the purpose of expressing an opinion on the effectiveness of the Fund’s internal control over financial reporting. Accordingly, we express no such opinion. An audit also includes examining, on a test basis, evidence supporting the amounts and disclosures in the financial statements, assessing the accounting principles used and significant estimates made by management, as well as evaluating the overall financial statement presentation. Our procedures included confirmation of securities owned as of December 31, 2008, by correspondence with the custodian and brokers; where replies were not received from brokers, we performed other auditing procedures. We believe that our audits provide a reasonable basis for our opinion.
In our opinion, the financial statements and financial highlights referred to above present fairly, in all material respects, the financial position of MFS Growth Portfolio as of December 31, 2008, the results of its operations for the year then ended, the changes in its net assets for each of the two years in the period then ended, and the financial highlights for each of the five years in the period then ended, in conformity with accounting principles generally accepted in the United States of America.
DELOITTE & TOUCHE LLP
Boston, Massachusetts
February 19, 2009
19
TRUSTEES AND OFFICERS – IDENTIFICATION AND BACKGROUND
The Trustees and officers of the Trust, as of February 1, 2009, are listed below, together with their principal occupations during the past five years. (Their titles may have varied during that period.) The address of each Trustee and officer is 500 Boylston Street, Boston, Massachusetts 02116.
| | | | | | |
Name, Date of Birth | | Position(s) Held
with Fund | | Trustee/Officer
Since (1) | | Principal Occupations During the Past Five Years and
Other Directorships (2) |
| INTERESTED TRUSTEE | | | | |
David D. Horn (3) (born 6/07/41) | | Trustee | | April 1986 | | Private investor; Sun Life Assurance Company of Canada, Senior Vice President and General Manager for the United States (until 1997); Director (until March 2004) |
| | |
| INDEPENDENT TRUSTEES | | | | |
J. Kermit Birchfield (born 1/08/40) | | Chairman | | May 1997 | | Consultant; Century Partners, Inc. (investments), Director; Displaytech, Inc. (technology), Director; Dessin Fournir LLC (furniture manufacturer), Director (2005 to present); Intermountain Gas Company, Inc. & Intermountain Industries, Inc. (oil & gas exploration and production), Director; Site Watch LLC (software to monitor oil tanks), Managing Director (2006 to present); Juridica Investments (fund investing in judicial matters), Director (2007 to present); HPSC, Inc. (medical financing), Director (until January 2004) |
| | | |
Robert C. Bishop (born 1/13/43) | | Trustee | | May 2001 | | AutoImmune, Inc. (pharmaceutical product development), Chairman, President and Chief Executive Officer; Caliper Life Sciences Corp. (laboratory analytical instruments), Director; Millipore Corporation (purification/filtration products), Director; Waterstreet Capital (leverage buyouts), Advisory Board (August 2006 to present); Optobionics Corporation (ophthalmic devices), Director (2002 to 2007) |
| | | |
Frederick H. Dulles (born 3/12/42) | | Trustee | | May 2001 | | Ten State International Law PLLC (law firm), Of Counsel (since 2006); Prudential Carolina Real Estate, (real estate), Broker (since 2006); Free Enterprise Foundation, Inc. (research institute), Director & Secretary (until 2008); Disher, Hamrick & Myers Residential, Inc. (real estate) Broker (2005 until 2006); Frederick H. Dulles law practice (until 2006); Ten State Street LLP (law firm), Member (until 2005) |
| | | |
Marcia A. Kean (born 6/30/48) | | Trustee | | April 2005 | | Feinstein Kean Healthcare (consulting), Chief Executive Officer |
| | | |
Ronald G. Steinhart (born 6/15/40) | | Trustee | | May 2001 | | Private investor; Penske Automotive Group (automotive retailer), Director; Animal Health International, Inc. (animal health products), Director (since 2007); Texas Industries (concrete/aggregates/cement), Director (since 2007); Penson Worldwide, Inc. (securities clearance), Director (since 2006); Carreker Corporation (technology consulting) Director (until 2005); Prentiss Properties Trust (real estate investment trust), Director (until 2006) |
| | | |
Haviland Wright (born 7/21/48) | | Trustee | | May 2001 | | Profitability of Hawaii (software), Chief Development Officer (since December 2008); Elixir Technologies Corporation (software) Director (since 2005); Nano Loa Inc. (liquid crystal displays), Director |
| | |
| TRUSTEE EMERITUS | | | | |
Samuel Adams (born 10/19/25) | | Trustee Emeritus | | | | Retired; K&L Gates LLP (law firm), Of Counsel |
| | |
| OFFICERS | | | | |
Maria F. Dwyer (4) (born 12/01/58) | | President | | November 2005 | | Massachusetts Financial Services Company, Executive Vice President and Chief Regulatory Officer (since March 2004) Chief Compliance Officer (since December 2006); Fidelity Management & Research Company, Vice President (prior to March 2004); Fidelity Group of Funds, President and Treasurer (until March 2004) |
| | | |
Christopher R. Bohane (4) (born 1/18/74) | | Assistant Secretary and Assistant Clerk | | July 2005 | | Massachusetts Financial Services Company, Vice President and Senior Counsel |
| | | |
John M. Corcoran (4) (born 4/13/65) | | Treasurer | | October 2008 | | Massachusetts Financial Services Company, Senior Vice President (since October 2008); State Street Bank and Trust (financial services provider), Senior Vice President, (until September 2008) |
| | | |
Ethan D. Corey (4) (born 11/21/63) | | Assistant Secretary and Assistant Clerk | | July 2005 | | Massachusetts Financial Services Company, Senior Vice President and Associate General Counsel (since 2004); Dechert LLP (law firm), Counsel (prior to December 2004) |
| | | |
David L. DiLorenzo (4) (born 8/10/68) | | Assistant Treasurer | | July 2005 | | Massachusetts Financial Services Company, Vice President (since June 2005); JP Morgan Investor Services, Vice President (until June 2005) |
| | | |
Timothy M. Fagan (4) (born 7/10/68) | | Assistant Secretary and Assistant Clerk | | September 2005 | | Massachusetts Financial Services Company, Vice President and Senior Counsel (since September 2005); John Hancock Advisers, LLC, Vice President, Senior Attorney and Chief Compliance Officer (until August 2005) |
20
Trustees and Officers – continued
| | | | | | |
Name, Date of Birth | | Position(s) Held
with Fund | | Trustee/Officer
Since (1) | | Principal Occupations During the Past Five Years and
Other Directorships (2) |
Mark D. Fischer (4) (born 10/27/70) | | Assistant Treasurer | | July 2005 | | Massachusetts Financial Services Company, Vice President (since May 2005); JP Morgan Investment Management Company, Vice President (until May 2005) |
| | | |
Robyn L. Griffin (born 7/04/75) | | Assistant Independent Chief Compliance Officer | | August 2008 | | Griffin Compliance LLC (provider of compliance services), Principal (since August 2008); State Street Corporation (financial services provider), Mutual Fund Administration Assistant Vice President (October 2006 – July 2008); Liberty Mutual Group (insurance), Personal Market Assistant Controller (April 2006 – October 2006); Deloitte & Touche LLP (professional services firm), Senior Manager (prior to April 2006) |
| | | |
Brian E. Langenfeld (4) (born 3/07/73) | | Assistant Secretary and Assistant Clerk | | May 2006 | | Massachusetts Financial Services Company, Vice President and Senior Counsel (since May 2006); John Hancock Advisers, LLC, Assistant Vice President and Counsel (until April 2006) |
| | | |
Ellen Moynihan (4) (born 11/13/57) | | Assistant Treasurer | | May 1997 | | Massachusetts Financial Services Company, Senior Vice President |
| | | |
Susan S. Newton (4) (born 3/07/50) | | Assistant Secretary and Assistant Clerk | | May 2005 | | Massachusetts Financial Services Company, Senior Vice President and Associate General Counsel (since April 2005); John Hancock Advisers, LLC, Senior Vice President, Secretary and Chief Legal Officer (until April 2005) |
| | | |
Susan A. Pereira (4) (born 11/05/70) | | Assistant Secretary and Assistant Clerk | | July 2005 | | Massachusetts Financial Services Company, Vice President and Senior Counsel (since June 2004); Bingham McCutchen LLP (law firm), Associate (until June 2004) |
| | | |
Mark N. Polebaum (4) (born 5/01/52) | | Secretary and Clerk | | February 2006 | | Massachusetts Financial Services Company, Executive Vice President, General Counsel and Secretary (since January 2006); Wilmer Cutler Pickering Hale and Dorr LLP (law firm), Partner (until January 2006) |
| | | |
Frank L. Tarantino (born 3/07/44) | | Independent Chief Compliance Officer | | September 2004 | | Tarantino LLC (provider of compliance services), Principal (since June 2004); CRA Business Strategies Group (consulting services), Executive Vice President (until June 2004) |
| | | |
Richard S. Weitzel (4) (born 7/16/70) | | Assistant Secretary and Assistant Clerk | | October 2007 | | Massachusetts Financial Services Company, Vice President and Assistant General Counsel (since 2004); Massachusetts Department of Business and Technology, General Counsel (until April 2004) |
| | | |
James O. Yost (4) (born 6/12/60) | | Assistant Treasurer | | April 1992 | | Massachusetts Financial Services Company, Senior Vice President |
| (1) | Date first appointed to serve as Trustee/Officer of an MFS fund or a Compass variable account. Each Trustee has served continuously since appointment. |
| (2) | Directorships or trusteeships of companies required to report to the Securities and Exchange Commission (i.e., “public companies”). |
| (3) | “Interested person” of the Trust, within the meaning of the Investment Company Act of 1940 (referred to as the 1940 Act), which is the principal federal law governing investment companies like the Trust, as a result of position with Sun Life of Canada (U.S.). The address of Sun Life of Canada (U.S.) is One Sun Life Executive Park, Wellesley Hills, Massachusetts 02481. |
| (4) | “Interested person” of MFS within the meaning of the 1940 Act. The address of MFS is 500 Boylston Street, Boston, Massachusetts 02116. |
The Trust does not hold annual meetings for the purpose of electing Trustees, and Trustees are not elected for fixed terms. Each Trustee and officer holds office until his or her successor is chosen and qualified, or until his or her earlier death, resignation, retirement or removal.
All Trustees currently serve as Trustees of the Trust and have served in that capacity since originally elected or appointed. All of the Trustees are also Managers of the Compass Variable Accounts. The executive officers of the Trust hold similar offices for the Compass Variable Accounts and other funds in the MFS fund complex. As of January 1, 2009, each Trustee serves as a Trustee or Manager of 35 Accounts/Funds.
The Statement of Additional Information contains further information about the Trustees and is available without charge upon request by calling 1-800-752-7215.
| | |
Investment Adviser
Massachusetts Financial Services Company 500 Boylston Street, Boston, MA 02116-3741 | | Custodian State Street Bank and Trust 1 Lincoln Street, Boston, MA 02111-2900 |
Distributor
MFS Fund Distributors, Inc. 500 Boylston Street, Boston, MA 02116-3741 | | Independent Registered Public Accounting Firm Deloitte & Touche LLP 200 Berkeley Street, Boston, MA 02116 |
Portfolio Manager Eric Fischman | | |
21
BOARD REVIEW OF INVESTMENT ADVISORY AGREEMENT
The Investment Company Act of 1940 requires that both the full Board of Trustees and a majority of the non-interested (“independent”) Trustees, voting separately, annually approve the continuation of the investment advisory agreement between MFS Variable Insurance Trust II (the “Trust”) and Massachusetts Financial Services Company (“MFS”) on behalf of the Fund. The Trustees consider matters bearing on the Fund and the advisory arrangements at their meetings throughout the year, including a review of performance data at each regular meeting. In addition, the independent Trustees met in May and again in July 2008 (“contract review meetings”) for the specific purpose of considering whether to approve the continuation of the investment advisory agreement for the Fund. The independent Trustees were assisted in their evaluation of the investment advisory agreement by independent legal counsel, from whom they received separate legal advice and with whom they met separately from MFS management during various contract review meetings. The independent Trustees were also assisted in this process by the Fund’s Independent Chief Compliance Officer, a full-time senior officer appointed by and reporting to the independent Trustees.
In connection with their deliberations, the Trustees, including the independent Trustees, considered such information and factors as they believed, in light of the legal advice furnished to them and their own business judgment, to be relevant. The investment advisory agreement was considered separately for the Fund, although the Trustees also took into account the common interests of all Funds in the Trust in their review. As described below, the Trustees considered the nature, quality, and extent of the various investment advisory, administrative, and shareholder services performed by MFS under the existing investment advisory agreement and other arrangements with the Trust.
In connection with their contract review meetings, the Trustees received and relied upon materials which included, among other items: (i) information provided by Lipper Inc. on the investment performance of the Fund for various time periods ended December 31, 2007, compared to the investment performance of a group of funds with substantially similar investment classifications/objectives (the “Lipper performance universe”), (ii) information provided by Lipper Inc. on the Fund’s advisory fees and other expenses compared to the advisory fees and other expenses of comparable funds identified by Lipper (the “Lipper expense group”), (iii) information provided by MFS on the advisory fees of comparable portfolios of its other clients, including institutional separate account and other clients, (iv) information as to whether expense waivers, reimbursements or fee “breakpoints” are observed for the Fund, (v) information regarding MFS’ financial results and financial condition, including MFS’ and certain of its affiliates’ estimated profitability from services performed for the Fund, (vi) MFS’ views regarding the outlook for the mutual fund industry and its strategic business plans, (vii) descriptions of various functions performed by MFS for the Trust, such as compliance monitoring and portfolio trading practices, and (viii) information regarding the overall organization of MFS, including information about MFS’ senior management and other personnel providing investment advisory, administrative and other services to the Fund. The comparative performance, fee and expense information prepared and provided by Lipper Inc. was not independently verified, and the independent Trustees did not independently verify any information provided to them by MFS.
The Trustees’ conclusion as to the continuation of the investment advisory agreement was based on comprehensive consideration of all information provided to the Trustees and not the result of any single factor. Some of the factors that figured particularly in the Trustees’ deliberations are described below for the Fund, while individual Trustees may have given different weight to various factors and evaluated the information presented as a whole differently than another Trustee. The Trustees recognized that the fee arrangements for the Fund reflect years of review and discussion between the independent Trustees and MFS, that certain aspects of such arrangements may receive greater scrutiny in some years than others, and that the Trustees’ conclusions may be based, in part, on their consideration of these same arrangements during the course of the year and in prior years.
Based on information provided by Lipper Inc., the Trustees compared the Fund’s total return investment performance to the performance of a peer group of funds over various time periods. The Trustees placed particular emphasis on the total return performance of the Fund’s Initial Class shares in comparison to the performance of funds in its Lipper performance universe over the one-, three- and five-year periods. The Trustees did not rely on performance results for more recent periods, including those shown elsewhere in this report.
The Trustees noted the performance of the Fund’s Initial Class shares was in the 1st quintile relative to the other funds in the Lipper Classification Index for the one-year period (the 1st quintile being the best performers and the 5th quintile being the worst performers). The total return performance of the Fund was in the 2nd quintile for the three-year period and the five-year period ended December 31, 2007, relative to the Lipper performance universe. Based on the nature and quality of services provided by MFS, the Board of Trustees concluded that the Fund’s performance was satisfactory.
In the course of their deliberations, the Trustees took into account information provided by MFS during contract review meetings, as well as during investment review meetings conducted with portfolio management personnel during the course of the year.
22
Board Review of Investment Advisory Agreement – continued
In assessing the reasonableness of the Fund’s advisory fee, the Trustees considered, among other information, the Fund’s advisory fee and the total expense ratio of the Fund’s Initial Class shares as a percentage of average daily net assets, compared to the advisory fee and total expense ratios of its peer group of funds based on information provided by Lipper Inc. The Trustees also considered the advisory fees charged by MFS to institutional accounts. In comparing these fees, the Trustees considered the generally broader scope of services provided by MFS to the Trust than those provided to institutional accounts. The Trustees also considered the higher demands placed on MFS’ investment personnel and trading infrastructure as a result of the daily cash in-flows and out-flows of the Fund, and the impact on MFS and related expenses due to the more extensive regulatory regime to which the Fund is subject, compared to institutional accounts.
In considering the fees, the Trustees noted from the Lipper data that the Fund’s effective advisory fee rate and total expense ratio were each approximately at the median of such fees and expenses of funds in the Lipper expense group. The Trustees further concluded that the existing breakpoint was sufficient to allow the Fund to benefit from economies of scale as its assets grow. The Trustees concluded that the fees were reasonable in light of the nature and quality of services provided.
The Trustees also considered information prepared by MFS relating to its costs and profits with respect to the Fund and other investment companies and accounts advised by MFS, as well as MFS’ methodologies used to determine and allocate its costs to the Fund and other accounts and products for purposes of estimating profitability.
After reviewing these and other factors described below, the Trustees concluded that the advisory fees charged to the Fund represent reasonable compensation in light of the nature and quality of the services being provided by MFS.
In addition, the Trustees considered MFS’ resources and related efforts to continue to retain, attract and motivate capable personnel to serve the Fund. The Trustees also considered the financial resources of MFS and its parent, Sun Life Financial Inc. The Trustees further considered any advantages and possible disadvantages of having an adviser which also serves other investment companies as well as institutional accounts.
The Trustees also considered the nature, quality, cost, and extent of administrative, transfer agency, and distribution services provided to the Fund by MFS and its affiliates under agreements and plans other than the investment advisory agreement, including the 12b-1 fees the Fund pays to MFS Fund Distributors, Inc., an affiliate of MFS. The Trustees also considered the nature, extent and quality of certain other services MFS performs or arranges on the Fund’s behalf, which may include securities lending programs, directed expense payment programs, class action recovery programs, and MFS’ interaction with third-party service providers, principally custodians and sub-custodians. The Trustees concluded that the various non-advisory services provided by MFS and its affiliates on behalf of the Fund were satisfactory. The Trustees also considered the benefits to MFS from the use of the Fund’s portfolio brokerage commissions to pay for research and other similar services and various other factors. Additionally, the Trustees considered so-called “fall-out benefits” to MFS such as reputational value derived from serving as investment manager to the Trust, and determined that any such benefits derived by MFS were reasonable and fair.
Based on their evaluation of factors that they deemed to be material, including those factors described above, the Board of Trustees, including a majority of the independent Trustees, concluded that the investment advisory agreement should be continued for an additional one-year period, commencing September 1, 2008.
A discussion regarding the Board’s most recent review and renewal of the fund’s Investment Advisory Agreement with MFS is available by clicking on the fund’s name under “Variable Insurance Portfolios-VIT II” in the “Products & Performance” section on the MFS Web site (mfs.com).
23
PROXY VOTING POLICIES AND INFORMATION
A general description of the MFS funds’ proxy voting policies and procedures is available without charge, upon request, by calling
1-800-225-2606, by visiting the Proxy Voting section of mfs.com or by visiting the SEC’s Web site at http://www.sec.gov.
Information regarding how the fund voted proxies relating to portfolio securities during the most recent twelve-month period ended June 30 is available without charge by visiting the Proxy Voting section of mfs.com or by visiting the SEC’s Web site at http://www.sec.gov.
QUARTERLY PORTFOLIO DISCLOSURE
The fund will file a complete schedule of portfolio holdings with the Securities and Exchange Commission (the Commission) for the first and third quarters of each fiscal year on Form N-Q. The fund’s Form N-Q may be reviewed and copied at the:
Public Reference Room
Securities and Exchange Commission
100 F Street, NE, Room 1580
Washington, D.C. 20549
Information on the operation of the Public Reference Room may be obtained by calling the Commission at 1-800-SEC-0330. The fund’s Form N-Q is available on the EDGAR database on the Commission’s Internet Web site at http://www.sec.gov, and copies of this information may be obtained, upon payment of a duplicating fee, by electronic request at the following e-mail address: publicinfo@sec.gov or by writing the Public Reference Section at the above address.
FEDERAL TAX INFORMATION (unaudited)
The following information is provided pursuant to provisions of the Internal Revenue Code.
For corporate shareholders, 100.00% of the ordinary income dividends paid during the fiscal year qualify for the corporate dividends received deduction.
24
MFS® PRIVACY NOTICE
Privacy is a concern for every investor today. At MFS Investment Management® and the MFS funds, we take this concern very seriously. We want you to understand our policies about the investment products and services that we offer, and how we protect the nonpublic personal information of investors who have a direct relationship with us and our wholly owned subsidiaries.
Throughout our business relationship, you provide us with personal information. We maintain information and records about you, your investments, and the services you use. Examples of the nonpublic personal information we maintain include
| | Ÿ | | data from investment applications and other forms |
| | Ÿ | | share balances and transactional history with us, our affiliates, or others |
| | Ÿ | | facts from a consumer reporting agency |
We do not disclose any nonpublic personal information about our customers or former customers to anyone, except as permitted by law. We may share nonpublic personal information with third parties or certain of our affiliates in connection with servicing your account or processing your transactions. We may share information with companies or financial institutions that perform marketing services on our behalf or with other financial institutions with which we have joint marketing arrangements, subject to any legal requirements.
Authorization to access your nonpublic personal information is limited to appropriate personnel who provide products, services, or information to you. We maintain physical, electronic, and procedural safeguards to help protect the personal information we collect about you.
If you have any questions about the MFS privacy policy, please call 1-800-225-2606 any business day between 8 a.m. and 8 p.m. Eastern time.
Note: If you own MFS products or receive MFS services in the name of a third party such as a bank or broker-dealer, their privacy policy may apply to you instead of ours.
25


MFS® MID CAP GROWTH PORTFOLIO
The report is prepared for the general information of contract owners. It is authorized for distribution to prospective investors only when preceded or accompanied by a current prospectus.
NOT FDIC INSURED Ÿ MAY LOSE VALUE Ÿ NO BANK GUARANTEE Ÿ NOT A DEPOSIT Ÿ NOT INSURED BY ANY FEDERAL GOVERNMENT AGENCY OR NCUA/NCUSIF
LETTER FROM THE CEO

Dear Contract Owners:
The market downturns and economic setbacks of late probably rank among the worst financial declines most of us have experienced. Inevitably, people may be questioning their commitment to investing. Still, it is important to remember that downturns are an inescapable part of the business cycle. Such troughs have been seen before, and if we can use history as a guide, market recoveries typically have followed.
Recent events have clearly shown us the value of certain types of investments. In this environment, two of the hallmarks of mutual funds — transparency and liquidity — have become critically important. Unlike some other types of investments, the operations of mutual funds are relatively transparent to their shareholders. With their daily redemption feature, mutual funds also generally provide easy, convenient access to one’s money. Through these recent market upheavals, this level of liquidity enhanced the ability of mutual fund investors to respond and modify their investments as they and their advisors saw fit — a flexibility that those in less liquid investments simply did not have at their disposal.
At MFS® we take particular pride in how well mutual funds can serve investors because we invented the mutual fund in the United States. Established in 1924, Massachusetts Investors Trust was the nation’s first fund. Recent market events only reinforce what we have learned through 85 years — that mutual funds provide unique features that are important to investors in any type of market climate.
Respectfully,

Robert J. Manning
Chief Executive Officer and Chief Investment Officer
MFS Investment Management®
February 17, 2009
The opinions expressed in this letter are subject to change, may not be relied upon for investment advice, and no forecasts can be guaranteed.
Before investing, consider the fund’s investment objectives, risks, charges, and expenses. For a prospectus containing this and other information, contact your investment professional or view online. Read it carefully.
MFS Fund Distributors, Inc., 500 Boylston Street, Boston, MA 02116
1
PORTFOLIO COMPOSITION
Portfolio structure
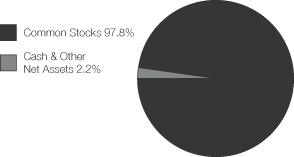
| | |
| Top ten holdings | | |
| Allergan, Inc. | | 3.0% |
| Genzyme Corp. | | 2.4% |
| VeriSign, Inc. | | 2.3% |
| Molson Coors Brewing Co. | | 2.1% |
| Danaher Corp. | | 1.9% |
| Lorillard, Inc. | | 1.8% |
| Pepsi Bottling Group, Inc. | | 1.7% |
| Noble Corp. | | 1.7% |
| Eaton Corp. | | 1.7% |
| St. Jude Medical, Inc. | | 1.5% |
| | |
| Equity sectors | | |
| Health Care | | 16.0% |
| Technology | | 15.0% |
| Industrial Goods & Services | | 11.1% |
| Energy | | 8.4% |
| Special Products & Services | | 8.1% |
| Consumer Staples | | 7.5% |
| Retailing | | 7.2% |
| Utilities & Communications | | 6.3% |
| Financial Services | | 6.1% |
| Leisure | | 5.3% |
| Basic Materials | | 2.8% |
| Transportation | | 2.5% |
| Autos & Housing | | 1.5% |
Percentages are based on net assets as of 12/31/08.
The portfolio is actively managed and current holdings may be different.
2
MANAGEMENT REVIEW
Summary of Results
For the twelve months ended December 31, 2008, Initial Class shares of the MFS Mid Cap Growth Portfolio (the “fund”) provided a total return of –51.34%, while Service Class shares of the fund provided a total return of –51.43%. This compares with a return of
–44.32% for the fund’s benchmark, the Russell Midcap Growth Index.
Market Environment
The U.S. economy and financial markets experienced significant deterioration and extraordinary volatility over the reporting period. U.S. economic growth slowed significantly, despite the short-term bounce from the second quarter fiscal stimulus. Strong domestic headwinds included accelerated deterioration in the housing market, anemic corporate investment, a rapidly declining job market, and a much tighter credit environment. During the period, a seemingly continuous series of tumultuous financial events hammered markets, including: the distressed sale of failing Bear Stearns to JPMorgan, the conservatorship of Government Sponsored Enterprises (GSEs) Fannie Mae and Freddie Mac, the bankruptcy of investment bank Lehman Brothers, the Federal Reserve Bank’s complex intervention of insurance company American International Group (AIG), the nationalization of several large European banks, the failure of Washington Mutual, and the distressed sale of Wachovia. As a result of this barrage of turbulent news, global equity markets pushed significantly lower and credit markets witnessed the worst dislocation since the beginning of the credit crisis. Though conditions improved towards the end of the period, the state of financial and macroeconomic dislocation remained severe.
While reasonably resilient during the first half of the period, the global economy and financial system increasingly experienced considerable negative spillovers from the U.S. slowdown. Not only did Europe and Japan show obvious signs of economic softening, the more powerful engine of global growth – emerging markets – also displayed weakening dynamics.
During the reporting period, the U.S. Federal Reserve Board cut interest rates aggressively and introduced a multitude of new lending facilities to alleviate ever-tightening credit markets, while the U.S. federal government moved quickly to design and implement a meaningful fiscal stimulus package. Although several other global central banks also cut rates, the dilemma of rising energy and food prices heightened concerns among central bankers that inflationary expectations might become unhinged despite weaker growth. Only later in the reporting period did slowing global growth result in a very precipitous decline in commodity prices, which significantly eased inflation and inflationary expectations. As inflationary concerns diminished in the face of global deleveraging, and equity and credit markets deteriorated more sharply, a coordinated rate cut marked the beginning of much more aggressive easing by the major global central banks.
Detractors from Performance
During the reporting period, stock selection was the principal factor detracting from the fund’s performance relative to the Russell Midcap Growth Index. Particularly hard hit were the health care, technology, and energy sectors.
In the health care sector, the fund’s positions in poor-performing health insurer Cigna (g) and managed health care company Coventry Health Care (g) were among the fund’s top detractors. Shares of Coventry Health Care declined amidst a drop in profits due to higher-than-expected medical costs. Holdings of genetic diagnostics equipment company Affymetrix (aa)(g) also hurt.
In the technology sector, the fund’s holdings of electronics assembly manufacturer Flextronics (aa) weighed on relative performance. We feel that shares of Flextronics fell as the market became concerned about weak industry demand and how potential funding constraints could impair the company. Energy holdings that hurt relative returns included oil and gas services company Tetra Technologies (g) and offshore oil and gas exploration company Helix Energy Solutions Group (g). Shares of Helix declined on concerns of lower production due to Gulf Coast storms.
The industrial goods and services sector was another area of relative weakness, although no individual stocks within the sector were among the fund’s top detractors.
Elsewhere in the fund, our positioning in women’s apparel company Ann Taylor (g) and slot machine manufacturer International Game Technology detracted from relative performance, as these stocks underperformed the benchmark over the reporting period. Holdings of insurance company Genworth Financial (aa)(g) and home furnishings and décor retailer Pier 1 Imports (aa) also hindered returns as these stocks underperformed the benchmark. Shares of Pier 1 Imports declined after the company’s same-store sales fell more than previously expected.
Contributors to Performance
Stock selection in the consumer staples sector was a positive contributor to relative returns during the reporting period. An overweighted position in tobacco company Lorillard and holdings of brewery company Molson Coors Brewing (aa) were among the fund’s top relative contributors within this sector. Shares of Molson Coors Brewing outperformed the index as the company shed costs and formed a joint venture with SABMiller.
3
Management Review – continued
Elsewhere, the fund’s positions in discount retailer Family Dollar Stores (g), automotive parts retailer O’Reilly Automotive, and higher education company Devry aided relative performance. Holdings of biopharmaceutical company Cubist Pharmaceuticals (aa)(g), financial services firm UnionBanCal (aa)(g), and global biotech company Genyzyme (aa) also boosted results as these stocks outperformed the benchmark. Shares of Genzyme fared better than the sector overall due to strong sales growth in its drug products, particularly a significant jump in the latter part of the reporting period in sales of its rare genetic disorder drug Myozyme.
Respectfully,
| | |
| David DeGroff | | Eric Fischman |
| Portfolio Manager | | Portfolio Manager |
Note to Shareholders: Effective November 20, 2008, David DeGroff and Eric Fischman became co-managers of the fund. Previously, the fund was co-managed by Matthew Krummell and Eric Weigel.
| (aa) | | Security is not a benchmark constituent. |
| (g) | | Security was not held in the portfolio at period end. |
The views expressed in this report are those of the portfolio managers only through the end of the period of the report as stated on the cover and do not necessarily reflect the views of MFS or any other person in the MFS organization. These views are subject to change at any time based on market or other conditions, and MFS disclaims any responsibility to update such views. These views may not be relied upon as investment advice or an indication of trading intent on behalf of any MFS portfolio. References to specific securities are not recommendations of such securities, and may not be representative of any MFS portfolio’s current or future investments.
4
PERFORMANCE SUMMARY THROUGH 12/31/08
The following chart illustrates the historical performance of the fund in comparison to its benchmark(s). Benchmark comparisons are unmanaged; do not reflect any fees or expenses; and cannot be invested in directly. The performance of other share classes will be greater than or less than that of the class depicted below. (See Notes to Performance Summary.)
Performance data shown represents past performance and is no guarantee of future results. Investment return and principal value fluctuate so your units, when sold, may be worth more or less than the original cost; current performance may be lower or higher than quoted. The performance shown does not reflect the deduction of taxes, if any, that a contract holder would pay on fund distributions or the redemption of contract units. The returns for the fund shown also do not reflect the deduction of expenses associated with variable products, such as mortality and expense risk charges, separate account charges, and sales charges imposed by the insurance company separate accounts. Such expenses would reduce the overall returns shown.
Growth of a hypothetical $10,000 investment (t)
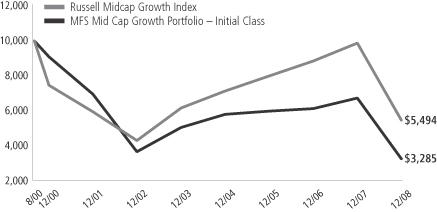
Total rates of return through 12/31/08
Average Annual Total Returns
| | | | | | | | | | | | |
| | | Share class | | Class inception date | | 1-yr | | 5-yr | | Life (t) | | |
| | | Initial Class | | 8/31/00 | | (51.34)% | | (8.35)% | | (12.50)% | | |
| | | Service Class | | 8/24/01 | | (51.43)% | | (8.57)% | | (12.66)% | | |
Comparative Benchmark
| | | | | | | | | | | | |
| | | Russell Midcap Growth Index (f) | | (44.32)% | | (2.33)% | | (6.91)% | | |
| (f) | Source: FactSet Research Systems Inc. |
| (t) | For the period from the commencement of the fund’s investment operations, August 31, 2000 through the stated period end. |
Benchmark Definition
Russell Midcap Growth Index – constructed to provide a comprehensive barometer for growth securities in the mid-cap segment of the U.S. equity universe. Companies in this index generally have higher price-to-book ratios and higher forecasted growth values.
It is not possible to invest directly in an index.
Notes to Performance Summary
Performance for the Service Class includes the performance of the fund’s Initial Class for periods prior to their offering. Because Service Class expenses are higher than those of Initial Class, performance shown for Service Class is higher than it would have been had it been offered for the entire period. Performance has not been adjusted to take into account differences in class specific operating expenses (such as Rule 12b-1 fees). Please see the prospectus for additional information about performance and expenses.
Performance results reflect any applicable expense subsidies and waivers in effect during the periods shown. Without such subsidies and waivers the fund’s performance results would be less favorable. Please see the prospectus for complete details. All results are historical and assume the reinvestment of any dividends and capital gains distributions.
From time to time the fund may receive proceeds from litigation settlements, without which performance would be lower.
5
EXPENSE TABLE
Fund Expenses Borne by the Contract Holders During the Period,
July 1, 2008 through December 31, 2008
As a contract holder of the fund, you incur ongoing costs, including management fees; distribution (12b-1) fees; and other fund expenses. This example is intended to help you understand your ongoing costs (in dollars) of investing in the fund and to compare these costs with the ongoing costs of investing in other mutual funds.
The example is based on an investment of $1,000 invested at the beginning of the period and held for the entire period July 1, 2008 through December 31, 2008.
Actual Expenses
The first line for each share class in the following table provides information about actual account values and actual expenses. You may use the information in this line, together with the amount you invested, to estimate the expenses that you paid over the period. Simply divide your account value by $1,000 (for example, an $8,600 account value divided by $1,000 = 8.6), then multiply the result by the number in the first line under the heading entitled “Expenses Paid During Period” to estimate the expenses you paid on your account during this period.
Hypothetical Example for Comparison Purposes
The second line for each share class in the following table provides information about hypothetical account values and hypothetical expenses based on the fund’s actual expense ratio and an assumed rate of return of 5% per year before expenses, which is not the fund’s actual return. The hypothetical account values and expenses may not be used to estimate the actual ending account balance or expenses you paid for the period. You may use this information to compare the ongoing costs of investing in the fund and other funds. To do so, compare this 5% hypothetical example with the 5% hypothetical examples that appear in the shareholder reports of the other funds.
Please note that the expenses shown in the table are meant to highlight the fund’s ongoing costs only and do not take into account the fees and expenses imposed under the variable contracts through which your investment in the fund is made. Therefore, the second line for each share class in the table is useful in comparing ongoing costs associated with an investment in vehicles (such as the fund) which fund benefits under variable annuity and variable life insurance contracts and to qualified pension and retirement plans only, and will not help you determine the relative total costs of investing in the fund through variable annuity and variable life insurance contracts. If the fees and expenses imposed under the variable contracts were included, your costs would have been higher.
| | | | | | | | | | |
| Share Class | | | | Annualized
Expense Ratio | | Beginning
Account Value
7/01/08 | | Ending
Account Value
12/31/08 | | Expenses Paid
During Period (p)
7/01/08-12/31/08 |
| Initial Class | | Actual | | 1.03% | | $1,000.00 | | $523.20 | | $3.94 |
| | Hypothetical (h) | | 1.03% | | $1,000.00 | | $1,019.96 | | $5.23 |
| Service Class | | Actual | | 1.28% | | $1,000.00 | | $523.58 | | $4.90 |
| | Hypothetical (h) | | 1.28% | | $1,000.00 | | $1,018.70 | | $6.50 |
| (h) | 5% class return per year before expenses. |
| (p) | Expenses paid is equal to each class’ annualized expense ratio, as shown above, multiplied by the average account value over the period, multiplied by the number of days in the period, divided by the number of days in the year. |
6
PORTFOLIO OF INVESTMENTS – 12/31/08
The Portfolio of Investments is a complete list of all securities owned by your fund. It is categorized by broad-based asset classes.
| | | | | |
| Issuer | | Shares/Par | | Value ($) |
| | | | | |
| COMMON STOCKS – 97.8% | | | | | |
| Aerospace – 1.6% | | | |
| Goodrich Corp. | | 5,940 | | $ | 219,893 |
| L-3 Communications Holdings, Inc. | | 1,260 | | | 92,963 |
| Northrop Grumman Corp. | | 3,810 | | | 171,602 |
| | | | | |
| | | | $ | 484,458 |
| | | | | |
| Airlines – 0.8% | | | |
| Copa Holdings S.A., “A” | | 6,700 | | $ | 203,144 |
| UAL Corp. | | 2,890 | | | 31,848 |
| | | | | |
| | | | $ | 234,992 |
| | | | | |
| Alcoholic Beverages – 2.1% | | | |
| Molson Coors Brewing Co. | | 13,090 | | $ | 640,363 |
| | | | | |
| Automotive – 0.4% | | | |
| BorgWarner Transmission Systems, Inc. | | 5,350 | | $ | 116,470 |
| | | | | |
| Biotechnology – 3.5% | | | |
| Biogen Idec, Inc. (a) | | 4,060 | | $ | 193,378 |
| Celgene Corp. (a) | | 2,470 | | | 136,542 |
| Genzyme Corp. (a) | | 10,670 | | | 708,168 |
| | | | | |
| | | | $ | 1,038,088 |
| | | | | |
| Broadcasting – 0.5% | | | |
| Grupo Televisa S.A., ADR | | 10,720 | | $ | 160,157 |
| | | | | |
| Brokerage & Asset Managers – 2.2% | | | |
| Charles Schwab Corp. | | 19,120 | | $ | 309,170 |
| CME Group, Inc. | | 620 | | | 129,028 |
| Greenhill & Co., Inc. | | 1,470 | | | 102,562 |
| TD AMERITRADE Holding Corp. (a) | | 9,160 | | | 130,530 |
| | | | | |
| | | | $ | 671,290 |
| | | | | |
| Business Services – 3.2% | | | |
| Amdocs Ltd. (a) | | 15,720 | | $ | 287,519 |
| FTI Consulting, Inc. (a) | | 2,550 | | | 113,934 |
| MasterCard, Inc., “A” | | 2,340 | | | 334,456 |
| Visa, Inc. | | 2,690 | | | 141,091 |
| Western Union Co. | | 5,980 | | | 85,753 |
| | | | | |
| | | | $ | 962,753 |
| | | | | |
| Chemicals – 1.3% | | | |
| Ecolab, Inc. | | 10,970 | | $ | 385,596 |
| | | | | |
| Computer Software – 6.4% | | | |
| Akamai Technologies, Inc. (a) | | 20,650 | | $ | 311,609 |
| McAfee, Inc. (a) | | 8,090 | | | 279,671 |
| MicroStrategy, Inc., “A” (a) | | 8,710 | | | 323,402 |
| Salesforce.com, Inc. (a) | | 4,480 | | | 143,405 |
| Synopsys, Inc. (a) | | 9,430 | | | 174,644 |
| VeriSign, Inc. (a) | | 36,880 | | | 703,670 |
| | | | | |
| | | | $ | 1,936,401 |
| | | | | |
| Construction – 1.1% | | | |
| Pulte Homes, Inc. | | 2,800 | | $ | 30,604 |
| Sherwin-Williams Co. | | 5,010 | | | 299,348 |
| | | | | |
| | | | $ | 329,952 |
| | | | | |
| | | | | |
| Issuer | | Shares/Par | | Value ($) |
| | | | | |
| COMMON STOCKS – continued |
| Consumer Goods & Services – 5.9% | | | |
| Apollo Group, Inc., “A” (a) | | 1,560 | | $ | 119,527 |
| Avon Products, Inc. | | 8,000 | | | 192,240 |
| Capella Education Co. (a) | | 2,590 | | | 152,188 |
| Clorox Co. | | 1,910 | | | 106,120 |
| DeVry, Inc. | | 6,100 | | | 350,201 |
| New Oriental Education & Technology Group, Inc., ADR (a) | | 7,400 | | | 406,334 |
| Priceline.com, Inc. (a) | | 3,850 | | | 283,553 |
| Strayer Education, Inc. | | 790 | | | 169,384 |
| | | | | |
| | | | $ | 1,779,547 |
| | | | | |
| Electrical Equipment – 4.4% | | | |
| AMETEK, Inc. | | 4,560 | | $ | 137,758 |
| Danaher Corp. | | 10,360 | | | 586,480 |
| Rockwell Automation, Inc. | | 8,500 | | | 274,040 |
| W.W. Grainger, Inc. | | 4,270 | | | 336,647 |
| | | | | |
| | | | $ | 1,334,925 |
| | | | | |
| Electronics – 6.7% | | | |
| Atheros Communications, Inc. (a) | | 3,250 | | $ | 46,508 |
| Broadcom Corp., “A” (a) | | 5,440 | | | 92,317 |
| Flextronics International Ltd. (a) | | 155,290 | | | 397,542 |
| Hittite Microwave Corp. (a) | | 7,330 | | | 215,942 |
| Intersil Corp., “A” | | 24,140 | | | 221,847 |
| Linear Technology Corp. | | 9,350 | | | 206,822 |
| Marvell Technology Group Ltd. (a) | | 32,610 | | | 217,509 |
| MEMC Electronic Materials, Inc. (a) | | 8,580 | | | 122,522 |
| National Semiconductor Corp. | | 30,690 | | | 309,048 |
| Silicon Laboratories, Inc. (a) | | 7,110 | | | 176,186 |
| | | | | |
| | | | $ | 2,006,243 |
| | | | | |
| Energy – Independent – 4.7% | | | |
| Arena Resources, Inc. (a) | | 1,080 | | $ | 30,337 |
| Denbury Resources, Inc. (a) | | 3,370 | | | 36,800 |
| EOG Resources, Inc. | | 4,500 | | | 299,610 |
| Noble Energy, Inc. | | 3,180 | | | 156,520 |
| Plains Exploration & Production Co. (a) | | 9,540 | | | 221,710 |
| Ultra Petroleum Corp. (a) | | 9,460 | | | 326,465 |
| XTO Energy, Inc. | | 9,660 | | | 340,708 |
| | | | | |
| | | | $ | 1,412,150 |
| | | | | |
| Energy – Integrated – 0.5% | | | |
| Marathon Oil Corp. | | 5,780 | | $ | 158,141 |
| | | | | |
| Engineering – Construction – 1.4% | | | |
| Fluor Corp. | | 7,740 | | $ | 347,294 |
| Quanta Services, Inc. (a) | | 3,570 | | | 70,686 |
| | | | | |
| | | | $ | 417,980 |
| | | | | |
| Entertainment – 1.2% | | | |
| DreamWorks Animation, Inc., “A” (a) | | 12,620 | | $ | 318,781 |
| TiVo, Inc. (a) | | 5,080 | | | 36,373 |
| | | | | |
| | | | $ | 355,154 |
| | | | | |
7
Portfolio of Investments – continued
| | | | | |
| Issuer | | Shares/Par | | Value ($) |
| | | | | |
| COMMON STOCKS – continued |
| Food & Beverages – 2.6% | | | |
| Hain Celestial Group, Inc. (a) | | 1,790 | | $ | 34,171 |
| J.M. Smucker Co. | | 5,280 | | | 228,941 |
| Pepsi Bottling Group, Inc. | | 23,270 | | | 523,808 |
| | | | | |
| | | | $ | 786,920 |
| | | | | |
| Gaming & Lodging – 0.6% | | | |
| International Game Technology | | 16,150 | | $ | 192,024 |
| | | | | |
| General Merchandise – 1.8% | | | |
| Family Dollar Stores, Inc. | | 6,310 | | $ | 164,502 |
| Kohl’s Corp. (a) | | 10,260 | | | 371,412 |
| | | | | |
| | | | $ | 535,914 |
| | | | | |
| Insurance – 1.9% | | | |
| ACE Ltd. | | 2,810 | | $ | 148,705 |
| Allied World Assurance Co. Holdings Ltd. | | 2,350 | | | 95,410 |
| Aspen Insurance Holdings Ltd. | | 8,780 | | | 212,915 |
| PartnerRe Ltd. | | 1,470 | | | 104,767 |
| | | | | |
| | | | $ | 561,797 |
| | | | | |
| Leisure & Toys – 1.5% | | | |
| Electronic Arts, Inc. (a) | | 9,830 | | $ | 157,673 |
| Hasbro, Inc. | | 7,420 | | | 216,441 |
| THQ, Inc. (a) | | 16,540 | | | 69,303 |
| | | | | |
| | | | $ | 443,417 |
| | | | | |
| Machinery & Tools – 3.3% | | | |
| Bucyrus International, Inc. | | 7,700 | | $ | 142,604 |
| Eaton Corp. | | 10,410 | | | 517,481 |
| Fastenal Co. | | 2,020 | | | 70,397 |
| Kennametal, Inc. | | 8,610 | | | 191,056 |
| Roper Industries, Inc. | | 1,700 | | | 73,797 |
| | | | | |
| | | | $ | 995,335 |
| | | | | |
| Major Banks – 0.9% | | | |
| State Street Corp. | | 6,980 | | $ | 274,523 |
| | | | | |
| Medical & Health Technology & Services – 4.2% |
| DaVita, Inc. (a) | | 3,390 | | $ | 168,042 |
| Express Scripts, Inc. (a) | | 5,230 | | | 287,545 |
| IDEXX Laboratories, Inc. (a) | | 12,030 | | | 434,042 |
| Medco Health Solutions, Inc. (a) | | 9,220 | | | 386,410 |
| | | | | |
| | | | $ | 1,276,039 |
| | | | | |
| Medical Equipment – 5.3% | | | |
| Becton, Dickinson & Co. | | 3,380 | | $ | 231,158 |
| C.R. Bard, Inc. | | 4,610 | | | 388,439 |
| Covidien Ltd. | | 3,930 | | | 142,423 |
| St. Jude Medical, Inc. (a) | | 14,090 | | | 464,406 |
| Zimmer Holdings, Inc. (a) | | 9,150 | | | 369,843 |
| | | | | |
| | | | $ | 1,596,269 |
| | | | | |
| Natural Gas – Distribution – 0.6% | | | |
| Equitable Resources, Inc. | | 5,630 | | $ | 188,887 |
| | | | | |
| Natural Gas – Pipeline – 1.1% | | | |
| Williams Cos., Inc. | | 21,770 | | $ | 315,230 |
| | | | | |
| | | | | |
| Issuer | | Shares/Par | | Value ($) |
| | | | | |
| COMMON STOCKS – continued |
| Oil Services – 3.2% | | | |
| Exterran Holdings, Inc. (a) | | 13,150 | | $ | 280,095 |
| Noble Corp. | | 23,600 | | | 521,324 |
| Transocean, Inc. (a) | | 3,380 | | | 159,705 |
| | | | | |
| | | | $ | 961,124 |
| | | | | |
| Other Banks & Diversified Financials – 1.1% | | | |
| Northern Trust Corp. | | 6,230 | | $ | 324,832 |
| | | | | |
| Personal Computers & Peripherals – 1.9% | | | |
| NetApp, Inc. (a) | | 11,010 | | $ | 153,810 |
| Nuance Communications, Inc. (a) | | 40,560 | | | 420,202 |
| | | | | |
| | | | $ | 574,012 |
| | | | | |
| Pharmaceuticals – 3.0% | | | |
| Allergan, Inc. | | 22,080 | | $ | 890,266 |
| | | | | |
| Pollution Control – 0.4% | | | |
| Republic Services, Inc. | | 5,390 | | $ | 133,618 |
| | | | | |
| Restaurants – 1.5% | | | |
| Darden Restaurants, Inc. | | 7,200 | | $ | 202,896 |
| P.F. Chang’s China Bistro, Inc. (a) | | 3,460 | | | 72,452 |
| YUM! Brands, Inc. | | 5,750 | | | 181,125 |
| | | | | |
| | | | $ | 456,473 |
| | | | | |
| Specialty Chemicals – 1.5% | | | |
| Praxair, Inc. | | 7,380 | | $ | 438,077 |
| | | | | |
| Specialty Stores – 5.4% | | | |
| Abercrombie & Fitch Co., “A” | | 10,670 | | $ | 246,157 |
| Dick’s Sporting Goods, Inc. (a) | | 6,810 | | | 96,089 |
| O’Reilly Automotive, Inc. (a) | | 11,610 | | | 356,891 |
| PetSmart, Inc. | | 13,200 | | | 243,540 |
| Ross Stores, Inc. | | 4,390 | | | 130,515 |
| Staples, Inc. | | 15,230 | | | 272,922 |
| Tiffany & Co. | | 11,730 | | | 277,180 |
| | | | | |
| | | | $ | 1,623,294 |
| | | | | |
| Telecommunications – Wireless – 0.5% | | | |
| Rogers Communications, Inc., “B” | | 5,280 | | $ | 156,497 |
| | | | | |
| Telephone Services – 1.0% | | | |
| American Tower Corp., “A” (a) | | 10,700 | | $ | 313,724 |
| | | | | |
| Tobacco – 1.8% | | | |
| Lorillard, Inc. | | 9,540 | | $ | 537,579 |
| | | | | |
| Trucking – 1.7% | | | |
| J.B. Hunt Transport Services, Inc. | | 6,300 | | $ | 165,501 |
| Landstar System, Inc. | | 8,680 | | | 333,572 |
| | | | | |
| | | | $ | 499,073 |
| | | | | |
| Utilities – Electric Power – 3.1% | | | |
| AES Corp. (a) | | 7,410 | | $ | 61,058 |
| Allegheny Energy, Inc. | | 8,890 | | | 301,015 |
| American Electric Power Co., Inc. | | 7,200 | | | 239,616 |
| PPL Corp. | | 11,030 | | | 338,511 |
| | | | | |
| | | | $ | 940,200 |
| | | | | |
Total Common Stocks
(Identified Cost, $38,117,187) | | | | $ | 29,439,784 |
| | | | | |
8
Portfolio of Investments – continued
| | | | | | | |
| Issuer | | Shares/Par | | Value ($) | |
| | | | | | | |
| REPURCHASE AGREEMENTS – 2.5% | | | | |
| Goldman Sachs, 0.01%, dated 12/31/08, due 1/02/09, total to be received $751,000.41 (secured by various U.S. Treasury and Federal Agency obligations and Mortgage Backed securities in a jointly traded account), at Cost. | | $ | 751,000 | | $ | 751,000 | |
| | | | | | | |
Total Investments
(Identified Cost, $38,868,187) | | | | | $ | 30,190,784 | |
| | | | | | | |
OTHER ASSETS, LESS
LIABILITIES – (0.3)% | | | | | | (77,747 | ) |
| | | | | | | |
| Net Assets – 100.0% | | | | | $ | 30,113,037 | |
| | | | | | | |
| (a) | | Non-income producing security. |
The following abbreviations are used in this report and are defined:
| ADR | | American Depository Receipt |
See Notes to Financial Statements
9
FINANCIAL STATEMENTS | STATEMENT OF ASSETS AND LIABILITIES
This statement represents your fund’s balance sheet, which details the assets and liabilities comprising the total value of the fund.
| | | | | |
At 12/31/08 | | | | | |
Assets | | | | | |
Investments, at value (identified cost, $38,868,187) | | $30,190,784 | | | |
Cash | | 800 | | | |
Receivable for fund shares sold | | 10,651 | | | |
Interest and dividends receivable | | 25,156 | | | |
Other assets | | 2,298 | | | |
Total assets | | | | | $30,229,689 |
Liabilities | | | | | |
Payable for investments purchased | | $27,980 | | | |
Payable for fund shares reacquired | | 23,784 | | | |
Payable to affiliates | | | | | |
Management fee | | 1,196 | | | |
Distribution fees | | 190 | | | |
Administrative services fee | | 55 | | | |
Payable for trustees’ compensation | | 110 | | | |
Accrued expenses and other liabilities | | 63,337 | | | |
Total liabilities | | | | | $116,652 |
Net assets | | | | | $30,113,037 |
Net assets consist of | | | | | |
Paid-in capital | | $72,783,129 | | | |
Unrealized appreciation (depreciation) on investments and translation of assets and liabilities in foreign currencies | | (8,677,391 | ) | | |
Accumulated net realized gain (loss) on investments and foreign currency transactions | | (34,004,408 | ) | | |
Undistributed net investment income | | 11,707 | | | |
Net assets | | | | | $30,113,037 |
Shares of beneficial interest outstanding | | | | | 9,280,213 |
Initial Class shares | | | | | |
Net assets | | $15,803,288 | | | |
Shares outstanding | | 4,831,830 | | | |
Net asset value per share | | | | | $3.27 |
Service Class shares | | | | | |
Net assets | | $14,309,749 | | | |
Shares outstanding | | 4,448,383 | | | |
Net asset value per share | | | | | $3.22 |
See Notes to Financial Statements
10
FINANCIAL STATEMENTS | STATEMENT OF OPERATIONS
This statement describes how much your fund earned in investment income and accrued in expenses. It also describes any gains and/or losses generated by fund operations.
| | | | | | |
Year ended 12/31/08 | | | | | | |
Net investment income | | | | | | |
Income | | | | | | |
Dividends | | $513,008 | | | | |
Income on securities loaned | | 73,873 | | | | |
Interest | | 12,546 | | | | |
Foreign taxes withheld | | (50 | ) | | | |
Total investment income | | | | | $599,377 | |
Expenses | | | | | | |
Management fee | | $408,618 | | | | |
Distribution fees | | 59,405 | | | | |
Administrative services fee | | 15,554 | | | | |
Trustees’ compensation | | 8,148 | | | | |
Custodian fee | | 18,917 | | | | |
Shareholder communications | | 17,233 | | | | |
Auditing fees | | 42,228 | | | | |
Legal fees | | 7,128 | | | | |
Miscellaneous | | 9,934 | | | | |
Total expenses | | | | | $587,165 | |
Fees paid indirectly | | (53 | ) | | | |
Net expenses | | | | | $587,112 | |
Net investment income | | | | | $12,265 | |
Realized and unrealized gain (loss) on investments and foreign currency transactions | | | | | | |
Realized gain (loss) (identified cost basis) | | | | | | |
Investment transactions | | $(16,667,539 | ) | | | |
Foreign currency transactions | | (558 | ) | | | |
Net realized gain (loss) on investments and foreign currency transactions | | | | | $(16,668,097 | ) |
Change in unrealized appreciation (depreciation) | | | | | | |
Investments | | $(15,689,352 | ) | | | |
Translation of assets and liabilities in foreign currencies | | 12 | | | | |
Net unrealized gain (loss) on investments and foreign currency translation | | | | | $(15,689,340 | ) |
Net realized and unrealized gain (loss) on investments and foreign currency | | | | | $(32,357,437 | ) |
Change in net assets from operations | | | | | $(32,345,172 | ) |
See Notes to Financial Statements
11
FINANCIAL STATEMENTS | STATEMENTS OF CHANGES IN NET ASSETS
These statements describe the increases and/or decreases in net assets resulting from operations, any distributions, and any shareholder transactions.
| | | | | | |
For years ended 12/31 | | 2008 | | | 2007 | |
Change in net assets | | | | | | |
From operations | | | | | | |
Net investment income (loss) | | $12,265 | | | $(192,276 | ) |
Net realized gain (loss) on investments and foreign currency transactions | | (16,668,097 | ) | | 9,551,575 | |
Net unrealized gain (loss) on investments and foreign currency translation | | (15,689,340 | ) | | (943,630 | ) |
Change in net assets from operations | | $(32,345,172 | ) | | $8,415,669 | |
Distributions declared to shareholders | | | | | | |
From net investment income – Initial Class | | $— | | | $(19,627 | ) |
Change in net assets from fund share transactions | | $(15,405,068 | ) | | $(20,681,464 | ) |
Total change in net assets | | $(47,750,240 | ) | | $(12,285,422 | ) |
Net assets | | | | | | |
At beginning of period | | 77,863,277 | | | 90,148,699 | |
At end of period (including undistributed net investment income of $11,707 and
$0, respectively) | | $30,113,037 | | | $77,863,277 | |
See Notes to Financial Statements
12
FINANCIAL STATEMENTS | FINANCIAL HIGHLIGHTS
The financial highlights table is intended to help you understand the fund’s financial performance for the past 5 years. Certain information reflects financial results for a single fund share. The total returns in the table represent the rate by which an investor would have earned (or lost) on an investment in the fund share class (assuming reinvestment of all distributions) held for the entire period.
| | | | | | | | | | | | | | |
| Initial Class | | Years ended 12/31 | |
| | | 2008 | | | 2007 | | | 2006 | | 2005 | | | 2004 | |
Net asset value, beginning of period | | $6.72 | | | $6.12 | | | $5.98 | | $5.80 | | | $5.06 | |
| Income (loss) from investment operations | | | | | | | | | | | | | | |
Net investment income (loss) (d) | | $0.01 | | | $(0.01 | ) | | $0.01 | | $(0.02 | ) | | $(0.03 | ) |
Net realized and unrealized gain (loss) on investments
and foreign currency | | (3.46 | ) | | 0.61 | | | 0.13 | | 0.20 | | | 0.77 | |
Total from investment operations | | $(3.45 | ) | | $0.60 | | | $0.14 | | $0.18 | | | $0.74 | |
| Less distributions declared to shareholders | | | | | | | | | | | | | | |
From net investment income | | $— | | | $(0.00 | )(w) | | $— | | $— | | | $— | |
Net asset value, end of period | | $3.27 | | | $6.72 | | | $6.12 | | $5.98 | | | $5.80 | |
Total return (%) (k)(r)(s) | | (51.34 | ) | | 9.84 | | | 2.34 | | 3.10 | | | 14.62 | |
Ratios (%) (to average net assets)
and Supplemental data: | | | | | | | | | | | | | | |
Expenses before expense reductions (f) | | 0.97 | | | 0.88 | | | 0.93 | | 0.89 | | | 0.85 | |
Expenses after expense reductions (f) | | N/A | | | 0.88 | | | 0.91 | | N/A | | | N/A | |
Net investment income (loss) | | 0.13 | | | (0.12 | ) | | 0.11 | | (0.40 | ) | | (0.56 | ) |
Portfolio turnover | | 100 | | | 80 | | | 139 | | 81 | | | 84 | |
Net assets at end of period (000 Omitted) | | $15,803 | | | $44,944 | | | $53,504 | | $68,637 | | | $83,899 | |
| | | | | | | | | | | | | | | |
| Service Class | | Years ended 12/31 | |
| | | 2008 | | | 2007 | | | 2006 | | | 2005 | | | 2004 | |
Net asset value, beginning of period | | $6.63 | | | $6.05 | | | $5.92 | | | $5.76 | | | $5.04 | |
| Income (loss) from investment operations | | | | | | | | | | | | | | | |
Net investment loss (d) | | $(0.01 | ) | | $(0.02 | ) | | $(0.01 | ) | | $(0.04 | ) | | $(0.04 | ) |
Net realized and unrealized gain (loss) on investments
and foreign currency | | (3.40 | ) | | 0.60 | | | 0.14 | | | 0.20 | | | 0.76 | |
Total from investment operations | | $(3.41 | ) | | $0.58 | | | $0.13 | | | $0.16 | | | $0.72 | |
Net asset value, end of period | | $3.22 | | | $6.63 | | | $6.05 | | | $5.92 | | | $5.76 | |
Total return (%) (k)(r)(s) | | (51.43 | ) | | 9.59 | | | 2.20 | | | 2.78 | | | 14.29 | |
Ratios (%) (to average net assets)
and Supplemental data: | | | | | | | | | | | | | | | |
Expenses before expense reductions (f) | | 1.22 | | | 1.13 | | | 1.18 | | | 1.15 | | | 1.10 | |
Expenses after expense reductions (f) | | N/A | | | 1.13 | | | 1.16 | | | N/A | | | N/A | |
Net investment loss | | (0.12 | ) | | (0.37 | ) | | (0.11 | ) | | (0.65 | ) | | (0.81 | ) |
Portfolio turnover | | 100 | | | 80 | | | 139 | | | 81 | | | 84 | |
Net assets at end of period (000 Omitted) | | $14,310 | | | $32,919 | | | $36,645 | | | $41,713 | | | $45,443 | |
| (d) | Per share data are based on average shares outstanding. |
| (f) | Ratios do not reflect reductions from fees paid indirectly, if applicable. |
| (k) | The total return does not reflect expenses that apply to separate accounts. Inclusion of these charges would reduce the total return figures for all periods shown. |
| (r) | Certain expenses have been reduced without which performance would have been lower. |
| (s) | From time to time the series may receive proceeds from litigation settlements, without which performance would be lower. |
| (w) | Per share amount was less than $0.01. |
See Notes to Financial Statements
13
NOTES TO FINANCIAL STATEMENTS
| (1) | | Business and Organization |
MFS Mid Cap Growth Portfolio (the fund) is a series of MFS Variable Insurance Trust II (the trust). The trust is organized as a Massachusetts business trust and is registered under the Investment Company Act of 1940, as amended, as an open-end management investment company. The shares of the fund are sold to variable accounts established by insurance companies to fund benefits under variable contracts issued by such companies, and qualified retirement and pension plans.
| (2) | | Significant Accounting Policies |
General – The preparation of financial statements in conformity with U.S. generally accepted accounting principles requires management to make estimates and assumptions that affect the reported amounts of assets and liabilities, and disclosure of contingent assets and liabilities at the date of the financial statements and the reported amounts of revenues and expenses during the reporting period. Actual results could differ from those estimates. The fund can invest in foreign securities, including securities of emerging market issuers. Investments in foreign securities are vulnerable to the effects of changes in the relative values of the local currency and the U.S. dollar and to the effects of changes in each country’s legal, political, and economic environment. The markets of emerging markets countries are generally more volatile than the markets of developed countries with more mature economies. All of the risks of investing in foreign securities previously described are heightened when investing in emerging markets countries.
In March 2008, FASB Statement No. 161, Disclosures about Derivative Instruments and Hedging Activities (the “Standard”) was issued, and is effective for financial statements issued for fiscal years and interim periods beginning after November 15, 2008. This Standard provides enhanced disclosures about the fund’s use of and accounting for derivative instruments and the effect of derivative instruments on the fund’s results of operations and financial position. Management is evaluating the application of the Standard to the fund, and has not at this time determined the impact, if any, resulting from the adoption of this Standard on the fund’s financial statements.
FASB Staff Position (FSP) 133-1 was implemented during the period. FSP 133-1 amends FAS 133 to require sellers of credit derivatives to make disclosures that will enable financial statement users to assess the potential effects of those credit derivatives on an entity’s financial position, financial performance and cash flows. There was no impact from implementing FSP 133-1 as the fund did not hold any of these credit derivatives at period end.
Investment Valuations – Equity securities, including restricted equity securities, are generally valued at the last sale or official closing price as reported by a third party pricing service on the market or exchange on which they are primarily traded. For securities for which there were no sales reported that day, equity securities are generally valued at the last quoted daily bid quotation as reported by a third party pricing service on the market or exchange on which they are primarily traded. For securities held short for which there were no sales reported for the day, the position is generally valued at the last quoted daily ask quotation as reported by a third party pricing service on the market or exchange on which such securities are primarily traded. Short-term instruments with a maturity at issuance of 60 days or less may be valued at amortized cost, which approximates market value. Securities and other assets generally valued on the basis of information from a third party pricing service may also be valued at a broker-dealer bid quotation. Values obtained from pricing services can utilize both dealer-supplied valuations and electronic data processing techniques, which take into account factors such as institutional-size trading in similar groups of securities, yield, quality, coupon rate, maturity, type of issue, trading characteristics, and other market data. The values of foreign securities and other assets and liabilities expressed in foreign currencies are converted to U.S. dollars using the mean of bid and asked prices for rates reported by a third party pricing service.
The Board of Trustees has delegated primary responsibility for determining or causing to be determined the value of the fund’s investments (including any fair valuation) to the adviser pursuant to valuation policies and procedures approved by the Board. If the adviser determines that reliable market quotations are not readily available, investments are valued at fair value as determined in good faith by the adviser in accordance with such procedures under the oversight of the Board of Trustees. Under the fund’s valuation policies and procedures, market quotations are not considered to be readily available for most types of debt instruments and floating rate loans and many types of derivatives. These investments are generally valued at fair value based on information from third party pricing services. In addition, investments may be valued at fair value if the adviser determines that an investment’s value has been materially affected by events occurring after the close of the exchange or market on which the investment is principally traded (such as foreign exchange or market) and prior to the determination of the fund’s net asset value, or after the halting of trading of a specific security where trading does not resume prior to the close of the exchange or market on which the security is principally traded. Events that occur on a frequent basis after foreign markets close (such as developments in foreign markets and significant movements in the U.S. markets) and prior to the determination of the fund’s net asset value may be deemed to have a material affect on the value of securities traded in foreign markets. Accordingly, the fund’s foreign equity securities may often be valued at fair value. The adviser may rely on third party pricing services or other information (such as the correlation with price movements of similar securities in the same or other markets; the type, cost and
14
Notes to Financial Statements – continued
investment characteristics of the security; the business and financial condition of the issuer; and trading and other market data) to assist in determining whether to fair value and at what value to fair value an investment. The value of an investment for purposes of calculating the fund’s net asset value can differ depending on the source and method used to determine value. When fair valuation is used, the value of investments used to determine the fund’s net asset value may differ from quoted or published prices for the same investments.
The fund adopted FASB Statement No. 157, Fair Value Measurements (the “Statement”). This Statement provides a single definition of fair value, a hierarchy for measuring fair value and expanded disclosures about fair value measurements.
Various inputs are used in determining the value of the fund’s assets or liabilities carried at market value. These inputs are categorized into three broad levels. Level 1 includes quoted prices in active markets for identical assets or liabilities. Level 2 includes other significant observable market-based inputs (including quoted prices for similar securities, interest rates, prepayment speed, and credit risk). Level 3 includes unobservable inputs, which may include the adviser’s own assumptions in determining the fair value of investments. Other financial instruments are derivative instruments not reflected in total investments, such as futures, forwards, swap contracts and written options. The following is a summary of the levels used as of December 31, 2008 in valuing the fund’s assets or liabilities carried at market value:
| | | | | | | | |
| | | Level 1 | | Level 2 | | Level 3 | | Total |
| Investments in Securities | | $29,439,784 | | $751,000 | | $— | | $30,190,784 |
| Other Financial Instruments | | $— | | $— | | $— | | $— |
Repurchase Agreements – The fund may enter into repurchase agreements with approved counterparties. Each repurchase agreement is recorded at cost. The fund requires that the securities collateral in a repurchase transaction be transferred to a custodian. The fund monitors, on a daily basis, the value of the collateral to ensure that its value, including accrued interest, is greater than amounts owed to the fund under each such repurchase agreement. The fund and other funds managed by Massachusetts Financial Services Company (MFS), may utilize a joint trading account for the purpose of entering into one or more repurchase agreements.
Foreign Currency Translation – Purchases and sales of foreign investments, income, and expenses are converted into U.S. dollars based upon currency exchange rates prevailing on the respective dates of such transactions or on the reporting date for foreign denominated receivables and payables. Gains and losses attributable to foreign currency exchange rates on sales of securities are recorded for financial statement purposes as net realized gains and losses on investments. Gains and losses attributable to foreign exchange rate movements on receivables, payables, income and expenses are recorded for financial statement purposes as foreign currency transaction gains and losses. That portion of both realized and unrealized gains and losses on investments that results from fluctuations in foreign currency exchange rates is not separately disclosed.
Security Loans – State Street Bank and Trust Company (“State Street”), as lending agent, may loan the securities of the fund to certain qualified institutions (the “Borrowers”) approved by the fund. The loans are collateralized by cash and/or U.S. Treasury and federal agency obligations in an amount typically at least equal to the market value of the securities loaned. State Street provides the fund with indemnification against Borrower default. The fund bears the risk of loss with respect to the investment of cash collateral. On loans collateralized by cash, the cash collateral is invested in a money market fund or short-term securities. A portion of the income generated upon investment of the collateral is remitted to the Borrowers, and the remainder is allocated between the fund and the lending agent. On loans collateralized by U.S. Treasury and/or federal agency obligations, a fee is received from the Borrower, and is allocated between the fund and the lending agent. Income from securities lending is separately reported on the Statement of Operations. The dividend and interest income earned on the securities loaned is accounted for in the same manner as other dividend and interest income. At December 31, 2008 there were no securities on loan.
Indemnifications – Under the fund’s organizational documents, its officers and trustees may be indemnified against certain liabilities and expenses arising out of the performance of their duties to the fund. Additionally, in the normal course of business, the fund enters into agreements with service providers that may contain indemnification clauses. The fund’s maximum exposure under these agreements is unknown as this would involve future claims that may be made against the fund that have not yet occurred.
Investment Transactions and Income – Investment transactions are recorded on the trade date. Interest income is recorded on the accrual basis. All premium and discount is amortized or accreted for financial statement purposes in accordance with U.S. generally accepted accounting principles. Dividends received in cash are recorded on the ex-dividend date. Certain dividends from foreign securities will be recorded when the fund is informed of the dividend if such information is obtained subsequent to the ex-dividend date. Dividend and interest payments received in additional securities are recorded on the ex-dividend or ex-interest date in an amount equal to the value of the security on such date. The fund may receive proceeds from litigation settlements. Any proceeds received from litigation involving portfolio holdings are reflected in the Statement of Operations in realized gain/loss if the security has been disposed of by the fund or in unrealized gain/loss if the security is still held by the fund. Any other proceeds from litigation not related to portfolio holdings are reflected as other income in the Statement of Operations.
15
Notes to Financial Statements – continued
Fees Paid Indirectly – The fund’s custody fee may be reduced according to an arrangement that measures the value of cash deposited with the custodian by the fund. This amount, for the year ended December 31, 2008, is shown as a reduction of total expenses on the Statement of Operations.
Tax Matters and Distributions – The fund intends to qualify as a regulated investment company, as defined under Subchapter M of the Internal Revenue Code, and to distribute all of its taxable income, including realized capital gains. As a result, no provision for federal income tax is required. Each of the fund’s federal tax returns for the prior three fiscal years remains subject to examination by the Internal Revenue Service. Foreign taxes, if any, have been accrued by the fund in the accompanying financial statements.
Distributions to shareholders are recorded on the ex-dividend date. Income and capital gain distributions are determined in accordance with income tax regulations, which may differ from U.S. generally accepted accounting principles. Certain capital accounts in the financial statements are periodically adjusted for permanent differences in order to reflect their tax character. These adjustments have no impact on net assets or net asset value per share. Temporary differences which arise from recognizing certain items of income, expense, gain or loss in different periods for financial statement and tax purposes will reverse at some time in the future. Distributions in excess of net investment income or net realized gains are temporary overdistributions for financial statement purposes resulting from differences in the recognition or classification of income or distributions for financial statement and tax purposes.
Book/tax differences primarily relate to wash sale loss deferrals.
The tax character of distributions declared to shareholders for the last two fiscal years is as follows:
| | | | | |
| | | 12/31/08 | | 12/31/07 | |
| Ordinary income (including any short-term capital gains) | | $— | | $19,627 | (1) |
| | (1) | Included in fund’s distributions from ordinary income is $516 in excess of investment company taxable income. | |
The federal tax cost and the tax basis components of distributable earnings were as follows:
| | | |
| As of 12/31/08 | | | |
| Cost of investments | | $39,500,969 | |
| Gross appreciation | | 1,207,629 | |
| Gross depreciation | | (10,517,814 | ) |
| Net unrealized appreciation (depreciation) | | $(9,310,185 | ) |
| Undistributed ordinary income | | 11,707 | |
| Capital loss carryforwards | | (33,333,843 | ) |
| Other temporary differences | | (37,771 | ) |
As of December 31, 2008, the fund had capital loss carryforwards available to offset future realized gains. Such losses expire as follows:
| | | |
| 12/31/10 | | $(17,325,087 | ) |
| 12/31/16 | | (16,008,756 | ) |
| | $(33,333,843 | ) |
Multiple Classes of Shares of Beneficial Interest – The fund offers multiple classes of shares, which differ in their respective distribution fees. The fund’s income, realized and unrealized gain (loss), and common expenses are allocated to shareholders based on the daily net assets of each class. Dividends are declared separately for each class. Differences in per share dividend rates are generally due to differences in separate class expenses.
| (3) | | Transactions with Affiliates |
Investment Adviser – The fund has an investment advisory agreement with MFS to provide overall investment management and related administrative services and facilities to the fund. The management fee is computed daily and paid monthly at the following annual rates:
| | |
| First $1 billion of average daily net assets | | 0.75% |
| Average daily net assets in excess of $1 billion | | 0.70% |
The investment adviser has agreed in writing to reduce its management fee to 0.65% of average daily net assets in excess of $2.5 billion. This written agreement will continue until April 30, 2010. For the year ended December 31, 2008, the fund’s average daily net assets did not exceed $2.5 billion and therefore, the management fee was not reduced. The management fee incurred for the year ended December 31, 2008 was equivalent to an annual effective rate of 0.75% of the fund’s average daily net assets.
16
Notes to Financial Statements – continued
Distributor – MFS Fund Distributors, Inc. (MFD), a wholly-owned subsidiary of MFS, is the distributor of shares of the fund. The Trustees have adopted a distribution plan for the Service Class shares pursuant to Rule 12b-1 under the Investment Company Act of 1940.
The fund’s distribution plan provides that the fund will pay MFD distribution fees equal to 0.25% per annum of its average daily net assets attributable to Service Class shares as partial consideration for services performed and expenses incurred by MFD and financial intermediaries in connection with the sale and distribution of the fund’s Service Class shares and the sale and distribution of the variable annuity or variable life insurance contracts investing indirectly in Service Class shares. MFD may subsequently pay all, or a portion, of the distribution fees to financial intermediaries.
Shareholder Servicing Agent – MFS Service Center, Inc. (MFSC), a wholly-owned subsidiary of MFS, has contracted to provide transfer agent and recordkeeping functions in connection with the issuance, transfer, and redemption of each class of shares of the fund under a Shareholder Servicing Agent Agreement. During the year ended December 31, 2008, the fund did not pay MFSC a fee for this service
Administrator – MFS provides certain financial, legal, shareholder communications, compliance, and other administrative services to the fund. Under an administrative services agreement, the fund partially reimburses MFS the costs incurred to provide these services. The fund is charged an annual fixed amount of $10,000 plus a fee based on average daily net assets.
The administrative services fee incurred for the year ended December 31, 2008 was equivalent to an annual effective rate of 0.0285% of the fund’s average daily net assets.
Trustees’ and Officers’ Compensation – The fund pays compensation to trustees in the form of a retainer, attendance fees, and additional compensation to the Board chairperson. The fund does not pay compensation directly to officers of the fund who are also officers of the investment adviser, all of whom receive remuneration for their services to the fund from MFS. Certain officers and trustees of the fund are officers or directors of MFS, MFD, and MFSC.
Other – This fund and certain other MFS funds (the funds) have entered into services agreements (the Agreements) which provide for payment of fees by the funds to Tarantino LLC and Griffin Compliance LLC in return for the provision of services of an Independent Chief Compliance Officer (ICCO) and Assistant ICCO, respectively, for the funds. The ICCO and Assistant ICCO are officers of the funds and the sole members of Tarantino LLC and Griffin Compliance LLC, respectively. The funds can terminate the Agreements with Tarantino LLC and Griffin Compliance LLC at any time under the terms of the Agreements. MFS has agreed to bear all expenses associated with office space, other administrative support, and supplies provided to the ICCO and Assistant ICCO. For the year ended December 31, 2008, the aggregate fees paid by the fund to Tarantino LLC and Griffin Compliance LLC were $487 and are included in miscellaneous expense on the Statement of Operations.
Purchases and sales of investments, other than U.S. Government securities, purchased option transactions, and short-term obligations, aggregated $54,311,856 and $69,686,651, respectively.
| (5) | | Shares of Beneficial Interest |
The fund’s Declaration of Trust permits the Trustees to issue an unlimited number of full and fractional shares of beneficial interest. Transactions in fund shares were as follows:
| | | | | | | | | | | | |
| | | Year ended 12/31/08 | | | Year ended 12/31/07 | |
| | | Shares | | | Amount | | | Shares | | | Amount | |
| Shares sold | | | | | | | | | | | | |
Initial Class | | 373,591 | | | $1,559,371 | | | 389,149 | | | $2,594,560 | |
Service Class | | 1,019,185 | | | 3,755,838 | | | 149,937 | | | 981,054 | |
| | 1,392,776 | | | $5,315,209 | | | 539,086 | | | $3,575,614 | |
| Shares issued to shareholders in reinvestment of distributions | | | | | | | | | | | | |
Initial Class | | — | | | $— | | | 2,899 | | | $19,627 | |
| Shares reacquired | | | | | | | | | | | | |
Initial Class | | (2,227,156 | ) | | $(12,493,264 | ) | | (2,445,271 | ) | | $(16,132,853 | ) |
Service Class | | (1,536,459 | ) | | (8,227,013 | ) | | (1,240,919 | ) | | (8,143,852 | ) |
| | (3,763,615 | ) | | $(20,720,277 | ) | | (3,686,190 | ) | | $(24,276,705 | ) |
| Net change | | | | | | | | | | | | |
Initial Class | | (1,853,565 | ) | | $(10,933,893 | ) | | (2,053,223 | ) | | $(13,518,666 | ) |
Service Class | | (517,274 | ) | | (4,471,175 | ) | | (1,090,982 | ) | | (7,162,798 | ) |
| | (2,370,839 | ) | | $(15,405,068 | ) | | (3,144,205 | ) | | $(20,681,464 | ) |
17
Notes to Financial Statements – continued
The fund and other funds managed by MFS participate in a $1 billion unsecured committed line of credit provided by a syndication of banks under a credit agreement. In addition, the fund and other funds managed by MFS have established uncommitted borrowing arrangements with certain banks. Borrowings may be made for temporary financing needs. Interest is charged to each fund, based on its borrowings, generally at a rate equal to the Federal Reserve funds rate plus 0.30%. In addition, a commitment fee, based on the average daily, unused portion of the committed line of credit, is allocated among the participating funds at the end of each calendar quarter. For the year ended December 31, 2008, the fund’s commitment fee and interest expense were $263 and $0, respectively, and are included in miscellaneous expense on the Statement of Operations.
18
REPORT OF INDEPENDENT REGISTERED PUBLIC ACCOUNTING FIRM
To the Board of Trustees of MFS Variable Insurance Trust II and the Shareholders of
MFS Mid Cap Growth Portfolio:
We have audited the accompanying statement of assets and liabilities, including the portfolio of investments, of MFS Mid Cap Growth Portfolio (the “Fund”) (one of the portfolios comprising MFS Variable Insurance Trust II) as of December 31, 2008, and the related statement of operations for the year then ended, the statements of changes in net assets for each of the two years in the period then ended, and the financial highlights for each of the five years in the period then ended. These financial statements and financial highlights are the responsibility of the Fund’s management. Our responsibility is to express an opinion on these financial statements and financial highlights based on our audits.
We conducted our audits in accordance with the standards of the Public Company Accounting Oversight Board (United States). Those standards require that we plan and perform the audit to obtain reasonable assurance about whether the financial statements and financial highlights are free of material misstatement. The Fund is not required to have, nor were we engaged to perform, an audit of its internal control over financial reporting. Our audits included consideration of internal control over financial reporting as a basis for designing audit procedures that are appropriate in the circumstances, but not for the purpose of expressing an opinion on the effectiveness of the Fund’s internal control over financial reporting. Accordingly, we express no such opinion. An audit also includes examining, on a test basis, evidence supporting the amounts and disclosures in the financial statements, assessing the accounting principles used and significant estimates made by management, as well as evaluating the overall financial statement presentation. Our procedures included confirmation of securities owned as of December 31, 2008, by correspondence with the custodian and brokers; where replies were not received from brokers, we performed other auditing procedures. We believe that our audits provide a reasonable basis for our opinion.
In our opinion, the financial statements and financial highlights referred to above present fairly, in all material respects, the financial position of MFS Mid Cap Growth Portfolio as of December 31, 2008, the results of its operations for the year then ended, the changes in its net assets for each of the two years in the period then ended, and the financial highlights for each of the five years in the period then ended, in conformity with accounting principles generally accepted in the United States of America.
DELOITTE & TOUCHE LLP
Boston, Massachusetts
February 19, 2009
19
TRUSTEES AND OFFICERS – IDENTIFICATION AND BACKGROUND
The Trustees and officers of the Trust, as of February 1, 2009, are listed below, together with their principal occupations during the past five years. (Their titles may have varied during that period.) The address of each Trustee and officer is 500 Boylston Street, Boston, Massachusetts 02116.
| | | | | | |
Name, Date of Birth | | Position(s) Held
with Fund | | Trustee/Officer
Since (1) | | Principal Occupations During the Past Five Years and
Other Directorships (2) |
| INTERESTED TRUSTEE | | | | |
David D. Horn (3) (born 6/07/41) | | Trustee | | April 1986 | | Private investor; Sun Life Assurance Company of Canada, Senior Vice President and General Manager for the United States (until 1997); Director (until March 2004) |
| | |
| INDEPENDENT TRUSTEES | | | | |
J. Kermit Birchfield (born 1/08/40) | | Chairman | | May 1997 | | Consultant; Century Partners, Inc. (investments), Director; Displaytech, Inc. (technology), Director; Dessin Fournir LLC (furniture manufacturer), Director (2005 to present); Intermountain Gas Company, Inc. & Intermountain Industries, Inc. (oil & gas exploration and production), Director; Site Watch LLC (software to monitor oil tanks), Managing Director (2006 to present); Juridica Investments (fund investing in judicial matters), Director (2007 to present); HPSC, Inc. (medical financing), Director (until January 2004) |
| | | |
Robert C. Bishop (born 1/13/43) | | Trustee | | May 2001 | | AutoImmune, Inc. (pharmaceutical product development), Chairman, President and Chief Executive Officer; Caliper Life Sciences Corp. (laboratory analytical instruments), Director; Millipore Corporation (purification/filtration products), Director; Waterstreet Capital (leverage buyouts), Advisory Board (August 2006 to present); Optobionics Corporation (ophthalmic devices), Director (2002 to 2007) |
| | | |
Frederick H. Dulles (born 3/12/42) | | Trustee | | May 2001 | | Ten State International Law PLLC (law firm), Of Counsel (since 2006); Prudential Carolina Real Estate, (real estate), Broker (since 2006); Free Enterprise Foundation, Inc. (research institute), Director & Secretary (until 2008); Disher, Hamrick & Myers Residential, Inc. (real estate) Broker (2005 until 2006); Frederick H. Dulles law practice (until 2006); Ten State Street LLP (law firm), Member (until 2005) |
| | | |
Marcia A. Kean (born 6/30/48) | | Trustee | | April 2005 | | Feinstein Kean Healthcare (consulting), Chief Executive Officer |
| | | |
Ronald G. Steinhart (born 6/15/40) | | Trustee | | May 2001 | | Private investor; Penske Automotive Group (automotive retailer), Director; Animal Health International, Inc. (animal health products), Director (since 2007); Texas Industries (concrete/aggregates/cement), Director (since 2007); Penson Worldwide, Inc. (securities clearance), Director (since 2006); Carreker Corporation (technology consulting) Director (until 2005); Prentiss Properties Trust (real estate investment trust), Director (until 2006) |
| | | |
Haviland Wright (born 7/21/48) | | Trustee | | May 2001 | | Profitability of Hawaii (software), Chief Development Officer (since December 2008); Elixir Technologies Corporation (software) Director (since 2005); Nano Loa Inc. (liquid crystal displays), Director |
| | |
| TRUSTEE EMERITUS | | | | |
Samuel Adams (born 10/19/25) | | Trustee Emeritus | | | | Retired; K&L Gates LLP (law firm), Of Counsel |
| | |
| OFFICERS | | | | |
Maria F. Dwyer (4) (born 12/01/58) | | President | | November 2005 | | Massachusetts Financial Services Company, Executive Vice President and Chief Regulatory Officer (since March 2004) Chief Compliance Officer (since December 2006); Fidelity Management & Research Company, Vice President (prior to March 2004); Fidelity Group of Funds, President and Treasurer (until March 2004) |
| | | |
Christopher R. Bohane (4) (born 1/18/74) | | Assistant Secretary and Assistant Clerk | | July 2005 | | Massachusetts Financial Services Company, Vice President and Senior Counsel |
| | | |
John M. Corcoran (4) (born 4/13/65) | | Treasurer | | October 2008 | | Massachusetts Financial Services Company, Senior Vice President (since October 2008); State Street Bank and Trust (financial services provider), Senior Vice President, (until September 2008) |
| | | |
Ethan D. Corey (4) (born 11/21/63) | | Assistant Secretary and Assistant Clerk | | July 2005 | | Massachusetts Financial Services Company, Senior Vice President and Associate General Counsel (since 2004); Dechert LLP (law firm), Counsel (prior to December 2004) |
| | | |
David L. DiLorenzo (4) (born 8/10/68) | | Assistant Treasurer | | July 2005 | | Massachusetts Financial Services Company, Vice President (since June 2005); JP Morgan Investor Services, Vice President (until June 2005) |
| | | |
Timothy M. Fagan (4) (born 7/10/68) | | Assistant Secretary and Assistant Clerk | | September 2005 | | Massachusetts Financial Services Company, Vice President and Senior Counsel (since September 2005); John Hancock Advisers, LLC, Vice President, Senior Attorney and Chief Compliance Officer (until August 2005) |
20
Trustees and Officers – continued
| | | | | | |
Name, Date of Birth | | Position(s) Held
with Fund | | Trustee/Officer
Since (1) | | Principal Occupations During the Past Five Years and
Other Directorships (2) |
Mark D. Fischer (4) (born 10/27/70) | | Assistant Treasurer | | July 2005 | | Massachusetts Financial Services Company, Vice President (since May 2005); JP Morgan Investment Management Company, Vice President (until May 2005) |
Robyn L. Griffin (born 7/04/75) | | Assistant Independent Chief Compliance Officer | | August 2008 | | Griffin Compliance LLC (provider of compliance services), Principal (since August 2008); State Street Corporation (financial services provider), Mutual Fund Administration Assistant Vice President (October 2006 – July 2008); Liberty Mutual Group (insurance), Personal Market Assistant Controller (April 2006 – October 2006); Deloitte & Touche LLP (professional services firm), Senior Manager (prior to April 2006) |
Brian E. Langenfeld (4) (born 3/07/73) | | Assistant Secretary and Assistant Clerk | | May 2006 | | Massachusetts Financial Services Company, Vice President and Senior Counsel (since May 2006); John Hancock Advisers, LLC, Assistant Vice President and Counsel (until April 2006) |
Ellen Moynihan (4) (born 11/13/57) | | Assistant Treasurer | | May 1997 | | Massachusetts Financial Services Company, Senior Vice President |
Susan S. Newton (4) (born 3/07/50) | | Assistant Secretary and Assistant Clerk | | May 2005 | | Massachusetts Financial Services Company, Senior Vice President and Associate General Counsel (since April 2005); John Hancock Advisers, LLC, Senior Vice President, Secretary and Chief Legal Officer (until April 2005) |
Susan A. Pereira (4) (born 11/05/70) | | Assistant Secretary and Assistant Clerk | | July 2005 | | Massachusetts Financial Services Company, Vice President and Senior Counsel (since June 2004); Bingham McCutchen LLP (law firm), Associate (until June 2004) |
Mark N. Polebaum (4) (born 5/01/52) | | Secretary and Clerk | | February 2006 | | Massachusetts Financial Services Company, Executive Vice President, General Counsel and Secretary (since January 2006); Wilmer Cutler Pickering Hale and Dorr LLP (law firm), Partner (until January 2006) |
Frank L. Tarantino (born 3/07/44) | | Independent Chief Compliance Officer | | September 2004 | | Tarantino LLC (provider of compliance services), Principal (since June 2004); CRA Business Strategies Group (consulting services), Executive Vice President (until June 2004) |
Richard S. Weitzel (4) (born 7/16/70) | | Assistant Secretary and Assistant Clerk | | October 2007 | | Massachusetts Financial Services Company, Vice President and Assistant General Counsel (since 2004); Massachusetts Department of Business and Technology, General Counsel (until April 2004) |
James O. Yost (4) (born 6/12/60) | | Assistant Treasurer | | April 1992 | | Massachusetts Financial Services Company, Senior Vice President |
| (1) | Date first appointed to serve as Trustee/Officer of an MFS fund or a Compass variable account. Each Trustee has served continuously since appointment. |
| (2) | Directorships or trusteeships of companies required to report to the Securities and Exchange Commission (i.e., “public companies”). |
| (3) | “Interested person” of the Trust, within the meaning of the Investment Company Act of 1940 (referred to as the 1940 Act), which is the principal federal law governing investment companies like the Trust, as a result of position with Sun Life of Canada (U.S.). The address of Sun Life of Canada (U.S.) is One Sun Life Executive Park, Wellesley Hills, Massachusetts 02481. |
| (4) | “Interested person” of MFS within the meaning of the 1940 Act. The address of MFS is 500 Boylston Street, Boston, Massachusetts 02116. |
The Trust does not hold annual meetings for the purpose of electing Trustees, and Trustees are not elected for fixed terms. Each Trustee and officer holds office until his or her successor is chosen and qualified, or until his or her earlier death, resignation, retirement or removal.
All Trustees currently serve as Trustees of the Trust and have served in that capacity since originally elected or appointed. All of the Trustees are also Managers of the Compass Variable Accounts. The executive officers of the Trust hold similar offices for the Compass Variable Accounts and other funds in the MFS fund complex. As of January 1, 2009, each Trustee serves as a Trustee or Manager of 35 Accounts/Funds.
The Statement of Additional Information contains further information about the Trustees and is available without charge upon request by calling 1-800-752-7215.
The Statement of Additional Information contains further information about the Trustees and is available without charge upon request by calling 1-800-225-2606.
| | |
Investment Adviser
Massachusetts Financial Services Company 500 Boylston Street, Boston, MA 02116-3741 | | Custodian State Street Bank and Trust 1 Lincoln Street, Boston, MA 02111-2900 |
Distributor
MFS Fund Distributors, Inc. 500 Boylston Street, Boston, MA 02116-3741 | | Independent Registered Public Accounting Firm Deloitte & Touche LLP 200 Berkeley Street, Boston, MA 02116 |
Portfolio Managers David DeGroff Eric Fischman | | |
21
BOARD REVIEW OF INVESTMENT ADVISORY AGREEMENT
The Investment Company Act of 1940 requires that both the full Board of Trustees and a majority of the non-interested (“independent”) Trustees, voting separately, annually approve the continuation of the investment advisory agreement between MFS Variable Insurance Trust II (the “Trust”) and Massachusetts Financial Services Company (“MFS”) on behalf of the Fund. The Trustees consider matters bearing on the Fund and the advisory arrangements at their meetings throughout the year, including a review of performance data at each regular meeting. In addition, the independent Trustees met in May and again in July 2008 (“contract review meetings”) for the specific purpose of considering whether to approve the continuation of the investment advisory agreement for the Fund. The independent Trustees were assisted in their evaluation of the investment advisory agreement by independent legal counsel, from whom they received separate legal advice and with whom they met separately from MFS management during various contract review meetings. The independent Trustees were also assisted in this process by the Fund’s Independent Chief Compliance Officer, a full-time senior officer appointed by and reporting to the independent Trustees.
In connection with their deliberations, the Trustees, including the independent Trustees, considered such information and factors as they believed, in light of the legal advice furnished to them and their own business judgment, to be relevant. The investment advisory agreement was considered separately for the Fund, although the Trustees also took into account the common interests of all Funds in the Trust in their review. As described below, the Trustees considered the nature, quality, and extent of the various investment advisory, administrative, and shareholder services performed by MFS under the existing investment advisory agreement and other arrangements with the Trust.
In connection with their contract review meetings, the Trustees received and relied upon materials which included, among other items: (i) information provided by Lipper Inc. on the investment performance of the Fund for various time periods ended December 31, 2007, compared to the investment performance of a group of funds with substantially similar investment classifications/objectives (the “Lipper performance universe”), (ii) information provided by Lipper Inc. on the Fund’s advisory fees and other expenses compared to the advisory fees and other expenses of comparable funds identified by Lipper (the “Lipper expense group”), (iii) information provided by MFS on the advisory fees of comparable portfolios of its other clients, including institutional separate account and other clients, (iv) information as to whether expense waivers, reimbursements or fee “breakpoints” are observed for the Fund, (v) information regarding MFS’ financial results and financial condition, including MFS’ and certain of its affiliates’ estimated profitability from services performed for the Fund, (vi) MFS’ views regarding the outlook for the mutual fund industry and its strategic business plans, (vii) descriptions of various functions performed by MFS for the Trust, such as compliance monitoring and portfolio trading practices, and (viii) information regarding the overall organization of MFS, including information about MFS’ senior management and other personnel providing investment advisory, administrative and other services to the Fund. The comparative performance, fee and expense information prepared and provided by Lipper Inc. was not independently verified, and the independent Trustees did not independently verify any information provided to them by MFS.
The Trustees’ conclusion as to the continuation of the investment advisory agreement was based on comprehensive consideration of all information provided to the Trustees and not the result of any single factor. Some of the factors that figured particularly in the Trustees’ deliberations are described below for the Fund, while individual Trustees may have given different weight to various factors and evaluated the information presented as a whole differently than another Trustee. The Trustees recognized that the fee arrangements for the Fund reflect years of review and discussion between the independent Trustees and MFS, that certain aspects of such arrangements may receive greater scrutiny in some years than others, and that the Trustees’ conclusions may be based, in part, on their consideration of these same arrangements during the course of the year and in prior years.
Based on information provided by Lipper Inc., the Trustees compared the Fund’s total return investment performance to the performance of a peer group of funds over various time periods. The Trustees placed particular emphasis on the total return performance of the Fund’s Initial Class shares in comparison to the performance of funds in its Lipper performance universe over the one-, three- and five-year periods. The Trustees did not rely on performance results for more recent periods, including those shown elsewhere in this report.
The Trustees noted the performance of the Fund’s Initial Class shares was in the 4th quintile relative to the other funds in the Lipper Classification Index for the one-year period (the 1st quintile being the best performers and the 5th quintile being the worst performers). The total return performance of the Fund was in the 5th quintile for the three-year period and the five-year period ended December 31, 2007, relative to the Lipper performance universe. Based on the nature and quality of services provided by MFS and MFS’ explanation of steps taken to improve performance, the Board of Trustees concluded that the Fund’s performance was adequate.
In the course of their deliberations, the Trustees took into account information provided by MFS during contract review meetings, as well as during investment review meetings conducted with portfolio management personnel during the course of the year.
22
Board Review of Investment Advisory Agreement – continued
In assessing the reasonableness of the Fund’s advisory fee, the Trustees considered, among other information, the Fund’s advisory fee and the total expense ratio of the Fund’s Initial Class shares as a percentage of average daily net assets, compared to the advisory fee and total expense ratios of its peer group of funds based on information provided by Lipper Inc. The Trustees also considered the advisory fees charged by MFS to institutional accounts. In comparing these fees, the Trustees considered the generally broader scope of services provided by MFS to the Trust than those provided to institutional accounts. The Trustees also considered the higher demands placed on MFS’ investment personnel and trading infrastructure as a result of the daily cash in-flows and out-flows of the Fund, and the impact on MFS and related expenses due to the more extensive regulatory regime to which the Fund is subject, compared to institutional accounts.
In considering the fees, the Trustees noted from the Lipper data that the Fund’s effective advisory fee rate was approximately at the median and total expense ratio was below the median of such fees and expenses of funds in the Lipper expense group. The Trustees further noted that MFS agreed to continue to reduce its advisory fee on average daily net assets over $2.5 billion, and concluded that the existing breakpoints were sufficient to allow the Fund to benefit from economies of scale as its assets grow. The Trustees concluded that the fees were reasonable in light of the nature and quality of services provided.
The Trustees also considered information prepared by MFS relating to its costs and profits with respect to the Fund and other investment companies and accounts advised by MFS, as well as MFS’ methodologies used to determine and allocate its costs to the Fund and other accounts and products for purposes of estimating profitability.
After reviewing these and other factors described below, the Trustees concluded that the advisory fees charged to the Fund represent reasonable compensation in light of the nature and quality of the services being provided by MFS.
In addition, the Trustees considered MFS’ resources and related efforts to continue to retain, attract and motivate capable personnel to serve the Fund. The Trustees also considered the financial resources of MFS and its parent, Sun Life Financial Inc. The Trustees further considered any advantages and possible disadvantages of having an adviser which also serves other investment companies as well as institutional accounts.
The Trustees also considered the nature, quality, cost, and extent of administrative, transfer agency, and distribution services provided to the Fund by MFS and its affiliates under agreements and plans other than the investment advisory agreement, including the 12b-1 fees the Fund pays to MFS Fund Distributors, Inc., an affiliate of MFS. The Trustees also considered the nature, extent and quality of certain other services MFS performs or arranges on the Fund’s behalf, which may include securities lending programs, directed expense payment programs, class action recovery programs, and MFS’ interaction with third-party service providers, principally custodians and sub-custodians. The Trustees concluded that the various non-advisory services provided by MFS and its affiliates on behalf of the Fund were satisfactory. The Trustees also considered the benefits to MFS from the use of the Fund’s portfolio brokerage commissions to pay for research and other similar services and various other factors. Additionally, the Trustees considered so-called “fall-out benefits” to MFS such as reputational value derived from serving as investment manager to the Trust, and determined that any such benefits derived by MFS were reasonable and fair.
Based on their evaluation of factors that they deemed to be material, including those factors described above, the Board of Trustees, including a majority of the independent Trustees, concluded that the investment advisory agreement should be continued for an additional one-year period, commencing September 1, 2008.
A discussion regarding the Board’s most recent review and renewal of the fund’s Investment Advisory Agreement with MFS is available by clicking on the fund’s name under “Variable Insurance Portfolios-VIT II” in the “Products & Performance” section on the MFS Web site (mfs.com).
23
PROXY VOTING POLICIES AND INFORMATION
A general description of the MFS funds’ proxy voting policies and procedures is available without charge, upon request, by calling 1-800-225-2606, by visiting the Proxy Voting section of mfs.com or by visiting the SEC’s Web site at http://www.sec.gov.
Information regarding how the fund voted proxies relating to portfolio securities during the most recent twelve-month period ended June 30 is available without charge by visiting the Proxy Voting section of mfs.com or by visiting the SEC’s Web site at http://www.sec.gov.
QUARTERLY PORTFOLIO DISCLOSURE
The fund will file a complete schedule of portfolio holdings with the Securities and Exchange Commission (the Commission) for the first and third quarters of each fiscal year on Form N-Q. The fund’s Form N-Q may be reviewed and copied at the:
Public Reference Room
Securities and Exchange Commission
100 F Street, NE, Room 1580
Washington, D.C. 20549
Information on the operation of the Public Reference Room may be obtained by calling the Commission at 1-800-SEC-0330. The fund’s Form N-Q is available on the EDGAR database on the Commission’s Internet Web site at http://www.sec.gov, and copies of this information may be obtained, upon payment of a duplicating fee, by electronic request at the following e-mail address: publicinfo@sec.gov or by writing the Public Reference Section at the above address.
24
MFS® PRIVACY NOTICE
Privacy is a concern for every investor today. At MFS Investment Management® and the MFS funds, we take this concern very seriously. We want you to understand our policies about the investment products and services that we offer, and how we protect the nonpublic personal information of investors who have a direct relationship with us and our wholly owned subsidiaries.
Throughout our business relationship, you provide us with personal information. We maintain information and records about you, your investments, and the services you use. Examples of the nonpublic personal information we maintain include
| | Ÿ | | data from investment applications and other forms |
| | Ÿ | | share balances and transactional history with us, our affiliates, or others |
| | Ÿ | | facts from a consumer reporting agency |
We do not disclose any nonpublic personal information about our customers or former customers to anyone, except as permitted by law. We may share nonpublic personal information with third parties or certain of our affiliates in connection with servicing your account or processing your transactions. We may share information with companies or financial institutions that perform marketing services on our behalf or with other financial institutions with which we have joint marketing arrangements, subject to any legal requirements.
Authorization to access your nonpublic personal information is limited to appropriate personnel who provide products, services, or information to you. We maintain physical, electronic, and procedural safeguards to help protect the personal information we collect about you.
If you have any questions about the MFS privacy policy, please call 1-800-225-2606 any business day between 8 a.m. and 8 p.m. Eastern time.
Note: If you own MFS products or receive MFS services in the name of a third party such as a bank or broker-dealer, their privacy policy may apply to you instead of ours.
25


MFS® CAPITAL APPRECIATION PORTFOLIO
The report is prepared for the general information of contract owners. It is authorized for distribution to prospective investors only when preceded or accompanied by a current prospectus.
NOT FDIC INSURED Ÿ MAY LOSE VALUE Ÿ NO BANK GUARANTEE Ÿ NOT A DEPOSIT Ÿ NOT INSURED BY ANY FEDERAL GOVERNMENT AGENCY OR NCUA/NCUSIF
LETTER FROM THE CEO

Dear Contract Owners:
The market downturns and economic setbacks of late probably rank among the worst financial declines most of us have experienced. Inevitably, people may be questioning their commitment to investing. Still, it is important to remember that downturns are an inescapable part of the business cycle. Such troughs have been seen before, and if we can use history as a guide, market recoveries typically have followed.
Recent events have clearly shown us the value of certain types of investments. In this environment, two of the hallmarks of mutual funds — transparency and liquidity — have become critically important. Unlike some other types of investments, the operations of mutual funds are relatively transparent to their shareholders. With their daily redemption feature, mutual funds also generally provide easy, convenient access to one’s money. Through these recent market upheavals, this level of liquidity enhanced the ability of mutual fund investors to respond and modify their investments as they and their advisors saw fit — a flexibility that those in less liquid investments simply did not have at their disposal.
At MFS® we take particular pride in how well mutual funds can serve investors because we invented the mutual fund in the United States. Established in 1924, Massachusetts Investors Trust was the nation’s first fund. Recent market events only reinforce what we have learned through 85 years — that mutual funds provide unique features that are important to investors in any type of market climate.
Respectfully,

Robert J. Manning
Chief Executive Officer and Chief Investment Officer
MFS Investment Management®
February 17, 2009
The opinions expressed in this letter are subject to change, may not be relied upon for investment advice, and no forecasts can be guaranteed.
Before investing, consider the fund’s investment objectives, risks, charges, and expenses. For a prospectus containing this and other information, contact your investment professional or view online. Read it carefully.
MFS Fund Distributors, Inc., 500 Boylston Street, Boston, MA 02116
1
PORTFOLIO COMPOSITION
Portfolio structure
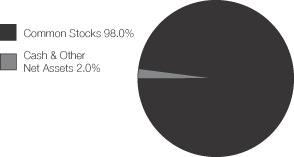
| | |
| Top ten holdings | | |
| Oracle Corp. | | 4.1% |
| Cisco Systems, Inc. | | 3.1% |
| CVS Caremark Corp. | | 3.0% |
| United Technologies Corp. | | 2.8% |
| Accenture Ltd. | | 2.8% |
| Danaher Corp. | | 2.8% |
| PepsiCo, Inc. | | 2.7% |
| Google, Inc., “A” | | 2.6% |
| Genzyme Corp. | | 2.6% |
| MasterCard, Inc., “A” | | 2.3% |
| | |
| Equity sectors | | |
| Technology | | 23.6% |
| Health Care | | 18.8% |
| Special Products & Services | | 10.1% |
| Consumer Staples | | 9.7% |
| Energy | | 8.1% |
| Retailing | | 7.6% |
| Industrial Goods & Services | | 7.0% |
| Financial Services | | 4.3% |
| Leisure | | 3.5% |
| Basic Materials | | 3.4% |
| Utilities & Communications | | 1.4% |
| Transportation | | 0.5% |
Percentages are based on net assets as of 12/31/08.
The portfolio is actively managed and current holdings may be different.
2
MANAGEMENT REVIEW
Summary of Results
For the twelve months ended December 31, 2008, Initial Class shares of the MFS Capital Appreciation Portfolio (the “fund”) provided a total return of –37.02%, while Service Class shares of the fund provided a total return of –37.22%. These compare with a return of
–38.44% for the fund’s benchmark, the Russell 1000 Growth Index.
Market Environment
The U.S. economy and financial markets experienced significant deterioration and extraordinary volatility over the reporting period. U.S. economic growth slowed significantly, despite the short-term bounce from the second quarter fiscal stimulus. Strong domestic headwinds included accelerated deterioration in the housing market, anemic corporate investment, a rapidly declining job market, and a much tighter credit environment. During the period, a seemingly continuous series of tumultuous financial events hammered markets, including: the distressed sale of failing Bear Stearns to JPMorgan, the conservatorship of Government Sponsored Enterprises (GSEs) Fannie Mae and Freddie Mac, the bankruptcy of investment bank Lehman Brothers, the Federal Reserve Bank’s complex intervention of insurance company American International Group (AIG), the nationalization of several large European banks, the failure of Washington Mutual, and the distressed sale of Wachovia. As a result of this barrage of turbulent news, global equity markets pushed significantly lower and credit markets witnessed the worst dislocation since the beginning of the credit crisis. Though conditions improved towards the end of the period, the state of financial and macroeconomic dislocation remained severe.
While reasonably resilient during the first half of the period, the global economy and financial system increasingly experienced considerable negative spillovers from the U.S. slowdown. Not only did Europe and Japan show obvious signs of economic softening, the more powerful engine of global growth – emerging markets – also displayed weakening dynamics.
During the reporting period, the U.S. Federal Reserve Board cut interest rates aggressively and introduced a multitude of new lending facilities to alleviate ever-tightening credit markets, while the U.S. federal government moved quickly to design and implement a meaningful fiscal stimulus package. Although several other global central banks also cut rates, the dilemma of rising energy and food prices heightened concerns among central bankers that inflationary expectations might become unhinged despite weaker growth. Only later in the reporting period did slowing global growth result in a very precipitous decline in commodity prices, which significantly eased inflation and inflationary expectations. As inflationary concerns diminished in the face of global deleveraging, and equity and credit markets deteriorated more sharply, a coordinated rate cut marked the beginning of much more aggressive easing by the major global central banks.
Contributors to Performance
Security selection in the industrial goods and services sector contributed to the fund’s performance relative to the Russell 1000 Growth Index. Facilities maintenance products supplier W.W. Grainger was among the fund’s top relative contributors.
A combination of stock selection and an underweighted position in the energy sector also boosted relative results, although no individual stocks within this sector were among the fund’s top relative contributors for the reporting period.
The fund’s holdings in several individual health care stocks also had a positive impact on relative performance. These included pharmaceutical company Wyeth, pharmaceutical and diagnostic company Roche Holding (aa) (Switzerland), diversified medical products maker Johnson & Johnson, and global biotechnology company Genzyme. Shares of Genzyme performed better than the sector overall due to strong sales growth in its drug products, particularly a significant jump in the latter part of the reporting period in sales of its rare genetic disorder drug Myozyme.
Securities in other sectors that aided relative returns included enterprise software products maker Oracle, semiconductor manufacturer Taiwan Semiconductor (aa), and food companies, Nestle (Switzerland) (aa) and General Mills (g). Stock price of General Mills appreciated during the period as the company reported positive results that were, in part, due to strong demands for its innovative products and the company’s ability to contain costs.
The fund’s cash position was also a contributor to relative performance. The fund holds cash to buy new holdings and to provide liquidity. In a period when equity markets declined, as measured by the fund’s benchmark, holding cash helped performance versus the benchmark, which has no cash position.
Detractors from Performance
Stock selection in the leisure sector was the principal detractor from the fund’s relative performance. Within this sector, cruise line operator Royal Caribbean Cruises (aa)(g) was the top relative detractor. Shares of Royal Caribbean suffered during the first part of the reporting period due to high fuel costs and more recently due to weak consumer spending. Not owning positive-performing fast food giant McDonald’s also hindered relative results over the reporting period.
3
Management Review – continued
In the retailing sector, security selection dampened relative returns. Not owning retail giant Wal-Mart Stores hurt relative performance as the stock significantly outperformed the benchmark.
Security selection in the health care sector also held back relative results. The fund’s positioning in eye care products maker Advanced Medical Optics (g) detracted from relative performance as the fund held the stock during a period when the stock’s price declined. Shares of Advanced Medical Optics suffered due to a weaker revenue outlook as a result of weakness in its U.S. Lasik procedures. Demand for this relatively costly elective procedure is expected to decline during a period of economic weakness. In addition, the stock was pressured by a previously announced recall of its lens solutions products and its impact on sales. Not holding medical products maker Abbott Laboratories and strong-performing biotech firm Gilead Sciences also negatively affected relative returns.
Elsewhere, oil field services provider Weatherford International (g), Canadian wireless solutions provider Research In Motion (aa), and German stock exchange Deutsche Boerse (aa) were among the fund’s top relative detractors. Not owning tobacco company Philip Morris International, which outperformed the benchmark over the reporting period, dampened relative results.
Respectfully,
Jeffrey Constantino
Portfolio Manager
Note to Shareholders: Effective November 20, 2008, Stephen Pesek and Maureen Pettirossi are no longer portfolio managers of the fund.
| (aa) | | Security is not a benchmark constituent. |
| (g) | | Security was not held in the portfolio at period end. |
The views expressed in this report are those of the portfolio manager only through the end of the period of the report as stated on the cover and do not necessarily reflect the views of MFS or any other person in the MFS organization. These views are subject to change at any time based on market or other conditions, and MFS disclaims any responsibility to update such views. These views may not be relied upon as investment advice or an indication of trading intent on behalf of any MFS portfolio. References to specific securities are not recommendations of such securities, and may not be representative of any MFS portfolio’s current or future investments.
4
PERFORMANCE SUMMARY THROUGH 12/31/08
The following chart illustrates the historical performance of the fund in comparison to its benchmark(s). Benchmark comparisons are unmanaged; do not reflect any fees or expenses; and cannot be invested in directly. The performance of other share classes will be greater than or less than that of the class depicted below. (See Notes to Performance Summary.)
Performance data shown represents past performance and is no guarantee of future results. Investment return and principal value fluctuate so your units, when sold, may be worth more or less than the original cost; current performance may be lower or higher than quoted. The performance shown does not reflect the deduction of taxes, if any, that a contract holder would pay on fund distributions or the redemption of contract units. The returns for the fund shown also do not reflect the deduction of expenses associated with variable products, such as mortality and expense risk charges, separate account charges, and sales charges imposed by the insurance company separate accounts. Such expenses would reduce the overall returns shown.
Growth of a hypothetical $10,000 investment
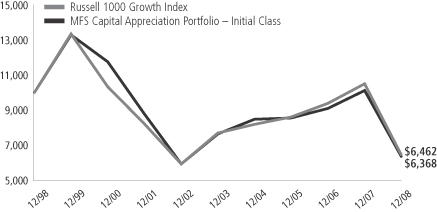
Total rates of return through 12/31/08
Average Annual Total Returns
| | | | | | | | | | | | |
| | | Share class | | Class inception date | | 1-yr | | 5-yr | | 10-yr | | |
| | | Initial Class | | 6/12/85 | | (37.02)% | | (3.56)% | | (4.41)% | | |
| | | Service Class | | 8/24/01 | | (37.22)% | | (3.81)% | | (4.59)% | | |
Comparative Benchmark
| | | | | | | | | | | | |
| | | Russell 1000 Growth Index (f) | | (38.44)% | | (3.42)% | | (4.27)% | | |
| (f) | Source: FactSet Research Systems Inc. |
Benchmark Definition
Russell 1000 Growth Index – constructed to provide a comprehensive barometer for growth securities in the large-cap segment of the U.S. equity universe. Companies in this index generally have higher price-to-book ratios and higher forecasted growth values.
It is not possible to invest directly in an index.
Notes to Performance Summary
Performance for the Service Class includes the performance of the fund’s Initial Class for periods prior to their offering. Because Service Class expenses are higher than those of Initial Class, performance shown for Service Class is higher than it would have been had it been offered for the entire period. Performance has not been adjusted to take into account differences in class specific operating expenses (such as Rule 12b-1 fees). Please see the prospectus for additional information about performance and expenses.
Performance results reflect any applicable expense subsidies and waivers in effect during the periods shown. Without such subsidies and waivers the fund’s performance results would be less favorable. Please see the prospectus for complete details. All results are historical and assume the reinvestment of any dividends and capital gains distributions.
From time to time the fund may receive proceeds from litigation settlements, without which performance would be lower.
5
EXPENSE TABLE
Fund Expenses Borne by the Contract Holders During the Period,
July 1, 2008 through December 31, 2008
As a contract holder of the fund, you incur ongoing costs, including management fees; distribution (12b-1) fees; and other fund expenses. This example is intended to help you understand your ongoing costs (in dollars) of investing in the fund and to compare these costs with the ongoing costs of investing in other mutual funds.
The example is based on an investment of $1,000 invested at the beginning of the period and held for the entire period July 1, 2008 through December 31, 2008.
Actual Expenses
The first line for each share class in the following table provides information about actual account values and actual expenses. You may use the information in this line, together with the amount you invested, to estimate the expenses that you paid over the period. Simply divide your account value by $1,000 (for example, an $8,600 account value divided by $1,000 = 8.6), then multiply the result by the number in the first line under the heading entitled “Expenses Paid During Period” to estimate the expenses you paid on your account during this period.
Hypothetical Example for Comparison Purposes
The second line for each share class in the following table provides information about hypothetical account values and hypothetical expenses based on the fund’s actual expense ratio and an assumed rate of return of 5% per year before expenses, which is not the fund’s actual return. The hypothetical account values and expenses may not be used to estimate the actual ending account balance or expenses you paid for the period. You may use this information to compare the ongoing costs of investing in the fund and other funds. To do so, compare this 5% hypothetical example with the 5% hypothetical examples that appear in the shareholder reports of the other funds.
Please note that the expenses shown in the table are meant to highlight the fund’s ongoing costs only and do not take into account the fees and expenses imposed under the variable contracts through which your investment in the fund is made. Therefore, the second line for each share class in the table is useful in comparing ongoing costs associated with an investment in vehicles (such as the fund) which fund benefits under variable annuity and variable life insurance contracts and to qualified pension and retirement plans only, and will not help you determine the relative total costs of investing in the fund through variable annuity and variable life insurance contracts. If the fees and expenses imposed under the variable contracts were included, your costs would have been higher.
| | | | | | | | | | |
| Share Class | | | | Annualized
Expense Ratio | | Beginning
Account Value
7/01/08 | | Ending
Account Value
12/31/08 | | Expenses Paid
During Period (p)
7/01/08-12/31/08 |
| Initial Class | | Actual | | 0.88% | | $1,000.00 | | $694.59 | | $3.75 |
| | Hypothetical (h) | | 0.88% | | $1,000.00 | | $1,020.71 | | $4.47 |
| Service Class | | Actual | | 1.12% | | $1,000.00 | | $693.67 | | $4.77 |
| | Hypothetical (h) | | 1.12% | | $1,000.00 | | $1,019.51 | | $5.69 |
| (h) | 5% class return per year before expenses. |
| (p) | Expenses paid is equal to each class’ annualized expense ratio, as shown above, multiplied by the average account value over the period, multiplied by the number of days in the period, divided by the number of days in the year. |
6
PORTFOLIO OF INVESTMENTS – 12/31/08
The Portfolio of Investments is a complete list of all securities owned by your fund. It is categorized by broad-based asset classes.
| | | | | |
| Issuer | | Shares/Par | | Value ($) |
| | | | | |
| COMMON STOCKS – 98.0% | | | | | |
| Aerospace – 2.8% | | | | | |
| United Technologies Corp. | | 130,180 | | $ | 6,977,644 |
| | | | | |
| Alcoholic Beverages – 1.3% | | | | | |
| Diageo PLC | | 227,490 | | $ | 3,164,506 |
| | | | | |
| Apparel Manufacturers – 2.8% | | | | | |
| LVMH Moet Hennessy Louis Vuitton S.A. | | 48,420 | | $ | 3,253,153 |
| NIKE, Inc., “B” | | 72,440 | | | 3,694,440 |
| | | | | |
| | | | $ | 6,947,593 |
| | | | | |
| Biotechnology – 2.6% | | | | | |
| Genzyme Corp. (a) | | 96,690 | | $ | 6,417,315 |
| | | | | |
| Broadcasting – 2.7% | | | | | |
| Grupo Televisa S.A., ADR | | 115,830 | | $ | 1,730,500 |
| Omnicom Group, Inc. | | 185,120 | | | 4,983,430 |
| | | | | |
| | | | $ | 6,713,930 |
| | | | | |
| Brokerage & Asset Managers – 1.3% | | | | | |
| Charles Schwab Corp. | | 82,550 | | $ | 1,334,834 |
| Deutsche Boerse AG | | 26,770 | | | 1,949,720 |
| | | | | |
| | | | $ | 3,284,554 |
| | | | | |
| Business Services – 10.1% | | | | | |
| Accenture Ltd. | | 212,570 | | $ | 6,970,170 |
| Amdocs Ltd. (a) | | 177,930 | | | 3,254,340 |
| Automatic Data Processing, Inc. | | 45,500 | | | 1,789,970 |
| Fidelity National Information Services, Inc. | | 73,430 | | | 1,194,706 |
| MasterCard, Inc., “A” | | 39,790 | | | 5,687,185 |
| Visa, Inc. | | 26,910 | | | 1,411,430 |
| Western Union Co. | | 343,830 | | | 4,930,522 |
| | | | | |
| | | | $ | 25,238,323 |
| | | | | |
| Cable TV – 0.8% | | | | | |
| Comcast Corp., “A” | | 119,530 | | $ | 2,017,666 |
| | | | | |
| Chemicals – 1.4% | | | | | |
| 3M Co. | | 62,200 | | $ | 3,578,988 |
| | | | | |
| Computer Software – 6.2% | | | | | |
| Microsoft Corp. | | 194,530 | | $ | 3,781,663 |
| Oracle Corp. (a) | | 578,750 | | | 10,261,238 |
| VeriSign, Inc. (a) | | 76,710 | | | 1,463,627 |
| | | | | |
| | | | $ | 15,506,528 |
| | | | | |
| Computer Software – Systems – 4.5% | | | | | |
| Apple, Inc. (a) | | 33,780 | | $ | 2,883,123 |
| EMC Corp. (a) | | 202,970 | | | 2,125,096 |
| Hewlett-Packard Co. | | 85,430 | | | 3,100,255 |
| International Business Machines Corp. | | 37,680 | | | 3,171,149 |
| | | | | |
| | | | $ | 11,279,623 |
| | | | | |
| Consumer Goods & Services – 3.8% | | | | | |
| Colgate-Palmolive Co. | | 64,640 | | $ | 4,430,426 |
| Procter & Gamble Co. | | 79,840 | | | 4,935,709 |
| | | | | |
| | | | $ | 9,366,135 |
| | | | | |
| | | | | |
| Issuer | | Shares/Par | | Value ($) |
| | | | | |
| COMMON STOCKS – continued | | | | | |
| Electrical Equipment – 4.2% | | | | | |
| Danaher Corp. | | 122,290 | | $ | 6,922,837 |
| W.W. Grainger, Inc. | | 44,590 | | | 3,515,476 |
| | | | | |
| | | | $ | 10,438,313 |
| | | | | |
| Electronics – 5.1% | | | | | |
| Intersil Corp., “A” | | 161,060 | | $ | 1,480,141 |
| KLA-Tencor Corp. | | 148,180 | | | 3,228,842 |
| National Semiconductor Corp. | | 308,500 | | | 3,106,595 |
| Samsung Electronics Co. Ltd., GDR | | 12,525 | | | 2,191,875 |
| Taiwan Semiconductor Manufacturing Co. Ltd., ADR | | 348,664 | | | 2,754,446 |
| | | | | |
| | | | $ | 12,761,899 |
| | | | | |
| Energy – Integrated – 5.5% | | | | | |
| Chevron Corp. | | 58,280 | | $ | 4,310,972 |
| Exxon Mobil Corp. | | 36,350 | | | 2,901,821 |
| Hess Corp. | | 57,620 | | | 3,090,737 |
| Marathon Oil Corp. | | 122,780 | | | 3,359,261 |
| | | | | |
| | | | $ | 13,662,791 |
| | | | | |
| Food & Beverages – 4.6% | | | | | |
| Groupe Danone | | 34,372 | | $ | 2,074,521 |
| Nestle S.A. | | 64,807 | | | 2,554,211 |
| PepsiCo, Inc. | | 124,160 | | | 6,800,243 |
| | | | | |
| | | | $ | 11,428,975 |
| | | | | |
| Food & Drug Stores – 3.0% | | | | | |
| CVS Caremark Corp. | | 258,272 | | $ | 7,422,737 |
| | | | | |
| General Merchandise – 0.5% | | | | | |
| Kohl’s Corp. (a) | | 37,350 | | $ | 1,352,070 |
| | | | | |
| Internet – 3.2% | | | | | |
| eBay, Inc. (a) | | 112,340 | | $ | 1,568,266 |
| Google, Inc., “A” (a) | | 21,220 | | | 6,528,333 |
| | | | | |
| | | | $ | 8,096,599 |
| | | | | |
| Major Banks – 3.0% | | | | | |
| Bank of New York Mellon Corp. | | 107,901 | | $ | 3,056,835 |
| State Street Corp. | | 115,800 | | | 4,554,414 |
| | | | | |
| | | | $ | 7,611,249 |
| | | | | |
| Medical & Health Technology & Services – 2.5% | | | |
| Medco Health Solutions, Inc. (a) | | 38,260 | | $ | 1,603,477 |
| Patterson Cos., Inc. (a) | | 146,920 | | | 2,754,750 |
| VCA Antech, Inc. (a) | | 92,050 | | | 1,829,954 |
| | | | | |
| | | | $ | 6,188,181 |
| | | | | |
| Medical Equipment – 7.7% | | | | | |
| DENTSPLY International, Inc. | | 59,600 | | $ | 1,683,104 |
| Medtronic, Inc. | | 176,570 | | | 5,547,829 |
| Stryker Corp. | | 57,070 | | | 2,279,947 |
| Thermo Fisher Scientific, Inc. (a) | | 120,750 | | | 4,113,953 |
| Waters Corp. (a) | | 89,160 | | | 3,267,714 |
| Zimmer Holdings, Inc. (a) | | 60,600 | | | 2,449,452 |
| | | | | |
| | | | $ | 19,341,999 |
| | | | | |
7
Portfolio of Investments – continued
| | | | | |
| Issuer | | Shares/Par | | Value ($) |
| | | | | |
| COMMON STOCKS – continued | | | | | |
| Metals & Mining – 0.8% | | | | | |
| BHP Billiton Ltd., ADR | | 46,790 | | $ | 2,007,291 |
| | | | | |
| Network & Telecom – 3.7% | | | | | |
| Cisco Systems, Inc. (a) | | 471,020 | | $ | 7,677,626 |
| Research in Motion Ltd. (a) | | 39,530 | | | 1,604,127 |
| | | | | |
| | | | $ | 9,281,753 |
| | | | | |
| Oil Services – 2.6% | | | | | |
| Halliburton Co. | | 183,030 | | $ | 3,327,485 |
| Noble Corp. | | 90,280 | | | 1,994,285 |
| Schlumberger Ltd. | | 29,100 | | | 1,231,803 |
| | | | | |
| | | | $ | 6,553,573 |
| | | | | |
| Personal Computers & Peripherals – 0.9% | | | |
| NetApp, Inc. (a) | | 153,280 | | $ | 2,141,322 |
| | | | | |
| Pharmaceuticals – 6.0% | | | | | |
| Allergan, Inc. | | 110,430 | | $ | 4,452,538 |
| Johnson & Johnson | | 60,180 | | | 3,600,569 |
| Merck KGaA | | 28,410 | | | 2,582,967 |
| Roche Holding AG | | 19,050 | | | 2,932,437 |
| Wyeth | | 39,980 | | | 1,499,650 |
| | | | | |
| | | | $ | 15,068,161 |
| | | | | |
| Specialty Chemicals – 1.2% | | | | | |
| Praxair, Inc. | | 51,210 | | $ | 3,039,826 |
| | | | | |
| Specialty Stores – 1.3% | | | | | |
| Staples, Inc. | | 178,640 | | $ | 3,201,229 |
| | | | | |
| | | | | |
| Issuer | | Shares/Par | | Value ($) |
| | | | | |
| COMMON STOCKS – continued | | | | | |
| Telecommunications – Wireless – 1.4% | | | |
| America Movil S.A.B. de C.V., “L”, ADR | | 61,000 | | $ | 1,890,390 |
| Rogers Communications, Inc., “B” | | 51,730 | | | 1,556,038 |
| | | | | |
| | | | $ | 3,446,428 |
| | | | | |
| Trucking – 0.5% | | | | | |
| United Parcel Service, Inc., “B” | | 22,280 | | $ | 1,228,965 |
| | | | | |
Total Common Stocks
(Identified Cost, $320,124,379) | | | | $ | 244,766,166 |
| | | | | |
| | |
| Money Market Funds (v) – 1.7% | | | | | |
| MFS Institutional Money Market Portfolio, 0.37%, at Cost and Net Asset Value | | 4,249,723 | | $ | 4,249,723 |
| | | | | |
Total Investments
(Identified Cost, $324,374,102) | | | | $ | 249,015,889 |
| | | | | |
OTHER ASSETS, LESS
LIABILITIES – 0.3% | | | | | 803,341 |
| | | | | |
| Net Assets – 100.0% | | | | $ | 249,819,230 |
| | | | | |
| (a) | Non-income producing security. |
| (v) | Underlying fund that is available only to investment companies managed by MFS. The rate quoted is the annualized seven-day yield of the fund at period end. |
The following abbreviations are used in this report and are defined:
| ADR | | American Depository Receipt |
| GDR | | Global Depository Receipt |
See Notes to Financial Statements
8
FINANCIAL STATEMENTS | STATEMENT OF ASSETS AND LIABILITIES
This statement represents your fund’s balance sheet, which details the assets and liabilities comprising the total value of the fund.
| | | | | |
At 12/31/08 | | | | | |
Assets | | | | | |
Investments – | | | | | |
Non-affiliated issuers, at value (identified cost, $320,124,379) | | $244,766,166 | | | |
Underlying funds, at cost and value | | 4,249,723 | | | |
Total investments, at value (identified cost, $324,374,102) | | $249,015,889 | | | |
Receivable for investments sold | | $8,047,067 | | | |
Receivable for fund shares sold | | 227 | | | |
Interest and dividends receivable | | 353,824 | | | |
Other assets | | 13,487 | | | |
Total assets | | | | | $257,430,494 |
Liabilities | | | | | |
Payable for investments purchased | | $7,087,723 | | | |
Payable for fund shares reacquired | | 392,242 | | | |
Payable to affiliates | | | | | |
Management fee | | 10,027 | | | |
Distribution fees | | 202 | | | |
Administrative services fee | | 736 | | | |
Payable for trustees’ compensation | | 401 | | | |
Accrued expenses and other liabilities | | 119,933 | | | |
Total liabilities | | | | | $7,611,264 |
Net assets | | | | | $249,819,230 |
Net assets consist of | | | | | |
Paid-in capital | | $1,029,583,881 | | | |
Unrealized appreciation (depreciation) on investments and translation of assets and liabilities in foreign currencies | | (75,362,052 | ) | | |
Accumulated net realized gain (loss) on investments and foreign currency transactions | | (706,362,198 | ) | | |
Undistributed net investment income | | 1,959,599 | | | |
Net assets | | | | | $249,819,230 |
Shares of beneficial interest outstanding | | | | | 17,530,952 |
Initial Class shares | | | | | |
Net assets | | $234,711,622 | | | |
Shares outstanding | | 16,462,066 | | | |
Net asset value per share | | | | | $14.26 |
Service Class shares | | | | | |
Net assets | | $15,107,608 | | | |
Shares outstanding | | 1,068,886 | | | |
Net asset value per share | | | | | $14.13 |
See Notes to Financial Statements
9
FINANCIAL STATEMENTS | STATEMENT OF OPERATIONS
This statement describes how much your fund earned in investment income and accrued in expenses. It also describes any gains and/or losses generated by fund operations.
| | | | | | |
| Year ended 12/31/08 | | | | | | |
| Net investment income | | | | | | |
Income | | | | | | |
Dividends | | $5,371,289 | | | | |
Interest | | 83,060 | | | | |
Dividends from underlying funds | | 8,627 | | | | |
Foreign taxes withheld | | (211,737 | ) | | | |
Total investment income | | | | | $5,251,239 | |
Expenses | | | | | | |
Management fee | | $2,800,945 | | | | |
Distribution fees | | 55,015 | | | | |
Administrative services fee | | 114,552 | | | | |
Trustees’ compensation | | 50,688 | | | | |
Custodian fee | | 91,427 | | | | |
Shareholder communications | | 48,925 | | | | |
Auditing fees | | 42,228 | | | | |
Legal fees | | 7,127 | | | | |
Miscellaneous | | 38,442 | | | | |
Total expenses | | | | | $3,249,349 | |
Fees paid indirectly | | (212 | ) | | | |
Net expenses | | | | | $3,249,137 | |
Net investment income | | | | | $2,002,102 | |
Realized and unrealized gain (loss) on investments and foreign currency transactions | | | | | | |
Realized gain (loss) (identified cost basis) | | | | | | |
Investments transactions: | | | | | | |
Non-affiliated issuers | | $(43,410,581 | ) | | | |
Foreign currency transactions | | (37,476 | ) | | | |
Net realized gain (loss) on investments and foreign currency transactions | | | | | $(43,448,057 | ) |
Change in unrealized appreciation (depreciation) | | | | | | |
Investments | | $(116,129,989 | ) | | | |
Translation of assets and liabilities in foreign currencies | | (7,141 | ) | | | |
Net unrealized gain (loss) on investments and foreign currency translation | | | | | $(116,137,130 | ) |
Net realized and unrealized gain (loss) on investments and foreign currency | | | | | $(159,585,187 | ) |
Change in net assets from operations | | | | | $(157,583,085 | ) |
See Notes to Financial Statements
10
FINANCIAL STATEMENTS | STATEMENTS OF CHANGES IN NET ASSETS
These statements describe the increases and/or decreases in net assets resulting from operations, any distributions, and any shareholder transactions.
| | | | | | |
For years ended 12/31 | | 2008 | | | 2007 | |
Change in net assets | | | | | | |
From operations | | | | | | |
Net investment income | | $2,002,102 | | | $1,801,291 | |
Net realized gain (loss) on investments and foreign currency transactions | | (43,448,057 | ) | | 52,056,987 | |
Net unrealized gain (loss) on investments and foreign currency translation | | (116,137,130 | ) | | 2,426,238 | |
Change in net assets from operations | | $(157,583,085 | ) | | $56,284,516 | |
Distributions declared to shareholders | | | | | | |
From net investment income | | | | | | |
Initial Class | | $(1,763,333 | ) | | $(981,066 | ) |
Service Class | | (37,450 | ) | | — | |
Total distributions declared to shareholders | | $(1,800,783 | ) | | $(981,066 | ) |
Change in net assets from fund share transactions | | $(74,356,683 | ) | | $(130,804,964 | ) |
Total change in net assets | | $(233,740,551 | ) | | $(75,501,514 | ) |
Net assets | | | | | | |
At beginning of period | | 483,559,781 | | | 559,061,295 | |
At end of period (including undistributed net investment income of $1,959,599 and
$1,795,756, respectively) | | $249,819,230 | | | $483,559,781 | |
See Notes to Financial Statements
11
FINANCIAL STATEMENTS | FINANCIAL HIGHLIGHTS
The financial highlights table is intended to help you understand the fund’s financial performance for the past 5 years. Certain information reflects financial results for a single fund share. The total returns in the table represent the rate by which an investor would have earned (or lost) on an investment in the fund share class (assuming reinvestment of all distributions) held for the entire period.
| | | | | | | | | | | | | | | |
| Initial Class | | Years ended 12/31 | |
| | | 2008 | | | 2007 | | | 2006 | | | 2005 | | | 2004 | |
Net asset value, beginning of period | | $22.74 | | | $20.50 | | | $19.31 | | | $19.25 | | | $17.35 | |
| Income (loss) from investment operations | | | | | | | | | | | | | | | |
Net investment income (d) | | $0.11 | | | $0.08 | | | $0.03 | | | $0.03 | | | $0.11 | |
Net realized and unrealized gain (loss) on investments
and foreign currency | | (8.49 | ) | | 2.20 | | | 1.20 | | | 0.14 | | | 1.80 | |
Total from investment operations | | $(8.38 | ) | | $2.28 | | | $1.23 | | | $0.17 | | | $1.91 | |
| Less distributions declared to shareholders | | | | | | | | | | | | | | | |
From net investment income | | $(0.10 | ) | | $(0.04 | ) | | $(0.04 | ) | | $(0.11 | ) | | $(0.01 | ) |
Net asset value, end of period | | $14.26 | | | $22.74 | | | $20.50 | | | $19.31 | | | $19.25 | |
Total return (%) (k)(s) | | (37.02 | ) | | 11.14 | | | 6.37 | | | 0.92 | | | 11.02 | (b) |
Ratios (%) (to average net assets)
and Supplemental data: | | | | | | | | | | | | | | | |
| Expenses (f) | | 0.86 | | | 0.83 | | | 0.79 | | | 0.85 | | | 0.82 | |
| Net investment income | | 0.55 | | | 0.36 | | | 0.18 | | | 0.18 | | | 0.62 | |
| Portfolio turnover | | 44 | | | 61 | | | 60 | | | 153 | | | 64 | |
Net assets at end of period (000 Omitted) | | $234,712 | | | $456,006 | | | $528,522 | | | $649,588 | | | $672,246 | |
| |
| Service Class | | Years ended 12/31 | |
| | | 2008 | | | 2007 | | | 2006 | | | 2005 | | | 2004 | |
Net asset value, beginning of period | | $22.54 | | | $20.32 | | | $19.16 | | | $19.11 | | | $17.25 | |
| Income (loss) from investment operations | | | | | | | | | | | | | | | |
Net investment income (loss) (d) | | $0.06 | | | $0.02 | | | $(0.01 | ) | | $(0.01 | ) | | $0.07 | |
Net realized and unrealized gain (loss) on investments
and foreign currency | | (8.44 | ) | | 2.20 | | | 1.17 | | | 0.13 | | | 1.79 | |
Total from investment operations | | $(8.38 | ) | | $2.22 | | | $1.16 | | | $0.12 | | | $1.86 | |
| Less distributions declared to shareholders | | | | | | | | | | | | | | | |
From net investment income | | $(0.03 | ) | | $— | | | $— | | | $(0.07 | ) | | $— | |
Net asset value, end of period | | $14.13 | | | $22.54 | | | $20.32 | | | $19.16 | | | $19.11 | |
Total return (%) (k)(s) | | (37.22 | ) | | 10.93 | | | 6.05 | | | 0.63 | | | 10.78 | (b) |
Ratios (%) (to average net assets)
and Supplemental data: | | | | | | | | | | | | | | | |
| Expenses (f) | | 1.10 | | | 1.08 | | | 1.04 | | | 1.10 | | | 1.07 | |
| Net investment income (loss) | | 0.30 | | | 0.11 | | | (0.07 | ) | | (0.07 | ) | | 0.40 | |
| Portfolio turnover | | 44 | | | 61 | | | 60 | | | 153 | | | 64 | |
Net assets at end of period (000 Omitted) | | $15,108 | | | $27,554 | | | $30,540 | | | $35,371 | | | $35,997 | |
| (b) | The fund’s net asset value and total return calculation include a non-recurring accrual recorded as a result of an administrative proceeding regarding disclosure of brokerage allocation practices in connection with fund sales. The non-recurring accrual resulted in an increase in the net asset value of $0.02 per share based on shares outstanding on the day the accrual was recorded. Excluding the effect of this accrual from the ending net asset value per share, the Initial and Service Class total returns for the year ended December 31, 2004 would have been lower by approximately 0.11%. |
| (d) | Per share data is based on average shares outstanding. |
| (f) | Ratios do not reflect reductions from fees paid indirectly, if applicable. |
| (k) | The total return does not reflect expenses that apply to separate accounts. Inclusion of these charges would reduce the total return figures for all periods shown. |
| (s) | From time to time the fund may receive proceeds from litigation settlements, without which performance would be lower. |
See Notes to Financial Statements
12
NOTES TO FINANCIAL STATEMENTS
| (1) | | Business and Organization |
MFS Capital Appreciation Portfolio (the fund) is a series of MFS Variable Insurance Trust II (the trust). The trust is organized as a Massachusetts business trust and is registered under the Investment Company Act of 1940, as amended, as an open-end management investment company. The shares of the fund are sold to variable accounts established by insurance companies to fund benefits under variable contracts issued by such companies, and qualified retirement and pension plans.
| (2) | | Significant Accounting Policies |
General – The preparation of financial statements in conformity with U.S. generally accepted accounting principles requires management to make estimates and assumptions that affect the reported amounts of assets and liabilities, and disclosure of contingent assets and liabilities at the date of the financial statements and the reported amounts of revenues and expenses during the reporting period. Actual results could differ from those estimates. The fund can invest in foreign securities. Investments in foreign securities are vulnerable to the effects of changes in the relative values of the local currency and the U.S. dollar and to the effects of changes in each country’s legal, political, and economic environment.
In March 2008, FASB Statement No. 161, Disclosures about Derivative Instruments and Hedging Activities (the “Standard”) was issued, and is effective for financial statements issued for fiscal years and interim periods beginning after November 15, 2008. This Standard provides enhanced disclosures about the fund’s use of and accounting for derivative instruments and the effect of derivative instruments on the fund’s results of operations and financial position. Management is evaluating the application of the Standard to the fund, and has not at this time determined the impact, if any, resulting from the adoption of this Standard on the fund’s financial statements.
FASB Staff Position (FSP) 133-1 was implemented during the period. FSP 133-1 amends FAS 133 to require sellers of credit derivatives to make disclosures that will enable financial statement users to assess the potential effects of those credit derivatives on an entity’s financial position, financial performance and cash flows. There was no impact from implementing FSP 133-1 as the fund did not hold any of these credit derivatives at period end.
Investment Valuations – Equity securities, including restricted equity securities, are generally valued at the last sale or official closing price as reported by a third party pricing service on the market or exchange on which they are primarily traded. For securities for which there were no sales reported that day, equity securities are generally valued at the last quoted daily bid quotation as reported by a third party pricing service on the market or exchange on which they are primarily traded. For securities held short for which there were no sales reported for the day, the position is generally valued at the last quoted daily ask quotation as reported by a third party pricing service on the market or exchange on which such securities are primarily traded. Short-term instruments with a maturity at issuance of 60 days or less may be valued at amortized cost, which approximates market value. Open-end investment companies are generally valued at net asset value per share. Securities and other assets generally valued on the basis of information from a third party pricing service may also be valued at a broker-dealer bid quotation. Values obtained from pricing services can utilize both dealer-supplied valuations and electronic data processing techniques, which take into account factors such as institutional-size trading in similar groups of securities, yield, quality, coupon rate, maturity, type of issue, trading characteristics, and other market data. The values of foreign securities and other assets and liabilities expressed in foreign currencies are converted to U.S. dollars using the mean of bid and asked prices for rates reported by a third party pricing service.
The Board of Trustees has delegated primary responsibility for determining or causing to be determined the value of the fund’s investments (including any fair valuation) to the adviser pursuant to valuation policies and procedures approved by the Board. If the adviser determines that reliable market quotations are not readily available, investments are valued at fair value as determined in good faith by the adviser in accordance with such procedures under the oversight of the Board of Trustees. Under the fund’s valuation policies and procedures, market quotations are not considered to be readily available for most types of debt instruments and floating rate loans and many types of derivatives. These investments are generally valued at fair value based on information from third party pricing services. In addition, investments may be valued at fair value if the adviser determines that an investment’s value has been materially affected by events occurring after the close of the exchange or market on which the investment is principally traded (such as foreign exchange or market) and prior to the determination of the fund’s net asset value, or after the halting of trading of a specific security where trading does not resume prior to the close of the exchange or market on which the security is principally traded. Events that occur on a frequent basis after foreign markets close (such as developments in foreign markets and significant movements in the U.S. markets) and prior to the determination of the fund’s net asset value may be deemed to have a material affect on the value of securities traded in foreign markets. Accordingly, the fund’s foreign equity securities may often be valued at fair value. The adviser may rely on third party pricing services or other information (such as the correlation with price movements of similar securities in the same or other markets; the type, cost and investment characteristics of the security; the business and financial condition of the issuer; and trading and other market data) to assist in determining whether to fair value and at what value to fair value an investment. The
13
Notes to Financial Statements – continued
value of an investment for purposes of calculating the fund’s net asset value can differ depending on the source and method used to determine value. When fair valuation is used, the value of investments used to determine the fund’s net asset value may differ from quoted or published prices for the same investments.
The fund adopted FASB Statement No. 157, Fair Value Measurements (the “Statement”). This Statement provides a single definition of fair value, a hierarchy for measuring fair value and expanded disclosures about fair value measurements.
Various inputs are used in determining the value of the fund’s assets or liabilities carried at market value. These inputs are categorized into three broad levels. Level 1 includes quoted prices in active markets for identical assets or liabilities. Level 2 includes other significant observable market-based inputs (including quoted prices for similar securities, interest rates, prepayment speed, and credit risk). Level 3 includes unobservable inputs, which may include the adviser’s own assumptions in determining the fair value of investments. Other financial instruments are derivative instruments not reflected in total investments, such as futures, forwards, swap contracts and written options. The following is a summary of the levels used as of December 31, 2008 in valuing the fund’s assets or liabilities carried at market value:
| | | | | | | | |
| | | Level 1 | | Level 2 | | Level 3 | | Total |
Investments in Securities | | $230,504,375 | | $18,511,514 | | $— | | $249,015,889 |
Other Financial Instruments | | $— | | $— | | $— | | $— |
Repurchase Agreements – The fund may enter into repurchase agreements with approved counterparties. Each repurchase agreement is recorded at cost. The fund requires that the securities collateral in a repurchase transaction be transferred to a custodian. The fund monitors, on a daily basis, the value of the collateral to ensure that its value, including accrued interest, is greater than amounts owed to the fund under each such repurchase agreement. The fund and other funds managed by Massachusetts Financial Services Company (MFS), may utilize a joint trading account for the purpose of entering into one or more repurchase agreements.
Foreign Currency Translation – Purchases and sales of foreign investments, income, and expenses are converted into U.S. dollars based upon currency exchange rates prevailing on the respective dates of such transactions or on the reporting date for foreign denominated receivables and payables. Gains and losses attributable to foreign currency exchange rates on sales of securities are recorded for financial statement purposes as net realized gains and losses on investments. Gains and losses attributable to foreign exchange rate movements on receivables, payables, income and expenses are recorded for financial statement purposes as foreign currency transaction gains and losses. That portion of both realized and unrealized gains and losses on investments that results from fluctuations in foreign currency exchange rates is not separately disclosed.
Indemnifications – Under the fund’s organizational documents, its officers and trustees may be indemnified against certain liabilities and expenses arising out of the performance of their duties to the fund. Additionally, in the normal course of business, the fund enters into agreements with service providers that may contain indemnification clauses. The fund’s maximum exposure under these agreements is unknown as this would involve future claims that may be made against the fund that have not yet occurred.
Investment Transactions and Income – Investment transactions are recorded on the trade date. Interest income is recorded on the accrual basis. All premium and discount is amortized or accreted for financial statement purposes in accordance with U.S. generally accepted accounting principles. Dividends received in cash are recorded on the ex-dividend date. Certain dividends from foreign securities will be recorded when the fund is informed of the dividend if such information is obtained subsequent to the ex-dividend date. Dividend and interest payments received in additional securities are recorded on the ex-dividend or ex-interest date in an amount equal to the value of the security on such date.
The fund may receive proceeds from litigation settlements. Any proceeds received from litigation involving portfolio holdings are reflected in the Statement of Operations in realized gain/loss if the security has been disposed of by the fund or in unrealized gain/loss if the security is still held by the fund. Any other proceeds from litigation not related to portfolio holdings are reflected as other income in the Statement of Operations.
Fees Paid Indirectly – The fund’s custody fee may be reduced according to an arrangement that measures the value of cash deposited with the custodian by the fund. This amount, for the year ended December 31, 2008, is shown as a reduction of total expenses on the Statement of Operations.
Tax Matters and Distributions – The fund intends to qualify as a regulated investment company, as defined under Subchapter M of the Internal Revenue Code, and to distribute all of its taxable income, including realized capital gains. As a result, no provision for federal income tax is required. Each of the fund’s federal tax returns for the prior three fiscal years remains subject to examination by the Internal Revenue Service. Foreign taxes, if any, have been accrued by the fund in the accompanying financial statements.
14
Notes to Financial Statements – continued
Distributions to shareholders are recorded on the ex-dividend date. Income and capital gain distributions are determined in accordance with income tax regulations, which may differ from U.S. generally accepted accounting principles. Certain capital accounts in the financial statements are periodically adjusted for permanent differences in order to reflect their tax character. These adjustments have no impact on net assets or net asset value per share. Temporary differences which arise from recognizing certain items of income, expense, gain or loss in different periods for financial statement and tax purposes will reverse at some time in the future. Distributions in excess of net investment income or net realized gains are temporary overdistributions for financial statement purposes resulting from differences in the recognition or classification of income or distributions for financial statement and tax purposes.
Book/tax differences primarily relate to expiration of capital loss carryforwards, and wash sale loss deferrals.
The tax character of distributions declared to shareholders for the last two fiscal years is as follows:
| | | | |
| | | 12/31/08 | | 12/31/07 |
| Ordinary income (including any short-term capital gains) | | $1,800,783 | | $981,066 |
The federal tax cost and the tax basis components of distributable earnings were as follows:
| | | |
| As of 12/31/08 | | | |
| Cost of investments | | $324,951,830 | |
| Gross appreciation | | 1,762,339 | |
| Gross depreciation | | (77,698,280 | ) |
| Net unrealized appreciation (depreciation) | | $(75,935,941 | ) |
| Undistributed ordinary income | | 1,959,599 | |
| Capital loss carryforwards | | (705,784,470 | ) |
| Other temporary differences | | (3,839 | ) |
As of December 31, 2008, the fund had capital loss carryforwards available to offset future realized gains. Such losses expire as follows:
| | | |
| 12/31/09 | | $(282,399,140 | ) |
| 12/31/10 | | (348,269,974 | ) |
| 12/31/11 | | (32,085,262 | ) |
| 12/31/16 | | (43,030,094 | ) |
| | $(705,784,470 | ) |
The availability of a portion of the capital loss carryforwards, which were acquired on April 25, 2005 in connection with the Managed Sectors Series merger, may be limited in a given year.
Multiple Classes of Shares of Beneficial Interest – The fund offers multiple classes of shares, which differ in their respective distribution fees. The fund’s income, realized and unrealized gain (loss), and common expenses are allocated to shareholders based on the daily net assets of each class. Dividends are declared separately for each class. Differences in per share dividend rates are generally due to differences in separate class expenses.
| (3) | | Transactions with Affiliates |
Investment Adviser – The fund has an investment advisory agreement with MFS to provide overall investment management and related administrative services and facilities to the fund. The management fee is computed daily and paid monthly at the following annual rates:
| | |
| First $1 billion of average daily net assets | | 0.75% |
| Next $500 million of average daily net assets | | 0.675% |
| Average daily net assets in excess of $1.5 billion | | 0.65% |
The management fee incurred for the year ended December 31, 2008 was equivalent to an annual effective rate of 0.75% of the
fund’s average daily net assets.
The investment adviser has agreed in writing to pay a portion of the fund’s total annual operating expenses, exclusive of interest, taxes, brokerage commissions, and extraordinary expenses, such that the total annual operating expenses of the fund do not exceed 1.25% of the fund’s average daily net assets. MFS’ agreement to limit the fund’s operating expenses is contained in the investment advisory agreement between MFS and the fund and may not be rescinded without shareholder approval. In addition, the investment adviser has voluntarily agreed to pay a portion of the fund’s total annual operating expenses, exclusive of interest, taxes, brokerage commissions, and extraordinary expenses, such that total annual operating expenses do not exceed 1.00% of the fund’s average daily net assets attributable to Initial Class shares. This voluntary agreement may be changed or rescinded at any time by MFS. For the year ended December 31, 2008, the fund’s actual operating expenses did not exceed the limit and therefore, the investment adviser did not pay a portion of the fund’s expenses.
15
Notes to Financial Statements – continued
Distributor – MFS Fund Distributors, Inc. (MFD), a wholly-owned subsidiary of MFS, is the distributor of shares of the fund. The Trustees have adopted a distribution plan for the Service Class shares pursuant to Rule 12b-1 under the Investment Company Act of 1940.
The fund’s distribution plan provides that the fund will pay MFD distribution fees equal to 0.25% per annum of its average daily net assets attributable to Service Class shares as partial consideration for services performed and expenses incurred by MFD and financial intermediaries (including participating insurance companies that invest in the fund to fund variable annuity and variable life insurance contracts, sponsors of qualified retirement and pension plans that invest in the fund, and affiliates of these participating insurance companies and plan sponsors) in connection with the sale and distribution of the Service Class shares. MFD may subsequently pay all, or a portion, of the distribution fees to financial intermediaries.
Shareholder Servicing Agent – MFS Service Center, Inc. (MFSC), a wholly-owned subsidiary of MFS, has contracted to provide transfer agent and recordkeeping functions in connection with the issuance, transfer, and redemption of each class of shares of the fund under a Shareholder Servicing Agent Agreement. During the year ended December 31, 2008, the fund did not pay MFSC a fee for this service.
Administrator – MFS provides certain financial, legal, shareholder communications, compliance, and other administrative services to the fund. Under an administrative services agreement, the fund partially reimburses MFS the costs incurred to provide these services. The fund is charged an annual fixed amount of $10,000 plus a fee based on average daily net assets.
The administrative services fee incurred for the year ended December 31, 2008 was equivalent to an annual effective rate of 0.0307% of the fund’s average daily net assets.
Trustees’ and Officers’ Compensation – The fund pays compensation to trustees in the form of a retainer, attendance fees, and additional compensation to the Board chairperson. The fund does not pay compensation directly to officers of the fund who are also officers of the investment adviser, all of whom receive remuneration for their services to the fund from MFS. Certain officers and trustees of the fund are officers or directors of MFS, MFD, and MFSC.
Other – This fund and certain other MFS funds (the funds) have entered into services agreements (the Agreements) which provide for payment of fees by the funds to Tarantino LLC and Griffin Compliance LLC in return for the provision of services of an Independent Chief Compliance Officer (ICCO) and Assistant ICCO, respectively, for the funds. The ICCO and Assistant ICCO are officers of the funds and the sole members of Tarantino LLC and Griffin Compliance LLC, respectively. The funds can terminate the Agreements with Tarantino LLC and Griffin Compliance LLC at any time under the terms of the Agreements. MFS has agreed to bear all expenses associated with office space, other administrative support, and supplies provided to the ICCO and Assistant ICCO. For the year ended December 31, 2008, the aggregate fees paid by the fund to Tarantino LLC and Griffin Compliance LLC were $3,496 and are included in miscellaneous expense on the Statement of Operations.
The fund may invest in a money market fund managed by MFS which seeks a high level of current income consistent with preservation of capital and liquidity. Income earned on this investment is included in dividends from underlying funds on the Statement of Operations. This money market fund does not pay a management fee to MFS.
Purchases and sales of investments, other than U.S. Government securities, purchased option transactions, and short-term obligations, aggregated $162,595,564 and $234,190,815, respectively.
16
Notes to Financial Statements – continued
| (5) | | Shares of Beneficial Interest |
The fund’s Declaration of Trust permits the Trustees to issue an unlimited number of full and fractional shares of beneficial interest. Transactions in fund shares were as follows:
| | | | | | | | | | | | |
| | | Year ended 12/31/08 | | | Year ended 12/31/07 | |
| | | Shares | | | Amount | | | Shares | | | Amount | |
| Shares sold | | | | | | | | | | | | |
Initial Class | | 548,417 | | | $8,836,986 | | | 169,097 | | | $3,653,840 | |
Service Class | | 119,550 | | | 1,990,570 | | | 58,373 | | | 1,243,614 | |
| | 667,967 | | | $10,827,556 | | | 227,470 | | | $4,897,454 | |
| Shares issued to shareholders in reinvestment of distributions | | | | | | | | | | | | |
Initial Class | | 79,002 | | | $1,763,333 | | | 44,941 | | | $981,066 | |
Service Class | | 1,690 | | | 37,450 | | | — | | | — | |
| | 80,692 | | | $1,800,783 | | | 44,941 | | | $981,066 | |
| Shares reacquired | | | | | | | | | | | | |
Initial Class | | (4,218,367 | ) | | $(81,976,815 | ) | | (5,948,468 | ) | | $(129,379,348 | ) |
Service Class | | (275,061 | ) | | (5,008,207 | ) | | (338,421 | ) | | (7,304,136 | ) |
| | (4,493,428 | ) | | $(86,985,022 | ) | | (6,286,889 | ) | | $(136,683,484 | ) |
| Net change | | | | | | | | | | | | |
Initial Class | | (3,590,948 | ) | | $(71,376,496 | ) | | (5,734,430 | ) | | $(124,744,442 | ) |
Service Class | | (153,821 | ) | | (2,980,187 | ) | | (280,048 | ) | | (6,060,522 | ) |
| | (3,744,769 | ) | | $(74,356,683 | ) | | (6,014,478 | ) | | $(130,804,964 | ) |
The fund and other funds managed by MFS participate in a $1 billion unsecured committed line of credit provided by a syndication of banks under a credit agreement. In addition, the fund and other funds managed by MFS have established uncommitted borrowing arrangements with certain banks. Borrowings may be made for temporary financing needs. Interest is charged to the fund, based on its borrowings, generally at a rate equal to the Federal Reserve funds rate plus 0.30%. In addition, a commitment fee, based on the average daily, unused portion of the committed line of credit, is allocated among the participating funds at the end of each calendar quarter. For the year ended December 31, 2008, the fund’s commitment fee and interest expense were $1,867 and $0, respectively, and are included in miscellaneous expense on the Statement of Operations.
| (7) | | Transactions in Underlying Funds – Affiliated Issuers |
An affiliated issuer may be considered one in which the fund owns 5% or more of the outstanding voting securities, or a company which is under common control. For the purposes of this report, the fund assumes the following to be affiliated issuers:
| | | | | | | | | |
| Underlying Funds | | Beginning
Shares/Par
Amount | | Acquisitions
Shares/Par
Amount | | Dispositions
Shares/Par
Amount | | | Ending
Shares/Par
Amount |
| MFS Institutional Money Market Portfolio | | — | | 39,866,378 | | (35,616,655 | ) | | 4,249,723 |
| | | | |
| Underlying Funds | | Realized
Gain (Loss) | | Capital Gain
Distributions | | Dividend
Income | | | Ending
Value |
| MFS Institutional Money Market Portfolio | | $— | | $— | | $8,627 | | | $4,249,723 |
17
REPORT OF INDEPENDENT REGISTERED PUBLIC ACCOUNTING FIRM
To the Board of Trustees of MFS Variable Insurance Trust II and the Shareholders of
MFS Capital Appreciation Portfolio:
We have audited the accompanying statement of assets and liabilities, including the portfolio of investments, of MFS Capital Appreciation Portfolio (the “Fund”) (one of the portfolios comprising MFS Variable Insurance Trust II) as of December 31, 2008, and the related statement of operations for the year then ended, the statements of changes in net assets for each of the two years in the period then ended, and the financial highlights for each of the five years in the period then ended. These financial statements and financial highlights are the responsibility of the Fund’s management. Our responsibility is to express an opinion on these financial statements and financial highlights based on our audits.
We conducted our audits in accordance with the standards of the Public Company Accounting Oversight Board (United States). Those standards require that we plan and perform the audit to obtain reasonable assurance about whether the financial statements and financial highlights are free of material misstatement. The Fund is not required to have, nor were we engaged to perform, an audit of its internal control over financial reporting. Our audits included consideration of internal control over financial reporting as a basis for designing audit procedures that are appropriate in the circumstances, but not for the purpose of expressing an opinion on the effectiveness of the Fund’s internal control over financial reporting. Accordingly, we express no such opinion. An audit also includes examining, on a test basis, evidence supporting the amounts and disclosures in the financial statements, assessing the accounting principles used and significant estimates made by management, as well as evaluating the overall financial statement presentation. Our procedures included confirmation of securities owned as of December 31, 2008, by correspondence with the custodian and brokers; where replies were not received from brokers, we performed other auditing procedures. We believe that our audits provide a reasonable basis for our opinion.
In our opinion, the financial statements and financial highlights referred to above present fairly, in all material respects, the financial position of MFS Capital Appreciation Portfolio as of December 31, 2008, the results of its operations for the year then ended, the changes in its net assets for each of the two years in the period then ended, and the financial highlights for each of the five years in the period then ended, in conformity with accounting principles generally accepted in the United States of America.
DELOITTE & TOUCHE LLP
Boston, Massachusetts
February 19, 2009
18
TRUSTEES AND OFFICERS – IDENTIFICATION AND BACKGROUND
The Trustees and officers of the Trust, as of February 1, 2009, are listed below, together with their principal occupations during the past five years. (Their titles may have varied during that period.) The address of each Trustee and officer is 500 Boylston Street, Boston, Massachusetts 02116.
| | | | | | |
Name, Date of Birth | | Position(s) Held
with Fund | | Trustee/Officer
Since (1) | | Principal Occupations During the Past Five Years and
Other Directorships (2) |
| INTERESTED TRUSTEE | | | | |
David D. Horn (3) (born 6/07/41) | | Trustee | | April 1986 | | Private investor; Sun Life Assurance Company of Canada, Senior Vice President and General Manager for the United States (until 1997); Director (until March 2004) |
| | |
| INDEPENDENT TRUSTEES | | | | |
J. Kermit Birchfield (born 1/08/40) | | Chairman | | May 1997 | | Consultant; Century Partners, Inc. (investments), Director; Displaytech, Inc. (technology), Director; Dessin Fournir LLC (furniture manufacturer), Director (2005 to present); Intermountain Gas Company, Inc. & Intermountain Industries, Inc. (oil & gas exploration and production), Director; Site Watch LLC (software to monitor oil tanks), Managing Director (2006 to present); Juridica Investments (fund investing in judicial matters), Director (2007 to present); HPSC, Inc. (medical financing), Director (until January 2004) |
| | | |
Robert C. Bishop (born 1/13/43) | | Trustee | | May 2001 | | AutoImmune, Inc. (pharmaceutical product development), Chairman, President and Chief Executive Officer; Caliper Life Sciences Corp. (laboratory analytical instruments), Director; Millipore Corporation (purification/filtration products), Director; Waterstreet Capital (leverage buyouts), Advisory Board (August 2006 to present); Optobionics Corporation (ophthalmic devices), Director (2002 to 2007) |
| | | |
Frederick H. Dulles (born 3/12/42) | | Trustee | | May 2001 | | Ten State International Law PLLC (law firm), Of Counsel (since 2006); Prudential Carolina Real Estate, (real estate), Broker (since 2006); Free Enterprise Foundation, Inc. (research institute), Director & Secretary (until 2008); Disher, Hamrick & Myers Residential, Inc. (real estate) Broker (2005 until 2006); Frederick H. Dulles law practice (until 2006); Ten State Street LLP (law firm), Member (until 2005) |
| | | |
Marcia A. Kean (born 6/30/48) | | Trustee | | April 2005 | | Feinstein Kean Healthcare (consulting), Chief Executive Officer |
| | | |
Ronald G. Steinhart (born 6/15/40) | | Trustee | | May 2001 | | Private investor; Penske Automotive Group (automotive retailer), Director; Animal Health International, Inc. (animal health products), Director (since 2007); Texas Industries (concrete/aggregates/cement), Director (since 2007); Penson Worldwide, Inc. (securities clearance), Director (since 2006); Carreker Corporation (technology consulting) Director (until 2005); Prentiss Properties Trust (real estate investment trust), Director (until 2006) |
| | | |
Haviland Wright (born 7/21/48) | | Trustee | | May 2001 | | Profitability of Hawaii (software), Chief Development Officer (since December 2008); Elixir Technologies Corporation (software) Director (since 2005); Nano Loa Inc. (liquid crystal displays), Director |
| | |
| TRUSTEE EMERITUS | | | | |
Samuel Adams (born 10/19/25) | | Trustee Emeritus | | | | Retired; K&L Gates LLP (law firm), Of Counsel |
| | |
| OFFICERS | | | | |
Maria F. Dwyer (4) (born 12/01/58) | | President | | November 2005 | | Massachusetts Financial Services Company, Executive Vice President and Chief Regulatory Officer (since March 2004) Chief Compliance Officer (since December 2006); Fidelity Management & Research Company, Vice President (prior to March 2004); Fidelity Group of Funds, President and Treasurer (until March 2004) |
| | | |
Christopher R. Bohane (4) (born 1/18/74) | | Assistant Secretary and Assistant Clerk | | July 2005 | | Massachusetts Financial Services Company, Vice President and Senior Counsel |
| | | |
John M. Corcoran (4) (born 4/13/65) | | Treasurer | | October 2008 | | Massachusetts Financial Services Company, Senior Vice President (since October 2008); State Street Bank and Trust (financial services provider), Senior Vice President, (until September 2008) |
| | | |
Ethan D. Corey (4) (born 11/21/63) | | Assistant Secretary and Assistant Clerk | | July 2005 | | Massachusetts Financial Services Company, Senior Vice President and Associate General Counsel (since 2004); Dechert LLP (law firm), Counsel (prior to December 2004) |
| | | |
David L. DiLorenzo (4) (born 8/10/68) | | Assistant Treasurer | | July 2005 | | Massachusetts Financial Services Company, Vice President (since June 2005); JP Morgan Investor Services, Vice President (until June 2005) |
| | | |
Timothy M. Fagan (4) (born 7/10/68) | | Assistant Secretary and Assistant Clerk | | September 2005 | | Massachusetts Financial Services Company, Vice President and Senior Counsel (since September 2005); John Hancock Advisers, LLC, Vice President, Senior Attorney and Chief Compliance Officer (until August 2005) |
19
Trustees and Officers – continued
| | | | | | |
Name, Date of Birth | | Position(s) Held
with Fund | | Trustee/Officer
Since (1) | | Principal Occupations During the Past Five Years and
Other Directorships (2) |
Mark D. Fischer (4) (born 10/27/70) | | Assistant Treasurer | | July 2005 | | Massachusetts Financial Services Company, Vice President (since May 2005); JP Morgan Investment Management Company, Vice President (until May 2005) |
| | | |
Robyn L. Griffin (born 7/04/75) | | Assistant Independent Chief Compliance Officer | | August 2008 | | Griffin Compliance LLC (provider of compliance services), Principal (since August 2008); State Street Corporation (financial services provider), Mutual Fund Administration Assistant Vice President (October 2006 – July 2008); Liberty Mutual Group (insurance), Personal Market Assistant Controller (April 2006 – October 2006); Deloitte & Touche LLP (professional services firm), Senior Manager (prior to April 2006) |
| | | |
Brian E. Langenfeld (4) (born 3/07/73) | | Assistant Secretary and Assistant Clerk | | May 2006 | | Massachusetts Financial Services Company, Vice President and Senior Counsel (since May 2006); John Hancock Advisers, LLC, Assistant Vice President and Counsel (until April 2006) |
| | | |
Ellen Moynihan (4) (born 11/13/57) | | Assistant Treasurer | | May 1997 | | Massachusetts Financial Services Company, Senior Vice President |
| | | |
Susan S. Newton (4) (born 3/07/50) | | Assistant Secretary and Assistant Clerk | | May 2005 | | Massachusetts Financial Services Company, Senior Vice President and Associate General Counsel (since April 2005); John Hancock Advisers, LLC, Senior Vice President, Secretary and Chief Legal Officer (until April 2005) |
| | | |
Susan A. Pereira (4) (born 11/05/70) | | Assistant Secretary and Assistant Clerk | | July 2005 | | Massachusetts Financial Services Company, Vice President and Senior Counsel (since June 2004); Bingham McCutchen LLP (law firm), Associate (until June 2004) |
| | | |
Mark N. Polebaum (4) (born 5/01/52) | | Secretary and Clerk | | February 2006 | | Massachusetts Financial Services Company, Executive Vice President, General Counsel and Secretary (since January 2006); Wilmer Cutler Pickering Hale and Dorr LLP (law firm), Partner (until January 2006) |
| | | |
Frank L. Tarantino (born 3/07/44) | | Independent Chief Compliance Officer | | September 2004 | | Tarantino LLC (provider of compliance services), Principal (since June 2004); CRA Business Strategies Group (consulting services), Executive Vice President (until June 2004) |
| | | |
Richard S. Weitzel (4) (born 7/16/70) | | Assistant Secretary and Assistant Clerk | | October 2007 | | Massachusetts Financial Services Company, Vice President and Assistant General Counsel (since 2004); Massachusetts Department of Business and Technology, General Counsel (until April 2004) |
| | | |
James O. Yost (4) (born 6/12/60) | | Assistant Treasurer | | April 1992 | | Massachusetts Financial Services Company, Senior Vice President |
| (1) | Date first appointed to serve as Trustee/Officer of an MFS fund or a Compass variable account. Each Trustee has served continuously since appointment. |
| (2) | Directorships or trusteeships of companies required to report to the Securities and Exchange Commission (i.e., “public companies”). |
| (3) | “Interested person” of the Trust, within the meaning of the Investment Company Act of 1940 (referred to as the 1940 Act), which is the principal federal law governing investment companies like the Trust, as a result of position with Sun Life of Canada (U.S.). The address of Sun Life of Canada (U.S.) is One Sun Life Executive Park, Wellesley Hills, Massachusetts 02481. |
| (4) | “Interested person” of MFS within the meaning of the 1940 Act. The address of MFS is 500 Boylston Street, Boston, Massachusetts 02116. |
The Trust does not hold annual meetings for the purpose of electing Trustees, and Trustees are not elected for fixed terms. Each Trustee and officer holds office until his or her successor is chosen and qualified, or until his or her earlier death, resignation, retirement or removal.
All Trustees currently serve as Trustees of the Trust and have served in that capacity since originally elected or appointed. All of the Trustees are also Managers of the Compass Variable Accounts. The executive officers of the Trust hold similar offices for the Compass Variable Accounts and other funds in the MFS fund complex. As of January 1, 2009, each Trustee serves as a Trustee or Manager of 35 Accounts/Funds.
The Statement of Additional Information contains further information about the Trustees and is available without charge upon request by calling 1-800-752-7215.
| | |
Investment Adviser
Massachusetts Financial Services Company 500 Boylston Street, Boston, MA 02116-3741 | | Custodian State Street Bank and Trust 1 Lincoln Street, Boston, MA 02111-2900 |
Distributor
MFS Fund Distributors, Inc. 500 Boylston Street, Boston, MA 02116-3741 | | Independent Registered Public Accounting Firm Deloitte & Touche LLP 200 Berkeley Street, Boston, MA 02116 |
Portfolio Manager Jeffrey Constantino | | |
20
BOARD REVIEW OF INVESTMENT ADVISORY AGREEMENT
The Investment Company Act of 1940 requires that both the full Board of Trustees and a majority of the non-interested (“independent”) Trustees, voting separately, annually approve the continuation of the investment advisory agreement between MFS Variable Insurance Trust II (the “Trust”) and Massachusetts Financial Services Company (“MFS”) on behalf of the Fund. The Trustees consider matters bearing on the Fund and the advisory arrangements at their meetings throughout the year, including a review of performance data at each regular meeting. In addition, the independent Trustees met in May and again in July 2008 (“contract review meetings”) for the specific purpose of considering whether to approve the continuation of the investment advisory agreement for the Fund. The independent Trustees were assisted in their evaluation of the investment advisory agreement by independent legal counsel, from whom they received separate legal advice and with whom they met separately from MFS management during various contract review meetings. The independent Trustees were also assisted in this process by the Fund’s Independent Chief Compliance Officer, a full-time senior officer appointed by and reporting to the independent Trustees.
In connection with their deliberations, the Trustees, including the independent Trustees, considered such information and factors as they believed, in light of the legal advice furnished to them and their own business judgment, to be relevant. The investment advisory agreement was considered separately for the Fund, although the Trustees also took into account the common interests of all Funds in the Trust in their review. As described below, the Trustees considered the nature, quality, and extent of the various investment advisory, administrative, and shareholder services performed by MFS under the existing investment advisory agreement and other arrangements with the Trust.
In connection with their contract review meetings, the Trustees received and relied upon materials which included, among other items: (i) information provided by Lipper Inc. on the investment performance of the Fund for various time periods ended December 31, 2007, compared to the investment performance of a group of funds with substantially similar investment classifications/objectives (the “Lipper performance universe”), (ii) information provided by Lipper Inc. on the Fund’s advisory fees and other expenses compared to the advisory fees and other expenses of comparable funds identified by Lipper (the “Lipper expense group”), (iii) information provided by MFS on the advisory fees of comparable portfolios of its other clients, including institutional separate account and other clients, (iv) information as to whether expense waivers, reimbursements or fee “breakpoints” are observed for the Fund, (v) information regarding MFS’ financial results and financial condition, including MFS’ and certain of its affiliates’ estimated profitability from services performed for the Fund, (vi) MFS’ views regarding the outlook for the mutual fund industry and its strategic business plans, (vii) descriptions of various functions performed by MFS for the Trust, such as compliance monitoring and portfolio trading practices, and (viii) information regarding the overall organization of MFS, including information about MFS’ senior management and other personnel providing investment advisory, administrative and other services to the Fund. The comparative performance, fee and expense information prepared and provided by Lipper Inc. was not independently verified, and the independent Trustees did not independently verify any information provided to them by MFS.
The Trustees’ conclusion as to the continuation of the investment advisory agreement was based on comprehensive consideration of all information provided to the Trustees and not the result of any single factor. Some of the factors that figured particularly in the Trustees’ deliberations are described below for the Fund, while individual Trustees may have given different weight to various factors and evaluated the information presented as a whole differently than another Trustee. The Trustees recognized that the fee arrangements for the Fund reflect years of review and discussion between the independent Trustees and MFS, that certain aspects of such arrangements may receive greater scrutiny in some years than others, and that the Trustees’ conclusions may be based, in part, on their consideration of these same arrangements during the course of the year and in prior years.
Based on information provided by Lipper Inc., the Trustees compared the Fund’s total return investment performance to the performance of a peer group of funds over various time periods. The Trustees placed particular emphasis on the total return performance of the Fund’s Initial Class shares in comparison to the performance of funds in its Lipper performance universe over the one-, three- and five-year periods. The Trustees did not rely on performance results for more recent periods, including those shown elsewhere in this report.
The Trustees noted the performance of the Fund’s Initial Class shares was in the 4th quintile relative to the other funds in the Lipper Classification Index for the one-year period (the 1st quintile being the best performers and the 5th quintile being the worst performers). The total return performance of the Fund was in the 5th quintile for the three-year period and the 4th quintile for the five-year period ended December 31, 2007, relative to the Lipper performance universe. Based on the nature and quality of services provided by MFS and MFS’ explanation of steps taken to improve performance, the Board of Trustees concluded that the Fund’s performance was adequate.
21
Board Review of Investment Advisory Agreement – continued
In the course of their deliberations, the Trustees took into account information provided by MFS during contract review meetings, as well as during investment review meetings conducted with portfolio management personnel during the course of the year.
In assessing the reasonableness of the Fund’s advisory fee, the Trustees considered, among other information, the Fund’s advisory fee and the total expense ratio of the Fund’s Initial Class shares as a percentage of average daily net assets, compared to the advisory fee and total expense ratios of its peer group of funds based on information provided by Lipper Inc. The Trustees also considered the advisory fees charged by MFS to institutional accounts. In comparing these fees, the Trustees considered the generally broader scope of services provided by MFS to the Trust than those provided to institutional accounts. The Trustees also considered the higher demands placed on MFS’ investment personnel and trading infrastructure as a result of the daily cash in-flows and out-flows of the Fund, and the impact on MFS and related expenses due to the more extensive regulatory regime to which the Fund is subject, compared to institutional accounts.
In considering the fees, the Trustees noted from the Lipper data that the Fund’s effective advisory fee rate was above the median and total expense ratio was approximately at the median of such fees and expenses of funds in the Lipper expense group. In addition, the Trustees noted that MFS currently observes an expense limitation for the Fund. The Trustees further concluded that the existing breakpoints were sufficient to allow the Fund to benefit from economies of scale as its assets grow. The Trustees concluded that the fees were reasonable in light of the nature and quality of services provided.
The Trustees also considered information prepared by MFS relating to its costs and profits with respect to the Fund and other investment companies and accounts advised by MFS, as well as MFS’ methodologies used to determine and allocate its costs to the Fund and other accounts and products for purposes of estimating profitability.
After reviewing these and other factors described below, the Trustees concluded that the advisory fees charged to the Fund represent reasonable compensation in light of the nature and quality of the services being provided by MFS.
In addition, the Trustees considered MFS’ resources and related efforts to continue to retain, attract and motivate capable personnel to serve the Fund. The Trustees also considered the financial resources of MFS and its parent, Sun Life Financial Inc. The Trustees further considered any advantages and possible disadvantages of having an adviser which also serves other investment companies as well as institutional accounts.
The Trustees also considered the nature, quality, cost, and extent of administrative, transfer agency, and distribution services provided to the Fund by MFS and its affiliates under agreements and plans other than the investment advisory agreement, including the 12b-1 fees the Fund pays to MFS Fund Distributors, Inc., an affiliate of MFS. The Trustees also considered the nature, extent and quality of certain other services MFS performs or arranges on the Fund’s behalf, which may include securities lending programs, directed expense payment programs, class action recovery programs, and MFS’ interaction with third-party service providers, principally custodians and sub-custodians. The Trustees concluded that the various non-advisory services provided by MFS and its affiliates on behalf of the Fund were satisfactory. The Trustees also considered the benefits to MFS from the use of the Fund’s portfolio brokerage commissions to pay for research and other similar services and various other factors. Additionally, the Trustees considered so-called “fall-out benefits” to MFS such as reputational value derived from serving as investment manager to the Trust, and determined that any such benefits derived by MFS were reasonable and fair.
Based on their evaluation of factors that they deemed to be material, including those factors described above, the Board of Trustees, including a majority of the independent Trustees, concluded that the investment advisory agreement should be continued for an additional one-year period, commencing September 1, 2008.
A discussion regarding the Board’s most recent review and renewal of the fund’s Investment Advisory Agreement with MFS is available by clicking on the fund’s name under “Variable Insurance Portfolios-VIT II” in the “Products & Performance” section on the MFS Web site (mfs.com).
22
PROXY VOTING POLICIES AND INFORMATION
A general description of the MFS funds’ proxy voting policies and procedures is available without charge, upon request, by calling
1-800-225-2606, by visiting the Proxy Voting section of mfs.com or by visiting the SEC’s Web site at http://www.sec.gov.
Information regarding how the fund voted proxies relating to portfolio securities during the most recent twelve-month period ended June 30 is available without charge by visiting the Proxy Voting section of mfs.com or by visiting the SEC’s Web site at http://www.sec.gov.
QUARTERLY PORTFOLIO DISCLOSURE
The fund will file a complete schedule of portfolio holdings with the Securities and Exchange Commission (the Commission) for the first and third quarters of each fiscal year on Form N-Q. The fund’s Form N-Q may be reviewed and copied at the:
Public Reference Room
Securities and Exchange Commission
100 F Street, NE, Room 1580
Washington, D.C. 20549
Information on the operation of the Public Reference Room may be obtained by calling the Commission at 1-800-SEC-0330. The fund’s Form N-Q is available on the EDGAR database on the Commission’s Internet Web site at http://www.sec.gov, and copies of this information may be obtained, upon payment of a duplicating fee, by electronic request at the following e-mail address: publicinfo@sec.gov or by writing the Public Reference Section at the above address.
FEDERAL TAX INFORMATION (unaudited)
The following information is provided pursuant to provisions of the Internal Revenue Code.
For corporate shareholders, 100.00% of the ordinary income dividends paid during the fiscal year qualify for the corporate dividends received deduction.
23
MFS® PRIVACY NOTICE
Privacy is a concern for every investor today. At MFS Investment Management® and the MFS funds, we take this concern very seriously. We want you to understand our policies about the investment products and services that we offer, and how we protect the nonpublic personal information of investors who have a direct relationship with us and our wholly owned subsidiaries.
Throughout our business relationship, you provide us with personal information. We maintain information and records about you, your investments, and the services you use. Examples of the nonpublic personal information we maintain include
| | Ÿ | | data from investment applications and other forms |
| | Ÿ | | share balances and transactional history with us, our affiliates, or others |
| | Ÿ | | facts from a consumer reporting agency |
We do not disclose any nonpublic personal information about our customers or former customers to anyone, except as permitted by law. We may share nonpublic personal information with third parties or certain of our affiliates in connection with servicing your account or processing your transactions. We may share information with companies or financial institutions that perform marketing services on our behalf or with other financial institutions with which we have joint marketing arrangements, subject to any legal requirements.
Authorization to access your nonpublic personal information is limited to appropriate personnel who provide products, services, or information to you. We maintain physical, electronic, and procedural safeguards to help protect the personal information we collect about you.
If you have any questions about the MFS privacy policy, please call 1-800-225-2606 any business day between 8 a.m. and 8 p.m. Eastern time.
Note: If you own MFS products or receive MFS services in the name of a third party such as a bank or broker-dealer, their privacy policy may apply to you instead of ours.
24


MFS® UTILITIES PORTFOLIO
The report is prepared for the general information of contract owners. It is authorized for distribution to prospective investors only when preceded or accompanied by a current prospectus.
NOT FDIC INSURED Ÿ MAY LOSE VALUE Ÿ NO BANK GUARANTEE Ÿ NOT A DEPOSIT Ÿ NOT INSURED BY ANY FEDERAL GOVERNMENT AGENCY OR NCUA/NCUSIF
LETTER FROM THE CEO

Dear Contract Owners:
The market downturns and economic setbacks of late probably rank among the worst financial declines most of us have experienced. Inevitably, people may be questioning their commitment to investing. Still, it is important to remember that downturns are an inescapable part of the business cycle. Such troughs have been seen before, and if we can use history as a guide, market recoveries typically have followed.
Recent events have clearly shown us the value of certain types of investments. In this environment, two of the hallmarks of mutual funds — transparency and liquidity — have become critically important. Unlike some other types of investments, the operations of mutual funds are relatively transparent to their shareholders. With their daily redemption feature, mutual funds also generally provide easy, convenient access to one’s money. Through these recent market upheavals, this level of liquidity enhanced the ability of mutual fund investors to respond and modify their investments as they and their advisors saw fit — a flexibility that those in less liquid investments simply did not have at their disposal.
At MFS® we take particular pride in how well mutual funds can serve investors because we invented the mutual fund in the United States. Established in 1924, Massachusetts Investors Trust was the nation’s first fund. Recent market events only reinforce what we have learned through 85 years — that mutual funds provide unique features that are important to investors in any type of market climate.
Respectfully,

Robert J. Manning
Chief Executive Officer and Chief Investment Officer
MFS Investment Management®
February 17, 2009
The opinions expressed in this letter are subject to change, may not be relied upon for investment advice, and no forecasts can be guaranteed.
Before investing, consider the fund’s investment objectives, risks, charges, and expenses. For a prospectus containing this and other information, contact your investment professional or view online. Read it carefully.
MFS Fund Distributors, Inc., 500 Boylston Street, Boston, MA 02116
1
PORTFOLIO COMPOSITION
Portfolio structure (i)
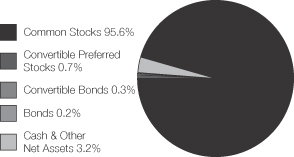
| | |
| Top ten holdings (i) | | |
| NRG Energy, Inc. | | 5.6% |
| Equitable Resources, Inc. | | 4.2% |
| E.ON AG | | 3.3% |
| Rogers Communications, Inc., “B” | | 3.2% |
| Public Service Enterprise Group, Inc. | | 3.0% |
| Allegheny Energy, Inc. | | 3.0% |
| American Electric Power Co., Inc. | | 2.9% |
| Telefonica S.A. | | 2.9% |
| CMS Energy Corp. | | 2.9% |
| Sempra Energy | | 2.7% |
| | |
| Top five industries (i) | | |
| Uilities – Electric Power | | 46.7% |
| Telecommunications – Wireless | | 13.9% |
| Telephone Services | | 11.1% |
| Natural Gas – Distribution | | 9.8% |
| Natural Gas – Pipeline | | 6.7% |
| | |
| Country weightings (i) | | |
| United States | | 66.6% |
| Spain | | 6.3% |
| Canada | | 5.2% |
| Germany | | 3.7% |
| United Kingdom | | 3.6% |
| Brazil | | 3.5% |
| Mexico | | 2.6% |
| Israel | | 2.3% |
| Czech Republic | | 1.4% |
| Other Countries | | 4.8% |
| (i) | For purposes of this presentation, the bond component includes accrued interest amounts and may be positively or negatively impacted by the equivalent exposure from any derivative holdings, if applicable. |
Percentages are based on net assets as of 12/31/08.
The portfolio is actively managed and current holdings may be different.
2
MANAGEMENT REVIEW
Summary of Results
For the twelve months ended December 31, 2008, Initial Class shares of the MFS Utilities Portfolio (the “fund”) provided a total return of –37.16%, while Service Class shares of the fund provided a total return of –37.31%. These returns include the impact of a material class action settlement received by the fund during the reporting period (see Performance Summary for details). The fund’s returns compare with a return of –37.00% for the fund’s benchmark, the Standard & Poor’s 500 Stock Index, and a return of –28.98% for the fund’s other benchmark, the Standard & Poor’s 500 Utilities Index (S&P Utilities Index).
Market Environment
The U.S. economy and financial markets experienced significant deterioration and extraordinary volatility over the reporting period. U.S. economic growth slowed significantly, despite the short-term bounce from the second quarter fiscal stimulus. Strong domestic headwinds included accelerated deterioration in the housing market, anemic corporate investment, a rapidly declining job market, and a much tighter credit environment. During the period, a seemingly continuous series of tumultuous financial events hammered markets, including: the distressed sale of failing Bear Stearns to JPMorgan, the conservatorship of Government Sponsored Enterprises (GSEs) Fannie Mae and Freddie Mac, the bankruptcy of investment bank Lehman Brothers, the Federal Reserve Bank’s complex intervention of insurance company American International Group (AIG), the nationalization of several large European banks, the failure of Washington Mutual, and the distressed sale of Wachovia. As a result of this barrage of turbulent news, global equity markets pushed significantly lower and credit markets witnessed the worst dislocation since the beginning of the credit crisis. Though conditions improved towards the end of the period, the state of financial and macroeconomic dislocation remained severe.
While reasonably resilient during the first half of the period, the global economy and financial system increasingly experienced considerable negative spillovers from the U.S. slowdown. Not only did Europe and Japan show obvious signs of economic softening, the more powerful engine of global growth – emerging markets – also displayed weakening dynamics.
During the reporting period, the U.S. Federal Reserve Board cut interest rates aggressively and introduced a multitude of new lending facilities to alleviate ever-tightening credit markets, while the U.S. federal government moved quickly to design and implement a meaningful fiscal stimulus package. Although several other global central banks also cut rates, the dilemma of rising energy and food prices heightened concerns among central bankers that inflationary expectations might become unhinged despite weaker growth. Only later in the reporting period did slowing global growth result in a very precipitous decline in commodity prices, which significantly eased inflation and inflationary expectations. As inflationary concerns diminished in the face of global deleveraging, and equity and credit markets deteriorated more sharply, a coordinated rate cut marked the beginning of much more aggressive easing by the major global central banks.
Detractors from Performance
During the reporting period, stock selection in the electric power industry detracted from the fund’s performance relative to the S&P Utilities Index. Power distribution company PG&E Corp. and power generation companies, Reliant Energy (aa)(g), E.ON AG (Germany) (aa), and International Power (U.K.) (aa), were among the fund’s top detractors. Shares of International Power fell substantially during the latter part of the reporting period due to falling commodity prices and a weaker British pound. Not owning power distributor Southern Company, which outperformed the S&P Utilities Index, also dampened relative results.
The fund’s holdings in the wireless communications industry, which is not represented in the S&P Utilities Index, also had a negative impact on relative returns. Mobile phone service providers Mobile TeleSystems (aa) (Russia) and NII Holdings (Latin America) (aa) were among the fund’s top relative detractors within this industry. Despite being a major wireless communications provider in Latin America with strong growth and a solid balance sheet, shares of NII Holdings were hit hard given its exposure to emerging market countries and currencies during the market sell off.
The fund’s holdings in the natural gas pipeline industry, which is also not represented in the S&P Utilities Index, hindered relative performance as well. Top detractors in this sector included gas pipeline companies, El Paso (aa) and Williams Cos. (aa).
Elsewhere, the fund’s holdings of poor-performing oilfield services provider Halliburton (aa) hurt relative returns.
During the reporting period, the fund’s currency exposure was also a detractor from relative performance. All of MFS’ investment decisions are driven by the fundamentals of each individual opportunity and as such, it is common for our funds to have different currency exposure than the benchmark.
3
Management Review – continued
Contributors to Performance
Security selection in the natural gas distribution industry was the principal investment factor contributing to relative performance. Within this industry, the fund’s positioning in integrated natural gas company Equitable Resources benefited relative results. The fund captured positive relative performance, in the latter part of the reporting period, as the stock outperformed the S&P Utilities Index.
The fund’s holdings in the cable TV industry, which is not represented in the S&P Utilities Index, also aided relative returns. Cable services provider Comcast (aa) was among the fund’s top contributors within this industry for the reporting period. Comcast reported quarterly earnings that exceeded consensus expectations and attributed the positive results to favorable subscriber trends due to increased operations and marketing.
Although the fund’s investments in the electric power industry underperformed the S&P Utilities Index, several individual securities within this industry were positive contributors. These included electric utility companies, Constellation Energy Group, Public Service Enterprise Group, Allegheny Energy, and Northeast Utilities (aa), along with independent power producer AES Corp. The fund’s positioning in electric utility distributor PPL Corp. also helped as the fund was less impacted by the stock’s price decline, in the latter part of the reporting period, than the benchmark.
Elsewhere, holdings of telecommunications services provider Verizon Communications (aa)(g) aided relative performance as the stock outperformed the S&P Utilities Index over the reporting period.
The fund’s cash position also boosted relative returns. The fund holds cash to buy new holdings and to provide liquidity. In a period when equity markets declined, as measured by the fund’s benchmark, holding cash helped performance versus this benchmark, which has no cash position.
Respectfully,
| | |
| Robert Persons | | Maura Shaughnessy |
| Portfolio Manager | | Portfolio Manager |
| (aa) | | Security is not a benchmark constituent. |
| (g) | | Security was not held in the portfolio at period end. |
The views expressed in this report are those of the portfolio managers only through the end of the period of the report as stated on the cover and do not necessarily reflect the views of MFS or any other person in the MFS organization. These views are subject to change at any time based on market or other conditions, and MFS disclaims any responsibility to update such views. These views may not be relied upon as investment advice or an indication of trading intent on behalf of any MFS portfolio. References to specific securities are not recommendations of such securities, and may not be representative of any MFS portfolio’s current or future investments.
4
PERFORMANCE SUMMARY THROUGH 12/31/08
The following chart illustrates the historical performance of the fund in comparison to its benchmark(s). Benchmark comparisons are unmanaged; do not reflect any fees or expenses; and cannot be invested in directly. The performance of other share classes will be greater than or less than that of the class depicted below. (See Notes to Performance Summary.)
Performance data shown represents past performance and is no guarantee of future results. Investment return and principal value fluctuate so your units, when sold, may be worth more or less than the original cost; current performance may be lower or higher than quoted. The performance shown does not reflect the deduction of taxes, if any, that a contract holder would pay on fund distributions or the redemption of contract units. The returns for the fund shown also do not reflect the deduction of expenses associated with variable products, such as mortality and expense risk charges, separate account charges, and sales charges imposed by the insurance company separate accounts. Such expenses would reduce the overall returns shown.
Growth of a hypothetical $10,000 investment
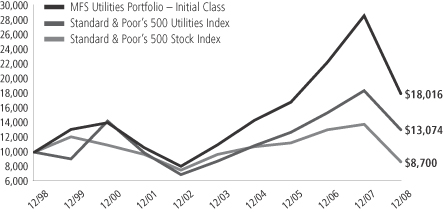
Total rates of return through 12/31/08
Average Annual Total Returns
| | | | | | | | | | | | |
| | | Share class | | Class inception date | | 1-yr | | 5-yr | | 10-yr | | |
| | | Initial Class | | 11/16/93 | | (37.16)% | | 10.32% | | 6.06% | | |
| | | Service Class | | 8/24/01 | | (37.31)% | | 10.04% | | 5.86% | | |
Comparative Benchmarks
| | | | | | | | | | | | |
| | | Standard & Poor’s 500 Utilities Index (f) | | (28.98)% | | 8.29% | | 2.72% | | |
| | | Standard & Poor’s 500 Stock Index (f) | | (37.00)% | | (2.19)% | | (1.38)% | | |
| (f) | Source: FactSet Research Systems Inc. |
Included in the Initial Class and Service Class total returns for the year ended December 31, 2008 are proceeds received from a non-recurring litigation settlement with Enron Corp., had these proceeds not been included the 1-yr total returns would have each been lower by approximately 1.01%.
Benchmark Definitions
Standard & Poor’s 500 Utilities Index – a market capitalization-weighted index designed to measure the utilities sector, including those companies considered electric, gas or water utilities, or companies that operate as independent producers and/or distributors of power.
Standard & Poor’s 500 Stock Index – a market capitalization-weighted index of 500 widely held equity securities, designed to measure broad U.S. equity performance.
It is not possible to invest directly in an index.
Notes to Performance Summary
Performance for the Service Class includes the performance of the fund’s Initial Class for periods prior to their offering. Because Service Class expenses are higher than those of Initial Class, performance shown for Service Class is higher than it
5
Performance Summary – continued
would have been had it been offered for the entire period. Performance has not been adjusted to take into account differences in class specific operating expenses (such as Rule 12b-1 fees). Please see the prospectus for additional information about performance and expenses.
Performance results reflect any applicable expense subsidies and waivers in effect during the periods shown. Without such subsidies and waivers the fund’s performance results would be less favorable. Please see the prospectus for complete details. All results are historical and assume the reinvestment of any dividends and capital gains distributions.
From time to time the fund may receive proceeds from litigation settlements, without which performance would be lower.
6
EXPENSE TABLE
Fund Expenses Borne by the Contract Holders During the Period,
July 1, 2008 through December 31, 2008
As a contract holder of the fund, you incur ongoing costs, including management fees; distribution (12b-1) fees; and other fund expenses. This example is intended to help you understand your ongoing costs (in dollars) of investing in the fund and to compare these costs with the ongoing costs of investing in other mutual funds.
The example is based on an investment of $1,000 invested at the beginning of the period and held for the entire period July 1, 2008 through December 31, 2008.
Actual Expenses
The first line for each share class in the following table provides information about actual account values and actual expenses. You may use the information in this line, together with the amount you invested, to estimate the expenses that you paid over the period. Simply divide your account value by $1,000 (for example, an $8,600 account value divided by $1,000 = 8.6), then multiply the result by the number in the first line under the heading entitled “Expenses Paid During Period” to estimate the expenses you paid on your account during this period.
Hypothetical Example for Comparison Purposes
The second line for each share class in the following table provides information about hypothetical account values and hypothetical expenses based on the fund’s actual expense ratio and an assumed rate of return of 5% per year before expenses, which is not the fund’s actual return. The hypothetical account values and expenses may not be used to estimate the actual ending account balance or expenses you paid for the period. You may use this information to compare the ongoing costs of investing in the fund and other funds. To do so, compare this 5% hypothetical example with the 5% hypothetical examples that appear in the shareholder reports of the other funds.
Please note that the expenses shown in the table are meant to highlight the fund’s ongoing costs only and do not take into account the fees and expenses imposed under the variable contracts through which your investment in the fund is made. Therefore, the second line for each share class in the table is useful in comparing ongoing costs associated with an investment in vehicles (such as the fund) which fund benefits under variable annuity and variable life insurance contracts and to qualified pension and retirement plans only, and will not help you determine the relative total costs of investing in the fund through variable annuity and variable life insurance contracts. If the fees and expenses imposed under the variable contracts were included, your costs would have been higher.
| | | | | | | | | | |
| Share Class | | | | Annualized
Expense Ratio | | Beginning
Account Value
7/01/08 | | Ending
Account Value
12/31/08 | | Expenses Paid
During Period (p)
7/01/08-12/31/08 |
| Initial Class | | Actual | | 0.91% | | $1,000.00 | | $639.80 | | $3.75 |
| | Hypothetical (h) | | 0.91% | | $1,000.00 | | $1,020.56 | | $4.62 |
| Service Class | | Actual | | 1.15% | | $1,000.00 | | $639.15 | | $4.74 |
| | Hypothetical (h) | | 1.15% | | $1,000.00 | | $1,019.36 | | $5.84 |
| (h) | 5% class return per year before expenses. |
| (p) | Expenses paid is equal to each class’ annualized expense ratio, as shown above, multiplied by the average account value over the period, multiplied by the number of days in the period, divided by the number of days in the year. |
7
PORTFOLIO OF INVESTMENTS – 12/31/08
The Portfolio of Investments is a complete list of all securities owned by your fund. It is categorized by broad-based asset classes.
| | | | | |
| Issuer | | Shares/Par | | Value ($) |
| | | | | |
| COMMON STOCKS – 95.6% | | | |
| Broadcasting – 0.5% | | | | | |
| Grupo Televisa S.A., ADR | | 78,500 | | $ | 1,172,791 |
| | | | | |
| Cable TV – 4.1% | | | | | |
| Comcast Corp., “Special A” | | 253,400 | | $ | 4,092,410 |
| Time Warner Cable, Inc., “A” (a) | | 313,600 | | | 6,726,720 |
| | | | | |
| | | | $ | 10,819,130 |
| | | | | |
| Energy – Independent – 2.4% | | | | | |
| Devon Energy Corp. | | 13,800 | | $ | 906,798 |
| EOG Resources, Inc. | | 21,800 | | | 1,451,444 |
| Ultra Petroleum Corp. (a) | | 30,200 | | | 1,042,202 |
| XTO Energy, Inc. | | 82,250 | | | 2,900,958 |
| | | | | |
| | | | $ | 6,301,402 |
| | | | | |
| Natural Gas – Distribution – 9.8% | | | |
| Energen Corp. | | 88,600 | | $ | 2,598,638 |
| Equitable Resources, Inc. | | 328,900 | | | 11,034,595 |
| Questar Corp. | | 156,600 | | | 5,119,254 |
| Sempra Energy | | 163,500 | | | 6,970,005 |
| | | | | |
| | | | $ | 25,722,492 |
| | | | | |
| Natural Gas – Pipeline – 5.8% | | | | | |
| El Paso Corp. | | 762,000 | | $ | 5,966,460 |
| Enagas S.A. | | 150,774 | | | 3,307,593 |
| Williams Cos., Inc. | | 412,817 | | | 5,977,590 |
| | | | | |
| | | | $ | 15,251,643 |
| | | | | |
| Oil Services – 1.3% | | | | | |
| Halliburton Co. | | 28,700 | | $ | 521,766 |
| Noble Corp. | | 73,900 | | | 1,632,451 |
| Transocean, Inc. (a) | | 27,100 | | | 1,280,475 |
| | | | | |
| | | | $ | 3,434,692 |
| | | | | |
| Telecommunications – Wireless – 13.9% | | | |
| America Movil S.A.B. de C.V., “L”, ADR | | 182,200 | | $ | 5,646,378 |
| Cellcom Israel Ltd. | | 271,522 | | | 6,000,636 |
| China Mobile Ltd., ADR | | 10,000 | | | 508,500 |
| Hutchison Telecommunications International Ltd. | | 1,361,000 | | | 365,265 |
| Mobile TeleSystems OJSC, ADR | | 107,100 | | | 2,857,428 |
| MTN Group Ltd. | | 168,200 | | | 1,990,117 |
| NII Holdings, Inc. “B” (a) | | 146,100 | | | 2,656,098 |
| Rogers Communications, Inc., “B” | | 282,400 | | | 8,370,203 |
| Tim Participacoes S.A., ADR (l) | | 82,300 | | | 1,027,927 |
| Vivo Participacoes S.A., ADR | | 108,775 | | | 1,364,039 |
| Vodafone Group PLC | | 2,875,000 | | | 5,787,702 |
| | | | | |
| | | | $ | 36,574,293 |
| | | | | |
| Telephone Services – 11.1% | | | | | |
| AT&T, Inc. | | 195,800 | | $ | 5,580,300 |
| BCE, Inc. | | 176,800 | | | 3,599,015 |
| CenturyTel, Inc. | | 75,200 | | | 2,055,216 |
| Embarq Corp. | | 80,100 | | | 2,880,396 |
| Royal KPN N.V. | | 236,500 | | | 3,429,452 |
| Telefonica S.A. | | 342,500 | | | 7,677,297 |
| | | | | | |
| Issuer | | Shares/Par | | Value ($) |
| | | | | | |
| COMMON STOCKS – continued | | | |
| Telephone Services – continued | | | | | | |
| TELUS Corp. | | | 61,580 | | $ | 1,740,901 |
| Windstream Corp. | | | 220,255 | | | 2,026,346 |
| | | | | | |
| | | | | $ | 28,988,923 |
| | | | | | |
| Utilities – Electric Power – 46.7% | | | |
| AES Corp. (a) | | | 697,300 | | $ | 5,745,752 |
| AES Tiete S.A., IPS | | | 338,254 | | | 2,193,180 |
| Allegheny Energy, Inc. | | | 229,500 | | | 7,770,870 |
| American Electric Power Co., Inc. | | | 232,000 | | | 7,720,960 |
| CEZ AS | | | 91,000 | | | 3,698,005 |
| CMS Energy Corp. | | | 744,000 | | | 7,521,840 |
| Constellation Energy Group, Inc. | | | 77,500 | | | 1,944,475 |
| DPL, Inc. | | | 171,100 | | | 3,907,924 |
| Dynegy, Inc., “A” (a) | | | 929,898 | | | 1,859,796 |
| E.ON AG | | | 215,316 | | | 8,706,767 |
| Edison International | | | 179,600 | | | 5,768,752 |
| EDP Renovaveis S.A. (a) | | | 119,459 | | | 836,563 |
| Eletropaulo Metropolitana S.A., IPS | | | 402,540 | | | 4,514,580 |
| FirstEnergy Corp. | | | 90,500 | | | 4,396,490 |
| Fortum Corp. | | | 31,000 | | | 665,861 |
| Iberdrola S.A. (a) | | | 257,800 | | | 1,114,590 |
| International Power PLC | | | 849,000 | | | 2,947,803 |
| Northeast Utilities | | | 239,500 | | | 5,762,370 |
| NRG Energy, Inc. (a) | | | 624,186 | | | 14,562,275 |
| Oesterreichische Elektrizitaetswirtschafts AG (Verbund), “A” | | | 43,900 | | | 2,014,455 |
| Pepco Holdings, Inc. | | | 61,880 | | | 1,098,989 |
| PG&E Corp. | | | 27,300 | | | 1,056,783 |
| PPL Corp. | | | 220,600 | | | 6,770,214 |
| Public Service Enterprise Group, Inc. | | | 266,600 | | | 7,776,722 |
| Red Electrica de Espana | | | 90,624 | | | 4,591,237 |
| RWE AG | | | 13,000 | | | 1,168,656 |
| Scottish & Southern Energy PLC | | | 36,500 | | | 642,685 |
| Wisconsin Energy Corp. | | | 14,900 | | | 625,502 |
| Xcel Energy, Inc. | | | 267,730 | | | 4,966,392 |
| | | | | | |
| | | | | $ | 122,350,488 |
| | | | | | |
Total Common Stocks
(Identified Cost, $327,828,198) | | | | | $ | 250,615,854 |
| | | | | | |
| | |
| BONDS – 0.2% | | | | | | |
| Asset Backed & Securitized – 0.0% | | | | | | |
Falcon Franchise Loan LLC, FRN,
2.96%, 2023 (i)(n) | | $ | 705,896 | | $ | 38,683 |
| | | | | | |
| Natural Gas – Pipeline – 0.2% | | | | | | |
| El Paso Corp., 12%, 2013 | | $ | 570,000 | | $ | 558,600 |
| | | | | | |
| Utilities – Electric Power – 0.0% | | | | | | |
| TXU Eastern Funding Co., 6.75%, 2009 (d) | | $ | 191,000 | | $ | 5,730 |
| | | | | | |
Total Bonds
(Identified Cost, $713,993) | | | | | $ | 603,013 |
| | | | | | |
8
Portfolio of Investments – continued
| | | | | | |
| Issuer | | Shares/Par | | Value ($) |
| | | | | | |
|
| CONVERTIBLE PREFERRED STOCKS – 0.7% |
| Natural Gas – Pipeline – 0.7% | | | | | | |
El Paso Corp., 4.99%
(Identified Cost, $3,061,086) | | | 2,720 | | $ | 1,795,200 |
| | | | | | |
|
| CONVERTIBLE BONDS – 0.3% |
| Energy – Independent – 0.3% | | | | | | |
| Peabody Energy Corp., 4.75%, 2066 (Identified Cost, $1,414,272) | | $ | 1,310,000 | | $ | 786,000 |
| | | | | | |
| | |
| REPURCHASE AGREEMENTS – 4.6% | | | | | | |
Goldman Sachs, 0.01%, dated 12/31/08, due 1/02/09, total to be received $9,527,005 (secured by U.S. Treasury
and Federal Agency obligations and Mortgage Backed securities in a jointly traded account) | | $ | 9,527,000 | | $ | 9,527,000 |
| | | | | | | |
| Issuer | | Shares/Par | | Value ($) | |
| | | | | | | |
| REPURCHASE AGREEMENTS – continued | |
Morgan Stanley, 0.02%, dated 12/31/08, due 1/02/09, total to be received $2,542,003 (secured by U.S. Treasury
and Federal Agency obligations and Mortgage Backed securities in a jointly traded account) | | $ | 2,542,000 | | $ | 2,542,000 | |
| | | | | | | |
| Total Repurchase Agreements, at Cost | | | | | $ | 12,069,000 | |
| | | | | | | |
| |
| COLLATERAL FOR SECURITIES LOANED – 0.1% | | | | |
| Navigator Securities Lending Prime Portfolio, at Cost and Net Asset Value | | | 169,650 | | $ | 169,650 | |
| | | | | | | |
Total Investments
(Identified Cost, $345,256,199) | | | | | $ | 266,038,717 | |
| | | | | | | |
OTHER ASSETS, LESS
LIABILITIES – (1.5)% | | | | | | (3,985,773 | ) |
| | | | | | | |
| Net Assets – 100.0% | | | | | $ | 262,052,944 | |
| | | | | | | |
| (a) | | Non-income producing security. |
| (d) | | Non-income producing security – in default. |
| (i) | | Interest only security for which the series receives interest on notional principal (Par amount). Par amount shown is the notional principal and does not reflect the cost of the security. |
| (l) | | All or a portion of this security is on loan. |
| (n) | | Securities exempt from registration under Rule 144A of the Securities Act of 1933. These securities may be sold in the ordinary course of business in transactions exempt from registration, normally to qualified institutional buyers. At period end, the aggregate value of these securities was $38,683, representing 0.01% of net assets. |
The following abbreviations are used in this report and are defined:
| ADR | | American Depository Receipt |
| FRN | | Floating Rate Note. Interest rate resets periodically and may not be the rate reported at period end. |
| IPS | | International Preference Stock |
Abbreviations indicate amounts shown in currencies other than the U.S. dollar. All amounts are stated in U.S. dollars unless otherwise indicated. A list of abbreviations is shown below:
Derivative Contracts at 12/31/08
Forward Foreign Currency Exchange Contracts at 12/31/08
| | | | | | | | | | | | | | | | | | |
Type | | Currency | | Contracts to
Deliver/Receive | | Settlement Date
Range | | In Exchange For | | Contracts
at Value | | Net Unrealized
Appreciation
(Depreciation) | |
| Appreciation | | | | | | | | | | | | | | | | |
| | SELL | | EUR | | 20,856,409 | | 2/19/09 | | $ | 29,881,386 | | $ | 28,939,185 | | $ | 942,201 | |
| | SELL | | GBP | | 4,344,480 | | 2/17/09 | | | 6,457,060 | | | 6,239,282 | | | 217,778 | |
| | | | | | | | | | | | | | | | | | |
| | | | | | | | | | | | | | | | $ | 1,159,979 | |
| | | | | | | | | | | | | | | | | | |
| Depreciation | | | | | | | | | | | | | | | | |
| | BUY | | EUR | | 4,416,858 | | 2/17/09-2/19/09 | | $ | 6,313,641 | | $ | 6,128,599 | | $ | (185,042 | ) |
At December 31, 2008, the fund had sufficient cash and/or securities to cover any commitments under these derivative contracts.
See Notes to Financial Statements
9
FINANCIAL STATEMENTS | STATEMENT OF ASSETS AND LIABILITIES
This statement represents your fund’s balance sheet, which details the assets and liabilities comprising the total value of the fund.
| | | | | |
At 12/31/08 | | | | | |
Assets | | | | | |
Investments, at value, including $162,995 of securities on loan (identified cost, $345,256,199) | | $266,038,717 | | | |
Cash | | 765 | | | |
Receivable for forward foreign currency exchange contracts | | 1,159,979 | | | |
Receivable for investments sold | | 1,450,148 | | | |
Receivable for fund shares sold | | 82,850 | | | |
Interest and dividends receivable | | 718,781 | | | |
Other assets | | 9,834 | | | |
Total assets | | | | | $269,461,074 |
Liabilities | | | | | |
Payable for forward foreign currency exchange contracts | | $185,042 | | | |
Payable for investments purchased | | 6,703,150 | | | |
Payable for fund shares reacquired | | 184,141 | | | |
Collateral for securities loaned, at value | | 169,650 | | | |
Payable to affiliates | | | | | |
Management fee | | 10,437 | | | |
Distribution fees | | 1,103 | | | |
Administrative services fee | | 769 | | | |
Payable for trustees’ compensation | | 458 | | | |
Accrued expenses and other liabilities | | 153,380 | | | |
Total liabilities | | | | | $7,408,130 |
Net assets | | | | | $262,052,944 |
Net assets consist of | | | | | |
Paid-in capital | | $355,850,017 | | | |
Unrealized appreciation (depreciation) on investments and translation of assets and liabilities in foreign currencies | | (78,252,419 | ) | | |
Accumulated net realized gain (loss) on investments and foreign currency transactions | | (27,572,321 | ) | | |
Undistributed net investment income | | 12,027,667 | | | |
Net assets | | | | | $262,052,944 |
Shares of beneficial interest outstanding | | | | | 16,894,647 |
Initial Class shares | | | | | |
Net assets | | $178,804,519 | | | |
Shares outstanding | | 11,491,514 | | | |
Net asset value per share | | | | | $15.56 |
Service Class shares | | | | | |
Net assets | | $83,248,425 | | | |
Shares outstanding | | 5,403,133 | | | |
Net asset value per share | | | | | $15.41 |
See Notes to Financial Statements
10
FINANCIAL STATEMENTS | STATEMENT OF OPERATIONS
This statement describes how much your fund earned in investment income and accrued in expenses. It also describes any gains and/or losses generated by fund operations.
| | | | | | |
| Year ended 12/31/08 | | | | | | |
| Net investment income | | | | | | |
Income | | | | | | |
Dividends | | $14,482,318 | | | | |
Interest | | 586,287 | | | | |
Foreign taxes withheld | | (715,235 | ) | | | |
Total investment income | | | | | $14,353,370 | |
Expenses | | | | | | |
Management fee | | $2,902,708 | | | | |
Distribution fees | | 278,561 | | | | |
Administrative services fee | | 121,076 | | | | |
Trustees’ compensation | | 54,017 | | | | |
Custodian fee | | 211,771 | | | | |
Shareholder communications | | 43,517 | | | | |
Auditing fees | | 47,975 | | | | |
Legal fees | | 13,224 | | | | |
Miscellaneous | | 39,083 | | | | |
Total expenses | | | | | $3,711,932 | |
Fees paid indirectly | | (1,420 | ) | | | |
Net expenses | | | | | $3,710,512 | |
Net investment income | | | | | $10,642,858 | |
| Realized and unrealized gain (loss) on investments and foreign currency transactions | | | | | | |
Realized gain (loss) (identified cost basis) | | | | | | |
Investment transactions (s) | | $(27,523,262 | ) | | | |
Foreign currency transactions | | 1,615,705 | | | | |
Net realized gain (loss) on investments and foreign currency transactions | | | | | $(25,907,557 | ) |
Change in unrealized appreciation (depreciation) | | | | | | |
Investments (net of $18,316 decrease in deferred country tax) | | $(157,630,515 | ) | | | |
Translation of assets and liabilities in foreign currencies | | 816,550 | | | | |
Net unrealized gain (loss) on investments and foreign currency translation | | | | | $(156,813,965 | ) |
Net realized and unrealized gain (loss) on investments and foreign currency | | | | | $(182,721,522 | ) |
Change in net assets from operations | | | | | $(172,078,664 | ) |
| (s) | Includes proceeds received from a non-recurring cash settlement in the amount of $2,534,437 from a litigation settlement against Enron Corp. |
See Notes to Financial Statements
11
FINANCIAL STATEMENTS | STATEMENTS OF CHANGES IN NET ASSETS
These statements describe the increases and/or decreases in net assets resulting from operations, any distributions, and any shareholder transactions.
| | | | | | |
For years ended 12/31 | | 2008 | | | 2007 | |
Change in net assets | | | | | | |
From operations | | | | | | |
Net investment income | | $10,642,858 | | | $10,564,614 | |
Net realized gain (loss) on investments and foreign currency transactions | | (25,907,557 | ) | | 115,471,737 | |
Net unrealized gain (loss) on investments and foreign currency translation | | (156,813,965 | ) | | (3,614,826 | ) |
Change in net assets from operations | | $(172,078,664 | ) | | $122,421,525 | |
Distributions declared to shareholders | | | | | | |
From net investment income | | | | | | |
Initial Class | | $(5,508,025 | ) | | $(5,212,212 | ) |
Service Class | | (1,870,950 | ) | | (1,129,740 | ) |
From net realized gain on investments | | | | | | |
Initial Class | | (50,644,712 | ) | | — | |
Service Class | | (19,570,542 | ) | | — | |
Total distributions declared to shareholders | | $(77,594,229 | ) | | $(6,341,952 | ) |
Change in net assets from fund share transactions | | $3,940,360 | | | $(64,307,493 | ) |
Total change in net assets | | $(245,732,533 | ) | | $51,772,080 | |
Net assets | | | | | | |
At beginning of period | | 507,785,477 | | | 456,013,397 | |
At end of period (including undistributed net investment income of $12,027,667 and
$7,152,764, respectively) | | $262,052,944 | | | $507,785,477 | |
See Notes to Financial Statements
12
FINANCIAL STATEMENTS | FINANCIAL HIGHLIGHTS
The financial highlights table is intended to help you understand the fund’s financial performance for the past 5 years. Certain information reflects financial results for a single fund share. The total returns in the table represent the rate by which an investor would have earned (or lost) on an investment in the fund share class (assuming reinvestment of all distributions) held for the entire period.
| | | | | | | | | | | | | | | |
| Initial Class | | Years ended 12/31 | |
| | | 2008 | | | 2007 | | | 2006 | | | 2005 | | | 2004 | |
Net asset value, beginning of period | | $29.51 | | | $23.25 | | | $18.11 | | | $15.61 | | | $12.23 | |
| Income (loss) from investment operations | | | | | | | | | | | | | | | |
Net investment income (d) | | $0.62 | | | $0.58 | | | $0.48 | | | $0.31 | | | $0.30 | |
Net realized and unrealized gain (loss) on investments
and foreign currency | | (9.78 | ) | | 6.02 | | | 5.25 | | | 2.35 | | | 3.34 | |
Total from investment operations | | $(9.16 | ) | | $6.60 | | | $5.73 | | | $2.66 | | | $3.64 | |
| Less distributions declared to shareholders | | | | | | | | | | | | | | | |
From net investment income | | $(0.47 | ) | | $(0.34 | ) | | $(0.59 | ) | | $(0.16 | ) | | $(0.26 | ) |
From net realized gain on investments | | (4.32 | ) | | — | | | — | | | — | | | — | |
Total distributions declared to shareholders | | $(4.79 | ) | | $(0.34 | ) | | $(0.59 | ) | | $(0.16 | ) | | $(0.26 | ) |
Net asset value, end of period | | $15.56 | | | $29.51 | | | $23.25 | | | $18.11 | | | $15.61 | |
Total return (%) (k)(s) | | (37.16 | )(t) | | 28.53 | | | 32.35 | | | 17.23 | | | 30.37 | (b)(v) |
Ratios (%) (to average net assets)
and Supplemental data: | | | | | | | | | | | | | | | |
Expenses (f) | | 0.86 | | | 0.84 | | | 0.84 | | | 0.86 | | | 0.84 | |
Net investment income | | 2.73 | | | 2.18 | | | 2.41 | | | 1.87 | | | 2.25 | |
Portfolio turnover | | 63 | | | 90 | | | 93 | | | 96 | | | 103 | |
Net assets at end of period (000 Omitted) | | $178,805 | | | $381,498 | | | $377,354 | | | $344,717 | | | $328,541 | |
See Notes to Financial Statements
13
Financial Highlights – continued
| | | | | | | | | | | | | | | |
| Service Class | | Years ended 12/31 | |
| | | 2008 | | | 2007 | | | 2006 | | | 2005 | | | 2004 | |
Net asset value, beginning of period | | $29.28 | | | $23.09 | | | $18.01 | | | $15.53 | | | $12.18 | |
| Income (loss) from investment operations | | | | | | | | | | | | | | | |
Net investment income (d) | | $0.57 | | | $0.52 | | | $0.42 | | | $0.27 | | | $0.26 | |
Net realized and unrealized gain (loss) on investments
and foreign currency | | (9.71 | ) | | 5.97 | | | 5.22 | | | 2.35 | | | 3.32 | |
Total from investment operations | | $(9.14 | ) | | $6.49 | | | $5.64 | | | $2.62 | | | $3.58 | |
| Less distributions declared to shareholders | | | | | | | | | | | | | | | |
From net investment income | | $(0.41 | ) | | $(0.30 | ) | | $(0.56 | ) | | $(0.14 | ) | | $(0.23 | ) |
From net realized gain on investments | | (4.32 | ) | | — | | | — | | | — | | | — | |
Total distributions declared to shareholders | | $(4.73 | ) | | $(0.30 | ) | | $(0.56 | ) | | $(0.14 | ) | | $(0.23 | ) |
Net asset value, end of period | | $15.41 | | | $29.28 | | | $23.09 | | | $18.01 | | | $15.53 | |
Total return (%) (k)(s) | | (37.31 | )(t) | | 28.24 | | | 31.96 | | | 16.97 | | | 30.01 | (b)(v) |
Ratios (%) (to average net assets)
and Supplemental data: | | | | | | | | | | | | | | | |
Expenses (f) | | 1.12 | | | 1.08 | | | 1.09 | | | 1.11 | | | 1.09 | |
Net investment income | | 2.57 | | | 1.93 | | | 2.12 | | | 1.62 | | | 2.01 | |
Portfolio turnover | | 63 | | | 90 | | | 93 | | | 96 | | | 103 | |
Net assets at end of period (000 Omitted) | | $83,248 | | | $126,288 | | | $78,660 | | | $47,240 | | | $32,599 | |
| (b) | The fund’s net asset value and total return calculation include a non-recurring accrual recorded as a result of an administrative proceeding regarding disclosure of brokerage allocation practices in connection with fund sales. The non-recurring accrual did not have a material impact on the net asset value per share based on the shares outstanding on the day the accrual was recorded. |
| (d) | Per share data are based on average shares outstanding. |
| (f) | Ratios do not reflect reductions from fees paid indirectly, if applicable. |
| (k) | The total return does not reflect expenses that apply to separate accounts. Inclusion of these charges would reduce the total return figures for all periods shown. |
| (s) | From time to time the fund may receive proceeds from litigation settlements, without which performance would be lower. |
| (t) | Excluding the effect of the proceeds received from a non-recurring litigation settlement against Enron Corp., the Initial Class and service Class total returns for the year ended December 31, 2008 would have been lower by approximately 1.01%. |
| (v) | The fund’s total return calculation includes a net increase from gains realized on the disposal of investments in violation of the fund’s investment restrictions. The gains resulted in an increase in net asset value of $0.00278 per share based on shares outstanding on the day the gains were realized. Excluding the offset of these gains from the fund’s ending net asset value per share, the total return for the year ended December 31, 2004 would have been approximately 30.35% and 29.99% for the Initial Class and the Service Class shares, respectively. |
See Notes to Financial Statements
14
NOTES TO FINANCIAL STATEMENTS
| (1) | | Business and Organization |
MFS Utilities Portfolio (the fund) is a series of MFS Variable Insurance Trust II (the trust). The trust is organized as a Massachusetts business trust and is registered under the Investment Company Act of 1940, as amended, as an open-end management investment company. The shares of the fund are sold to variable accounts established by insurance companies to fund benefits under variable contracts issued by such companies, and qualified retirement and pension plans.
| (2) | | Significant Accounting Policies |
General – The preparation of financial statements in conformity with U.S. generally accepted accounting principles requires management to make estimates and assumptions that affect the reported amounts of assets and liabilities, and disclosure of contingent assets and liabilities at the date of the financial statements and the reported amounts of revenues and expenses during the reporting period. Actual results could differ from those estimates. The fund can invest in foreign securities, including securities of emerging market issuers. Investments in foreign securities are vulnerable to the effects of changes in the relative values of the local currency and the U.S. dollar and to the effects of changes in each country’s legal, political, and economic environment. The markets of emerging markets countries are generally more volatile than the markets of developed countries with more mature economies. All of the risks of investing in foreign securities previously described are heightened when investing in emerging markets countries.
Investment Valuations – Equity securities, including restricted equity securities, are generally valued at the last sale or official closing price as reported by a third party pricing service on the market or exchange on which they are primarily traded. For securities for which there were no sales reported that day, equity securities are generally valued at the last quoted daily bid quotation as reported by a third party pricing service on the market or exchange on which they are primarily traded. For securities held short for which there were no sales reported for the day, the position is generally valued at the last quoted daily ask quotation as reported by a third party pricing service on the market or exchange on which such securities are primarily traded. Debt instruments and floating rate loans (other than short-term instruments), including restricted debt instruments, are generally valued at an evaluated or composite bid as reported by a third party pricing service. Short-term instruments with a maturity at issuance of 60 days or less may be valued at amortized cost, which approximates market value. Forward foreign currency contracts are generally valued at the mean of bid and asked prices for the time period interpolated from rates reported by a third party pricing service for proximate time periods. Open-end investment companies are generally valued at net asset value per share. Securities and other assets generally valued on the basis of information from a third party pricing service may also be valued at a broker-dealer bid quotation. Values obtained from pricing services can utilize both dealer-supplied valuations and electronic data processing techniques, which take into account factors such as institutional-size trading in similar groups of securities, yield, quality, coupon rate, maturity, type of issue, trading characteristics, and other market data. The values of foreign securities and other assets and liabilities expressed in foreign currencies are converted to U.S. dollars using the mean of bid and asked prices for rates reported by a third party pricing service.
The Board of Trustees has delegated primary responsibility for determining or causing to be determined the value of the fund’s investments (including any fair valuation) to the adviser pursuant to valuation policies and procedures approved by the Board. If the adviser determines that reliable market quotations are not readily available, investments are valued at fair value as determined in good faith by the adviser in accordance with such procedures under the oversight of the Board of Trustees. Under the fund’s valuation policies and procedures, market quotations are not considered to be readily available for most types of debt instruments and floating rate loans and many types of derivatives. These investments are generally valued at fair value based on information from third party pricing services. In addition, investments may be valued at fair value if the adviser determines that an investment’s value has been materially affected by events occurring after the close of the exchange or market on which the investment is principally traded (such as foreign exchange or market) and prior to the determination of the fund’s net asset value, or after the halting of trading of a specific security where trading does not resume prior to the close of the exchange or market on which the security is principally traded. Events that occur on a frequent basis after foreign markets close (such as developments in foreign markets and significant movements in the U.S. markets) and prior to the determination of the fund’s net asset value may be deemed to have a material affect on the value of securities traded in foreign markets. Accordingly, the fund’s foreign equity securities may often be valued at fair value. The adviser may rely on third party pricing services or other information (such as the correlation with price movements of similar securities in the same or other markets; the type, cost and investment characteristics of the security; the business and financial condition of the issuer; and trading and other market data) to assist in determining whether to fair value and at what value to fair value an investment. The value of an investment for purposes of calculating the fund’s net asset value can differ depending on the source and method used to determine value. When fair valuation is used, the value of investments used to determine the fund’s net asset value may differ from quoted or published prices for the same investments.
The fund adopted FASB Statement No. 157, Fair Value Measurements (the “Statement”). This Statement provides a single definition of fair value, a hierarchy for measuring fair value and expanded disclosures about fair value measurements.
15
Notes to Financial Statements – continued
Various inputs are used in determining the value of the fund’s assets or liabilities carried at market value. These inputs are categorized into three broad levels. Level 1 includes quoted prices in active markets for identical assets or liabilities. Level 2 includes other significant observable market-based inputs (including quoted prices for similar securities, interest rates, prepayment speed, and credit risk). Level 3 includes unobservable inputs, which may include the adviser’s own assumptions in determining the fair value of investments. Other financial instruments are derivative instruments not reflected in total investments, such as futures, forwards, swap contracts and written options. The following is a summary of the levels used as of December 31, 2008 in valuing the fund’s assets or liabilities carried at market value:
| | | | | | | | |
| | | Level 1 | | Level 2 | | Level 3 | | Total |
| Investments in Securities | | $199,196,964 | | $66,841,753 | | $— | | $266,038,717 |
| Other Financial Instruments | | $— | | $974,937 | | $— | | $974,937 |
Repurchase Agreements – The fund may enter into repurchase agreements with approved counterparties. Each repurchase agreement is recorded at cost. The fund requires that the securities collateral in a repurchase transaction be transferred to a custodian. The fund monitors, on a daily basis, the value of the collateral to ensure that its value, including accrued interest, is greater than amounts owed to the fund under each such repurchase agreement. The fund and other funds managed by Massachusetts Financial Services Company (MFS), may utilize a joint trading account for the purpose of entering into one or more repurchase agreements.
Foreign Currency Translation – Purchases and sales of foreign investments, income, and expenses are converted into U.S. dollars based upon currency exchange rates prevailing on the respective dates of such transactions or on the reporting date for foreign denominated receivables and payables. Gains and losses attributable to foreign currency exchange rates on sales of securities are recorded for financial statement purposes as net realized gains and losses on investments. Gains and losses attributable to foreign exchange rate movements on receivables, payables, income and expenses are recorded for financial statement purposes as foreign currency transaction gains and losses. That portion of both realized and unrealized gains and losses on investments that results from fluctuations in foreign currency exchange rates is not separately disclosed.
Derivative Risk – The fund may invest in derivatives for hedging or non-hedging purposes. While hedging can reduce or eliminate losses, it can also reduce or eliminate gains. When the fund uses derivatives as an investment to gain market exposure, or for hedging purposes, gains and losses from derivative instruments may be substantially greater than the derivative’s original cost. Cash that has been segregated on behalf of certain derivative contracts will be reported separately on the Statement of Assets and Liabilities as restricted cash. On some over-the-counter derivatives, the fund attempts to reduce its exposure to counterparty credit risk by entering into an ISDA Master Agreement on a bilateral basis with each of the counterparties with whom it undertakes a significant volume of transactions. The ISDA Master Agreement gives the fund the right, upon an event of default by the applicable counterparty, to close out all transactions traded under such agreement and to net amounts owed under each transaction to one net amount payable by one party to the other. This right to close out and net payments across all transactions traded under the ISDA Master Agreement could result in a reduction of the fund’s credit risk to such counterparty equal to any amounts payable by the fund under the applicable transactions, if any. However, absent an event of default by the counterparty, the ISDA Master Agreement does not result in an offset of reported balance sheet assets and liabilities across transactions between the fund and the applicable counterparty. Derivative instruments include forward foreign currency exchange contracts.
In March 2008, FASB Statement No. 161, Disclosures about Derivative Instruments and Hedging Activities (the “Standard”) was issued, and is effective for financial statements issued for fiscal years and interim periods beginning after November 15, 2008. This Standard provides enhanced disclosures about the fund’s use of and accounting for derivative instruments and the effect of derivative instruments on the fund’s results of operations and financial position. Management is evaluating the application of the Standard to the fund, and has not at this time determined the impact, if any, resulting from the adoption of this Standard on the fund’s financial statements.
FASB Staff Position (FSP) 133-1 was implemented during the period. FSP 133-1 amends FAS 133 to require sellers of credit derivatives to make disclosures that will enable financial statement users to assess the potential effects of those credit derivatives on an entity’s financial position, financial performance and cash flows. There was no impact from implementing FSP 133-1 as the fund did not hold any of these credit derivatives at period end.
Forward Foreign Currency Exchange Contracts – The fund may enter into forward foreign currency exchange contracts for the purchase or sale of a specific foreign currency at a fixed price on a future date. Risks may arise upon entering into these contracts from the potential inability of counterparties to meet the terms of their contracts and from unanticipated movements in the value of the contract. The fund may enter into forward foreign currency exchange contracts for hedging purposes as well as for non-hedging purposes. For hedging purposes, the fund may enter into contracts to deliver or receive foreign currency it will receive from or require for its normal investment activities. The fund may also use contracts in a manner intended to
16
Notes to Financial Statements – continued
protect foreign currency denominated securities from declines in value due to unfavorable exchange rate movements. For non-hedging purposes, the fund may enter into contracts with the intent of changing the relative exposure of the fund’s portfolio of securities to different currencies to take advantage of anticipated changes. The forward foreign currency exchange contracts are adjusted by the daily exchange rate of the underlying currency and any gains or losses are recorded as unrealized until the contract settlement date. On contract settlement date, the gains or losses are recorded as realized gains or losses on foreign currency transactions.
Security Loans – State Street Bank and Trust Company (“State Street”), as lending agent, may loan the securities of the fund to certain qualified institutions (the “Borrowers”) approved by the fund. The loans are collateralized by cash and/or U.S. Treasury and federal agency obligations in an amount typically at least equal to the market value of the securities loaned. State Street provides the fund with indemnification against Borrower default. The fund bears the risk of loss with respect to the investment of cash collateral. On loans collateralized by cash, the cash collateral is invested in a money market fund or short-term securities. A portion of the income generated upon investment of the collateral is remitted to the Borrowers, and the remainder is allocated between the fund and the lending agent. On loans collateralized by U.S. Treasury and/or federal agency obligations, a fee is received from the Borrower, and is allocated between the fund and the lending agent. Income from securities lending is included in interest income on the Statement of Operations. The dividend and interest income earned on the securities loaned is accounted for in the same manner as other dividend and interest income.
Indemnifications – Under the fund’s organizational documents, its officers and trustees may be indemnified against certain liabilities and expenses arising out of the performance of their duties to the fund. Additionally, in the normal course of business, the fund enters into agreements with service providers that may contain indemnification clauses. The fund’s maximum exposure under these agreements is unknown as this would involve future claims that may be made against the fund that have not yet occurred.
Investment Transactions and Income – Investment transactions are recorded on the trade date. Interest income is recorded on the accrual basis. All premium and discount is amortized or accreted for financial statement purposes in accordance with U.S. generally accepted accounting principles. Dividends received in cash are recorded on the ex-dividend date. Certain dividends from foreign securities will be recorded when the fund is informed of the dividend if such information is obtained subsequent to the ex-dividend date. Dividend and interest payments received in additional securities are recorded on the ex-dividend or ex-interest date in an amount equal to the value of the security on such date. The fund may receive proceeds from litigation settlements. Any proceeds received from litigation involving portfolio holdings are reflected in the Statement of Operations in realized gain/loss if the security has been disposed of by the fund or in unrealized gain/loss if the security is still held by the fund. Any other proceeds from litigation not related to portfolio holdings are reflected as other income in the Statement of Operations. The fund was a participant in litigation against Enron Corp. On December 26, 2008, the fund received a cash settlement in the amount of $2,534,437.
Fees Paid Indirectly – The fund’s custody fee may be reduced according to an arrangement that measures the value of cash deposited with the custodian by the fund. This amount, for the year ended December 31, 2008, is shown as a reduction of total expenses on the Statement of Operations.
Tax Matters and Distributions – The fund intends to qualify as a regulated investment company, as defined under Subchapter M of the Internal Revenue Code, and to distribute all of its taxable income, including realized capital gains. As a result, no provision for federal income tax is required. Each of the fund’s federal tax returns for the prior three fiscal years remains subject to examination by the Internal Revenue Service. Foreign taxes, if any, have been accrued by the fund in the accompanying financial statements.
Distributions to shareholders are recorded on the ex-dividend date. Income and capital gain distributions are determined in accordance with income tax regulations, which may differ from U.S. generally accepted accounting principles. Certain capital accounts in the financial statements are periodically adjusted for permanent differences in order to reflect their tax character. These adjustments have no impact on net assets or net asset value per share. Temporary differences which arise from recognizing certain items of income, expense, gain or loss in different periods for financial statement and tax purposes will reverse at some time in the future. Distributions in excess of net investment income or net realized gains are temporary overdistributions for financial statement purposes resulting from differences in the recognition or classification of income or distributions for financial statement and tax purposes.
Book/tax differences primarily relate to defaulted bonds, wash sale loss deferrals, foreign currency transactions and derivative transactions.
17
Notes to Financial Statements – continued
The tax character of distributions declared to shareholders for the last two fiscal years is as follows:
| | | | |
| | | 12/31/08 | | 12/31/07 |
| Ordinary income (including any short-term capital gains) | | $7,383,972 | | $6,341,952 |
| Long-term capital gain | | 70,210,257 | | — |
| Total Distributions | | $77,594,229 | | $6,341,952 |
The federal tax cost and the tax basis components of distributable earnings were as follows:
| | | |
| As of 12/31/08 | | | |
| Cost of investments | | $354,259,626 | |
| Gross appreciation | | 2,545,768 | |
| Gross depreciation | | (90,766,677 | ) |
| Net unrealized appreciation (depreciation) | | $(88,220,909 | ) |
| Undistributed ordinary income | | 13,088,056 | |
| Capital loss carryforwards | | (18,412,487 | ) |
| Other temporary differences | | (251,733 | ) |
As of December 31, 2008 the fund had capital loss carryforwards available to offset future realized gains. Such losses expire as follows:
Multiple Classes of Shares of Beneficial Interest – The fund offers multiple classes of shares, which differ in their respective distribution fees. The fund’s income, realized and unrealized gain (loss), and common expenses are allocated to shareholders based on the daily net assets of each class. Dividends are declared separately for each class. Differences in per share dividend rates are generally due to differences in separate class expenses.
| (3) | | Transactions with Affiliates |
Investment Adviser – The fund has an investment advisory agreement with Massachusetts Financial Services Company (MFS) to provide overall investment management and related administrative services and facilities to the fund. The management fee is computed daily and paid monthly at the following annual rates:
| | |
| First $300 million of average daily net assets | | 0.75% |
| Average daily net assets in excess of $300 million | | 0.675% |
The management fee incurred for the year ended December 31, 2008 was equivalent to an annual effective rate of 0.73% of the fund’s average daily net assets.
Distributor – MFS Fund Distributors, Inc. (MFD), a wholly-owned subsidiary of MFS, is the distributor of shares of the fund. The Trustees have adopted a distribution plan for the Service Class shares pursuant to Rule 12b-1 under the Investment Company Act of 1940.
The fund’s distribution plan provides that the fund will pay MFD distribution fees equal to 0.25% per annum of its average daily net assets attributable to Service Class shares as partial consideration for services performed and expenses incurred by MFD and financial intermediaries in connection with the sale and distribution of the fund’s Service Class shares and the sale and distribution of the variable annuity or variable life insurance contracts investing indirectly in Service Class shares. MFD may subsequently pay all, or a portion, of the distribution fees to financial intermediaries.
Shareholder Servicing Agent – MFS Service Center, Inc. (MFSC), a wholly-owned subsidiary of MFS, has contracted to provide transfer agent and recordkeeping functions in connection with the issuance, transfer, and redemption of each class of shares of the fund under a Shareholder Servicing Agent Agreement. During the year ended December 31, 2008, the fund did not pay MFSC a fee for this service.
Administrator – MFS provides certain financial, legal, shareholder communications, compliance, and other administrative services to the fund. Under an administrative services agreement, the fund partially reimburses MFS the costs incurred to provide these services. The fund is charged an annual fixed amount of $10,000 plus a fee based on average daily net assets.
The administrative services fee incurred for the year ended December 31, 2008 was equivalent to an annual effective rate of 0.0305% of the fund’s average daily net assets.
Trustees’ and Officers’ Compensation – The fund pays compensation to trustees in the form of a retainer, attendance fees, and additional compensation to the Board chairperson. The fund does not pay compensation directly to officers of the fund who are also officers of the investment adviser, all of whom receive remuneration for their services to the fund from MFS. Certain officers of the fund are officers or directors of MFS, MFD, and MFSC.
18
Notes to Financial Statements – continued
Other – This fund and certain other MFS funds (the funds) have entered into services agreements (the Agreements) which provide for payment of fees by the funds to Tarantino LLC and Griffin Compliance LLC in return for the provision of services of an Independent Chief Compliance Officer (ICCO) and Assistant ICCO, respectively, for the funds. The ICCO and Assistant ICCO are officers of the funds and the sole members of Tarantino LLC and Griffin Compliance LLC, respectively. The funds can terminate the Agreements with Tarantino LLC and Griffin Compliance LLC at any time under the terms of the Agreements. MFS has agreed to bear all expenses associated with office space, other administrative support, and supplies provided to the ICCO and Assistant ICCO. For the year ended December 31, 2008, the aggregate fees paid by the fund to Tarantino LLC and Griffin Compliance LLC were $3,679 and are included in miscellaneous expense on the Statement of Operations.
Purchases and sales of investments, other than U.S. Government securities, purchased option transactions, and short-term obligations, aggregated $250,125,294 and $308,864,303, respectively.
| (5) | | Shares of Beneficial Interest |
The fund’s Declaration of Trust permits the Trustees to issue an unlimited number of full and fractional shares of beneficial interest. Transactions in fund shares were as follows:
| | | | | | | | | | | | |
| | | Year ended 12/31/08 | | | Year ended 12/31/07 | |
| | | Shares | | | Amount | | | Shares | | | Amount | |
| Shares sold | | | | | | | | | | | | |
Initial Class | | 288,875 | | | $6,892,701 | | | 283,911 | | | $7,603,251 | |
Service Class | | 1,529,033 | | | 33,924,835 | | | 1,314,137 | | | 35,226,799 | |
| | 1,817,908 | | | $40,817,536 | | | 1,598,048 | | | $42,830,050 | |
| Shares issued to shareholders in reinvestment of distributions | | | | | | | | | | | | |
Initial Class | | 2,247,908 | | | $56,152,737 | | | 193,045 | | | $5,212,212 | |
Service Class | | 865,623 | | | 21,441,492 | | | 42,123 | | | 1,129,740 | |
| | 3,113,531 | | | $77,594,229 | | | 235,168 | | | $6,341,952 | |
| Shares reacquired | | | | | | | | | | | | |
Initial Class | | (3,972,057 | ) | | $(88,256,964 | ) | | (3,782,213 | ) | | $(101,515,803 | ) |
Service Class | | (1,305,000 | ) | | (26,214,441 | ) | | (449,929 | ) | | (11,963,692 | ) |
| | (5,277,057 | ) | | $(114,471,405 | ) | | (4,232,142 | ) | | $(113,479,495 | ) |
| Net change | | | | | | | | | | | | |
Initial Class | | (1,435,274 | ) | | $(25,211,526 | ) | | (3,305,257 | ) | | $(88,700,340 | ) |
Service Class | | 1,089,656 | | | 29,151,886 | | | 906,331 | | | 24,392,847 | |
| | (345,618 | ) | | $3,940,360 | | | (2,398,926 | ) | | $(64,307,493 | ) |
The fund and other funds managed by MFS participate in a $1 billion unsecured committed line of credit provided by a syndication of banks under a credit agreement. In addition, the fund and other funds managed by MFS have established uncommitted borrowing arrangements with certain banks. Borrowings may be made for temporary financing needs. Interest is charged to each fund, based on its borrowings, generally at a rate equal to the Federal Reserve funds rate plus 0.30%. In addition, a commitment fee, based on the average daily, unused portion of the committed line of credit, is allocated among the participating funds at the end of each calendar quarter. For the year ended December 31, 2008, the fund’s commitment fee and interest expense were $2,067 and $0, respectively, and are included in miscellaneous expense on the Statement of Operations.
19
REPORT OF INDEPENDENT REGISTERED PUBLIC ACCOUNTING FIRM
To the Board of Trustees of MFS Variable Insurance Trust II and the Shareholders of
MFS Utilities Portfolio:
We have audited the accompanying statement of assets and liabilities, including the portfolio of investments, of MFS Utilities Portfolio (the “Fund”) (one of the portfolios comprising MFS Variable Insurance Trust II) as of December 31, 2008, and the related statement of operations for the year then ended, the statements of changes in net assets for each of the two years in the period then ended, and the financial highlights for each of the five years in the period then ended. These financial statements and financial highlights are the responsibility of the Fund’s management. Our responsibility is to express an opinion on these financial statements and financial highlights based on our audits.
We conducted our audits in accordance with the standards of the Public Company Accounting Oversight Board (United States). Those standards require that we plan and perform the audit to obtain reasonable assurance about whether the financial statements and financial highlights are free of material misstatement. The Fund is not required to have, nor were we engaged to perform, an audit of its internal control over financial reporting. Our audits included consideration of internal control over financial reporting as a basis for designing audit procedures that are appropriate in the circumstances, but not for the purpose of expressing an opinion on the effectiveness of the Fund’s internal control over financial reporting. Accordingly, we express no such opinion. An audit also includes examining, on a test basis, evidence supporting the amounts and disclosures in the financial statements, assessing the accounting principles used and significant estimates made by management, as well as evaluating the overall financial statement presentation. Our procedures included confirmation of securities owned as of December 31, 2008, by correspondence with the custodian and brokers; where replies were not received from brokers, we performed other auditing procedures. We believe that our audits provide a reasonable basis for our opinion.
In our opinion, the financial statements and financial highlights referrred to above present fairly, in all material respects, the financial position of MFS Utilities Portfolio as of December 31, 2008, the results of its operations for the year then ended, the changes in its net assets for each of the two years in the period then ended, and the financial highlights for each of the five years in the period then ended, in conformity with accounting principles generally accepted in the United States of America.
DELOITTE & TOUCHE LLP
Boston, Massachusetts
February 19, 2009
20
TRUSTEES AND OFFICERS – IDENTIFICATION AND BACKGROUND
The Trustees and officers of the Trust, as of February 1, 2009, are listed below, together with their principal occupations during the past five years. (Their titles may have varied during that period.) The address of each Trustee and officer is 500 Boylston Street, Boston, Massachusetts 02116.
| | | | | | |
Name, Date of Birth | | Position(s) Held
with Fund | | Trustee/Officer
Since (1) | | Principal Occupations During the Past Five Years and
Other Directorships (2) |
| INTERESTED TRUSTEE | | | | |
David D. Horn (3) (born 6/07/41) | | Trustee | | April 1986 | | Private investor; Sun Life Assurance Company of Canada, Senior Vice President and General Manager for the United States (until 1997); Director (until March 2004) |
| | |
| INDEPENDENT TRUSTEES | | | | |
J. Kermit Birchfield (born 1/08/40) | | Chairman | | May 1997 | | Consultant; Century Partners, Inc. (investments), Director; Displaytech, Inc. (technology), Director; Dessin Fournir LLC (furniture manufacturer), Director (2005 to present); Intermountain Gas Company, Inc. & Intermountain Industries, Inc. (oil & gas exploration and production), Director; Site Watch LLC (software to monitor oil tanks), Managing Director (2006 to present); Juridica Investments (fund investing in judicial matters), Director (2007 to present); HPSC, Inc. (medical financing), Director (until January 2004) |
| | | |
Robert C. Bishop (born 1/13/43) | | Trustee | | May 2001 | | AutoImmune, Inc. (pharmaceutical product development), Chairman, President and Chief Executive Officer; Caliper Life Sciences Corp. (laboratory analytical instruments), Director; Millipore Corporation (purification/filtration products), Director; Waterstreet Capital (leverage buyouts), Advisory Board (August 2006 to present); Optobionics Corporation (ophthalmic devices), Director (2002 to 2007) |
| | | |
Frederick H. Dulles (born 3/12/42) | | Trustee | | May 2001 | | Ten State International Law PLLC (law firm), Of Counsel (since 2006); Prudential Carolina Real Estate, (real estate), Broker (since 2006); Free Enterprise Foundation, Inc. (research institute), Director & Secretary (until 2008); Disher, Hamrick & Myers Residential, Inc. (real estate) Broker (2005 until 2006); Frederick H. Dulles law practice (until 2006); Ten State Street LLP (law firm), Member (until 2005) |
| | | |
Marcia A. Kean (born 6/30/48) | | Trustee | | April 2005 | | Feinstein Kean Healthcare (consulting), Chief Executive Officer |
| | | |
Ronald G. Steinhart (born 6/15/40) | | Trustee | | May 2001 | | Private investor; Penske Automotive Group (automotive retailer), Director; Animal Health International, Inc. (animal health products), Director (since 2007); Texas Industries (concrete/aggregates/cement), Director (since 2007); Penson Worldwide, Inc. (securities clearance), Director (since 2006); Carreker Corporation (technology consulting) Director (until 2005); Prentiss Properties Trust (real estate investment trust), Director (until 2006) |
| | | |
Haviland Wright (born 7/21/48) | | Trustee | | May 2001 | | Profitability of Hawaii (software), Chief Development Officer (since December 2008); Elixir Technologies Corporation (software) Director (since 2005); Nano Loa Inc. (liquid crystal displays), Director |
| | |
| TRUSTEE EMERITUS | | | | |
Samuel Adams (born 10/19/25) | | Trustee Emeritus | | | | Retired; K&L Gates LLP (law firm), Of Counsel |
| | |
| OFFICERS | | | | |
Maria F. Dwyer (4) (born 12/01/58) | | President | | November 2005 | | Massachusetts Financial Services Company, Executive Vice President and Chief Regulatory Officer (since March 2004) Chief Compliance Officer (since December 2006); Fidelity Management & Research Company, Vice President (prior to March 2004); Fidelity Group of Funds, President and Treasurer (until March 2004) |
| | | |
Christopher R. Bohane (4) (born 1/18/74) | | Assistant Secretary and Assistant Clerk | | July 2005 | | Massachusetts Financial Services Company, Vice President and Senior Counsel |
| | | |
John M. Corcoran (4) (born 4/13/65) | | Treasurer | | October 2008 | | Massachusetts Financial Services Company, Senior Vice President (since October 2008); State Street Bank and Trust (financial services provider), Senior Vice President, (until September 2008) |
| | | |
Ethan D. Corey (4) (born 11/21/63) | | Assistant Secretary and Assistant Clerk | | July 2005 | | Massachusetts Financial Services Company, Senior Vice President and Associate General Counsel (since 2004); Dechert LLP (law firm), Counsel (prior to December 2004) |
| | | |
David L. DiLorenzo (4) (born 8/10/68) | | Assistant Treasurer | | July 2005 | | Massachusetts Financial Services Company, Vice President (since June 2005); JP Morgan Investor Services, Vice President (until June 2005) |
| | | |
Timothy M. Fagan (4) (born 7/10/68) | | Assistant Secretary and Assistant Clerk | | September 2005 | | Massachusetts Financial Services Company, Vice President and Senior Counsel (since September 2005); John Hancock Advisers, LLC, Vice President, Senior Attorney and Chief Compliance Officer (until August 2005) |
21
Trustees and Officers – continued
| | | | | | |
Name, Date of Birth | | Position(s) Held
with Fund | | Trustee/Officer
Since (1) | | Principal Occupations During the Past Five Years and
Other Directorships (2) |
Mark D. Fischer (4) (born 10/27/70) | | Assistant Treasurer | | July 2005 | | Massachusetts Financial Services Company, Vice President (since May 2005); JP Morgan Investment Management Company, Vice President (until May 2005) |
| | | |
Robyn L. Griffin (born 7/04/75) | | Assistant Independent Chief Compliance Officer | | August 2008 | | Griffin Compliance LLC (provider of compliance services), Principal (since August 2008); State Street Corporation (financial services provider), Mutual Fund Administration Assistant Vice President (October 2006 – July 2008); Liberty Mutual Group (insurance), Personal Market Assistant Controller (April 2006 – October 2006); Deloitte & Touche LLP (professional services firm), Senior Manager (prior to April 2006) |
| | | |
Brian E. Langenfeld (4) (born 3/07/73) | | Assistant Secretary and Assistant Clerk | | May 2006 | | Massachusetts Financial Services Company, Vice President and Senior Counsel (since May 2006); John Hancock Advisers, LLC, Assistant Vice President and Counsel (until April 2006) |
| | | |
Ellen Moynihan (4) (born 11/13/57) | | Assistant Treasurer | | May 1997 | | Massachusetts Financial Services Company, Senior Vice President |
| | | |
Susan S. Newton (4) (born 3/07/50) | | Assistant Secretary and Assistant Clerk | | May 2005 | | Massachusetts Financial Services Company, Senior Vice President and Associate General Counsel (since April 2005); John Hancock Advisers, LLC, Senior Vice President, Secretary and Chief Legal Officer (until April 2005) |
| | | |
Susan A. Pereira (4) (born 11/05/70) | | Assistant Secretary and Assistant Clerk | | July 2005 | | Massachusetts Financial Services Company, Vice President and Senior Counsel (since June 2004); Bingham McCutchen LLP (law firm), Associate (until June 2004) |
| | | |
Mark N. Polebaum (4) (born 5/01/52) | | Secretary and Clerk | | February 2006 | | Massachusetts Financial Services Company, Executive Vice President, General Counsel and Secretary (since January 2006); Wilmer Cutler Pickering Hale and Dorr LLP (law firm), Partner (until January 2006) |
| | | |
Frank L. Tarantino (born 3/07/44) | | Independent Chief Compliance Officer | | September 2004 | | Tarantino LLC (provider of compliance services), Principal (since June 2004); CRA Business Strategies Group (consulting services), Executive Vice President (until June 2004) |
| | | |
Richard S. Weitzel (4) (born 7/16/70) | | Assistant Secretary and Assistant Clerk | | October 2007 | | Massachusetts Financial Services Company, Vice President and Assistant General Counsel (since 2004); Massachusetts Department of Business and Technology, General Counsel (until April 2004) |
| | | |
James O. Yost (4) (born 6/12/60) | | Assistant Treasurer | | April 1992 | | Massachusetts Financial Services Company, Senior Vice President |
| (1) | Date first appointed to serve as Trustee/Officer of an MFS fund or a Compass variable account. Each Trustee has served continuously since appointment. |
| (2) | Directorships or trusteeships of companies required to report to the Securities and Exchange Commission (i.e., “public companies”). |
| (3) | “Interested person” of the Trust, within the meaning of the Investment Company Act of 1940 (referred to as the 1940 Act), which is the principal federal law governing investment companies like the Trust, as a result of position with Sun Life of Canada (U.S.). The address of Sun Life of Canada (U.S.) is One Sun Life Executive Park, Wellesley Hills, Massachusetts 02481. |
| (4) | “Interested person” of MFS within the meaning of the 1940 Act. The address of MFS is 500 Boylston Street, Boston, Massachusetts 02116. |
The Trust does not hold annual meetings for the purpose of electing Trustees, and Trustees are not elected for fixed terms. Each Trustee and officer holds office until his or her successor is chosen and qualified, or until his or her earlier death, resignation, retirement or removal.
All Trustees currently serve as Trustees of the Trust and have served in that capacity since originally elected or appointed. All of the Trustees are also Managers of the Compass Variable Accounts. The executive officers of the Trust hold similar offices for the Compass Variable Accounts and other funds in the MFS fund complex. As of January 1, 2009, each Trustee serves as a Trustee or Manager of 35 Accounts/Funds.
The Statement of Additional Information contains further information about the Trustees and is available without charge upon request by calling 1-800-752-7215.
| | |
Investment Adviser
Massachusetts Financial Services Company 500 Boylston Street, Boston, MA 02116-3741 | | Custodian State Street Bank and Trust 1 Lincoln Street, Boston, MA 02111-2900 |
Distributor
MFS Fund Distributors, Inc. 500 Boylston Street, Boston, MA 02116-3741 | | Independent Registered Public Accounting Firm Deloitte & Touche LLP 200 Berkeley Street, Boston, MA 02116 |
Portfolio Managers Robert Persons Maura Shaughnessy | | |
22
BOARD REVIEW OF INVESTMENT ADVISORY AGREEMENT
The Investment Company Act of 1940 requires that both the full Board of Trustees and a majority of the non-interested (“independent”) Trustees, voting separately, annually approve the continuation of the investment advisory agreement between MFS Variable Insurance Trust II (the “Trust”) and Massachusetts Financial Services Company (“MFS”) on behalf of the Fund. The Trustees consider matters bearing on the Fund and the advisory arrangements at their meetings throughout the year, including a review of performance data at each regular meeting. In addition, the independent Trustees met in May and again in July 2008 (“contract review meetings”) for the specific purpose of considering whether to approve the continuation of the investment advisory agreement for the Fund. The independent Trustees were assisted in their evaluation of the investment advisory agreement by independent legal counsel, from whom they received separate legal advice and with whom they met separately from MFS management during various contract review meetings. The independent Trustees were also assisted in this process by the Fund’s Independent Chief Compliance Officer, a full-time senior officer appointed by and reporting to the independent Trustees.
In connection with their deliberations, the Trustees, including the independent Trustees, considered such information and factors as they believed, in light of the legal advice furnished to them and their own business judgment, to be relevant. The investment advisory agreement was considered separately for the Fund, although the Trustees also took into account the common interests of all Funds in the Trust in their review. As described below, the Trustees considered the nature, quality, and extent of the various investment advisory, administrative, and shareholder services performed by MFS under the existing investment advisory agreement and other arrangements with the Trust.
In connection with their contract review meetings, the Trustees received and relied upon materials which included, among other items: (i) information provided by Lipper Inc. on the investment performance of the Fund for various time periods ended December 31, 2007, compared to the investment performance of a group of funds with substantially similar investment classifications/objectives (the “Lipper performance universe”), (ii) information provided by Lipper Inc. on the Fund’s advisory fees and other expenses compared to the advisory fees and other expenses of comparable funds identified by Lipper (the “Lipper expense group”), (iii) information provided by MFS on the advisory fees of comparable portfolios of its other clients, including institutional separate account and other clients, (iv) information as to whether expense waivers, reimbursements or fee “breakpoints” are observed for the Fund, (v) information regarding MFS’ financial results and financial condition, including MFS’ and certain of its affiliates’ estimated profitability from services performed for the Fund, (vi) MFS’ views regarding the outlook for the mutual fund industry and its strategic business plans, (vii) descriptions of various functions performed by MFS for the Trust, such as compliance monitoring and portfolio trading practices, and (viii) information regarding the overall organization of MFS, including information about MFS’ senior management and other personnel providing investment advisory, administrative and other services to the Fund. The comparative performance, fee and expense information prepared and provided by Lipper Inc. was not independently verified, and the independent Trustees did not independently verify any information provided to them by MFS.
The Trustees’ conclusion as to the continuation of the investment advisory agreement was based on comprehensive consideration of all information provided to the Trustees and not the result of any single factor. Some of the factors that figured particularly in the Trustees’ deliberations are described below for the Fund, while individual Trustees may have given different weight to various factors and evaluated the information presented as a whole differently than another Trustee. The Trustees recognized that the fee arrangements for the Fund reflect years of review and discussion between the independent Trustees and MFS, that certain aspects of such arrangements may receive greater scrutiny in some years than others, and that the Trustees’ conclusions may be based, in part, on their consideration of these same arrangements during the course of the year and in prior years.
Based on information provided by Lipper Inc., the Trustees compared the Fund’s total return investment performance to the performance of a peer group of funds over various time periods. The Trustees placed particular emphasis on the total return performance of the Fund’s Initial Class shares in comparison to the performance of funds in its Lipper performance universe over the one-, three- and five-year periods. The Trustees did not rely on performance results for more recent periods, including those shown elsewhere in this report.
The Trustees noted the performance of the Fund’s Initial Class shares was in the 1st quintile relative to the other funds in the Lipper Classification Index for the one-year period (the 1st quintile being the best performers and the 5th quintile being the worst performers). The total return performance of the Fund was also in the 1st quintile for the three-year period and the five-year period ended December 31, 2007, relative to the Lipper performance universe. Based on the nature and quality of services provided by MFS, the Board of Trustees concluded that the Fund’s performance was satisfactory.
In the course of their deliberations, the Trustees took into account information provided by MFS during contract review meetings, as well as during investment review meetings conducted with portfolio management personnel during the course of the year.
23
Board Review of Investment Advisory Agreement – continued
In assessing the reasonableness of the Fund’s advisory fee, the Trustees considered, among other information, the Fund’s advisory fee and the total expense ratio of the Fund’s Initial Class shares as a percentage of average daily net assets, compared to the advisory fee and total expense ratios of its peer group of funds based on information provided by Lipper Inc. The Trustees also considered the advisory fees charged by MFS to institutional accounts. In comparing these fees, the Trustees considered the generally broader scope of services provided by MFS to the Trust than those provided to institutional accounts. The Trustees also considered the higher demands placed on MFS’ investment personnel and trading infrastructure as a result of the daily cash in-flows and out-flows of the Fund, and the impact on MFS and related expenses due to the more extensive regulatory regime to which the Fund is subject, compared to institutional accounts.
In considering the fees, the Trustees noted from the Lipper data that the Fund’s effective advisory fee rate was above the median and total expense ratio was approximately at the median of such fees and expenses of funds in the Lipper expense group. The Trustees further concluded that the existing breakpoint was sufficient to allow the Fund to benefit from economies of scale as its assets grow. The Trustees concluded that the fees were reasonable in light of the nature and quality of services provided.
The Trustees also considered information prepared by MFS relating to its costs and profits with respect to the Fund and other investment companies and accounts advised by MFS, as well as MFS’ methodologies used to determine and allocate its costs to the Fund and other accounts and products for purposes of estimating profitability.
After reviewing these and other factors described below, the Trustees concluded that the advisory fees charged to the Fund represent reasonable compensation in light of the nature and quality of the services being provided by MFS.
In addition, the Trustees considered MFS’ resources and related efforts to continue to retain, attract and motivate capable personnel to serve the Fund. The Trustees also considered the financial resources of MFS and its parent, Sun Life Financial Inc. The Trustees further considered any advantages and possible disadvantages of having an adviser which also serves other investment companies as well as institutional accounts.
The Trustees also considered the nature, quality, cost, and extent of administrative, transfer agency, and distribution services provided to the Fund by MFS and its affiliates under agreements and plans other than the investment advisory agreement, including the 12b-1 fees the Fund pays to MFS Fund Distributors, Inc., an affiliate of MFS. The Trustees also considered the nature, extent and quality of certain other services MFS performs or arranges on the Fund’s behalf, which may include securities lending programs, directed expense payment programs, class action recovery programs, and MFS’ interaction with third-party service providers, principally custodians and sub-custodians. The Trustees concluded that the various non-advisory services provided by MFS and its affiliates on behalf of the Fund were satisfactory. The Trustees also considered the benefits to MFS from the use of the Fund’s portfolio brokerage commissions to pay for research and other similar services and various other factors. Additionally, the Trustees considered so-called “fall-out benefits” to MFS such as reputational value derived from serving as investment manager to the Trust, and determined that any such benefits derived by MFS were reasonable and fair.
Based on their evaluation of factors that they deemed to be material, including those factors described above, the Board of Trustees, including a majority of the independent Trustees, concluded that the investment advisory agreement should be continued for an additional one-year period, commencing September 1, 2008.
A discussion regarding the Board’s most recent review and renewal of the fund’s Investment Advisory Agreement with MFS is available by clicking on the fund’s name under “Variable Insurance Portfolios-VIT II” in the “Products & Performance” section on the MFS Web site (mfs.com).
24
PROXY VOTING POLICIES AND INFORMATION
A general description of the MFS funds’ proxy voting policies and procedures is available without charge, upon request, by calling
1-800-225-2606, by visiting the Proxy Voting section of mfs.com or by visiting the SEC’s Web site at http://www.sec.gov.
Information regarding how the fund voted proxies relating to portfolio securities during the most recent twelve-month period ended June 30 is available without charge by visiting the Proxy Voting section of mfs.com or by visiting the SEC’s Web site at http://www.sec.gov.
QUARTERLY PORTFOLIO DISCLOSURE
The fund will file a complete schedule of portfolio holdings with the Securities and Exchange Commission (the Commission) for the first and third quarters of each fiscal year on Form N-Q. The fund’s Form N-Q may be reviewed and copied at the:
Public Reference Room
Securities and Exchange Commission
100 F Street, NE, Room 1580
Washington, D.C. 20549
Information on the operation of the Public Reference Room may be obtained by calling the Commission at 1-800-SEC-0330. The fund’s Form N-Q is available on the EDGAR database on the Commission’s Internet Web site at http://www.sec.gov, and copies of this information may be obtained, upon payment of a duplicating fee, by electronic request at the following e-mail address: publicinfo@sec.gov or by writing the Public Reference Section at the above address.
FEDERAL TAX INFORMATION (unaudited)
The following information is provided pursuant to provisions of the Internal Revenue Code.
The fund designates $70,210,257 as capital gain dividends paid during the fiscal year.
For corporate shareholders, 79.34% of the ordinary income dividends paid during the fiscal year qualify for the corporate dividends received deduction.
25
MFS® PRIVACY NOTICE
Privacy is a concern for every investor today. At MFS Investment Management® and the MFS funds, we take this concern very seriously. We want you to understand our policies about the investment products and services that we offer, and how we protect the nonpublic personal information of investors who have a direct relationship with us and our wholly owned subsidiaries.
Throughout our business relationship, you provide us with personal information. We maintain information and records about you, your investments, and the services you use. Examples of the nonpublic personal information we maintain include
| | Ÿ | | data from investment applications and other forms |
| | Ÿ | | share balances and transactional history with us, our affiliates, or others |
| | Ÿ | | facts from a consumer reporting agency |
We do not disclose any nonpublic personal information about our customers or former customers to anyone, except as permitted by law. We may share nonpublic personal information with third parties or certain of our affiliates in connection with servicing your account or processing your transactions. We may share information with companies or financial institutions that perform marketing services on our behalf or with other financial institutions with which we have joint marketing arrangements, subject to any legal requirements.
Authorization to access your nonpublic personal information is limited to appropriate personnel who provide products, services, or information to you. We maintain physical, electronic, and procedural safeguards to help protect the personal information we collect about you.
If you have any questions about the MFS privacy policy, please call 1-800-225-2606 any business day between 8 a.m. and 8 p.m. Eastern time.
Note: If you own MFS products or receive MFS services in the name of a third party such as a bank or broker-dealer, their privacy policy may apply to you instead of ours.
26

MFS® STRATEGIC INCOME PORTFOLIO
The report is prepared for the general information of contract owners. It is authorized for distribution to prospective investors only when preceded or accompanied by a current prospectus.
NOT FDIC INSURED Ÿ MAY LOSE VALUE Ÿ NO BANK GUARANTEE Ÿ NOT A DEPOSIT Ÿ NOT INSURED BY ANY FEDERAL GOVERNMENT AGENCY OR NCUA/NCUSIF
LETTER FROM THE CEO

Dear Contract Owners:
The market downturns and economic setbacks of late probably rank among the worst financial declines most of us have experienced. Inevitably, people may be questioning their commitment to investing. Still, it is important to remember that downturns are an inescapable part of the business cycle. Such troughs have been seen before, and if we can use history as a guide, market recoveries typically have followed.
Recent events have clearly shown us the value of certain types of investments. In this environment, two of the hallmarks of mutual funds — transparency and liquidity — have become critically important. Unlike some other types of investments, the operations of mutual funds are relatively transparent to their shareholders. With their daily redemption feature, mutual funds also generally provide easy, convenient access to one’s money. Through these recent market upheavals, this level of liquidity enhanced the ability of mutual fund investors to respond and modify their investments as they and their advisors saw fit — a flexibility that those in less liquid investments simply did not have at their disposal.
At MFS® we take particular pride in how well mutual funds can serve investors because we invented the mutual fund in the United States. Established in 1924, Massachusetts Investors Trust was the nation’s first fund. Recent market events only reinforce what we have learned through 85 years — that mutual funds provide unique features that are important to investors in any type of market climate.
Respectfully,

Robert J. Manning
Chief Executive Officer and Chief Investment Officer
MFS Investment Management®
February 17, 2009
The opinions expressed in this letter are subject to change, may not be relied upon for investment advice, and no forecasts can be guaranteed.
Before investing, consider the fund’s investment objectives, risks, charges, and expenses. For a prospectus containing this and other information, contact your investment professional or view online. Read it carefully.
MFS Fund Distributors, Inc., 500 Boylston Street, Boston, MA 02116
1
PORTFOLIO COMPOSITION
Portfolio structure (i)
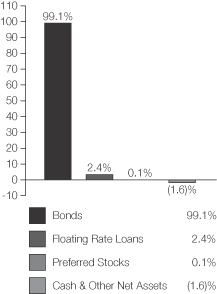
| | |
| Fixed income sectors (i) | | |
| Non-U.S. Government Bonds | | 29.8% |
| High Yield Corporates | | 26.8% |
| High Grade Corporates | | 24.5% |
| Emerging Markets Bonds | | 5.6% |
| Commercial Mortgage-Backed Securities | | 4.6% |
| U.S. Government Agencies | | 4.0% |
| Mortgage-Backed Securities | | 2.8% |
| Floating Rate Loans | | 2.4% |
| Asset-Backed Securities | | 0.8% |
| Collateralized Debt Obligations | | 0.2% |
| U.S. Treasury Securities (o) | | 0.0% |
| | |
| Credit quality of bonds (r) | | |
| AAA | | 23.6% |
| AA | | 10.0% |
| A | | 10.8% |
| BBB | | 19.8% |
| BB | | 13.2% |
| B | | 16.6% |
| CCC | | 5.0% |
| CC | | 0.1% |
| C (o) | | 0.0% |
| D | | 0.1% |
| Not Rated | | 0.8% |
| |
| Portfolio facts | | |
| Average Duration (d)(i) | | 5.1 |
| Average Life (i)(m) | | 7.4 yrs. |
| Average Maturity (i)(m) | | 10.3 yrs. |
| Average Credit Quality of Rated Securities (long-term) (a) | | BBB+ |
| Average Credit Quality of Rated Securities (short-term) (a) | | A-1 |
| |
| Country weightings (i) | | |
| United States | | 54.2% |
| Germany | | 10.8% |
| Japan | | 9.2% |
| France | | 4.5% |
| United Kingdom | | 3.9% |
| Spain | | 3.0% |
| Canada | | 2.2% |
| Austria | | 1.9% |
| Sweden | | 1.3% |
| Other Countries | | 9.0% |
| (a) | | The average credit quality of rated securities is based upon a market weighted average of portfolio holdings that are rated by public rating agencies. |
| (d) | | Duration is a measure of how much a bond’s price is likely to fluctuate with general changes in interest rates, e.g., if rates rise 1.00%, a bond with a 5-year duration is likely to lose about 5.00% of its value. |
| (i) | | For purposes of this presentation, the bond component includes accrued interest amounts and may be positively or negatively impacted by the equivalent exposure from any derivative holdings, if applicable. |
| (m) | | The average maturity shown is calculated using the final stated maturity on the portfolio’s holdings without taking into account any holdings which have been pre-refunded or pre-paid to an earlier date or which have a mandatory put date prior to the stated maturity. The average life shown takes into account these earlier dates. |
| (r) | | Each security is assigned a rating from Moody’s Investors Service. If not rated by Moody’s, the rating will be that assigned by Standard & Poor’s. Likewise, if not assigned a rating by Standard & Poor’s, it will be based on the rating assigned by Fitch, Inc. For those portfolios that hold a security which is not rated by any of the three agencies, the security is considered Not Rated. Holdings in U.S. Treasuries and government agency mortgage-backed securities, if any, are included in the “AAA”-rating category. Percentages are based on the total market value of investments as of 12/31/08. |
From time to time “Cash & Other Net Assets” may be negative due to the timing of cash receipts and/or the equivalent exposure from any derivative holdings.
Percentages are based on net assets as of 12/31/08, unless otherwise noted.
The portfolio is actively managed and current holdings may be different.
2
MANAGEMENT REVIEW
Summary of Results
For the twelve months ended December 31, 2008, Initial Class shares of the MFS Strategic Income Portfolio (the “fund”) provided a total return of –12.94%, while Service Class shares of the fund provided a total return of –13.21%. These compare with a return of –26.16% for the fund’s benchmark, the Barclays Capital U.S. High-Yield Corporate Bond Index. Over the same period, the fund’s other benchmarks, the Barclays Capital U.S. Aggregate Bond Index, Barclays Capital U.S. Credit Bond Index, Barclays Capital U.S. Government/Mortgage Bond Index, Citigroup World Government Bond Non-Dollar Hedged Index, the Citigroup World Government Bond Non-Dollar Index, and JPMorgan Emerging Markets Bond Index Global generated returns of 5.24%, –3.08%, 10.17%, 8.01%, 10.11%, and –10.91%, respectively.
Market Environment
The U.S. economy and financial markets experienced significant deterioration and extraordinary volatility over the reporting period. U.S. economic growth slowed significantly, despite the short-term bounce from the second quarter fiscal stimulus. Strong domestic headwinds included accelerated deterioration in the housing market, anemic corporate investment, a rapidly declining job market, and a much tighter credit environment. During the period, a seemingly continuous series of tumultuous financial events hammered markets, including: the distressed sale of failing Bear Stearns to JPMorgan, the conservatorship of Government Sponsored Enterprises (GSEs) Fannie Mae and Freddie Mac, the bankruptcy of investment bank Lehman Brothers, the Federal Reserve Bank’s complex intervention of insurance company American International Group (AIG), the nationalization of several large European banks, the failure of Washington Mutual, and the distressed sale of Wachovia. As a result of this barrage of turbulent news, global equity markets pushed significantly lower and credit markets witnessed the worst dislocation since the beginning of the credit crisis. Though conditions improved towards the end of the period, the state of financial and macroeconomic dislocation remained severe.
While reasonably resilient during the first half of the period, the global economy and financial system increasingly experienced considerable negative spillovers from the U.S. slowdown. Not only did Europe and Japan show obvious signs of economic softening, the more powerful engine of global growth – emerging markets – also displayed weakening dynamics.
During the reporting period, the U.S. Federal Reserve Board cut interest rates aggressively and introduced a multitude of new lending facilities to alleviate ever-tightening credit markets, while the U.S. federal government moved quickly to design and implement a meaningful fiscal stimulus package. Although several other global central banks also cut rates, the dilemma of rising energy and food prices heightened concerns among central bankers that inflationary expectations might become unhinged despite weaker growth. Only later in the reporting period did slowing global growth result in a very precipitous decline in commodity prices, which significantly eased inflation and inflationary expectations. As inflationary concerns diminished in the face of global deleveraging, and equity and credit markets deteriorated more sharply, a coordinated rate cut marked the beginning of much more aggressive easing by the major global central banks.
Contributors to Performance
During the reporting period, the fund’s return from yield, which was greater than that of the benchmarks, was a key contributor to performance. The fund’s holdings of U.S. Treasury securities and some sovereign government bonds, particularly those of Japan, were another benefit to relative results.
Detractors from Performance
The fund’s greater exposure to the financial and banking sectors held back performance as holdings within these sectors suffered amid the global credit crisis. Some of the fund’s high yield holdings in the media and gaming sectors were also adversely affected by weakening economic conditions.
Our overall credit exposure was a relative detractor as there has been a flight to the highest quality securities such as treasury bonds.
A shorter duration (d) stance was another negative factor in the fund’s relative performance.
Respectfully,
| | | | | | | | |
| John Addeo | | James Calmas | | Robert Persons | | Matthew Ryan | | Erik Weisman |
| Portfolio Manager | | Portfolio Manager | | Portfolio Manager | | Portfolio Manager | | Portfolio Manager |
3
Management Review – continued
| (d) | Duration is a measure of how much a bond’s price is likely to fluctuate with general changes in interest rates, e.g., if rates rise 1.00%, a bond with a 5-year duration is likely to lose about 5.00% of its value. |
The views expressed in this report are those of the portfolio managers only through the end of the period of the report as stated on the cover and do not necessarily reflect the views of MFS or any other person in the MFS organization. These views are subject to change at any time based on market or other conditions, and MFS disclaims any responsibility to update such views. These views may not be relied upon as investment advice or an indication of trading intent on behalf of any MFS portfolio. References to specific securities are not recommendations of such securities, and may not be representative of any MFS portfolio’s current or future investments.
4
PERFORMANCE SUMMARY THROUGH 12/31/08
The following chart illustrates the historical performance of the fund in comparison to its benchmark(s). Benchmark comparisons are unmanaged; do not reflect any fees or expenses; and cannot be invested in directly. The performance of other share classes will be greater than or less than that of the class depicted below. (See Notes to Performance Summary.)
Performance data shown represents past performance and is no guarantee of future results. Investment return and principal value fluctuate so your units, when sold, may be worth more or less than the original cost; current performance may be lower or higher than quoted. The performance shown does not reflect the deduction of taxes, if any, that a contract holder would pay on fund distributions or the redemption of contract units. The returns for the fund shown also do not reflect the deduction of expenses associated with variable products, such as mortality and expense risk charges, separate account charges, and sales charges imposed by the insurance company separate accounts. Such expenses would reduce the overall returns shown.
Growth of a hypothetical $10,000 investment
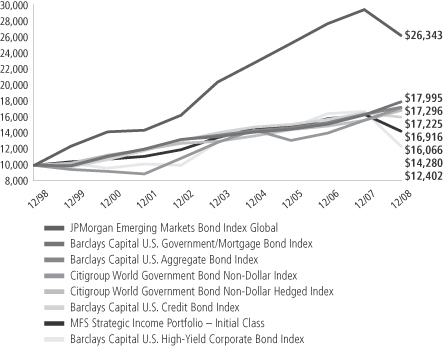
Total rates of return through 12/31/08
Average Annual Total Returns
| | | | | | | | | | | | |
| | | Share class | | Class inception date | | 1-yr | | 5-yr | | 10-yr | | |
| | | Initial Class | | 5/06/98 | | (12.94)% | | 1.14% | | 3.63% | | |
| | | Service Class | | 8/24/01 | | (13.21)% | | 0.88% | | 3.43% | | |
Comparative Benchmarks
| | | | | | | | | | | | |
| | | Barclays Capital U.S. High-Yield Corporate Bond Index (f) | | (26.16)% | | (0.80)% | | 2.18% | | |
| | | Barclays Capital U.S. Aggregate Bond Index (f)(x) | | 5.24% | | 4.65% | | 5.63% | | |
| | | Barclays Capital U.S. Credit Bond Index (f)(x) | | (3.08)% | | 2.65% | | 4.86% | | |
| | | Barclays Capital U.S. Government/Mortgage Bond Index (f)(x) | | 10.17% | | 5.75% | | 6.05% | | |
| | | Citigroup World Government Bond Non-Dollar Hedged Index (f) | | 8.01% | | 5.36% | | 5.40% | | |
| | | Citigroup World Government Bond Non-Dollar Index (f)(x) | | 10.11% | | 5.97% | | 5.59% | | |
| | | JPMorgan Emerging Markets Bond Index Global (f) | | (10.91)% | | 5.18% | | 10.17% | | |
5
Performance Summary – continued
| (f) | Source: FactSet Research Systems Inc. |
| (x) | Effective December 18, 2008, the fund changed certain other benchmarks replacing the Barclays Capital U.S. Aggregate Bond Index with the Barclays Capital U.S. Credit Bond Index and Barclays Capital U.S. Government/Mortgage Bond Index, and also added the Citigroup World Government Bond Non-Dollar Index. It is believed that these other benchmark changes more closely correspond to the investment strategy of the fund. |
Benchmark Definitions
Barclays Capital U.S. Aggregate Bond Index (formerly known as Lehman Brothers U.S. Aggregate Bond Index) – a market capitalization-weighted index that measures the performance of the U.S. investment-grade, fixed rate bond market, with index components for government and corporate securities, mortgage pass-through securities, and asset-backed securities with at least one year to final maturity.
Barclays Capital U.S. Credit Bond Index (formerly known as Lehman Brothers U.S. Credit Bond Index) – a market capitalization-weighted index that measures the performance of publicly issued, SEC-registered, U.S. corporate and specified foreign debentures and secured notes that meet specified maturity, liquidity, and quality requirements.
Barclays Capital U.S. Government/Mortgage Bond Index (formerly known as Lehman Brothers U.S. Government/Mortgage Bond Index) – measures debt issued by the U.S. Government, and its agencies, as well as mortgage-backed pass-through securities of Ginnie Mae (GNMA), Fannie Mae (FNMA), and Freddie Mac (FHLMC).
Barclays Capital U.S. High-Yield Corporate Bond Index (formerly known as Lehman Brothers U.S. High-Yield Corporate Bond Index) – a market capitalization-weighted index that measures the performance of non-investment grade, fixed rate debt. Eurobonds and debt issues from countries designated as emerging markets (e.g., Argentina, Brazil, Venezuela, etc.) are excluded.
Citigroup World Government Bond Non-Dollar Hedged Index – a market capitalization-weighted index that is designed to represent the currency-hedged performance of the international developed government bond markets, excluding the United States.
Citigroup World Government Bond Non-Dollar Index – a market capitalization-weighted index that is designed to represent the performance of the international developed government bond markets, excluding the United States.
JPMorgan Emerging Markets Bond Index Global – measures the performance of U.S.-dollar-denominated debt instruments issued by emerging market sovereign and quasi-sovereign entities: Brady bonds, loans, Eurobonds.
It is not possible to invest directly in an index.
Notes to Performance Summary
Performance for the Service Class includes the performance of the fund’s Initial Class for periods prior to their offering. Because Service Class expenses are higher than those of Initial Class, performance shown for Service Class is higher than it would have been had it been offered for the entire period. Performance has not been adjusted to take into account differences in class specific operating expenses (such as Rule 12b-1 fees). Please see the prospectus for additional information about performance and expenses.
Performance results reflect any applicable expense subsidies and waivers in effect during the periods shown. Without such subsidies and waivers the fund’s performance results would be less favorable. Please see the prospectus for complete details. All results are historical and assume the reinvestment of any dividends and capital gains distributions.
From time to time the fund may receive proceeds from litigation settlements, without which performance would be lower.
6
EXPENSE TABLE
Fund Expenses Borne by the Contract Holders During the Period,
July 1, 2008 through December 31, 2008
As a contract holder of the fund, you incur ongoing costs, including management fees; distribution (12b-1) fees; and other fund expenses. This example is intended to help you understand your ongoing costs (in dollars) of investing in the fund and to compare these costs with the ongoing costs of investing in other mutual funds.
The example is based on an investment of $1,000 invested at the beginning of the period and held for the entire period July 1, 2008 through December 31, 2008.
Actual Expenses
The first line for each share class in the following table provides information about actual account values and actual expenses. You may use the information in this line, together with the amount you invested, to estimate the expenses that you paid over the period. Simply divide your account value by $1,000 (for example, an $8,600 account value divided by $1,000 = 8.6), then multiply the result by the number in the first line under the heading entitled “Expenses Paid During Period” to estimate the expenses you paid on your account during this period.
Hypothetical Example for Comparison Purposes
The second line for each share class in the following table provides information about hypothetical account values and hypothetical expenses based on the fund’s actual expense ratio and an assumed rate of return of 5% per year before expenses, which is not the fund’s actual return. The hypothetical account values and expenses may not be used to estimate the actual ending account balance or expenses you paid for the period. You may use this information to compare the ongoing costs of investing in the fund and other funds. To do so, compare this 5% hypothetical example with the 5% hypothetical examples that appear in the shareholder reports of the other funds.
Please note that the expenses shown in the table are meant to highlight the fund’s ongoing costs only and do not take into account the fees and expenses imposed under the variable contracts through which your investment in the fund is made. Therefore, the second line for each share class in the table is useful in comparing ongoing costs associated with an investment in vehicles (such as the fund) which fund benefits under variable annuity and variable life insurance contracts and to qualified pension and retirement plans only, and will not help you determine the relative total costs of investing in the fund through variable annuity and variable life insurance contracts. If the fees and expenses imposed under the variable contracts were included, your costs would have been higher.
| | | | | | | | | | |
| Share Class | | | | Annualized
Expense Ratio | | Beginning
Account Value
7/01/08 | | Ending
Account Value
12/31/08 | | Expenses Paid
During Period (p)
7/01/08-12/31/08 |
| Initial Class | | Actual | | 0.90% | | $1,000.00 | | $875.39 | | $4.24 |
| | Hypothetical (h) | | 0.90% | | $1,000.00 | | $1,020.61 | | $4.57 |
| Service Class | | Actual | | 1.15% | | $1,000.00 | | $873.68 | | $5.42 |
| | Hypothetical (h) | | 1.15% | | $1,000.00 | | $1,019.36 | | $5.84 |
| (h) | 5% class return per year before expenses. |
| (p) | Expenses paid is equal to each class’ annualized expense ratio, as shown above, multiplied by the average account value over the period, multiplied by the number of days in the period, divided by the number of days in the year. |
7
PORTFOLIO OF INVESTMENTS – 12/31/08
The Portfolio of Investments is a complete list of all securities owned by your fund. It is categorized by broad-based asset classes.
| | | | | |
| Issuer | | Shares/Par | | Value ($) |
| | | | | |
| BONDS – 94.8% | | | | | |
| Aerospace – 0.3% | | | | | |
| Hawker Beechcraft Acquisition Co. LLC, 9.75%, 2017 | | $ 10,000 | | $ | 2,700 |
| Vought Aircraft Industries, Inc., 8%, 2011 | | 160,000 | | | 108,000 |
| | | | | |
| | | | $ | 110,700 |
| | | | | |
| Agency – Other – 0.3% | | | | | |
| Citigroup, Inc., 2.875%, 2011 | | $ 140,000 | | $ | 144,364 |
| | | | | |
| Airlines – 0.2% | | | | | |
| Continental Airlines, Inc., 7.339%, 2014 | | $ 126,000 | | $ | 83,160 |
| | | | | |
| Asset Backed & Securitized – 5.6% | | | |
| Anthracite Ltd., CDO, 6%, 2037 (z) | | $ 200,000 | | $ | 40,000 |
| ARCap REIT, Inc., CDO, “H”, 6.1%, 2045 (n) | | 200,000 | | | 14,000 |
| Bayview Financial Revolving Mortgage Loan Trust, FRN, 1.271%, 2040 (z) | | 250,000 | | | 155,000 |
| Brazilian Merchant Voucher Receivables Ltd., 5.911%, 2011 (z) | | 179,307 | | | 170,342 |
| Chase Commercial Mortgage Securities Corp., 6.6%, 2029 (z) | | 128,924 | | | 123,880 |
| Countrywide Asset-Backed Certificates, FRN, 4.575%, 2035 | | 4,742 | | | 4,587 |
| Crest Ltd., CDO, 7%, 2040 | | 270,000 | | | 45,900 |
| Deutsche Mortgage & Asset Receiving Corp., FRN, 7.5%, 2031 | | 250,000 | | | 246,476 |
| DLJ Commercial Mortgage Corp., 6.04%, 2031 (z) | | 265,000 | | | 227,905 |
Falcon Franchise Loan LLC,
6.5%, 2014 (z) | | 250,000 | | | 132,500 |
| Falcon Franchise Loan LLC, FRN, 2.96%, 2023 (i)(n) | | 577,707 | | | 31,658 |
| Falcon Franchise Loan LLC, FRN, 3.727%, 2025 (i)(z) | | 643,348 | | | 47,736 |
| First Union-Lehman Brothers Bank of America, FRN, 0.418%, 2028 (i) | | 2,725,825 | | | 32,967 |
| First Union-Lehman Brothers Commercial Mortgage Trust, 7%, 2029 (n) | | 104,666 | | | 101,356 |
| GMAC Commercial Mortgage Securities, Inc., FRN, 6.02%, 2033 (z) | | 350,000 | | | 262,300 |
| Morgan Stanley Capital I, Inc., FRN, 1.44%, 2039 (i)(n) | | 2,662,489 | | | 47,579 |
| Prudential Securities Secured Financing Corp., FRN, 7.245%, 2013 (z) | | 411,000 | | | 163,876 |
| Salomon Brothers Mortgage Securities, Inc., FRN, 7.058%, 2032 (z) | | 530,129 | | | 512,634 |
| | | | | |
| | | | $ | 2,360,696 |
| | | | | |
| Automotive – 1.4% | | | | | |
| Accuride Corp., 8.5%, 2015 | | $ 35,000 | | $ | 11,463 |
| Allison Transmission, Inc., 11%, 2015 (n) | | 155,000 | | | 75,950 |
| FCE Bank PLC, 7.125%, 2012 | | EUR 150,000 | | | 139,700 |
| Ford Motor Credit Co. LLC, 9.75%, 2010 | | 100,000 | | | 79,999 |
| Ford Motor Credit Co. LLC, 12%, 2015 | | 200,000 | | | 149,352 |
| Ford Motor Credit Co. LLC, 8%, 2016 | | 100,000 | | | 65,137 |
| | | | | | |
| Issuer | | Shares/Par | | Value ($) |
| | | | | | |
| BONDS – continued | | | | | | |
| Automotive – continued | | | | | | |
| General Motors Corp., 8.375%, 2033 | | $ | 37,000 | | $ | 6,475 |
| Johnson Controls, Inc., 5.25%, 2011 | | | 60,000 | | | 55,132 |
| | | | | | |
| | | | | $ | 583,208 |
| | | | | | |
| Broadcasting – 1.8% | | | | | | |
| Allbritton Communications Co., 7.75%, 2012 | | $ | 116,000 | | $ | 56,985 |
| CanWest MediaWorks LP, 9.25%, 2015 (n) | | | 85,000 | | | 32,300 |
| Clear Channel Communications, 10.75%, 2016 (n) | | | 30,000 | | | 6,150 |
| DirectTV Holdings LLC, 7.625%, 2016 | | | 110,000 | | | 106,700 |
| Lamar Media Corp., 6.625%, 2015 | | | 115,000 | | | 83,088 |
| Lamar Media Corp., “C”, 6.625%, 2015 | | | 70,000 | | | 50,575 |
| LBI Media, Inc., 8.5%, 2017 (z) | | | 75,000 | | | 26,250 |
| LIN TV Corp., 6.5%, 2013 | | | 165,000 | | | 78,788 |
| Local TV Finance LLC, 9.25%, 2015 (p)(z) | | | 120,000 | | | 26,400 |
| Newport Television LLC, 13%, 2017 (n)(p) | | | 110,000 | | | 8,388 |
| News America, Inc., 6.4%, 2035 | | | 220,000 | | | 203,337 |
| Nexstar Broadcasting Group, Inc., 7%, 2014 | | | 120,000 | | | 51,750 |
| Univision Communications, Inc., 9.75%, 2015 (n)(p) | | | 175,000 | | | 21,875 |
| | | | | | |
| | | | | $ | 752,586 |
| | | | | | |
| Brokerage & Asset Managers – 0.3% | | | | | | |
| Lehman Brothers Holdings, Inc., 6.5%, 2017 (d) | | $ | 180,000 | | $ | 18 |
| Merrill Lynch & Co., Inc., 6.4%, 2017 | | | 90,000 | | | 90,168 |
| Nuveen Investments, Inc., 10.5%, 2015 (n) | | | 195,000 | | | 43,144 |
| | | | | | |
| | | | | $ | 133,330 |
| | | | | | |
| Building – 1.6% | | | | | | |
| Associated Materials, Inc., 0% to 2009, 11.25% to 2014 | | $ | 50,000 | | $ | 27,750 |
| Building Materials Corp. of America, 7.75%, 2014 | | | 70,000 | | | 44,100 |
| CRH PLC, 8.125%, 2018 | | | 320,000 | | | 231,040 |
| Lafarge S.A., 6.15%, 2011 | | | 330,000 | | | 287,325 |
| Nortek Holdings, Inc., 8.5%, 2014 | | | 40,000 | | | 9,200 |
| Nortek, Inc., 10%, 2013 | | | 50,000 | | | 34,000 |
| Ply Gem Industries, Inc., 9%, 2012 | | | 80,000 | | | 19,200 |
| Ply Gem Industries, Inc., 11.75%, 2013 | | | 40,000 | | | 21,600 |
| | | | | | |
| | | | | $ | 674,215 |
| | | | | | |
| Business Services – 0.3% | | | | | | |
| First Data Corp., 9.875%, 2015 | | $ | 115,000 | | $ | 69,575 |
| SunGard Data Systems, Inc., 10.25%, 2015 | | | 106,000 | | | 69,960 |
| | | | | | |
| | | | | $ | 139,535 |
| | | | | | |
| Cable TV – 1.5% | | | | | | |
| CCH II Holdings LLC, 10.25%, 2010 | | $ | 100,000 | | $ | 46,000 |
| CCO Holdings LLC, 8.75%, 2013 | | | 255,000 | | | 160,650 |
| CSC Holdings, Inc., 6.75%, 2012 | | | 80,000 | | | 73,200 |
| Mediacom LLC, 9.5%, 2013 | | | 40,000 | | | 30,200 |
| NTL Cable PLC, 9.125%, 2016 | | | 100,000 | | | 74,000 |
| TCI Communications, Inc., 9.8%, 2012 | | | 245,000 | | | 258,280 |
| | | | | | |
| | | | | $ | 642,330 |
| | | | | | |
8
Portfolio of Investments – continued
| | | | | | |
| Issuer | | Shares/Par | | Value ($) |
| | | | | | |
| BONDS – continued | | | | | | |
| Chemicals – 1.5% | | | | | | |
| Innophos Holdings, Inc., 8.875%, 2014 | | $ | 100,000 | | $ | 70,000 |
| Momentive Performance Materials, Inc., 11.5%, 2016 | | | 120,000 | | | 35,400 |
| Nalco Co., 7.75%, 2011 | | | 115,000 | | | 110,400 |
| Nalco Co., 8.875%, 2013 | | | 75,000 | | | 63,375 |
| Nalco Finance Holdings, Inc., 0% to 2009, 9% to 2014 | | | 115,000 | | | 82,800 |
| Yara International A.S.A., 5.25%, 2014 (n) | | | 310,000 | | | 278,543 |
| | | | | | |
| | | | | $ | 640,518 |
| | | | | | |
| Conglomerates – 0.5% | | | | | | |
| American Standard Cos., Inc., 7.625%, 2010 | | $ | 225,000 | | $ | 224,998 |
| | | | | | |
| Construction – 0.5% | | | | | | |
| Lennar Corp., 5.125%, 2010 | | $ | 270,000 | | $ | 218,700 |
| | | | | | |
| Consumer Goods & Services – 2.6% | | | | | | |
| Fortune Brands, Inc., 5.125%, 2011 | | $ | 244,000 | | $ | 234,363 |
| Jarden Corp., 7.5%, 2017 | | | 65,000 | | | 44,363 |
| KAR Holdings, Inc., 10%, 2015 | | | 60,000 | | | 19,800 |
| Procter & Gamble Co., 4.6%, 2014 | | | 160,000 | | | 167,664 |
| Service Corp. International, 7%, 2017 | | | 135,000 | | | 101,250 |
| Service Corp. International, 7.625%, 2018 | | | 107,000 | | | 79,180 |
| Ticketmaster, 10.75%, 2016 (n) | | | 40,000 | | | 21,600 |
| Western Union Co., 5.4%, 2011 | | | 440,000 | | | 422,919 |
| | | | | | |
| | | | | $ | 1,091,139 |
| | | | | | |
| Containers – 1.1% | | | | | | |
| Graham Packaging Holdings Co., 9.875%, 2014 | | $ | 100,000 | | $ | 61,500 |
| Greif, Inc., 6.75%, 2017 | | | 220,000 | | | 194,700 |
| Owens-Brockway Glass Container, Inc., 8.25%, 2013 | | | 200,000 | | | 197,000 |
| | | | | | |
| | | | | $ | 453,200 |
| | | | | | |
| Defense Electronics – 0.8% | | | | | | |
| BAE Systems Holdings, Inc., 5.2%, 2015 (n) | | $ | 312,000 | | $ | 290,222 |
| L-3 Communications Corp., 5.875%, 2015 | | | 75,000 | | | 67,500 |
| | | | | | |
| | | | | $ | 357,722 |
| | | | | | |
| Electronics – 0.3% | | | | | | |
| Avago Technologies Ltd., 11.875%, 2015 | | $ | 40,000 | | $ | 27,800 |
| Flextronics International Ltd., 6.25%, 2014 | | | 115,000 | | | 85,675 |
| Freescale Semiconductor, Inc., 8.875%, 2014 | | | 50,000 | | | 22,000 |
| Spansion, Inc., 11.25%, 2016 (n) | | | 65,000 | | | 4,550 |
| | | | | | |
| | | | | $ | 140,025 |
| | | | | | |
| Emerging Market Quasi-Sovereign – 1.8% | | | |
| Banco Nacional de Desenvolvimento Economico e Social, 6.369%, 2018 (n) | | $ | 100,000 | | $ | 95,000 |
| Corporacion Nacional del Cobre de Chile, 4.75%, 2014 | | | 124,000 | | | 116,460 |
| National Power Corp., FRN, 6.403%, 2011 | | | 93,000 | | | 80,134 |
Pemex Project Funding Master Trust,
5.75%, 2018 (n) | | | 316,000 | | | 278,870 |
| Ras Laffan Liquefied Natural Gas Co. Ltd., 5.832%, 2016 (n) | | | 250,000 | | | 186,113 |
| | | | | | |
| | | | | $ | 756,577 |
| | | | | | |
| | | | | | |
| Issuer | | Shares/Par | | Value ($) |
| | | | | | |
| BONDS – continued | | | | | | |
| Emerging Market Sovereign – 1.2% | | | | | | |
| Federative Republic of Brazil, 8%, 2018 | | $ | 32,000 | | $ | 35,840 |
| Republic of Argentina, FRN, 3.127%, 2012 | | | 84,450 | | | 44,822 |
| Republic of Colombia, 7.375%, 2017 | | | 258,000 | | | 268,320 |
| Republic of Philippines, 9.375%, 2017 | | | 66,000 | | | 71,280 |
| Republic of Uruguay, 8%, 2022 | | | 100,000 | | | 92,500 |
| | | | | | |
| | | | | $ | 512,762 |
| | | | | | |
| Energy – Independent – 2.6% | | | | | | |
| Chaparral Energy, Inc., 8.875%, 2017 | | $ | 95,000 | | $ | 19,000 |
| Chesapeake Energy Corp., 6.375%, 2015 | | | 125,000 | | | 98,750 |
| Forest Oil Corp., 7.25%, 2019 | | | 105,000 | | | 76,650 |
| Hilcorp Energy I LP, 7.75%, 2015 (n) | | | 105,000 | | | 74,025 |
| Hilcorp Energy I LP, 9%, 2016 (n) | | | 115,000 | | | 82,225 |
| Mariner Energy, Inc., 8%, 2017 | | | 95,000 | | | 49,400 |
| Newfield Exploration Co., 6.625%, 2014 | | | 95,000 | | | 77,900 |
| Newfield Exploration Co., 6.625%, 2016 | | | 25,000 | | | 19,875 |
| Nexen, Inc., 6.4%, 2037 | | | 280,000 | | | 219,095 |
| OPTI Canada, Inc., 8.25%, 2014 | | | 155,000 | | | 83,700 |
| Plains Exploration & Production Co., 7%, 2017 | | | 210,000 | | | 143,850 |
| Quicksilver Resources, Inc., 7.125%, 2016 | | | 160,000 | | | 85,600 |
| Range Resource Corp., 7.5%, 2016 | | | 10,000 | | | 8,675 |
| SandRidge Energy, Inc., 8.625%, 2015 (p) | | | 32,000 | | | 16,800 |
| SandRidge Energy, Inc., 8%, 2018 (n) | | | 70,000 | | | 38,850 |
| | | | | | |
| | | | | $ | 1,094,395 |
| | | | | | |
| Entertainment – 0.2% | | | | | | |
| AMC Entertainment, Inc., 11%, 2016 | | $ | 65,000 | | $ | 45,419 |
| Marquee Holdings, Inc., 12%, 2014 | | | 55,000 | | | 28,050 |
| Time Warner, Inc., 6.5%, 2036 | | | 20,000 | | | 18,132 |
| | | | | | |
| | | | | $ | 91,601 |
| | | | | | |
| Financial Institutions – 2.1% | | | | | | |
| American Express Centurion Bank, 5.2%, 2010 | | $ | 250,000 | | $ | 242,685 |
General Electric Capital Corp., FRN,
3.322%, 2012 | | | 170,000 | | | 140,534 |
| GMAC Commercial Mortgage Securities, Inc., 6.875%, 2011 (z) | | | 135,000 | | | 110,600 |
| GMAC Commercial Mortgage Securities, Inc., 8%, 2031 (z) | | | 41,000 | | | 24,370 |
| ILFC E-Capital Trust I, 5.9% to 2010, FRN to 2065 (n) | | | 300,000 | | | 96,153 |
| ORIX Corp., 5.48%, 2011 | | | 380,000 | | | 285,485 |
| | | | | | |
| | | | | $ | 899,827 |
| | | | | | |
| Food & Beverages – 2.4% | | | | | | |
| ARAMARK Corp., 8.5%, 2015 | | $ | 85,000 | | $ | 76,925 |
| B&G Foods, Inc., 8%, 2011 | | | 80,000 | | | 68,000 |
| Dean Foods Co., 7%, 2016 | | | 105,000 | | | 89,250 |
| Del Monte Corp., 6.75%, 2015 | | | 90,000 | | | 77,400 |
| Kraft Foods, Inc., 6.125%, 2018 | | | 170,000 | | | 167,599 |
| Michael Foods, Inc., 8%, 2013 | | | 110,000 | | | 94,600 |
| Miller Brewing Co., 5.5%, 2013 (n) | | | 330,000 | | | 307,687 |
| Tyson Foods, Inc., 7.35%, 2016 | | | 170,000 | | | 125,800 |
| | | | | | |
| | | | | $ | 1,007,261 |
| | | | | | |
9
Portfolio of Investments – continued
| | | | | |
| Issuer | | Shares/Par | | Value ($) |
| | | | | |
| BONDS – continued | | | | | |
| Food & Drug Stores – 0.1% | | | | | |
| CVS Caremark Corp., 5.75%, 2017 | | $ 43,000 | | $ | 40,483 |
| | | | | |
| Forest & Paper Products – 1.7% | | | | | |
| Buckeye Technologies, Inc., 8%, 2010 | | $ 7,000 | | $ | 6,370 |
| Buckeye Technologies, Inc., 8.5%, 2013 | | 240,000 | | | 204,000 |
| Georgia-Pacific Corp., 7.125%, 2017 (n) | | 60,000 | | | 50,400 |
| Georgia-Pacific Corp., 8%, 2024 | | 35,000 | | | 23,625 |
| Graphic Packaging International Corp., 9.5%, 2013 | | 55,000 | | | 37,950 |
| International Paper Co., 7.95%, 2018 | | 90,000 | | | 71,132 |
| Jefferson Smurfit Corp., 8.25%, 2012 | | 40,000 | | | 6,800 |
| JSG Funding PLC, 7.75%, 2015 | | EUR 130,000 | | | 121,073 |
Millar Western Forest Products Ltd.,
7.75%, 2013 | | $ 125,000 | | | 62,500 |
| NewPage Holding Corp., 10%, 2012 | | 50,000 | | | 22,000 |
| Smurfit-Stone Container Corp., 8%, 2017 | | 39,000 | | | 7,410 |
| Stora Enso Oyj, 6.404%, 2016 (z) | | 160,000 | | | 105,638 |
| | | | | |
| | | | $ | 718,898 |
| | | | | |
| Gaming & Lodging – 1.9% | | | | | |
| Boyd Gaming Corp., 6.75%, 2014 | | $ 65,000 | | $ | 40,950 |
| Firekeepers Development Authority, 13.875%, 2015 (z) | | 65,000 | | | 40,300 |
| Fontainebleau Las Vegas Holdings LLC, 10.25%, 2015 (n) | | 95,000 | | | 9,263 |
Harrah’s Operating Co., Inc.,
10.75%, 2016 (n) | | 196,000 | | | 55,860 |
| Harrah’s Operating Co., Inc., 10%, 2018 (z) | | 44,000 | | | 16,060 |
| Host Hotels & Resorts, Inc., 7.125%, 2013 | | 60,000 | | | 48,300 |
| Host Hotels & Resorts, Inc., 6.75%, 2016 | | 30,000 | | | 21,900 |
| MGM Mirage, 8.375%, 2011 | | 350,000 | | | 208,250 |
| MGM Mirage, 6.75%, 2013 | | 60,000 | | | 40,200 |
| Pinnacle Entertainment, Inc., 8.75%, 2013 | | 5,000 | | | 3,950 |
| Pinnacle Entertainment, Inc., 7.5%, 2015 | | 140,000 | | | 81,200 |
| Scientific Games Corp., 6.25%, 2012 | | 185,000 | | | 148,925 |
| Station Casinos, Inc., 6%, 2012 | | 50,000 | | | 10,000 |
| Station Casinos, Inc., 6.5%, 2014 | | 150,000 | | | 8,625 |
| Station Casinos, Inc., 6.875%, 2016 | | 140,000 | | | 8,050 |
| Trump Entertainment Resorts Holdings, Inc., 8.5%, 2015 (d) | | 245,000 | | | 32,463 |
| Wyndham Worldwide Corp., 6%, 2016 | | 90,000 | | | 36,278 |
| | | | | |
| | | | $ | 810,574 |
| | | | | |
| Industrial – 1.1% | | | | | |
| Blount International, Inc., 8.875%, 2012 | | $ 160,000 | | $ | 148,000 |
| JohnsonDiversey, Inc., 9.625%, 2012 | | EUR 35,000 | | | 35,516 |
| JohnsonDiversey, Inc., “B”, 9.625%, 2012 | | $ 165,000 | | | 135,300 |
| Steelcase, Inc., 6.5%, 2011 | | 146,000 | | | 137,492 |
| | | | | |
| | | | $ | 456,308 |
| | | | | |
| | | | | |
| Issuer | | Shares/Par | | Value ($) |
| | | | | |
| BONDS – continued | | | | | |
| Insurance – 1.1% | | | | | |
| Allianz AG, 5.5% to 2014, FRN to 2049 | | EUR 248,000 | | $ | 253,356 |
| ING Groep N.V., 5.775% to 2015, FRN to 2049 | | $ 490,000 | | | 209,863 |
| | | | | |
| | | | $ | 463,219 |
| | | | | |
| Insurance – Property & Casualty – 0.8% | | | |
| AXIS Capital Holdings Ltd., 5.75%, 2014 | | $ 375,000 | | $ | 287,716 |
| USI Holdings Corp., 9.75%, 2015 (z) | | 75,000 | | | 29,906 |
| | | | | |
| | | | $ | 317,622 |
| | | | | |
| International Market Quasi-Sovereign – 0.2% | | | |
| Canada Housing Trust, 4.6%, 2011 (n) | | CAD 120,000 | | $ | 104,480 |
| | | | | |
| International Market Sovereign – 21.8% | | | |
| Commonwealth of Australia, 6%, 2017 | | AUD 106,000 | | $ | 84,757 |
| Federal Republic of Germany, 3.75%, 2015 | | EUR 268,000 | | | 397,076 |
| Federal Republic of Germany, 6.25%, 2030 | | EUR 309,000 | | | 574,950 |
| Government of Canada, 4.5%, 2015 | | CAD 203,000 | | | 187,605 |
| Government of Canada, 5.75%, 2033 | | CAD 53,000 | | | 58,408 |
| Government of Japan, 1.5%, 2012 | | JPY 25,000,000 | | | 284,644 |
| Government of Japan, 1.3%, 2014 | | JPY 109,000,000 | | | 1,239,422 |
| Government of Japan, 1.7%, 2017 | | JPY 81,000,000 | | | 949,610 |
| Government of Japan, 2.2%, 2027 | | JPY 47,000,000 | | | 558,446 |
| Government of Japan, 2.4%, 2037 | | JPY 27,000,000 | | | 336,549 |
| Kingdom of Denmark, 4%, 2015 | | DKK 417,000 | | | 81,339 |
| Kingdom of Spain, 5.35%, 2011 | | EUR 666,000 | | | 986,624 |
| Kingdom of Sweden, 4.5%, 2015 | | SEK 730,000 | | | 105,157 |
| Republic of Austria, 4.65%, 2018 | | EUR 516,000 | | | 764,712 |
| Republic of France, 4.75%, 2012 | | EUR 113,000 | | | 168,727 |
| Republic of France, 5%, 2016 | | EUR 280,000 | | | 436,587 |
| Republic of France, 6%, 2025 | | EUR 136,000 | | | 241,884 |
| Republic of France, 4.75%, 2035 | | EUR 508,000 | | | 813,791 |
| United Kingdom Treasury, 8%, 2015 | | GBP 271,000 | | | 505,101 |
| United Kingdom Treasury, 8%, 2021 | | GBP 86,000 | | | 180,648 |
| United Kingdom Treasury, 4%, 2036 | | GBP 183,000 | | | 283,315 |
| | | | | |
| | | | $ | 9,239,352 |
| | | | | |
| Machinery & Tools – 1.0% | | | | | |
| Atlas Copco AB, 5.6%, 2017 (n) | | $ 350,000 | | $ | 328,791 |
| Case New Holland, Inc., 7.125%, 2014 | | 135,000 | | | 95,850 |
| | | | | |
| | | | $ | 424,641 |
| | | | | |
| Major Banks – 1.7% | | | | | |
| BAC Capital Trust XIV, 5.63% to 2012, FRN to 2049 | | $ 460,000 | | $ | 184,302 |
BNP Paribas, 5.186% to 2015,
FRN to 2049 (n) | | 108,000 | | | 61,267 |
BNP Paribas, 7.195% to 2037,
FRN to 2049 (n) | | 100,000 | | | 63,572 |
Natixis S.A., 10% to 2018,
FRN to 2049 (n) | | 200,000 | | | 106,523 |
| Royal Bank of Scotland Group PLC, 9.118%, 2049 | | 207,000 | | | 176,723 |
| UniCredito Italiano Capital Trust II, 9.2% to 2010, FRN to 2049 (n) | | 290,000 | | | 110,949 |
| | | | | |
| | | | $ | 703,336 |
| | | | | |
10
Portfolio of Investments – continued
| | | | | | |
| Issuer | | Shares/Par | | Value ($) |
| | | | | | |
| BONDS – continued | | | | | | |
| Medical & Health Technology & Services – 4.2% | | | |
| Biomet, Inc., 10%, 2017 | | $ | 105,000 | | $ | 100,800 |
| Biomet, Inc., 11.625%, 2017 | | | 85,000 | | | 72,675 |
| Cardinal Health, Inc., 5.8%, 2016 | | | 201,000 | | | 181,840 |
| Community Health Systems, Inc., 8.875%, 2015 | | | 210,000 | | | 193,200 |
| Cooper Cos., Inc., 7.125%, 2015 | | | 55,000 | | | 46,200 |
| DaVita, Inc., 6.625%, 2013 | | | 33,000 | | | 31,350 |
| DaVita, Inc., 7.25%, 2015 | | | 134,000 | | | 127,300 |
| HCA, Inc., 6.375%, 2015 | | | 180,000 | | | 109,800 |
| HCA, Inc., 9.25%, 2016 | | | 275,000 | | | 252,313 |
| Hospira, Inc., 5.55%, 2012 | | | 110,000 | | | 104,221 |
| Hospira, Inc., 6.05%, 2017 | | | 100,000 | | | 81,222 |
| McKesson Corp., 5.7%, 2017 | | | 90,000 | | | 81,413 |
| Owens & Minor, Inc., 6.35%, 2016 | | | 170,000 | | | 143,255 |
| Psychiatric Solutions, Inc., 7.75%, 2015 | | | 95,000 | | | 69,825 |
| U.S. Oncology, Inc., 10.75%, 2014 | | | 120,000 | | | 97,800 |
Universal Hospital Services, Inc.,
8.5%, 2015 (p) | | | 75,000 | | | 53,250 |
| Universal Hospital Services, Inc., FRN, 6.302%, 2015 | | | 20,000 | | | 12,200 |
| VWR Funding, Inc., 10.25%, 2015 (p) | | | 65,000 | | | 40,950 |
| | | | | | |
| | | | | $ | 1,799,614 |
| | | | | | |
| Metals & Mining – 1.6% | | | | | | |
| Arch Western Finance LLC, 6.75%, 2013 | | $ | 95,000 | | $ | 82,650 |
| FMG Finance Ltd., 10.625%, 2016 (n) | | | 185,000 | | | 107,300 |
| Freeport-McMoRan Copper & Gold, Inc., 8.375%, 2017 | | | 265,000 | | | 217,300 |
| Freeport-McMoRan Copper & Gold, Inc., FRN, 7.083%, 2015 | | | 55,000 | | | 36,300 |
| Peabody Energy Corp., 7.375%, 2016 | | | 40,000 | | | 37,600 |
| Peabody Energy Corp., “B”, 6.875%, 2013 | | | 160,000 | | | 151,600 |
| Rio Tinto Finance USA Ltd., 5.875%, 2013 | | | 40,000 | | | 31,861 |
| | | | | | |
| | | | | $ | 664,611 |
| | | | | | |
| Mortgage Backed – 2.8% | | | | | | |
| Fannie Mae, 5.5%, 2019 (f) | | $ | 492,113 | | $ | 509,486 |
| Fannie Mae, 6.5%, 2032 | | | 206,087 | | | 215,039 |
| Fannie Mae, 5.5%, 2034 | | | 441,493 | | | 453,654 |
| | | | | | |
| | | | | $ | 1,178,179 |
| | | | | | |
| Natural Gas – Distribution – 0.3% | | | | | | |
| AmeriGas Partners LP, 7.125%, 2016 | | $ | 100,000 | | $ | 80,000 |
| Inergy LP, 6.875%, 2014 | | | 85,000 | | | 66,300 |
| | | | | | |
| | | | | $ | 146,300 |
| | | | | | |
| Natural Gas – Pipeline – 3.3% | | | | | | |
| Atlas Pipeline Partners LP, 8.125%, 2015 | | $ | 50,000 | | $ | 33,750 |
| Atlas Pipeline Partners LP, 8.75%, 2018 (n) | | | 65,000 | | | 42,575 |
| CenterPoint Energy, Inc., 7.875%, 2013 | | | 448,000 | | | 414,980 |
| Deutsche Bank (El Paso Performance-Linked Trust, CLN), 7.75%, 2011 (n) | | | 155,000 | | | 134,191 |
| El Paso Corp., 7.25%, 2018 | | | 65,000 | | | 51,589 |
| Kinder Morgan Energy Partners LP, 6%, 2017 | | | 200,000 | | | 173,635 |
| Kinder Morgan Finance Corp., 5.35%, 2011 | | | 362,000 | | | 323,085 |
| | | | | | |
| Issuer | | Shares/Par | | Value ($) |
| | | | | | |
| BONDS – continued | | | | | | |
| Natural Gas – Pipeline – continued | | | | | | |
| Spectra Energy Capital LLC, 8%, 2019 | | $ | 164,000 | | $ | 170,190 |
| Williams Partners LP, 7.25%, 2017 | | | 65,000 | | | 51,350 |
| | | | | | |
| | | | | $ | 1,395,345 |
| | | | | | |
| Network & Telecom – 3.4% | | | | | | |
| Cincinnati Bell, Inc., 8.375%, 2014 | | $ | 120,000 | | $ | 92,400 |
| Citizens Communications Co., 9.25%, 2011 | | | 162,000 | | | 153,900 |
| Citizens Communications Co., 9%, 2031 | | | 155,000 | | | 97,650 |
| Deutsche Telekom International Finance B.V., 8.5%, 2010 | | | 137,000 | | | 141,120 |
| Nordic Telephone Co. Holdings, 8.875%, 2016 (n) | | | 115,000 | | | 80,500 |
| Qwest Communications International, Inc., 7.25%, 2011 | | | 170,000 | | | 142,800 |
| Qwest Corp., 8.875%, 2012 | | | 70,000 | | | 64,750 |
| Qwest Corp., 7.5%, 2014 | | | 140,000 | | | 116,200 |
| Telecom Italia Capital, 4.875%, 2010 | | | 60,000 | | | 54,300 |
| Telefonica Europe B.V., 7.75%, 2010 | | | 260,000 | | | 263,994 |
| Verizon Communications, Inc., 8.75%, 2018 | | | 140,000 | | | 164,251 |
| Windstream Corp., 8.625%, 2016 | | | 70,000 | | | 61,950 |
| | | | | | |
| | | | | $ | 1,433,815 |
| | | | | | |
| Oil Services – 0.3% | | | | | | |
| KazMunaiGaz Finance B.V., 8.375%, 2013 (n) | | $ | 100,000 | | $ | 78,000 |
| Weatherford International Ltd., 6.35%, 2017 | | | 80,000 | | | 68,275 |
| | | | | | |
| | | | | $ | 146,275 |
| | | | | | |
| Oils – 0.7% | | | | | | |
| Premcor Refining Group, Inc., 7.5%, 2015 | | $ | 310,000 | | $ | 279,129 |
| | | | | | |
| Other Banks & Diversified Financials – 1.7% | | | |
| Alfa Diversified Payment Rights Finance Co. S.A., FRN, 3.896%, 2011 (n) | | $ | 150,000 | | $ | 97,500 |
| Bosphorus Financial Services Ltd., FRN, 3.948%, 2012 (z) | | | 162,500 | | | 138,327 |
| Resona Bank Ltd., 5.85% to 2016, FRN to 2049 (n) | | | 100,000 | | | 56,688 |
| Swedbank AB, 9% to 2010, FRN to 2049 (n) | | | 190,000 | | | 125,412 |
| UBS Preferred Funding Trust V, 6.243% to 2016, FRN to 2049 | | | 270,000 | | | 147,453 |
| UFJ Finance Aruba AEC, 6.75%, 2013 | | | 159,000 | | | 155,406 |
| | | | | | |
| | | | | $ | 720,786 |
| | | | | | |
| Pharmaceuticals – 0.2% | | | | | | |
| Teva Pharmaceutical Finance LLC, 5.55%, 2016 | | $ | 87,000 | | $ | 85,749 |
| | | | | | |
| Pollution Control – 0.2% | | | | | | |
| Allied Waste North America, Inc., 7.125%, 2016 | | $ | 85,000 | | $ | 77,350 |
| | | | | | |
| Printing & Publishing – 0.4% | | | | | | |
| American Media Operations, Inc., 10.25%, 2009 (d)(z) | | $ | 3,818 | | $ | 768 |
| American Media Operations, Inc., “B”, 10.25%, 2009 (d) | | | 105,000 | | | 21,132 |
| Dex Media West LLC, 9.875%, 2013 | | | 183,000 | | | 43,463 |
| Idearc, Inc., 8%, 2016 | | | 59,000 | | | 4,425 |
| Nielsen Finance LLC, 10%, 2014 | | | 80,000 | | | 64,000 |
11
Portfolio of Investments – continued
| | | | | | |
| Issuer | | Shares/Par | | Value ($) |
| | | | | | |
| BONDS – continued | | | | | | |
| Printing & Publishing – continued | | | | | | |
| Nielsen Finance LLC, 0% to 2011, 12.5% to 2016 | | $ | 134,000 | | $ | 48,575 |
| Quebecor World, Inc., 6.125%, 2013 (d) | | | 55,000 | | | 1,513 |
| Tribune Co., 5.25%, 2015 (d) | | | 60,000 | | | 2,700 |
| | | | | | |
| | | | | $ | 186,576 |
| | | | | | |
| Railroad & Shipping – 0.1% | | | | | | |
| Panama Canal Railway Co., 7%, 2026 (n) | | $ | 100,000 | | $ | 55,000 |
| | | | | | |
| Real Estate – 0.9% | | | | | | |
| ERP Operating LP, REIT, 5.75%, 2017 | | $ | 150,000 | | $ | 103,538 |
| Simon Property Group, Inc., REIT, 6.1%, 2016 | | | 430,000 | | | 274,778 |
| | | | | | |
| | | | | $ | 378,316 |
| | | | | | |
| Retailers – 0.9% | | | | | | |
| Couche-Tard, Inc., 7.5%, 2013 | | $ | 135,000 | | $ | 106,650 |
| Limited Brands, Inc., 5.25%, 2014 | | | 165,000 | | | 95,184 |
| Macy’s Retail Holdings, Inc., 7.875%, 2015 | | | 200,000 | | | 144,053 |
| Sally Beauty Holdings, Inc., 10.5%, 2016 | | | 40,000 | | | 27,200 |
| | | | | | |
| | | | | $ | 373,087 |
| | | | | | |
| Specialty Stores – 0.2% | | | | | | |
| Payless ShoeSource, Inc., 8.25%, 2013 | | $ | 85,000 | | $ | 63,750 |
| | | | | | |
| Steel – 0.1% | | | | | | |
| Steel Capital S.A., 9.75%, 2013 (n) | | $ | 100,000 | | $ | 53,000 |
| | | | | | |
| Supermarkets – 0.3% | | | | | | |
| Safeway, Inc., 4.95%, 2010 | | $ | 112,000 | | $ | 110,795 |
| | | | | | |
| Supranational – 0.7% | | | | | | |
| Central American Bank, 4.875%, 2012 (n) | | $ | 305,000 | | $ | 315,368 |
| | | | | | |
| Telecommunications – Wireless – 2.0% | | | | | | |
| Alltel Corp., 7%, 2012 | | $ | 123,000 | | $ | 122,385 |
| MetroPCS Wireless, Inc., 9.25%, 2014 | | | 90,000 | | | 80,550 |
| Rogers Cable, Inc., 5.5%, 2014 | | | 164,000 | | | 151,299 |
| Sprint Nextel Corp., 4.168%, 2010 | | | 30,000 | | | 25,131 |
| Sprint Nextel Corp., 8.375%, 2012 | | | 135,000 | | | 108,000 |
| Vodafone Group PLC, 5.375%, 2015 | | | 270,000 | | | 254,312 |
Wind Acquisition Finance S.A.,
10.75%, 2015 (z) | | | 106,000 | | | 91,160 |
| | | | | | |
| | | | | $ | 832,837 |
| | | | | | |
| Tobacco – 0.5% | | | | | | |
| Reynolds American, Inc., 6.75%, 2017 | | $ | 240,000 | | $ | 190,509 |
| | | | | | |
| Transportation – 0.2% | | | | | | |
| IIRSA Norte Finance Ltd., 8.75%, 2024 | | $ | 137,780 | | $ | 99,202 |
| | | | | | |
| Transportation – Services – 0.2% | | | | | | |
| Hertz Corp., 8.875%, 2014 | | $ | 115,000 | | $ | 70,725 |
| | | | | | |
| U.S. Government Agencies – 3.6% | | | | | | |
| Small Business Administration, 4.34%, 2024 | | $ | 276,233 | | $ | 272,813 |
| Small Business Administration, 4.77%, 2024 | | | 212,414 | | | 214,111 |
| Small Business Administration, 5.18%, 2024 | | | 395,272 | | | 405,980 |
| Small Business Administration, 4.625%, 2025 | | | 162,318 | | | 162,373 |
| Small Business Administration, 4.86%, 2025 | | | 292,544 | | | 296,154 |
| Small Business Administration, 5.11%, 2025 | | | 153,994 | | | 157,417 |
| | | | | | |
| | | | | $ | 1,508,848 |
| | | | | | |
| | | | | | |
| Issuer | | Shares/Par | | Value ($) |
| | | | | | |
| BONDS – continued | | | | | | |
| U.S. Treasury Obligations – 0.0% | | | | | | |
| U.S. Treasury Bonds, 4.5%, 2036 | | $ | 12,000 | | $ | 15,943 |
| | | | | | |
| Utilities – Electric Power – 3.7% | | | | | | |
| Beaver Valley Funding Corp., 9%, 2017 | | $ | 385,000 | | $ | 360,934 |
| Dynegy Holdings, Inc., 7.5%, 2015 | | | 80,000 | | | 56,000 |
| Edison Mission Energy, 7%, 2017 | | | 95,000 | | | 82,650 |
| FirstEnergy Corp., 6.45%, 2011 | | | 207,000 | | | 195,668 |
| HQI Transelec Chile S.A., 7.875%, 2011 | | | 200,000 | | | 198,417 |
| Mirant North America LLC, 7.375%, 2013 | | | 145,000 | | | 139,200 |
| NRG Energy, Inc., 7.375%, 2016 | | | 325,000 | | | 302,250 |
| Texas Competitive Electric Holdings LLC, 10.25% to 2010, 10.5% to 2015 (n) | | | 325,000 | | | 230,750 |
| | | | | | |
| | | | | $ | 1,565,869 |
| | | | | | |
Total Bonds
(Identified Cost, $49,496,542) | | | | | $ | 40,138,740 |
| | | | | | |
| |
| PREFERRED STOCKS – 0.1% | | | |
| Automotive – 0.1% | | | | | | |
Preferred Blocker, Inc., 9%
(Identified Cost, $29,260) (z) | | | 38 | | $ | 29,260 |
| | | | | | |
| FLOATING RATE LOANS (g)(r) – 2.4% | | | |
| Aerospace – 0.2% | | | | | | |
| Hawker Beechcraft Acquisition Co. LLC, Letter of Credit, 3.45%, 2014 | | $ | 6,814 | | $ | 3,509 |
| Hawker Beechcraft Acquisition Co. LLC, Term Loan, 2.78%, 2014 | | | 155,542 | | | 80,104 |
| | | | | | |
| | | | | $ | 83,613 |
| | | | | | |
| Automotive – 0.6% | | | | | | |
| Accuride Corp., Term Loan B, 5.56%, 2012 | | $ | 10,170 | | $ | 6,890 |
| Allison Transmission, Inc., Term Loan B, 4.58%, 2014 | | | 85,962 | | | 47,525 |
| Federal-Mogul Corp., Term Loan B, 3.49%, 2014 | | | 84,040 | | | 37,818 |
| Ford Motor Co., Term Loan B, 5%, 2013 | | | 48,549 | | | 19,480 |
| General Motors, Term Loan B, 5.79%, 2013 (o) | | | 117,454 | | | 52,854 |
| Goodyear Tire & Rubber Co., Second Lien Term Loan, 2.22%, 2014 | | | 151,928 | | | 95,335 |
| | | | | | |
| | | | | $ | 259,902 |
| | | | | | |
| Broadcasting – 0.1% | | | | | | |
| Gray Television, Inc., Term Loan, 2014 (o) | | $ | 38,458 | | $ | 14,518 |
| Young Broadcasting, Inc., Term Loan, 5.24%, 2012 | | | 61,672 | | | 20,969 |
| Young Broadcasting, Inc., Term Loan B-1, 5.25%, 2012 | | | 32,339 | | | 10,995 |
| | | | | | |
| | | | | $ | 46,482 |
| | | | | | |
| Building – 0.0% | | | | | | |
Building Materials Holding Corp.,
Term Loan, 2014 (o) | | $ | 11,349 | | $ | 6,752 |
| | | | | | |
| Business Services – 0.2% | | | | | | |
| First Data Corp., Term Loan B-1, 3.21%, 2014 | | $ | 107,270 | | $ | 68,614 |
| | | | | | |
12
Portfolio of Investments – continued
| | | | | | |
| Issuer | | Shares/Par | | Value ($) |
| | | | | | |
| FLOATING RATE LOANS (g)(r) – continued |
| Cable TV – 0.2% | | | | | | |
| Charter Communications Operating LLC, Term Loan, 5.06%, 2014 | | $ | 33,585 | | $ | 24,517 |
| CSC Holdings, Inc., Incremental Term Loan, 2.94%, 2013 | | | 93,350 | | | 79,309 |
| | | | | | |
| | | | | $ | 103,826 |
| | | | | | |
| Electronics – 0.0% | | | | | | |
| Freescale Semiconductor, Inc., Term Loan B, 3.93%, 2013 | | $ | 34,047 | | $ | 19,501 |
| | | | | | |
| Forest & Paper Products – 0.1% | | | | | | |
| Abitibi-Consolidated, Inc., Term Loan, 11.5%, 2009 | | $ | 32,931 | | $ | 23,957 |
| | | | | | |
| Gaming & Lodging – 0.0% | | | | | | |
| Green Valley Ranch Gaming LLC, Second Lien Term Loan, 5.07%, 2014 | | $ | 74,178 | | $ | 8,530 |
| | | | | | |
| Medical & Health Technology & Services – 0.1% | | | |
| Community Health Systems, Inc., Delayed Draw Term Loan, 1.8%, 2014 (q) | | $ | 1,087 | | $ | 842 |
| Community Health Systems, Inc., Term Loan B, 4.44%, 2014 | | | 21,245 | | | 16,470 |
| HCA, Inc., Term Loan B, 3.7%, 2013 | | | 44,803 | | | 35,030 |
| | | | | | |
| | | | | $ | 52,342 |
| | | | | | |
| Printing & Publishing – 0.2% | | | | | | |
| Nielsen Finance LLC, Term Loan B, 4.24%, 2013 (o) | | $ | 57,983 | | $ | 39,030 |
Tribune Co., Incremental Term Loan,
6.5%, 2014 (d) | | | 128,174 | | | 23,285 |
| | | | | | |
| | | | | $ | 62,315 |
| | | | | | |
| | | | | | |
| Issuer | | Shares/Par | | Value ($) |
| | | | | | |
| FLOATING RATE LOANS (g)(r) – continued |
| Specialty Chemicals – 0.1% | | | | | | |
| Lyondell Chemical Co., Term Loan B2, 2015 (o) | | $ | 47,952 | | $ | 21,578 |
| | | | | | |
| Specialty Stores – 0.0% | | | | | | |
| Michaels Stores, Inc., Term Loan B, 3.52%, 2013 | | $ | 23,826 | | $ | 12,252 |
| | | | | | |
| Utilities – Electric Power – 0.6% | | | | | | |
| Calpine Corp., Term Loan, 4.33%, 2014 | | $ | 99,573 | | $ | 73,044 |
| NRG Energy, Inc., Letter of Credit, 2.95%, 2013 | | | 23,383 | | | 20,197 |
| NRG Energy, Inc., Term Loan, 1.96%, 2013 | | | 47,583 | | | 41,100 |
| Texas Competitive Electric Holdings Co. LLC, Term Loan B-3, 5.36%, 2014 | | | 162,835 | | | 112,560 |
| | | | | | |
| | | | | $ | 246,901 |
| | | | | | |
Total Floating Rate Loans
(Identified Cost, $1,563,851) | | | | | $ | 1,016,565 |
| | | | | | |
| |
| REPURCHASE AGREEMENTS – 0.1% | | | |
| Goldman Sachs, 0.01%, dated 12/31/08, due 1/02/09, total to be received $57,000.03 (secured by U.S. Treasury and Federal Agency obligations and Mortgage Backed securities in a jointly traded account), at Cost | | $ | 57,000 | | $ | 57,000 |
| | | | | | |
Total Investments
(Identified Cost, $51,146,653) | | | | | $ | 41,241,565 |
| | | | | | |
OTHER ASSETS, LESS
LIABILITIES – 2.6% | | | | | | 1,109,644 |
| | | | | | |
| Net Assets – 100.0% | | | | | $ | 42,351,209 |
| | | | | | |
13
Portfolio of Investments – continued
| (d) | | Non-income producing security – in default. |
| (f) | | All or a portion of the security has been segregated as collateral for open futures contracts. |
| (g) | | The rate shown represents a weighted average coupon rate on settled positions at period end, unless otherwise indicated. |
| (i) | | Interest only security for which the fund receives interest on notional principal (Par amount). Par amount shown is the notional principal and does not reflect the cost of the security. |
| (n) | | Securities exempt from registration under Rule 144A of the Securities Act of 1933. These securities may be sold in the ordinary course of business in transactions exempt from registration, normally to qualified institutional buyers. At period end, the aggregate value of these securities was $4,403,627, representing 10.40% of net assets. |
| (o) | | All or a portion of this position has not settled. Upon settlement date, interest rates for unsettled amounts will be determined. The rate shown represents the weighted average coupon rate for settled amounts. |
| (p) | | Payment-in-kind security. |
| (q) | | All or a portion of this position represents an unfunded loan commitment. The rate shown represents a weighted average coupon rate on the full position, including the unfunded loan commitment which has no current coupon rate. |
| (r) | | Remaining maturities of floating rate loans may be less than stated maturities shown as a result of contractual or optional prepayments by the borrower. Such prepayments cannot be predicted with certainty. These loans may be subject to restrictions on resale. Floating rate loans generally have rates of interest which are determined periodically by reference to a base lending rate plus a premium. |
| (z) | | Restricted securities are not registered under the Securities Act of 1933 and are subject to legal restrictions on resale. These securities generally may be resold in transactions exempt from registration or to the public if the securities are subsequently registered. Disposal of these securities may involve time-consuming negotiations and prompt sale at an acceptable price may be difficult. The fund holds the following restricted securities: |
| | | | | | |
| Restricted Securities | | Acquisition
Date | | Cost | | Current
Market Value |
| American Media Operations, Inc., 10.25%, 2009 | | 12/01/06-11/28/07 | | $3,787 | | $768 |
| Anthracite Ltd., CDO, 6%, 2037 | | 5/14/02 | | 170,335 | | 40,000 |
| Bayview Financial Revolving Mortgage Loan Trust, FRN, 1.271%, 2040 | | 3/01/06 | | 250,000 | | 155,000 |
| Bosphorus Financial Services Ltd., FRN, 3.948%, 2012 | | 3/08/05 | | 162,500 | | 138,327 |
| Brazilian Merchant Voucher Receivables Ltd., 5.911%, 2011 | | 3/08/07 | | 180,204 | | 170,342 |
| Chase Commercial Mortgage Securities Corp., 6.6%, 2029 | | 6/07/00 | | 124,582 | | 123,880 |
| DLJ Commercial Mortgage Corp., 6.04%, 2031 | | 7/23/04 | | 260,953 | | 227,905 |
| Falcon Franchise Loan LLC, 6.5%, 2014 | | 7/15/05 | | 231,126 | | 132,500 |
| Falcon Franchise Loan LLC, FRN, 3.727%, 2025 | | 1/29/03 | | 76,973 | | 47,736 |
| Firekeepers Development Authority, 13.875%, 2015 | | 4/22/08 | | 63,115 | | 40,300 |
| GMAC Commercial Mortgage Securities, Inc., 6.875%, 2011 | | 12/26/08 | | 110,600 | | 110,600 |
| GMAC Commercial Mortgage Securities, Inc., 8%, 2031 | | 12/26/08 | | 24,370 | | 24,370 |
| GMAC Commercial Mortgage Securities, Inc., FRN, 6.02%, 2033 | | 11/17/00 | | 328,222 | | 262,300 |
| Harrah’s Operating Co., Inc., 10%, 2018 | | 1/30/08-10/03/08 | | 50,492 | | 16,060 |
| LBI Media, Inc., 8.5%, 2017 | | 7/18/07 | | 73,763 | | 26,250 |
| Local TV Finance LLC, 9.25%, 2015 | | 11/09/07-12/11/07 | | 115,683 | | 26,400 |
| Preferred Blocker, Inc., 9% (Preferred Stock) | | 12/26/08 | | 29,260 | | 29,260 |
| Prudential Securities Secured Financing Corp., FRN, 7.245%, 2013 | | 12/06/04 | | 456,290 | | 163,876 |
| Salomon Brothers Mortgage Securities, Inc., FRN, 7.058%, 2032 | | 1/07/05 | | 609,048 | | 512,634 |
| Stora Enso Oyj, 6.404%, 2016 | | 4/10/06 | | 159,381 | | 105,638 |
| USI Holdings Corp., 9.75%, 2015 | | 4/26/07-6/08/07 | | 75,863 | | 29,906 |
| Wind Acquisition Finance S.A., 10.75%, 2015 | | 3/19/08 | | 106,265 | | 91,160 |
| Total Restricted Securities | | | | | | $2,475,212 |
| % of Net Assets | | | | | | 5.8% |
14
Portfolio of Investments – continued
The following abbreviations are used in this report and are defined:
| CDO | | Collateralized Debt Obligation |
| FRN | | Floating Rate Note. Interest rate resets periodically and may not be the rate reported at period end. |
| REIT | | Real Estate Investment Trust |
Abbreviations indicate amounts shown in currencies other than the U.S. dollar. All amounts are stated in U.S. dollars unless otherwise indicated. A list of abbreviations is shown below:
Derivative Contracts at 12/31/08
Forward Foreign Currency Exchange Contracts at 12/31/08
| | | | | | | | | | | | | | | | | | |
| | | Type | | Currency | | Contracts to
Deliver/Receive | | Settlement Date
Range | | In Exchange For | | Contracts
at Value | | Net Unrealized
Appreciation
(Depreciation) | |
| Appreciation | | | | | | | | | | | | | | | | | | |
| | SELL | | CAD | | 409,690 | | 2/19/09 | | $ | 341,679 | | $ | 331,785 | | $ | 9,894 | |
| | SELL | | EUR | | 2,529,041 | | 2/19/09 | | | 3,620,496 | | | 3,509,156 | | | 111,340 | |
| | SELL | | GBP | | 614,337 | | 2/17/09 | | | 913,439 | | | 882,274 | | | 31,165 | |
| | BUY | | JPY | | 59,130,550 | | 2/18/09 | | | 651,749 | | | 652,884 | | | 1,135 | |
| | SELL | | SEK | | 756,776 | | 1/30/09 | | | 96,485 | | | 95,652 | | | 833 | |
| | | | | | | | | | | | | | | | | | |
| | | | | | | | | | | | | | | | $ | 154,367 | |
| | | | | | | | | | | | | | | | | | |
| Depreciation | | | | | | | | | | | | | | | | | | |
| | SELL | | AUD | | 103,893 | | 1/07/09 | | $ | 70,289 | | $ | 72,418 | | $ | (2,129 | ) |
| | SELL | | DKK | | 434,064 | | 1/07/09 | | | 74,101 | | | 81,049 | | | (6,948 | ) |
| | BUY | | EUR | | 832,927 | | 2/19/09 | | | 1,169,633 | | | 1,155,723 | | | (13,910 | ) |
| | SELL | | JPY | | 141,875,162 | | 2/17/09 | | | 1,560,903 | | | 1,566,466 | | | (5,563 | ) |
| | BUY | | MXN | | 764,636 | | 1/16/09 | | | 55,726 | | | 55,000 | | | (726 | ) |
| | | | | | | | | | | | | | | | | | |
| | | | | | | | | | | | | | | | $ | (29,276 | ) |
| | | | | | | | | | | | | | | | | | |
Futures contracts outstanding at 12/31/08
| | | | | | | | | |
| Description | | Contracts | | Value | | Expiration
Date | | Unrealized
Appreciation
(Depreciation) | |
| German Euro-Bobl (Long) | | 2 | | $323,075 | | Mar-09 | | $5,084 | |
| German Euro-Bund (Long) | | 5 | | 867,669 | | Mar-09 | | (3,586 | ) |
| German Euro-Schatz (Long) | | 13 | | 1,942,052 | | Mar-09 | | 13,727 | |
| | | | | | | | | |
| | | | | | | | $15,225 | |
| | | | | | | | | |
15
Portfolio of Investments – continued
Swap Agreements at 12/31/08
| | | | | | | | | | | | | | |
| Expiration | | Notional
Amount | | | Counterparty | | Cash Flows to
Receive | | Cash Flows
to Pay | | Value | |
| Credit Default Swaps | | | | | | | |
| 6/20/09 | | USD | | 100,000 | | | JPMorgan Chase Bank | | 4.1% (fixed rate) | | (1) | | $(66,202 | ) |
| 9/20/10 | | USD | | 270,000 | | | Merrill Lynch International | | (2) | | 0.68% (fixed rate) | | 26,510 | |
| 3/20/13 | | USD | | 430,000 | | | Goldman Sachs International | | (3) | | 2.13% (fixed rate) | | 68,690 | |
| 6/20/13 | | USD | | 1,400,000 | (a) | | Morgan Stanley Capital Services, Inc. | | (4) | | 5.00% (fixed rate) | | 215,352 | |
| 9/20/13 | | USD | | 140,000 | | | Merrill Lynch International | | (5) | | 0.77% (fixed rate) | | 4,128 | |
| 12/20/13 | | USD | | 130,000 | | | JPMorgan Chase Bank | | (6) | | 0.78% (fixed rate) | | 7,679 | |
| 12/20/13 | | USD | | 160,000 | | | Merrill Lynch International | | (7) | | 2.00% (fixed rate) | | (5,689 | ) |
| | | | | | | | | | | | | | |
| | | | | | | | | | | | | $250,468 | |
| | | | | | | | | | | | | | |
| (1) | | Fund, as protection seller, to pay notional amount upon a defined credit event by Abitibi Consolidated, 8.375%, 4/01/15, a Caa2 rated bond. The fund entered into the contract to gain issuer exposure. |
| (2) | | Fund, as protection buyer, to receive notional amount upon a defined credit event by Lennar Corp., 5.95%, 3/01/13. |
| (3) | | Fund, as protection buyer, to receive notional amount upon a defined credit event by Simon Property Group Corp., 6.35%, 8/28/12. |
| (4) | | Fund, as protection buyer, to receive notional amount upon a defined credit event by a reference obligation specified in the CDX.NA.HY.10 Index. |
| (5) | | Fund, as protection buyer, to receive notional amount upon a defined credit event by AutoZone, Inc., 5.875%, 10/15/12. |
| (6) | | Fund, as protection buyer, to receive notional amount upon a defined credit event by Arrow Electronics Inc., 6.875%, 6/01/18. |
| (7) | | Fund, as protection buyer, to receive notional amount upon a defined credit event by Aetna Inc., 6.625%, 6/15/36. |
| (a) | | Net unamortized premiums paid by the fund amounted to $83,668. |
The credit ratings presented here are an indicator of the current payment/performance risk of the related swap, the reference obligation for which may be either a single security or, in case of a credit default index, a basket of securities issued by corporate or sovereign issuers. Each reference security, including each individual security within a reference basket of securities, is assigned a rating from Moody’s Investor Service. If not rated by Moody’s, the rating will be that assigned by Standard & Poor’s. Likewise, if not assigned by Standard & Poor’s, it will be based on the rating assigned by Fitch, Inc. The ratings for a credit default index are calculated by MFS as a weighted average of the external credit ratings of the individual securities that compose the index’s reference basket of securities.
At December 31, 2008, the fund had sufficient cash and/or other liquid securities to cover any commitments under these derivative contracts.
See Notes to Financial Statements
16
FINANCIAL STATEMENTS | STATEMENT OF ASSETS AND LIABILITIES
This statement represents your fund’s balance sheet, which details the assets and liabilities comprising the total value of the fund.
| | | | | |
At 12/31/08 | | | | | |
Assets | | | | | |
| Investments, at value (identified cost, $51,146,653) | | $41,241,565 | | | |
| Cash | | 67,082 | | | |
| Receivable for forward foreign currency exchange contracts | | 154,367 | | | |
| Receivable for investments sold | | 5,066 | | | |
| Interest receivable | | 841,034 | | | |
| Receivable from investment adviser | | 7,934 | | | |
| Swaps, at value (net unamortized premiums paid, $83,668) | | 322,359 | | | |
Other assets | | 2,948 | | | |
Total assets | | | | | $42,642,355 |
Liabilities | | | | | |
| Payable for forward foreign currency exchange contracts | | $29,276 | | | |
| Payable for daily variation margin on open futures contracts | | 181 | | | |
| Payable for investments purchased | | 89,024 | | | |
| Payable for fund shares reacquired | | 28,024 | | | |
| Swaps, at value | | 71,891 | | | |
| Payable to affiliates | | | | | |
Management fee | | 1,612 | | | |
Distribution fees | | 152 | | | |
Administrative services fee | | 78 | | | |
Payable for trustees’ compensation | | 24 | | | |
Accrued expenses and other liabilities | | 70,884 | | | |
Total liabilities | | | | | $291,146 |
Net assets | | | | | $42,351,209 |
Net assets consist of | | | | | |
| Paid-in capital | | $51,228,369 | | | |
| Unrealized appreciation (depreciation) on investments and translation of assets and liabilities in foreign currencies | | (9,605,864 | ) | | |
Accumulated net realized gain (loss) on investments and foreign currency transactions | | (3,203,643 | ) | | |
Undistributed net investment income | | 3,932,347 | | | |
Net assets | | | | | $42,351,209 |
Shares of beneficial interest outstanding | | | | | 5,076,805 |
| Initial Class shares | | | | | |
Net assets | | $31,159,071 | | | |
Shares outstanding | | 3,728,649 | | | |
Net asset value per share | | | | | $8.36 |
| Service Class shares | | | | | |
Net assets | | $11,192,138 | | | |
Shares outstanding | | 1,348,156 | | | |
Net asset value per share | | | | | $8.30 |
See Notes to Financial Statements
17
FINANCIAL STATEMENTS | STATEMENT OF OPERATIONS
This statement describes how much your fund earned in investment income and accrued in expenses. It also describes any gains and/or losses generated by fund operations.
| | | | | | |
| Year ended 12/31/08 | | | | | | |
| Net investment income | | | | | | |
Interest income | | | | | $3,956,283 | |
Expenses | | | | | | |
Management fee | | $425,576 | | | | |
Distribution fees | | 39,144 | | | | |
Administrative services fee | | 16,357 | | | | |
Trustees’ compensation | | 7,251 | | | | |
Custodian fee | | 45,167 | | | | |
Shareholder communications | | 17,786 | | | | |
Auditing fees | | 45,345 | | | | |
Legal fees | | 7,207 | | | | |
Miscellaneous | | 11,277 | | | | |
Total expenses | | | | | $615,110 | |
Fees paid indirectly | | (807 | ) | | | |
Reduction of expenses by investment adviser | | (64,651 | ) | | | |
Net expenses | | | | | $549,652 | |
Net investment income | | | | | $3,406,631 | |
Realized and unrealized gain (loss) on investments and foreign currency transactions | | | | | | |
Realized gain (loss) (identified cost basis) | | | | | | |
Investment transactions | | $(1,448,744 | ) | | | |
Futures contracts | | (1,165 | ) | | | |
Swap transactions | | (142,881 | ) | | | |
Foreign currency transactions | | 409,117 | | | | |
Net realized gain (loss) on investments and foreign currency transactions | | | | | $(1,183,673 | ) |
Change in unrealized appreciation (depreciation) | | | | | | |
Investments | | $(9,670,749 | ) | | | |
Futures contracts | | 9,671 | | | | |
Swap transactions | | 135,961 | | | | |
Translation of assets and liabilities in foreign currencies | | 73,502 | | | | |
Net unrealized gain (loss) on investments and foreign currency translation | | | | | $(9,451,615 | ) |
Net realized and unrealized gain (loss) on investments and foreign currency | | | | | $(10,635,288 | ) |
Change in net assets from operations | | | | | $(7,228,657 | ) |
See Notes to Financial Statements
18
FINANCIAL STATEMENTS | STATEMENTS OF CHANGES IN NET ASSETS
These statements describe the increases and/or decreases in net assets resulting from operations, any distributions, and any shareholder transactions.
| | | | | | |
For years ended 12/31 | | 2008 | | | 2007 | |
Change in net assets | | | | | | |
From operations | | | | | | |
Net investment income | | $3,406,631 | | | $4,156,803 | |
Net realized gain (loss) on investments and foreign currency transactions | | (1,183,673 | ) | | (6,500 | ) |
Net unrealized gain (loss) on investments and foreign currency translation | | (9,451,615 | ) | | (1,731,526 | ) |
Change in net assets from operations | | $(7,228,657 | ) | | $2,418,777 | |
Distributions declared to shareholders | | | | | | |
From net investment income | | | | | | |
Initial Class | | $(3,387,697 | ) | | $(2,912,294 | ) |
Service Class | | (1,262,671 | ) | | (1,051,166 | ) |
Total distributions declared to shareholders | | $(4,650,368 | ) | | $(3,963,460 | ) |
Change in net assets from fund share transactions | | $(14,583,449 | ) | | $(6,013,847 | ) |
Total change in net assets | | $(26,462,474 | ) | | $(7,558,530 | ) |
Net assets | | | | | | |
At beginning of period | | 68,813,683 | | | 76,372,213 | |
At end of period (including undistributed net investment income of $3,932,347 and
$4,144,912, respectively) | | $42,351,209 | | | $68,813,683 | |
See Notes to Financial Statements
19
FINANCIAL STATEMENTS | FINANCIAL HIGHLIGHTS
The financial highlights table is intended to help you understand the fund’s financial performance for the past 5 years. Certain information reflects financial results for a single fund share. The total returns in the table represent the rate by which an investor would have earned (or lost) on an investment in the fund share class (assuming reinvestment of all distributions) held for the entire period.
| | | | | | | | | | | | | | | |
| Initial Class | | Years ended 12/31 | |
| | | 2008 | | | 2007 | | | 2006 | | | 2005 | | | 2004 | |
Net asset value, beginning of period | | $10.40 | | | $10.61 | | | $10.71 | | | $11.42 | | | $11.12 | |
| Income (loss) from investment operations | | | | | | | | | | | | | | | |
Net investment income (d) | | $0.58 | | | $0.60 | | | $0.57 | | | $0.58 | | | $0.61 | |
Net realized and unrealized gain (loss) on investments
and foreign currency | | (1.82 | ) | | (0.23 | ) | | 0.11 | | | (0.39 | ) | | 0.23 | |
Total from investment operations | | $(1.24 | ) | | $0.37 | | | $0.68 | | | $0.19 | | | $0.84 | |
| Less distributions declared to shareholders | | | | | | | | | | | | | | | |
From net investment income | | $(0.80 | ) | | $(0.58 | ) | | $(0.66 | ) | | $(0.80 | ) | | $(0.54 | ) |
From net realized gain on investments | | — | | | — | | | (0.12 | ) | | (0.10 | ) | | — | |
Total distributions declared to shareholders | | $(0.80 | ) | | $(0.58 | ) | | $(0.78 | ) | | $(0.90 | ) | | $(0.54 | ) |
Net asset value, end of period | | $8.36 | | | $10.40 | | | $10.61 | | | $10.71 | | | $11.42 | |
Total return (%) (k)(r)(s) | | (12.94 | ) | | 3.49 | | | 6.71 | | | 1.89 | | | 8.04 | |
Ratios (%) (to average net assets)
and Supplemental data: | | | | | | | | | | | | | | | |
Expenses before expense reductions (f) | | 1.02 | | | 0.95 | | | 0.97 | | | 0.97 | | | 0.91 | |
Expenses after expense reductions (f) | | 0.90 | | | 0.90 | | | 0.95 | | | N/A | | | N/A | |
Net investment income | | 6.07 | | | 5.70 | | | 5.44 | | | 5.33 | | | 5.55 | |
Portfolio turnover | | 38 | | | 49 | | | 64 | | | 66 | | | 74 | |
Net assets at end of period (000 Omitted) | | $31,159 | | | $49,582 | | | $54,423 | | | $59,707 | | | $66,248 | |
| |
| Service Class | | Years ended 12/31 | |
| | | 2008 | | | 2007 | | | 2006 | | | 2005 | | | 2004 | |
Net asset value, beginning of period | | $10.33 | | | $10.54 | | | $10.64 | | | $11.35 | | | $11.06 | |
| Income (loss) from investment operations | | | | | | | | | | | | | | | |
Net investment income (d) | | $0.55 | | | $0.57 | | | $0.54 | | | $0.55 | | | $0.59 | |
Net realized and unrealized gain (loss) on investments
and foreign currency | | (1.80 | ) | | (0.23 | ) | | 0.11 | | | (0.39 | ) | | 0.22 | |
Total from investment operations | | $(1.25 | ) | | $0.34 | | | $0.65 | | | $0.16 | | | $0.81 | |
| Less distributions declared to shareholders | | | | | | | | | | | | | | | |
From net investment income | | $(0.78 | ) | | $(0.55 | ) | | $(0.63 | ) | | $(0.77 | ) | | $(0.52 | ) |
From net realized gain on investments | | — | | | — | | | (0.12 | ) | | (0.10 | ) | | — | |
Total distributions declared to shareholders | | $(0.78 | ) | | $(0.55 | ) | | $(0.75 | ) | | $(0.87 | ) | | $(0.52 | ) |
Net asset value, end of period | | $8.30 | | | $10.33 | | | $10.54 | | | $10.64 | | | $11.35 | |
Total return (%) (k)(r)(s) | | (13.21 | ) | | 3.24 | | | 6.45 | | | 1.61 | | | 7.83 | |
Ratios (%) (to average net assets)
and Supplemental data: | | | | | | | | | | | | | | | |
Expenses before expense reductions (f) | | 1.26 | | | 1.20 | | | 1.22 | | | 1.22 | | | 1.16 | |
Expenses after expense reductions (f) | | 1.15 | | | 1.15 | | | 1.19 | | | N/A | | | N/A | |
Net investment income | | 5.82 | | | 5.45 | | | 5.19 | | | 5.08 | | | 5.31 | |
Portfolio turnover | | 38 | | | 49 | | | 64 | | | 66 | | | 74 | |
Net assets at end of period (000 Omitted) | | $11,192 | | | $19,232 | | | $21,949 | | | $22,643 | | | $24,184 | |
| (d) | Per share data is based on average shares outstanding. |
| (f) | Ratios do not reflect reductions from fees paid indirectly, if applicable. |
| (k) | The total return does not reflect expenses that apply to separate accounts. Inclusion of these charges would reduce the total return figures for all periods shown. |
| (r) | Certain expenses have been reduced without which performance would have been lower. |
| (s) | From time to time the fund may receive proceeds from litigation settlements, without which performance would be lower. |
See Notes to Financial Statements
20
NOTES TO FINANCIAL STATEMENTS
| (1) | | Business and Organization |
MFS Strategic Income Portfolio (the fund) is a series of MFS Variable Insurance Trust II (the trust). The trust is organized as a Massachusetts business trust and is registered under the Investment Company Act of 1940, as amended, as an open-end management investment company. The shares of the fund are sold to variable accounts established by insurance companies to fund benefits under variable contracts issued by such companies, and qualified retirement and pension plans.
| (2) | | Significant Accounting Policies |
General – The preparation of financial statements in conformity with U.S. generally accepted accounting principles requires management to make estimates and assumptions that affect the reported amounts of assets and liabilities, and disclosure of contingent assets and liabilities at the date of the financial statements and the reported amounts of revenues and expenses during the reporting period. Actual results could differ from those estimates. The fund can invest in foreign securities, including securities of emerging market issuers. Investments in foreign securities are vulnerable to the effects of changes in the relative values of the local currency and the U.S. dollar and to the effects of changes in each country’s legal, political, and economic environment. The markets of emerging markets countries are generally more volatile than the markets of developed countries with more mature economies. All of the risks of investing in foreign securities previously described are heightened when investing in emerging markets countries.
Investment Valuations – Debt instruments and floating rate loans (other than short-term instruments), including restricted debt instruments, are generally valued at an evaluated or composite bid as reported by a third party pricing service. Short-term instruments with a maturity at issuance of 60 days or less may be valued at amortized cost, which approximates market value. Futures contracts are generally valued at last posted settlement price as reported by a third party pricing service on the market on which they are primarily traded. Futures contracts for which there were no trades that day for a particular position are generally valued at the closing bid quotation as reported by a third party pricing service on the market on which such futures contracts are primarily traded. Forward foreign currency contracts are generally valued at the mean of bid and asked prices for the time period interpolated from rates reported by a third party pricing service for proximate time periods. Swaps are generally valued at an evaluated bid as reported by a third party pricing service. Securities and other assets generally valued on the basis of information from a third party pricing service may also be valued at a broker-dealer bid quotation. Values obtained from pricing services can utilize both dealer-supplied valuations and electronic data processing techniques, which take into account factors such as institutional-size trading in similar groups of securities, yield, quality, coupon rate, maturity, type of issue, trading characteristics, and other market data. The values of foreign securities and other assets and liabilities expressed in foreign currencies are converted to U.S. dollars using the mean of bid and asked prices for rates reported by a third party pricing service.
The Board of Trustees has delegated primary responsibility for determining or causing to be determined the value of the fund’s investments (including any fair valuation) to the adviser pursuant to valuation policies and procedures approved by the Board. If the adviser determines that reliable market quotations are not readily available, investments are valued at fair value as determined in good faith by the adviser in accordance with such procedures under the oversight of the Board of Trustees. Under the fund’s valuation policies and procedures, market quotations are not considered to be readily available for most types of debt instruments and floating rate loans and many types of derivatives. These investments are generally valued at fair value based on information from third party pricing services. In addition, investments may be valued at fair value if the adviser determines that an investment’s value has been materially affected by events occurring after the close of the exchange or market on which the investment is principally traded (such as foreign exchange or market) and prior to the determination of the fund’s net asset value, or after the halting of trading of a specific security where trading does not resume prior to the close of the exchange or market on which the security is principally traded. The adviser may rely on third party pricing services or other information (such as the correlation with price movements of similar securities in the same or other markets; the type, cost and investment characteristics of the security; the business and financial condition of the issuer; and trading and other market data) to assist in determining whether to fair value and at what value to fair value an investment. The value of an investment for purposes of calculating the fund’s net asset value can differ depending on the source and method used to determine value. When fair valuation is used, the value of investments used to determine the fund’s net asset value may differ from quoted or published prices for the same investments.
The fund adopted FASB Statement No. 157, Fair Value Measurements (the “Statement”). This Statement provides a single definition of fair value, a hierarchy for measuring fair value and expanded disclosures about fair value measurements.
Various inputs are used in determining the value of the fund’s assets or liabilities carried at market value. These inputs are categorized into three broad levels. Level 1 includes quoted prices in active markets for identical assets or liabilities. Level 2 includes other significant observable market-based inputs (including quoted prices for similar securities, interest rates, prepayment speed, and credit risk). Level 3 includes unobservable inputs, which may include the adviser’s own assumptions in
21
Notes to Financial Statements – continued
determining the fair value of investments. Other financial instruments are derivative instruments not reflected in total investments, such as futures, forwards, swap contracts and written options. The following is a summary of the levels used as of December 31, 2008 in valuing the fund’s assets or liabilities carried at market value:
| | | | | | | | |
| | | Level 1 | | Level 2 | | Level 3 | | Total |
| Investments in Securities | | $ | | $41,241,565 | | $— | | $41,241,565 |
| Other Financial Instruments | | $15,225 | | $375,559 | | $— | | $390,784 |
Repurchase Agreements – The fund may enter into repurchase agreements with approved counterparties. Each repurchase agreement is recorded at cost. The fund requires that the securities collateral in a repurchase transaction be transferred to a custodian. The fund monitors, on a daily basis, the value of the collateral to ensure that its value, including accrued interest, is greater than amounts owed to the fund under each such repurchase agreement. The fund and other funds managed by Massachusetts Financial Services Company (MFS), may utilize a joint trading account for the purpose of entering into one or more repurchase agreements.
Foreign Currency Translation – Purchases and sales of foreign investments, income, and expenses are converted into U.S. dollars based upon currency exchange rates prevailing on the respective dates of such transactions or on the reporting date for foreign denominated receivables and payables. Gains and losses attributable to foreign currency exchange rates on sales of securities are recorded for financial statement purposes as net realized gains and losses on investments. Gains and losses attributable to foreign exchange rate movements on receivables, payables, income and expenses are recorded for financial statement purposes as foreign currency transaction gains and losses. That portion of both realized and unrealized gains and losses on investments that results from fluctuations in foreign currency exchange rates is not separately disclosed.
Derivative Risk – The fund may invest in derivatives for hedging or non-hedging purposes. While hedging can reduce or eliminate losses, it can also reduce or eliminate gains. When the fund uses derivatives as an investment to gain market exposure, or for hedging purposes, gains and losses from derivative instruments may be substantially greater than the derivative’s original cost. Cash that has been segregated on behalf of certain derivative contracts will be reported separately on the Statement of Assets and Liabilities as restricted cash. On some over-the-counter derivatives, the fund attempts to reduce its exposure to counterparty credit risk by entering into an ISDA Master Agreement on a bilateral basis with each of the counterparties with whom it undertakes a significant volume of transactions. The ISDA Master Agreement gives the fund the right, upon an event of default by the applicable counterparty, to close out all transactions traded under such agreement and to net amounts owed under each transaction to one net amount payable by one party to the other. This right to close out and net payments across all transactions traded under the ISDA Master Agreement could result in a reduction of the fund’s credit risk to such counterparty equal to any amounts payable by the fund under the applicable transactions, if any. However, absent an event of default by the counterparty, the ISDA Master Agreement does not result in an offset of reported balance sheet assets and liabilities across transactions between the fund and the applicable counterparty. Derivative instruments include futures contracts, forward foreign currency exchange contracts, and swap agreements.
In March 2008, FASB Statement No. 161, Disclosures about Derivative Instruments and Hedging Activities (the “Standard”) was issued, and is effective for financial statements issued for fiscal years and interim periods beginning after November 15, 2008. This Standard provides enhanced disclosures about the fund’s use of and accounting for derivative instruments and the effect of derivative instruments on the fund’s results of operations and financial position. Management is evaluating the application of the Standard to the fund, and has not at this time determined the impact, if any, resulting from the adoption of this Standard on the fund’s financial statements.
FASB Staff Position (FSP) 133-1 was implemented during the period. FSP 133-1 amends FAS 133 to require sellers of credit derivatives to make disclosures that will enable financial statement users to assess the potential effects of those credit derivatives on an entity’s financial position, financial performance and cash flows. Accordingly, appropriate disclosures have been included within the Swap Agreements table in the Portfolio of Investments and Significant Accounting Policies.
Futures Contracts – The fund may enter into futures contracts for the delayed delivery of securities or currency, or contracts based on financial indices at a fixed price on a future date. In entering such contracts, the fund is required to deposit with the broker either in cash or securities an amount equal to a certain percentage of the contract amount. Subsequent payments are made or received by the fund each day, depending on the daily fluctuations in the value of the contract, and are recorded for financial statement purposes as unrealized gains or losses by the fund. Upon entering into such contracts, the fund bears the risk of interest or exchange rates or securities prices moving unexpectedly, in which case, the fund may not achieve the anticipated benefits of the futures contracts and may realize a loss.
Forward Foreign Currency Exchange Contracts – The fund may enter into forward foreign currency exchange contracts for the purchase or sale of a specific foreign currency at a fixed price on a future date. Risks may arise upon entering into these contracts from the potential inability of counterparties to meet the terms of their contracts and from unanticipated movements
22
Notes to Financial Statements – continued
in the value of the contract. The fund may enter into forward foreign currency exchange contracts for hedging purposes as well as for non-hedging purposes. For hedging purposes, the fund may enter into contracts to deliver or receive foreign currency it will receive from or require for its normal investment activities. The fund may also use contracts in a manner intended to protect foreign currency denominated securities from declines in value due to unfavorable exchange rate movements. For non-hedging purposes, the fund may enter into contracts with the intent of changing the relative exposure of the fund’s portfolio of securities to different currencies to take advantage of anticipated changes. The forward foreign currency exchange contracts are adjusted by the daily exchange rate of the underlying currency and any gains or losses are recorded as unrealized until the contract settlement date. On contract settlement date, the gains or losses are recorded as realized gains or losses on foreign currency transactions.
Swap Agreements – The fund may enter into swap agreements. A swap is generally an exchange of cash payments, at specified intervals or upon the occurrence of specified events, between the fund and a counterparty. The net cash payments exchanged are recorded as a realized gain or loss on swap transactions in the Statement of Operations. The value of the swap, which is adjusted daily and includes any related interest accruals to be paid or received by the fund, is recorded on the Statement of Assets and Liabilities. The daily change in value, including any related interest accruals to be paid or received, is recorded as unrealized appreciation or depreciation on swap transactions in the Statement of Operations. Amounts paid or received at the inception of the swap are reflected as premiums paid or received on the Statement of Assets and Liabilities and are amortized using the effective interest method over the term of the agreement. A liquidation payment received or made upon early termination is recorded as a realized gain or loss on swap transactions in the Statement of Operations.
Risks related to swap agreements include the possible lack of a liquid market, unfavorable market and interest rate movements of the underlying instrument and the failure of the counterparty to perform under the terms of the agreements. To address counterparty risk, swap transactions are limited to only highly-rated counterparties and collateral, in the form of cash or securities, may be required to be posted by the counterparty to the fund and held in segregated accounts with the fund’s custodian. Counterparty risk is further mitigated by having ISDA Master Agreements between the fund and its counterparties providing for netting as described above.
The fund may enter into credit default swaps to manage its exposure to the market or certain sectors of the market, to reduce its credit risk exposure to defaults of corporate and sovereign issuers or to create exposure to corporate or sovereign issuers to which it is not otherwise exposed. In a credit default swap, the protection buyer makes a stream of payments based on a fixed percentage applied to the contract notional amount to the protection seller in exchange for the right to receive a specified return upon the occurrence of a defined credit event on the reference obligation (which may be either a single security or a basket of securities issued by corporate or sovereign issuers) and, with respect to swap transactions where physical settlement applies, the delivery by the buyer to the seller of a deliverable reference obligation as defined by the contract. Although contract-specific, credit events generally consist of a combination of the following: bankruptcy, failure to pay, restructuring, obligation acceleration, obligation default, or repudiation/moratorium, each as defined in the 2003 ISDA Credit Derivatives Definitions as amended by the relevant contract. Obligation acceleration, obligation default, or repudiation/moratorium are generally applicable when the reference obligation is issued by a sovereign entity or an entity in an emerging country. In the event that a defined credit event occurs, the protection buyer, under the terms of the swap contract, designates which security will be delivered to satisfy the reference obligation. Upon designation of the reference security (or upon delivery of the reference security in the case of physical settlement), the difference between the value of the reference obligation and the swap’s notional amount is recorded as realized gain or loss on swap transactions in the Statement of Operations.
Absent any recoveries under recourse or collateral provisions, the maximum amount of future, undiscounted payments that the fund, as protection seller, could be required to make is equal to the swap’s notional amount. The protection seller’s payment obligation would be offset to the extent of the value of the contract’s reference obligation.
Hybrid Instruments – The fund may invest in indexed or hybrid securities on which any combination of interest payments, the principal or stated amount payable at maturity is determined by reference to prices of other securities, currencies, indexes, economic factors or other measures, including interest rates, currency exchange rates, or securities indices. The risks of investing in hybrid instruments reflect a combination of the risks of investing in securities, swaps, options, futures and currencies. Hybrid instruments are potentially more volatile and carry greater market risks than traditional debt instruments. Depending on the structure of the particular hybrid instrument, changes in a benchmark, underlying assets or economic indicator may be magnified by the terms of the hybrid instrument and have an even more dramatic and substantial effect upon the value of the hybrid instrument. Also, the prices of the hybrid instrument and the benchmark, underlying asset or economic indicator may not move in the same direction or at the same time.
Loans and Other Direct Debt Instruments – The fund may invest in loans and loan participations or other receivables. These investments may include standby financing commitments, including revolving credit facilities, which obligate the fund to
23
Notes to Financial Statements – continued
supply additional cash to the borrower on demand. At December 31, 2008, the portfolio had unfunded loan commitments of $724, which could be extended at the option of the borrower and which are covered by sufficient cash and/or liquid securities held by the fund. The market value and obligation of the fund on these unfunded loan commitments is included in Investments, at value and Payable for investments purchased, respectively, on the Statement of Assets and Liabilities. Loan participations involve a risk of insolvency of the lending bank or other financial intermediary.
Indemnifications – Under the fund’s organizational documents, its officers and trustees may be indemnified against certain liabilities and expenses arising out of the performance of their duties to the fund. Additionally, in the normal course of business, the fund enters into agreements with service providers that may contain indemnification clauses. The fund’s maximum exposure under these agreements is unknown as this would involve future claims that may be made against the fund that have not yet occurred.
Investment Transactions and Income – Investment transactions are recorded on the trade date. Interest income is recorded on the accrual basis. All premium and discount is amortized or accreted for financial statement purposes in accordance with U.S. generally accepted accounting principles. The fund earns certain fees in connection with its floating rate loan purchasing activities. These fees are in addition to interest payments earned and may include amendment fees, commitment fees, facility fees, consent fees, and prepayment fees. Commitment fees are recorded on an accrual basis as income in the accompanying financial statements.
The fund may receive proceeds from litigation settlements. Any proceeds received from litigation involving portfolio holdings are reflected in the Statement of Operations in realized gain/loss if the security has been disposed of by the fund or in unrealized gain/loss if the security is still held by the fund. Any other proceeds from litigation not related to portfolio holdings are reflected as other income in the Statement of Operations.
Fees Paid Indirectly – The fund’s custody fee may be reduced according to an arrangement that measures the value of cash deposited with the custodian by the fund. This amount, for the year ended December 31, 2008, is shown as a reduction of total expenses on the Statement of Operations.
Tax Matters and Distributions – The fund intends to qualify as a regulated investment company, as defined under Subchapter M of the Internal Revenue Code, and to distribute all of its taxable income, including realized capital gains. As a result, no provision for federal income tax is required. Each of the fund’s federal tax returns for the prior three fiscal years remains subject to examination by the Internal Revenue Service. Foreign taxes, if any, have been accrued by the fund in the accompanying financial statements.
Distributions to shareholders are recorded on the ex-dividend date. Income and capital gain distributions are determined in accordance with income tax regulations, which may differ from U.S. generally accepted accounting principles. Certain capital accounts in the financial statements are periodically adjusted for permanent differences in order to reflect their tax character. These adjustments have no impact on net assets or net asset value per share. Temporary differences which arise from recognizing certain items of income, expense, gain or loss in different periods for financial statement and tax purposes will reverse at some time in the future. Distributions in excess of net investment income or net realized gains are temporary overdistributions for financial statement purposes resulting from differences in the recognition or classification of income or distributions for financial statement and tax purposes.
Book/tax differences primarily relate to amortization and accretion of debt securities, straddle loss deferrals, foreign currency transactions, and derivative transactions.
The tax character of distributions declared to shareholders for the last two fiscal years is as follows:
| | | | |
| | | 12/31/08 | | 12/31/07 |
| Ordinary income (including any short-term capital gains) | | $4,650,368 | | $3,963,460 |
The federal tax cost and the tax basis components of distributable earnings were as follows:
| | | |
| As of 12/31/08 | | | |
| Cost of investments | | $51,536,507 | |
| Gross appreciation | | 950,297 | |
| Gross depreciation | | (11,245,239 | ) |
| Net unrealized appreciation (depreciation) | | $(10,294,942 | ) |
| Undistributed ordinary income | | 4,831,295 | |
| Capital loss carryforwards | | (2,778,324 | ) |
| Other temporary differences | | (635,189 | ) |
24
Notes to Financial Statements – continued
As of December 31, 2008, the fund had capital loss carryforwards available to offset future realized gains. Such losses expire as follows:
| | | |
| 12/31/14 | | $(500,150 | ) |
| 12/31/15 | | (121,618 | ) |
| 12/31/16 | | (2,156,556 | ) |
| | $(2,778,324 | ) |
Multiple Classes of Shares of Beneficial Interest – The fund offers multiple classes of shares, which differ in their respective distribution fees. The fund’s income, realized and unrealized gain (loss), and common expenses are allocated to shareholders based on the daily net assets of each class. Dividends are declared separately for each class. Differences in per share dividend rates are generally due to differences in separate class expenses.
| (3) | | Transactions with Affiliates |
Investment Adviser – The fund has an investment advisory agreement with MFS to provide overall investment management and related administrative services and facilities to the fund.
The management fee is computed daily and paid monthly at the following annual rates:
| | |
| First $1 billion of average daily net assets | | 0.75% |
| Average daily net assets in excess of $1 billion | | 0.65% |
The investment adviser has agreed in writing to reduce its management fee to 0.70% for the first $1 billion of average daily net assets. This written agreement will continue until April 30, 2010. This management fee reduction amounted to $28,431, which is shown as a reduction of total expenses in the Statement of Operations. The management fee incurred for the year ended December 31, 2008 was equivalent to an annual effective rate of 0.70% of the fund’s average daily net assets.
The investment adviser has agreed in writing to pay a portion of the fund’s total annual operating expenses, exclusive of interest, taxes, extraordinary expenses, brokerage and transaction costs, and investment-related expenses, such that total annual operating expenses do not exceed 0.90% annually of average daily net assets for the Initial Class shares and 1.15% annually of average daily net assets for the Service Class shares. This written agreement will continue until April 30, 2010. For the year ended December 31, 2008, this reduction amounted to $36,220 and is reflected as a reduction of total expenses in the Statement of Operations.
Distributor – MFS Fund Distributors, Inc. (MFD), a wholly-owned subsidiary of MFS, is the distributor of shares of the fund. The Trustees have adopted a distribution plan for the Service Class shares pursuant to Rule 12b-1 under the Investment Company Act of 1940.
The fund’s distribution plan provides that the fund will pay MFD distribution fees equal to 0.25% per annum of its average daily net assets attributable to Service Class shares as partial consideration for services performed and expenses incurred by MFD and financial intermediaries in connection with the sale and distribution of the fund’s Service Class shares and the sale and distribution of the variable annuity or variable life insurance contracts investing indirectly in Service Class shares. MFD may subsequently pay all, or a portion, of the distribution fees to financial intermediaries.
Shareholder Servicing Agent – MFS Service Center, Inc. (MFSC), a wholly-owned subsidiary of MFS, has contracted to provide transfer agent and recordkeeping functions in connection with the issuance, transfer, and redemption of each class of shares of the fund under a Shareholder Servicing Agent Agreement. During the year ended December 31, 2008, the fund did not pay MFSC a fee for this service.
Administrator – MFS provides certain financial, legal, shareholder communications, compliance, and other administrative services to the fund. Under an administrative services agreement, the fund partially reimburses MFS the costs incurred to provide these services. The fund is charged an annual fixed amount of $10,000 plus a fee based on average daily net assets.
The administrative services fee incurred for the year ended December 31, 2008 was equivalent to an annual effective rate of 0.0288% of the fund’s average daily net assets.
Trustees’ and Officers’ Compensation – The fund pays compensation to trustees in the form of a retainer, attendance fees, and additional compensation to the Board chairperson. The fund does not pay compensation directly to officers of the fund who are also officers of the investment adviser, all of whom receive remuneration for their services to the fund from MFS. Certain officers of the fund are officers or directors of MFS, MFD, and MFSC.
Other – This fund and certain other MFS funds (the funds) have entered into services agreements (the Agreements) which provide for payment of fees by the funds to Tarantino LLC and Griffin Compliance LLC in return for the provision of services of an Independent Chief Compliance Officer (ICCO) and Assistant ICCO, respectively, for the funds. The ICCO and Assistant ICCO are officers of the funds and the sole members of Tarantino LLC and Griffin Compliance LLC, respectively. The funds can terminate the Agreements with Tarantino LLC and Griffin Compliance LLC at any time under the terms of the Agreements.
25
Notes to Financial Statements – continued
MFS has agreed to bear all expenses associated with office space, other administrative support, and supplies provided to the ICCO and Assistant ICCO. For the year ended December 31, 2008, the aggregate fees paid by the fund to Tarantino LLC and Griffin Compliance LLC were $538 and are included in miscellaneous expense on the Statement of Operations.
Purchases and sales of investments, other than purchased option transactions and short-term obligations, were as follows:
| | | | |
| | | Purchases | | Sales |
| U.S. Government securities | | $— | | $2,389,705 |
| Investments (non-U.S. Government securities) | | $20,819,243 | | $32,931,057 |
| (5) | | Shares of Beneficial Interest |
The fund’s Declaration of Trust permits the Trustees to issue an unlimited number of full and fractional shares of beneficial interest. Transactions in fund shares were as follows:
| | | | | | | | | | | | |
| | | Year ended 12/31/08 | | | Year ended 12/31/07 | |
| | | Shares | | | Amount | | | Shares | | | Amount | |
| Shares sold | | | | | | | | | | | | |
Initial Class | | 213,383 | | | $2,018,276 | | | 431,832 | | | $4,503,427 | |
Service Class | | 77,715 | | | 714,237 | | | 135,110 | | | 1,394,660 | |
| | 291,098 | | | $2,732,513 | | | 566,942 | | | $5,898,087 | |
| Shares issued to shareholders in reinvestment of distributions | | | | | | | | | | | | |
Initial Class | | 349,608 | | | $3,387,697 | | | 281,653 | | | $2,912,294 | |
Service Class | | 130,982 | | | 1,262,671 | | | 102,254 | | | 1,051,166 | |
| | 480,590 | | | $4,650,368 | | | 383,907 | | | $3,963,460 | |
| Shares reacquired | | | | | | | | | | | | |
Initial Class | | (1,603,861 | ) | | $(15,258,299 | ) | | (1,071,663 | ) | | $(11,113,051 | ) |
Service Class | | (722,969 | ) | | (6,708,031 | ) | | (456,484 | ) | | (4,762,343 | ) |
| | (2,326,830 | ) | | $(21,966,330 | ) | | (1,528,147 | ) | | $(15,875,394 | ) |
| Net change | | | | | | | | | | | | |
Initial Class | | (1,040,870 | ) | | $(9,852,326 | ) | | (358,178 | ) | | $(3,697,330 | ) |
Service Class | | (514,272 | ) | | (4,731,123 | ) | | (219,120 | ) | | (2,316,517 | ) |
| | (1,555,142 | ) | | $(14,583,449 | ) | | (577,298 | ) | | $(6,013,847 | ) |
The fund and other funds managed by MFS participate in a $1 billion unsecured committed line of credit provided by a syndication of banks under a credit agreement. In addition, the fund and other funds managed by MFS have established uncommitted borrowing arrangements with certain banks. Borrowings may be made for temporary financing needs. Interest is charged to each fund, based on its borrowings, generally at a rate equal to the Federal Reserve funds rate plus 0.30%. In addition, a commitment fee, based on the average daily, unused portion of the committed line of credit, is allocated among the participating funds at the end of each calendar quarter. For the year ended December 31, 2008, the fund’s commitment fee and interest expense were $283 and $0, respectively, and are included in miscellaneous expense on the Statement of Operations.
26
REPORT OF INDEPENDENT REGISTERED PUBLIC ACCOUNTING FIRM
To the Board of Trustees of MFS Variable Insurance Trust II and the Shareholders of
MFS Strategic Income Portfolio:
We have audited the accompanying statement of assets and liabilities, including the portfolio of investments, of MFS Strategic Income Portfolio (the “Fund”) (one of the portfolios comprising MFS Variable Insurance Trust II) as of December 31, 2008, and the related statement of operations for the year then ended, the statements of changes in net assets for each of the two years in the period then ended, and the financial highlights for each of the five years in the period then ended. These financial statements and financial highlights are the responsibility of the Fund’s management. Our responsibility is to express an opinion on these financial statements and financial highlights based on our audits.
We conducted our audits in accordance with the standards of the Public Company Accounting Oversight Board (United States). Those standards require that we plan and perform the audit to obtain reasonable assurance about whether the financial statements and financial highlights are free of material misstatement. The Fund is not required to have, nor were we engaged to perform, an audit of its internal control over financial reporting. Our audits included consideration of internal control over financial reporting as a basis for designing audit procedures that are appropriate in the circumstances, but not for the purpose of expressing an opinion on the effectiveness of the Fund’s internal control over financial reporting. Accordingly, we express no such opinion. An audit also includes examining, on a test basis, evidence supporting the amounts and disclosures in the financial statements, assessing the accounting principles used and significant estimates made by management, as well as evaluating the overall financial statement presentation. Our procedures included confirmation of securities owned as of December 31, 2008, by correspondence with the custodian and brokers; where replies were not received from brokers, we performed other auditing procedures. We believe that our audits provide a reasonable basis for our opinion.
In our opinion, the financial statements and financial highlights referred to above present fairly, in all material respects, the financial position of MFS Strategic Income Portfolio as of December 31, 2008, the results of its operations for the year then ended, the changes in its net assets for each of the two years in the period then ended, and the financial highlights for each of the five years in the period then ended, in conformity with accounting principles generally accepted in the United States of America.
DELOITTE & TOUCHE LLP
Boston, Massachusetts
February 19, 2009
27
TRUSTEES AND OFFICERS – IDENTIFICATION AND BACKGROUND
The Trustees and officers of the Trust, as of February 1, 2009, are listed below, together with their principal occupations during the past five years. (Their titles may have varied during that period.) The address of each Trustee and officer is 500 Boylston Street, Boston, Massachusetts 02116.
| | | | | | |
Name, Date of Birth | | Position(s) Held
with Fund | | Trustee/Officer
Since (1) | | Principal Occupations During the Past Five Years and
Other Directorships (2) |
| INTERESTED TRUSTEE | | | | |
David D. Horn (3) (born 6/07/41) | | Trustee | | April 1986 | | Private investor; Sun Life Assurance Company of Canada, Senior Vice President and General Manager for the United States (until 1997); Director (until March 2004) |
| | |
| INDEPENDENT TRUSTEES | | | | |
J. Kermit Birchfield (born 1/08/40) | | Chairman | | May 1997 | | Consultant; Century Partners, Inc. (investments), Director; Displaytech, Inc. (technology), Director; Dessin Fournir LLC (furniture manufacturer), Director (2005 to present); Intermountain Gas Company, Inc. & Intermountain Industries, Inc. (oil & gas exploration and production), Director; Site Watch LLC (software to monitor oil tanks), Managing Director (2006 to present); Juridica Investments (fund investing in judicial matters), Director (2007 to present); HPSC, Inc. (medical financing), Director (until January 2004) |
| | | |
Robert C. Bishop (born 1/13/43) | | Trustee | | May 2001 | | AutoImmune, Inc. (pharmaceutical product development), Chairman, President and Chief Executive Officer; Caliper Life Sciences Corp. (laboratory analytical instruments), Director; Millipore Corporation (purification/filtration products), Director; Waterstreet Capital (leverage buyouts), Advisory Board (August 2006 to present); Optobionics Corporation (ophthalmic devices), Director (2002 to 2007) |
| | | |
Frederick H. Dulles (born 3/12/42) | | Trustee | | May 2001 | | Ten State International Law PLLC (law firm), Of Counsel (since 2006); Prudential Carolina Real Estate, (real estate), Broker (since 2006); Free Enterprise Foundation, Inc. (research institute), Director & Secretary (until 2008); Disher, Hamrick & Myers Residential, Inc. (real estate) Broker (2005 until 2006); Frederick H. Dulles law practice (until 2006); Ten State Street LLP (law firm), Member (until 2005) |
| | | |
Marcia A. Kean (born 6/30/48) | | Trustee | | April 2005 | | Feinstein Kean Healthcare (consulting), Chief Executive Officer |
| | | |
Ronald G. Steinhart (born 6/15/40) | | Trustee | | May 2001 | | Private investor; Penske Automotive Group (automotive retailer), Director; Animal Health International, Inc. (animal health products), Director (since 2007); Texas Industries (concrete/aggregates/cement), Director (since 2007); Penson Worldwide, Inc. (securities clearance), Director (since 2006); Carreker Corporation (technology consulting) Director (until 2005); Prentiss Properties Trust (real estate investment trust), Director (until 2006) |
| | | |
Haviland Wright (born 7/21/48) | | Trustee | | May 2001 | | Profitability of Hawaii (software), Chief Development Officer (since December 2008); Elixir Technologies Corporation (software) Director (since 2005); Nano Loa Inc. (liquid crystal displays), Director |
| | |
| TRUSTEE EMERITUS | | | | |
Samuel Adams (born 10/19/25) | | Trustee Emeritus | | | | Retired; K&L Gates LLP (law firm), Of Counsel |
| | |
| OFFICERS | | | | |
Maria F. Dwyer (4) (born 12/01/58) | | President | | November 2005 | | Massachusetts Financial Services Company, Executive Vice President and Chief Regulatory Officer (since March 2004) Chief Compliance Officer (since December 2006); Fidelity Management & Research Company, Vice President (prior to March 2004); Fidelity Group of Funds, President and Treasurer (until March 2004) |
| | | |
Christopher R. Bohane (4) (born 1/18/74) | | Assistant Secretary and Assistant Clerk | | July 2005 | | Massachusetts Financial Services Company, Vice President and Senior Counsel |
| | | |
John M. Corcoran (4) (born 4/13/65) | | Treasurer | | October 2008 | | Massachusetts Financial Services Company, Senior Vice President (since October 2008); State Street Bank and Trust (financial services provider), Senior Vice President, (until September 2008) |
| | | |
Ethan D. Corey (4) (born 11/21/63) | | Assistant Secretary and Assistant Clerk | | July 2005 | | Massachusetts Financial Services Company, Senior Vice President and Associate General Counsel (since 2004); Dechert LLP (law firm), Counsel (prior to December 2004) |
| | | |
David L. DiLorenzo (4) (born 8/10/68) | | Assistant Treasurer | | July 2005 | | Massachusetts Financial Services Company, Vice President (since June 2005); JP Morgan Investor Services, Vice President (until June 2005) |
| | | |
Timothy M. Fagan (4) (born 7/10/68) | | Assistant Secretary and Assistant Clerk | | September 2005 | | Massachusetts Financial Services Company, Vice President and Senior Counsel (since September 2005); John Hancock Advisers, LLC, Vice President, Senior Attorney and Chief Compliance Officer (until August 2005) |
| | | |
Mark D. Fischer (4) (born 10/27/70) | | Assistant Treasurer | | July 2005 | | Massachusetts Financial Services Company, Vice President (since May 2005); JP Morgan Investment Management Company, Vice President (until May 2005) |
28
Trustees and Officers – continued
| | | | | | |
Name, Date of Birth | | Position(s) Held
with Fund | | Trustee/Officer
Since (1) | | Principal Occupations During the Past Five Years and
Other Directorships (2) |
Robyn L. Griffin (born 7/04/75) | | Assistant Independent Chief Compliance Officer | | August 2008 | | Griffin Compliance LLC (provider of compliance services), Principal (since August 2008); State Street Corporation (financial services provider), Mutual Fund Administration Assistant Vice President (October 2006 – July 2008); Liberty Mutual Group (insurance), Personal Market Assistant Controller (April 2006 – October 2006); Deloitte & Touche LLP (professional services firm), Senior Manager (prior to April 2006) |
| | | |
Brian E. Langenfeld (4) (born 3/07/73) | | Assistant Secretary and Assistant Clerk | | May 2006 | | Massachusetts Financial Services Company, Vice President and Senior Counsel (since May 2006); John Hancock Advisers, LLC, Assistant Vice President and Counsel (until April 2006) |
| | | |
Ellen Moynihan (4) (born 11/13/57) | | Assistant Treasurer | | May 1997 | | Massachusetts Financial Services Company, Senior Vice President |
| | | |
Susan S. Newton (4) (born 3/07/50) | | Assistant Secretary and Assistant Clerk | | May 2005 | | Massachusetts Financial Services Company, Senior Vice President and Associate General Counsel (since April 2005); John Hancock Advisers, LLC, Senior Vice President, Secretary and Chief Legal Officer (until April 2005) |
| | | |
Susan A. Pereira (4) (born 11/05/70) | | Assistant Secretary and Assistant Clerk | | July 2005 | | Massachusetts Financial Services Company, Vice President and Senior Counsel (since June 2004); Bingham McCutchen LLP (law firm), Associate (until June 2004) |
| | | |
Mark N. Polebaum (4) (born 5/01/52) | | Secretary and Clerk | | February 2006 | | Massachusetts Financial Services Company, Executive Vice President, General Counsel and Secretary (since January 2006); Wilmer Cutler Pickering Hale and Dorr LLP (law firm), Partner (until January 2006) |
| | | |
Frank L. Tarantino (born 3/07/44) | | Independent Chief Compliance Officer | | September 2004 | | Tarantino LLC (provider of compliance services), Principal (since June 2004); CRA Business Strategies Group (consulting services), Executive Vice President (until June 2004) |
| | | |
Richard S. Weitzel (4) (born 7/16/70) | | Assistant Secretary and Assistant Clerk | | October 2007 | | Massachusetts Financial Services Company, Vice President and Assistant General Counsel (since 2004); Massachusetts Department of Business and Technology, General Counsel (until April 2004) |
| | | |
James O. Yost (4) (born 6/12/60) | | Assistant Treasurer | | April 1992 | | Massachusetts Financial Services Company, Senior Vice President |
| (1) | Date first appointed to serve as Trustee/Officer of an MFS fund or a Compass variable account. Each Trustee has served continuously since appointment. |
| (2) | Directorships or trusteeships of companies required to report to the Securities and Exchange Commission (i.e., “public companies”). |
| (3) | “Interested person” of the Trust, within the meaning of the Investment Company Act of 1940 (referred to as the 1940 Act), which is the principal federal law governing investment companies like the Trust, as a result of position with Sun Life of Canada (U.S.). The address of Sun Life of Canada (U.S.) is One Sun Life Executive Park, Wellesley Hills, Massachusetts 02481. |
| (4) | “Interested person” of MFS within the meaning of the 1940 Act. The address of MFS is 500 Boylston Street, Boston, Massachusetts 02116. |
The Trust does not hold annual meetings for the purpose of electing Trustees, and Trustees are not elected for fixed terms. Each Trustee and officer holds office until his or her successor is chosen and qualified, or until his or her earlier death, resignation, retirement or removal.
All Trustees currently serve as Trustees of the Trust and have served in that capacity since originally elected or appointed. All of the Trustees are also Managers of the Compass Variable Accounts. The executive officers of the Trust hold similar offices for the Compass Variable Accounts and other funds in the MFS fund complex. As of January 1, 2009, each Trustee serves as a Trustee or Manager of 35 Accounts/Funds.
The Statement of Additional Information contains further information about the Trustees and is available without charge upon request by calling 1-800-752-7215.
| | |
Investment Adviser
Massachusetts Financial Services Company 500 Boylston Street, Boston, MA 02116-3741 | | Custodian State Street Bank and Trust 1 Lincoln Street, Boston, MA 02111-2900 |
Distributor
MFS Fund Distributors, Inc. 500 Boylston Street, Boston, MA 02116-3741 | | Independent Registered Public Accounting Firm Deloitte & Touche LLP 200 Berkeley Street, Boston, MA 02116 |
Portfolio Managers John Addeo James Calmas Robert Persons Matthew Ryan Erik Weisman | | |
29
BOARD REVIEW OF INVESTMENT ADVISORY AGREEMENT
The Investment Company Act of 1940 requires that both the full Board of Trustees and a majority of the non-interested (“independent”) Trustees, voting separately, annually approve the continuation of the investment advisory agreement between MFS Variable Insurance Trust II (the “Trust”) and Massachusetts Financial Services Company (“MFS”) on behalf of the Fund. The Trustees consider matters bearing on the Fund and the advisory arrangements at their meetings throughout the year, including a review of performance data at each regular meeting. In addition, the independent Trustees met in May and again in July 2008 (“contract review meetings”) for the specific purpose of considering whether to approve the continuation of the investment advisory agreement for the Fund. The independent Trustees were assisted in their evaluation of the investment advisory agreement by independent legal counsel, from whom they received separate legal advice and with whom they met separately from MFS management during various contract review meetings. The independent Trustees were also assisted in this process by the Fund’s Independent Chief Compliance Officer, a full-time senior officer appointed by and reporting to the independent Trustees.
In connection with their deliberations, the Trustees, including the independent Trustees, considered such information and factors as they believed, in light of the legal advice furnished to them and their own business judgment, to be relevant. The investment advisory agreement was considered separately for the Fund, although the Trustees also took into account the common interests of all Funds in the Trust in their review. As described below, the Trustees considered the nature, quality, and extent of the various investment advisory, administrative, and shareholder services performed by MFS under the existing investment advisory agreement and other arrangements with the Trust.
In connection with their contract review meetings, the Trustees received and relied upon materials which included, among other items: (i) information provided by Lipper Inc. on the investment performance of the Fund for various time periods ended December 31, 2007, compared to the investment performance of a group of funds with substantially similar investment classifications/objectives (the “Lipper performance universe”), (ii) information provided by Lipper Inc. on the Fund’s advisory fees and other expenses compared to the advisory fees and other expenses of comparable funds identified by Lipper (the “Lipper expense group”), (iii) information provided by MFS on the advisory fees of comparable portfolios of its other clients, including institutional separate account and other clients, (iv) information as to whether expense waivers, reimbursements or fee “breakpoints” are observed for the Fund, (v) information regarding MFS’ financial results and financial condition, including MFS’ and certain of its affiliates’ estimated profitability from services performed for the Fund, (vi) MFS’ views regarding the outlook for the mutual fund industry and its strategic business plans, (vii) descriptions of various functions performed by MFS for the Trust, such as compliance monitoring and portfolio trading practices, and (viii) information regarding the overall organization of MFS, including information about MFS’ senior management and other personnel providing investment advisory, administrative and other services to the Fund. The comparative performance, fee and expense information prepared and provided by Lipper Inc. was not independently verified, and the independent Trustees did not independently verify any information provided to them by MFS.
The Trustees’ conclusion as to the continuation of the investment advisory agreement was based on comprehensive consideration of all information provided to the Trustees and not the result of any single factor. Some of the factors that figured particularly in the Trustees’ deliberations are described below for the Fund, while individual Trustees may have given different weight to various factors and evaluated the information presented as a whole differently than another Trustee. The Trustees recognized that the fee arrangements for the Fund reflect years of review and discussion between the independent Trustees and MFS, that certain aspects of such arrangements may receive greater scrutiny in some years than others, and that the Trustees’ conclusions may be based, in part, on their consideration of these same arrangements during the course of the year and in prior years.
Based on information provided by Lipper Inc., the Trustees compared the Fund’s total return investment performance to the performance of a peer group of funds over various time periods. The Trustees placed particular emphasis on the total return performance of the Fund’s Initial Class shares in comparison to the performance of funds in its Lipper performance universe over the one-, three- and five-year periods. The Trustees did not rely on performance results for more recent periods, including those shown elsewhere in this report.
The Trustees noted the performance of the Fund’s Initial Class shares was in the 5th quintile relative to the other funds in the Lipper Classification Index for the one-year period (the 1st quintile being the best performers and the 5th quintile being the worst performers). The total return performance of the Fund was in the 4th quintile for the three-year period and the 2nd quintile for the five-year period ended December 31, 2007, relative to the Lipper performance universe. Based on the nature and quality of services provided by MFS, the Board of Trustees concluded that the Fund’s performance was adequate.
In the course of their deliberations, the Trustees took into account information provided by MFS during contract review meetings, as well as during investment review meetings conducted with portfolio management personnel during the course of the year.
30
Board Review of Investment Advisory Agreement – continued
In assessing the reasonableness of the Fund’s advisory fee, the Trustees considered, among other information, the Fund’s advisory fee and the total expense ratio of the Fund’s Initial Class shares as a percentage of average daily net assets, compared to the advisory fee and total expense ratios of its peer group of funds based on information provided by Lipper Inc. The Trustees also considered the advisory fees charged by MFS to institutional accounts. In comparing these fees, the Trustees considered the generally broader scope of services provided by MFS to the Trust than those provided to institutional accounts. The Trustees also considered the higher demands placed on MFS’ investment personnel and trading infrastructure as a result of the daily cash in-flows and out-flows of the Fund, and the impact on MFS and related expenses due to the more extensive regulatory regime to which the Fund is subject, compared to institutional accounts.
In considering the fees, the Trustees noted from the Lipper data that the Fund’s effective advisory fee rate and total expense ratio were each above the median of such fees and expenses of funds in the Lipper expense group. In addition, the Trustees noted that MFS agreed to continue to reduce its advisory fee, and they accepted MFS’ offer to continue the expense limitation for the Fund. The Trustees further concluded that the existing breakpoint was sufficient to allow the Fund to benefit from economies of scale as its assets grow. The Trustees concluded that the fees were reasonable in light of the nature and quality of services provided.
The Trustees also considered information prepared by MFS relating to its costs and profits with respect to the Fund and other investment companies and accounts advised by MFS, as well as MFS’ methodologies used to determine and allocate its costs to the Fund and other accounts and products for purposes of estimating profitability.
After reviewing these and other factors described below, the Trustees concluded that the advisory fees charged to the Fund represent reasonable compensation in light of the nature and quality of the services being provided by MFS.
In addition, the Trustees considered MFS’ resources and related efforts to continue to retain, attract and motivate capable personnel to serve the Fund. The Trustees also considered the financial resources of MFS and its parent, Sun Life Financial Inc. The Trustees further considered any advantages and possible disadvantages of having an adviser which also serves other investment companies as well as institutional accounts.
The Trustees also considered the nature, quality, cost, and extent of administrative, transfer agency, and distribution services provided to the Fund by MFS and its affiliates under agreements and plans other than the investment advisory agreement, including the 12b-1 fees the Fund pays to MFS Fund Distributors, Inc., an affiliate of MFS. The Trustees also considered the nature, extent and quality of certain other services MFS performs or arranges on the Fund’s behalf, which may include securities lending programs, directed expense payment programs, class action recovery programs, and MFS’ interaction with third-party service providers, principally custodians and sub-custodians. The Trustees concluded that the various non-advisory services provided by MFS and its affiliates on behalf of the Fund were satisfactory. The Trustees also considered the benefits to MFS from the use of the Fund’s portfolio brokerage commissions to pay for research and other similar services and various other factors. Additionally, the Trustees considered so-called “fall-out benefits” to MFS such as reputational value derived from serving as investment manager to the Trust, and determined that any such benefits derived by MFS were reasonable and fair.
Based on their evaluation of factors that they deemed to be material, including those factors described above, the Board of Trustees, including a majority of the independent Trustees, concluded that the investment advisory agreement should be continued for an additional one-year period, commencing September 1, 2008.
A discussion regarding the Board’s most recent review and renewal of the fund’s Investment Advisory Agreement with MFS is available by clicking on the fund’s name under “Variable Insurance Portfolios-VIT II” in the “Products and Performance” section of the MFS Web site (mfs.com).
31
PROXY VOTING POLICIES AND INFORMATION
A general description of the MFS funds’ proxy voting policies and procedures is available without charge, upon request, by calling
1-800-225-2606, by visiting the Proxy Voting section of mfs.com or by visiting the SEC’s Web site at http://www.sec.gov.
Information regarding how the fund voted proxies relating to portfolio securities during the most recent twelve-month period ended June 30 is available without charge by visiting the Proxy Voting section of mfs.com or by visiting the SEC’s Web site at http://www.sec.gov.
QUARTERLY PORTFOLIO DISCLOSURE
The fund will file a complete schedule of portfolio holdings with the Securities and Exchange Commission (the Commission) for the first and third quarters of each fiscal year on Form N-Q. The fund’s Form N-Q may be reviewed and copied at the:
Public Reference Room
Securities and Exchange Commission
100 F Street, NE, Room 1580
Washington, D.C. 20549
Information on the operation of the Public Reference Room may be obtained by calling the Commission at 1-800-SEC-0330. The fund’s Form N-Q is available on the EDGAR database on the Commission’s Internet Web site at http://www.sec.gov, and copies of this information may be obtained, upon payment of a duplicating fee, by electronic request at the following e-mail address: publicinfo@sec.gov or by writing the Public Reference Section at the above address.
32
MFS® PRIVACY NOTICE
Privacy is a concern for every investor today. At MFS Investment Management® and the MFS funds, we take this concern very seriously. We want you to understand our policies about the investment products and services that we offer, and how we protect the nonpublic personal information of investors who have a direct relationship with us and our wholly owned subsidiaries.
Throughout our business relationship, you provide us with personal information. We maintain information and records about you, your investments, and the services you use. Examples of the nonpublic personal information we maintain include
| | Ÿ | | data from investment applications and other forms |
| | Ÿ | | share balances and transactional history with us, our affiliates, or others |
| | Ÿ | | facts from a consumer reporting agency |
We do not disclose any nonpublic personal information about our customers or former customers to anyone, except as permitted by law. We may share nonpublic personal information with third parties or certain of our affiliates in connection with servicing your account or processing your transactions. We may share information with companies or financial institutions that perform marketing services on our behalf or with other financial institutions with which we have joint marketing arrangements, subject to any legal requirements.
Authorization to access your nonpublic personal information is limited to appropriate personnel who provide products, services, or information to you. We maintain physical, electronic, and procedural safeguards to help protect the personal information we collect about you.
If you have any questions about the MFS privacy policy, please call 1-800-225-2606 any business day between 8 a.m. and 8 p.m. Eastern time.
Note: If you own MFS products or receive MFS services in the name of a third party such as a bank or broker-dealer, their privacy policy may apply to you instead of ours.
33

MFS® GLOBAL GOVERNMENTS PORTFOLIO
The report is prepared for the general information of contract owners. It is authorized for distribution to prospective investors only when preceded or accompanied by a current prospectus.
NOT FDIC INSURED Ÿ MAY LOSE VALUE Ÿ NO BANK GUARANTEE Ÿ NOT A DEPOSIT Ÿ NOT INSURED BY ANY FEDERAL GOVERNMENT AGENCY OR NCUA/NCUSIF
LETTER FROM THE CEO

Dear Contract Owners:
The market downturns and economic setbacks of late probably rank among the worst financial declines most of us have experienced. Inevitably, people may be questioning their commitment to investing. Still, it is important to remember that downturns are an inescapable part of the business cycle. Such troughs have been seen before, and if we can use history as a guide, market recoveries typically have followed.
Recent events have clearly shown us the value of certain types of investments. In this environment, two of the hallmarks of mutual funds — transparency and liquidity — have become critically important. Unlike some other types of investments, the operations of mutual funds are relatively transparent to their shareholders. With their daily redemption feature, mutual funds also generally provide easy, convenient access to one’s money. Through these recent market upheavals, this level of liquidity enhanced the ability of mutual fund investors to respond and modify their investments as they and their advisors saw fit — a flexibility that those in less liquid investments simply did not have at their disposal.
At MFS® we take particular pride in how well mutual funds can serve investors because we invented the mutual fund in the United States. Established in 1924, Massachusetts Investors Trust was the nation’s first fund. Recent market events only reinforce what we have learned through 85 years — that mutual funds provide unique features that are important to investors in any type of market climate.
Respectfully,

Robert J. Manning
Chief Executive Officer and Chief Investment Officer
MFS Investment Management®
February 17, 2009
The opinions expressed in this letter are subject to change, may not be relied upon for investment advice, and no forecasts can be guaranteed.
Before investing, consider the fund’s investment objectives, risks, charges, and expenses. For a prospectus containing this and other information, contact your investment professional or view online. Read it carefully.
MFS Fund Distributors, Inc., 500 Boylston Street, Boston, MA 02116
1
PORTFOLIO COMPOSITION
Portfolio structure (i)
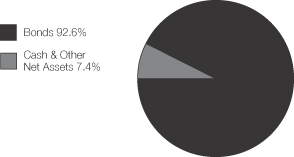
| | |
| Fixed income sectors (i) | | |
| Non-U.S. Government Bonds | | 72.1% |
| U.S. Treasury Securities | | 14.2% |
| Commercial Mortgage-Backed Securities | | 2.3% |
| U.S. Government Agencies | | 1.9% |
| Mortgage-Backed Securities | | 1.1% |
| Municipal Bonds | | 1.0% |
| |
| Credit quality of bonds (r) | | |
| AAA | | 76.5% |
| AA | | 23.5% |
| | |
| Portfolio facts | | |
| Average Duration (d)(i) | | 6.6 |
| Average Life (i)(m) | | 8.5 yrs. |
| Average Maturity (i)(m) | | 8.9 yrs. |
| Average Credit Quality of Rated Securities (long-term) (a) | | AA+ |
| Average Credit Quality of Rated Securities (short-term) (a) | | A-1 |
| |
| Country weightings (i) | | |
| United States | | 27.7% |
| Japan | | 22.2% |
| Germany | | 14.2% |
| United Kingdom | | 8.3% |
| France | | 6.1% |
| Netherlands | | 4.6% |
| Spain | | 4.3% |
| Italy | | 4.0% |
| Belgium | | 3.6% |
| Other Countries | | 5.0% |
| (a) | The average credit quality of rated securities is based upon a market weighted average of portfolio holdings that are rated by public rating agencies. |
| (d) | Duration is a measure of how much a bond’s price is likely to fluctuate with general changes in interest rates, e.g., if rates rise 1.00%, a bond with a 5-year duration is likely to lose about 5.00% of its value. |
| (i) | For purposes of this presentation, the bond component includes accrued interest amounts and may be positively or negatively impacted by the equivalent exposure from any derivative holdings, if applicable. |
| (m) | The average maturity shown is calculated using the final stated maturity on the portfolio’s holdings without taking into account any holdings which have been pre-refunded or pre-paid to an earlier date or which have a mandatory put date prior to the stated maturity. The average life shown takes into account these earlier dates. |
| (r) | Each security is assigned a rating from Moody’s Investors Service. If not rated by Moody’s, the rating will be that assigned by Standard & Poor’s. Likewise, if not assigned a rating by Standard & Poor’s, it will be based on the rating assigned by Fitch, Inc. For those portfolios that hold a security which is not rated by any of the three agencies, the security is considered Not Rated. Holdings in U.S. Treasuries and government agency mortgage-backed securities, if any, are included in the “AAA”-rating category. Percentages are based on the total market value of investments as of 12/31/08. |
Percentages are based on net assets as of 12/31/08, unless otherwise noted.
The portfolio is actively managed and current holdings may be different.
2
MANAGEMENT REVIEW
Summary of Results
For the twelve months ended December 31, 2008, Initial Class shares of the MFS Global Governments Portfolio (the “fund”) provided a total return of 10.12%, while Service Class shares of the fund provided a total return of 9.93%. These compare with a return of 12.00% for the fund’s benchmark, the JPMorgan Global Government Bond Index (Unhedged).
Market Environment
The U.S. economy and financial markets experienced significant deterioration and extraordinary volatility over the reporting period. U.S. economic growth slowed significantly, despite the short-term bounce from the second quarter fiscal stimulus. Strong domestic headwinds included accelerated deterioration in the housing market, anemic corporate investment, a rapidly declining job market, and a much tighter credit environment. During the period, a seemingly continuous series of tumultuous financial events hammered markets, including: the distressed sale of failing Bear Stearns to JPMorgan, the conservatorship of Government Sponsored Enterprises (GSEs) Fannie Mae and Freddie Mac, the bankruptcy of investment bank Lehman Brothers, the Federal Reserve Bank’s complex intervention of insurance company American International Group (AIG), the nationalization of several large European banks, the failure of Washington Mutual, and the distressed sale of Wachovia. As a result of this barrage of turbulent news, global equity markets pushed significantly lower and credit markets witnessed the worst dislocation since the beginning of the credit crisis. Though conditions improved towards the end of the period, the state of financial and macroeconomic dislocation remained severe.
While reasonably resilient during the first half of the period, the global economy and financial system increasingly experienced considerable negative spillovers from the U.S. slowdown. Not only did Europe and Japan show obvious signs of economic softening, the more powerful engine of global growth – emerging markets – also displayed weakening dynamics.
During the reporting period, the U.S. Federal Reserve Board cut interest rates aggressively and introduced a multitude of new lending facilities to alleviate ever-tightening credit markets, while the U.S. federal government moved quickly to design and implement a meaningful fiscal stimulus package. Although several other global central banks also cut rates, the dilemma of rising energy and food prices heightened concerns among central bankers that inflationary expectations might become unhinged despite weaker growth. Only later in the reporting period did slowing global growth result in a very precipitous decline in commodity prices, which significantly eased inflation and inflationary expectations. As inflationary concerns diminished in the face of global deleveraging, and equity and credit markets deteriorated more sharply, a coordinated rate cut marked the beginning of much more aggressive easing by the major global central banks.
Detractors from Performance
Relative to the JPMorgan Global Government Bond Index (Unhedged), a key detractor from performance was the fund’s lesser exposure to U.S. Treasury securities, which outperformed the benchmark over the reporting period. The strong relative performance of treasuries, we believe, was fueled by investors’ flight to quality, the general risk aversion in the market place, and by weakening macroeconomic conditions.
The fund’s greater exposure to “AAA” (s) rated commercial mortgage-backed securities (CMBS), delegated underwriting and servicing (DUS) bonds (pools of multifamily housing loans issued by the Federal National Mortgage Association (Fannie Mae)), and Small Business Association (SBA) bonds also held back performance as swap and credit spreads widened during the reporting period.
Additionally, our greater exposures to Treasury Inflation Protected Securities (TIPS) and to the Norwegian krone also detracted from performance. An underweight in Japanese government bonds was another factor that dampened relative results.
Contributors to Performance
During the first half of the reporting period, the fund’s underweighted exposure to the U.S. dollar contributed to relative performance, while during the second half of the reporting period, the fund’s considerable overweight to the dollar benefited results. A greater relative exposure to Euroland, U.K., and Australian bonds also boosted relative returns, as did our underweighted exposure to Italian bonds.
3
Management Review – continued
During the reporting period, the fund’s return from yield, which was greater than that of the benchmark, was a key contributor to performance.
Respectfully,
| | |
| Matthew Ryan | | Erik Weisman |
| Portfolio Manager | | Portfolio Manager |
| (s) | Bonds rated “BBB”, “Baa”, or higher are considered investment grade; bonds rated “BB”, “Ba”, or below are considered non-investment grade. The primary source for bond quality ratings is Moody’s Investors Service. If not available, ratings by Standard & Poor’s are used, else ratings by Fitch, Inc. For securities which are not rated by any of the three agencies, the security is considered Not Rated. |
The views expressed in this report are those of the portfolio managers only through the end of the period of the report as stated on the cover and do not necessarily reflect the views of MFS or any other person in the MFS organization. These views are subject to change at any time based on market or other conditions, and MFS disclaims any responsibility to update such views. These views may not be relied upon as investment advice or an indication of trading intent on behalf of any MFS portfolio. References to specific securities are not recommendations of such securities, and may not be representative of any MFS portfolio’s current or future investments.
4
PERFORMANCE SUMMARY THROUGH 12/31/08
The following chart illustrates the historical performance of the fund in comparison to its benchmark(s). Benchmark comparisons are unmanaged; do not reflect any fees or expenses; and cannot be invested in directly. The performance of other share classes will be greater than or less than that of the class depicted below. (See Notes to Performance Summary.)
Performance data shown represents past performance and is no guarantee of future results. Investment return and principal value fluctuate so your units, when sold, may be worth more or less than the original cost; current performance may be lower or higher than quoted. The performance shown does not reflect the deduction of taxes, if any, that a contract holder would pay on fund distributions or the redemption of contract units. The returns for the fund shown also do not reflect the deduction of expenses associated with variable products, such as mortality and expense risk charges, separate account charges, and sales charges imposed by the insurance company separate accounts. Such expenses would reduce the overall returns shown.
Growth of a hypothetical $10,000 investment
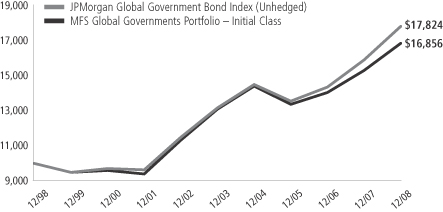
Total rates of return through 12/31/08
Average Annual Total Returns
| | | | | | | | | | | | |
| | | Share class | | Class inception date | | 1-yr | | 5-yr | | 10-yr | | |
| | | Initial Class | | 5/16/88 | | 10.12% | | 5.17% | | 5.36% | | |
| | | Service Class | | 8/24/01 | | 9.93% | | 4.90% | | 5.16% | | |
Comparative Benchmark
| | | | | | | | | | | | |
| | | JPMorgan Global Government Bond Index (Unhedged) (f) | | 12.00% | | 6.23% | | 5.95% | | |
| (f) | Source: FactSet Research Systems Inc. |
Benchmark Definition
JPMorgan Global Government Bond Index (Unhedged) – measures developed government bond markets around the world.
It is not possible to invest directly in an index.
Notes to Performance Summary
Performance for the Service Class includes the performance of the fund’s Initial Class for periods prior to their offering. Because Service Class expenses are higher than those of Initial Class, performance shown for Service Class is higher than it would have been had it been offered for the entire period. Performance has not been adjusted to take into account differences in class specific operating expenses (such as Rule 12b-1 fees). Please see the prospectus for additional information about performance and expenses.
Performance results reflect any applicable expense subsidies and waivers in effect during the periods shown. Without such subsidies and waivers the fund’s performance results would be less favorable. Please see the prospectus for complete details. All results are historical and assume the reinvestment of any dividends and capital gains distributions.
From time to time the fund may receive proceeds from litigation settlements, without which performance would be lower.
5
EXPENSE TABLE
Fund Expenses Borne by the Contract Holders During the Period,
July 1, 2008 through December 31, 2008
As a contract holder of the fund, you incur ongoing costs, including management fees; distribution (12b-1) fees; and other fund expenses. This example is intended to help you understand your ongoing costs (in dollars) of investing in the fund and to compare these costs with the ongoing costs of investing in other mutual funds.
The example is based on an investment of $1,000 invested at the beginning of the period and held for the entire period July 1, 2008 through December 31, 2008.
Actual Expenses
The first line for each share class in the following table provides information about actual account values and actual expenses. You may use the information in this line, together with the amount you invested, to estimate the expenses that you paid over the period. Simply divide your account value by $1,000 (for example, an $8,600 account value divided by $1,000 = 8.6), then multiply the result by the number in the first line under the heading entitled “Expenses Paid During Period” to estimate the expenses you paid on your account during this period.
Hypothetical Example for Comparison Purposes
The second line for each share class in the following table provides information about hypothetical account values and hypothetical expenses based on the fund’s actual expense ratio and an assumed rate of return of 5% per year before expenses, which is not the fund’s actual return. The hypothetical account values and expenses may not be used to estimate the actual ending account balance or expenses you paid for the period. You may use this information to compare the ongoing costs of investing in the fund and other funds. To do so, compare this 5% hypothetical example with the 5% hypothetical examples that appear in the shareholder reports of the other funds.
Please note that the expenses shown in the table are meant to highlight the fund’s ongoing costs only and do not take into account the fees and expenses imposed under the variable contracts through which your investment in the fund is made. Therefore, the second line for each share class in the table is useful in comparing ongoing costs associated with an investment in vehicles (such as the fund) which fund benefits under variable annuity and variable life insurance contracts and to qualified pension and retirement plans only, and will not help you determine the relative total costs of investing in the fund through variable annuity and variable life insurance contracts. If the fees and expenses imposed under the variable contracts were included, your costs would have been higher.
| | | | | | | | | | |
| Share Class | | | | Annualized
Expense Ratio | | Beginning
Account Value
7/01/08 | | Ending
Account Value
12/31/08 | | Expenses Paid
During Period (p)
7/01/08-12/31/08 |
| Initial Class | | Actual | | 1.00% | | $1,000.00 | | $1,061.36 | | $5.18 |
| | Hypothetical (h) | | 1.00% | | $1,000.00 | | $1,020.11 | | $5.08 |
| Service Class | | Actual | | 1.25% | | $1,000.00 | | $1,060.07 | | $6.47 |
| | Hypothetical (h) | | 1.25% | | $1,000.00 | | $1,018.85 | | $6.34 |
| (h) | 5% class return per year before expenses. |
| (p) | Expenses paid is equal to each class’ annualized expense ratio, as shown above, multiplied by the average account value over the period, multiplied by the number of days in the period, divided by the number of days in the year. |
6
PORTFOLIO OF INVESTMENTS – 12/31/08
The Portfolio of Investments is a complete list of all securities owned by your fund. It is categorized by broad-based asset classes.
| | | | | | |
| Issuer | | Shares/Par | | Value ($) |
| | | | | | |
| BONDS – 80.6% | | | | | | |
| Foreign Bonds – 60.6% | | | | | | |
| Australia – 1.4% | | | | | | |
| Commonwealth of Australia, 6%, 2017 | | AUD | 767,000 | | $ | 613,286 |
| | | | | | |
| Belgium – 3.6% | | | | | | |
| Kingdom of Belgium, 5.5%, 2017 | | EUR | 979,000 | | $ | 1,537,272 |
| | | | | | |
| Canada – 2.3% | | | | | | |
| Bayview Commercial Asset Trust, FRN, 2.137%, 2023 (n) | | CAD | 150,000 | | $ | 82,685 |
| Canada Housing Trust, 4.6%, 2011 (n) | | CAD | 280,000 | | | 243,787 |
| Government of Canada, 4.5%, 2015 | | CAD | 597,000 | | | 551,726 |
| Government of Canada, 5.75%, 2033 | | CAD | 87,000 | | | 95,877 |
| | | | | | |
| | | | | $ | 974,075 |
| | | | | | |
| Denmark – 0.6% | | | | | | |
| Kingdom of Denmark, 4%, 2015 | | DKK | 1,413,000 | | $ | 275,615 |
| | | | | | |
| France – 6.0% | | | | | | |
| Republic of France, 6%, 2025 | | EUR | 1,109,000 | | $ | 1,972,423 |
| Republic of France, 4.75%, 2035 | | EUR | 381,000 | | | 610,343 |
| | | | | | |
| | | | | $ | 2,582,766 |
| | | | | | |
| Germany – 13.8% | | | | | | |
| Bundesrepublik Deutschland, 5%, 2011 | | EUR | 335,000 | | $ | 500,163 |
Bundesrepublik Deutschland,
4.25%, 2018 | | EUR | 616,000 | | | 946,093 |
Federal Republic of Germany,
5.25%, 2010 | | EUR | 577,000 | | | 839,948 |
Federal Republic of Germany,
3.75%, 2013 | | EUR | 349,000 | | | 514,080 |
Federal Republic of Germany,
3.75%, 2015 | | EUR | 1,062,000 | | | 1,573,486 |
Federal Republic of Germany,
6.25%, 2030 | | EUR | 843,000 | | | 1,568,552 |
| | | | | | |
| | | | | $ | 5,942,322 |
| | | | | | |
| Italy – 3.9% | | | | | | |
| Republic of Italy, 4.75%, 2013 | | EUR | 1,179,000 | | $ | 1,705,242 |
| | | | | | |
| Japan – 11.4% | | | | | | |
| Government of Japan, 1.3%, 2014 | | JPY | 66,000,000 | | $ | 750,476 |
| Government of Japan, 1.5%, 2015 | | JPY | 24,000,000 | | | 276,510 |
| Government of Japan, 1.7%, 2017 | | JPY | 77,000,000 | | | 902,716 |
| Government of Japan, 2.1%, 2024 | | JPY | 123,000,000 | | | 1,442,342 |
| Government of Japan, 2.2%, 2027 | | JPY | 103,000,000 | | | 1,223,829 |
| Government of Japan, 2.4%, 2037 | | JPY | 26,000,000 | | | 324,084 |
| | | | | | |
| | | | | $ | 4,919,957 |
| | | | | | |
| Netherlands – 4.6% | | | | | | |
| Kingdom of Netherlands, 3.75%, 2014 | | EUR | 1,371,000 | | $ | 1,971,392 |
| | | | | | |
| Spain – 4.2% | | | | | | |
| Kingdom of Spain, 5%, 2012 | | EUR | 1,222,000 | | $ | 1,807,846 |
| | | | | | |
| Sweden – 0.6% | | | | | | |
| Kingdom of Sweden, 4.5%, 2015 | | SEK | 1,965,000 | | $ | 283,060 |
| | | | | | |
| | | | | | |
| Issuer | | Shares/Par | | Value ($) |
| | | | | | |
| BONDS – continued | | | | | | |
| Foreign Bonds – continued | | | | | | |
| United Kingdom – 8.2% | | | | | | |
| United Kingdom Treasury, 9%, 2011 | | GBP | 292,000 | | $ | 493,767 |
| United Kingdom Treasury, 8%, 2015 | | GBP | 769,000 | | | 1,433,294 |
| United Kingdom Treasury, 8%, 2021 | | GBP | 420,000 | | | 882,232 |
| United Kingdom Treasury, 4.25%, 2036 | | GBP | 475,000 | | | 735,381 |
| | | | | | |
| | | | | $ | 3,544,674 |
| | | | | | |
| Total Foreign Bonds | | | | | $ | 26,157,507 |
| | | | | | |
| U.S. Bonds – 20.0% | | | | | | |
| Asset Backed & Securitized – 2.1% |
| Commercial Mortgage Asset Trust, FRN, 0.896%, 2032 (i)(n) | | $ | 6,106,068 | | $ | 134,647 |
| Commercial Mortgage Pass-Through Certificates, FRN, 1.385%, 2017 (n) | | | 331,000 | | | 273,879 |
| Commercial Mortgage Pass-Through Certificates, FRN, 1.395%, 2017 (n) | | | 433,234 | | | 370,805 |
| First Union National Bank Commercial Mortgage Trust, FRN, 0.896%, 2043 (i)(n) | | | 7,935,439 | | | 112,190 |
| | | | | | |
| | | | | $ | 891,521 |
| | | | | | |
| Mortgage Backed – 1.0% | | | | | | |
| Fannie Mae, 5.37%, 2013 | | $ | 96,521 | | $ | 98,788 |
| Fannie Mae, 4.78%, 2015 | | | 71,320 | | | 72,229 |
| Fannie Mae, 4.856%, 2015 | | | 45,689 | | | 46,088 |
| Fannie Mae, 5.09%, 2016 | | | 59,000 | | | 60,520 |
| Fannie Mae, 5.424%, 2016 | | | 71,409 | | | 74,813 |
| Fannie Mae, 5.05%, 2017 | | | 54,000 | | | 55,262 |
| Fannie Mae, 5.32%, 2017 | | | 43,355 | | | 45,054 |
| | | | | | |
| | | | | $ | 452,754 |
| | | | | | |
| Municipals – 0.9% | | | | | | |
Minnesota Public Facilities Authority, Water Pollution Control Rev., “B”,
5%, 2018 | | $ | 215,000 | | $ | 239,170 |
| New York, Dormitory Authority Rev. (New York University), BHAC, 5.5%, 2031 | | | 170,000 | | | 172,865 |
| | | | | | |
| | | | | $ | 412,035 |
| | | | | | |
| U.S. Government Agencies – 1.9% |
| Aid-Egypt, 4.45%, 2015 | | $ | 252,000 | | $ | 272,248 |
Small Business Administration,
5.09%, 2025 | | | 45,802 | | | 46,425 |
Small Business Administration,
5.21%, 2026 | | | 492,510 | | | 501,180 |
| | | | | | |
| | | | | $ | 819,853 |
| | | | | | |
| U.S. Treasury Obligations – 14.1% |
| U.S. Treasury Bonds, 2.375%, 2010 | | $ | 1,166,000 | | $ | 1,201,390 |
| U.S. Treasury Bonds, 4.75%, 2017 | | | 766,000 | | | 915,849 |
| U.S. Treasury Bonds, 8%, 2021 | | | 591,000 | | | 896,104 |
| U.S. Treasury Bonds, 5.375%, 2031 | | | 159,000 | | | 218,476 |
| U.S. Treasury Notes, 4.75%, 2012 (f) | | | 1,230,000 | | | 1,367,991 |
7
Portfolio of Investments – continued
| | | | | | |
| Issuer | | Shares/Par | | Value ($) |
| | | | | | |
| BONDS – continued | | | | | | |
| U.S. Bonds – continued | | | | | | |
| U.S. Treasury Obligations – continued | | | | | | |
| U.S. Treasury Notes, 4.125%, 2015 | | $ | 554,000 | | $ | 635,369 |
| U.S. Treasury Notes, TIPS, 2%, 2016 | | | 881,956 | | | 844,611 |
| | | | | | |
| | | | | $ | 6,079,790 |
| | | | | | |
| Total U.S. Bonds | | | | | $ | 8,655,953 |
| | | | | | |
Total Bonds
(Identified Cost, $34,809,702) | | | | | $ | 34,813,460 |
| | | | | | |
|
| SHORT-TERM OBLIGATIONS (y) – 6.3% |
Federal Home Loan Bank,
0.001%, due 1/02/09 | | $ | 1,431,000 | | $ | 1,431,000 |
| HSBC Americas, Inc., 0.05%, due 1/02/09 | | | 1,306,000 | | | 1,305,998 |
| | | | | | |
Total Short-Term Obligations,
at Amortized Cost and Value | | | | | $ | 2,736,998 |
| | | | | | |
| | | | | | |
| Issuer | | Shares/Par | | Value ($) |
| | | | | | |
| REPURCHASE AGREEMENTS – 9.1% |
| Goldman Sachs, 0.01%, dated 12/31/08, due 1/02/09, total to be received $1,959,001 (secured by U.S. Treasury and Federal Agency obligations and Mortgage Backed securities in a jointly traded account) | | $ | 1,959,000 | | $ | 1,959,000 |
| Morgan Stanley, 0.02%, dated 12/31/08, due 1/02/09, total to be received $1,959,002 (secured by various U.S. Treasury and Federal Agency obligations and Mortgage Backed securities in a jointly traded account) | | | 1,959,000 | | | 1,959,000 |
| | | | | | |
| Total Repurchase Agreements, at Cost | | | | | $ | 3,918,000 |
| | | | | | |
Total Investments
(Identified Cost, $41,464,700) | | | | | $ | 41,468,458 |
| | | | | | |
OTHER ASSETS, LESS
LIABILITIES – 4.0% | | | | | | 1,715,600 |
| | | | | | |
| Net Assets – 100.0% | | | | | $ | 43,184,058 |
| | | | | | |
| (f) | | All or a portion of the security has been segregated as collateral for an open futures contract. |
| (i) | | Interest only security for which the fund receives interest on notional principal (Par amount). Par amount shown is the notional principal and does not reflect the cost of the security. |
| (n) | | Securities exempt from registration under Rule 144A of the Securities Act of 1933. These securities may be sold in the ordinary course of business in transactions exempt from registration, normally to qualified institutional buyers. At period end, the aggregate value of these securities was $1,217,993, representing 2.8% of net assets. |
| (y) | | The rate shown represents an annualized yield at time of purchase. |
The following abbreviations are used in this report and are defined:
| FRN | | Floating Rate Note. Interest rate resets periodically and may not be the rate reported at period end. |
| TIPS | | Treasury Inflation Protected Security |
| | | | | | |
| Insurers | | |
| BHAC | | Berkshire Hathaway Assurance Corp. | | | | |
Abbreviations indicate amounts shown in currencies other than the U.S. dollar. All amounts are stated in U.S. dollars unless otherwise indicated. A list of abbreviations is shown below:
8
Portfolio of Investments – continued
Derivative Contracts at 12/31/08
Forward Foreign Currency Exchange Contracts at 12/31/08
| | | | | | | | | | | | | | | | | | |
| | | Type | | Currency | | Contracts to
Deliver/Receive | | Settlement Date
Range | | In Exchange For | | Contracts
at Value | | Net Unrealized
Appreciation
(Depreciation) | |
| Appreciation | | | | | | | | | | | | | | | | | | |
| | BUY | | AUD | | 37,134 | | 1/07/09 | | $ | 25,287 | | $ | 25,885 | | $ | 598 | |
| | SELL | | CAD | | 345,086 | | 2/19/09 | | | 287,379 | | | 279,465 | | | 7,914 | |
| | BUY | | CHF | | 121,112 | | 1/20/09 | | | 102,211 | | | 113,808 | | | 11,597 | |
| | BUY | | DKK | | 314,097 | | 1/07/2009 | | | 53,618 | | | 58,649 | | | 5,031 | |
| | BUY | | EUR | | 31,836 | | 2/19/09 | | | 44,000 | | | 44,174 | | | 174 | |
| | SELL | | EUR | | 6,071,413 | | 2/18/09-2/19/09 | | | 8,693,119 | | | 8,424,355 | | | 268,764 | |
| | SELL | | GBP | | 1,465,238 | | 2/17/09 | | | 2,178,189 | | | 2,104,288 | | | 73,901 | |
| | BUY | | JPY | | 910,256,475 | | 2/17/09-2/18/09 | | | 10,016,056 | | | 10,050,300 | | | 34,244 | |
| | SELL | | JPY | | 64,682,642 | | 2/17/09-2/18/09 | | | 725,000 | | | 714,178 | | | 10,822 | |
| | SELL | | SEK | | 413,412 | | 1/30/09 | | | 52,708 | | | 52,253 | | | 455 | |
| | | | | | | | | | | | | | | | | | |
| | | | | | | | | | | | | | | | $ | 413,500 | |
| | | | | | | | | | | | | | | | | | |
| Depreciation | | | | | | | | | | | | | | | | | | |
| | SELL | | AUD | | 705,628 | | 1/07/09 | | $ | 473,235 | | $ | 491,854 | | $ | (18,619 | ) |
| | SELL | | DKK | | 309,162 | | 1/07/09 | | | 52,000 | | | 57,728 | | | (5,728 | ) |
| | BUY | | EUR | | 5,031,151 | | 2/19/09 | | | 7,173,639 | | | 6,980,944 | | | (192,695 | ) |
| | SELL | | EUR | | 76,391 | | 2/19/09 | | | 105,667 | | | 105,995 | | | (328 | ) |
| | BUY | | GBP | | 534,621 | | 2/17/09 | | | 797,856 | | | 767,791 | | | (30,065 | ) |
| | BUY | | JPY | | 110,027,442 | | 2/18/09-2/19/09 | | | 1,227,603 | | | 1,214,863 | | | (12,740 | ) |
| | SELL | | JPY | | 46,038,770 | | 2/17/09 | | | 508,000 | | | 508,321 | | | (321 | ) |
| | SELL | | NOK | | 31,329 | | 1/14/09 | | | 4,377 | | | 4,471 | | | (94 | ) |
| | SELL | | SEK | | 135,648 | | 1/30/09 | | | 17,000 | | | 17,145 | | | (145 | ) |
| | | | | | | | | | | | | | | | | | |
| | | | | | | | | | | | | | | | $ | (260,735 | ) |
| | | | | | | | | | | | | | | | | | |
Futures contracts outstanding at 12/31/08
| | | | | | | | |
| Description | | Contracts | | Value | | Expiration
Date | | Unrealized
Appreciation
(Depreciation) |
| Japan Government Bonds 10 Yr (Long) | | 3 | | 4,637,176 | | Mar-09 | | $26,075 |
At December 31, 2008, the fund had sufficient cash and/or other liquid securities to cover any commitments under these derivative contracts.
See Notes to Financial Statements
9
FINANCIAL STATEMENTS | STATEMENT OF ASSETS AND LIABILITIES
This statement represents your fund’s balance sheet, which details the assets and liabilities comprising the total value of the fund.
| | | | | |
At 12/31/08 | | | | | |
Assets | | | | | |
Investments, at value (identified cost, $41,464,700) | | $41,468,458 | | | |
Cash | | 818 | | | |
Foreign currency, at value (identified cost, $301) | | 297 | | | |
Receivable for forward foreign currency exchange contracts | | 413,500 | | | |
Receivable for investments sold | | 1,706,801 | | | |
Receivable for fund shares sold | | 8,410 | | | |
Interest receivable | | 553,262 | | | |
Receivable from investment adviser | | 7,833 | | | |
Other assets | | 2,705 | | | |
Total assets | | | | | $44,162,084 |
Liabilities | | | | | |
Payable for forward foreign currency exchange contracts | | $260,735 | | | |
Payable for daily variation margin on open futures contracts | | 123 | | | |
Payable for investments purchased | | 559,486 | | | |
Payable for fund shares reacquired | | 84,242 | | | |
Payable to affiliates | | | | | |
Management fee | | 1,782 | | | |
Distribution fees | | 87 | | | |
Administrative services fee | | 82 | | | |
Payable for trustees’ compensation | | 16 | | | |
Accrued expenses and other liabilities | | 71,473 | | | |
Total liabilities | | | | | $978,026 |
Net assets | | | | | $43,184,058 |
Net assets consist of | | | | | |
Paid-in capital | | $39,368,377 | | | |
Unrealized appreciation (depreciation) on investments and translation of assets and liabilities in foreign currencies | | 173,289 | | | |
Accumulated net realized gain (loss) on investments and foreign currency transactions | | (457,201 | ) | | |
Undistributed net investment income | | 4,099,593 | | | |
Net assets | | | | | $43,184,058 |
Shares of beneficial interest outstanding | | | | | 3,730,436 |
Initial Class shares | | | | | |
Net assets | | $36,813,104 | | | |
Shares outstanding | | 3,175,143 | | | |
Net asset value per share | | | | | $11.59 |
Service Class shares | | | | | |
Net assets | | $6,370,954 | | | |
Shares outstanding | | 555,293 | | | |
Net asset value per share | | | | | $11.47 |
See Notes to Financial Statements
10
FINANCIAL STATEMENTS | STATEMENT OF OPERATIONS
This statement describes how much your fund earned in investment income and accrued in expenses. It also describes any gains and/or losses generated by fund operations.
| | | | | | |
| Year ended 12/31/08 | | | | | | |
| Net investment income | | | | | | |
Interest income | | $1,464,159 | | | | |
Foreign taxes withheld | | (1,243 | ) | | | |
Total investment income | | | | | $1,462,916 | |
Expenses | | | | | | |
Management fee | | 331,778 | | | | |
Distribution fees | | 14,313 | | | | |
Administrative services fee | | 13,038 | | | | |
Trustees’ compensation | | 4,351 | | | | |
Custodian fee | | 54,814 | | | | |
Shareholder communications | | 11,267 | | | | |
Auditing fees | | 54,607 | | | | |
Legal fees | | 7,127 | | | | |
Miscellaneous | | 6,231 | | | | |
Total expenses | | | | | $497,526 | |
Fees paid indirectly | | (178 | ) | | | |
Reduction of expenses by investment adviser | | (40,861 | ) | | | |
Net expenses | | | | | $456,487 | |
Net investment income | | | | | $1,006,429 | |
Realized and unrealized gain (loss) on investments | | | | | | |
Realized gain (loss) (identified cost basis) | | | | | | |
Investment transactions | | $1,483,509 | | | | |
Futures contracts | | 98,786 | | | | |
Foreign currency transactions | | 1,975,856 | | | | |
Net realized gain (loss) on investments and foreign currency transactions | | | | | $3,558,151 | |
Change in unrealized appreciation (depreciation) | | | | | | |
Investments | | $(686,206 | ) | | | |
Futures contracts | | 12,366 | | | | |
Translation of assets and liabilities in foreign currencies | | 132,849 | | | | |
Net unrealized gain (loss) on investments and foreign currency translation | | | | | $(540,991 | ) |
Net realized and unrealized gain (loss) on investments and foreign currency | | | | | $3,017,160 | |
Change in net assets from operations | | | | | $4,023,589 | |
See Notes to Financial Statements
11
FINANCIAL STATEMENTS | STATEMENTS OF CHANGES IN NET ASSETS
These statements describe the increases and/or decreases in net assets resulting from operations, any distributions, and any shareholder transactions.
| | | | | | |
For years ended 12/31 | | 2008 | | | 2007 | |
Change in net assets | | | | | | |
From operations | | | | | | |
Net investment income | | $1,006,429 | | | $1,361,264 | |
Net realized gain (loss) on investments and foreign currency transactions | | 3,558,151 | | | 2,069,516 | |
Net unrealized gain (loss) on investments and foreign currency translation | | (540,991 | ) | | (6,909 | ) |
Change in net assets from operations | | $4,023,589 | | | $3,423,871 | |
Distributions declared to shareholders | | | | | | |
From net investment income | | | | | | |
Initial Class | | $(3,124,520 | ) | | $(767,617 | ) |
Service Class | | (424,166 | ) | | (65,103 | ) |
Total distributions declared to shareholders | | $(3,548,686 | ) | | $(832,720 | ) |
Change in net assets from fund share transactions | | $2,087,593 | | | $(5,399,291 | ) |
Total change in net assets | | $2,562,496 | | | $(2,808,140 | ) |
Net assets | | | | | | |
At beginning of period | | 40,621,562 | | | 43,429,702 | |
At end of period (including undistributed net investment income of $4,099,593 and
$3,362,337, respectively) | | $43,184,058 | | | $40,621,562 | |
See Notes to Financial Statements
12
FINANCIAL STATEMENTS | FINANCIAL HIGHLIGHTS
The financial highlights table is intended to help you understand the fund’s financial performance for the past 5 years. Certain information reflects financial results for a single fund share. The total returns in the table represent the rate by which an investor would have earned (or lost) on an investment in the fund share class (assuming reinvestment of all distributions) held for the entire period.
| | | | | | | | | | | | | | | |
| Initial Class | | Years ended 12/31 | |
| | | 2008 | | | 2007 | | | 2006 | | | 2005 | | | 2004 | |
Net asset value, beginning of period | | $11.43 | | | $10.70 | | | $10.29 | | | $12.40 | | | $12.92 | |
| Income (loss) from investment operations | | | | | | | | | | | | | | | |
Net investment income (d) | | $0.26 | | | $0.36 | | | $0.34 | | | $0.29 | | | $0.30 | |
Net realized and unrealized gain (loss) on investments
and foreign currency | | 0.84 | | | 0.58 | | | 0.17 | | | (1.10 | ) | | 0.76 | |
Total from investment operations | | $1.10 | | | $0.94 | | | $0.51 | | | $(0.81 | ) | | $1.06 | |
| Less distributions declared to shareholders | | | | | | | | | | | | | | | |
From net investment income | | $(0.94 | ) | | $(0.21 | ) | | $— | | | $(1.23 | ) | | $(1.58 | ) |
From net realized gain on investments | | — | | | — | | | (0.10 | ) | | (0.07 | ) | | — | |
Total distributions declared to shareholders | | $(0.94 | ) | | $(0.21 | ) | | $(0.10 | ) | | $(1.30 | ) | | $(1.58 | ) |
Net asset value, end of period | | $11.59 | | | $11.43 | | | $10.70 | | | $10.29 | | | $12.40 | |
Total return (%) (k)(r)(s) | | 10.12 | | | 8.99 | | | 4.97 | | | (7.20 | ) | | 10.06 | |
Ratios (%) (to average net assets)
and Supplemental data: | | | | | | | | | | | | | | | |
Expenses before expense reductions (f) | | 1.09 | | | 1.08 | | | 1.13 | | | 1.03 | | | 0.98 | |
Expenses after expense reductions (f) | | 1.00 | | | 1.00 | | | 1.00 | | | 1.00 | | | N/A | |
Net investment income | | 2.31 | | | 3.33 | | | 3.21 | | | 2.64 | | | 2.48 | |
Portfolio turnover | | 113 | | | 134 | | | 122 | | | 137 | | | 124 | |
Net assets at end of period (000 Omitted) | | $36,813 | | | $36,559 | | | $39,637 | | | $48,203 | | | $62,107 | |
See Notes to Financial Statements
13
Financial Highlights – continued
| | | | | | | | | | | | | | | |
| Service Class | | Years ended 12/31 | |
| | | 2008 | | | 2007 | | | 2006 | | | 2005 | | | 2004 | |
Net asset value, beginning of period | | $11.32 | | | $10.60 | | | $10.22 | | | $12.33 | | | $12.85 | |
| Income (loss) from investment operations | | | | | | | | | | | | | | | |
Net investment income (d) | | $0.23 | | | $0.33 | | | $0.31 | | | $0.27 | | | $0.27 | |
Net realized and unrealized gain (loss) on investments
and foreign currency | | 0.84 | | | 0.58 | | | 0.17 | | | (1.11 | ) | | 0.75 | |
Total from investment operations | | $1.07 | | | $0.91 | | | $0.48 | | | $(0.84 | ) | | $1.02 | |
| Less distributions declared to shareholders | | | | | | | | | | | | | | | |
From net investment income | | $(0.92 | ) | | $(0.19 | ) | | $— | | | $(1.20 | ) | | $(1.54 | ) |
From net realized gain on investments | | — | | | — | | | (0.10 | ) | | (0.07 | ) | | — | |
Total distributions declared to shareholders | | $(0.92 | ) | | $(0.19 | ) | | $(0.10 | ) | | $(1.27 | ) | | $(1.54 | ) |
Net asset value, end of period | | $11.47 | | | $11.32 | | | $10.60 | | | $10.22 | | | $12.33 | |
Total return (%) (k)(r)(s) | | 9.93 | | | 8.67 | | | 4.70 | | | (7.49 | ) | | 9.80 | |
Ratios (%) (to average net assets)
and Supplemental data: | | | | | | | | | | | | | | | |
Expenses before expense reductions (f) | | 1.35 | | | 1.33 | | | 1.38 | | | 1.28 | | | 1.23 | |
Expenses after expense reductions (f) | | 1.25 | | | 1.25 | | | 1.25 | | | 1.25 | | | N/A | |
Net investment income | | 2.03 | | | 3.08 | | | 2.96 | | | 2.39 | | | 2.23 | |
Portfolio turnover | | 113 | | | 134 | | | 122 | | | 137 | | | 124 | |
Net assets at end of period (000 Omitted) | | $6,371 | | | $4,063 | | | $3,793 | | | $4,238 | | | $4,832 | |
| (d) | Per share data is based on average shares outstanding. |
| (f) | Ratios do not reflect reductions from fees paid indirectly, if applicable. |
| (k) | The total return does not reflect expenses that apply to separate accounts. Inclusion of these charges would reduce the total return figures for all periods shown. |
| (r) | Certain expenses have been reduced without which performance would have been lower. |
| (s) | From time to time the fund may receive proceeds from litigation settlements, without which performance would be lower. |
See Notes to Financial Statements
14
NOTES TO FINANCIAL STATEMENTS
| (1) | | Business and Organization |
MFS Global Governments Portfolio (the fund) is a series of MFS Variable Insurance Trust II (the trust). The trust is organized as a Massachusetts business trust and is registered under the Investment Company Act of 1940, as amended, as an open-end management investment company. The shares of the fund are sold to variable accounts established by insurance companies to fund benefits under variable contracts issued by such companies, and qualified retirement and pension plans.
| (2) | | Significant Accounting Policies |
General – The preparation of financial statements in conformity with U.S. generally accepted accounting principles requires management to make estimates and assumptions that affect the reported amounts of assets and liabilities, and disclosure of contingent assets and liabilities at the date of the financial statements and the reported amounts of revenues and expenses during the reporting period. Actual results could differ from those estimates. The fund can invest in foreign securities. Investments in foreign securities are vulnerable to the effects of changes in the relative values of the local currency and the U.S. dollar and to the effects of changes in each country’s legal, political, and economic environment.
Investment Valuations – Debt instruments and floating rate loans (other than short-term instruments), including restricted debt instruments, are generally valued at an evaluated or composite bid as reported by a third party pricing service. Short-term instruments with a maturity at issuance of 60 days or less may be valued at amortized cost, which approximates market value. Futures contracts are generally valued at last posted settlement price as reported by a third party pricing service on the market on which they are primarily traded. Futures contracts for which there were no trades that day for a particular position are generally valued at the closing bid quotation as reported by a third party pricing service on the market on which such futures contracts are primarily traded. Forward foreign currency contracts are generally valued at the mean of bid and asked prices for the time period interpolated from rates reported by a third party pricing service for proximate time periods. Securities and other assets generally valued on the basis of information from a third party pricing service may also be valued at a broker-dealer bid quotation. Values obtained from pricing services can utilize both dealer-supplied valuations and electronic data processing techniques, which take into account factors such as institutional-size trading in similar groups of securities, yield, quality, coupon rate, maturity, type of issue, trading characteristics, and other market data. The values of foreign securities and other assets and liabilities expressed in foreign currencies are converted to U.S. dollars using the mean of bid and asked prices for rates reported by a third party pricing service.
The Board of Trustees has delegated primary responsibility for determining or causing to be determined the value of the fund’s investments (including any fair valuation) to the adviser pursuant to valuation policies and procedures approved by the Board. If the adviser determines that reliable market quotations are not readily available, investments are valued at fair value as determined in good faith by the adviser in accordance with such procedures under the oversight of the Board of Trustees. Under the fund’s valuation policies and procedures, market quotations are not considered to be readily available for most types of debt instruments and floating rate loans and many types of derivatives. These investments are generally valued at fair value based on information from third party pricing services. In addition, investments may be valued at fair value if the adviser determines that an investment’s value has been materially affected by events occurring after the close of the exchange or market on which the investment is principally traded (such as foreign exchange or market) and prior to the determination of the fund’s net asset value, or after the halting of trading of a specific security where trading does not resume prior to the close of the exchange or market on which the security is principally traded. The adviser may rely on third party pricing services or other information (such as the correlation with price movements of similar securities in the same or other markets; the type, cost and investment characteristics of the security; the business and financial condition of the issuer; and trading and other market data) to assist in determining whether to fair value and at what value to fair value an investment. The value of an investment for purposes of calculating the fund’s net asset value can differ depending on the source and method used to determine value. When fair valuation is used, the value of investments used to determine the fund’s net asset value may differ from quoted or published prices for the same investments.
The fund adopted FASB Statement No. 157, Fair Value Measurements (the “Statement”). This Statement provides a single definition of fair value, a hierarchy for measuring fair value and expanded disclosures about fair value measurements.
Various inputs are used in determining the value of the fund’s assets or liabilities carried at market value. These inputs are categorized into three broad levels. Level 1 includes quoted prices in active markets for identical assets or liabilities. Level 2 includes other significant observable market-based inputs (including quoted prices for similar securities, interest rates, prepayment speed, and credit risk). Level 3 includes unobservable inputs, which may include the adviser’s own assumptions in determining the fair value of investments. Other financial instruments are derivative instruments not reflected in total
15
Notes to Financial Statements – continued
investments, such as futures, forwards, swap contracts and written options. The following is a summary of the levels used as of December 31, 2008 in valuing the fund’s assets or liabilities carried at market value:
| | | | | | | | |
| | | Level 1 | | Level 2 | | Level 3 | | Total |
| Investments in Securities | | $— | | $41,468,458 | | $— | | $41,468,458 |
| Other Financial Instruments | | $26,075 | | $152,765 | | $— | | $178,840 |
Repurchase Agreements – The fund may enter into repurchase agreements with approved counterparties. Each repurchase agreement is recorded at cost. The fund requires that the securities collateral in a repurchase transaction be transferred to a custodian. The fund monitors, on a daily basis, the value of the collateral to ensure that its value, including accrued interest, is greater than amounts owed to the fund under each such repurchase agreement. The fund and other funds managed by Massachusetts Financial Services Company (MFS), may utilize a joint trading account for the purpose of entering into one or more repurchase agreements.
Inflation-Adjusted Debt Securities – The fund invests in inflation-adjusted debt securities issued by the U.S. Treasury. The fund may also invest in inflation-adjusted debt securities issued by U.S. Government agencies and instrumentalities other than the U.S. Treasury and by other entities such as U.S. and foreign corporations and foreign governments. The principal value of these debt securities is adjusted through income according to changes in the Consumer Price Index or another general price or wage index. These debt securities typically pay a fixed rate of interest, but this fixed rate is applied to the inflation-adjusted principal amount. The principal paid at maturity of the debt security is typically equal to the inflation-adjusted principal amount, or the security’s original par value, whichever is greater. Other types of inflation-adjusted securities may use other methods to adjust for other measures of inflation.
Foreign Currency Translation – Purchases and sales of foreign investments, income, and expenses are converted into U.S. dollars based upon currency exchange rates prevailing on the respective dates of such transactions or on the reporting date for foreign denominated receivables and payables. Gains and losses attributable to foreign currency exchange rates on sales of securities are recorded for financial statement purposes as net realized gains and losses on investments. Gains and losses attributable to foreign exchange rate movements on receivables, payables, income and expenses are recorded for financial statement purposes as foreign currency transaction gains and losses. That portion of both realized and unrealized gains and losses on investments that results from fluctuations in foreign currency exchange rates is not separately disclosed.
Derivative Risk – The fund may invest in derivatives for hedging or non-hedging purposes. While hedging can reduce or eliminate losses, it can also reduce or eliminate gains. When the fund uses derivatives as an investment to gain market exposure, or for hedging purposes, gains and losses from derivative instruments may be substantially greater than the derivative’s original cost. Cash that has been segregated on behalf of certain derivative contracts will be reported separately on the Statement of Assets and Liabilities as restricted cash. On some over-the-counter derivatives, the fund attempts to reduce its exposure to counterparty credit risk by entering into an ISDA Master Agreement on a bilateral basis with each of the counterparties with whom it undertakes a significant volume of transactions. The ISDA Master Agreement gives the fund the right, upon an event of default by the applicable counterparty, to close out all transactions traded under such agreement and to net amounts owed under each transaction to one net amount payable by one party to the other. This right to close out and net payments across all transactions traded under the ISDA Master Agreement could result in a reduction of the fund’s credit risk to such counterparty equal to any amounts payable by the fund under the applicable transactions, if any. However, absent an event of default by the counterparty, the ISDA Master Agreement does not result in an offset of reported balance sheet assets and liabilities across transactions between the fund and the applicable counterparty. Derivative instruments include futures contracts and forward foreign currency exchange contracts.
In March 2008, FASB Statement No. 161, Disclosures about Derivative Instruments and Hedging Activities (the “Standard”) was issued, and is effective for financial statements issued for fiscal years and interim periods beginning after November 15, 2008. This Standard provides enhanced disclosures about the fund’s use of and accounting for derivative instruments and the effect of derivative instruments on the fund’s results of operations and financial position. Management is evaluating the application of the Standard to the fund, and has not at this time determined the impact, if any, resulting from the adoption of this Standard on the fund’s financial statements.
FASB Staff Position (FSP) 133-1 was implemented during the period. FSP 133-1 amends FAS 133 to require sellers of credit derivatives to make disclosures that will enable financial statement users to assess the potential effects of those credit derivatives on an entity’s financial position, financial performance and cash flows. There was no impact from implementing FSP 133-1 as the fund did not hold any of these credit derivatives at period end.
Futures Contracts – The fund may enter into futures contracts for the delayed delivery of securities or currency, or contracts based on financial indices at a fixed price on a future date. In entering such contracts, the fund is required to deposit with the broker either in cash or securities an amount equal to a certain percentage of the contract amount. Subsequent payments are
16
Notes to Financial Statements – continued
made or received by the fund each day, depending on the daily fluctuations in the value of the contract, and are recorded for financial statement purposes as unrealized gains or losses by the fund. Upon entering into such contracts, the fund bears the risk of interest or exchange rates or securities prices moving unexpectedly, in which case, the fund may not achieve the anticipated benefits of the futures contracts and may realize a loss.
Forward Foreign Currency Exchange Contracts – The fund may enter into forward foreign currency exchange contracts for the purchase or sale of a specific foreign currency at a fixed price on a future date. Risks may arise upon entering into these contracts from the potential inability of counterparties to meet the terms of their contracts and from unanticipated movements in the value of the contract. The fund may enter into forward foreign currency exchange contracts for hedging purposes as well as for non-hedging purposes. For hedging purposes, the fund may enter into contracts to deliver or receive foreign currency it will receive from or require for its normal investment activities. The fund may also use contracts in a manner intended to protect foreign currency denominated securities from declines in value due to unfavorable exchange rate movements. For non-hedging purposes, the fund may enter into contracts with the intent of changing the relative exposure of the fund’s portfolio of securities to different currencies to take advantage of anticipated changes. The forward foreign currency exchange contracts are adjusted by the daily exchange rate of the underlying currency and any gains or losses are recorded as unrealized until the contract settlement date. On contract settlement date, the gains or losses are recorded as realized gains or losses on foreign currency transactions.
Indemnifications – Under the fund’s organizational documents, its officers and trustees may be indemnified against certain liabilities and expenses arising out of the performance of their duties to the fund. Additionally, in the normal course of business, the fund enters into agreements with service providers that may contain indemnification clauses. The fund’s maximum exposure under these agreements is unknown as this would involve future claims that may be made against the fund that have not yet occurred.
Investment Transactions and Income – Investment transactions are recorded on the trade date. Interest income is recorded on the accrual basis. All premium and discount is amortized or accreted for financial statement purposes in accordance with U.S. generally accepted accounting principles.
The fund may receive proceeds from litigation settlements. Any proceeds received from litigation involving portfolio holdings are reflected in the Statement of Operations in realized gain/loss if the security has been disposed of by the fund or in unrealized gain/loss if the security is still held by the fund. Any other proceeds from litigation not related to portfolio holdings are reflected as other income in the Statement of Operations.
Fees Paid Indirectly – The fund’s custody fee may be reduced according to an arrangement that measures the value of cash deposited with the custodian by the fund. This amount, for the year ended December 31, 2008, is shown as a reduction of total expenses on the Statement of Operations.
Tax Matters and Distributions – The fund intends to qualify as a regulated investment company, as defined under Subchapter M of the Internal Revenue Code, and to distribute all of its taxable income, including realized capital gains. As a result, no provision for federal income tax is required. Each of the fund’s federal tax returns for the prior three fiscal years remain subject to examination by the Internal Revenue Service. Foreign taxes, if any, have been accrued by the fund in the accompanying financial statements.
Distributions to shareholders are recorded on the ex-dividend date. Income and capital gain distributions are determined in accordance with income tax regulations, which may differ from U.S. generally accepted accounting principles. Certain capital accounts in the financial statements are periodically adjusted for permanent differences in order to reflect their tax character. These adjustments have no impact on net assets or net asset value per share. Temporary differences which arise from recognizing certain items of income, expense, gain or loss in different periods for financial statement and tax purposes will reverse at some time in the future. Distributions in excess of net investment income or net realized gains are temporary overdistributions for financial statement purposes resulting from differences in the recognition or classification of income or distributions for financial statement and tax purposes.
Book/tax differences primarily relate to amortization and accretion of debt securities, wash sale loss deferrals, straddle loss deferrals, foreign currency transactions, and derivative transactions.
The tax character of distributions declared to shareholders for the last two fiscal years is as follows:
| | | | |
| | | 12/31/08 | | 12/31/07 |
| Ordinary income (including any short-term capital gains) | | $3,548,686 | | $832,720 |
17
Notes to Financial Statements – continued
The federal tax cost and the tax basis components of distributable earnings were as follows:
| | | |
| As of 12/31/08 | | | |
| Cost of investments | | $41,717,565 | |
| Gross appreciation | | 1,525,661 | |
| Gross depreciation | | (1,774,768 | ) |
| Net unrealized appreciation (depreciation) | | $(249,107 | ) |
| Undistributed ordinary income | | 4,465,503 | |
| Capital loss carryforwards | | (171,838 | ) |
| Other temporary differences | | (228,877 | ) |
As of December 31, 2008, the fund had capital loss carryforwards available to offset future realized gains. Such losses expire as follows:
| | | |
| 12/31/14 | | $(78,301 | ) |
| 12/31/15 | | (93,537 | ) |
| | $(171,838 | ) |
Multiple Classes of Shares of Beneficial Interest – The fund offers multiple classes of shares, which differ in their respective distribution fees. The fund’s income, realized and unrealized gain (loss), and common expenses are allocated to shareholders based on the daily net assets of each class. Dividends are declared separately for each class. Differences in per share dividend rates are generally due to differences in separate class expenses.
| (3) | | Transactions with Affiliates |
Investment Adviser – The fund has an investment advisory agreement with MFS to provide overall investment management and related administrative services and facilities to the fund. The management fee is computed daily and paid monthly at the following annual rates:
| | |
| First $300 million of average daily net assets | | 0.75% |
| Average daily net assets in excess of $300 million | | 0.675% |
The management fee incurred for the year ended December 31, 2008 was equivalent to an annual effective rate of 0.75% of the fund’s average daily net assets.
The investment adviser has agreed in writing to pay a portion of the fund’s total annual operating expenses, exclusive of interest, taxes, brokerage commissions, and extraordinary expenses, such that the total annual operating expenses of the fund do not exceed 1.25% of the fund’s average daily net assets. MFS’ agreement to limit the fund’s operating expenses is contained in the investment advisory agreement between MFS and the fund and may not be rescinded without shareholder approval. In addition, the investment adviser has voluntarily agreed to pay a portion of the fund’s total annual operating expenses, exclusive of interest, taxes, brokerage commissions, and extraordinary expenses, such that total annual operating expenses do not exceed 1.00% annually of the fund’s average daily net assets attributable to Initial Class shares. This voluntarily agreement may be changed or rescinded at any time by MFS. For the year ended December 31, 2008, this reduction amounted to $40,861 and is reflected as a reduction of total expenses in the Statement of Operations.
Distributor – MFS Fund Distributors, Inc. (MFD), a wholly-owned subsidiary of MFS, is the distributor of shares of the fund. The Trustees have adopted a distribution plan for the Service Class shares pursuant to Rule 12b-1 under the Investment Company Act of 1940.
The fund’s distribution plan provides that the fund will pay MFD distribution fees equal to 0.25% per annum of its average daily net assets attributable to Service Class shares as partial consideration for services performed and expenses incurred by MFD and financial intermediaries (including participating insurance companies that invest in the fund to fund variable annuity and variable life insurance contracts, sponsors of qualified retirement and pension plans that invest in the fund, and affiliates of these participating insurance companies and plan sponsors) in connection with the sale and distribution of the Service Class shares. MFD may subsequently pay all, or a portion, of the distribution fees to financial intermediaries.
Shareholder Servicing Agent – MFS Service Center, Inc. (MFSC), a wholly-owned subsidiary of MFS, has contracted to provide transfer agent and recordkeeping functions in connection with the issuance, transfer, and redemption of each class of shares of the fund under a Shareholder Servicing Agent Agreement. During the year ended December 31, 2008, the fund did not pay MFSC a fee for this service.
Administrator – MFS provides certain financial, legal, shareholder communications, compliance, and other administrative services to the fund. Under an administrative services agreement, the fund partially reimburses MFS the costs incurred to provide these services. The fund is charged an annual fixed amount of $10,000 plus a fee based on average daily net assets.
18
Notes to Financial Statements – continued
The administrative services fee incurred for the year ended December 31, 2008 was equivalent to an annual effective rate of 0.0295% of the fund’s average daily net assets.
Trustees’ and Officers’ Compensation – The fund pays compensation to trustees in the form of a retainer, attendance fees, and additional compensation to the Board chairperson. The fund does not pay compensation directly to officers of the fund who are also officers of the investment adviser, all of whom receive remuneration for their services to the fund from MFS. Certain officers of the fund are officers or directors of MFS, MFD, and MFSC.
Other – This fund and certain other MFS funds (the funds) have entered into services agreements (the Agreements) which provide for payment of fees by the funds to Tarantino LLC and Griffin Compliance LLC in return for the provision of services of an Independent Chief Compliance Officer (ICCO) and Assistant ICCO, respectively, for the funds. The ICCO and Assistant ICCO are officers of the funds and the sole members of Tarantino LLC and Griffin Compliance LLC, respectively. The funds can terminate the Agreements with Tarantino LLC and Griffin Compliance LLC at any time under the terms of the Agreements. MFS has agreed to bear all expenses associated with office space, other administrative support, and supplies provided to the ICCO and Assistant ICCO. For the year ended December 31, 2008, the aggregate fees paid by the fund to Tarantino LLC and Griffin Compliance LLC were $442 and are included in miscellaneous expense on the Statement of Operations.
Purchases and sales of investments, other than purchased option transactions and short-term obligations, were as follows:
| | | | |
| | | Purchases | | Sales |
| U.S. Government securities | | $20,795,103 | | $19,993,835 |
| Investments (non-U.S. Government securities) | | $21,904,272 | | $21,348,877 |
| (5) | | Shares of Beneficial Interest |
The fund’s Declaration of Trust permits the Trustees to issue an unlimited number of full and fractional shares of beneficial interest. Transactions in fund shares were as follows:
| | | | | | | | | | | | |
| | | Year ended 12/31/08 | | | Year ended 12/31/07 | |
| | | Shares | | | Amount | | | Shares | | | Amount | |
| Shares sold | | | | | | | | | | | | |
Initial Class | | 772,478 | | | $8,906,496 | | | 358,978 | | | $3,895,230 | |
Service Class | | 451,093 | | | 5,027,476 | | | 71,703 | | | 777,100 | |
| | 1,223,571 | | | $13,933,972 | | | 430,681 | | | $4,672,330 | |
| Shares issued to shareholders in reinvestment of distributions | | | | | | | | | | | | |
Initial Class | | 284,565 | | | $3,124,520 | | | 72,417 | | | $767,617 | |
Service Class | | 38,986 | | | 424,166 | | | 6,188 | | | 65,103 | |
| | 323,551 | | | $3,548,686 | | | 78,605 | | | $832,720 | |
| Shares reacquired | | | | | | | | | | | | |
Initial Class | | (1,081,689 | ) | | $(12,174,656 | ) | | (936,883 | ) | | $(10,085,772 | ) |
Service Class | | (293,668 | ) | | (3,220,409 | ) | | (76,814 | ) | | (818,569 | ) |
| | (1,375,357 | ) | | $(15,395,065 | ) | | (1,013,697 | ) | | $(10,904,341 | ) |
| Net change | | | | | | | | | | | | |
Initial Class | | (24,646 | ) | | $(143,640 | ) | | (505,488 | ) | | $(5,422,925 | ) |
Service Class | | 196,411 | | | 2,231,233 | | | 1,077 | | | 23,634 | |
| | 171,765 | | | $2,087,593 | | | (504,411 | ) | | $(5,399,291 | ) |
The fund and other funds managed by MFS participate in a $1 billion unsecured committed line of credit provided by a syndication of banks under a credit agreement. In addition, the fund and other funds managed by MFS have established uncommitted borrowing arrangements with certain banks. Borrowings may be made for temporary financing needs. Interest is charged to the fund, based on its borrowings, generally at a rate equal to the Federal Reserve funds rate plus 0.30%. In addition, a commitment fee, based on the average daily, unused portion of the committed line of credit, is allocated among the participating funds at the end of each calendar quarter. For the year ended December 31, 2008, the fund’s commitment fee and interest expense were $234 and $0, respectively, and are included in miscellaneous expense on the Statement of Operations.
19
REPORT OF INDEPENDENT REGISTERED PUBLIC ACCOUNTING FIRM
To the Board of Trustees of MFS Variable Insurance Trust II and the Shareholders of
MFS Global Governments Portfolio:
We have audited the accompanying statement of assets and liabilities, including the portfolio of investments, of MFS Global Governments Portfolio (the “Fund”) (one of the portfolios comprising MFS Variable Insurance Trust II) as of December 31, 2008, and the related statement of operations for the year then ended, the statements of changes in net assets for each of the two years in the period then ended, and the financial highlights for each of the five years in the period then ended. These financial statements and financial highlights are the responsibility of the Fund’s management. Our responsibility is to express an opinion on these financial statements and financial highlights based on our audits.
We conducted our audits in accordance with the standards of the Public Company Accounting Oversight Board (United States). Those standards require that we plan and perform the audit to obtain reasonable assurance about whether the financial statements and financial highlights are free of material misstatement. The Fund is not required to have, nor were we engaged to perform, an audit of its internal control over financial reporting. Our audits included consideration of internal control over financial reporting as a basis for designing audit procedures that are appropriate in the circumstances, but not for the purpose of expressing an opinion on the effectiveness of the Fund’s internal control over financial reporting. Accordingly, we express no such opinion. An audit also includes examining, on a test basis, evidence supporting the amounts and disclosures in the financial statements, assessing the accounting principles used and significant estimates made by management, as well as evaluating the overall financial statement presentation. Our procedures included confirmation of securities owned as of December 31, 2008, by correspondence with the custodian and brokers; where replies were not received from brokers, we performed other auditing procedures. We believe that our audits provide a reasonable basis for our opinion.
In our opinion, the financial statements and financial highlights referred to above present fairly, in all material respects, the financial position of MFS Global Governments Portfolio as of December 31, 2008, the results of its operations for the year then ended, the changes in its net assets for each of the two years in the period then ended, and the financial highlights for each of the five years in the period then ended, in conformity with accounting principles generally accepted in the United States of America.
DELOITTE & TOUCHE LLP
Boston, Massachusetts
February 19, 2009
20
TRUSTEES AND OFFICERS – IDENTIFICATION AND BACKGROUND
The Trustees and officers of the Trust, as of February 1, 2009, are listed below, together with their principal occupations during the past five years. (Their titles may have varied during that period.) The address of each Trustee and officer is 500 Boylston Street, Boston, Massachusetts 02116.
| | | | | | |
Name, Date of Birth | | Position(s) Held
with Fund | | Trustee/Officer
Since (1) | | Principal Occupations During the Past Five Years and
Other Directorships (2) |
| INTERESTED TRUSTEE | | | | |
David D. Horn (3) (born 6/07/41) | | Trustee | | April 1986 | | Private investor; Sun Life Assurance Company of Canada, Senior Vice President and General Manager for the United States (until 1997); Director (until March 2004) |
| | |
| INDEPENDENT TRUSTEES | | | | |
J. Kermit Birchfield (born 1/08/40) | | Chairman | | May 1997 | | Consultant; Century Partners, Inc. (investments), Director; Displaytech, Inc. (technology), Director; Dessin Fournir LLC (furniture manufacturer), Director (2005 to present); Intermountain Gas Company, Inc. & Intermountain Industries, Inc. (oil & gas exploration and production), Director; Site Watch LLC (software to monitor oil tanks), Managing Director (2006 to present); Juridica Investments (fund investing in judicial matters), Director (2007 to present); HPSC, Inc. (medical financing), Director (until January 2004) |
| | | |
Robert C. Bishop (born 1/13/43) | | Trustee | | May 2001 | | AutoImmune, Inc. (pharmaceutical product development), Chairman, President and Chief Executive Officer; Caliper Life Sciences Corp. (laboratory analytical instruments), Director; Millipore Corporation (purification/filtration products), Director; Waterstreet Capital (leverage buyouts), Advisory Board (August 2006 to present); Optobionics Corporation (ophthalmic devices), Director (2002 to 2007) |
| | | |
Frederick H. Dulles (born 3/12/42) | | Trustee | | May 2001 | | Ten State International Law PLLC (law firm), Of Counsel (since 2006); Prudential Carolina Real Estate, (real estate), Broker (since 2006); Free Enterprise Foundation, Inc. (research institute), Director & Secretary (until 2008); Disher, Hamrick & Myers Residential, Inc. (real estate) Broker (2005 until 2006); Frederick H. Dulles law practice (until 2006); Ten State Street LLP (law firm), Member (until 2005) |
| | | |
Marcia A. Kean (born 6/30/48) | | Trustee | | April 2005 | | Feinstein Kean Healthcare (consulting), Chief Executive Officer |
| | | |
Ronald G. Steinhart (born 6/15/40) | | Trustee | | May 2001 | | Private investor; Penske Automotive Group (automotive retailer), Director; Animal Health International, Inc. (animal health products), Director (since 2007); Texas Industries (concrete/aggregates/cement), Director (since 2007); Penson Worldwide, Inc. (securities clearance), Director (since 2006); Carreker Corporation (technology consulting) Director (until 2005); Prentiss Properties Trust (real estate investment trust), Director (until 2006) |
| | | |
Haviland Wright (born 7/21/48) | | Trustee | | May 2001 | | Profitability of Hawaii (software), Chief Development Officer (since December 2008); Elixir Technologies Corporation (software) Director (since 2005); Nano Loa Inc. (liquid crystal displays), Director |
| | |
| TRUSTEE EMERITUS | | | | |
Samuel Adams (born 10/19/25) | | Trustee Emeritus | | | | Retired; K&L Gates LLP (law firm), Of Counsel |
| | |
| OFFICERS | | | | |
Maria F. Dwyer (4) (born 12/01/58) | | President | | November 2005 | | Massachusetts Financial Services Company, Executive Vice President and Chief Regulatory Officer (since March 2004) Chief Compliance Officer (since December 2006); Fidelity Management & Research Company, Vice President (prior to March 2004); Fidelity Group of Funds, President and Treasurer (until March 2004) |
| | | |
Christopher R. Bohane (4) (born 1/18/74) | | Assistant Secretary and Assistant Clerk | | July 2005 | | Massachusetts Financial Services Company, Vice President and Senior Counsel |
| | | |
John M. Corcoran (4) (born 4/13/65) | | Treasurer | | October 2008 | | Massachusetts Financial Services Company, Senior Vice President (since October 2008); State Street Bank and Trust (financial services provider), Senior Vice President, (until September 2008) |
| | | |
Ethan D. Corey (4) (born 11/21/63) | | Assistant Secretary and Assistant Clerk | | July 2005 | | Massachusetts Financial Services Company, Senior Vice President and Associate General Counsel (since 2004); Dechert LLP (law firm), Counsel (prior to December 2004) |
| | | |
David L. DiLorenzo (4) (born 8/10/68) | | Assistant Treasurer | | July 2005 | | Massachusetts Financial Services Company, Vice President (since June 2005); JP Morgan Investor Services, Vice President (until June 2005) |
| | | |
Timothy M. Fagan (4) (born 7/10/68) | | Assistant Secretary and Assistant Clerk | | September 2005 | | Massachusetts Financial Services Company, Vice President and Senior Counsel (since September 2005); John Hancock Advisers, LLC, Vice President, Senior Attorney and Chief Compliance Officer (until August 2005) |
21
Trustees and Officers – continued
| | | | | | |
Name, Date of Birth | | Position(s) Held
with Fund | | Trustee/Officer
Since (1) | | Principal Occupations During the Past Five Years and
Other Directorships (2) |
Mark D. Fischer (4) (born 10/27/70) | | Assistant Treasurer | | July 2005 | | Massachusetts Financial Services Company, Vice President (since May 2005); JP Morgan Investment Management Company, Vice President (until May 2005) |
| | | |
Robyn L. Griffin (born 7/04/75) | | Assistant Independent Chief Compliance Officer | | August 2008 | | Griffin Compliance LLC (provider of compliance services), Principal (since August 2008); State Street Corporation (financial services provider), Mutual Fund Administration Assistant Vice President (October 2006 – July 2008); Liberty Mutual Group (insurance), Personal Market Assistant Controller (April 2006 – October 2006); Deloitte & Touche LLP (professional services firm), Senior Manager (prior to April 2006) |
| | | |
Brian E. Langenfeld (4) (born 3/07/73) | | Assistant Secretary and Assistant Clerk | | May 2006 | | Massachusetts Financial Services Company, Vice President and Senior Counsel (since May 2006); John Hancock Advisers, LLC, Assistant Vice President and Counsel (until April 2006) |
| | | |
Ellen Moynihan (4) (born 11/13/57) | | Assistant Treasurer | | May 1997 | | Massachusetts Financial Services Company, Senior Vice President |
| | | |
Susan S. Newton (4) (born 3/07/50) | | Assistant Secretary and Assistant Clerk | | May 2005 | | Massachusetts Financial Services Company, Senior Vice President and Associate General Counsel (since April 2005); John Hancock Advisers, LLC, Senior Vice President, Secretary and Chief Legal Officer (until April 2005) |
| | | |
Susan A. Pereira (4) (born 11/05/70) | | Assistant Secretary and Assistant Clerk | | July 2005 | | Massachusetts Financial Services Company, Vice President and Senior Counsel (since June 2004); Bingham McCutchen LLP (law firm), Associate (until June 2004) |
| | | |
Mark N. Polebaum (4) (born 5/01/52) | | Secretary and Clerk | | February 2006 | | Massachusetts Financial Services Company, Executive Vice President, General Counsel and Secretary (since January 2006); Wilmer Cutler Pickering Hale and Dorr LLP (law firm), Partner (until January 2006) |
| | | |
Frank L. Tarantino (born 3/07/44) | | Independent Chief Compliance Officer | | September 2004 | | Tarantino LLC (provider of compliance services), Principal (since June 2004); CRA Business Strategies Group (consulting services), Executive Vice President (until June 2004) |
| | | |
Richard S. Weitzel (4) (born 7/16/70) | | Assistant Secretary and Assistant Clerk | | October 2007 | | Massachusetts Financial Services Company, Vice President and Assistant General Counsel (since 2004); Massachusetts Department of Business and Technology, General Counsel (until April 2004) |
| | | |
James O. Yost (4) (born 6/12/60) | | Assistant Treasurer | | April 1992 | | Massachusetts Financial Services Company, Senior Vice President |
| (1) | Date first appointed to serve as Trustee/Officer of an MFS fund or a Compass variable account. Each Trustee has served continuously since appointment. |
| (2) | Directorships or trusteeships of companies required to report to the Securities and Exchange Commission (i.e., “public companies”). |
| (3) | “Interested person” of the Trust, within the meaning of the Investment Company Act of 1940 (referred to as the 1940 Act), which is the principal federal law governing investment companies like the Trust, as a result of position with Sun Life of Canada (U.S.). The address of Sun Life of Canada (U.S.) is One Sun Life Executive Park, Wellesley Hills, Massachusetts 02481. |
| (4) | “Interested person” of MFS within the meaning of the 1940 Act. The address of MFS is 500 Boylston Street, Boston, Massachusetts 02116. |
The Trust does not hold annual meetings for the purpose of electing Trustees, and Trustees are not elected for fixed terms. Each Trustee and officer holds office until his or her successor is chosen and qualified, or until his or her earlier death, resignation, retirement or removal.
All Trustees currently serve as Trustees of the Trust and have served in that capacity since originally elected or appointed. All of the Trustees are also Managers of the Compass Variable Accounts. The executive officers of the Trust hold similar offices for the Compass Variable Accounts and other funds in the MFS fund complex. As of January 1, 2009, each Trustee serves as a Trustee or Manager of 35 Accounts/Funds.
The Statement of Additional Information contains further information about the Trustees and is available without charge upon request by calling 1-800-752-7215.
| | |
Investment Adviser
Massachusetts Financial Services Company 500 Boylston Street, Boston, MA 02116-3741 | | Custodian State Street Bank and Trust 1 Lincoln Street, Boston, MA 02111-2900 |
Distributor
MFS Fund Distributors, Inc. 500 Boylston Street, Boston, MA 02116-3741 | | Independent Registered Public Accounting Firm Deloitte & Touche LLP 200 Berkeley Street, Boston, MA 02116 |
Portfolio Managers Matthew Ryan Erik Weisman | | |
22
BOARD REVIEW OF INVESTMENT ADVISORY AGREEMENT
The Investment Company Act of 1940 requires that both the full Board of Trustees and a majority of the non-interested (“independent”) Trustees, voting separately, annually approve the continuation of the investment advisory agreement between MFS Variable Insurance Trust II (the “Trust”) and Massachusetts Financial Services Company (“MFS”) on behalf of the Fund. The Trustees consider matters bearing on the Fund and the advisory arrangements at their meetings throughout the year, including a review of performance data at each regular meeting. In addition, the independent Trustees met in May and again in July 2008 (“contract review meetings”) for the specific purpose of considering whether to approve the continuation of the investment advisory agreement for the Fund. The independent Trustees were assisted in their evaluation of the investment advisory agreement by independent legal counsel, from whom they received separate legal advice and with whom they met separately from MFS management during various contract review meetings. The independent Trustees were also assisted in this process by the Fund’s Independent Chief Compliance Officer, a full-time senior officer appointed by and reporting to the independent Trustees.
In connection with their deliberations, the Trustees, including the independent Trustees, considered such information and factors as they believed, in light of the legal advice furnished to them and their own business judgment, to be relevant. The investment advisory agreement was considered separately for the Fund, although the Trustees also took into account the common interests of all Funds in the Trust in their review. As described below, the Trustees considered the nature, quality, and extent of the various investment advisory, administrative, and shareholder services performed by MFS under the existing investment advisory agreement and other arrangements with the Trust.
In connection with their contract review meetings, the Trustees received and relied upon materials which included, among other items: (i) information provided by Lipper Inc. on the investment performance of the Fund for various time periods ended December 31, 2007, compared to the investment performance of a group of funds with substantially similar investment classifications/objectives (the “Lipper performance universe”), (ii) information provided by Lipper Inc. on the Fund’s advisory fees and other expenses compared to the advisory fees and other expenses of comparable funds identified by Lipper (the “Lipper expense group”), (iii) information provided by MFS on the advisory fees of comparable portfolios of its other clients, including institutional separate account and other clients, (iv) information as to whether expense waivers, reimbursements or fee “breakpoints” are observed for the Fund, (v) information regarding MFS’ financial results and financial condition, including MFS’ and certain of its affiliates’ estimated profitability from services performed for the Fund, (vi) MFS’ views regarding the outlook for the mutual fund industry and its strategic business plans, (vii) descriptions of various functions performed by MFS for the Trust, such as compliance monitoring and portfolio trading practices, and (viii) information regarding the overall organization of MFS, including information about MFS’ senior management and other personnel providing investment advisory, administrative and other services to the Fund. The comparative performance, fee and expense information prepared and provided by Lipper Inc. was not independently verified, and the independent Trustees did not independently verify any information provided to them by MFS.
The Trustees’ conclusion as to the continuation of the investment advisory agreement was based on comprehensive consideration of all information provided to the Trustees and not the result of any single factor. Some of the factors that figured particularly in the Trustees’ deliberations are described below for the Fund, while individual Trustees may have given different weight to various factors and evaluated the information presented as a whole differently than another Trustee. The Trustees recognized that the fee arrangements for the Fund reflect years of review and discussion between the independent Trustees and MFS, that certain aspects of such arrangements may receive greater scrutiny in some years than others, and that the Trustees’ conclusions may be based, in part, on their consideration of these same arrangements during the course of the year and in prior years.
Based on information provided by Lipper Inc., the Trustees compared the Fund’s total return investment performance to the performance of a peer group of funds over various time periods. The Trustees placed particular emphasis on the total return performance of the Fund’s Initial Class shares in comparison to the performance of funds in its Lipper performance universe over the one-, three- and five-year periods. The Trustees did not rely on performance results for more recent periods, including those shown elsewhere in this report.
The Trustees noted the performance of the Fund’s Initial Class shares was in the 3rd quintile relative to the other funds in the Lipper Classification Index for the one-year period (the 1st quintile being the best performers and the 5th quintile being the worst performers). The total return performance of the Fund was in the 5th quintile for the three-year period and the 4th quintile for the five-year period ended December 31, 2007, relative to the Lipper performance universe. Based on the nature and quality of services provided by MFS, the Board of Trustees concluded that the Fund’s performance was adequate.
In the course of their deliberations, the Trustees took into account information provided by MFS during contract review meetings, as well as during investment review meetings conducted with portfolio management personnel during the course of the year.
23
Board Review of Investment Advisory Agreement – continued
In assessing the reasonableness of the Fund’s advisory fee, the Trustees considered, among other information, the Fund’s advisory fee and the total expense ratio of the Fund’s Initial Class shares as a percentage of average daily net assets, compared to the advisory fee and total expense ratios of its peer group of funds based on information provided by Lipper Inc. The Trustees also considered the advisory fees charged by MFS to institutional accounts. In comparing these fees, the Trustees considered the generally broader scope of services provided by MFS to the Trust than those provided to institutional accounts. The Trustees also considered the higher demands placed on MFS’ investment personnel and trading infrastructure as a result of the daily cash in-flows and out-flows of the Fund, and the impact on MFS and related expenses due to the more extensive regulatory regime to which the Fund is subject, compared to institutional accounts.
In considering the fees, the Trustees noted from the Lipper data that the Fund’s effective advisory fee rate was at the median and total expense ratio was approximately at the median of such fees and expenses of funds in the Lipper expense group. In addition, the Trustees noted that MFS currently observes an expense limitation for the Fund. The Trustees further concluded that the existing breakpoint was sufficient to allow the Fund to benefit from economies of scale as its assets grow. The Trustees concluded that the fees were reasonable in light of the nature and quality of services provided.
The Trustees also considered information prepared by MFS relating to its costs and profits with respect to the Fund and other investment companies and accounts advised by MFS, as well as MFS’ methodologies used to determine and allocate its costs to the Fund and other accounts and products for purposes of estimating profitability.
After reviewing these and other factors described below, the Trustees concluded that the advisory fees charged to the Fund represent reasonable compensation in light of the nature and quality of the services being provided by MFS.
In addition, the Trustees considered MFS’ resources and related efforts to continue to retain, attract and motivate capable personnel to serve the Fund. The Trustees also considered the financial resources of MFS and its parent, Sun Life Financial Inc. The Trustees further considered any advantages and possible disadvantages of having an adviser which also serves other investment companies as well as institutional accounts.
The Trustees also considered the nature, quality, cost, and extent of administrative, transfer agency, and distribution services provided to the Fund by MFS and its affiliates under agreements and plans other than the investment advisory agreement, including the 12b-1 fees the Fund pays to MFS Fund Distributors, Inc., an affiliate of MFS. The Trustees also considered the nature, extent and quality of certain other services MFS performs or arranges on the Fund’s behalf, which may include securities lending programs, directed expense payment programs, class action recovery programs, and MFS’ interaction with third-party service providers, principally custodians and sub-custodians. The Trustees concluded that the various non-advisory services provided by MFS and its affiliates on behalf of the Fund were satisfactory. The Trustees also considered the benefits to MFS from the use of the Fund’s portfolio brokerage commissions to pay for research and other similar services and various other factors. Additionally, the Trustees considered so-called “fall-out benefits” to MFS such as reputational value derived from serving as investment manager to the Trust, and determined that any such benefits derived by MFS were reasonable and fair.
Based on their evaluation of factors that they deemed to be material, including those factors described above, the Board of Trustees, including a majority of the independent Trustees, concluded that the investment advisory agreement should be continued for an additional one-year period, commencing September 1, 2008.
A discussion regarding the Board’s most recent review and renewal of the fund’s Investment Advisory Agreement with MFS is available by clicking on the fund’s name under “Variable Insurance Portfolios-VIT II” in the “Products & Performance” section on the MFS Web site (mfs.com).
24
PROXY VOTING POLICIES AND INFORMATION
A general description of the MFS funds’ proxy voting policies and procedures is available without charge, upon request, by calling
1-800-225-2606, by visiting the Proxy Voting section of mfs.com or by visiting the SEC’s Web site at http://www.sec.gov.
Information regarding how the fund voted proxies relating to portfolio securities during the most recent twelve-month period ended June 30 is available without charge by visiting the Proxy Voting section of mfs.com or by visiting the SEC’s Web site at http://www.sec.gov.
QUARTERLY PORTFOLIO DISCLOSURE
The fund will file a complete schedule of portfolio holdings with the Securities and Exchange Commission (the Commission) for the first and third quarters of each fiscal year on Form N-Q. The fund’s Form N-Q may be reviewed and copied at the:
Public Reference Room
Securities and Exchange Commission
100 F Street, NE, Room 1580
Washington, D.C. 20549
Information on the operation of the Public Reference Room may be obtained by calling the Commission at 1-800-SEC-0330. The fund’s Form N-Q is available on the EDGAR database on the Commission’s Internet Web site at http://www.sec.gov, and copies of this information may be obtained, upon payment of a duplicating fee, by electronic request at the following e-mail address: publicinfo@sec.gov or by writing the Public Reference Section at the above address.
25
MFS® PRIVACY NOTICE
Privacy is a concern for every investor today. At MFS Investment Management® and the MFS funds, we take this concern very seriously. We want you to understand our policies about the investment products and services that we offer, and how we protect the nonpublic personal information of investors who have a direct relationship with us and our wholly owned subsidiaries.
Throughout our business relationship, you provide us with personal information. We maintain information and records about you, your investments, and the services you use. Examples of the nonpublic personal information we maintain include
| | Ÿ | | data from investment applications and other forms |
| | Ÿ | | share balances and transactional history with us, our affiliates, or others |
| | Ÿ | | facts from a consumer reporting agency |
We do not disclose any nonpublic personal information about our customers or former customers to anyone, except as permitted by law. We may share nonpublic personal information with third parties or certain of our affiliates in connection with servicing your account or processing your transactions. We may share information with companies or financial institutions that perform marketing services on our behalf or with other financial institutions with which we have joint marketing arrangements, subject to any legal requirements.
Authorization to access your nonpublic personal information is limited to appropriate personnel who provide products, services, or information to you. We maintain physical, electronic, and procedural safeguards to help protect the personal information we collect about you.
If you have any questions about the MFS privacy policy, please call 1-800-225-2606 any business day between 8 a.m. and 8 p.m. Eastern time.
Note: If you own MFS products or receive MFS services in the name of a third party such as a bank or broker-dealer, their privacy policy may apply to you instead of ours.
26

MFS® HIGH YIELD PORTFOLIO
The report is prepared for the general information of contract owners. It is authorized for distribution to prospective investors only when preceded or accompanied by a current prospectus.
NOT FDIC INSURED Ÿ MAY LOSE VALUE Ÿ NO BANK GUARANTEE Ÿ NOT A DEPOSIT Ÿ NOT INSURED BY ANY FEDERAL GOVERNMENT AGENCY OR NCUA/NCUSIF
LETTER FROM THE CEO

Dear Contract Owners:
The market downturns and economic setbacks of late probably rank among the worst financial declines most of us have experienced. Inevitably, people may be questioning their commitment to investing. Still, it is important to remember that downturns are an inescapable part of the business cycle. Such troughs have been seen before, and if we can use history as a guide, market recoveries typically have followed.
Recent events have clearly shown us the value of certain types of investments. In this environment, two of the hallmarks of mutual funds — transparency and liquidity — have become critically important. Unlike some other types of investments, the operations of mutual funds are relatively transparent to their shareholders. With their daily redemption feature, mutual funds also generally provide easy, convenient access to one’s money. Through these recent market upheavals, this level of liquidity enhanced the ability of mutual fund investors to respond and modify their investments as they and their advisors saw fit — a flexibility that those in less liquid investments simply did not have at their disposal.
At MFS® we take particular pride in how well mutual funds can serve investors because we invented the mutual fund in the United States. Established in 1924, Massachusetts Investors Trust was the nation’s first fund. Recent market events only reinforce what we have learned through 85 years — that mutual funds provide unique features that are important to investors in any type of market climate.
Respectfully,

Robert J. Manning
Chief Executive Officer and Chief Investment Officer
MFS Investment Management®
February 17, 2009
The opinions expressed in this letter are subject to change, may not be relied upon for investment advice, and no forecasts can be guaranteed.
Before investing, consider the fund’s investment objectives, risks, charges, and expenses. For a prospectus containing this and other information, contact your investment professional or view online. Read it carefully.
MFS Fund Distributors, Inc., 500 Boylston Street, Boston, MA 02116
1
PORTFOLIO COMPOSITION
Portfolio structure (i)
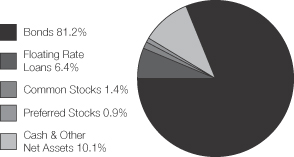
| | |
| Top five industries (i) | | |
| Medical & Health Technology & Services | | 8.7% |
| Utilities – Electric Power | | 7.4% |
| Energy – Independent | | 5.4% |
| Gaming & Lodging | | 5.1% |
| Automotive | | 4.7% |
| | |
| Credit quality of bonds (r) | | |
| AAA | | 4.2% |
| AA | | 0.9% |
| A | | 2.3% |
| BBB | | 1.6% |
| BB | | 24.6% |
| B | | 47.0% |
| CCC | | 15.8% |
| CC | | 0.6% |
| C | | 0.1% |
| D | | 0.2% |
| Not Rated | | 2.7% |
| |
| Portfolio facts | | |
| Average Duration (d)(i) | | 3.2 |
| Average Life (i)(m) | | 5.3 yrs. |
| Average Maturity (i)(m) | | 7.0 yrs. |
| Average Credit Quality of Rated Securities (long-term) (a) | | B+ |
| Average Credit Quality of Rated Securities (short-term) (a) | | A-1 |
| (a) | The average credit quality of rated securities is based upon a market weighted average of portfolio holdings that are rated by public rating agencies. |
| (d) | Duration is a measure of how much a bond’s price is likely to fluctuate with general changes in interest rates, e.g., if rates rise 1.00%, a bond with a 5-year duration is likely to lose about 5.00% of its value. |
| (i) | For purposes of this presentation, the bond component includes accrued interest amounts and may be positively or negatively impacted by the equivalent exposure from any derivative holdings, if applicable. |
| (m) | The average maturity shown is calculated using the final stated maturity on the portfolio’s holdings without taking into account any holdings which have been pre-refunded or pre-paid to an earlier date or which have a mandatory put date prior to the stated maturity. The average life shown takes into account these earlier dates. |
| (r) | Each security is assigned a rating from Moody’s Investors Service. If not rated by Moody’s, the rating will be that assigned by Standard & Poor’s. Likewise, if not assigned a rating by Standard & Poor’s, it will be based on the rating assigned by Fitch, Inc. For those portfolios that hold a security which is not rated by any of the three agencies, the security is considered Not Rated. Holdings in U.S. Treasuries and government agency mortgage-backed securities, if any, are included in the “AAA”-rating category. Percentages are based on the total market value of investments as of 12/31/08. |
Percentages are based on net assets as of 12/31/08, unless otherwise noted.
The portfolio is actively managed and current holdings may be different.
2
MANAGEMENT REVIEW
Summary of Results
For the twelve months ended December 31, 2008, Initial Class shares of the MFS High Yield Portfolio (the “fund”) provided a total return of –29.50%, while Service Class shares of the fund provided a total return of –29.64%. These compare with a return of
–26.16% for the fund’s benchmark, the Barclays Capital U.S. High-Yield Corporate Bond Index.
Market Environment
The U.S. economy and financial markets experienced significant deterioration and extraordinary volatility over the reporting period. U.S. economic growth slowed significantly, despite the short-term bounce from the second quarter fiscal stimulus. Strong domestic headwinds included accelerated deterioration in the housing market, anemic corporate investment, a rapidly declining job market, and a much tighter credit environment. During the period, a seemingly continuous series of tumultuous financial events hammered markets, including: the distressed sale of failing Bear Stearns to JPMorgan, the conservatorship of Government Sponsored Enterprises (GSEs) Fannie Mae and Freddie Mac, the bankruptcy of investment bank Lehman Brothers, the Federal Reserve Bank’s complex intervention of insurance company American International Group (AIG), the nationalization of several large European banks, the failure of Washington Mutual, and the distressed sale of Wachovia. As a result of this barrage of turbulent news, global equity markets pushed significantly lower and credit markets witnessed the worst dislocation since the beginning of the credit crisis. Though conditions improved towards the end of the period, the state of financial and macroeconomic dislocation remained severe.
While reasonably resilient during the first half of the period, the global economy and financial system increasingly experienced considerable negative spillovers from the U.S. slowdown. Not only did Europe and Japan show obvious signs of economic softening, the more powerful engine of global growth – emerging markets – also displayed weakening dynamics.
During the reporting period, the U.S. Federal Reserve Board cut interest rates aggressively and introduced a multitude of new lending facilities to alleviate ever-tightening credit markets, while the U.S. federal government moved quickly to design and implement a meaningful fiscal stimulus package. Although several other global central banks also cut rates, the dilemma of rising energy and food prices heightened concerns among central bankers that inflationary expectations might become unhinged despite weaker growth. Only later in the reporting period did slowing global growth result in a very precipitous decline in commodity prices, which significantly eased inflation and inflationary expectations. As inflationary concerns diminished in the face of global deleveraging, and equity and credit markets deteriorated more sharply, a coordinated rate cut marked the beginning of much more aggressive easing by the major global central banks.
Detractors from Performance
Relative to the Barclays Capital U.S. High-Yield Corporate Bond Index, the fund’s greater exposure to “B” rated (s) securities detracted from performance as credit spreads widened over the reporting period.
Greater exposures to the financial and banking sectors also held back relative results as holdings within these sectors suffered amid the global credit crisis. Debt holdings of financial services company Nuveen were among the fund’s top relative detractors for the reporting period.
Among individual securities, holdings of media companies Dex Media West and Idearc hindered relative performance. Gaming and lodging companies Harrah’s, Station Casinos, Trump Entertainment, and Fontainebleau also hurt relative returns. Holdings of television broadcasting company Newport Television were also among the fund’s top detractors.
Contributors to Performance
The fund’s lesser exposures to “BB” and “CCC” rated securities contributed to relative performance as lower quality securities underperformed higher quality issues over the reporting period.
3
Management Review – continued
Top individual contributors during the reporting period included the debt of hospital operators Hospital Corporation of America (HCA) and Community Health Systems, global finance firm GMAC LLC, power generation company NRG Energy, wireless telecommunications network operator Alltel, airline carrier Continental Airlines, and health care services company DaVita.
Respectfully,
| | |
| John Addeo | | David Cole |
| Portfolio Manager | | Portfolio Manager |
| (s) | Bonds rated “BBB”, “Baa”, or higher are considered investment grade; bonds rated “BB”, “Ba”, or below are considered non-investment grade. The primary source for bond quality ratings is Moody’s Investors Service. If not available, ratings by Standard & Poor’s are used, else ratings by Fitch, Inc. For securities which are not rated by any of the three agencies, the security is considered Not Rated. |
The views expressed in this report are those of the portfolio managers only through the end of the period of the report as stated on the cover and do not necessarily reflect the views of MFS or any other person in the MFS organization. These views are subject to change at any time based on market or other conditions, and MFS disclaims any responsibility to update such views. These views may not be relied upon as investment advice or an indication of trading intent on behalf of any MFS portfolio. References to specific securities are not recommendations of such securities, and may not be representative of any MFS portfolio’s current or future investments.
4
PERFORMANCE SUMMARY THROUGH 12/31/08
The following chart illustrates the historical performance of the fund in comparison to its benchmark(s). Benchmark comparisons are unmanaged; do not reflect any fees or expenses; and cannot be invested in directly. The performance of other share classes will be greater than or less than that of the class depicted below. (See Notes to Performance Summary.)
Performance data shown represents past performance and is no guarantee of future results. Investment return and principal value fluctuate so your units, when sold, may be worth more or less than the original cost; current performance may be lower or higher than quoted. The performance shown does not reflect the deduction of taxes, if any, that a contract holder would pay on fund distributions or the redemption of contract units. The returns for the fund shown also do not reflect the deduction of expenses associated with variable products, such as mortality and expense risk charges, separate account charges, and sales charges imposed by the insurance company separate accounts. Such expenses would reduce the overall returns shown.
Growth of a hypothetical $10,000 investment
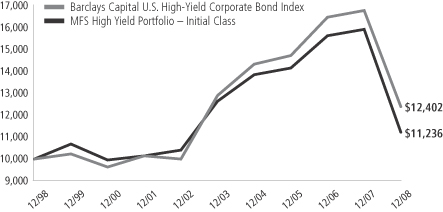
Total rates of return through 12/31/08
Average Annual Total Returns
| | | | | | | | | | | | |
| | | Share class | | Class inception date | | 1-yr | | 5-yr | | 10-yr | | |
| | | Initial Class | | 6/12/85 | | (29.50)% | | (2.35)% | | 1.17% | | |
| | | Service Class | | 8/24/01 | | (29.64)% | | (2.60)% | | 0.98% | | |
Comparative Benchmark
| | | | | | | | | | | | |
| | | Barclays Capital U.S. High-Yield Corporate Bond Index (f) | | (26.16)% | | (0.80)% | | 2.18% | | |
| (f) | Source: FactSet Research Systems Inc. |
Benchmark Definition
Barclays Capital U.S. High-Yield Corporate Bond Index (formerly known as Lehman Brothers U.S. High-Yield Corporate Bond Index) – a market capitalization-weighted index that measures the performance of non-investment grade, fixed rate debt. Eurobonds and debt issues from countries designated as emerging markets (e.g., Argentina, Brazil, Venezuela, etc.) are excluded.
It is not possible to invest directly in an index.
Notes to Performance Summary
Performance for the Service Class includes the performance of the fund’s Initial Class for periods prior to their offering. Because Service Class expenses are higher than those of Initial Class, performance shown for Service Class is higher than it would have been had it been offered for the entire period. Performance has not been adjusted to take into account differences in class specific operating expenses (such as Rule 12b-1 fees). Please see the prospectus for additional information about performance and expenses.
Performance results reflect any applicable expense subsidies and waivers in effect during the periods shown. Without such subsidies and waivers the fund’s performance results would be less favorable. Please see the prospectus for complete details. All results are historical and assume the reinvestment of any dividends and capital gains distributions.
From time to time the fund may receive proceeds from litigation settlements, without which performance would be lower.
5
EXPENSE TABLE
Fund Expenses Borne by the Contract Holders During the Period,
July 1, 2008 through December 31, 2008
As a contract holder of the fund, you incur ongoing costs, including management fees; distribution (12b-1) fees; and other fund expenses. This example is intended to help you understand your ongoing costs (in dollars) of investing in the fund and to compare these costs with the ongoing costs of investing in other mutual funds.
The example is based on an investment of $1,000 invested at the beginning of the period and held for the entire period July 1, 2008 through December 31, 2008.
Actual Expenses
The first line for each share class in the following table provides information about actual account values and actual expenses. You may use the information in this line, together with the amount you invested, to estimate the expenses that you paid over the period. Simply divide your account value by $1,000 (for example, an $8,600 account value divided by $1,000 = 8.6), then multiply the result by the number in the first line under the heading entitled “Expenses Paid During Period” to estimate the expenses you paid on your account during this period.
Hypothetical Example for Comparison Purposes
The second line for each share class in the following table provides information about hypothetical account values and hypothetical expenses based on the fund’s actual expense ratio and an assumed rate of return of 5% per year before expenses, which is not the fund’s actual return. The hypothetical account values and expenses may not be used to estimate the actual ending account balance or expenses you paid for the period. You may use this information to compare the ongoing costs of investing in the fund and other funds. To do so, compare this 5% hypothetical example with the 5% hypothetical examples that appear in the shareholder reports of the other funds.
Please note that the expenses shown in the table are meant to highlight the fund’s ongoing costs only and do not take into account the fees and expenses imposed under the variable contracts through which your investment in the fund is made. Therefore, the second line for each share class in the table is useful in comparing ongoing costs associated with an investment in vehicles (such as the fund) which fund benefits under variable annuity and variable life insurance contracts and to qualified pension and retirement plans only, and will not help you determine the relative total costs of investing in the fund through variable annuity and variable life insurance contracts. If the fees and expenses imposed under the variable contracts were included, your costs would have been higher.
| | | | | | | | | | |
| Share Class | | | | Annualized
Expense Ratio | | Beginning
Account Value
7/01/08 | | Ending
Account Value
12/31/08 | | Expenses Paid
During Period (p)
7/01/08-12/31/08 |
| Initial Class | | Actual | | 0.88% | | $1,000.00 | | $715.49 | | $3.79 |
| | Hypothetical (h) | | 0.88% | | $1,000.00 | | $1,020.71 | | $4.47 |
| Service Class | | Actual | | 1.13% | | $1,000.00 | | $714.77 | | $4.87 |
| | Hypothetical (h) | | 1.13% | | $1,000.00 | | $1,019.46 | | $5.74 |
| (h) | 5% class return per year before expenses. |
| (p) | Expenses paid is equal to each class’ annualized expense ratio, as shown above, multiplied by the average account value over the period, multiplied by the number of days in the period, divided by the number of days in the year. |
6
PORTFOLIO OF INVESTMENTS – 12/31/08
The Portfolio of Investments is a complete list of all securities owned by your fund. It is categorized by broad-based asset classes.
| | | | | | |
| Issuer | | Shares/Par | | Value ($) |
| | | | | | |
| BONDS – 78.1% | | | | | | |
| Aerospace – 0.8% | | | | | | |
| Bombardier, Inc., 6.3%, 2014 (n) | | $ | 300,000 | | $ | 246,750 |
| Hawker Beechcraft Acquisition Co. LLC, 9.75%, 2017 | | | 150,000 | | | 40,500 |
| Vought Aircraft Industries, Inc., 8%, 2011 | | | 2,010,000 | | | 1,356,750 |
| | | | | | |
| | | | | $ | 1,644,000 |
| | | | | | |
| Airlines – 0.8% | | | | | | |
| Continental Airlines, Inc., 7.339%, 2014 | | $ | 1,835,000 | | $ | 1,211,100 |
| Continental Airlines, Inc., 6.9%, 2017 | | | 271,354 | | | 184,518 |
| Continental Airlines, Inc., 6.748%, 2017 | | | 210,033 | | | 147,023 |
| | | | | | |
| | | | | $ | 1,542,641 |
| | | | | | |
| Asset Backed & Securitized – 4.4% | | | | | | |
Airlie LCDO Ltd., CDO, FRN,
5.103%, 2011 (z) | | $ | 665,000 | | $ | 155,477 |
| Anthracite Ltd., CDO, 6%, 2037 (z) | | | 1,300,000 | | | 260,000 |
| Arbor Realty Mortgage Securities, CDO, FRN, 6.718%, 2038 (z) | | | 650,026 | | | 26,001 |
Babson Ltd., CLO, “D”, FRN,
6.252%, 2018 (n) | | | 670,000 | | | 65,325 |
| Banc of America Commercial Mortgage, Inc., 5.39%, 2045 | | | 502,595 | | | 241,895 |
| Banc of America Commercial Mortgage, Inc., FRN, 5.658%, 2017 | | | 935,000 | | | 683,834 |
| Banc of America Commercial Mortgage, Inc., FRN, 5.772%, 2017 | | | 2,075,160 | | | 932,892 |
| Banc of America Commercial Mortgage, Inc., FRN, 5.811%, 2017 | | | 486,385 | | | 223,617 |
| Citigroup Commercial Mortgage Trust, FRN, 5.7%, 2017 | | | 952,699 | | | 141,454 |
| Credit Suisse Mortgage Capital Certificate, 5.343%, 2039 | | | 472,183 | | | 223,921 |
| CWCapital Cobalt Ltd., “C1”, 5.223%, 2048 | | | 260,000 | | | 198,376 |
CWCapital Cobalt Ltd., CDO,
6.23%, 2045 (n) | | | 950,000 | | | 38,000 |
| CWCapital Cobalt Ltd., CDO, “F”, FRN, 4.835%, 2050 (z) | | | 500,000 | | | 20,000 |
| First Union National Bank Commercial Mortgage Trust, 6.75%, 2032 | | | 855,000 | | | 394,522 |
| GS Mortgage Securities Corp., “GG8”, 5.56%, 2039 | | | 1,065,000 | | | 844,752 |
| JPMorgan Chase Commercial Mortgage Securities Corp., 5.44%, 2045 | | | 1,457,387 | | | 709,514 |
| JPMorgan Chase Commercial Mortgage Securities Corp., 5.42%, 2049 | | | 1,475,000 | | | 1,042,777 |
| JPMorgan Chase Commercial Mortgage Securities Corp., FRN, 5.466%, 2047 | | | 984,062 | | | 450,057 |
| JPMorgan Chase Commercial Mortgage Securities Corp., FRN, 6.062%, 2051 | | | 690,000 | | | 127,079 |
Merrill Lynch Mortgage Trust, FRN,
5.828%, 2050 | | | 690,000 | | | 124,600 |
| Merrill Lynch/Countrywide Commercial Mortgage Trust, FRN, 5.204%, 2049 | | | 1,576,549 | | | 741,510 |
| Merrill Lynch/Countrywide Commercial Mortgage Trust, FRN, 5.749%, 2050 | | | 404,000 | | | 186,804 |
| | | | | | |
| Issuer | | Shares/Par | | Value ($) |
| | | | | | |
| BONDS – continued | | | |
| Asset Backed & Securitized – continued |
| Wachovia Bank Commercial Mortgage Trust, FRN, 5.752%, 2047 | | $ | 557,306 | | $ | 97,751 |
| Wachovia Bank Commercial Mortgage Trust, FRN, 5.902%, 2051 | | | 1,571,863 | | | 729,373 |
Wachovia Credit, CDO, FRN,
2.816%, 2026 (z) | | | 376,000 | | | 45,120 |
| | | | | | |
| | | | | $ | 8,704,651 |
| | | | | | |
| Automotive – 3.2% | | | | | | |
| Accuride Corp., 8.5%, 2015 | | $ | 850,000 | | $ | 278,375 |
Allison Transmission, Inc.,
11%, 2015 (n) | | | 1,870,000 | | | 916,300 |
| FCE Bank PLC, 7.125%, 2012 | | EUR | 2,250,000 | | | 2,095,499 |
| Ford Motor Credit Co. LLC, 9.75%, 2010 | | $ | 855,000 | | | 683,995 |
| Ford Motor Credit Co. LLC, 12%, 2015 | | | 1,580,000 | | | 1,179,879 |
| Ford Motor Credit Co. LLC, 8%, 2016 | | | 1,590,000 | | | 1,035,674 |
| General Motors Corp., 8.375%, 2033 | | | 664,000 | | | 116,200 |
| | | | | | |
| | | | | $ | 6,305,922 |
| | | | | | |
| Broadcasting – 4.1% | | | | | | |
Allbritton Communications Co.,
7.75%, 2012 | | $ | 2,128,000 | | $ | 1,045,380 |
Bonten Media Acquisition Co.,
9%, 2015 (p)(z) | | | 835,000 | | | 250,500 |
CanWest MediaWorks LP,
9.25%, 2015 (n) | | | 1,005,000 | | | 381,900 |
Clear Channel Communications,
10.75%, 2016 (n) | | | 425,000 | | | 87,125 |
| DirectTV Holdings LLC, 7.625%, 2016 | | | 1,605,000 | | | 1,556,850 |
| Lamar Media Corp., 6.625%, 2015 | | | 1,875,000 | | | 1,354,688 |
| Lamar Media Corp., “C”, 6.625%, 2015 | | | 925,000 | | | 668,313 |
| LBI Media, Inc., 8.5%, 2017 (z) | | | 940,000 | | | 329,000 |
| LIN TV Corp., 6.5%, 2013 | | | 2,080,000 | | | 993,200 |
Local TV Finance LLC,
9.25%, 2015 (p)(z) | | | 1,550,000 | | | 341,000 |
Newport Television LLC,
13%, 2017 (n)(p) | | | 1,815,000 | | | 138,394 |
Nexstar Broadcasting Group, Inc.,
7%, 2014 | | | 1,725,000 | | | 743,906 |
Univision Communications, Inc.,
9.75%, 2015 (n)(p) | | | 2,430,000 | | | 303,750 |
| Young Broadcasting, Inc., 8.75%, 2014 | | | 525,000 | | | 5,250 |
| | | | | | |
| | | | | $ | 8,199,256 |
| | | | | | |
| Brokerage & Asset Managers – 0.3% | | | |
Nuveen Investments, Inc.,
10.5%, 2015 (n) | | $ | 2,290,000 | | $ | 506,663 |
| | | | | | |
| Building – 1.4% | | | | | | |
| Associated Materials, Inc., 9.75%, 2012 | | $ | 600,000 | | $ | 472,500 |
| Associated Materials, Inc., 0% to 2009, 11.25% to 2014 | | | 775,000 | | | 430,125 |
| Building Materials Corp. of America, 7.75%, 2014 | | | 855,000 | | | 538,650 |
| Nortek Holdings, Inc., 8.5%, 2014 | | | 515,000 | | | 118,450 |
| Nortek, Inc., 10%, 2013 | | | 780,000 | | | 530,400 |
7
Portfolio of Investments – continued
| | | | | | |
| Issuer | | Shares/Par | | Value ($) |
| | | | | | |
| BONDS – continued | | | |
| Building – continued |
| Ply Gem Industries, Inc., 9%, 2012 | | $ | 1,380,000 | | $ | 331,200 |
| Ply Gem Industries, Inc., 11.75%, 2013 | | | 535,000 | | | 288,900 |
| | | | | | |
| | | | | $ | 2,710,225 |
| | | | | | |
| Business Services – 0.9% | | | | | | |
| First Data Corp., 9.875%, 2015 | | $ | 1,340,000 | | $ | 810,700 |
SunGard Data Systems, Inc.,
10.25%, 2015 | | | 1,652,000 | | | 1,090,320 |
| | | | | | |
| | | | | $ | 1,901,020 |
| | | | | | |
| Cable TV – 3.5% | | | | | | |
| CCH II Holdings LLC, 10.25%, 2010 | | $ | 1,355,000 | | $ | 623,300 |
| CCO Holdings LLC, 8.75%, 2013 | | | 4,530,000 | | | 2,853,900 |
| CSC Holdings, Inc., 6.75%, 2012 | | | 1,265,000 | | | 1,157,475 |
| CSC Holdings, Inc., 8.5%, 2015 (n) | | | 380,000 | | | 334,400 |
| Mediacom LLC, 9.5%, 2013 | | | 480,000 | | | 362,400 |
| NTL Cable PLC, 9.125%, 2016 | | | 1,540,000 | | | 1,139,600 |
| Time Warner Cable, Inc., 8.75%, 2019 | | | 550,000 | | | 598,034 |
| | | | | | |
| | | | | $ | 7,069,109 |
| | | | | | |
| Chemicals – 2.7% | | | | | | |
| Innophos Holdings, Inc., 8.875%, 2014 | | $ | 1,600,000 | | $ | 1,120,000 |
KI Holdings, Inc., 0% to 2009,
9.875% to 2014 | | | 1,960,000 | | | 1,519,000 |
| Momentive Performance Materials, Inc., 11.5%, 2016 | | | 1,904,000 | | | 561,680 |
| Nalco Co., 7.75%, 2011 | | | 915,000 | | | 878,400 |
| Nalco Co., 8.875%, 2013 | | | 1,475,000 | | | 1,246,375 |
| | | | | | |
| | | | | $ | 5,325,455 |
| | | | | | |
| Consumer Goods & Services – 2.6% | | | | | | |
Corrections Corp. of America,
6.25%, 2013 | | $ | 770,000 | | $ | 716,100 |
| GEO Group, Inc., 8.25%, 2013 | | | 805,000 | | | 710,413 |
| Jarden Corp., 7.5%, 2017 | | | 480,000 | | | 327,600 |
| KAR Holdings, Inc., 10%, 2015 | | | 1,120,000 | | | 369,600 |
Service Corp. International,
7.375%, 2014 | | | 700,000 | | | 595,000 |
| Service Corp. International, 7%, 2017 | | | 2,755,000 | | | 2,066,250 |
| Ticketmaster, 10.75%, 2016 (n) | | | 775,000 | | | 418,500 |
| | | | | | |
| | | | | $ | 5,203,463 |
| | | | | | |
| Containers – 1.6% | | | | | | |
| Crown Americas LLC, 7.625%, 2013 | | $ | 980,000 | | $ | 970,200 |
Graham Packaging Holdings Co.,
9.875%, 2014 | | | 1,365,000 | | | 839,475 |
| Greif, Inc., 6.75%, 2017 | | | 1,005,000 | | | 889,425 |
| Owens-Brockway Glass Container, Inc., 8.25%, 2013 | | | 545,000 | | | 536,825 |
| | | | | | |
| | | | | $ | 3,235,925 |
| | | | | | |
| Defense Electronics – 1.1% | | | | | | |
L-3 Communications Corp.,
6.125%, 2014 | | $ | 1,525,000 | | $ | 1,383,938 |
L-3 Communications Corp.,
5.875%, 2015 | | | 1,015,000 | | | 913,500 |
| | | | | | |
| | | | | $ | 2,297,438 |
| | | | | | |
| | | | | | |
| Issuer | | Shares/Par | | Value ($) |
| | | | | | |
| BONDS – continued | | | |
| Electronics – 0.7% | | | | | | |
| Avago Technologies Ltd., 11.875%, 2015 | | $ | 455,000 | | $ | 316,225 |
Flextronics International Ltd.,
6.25%, 2014 | | | 780,000 | | | 581,100 |
Freescale Semiconductor, Inc.,
8.875%, 2014 | | | 685,000 | | | 301,400 |
| Spansion, Inc., 11.25%, 2016 (n) | | | 1,605,000 | | | 112,350 |
| | | | | | |
| | | | | $ | 1,311,075 |
| | | | | | |
| Emerging Market Sovereign – 0.1% | | | |
Republic of Argentina, FRN,
3.127%, 2012 | | $ | 481,500 | | $ | 255,559 |
| | | | | | |
| Energy – Independent – 5.3% | | | | | | |
| Chaparral Energy, Inc., 8.875%, 2017 | | $ | 1,260,000 | | $ | 252,000 |
| Chesapeake Energy Corp., 7%, 2014 | | | 644,000 | | | 534,520 |
| Chesapeake Energy Corp., 6.375%, 2015 | | | 2,460,000 | | | 1,943,400 |
| Forest Oil Corp., 7.25%, 2019 (n) | | | 250,000 | | | 182,500 |
| Forest Oil Corp., 7.25%, 2019 | | | 1,390,000 | | | 1,014,700 |
| Hilcorp Energy I LP, 9%, 2016 (n) | | | 440,000 | | | 314,600 |
| Mariner Energy, Inc., 8%, 2017 | | | 1,280,000 | | | 665,600 |
| Newfield Exploration Co., 6.625%, 2014 | | | 1,160,000 | | | 951,200 |
| Newfield Exploration Co., 6.625%, 2016 | | | 320,000 | | | 254,400 |
| OPTI Canada, Inc., 8.25%, 2014 | | | 2,095,000 | | | 1,131,300 |
Plains Exploration & Production Co.,
7%, 2017 | | | 1,745,000 | | | 1,195,325 |
Quicksilver Resources, Inc.,
7.125%, 2016 | | | 2,265,000 | | | 1,211,775 |
| Range Resource Corp., 7.5%, 2016 | | | 200,000 | | | 173,500 |
SandRidge Energy, Inc.,
8.625%, 2015 (p) | | | 476,000 | | | 249,900 |
| SandRidge Energy, Inc., 8%, 2018 (n) | | | 940,000 | | | 521,700 |
| | | | | | |
| | | | | $ | 10,596,420 |
| | | | | | |
| Entertainment – 0.5% | | | | | | |
| AMC Entertainment, Inc., 11%, 2016 | | $ | 950,000 | | $ | 663,813 |
| Marquee Holdings, Inc., 12%, 2014 | | | 750,000 | | | 382,500 |
| | | | | | |
| | | | | $ | 1,046,313 |
| | | | | | |
| Financial Institutions – 1.0% | | | | | | |
| GMAC Commercial Mortgage Securities, Inc., 6.875%, 2011 (z) | | $ | 1,906,000 | | $ | 1,561,510 |
| GMAC Commercial Mortgage Securities, Inc., 8%, 2031 (z) | | | 609,000 | | | 361,984 |
| | | | | | |
| | | | | $ | 1,923,494 |
| | | | | | |
| Food & Beverages – 2.4% | | | | | | |
| ARAMARK Corp., 8.5%, 2015 | | $ | 535,000 | | $ | 484,175 |
| B&G Foods, Inc., 8%, 2011 | | | 1,190,000 | | | 1,011,500 |
| Dean Foods Co., 7%, 2016 | | | 1,510,000 | | | 1,283,500 |
| Del Monte Corp., 6.75%, 2015 | | | 1,350,000 | | | 1,161,000 |
| Michael Foods, Inc., 8%, 2013 | | | 950,000 | | | 817,000 |
| | | | | | |
| | | | | $ | 4,757,175 |
| | | | | | |
| Forest & Paper Products – 2.3% | | | | | | |
| Buckeye Technologies, Inc., 8%, 2010 | | $ | 78,000 | | $ | 70,980 |
| Buckeye Technologies, Inc., 8.5%, 2013 | | | 2,010,000 | | | 1,708,500 |
| Georgia-Pacific Corp., 7.125%, 2017 (n) | | | 855,000 | | | 718,200 |
| Georgia-Pacific Corp., 8%, 2024 | | | 490,000 | | | 330,750 |
8
Portfolio of Investments – continued
| | | | | | |
| Issuer | | Shares/Par | | Value ($) |
| | | | | | |
| BONDS – continued | | | |
| Forest & Paper Products – continued |
Graphic Packaging International Corp.,
9.5%, 2013 | | $ | 1,080,000 | | $ | 745,200 |
| Jefferson Smurfit Corp., 8.25%, 2012 | | | 555,000 | | | 94,350 |
| JSG Funding PLC, 7.75%, 2015 | | | 150,000 | | | 81,750 |
| Millar Western Forest Products Ltd., 7.75%, 2013 | | | 1,465,000 | | | 732,500 |
| Smurfit-Stone Container Corp., 8%, 2017 | | | 787,000 | | | 149,530 |
| | | | | | |
| | | | | $ | 4,631,760 |
| | | | | | |
| Gaming & Lodging – 4.3% | | | | | | |
| Boyd Gaming Corp., 6.75%, 2014 | | $ | 1,070,000 | | $ | 674,100 |
| Fontainebleau Las Vegas Holdings LLC, 10.25%, 2015 (n) | | | 1,270,000 | | | 123,825 |
Harrah’s Operating Co., Inc.,
10.75%, 2016 (n) | | | 2,760,000 | | | 786,600 |
Harrah’s Operating Co., Inc.,
10%, 2018 (z) | | | 633,000 | | | 231,045 |
| Host Hotels & Resorts, Inc., 7.125%, 2013 | | | 865,000 | | | 696,325 |
| Host Hotels & Resorts, Inc., 6.75%, 2016 | | | 790,000 | | | 576,700 |
| Mandalay Resort Group, 9.375%, 2010 | | | 1,085,000 | | | 792,050 |
| MGM Mirage, 8.5%, 2010 | | | 1,165,000 | | | 978,600 |
| MGM Mirage, 8.375%, 2011 | | | 1,505,000 | | | 895,475 |
| MGM Mirage, 6.75%, 2013 | | | 690,000 | | | 462,300 |
| MGM Mirage, 5.875%, 2014 | | | 555,000 | | | 355,200 |
| Pinnacle Entertainment, Inc., 8.75%, 2013 | | | 85,000 | | | 67,150 |
| Pinnacle Entertainment, Inc., 7.5%, 2015 | | | 2,105,000 | | | 1,220,900 |
| Station Casinos, Inc., 6%, 2012 | | | 440,000 | | | 88,000 |
| Station Casinos, Inc., 6.5%, 2014 | | | 2,020,000 | | | 116,150 |
| Station Casinos, Inc., 6.875%, 2016 | | | 2,495,000 | | | 143,463 |
| Trump Entertainment Resorts Holdings, Inc., 8.5%, 2015 (d) | | | 3,230,000 | | | 427,975 |
| | | | | | |
| | | | | $ | 8,635,858 |
| | | | | | |
| Industrial – 1.6% | | | | | | |
| Blount International, Inc., 8.875%, 2012 | | $ | 1,055,000 | | $ | 975,875 |
| JohnsonDiversey, Inc., 9.625%, 2012 | | EUR | 455,000 | | | 461,705 |
| JohnsonDiversey, Inc., “B”, 9.625%, 2012 | | $ | 2,245,000 | | | 1,840,900 |
| | | | | | |
| | | | | $ | 3,278,480 |
| | | | | | |
| Insurance – Property & Casualty – 0.2% | | | |
| USI Holdings Corp., 9.75%, 2015 (z) | | $ | 990,000 | | $ | 394,763 |
| | | | | | |
| Machinery & Tools – 0.7% | | | | | | |
| Case New Holland, Inc., 7.125%, 2014 | | $ | 1,910,000 | | $ | 1,356,100 |
| | | | | | |
| Major Banks – 1.8% | | | | | | |
Bank of America Corp., 8% to 2018,
FRN to 2059 | | $ | 2,045,000 | | $ | 1,470,944 |
| JPMorgan Chase & Co., 7.9% to 2018, FRN to 2049 | | | 2,080,000 | | | 1,730,206 |
| Wells Fargo Capital XV, 9.75% to 2009, FRN to 2049 | | | 460,000 | | | 464,600 |
| | | | | | |
| | | | | $ | 3,665,750 |
| | | | | | |
| Medical & Health Technology & Services – 7.5% | | | |
| Biomet, Inc., 10%, 2017 | | $ | 895,000 | | $ | 859,200 |
| Biomet, Inc., 11.625%, 2017 | | | 575,000 | | | 491,625 |
| | | | | | |
| Issuer | | Shares/Par | | Value ($) |
| | | | | | |
| BONDS – continued | | | |
| Medical & Health Technology & Services – continued |
Community Health Systems, Inc.,
8.875%, 2015 | | $ | 2,600,000 | | $ | 2,392,000 |
| Cooper Cos., Inc., 7.125%, 2015 | | | 370,000 | | | 310,800 |
| DaVita, Inc., 7.25%, 2015 | | | 1,136,000 | | | 1,079,200 |
| HCA, Inc., 6.375%, 2015 | | | 1,930,000 | | | 1,177,300 |
| HCA, Inc., 9.25%, 2016 | | | 4,970,000 | | | 4,559,975 |
| Psychiatric Solutions, Inc., 7.75%, 2015 | | | 970,000 | | | 712,950 |
| U.S. Oncology, Inc., 10.75%, 2014 | | | 2,150,000 | | | 1,752,250 |
Universal Hospital Services, Inc.,
8.5%, 2015 (p) | | | 1,195,000 | | | 848,450 |
Universal Hospital Services, Inc., FRN,
5.942%, 2015 | | | 290,000 | | | 176,900 |
| VWR Funding, Inc., 10.25%, 2015 (p) | | | 840,000 | | | 529,200 |
| | | | | | |
| | | | | $ | 14,889,850 |
| | | | | | |
| Metals & Mining – 3.9% | | | | | | |
| Arch Western Finance LLC, 6.75%, 2013 | | $ | 1,145,000 | | $ | 996,150 |
| FMG Finance Ltd., 10.625%, 2016 (n) | | | 2,140,000 | | | 1,241,200 |
| Freeport-McMoRan Copper & Gold, Inc., 8.375%, 2017 | | | 3,440,000 | | | 2,820,800 |
| Freeport-McMoRan Copper & Gold, Inc., FRN, 7.083%, 2015 | | | 500,000 | | | 330,000 |
| Peabody Energy Corp., 5.875%, 2016 | | | 960,000 | | | 816,000 |
| Peabody Energy Corp., 7.375%, 2016 | | | 1,310,000 | | | 1,231,400 |
| Rio Tinto Finance USA Ltd., 5.875%, 2013 | | | 510,000 | | | 406,222 |
| | | | | | |
| | | | | $ | 7,841,772 |
| | | | | | |
| Municipals – 0.6% | | | | | | |
| Regional Transportation Authority, IL, “A”, MBIA, 4.5%, 2035 | | $ | 1,395,000 | | $ | 1,180,993 |
| | | | | | |
| Natural Gas – Distribution – 1.2% | | | | | | |
| AmeriGas Partners LP, 7.125%, 2016 | | $ | 1,540,000 | | $ | 1,232,000 |
| Inergy LP, 6.875%, 2014 | | | 1,435,000 | | | 1,119,300 |
| | | | | | |
| | | | | $ | 2,351,300 |
| | | | | | |
| Natural Gas – Pipeline – 2.2% | | | | | | |
| Atlas Pipeline Partners LP, 8.125%, 2015 | | $ | 1,000,000 | | $ | 675,000 |
| Atlas Pipeline Partners LP, 8.75%, 2018 (n) | | | 905,000 | | | 592,775 |
| Deutsche Bank (El Paso Performance-Linked Trust, CLN), 7.75%, 2011 (n) | | | 1,525,000 | | | 1,320,269 |
| El Paso Corp., 7.25%, 2018 | | | 930,000 | | | 738,115 |
Transcontinental Gas Pipe Line Corp.,
7%, 2011 | | | 303,000 | | | 297,364 |
| Williams Partners LP, 7.25%, 2017 | | | 935,000 | | | 738,650 |
| | | | | | |
| | | | | $ | 4,362,173 |
| | | | | | |
| Network & Telecom – 3.7% | | | | | | |
| Cincinnati Bell, Inc., 8.375%, 2014 | | $ | 1,660,000 | | $ | 1,278,200 |
| Citizens Communications Co., 9.25%, 2011 | | | 1,286,000 | | | 1,221,700 |
Nordic Telephone Co. Holdings,
8.875%, 2016 (n) | | | 1,120,000 | | | 784,000 |
| Qwest Communications International, Inc., 7.25%, 2011 | | | 1,315,000 | | | 1,104,600 |
| Qwest Corp., 7.875%, 2011 | | | 530,000 | | | 487,600 |
| Qwest Corp., 8.875%, 2012 | | | 1,695,000 | | | 1,567,875 |
| Windstream Corp., 8.625%, 2016 | | | 985,000 | | | 871,725 |
| | | | | | |
| | | | | $ | 7,315,700 |
| | | | | | |
9
Portfolio of Investments – continued
| | | | | | |
| Issuer | | Shares/Par | | Value ($) |
| | | | | | |
| BONDS – continued | | | |
| Printing & Publishing – 0.9% | | | | | | |
American Media Operations, Inc.,
10.25%, 2009 (d)(z) | | $ | 48,468 | | $ | 9,754 |
| American Media Operations, Inc., “B”, 10.25%, 2009 (d) | | | 1,333,000 | | | 268,274 |
| Dex Media, Inc., 9%, 2013 | | | 1,710,000 | | | 316,350 |
| Idearc, Inc., 8%, 2016 | | | 1,322,000 | | | 99,150 |
| Nielsen Finance LLC, 10%, 2014 | | | 1,155,000 | | | 924,000 |
Nielsen Finance LLC, 0% to 2011,
12.5% to 2016 | | | 216,000 | | | 78,300 |
| Quebecor World, Inc., 6.125%, 2013 (d) | | | 800,000 | | | 22,000 |
| Tribune Co., 5.25%, 2015 (d) | | | 755,000 | | | 33,975 |
| | | | | | |
| | | | | $ | 1,751,803 |
| | | | | | |
| Retailers – 0.3% | | | | | | |
| Couche-Tard, Inc., 7.5%, 2013 | | $ | 350,000 | | $ | 276,500 |
| Sally Beauty Holdings, Inc., 10.5%, 2016 | | | 485,000 | | | 329,800 |
| | | | | | |
| | | | | $ | 606,300 |
| | | | | | |
| Specialty Stores – 0.4% | | | | | | |
| Payless ShoeSource, Inc., 8.25%, 2013 | | $ | 1,055,000 | | $ | 791,250 |
| | | | | | |
| Telecommunications – Wireless – 2.5% | | | |
| Alltel Corp., 7%, 2012 | | $ | 1,621,000 | | $ | 1,612,895 |
| Alltel Corp., 6.5%, 2013 | | | 415,000 | | | 406,700 |
| MetroPCS Wireless, Inc., 9.25%, 2014 | | | 420,000 | | | 375,900 |
| Sprint Nextel Corp., FRN, 1.866%, 2010 | | | 415,000 | | | 347,651 |
| Sprint Nextel Corp., 8.375%, 2012 | | | 1,220,000 | | | 976,000 |
Wind Acquisition Finance S.A.,
10.75%, 2015 (z) | | | 1,580,000 | | | 1,358,800 |
| | | | | | |
| | | | | $ | 5,077,946 |
| | | | | | |
| Tobacco – 0.6% | | | | | | |
| Altria Group, Inc., 9.7%, 2018 | | $ | 1,120,000 | | $ | 1,210,530 |
| | | | | | |
| Transportation – Services – 0.4% | | | | | | |
| Hertz Corp., 8.875%, 2014 | | $ | 1,415,000 | | $ | 870,225 |
| | | | | | |
| Utilities – Electric Power – 5.6% | | | | | | |
| Dynegy Holdings, Inc., 7.5%, 2015 | | $ | 940,000 | | $ | 658,000 |
| Dynegy Holdings, Inc., 7.75%, 2019 | | | 480,000 | | | 331,200 |
| Edison Mission Energy, 7%, 2017 | | | 1,555,000 | | | 1,352,850 |
Mirant Americas Generation LLC,
8.3%, 2011 | | | 800,000 | | | 776,000 |
| Mirant North America LLC, 7.375%, 2013 | | | 1,375,000 | | | 1,320,000 |
| NRG Energy, Inc., 7.375%, 2016 | | | 4,010,000 | | | 3,729,300 |
| Reliant Energy, Inc., 7.875%, 2017 | | | 773,000 | | | 626,130 |
| Texas Competitive Electric Holdings LLC, 10.25% to 2010, 10.5% to 2015 (n) | | | 3,400,000 | | | 2,414,000 |
| | | | | | |
| | | | | $ | 11,207,480 |
| | | | | | |
Total Bonds
(Identified Cost, $233,451,301) | | | | | $ | 155,955,837 |
| | | | | | |
| | | | | | |
| Issuer | | Shares/Par | | Value ($) |
| | | | | | |
| |
| FLOATING RATE LOANS (g)(r) – 6.3% | | | |
| Aerospace – 0.4% | | | | | | |
| Hawker Beechcraft Acquisition Co. LLC, Letter of Credit, 3.46%, 2014 | | $ | 65,293 | | $ | 33,626 |
| Hawker Beechcraft Acquisition Co. LLC, Term Loan, 2.79%, 2014 | | | 1,617,033 | | | 832,772 |
| | | | | | |
| | | | | $ | 866,398 |
| | | | | | |
| Automotive – 1.2% | | | | | | |
| Accuride Corp., Term Loan B, 5.56%, 2012 | | $ | 136,626 | | $ | 92,564 |
Federal-Mogul Corp., Term Loan B,
3.49%, 2014 | | | 1,196,549 | | | 538,447 |
| Ford Motor Co., Term Loan B, 5%, 2013 | | | 2,258,943 | | | 906,401 |
General Motors, Term Loan B,
5.8%, 2013 (o) | | | 1,582,013 | | | 711,906 |
| Mark IV Industries, Inc., Second Lien Term Loan, 10.76%, 2011 | | | 982,733 | | | 63,878 |
| | | | | | |
| | | | | $ | 2,313,196 |
| | | | | | |
| Broadcasting – 0.4% | | | | | | |
| Gray Television, Inc., Term Loan, 2014 (o) | | $ | 525,767 | | $ | 198,477 |
Young Broadcasting, Inc., Term Loan,
5.24%, 2012 | | | 1,179,836 | | | 401,144 |
| Young Broadcasting, Inc., Term Loan B-1, 5.25%, 2012 | | | 438,565 | | | 149,112 |
| | | | | | |
| | | | | $ | 748,733 |
| | | | | | |
| Building – 0.0% | | | | | | |
| Building Materials Holding Corp., Term Loan, 2014 (o) | | $ | 162,445 | | $ | 96,655 |
| | | | | | |
| Business Services – 0.5% | | | | | | |
First Data Corp., Term Loan B-1,
3.21%, 2014 | | $ | 1,558,514 | | $ | 996,892 |
| | | | | | |
| Cable TV – 0.2% | | | | | | |
| Charter Communications Operating LLC, Term Loan, 5.06%, 2014 | | $ | 451,533 | | $ | 329,619 |
| | | | | | |
| Electronics – 0.1% | | | | | | |
| Freescale Semiconductor, Inc., Term Loan B, 3.93%, 2013 | | $ | 455,330 | | $ | 260,803 |
| | | | | | |
| Forest & Paper Products – 0.1% | | | | | | |
Abitibi-Consolidated, Inc., Term Loan,
11.5%, 2009 | | $ | 410,542 | | $ | 298,669 |
| | | | | | |
| Gaming & Lodging – 0.1% | | | | | | |
| Green Valley Ranch Gaming LLC, Second Lien Term Loan, 5.08%, 2014 | | $ | 1,601,789 | | $ | 184,206 |
| | | | | | |
| Medical & Health Technology & Services – 1.0% | | | |
| Community Health Systems, Inc., Delayed Draw Term Loan, 1.8%, 2014 (q) | | $ | 53,338 | | $ | 41,350 |
| Community Health Systems, Inc., Term Loan B, 4.45%, 2014 | | | 1,042,707 | | | 808,359 |
| HCA, Inc., Term Loan B, 3.71%, 2013 | | | 1,362,635 | | | 1,065,410 |
| | | | | | |
| | | | | $ | 1,915,119 |
| | | | | | |
10
Portfolio of Investments – continued
| | | | | | |
| Issuer | | Shares/Par | | Value ($) |
| | | | | | |
| |
| FLOATING RATE LOANS (g)(r) – continued | | | |
| Printing & Publishing – 0.4% | | | | | | |
Nielsen Finance LLC, Term Loan B,
4.24%, 2013 (o) | | $ | 798,688 | | $ | 537,617 |
Tribune Co., Incremental Term Loan,
6.5%, 2014 (d) | | | 1,825,983 | | | 331,721 |
| | | | | | |
| | | | | $ | 869,338 |
| | | | | | |
| Specialty Chemicals – 0.1% | | | | | | |
Lyondell Chemical Co., Term Loan B2,
2014 (o) | | $ | 632,559 | | $ | 284,651 |
| | | | | | |
| Specialty Stores – 0.1% | | | | | | |
Michaels Stores, Inc., Term Loan B,
3.52%, 2013 | | $ | 311,920 | | $ | 160,405 |
| | | | | | |
| Utilities – Electric Power – 1.7% | | | | | | |
| Calpine Corp., Term Loan, 4.34%, 2014 | | $ | 1,310,974 | | $ | 961,692 |
NRG Energy, Inc., Letter of Credit,
2.96%, 2013 | | | 315,035 | | | 272,112 |
| NRG Energy, Inc., Term Loan, 1.96%, 2013 | | | 641,084 | | | 553,736 |
| Texas Competitive Electric Holdings Co. LLC, Term Loan B-3, 5.36%, 2014 | | | 2,222,171 | | | 1,536,075 |
| | | | | | |
| | | | | $ | 3,323,615 |
| | | | | | |
Total Floating Rate Loans
(Identified Cost, $21,299,933) | | | | | $ | 12,648,299 |
| | | | | | |
| | |
| COMMON STOCKS – 1.4% | | | | | | |
| Automotive – 0.0% | | | | | | |
| Oxford Automotive, Inc. (a) | | | 21 | | $ | 0 |
| | | | | | |
| Cable TV – 0.7% | | | | | | |
| Cablevision Systems Corp., “A” | | | 13,700 | | $ | 230,708 |
| Comcast Corp., “A” | | | 49,300 | | | 832,184 |
| Time Warner Cable, Inc., “A” (a) | | | 17,400 | | | 373,230 |
| | | | | | |
| | | | | $ | 1,436,122 |
| | | | | | |
| Energy – Integrated – 0.1% | | | | | | |
| Chevron Corp. | | | 2,700 | | $ | 199,719 |
| | | | | | |
| Gaming & Lodging – 0.3% | | | | | | |
| MGM Mirage (a) | | | 8,300 | | $ | 114,208 |
| Pinnacle Entertainment, Inc. (a) | | | 65,200 | | | 500,736 |
| | | | | | |
| | | | | $ | 614,944 |
| | | | | | |
| | | | | | |
| Issuer | | Shares/Par | | Value ($) |
| | |
| COMMON STOCKS – continued | | | | | | |
| Printing & Publishing – 0.0% | | | | | | |
| Golden Books Family Entertainment, Inc. (a) | | | 17,708 | | $ | 0 |
| | | | | | |
| Telephone Services – 0.3% | | | | | | |
| Windstream Corp. | | | 49,400 | | $ | 454,480 |
| | | | | | |
Total Common Stocks (Identified Cost, $4,344,918) | | | | | $ | 2,705,265 |
| | | | | | |
| | | | | | |
| | |
| PREFERRED STOCKS – 0.9% | | | | | | |
| Automotive – 0.2% | | | | | | |
| Preferred Blocker, Inc., 9% (z) | | | 556 | | $ | 428,120 |
| | | | | | |
| Brokerage & Asset Managers – 0.7% | | | | | | |
| Merrill Lynch Co., Inc., 8.625% | | | 72,900 | | $ | 1,441,962 |
| | | | | | |
Total Preferred Stocks
(Identified Cost, $2,250,620) | | | | | $ | 1,870,082 |
| | | | | | |
| |
| SHORT-TERM OBLIGATIONS (y) – 1.4% | | | |
| HSBC Americas, Inc., 0.05%, due 1/02/09, at Amortized Cost and Value | | $ | 2,858,000 | | $ | 2,857,996 |
| | | | | | |
| |
| REPURCHASE AGREEMENTS – 8.7% | | | |
| Morgan Stanley, 0.02%, dated 12/31/08, due 1/02/09, total to be received $17,345,019 (secured by U.S. Treasury and Federal Agency obligations and Mortgage Backed securities in a jointly traded account), at Cost | | $ | 17,345,000 | | $ | 17,345,000 |
| | | | | | |
Total Investments (Identified Cost, $281,549,768) | | | | | $ | 193,382,479 |
| | | | | | |
OTHER ASSETS, LESS
LIABILITIES – 3.2% | | | | | | 6,391,828 |
| | | | | | |
| Net Assets – 100.0% | | | | | $ | 199,774,307 |
| | | | | | |
11
Portfolio of Investments – continued
| (a) | | Non-income producing security. |
| (d) | | Non-income producing security – in default. |
| (g) | | The rate shown represents a weighted average coupon rate on settled positions at period end, unless otherwise indicated. |
| (n) | | Securities exempt from registration under Rule 144A of the Securities Act of 1933. These securities may be sold in the ordinary course of business in transactions exempt from registration, normally to qualified institutional buyers. At period end, the aggregate value of these securities was $12,549,126, representing 6.3% of net assets. |
| (o) | | All or a portion of this position has not settled. Upon settlement date, interest rates will be determined. The rate shown represents a weighted average coupon rate on the full position, including unsettled positions which have no current coupon. |
| (p) | | Payment-in-kind security. |
| (q) | | All or a portion of this position represents an unfunded loan commitment. The rate shown represents a weighted average coupon rate on the full position, including the unfunded loan commitment which has no current coupon rate. |
| (r) | | Remaining maturities of floating rate loans may be less than stated maturities shown as a result of contractual or optional prepayments by the borrower. Such prepayments cannot be predicted with certainty. These loans may be subject to restrictions on resale. Floating rate loans generally have rates of interest which are determined periodically by reference to a base lending rate plus a premium. |
| (y) | | The rate shown represents an annualized yield at time of purchase. |
| (z) | | Restricted securities are not registered under the Securities Act of 1933 and are subject to legal restrictions on resale. These securities generally may be resold in transactions exempt from registration or to the public if the securities are subsequently registered. Disposal of these securities may involve time-consuming negotiations and prompt sale at an acceptable price may be difficult. The fund holds the following restricted securities: |
| | | | | | |
| Restricted Securities | | Acquisition Date | | Cost | | Current
Market Value |
| Airlie LCDO Ltd., CDO, FRN, 5.103%, 2011 | | 10/13/06 | | $665,000 | | $155,477 |
| American Media Operations, Inc., 10.25%, 2009 | | 12/01/06-11/28/07 | | 48,079 | | 9,754 |
| Anthracite Ltd., CDO, 6%, 2037 | | 5/14/02 | | 1,116,195 | | 260,000 |
| Arbor Realty Mortgage Securities, CDO, FRN, 6.718%, 2038 | | 12/20/05 | | 650,026 | | 26,001 |
| Bonten Media Acquisition Co., 9%, 2015 | | 5/22/07 | | 837,125 | | 250,500 |
| CWCapital Cobalt Ltd., CDO, “F”, FRN, 4.835%, 2050 | | 4/12/06 | | 500,000 | | 20,000 |
| GMAC Commercial Mortgage Securities, Inc., 6.875%, 2011 | | 12/26/08 | | 1,561,510 | | 1,561,510 |
| GMAC Commercial Mortgage Securities, Inc., 8%, 2031 | | 12/26/08 | | 361,984 | | 361,984 |
| Harrah’s Operating Co., Inc., 10%, 2018 | | 1/30/08-10/03/08 | | 718,307 | | 231,045 |
| LBI Media, Inc., 8.5%, 2017 | | 7/18/07 | | 924,490 | | 329,000 |
| Local TV Finance LLC, 9.25%, 2015 | | 11/09/07-9/08/08 | | 1,487,179 | | 341,000 |
| Preferred Blocker, Inc., 9% (Preferred Stock) | | 12/26/08 | | 428,120 | | 428,120 |
| USI Holdings Corp., 9.75%, 2015 | | 4/26/07-6/08/07 | | 1,001,425 | | 394,763 |
| Wachovia Credit, CDO, FRN, 2.816%, 2026 | | 6/08/06 | | 376,000 | | 45,120 |
| Wind Acquisition Finance S.A., 10.75%, 2015 | | 11/22/05-9/12/06 | | 1,665,413 | | 1,358,800 |
| Total Restricted Securities | | | | | | $5,773,074 |
| % of Net Assets | | | | | | 2.9% |
The following abbreviations are used in this report and are defined:
| CDO | | Collateralized Debt Obligation |
| CLO | | Collateralized Loan Obligation |
| FRN | | Floating Rate Note. Interest rate resets periodically and may not be the rate reported at period end. |
| | | | |
| Insurers | | |
| MBIA | | MBIA Insurance Corp. | | |
Abbreviations indicate amounts shown in currencies other than the U.S. dollar. All amounts are stated in U.S. dollars unless otherwise indicated. A list of abbreviations is shown below:
12
Portfolio of Investments – continued
Derivative Contracts at 12/31/08
Forward Foreign Currency Exchange Contracts at 12/31/08
| | | | | | | | | | | | | | | | | |
| | | Type | | Currency | | Contracts to
Deliver/Receive | | Settlement Date
Range | | In Exchange For | | Contracts
at Value | | Net Unrealized
Appreciation
(Depreciation) |
| Appreciation | | SELL | | EUR | | 1,603,633 | | 2/19/09 | | $ | 2,298,727 | | $ | 2,225,111 | | $ | 73,616 |
Swap Agreements at 12/31/08
| | | | | | | | | | | | | | |
| Expiration | | Notional
Amount | | | Counterparty | | Cash Flows to
Receive | | Cash Flows to Pay | | Value | |
| Credit Default Swaps | | | | | | | | | | |
| 6/20/09 | | USD | | 1,200,000 | | | JPMorgan Chase Bank | | 4.10% (fixed rate) | | (1) | | $(794,426 | ) |
| 6/20/12 | | USD | | 1,200,000 | | | Morgan Stanley Capital Services, Inc. | | 3.76% (fixed rate) | | (2) | | (924,378 | ) |
| 6/20/12 | | USD | | 600,000 | | | Morgan Stanley Capital Services, Inc. | | 4.15% (fixed rate) | | (2) | | (460,457 | ) |
| 6/20/13 | | USD | | 1,295,000 | (a) | | Goldman Sachs International | | 5.00% (fixed rate) | | (3) | | (1,012,170 | ) |
| | | | | | | | | | | | | | |
| | | | | | | | | | | | | $(3,191,431 | ) |
| | | | | | | | | | | | | | |
| (1) | Fund, as protection seller, to pay notional amount upon a defined credit event by Abitibi-Consolidated, Inc., 8.375%, 4/01/15, a Caa2 rated bond. The fund entered into the contract to gain issuer exposure. |
| (2) | Fund, as protection seller, to pay notional amount upon a defined credit event by Bowater, Inc., 6.5%, 6/15/13, a Caa2 rated bond. The fund entered into the contract to gain issuer exposure. |
| (3) | Fund, as protection seller, to pay notional amount upon a defined credit event by Station Casinos, Inc., 6%, 4/01/12, a Caa3 rated bond. The fund entered into the contract to gain issuer exposure. |
| (a) | Net unamortized premiums received by the fund amounted to $198,430. |
The credit ratings presented here are an indicator of the current payment/performance risk of the related swap, the reference obligation for which may be either a single security or, in case of a credit default index, a basket of securities issued by corporate or sovereign issuers. Each reference security, including each individual security within a reference basket of securities, is assigned a rating from Moody’s Investor Service. If not rated by Moody’s, the rating will be that assigned by Standard & Poor’s. Likewise, if not assigned by Standard & Poor’s, it will be based on the rating assigned by Fitch, Inc. The ratings for a credit default index are calculated by MFS as a weighted average of the external credit ratings of the individual securities that compose the index’s reference basket of securities.
At December 31, 2008, the fund had sufficient cash and/or other liquid securities to cover any commitments under these derivative contracts.
See Notes to Financial Statements
13
FINANCIAL STATEMENTS | STATEMENT OF ASSETS AND LIABILITIES
This statement represents your fund’s balance sheet, which details the assets and liabilities comprising the total value of the fund.
| | | | | |
At 12/31/08 | | | | | |
Assets | | | | | |
Investments, at value (identified cost, $281,549,768) | | $193,382,479 | | | |
Cash | | 781,529 | | | |
Restricted cash | | 2,080,000 | | | |
Receivable for forward foreign currency exchange contracts | | 73,616 | | | |
Receivable for investments sold | | 67,474 | | | |
Receivable for fund shares sold | | 3,240,256 | | | |
Interest and dividends receivable | | 4,880,198 | | | |
Other assets | | 10,094 | | | |
Total assets | | | | | $204,515,646 |
Liabilities | | | | | |
Payable for investments purchased | | $1,341,967 | | | |
Payable for fund shares reacquired | | 50,558 | | | |
Swaps, at value (net unamortized premiums received, $198,430) | | 3,191,431 | | | |
Payable to affiliates | | | | | |
Management fee | | 7,403 | | | |
Distribution and service fees | | 1,364 | | | |
Administrative services fee | | 570 | | | |
Payable for trustees’ compensation | | 212 | | | |
Accrued expenses and other liabilities | | 147,834 | | | |
Total liabilities | | | | | $4,741,339 |
Net assets | | | | | $199,774,307 |
Net assets consist of | | | | | |
Paid-in capital | | $387,861,149 | | | |
Unrealized appreciation (depreciation) on investments and translation of assets and liabilities in foreign currencies | | (91,092,603 | ) | | |
Accumulated net realized gain (loss) on investments and foreign currency transactions | | (120,860,161 | ) | | |
Undistributed net investment income | | 23,865,922 | | | |
Net assets | | | | | $199,774,307 |
Shares of beneficial interest outstanding | | | | | 47,198,112 |
Initial Class shares | | | | | |
Net assets | | $96,604,858 | | | |
Shares outstanding | | 22,721,204 | | | |
Net asset value per share | | | | | $4.25 |
Service Class shares | | | | | |
Net assets | | $103,169,449 | | | |
Shares outstanding | | 24,476,908 | | | |
Net asset value per share | | | | | $4.21 |
See Notes to Financial Statements
14
FINANCIAL STATEMENTS | STATEMENT OF OPERATIONS
This statement describes how much your fund earned in investment income and accrued in expenses. It also describes any gains and/or losses generated by fund operations.
| | | | | | |
| Year ended 12/31/08 | | | | | | |
| Net investment income | | | | | | |
Income | | | | | | |
Interest | | $25,093,646 | | | | |
Dividends | | 228,522 | | | | |
Foreign taxes withheld | | (1,531 | ) | | | |
Total investment income | | | | | $25,320,637 | |
Expenses | | | | | | |
Management fee | | $2,009,878 | | | | |
Distribution fees | | 323,508 | | | | |
Administrative services fee | | 81,979 | | | | |
Trustees’ compensation | | 34,252 | | | | |
Custodian fee | | 69,884 | | | | |
Shareholder communications | | 89,898 | | | | |
Auditing fees | | 61,488 | | | | |
Legal fees | | 10,113 | | | | |
Miscellaneous | | 23,784 | | | | |
Total expenses | | | | | $2,704,784 | |
Fees paid indirectly | | (7,504 | ) | | | |
Reduction of expenses by investment adviser | | (134,371 | ) | | | |
Net expenses | | | | | $2,562,909 | |
Net investment income | | | | | $22,757,728 | |
| Realized and unrealized gain (loss) on investments and foreign currency transactions | | | | | | |
Realized gain (loss) (identified cost basis) | | | | | | |
Investment transactions | | $(23,078,906 | ) | | | |
Swap transactions | | 221,326 | | | | |
Foreign currency transactions | | 107,767 | | | | |
Net realized gain (loss) on investments and foreign currency transactions | | | | | $(22,749,813 | ) |
Change in unrealized appreciation (depreciation) | | | | | | |
Investments | | $(76,237,213 | ) | | | |
Swap transactions | | (2,537,427 | ) | | | |
Translation of assets and liabilities in foreign currencies | | 67,687 | | | | |
Net unrealized gain (loss) on investments and foreign currency translation | | | | | $(78,706,953 | ) |
Net realized and unrealized gain (loss) on investments and foreign currency | | | | | $(101,456,766 | ) |
Change in net assets from operations | | | | | $(78,699,038 | ) |
See Notes to Financial Statements
15
FINANCIAL STATEMENTS | STATEMENTS OF CHANGES IN NET ASSETS
These statements describe the increases and/or decreases in net assets resulting from operations, any distributions, and any shareholder transactions.
| | | | | | |
For years ended 12/31 | | 2008 | | | 2007 | |
Change in net assets | | | | | | |
From operations | | | | | | |
Net investment income | | $22,757,728 | | | $24,674,445 | |
Net realized gain (loss) on investments and foreign currency transactions | | (22,749,813 | ) | | 1,382,911 | |
Net unrealized gain (loss) on investments and foreign currency translation | | (78,706,953 | ) | | (19,569,542 | ) |
Change in net assets from operations | | $(78,699,038 | ) | | $6,487,814 | |
Distributions declared to shareholders | | | | | | |
From net investment income | | | | | | |
Initial Class | | $(13,147,666 | ) | | $(15,332,557 | ) |
Service Class | | (11,985,728 | ) | | (10,039,719 | ) |
Total distributions declared to shareholders | | $(25,133,394 | ) | | $(25,372,276 | ) |
Change in net assets from fund share transactions | | $(20,962,942 | ) | | $(12,797,321 | ) |
Total change in net assets | | $(124,795,374 | ) | | $(31,681,783 | ) |
Net assets | | | | | | |
At beginning of period | | 324,569,681 | | | 356,251,464 | |
At end of period (including undistributed net investment income of $23,865,922 and
$25,441,945, respectively) | | $199,774,307 | | | $324,569,681 | |
See Notes to Financial Statements
16
FINANCIAL STATEMENTS | FINANCIAL HIGHLIGHTS
The financial highlights table is intended to help you understand the fund’s financial performance for the past 5 years. Certain information reflects financial results for a single fund share. The total returns in the table represent the rate by which an investor would have earned (or lost) on an investment in the fund share class (assuming reinvestment of all distributions) held for the entire period.
| | | | | | | | | | | | | | | |
| Initial Class | | Years ended 12/31 | |
| | | 2008 | | | 2007 | | | 2006 | | | 2005 | | | 2004 | |
Net asset value, beginning of period | | $6.56 | | | $6.93 | | | $6.83 | | | $7.32 | | | $7.27 | |
| Income (loss) from investment operations | | | | | | | | | | | | | | | |
Net investment income (d) | | $0.49 | | | $0.49 | | | $0.48 | | | $0.49 | | | $0.52 | |
Net realized and unrealized gain (loss) on investments
and foreign currency | | (2.26 | ) | | (0.34 | ) | | 0.19 | | | (0.36 | ) | | 0.11 | |
Total from investment operations | | $(1.77 | ) | | $0.15 | | | $0.67 | | | $0.13 | | | $0.63 | |
| Less distributions declared to shareholders | | | | | | | | | | | | | | | |
From net investment income | | $(0.54 | ) | | $(0.52 | ) | | $(0.57 | ) | | $(0.62 | ) | | $(0.58 | ) |
Net asset value, end of period | | $4.25 | | | $6.56 | | | $6.93 | | | $6.83 | | | $7.32 | |
Total return (%) (k)(r)(s) | | (29.50 | ) | | 1.93 | | | 10.39 | | | 2.19 | | | 9.54 | |
| Ratios (%) (to average net assets) and Supplemental data: | | | | | | | | | | | | | | | |
Expenses before expense reductions (f) | | 0.89 | | | 0.84 | | | 0.85 | | | 0.86 | | | 0.83 | |
Expenses after expense reductions (f) | | 0.84 | | | 0.79 | | | 0.83 | | | N/A | | | N/A | |
Net investment income | | 8.60 | | | 7.25 | | | 7.14 | | | 7.06 | | | 7.27 | |
Portfolio turnover | | 63 | | | 69 | | | 92 | | | 53 | | | 68 | |
Net assets at end of period (000 Omitted) | | $96,605 | | | $175,408 | | | $224,412 | | | $255,999 | | | $319,653 | |
| | | | | | | | | | | | | | | |
| Service Class | | Years ended 12/31 | |
| | | 2008 | | | 2007 | | | 2006 | | | 2005 | | | 2004 | |
Net asset value, beginning of period | | $6.50 | | | $6.88 | | | $6.79 | | | $7.28 | | | $7.23 | |
| Income (loss) from investment operations | | | | | | | | | | | | | | | |
Net investment income (d) | | $0.47 | | | $0.47 | | | $0.46 | | | $0.47 | | | $0.49 | |
Net realized and unrealized gain (loss) on investments
and foreign currency | | (2.24 | ) | | (0.35 | ) | | 0.19 | | | (0.36 | ) | | 0.12 | |
Total from investment operations | | $(1.77 | ) | | $0.12 | | | $0.65 | | | $0.11 | | | $0.61 | |
| Less distributions declared to shareholders | | | | | | | | | | | | | | | |
From net investment income | | $(0.52 | ) | | $(0.50 | ) | | $(0.56 | ) | | $(0.60 | ) | | $(0.56 | ) |
Net asset value, end of period | | $4.21 | | | $6.50 | | | $6.88 | | | $6.79 | | | $7.28 | |
Total return (%) (k)(r)(s) | | (29.64 | ) | | 1.56 | | | 10.04 | | | 1.93 | | | 9.37 | |
| Ratios (%) (to average net assets) and Supplemental data: | | | | | | | | | | | | | | | |
Expenses before expense reductions (f) | | 1.14 | | | 1.09 | | | 1.10 | | | 1.11 | | | 1.08 | |
Expenses after expense reductions (f) | | 1.09 | | | 1.04 | | | 1.08 | | | N/A | | | N/A | |
Net investment income | | 8.38 | | | 7.01 | | | 6.89 | | | 6.81 | | | 6.99 | |
Portfolio turnover | | 63 | | | 69 | | | 92 | | | 53 | | | 68 | |
Net assets at end of period (000 Omitted) | | $103,169 | | | $149,162 | | | $131,839 | | | $111,348 | | | $109,914 | |
| (d) | Per share data is based on average shares outstanding. |
| (f) | Ratios do not reflect reductions from fees paid indirectly, if applicable. |
| (k) | The total return does not reflect expenses that apply to separate accounts. Inclusion of these charges would reduce the total return figures for all periods shown. |
| (r) | Certain expenses have been reduced without which performance would have been lower. |
| (s) | From time to time the fund may receive proceeds from litigation settlements, without which performance would be lower. |
See Notes to Financial Statements
17
NOTES TO FINANCIAL STATEMENTS
| (1) | | Business and Organization |
MFS High Yield Portfolio (the fund) is a series of MFS Variable Insurance Trust II (the trust). The trust is organized as a Massachusetts business trust and is registered under the Investment Company Act of 1940, as amended, as an open-end management investment company. The shares of the fund are sold to variable accounts established by insurance companies to fund benefits under variable contracts issued by such companies, and qualified retirement and pension plans.
| (2) | | Significant Accounting Policies |
General – The preparation of financial statements in conformity with U.S. generally accepted accounting principles requires management to make estimates and assumptions that affect the reported amounts of assets and liabilities, and disclosure of contingent assets and liabilities at the date of the financial statements and the reported amounts of revenues and expenses during the reporting period. Actual results could differ from those estimates. The fund can invest up to 100% of its portfolio in high-yield securities rated below investment grade. Investments in high-yield securities involve greater degrees of credit and market risk than investments in higher-rated securities and tend to be more sensitive to economic conditions. The fund can invest in foreign securities, including securities of emerging market issuers. Investments in foreign securities are vulnerable to the effects of changes in the relative values of the local currency and the U.S. dollar and to the effects of changes in each country’s legal, political, and economic environment. The markets of emerging markets countries are generally more volatile than the markets of developed countries with more mature economies. All of the risks of investing in foreign securities previously described are heightened when investing in emerging markets countries.
Investment Valuations – Equity securities, including restricted equity securities, are generally valued at the last sale or official closing price as reported by a third party pricing service on the market or exchange on which they are primarily traded. For securities for which there were no sales reported that day, equity securities are generally valued at the last quoted daily bid quotation as reported by a third party pricing service on the market or exchange on which they are primarily traded. For securities held short for which there were no sales reported for the day, the position is generally valued at the last quoted daily ask quotation as reported by a third party pricing service on the market or exchange on which such securities are primarily traded. Debt instruments and floating rate loans (other than short-term instruments), including restricted debt instruments, are generally valued at an evaluated or composite bid as reported by a third party pricing service. Short-term instruments with a maturity at issuance of 60 days or less may be valued at amortized cost, which approximates market value. Forward foreign currency contracts are generally valued at the mean of bid and asked prices for the time period interpolated from rates reported by a third party pricing service for proximate time periods. Swaps are generally valued at an evaluated bid as reported by a third party pricing service. Securities and other assets generally valued on the basis of information from a third party pricing service may also be valued at a broker-dealer bid quotation. Values obtained from pricing services can utilize both dealer-supplied valuations and electronic data processing techniques, which take into account factors such as institutional-size trading in similar groups of securities, yield, quality, coupon rate, maturity, type of issue, trading characteristics, and other market data. The values of foreign securities and other assets and liabilities expressed in foreign currencies are converted to U.S. dollars using the mean of bid and asked prices for rates reported by a third party pricing service.
The Board of Trustees has delegated primary responsibility for determining or causing to be determined the value of the fund’s investments (including any fair valuation) to the adviser pursuant to valuation policies and procedures approved by the Board. If the adviser determines that reliable market quotations are not readily available, investments are valued at fair value as determined in good faith by the adviser in accordance with such procedures under the oversight of the Board of Trustees. Under the fund’s valuation policies and procedures, market quotations are not considered to be readily available for most types of debt instruments and floating rate loans and many types of derivatives. These investments are generally valued at fair value based on information from third party pricing services. In addition, investments may be valued at fair value if the adviser determines that an investment’s value has been materially affected by events occurring after the close of the exchange or market on which the investment is principally traded (such as foreign exchange or market) and prior to the determination of the fund’s net asset value, or after the halting of trading of a specific security where trading does not resume prior to the close of the exchange or market on which the security is principally traded. The adviser may rely on third party pricing services or other information (such as the correlation with price movements of similar securities in the same or other markets; the type, cost and investment characteristics of the security; the business and financial condition of the issuer; and trading and other market data) to assist in determining whether to fair value and at what value to fair value an investment. The value of an investment for purposes of calculating the fund’s net asset value can differ depending on the source and method used to determine value. When fair valuation is used, the value of investments used to determine the fund’s net asset value may differ from quoted or published prices for the same investments.
The fund adopted FASB Statement No. 157, Fair Value Measurements (the “Statement”). This Statement provides a single definition of fair value, a hierarchy for measuring fair value and expanded disclosures about fair value measurements.
18
Notes to Financial Statements – continued
Various inputs are used in determining the value of the fund’s assets or liabilities carried at market value. These inputs are categorized into three broad levels. Level 1 includes quoted prices in active markets for identical assets or liabilities. Level 2 includes other significant observable market-based inputs (including quoted prices for similar securities, interest rates, prepayment speed, and credit risk). Level 3 includes unobservable inputs, which may include the adviser’s own assumptions in determining the fair value of investments. Other financial instruments are derivative instruments not reflected in total investments, such as futures, forwards, swap contracts and written options. The following is a summary of the levels used as of December 31, 2008 in valuing the fund’s assets or liabilities carried at market value:
| | | | | | | | | | |
| | | Level 1 | | Level 2 | | | Level 3 | | Total | |
| Investments in Securities | | $4,147,227 | | $189,235,252 | | | $— | | $193,382,479 | |
| Other Financial Instruments | | $— | | $(3,117,815 | ) | | $— | | $(3,117,815 | ) |
Repurchase Agreements – The fund may enter into repurchase agreements with approved counterparties. Each repurchase agreement is recorded at cost. The fund requires that the securities collateral in a repurchase transaction be transferred to a custodian. The fund monitors, on a daily basis, the value of the collateral to ensure that its value, including accrued interest, is greater than amounts owed to the fund under each such repurchase agreement. The fund and other funds managed by Massachusetts Financial Services Company (MFS), may utilize a joint trading account for the purpose of entering into one or more repurchase agreements.
Foreign Currency Translation – Purchases and sales of foreign investments, income, and expenses are converted into U.S. dollars based upon currency exchange rates prevailing on the respective dates of such transactions or on the reporting date for foreign denominated receivables and payables. Gains and losses attributable to foreign currency exchange rates on sales of securities are recorded for financial statement purposes as net realized gains and losses on investments. Gains and losses attributable to foreign exchange rate movements on receivables, payables, income and expenses are recorded for financial statement purposes as foreign currency transaction gains and losses. That portion of both realized and unrealized gains and losses on investments that results from fluctuations in foreign currency exchange rates is not separately disclosed.
Derivative Risk – The fund may invest in derivatives for hedging or non-hedging purposes. While hedging can reduce or eliminate losses, it can also reduce or eliminate gains. When the fund uses derivatives as an investment to gain market exposure, or for hedging purposes, gains and losses from derivative instruments may be substantially greater than the derivative’s original cost. Cash that has been segregated on behalf of certain derivative contracts will be reported separately on the Statement of Assets and Liabilities as restricted cash. On some over-the-counter derivatives, the fund attempts to reduce its exposure to counterparty credit risk by entering into an ISDA Master Agreement on a bilateral basis with each of the counterparties with whom it undertakes a significant volume of transactions. The ISDA Master Agreement gives the fund the right, upon an event of default by the applicable counterparty, to close out all transactions traded under such agreement and to net amounts owed under each transaction to one net amount payable by one party to the other. This right to close out and net payments across all transactions traded under the ISDA Master Agreement could result in a reduction of the fund’s credit risk to such counterparty equal to any amounts payable by the fund under the applicable transactions, if any. However, absent an event of default by the counterparty, the ISDA Master Agreement does not result in an offset of reported balance sheet assets and liabilities across transactions between the fund and the applicable counterparty. Derivative instruments include forward foreign currency exchange contracts and swap agreements.
In March 2008, FASB Statement No. 161, Disclosures about Derivative Instruments and Hedging Activities (the “Standard”) was issued, and is effective for financial statements issued for fiscal years and interim periods beginning after November 15, 2008. This Standard provides enhanced disclosures about the fund’s use of and accounting for derivative instruments and the effect of derivative instruments on the fund’s results of operations and financial position. Management is evaluating the application of the Standard to the fund, and has not at this time determined the impact, if any, resulting from the adoption of this Standard on the fund’s financial statements.
FASB Staff Position (FSP) 133-1 was implemented during the period. FSP 133-1 amends FAS 133 to require sellers of credit derivatives to make disclosures that will enable financial statement users to assess the potential effects of those credit derivatives on an entity’s financial position, financial performance and cash flows. Accordingly, appropriate disclosures have been included within the Swap Agreements table in the Portfolio of Investments and Significant Accounting Policies.
Forward Foreign Currency Exchange Contracts – The fund may enter into forward foreign currency exchange contracts for the purchase or sale of a specific foreign currency at a fixed price on a future date. Risks may arise upon entering into these contracts from the potential inability of counterparties to meet the terms of their contracts and from unanticipated movements in the value of the contract. The fund may enter into forward foreign currency exchange contracts for hedging purposes as well as for non-hedging purposes. For hedging purposes, the fund may enter into contracts to deliver or receive foreign currency it will receive from or require for its normal investment activities. The fund may also use contracts in a manner intended to
19
Notes to Financial Statements – continued
protect foreign currency denominated securities from declines in value due to unfavorable exchange rate movements. For non-hedging purposes, the fund may enter into contracts with the intent of changing the relative exposure of the fund’s portfolio of securities to different currencies to take advantage of anticipated changes. The forward foreign currency exchange contracts are adjusted by the daily exchange rate of the underlying currency and any gains or losses are recorded as unrealized until the contract settlement date. On contract settlement date, the gains or losses are recorded as realized gains or losses on foreign currency transactions.
Swap Agreements – The fund may enter into swap agreements. A swap is generally an exchange of cash payments, at specified intervals or upon the occurrence of specified events, between the fund and a counterparty. The net cash payments exchanged are recorded as a realized gain or loss on swap transactions in the Statement of Operations. The value of the swap, which is adjusted daily and includes any related interest accruals to be paid or received by the fund, is recorded on the Statement of Assets and Liabilities. The daily change in value, including any related interest accruals to be paid or received, is recorded as unrealized appreciation or depreciation on swap transactions in the Statement of Operations. Amounts paid or received at the inception of the swap are reflected as premiums paid or received on the Statement of Assets and Liabilities and are amortized using the effective interest method over the term of the agreement. A liquidation payment received or made upon early termination is recorded as a realized gain or loss on swap transactions in the Statement of Operations.
Risks related to swap agreements include the possible lack of a liquid market, unfavorable market and interest rate movements of the underlying instrument and the failure of the counterparty to perform under the terms of the agreements. To address counterparty risk, swap transactions are limited to only highly-rated counterparties and collateral, in the form of cash or securities, may be required to be posted by the counterparty to the fund and held in segregated accounts with the fund’s custodian. Counterparty risk is further mitigated by having ISDA Master Agreements between the fund and its counterparties providing for netting as described above.
The fund may enter into credit default swaps to manage its exposure to the market or certain sectors of the market, to reduce its credit risk exposure to defaults of corporate and sovereign issuers or to create exposure to corporate or sovereign issuers to which it is not otherwise exposed. In a credit default swap, the protection buyer makes a stream of payments based on a fixed percentage applied to the contract notional amount to the protection seller in exchange for the right to receive a specified return upon the occurrence of a defined credit event on the reference obligation (which may be either a single security or a basket of securities issued by corporate or sovereign issuers) and, with respect to swap transactions where physical settlement applies, the delivery by the buyer to the seller of a deliverable reference obligation as defined by the contract. Although contract-specific, credit events generally consist of a combination of the following: bankruptcy, failure to pay, restructuring, obligation acceleration, obligation default, or repudiation/moratorium, each as defined in the 2003 ISDA Credit Derivatives Definitions as amended by the relevant contract. Obligation acceleration, obligation default, or repudiation/moratorium are generally applicable when the reference obligation is issued by a sovereign entity or an entity in an emerging country. In the event that a defined credit event occurs, the protection buyer, under the terms of the swap contract, designates which security will be delivered to satisfy the reference obligation. Upon designation of the reference security (or upon delivery of the reference security in the case of physical settlement), the difference between the value of the reference obligation and the swap’s notional amount is recorded as realized gain or loss on swap transactions in the Statement of Operations.
Absent any recoveries under recourse or collateral provisions, the maximum amount of future, undiscounted payments that the fund, as protection seller, could be required to make is equal to the swap’s notional amount. The protection seller’s payment obligation would be offset to the extent of the value of the contract’s reference obligation.
Hybrid Instruments – The fund may invest in indexed or hybrid securities on which any combination of interest payments, the principal or stated amount payable at maturity is determined by reference to prices of other securities, currencies, indexes, economic factors or other measures, including interest rates, currency exchange rates, or securities indices. The risks of investing in hybrid instruments reflect a combination of the risks of investing in securities, swaps, options, futures and currencies. Hybrid instruments are potentially more volatile and carry greater market risks than traditional debt instruments. Depending on the structure of the particular hybrid instrument, changes in a benchmark, underlying assets or economic indicator may be magnified by the terms of the hybrid instrument and have an even more dramatic and substantial effect upon the value of the hybrid instrument. Also, the prices of the hybrid instrument and the benchmark, underlying asset or economic indicator may not move in the same direction or at the same time.
Loans and Other Direct Debt Instruments – The fund may invest in loans and loan participations or other receivables. These investments may include standby financing commitments, including revolving credit facilities, which obligate the fund to supply additional cash to the borrower on demand. At December 31, 2008, the portfolio had unfunded loan commitments of $35,558, which could be extended at the option of the borrower and which are covered by sufficient cash and/or liquid
20
Notes to Financial Statements – continued
securities held by the fund. The market value and obligation of the fund on these unfunded loan commitments is included in Investments, at value and Payable for investments purchased, respectively, on the Statement of Assets and Liabilities. Loan participations involve a risk of insolvency of the lending bank or other financial intermediary.
Indemnifications – Under the fund’s organizational documents, its officers and trustees may be indemnified against certain liabilities and expenses arising out of the performance of their duties to the fund. Additionally, in the normal course of business, the fund enters into agreements with service providers that may contain indemnification clauses. The fund’s maximum exposure under these agreements is unknown as this would involve future claims that may be made against the fund that have not yet occurred.
Investment Transactions and Income – Investment transactions are recorded on the trade date. Interest income is recorded on the accrual basis. All premium and discount is amortized or accreted for financial statement purposes in accordance with U.S. generally accepted accounting principles. The fund earns certain fees in connection with its floating rate loan purchasing activities. These fees are in addition to interest payments earned and may include amendment fees, commitment fees, facility fees, consent fees, and prepayment fees. Commitment fees are recorded on an accrual basis as income in the accompanying financial statements. Dividends received in cash are recorded on the ex-dividend date. Certain dividends from foreign securities will be recorded when the fund is informed of the dividend if such information is obtained subsequent to the ex-dividend date. Dividend and interest payments received in additional securities are recorded on the ex-dividend or ex-interest date in an amount equal to the value of the security on such date.
The fund may receive proceeds from litigation settlements. Any proceeds received from litigation involving portfolio holdings are reflected in the Statement of Operations in realized gain/loss if the security has been disposed of by the fund or in unrealized gain/loss if the security is still held by the fund. Any other proceeds from litigation not related to portfolio holdings are reflected as other income in the Statement of Operations.
Fees Paid Indirectly – The fund’s custody fee may be reduced according to an arrangement that measures the value of cash deposited with the custodian by the fund. This amount, for the year ended December 31, 2008, is shown as a reduction of total expenses on the Statement of Operations.
Tax Matters and Distributions – The fund intends to qualify as a regulated investment company, as defined under Subchapter M of the Internal Revenue Code, and to distribute all of its taxable income, including realized capital gains. As a result, no provision for federal income tax is required. Each of the fund’s federal tax returns for the prior three fiscal years remains subject to examination by the Internal Revenue Service. Foreign taxes, if any, have been accrued by the fund in the accompanying financial statements.
Distributions to shareholders are recorded on the ex-dividend date. Income and capital gain distributions are determined in accordance with income tax regulations, which may differ from U.S. generally accepted accounting principles. Certain capital accounts in the financial statements are periodically adjusted for permanent differences in order to reflect their tax character. These adjustments have no impact on net assets or net asset value per share. Temporary differences which arise from recognizing certain items of income, expense, gain or loss in different periods for financial statement and tax purposes will reverse at some time in the future. Distributions in excess of net investment income or net realized gains are temporary overdistributions for financial statement purposes resulting from differences in the recognition or classification of income or distributions for financial statement and tax purposes.
Book/tax differences primarily relate to expiration of capital loss carryforwards, amortization and accretion of debt securities, defaulted bonds, wash sale loss deferrals, and derivative transactions.
The tax character of distributions declared to shareholders for the last two fiscal years is as follows:
| | | | |
| | | 12/31/08 | | 12/31/07 |
| Ordinary income (including any short-term capital gains) | | $25,133,394 | | $25,372,276 |
The federal tax cost and the tax basis components of distributable earnings were as follows:
| | | |
| As of 12/31/08 | | | |
| Cost of investments | | $282,709,716 | |
| Gross appreciation | | 1,564,289 | |
| Gross depreciation | | (90,891,526 | ) |
| Net unrealized appreciation (depreciation) | | $(89,327,237 | ) |
| Undistributed ordinary income | | 21,194,959 | |
| Capital loss carryforwards | | (119,653,677 | ) |
| Other temporary differences | | (300,887 | ) |
21
Notes to Financial Statements – continued
As of December 31, 2008, the fund had capital loss carryforwards available to offset future realized gains. Such losses expire as follows:
| | | |
| 12/31/09 | | $(37,568,488 | ) |
| 12/31/10 | | (46,740,625 | ) |
| 12/31/13 | | (5,089,839 | ) |
| 12/31/14 | | (7,011,353 | ) |
| 12/31/16 | | (23,243,372 | ) |
| | $(119,653,677 | ) |
Multiple Classes of Shares of Beneficial Interest – The fund offers multiple classes of shares, which differ in their respective distribution fees. The fund’s income, realized and unrealized gain (loss), and common expenses are allocated to shareholders based on the daily net assets of each class. Dividends are declared separately for each class. Differences in per share dividend rates are generally due to differences in separate class expenses.
| (3) | | Transactions with Affiliates |
Investment Adviser – The fund has an investment advisory agreement with MFS to provide overall investment management and related administrative services and facilities to the fund. The management fee is computed daily and paid monthly at an annual rate of 0.75% of the fund’s average daily net assets. The investment adviser has agreed in writing to reduce its management fee to 0.70% for the first $1 billion of average daily net assets and 0.65% of average daily net assets in excess of $1 billion. This written agreement will continue until April 30, 2010. This management fee reduction amounted to $134,371, which is shown as a reduction of total expenses in the Statement of Operations. The management fee incurred for the year ended December 31, 2008 was equivalent to an annual effective rate of 0.70% of the fund’s average daily net assets.
The investment adviser has agreed in writing to pay a portion of the fund’s total annual operating expenses, exclusive of interest, taxes, extraordinary expenses, and brokerage commissions, such that total annual fund operating expenses do not exceed 1.25% of the fund’s average daily net assets. MFS’ agreement to limit the fund’s total annual operating expenses is contained in the investment advisory agreement between MFS and the fund and may not be rescinded without shareholder approval. In addition, the investment adviser has voluntarily agreed to pay a portion of the fund’s total annual operating expenses, exclusive of interest, taxes, extraordinary expenses, and brokerage commissions, such that total annual operating expenses do not exceed 1.00% of the fund’s average daily net assets attributable to Initial Class shares. This voluntary agreement may be changed or rescinded at any time by MFS. For the year ended December 31, 2008, the fund’s actual operating expenses did not exceed the limit and therefore, the investment adviser did not pay a portion of the fund’s expenses.
In addition, the investment adviser has agreed in writing to pay a portion of the fund’s total annual operating expenses, exclusive of interest, taxes, extraordinary expenses, brokerage and transaction costs, and investment-related expenses, such that total annual operating expenses do not exceed 1.00% annually of average daily net assets for the Initial Class shares and 1.25% annually of average daily net assets for the Service Class shares. This written agreement will continue until April 30, 2010. For the year ended December 31, 2008, the fund’s actual operating expenses did not exceed the limit and therefore, the investment adviser did not pay any portion of the fund’s expenses.
Distributor – MFS Fund Distributors, Inc. (MFD), a wholly-owned subsidiary of MFS, is the distributor of shares of the fund. The Trustees have adopted a distribution plan for the Service Class shares pursuant to Rule 12b-1 under the Investment Company Act of 1940.
The fund’s distribution plan provides that the fund will pay MFD distribution fees equal to 0.25% per annum of its average daily net assets attributable to Service Class shares as partial consideration for services performed and expenses incurred by MFD and financial intermediaries in connection with the sale and distribution of the fund’s Service Class shares and the sale and distribution of the variable annuity or variable life insurance contracts investing indirectly in Service Class shares. MFD may subsequently pay all, or a portion, of the distribution fees to financial intermediaries.
Shareholder Servicing Agent – MFS Service Center, Inc. (MFSC), a wholly-owned subsidiary of MFS, has contracted to provide transfer agent and recordkeeping functions in connection with the issuance, transfer, and redemption of each class of shares of the fund under a Shareholder Servicing Agent Agreement. During the year ended December 31, 2008, the fund did not pay MFSC a fee for this service.
Administrator – MFS provides certain financial, legal, shareholder communications, compliance, and other administrative services to the fund. Under an administrative services agreement, the fund partially reimburses MFS the costs incurred to provide these services. The fund is charged an annual fixed amount of $10,000 plus a fee based on average daily net assets.
The administrative services fee incurred for the year ended December 31, 2008 was equivalent to an annual effective rate of 0.0306% of the fund’s average daily net assets.
22
Notes to Financial Statements – continued
Trustees’ and Officers’ Compensation – The fund pays compensation to trustees in the form of a retainer, attendance fees, and additional compensation to the Board chairperson. The fund does not pay compensation directly to officers of the fund who are also officers of the investment adviser, all of whom receive remuneration for their services to the fund from MFS. Certain officers of the fund are officers or directors of MFS, MFD, and MFSC.
Other – This fund and certain other MFS funds (the funds) have entered into services agreements (the Agreements) which provide for payment of fees by the funds to Tarantino LLC and Griffin Compliance LLC in return for the provision of services of an Independent Chief Compliance Officer (ICCO) and Assistant ICCO, respectively, for the funds. The ICCO and Assistant ICCO are officers of the funds and the sole members of Tarantino LLC and Griffin Compliance LLC, respectively. The funds can terminate the Agreements with Tarantino LLC and Griffin Compliance LLC at any time under the terms of the Agreements. MFS has agreed to bear all expenses associated with office space, other administrative support, and supplies provided to the ICCO and Assistant ICCO. For the year ended December 31, 2008, the aggregate fees paid by the fund to Tarantino LLC and Griffin Compliance LLC were $2,484 and are included in miscellaneous expense on the Statement of Operations.
Purchases and sales of investments, other than U.S. Government securities, purchased option transactions, and short-term obligations, aggregated $159,388,607 and $192,389,992, respectively.
| (5) | | Shares of Beneficial Interest |
The fund’s Declaration of Trust permits the Trustees to issue an unlimited number of full and fractional shares of beneficial interest. Transactions in fund shares were as follows:
| | | | | | | | | | | | |
| | | Year ended 12/31/08 | | | Year ended 12/31/07 | |
| | | Shares | | | Amount | | | Shares | | | Amount | |
| Shares sold | | | | | | | | | | | | |
Initial Class | | 2,668,236 | | | $13,260,670 | | | 1,097,309 | | | $7,281,527 | |
Service Class | | 5,487,552 | | | 24,860,434 | | | 5,200,205 | | | 34,692,961 | |
| | 8,155,788 | | | $38,121,104 | | | 6,297,514 | | | $41,974,488 | |
| Shares issued to shareholders in reinvestment of distributions | | | | | | | | | | | | |
Initial Class | | 2,151,827 | | | $13,147,666 | | | 2,278,240 | | | $15,332,557 | |
Service Class | | 1,974,585 | | | 11,985,728 | | | 1,500,705 | | | 10,039,719 | |
| | 4,126,412 | | | $25,133,394 | | | 3,778,945 | | | $25,372,276 | |
| Shares reacquired | | | | | | | | | | | | |
Initial Class | | (8,850,420 | ) | | $(51,391,122 | ) | | (8,997,898 | ) | | $(60,695,053 | ) |
Service Class | | (5,915,569 | ) | | (32,826,318 | ) | | (2,925,600 | ) | | (19,449,032 | ) |
| | (14,765,989 | ) | | $(84,217,440 | ) | | (11,923,498 | ) | | $(80,144,085 | ) |
| Net change | | | | | | | | | | | | |
Initial Class | | (4,030,357 | ) | | $(24,982,786 | ) | | (5,622,349 | ) | | $(38,080,969 | ) |
Service Class | | 1,546,568 | | | 4,019,844 | | | 3,775,310 | | | 25,283,648 | |
| | (2,483,789 | ) | | $(20,962,942 | ) | | (1,847,039 | ) | | $(12,797,321 | ) |
The fund and other funds managed by MFS participate in a $1 billion unsecured committed line of credit provided by a syndication of banks under a credit agreement. In addition, the fund and other funds managed by MFS have established uncommitted borrowing arrangements with certain banks. Borrowings may be made for temporary financing needs. Interest is charged to each fund, based on its borrowings, generally at a rate equal to the Federal Reserve funds rate plus 0.30%. In addition, a commitment fee, based on the average daily, unused portion of the committed line of credit, is allocated among the participating funds at the end of each calendar quarter. For the year ended December 31, 2008, the fund’s commitment fee and interest expense were $1,347 and $0, respectively, and are included in miscellaneous expense on the Statement of Operations.
23
REPORT OF INDEPENDENT REGISTERED PUBLIC ACCOUNTING FIRM
To the Board of Trustees of MFS Variable Insurance Trust II and the Shareholders of
MFS High Yield Portfolio:
We have audited the accompanying statement of assets and liabilities, including the portfolio of investments, of MFS High Yield Portfolio (the “Fund”) (one of the portfolios comprising MFS Variable Insurance Trust II) as of December 31, 2008, and the related statement of operations for the year then ended, the statements of changes in net assets for each of the two years in the period then ended, and the financial highlights for each of the five years in the period then ended. These financial statements and financial highlights are the responsibility of the Fund’s management. Our responsibility is to express an opinion on these financial statements and financial highlights based on our audits.
We conducted our audits in accordance with the standards of the Public Company Accounting Oversight Board (United States). Those standards require that we plan and perform the audit to obtain reasonable assurance about whether the financial statements and financial highlights are free of material misstatement. The Fund is not required to have, nor were we engaged to perform, an audit of its internal control over financial reporting. Our audits included consideration of internal control over financial reporting as a basis for designing audit procedures that are appropriate in the circumstances, but not for the purpose of expressing an opinion on the effectiveness of the Fund’s internal control over financial reporting. Accordingly, we express no such opinion. An audit also includes examining, on a test basis, evidence supporting the amounts and disclosures in the financial statements, assessing the accounting principles used and significant estimates made by management, as well as evaluating the overall financial statement presentation. Our procedures included confirmation of securities owned as of December 31, 2008, by correspondence with the custodian and brokers; where replies were not received from brokers, we performed other auditing procedures. We believe that our audits provide a reasonable basis for our opinion.
In our opinion, the financial statements and financial highlights referred to above present fairly, in all material respects, the financial position of MFS High Yield Portfolio as of December 31, 2008, the results of its operations for the year then ended, the changes in its net assets for each of the two years in the period then ended, and the financial highlights for each of the five years in the period then ended, in conformity with accounting principles generally accepted in the United States of America.
DELOITTE & TOUCHE LLP
Boston, Massachusetts
February 19, 2009
24
TRUSTEES AND OFFICERS – IDENTIFICATION AND BACKGROUND
The Trustees and officers of the Trust, as of February 1, 2009, are listed below, together with their principal occupations during the past five years. (Their titles may have varied during that period.) The address of each Trustee and officer is 500 Boylston Street, Boston, Massachusetts 02116.
| | | | | | |
Name, Date of Birth | | Position(s) Held
with Fund | | Trustee/Officer
Since (1) | | Principal Occupations During the Past Five Years and
Other Directorships (2) |
| INTERESTED TRUSTEE | | | | |
David D. Horn (3) (born 6/07/41) | | Trustee | | April 1986 | | Private investor; Sun Life Assurance Company of Canada, Senior Vice President and General Manager for the United States (until 1997); Director (until March 2004) |
| | |
| INDEPENDENT TRUSTEES | | | | |
J. Kermit Birchfield (born 1/08/40) | | Chairman | | May 1997 | | Consultant; Century Partners, Inc. (investments), Director; Displaytech, Inc. (technology), Director; Dessin Fournir LLC (furniture manufacturer), Director (2005 to present); Intermountain Gas Company, Inc. & Intermountain Industries, Inc. (oil & gas exploration and production), Director; Site Watch LLC (software to monitor oil tanks), Managing Director (2006 to present); Juridica Investments (fund investing in judicial matters), Director (2007 to present); HPSC, Inc. (medical financing), Director (until January 2004) |
| | | |
Robert C. Bishop (born 1/13/43) | | Trustee | | May 2001 | | AutoImmune, Inc. (pharmaceutical product development), Chairman, President and Chief Executive Officer; Caliper Life Sciences Corp. (laboratory analytical instruments), Director; Millipore Corporation (purification/filtration products), Director; Waterstreet Capital (leverage buyouts), Advisory Board (August 2006 to present); Optobionics Corporation (ophthalmic devices), Director (2002 to 2007) |
| | | |
Frederick H. Dulles (born 3/12/42) | | Trustee | | May 2001 | | Ten State International Law PLLC (law firm), Of Counsel (since 2006); Prudential Carolina Real Estate, (real estate), Broker (since 2006); Free Enterprise Foundation, Inc. (research institute), Director & Secretary (until 2008); Disher, Hamrick & Myers Residential, Inc. (real estate) Broker (2005 until 2006); Frederick H. Dulles law practice (until 2006); Ten State Street LLP (law firm), Member (until 2005) |
| | | |
Marcia A. Kean (born 6/30/48) | | Trustee | | April 2005 | | Feinstein Kean Healthcare (consulting), Chief Executive Officer |
| | | |
Ronald G. Steinhart (born 6/15/40) | | Trustee | | May 2001 | | Private investor; Penske Automotive Group (automotive retailer), Director; Animal Health International, Inc. (animal health products), Director (since 2007); Texas Industries (concrete/aggregates/cement), Director (since 2007); Penson Worldwide, Inc. (securities clearance), Director (since 2006); Carreker Corporation (technology consulting) Director (until 2005); Prentiss Properties Trust (real estate investment trust), Director (until 2006) |
| | | |
Haviland Wright (born 7/21/48) | | Trustee | | May 2001 | | Profitability of Hawaii (software), Chief Development Officer (since December 2008); Elixir Technologies Corporation (software) Director (since 2005); Nano Loa Inc. (liquid crystal displays), Director |
| | |
| TRUSTEE EMERITUS | | | | |
Samuel Adams (born 10/19/25) | | Trustee Emeritus | | | | Retired; K&L Gates LLP (law firm), Of Counsel |
| | |
| OFFICERS | | | | |
Maria F. Dwyer (4) (born 12/01/58) | | President | | November 2005 | | Massachusetts Financial Services Company, Executive Vice President and Chief Regulatory Officer (since March 2004) Chief Compliance Officer (since December 2006); Fidelity Management & Research Company, Vice President (prior to March 2004); Fidelity Group of Funds, President and Treasurer (until March 2004) |
| | | |
Christopher R. Bohane (4) (born 1/18/74) | | Assistant Secretary and Assistant Clerk | | July 2005 | | Massachusetts Financial Services Company, Vice President and Senior Counsel |
| | | |
John M. Corcoran (4) (born 4/13/65) | | Treasurer | | October 2008 | | Massachusetts Financial Services Company, Senior Vice President (since October 2008); State Street Bank and Trust (financial services provider), Senior Vice President, (until September 2008) |
| | | |
Ethan D. Corey (4) (born 11/21/63) | | Assistant Secretary and Assistant Clerk | | July 2005 | | Massachusetts Financial Services Company, Senior Vice President and Associate General Counsel (since 2004); Dechert LLP (law firm), Counsel (prior to December 2004) |
| | | |
David L. DiLorenzo (4) (born 8/10/68) | | Assistant Treasurer | | July 2005 | | Massachusetts Financial Services Company, Vice President (since June 2005); JP Morgan Investor Services, Vice President (until June 2005) |
| | | |
Timothy M. Fagan (4) (born 7/10/68) | | Assistant Secretary and Assistant Clerk | | September 2005 | | Massachusetts Financial Services Company, Vice President and Senior Counsel (since September 2005); John Hancock Advisers, LLC, Vice President, Senior Attorney and Chief Compliance Officer (until August 2005) |
25
Trustees and Officers – continued
| | | | | | |
Name, Date of Birth | | Position(s) Held
with Fund | | Trustee/Officer
Since (1) | | Principal Occupations During the Past Five Years and
Other Directorships (2) |
Mark D. Fischer (4) (born 10/27/70) | | Assistant Treasurer | | July 2005 | | Massachusetts Financial Services Company, Vice President (since May 2005); JP Morgan Investment Management Company, Vice President (until May 2005) |
| | | |
Robyn L. Griffin (born 7/04/75) | | Assistant Independent Chief Compliance Officer | | August 2008 | | Griffin Compliance LLC (provider of compliance services), Principal (since August 2008); State Street Corporation (financial services provider), Mutual Fund Administration Assistant Vice President (October 2006 – July 2008); Liberty Mutual Group (insurance), Personal Market Assistant Controller (April 2006 – October 2006); Deloitte & Touche LLP (professional services firm), Senior Manager (prior to April 2006) |
| | | |
Brian E. Langenfeld (4) (born 3/07/73) | | Assistant Secretary and Assistant Clerk | | May 2006 | | Massachusetts Financial Services Company, Vice President and Senior Counsel (since May 2006); John Hancock Advisers, LLC, Assistant Vice President and Counsel (until April 2006) |
| | | |
Ellen Moynihan (4) (born 11/13/57) | | Assistant Treasurer | | May 1997 | | Massachusetts Financial Services Company, Senior Vice President |
| | | |
Susan S. Newton (4) (born 3/07/50) | | Assistant Secretary and Assistant Clerk | | May 2005 | | Massachusetts Financial Services Company, Senior Vice President and Associate General Counsel (since April 2005); John Hancock Advisers, LLC, Senior Vice President, Secretary and Chief Legal Officer (until April 2005) |
| | | |
Susan A. Pereira (4) (born 11/05/70) | | Assistant Secretary and Assistant Clerk | | July 2005 | | Massachusetts Financial Services Company, Vice President and Senior Counsel (since June 2004); Bingham McCutchen LLP (law firm), Associate (until June 2004) |
| | | |
Mark N. Polebaum (4) (born 5/01/52) | | Secretary and Clerk | | February 2006 | | Massachusetts Financial Services Company, Executive Vice President, General Counsel and Secretary (since January 2006); Wilmer Cutler Pickering Hale and Dorr LLP (law firm), Partner (until January 2006) |
| | | |
Frank L. Tarantino (born 3/07/44) | | Independent Chief Compliance Officer | | September 2004 | | Tarantino LLC (provider of compliance services), Principal (since June 2004); CRA Business Strategies Group (consulting services), Executive Vice President (until June 2004) |
| | | |
Richard S. Weitzel (4) (born 7/16/70) | | Assistant Secretary and Assistant Clerk | | October 2007 | | Massachusetts Financial Services Company, Vice President and Assistant General Counsel (since 2004); Massachusetts Department of Business and Technology, General Counsel (until April 2004) |
| | | |
James O. Yost (4) (born 6/12/60) | | Assistant Treasurer | | April 1992 | | Massachusetts Financial Services Company, Senior Vice President |
| (1) | Date first appointed to serve as Trustee/Officer of an MFS fund or a Compass variable account. Each Trustee has served continuously since appointment. |
| (2) | Directorships or trusteeships of companies required to report to the Securities and Exchange Commission (i.e., “public companies”). |
| (3) | “Interested person” of the Trust, within the meaning of the Investment Company Act of 1940 (referred to as the 1940 Act), which is the principal federal law governing investment companies like the Trust, as a result of position with Sun Life of Canada (U.S.). The address of Sun Life of Canada (U.S.) is One Sun Life Executive Park, Wellesley Hills, Massachusetts 02481. |
| (4) | “Interested person” of MFS within the meaning of the 1940 Act. The address of MFS is 500 Boylston Street, Boston, Massachusetts 02116. |
The Trust does not hold annual meetings for the purpose of electing Trustees, and Trustees are not elected for fixed terms. Each Trustee and officer holds office until his or her successor is chosen and qualified, or until his or her earlier death, resignation, retirement or removal.
All Trustees currently serve as Trustees of the Trust and have served in that capacity since originally elected or appointed. All of the Trustees are also Managers of the Compass Variable Accounts. The executive officers of the Trust hold similar offices for the Compass Variable Accounts and other funds in the MFS fund complex. As of January 1, 2009, each Trustee serves as a Trustee or Manager of 35 Accounts/Funds.
The Statement of Additional Information contains further information about the Trustees and is available without charge upon request by calling 1-800-752-7215.
| | |
Investment Adviser
Massachusetts Financial Services Company 500 Boylston Street, Boston, MA 02116-3741 | | Custodian State Street Bank and Trust 1 Lincoln Street, Boston, MA 02111-2900 |
Distributor
MFS Fund Distributors, Inc. 500 Boylston Street, Boston, MA 02116-3741 | | Independent Registered Public Accounting Firm Deloitte & Touche LLP 200 Berkeley Street, Boston, MA 02116 |
Portfolio Managers John Addeo David Cole | | |
26
BOARD REVIEW OF INVESTMENT ADVISORY AGREEMENT
The Investment Company Act of 1940 requires that both the full Board of Trustees and a majority of the non-interested (“independent”) Trustees, voting separately, annually approve the continuation of the investment advisory agreement between MFS Variable Insurance Trust II (the “Trust”) and Massachusetts Financial Services Company (“MFS”) on behalf of the Fund. The Trustees consider matters bearing on the Fund and the advisory arrangements at their meetings throughout the year, including a review of performance data at each regular meeting. In addition, the independent Trustees met in May and again in July 2008 (“contract review meetings”) for the specific purpose of considering whether to approve the continuation of the investment advisory agreement for the Fund. The independent Trustees were assisted in their evaluation of the investment advisory agreement by independent legal counsel, from whom they received separate legal advice and with whom they met separately from MFS management during various contract review meetings. The independent Trustees were also assisted in this process by the Fund’s Independent Chief Compliance Officer, a full-time senior officer appointed by and reporting to the independent Trustees.
In connection with their deliberations, the Trustees, including the independent Trustees, considered such information and factors as they believed, in light of the legal advice furnished to them and their own business judgment, to be relevant. The investment advisory agreement was considered separately for the Fund, although the Trustees also took into account the common interests of all Funds in the Trust in their review. As described below, the Trustees considered the nature, quality, and extent of the various investment advisory, administrative, and shareholder services performed by MFS under the existing investment advisory agreement and other arrangements with the Trust.
In connection with their contract review meetings, the Trustees received and relied upon materials which included, among other items: (i) information provided by Lipper Inc. on the investment performance of the Fund for various time periods ended December 31, 2007, compared to the investment performance of a group of funds with substantially similar investment classifications/objectives (the “Lipper performance universe”), (ii) information provided by Lipper Inc. on the Fund’s advisory fees and other expenses compared to the advisory fees and other expenses of comparable funds identified by Lipper (the “Lipper expense group”), (iii) information provided by MFS on the advisory fees of comparable portfolios of its other clients, including institutional separate account and other clients, (iv) information as to whether expense waivers, reimbursements or fee “breakpoints” are observed for the Fund, (v) information regarding MFS’ financial results and financial condition, including MFS’ and certain of its affiliates’ estimated profitability from services performed for the Fund, (vi) MFS’ views regarding the outlook for the mutual fund industry and its strategic business plans, (vii) descriptions of various functions performed by MFS for the Trust, such as compliance monitoring and portfolio trading practices, and (viii) information regarding the overall organization of MFS, including information about MFS’ senior management and other personnel providing investment advisory, administrative and other services to the Fund. The comparative performance, fee and expense information prepared and provided by Lipper Inc. was not independently verified, and the independent Trustees did not independently verify any information provided to them by MFS.
The Trustees’ conclusion as to the continuation of the investment advisory agreement was based on comprehensive consideration of all information provided to the Trustees and not the result of any single factor. Some of the factors that figured particularly in the Trustees’ deliberations are described below for the Fund, while individual Trustees may have given different weight to various factors and evaluated the information presented as a whole differently than another Trustee. The Trustees recognized that the fee arrangements for the Fund reflect years of review and discussion between the independent Trustees and MFS, that certain aspects of such arrangements may receive greater scrutiny in some years than others, and that the Trustees’ conclusions may be based, in part, on their consideration of these same arrangements during the course of the year and in prior years.
Based on information provided by Lipper Inc., the Trustees compared the Fund’s total return investment performance to the performance of a peer group of funds over various time periods. The Trustees placed particular emphasis on the total return performance of the Fund’s Initial Class shares in comparison to the performance of funds in its Lipper performance universe over the one-, three- and five-year periods. The Trustees did not rely on performance results for more recent periods, including those shown elsewhere in this report.
The Trustees noted the performance of the Fund’s Initial Class shares was in the 4th quintile relative to the other funds in the Lipper Classification Index for the one-year period (the 1st quintile being the best performers and the 5th quintile being the worst performers). The total return performance of the Fund was in the 3rd quintile for the three-year period and the 4th quintile for the five-year period ended December 31, 2007, relative to the Lipper performance universe. Based on the nature and quality of services provided by MFS, the Board of Trustees concluded that the Fund’s performance was adequate.
In the course of their deliberations, the Trustees took into account information provided by MFS during contract review meetings, as well as during investment review meetings conducted with portfolio management personnel during the course of the year.
27
Board Review of Investment Advisory Agreement – continued
In assessing the reasonableness of the Fund’s advisory fee, the Trustees considered, among other information, the Fund’s advisory fee and the total expense ratio of the Fund’s Initial Class shares as a percentage of average daily net assets, compared to the advisory fee and total expense ratios of its peer group of funds based on information provided by Lipper Inc. The Trustees also considered the advisory fees charged by MFS to institutional accounts. In comparing these fees, the Trustees considered the generally broader scope of services provided by MFS to the Trust than those provided to institutional accounts. The Trustees also considered the higher demands placed on MFS’ investment personnel and trading infrastructure as a result of the daily cash in-flows and out-flows of the Fund, and the impact on MFS and related expenses due to the more extensive regulatory regime to which the Fund is subject, compared to institutional accounts.
In considering the fees, the Trustees noted from the Lipper data that the Fund’s effective advisory fee rate and total expense ratio were each above the median of such fees and expenses of funds in the Lipper expense group. The Trustees further noted that MFS agreed to continue to reduce its advisory fee, and they accepted MFS’ offer to continue the total expense limitation for the next year. The Trustees further concluded that the existing breakpoint was sufficient to allow the Fund to benefit from economies of scale as its assets grow. The Trustees concluded that the reduced fees were reasonable in light of the nature and quality of services provided.
The Trustees also considered information prepared by MFS relating to its costs and profits with respect to the Fund and other investment companies and accounts advised by MFS, as well as MFS’ methodologies used to determine and allocate its costs to the Fund and other accounts and products for purposes of estimating profitability.
After reviewing these and other factors described below, the Trustees concluded that the advisory fees charged to the Fund represent reasonable compensation in light of the nature and quality of the services being provided by MFS.
In addition, the Trustees considered MFS’ resources and related efforts to continue to retain, attract and motivate capable personnel to serve the Fund. The Trustees also considered the financial resources of MFS and its parent, Sun Life Financial Inc. The Trustees further considered any advantages and possible disadvantages of having an adviser which also serves other investment companies as well as institutional accounts.
The Trustees also considered the nature, quality, cost, and extent of administrative, transfer agency, and distribution services provided to the Fund by MFS and its affiliates under agreements and plans other than the investment advisory agreement, including the 12b-1 fees the Fund pays to MFS Fund Distributors, Inc., an affiliate of MFS. The Trustees also considered the nature, extent and quality of certain other services MFS performs or arranges on the Fund’s behalf, which may include securities lending programs, directed expense payment programs, class action recovery programs, and MFS’ interaction with third-party service providers, principally custodians and sub-custodians. The Trustees concluded that the various non-advisory services provided by MFS and its affiliates on behalf of the Fund were satisfactory. The Trustees also considered the benefits to MFS from the use of the Fund’s portfolio brokerage commissions to pay for research and other similar services and various other factors. Additionally, the Trustees considered so-called “fall-out benefits” to MFS such as reputational value derived from serving as investment manager to the Trust, and determined that any such benefits derived by MFS were reasonable and fair.
Based on their evaluation of factors that they deemed to be material, including those factors described above, the Board of Trustees, including a majority of the independent Trustees, concluded that the investment advisory agreement should be continued for an additional one-year period, commencing September 1, 2008.
A discussion regarding the Board’s most recent review and renewal of the fund’s Investment Advisory Agreement with MFS is available by clicking on the fund’s name under “Variable Insurance Portfolios – VIT II” in the “Products and Performance” section of the MFS Web site (mfs.com).
28
PROXY VOTING POLICIES AND INFORMATION
A general description of the MFS funds’ proxy voting policies and procedures is available without charge, upon request, by calling 1-800-225-2606, by visiting the Proxy Voting section of mfs.com or by visiting the SEC’s Web site at http://www.sec.gov.
Information regarding how the fund voted proxies relating to portfolio securities during the most recent twelve-month period ended June 30 is available without charge by visiting the Proxy Voting section of mfs.com or by visiting the SEC’s Web site at http://www.sec.gov.
QUARTERLY PORTFOLIO DISCLOSURE
The fund will file a complete schedule of portfolio holdings with the Securities and Exchange Commission (the Commission) for the first and third quarters of each fiscal year on Form N-Q. The fund’s Form N-Q may be reviewed and copied at the:
Public Reference Room
Securities and Exchange Commission
100 F Street, NE, Room 1580
Washington, D.C. 20549
Information on the operation of the Public Reference Room may be obtained by calling the Commission at 1-800-SEC-0330. The fund’s Form N-Q is available on the EDGAR database on the Commission’s Internet Web site at http://www.sec.gov, and copies of this information may be obtained, upon payment of a duplicating fee, by electronic request at the following e-mail address: publicinfo@sec.gov or by writing the Public Reference Section at the above address.
29
MFS® PRIVACY NOTICE
Privacy is a concern for every investor today. At MFS Investment Management® and the MFS funds, we take this concern very seriously. We want you to understand our policies about the investment products and services that we offer, and how we protect the nonpublic personal information of investors who have a direct relationship with us and our wholly owned subsidiaries.
Throughout our business relationship, you provide us with personal information. We maintain information and records about you, your investments, and the services you use. Examples of the nonpublic personal information we maintain include
| | Ÿ | | data from investment applications and other forms |
| | Ÿ | | share balances and transactional history with us, our affiliates, or others |
| | Ÿ | | facts from a consumer reporting agency |
We do not disclose any nonpublic personal information about our customers or former customers to anyone, except as permitted by law. We may share nonpublic personal information with third parties or certain of our affiliates in connection with servicing your account or processing your transactions. We may share information with companies or financial institutions that perform marketing services on our behalf or with other financial institutions with which we have joint marketing arrangements, subject to any legal requirements.
Authorization to access your nonpublic personal information is limited to appropriate personnel who provide products, services, or information to you. We maintain physical, electronic, and procedural safeguards to help protect the personal information we collect about you.
If you have any questions about the MFS privacy policy, please call 1-800-225-2606 any business day between 8 a.m. and 8 p.m. Eastern time.
Note: If you own MFS products or receive MFS services in the name of a third party such as a bank or broker-dealer, their privacy policy may apply to you instead of ours.
30

MFS® BOND PORTFOLIO
The report is prepared for the general information of contract owners. It is authorized for distribution to prospective investors only when preceded or accompanied by a current prospectus.
NOT FDIC INSURED Ÿ MAY LOSE VALUE Ÿ NO BANK GUARANTEE Ÿ NOT A DEPOSIT Ÿ NOT INSURED BY ANY FEDERAL GOVERNMENT AGENCY OR NCUA/NCUSIF
LETTER FROM THE CEO

Dear Contract Owners:
The market downturns and economic setbacks of late probably rank among the worst financial declines most of us have experienced. Inevitably, people may be questioning their commitment to investing. Still, it is important to remember that downturns are an inescapable part of the business cycle. Such troughs have been seen before, and if we can use history as a guide, market recoveries typically have followed.
Recent events have clearly shown us the value of certain types of investments. In this environment, two of the hallmarks of mutual funds — transparency and liquidity — have become critically important. Unlike some other types of investments, the operations of mutual funds are relatively transparent to their shareholders. With their daily redemption feature, mutual funds also generally provide easy, convenient access to one’s money. Through these recent market upheavals, this level of liquidity enhanced the ability of mutual fund investors to respond and modify their investments as they and their advisors saw fit — a flexibility that those in less liquid investments simply did not have at their disposal.
At MFS® we take particular pride in how well mutual funds can serve investors because we invented the mutual fund in the United States. Established in 1924, Massachusetts Investors Trust was the nation’s first fund. Recent market events only reinforce what we have learned through 85 years — that mutual funds provide unique features that are important to investors in any type of market climate.
Respectfully,

Robert J. Manning
Chief Executive Officer and Chief Investment Officer
MFS Investment Management®
February 17, 2009
The opinions expressed in this letter are subject to change, may not be relied upon for investment advice, and no forecasts can be guaranteed.
Before investing, consider the fund’s investment objectives, risks, charges, and expenses. For a prospectus containing this and other information, contact your investment professional or view online. Read it carefully.
MFS Fund Distributors, Inc., 500 Boylston Street, Boston, MA 02116
1
PORTFOLIO COMPOSITION
Portfolio structure (i)

| | |
| Fixed income sectors (i) | | |
| High Grade Corporates | | 64.2% |
| High Yield Corporates | | 9.6% |
| Commercial Mortgage-Backed Securities | | 8.1% |
| Mortgage-Backed Securities | | 4.6% |
| U.S. Treasury Securities | | 3.8% |
| Municipal Bonds | | 3.5% |
| Emerging Markets Bonds | | 1.2% |
| Asset-Backed Securities | | 0.7% |
| Non-U.S. Government Bonds | | 0.4% |
| Collateralized Debt Obligations (o) | | 0.0% |
| | |
| Credit quality of bonds (r) | | |
| AAA | | 14.7% |
| AA | | 7.8% |
| A | | 19.5% |
| BBB | | 47.7% |
| BB | | 7.0% |
| B | | 2.1% |
| CCC | | 0.8% |
| C (o) | | 0.0% |
| Not Rated | | 0.4% |
| |
| Portfolio facts | | |
| Average Duration (d)(i) | | 5.0 |
| Average Life (i)(m) | | 7.7 yrs. |
| Average Maturity (i)(m) | | 11.8 yrs. |
| Average Credit Quality of Rated Securities (long-term) (a) | | A– |
| Average Credit Quality of Rated Securities (short-term) (a) | | A-1 |
| (a) | The average credit quality of rated securities is based upon a market weighted average of portfolio holdings that are rated by public rating agencies. |
| (d) | Duration is a measure of how much a bond’s price is likely to fluctuate with general changes in interest rates, e.g., if rates rise 1.00%, a bond with a 5-year duration is likely to lose about 5.00% of its value. |
| (i) | For purposes of this presentation, the bond component includes accrued interest amounts and may be positively or negatively impacted by the equivalent exposure from any derivative holdings, if applicable. |
| (m) | The average maturity shown is calculated using the final stated maturity on the portfolio’s holdings without taking into account any holdings which have been pre-refunded or pre-paid to an earlier date or which have a mandatory put date prior to the stated maturity. The average life shown takes into account these earlier dates. |
| (r) | Each security is assigned a rating from Moody’s Investors Service. If not rated by Moody’s, the rating will be that assigned by Standard & Poor’s. Likewise, if not assigned a rating by Standard & Poor’s, it will be based on the rating assigned by Fitch, Inc. For those portfolios that hold a security which is not rated by any of the three agencies, the security is considered Not Rated. Holdings in U.S. Treasuries and government agency mortgage-backed securities, if any, are included in the “AAA”-rating category. Percentages are based on the total market value of investments as of 12/31/08. |
Percentages are based on net assets as of 12/31/08, unless otherwise noted.
The portfolio is actively managed and current holdings may be different.
2
MANAGEMENT REVIEW
Summary of Results
For the twelve months ended December 31, 2008, Initial Class shares of the MFS Bond Portfolio (the “fund”) provided a total return of –10.53%, while Service Class shares of the fund provided a total return of –10.77%. These compare with a return of 5.70% for the fund’s benchmark, the Barclays Capital U.S. Government/Credit Bond Index.
Market Environment
The U.S. economy and financial markets experienced significant deterioration and extraordinary volatility over the reporting period. U.S. economic growth slowed significantly, despite the short-term bounce from the second quarter fiscal stimulus. Strong domestic headwinds included accelerated deterioration in the housing market, anemic corporate investment, a rapidly declining job market, and a much tighter credit environment. During the period, a seemingly continuous series of tumultuous financial events hammered markets, including: the distressed sale of failing Bear Stearns to JPMorgan, the conservatorship of Government Sponsored Enterprises (GSEs) Fannie Mae and Freddie Mac, the bankruptcy of investment bank Lehman Brothers, the Federal Reserve Bank’s complex intervention of insurance company American International Group (AIG), the nationalization of several large European banks, the failure of Washington Mutual, and the distressed sale of Wachovia. As a result of this barrage of turbulent news, global equity markets pushed significantly lower and credit markets witnessed the worst dislocation since the beginning of the credit crisis. Though conditions improved towards the end of the period, the state of financial and macroeconomic dislocation remained severe.
While reasonably resilient during the first half of the period, the global economy and financial system increasingly experienced considerable negative spillovers from the U.S. slowdown. Not only did Europe and Japan show obvious signs of economic softening, the more powerful engine of global growth – emerging markets – also displayed weakening dynamics.
During the reporting period, the U.S. Federal Reserve Board cut interest rates aggressively and introduced a multitude of new lending facilities to alleviate ever-tightening credit markets, while the U.S. federal government moved quickly to design and implement a meaningful fiscal stimulus package. Although several other global central banks also cut rates, the dilemma of rising energy and food prices heightened concerns among central bankers that inflationary expectations might become unhinged despite weaker growth. Only later in the reporting period did slowing global growth result in a very precipitous decline in commodity prices, which significantly eased inflation and inflationary expectations. As inflationary concerns diminished in the face of global deleveraging, and equity and credit markets deteriorated more sharply, a coordinated rate cut marked the beginning of much more aggressive easing by the major global central banks.
Detractors from Performance
Relative to the Barclays Capital U.S. Government/Credit Bond Index, the fund’s greater exposure to the financial and banking sectors, as well as holdings of commercial mortgage-backed securities (CMBS), held back performance as holdings within these sectors suffered amid the global credit crisis.
Credit quality, particularly holdings of “BBB” rated (s) and below investment grade securities, also dampened relative results as credit spreads between higher quality and lower quality bonds widened over the reporting period.
A shorter duration (d) stance was another detractor from the fund’s relative performance.
Contributors to Performance
During the reporting period, the fund’s return from yield, which was greater than that of the benchmark, was a key contributor to performance.
3
Management Review – continued
The fund’s underweighted exposure to government agency debt and to some longer-dated U.S. Treasury bonds also helped relative results. Although the fund’s shorter duration stance, overall, was a detractor from relative performance, our greater exposure to shorter-dated corporate bonds was a positive contributor to the fund’s relative performance.
Respectfully,
| | |
| Richard Hawkins | | Robert Persons |
| Portfolio Manager | | Portfolio Manager |
| (d) | Duration is a measure of how much a bond’s price is likely to fluctuate with general changes in interest rates, e.g., if rates rise 1.00%, a bond with a 5-year duration is likely to lose about 5.00% of its value. |
| (s) | Bonds rated “BBB”, “Baa”, or higher are considered investment grade; bonds rated “BB”, “Ba”, or below are considered non-investment grade. The primary source for bond quality ratings is Moody’s Investors Service. If not available, ratings by Standard & Poor’s are used, else ratings by Fitch, Inc. For securities which are not rated by any of the three agencies, the security is considered Not Rated. |
The views expressed in this report are those of the portfolio managers only through the end of the period of the report as stated on the cover and do not necessarily reflect the views of MFS or any other person in the MFS organization. These views are subject to change at any time based on market or other conditions, and MFS disclaims any responsibility to update such views. These views may not be relied upon as investment advice or an indication of trading intent on behalf of any MFS portfolio. References to specific securities are not recommendations of such securities, and may not be representative of any MFS portfolio’s current or future investments.
4
PERFORMANCE SUMMARY THROUGH 12/31/08
The following chart illustrates the historical performance of the fund in comparison to its benchmark(s). Benchmark comparisons are unmanaged; do not reflect any fees or expenses; and cannot be invested in directly. The performance of other share classes will be greater than or less than that of the class depicted below. (See Notes to Performance Summary.)
Performance data shown represents past performance and is no guarantee of future results. Investment return and principal value fluctuate so your units, when sold, may be worth more or less than the original cost; current performance may be lower or higher than quoted. The performance shown does not reflect the deduction of taxes, if any, that a contract holder would pay on fund distributions or the redemption of contract units. The returns for the fund shown also do not reflect the deduction of expenses associated with variable products, such as mortality and expense risk charges, separate account charges, and sales charges imposed by the insurance company separate accounts. Such expenses would reduce the overall returns shown.
Growth of a hypothetical $10,000 investment
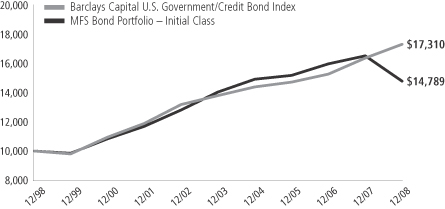
Total rates of return through 12/31/08
Average Annual Total Returns
| | | | | | | | | | | | |
| | | Share class | | Class inception date | | 1-yr | | 5-yr | | 10-yr | | |
| | | Initial Class | | 5/06/98 | | (10.53)% | | 1.05% | | 3.99% | | |
| | | Service Class | | 8/24/01 | | (10.77)% | | 0.79% | | 3.79% | | |
Comparative Benchmark
| | | | | | | | | | | | |
| | | Barclays Capital U.S. Government/Credit Bond Index (f) | | 5.70% | | 4.64% | | 5.64% | | |
| (f) | Source: FactSet Research Systems Inc. |
Benchmark Definition
Barclays Capital U.S. Government/Credit Bond Index (formerly known as Lehman Brothers U.S. Government/Credit Bond Index) – a market capitalization-weighted index that measures the performance of investment-grade debt obligations of the U.S. Treasury and U.S. government agencies, as well as U.S. corporate and foreign debentures and secured notes that meet specified maturity, liquidity, and quality requirements.
It is not possible to invest directly in an index.
Notes to Performance Summary
Performance for the Service Class includes the performance of the fund’s Initial Class for periods prior to their offering. Because Service Class expenses are higher than those of Initial Class, performance shown for Service Class is higher than it would have been had it been offered for the entire period. Performance has not been adjusted to take into account differences in class specific operating expenses (such as Rule 12b-1 fees). Please see the prospectus for additional information about performance and expenses.
Performance results reflect any applicable expense subsidies and waivers in effect during the periods shown. Without such subsidies and waivers the fund’s performance results would be less favorable. Please see the prospectus for complete details. All results are historical and assume the reinvestment of any dividends and capital gains distributions.
From time to time the fund may receive proceeds from litigation settlements, without which performance would be lower.
5
EXPENSE TABLE
Fund Expenses Borne by the Contract Holders During the Period,
July 1, 2008 through December 31, 2008
As a contract holder of the fund, you incur ongoing costs, including management fees; distribution (12b-1) fees; and other fund expenses. This example is intended to help you understand your ongoing costs (in dollars) of investing in the fund and to compare these costs with the ongoing costs of investing in other mutual funds.
The example is based on an investment of $1,000 invested at the beginning of the period and held for the entire period July 1, 2008 through December 31, 2008.
Actual Expenses
The first line for each share class in the following table provides information about actual account values and actual expenses. You may use the information in this line, together with the amount you invested, to estimate the expenses that you paid over the period. Simply divide your account value by $1,000 (for example, an $8,600 account value divided by $1,000 = 8.6), then multiply the result by the number in the first line under the heading entitled “Expenses Paid During Period” to estimate the expenses you paid on your account during this period.
Hypothetical Example for Comparison Purposes
The second line for each share class in the following table provides information about hypothetical account values and hypothetical expenses based on the fund’s actual expense ratio and an assumed rate of return of 5% per year before expenses, which is not the fund’s actual return. The hypothetical account values and expenses may not be used to estimate the actual ending account balance or expenses you paid for the period. You may use this information to compare the ongoing costs of investing in the fund and other funds. To do so, compare this 5% hypothetical example with the 5% hypothetical examples that appear in the shareholder reports of the other funds.
Please note that the expenses shown in the table are meant to highlight the fund’s ongoing costs only and do not take into account the fees and expenses imposed under the variable contracts through which your investment in the fund is made. Therefore, the second line for each share class in the table is useful in comparing ongoing costs associated with an investment in vehicles (such as the fund) which fund benefits under variable annuity and variable life insurance contracts and to qualified pension and retirement plans only, and will not help you determine the relative total costs of investing in the fund through variable annuity and variable life insurance contracts. If the fees and expenses imposed under the variable contracts were included, your costs would have been higher.
| | | | | | | | | | |
| Share Class | | | | Annualized
Expense Ratio | | Beginning
Account Value
7/01/08 | | Ending
Account Value
12/31/08 | | Expenses Paid
During Period (p)
7/01/08-12/31/08 |
| Initial Class | | Actual | | 0.77% | | $1,000.00 | | $900.20 | | $3.68 |
| | Hypothetical (h) | | 0.77% | | $1,000.00 | | $1,021.27 | | $3.91 |
| Service Class | | Actual | | 1.02% | | $1,000.00 | | $899.50 | | $4.87 |
| | Hypothetical (h) | | 1.02% | | $1,000.00 | | $1,020.01 | | $5.18 |
| (h) | 5% class return per year before expenses. |
| (p) | Expenses paid is equal to each class’ annualized expense ratio, as shown above, multiplied by the average account value over the period, multiplied by the number of days in the period, divided by the number of days in the year. |
6
PORTFOLIO OF INVESTMENTS – 12/31/08
The Portfolio of Investments is a complete list of all securities owned by your fund. It is categorized by broad-based asset classes.
| | | | | | |
| Issuer | | Shares/Par | | Value ($) |
| | | | | | |
| BONDS – 96.6% | | | | | | |
| Aerospace – 0.9% | | | | | | |
| Bombardier, Inc., 6.3%, 2014 (n) | | $ | 1,275,000 | | $ | 1,048,687 |
| | | | | | |
| Asset Backed & Securitized – 8.8% | | | |
| ARCap REIT, Inc., CDO, “G”, 6.1%, 2045 (n) | | $ | 350,000 | | $ | 28,000 |
| Asset Securitization Corp., FRN, 8.335%, 2029 | | | 522,978 | | | 557,876 |
| Banc of America Commercial Mortgage, Inc., FRN, 5.658%, 2017 | | | 339,342 | | | 248,186 |
| Bayview Financial Revolving Mortgage Loan Trust, FRN, 2.231%, 2040 (z) | | | 470,000 | | | 291,400 |
| Brazilian Merchant Voucher Receivables Ltd., 5.911%, 2011 (z) | | | 531,025 | | | 504,474 |
| Citigroup/Deutsche Bank Commercial Mortgage Trust, 5.322%, 2049 | | | 514,266 | | | 359,007 |
| Commercial Mortgage Acceptance Corp., FRN, 1.527%, 2030 (i) | | | 1,473,985 | | | 59,699 |
| Countrywide Asset-Backed Certificates, FRN, 4.575%, 2035 | | | 14,850 | | | 14,366 |
| Credit Suisse Mortgage Capital Certificate, 5.343%, 2039 | | | 890,177 | | | 422,145 |
| DLJ Commercial Mortgage Corp., 6.04%, 2031 (z) | | | 625,000 | | | 537,511 |
| Falcon Franchise Loan LLC, 6.5%, 2014 (z) | | | 440,000 | | | 233,200 |
| Falcon Franchise Loan LLC, FRN, 3.727%, 2025 (i)(z) | | | 2,154,572 | | | 159,869 |
| First Union-Lehman Brothers Commercial Mortgage Trust, 7%, 2029 (n) | | | 423,549 | | | 410,152 |
| GE Commercial Mortgage Corp., FRN, 5.338%, 2044 | | | 440,000 | | | 222,928 |
| GMAC Commercial Mortgage Securities, Inc., FRN, 6.02%, 2033 (z) | | | 800,000 | | | 599,542 |
| GMAC Commercial Mortgage Securities, Inc., FRN, 7.662%, 2034 (n) | | | 825,000 | | | 517,153 |
| Greenwich Capital Commercial Funding Corp., 4.305%, 2042 | | | 588,989 | | | 557,339 |
| Greenwich Capital Commercial Funding Corp., FRN, 5.913%, 2038 | | | 350,000 | | | 181,174 |
| GS Mortgage Securities Corp., “GG8”, 5.56%, 2039 | | | 215,006 | | | 170,541 |
| JPMorgan Chase Commercial Mortgage Securities Corp., 6.188%, 2014 | | | 410,000 | | | 292,531 |
| JPMorgan Chase Commercial Mortgage Securities Corp., 5.42%, 2049 | | | 260,006 | | | 183,816 |
| JPMorgan Chase Commercial Mortgage Securities Corp., FRN, 5.343%, 2042 (n) | | | 765,072 | | | 168,810 |
| JPMorgan Chase Commercial Mortgage Securities Corp., FRN, 5.35%, 2043 | | | 1,168,381 | | | 519,862 |
| JPMorgan Chase Commercial Mortgage Securities Corp., FRN, 5.855%, 2043 | | | 681,261 | | | 340,493 |
| JPMorgan Chase Commercial Mortgage Securities Corp., FRN, 5.038%, 2046 | | | 880,000 | | | 710,304 |
| KKR Financial CLO Ltd., “C”, CDO, FRN, 4.254%, 2021 (n) | | | 505,395 | | | 22,743 |
| Lehman Brothers Commercial Conduit Mortgage Trust, FRN, 0.813%, 2030 (i) | | | 1,953,479 | | | 58,604 |
| | | | | | |
| Issuer | | Shares/Par | | Value ($) |
| | | | | | |
| BONDS – continued | | | | | | |
| Asset Backed & Securitized – continued |
| Merrill Lynch Mortgage Trust, FRN, 5.828%, 2050 | | $ | 234,000 | | $ | 41,029 |
Morgan Stanley Capital I, Inc.,
5.72%, 2032 | | | 198,247 | | | 195,607 |
| Morgan Stanley Capital I, Inc., FRN, 0.814%, 2030 (i)(n) | | | 4,336,189 | | | 72,892 |
| Mortgage Capital Funding, Inc., FRN, 2.158%, 2031 (i) | | | 202,215 | | | 10 |
| Nomura Asset Acceptance Corp., FRN, 4.423%, 2034 | | | 6,570 | | | 6,519 |
| PNC Mortgage Acceptance Corp., FRN, 7.1%, 2032 (z) | | | 800,000 | | | 668,092 |
| Prudential Securities Secured Financing Corp., FRN, 7.245%, 2013 (z) | | | 567,000 | | | 226,077 |
| Spirit Master Funding LLC, 5.05%, 2023 (z) | | | 421,030 | | | 344,987 |
| Wachovia Bank Commercial Mortgage Trust, FRN, 4.847%, 2041 | | | 551,473 | | | 442,929 |
| Wachovia Bank Commercial Mortgage Trust, FRN, 5.956%, 2045 | | | 680,000 | | | 352,701 |
| | | | | | |
| | | | | $ | 10,722,568 |
| | | | | | |
| Automotive – 1.0% | | | | | | |
| Ford Motor Credit Co. LLC, 9.75%, 2010 | | $ | 530,000 | | $ | 423,997 |
| Johnson Controls, Inc., 5.5%, 2016 | | | 1,050,000 | | | 813,684 |
| | | | | | |
| | | | | $ | 1,237,681 |
| | | | | | |
| Broadcasting – 1.3% | | | | | | |
| CBS Corp., 6.625%, 2011 | | $ | 933,000 | | $ | 826,808 |
| News America, Inc., 8.5%, 2025 | | | 770,000 | | | 757,782 |
| | | | | | |
| | | | | $ | 1,584,590 |
| | | | | | |
| Brokerage & Asset Managers – 1.1% |
| INVESCO PLC, 4.5%, 2009 | | $ | 1,097,000 | | $ | 1,031,349 |
| Lehman Brothers Holdings, Inc., 6.2%, 2014 (d) | | | 260,000 | | | 24,700 |
| Lehman Brothers Holdings, Inc., 6.5%, 2017 (d) | | | 480,000 | | | 48 |
| Merrill Lynch & Co., Inc., 6.05%, 2016 | | | 349,000 | | | 326,480 |
| | | | | | |
| | | | | $ | 1,382,577 |
| | | | | | |
| Building – 0.4% | | | | | | |
| CRH PLC, 8.125%, 2018 | | $ | 477,000 | | $ | 344,394 |
| Hanson PLC, 7.875%, 2010 | | | 380,000 | | | 153,467 |
| | | | | | |
| | | | | $ | 497,861 |
| | | | | | |
| Cable TV – 1.7% | | | | | | |
| Comcast Corp., 6.4%, 2038 | | $ | 256,000 | | $ | 255,402 |
| Cox Communications, Inc., 4.625%, 2013 | | | 994,000 | | | 861,469 |
| Cox Communications, Inc., 6.25%, 2018 (n) | | | 261,000 | | | 231,662 |
| TCI Communications, Inc., 9.8%, 2012 | | | 439,000 | | | 462,796 |
| Time Warner Entertainment Co. LP, 8.375%, 2033 | | | 266,000 | | | 268,428 |
| | | | | | |
| | | | | $ | 2,079,757 |
| | | | | | |
7
Portfolio of Investments – continued
| | | | | | |
| Issuer | | Shares/Par | | Value ($) |
| | | | | | |
| BONDS – continued | | | | | | |
| Chemicals – 0.4% | | | | | | |
| PPG Industries, Inc., 5.75%, 2013 | | $ | 452,000 | | $ | 446,999 |
| | | | | | |
| Computer Software – 0.6% | | | | | | |
| Seagate Technology HDD Holdings, 6.375%, 2011 | | $ | 1,070,000 | | $ | 738,300 |
| | | | | | |
| Conglomerates – 0.7% | | | | | | |
| American Standard Cos., Inc., 7.625%, 2010 | | $ | 302,000 | | $ | 301,997 |
| Kennametal, Inc., 7.2%, 2012 | | | 526,000 | | | 511,039 |
| | | | | | |
| | | | | $ | 813,036 |
| | | | | | |
| Construction – 0.7% | | | | | | |
| D.R. Horton, Inc., 7.875%, 2011 | | $ | 764,000 | | $ | 657,040 |
| D.R. Horton, Inc., 5.625%, 2014 | | | 269,000 | | | 185,610 |
| | | | | | |
| | | | | $ | 842,650 |
| | | | | | |
| Consumer Goods & Services – 2.9% |
| Clorox Co., 5%, 2013 | | $ | 700,000 | | $ | 689,658 |
| Fortune Brands, Inc., 5.125%, 2011 | | | 940,000 | | | 902,876 |
| Procter & Gamble Co., 4.6%, 2014 | | | 600,000 | | | 628,742 |
| Service Corp. International, 7.375%, 2014 | | | 300,000 | | | 255,000 |
| Western Union Co., 5.4%, 2011 | | | 1,133,000 | | | 1,089,016 |
| | | | | | |
| | | | | $ | 3,565,292 |
| | | | | | |
| Defense Electronics – 0.9% | | | | | | |
| L-3 Communications Corp., 6.375%, 2015 | | $ | 1,115,000 | | $ | 1,042,525 |
| | | | | | |
| Electronics – 0.4% | | | | | | |
| Tyco Electronics Group S.A., 6.55%, 2017 | | $ | 360,000 | | $ | 302,545 |
| Tyco Electronics Group S.A., 7.125%, 2037 | | | 260,000 | | | 196,707 |
| | | | | | |
| | | | | $ | 499,252 |
| | | | | | |
| Energy – Independent – 1.2% | | | | | | |
| Ocean Energy, Inc., 7.25%, 2011 | | $ | 1,400,000 | | $ | 1,437,365 |
| | | | | | |
| Entertainment – 0.8% | | | | | | |
| Time Warner, Inc., 9.125%, 2013 | | $ | 916,000 | | $ | 907,761 |
| Time Warner, Inc., 6.5%, 2036 | | | 110,000 | | | 99,725 |
| | | | | | |
| | | | | $ | 1,007,486 |
| | | | | | |
| Financial Institutions – 1.4% | | | | | | |
| American Express Centurion Bank, 5.55%, 2012 | | $ | 590,000 | | $ | 560,468 |
| GMAC LLC, 7.25%, 2011 (z) | | | 609,000 | | | 523,369 |
| ILFC E-Capital Trust I, 5.9% to 2010, FRN to 2065 (n) | | | 1,000,000 | | | 320,511 |
| International Lease Finance Corp., 5.625%, 2013 | | | 524,000 | | | 349,914 |
| | | | | | |
| | | | | $ | 1,754,262 |
| | | | | | |
| Food & Beverages – 4.1% | | | | | | |
| Diageo Capital PLC, 5.5%, 2016 | | $ | 1,070,000 | | $ | 1,025,609 |
| Dr. Pepper Snapple Group, Inc., 6.82%, 2018 (n) | | | 656,000 | | | 647,047 |
| General Mills, Inc., 5.65%, 2012 | | | 374,000 | | | 381,755 |
| Kraft Foods, Inc., 6.125%, 2018 | | | 920,000 | | | 907,004 |
| Miller Brewing Co., 5.5%, 2013 (n) | | | 1,494,000 | | | 1,392,983 |
| Tyson Foods, Inc., 7.35%, 2016 | | | 950,000 | | | 703,000 |
| | | | | | |
| | | | | $ | 5,057,398 |
| | | | | | |
| | | | | | |
| Issuer | | Shares/Par | | Value ($) |
| | | | | | |
| BONDS – continued | | | | | | |
| Food & Drug Stores – 0.5% | | | | | | |
| CVS Caremark Corp., 5.75%, 2017 | | $ | 664,000 | | $ | 625,135 |
| | | | | | |
| Forest & Paper Products – 0.7% | | | | | | |
| International Paper Co., 7.95%, 2018 | | $ | 740,000 | | $ | 584,866 |
| Stora Enso Oyj, 7.25%, 2036 (n) | | | 623,000 | | | 328,305 |
| | | | | | |
| | | | | $ | 913,171 |
| | | | | | |
| Gaming & Lodging – 1.1% | | | | | | |
| Royal Caribbean Cruises Ltd., 8%, 2010 | | $ | 705,000 | | $ | 602,775 |
| Starwood Hotels & Resorts Worldwide, Inc., 7.875%, 2012 | | | 575,000 | | | 428,375 |
| Wyndham Worldwide Corp., 6%, 2016 | | | 670,000 | | | 270,069 |
| | | | | | |
| | | | | $ | 1,301,219 |
| | | | | | |
| Insurance – 1.6% | | | | | | |
| ING Groep N.V., 5.775% to 2015, FRN to 2049 | | $ | 792,000 | | $ | 339,207 |
| Metropolitan Life Global Funding, 5.125%, 2013 (n) | | | 600,000 | | | 559,055 |
| UnumProvident Corp., 6.85%, 2015 (n) | | | 1,340,000 | | | 1,095,756 |
| | | | | | |
| | | | | $ | 1,994,018 |
| | | | | | |
| Insurance – Health – 0.5% | | | | | | |
| Humana, Inc., 7.2%, 2018 | | $ | 370,000 | | $ | 297,550 |
| UnitedHealth Group, Inc., 6.875%, 2038 | | | 350,000 | | | 306,464 |
| | | | | | |
| | | | | $ | 604,014 |
| | | | | | |
| Insurance – Property & Casualty – 1.4% |
| AXIS Capital Holdings Ltd., 5.75%, 2014 | | $ | 605,000 | | $ | 464,181 |
| Chubb Corp., 5.75%, 2018 | | | 147,000 | | | 141,145 |
| Chubb Corp., 6.375% to 2017, FRN to 2067 | | | 279,000 | | | 173,034 |
| Fund American Cos., Inc., 5.875%, 2013 | | | 993,000 | | | 722,694 |
| ZFS Finance USA Trust V, 6.5% to 2017, FRN to 2037 (n) | | | 580,000 | | | 237,800 |
| | | | | | |
| | | | | $ | 1,738,854 |
| | | | | | |
| Machinery & Tools – 0.6% | | | | | | |
| Case New Holland, Inc., 7.125%, 2014 | | $ | 1,095,000 | | $ | 777,450 |
| | | | | | |
| Major Banks – 7.9% | | | | | | |
| BAC Capital Trust XIV, 5.63% to 2012, FRN to 2049 | | $ | 640,000 | | $ | 256,420 |
| Barclays Bank PLC, 8.55% to 2011, FRN to 2049 (n) | | | 882,000 | | | 432,988 |
| Bear Stearns Cos., Inc., 5.85%, 2010 | | | 389,000 | | | 392,958 |
| BNP Paribas, 7.195% to 2037, FRN to 2049 (n) | | | 700,000 | | | 445,001 |
| Credit Suisse (USA), Inc., 4.875%, 2010 | | | 1,389,000 | | | 1,388,711 |
| Credit Suisse New York, 6%, 2018 | | | 180,000 | | | 165,299 |
| Goldman Sachs Group, Inc., 5.625%, 2017 | | | 1,241,000 | | | 1,066,115 |
| Morgan Stanley, 5.75%, 2016 | | | 906,000 | | | 761,287 |
| Morgan Stanley, 6.625%, 2018 | | | 461,000 | | | 404,431 |
| MUFG Capital Finance 1 Ltd., 6.346% to 2016, FRN to 2049 | | | 1,186,000 | | | 826,313 |
| PNC Funding Corp., 5.625%, 2017 | | | 710,000 | | | 689,600 |
| Royal Bank of Scotland Group PLC, 9.118%, 2049 | | | 348,000 | | | 297,100 |
| Royal Bank of Scotland Group PLC, 6.99% to 2017, FRN to 2049 (n) | | | 370,000 | | | 172,988 |
8
Portfolio of Investments – continued
| | | | | | |
| Issuer | | Shares/Par | | Value ($) |
| | | | | | |
| BONDS – continued | | | | | | |
| Major Banks – continued | | | | | | |
| UniCredito Italiano Capital Trust II, 9.2% to 2010, FRN to 2049 (n) | | $ | 851,000 | | $ | 325,577 |
| UniCredito Luxembourg Finance S.A., 6%, 2017 (n) | | | 1,020,000 | | | 850,491 |
| Wachovia Corp., 6.605%, 2025 | | | 1,270,000 | | | 1,153,479 |
| | | | | | |
| | | | | $ | 9,628,758 |
| | | | | | |
| Medical & Health Technology & Services – 2.6% |
| Fisher Scientific International, Inc., 6.125%, 2015 | | $ | 1,440,000 | | $ | 1,269,000 |
| HCA, Inc., 8.75%, 2010 | | | 438,000 | | | 420,480 |
| Hospira, Inc., 5.55%, 2012 | | | 210,000 | | | 198,968 |
| Hospira, Inc., 6.05%, 2017 | | | 760,000 | | | 617,286 |
| McKesson Corp., 5.7%, 2017 | | | 770,000 | | | 696,530 |
| | | | | | |
| | | | | $ | 3,202,264 |
| | | | | | |
| Metals & Mining – 1.1% | | | | | | |
| International Steel Group, Inc., 6.5%, 2014 | | $ | 945,000 | | $ | 671,919 |
| Rio Tinto Finance USA Ltd., 5.875%, 2013 | | | 810,000 | | | 645,176 |
| | | | | | |
| | | | | $ | 1,317,095 |
| | | | | | |
| Mortgage Backed – 4.6% | | | | | | |
| Fannie Mae, 5.5%, 2017-2034 | | $ | 1,493,965 | | $ | 1,538,145 |
| Fannie Mae, 6%, 2017-2035 | | | 947,252 | | | 980,678 |
| Fannie Mae, 4.5%, 2018 | | | 1,312,102 | | | 1,349,591 |
| Fannie Mae, 7.5%, 2030-2031 | | | 207,873 | | | 220,185 |
| Fannie Mae, 6.5%, 2032 | | | 691,224 | | | 721,250 |
| Freddie Mac, 6%, 2021-2034 | | | 554,438 | | | 573,815 |
| Freddie Mac, 5%, 2025 | | | 275,985 | | | 279,433 |
| | | | | | |
| | | | | $ | 5,663,097 |
| | | | | | |
| Municipals – 3.4% | | | | | | |
| Harris County, TX, “C”, FSA, 5.25%, 2028 | | $ | 440,000 | | $ | 449,192 |
| Harris County, TX, “C”, FSA, 5.25%, 2031 | | | 430,000 | | | 432,245 |
| Harris County, TX, “C”, FSA, 5.25%, 2032 | | | 430,000 | | | 429,974 |
| Metropolitan Atlanta, GA, Rapid Transit Tax Authority Rev., “A”, FGIC, 5.25%, 2032 | | | 690,000 | | | 692,774 |
| New York, Dormitory Authority Rev. (New York University), BHAC, 5.5%, 2031 | | | 360,000 | | | 366,066 |
| State of Massachusetts, “A”, AMBAC, 5.5%, 2030 | | | 905,000 | | | 952,594 |
| Utah Transit Authority Sales Tax Rev., “A”, BHAC, 5%, 2035 | | | 920,000 | | | 893,688 |
| | | | | | |
| | | | | $ | 4,216,533 |
| | | | | | |
| Natural Gas – Distribution – 0.4% | | | |
| Energy Transfer Partners, 9.7%, 2019 | | $ | 480,000 | | $ | 494,597 |
| | | | | | |
| Natural Gas – Pipeline – 4.2% | | | | | | |
| CenterPoint Energy, Inc., 7.875%, 2013 | | $ | 1,383,000 | | $ | 1,281,065 |
| Enterprise Products Operating LP, 5.65%, 2013 | | | 354,000 | | | 321,011 |
| Enterprise Products Partners LP, 6.3%, 2017 | | | 540,000 | | | 457,039 |
| Kinder Morgan Energy Partners LP, 5.125%, 2014 | | | 410,000 | | | 357,191 |
| Kinder Morgan Energy Partners LP, 7.4%, 2031 | | | 581,000 | | | 498,138 |
| Spectra Energy Capital LLC, 8%, 2019 | | | 942,000 | | | 977,556 |
| | | | | | |
| Issuer | | Shares/Par | | Value ($) |
| | | | | | |
| BONDS – continued | | | | | | |
| Natural Gas – Pipeline – continued |
| Williams Cos., Inc., 7.125%, 2011 | | $ | 1,349,000 | | $ | 1,241,080 |
| | | | | | |
| | | | | $ | 5,133,080 |
| | | | | | |
| Network & Telecom – 5.4% | | | | | | |
| AT&T, Inc., 5.1%, 2014 | | $ | 1,361,000 | | $ | 1,337,845 |
| British Telecommunications PLC, 5.15%, 2013 | | | 586,000 | | | 558,223 |
| Telecom Italia S.p.A., 6.375%, 2033 | | | 500,000 | | | 350,000 |
| Telefonica Emisiones S.A.U., 7.045%, 2036 | | | 550,000 | | | 600,342 |
| Telefonica Europe B.V., 7.75%, 2010 | | | 981,000 | | | 996,070 |
| TELUS Corp., 8%, 2011 | | | 1,734,000 | | | 1,724,615 |
| Verizon Communications, Inc., 8.95%, 2039 | | | 360,000 | | | 465,008 |
| Verizon New York, Inc., 6.875%, 2012 | | | 635,000 | | | 631,794 |
| | | | | | |
| | | | | $ | 6,663,897 |
| | | | | | |
| Oil Services – 1.0% | | | | | | |
| KazMunaiGaz Finance B.V., 8.375%, 2013 (n) | | $ | 567,000 | | $ | 442,260 |
| Weatherford International Ltd., 5.15%, 2013 | | | 460,000 | | | 405,063 |
| Weatherford International Ltd., 6.35%, 2017 | | | 440,000 | | | 375,512 |
| | | | | | |
| | | | | $ | 1,222,835 |
| | | | | | |
| Oils – 1.2% | | | | | | |
| Premcor Refining Group, Inc., 7.5%, 2015 | | $ | 1,690,000 | | $ | 1,521,703 |
| | | | | | |
| Other Banks & Diversified Financials – 2.0% |
| Alfa Diversified Payment Rights Finance Co. S.A., FRN, 3.896%, 2011 (n) | | $ | 247,800 | | $ | 161,070 |
| Alfa Diversified Payment Rights Finance Co. S.A., FRN, 3.996%, 2012 (z) | | | 227,500 | | | 160,037 |
| Nordea Bank AB, 5.424% to 2015, FRN to 2049 (n) | | | 412,000 | | | 188,415 |
| Resona Bank Ltd., 5.85% to 2016, FRN to 2049 (n) | | | 1,051,000 | | | 595,788 |
| UBS Preferred Funding Trust V, 6.243% to 2016, FRN to 2049 | | | 547,000 | | | 298,730 |
| UFJ Finance Aruba AEC, 6.75%, 2013 | | | 1,028,000 | | | 1,004,765 |
| | | | | | |
| | | | | $ | 2,408,805 |
| | | | | | |
| Printing & Publishing – 0.2% | | | | | | |
| Pearson PLC, 5.5%, 2013 (n) | | $ | 260,000 | | $ | 237,469 |
| | | | | | |
| Railroad & Shipping – 1.5% | | | | | | |
| Canadian Pacific Railway Co., 6.5%, 2018 | | $ | 570,000 | | $ | 502,707 |
| CSX Corp., 6.3%, 2012 | | | 826,000 | | | 799,755 |
| CSX Corp., 6%, 2036 | | | 360,000 | | | 285,133 |
| Kansas City Southern, 7.375%, 2014 | | | 330,000 | | | 270,006 |
| | | | | | |
| | | | | $ | 1,857,601 |
| | | | | | |
| Real Estate – 2.8% | | | | | | |
| ERP Operating LP, REIT, 5.75%, 2017 | | $ | 970,000 | | $ | 669,543 |
| HRPT Properties Trust, REIT, 6.25%, 2016 | | | 1,027,000 | | | 547,027 |
| Liberty Property LP, REIT, 5.5%, 2016 | | | 660,000 | | | 392,782 |
| ProLogis, REIT, 5.75%, 2016 | | | 933,000 | | | 465,300 |
| ProLogis, REIT, 5.625%, 2016 | | | 160,000 | | | 76,743 |
| Simon Property Group, Inc., REIT, 6.35%, 2012 | | | 629,000 | | | 489,658 |
| Simon Property Group, Inc., REIT, 5.75%, 2015 | | | 1,200,000 | | | 783,833 |
| | | | | | |
| | | | | $ | 3,424,886 |
| | | | | | |
9
Portfolio of Investments – continued
| | | | | | |
| Issuer | | Shares/Par | | Value ($) |
| | | | | | |
| BONDS – continued | | | | | | |
| Restaurants – 0.4% | | | | | | |
| YUM! Brands, Inc., 8.875%, 2011 | | $ | 466,000 | | $ | 472,006 |
| | | | | | |
| Retailers – 1.8% | | | | | | |
| Home Depot, Inc., 5.875%, 2036 | | $ | 756,000 | | $ | 592,781 |
| J.C. Penney Corp., Inc., 8%, 2010 | | | 81,000 | | | 78,629 |
| Macy’s Retail Holdings, Inc., 5.35%, 2012 | | | 480,000 | | | 356,531 |
| Macy’s, Inc., 6.625%, 2011 | | | 426,000 | | | 343,806 |
| Wal-Mart Stores, Inc., 6.2%, 2038 | | | 760,000 | | | 869,786 |
| | | | | | |
| | | | | $ | 2,241,533 |
| | | | | | |
| Supermarkets – 0.8% | | | | | | |
| Delhaize America, Inc., 9%, 2031 | | $ | 360,000 | | $ | 364,076 |
| Kroger Co., 6.4%, 2017 | | | 574,000 | | | 578,858 |
| | | | | | |
| | | | | $ | 942,934 |
| | | | | | |
| Supranational – 0.4% | | | | | | |
| Corporacion Andina de Fomento, 6.875%, 2012 | | $ | 481,000 | | $ | 465,328 |
| | | | | | |
| Telecommunications – Wireless – 0.9% |
| Rogers Cable, Inc., 5.5%, 2014 | | $ | 364,000 | | $ | 335,810 |
| Rogers Wireless, Inc., 7.25%, 2012 | | | 535,000 | | | 522,727 |
| Vodafone Group PLC, 5.625%, 2017 | | | 201,000 | | | 189,392 |
| | | | | | |
| | | | | $ | 1,047,929 |
| | | | | | |
| Telephone Services – 0.3% | | | | | | |
| Embarq Corp., 7.082%, 2016 | | $ | 540,000 | | $ | 415,800 |
| | | | | | |
| Tobacco – 3.3% | | | | | | |
| Altria Group Inc. Nt, 9.95%, 2038 | | $ | 710,000 | | $ | 773,056 |
| BAT International Finance PLC, 9.5%, 2018 (z) | | | 600,000 | | | 666,970 |
| Philip Morris International, Inc., 4.875%, 2013 | | | 930,000 | | | 932,662 |
| Reynolds American, Inc., 7.25%, 2012 | | | 881,000 | | | 817,498 |
| Reynolds American, Inc., 6.75%, 2017 | | | 1,100,000 | | | 873,165 |
| | | | | | |
| | | | | $ | 4,063,351 |
| | | | | | |
| U.S. Treasury Obligations – 3.7% | | | | | | |
| U.S. Treasury Bonds, 5.375%, 2031 | | $ | 1,623,000 | | $ | 2,230,103 |
| U.S. Treasury Bonds, 4.375%, 2038 | | | 1,747,000 | | | 2,339,888 |
| | | | | | |
| | | | | $ | 4,569,991 |
| | | | | | |
| Utilities – Electric Power – 11.0% | | | |
| Allegheny Energy Supply Co. LLC, 8.25%, 2012 (n) | | $ | 1,110,000 | | $ | 1,093,350 |
| Beaver Valley Funding Corp., 9%, 2017 | | | 926,000 | | | 868,116 |
| CenterPoint Energy, Inc., 5.95%, 2017 | | | 450,000 | | | 369,041 |
| | | | | | |
| Issuer | | Shares/Par | | Value ($) |
| | | | | | |
| BONDS – continued | | | | | | |
| Utilities – Electric Power – continued |
| Dominion Resources, Inc., 6.4%, 2018 | | $ | 430,000 | | $ | 421,057 |
| DPL, Inc., 6.875%, 2011 | | | 614,000 | | | 604,162 |
| Duke Energy Corp., 5.65%, 2013 | | | 930,000 | | | 912,230 |
| E.ON International Finance B.V., 6.65%, 2038 (n) | | | 145,000 | | | 134,682 |
| EDP Finance B.V., 6%, 2018 (n) | | | 1,010,000 | | | 838,447 |
| Enersis S.A., 7.375%, 2014 | | | 686,000 | | | 714,428 |
| Exelon Generation Co. LLC, 6.95%, 2011 | | | 1,790,000 | | | 1,737,551 |
| Mirant Americas Generation LLC, 8.3%, 2011 | | | 700,000 | | | 679,000 |
| NiSource Finance Corp., 7.875%, 2010 | | | 1,173,000 | | | 1,073,400 |
| NorthWestern Corp., 5.875%, 2014 | | | 680,000 | | | 627,065 |
| NRG Energy, Inc., 7.375%, 2016 | | | 420,000 | | | 390,600 |
| Oncor Electric Delivery Co. LLC, 6.8%, 2018 (n) | | | 561,000 | | | 537,996 |
| PSEG Power LLC, 5.5%, 2015 | | | 284,000 | | | 253,802 |
| Reliant Energy, Inc., 7.625%, 2014 | | | 1,030,000 | | | 854,900 |
| System Energy Resources, Inc., 5.129%, 2014 (z) | | | 588,482 | | | 558,811 |
| Waterford 3 Funding Corp., 8.09%, 2017 | | | 814,298 | | | 806,513 |
| | | | | | |
| | | | | $ | 13,475,151 |
| | | | | | |
Total Bonds
(Identified Cost, $141,274,351) | | | | | $ | 118,398,790 |
| | | | | | |
|
| PREFERRED STOCKS – 0.1% |
| Automotive – 0.1% | | | | | | |
Preferred Blocker, Inc.,
9% (Identified Cost, $99,330) (z) | | | 129 | | $ | 99,330 |
| | | | | | |
|
| REPURCHASE AGREEMENTS – 1.9% |
| Goldman Sachs, 0.01%, dated 12/31/08, due 1/02/09, total to be received $2,276,001 (secured by U.S. Treasury and Federal Agency obligations and Mortgage Backed securities in a jointly traded account), at Cost | | $ | 2,276,000 | | $ | 2,276,000 |
| | | | | | |
Total Investments
(Identified Cost, $143,649,681) | | | | | $ | 120,774,120 |
| | | | | | |
OTHER ASSETS, LESS
LIABILITIES – 1.4% | | | | | | 1,767,803 |
| | | | | | |
| Net Assets – 100.0% | | | | | $ | 122,541,923 |
| | | | | | |
10
Portfolio of Investments – continued
| (d) | | Non-income producing security – in default. |
| (i) | | Interest only security for which the fund receives interest on notional principal (Par amount). Par amount shown is the notional principal and does not reflect the cost of the security. |
| (n) | | Securities exempt from registration under Rule 144A of the Securities Act of 1933. These securities may be sold in the ordinary course of business in transactions exempt from registration, normally to qualified institutional buyers. At period end, the aggregate value of these securities was $13,538,078, representing 11.0% of net assets. |
| (z) | | Restricted securities are not registered under the Securities Act of 1933 and are subject to legal restrictions on resale. These securities generally may be resold in transactions exempt from registration or to the public if the securities are subsequently registered. Disposal of these securities may involve time-consuming negotiations and prompt sale at an acceptable price may be difficult. The fund holds the following restricted securities: |
| | | | | | |
| Restricted Securities | | Acquisition
Date | | Cost | | Current
Market Value |
| Alfa Diversified Payment Rights Finance Co. S.A., FRN, 3.996%, 2012 | | 3/23/07 | | $227,500 | | $160,037 |
| BAT International Finance PLC, 9.5%, 2018 | | 11/14/08 | | 594,336 | | 666,970 |
| Bayview Financial Revolving Mortgage Loan Trust, FRN, 2.231%, 2040 | | 3/01/06 | | 470,000 | | 291,400 |
| Brazilian Merchant Voucher Receivables Ltd., 5.911%, 2011 | | 7/02/03-3/08/07 | | 532,271 | | 504,474 |
| DLJ Commercial Mortgage Corp., 6.04%, 2031 | | 7/23/04 | | 615,454 | | 537,511 |
| Falcon Franchise Loan LLC, 6.5%, 2014 | | 7/15/05 | | 406,781 | | 233,200 |
| Falcon Franchise Loan LLC, FRN, 3.727%, 2025 | | 1/29/03 | | 257,784 | | 159,869 |
| GMAC Commercial Mortgage Securities, Inc., FRN, 6.02%, 2033 | | 3/20/02 | | 752,542 | | 599,542 |
| GMAC LLC, 7.25%, 2011 | | 12/26/08 | | 523,369 | | 523,369 |
| PNC Mortgage Acceptance Corp., FRN, 7.1%, 2032 | | 3/25/08 | | 800,000 | | 668,092 |
| Preferred Blocker, Inc., 9% (Preferred Stock) | | 12/26/08 | | 99,330 | | 99,330 |
| Prudential Securities Secured Financing Corp., FRN, 7.245%, 2013 | | 12/06/04 | | 629,481 | | 226,077 |
| Spirit Master Funding LLC, 5.05%, 2023 | | 10/04/05 | | 415,603 | | 344,987 |
| System Energy Resources, Inc., 5.129%, 2014 | | 4/16/04-9/08/04 | | 588,817 | | 558,811 |
| Total Restricted Securities | | | | | | $5,573,669 |
| % of Net Assets | | | | | | 4.5% |
The following abbreviations are used in this report and are defined:
| CDO | | Collateralized Debt Obligation |
| CLO | | Collateralized Loan Obligation |
| FRN | | Floating Rate Note. Interest rate resets periodically and may not be the rate reported at period end. |
| REIT | | Real Estate Investment Trust |
| | |
| Insurers | | |
| AMBAC | | AMBAC Indemnity Corp. |
| BHAC | | Berkshire Hathaway Assurance Corp. |
| FGIC | | Financial Guaranty Insurance Co. |
| FSA | | Financial Security Assurance Inc. |
11
Portfolio of Investments – continued
Derivative Contracts at 12/31/08
Swap Agreements at 12/31/08
| | | | | | | | | | | | | |
| Expiration | | Notional
Amount | | Counterparty | | Cash Flows to
Receive | | Cash Flows
to Pay | | Value | |
| Credit Default Swaps | | | | | | | | | |
| 12/20/12 | | USD | | 910,000 | | Merrill Lynch International | | 1.0% (fixed rate) | | (1) | | $(475,873 | ) |
| 12/20/12 | | USD | | 390,000 | | Goldman Sachs International | | (2) | | 1.3% (fixed rate) | | 69,822 | |
| 12/20/12 | | USD | | 390,000 | | Goldman Sachs International | | (3) | | 1.55% (fixed rate) | | 47,129 | |
| 6/20/13 | | USD | | 380,000 | | Morgan Stanley Capital Services, Inc. | | (4) | | 1.07% (fixed rate) | | 15,686 | |
| 12/20/13 | | USD | | 350,000 | | JPMorgan Chase Bank | | (4) | | 0.78% (fixed rate) | | 20,674 | |
| 6/20/13 | | USD | | 360,000 | | Morgan Stanley Capital Services, Inc. | | (5) | | 1.48% (fixed rate) | | 9,833 | |
| 9/20/13 | | USD | | 360,000 | | Morgan Stanley Capital Services, Inc. | | (6) | | 0.99% (fixed rate) | | 9,498 | |
| 12/20/13 | | USD | | 350,000 | | Goldman Sachs International | | (6) | | 1.5% (fixed rate) | | 1,245 | |
| 12/20/13 | | USD | | 350,000 | | Goldman Sachs International | | (7) | | 2.15% (fixed rate) | | (14,460 | ) |
| 12/20/13 | | USD | | 170,000 | | Merrill Lynch International | | (8) | | 1.43% (fixed rate) | | 9,255 | |
| | | | | | | | | | | | | |
| | | | | | | | | | | | $(307,191 | ) |
| | | | | | | | | | | | | |
| (1) | | Fund, as protection seller, to pay notional amount upon a defined credit event by MBIA, Inc., 4.0925%, 10/06/2010, an AA rated bond. The fund entered into the contract to gain issuer exposure. |
| (2) | | Fund, as protection buyer, to receive notional amount upon a defined credit event by Simon Property Group, Inc., 6.35%, 8/28/12. |
| (3) | | Fund, as protection buyer, to receive notional amount upon a defined credit event by Equity Residential, 5.75%, 6/15/17. |
| (4) | | Fund, as protection buyer, to receive notional amount upon a defined credit event by Arrow Electronics, Inc., 6.875%, 6/01/18. |
| (5) | | Fund, as protection buyer, to receive notional amount upon a defined credit event by Weyerhaeuser Co., 7.125%, 7/15/23. |
| (6) | | Fund, as protection buyer, to receive notional amount upon a defined credit event by British Telecom PLC, 5.75%, 12/07/28. |
| (7) | | Fund, as protection buyer, to receive notional amount upon a defined credit event by Aetna, Inc., 6.625%, 6/15/36. |
| (8) | | Fund, as protection buyer, to receive notional amount upon a defined credit event by CIGNA Corp., 7.875%, 5/15/27. |
The credit ratings presented here are an indicator of the current payment/performance risk of the related swap, the reference obligation for which may be either a single security or, in case of a credit default index, a basket of securities issued by corporate or sovereign issuers. Each reference security, including each individual security within a reference basket of securities, is assigned a rating from Moody’s Investor Service. If not rated by Moody’s, the rating will be that assigned by Standard & Poor’s. Likewise, if not assigned by Standard & Poor’s, it will be based on the rating assigned by Fitch, Inc. The ratings for a credit default index are calculated by MFS as a weighted average of the external credit ratings of the individual securities that compose the index’s reference basket of securities.
At December 31, 2008, the fund had sufficient cash and/or other liquid securities to cover any commitments under these derivative contracts.
See Notes to Financial Statements
12
FINANCIAL STATEMENTS | STATEMENT OF ASSETS AND LIABILITIES
This statement represents your fund’s balance sheet, which details the assets and liabilities comprising the total value of the fund.
| | | | | |
At 12/31/08 | | | | | |
Assets | | | | | |
Investments, at value (identified cost, $143,649,681) | | $120,774,120 | | | |
Cash | | 18,160 | | | |
Restricted cash | | 260,000 | | | |
Receivable for fund shares sold | | 49,779 | | | |
Interest receivable | | 1,943,660 | | | |
Swaps, at value | | 183,142 | | | |
Other assets | | 6,843 | | | |
Total assets | | | | | $123,235,704 |
Liabilities | | | | | |
Payable for fund shares reacquired | | $107,106 | | | |
Swaps, at value | | 490,333 | | | |
Payable to affiliates | | | | | |
Management fee | | 4,011 | | | |
Distribution fees | | 709 | | | |
Administrative services fee | | 339 | | | |
Payable for trustees’ compensation | | 23 | | | |
Accrued expenses and other liabilities | | 91,260 | | | |
Total liabilities | | | | | $693,781 |
Net assets | | | | | $122,541,923 |
Net assets consist of | | | | | |
Paid-in capital | | $146,850,881 | | | |
Unrealized appreciation (depreciation) on investments | | (23,182,752 | ) | | |
Accumulated net realized gain (loss) on investments | | (10,532,571 | ) | | |
Undistributed net investment income | | 9,406,365 | | | |
Net assets | | | | | $122,541,923 |
Shares of beneficial interest outstanding | | | | | 13,492,267 |
Initial Class shares | | | | | |
Net assets | | $70,504,198 | | | |
Shares outstanding | | 7,738,749 | | | |
Net asset value per share | | | | | $9.11 |
Service Class shares | | | | | |
Net assets | | $52,037,725 | | | |
Shares outstanding | | 5,753,518 | | | |
Net asset value per share | | | | | $9.04 |
See Notes to Financial Statements
13
FINANCIAL STATEMENTS | STATEMENT OF OPERATIONS
This statement describes how much your fund earned in investment income and accrued in expenses. It also describes any gains and/or losses generated by fund operations.
| | | | | | |
| Year ended 12/31/08 | | | | | | |
| Net investment income | | | | | | |
Income | | | | | | |
Interest | | $10,040,858 | | | | |
Foreign taxes withheld | | (2,275 | ) | | | |
Total investment income | | | | | $10,038,583 | |
Expenses | | | | | | |
Management fee | | $943,260 | | | | |
Distribution fees | | 169,732 | | | | |
Administrative services fee | | 48,651 | | | | |
Trustees’ compensation | | 19,355 | | | | |
Custodian fee | | 52,276 | | | | |
Shareholder communications | | 20,748 | | | | |
Auditing fees | | 58,438 | | | | |
Legal fees | | 7,550 | | | | |
Miscellaneous | | 18,181 | | | | |
Total expenses | | | | | $1,338,191 | |
Fees paid indirectly | | (1,890 | ) | | | |
Net expenses | | | | | $1,336,301 | |
Net investment income | | | | | $8,702,282 | |
Realized and unrealized gain (loss) on investments | | | | | | |
Realized gain (loss) (identified cost basis) | | | | | | |
Investment transactions | | $(5,248,224 | ) | | | |
Swap transactions | | 32,751 | | | | |
Net realized gain (loss) on investments | | | | | $(5,215,473 | ) |
Change in unrealized appreciation (depreciation) | | | | | | |
Investments | | $(19,897,820 | ) | | | |
Swap transactions | | (102,713 | ) | | | |
Net unrealized gain (loss) on investments | | | | | $(20,000,533 | ) |
Net realized and unrealized gain (loss) on investments | | | | | $(25,216,006 | ) |
Change in net assets from operations | | | | | $(16,513,724 | ) |
See Notes to Financial Statements
14
FINANCIAL STATEMENTS | STATEMENTS OF CHANGES IN NET ASSETS
These statements describe the increases and/or decreases in net assets resulting from operations, any distributions, and any shareholder transactions.
| | | | | | |
For years ended 12/31 | | 2008 | | | 2007 | |
Change in net assets | | | | | | |
From operations | | | | | | |
Net investment income | | $8,702,282 | | | $10,377,754 | |
Net realized gain (loss) on investments | | (5,215,473 | ) | | (580,388 | ) |
Net unrealized gain (loss) on investments | | (20,000,533 | ) | | (3,275,662 | ) |
Change in net assets from operations | | $(16,513,724 | ) | | $6,521,704 | |
Distributions declared to shareholders | | | | | | |
From net investment income | | | | | | |
Initial Class | | $(6,244,633 | ) | | $(7,180,439 | ) |
Service Class | | (4,546,725 | ) | | (4,365,847 | ) |
Total distributions declared to shareholders | | $(10,791,358 | ) | | $(11,546,286 | ) |
Change in net assets from fund share transactions | | $(33,294,978 | ) | | $(9,296,035 | ) |
Total change in net assets | | $(60,600,060 | ) | | $(14,320,617 | ) |
Net assets | | | | | | |
At beginning of period | | 183,141,983 | | | 197,462,600 | |
At end of period (including undistributed net investment income of $9,406,365 and
$10,991,316, respectively) | | $122,541,923 | | | $183,141,983 | |
See Notes to Financial Statements
15
FINANCIAL STATEMENTS | FINANCIAL HIGHLIGHTS
The financial highlights table is intended to help you understand the fund’s financial performance for the past 5 years. Certain information reflects financial results for a single fund share. The total returns in the table represent the rate by which an investor would have earned (or lost) on an investment in the fund share class (assuming reinvestment of all distributions) held for the entire period.
| | | | | | | | | | | | | | | |
| Initial Class | | Years ended 12/31 | |
| | | 2008 | | | 2007 | | | 2006 | | | 2005 | | | 2004 | |
Net asset value, beginning of period | | $10.89 | | | $11.19 | | | $11.40 | | | $12.15 | | | $12.39 | |
| Income (loss) from investment operations | | | | | | | | | | | | | | | |
Net investment income (d) | | $0.57 | | | $0.60 | | | $0.59 | | | $0.59 | | | $0.61 | |
Net realized and unrealized gain (loss) on investments
and foreign currency | | (1.64 | ) | | (0.21 | ) | | (0.04 | ) | | (0.39 | ) | | 0.09 | |
Total from investment operations | | $(1.07 | ) | | $0.39 | | | $0.55 | | | $0.20 | | | $0.70 | |
| Less distributions declared to shareholders | | | | | | | | | | | | | | | |
From net investment income | | $(0.71 | ) | | $(0.69 | ) | | $(0.69 | ) | | $(0.74 | ) | | $(0.76 | ) |
From net realized gain on investments | | — | | | — | | | (0.07 | ) | | (0.21 | ) | | (0.18 | ) |
Total distributions declared to shareholders | | $(0.71 | ) | | $(0.69 | ) | | $(0.76 | ) | | $(0.95 | ) | | $(0.94 | ) |
Net asset value, end of period | | $9.11 | | | $10.89 | | | $11.19 | | | $11.40 | | | $12.15 | |
Total return (%) (k)(s) | | (10.53 | ) | | 3.53 | | | 5.20 | | | 1.75 | | | 6.25 | |
Ratios (%) (to average net assets)
and Supplemental data: | | | | | | | | | | | | | | | |
Expenses (f) | | 0.74 | | | 0.71 | | | 0.71 | | | 0.72 | | | 0.69 | |
Net investment income | | 5.64 | | | 5.50 | | | 5.32 | | | 5.05 | | | 5.04 | |
Portfolio turnover | | 46 | | | 42 | | | 47 | | | 52 | | | 50 | |
Net assets at end of period (000 Omitted) | | $70,504 | | | $105,554 | | | $120,991 | | | $143,680 | | | $164,227 | |
| |
| Service Class | | Years ended 12/31 | |
| | | 2008 | | | 2007 | | | 2006 | | | 2005 | | | 2004 | |
Net asset value, beginning of period | | $10.81 | | | $11.11 | | | $11.33 | | | $12.07 | | | $12.33 | |
| Income (loss) from investment operations | | | | | | | | | | | | | | | |
Net investment income (d) | | $0.54 | | | $0.57 | | | $0.56 | | | $0.56 | | | $0.58 | |
Net realized and unrealized gain (loss) on investments
and foreign currency | | (1.63 | ) | | (0.21 | ) | | (0.05 | ) | | (0.38 | ) | | 0.08 | |
Total from investment operations | | $(1.09 | ) | | $0.36 | | | $0.51 | | | $0.18 | | | $0.66 | |
| Less distributions declared to shareholders | | | | | | | | | | | | | | | |
From net investment income | | $(0.68 | ) | | $(0.66 | ) | | $(0.66 | ) | | $(0.71 | ) | | $(0.74 | ) |
From net realized gain on investments | | — | | | — | | | (0.07 | ) | | (0.21 | ) | | (0.18 | ) |
Total distributions declared to shareholders | | $(0.68 | ) | | $(0.66 | ) | | $(0.73 | ) | | $(0.92 | ) | | $(0.92 | ) |
Net asset value, end of period | | $9.04 | | | $10.81 | | | $11.11 | | | $11.33 | | | $12.07 | |
Total return (%) (k)(s) | | (10.77 | ) | | 3.28 | | | 4.87 | | | 1.59 | | | 5.91 | |
Ratios (%) (to average net assets)
and Supplemental data: | | | | | | | | | | | | | | | |
Expenses (f) | | 0.99 | | | 0.96 | | | 0.96 | | | 0.97 | | | 0.94 | |
Net investment income | | 5.39 | | | 5.25 | | | 5.07 | | | 4.81 | | | 4.80 | |
Portfolio turnover | | 46 | | | 42 | | | 47 | | | 52 | | | 50 | |
Net assets at end of period (000 Omitted) | | $52,038 | | | $77,588 | | | $76,471 | | | $75,776 | | | $73,572 | |
| (d) | Per share data is based on average shares outstanding. |
| (f) | Ratios do not reflect reductions from fees paid indirectly, if applicable. |
| (k) | The total return does not reflect expenses that apply to separate accounts. Inclusion of these charges would reduce the total return figures for all periods shown. |
| (s) | From time to time the fund may receive proceeds from litigation settlements, without which performance would be lower. |
See Notes to Financial Statements
16
NOTES TO FINANCIAL STATEMENTS
| (1) | | Business and Organization |
MFS Bond Portfolio (the fund) is a series of MFS Variable Insurance Trust II (the trust). The trust is organized as a Massachusetts business trust and is registered under the Investment Company Act of 1940, as amended, as an open-end management investment company. The shares of the fund are sold to variable accounts established by insurance companies to fund benefits under variable contracts issued by such companies, and qualified retirement and pension plans.
| (2) | | Significant Accounting Policies |
General – The preparation of financial statements in conformity with U.S. generally accepted accounting principles requires management to make estimates and assumptions that affect the reported amounts of assets and liabilities, and disclosure of contingent assets and liabilities at the date of the financial statements and the reported amounts of revenues and expenses during the reporting period. Actual results could differ from those estimates. The fund can invest in foreign securities, including securities of emerging market issuers. Investments in foreign securities are vulnerable to the effects of changes in the relative values of the local currency and the U.S. dollar and to the effects of changes in each country’s legal, political, and economic environment. The markets of emerging markets countries are generally more volatile than the markets of developed countries with more mature economies. All of the risks of investing in foreign securities previously described are heightened when investing in emerging markets countries.
Investment Valuations – Debt instruments and floating rate loans (other than short-term instruments), including restricted debt instruments, are generally valued at an evaluated or composite bid as reported by a third party pricing service. Equity securities, including restricted equity securities, are generally valued at the last sale or official closing price as reported by a third party pricing service on the market or exchange on which they are primarily traded. For securities for which there were no sales reported that day, equity securities are generally valued at the last quoted daily bid quotation as reported by a third party pricing service on the market or exchange on which they are primarily traded. For securities held short for which there were no sales reported for the day, the position is generally valued at the last quoted daily ask quotation as reported by a third party pricing service on the market or exchange on which such securities are primarily traded. Short-term instruments with a maturity at issuance of 60 days or less may be valued at amortized cost, which approximates market value. Swaps are generally valued at an evaluated bid as reported by a third party pricing service. Securities and other assets generally valued on the basis of information from a third party pricing service may also be valued at a broker-dealer bid quotation. Values obtained from pricing services can utilize both dealer-supplied valuations and electronic data processing techniques, which take into account factors such as institutional-size trading in similar groups of securities, yield, quality, coupon rate, maturity, type of issue, trading characteristics, and other market data. The values of foreign securities and other assets and liabilities expressed in foreign currencies are converted to U.S. dollars using the mean of bid and asked prices for rates reported by a third party pricing service.
The Board of Trustees has delegated primary responsibility for determining or causing to be determined the value of the fund’s investments (including any fair valuation) to the adviser pursuant to valuation policies and procedures approved by the Board. If the adviser determines that reliable market quotations are not readily available, investments are valued at fair value as determined in good faith by the adviser in accordance with such procedures under the oversight of the Board of Trustees. Under the fund’s valuation policies and procedures, market quotations are not considered to be readily available for most types of debt instruments and floating rate loans and many types of derivatives. These investments are generally valued at fair value based on information from third party pricing services. In addition, investments may be valued at fair value if the adviser determines that an investment’s value has been materially affected by events occurring after the close of the exchange or market on which the investment is principally traded (such as foreign exchange or market) and prior to the determination of the fund’s net asset value, or after the halting of trading of a specific security where trading does not resume prior to the close of the exchange or market on which the security is principally traded. The adviser may rely on third party pricing services or other information (such as the correlation with price movements of similar securities in the same or other markets; the type, cost and investment characteristics of the security; the business and financial condition of the issuer; and trading and other market data) to assist in determining whether to fair value and at what value to fair value an investment. The value of an investment for purposes of calculating the fund’s net asset value can differ depending on the source and method used to determine value. When fair valuation is used, the value of investments used to determine the fund’s net asset value may differ from quoted or published prices for the same investments.
The fund adopted FASB Statement No. 157, Fair Value Measurements (the “Statement”). This Statement provides a single definition of fair value, a hierarchy for measuring fair value and expanded disclosures about fair value measurements.
Various inputs are used in determining the value of the fund’s assets or liabilities carried at market value. These inputs are categorized into three broad levels. Level 1 includes quoted prices in active markets for identical assets or liabilities. Level 2 includes other significant observable market-based inputs (including quoted prices for similar securities, interest rates,
17
Notes to Financial Statements – continued
prepayment speed, and credit risk). Level 3 includes unobservable inputs, which may include the adviser’s own assumptions in determining the fair value of investments. Other financial instruments are derivative instruments not reflected in total investments, such as futures, forwards, swap contracts and written options. The following is a summary of the levels used as of December 31, 2008 in valuing the fund’s assets or liabilities carried at market value:
| | | | | | | | | | |
| | | Level 1 | | Level 2 | | | Level 3 | | Total | |
| Investments in Securities | | $— | | $120,774,120 | | | $— | | $120,774,120 | |
| Other Financial Instruments | | $— | | $(307,191 | ) | | $— | | $(307,191 | ) |
Repurchase Agreements – The fund may enter into repurchase agreements with approved counterparties. Each repurchase agreement is recorded at cost. The fund requires that the securities collateral in a repurchase transaction be transferred to a custodian. The fund monitors, on a daily basis, the value of the collateral to ensure that its value, including accrued interest, is greater than amounts owed to the fund under each such repurchase agreement. The fund and other funds managed by Massachusetts Financial Services Company (MFS), may utilize a joint trading account for the purpose of entering into one or more repurchase agreements.
Derivative Risk – The fund may invest in derivatives for hedging or non-hedging purposes. While hedging can reduce or eliminate losses, it can also reduce or eliminate gains. When the fund uses derivatives as an investment to gain market exposure, or for hedging purposes, gains and losses from derivative instruments may be substantially greater than the derivative’s original cost. Cash that has been segregated on behalf of certain derivative contracts will be reported separately on the Statement of Assets and Liabilities as restricted cash. On some over-the-counter derivatives, the fund attempts to reduce its exposure to counterparty credit risk by entering into an ISDA Master Agreement on a bilateral basis with each of the counterparties with whom it undertakes a significant volume of transactions. The ISDA Master Agreement gives the fund the right, upon an event of default by the applicable counterparty, to close out all transactions traded under such agreement and to net amounts owed under each transaction to one net amount payable by one party to the other. This right to close out and net payments across all transactions traded under the ISDA Master Agreement could result in a reduction of the fund’s credit risk to such counterparty equal to any amounts payable by the fund under the applicable transactions, if any. However, absent an event of default by the counterparty, the ISDA Master Agreement does not result in an offset of reported balance sheet assets and liabilities across transactions between the fund and the applicable counterparty. Derivative instruments include swap agreements.
In March 2008, FASB Statement No. 161, Disclosures about Derivative Instruments and Hedging Activities (the “Standard”) was issued, and is effective for financial statements issued for fiscal years and interim periods beginning after November 15, 2008. This Standard provides enhanced disclosures about the fund’s use of and accounting for derivative instruments and the effect of derivative instruments on the fund’s results of operations and financial position. Management is evaluating the application of the Standard to the fund, and has not at this time determined the impact, if any, resulting from the adoption of this Standard on the fund’s financial statements.
FASB Staff Position (FSP) 133-1 was implemented during the period. FSP 133-1 amends FAS 133 to require sellers of credit derivatives to make disclosures that will enable financial statement users to assess the potential effects of those credit derivatives on an entity’s financial position, financial performance and cash flows. Accordingly, appropriate disclosures have been included within the Swap Agreements table in the Portfolio of Investments and Significant Accounting Policies.
Swap Agreements – The fund may enter into swap agreements. A swap is generally an exchange of cash payments, at specified intervals or upon the occurrence of specified events, between the fund and a counterparty. The net cash payments exchanged are recorded as a realized gain or loss on swap transactions in the Statement of Operations. The value of the swap, which is adjusted daily and includes any related interest accruals to be paid or received by the fund, is recorded on the Statement of Assets and Liabilities. The daily change in value, including any related interest accruals to be paid or received, is recorded as unrealized appreciation or depreciation on swap transactions in the Statement of Operations. Amounts paid or received at the inception of the swap are reflected as premiums paid or received on the Statement of Assets and Liabilities and are amortized using the effective interest method over the term of the agreement. A liquidation payment received or made upon early termination is recorded as a realized gain or loss on swap transactions in the Statement of Operations.
Risks related to swap agreements include the possible lack of a liquid market, unfavorable market and interest rate movements of the underlying instrument and the failure of the counterparty to perform under the terms of the agreements. To address counterparty risk, swap transactions are limited to only highly-rated counterparties and collateral, in the form of cash or securities, may be required to be posted by the counterparty to the fund and held in segregated accounts with the fund’s custodian. Counterparty risk is further mitigated by having ISDA Master Agreements between the fund and its counterparties providing for netting as described above.
18
Notes to Financial Statements – continued
The fund may enter into credit default swaps to manage its exposure to the market or certain sectors of the market, to reduce its credit risk exposure to defaults of corporate and sovereign issuers or to create exposure to corporate or sovereign issuers to which it is not otherwise exposed. In a credit default swap, the protection buyer makes a stream of payments based on a fixed percentage applied to the contract notional amount to the protection seller in exchange for the right to receive a specified return upon the occurrence of a defined credit event on the reference obligation (which may be either a single security or a basket of securities issued by corporate or sovereign issuers) and, with respect to swap transactions where physical settlement applies, the delivery by the buyer to the seller of a deliverable reference obligation as defined by the contract. Although contract-specific, credit events generally consist of a combination of the following: bankruptcy, failure to pay, restructuring, obligation acceleration, obligation default, or repudiation/moratorium, each as defined in the 2003 ISDA Credit Derivatives Definitions as amended by the relevant contract. Obligation acceleration, obligation default, or repudiation/moratorium are generally applicable when the reference obligation is issued by a sovereign entity or an entity in an emerging country. In the event that a defined credit event occurs, the protection buyer, under the terms of the swap contract, designates which security will be delivered to satisfy the reference obligation. Upon designation of the reference security (or upon delivery of the reference security in the case of physical settlement), the difference between the value of the reference obligation and the swap’s notional amount is recorded as realized gain or loss on swap transactions in the Statement of Operations.
Absent any recoveries under recourse or collateral provisions, the maximum amount of future, undiscounted payments that the fund, as protection seller, could be required to make is equal to the swap’s notional amount. The protection seller’s payment obligation would be offset to the extent of the value of the contract’s reference obligation.
Indemnifications – Under the fund’s organizational documents, its officers and trustees may be indemnified against certain liabilities and expenses arising out of the performance of their duties to the fund. Additionally, in the normal course of business, the fund enters into agreements with service providers that may contain indemnification clauses. The fund’s maximum exposure under these agreements is unknown as this would involve future claims that may be made against the fund that have not yet occurred.
Investment Transactions and Income – Investment transactions are recorded on the trade date. Interest income is recorded on the accrual basis. All premium and discount is amortized or accreted for financial statement purposes in accordance with U.S. generally accepted accounting principles.
The fund may receive proceeds from litigation settlements. Any proceeds received from litigation involving portfolio holdings are reflected in the Statement of Operations in realized gain/loss if the security has been disposed of by the fund or in unrealized gain/loss if the security is still held by the fund. Any other proceeds from litigation not related to portfolio holdings are reflected as other income in the Statement of Operations.
Fees Paid Indirectly – The fund’s custody fee may be reduced according to an arrangement that measures the value of cash deposited with the custodian by the fund. This amount, for the year ended December 31, 2008, is shown as a reduction of total expenses on the Statement of Operations.
Tax Matters and Distributions – The fund intends to qualify as a regulated investment company, as defined under Subchapter M of the Internal Revenue Code, and to distribute all of its taxable income, including realized capital gains. As a result, no provision for federal income tax is required. Each of the fund’s federal tax returns for the prior three fiscal years remains subject to examination by the Internal Revenue Service. Foreign taxes, if any, have been accrued by the fund in the accompanying financial statements.
Distributions to shareholders are recorded on the ex-dividend date. Income and capital gain distributions are determined in accordance with income tax regulations, which may differ from U.S. generally accepted accounting principles. Certain capital accounts in the financial statements are periodically adjusted for permanent differences in order to reflect their tax character. These adjustments have no impact on net assets or net asset value per share. Temporary differences which arise from recognizing certain items of income, expense, gain or loss in different periods for financial statement and tax purposes will reverse at some time in the future. Distributions in excess of net investment income or net realized gains are temporary overdistributions for financial statement purposes resulting from differences in the recognition or classification of income or distributions for financial statement and tax purposes.
Book/tax differences primarily relate to amortization and accretion of debt securities and derivative transactions.
The tax character of distributions declared to shareholders for the last two fiscal years is as follows:
| | | | |
| | | 12/31/08 | | 12/31/07 |
| Ordinary income (including any short-term capital gains) | | $10,791,358 | | $11,546,286 |
19
Notes to Financial Statements – continued
The federal tax cost and the tax basis components of distributable earnings were as follows:
| | | |
| As of 12/31/08 | | | |
| Cost of investments | | $144,937,280 | |
| Gross appreciation | | 1,994,489 | |
| Gross depreciation | | (26,157,649 | ) |
| Net unrealized appreciation (depreciation) | | $(24,163,160 | ) |
| Undistributed ordinary income | | 9,100,836 | |
| Capital loss carryforwards | | (9,246,634 | ) |
As of December 31, 2008, the fund had capital loss carryforwards available to offset future realized gains. Such losses expire as follows:
| | | |
| 12/31/14 | | $(2,113,205 | ) |
| 12/31/15 | | (1,256,685 | ) |
| 12/31/16 | | (5,876,744 | ) |
| | $(9,246,634 | ) |
Multiple Classes of Shares of Beneficial Interest – The fund offers multiple classes of shares, which differ in their respective distribution fees. The fund’s income, realized and unrealized gain (loss), and common expenses are allocated to shareholders based on the daily net assets of each class. Dividends are declared separately for each class. Differences in per share dividend rates are generally due to differences in separate class expenses.
| (3) | | Transactions with Affiliates |
Investment Adviser – The fund has an investment advisory agreement with MFS to provide overall investment management and related administrative services and facilities to the fund. The management fee is computed daily and paid monthly at an annual rate of 0.60% of the fund’s average daily net assets. The investment adviser has agreed in writing to reduce its management fee to 0.50% of average daily net assets in excess of $1 billion. This written agreement may be rescinded only upon consent of the fund’s Board of Trustees. For the year ended December 31, 2008, the fund’s average daily net assets did not exceed $1 billion and therefore, the management fee was not reduced. The management fee incurred for the year ended December 31, 2008 was equivalent to an annual effective rate of 0.60% of the fund’s average daily net assets.
Distributor – MFS Fund Distributors, Inc. (MFD), a wholly-owned subsidiary of MFS, is the distributor of shares of the fund. The Trustees have adopted a distribution plan for the Service Class shares pursuant to Rule 12b-1 under the Investment Company Act of 1940.
The fund’s distribution plan provides that the fund will pay MFD distribution fees equal to 0.25% per annum of its average daily net assets attributable to Service Class shares as partial consideration for services performed and expenses incurred by MFD and financial intermediaries (including participating insurance companies that invest in the fund to fund variable annuity and variable life insurance contracts, sponsors of qualified retirement and pension plans that invest in the fund, and affiliates of these participating insurance companies and plan sponsors) in connection with the sale and distribution of the Service Class shares. MFD may subsequently pay all, or a portion, of the distribution fees to financial intermediaries.
Shareholder Servicing Agent – MFS Service Center, Inc. (MFSC), a wholly-owned subsidiary of MFS, has contracted to provide transfer agent and recordkeeping functions in connection with the issuance, transfer, and redemption of each class of shares of the fund under a Shareholder Servicing Agent Agreement. During the year ended December 31, 2008, the fund did not pay MFSC a fee for this service.
Administrator – MFS provides certain financial, legal, shareholder communications, compliance, and other administrative services to the fund. Under an administrative services agreement, the fund partially reimburses MFS the costs incurred to provide these services. The fund is charged an annual fixed amount of $10,000 plus a fee based on average daily net assets.
The administrative services fee incurred for the year ended December 31, 2008 was equivalent to an annual effective rate of 0.0309% of the fund’s average daily net assets.
Trustees’ and Officers’ Compensation – The fund pays compensation to trustees in the form of a retainer, attendance fees, and additional compensation to the Board chairperson. The fund does not pay compensation directly to officers of the fund who are also officers of the investment adviser, all of whom receive remuneration for their services to the fund from MFS. Certain officers of the fund are officers or directors of MFS, MFD, and MFSC.
20
Notes to Financial Statements – continued
Other – This fund and certain other MFS funds (the funds) have entered into services agreements (the Agreements) which provide for payment of fees by the funds to Tarantino LLC and Griffin Compliance LLC in return for the provision of services of an Independent Chief Compliance Officer (ICCO) and Assistant ICCO, respectively, for the funds. The ICCO and Assistant ICCO are officers of the funds and the sole members of Tarantino LLC and Griffin Compliance LLC, respectively. The funds can terminate the Agreements with Tarantino LLC and Griffin Compliance LLC at any time under the terms of the Agreements. MFS has agreed to bear all expenses associated with office space, other administrative support, and supplies provided to the ICCO and Assistant ICCO. For the year ended December 31, 2008, the aggregate fees paid by the fund to Tarantino LLC and Griffin Compliance LLC were $1,505 and are included in miscellaneous expense on the Statement of Operations.
Purchases and sales of investments, other than purchased option transactions and short-term obligations, were as follows:
| | | | |
| | | Purchases | | Sales |
| U.S. Government securities | | $23,927,869 | | $39,332,472 |
| Investments (non-U.S. Government securities) | | $47,025,809 | | $68,027,447 |
| (5) | | Shares of Beneficial Interest |
The fund’s Declaration of Trust permits the Trustees to issue an unlimited number of full and fractional shares of beneficial interest. Transactions in fund shares were as follows:
| | | | | | | | | | | | |
| | | Year ended 12/31/08 | | | Year ended 12/31/07 | |
| | | Shares | | | Amount | | | Shares | | | Amount | |
| Shares sold | | | | | | | | | | | | |
Initial Class | | 314,028 | | | $3,103,635 | | | 729,940 | | | $8,016,412 | |
Service Class | | 508,752 | | | 5,148,811 | | | 1,038,873 | | | 11,209,759 | |
| | 822,780 | | | $8,252,446 | | | 1,768,813 | | | $19,226,171 | |
| Shares issued to shareholders in reinvestment of distributions | | | | | | | | | | | | |
Initial Class | | 609,828 | | | $6,244,633 | | | 667,327 | | | $7,180,439 | |
Service Class | | 446,633 | | | 4,546,725 | | | 408,023 | | | 4,365,847 | |
| | 1,056,461 | | | $10,791,358 | | | 1,075,350 | | | $11,546,286 | |
| Shares reacquired | | | | | | | | | | | | |
Initial Class | | (2,877,063 | ) | | $(29,003,530 | ) | | (2,517,785 | ) | | $(27,442,705 | ) |
Service Class | | (2,376,422 | ) | | (23,335,252 | ) | | (1,152,487 | ) | | (12,625,787 | ) |
| | (5,253,485 | ) | | $(52,338,782 | ) | | (3,670,272 | ) | | $(40,068,492 | ) |
| Net change | | | | | | | | | | | | |
Initial Class | | (1,953,207 | ) | | $(19,655,262 | ) | | (1,120,518 | ) | | $(12,245,854 | ) |
Service Class | | (1,421,037 | ) | | (13,639,716 | ) | | 294,409 | | | 2,949,819 | |
| | (3,374,244 | ) | | $(33,294,978 | ) | | (826,109 | ) | | $(9,296,035 | ) |
The fund and other funds managed by MFS participate in a $1 billion unsecured committed line of credit provided by a syndication of banks under a credit agreement. In addition, the fund and other funds managed by MFS have established uncommitted borrowing arrangements with certain banks. Borrowings may be made for temporary financing needs. Interest is charged to each fund, based on its borrowings, generally at a rate equal to the Federal Reserve funds rate plus 0.30%. In addition, a commitment fee, based on the average daily, unused portion of the committed line of credit, is allocated among the participating funds at the end of each calendar quarter. For the year ended December 31, 2008, the fund’s commitment fee and interest expense were $792 and $0, respectively, and are included in miscellaneous expense on the Statement of Operations.
21
REPORT OF INDEPENDENT REGISTERED PUBLIC ACCOUNTING FIRM
To the Board of Trustees of MFS Variable Insurance Trust II and the Shareholders of MFS Bond Portfolio:
We have audited the accompanying statement of assets and liabilities, including the portfolio of investments, of MFS Bond Portfolio (the “Fund”) (one of the portfolios comprising MFS Variable Insurance Trust II) as of December 31, 2008, and the related statement of operations for the year then ended, the statements of changes in net assets for each of the two years in the period then ended, and the financial highlights for each of the five years in the period then ended. These financial statements and financial highlights are the responsibility of the Fund’s management. Our responsibility is to express an opinion on these financial statements and financial highlights based on our audits.
We conducted our audits in accordance with the standards of the Public Company Accounting Oversight Board (United States). Those standards require that we plan and perform the audit to obtain reasonable assurance about whether the financial statements and financial highlights are free of material misstatement. The Fund is not required to have, nor were we engaged to perform, an audit of its internal control over financial reporting. Our audits included consideration of internal control over financial reporting as a basis for designing audit procedures that are appropriate in the circumstances, but not for the purpose of expressing an opinion on the effectiveness of the Fund’s internal control over financial reporting. Accordingly, we express no such opinion. An audit also includes examining, on a test basis, evidence supporting the amounts and disclosures in the financial statements, assessing the accounting principles used and significant estimates made by management, as well as evaluating the overall financial statement presentation. Our procedures included confirmation of securities owned as of December 31, 2008, by correspondence with the custodian. We believe that our audits provide a reasonable basis for our opinion.
In our opinion, the financial statements and financial highlights referred to above present fairly, in all material respects, the financial position of MFS Bond Portfolio as of December 31, 2008, the results of its operations for the year then ended, the changes in its net assets for each of the two years in the period then ended, and the financial highlights for each of the five years in the period then ended, in conformity with accounting principles generally accepted in the United States of America.
DELOITTE & TOUCHE LLP
Boston, Massachusetts
February 19, 2009
22
TRUSTEES AND OFFICERS – IDENTIFICATION AND BACKGROUND
The Trustees and officers of the Trust, as of February 1, 2009, are listed below, together with their principal occupations during the past five years. (Their titles may have varied during that period.) The address of each Trustee and officer is 500 Boylston Street, Boston, Massachusetts 02116.
| | | | | | |
Name, Date of Birth | | Position(s) Held
with Fund | | Trustee/Officer
Since (1) | | Principal Occupations During the Past Five Years and
Other Directorships (2) |
| INTERESTED TRUSTEE | | | | |
David D. Horn (3) (born 6/07/41) | | Trustee | | April 1986 | | Private investor; Sun Life Assurance Company of Canada, Senior Vice President and General Manager for the United States (until 1997); Director (until March 2004) |
| | |
| INDEPENDENT TRUSTEES | | | | |
J. Kermit Birchfield (born 1/08/40) | | Chairman | | May 1997 | | Consultant; Century Partners, Inc. (investments), Director; Displaytech, Inc. (technology), Director; Dessin Fournir LLC (furniture manufacturer), Director (2005 to present); Intermountain Gas Company, Inc. & Intermountain Industries, Inc. (oil & gas exploration and production), Director; Site Watch LLC (software to monitor oil tanks), Managing Director (2006 to present); Juridica Investments (fund investing in judicial matters), Director (2007 to present); HPSC, Inc. (medical financing), Director (until January 2004) |
| | | |
Robert C. Bishop (born 1/13/43) | | Trustee | | May 2001 | | AutoImmune, Inc. (pharmaceutical product development), Chairman, President and Chief Executive Officer; Caliper Life Sciences Corp. (laboratory analytical instruments), Director; Millipore Corporation (purification/filtration products), Director; Waterstreet Capital (leverage buyouts), Advisory Board (August 2006 to present); Optobionics Corporation (ophthalmic devices), Director (2002 to 2007) |
| | | |
Frederick H. Dulles (born 3/12/42) | | Trustee | | May 2001 | | Ten State International Law PLLC (law firm), Of Counsel (since 2006); Prudential Carolina Real Estate, (real estate), Broker (since 2006); Free Enterprise Foundation, Inc. (research institute), Director & Secretary (until 2008); Disher, Hamrick & Myers Residential, Inc. (real estate) Broker (2005 until 2006); Frederick H. Dulles law practice (until 2006); Ten State Street LLP (law firm), Member (until 2005) |
| | | |
Marcia A. Kean (born 6/30/48) | | Trustee | | April 2005 | | Feinstein Kean Healthcare (consulting), Chief Executive Officer |
| | | |
Ronald G. Steinhart (born 6/15/40) | | Trustee | | May 2001 | | Private investor; Penske Automotive Group (automotive retailer), Director; Animal Health International, Inc. (animal health products), Director (since 2007); Texas Industries (concrete/aggregates/cement), Director (since 2007); Penson Worldwide, Inc. (securities clearance), Director (since 2006); Carreker Corporation (technology consulting) Director (until 2005); Prentiss Properties Trust (real estate investment trust), Director (until 2006) |
| | | |
Haviland Wright (born 7/21/48) | | Trustee | | May 2001 | | Profitability of Hawaii (software), Chief Development Officer (since December 2008); Elixir Technologies Corporation (software) Director (since 2005); Nano Loa Inc. (liquid crystal displays), Director |
| | |
| TRUSTEE EMERITUS | | | | |
Samuel Adams (born 10/19/25) | | Trustee Emeritus | | | | Retired; K&L Gates LLP (law firm), Of Counsel |
| | |
| OFFICERS | | | | |
Maria F. Dwyer (4) (born 12/01/58) | | President | | November 2005 | | Massachusetts Financial Services Company, Executive Vice President and Chief Regulatory Officer (since March 2004) Chief Compliance Officer (since December 2006); Fidelity Management & Research Company, Vice President (prior to March 2004); Fidelity Group of Funds, President and Treasurer (until March 2004) |
| | | |
Christopher R. Bohane (4) (born 1/18/74) | | Assistant Secretary and Assistant Clerk | | July 2005 | | Massachusetts Financial Services Company, Vice President and Senior Counsel |
| | | |
John M. Corcoran (4) (born 4/13/65) | | Treasurer | | October 2008 | | Massachusetts Financial Services Company, Senior Vice President (since October 2008); State Street Bank and Trust (financial services provider), Senior Vice President, (until September 2008) |
| | | |
Ethan D. Corey (4) (born 11/21/63) | | Assistant Secretary and Assistant Clerk | | July 2005 | | Massachusetts Financial Services Company, Senior Vice President and Associate General Counsel (since 2004); Dechert LLP (law firm), Counsel (prior to December 2004) |
| | | |
David L. DiLorenzo (4) (born 8/10/68) | | Assistant Treasurer | | July 2005 | | Massachusetts Financial Services Company, Vice President (since June 2005); JP Morgan Investor Services, Vice President (until June 2005) |
| | | |
Timothy M. Fagan (4) (born 7/10/68) | | Assistant Secretary and Assistant Clerk | | September 2005 | | Massachusetts Financial Services Company, Vice President and Senior Counsel (since September 2005); John Hancock Advisers, LLC, Vice President, Senior Attorney and Chief Compliance Officer (until August 2005) |
23
Trustees and Officers – continued
| | | | | | |
Name, Date of Birth | | Position(s) Held
with Fund | | Trustee/Officer
Since (1) | | Principal Occupations During the Past Five Years and
Other Directorships (2) |
Mark D. Fischer (4) (born 10/27/70) | | Assistant Treasurer | | July 2005 | | Massachusetts Financial Services Company, Vice President (since May 2005); JP Morgan Investment Management Company, Vice President (until May 2005) |
| | | |
Robyn L. Griffin (born 7/04/75) | | Assistant Independent Chief Compliance Officer | | August 2008 | | Griffin Compliance LLC (provider of compliance services), Principal (since August 2008); State Street Corporation (financial services provider), Mutual Fund Administration Assistant Vice President (October 2006 – July 2008); Liberty Mutual Group (insurance), Personal Market Assistant Controller (April 2006 – October 2006); Deloitte & Touche LLP (professional services firm), Senior Manager (prior to April 2006) |
| | | |
Brian E. Langenfeld (4) (born 3/07/73) | | Assistant Secretary and Assistant Clerk | | May 2006 | | Massachusetts Financial Services Company, Vice President and Senior Counsel (since May 2006); John Hancock Advisers, LLC, Assistant Vice President and Counsel (until April 2006) |
| | | |
Ellen Moynihan (4) (born 11/13/57) | | Assistant Treasurer | | May 1997 | | Massachusetts Financial Services Company, Senior Vice President |
| | | |
Susan S. Newton (4) (born 3/07/50) | | Assistant Secretary and Assistant Clerk | | May 2005 | | Massachusetts Financial Services Company, Senior Vice President and Associate General Counsel (since April 2005); John Hancock Advisers, LLC, Senior Vice President, Secretary and Chief Legal Officer (until April 2005) |
| | | |
Susan A. Pereira (4) (born 11/05/70) | | Assistant Secretary and Assistant Clerk | | July 2005 | | Massachusetts Financial Services Company, Vice President and Senior Counsel (since June 2004); Bingham McCutchen LLP (law firm), Associate (until June 2004) |
| | | |
Mark N. Polebaum (4) (born 5/01/52) | | Secretary and Clerk | | February 2006 | | Massachusetts Financial Services Company, Executive Vice President, General Counsel and Secretary (since January 2006); Wilmer Cutler Pickering Hale and Dorr LLP (law firm), Partner (until January 2006) |
| | | |
Frank L. Tarantino (born 3/07/44) | | Independent Chief Compliance Officer | | September 2004 | | Tarantino LLC (provider of compliance services), Principal (since June 2004); CRA Business Strategies Group (consulting services), Executive Vice President (until June 2004) |
| | | |
Richard S. Weitzel (4) (born 7/16/70) | | Assistant Secretary and Assistant Clerk | | October 2007 | | Massachusetts Financial Services Company, Vice President and Assistant General Counsel (since 2004); Massachusetts Department of Business and Technology, General Counsel (until April 2004) |
| | | |
James O. Yost (4) (born 6/12/60) | | Assistant Treasurer | | April 1992 | | Massachusetts Financial Services Company, Senior Vice President |
| (1) | Date first appointed to serve as Trustee/Officer of an MFS fund or a Compass variable account. Each Trustee has served continuously since appointment. |
| (2) | Directorships or trusteeships of companies required to report to the Securities and Exchange Commission (i.e., “public companies”). |
| (3) | “Interested person” of the Trust, within the meaning of the Investment Company Act of 1940 (referred to as the 1940 Act), which is the principal federal law governing investment companies like the Trust, as a result of position with Sun Life of Canada (U.S.). The address of Sun Life of Canada (U.S.) is One Sun Life Executive Park, Wellesley Hills, Massachusetts 02481. |
| (4) | “Interested person” of MFS within the meaning of the 1940 Act. The address of MFS is 500 Boylston Street, Boston, Massachusetts 02116. |
The Trust does not hold annual meetings for the purpose of electing Trustees, and Trustees are not elected for fixed terms. Each Trustee and officer holds office until his or her successor is chosen and qualified, or until his or her earlier death, resignation, retirement or removal.
All Trustees currently serve as Trustees of the Trust and have served in that capacity since originally elected or appointed. All of the Trustees are also Managers of the Compass Variable Accounts. The executive officers of the Trust hold similar offices for the Compass Variable Accounts and other funds in the MFS fund complex. As of January 1, 2009, each Trustee serves as a Trustee or Manager of 35 Accounts/Funds.
The Statement of Additional Information contains further information about the Trustees and is available without charge upon request by calling 1-800-752-7215.
| | |
Investment Adviser
Massachusetts Financial Services Company 500 Boylston Street, Boston, MA 02116-3741 | | Custodian State Street Bank and Trust 1 Lincoln Street, Boston, MA 02111-2900 |
Distributor
MFS Fund Distributors, Inc. 500 Boylston Street, Boston, MA 02116-3741 | | Independent Registered Public Accounting Firm Deloitte & Touche LLP 200 Berkeley Street, Boston, MA 02116 |
Portfolio Managers Richard Hawkins Robert Persons | | |
24
BOARD REVIEW OF INVESTMENT ADVISORY AGREEMENT
The Investment Company Act of 1940 requires that both the full Board of Trustees and a majority of the non-interested (“independent”) Trustees, voting separately, annually approve the continuation of the investment advisory agreement between MFS Variable Insurance Trust II (the “Trust”) and Massachusetts Financial Services Company (“MFS”) on behalf of the Fund. The Trustees consider matters bearing on the Fund and the advisory arrangements at their meetings throughout the year, including a review of performance data at each regular meeting. In addition, the independent Trustees met in May and again in July 2008 (“contract review meetings”) for the specific purpose of considering whether to approve the continuation of the investment advisory agreement for the Fund. The independent Trustees were assisted in their evaluation of the investment advisory agreement by independent legal counsel, from whom they received separate legal advice and with whom they met separately from MFS management during various contract review meetings. The independent Trustees were also assisted in this process by the Fund’s Independent Chief Compliance Officer, a full-time senior officer appointed by and reporting to the independent Trustees.
In connection with their deliberations, the Trustees, including the independent Trustees, considered such information and factors as they believed, in light of the legal advice furnished to them and their own business judgment, to be relevant. The investment advisory agreement was considered separately for the Fund, although the Trustees also took into account the common interests of all Funds in the Trust in their review. As described below, the Trustees considered the nature, quality, and extent of the various investment advisory, administrative, and shareholder services performed by MFS under the existing investment advisory agreement and other arrangements with the Trust.
In connection with their contract review meetings, the Trustees received and relied upon materials which included, among other items: (i) information provided by Lipper Inc. on the investment performance of the Fund for various time periods ended December 31, 2007, compared to the investment performance of a group of funds with substantially similar investment classifications/objectives (the “Lipper performance universe”), (ii) information provided by Lipper Inc. on the Fund’s advisory fees and other expenses compared to the advisory fees and other expenses of comparable funds identified by Lipper (the “Lipper expense group”), (iii) information provided by MFS on the advisory fees of comparable portfolios of its other clients, including institutional separate account and other clients, (iv) information as to whether expense waivers, reimbursements or fee “breakpoints” are observed for the Fund, (v) information regarding MFS’ financial results and financial condition, including MFS’ and certain of its affiliates’ estimated profitability from services performed for the Fund, (vi) MFS’ views regarding the outlook for the mutual fund industry and its strategic business plans, (vii) descriptions of various functions performed by MFS for the Trust, such as compliance monitoring and portfolio trading practices, and (viii) information regarding the overall organization of MFS, including information about MFS’ senior management and other personnel providing investment advisory, administrative and other services to the Fund. The comparative performance, fee and expense information prepared and provided by Lipper Inc. was not independently verified, and the independent Trustees did not independently verify any information provided to them by MFS.
The Trustees’ conclusion as to the continuation of the investment advisory agreement was based on comprehensive consideration of all information provided to the Trustees and not the result of any single factor. Some of the factors that figured particularly in the Trustees’ deliberations are described below for the Fund, while individual Trustees may have given different weight to various factors and evaluated the information presented as a whole differently than another Trustee. The Trustees recognized that the fee arrangements for the Fund reflect years of review and discussion between the independent Trustees and MFS, that certain aspects of such arrangements may receive greater scrutiny in some years than others, and that the Trustees’ conclusions may be based, in part, on their consideration of these same arrangements during the course of the year and in prior years.
Based on information provided by Lipper Inc., the Trustees compared the Fund’s total return investment performance to the performance of a peer group of funds over various time periods. The Trustees placed particular emphasis on the total return performance of the Fund’s Initial Class shares in comparison to the performance of funds in its Lipper performance universe over the one-, three- and five-year periods. The Trustees did not rely on performance results for more recent periods, including those shown elsewhere in this report.
The Trustees noted the performance of the Fund’s Initial Class shares was in the 4th quintile relative to the other funds in the Lipper Classification Index for the one-year period (the 1st quintile being the best performers and the 5th quintile being the worst performers). The total return performance of the Fund was in the 5th quintile for the three-year period and the 2nd quintile for the five-year period ended December 31, 2007, relative to the Lipper performance universe. Based on the nature and quality of services provided by MFS, the Board of Trustees concluded that the Fund’s performance was adequate.
In the course of their deliberations, the Trustees took into account information provided by MFS during contract review meetings, as well as during investment review meetings conducted with portfolio management personnel during the course of the year.
25
Board Review of Investment Advisory Agreement – continued
In assessing the reasonableness of the Fund’s advisory fee, the Trustees considered, among other information, the Fund’s advisory fee and the total expense ratio of the Fund’s Initial Class shares as a percentage of average daily net assets, compared to the advisory fee and total expense ratios of its peer group of funds based on information provided by Lipper Inc. The Trustees also considered the advisory fees charged by MFS to institutional accounts. In comparing these fees, the Trustees considered the generally broader scope of services provided by MFS to the Trust than those provided to institutional accounts. The Trustees also considered the higher demands placed on MFS’ investment personnel and trading infrastructure as a result of the daily cash in-flows and out-flows of the Fund, and the impact on MFS and related expenses due to the more extensive regulatory regime to which the Fund is subject, compared to institutional accounts.
In considering the fees, the Trustees noted from the Lipper data that the Fund’s effective advisory fee rate and total expense ratio were each above the median of such fees and expenses of funds in the Lipper expense group. The Trustees further noted that MFS agreed to continue to reduce its advisory fee on average daily net assets over $1 billion, and concluded that the existing breakpoint was sufficient to allow the Fund to benefit from economies of scale as its assets grow. The Trustees concluded that the fees were reasonable in light of the nature and quality of services provided.
The Trustees also considered information prepared by MFS relating to its costs and profits with respect to the Fund and other investment companies and accounts advised by MFS, as well as MFS’ methodologies used to determine and allocate its costs to the Fund and other accounts and products for purposes of estimating profitability.
After reviewing these and other factors described below, the Trustees concluded that the advisory fees charged to the Fund represent reasonable compensation in light of the nature and quality of the services being provided by MFS.
In addition, the Trustees considered MFS’ resources and related efforts to continue to retain, attract and motivate capable personnel to serve the Fund. The Trustees also considered the financial resources of MFS and its parent, Sun Life Financial Inc. The Trustees further considered any advantages and possible disadvantages of having an adviser which also serves other investment companies as well as institutional accounts.
The Trustees also considered the nature, quality, cost, and extent of administrative, transfer agency, and distribution services provided to the Fund by MFS and its affiliates under agreements and plans other than the investment advisory agreement, including the 12b-1 fees the Fund pays to MFS Fund Distributors, Inc., an affiliate of MFS. The Trustees also considered the nature, extent and quality of certain other services MFS performs or arranges on the Fund’s behalf, which may include securities lending programs, directed expense payment programs, class action recovery programs, and MFS’ interaction with third-party service providers, principally custodians and sub-custodians. The Trustees concluded that the various non-advisory services provided by MFS and its affiliates on behalf of the Fund were satisfactory. The Trustees also considered the benefits to MFS from the use of the Fund’s portfolio brokerage commissions to pay for research and other similar services and various other factors. Additionally, the Trustees considered so-called “fall-out benefits” to MFS such as reputational value derived from serving as investment manager to the Trust, and determined that any such benefits derived by MFS were reasonable and fair.
Based on their evaluation of factors that they deemed to be material, including those factors described above, the Board of Trustees, including a majority of the independent Trustees, concluded that the investment advisory agreement should be continued for an additional one-year period, commencing September 1, 2008.
A discussion regarding the Board’s most recent review and renewal of the fund’s Investment Advisory Agreement with MFS is available by clicking on the fund’s name under “Variable Insurance Portfolios-VIT II” in the “Products & Performance” section on the MFS Web site (mfs.com).
26
PROXY VOTING POLICIES AND INFORMATION
A general description of the MFS funds’ proxy voting policies and procedures is available without charge, upon request, by calling
1-800-225-2606, by visiting the Proxy Voting section of mfs.com or by visiting the SEC’s Web site at http://www.sec.gov.
Information regarding how the fund voted proxies relating to portfolio securities during the most recent twelve-month period ended June 30 is available without charge by visiting the Proxy Voting section of mfs.com or by visiting the SEC’s Web site at http://www.sec.gov.
QUARTERLY PORTFOLIO DISCLOSURE
The fund will file a complete schedule of portfolio holdings with the Securities and Exchange Commission (the Commission) for the first and third quarters of each fiscal year on Form N-Q. The fund’s Form N-Q may be reviewed and copied at the:
Public Reference Room
Securities and Exchange Commission
100 F Street, NE, Room 1580
Washington, D.C. 20549
Information on the operation of the Public Reference Room may be obtained by calling the Commission at 1-800-SEC-0330. The fund’s Form N-Q is available on the EDGAR database on the Commission’s Internet Web site at http://www.sec.gov, and copies of this information may be obtained, upon payment of a duplicating fee, by electronic request at the following e-mail address: publicinfo@sec.gov or by writing the Public Reference Section at the above address.
27
MFS® PRIVACY NOTICE
Privacy is a concern for every investor today. At MFS Investment Management® and the MFS funds, we take this concern very seriously. We want you to understand our policies about the investment products and services that we offer, and how we protect the nonpublic personal information of investors who have a direct relationship with us and our wholly owned subsidiaries.
Throughout our business relationship, you provide us with personal information. We maintain information and records about you, your investments, and the services you use. Examples of the nonpublic personal information we maintain include
| | Ÿ | | data from investment applications and other forms |
| | Ÿ | | share balances and transactional history with us, our affiliates, or others |
| | Ÿ | | facts from a consumer reporting agency |
We do not disclose any nonpublic personal information about our customers or former customers to anyone, except as permitted by law. We may share nonpublic personal information with third parties or certain of our affiliates in connection with servicing your account or processing your transactions. We may share information with companies or financial institutions that perform marketing services on our behalf or with other financial institutions with which we have joint marketing arrangements, subject to any legal requirements.
Authorization to access your nonpublic personal information is limited to appropriate personnel who provide products, services, or information to you. We maintain physical, electronic, and procedural safeguards to help protect the personal information we collect about you.
If you have any questions about the MFS privacy policy, please call 1-800-225-2606 any business day between 8 a.m. and 8 p.m. Eastern time.
Note: If you own MFS products or receive MFS services in the name of a third party such as a bank or broker-dealer, their privacy policy may apply to you instead of ours.
28

MFS® GOVERNMENT SECURITIES PORTFOLIO
The report is prepared for the general information of contract owners. It is authorized for distribution to prospective investors only when preceded or accompanied by a current prospectus.
NOT FDIC INSURED Ÿ MAY LOSE VALUE Ÿ NO BANK GUARANTEE Ÿ NOT A DEPOSIT Ÿ NOT INSURED BY ANY FEDERAL GOVERNMENT AGENCY OR NCUA/NCUSIF
LETTER FROM THE CEO

Dear Contract Owners:
The market downturns and economic setbacks of late probably rank among the worst financial declines most of us have experienced. Inevitably, people may be questioning their commitment to investing. Still, it is important to remember that downturns are an inescapable part of the business cycle. Such troughs have been seen before, and if we can use history as a guide, market recoveries typically have followed.
Recent events have clearly shown us the value of certain types of investments. In this environment, two of the hallmarks of mutual funds — transparency and liquidity — have become critically important. Unlike some other types of investments, the operations of mutual funds are relatively transparent to their shareholders. With their daily redemption feature, mutual funds also generally provide easy, convenient access to one’s money. Through these recent market upheavals, this level of liquidity enhanced the ability of mutual fund investors to respond and modify their investments as they and their advisors saw fit — a flexibility that those in less liquid investments simply did not have at their disposal.
At MFS® we take particular pride in how well mutual funds can serve investors because we invented the mutual fund in the United States. Established in 1924, Massachusetts Investors Trust was the nation’s first fund. Recent market events only reinforce what we have learned through 85 years — that mutual funds provide unique features that are important to investors in any type of market climate.
Respectfully,

Robert J. Manning
Chief Executive Officer and Chief Investment Officer
MFS Investment Management®
February 17, 2009
The opinions expressed in this letter are subject to change, may not be relied upon for investment advice, and no forecasts can be guaranteed.
Before investing, consider the fund’s investment objectives, risks, charges, and expenses. For a prospectus containing this and other information, contact your investment professional or view online. Read it carefully.
MFS Fund Distributors, Inc., 500 Boylston Street, Boston, MA 02116
1
PORTFOLIO COMPOSITION
Portfolio structure (i)
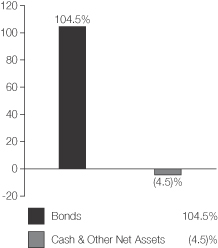
| | |
| Fixed income sectors (i) | | |
| Mortgage-Backed Securities | | 74.7% |
| U.S. Government Agencies | | 16.0% |
| U.S. Treasury Securities | | 10.0% |
| Municipal Bonds | | 3.8% |
| | |
| Credit quality of bonds (r) | | |
| AAA | | 97.7% |
| AA | | 2.3% |
| | |
| Portfolio facts | | |
| Average Duration (d)(i) | | 3.1 |
| Average Life (i)(m) | | 4.6 yrs. |
| Average Maturity (i)(m) | | 17.5 yrs. |
| Average Credit Quality of Rated Securities (long-term) (a) | | AAA |
| Average Credit Quality of Rated Securities (short-term) (a) | | A-1 |
| (a) | The average credit quality of rated securities is based upon a market weighted average of portfolio holdings that are rated by public rating agencies. |
| (d) | Duration is a measure of how much a bond’s price is likely to fluctuate with general changes in interest rates, e.g., if rates rise 1.00%, a bond with a 5-year duration is likely to lose about 5.00% of its value. |
| (i) | For purposes of this presentation, the bond component includes accrued interest amounts and may be positively or negatively impacted by the equivalent exposure from any derivative holdings, if applicable. |
| (m) | The average maturity shown is calculated using the final stated maturity on the portfolio’s holdings without taking into account any holdings which have been pre-refunded or pre-paid to an earlier date or which have a mandatory put date prior to the stated maturity. The average life shown takes into account these earlier dates. |
| (r) | Each security is assigned a rating from Moody’s Investors Service. If not rated by Moody’s, the rating will be that assigned by Standard & Poor’s. Likewise, if not assigned a rating by Standard & Poor’s, it will be based on the rating assigned by Fitch, Inc. For those portfolios that hold a security which is not rated by any of the three agencies, the security is considered Not Rated. Holdings in U.S. Treasuries and government agency mortgage-backed securities, if any, are included in the “AAA”-rating category. Percentages are based on the total market value of investments as of 12/31/08. |
From time to time “Cash & Other Net Assets” may be negative due to the timing of cash receipts and/or equivalent exposure from any derivative holdings.
Percentages are based on net assets as of 12/31/08, unless otherwise noted.
The portfolio is actively managed and current holdings may be different.
2
MANAGEMENT REVIEW
Summary of Results
For the twelve months ended December 31, 2008, Initial Class shares of the MFS Government Securities Portfolio (the “fund”) provided a total return of 8.55%, while Service Class shares of the fund provided a total return of 8.29%. These compare with a return of 10.17% for the fund’s benchmark, the Barclays Capital U.S. Government/Mortgage Bond Index.
Market Environment
The U.S. economy and financial markets experienced significant deterioration and extraordinary volatility over the reporting period. U.S. economic growth slowed significantly, despite the short-term bounce from the second quarter fiscal stimulus. Strong domestic headwinds included accelerated deterioration in the housing market, anemic corporate investment, a rapidly declining job market, and a much tighter credit environment. During the period, a seemingly continuous series of tumultuous financial events hammered markets, including: the distressed sale of failing Bear Stearns to JPMorgan, the conservatorship of Government Sponsored Enterprises (GSEs) Fannie Mae and Freddie Mac, the bankruptcy of investment bank Lehman Brothers, the Federal Reserve Bank’s complex intervention of insurance company American International Group (AIG), the nationalization of several large European banks, the failure of Washington Mutual, and the distressed sale of Wachovia. As a result of this barrage of turbulent news, global equity markets pushed significantly lower and credit markets witnessed the worst dislocation since the beginning of the credit crisis. Though conditions improved towards the end of the period, the state of financial and macroeconomic dislocation remained severe.
While reasonably resilient during the first half of the period, the global economy and financial system increasingly experienced considerable negative spillovers from the U.S. slowdown. Not only did Europe and Japan show obvious signs of economic softening, the more powerful engine of global growth – emerging markets – also displayed weakening dynamics.
During the reporting period, the U.S. Federal Reserve Board cut interest rates aggressively and introduced a multitude of new lending facilities to alleviate ever-tightening credit markets, while the U.S. federal government moved quickly to design and implement a meaningful fiscal stimulus package. Although several other global central banks also cut rates, the dilemma of rising energy and food prices heightened concerns among central bankers that inflationary expectations might become unhinged despite weaker growth. Only later in the reporting period did slowing global growth result in a very precipitous decline in commodity prices, which significantly eased inflation and inflationary expectations. As inflationary concerns diminished in the face of global deleveraging, and equity and credit markets deteriorated more sharply, a coordinated rate cut marked the beginning of much more aggressive easing by the major global central banks.
Detractors from Performance
Relative to the Barclays Capital U.S. Government/Mortgage Bond Index, a key detractor from performance was the fund’s lesser exposure to U.S. Treasury securities, which outperformed the benchmark over the reporting period. The strong relative performance of treasuries, we believe, was fueled by investors’ flight to quality, the general risk aversion in the market place, and by weakening macroeconomic conditions.
A shorter duration (d) stance also held back relative performance as interest rates generally declined during the period.
Our greater relative exposure to government agency debt, particularly to delegated underwriting and servicing (DUS) bonds (pools of multifamily housing loans issued by the Federal National Mortgage Association (Fannie Mae)), also dampened investment results as the sector lagged the returns of the benchmark.
Contributors to Performance
During the reporting period, the fund’s return from yield, which was greater than that of the benchmark, was a key contributor to performance.
3
Management Review – continued
The fund’s underweighted exposure to Government National Mortgage Association (Ginnie Mae) and Federal Home Loan Mortgage Corporation (Freddie Mac) mortgage-backed securities also supported positive performance as holdings within these sectors underperformed the benchmark over the reporting period.
Respectfully,
Geoffrey Schechter
Portfolio Manager
| (d) | Duration is a measure of how much a bond’s price is likely to fluctuate with general changes in interest rates, e.g., if rates rise 1.00%, a bond with a 5-year duration is likely to lose about 5.00% of its value. |
The views expressed in this report are those of the portfolio manager only through the end of the period of the report as stated on the cover and do not necessarily reflect the views of MFS or any other person in the MFS organization. These views are subject to change at any time based on market or other conditions, and MFS disclaims any responsibility to update such views. These views may not be relied upon as investment advice or an indication of trading intent on behalf of any MFS portfolio. References to specific securities are not recommendations of such securities, and may not be representative of any MFS portfolio’s current or future investments.
4
PERFORMANCE SUMMARY THROUGH 12/31/08
The following chart illustrates the historical performance of the fund in comparison to its benchmark(s). Benchmark comparisons are unmanaged; do not reflect any fees or expenses; and cannot be invested in directly. The performance of other share classes will be greater than or less than that of the class depicted below. (See Notes to Performance Summary.)
Performance data shown represents past performance and is no guarantee of future results. Investment return and principal value fluctuate so your units, when sold, may be worth more or less than the original cost; current performance may be lower or higher than quoted. The performance shown does not reflect the deduction of taxes, if any, that a contract holder would pay on fund distributions or the redemption of contract units. The returns for the fund shown also do not reflect the deduction of expenses associated with variable products, such as mortality and expense risk charges, separate account charges, and sales charges imposed by the insurance company separate accounts. Such expenses would reduce the overall returns shown.
Growth of a hypothetical $10,000 investment
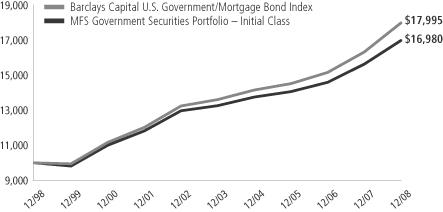
Total rates of return through 12/31/08
Average Annual Total Returns
| | | | | | | | | | | | |
| | | Share class | | Class inception date | | 1-yr | | 5-yr | | 10-yr | | |
| | | Initial Class | | 6/12/85 | | 8.55% | | 5.07% | | 5.44% | | |
| | | Service Class | | 8/24/01 | | 8.29% | | 4.82% | | 5.25% | | |
Comparative Benchmark
| | | | | | | | | | | | |
| | | Barclays Capital U.S. Government/Mortgage Bond Index (f) | | 10.17% | | 5.75% | | 6.05% | | |
| (f) | Source: FactSet Research Systems Inc. |
Benchmark Definition
Barclays Capital U.S. Government/Mortgage Bond Index (formerly known as Lehman Brothers U.S. Government/Mortgage Bond Index) – measures debt issued by the U.S. Government, and its agencies, as well as mortgage-backed pass-through securities of Ginnie Mae (GNMA), Fannie Mae (FNMA), and Freddie Mac (FHLMC).
It is not possible to invest directly in an index.
Notes to Performance Summary
Performance for the Service Class includes the performance of the fund’s Initial Class for periods prior to their offering. Because Service Class expenses are higher than those of Initial Class, performance shown for Service Class is higher than it would have been had it been offered for the entire period. Performance has not been adjusted to take into account differences in class specific operating expenses (such as Rule 12b-1 fees). Please see the prospectus for additional information about performance and expenses.
Performance results reflect any applicable expense subsidies and waivers in effect during the periods shown. Without such subsidies and waivers the fund’s performance results would be less favorable. Please see the prospectus for complete details. All results are historical and assume the reinvestment of any dividends and capital gains distributions.
From time to time the fund may receive proceeds from litigation settlements, without which performance would be lower.
5
EXPENSE TABLE
Fund Expenses Borne by the Contract Holders During the Period,
July 1, 2008 through December 31, 2008
As a contract holder of the fund, you incur ongoing costs, including management fees; distribution (12b-1) fees; and other fund expenses. This example is intended to help you understand your ongoing costs (in dollars) of investing in the fund and to compare these costs with the ongoing costs of investing in other mutual funds.
The example is based on an investment of $1,000 invested at the beginning of the period and held for the entire period July 1, 2008 through December 31, 2008.
Actual Expenses
The first line for each share class in the following table provides information about actual account values and actual expenses. You may use the information in this line, together with the amount you invested, to estimate the expenses that you paid over the period. Simply divide your account value by $1,000 (for example, an $8,600 account value divided by $1,000 = 8.6), then multiply the result by the number in the first line under the heading entitled “Expenses Paid During Period” to estimate the expenses you paid on your account during this period.
Hypothetical Example for Comparison Purposes
The second line for each share class in the following table provides information about hypothetical account values and hypothetical expenses based on the fund’s actual expense ratio and an assumed rate of return of 5% per year before expenses, which is not the fund’s actual return. The hypothetical account values and expenses may not be used to estimate the actual ending account balance or expenses you paid for the period. You may use this information to compare the ongoing costs of investing in the fund and other funds. To do so, compare this 5% hypothetical example with the 5% hypothetical examples that appear in the shareholder reports of the other funds.
Please note that the expenses shown in the table are meant to highlight the fund’s ongoing costs only and do not take into account the fees and expenses imposed under the variable contracts through which your investment in the fund is made. Therefore, the second line for each share class in the table is useful in comparing ongoing costs associated with an investment in vehicles (such as the fund) which fund benefits under variable annuity and variable life insurance contracts and to qualified pension and retirement plans only, and will not help you determine the relative total costs of investing in the fund through variable annuity and variable life insurance contracts. If the fees and expenses imposed under the variable contracts were included, your costs would have been higher.
| | | | | | | | | | |
| Share Class | | | | Annualized
Expense Ratio | | Beginning
Account Value
7/01/08 | | Ending
Account Value
12/31/08 | | Expenses Paid
During Period (p)
7/01/08-12/31/08 |
| Initial Class | | Actual | | 0.66% | | $1,000.00 | | $1,065.22 | | $3.43 |
| | Hypothetical (h) | | 0.66% | | $1,000.00 | | $1,021.82 | | $3.35 |
| Service Class | | Actual | | 0.91% | | $1,000.00 | | $1,063.92 | | $4.72 |
| | Hypothetical (h) | | 0.91% | | $1,000.00 | | $1,020.56 | | $4.62 |
| (h) | 5% class return per year before expenses. |
| (p) | Expenses paid is equal to each class’ annualized expense ratio, as shown above, multiplied by the average account value over the period, multiplied by the number of days in the period, divided by the number of days in the year. |
6
PORTFOLIO OF INVESTMENTS – 12/31/08
The Portfolio of Investments is a complete list of all securities owned by your fund. It is categorized by broad-based asset classes.
| | | | | | |
| Issuer | | Shares/Par | | Value ($) |
| | | | | | |
| BONDS – 98.6% | | | | | | |
| Agency – Other – 7.1% | | | | | | |
| Financing Corp., 9.4%, 2018 | | $ | 5,475,000 | | $ | 8,190,857 |
| Financing Corp., 9.8%, 2018 | | | 7,760,000 | | | 11,914,898 |
| Financing Corp., 10.35%, 2018 | | | 7,065,000 | | | 11,279,689 |
| Financing Corp., STRIPS, 0%, 2017 | | | 8,940,000 | | | 6,746,160 |
| | | | | | |
| | | | | $ | 38,131,604 |
| | | | | | |
| Mortgage Backed – 74.4% | | | | | | |
| Fannie Mae, 4.73%, 2012 | | $ | 900,553 | | $ | 915,203 |
| Fannie Mae, 4.79%, 2012-2015 | | | 7,241,730 | | | 7,385,138 |
| Fannie Mae, 4.543%, 2013 | | | 912,624 | | | 921,318 |
| Fannie Mae, 4.845%, 2013 | | | 1,725,248 | | | 1,758,274 |
| Fannie Mae, 5%, 2013-2027 | | | 27,914,662 | | | 28,553,673 |
| Fannie Mae, 5.06%, 2013-2017 | | | 1,548,087 | | | 1,583,041 |
| Fannie Mae, 5.37%, 2013 | | | 1,556,878 | | | 1,593,452 |
| Fannie Mae, 4.589%, 2014 | | | 1,287,645 | | | 1,299,228 |
| Fannie Mae, 4.6%, 2014 | | | 834,871 | | | 842,011 |
| Fannie Mae, 4.609%, 2014 | | | 3,261,466 | | | 3,294,273 |
| Fannie Mae, 4.77%, 2014 | | | 716,431 | | | 727,201 |
| Fannie Mae, 4.82%, 2014-2015 | | | 3,027,512 | | | 3,075,918 |
| Fannie Mae, 4.84%, 2014 | | | 4,889,507 | | | 4,985,394 |
| Fannie Mae, 4.872%, 2014 | | | 3,116,701 | | | 3,176,851 |
| Fannie Mae, 4.88%, 2014-2020 | | | 947,840 | | | 966,977 |
| Fannie Mae, 5.1%, 2014 | | | 899,106 | | | 925,052 |
| Fannie Mae, 4.56%, 2015 | | | 1,079,499 | | | 1,083,286 |
| Fannie Mae, 4.62%, 2015 | | | 1,508,079 | | | 1,518,571 |
| Fannie Mae, 4.665%, 2015 | | | 729,286 | | | 735,475 |
| Fannie Mae, 4.69%, 2015 | | | 595,052 | | | 600,957 |
| Fannie Mae, 4.7%, 2015 | | | 1,079,827 | | | 1,090,770 |
| Fannie Mae, 4.74%, 2015 | | | 682,772 | | | 690,837 |
| Fannie Mae, 4.78%, 2015 | | | 949,027 | | | 961,132 |
| Fannie Mae, 4.81%, 2015 | | | 952,313 | | | 966,593 |
| Fannie Mae, 4.815%, 2015 | | | 824,000 | | | 836,292 |
| Fannie Mae, 4.85%, 2015 | | | 596,015 | | | 606,362 |
| Fannie Mae, 4.87%, 2015 | | | 627,927 | | | 638,986 |
| Fannie Mae, 4.89%, 2015 | | | 709,338 | | | 722,883 |
| Fannie Mae, 4.921%, 2015 | | | 2,226,241 | | | 2,275,252 |
| Fannie Mae, 4.997%, 2015 | | | 107,443 | | | 110,175 |
| Fannie Mae, 5.466%, 2015 | | | 1,404,911 | | | 1,475,558 |
| Fannie Mae, 4.5%, 2016-2028 | | | 20,955,700 | | | 21,483,382 |
| Fannie Mae, 5.09%, 2016 | | | 600,000 | | | 615,461 |
| Fannie Mae, 5.423%, 2016 | | | 1,394,403 | | | 1,460,880 |
| Fannie Mae, 6.5%, 2016-2037 | | | 11,010,526 | | | 11,494,427 |
| Fannie Mae, 4.995%, 2017 | | | 2,291,293 | | | 2,335,473 |
| Fannie Mae, 5.05%, 2017 | | | 936,000 | | | 957,869 |
| Fannie Mae, 5.5%, 2017-2033 | | | 89,175,667 | | | 91,591,529 |
| Fannie Mae, 6%, 2017-2037 | | | 21,687,814 | | | 22,369,361 |
| Fannie Mae, 5.19%, 2020 | | | 654,184 | | | 662,873 |
| Fannie Mae, 7.5%, 2022-2031 | | | 953,294 | | | 1,010,434 |
| Freddie Mac, 4.5%, 2010-2026 | | | 5,422,362 | | | 5,476,322 |
| Freddie Mac, 4.375%, 2015 | | | 2,325,404 | | | 2,349,990 |
| Freddie Mac, 5%, 2016-2028 | | | 30,473,650 | | | 31,007,402 |
| Freddie Mac, 6%, 2021-2038 | | | 34,496,235 | | | 35,637,406 |
| Freddie Mac, 5.5%, 2022-2036 | | | 57,849,430 | | | 59,283,270 |
| Freddie Mac, 4%, 2024 | | | 1,195,615 | | | 1,198,642 |
| | | | | | |
| Issuer | | Shares/Par | | Value ($) |
| | | | | | |
| BONDS – continued | | | | | | |
| Mortgage Backed – continued | | | | | | |
| Freddie Mac, 6.5%, 2032 – 2037 | | $ | 6,118,385 | | $ | 6,374,711 |
| Ginnie Mae, 5.5%, 2033 – 2038 | | | 20,781,779 | | | 21,453,242 |
| Ginnie Mae, 5.612%, 2058 | | | 3,334,118 | | | 3,413,303 |
| Ginnie Mae, 6.36%, 2058 | | | 2,892,818 | | | 3,099,157 |
| | | | | | |
| | | | | $ | 399,591,267 |
| | | | | | |
| Municipals – 3.8% | | | | | | |
| California Educational Facilities Authority Rev. (Stanford University), “T-1”, 5%, 2039 | | $ | 6,165,000 | | $ | 6,155,013 |
| Illinois Regional Transportation Authority, “A”, FSA, 5.75%, 2034 | | | 3,235,000 | | | 3,356,960 |
Massachusetts Bay Transportation Authority, Sales Tax Rev., “A-1”,
5.25%, 2028 | | | 2,995,000 | | | 3,027,855 |
| Massachusetts Health & Educational Facilities Authority Rev. (Boston College), 5.5%, 2027 | | | 2,125,000 | | | 2,124,873 |
| Massachusetts Water Pollution Abatement Trust, 5.25%, 2033 | | | 1,020,000 | | | 1,031,240 |
| Massachusetts Water Resources Authority Rev., “B”, FSA, 5.25%, 2035 | | | 3,775,000 | | | 3,716,374 |
Minnesota Public Facilities Authority, Water Pollution Control Rev., “B”,
5%, 2018 | | | 795,000 | | | 884,374 |
| | | | | | |
| | | | | $ | 20,296,689 |
| | | | | | |
| U.S. Government Agencies – 8.6% | | | | | | |
| Aid-Egypt, 4.45%, 2015 | | $ | 3,299,000 | | $ | 3,564,075 |
| Aid-Lebanon, 7.62%, 2009 | | | 1,218,822 | | | 1,248,232 |
Empresa Energetica Cornito Ltd., 6.07%, 2010 | | | 2,690,000 | | | 2,781,433 |
| Farmer Mac, 5.5%, 2011 (n) | | | 5,370,000 | | | 5,716,451 |
| Freddie Mac, 5%, 2017 | | | 2,161,000 | | | 2,470,568 |
Small Business Administration,
8.7%, 2009 | | | 21,066 | | | 21,467 |
Small Business Administration,
9.05%, 2009 | | | 1,915 | | | 1,941 |
Small Business Administration,
10.05%, 2009 | | | 843 | | | 855 |
Small Business Administration,
6.34%, 2021 | | | 1,435,218 | | | 1,502,334 |
Small Business Administration,
6.35%, 2021 | | | 1,572,086 | | | 1,644,977 |
Small Business Administration,
6.44%, 2021 | | | 1,787,170 | | | 1,876,215 |
Small Business Administration,
6.625%, 2021 | | | 2,302,995 | | | 2,427,641 |
Small Business Administration,
6.07%, 2022 | | | 1,798,478 | | | 1,880,835 |
Small Business Administration,
4.98%, 2023 | | | 1,350,788 | | | 1,374,433 |
Small Business Administration,
4.77%, 2024 | | | 2,329,644 | | | 2,348,252 |
7
Portfolio of Investments – continued
| | | | | | |
| Issuer | | Shares/Par | | Value ($) |
| | | | | | |
| BONDS – continued | | | | | | |
| U.S. Government Agencies – continued | | | |
Small Business Administration,
4.86%, 2024 | | $ | 1,659,148 | | $ | 1,678,108 |
Small Business Administration,
4.88%, 2024 | | | 1,468,254 | | | 1,485,540 |
Small Business Administration,
4.99%, 2024 | | | 2,187,308 | | | 2,227,100 |
Small Business Administration,
5.52%, 2024 | | | 1,900,338 | | | 1,981,055 |
Small Business Administration,
5.11%, 2025 | | | 1,853,417 | | | 1,894,844 |
| U.S. Department of Housing & Urban Development, 6.36%, 2016 | | | 6,000,000 | | | 6,485,400 |
| U.S. Department of Housing & Urban Development, 6.59%, 2016 | | | 1,716,000 | | | 1,722,885 |
| | | | | | |
| | | | | $ | 46,334,641 |
| | | | | | |
| | | | | | |
| Issuer | | Shares/Par | | Value ($) |
| | | | | | |
| BONDS – continued | | | | | | |
| U.S. Treasury Obligations – 4.7% | | | |
| U.S. Treasury Bonds, 7.875%, 2021 | | $ | 114,000 | | $ | 169,433 |
| U.S. Treasury Bonds, 6.25%, 2023 | | | 2,875,000 | | | 3,921,230 |
| U.S. Treasury Bonds, 6%, 2026 | | | 2,699,000 | | | 3,766,792 |
| U.S. Treasury Bonds, 6.75%, 2026 (f) | | | 1,829,000 | | | 2,758,646 |
| U.S. Treasury Bonds, 5.25%, 2029 | | | 9,240,000 | | | 12,253,109 |
| U.S. Treasury Bonds, 4.375%, 2038 | | | 348,000 | | | 466,103 |
| U.S. Treasury Notes, 3.125%, 2013 | | | 2,000,000 | | | 2,157,968 |
| | | | | | |
| | | | | $ | 25,493,281 |
| | | | | | |
Total Bonds
(Identified Cost, $511,370,511) | | | | | $ | 529,847,482 |
| | | | | | |
| | |
| MONEY MARKET FUNDS (v) – 0.6% | | | | | | |
| MFS Institutional Money Market Portfolio, 0.37%, at Cost and Net Asset Value | | | 3,177,340 | | $ | 3,177,340 |
| | | | | | |
Total Investments
(Identified Cost, $514,547,851) | | | | | $ | 533,024,822 |
| | | | | | |
OTHER ASSETS, LESS
LIABILITIES – 0.8% | | | | | | 4,196,996 |
| | | | | | |
| Net Assets – 100.0% | | | | | $ | 537,221,818 |
| | | | | | |
| (f) | All or a portion of the security has been segregated as collateral for open futures contracts. |
| (n) | Securities exempt from registration under Rule 144A of the Securities Act of 1933. These securities may be sold in the ordinary course of business in transactions exempt from registration, normally to qualified institutional buyers. At period end, the aggregate value of these securities was $5,716,451, representing 1.1% of net assets. |
| (v) | Underlying fund that is available only to investment companies managed by MFS. The rate quoted is the annualized seven-day yield of the fund at period end. |
The following abbreviations are used in this report and are defined:
| STRIPS | | Separate Trading of Registered Interest and Principal of Securities Insurers |
| | | | | | |
| Insurers | | |
| FSA | | Financial Security Assurance, Inc. | | | | |
Derivative Contracts at 12/31/08
Futures contracts outstanding at 12/31/08
| | | | | | | | | |
| Description | | Contracts | | Value | | Expiration
Date | | Unrealized
Appreciation
(Depreciation) | |
| U.S. Treasury Bond 30 yr (Short) | | 53 | | $7,316,484 | | Mar-09 | | $(723,139 | ) |
| U.S. Treasury Note 2 yr (Long) | | 160 | | 34,890,000 | | Mar-09 | | 314,440 | |
| | | | | | | | | |
| | | | | | | | $(408,699 | ) |
| | | | | | | | | |
At December 31, 2008 the fund had sufficient cash and/or other liquid securities to cover any commitments under these derivative contracts.
See Notes to Financial Statements
8
FINANCIAL STATEMENTS | STATEMENT OF ASSETS AND LIABILITIES
This statement represents your fund’s balance sheet, which details the assets and liabilities comprising the total value of the fund.
| | | | | |
At 12/31/08 | | | | | |
Assets | | | | | |
Investments – | | | | | |
Non-affiliated issuers, at value (identified cost, $511,370,511) | | $529,847,482 | | | |
Underlying funds, at cost and value | | 3,177,340 | | | |
Total investments, at value (identified cost, $514,547,851) | | $533,024,822 | | | |
Receivable for daily variation margin on open futures contracts | | $173,875 | | | |
Receivable for fund shares sold | | 796,095 | | | |
Interest and dividends receivable | | 3,922,703 | | | |
Other assets | | 26,357 | | | |
Total assets | | | | | $537,943,852 |
Liabilities | | | | | |
Payable for investments purchased | | $358,412 | | | |
Payable for fund shares reacquired | | 175,850 | | | |
Payable to affiliates | | | | | |
Management fee | | 16,140 | | | |
Distribution fees | | 3,701 | | | |
Administrative services fee | | 1,687 | | | |
Payable for trustees’ compensation | | 60 | | | |
Accrued expenses and other liabilities | | 166,184 | | | |
Total liabilities | | | | | $722,034 |
Net assets | | | | | $537,221,818 |
Net assets consist of | | | | | |
Paid-in capital | | $500,150,370 | | | |
Unrealized appreciation (depreciation) on investments | | 18,068,272 | | | |
Accumulated net realized gain (loss) on investments | | (7,151,865 | ) | | |
Undistributed net investment income | | 26,155,041 | | | |
Net assets | | | | | $537,221,818 |
Shares of beneficial interest outstanding | | | | | 40,722,931 |
Initial Class shares | | | | | |
Net assets | | $266,170,297 | | | |
Shares outstanding | | 20,111,791 | | | |
Net asset value per share | | | | | $13.23 |
Service Class shares | | | | | |
Net assets | | $271,051,521 | | | |
Shares outstanding | | 20,611,140 | | | |
Net asset value per share | | | | | $13.15 |
See Notes to Financial Statements
9
FINANCIAL STATEMENTS | STATEMENT OF OPERATIONS
This statement describes how much your fund earned in investment income and accrued in expenses. It also describes any gains and/or losses generated by fund operations.
| | | | | |
Year ended 12/31/08 | | | | | |
| Net investment income | | | | | |
Interest income | | $29,074,332 | | | |
Dividends from underlying funds | | 12,873 | | | |
Total investment income | | | | | $29,087,205 |
Expenses | | | | | |
Management fee | | $3,230,420 | | | |
Distribution fees | | 758,725 | | | |
Administrative services fee | | 192,562 | | | |
Trustees’ compensation | | 65,835 | | | |
Custodian fee | | 129,598 | | | |
Shareholder communications | | 89,935 | | | |
Auditing fees | | 48,843 | | | |
Legal fees | | 7,128 | | | |
Miscellaneous | | 37,106 | | | |
Total expenses | | | | | $4,560,152 |
Fees paid indirectly | | (3,938 | ) | | |
Net expenses | | | | | $4,556,214 |
Net investment income | | | | | $24,530,991 |
Realized and unrealized gain (loss) on investments | | | | | |
Realized gain (loss) (identified cost basis) | | | | | |
Investment transactions | | $11,713,310 | | | |
Futures contracts | | 1,185,313 | | | |
Net realized gain (loss) on investments | | | | | $12,898,623 |
Change in unrealized appreciation (depreciation) | | | | | |
Investments | | $10,776,858 | | | |
Futures contracts | | (566,723 | ) | | |
Net unrealized gain (loss) on investments | | | | | $10,210,135 |
Net realized and unrealized gain (loss) on investments | | | | | $23,108,758 |
Change in net assets from operations | | | | | $47,639,749 |
See Notes to Financial Statements
10
FINANCIAL STATEMENTS | STATEMENTS OF CHANGES IN NET ASSETS
These statements describe the increases and/or decreases in net assets resulting from operations, any distributions, and any shareholder transactions.
| | | | | | |
For years ended 12/31 | | 2008 | | | 2007 | |
Change in net assets | | | | | | |
From operations | | | | | | |
Net investment income | | $24,530,991 | | | $28,299,794 | |
Net realized gain (loss) on investments | | 12,898,623 | | | 4,103,045 | |
Net unrealized gain (loss) on investments | | 10,210,135 | | | 11,603,103 | |
Change in net assets from operations | | $47,639,749 | | | $44,005,942 | |
Distributions declared to shareholders | | | | | | |
From net investment income | | | | | | |
Initial Class | | $(15,631,404 | ) | | $(16,335,537 | ) |
Service Class | | (15,370,082 | ) | | (15,330,764 | ) |
Total distributions declared to shareholders | | $(31,001,486 | ) | | $(31,666,301 | ) |
Change in net assets from fund share transactions | | $(99,982,211 | ) | | $(52,841,844 | ) |
Total change in net assets | | $(83,343,948 | ) | | $(40,502,203 | ) |
Net assets | | | | | | |
At beginning of period | | 620,565,766 | | | 661,067,969 | |
At end of period (including undistributed net investment income of $26,155,041 and
$30,996,381, respectively) | | $537,221,818 | | | $620,565,766 | |
See Notes to Financial Statements
11
FINANCIAL STATEMENTS | FINANCIAL HIGHLIGHTS
The financial highlights table is intended to help you understand the fund’s financial performance for the past 5 years. Certain information reflects financial results for a single fund share. The total returns in the table represent the rate by which an investor would have earned (or lost) on an investment in the fund share class (assuming reinvestment of all distributions) held for the entire period.
| | | | | | | | | | | | | | | |
| Initial Class | | Years ended 12/31 | |
| | | 2008 | | | 2007 | | | 2006 | | | 2005 | | | 2004 | |
Net asset value, beginning of period | | $12.89 | | | $12.65 | | | $12.84 | | | $13.16 | | | $13.44 | |
| Income (loss) from investment operations | | | | | | | | | | | | | | | |
Net investment income (d) | | $0.55 | | | $0.56 | | | $0.56 | | | $0.56 | | | $0.54 | |
Net realized and unrealized gain (loss) on investments | | 0.51 | | | 0.31 | | | (0.12 | ) | | (0.26 | ) | | (0.07 | ) |
Total from investment operations | | $1.06 | | | $0.87 | | | $0.44 | | | $0.30 | | | $0.47 | |
| Less distributions declared to shareholders | | | | | | | | | | | | | | | |
From net investment income | | $(0.72 | ) | | $(0.63 | ) | | $(0.63 | ) | | $(0.62 | ) | | $(0.75 | ) |
Net asset value, end of period | | $13.23 | | | $12.89 | | | $12.65 | | | $12.84 | | | $13.16 | |
Total return (%) (k)(s) | | 8.55 | | | 7.18 | | | 3.68 | | | 2.30 | | | 3.76 | |
Ratios (%) (to average net assets)
and Supplemental data: | | | | | | | | | | | | | | | |
Expenses (f) | | 0.65 | | | 0.63 | | | 0.63 | | | 0.63 | | | 0.62 | |
Net investment income | | 4.31 | | | 4.48 | | | 4.47 | | | 4.32 | | | 4.12 | |
Portfolio turnover | | 52 | | | 39 | | | 29 | | | 75 | | | 85 | |
Net assets at end of period (000 Omitted) | | $266,170 | | | $299,871 | | | $351,906 | | | $425,740 | | | $493,616 | |
| |
| Service Class | | Years ended 12/31 | |
| | | 2008 | | | 2007 | | | 2006 | | | 2005 | | | 2004 | |
Net asset value, beginning of period | | $12.81 | | | $12.58 | | | $12.77 | | | $13.10 | | | $13.38 | |
| Income (loss) from investment operations | | | | | | | | | | | | | | | |
Net investment income (d) | | $0.52 | | | $0.53 | | | $0.53 | | | $0.53 | | | $0.51 | |
Net realized and unrealized gain (loss) on investments | | 0.50 | | | 0.31 | | | (0.12 | ) | | (0.27 | ) | | (0.07 | ) |
Total from investment operations | | $1.02 | | | $0.84 | | | $0.41 | | | $0.26 | | | $0.44 | |
| Less distributions declared to shareholders | | | | | | | | | | | | | | | |
From net investment income | | $(0.68 | ) | | $(0.61 | ) | | $(0.60 | ) | | $(0.59 | ) | | $(0.72 | ) |
Net asset value, end of period | | $13.15 | | | $12.81 | | | $12.58 | | | $12.77 | | | $13.10 | |
Total return (%) (k)(s) | | 8.29 | | | 6.91 | | | 3.47 | | | 2.01 | | | 3.55 | |
Ratios (%) (to average net assets)
and Supplemental data: | | | | | | | | | | | | | | | |
Expenses (f) | | 0.90 | | | 0.88 | | | 0.88 | | | 0.88 | | | 0.87 | |
Net investment income | | 4.06 | | | 4.23 | | | 4.22 | | | 4.10 | | | 3.90 | |
Portfolio turnover | | 52 | | | 39 | | | 29 | | | 75 | | | 85 | |
Net assets at end of period (000 Omitted) | | $271,052 | | | $320,695 | | | $309,162 | | | $241,128 | | | $204,488 | |
| (d) | Per share data are based on average shares outstanding. |
| (f) | Ratios do not reflect reductions from fees paid indirectly, if applicable. |
| (k) | The total return does not reflect expenses that apply to separate accounts. Inclusion of these charges would reduce the total return figures for all periods shown. |
| (s) | From time to time the fund may receive proceeds from litigation settlements, without which performance would be lower. |
See Notes to Financial Statements
12
NOTES TO FINANCIAL STATEMENTS
| (1) | | Business and Organization |
MFS Government Securities Portfolio (the fund) is a series of MFS Variable Insurance Trust II (the trust). The trust is organized as a Massachusetts business trust and is registered under the Investment Company Act of 1940, as amended, as an open-end management investment company. The shares of the fund are sold to variable accounts established by insurance companies to fund benefits under variable contracts issued by such companies, and qualified retirement and pension plans.
| (2) | | Significant Accounting Policies |
General – The preparation of financial statements in conformity with U.S. generally accepted accounting principles requires management to make estimates and assumptions that affect the reported amounts of assets and liabilities, and disclosure of contingent assets and liabilities at the date of the financial statements and the reported amounts of revenues and expenses during the reporting period. Actual results could differ from those estimates. The fund may invest a significant portion of its assets in mortgage-backed securities. The value of mortgage-backed securities may depend, in part, on the issuer’s or borrower’s credit quality or ability to pay principal and interest when due and may fall if an issuer or borrower defaults on its obligation to pay principal or interest or if the instrument’s credit rating is downgraded by a credit rating agency. U.S. Government securities not supported as to the payment of principal or interest by the U.S. Treasury, such as those issued by Fannie Mae, Freddie Mac, and the Federal Home Loan Banks, are subject to greater credit risk than are U.S. Government securities supported by the U.S. Treasury, such as those issued by Ginnie Mae.
Investment Valuations – Debt instruments and floating rate loans (other than short-term instruments), including restricted debt instruments, are generally valued at an evaluated or composite bid as reported by a third party pricing service. Short-term instruments with a maturity at issuance of 60 days or less may be valued at amortized cost, which approximates market value. Futures contracts are generally valued at last posted settlement price as reported by a third party pricing service on the market on which they are primarily traded. Futures contracts for which there were no trades that day for a particular position are generally valued at the closing bid quotation as reported by a third party pricing service on the market on which such futures contracts are primarily traded. Open-end investment companies are generally valued at net asset value per share. Securities and other assets generally valued on the basis of information from a third party pricing service may also be valued at a broker-dealer bid quotation. Values obtained from pricing services can utilize both dealer-supplied valuations and electronic data processing techniques, which take into account factors such as institutional-size trading in similar groups of securities, yield, quality, coupon rate, maturity, type of issue, trading characteristics, and other market data.
The Board of Trustees has delegated primary responsibility for determining or causing to be determined the value of the fund’s investments (including any fair valuation) to the adviser pursuant to valuation policies and procedures approved by the Board. If the adviser determines that reliable market quotations are not readily available, investments are valued at fair value as determined in good faith by the adviser in accordance with such procedures under the oversight of the Board of Trustees. Under the fund’s valuation policies and procedures, market quotations are not considered to be readily available for most types of debt instruments and floating rate loans and many types of derivatives. These investments are generally valued at fair value based on information from third party pricing services. In addition, investments may be valued at fair value if the adviser determines that an investment’s value has been materially affected by events occurring after the close of the exchange or market on which the investment is principally traded (such as foreign exchange or market) and prior to the determination of the fund’s net asset value, or after the halting of trading of a specific security where trading does not resume prior to the close of the exchange or market on which the security is principally traded. The adviser may rely on third party pricing services or other information (such as the correlation with price movements of similar securities in the same or other markets; the type, cost and investment characteristics of the security; the business and financial condition of the issuer; and trading and other market data) to assist in determining whether to fair value and at what value to fair value an investment. The value of an investment for purposes of calculating the fund’s net asset value can differ depending on the source and method used to determine value. When fair valuation is used, the value of investments used to determine the fund’s net asset value may differ from quoted or published prices for the same investments.
The fund adopted FASB Statement No. 157, Fair Value Measurements (the “Statement”). This Statement provides a single definition of fair value, a hierarchy for measuring fair value and expanded disclosures about fair value measurements.
Various inputs are used in determining the value of the fund’s assets or liabilities carried at market value. These inputs are categorized into three broad levels. Level 1 includes quoted prices in active markets for identical assets or liabilities. Level 2 includes other significant observable market-based inputs (including quoted prices for similar securities, interest rates, prepayment speed, and credit risk). Level 3 includes unobservable inputs, which may include the adviser’s own assumptions in determining the fair value of investments. Other financial instruments are derivative instruments not reflected in total
13
Notes to Financial Statements – continued
investments, such as futures, forwards, swap contracts and written options. The following is a summary of the levels used as of December 31, 2008 in valuing the fund’s assets or liabilities carried at market value:
| | | | | | | | | | |
| | | Level 1 | | | Level 2 | | Level 3 | | Total | |
| Investments in Securities | | $3,177,340 | | | $529,847,482 | | $— | | $533,024,822 | |
| Other Financial Instruments | | $(408,699 | ) | | $— | | $— | | $(408,699 | ) |
Repurchase Agreements – The fund may enter into repurchase agreements with approved counterparties. Each repurchase agreement is recorded at cost. The fund requires that the securities collateral in a repurchase transaction be transferred to a custodian. The fund monitors, on a daily basis, the value of the collateral to ensure that its value, including accrued interest, is greater than amounts owed to the fund under each such repurchase agreement. The fund and other funds managed by Massachusetts Financial Services Company (MFS), may utilize a joint trading account for the purpose of entering into one or more repurchase agreements.
Derivative Risk – The fund may invest in derivatives for hedging or non-hedging purposes. While hedging can reduce or eliminate losses, it can also reduce or eliminate gains. When the fund uses derivatives as an investment to gain market exposure, or for hedging purposes, gains and losses from derivative instruments may be substantially greater than the derivative’s original cost. Cash that has been segregated on behalf of certain derivative contracts will be reported separately on the Statement of Assets and Liabilities as restricted cash. On some over-the-counter derivatives, the fund attempts to reduce its exposure to counterparty credit risk by entering into an ISDA Master Agreement on a bilateral basis with each of the counterparties with whom it undertakes a significant volume of transactions. The ISDA Master Agreement gives the fund the right, upon an event of default by the applicable counterparty, to close out all transactions traded under such agreement and to net amounts owed under each transaction to one net amount payable by one party to the other. This right to close out and net payments across all transactions traded under the ISDA Master Agreement could result in a reduction of the fund’s credit risk to such counterparty equal to any amounts payable by the fund under the applicable transactions, if any. However, absent an event of default by the counterparty, the ISDA Master Agreement does not result in an offset of reported balance sheet assets and liabilities across transactions between the fund and the applicable counterparty. Derivative instruments include futures contracts.
In March 2008, FASB Statement No. 161, Disclosures about Derivative Instruments and Hedging Activities (the “Standard”) was issued, and is effective for financial statements issued for fiscal years and interim periods beginning after November 15, 2008. This Standard provides enhanced disclosures about the fund’s use of and accounting for derivative instruments and the effect of derivative instruments on the fund’s results of operations and financial position. Management is evaluating the application of the Standard to the fund, and has not at this time determined the impact, if any, resulting from the adoption of this Standard on the fund’s financial statements.
FASB Staff Position (FSP) 133-1 was implemented during the period. FSP 133-1 amends FAS 133 to require sellers of credit derivatives to make disclosures that will enable financial statement users to assess the potential effects of those credit derivatives on an entity’s financial position, financial performance and cash flows. There was no impact from implementing FSP 133-1 as the fund did not hold any of these credit derivatives at period end.
Futures Contracts – The fund may enter into futures contracts for the delayed delivery of securities or currency, or contracts based on financial indices at a fixed price on a future date. In entering such contracts, the fund is required to deposit with the broker either in cash or securities an amount equal to a certain percentage of the contract amount. Subsequent payments are made or received by the fund each day, depending on the daily fluctuations in the value of the contract, and are recorded for financial statement purposes as unrealized gains or losses by the fund. Upon entering into such contracts, the fund bears the risk of interest or exchange rates or securities prices moving unexpectedly, in which case, the fund may not achieve the anticipated benefits of the futures contracts and may realize a loss.
Indemnifications – Under the fund’s organizational documents, its officers and trustees may be indemnified against certain liabilities and expenses arising out of the performance of their duties to the fund. Additionally, in the normal course of business, the fund enters into agreements with service providers that may contain indemnification clauses. The fund’s maximum exposure under these agreements is unknown as this would involve future claims that may be made against the fund that have not yet occurred.
Investment Transactions and Income – Investment transactions are recorded on the trade date. Interest income is recorded on the accrual basis. All premium and discount is amortized or accreted for financial statement purposes in accordance with U.S. generally accepted accounting principles. The fund may receive proceeds from litigation settlements. Any proceeds received from litigation involving portfolio holdings are reflected in the Statement of Operations in realized gain/loss if the security has been disposed of by the fund or in unrealized gain/loss if the security is still held by the fund. Any other proceeds from litigation not related to portfolio holdings are reflected as other income in the Statement of Operations.
14
Notes to Financial Statements – continued
The fund may enter into “TBA” (to be announced) purchase commitments to purchase securities for a fixed unit price at a future date. Although the unit price has been established, the principal value has not been finalized. However, the principal amount of the commitments will not fluctuate more than 0.01%. The fund holds, and maintains until settlement date, cash or high-grade debt obligations in an amount sufficient to meet the purchase price, or the fund may enter into offsetting contracts for the forward sale of other securities it owns. Income on the securities will not be earned until settlement date. TBA purchase commitments may be considered securities in themselves, and involve a risk of loss if the value of the security to be purchased declines prior to settlement date, which is in addition to the risk of decline in the value of the fund’s other assets. Unsettled TBA purchase commitments are valued at the current market value of the underlying securities.
The fund may enter into “TBA” (to be announced) sale commitments to hedge its portfolio positions or to sell mortgage-backed securities it owns under delayed delivery arrangements. Proceeds of TBA sale commitments are not received until the contractual settlement date. During the time a TBA sale commitment is outstanding, equivalent deliverable securities, or an offsetting TBA purchase commitment deliverable on or before the sale commitment date, are held as “cover” for the transaction.
Fees Paid Indirectly – The fund’s custody fee may be reduced according to an arrangement that measures the value of cash deposited with the custodian by the fund. This amount, for the year ended December 31, 2008, is shown as a reduction of total expenses on the Statement of Operations.
Tax Matters and Distributions – The fund intends to qualify as a regulated investment company, as defined under Subchapter M of the Internal Revenue Code, and to distribute all of its taxable income, including realized capital gains. As a result, no provision for federal income tax is required. Each of the fund’s federal tax returns for the prior three fiscal years remains subject to examination by the Internal Revenue Service. Foreign taxes, if any, have been accrued by the fund in the accompanying financial statements.
Distributions to shareholders are recorded on the ex-dividend date. Income and capital gain distributions are determined in accordance with income tax regulations, which may differ from U.S. generally accepted accounting principles. Certain capital accounts in the financial statements are periodically adjusted for permanent differences in order to reflect their tax character. These adjustments have no impact on net assets or net asset value per share. Temporary differences which arise from recognizing certain items of income, expense, gain or loss in different periods for financial statement and tax purposes will reverse at some time in the future. Distributions in excess of net investment income or net realized gains are temporary overdistributions for financial statement purposes resulting from differences in the recognition or classification of income or distributions for financial statement and tax purposes.
Book/tax differences primarily relate to amortization and accretion of debt securities, straddle loss deferrals, and derivative transactions.
The tax character of distributions declared to shareholders for the last two fiscal years is as follows:
| | | | |
| | | 12/31/08 | | 12/31/07 |
| Ordinary income (including any short-term capital gains) | | $31,001,486 | | $31,666,301 |
The federal tax cost and the tax basis components of distributable earnings were as follows:
| | | |
| As of 12/31/08 | | | |
| Cost of investments | | $517,987,496 | |
| Gross appreciation | | 16,352,875 | |
| Gross depreciation | | (1,315,549 | ) |
| Net unrealized appreciation (depreciation) | | $15,037,326 | |
| Undistributed ordinary income | | 26,155,041 | |
| Capital loss carryforwards | | (3,369,627 | ) |
| Other temporary differences | | (751,292 | ) |
As of December 31, 2008, the fund had capital loss carryforwards available to offset future realized gains. Such losses expire as follows:
| | | |
| 12/31/2013 | | $(1,518,442 | ) |
| 12/31/2014 | | (1,851,185 | ) |
| | $(3,369,627 | ) |
Multiple Classes of Shares of Beneficial Interest – The fund offers multiple classes of shares, which differ in their respective distribution fees. The fund’s income, realized and unrealized gain (loss), and common expenses are allocated to shareholders based on the daily net assets of each class. Dividends are declared separately for each class. Differences in per share dividend rates are generally due to differences in separate class expenses.
15
Notes to Financial Statements – continued
| (3) | | Transactions with Affiliates |
Investment Adviser – The fund has an investment advisory agreement with MFS to provide overall investment management and related administrative services and facilities to the fund. The management fee is computed daily and paid monthly at the following annual rates:
| | |
| First $1 billion of average daily net assets | | 0.55% |
| Average daily net assets in excess of $1 billion | | 0.50% |
The management fee incurred for the year ended December 31, 2008 was equivalent to an annual effective rate of 0.55% of the fund’s average daily net assets.
The investment adviser has agreed in writing to pay a portion of the fund’s total annual operating expenses, exclusive of interest, taxes, extraordinary expenses, and brokerage commissions, such that the total annual operating expenses of the fund do not exceed 1.25% of the fund’s average daily net assets. MFS’ agreement to limit the fund’s operating expenses is contained in the investment advisory agreement between MFS and the fund and may not be rescinded without shareholder approval. In addition, the investment adviser has voluntarily agreed to pay a portion of the fund’s total annual operating expenses, exclusive of interest, taxes, extraordinary expenses, and brokerage commissions such that total annual operating expenses do not exceed 1.00% of the fund’s average daily net assets attributable to Initial Class shares. This voluntary agreement may be changed or rescinded at any time by MFS. For the year ended December 31, 2008, the fund’s actual operating expenses did not exceed the limit and therefore, the investment adviser did not pay a portion of the fund’s expenses.
Distributor – MFS Fund Distributors, Inc. (MFD), a wholly-owned subsidiary of MFS, is the distributor of shares of the fund. The Trustees have adopted a distribution plan for the Service Class shares pursuant to Rule 12b-1 under the Investment Company Act of 1940.
The fund’s distribution plan provides that the fund will pay MFD distribution fees equal to 0.25% per annum of its average daily net assets attributable to Service Class shares as partial consideration for services performed and expenses incurred by MFD and financial intermediaries in connection with the sale and distribution of the fund’s Service Class shares and the sale and distribution of the variable annuity or variable life insurance contracts investing indirectly in Service Class shares. MFD may subsequently pay all, or a portion, of the distribution fees to financial intermediaries.
Shareholder Servicing Agent – MFS Service Center, Inc. (MFSC), a wholly-owned subsidiary of MFS, has contracted to provide transfer agent and recordkeeping functions in connection with the issuance, transfer, and redemption of each class of shares of the fund under a Shareholder Servicing Agent Agreement. During the year ended December 31, 2008, the fund did not pay MFSC a fee for this service.
Administrator – MFS provides certain financial, legal, shareholder communications, compliance, and other administrative services to the fund. Under an administrative services agreement, the fund partially reimburses MFS the costs incurred to provide these services. The fund is charged an annual fixed amount of $10,000 plus a fee based on average daily net assets.
The administrative services fee incurred for the year ended December 31, 2008 was equivalent to an annual effective rate of 0.0328% of the fund’s average daily net assets.
Trustees’ and Officers’ Compensation – The fund pays compensation to trustees in the form of a retainer, attendance fees, and additional compensation to the Board chairperson. The fund does not pay compensation directly to officers of the fund who are also officers of the investment adviser, all of whom receive remuneration for their services to the fund from MFS. Certain officers of the fund are officers or directors of MFS, MFD, and MFSC.
Other – This fund and certain other MFS funds (the funds) have entered into services agreements (the Agreements) which provide for payment of fees by the funds to Tarantino LLC and Griffin Compliance LLC in return for the provision of services of an Independent Chief Compliance Officer (ICCO) and Assistant ICCO, respectively, for the funds. The ICCO and Assistant ICCO are officers of the funds and the sole members of Tarantino LLC and Griffin Compliance LLC, respectively. The funds can terminate the Agreements with Tarantino LLC and Griffin Compliance LLC at any time under the terms of the Agreements. MFS has agreed to bear all expenses associated with office space, other administrative support, and supplies provided to the ICCO and Assistant ICCO. For the year ended December 31, 2008, the aggregate fees paid by the fund to Tarantino LLC and Griffin Compliance LLC were $5,866 and are included in miscellaneous expense on the Statement of Operations.
The fund may invest in a money market fund managed by MFS which seeks a high level of current income consistent with preservation of capital and liquidity. Income earned on this investment is included in dividends from underlying funds on the Statement of Operations. This money market fund does not pay a management fee to MFS.
16
Notes to Financial Statements – continued
Purchases and sales of investments, other than purchased option transactions and short-term obligations, were as follows:
| | | | |
| | | Purchases | | Sales |
| U.S. Government securities | | $264,613,707 | | $370,018,295 |
| Investments (non-U.S. Government securities) | | $31,891,937 | | $29,269,638 |
| (5) | | Shares of Beneficial Interest |
The fund’s Declaration of Trust permits the Trustees to issue an unlimited number of full and fractional shares of beneficial interest. Transactions in fund shares were as follows:
| | | | | | | | | | | | |
| | | Year ended 12/31/08 | | | Year ended 12/31/07 | |
| | | Shares | | | Amount | | | Shares | | | Amount | |
| Shares sold | | | | | | | | | | | | |
Initial Class | | 3,062,068 | | | $39,366,748 | | | 1,325,989 | | | $16,419,478 | |
Service Class | | 3,775,423 | | | 47,971,366 | | | 2,759,668 | | | 34,066,245 | |
| | 6,837,491 | | | $87,338,114 | | | 4,085,657 | | | $50,485,723 | |
| Shares issued to shareholders in reinvestment of distributions | | | | | | | | | | | | |
Initial Class | | 1,250,512 | | | $15,631,404 | | | 1,333,513 | | | $16,335,537 | |
Service Class | | 1,235,537 | | | 15,370,082 | | | 1,257,651 | | | 15,330,764 | |
| | 2,486,049 | | | $31,001,486 | | | 2,591,164 | | | $31,666,301 | |
| Shares reacquired | | | | | | | | | | | | |
Initial Class | | (7,462,745 | ) | | $(96,129,042 | ) | | (7,206,116 | ) | | $(90,653,401 | ) |
Service Class | | (9,434,584 | ) | | (122,192,769 | ) | | (3,552,033 | ) | | (44,340,467 | ) |
| | (16,897,329 | ) | | $(218,321,811 | ) | | (10,758,149 | ) | | $(134,993,868 | ) |
| Net change | | | | | | | | | | | | |
Initial Class | | (3,150,165 | ) | | $(41,130,890 | ) | | (4,546,614 | ) | | $(57,898,386 | ) |
Service Class | | (4,423,624 | ) | | (58,851,321 | ) | | 465,286 | | | 5,056,542 | |
| | (7,573,789 | ) | | $(99,982,211 | ) | | (4,081,328 | ) | | $(52,841,844 | ) |
The fund and other funds managed by MFS participate in a $1 billion unsecured committed line of credit provided by a syndication of banks under a credit agreement. In addition, the fund and other funds managed by MFS have established uncommitted borrowing arrangements with certain banks. Borrowings may be made for temporary financing needs. Interest is charged to the fund, based on its borrowings, generally at a rate equal to the Federal Reserve funds rate plus 0.30%. In addition, a commitment fee, based on the average daily, unused portion of the committed line of credit, is allocated among the participating funds at the end of each calendar quarter. For the year ended December 31, 2008, the fund’s commitment fee and interest expense were $2,953 and $0, respectively, and are included in miscellaneous expense on the Statement of Operations.
| (7) | | Transactions in Underlying Funds – Affiliated Issuers |
An affiliated issuer may be considered one in which the fund owns 5% or more of the outstanding voting securities, or a company which is under common control. For the purposes of this report, the fund assumes the following to be affiliated issuers:
| | | | | | | | | |
| Underlying Funds | | Beginning
Shares/Par
Amount | | Acquisitions
Shares/Par
Amount | | Dispositions
Shares/Par
Amount | | | Ending
Shares/Par
Amount |
| MFS Institutional Money Market Portfolio | | — | | 48,541,625 | | (45,364,285 | ) | | 3,177,340 |
| | | | |
| Underlying Funds | | Realized
Gain (Loss) | | Capital Gain
Distributions | | Dividend
Income | | | Ending
Value |
| MFS Institutional Money Market Portfolio | | $— | | $— | | $12,873 | | | $3,177,340 |
17
REPORT OF INDEPENDENT REGISTERED PUBLIC ACCOUNTING FIRM
To the Board of Trustees of MFS Variable Insurance Trust II and the Shareholders of
MFS Government Securities Portfolio:
We have audited the accompanying statement of assets and liabilities, including the portfolio of investments, of MFS Government Securities Portfolio (the “Fund”) (one of the portfolios comprising MFS Variable Insurance Trust II) as of December 31, 2008, and the related statement of operations for the year then ended, the statements of changes in net assets for each of the two years in the period then ended, and the financial highlights for each of the five years in the period then ended. These financial statements and financial highlights are the responsibility of the Fund’s management. Our responsibility is to express an opinion on these financial statements and financial highlights based on our audits.
We conducted our audits in accordance with the standards of the Public Company Accounting Oversight Board (United States). Those standards require that we plan and perform the audit to obtain reasonable assurance about whether the financial statements and financial highlights are free of material misstatement. The Fund is not required to have, nor were we engaged to perform, an audit of its internal control over financial reporting. Our audits included consideration of internal control over financial reporting as a basis for designing audit procedures that are appropriate in the circumstances, but not for the purpose of expressing an opinion on the effectiveness of the Fund’s internal control over financial reporting. Accordingly, we express no such opinion. An audit also includes examining, on a test basis, evidence supporting the amounts and disclosures in the financial statements, assessing the accounting principles used and significant estimates made by management, as well as evaluating the overall financial statement presentation. Our procedures included confirmation of securities owned as of December 31, 2008, by correspondence with the custodian and brokers; where replies were not received from brokers, we performed other auditing procedures. We believe that our audits provide a reasonable basis for our opinion.
In our opinion, such financial statements and financial highlights present fairly, in all material respects, the financial position of MFS Government Securities Portfolio as of December 31, 2008, the results of its operations for the year then ended, the changes in its net assets for each of the two years in the period then ended, and the financial highlights for each of the five years in the period then ended, in conformity with accounting principles generally accepted in the United States of America.
DELOITTE & TOUCHE LLP
Boston, Massachusetts
February 19, 2009
18
TRUSTEES AND OFFICERS – IDENTIFICATION AND BACKGROUND
The Trustees and officers of the Trust, as of February 1, 2009, are listed below, together with their principal occupations during the past five years. (Their titles may have varied during that period.) The address of each Trustee and officer is 500 Boylston Street, Boston, Massachusetts 02116.
| | | | | | |
Name, Date of Birth | | Position(s) Held
with Fund | | Trustee/Officer
Since (1) | | Principal Occupations During the Past Five Years and
Other Directorships (2) |
| INTERESTED TRUSTEE | | | | |
David D. Horn (3) (born 6/07/41) | | Trustee | | April 1986 | | Private investor; Sun Life Assurance Company of Canada, Senior Vice President and General Manager for the United States (until 1997); Director (until March 2004) |
| | |
| INDEPENDENT TRUSTEES | | | | |
J. Kermit Birchfield (born 1/08/40) | | Chairman | | May 1997 | | Consultant; Century Partners, Inc. (investments), Director; Displaytech, Inc. (technology), Director; Dessin Fournir LLC (furniture manufacturer), Director (2005 to present); Intermountain Gas Company, Inc. & Intermountain Industries, Inc. (oil & gas exploration and production), Director; Site Watch LLC (software to monitor oil tanks), Managing Director (2006 to present); Juridica Investments (fund investing in judicial matters), Director (2007 to present); HPSC, Inc. (medical financing), Director (until January 2004) |
| | | |
Robert C. Bishop (born 1/13/43) | | Trustee | | May 2001 | | AutoImmune, Inc. (pharmaceutical product development), Chairman, President and Chief Executive Officer; Caliper Life Sciences Corp. (laboratory analytical instruments), Director; Millipore Corporation (purification/filtration products), Director; Waterstreet Capital (leverage buyouts), Advisory Board (August 2006 to present); Optobionics Corporation (ophthalmic devices), Director (2002 to 2007) |
| | | |
Frederick H. Dulles (born 3/12/42) | | Trustee | | May 2001 | | Ten State International Law PLLC (law firm), Of Counsel (since 2006); Prudential Carolina Real Estate, (real estate), Broker (since 2006); Free Enterprise Foundation, Inc. (research institute), Director & Secretary (until 2008); Disher, Hamrick & Myers Residential, Inc. (real estate) Broker (2005 until 2006); Frederick H. Dulles law practice (until 2006); Ten State Street LLP (law firm), Member (until 2005) |
| | | |
Marcia A. Kean (born 6/30/48) | | Trustee | | April 2005 | | Feinstein Kean Healthcare (consulting), Chief Executive Officer |
| | | |
Ronald G. Steinhart (born 6/15/40) | | Trustee | | May 2001 | | Private investor; Penske Automotive Group (automotive retailer), Director; Animal Health International, Inc. (animal health products), Director (since 2007); Texas Industries (concrete/aggregates/cement), Director (since 2007); Penson Worldwide, Inc. (securities clearance), Director (since 2006); Carreker Corporation (technology consulting) Director (until 2005); Prentiss Properties Trust (real estate investment trust), Director (until 2006) |
| | | |
Haviland Wright (born 7/21/48) | | Trustee | | May 2001 | | Profitability of Hawaii (software), Chief Development Officer (since December 2008); Elixir Technologies Corporation (software) Director (since 2005); Nano Loa Inc. (liquid crystal displays), Director |
| | |
| TRUSTEE EMERITUS | | | | |
Samuel Adams (born 10/19/25) | | Trustee Emeritus | | | | Retired; K&L Gates LLP (law firm), Of Counsel |
| | |
| OFFICERS | | | | |
Maria F. Dwyer (4) (born 12/01/58) | | President | | November 2005 | | Massachusetts Financial Services Company, Executive Vice President and Chief Regulatory Officer (since March 2004) Chief Compliance Officer (since December 2006); Fidelity Management & Research Company, Vice President (prior to March 2004); Fidelity Group of Funds, President and Treasurer (until March 2004) |
| | | |
Christopher R. Bohane (4) (born 1/18/74) | | Assistant Secretary and Assistant Clerk | | July 2005 | | Massachusetts Financial Services Company, Vice President and Senior Counsel |
| | | |
John M. Corcoran (4) (born 4/13/65) | | Treasurer | | October 2008 | | Massachusetts Financial Services Company, Senior Vice President (since October 2008); State Street Bank and Trust (financial services provider), Senior Vice President, (until September 2008) |
| | | |
Ethan D. Corey (4) (born 11/21/63) | | Assistant Secretary and Assistant Clerk | | July 2005 | | Massachusetts Financial Services Company, Senior Vice President and Associate General Counsel (since 2004); Dechert LLP (law firm), Counsel (prior to December 2004) |
| | | |
David L. DiLorenzo (4) (born 8/10/68) | | Assistant Treasurer | | July 2005 | | Massachusetts Financial Services Company, Vice President (since June 2005); JP Morgan Investor Services, Vice President (until June 2005) |
| | | |
Timothy M. Fagan (4) (born 7/10/68) | | Assistant Secretary and Assistant Clerk | | September 2005 | | Massachusetts Financial Services Company, Vice President and Senior Counsel (since September 2005); John Hancock Advisers, LLC, Vice President, Senior Attorney and Chief Compliance Officer (until August 2005) |
19
Trustees and Officers – continued
| | | | | | |
Name, Date of Birth | | Position(s) Held
with Fund | | Trustee/Officer
Since (1) | | Principal Occupations During the Past Five Years and
Other Directorships (2) |
Mark D. Fischer (4) (born 10/27/70) | | Assistant Treasurer | | July 2005 | | Massachusetts Financial Services Company, Vice President (since May 2005); JP Morgan Investment Management Company, Vice President (until May 2005) |
| | | |
Robyn L. Griffin (born 7/04/75) | | Assistant Independent Chief Compliance Officer | | August 2008 | | Griffin Compliance LLC (provider of compliance services), Principal (since August 2008); State Street Corporation (financial services provider), Mutual Fund Administration Assistant Vice President (October 2006 – July 2008); Liberty Mutual Group (insurance), Personal Market Assistant Controller (April 2006 – October 2006); Deloitte & Touche LLP (professional services firm), Senior Manager (prior to April 2006) |
| | | |
Brian E. Langenfeld (4) (born 3/07/73) | | Assistant Secretary and Assistant Clerk | | May 2006 | | Massachusetts Financial Services Company, Vice President and Senior Counsel (since May 2006); John Hancock Advisers, LLC, Assistant Vice President and Counsel (until April 2006) |
| | | |
Ellen Moynihan (4) (born 11/13/57) | | Assistant Treasurer | | May 1997 | | Massachusetts Financial Services Company, Senior Vice President |
| | | |
Susan S. Newton (4) (born 3/07/50) | | Assistant Secretary and Assistant Clerk | | May 2005 | | Massachusetts Financial Services Company, Senior Vice President and Associate General Counsel (since April 2005); John Hancock Advisers, LLC, Senior Vice President, Secretary and Chief Legal Officer (until April 2005) |
| | | |
Susan A. Pereira (4) (born 11/05/70) | | Assistant Secretary and Assistant Clerk | | July 2005 | | Massachusetts Financial Services Company, Vice President and Senior Counsel (since June 2004); Bingham McCutchen LLP (law firm), Associate (until June 2004) |
| | | |
Mark N. Polebaum (4) (born 5/01/52) | | Secretary and Clerk | | February 2006 | | Massachusetts Financial Services Company, Executive Vice President, General Counsel and Secretary (since January 2006); Wilmer Cutler Pickering Hale and Dorr LLP (law firm), Partner (until January 2006) |
| | | |
Frank L. Tarantino (born 3/07/44) | | Independent Chief Compliance Officer | | September 2004 | | Tarantino LLC (provider of compliance services), Principal (since June 2004); CRA Business Strategies Group (consulting services), Executive Vice President (until June 2004) |
| | | |
Richard S. Weitzel (4) (born 7/16/70) | | Assistant Secretary and Assistant Clerk | | October 2007 | | Massachusetts Financial Services Company, Vice President and Assistant General Counsel (since 2004); Massachusetts Department of Business and Technology, General Counsel (until April 2004) |
| | | |
James O. Yost (4) (born 6/12/60) | | Assistant Treasurer | | April 1992 | | Massachusetts Financial Services Company, Senior Vice President |
| (1) | Date first appointed to serve as Trustee/Officer of an MFS fund or a Compass variable account. Each Trustee has served continuously since appointment. |
| (2) | Directorships or trusteeships of companies required to report to the Securities and Exchange Commission (i.e., “public companies”). |
| (3) | “Interested person” of the Trust, within the meaning of the Investment Company Act of 1940 (referred to as the 1940 Act), which is the principal federal law governing investment companies like the Trust, as a result of position with Sun Life of Canada (U.S.). The address of Sun Life of Canada (U.S.) is One Sun Life Executive Park, Wellesley Hills, Massachusetts 02481. |
| (4) | “Interested person” of MFS within the meaning of the 1940 Act. The address of MFS is 500 Boylston Street, Boston, Massachusetts 02116. |
The Trust does not hold annual meetings for the purpose of electing Trustees, and Trustees are not elected for fixed terms. Each Trustee and officer holds office until his or her successor is chosen and qualified, or until his or her earlier death, resignation, retirement or removal.
All Trustees currently serve as Trustees of the Trust and have served in that capacity since originally elected or appointed. All of the Trustees are also Managers of the Compass Variable Accounts. The executive officers of the Trust hold similar offices for the Compass Variable Accounts and other funds in the MFS fund complex. As of January 1, 2009, each Trustee serves as a Trustee or Manager of 35 Accounts/Funds.
The Statement of Additional Information contains further information about the Trustees and is available without charge upon request by calling 1-800-752-7215.
| | |
Investment Adviser
Massachusetts Financial Services Company 500 Boylston Street, Boston, MA 02116-3741 | | Custodian State Street Bank and Trust 1 Lincoln Street, Boston, MA 02111-2900 |
Distributor
MFS Fund Distributors, Inc. 500 Boylston Street, Boston, MA 02116-3741 | | Independent Registered Public Accounting Firm Deloitte & Touche LLP 200 Berkeley Street, Boston, MA 02116 |
Portfolio Manager Geoffrey Schechter | | |
20
BOARD REVIEW OF INVESTMENT ADVISORY AGREEMENT
The Investment Company Act of 1940 requires that both the full Board of Trustees and a majority of the non-interested (“independent”) Trustees, voting separately, annually approve the continuation of the investment advisory agreement between MFS Variable Insurance Trust II (the “Trust”) and Massachusetts Financial Services Company (“MFS”) on behalf of the Fund. The Trustees consider matters bearing on the Fund and the advisory arrangements at their meetings throughout the year, including a review of performance data at each regular meeting. In addition, the independent Trustees met in May and again in July 2008 (“contract review meetings”) for the specific purpose of considering whether to approve the continuation of the investment advisory agreement for the Fund. The independent Trustees were assisted in their evaluation of the investment advisory agreement by independent legal counsel, from whom they received separate legal advice and with whom they met separately from MFS management during various contract review meetings. The independent Trustees were also assisted in this process by the Fund’s Independent Chief Compliance Officer, a full-time senior officer appointed by and reporting to the independent Trustees.
In connection with their deliberations, the Trustees, including the independent Trustees, considered such information and factors as they believed, in light of the legal advice furnished to them and their own business judgment, to be relevant. The investment advisory agreement was considered separately for the Fund, although the Trustees also took into account the common interests of all Funds in the Trust in their review. As described below, the Trustees considered the nature, quality, and extent of the various investment advisory, administrative, and shareholder services performed by MFS under the existing investment advisory agreement and other arrangements with the Trust.
In connection with their contract review meetings, the Trustees received and relied upon materials which included, among other items: (i) information provided by Lipper Inc. on the investment performance of the Fund for various time periods ended December 31, 2007, compared to the investment performance of a group of funds with substantially similar investment classifications/objectives (the “Lipper performance universe”), (ii) information provided by Lipper Inc. on the Fund’s advisory fees and other expenses compared to the advisory fees and other expenses of comparable funds identified by Lipper (the “Lipper expense group”), (iii) information provided by MFS on the advisory fees of comparable portfolios of its other clients, including institutional separate account and other clients, (iv) information as to whether expense waivers, reimbursements or fee “breakpoints” are observed for the Fund, (v) information regarding MFS’ financial results and financial condition, including MFS’ and certain of its affiliates’ estimated profitability from services performed for the Fund, (vi) MFS’ views regarding the outlook for the mutual fund industry and its strategic business plans, (vii) descriptions of various functions performed by MFS for the Trust, such as compliance monitoring and portfolio trading practices, and (viii) information regarding the overall organization of MFS, including information about MFS’ senior management and other personnel providing investment advisory, administrative and other services to the Fund. The comparative performance, fee and expense information prepared and provided by Lipper Inc. was not independently verified, and the independent Trustees did not independently verify any information provided to them by MFS.
The Trustees’ conclusion as to the continuation of the investment advisory agreement was based on comprehensive consideration of all information provided to the Trustees and not the result of any single factor. Some of the factors that figured particularly in the Trustees’ deliberations are described below for the Fund, while individual Trustees may have given different weight to various factors and evaluated the information presented as a whole differently than another Trustee. The Trustees recognized that the fee arrangements for the Fund reflect years of review and discussion between the independent Trustees and MFS, that certain aspects of such arrangements may receive greater scrutiny in some years than others, and that the Trustees’ conclusions may be based, in part, on their consideration of these same arrangements during the course of the year and in prior years.
Based on information provided by Lipper Inc., the Trustees compared the Fund’s total return investment performance to the performance of a peer group of funds over various time periods. The Trustees placed particular emphasis on the total return performance of the Fund’s Initial Class shares in comparison to the performance of funds in its Lipper performance universe over the one-, three- and five-year periods. The Trustees did not rely on performance results for more recent periods, including those shown elsewhere in this report.
The Trustees noted the performance of the Fund’s Initial Class shares was in the 3rd quintile relative to the other funds in the Lipper Classification Index for the one-year period (the 1st quintile being the best performers and the 5th quintile being the worst performers). The total return performance of the Fund was in the 2nd quintile for the three-year period and the five-year period ended December 31, 2007, relative to the Lipper performance universe. Based on the nature and quality of services provided by MFS, the Board of Trustees concluded that the Fund’s performance was satisfactory.
In the course of their deliberations, the Trustees took into account information provided by MFS during contract review meetings, as well as during investment review meetings conducted with portfolio management personnel during the course of the year.
21
Board Review of Investment Advisory Agreement – continued
In assessing the reasonableness of the Fund’s advisory fee, the Trustees considered, among other information, the Fund’s advisory fee and the total expense ratio of the Fund’s Initial Class shares as a percentage of average daily net assets, compared to the advisory fee and total expense ratios of its peer group of funds based on information provided by Lipper Inc. The Trustees also considered the advisory fees charged by MFS to institutional accounts. In comparing these fees, the Trustees considered the generally broader scope of services provided by MFS to the Trust than those provided to institutional accounts. The Trustees also considered the higher demands placed on MFS’ investment personnel and trading infrastructure as a result of the daily cash in-flows and out-flows of the Fund, and the impact on MFS and related expenses due to the more extensive regulatory regime to which the Fund is subject, compared to institutional accounts.
In considering the fees, the Trustees noted from the Lipper data that the Fund’s effective advisory fee rate and total expense ratio were each above the median of such fees and expenses of funds in the Lipper expense group. In addition, the Trustees noted that MFS currently observes an expense limitation for the Fund. The Trustees further concluded that the existing breakpoint was sufficient to allow the Fund to benefit from economies of scale as its assets grow. The Trustees concluded that the fees were reasonable in light of the nature and quality of services provided.
The Trustees also considered information prepared by MFS relating to its costs and profits with respect to the Fund and other investment companies and accounts advised by MFS, as well as MFS’ methodologies used to determine and allocate its costs to the Fund and other accounts and products for purposes of estimating profitability.
After reviewing these and other factors described below, the Trustees concluded that the advisory fees charged to the Fund represent reasonable compensation in light of the nature and quality of the services being provided by MFS.
In addition, the Trustees considered MFS’ resources and related efforts to continue to retain, attract and motivate capable personnel to serve the Fund. The Trustees also considered the financial resources of MFS and its parent, Sun Life Financial Inc. The Trustees further considered any advantages and possible disadvantages of having an adviser which also serves other investment companies as well as institutional accounts.
The Trustees also considered the nature, quality, cost, and extent of administrative, transfer agency, and distribution services provided to the Fund by MFS and its affiliates under agreements and plans other than the investment advisory agreement, including the 12b-1 fees the Fund pays to MFS Fund Distributors, Inc., an affiliate of MFS. The Trustees also considered the nature, extent and quality of certain other services MFS performs or arranges on the Fund’s behalf, which may include securities lending programs, directed expense payment programs, class action recovery programs, and MFS’ interaction with third-party service providers, principally custodians and sub-custodians. The Trustees concluded that the various non-advisory services provided by MFS and its affiliates on behalf of the Fund were satisfactory. The Trustees also considered the benefits to MFS from the use of the Fund’s portfolio brokerage commissions to pay for research and other similar services and various other factors. Additionally, the Trustees considered so-called “fall-out benefits” to MFS such as reputational value derived from serving as investment manager to the Trust, and determined that any such benefits derived by MFS were reasonable and fair.
Based on their evaluation of factors that they deemed to be material, including those factors described above, the Board of Trustees, including a majority of the independent Trustees, concluded that the investment advisory agreement should be continued for an additional one-year period, commencing September 1, 2008.
A discussion regarding the Board’s most recent review and renewal of the fund’s Investment Advisory Agreement with MFS is available by clicking on the fund’s name under “Variable Insurance Portfolios-VIT II” in the “Products & Performance” section on the MFS Web site (mfs.com).
22
PROXY VOTING POLICIES AND INFORMATION
A general description of the MFS funds’ proxy voting policies and procedures is available without charge, upon request, by calling
1-800-225-2606, by visiting the Proxy Voting section of mfs.com or by visiting the SEC’s Web site at http://www.sec.gov.
Information regarding how the fund voted proxies relating to portfolio securities during the most recent twelve-month period ended June 30 is available without charge by visiting the Proxy Voting section of mfs.com or by visiting the SEC’s Web site at http://www.sec.gov.
QUARTERLY PORTFOLIO DISCLOSURE
The fund will file a complete schedule of portfolio holdings with the Securities and Exchange Commission (the Commission) for the first and third quarters of each fiscal year on Form N-Q. The fund’s Form N-Q may be reviewed and copied at the:
Public Reference Room
Securities and Exchange Commission
100 F Street, NE, Room 1580
Washington, D.C. 20549
Information on the operation of the Public Reference Room may be obtained by calling the Commission at 1-800-SEC-0330. The fund’s Form N-Q is available on the EDGAR database on the Commission’s Internet Web site at http://www.sec.gov, and copies of this information may be obtained, upon payment of a duplicating fee, by electronic request at the following e-mail address: publicinfo@sec.gov or by writing the Public Reference Section at the above address.
23
MFS® PRIVACY NOTICE
Privacy is a concern for every investor today. At MFS Investment Management® and the MFS funds, we take this concern very seriously. We want you to understand our policies about the investment products and services that we offer, and how we protect the nonpublic personal information of investors who have a direct relationship with us and our wholly owned subsidiaries.
Throughout our business relationship, you provide us with personal information. We maintain information and records about you, your investments, and the services you use. Examples of the nonpublic personal information we maintain include
| | Ÿ | | data from investment applications and other forms |
| | Ÿ | | share balances and transactional history with us, our affiliates, or others |
| | Ÿ | | facts from a consumer reporting agency |
We do not disclose any nonpublic personal information about our customers or former customers to anyone, except as permitted by law. We may share nonpublic personal information with third parties or certain of our affiliates in connection with servicing your account or processing your transactions. We may share information with companies or financial institutions that perform marketing services on our behalf or with other financial institutions with which we have joint marketing arrangements, subject to any legal requirements.
Authorization to access your nonpublic personal information is limited to appropriate personnel who provide products, services, or information to you. We maintain physical, electronic, and procedural safeguards to help protect the personal information we collect about you.
If you have any questions about the MFS privacy policy, please call 1-800-225-2606 any business day between 8 a.m. and 8 p.m. Eastern time.
Note: If you own MFS products or receive MFS services in the name of a third party such as a bank or broker-dealer, their privacy policy may apply to you instead of ours.
24


MFS® TOTAL RETURN PORTFOLIO
The report is prepared for the general information of contract owners. It is authorized for distribution to prospective investors only when preceded or accompanied by a current prospectus.
NOT FDIC INSURED Ÿ MAY LOSE VALUE Ÿ NO BANK GUARANTEE Ÿ NOT A DEPOSIT Ÿ NOT INSURED BY ANY FEDERAL GOVERNMENT AGENCY OR NCUA/NCUSIF
LETTER FROM THE CEO

Dear Contract Owners:
The market downturns and economic setbacks of late probably rank among the worst financial declines most of us have experienced. Inevitably, people may be questioning their commitment to investing. Still, it is important to remember that downturns are an inescapable part of the business cycle. Such troughs have been seen before, and if we can use history as a guide, market recoveries typically have followed.
Recent events have clearly shown us the value of certain types of investments. In this environment, two of the hallmarks of mutual funds — transparency and liquidity — have become critically important. Unlike some other types of investments, the operations of mutual funds are relatively transparent to their shareholders. With their daily redemption feature, mutual funds also generally provide easy, convenient access to one’s money. Through these recent market upheavals, this level of liquidity enhanced the ability of mutual fund investors to respond and modify their investments as they and their advisors saw fit — a flexibility that those in less liquid investments simply did not have at their disposal.
At MFS® we take particular pride in how well mutual funds can serve investors because we invented the mutual fund in the United States. Established in 1924, Massachusetts Investors Trust was the nation’s first fund. Recent market events only reinforce what we have learned through 85 years — that mutual funds provide unique features that are important to investors in any type of market climate.
Respectfully,

Robert J. Manning
Chief Executive Officer and Chief Investment Officer
MFS Investment Management®
February 17, 2009
The opinions expressed in this letter are subject to change, may not be relied upon for investment advice, and no forecasts can be guaranteed.
Before investing, consider the fund’s investment objectives, risks, charges, and expenses. For a prospectus containing this and other information, contact your investment professional or view online. Read it carefully.
MFS Fund Distributors, Inc., 500 Boylston Street, Boston, MA 02116
1
PORTFOLIO COMPOSITION
Portfolio structure (i)
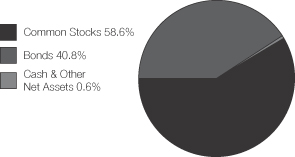
| | |
| Top ten holdings (i) | | |
| Fannie Mae, 5.5%, 30 years | | 3.5% |
| U.S. Treasury Notes, 2.375%, 2010 | | 3.2% |
| Exxon Mobil Corp. | | 2.5% |
| Fannie Mae, 6.0%, 30 years | | 2.1% |
| Lockheed Martin Corp. | | 2.1% |
| AT&T, Inc. | | 2.1% |
| Philip Morris International, Inc. | | 1.8% |
| JPMorgan Chase & Co | | 1.7% |
| MetLife, Inc. | | 1.6% |
| TOTAL S.A., ADR | | 1.5% |
| | |
| Equity sectors | | |
| Financial Services | | 10.8% |
| Energy | | 9.1% |
| Utilities & Communications | | 7.4% |
| Consumer Staples | | 7.0% |
| Industrial Goods & Services | | 5.7% |
| Health Care | | 5.2% |
| Technology | | 3.9% |
| Retailing | | 3.5% |
| Leisure | | 1.9% |
| Basic Materials | | 1.9% |
| Special Products & Services | | 1.3% |
| Autos & Housing | | 0.7% |
| Transportation | | 0.2% |
| |
| Fixed income sectors (i) | | |
| Mortgage-Backed Securities | | 16.7% |
| High Grade Corporates | | 9.3% |
| U.S. Treasury Securities | | 8.9% |
| Commercial Mortgage-Backed Securities | | 2.2% |
| U.S. Government Agencies | | 2.2% |
| Asset-Backed Securities | | 0.4% |
| Non-U.S. Government Bonds | | 0.4% |
| Municipal Bonds | | 0.3% |
| Emerging Markets Bonds | | 0.3% |
| High Yield Corporates | | 0.1% |
| Residential Mortgage-Backed Securities (o) | | 0.0% |
| (i) | For purposes of this presentation, the bond component includes accrued interest amounts and may be positively or negatively impacted by the equivalent exposure from any derivative holdings, if applicable. |
Percentages are based on net assets as of 12/31/08, unless otherwise noted.
The portfolio is actively managed and current holdings may be different.
2
MANAGEMENT REVIEW
Summary of Results
For the twelve months ended December 31, 2008, Initial Class shares of the MFS Total Return Portfolio (the “fund”) provided a total return of –21.55%, while Service Class shares of the fund provided a total return of –21.74%. These compare with returns of –37.00% and 5.24% for the fund’s benchmarks, the Standard & Poor’s 500 Stock Index (S&P 500 Index) and the Barclays Capital U.S. Aggregate Bond Index, respectively.
Market Environment
The U.S. economy and financial markets experienced significant deterioration and extraordinary volatility over the reporting period. U.S. economic growth slowed significantly, despite the short-term bounce from the second quarter fiscal stimulus. Strong domestic headwinds included accelerated deterioration in the housing market, anemic corporate investment, a rapidly declining job market, and a much tighter credit environment. During the period, a seemingly continuous series of tumultuous financial events hammered markets, including: the distressed sale of failing Bear Stearns to JPMorgan, the conservatorship of Government Sponsored Enterprises (GSEs) Fannie Mae and Freddie Mac, the bankruptcy of investment bank Lehman Brothers, the Federal Reserve Bank’s complex intervention of insurance company American International Group (AIG), the nationalization of several large European banks, the failure of Washington Mutual, and the distressed sale of Wachovia. As a result of this barrage of turbulent news, global equity markets pushed significantly lower and credit markets witnessed the worst dislocation since the beginning of the credit crisis. Though conditions improved towards the end of the period, the state of financial and macroeconomic dislocation remained severe.
While reasonably resilient during the first half of the period, the global economy and financial system increasingly experienced considerable negative spillovers from the U.S. slowdown. Not only did Europe and Japan show obvious signs of economic softening, the more powerful engine of global growth – emerging markets – also displayed weakening dynamics.
During the reporting period, the U.S. Federal Reserve Board cut interest rates aggressively and introduced a multitude of new lending facilities to alleviate ever-tightening credit markets, while the U.S. federal government moved quickly to design and implement a meaningful fiscal stimulus package. Although several other global central banks also cut rates, the dilemma of rising energy and food prices heightened concerns among central bankers that inflationary expectations might become unhinged despite weaker growth. Only late in the reporting period did slowing global growth result in a very precipitous decline in commodity prices, which significantly eased inflation and inflationary expectations. As inflationary concerns diminished in the face of global deleveraging, and equity and credit markets deteriorated more sharply, a coordinated rate cut marked the beginning of much more aggressive easing by the major global central banks.
Detractors from Performance
Within the equity portion of the fund, a combination of an underweighted position and stock selection in the health care sector hurt performance relative to the S&P 500 Index. The fund’s underweighted position in pharmaceutical company Pfizer held back relative returns as the company’s stock outperformed the benchmark.
Stock selection in the leisure sector also had a negative impact on relative results. The fund’s positioning in hospitality company Wyndham Worldwide (g) and ownership of cruise line operator Royal Caribbean Cruises (aa) dampened relative returns. Shares of Royal Caribbean suffered during the first part of the reporting period due to high fuel costs and more recently due to weak consumer spending. Not owning fast food company McDonald’s also hurt as the company’s stock significantly outperformed the benchmark.
Stocks in other sectors that were among the fund’s top relative detractors included insurance company Genworth Financial and electronics services provider Flextronics (aa)(g) (Singapore). Our ownership of investment banking firm Bear Stearns, which was eventually acquired by JPMorgan Chase, and not owning financial services company Wells Fargo during a time when its stock outperformed the benchmark, also had a negative impact on performance. Not holding alcoholic beverage company Anheuser Busch and the fund’s underweighted positions in discount retailer Wal-Mart Stores hindered relative returns as both companies turned in positive returns over the period.
During the reporting period, currency exposure in the equity portion of the fund was a detractor from relative performance. All of MFS’ investment decisions are driven by the fundamentals of each individual opportunity and, as such, it is common for our portfolios to have different currency exposure than the benchmark.
Within the fixed income portion of the fund, a greater exposure to bonds in the financial sector and commercial mortgage-backed securities (CMBS) held back performance relative to the Barclays Capital U.S. Aggregate Bond Index as these securities suffered amid the global credit crisis. The fund’s yield curve (y) positioning was another negative factor. A greater exposure to “BBB” (s) rated securities also detracted from performance as credit spreads between higher quality and lower quality issues widened over the reporting period.
3
Management Review – continued
Contributors to Performance
Within the equity portion of the fund, a combination of an underweighted position and stock selection in the technology sector was the primary contributor to relative performance. Not owning poor-performing computer and electronics maker Apple boosted relative results.
Stock selection in the industrial goods and services sector also bolstered relative returns. Underweighting poor-performing industrial conglomerate General Electric positively impacted results. The fund’s overweighted position in defense contractor Lockheed Martin further strengthened relative performance as the company provided greater returns than the benchmark.
Elsewhere, the fund’s positioning in insurance company American International Group (AIG) (g) and diversified financial services company Citigroup (g) aided results as we sold out of both stocks prior to significant declines in their respective prices. Tobacco company Philip Morris International, insurance company MetLife, integrated oil company TOTAL (aa) (France), and pharmaceutical company Wyeth were among the fund’s top relative contributors. Shares of Wyeth turned in stronger returns than the overall benchmark, in part, due to the continued solid performance of the company’s major products. Not owning oil field services company Schlumberger also had a positive impact on relative performance.
Within the fixed income portion of the fund, a greater exposure to U.S. Treasury securities aided returns relative to the benchmark. During the reporting period, the fund’s return from yield, which was greater than that of the benchmark, was a key contributor to performance. The fund’s greater exposure to mortgage-backed securities also had a positive impact on relative performance.
Respectfully,
| | | | | | | | |
| Nevin Chitkara | | William Douglas | | Steven Gorham | | Richard Hawkins | | |
| Portfolio Manager | | Portfolio Manager | | Portfolio Manager | | Portfolio Manager | | |
| | | | |
| Joshua Marston | | Michael Roberge | | Brooks Taylor | | | | |
| Portfolio Manager | | Portfolio Manager | | Portfolio Manager | | | | |
Note to Shareholders: Effective November 20, 2008, Joshua Marston became a co-manager of the fund.
| (aa) | | Security is not a benchmark constituent. |
| (g) | | Security was not held in the portfolio at period end. |
| (s) | | Bonds rated “BBB”, “Baa”, or higher are considered investment grade; bonds rated “BB”, “Ba”, or below are considered non-investment grade. The primary source for bond quality ratings is Moody’s Investors Service. If not available, ratings by Standard & Poor’s are used, else ratings by Fitch, Inc. For securities which are not rated by any of the three agencies, the security is considered not rated. |
| (y) | | A yield curve graphically depicts the yields of different maturity bonds of the same credit quality and type; a normal yield curve is upward sloping, with short-term rates lower than long-term rates. |
The views expressed in this report are those of the portfolio managers only through the end of the period of the report as stated on the cover and do not necessarily reflect the views of MFS or any other person in the MFS organization. These views are subject to change at any time based on market or other conditions, and MFS disclaims any responsibility to update such views. These views may not be relied upon as investment advice or an indication of trading intent on behalf of any MFS portfolio. References to specific securities are not recommendations of such securities, and may not be representative of any MFS portfolio’s current or future investments.
4
PERFORMANCE SUMMARY THROUGH 12/31/08
The following chart illustrates the historical performance of the fund in comparison to its benchmark(s). Benchmark comparisons are unmanaged; do not reflect any fees or expenses; and cannot be invested in directly. The performance of other share classes will be greater than or less than that of the class depicted below. (See Notes to Performance Summary.)
Performance data shown represents past performance and is no guarantee of future results. Investment return and principal value fluctuate so your units, when sold, may be worth more or less than the original cost; current performance may be lower or higher than quoted. The performance shown does not reflect the deduction of taxes, if any, that a contract holder would pay on fund distributions or the redemption of contract units. The returns for the fund shown also do not reflect the deduction of expenses associated with variable products, such as mortality and expense risk charges, separate account charges, and sales charges imposed by the insurance company separate accounts. Such expenses would reduce the overall returns shown.
Growth of a hypothetical $10,000 investment
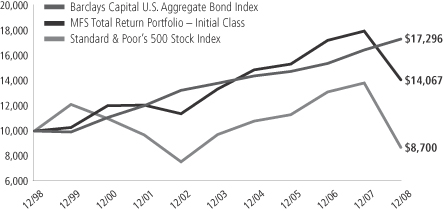
Total rates of return through 12/31/08
Average Annual Total Returns
| | | | | | | | | | | | |
| | | Share class | | Class inception date | | 1-yr | | 5-yr | | 10-yr | | |
| | | Initial Class | | 5/11/88 | | (21.55)% | | 1.07% | | 3.47% | | |
| | | Service Class | | 8/24/01 | | (21.74)% | | 0.82% | | 3.28% | | |
Comparative Benchmarks
| | | | | | | | | | | | |
| | | Standard & Poor’s 500 Stock Index (f) | | (37.00)% | | (2.19)% | | (1.38)% | | |
| | | Barclays Capital U.S. Aggregate Bond Index (f) | | 5.24% | | 4.65% | | 5.63% | | |
| (f) | Source: FactSet Research Systems Inc. |
Benchmark Definitions
Barclays Capital U.S. Aggregate Bond Index (formerly known as Lehman Brothers U.S. Aggregate Bond Index) – a market capitalization-weighted index that measures the performance of the U.S. investment-grade, fixed rate bond market, with index components for government and corporate securities, mortgage pass-through securities, and asset-backed securities with at least one year to final maturity.
Standard & Poor’s 500 Stock Index – a market capitalization-weighted index of 500 widely held equity securities, designed to measure broad U.S. equity performance.
It is not possible to invest directly in an index.
Notes to Performance Summary
Performance for the Service Class includes the performance of the fund’s Initial Class for periods prior to their offering. Because Service Class expenses are higher than those of Initial Class, performance shown for Service Class is higher than it would have been had it been offered for the entire period. Performance has not been adjusted to take into account differences in class specific operating expenses (such as Rule 12b-1 fees). Please see the prospectus for additional information about performance and expenses.
5
Performance Summary – continued
Performance results reflect any applicable expense subsidies and waivers in effect during the periods shown. Without such subsidies and waivers the fund’s performance results would be less favorable. Please see the prospectus for complete details. All results are historical and assume the reinvestment of any dividends and capital gains distributions.
From time to time the fund may receive proceeds from litigation settlements, without which performance would be lower.
6
EXPENSE TABLE
Fund Expenses Borne by the Contract Holders During the Period,
July 1, 2008 through December 31, 2008
As a contract holder of the fund, you incur ongoing costs, including management fees; distribution (12b-1) fees; and other fund expenses. This example is intended to help you understand your ongoing costs (in dollars) of investing in the fund and to compare these costs with the ongoing costs of investing in other mutual funds.
The example is based on an investment of $1,000 invested at the beginning of the period and held for the entire period July 1, 2008 through December 31, 2008.
Actual Expenses
The first line for each share class in the following table provides information about actual account values and actual expenses. You may use the information in this line, together with the amount you invested, to estimate the expenses that you paid over the period. Simply divide your account value by $1,000 (for example, an $8,600 account value divided by $1,000 = 8.6), then multiply the result by the number in the first line under the heading entitled “Expenses Paid During Period” to estimate the expenses you paid on your account during this period.
Hypothetical Example for Comparison Purposes
The second line for each share class in the following table provides information about hypothetical account values and hypothetical expenses based on the fund’s actual expense ratio and an assumed rate of return of 5% per year before expenses, which is not the fund’s actual return. The hypothetical account values and expenses may not be used to estimate the actual ending account balance or expenses you paid for the period. You may use this information to compare the ongoing costs of investing in the fund and other funds. To do so, compare this 5% hypothetical example with the 5% hypothetical examples that appear in the shareholder reports of the other funds.
Please note that the expenses shown in the table are meant to highlight the fund’s ongoing costs only and do not take into account the fees and expenses imposed under the variable contracts through which your investment in the fund is made. Therefore, the second line for each share class in the table is useful in comparing ongoing costs associated with an investment in vehicles (such as the fund) which fund benefits under variable annuity and variable life insurance contracts and to qualified pension and retirement plans only, and will not help you determine the relative total costs of investing in the fund through variable annuity and variable life insurance contracts. If the fees and expenses imposed under the variable contracts were included, your costs would have been higher.
| | | | | | | | | | |
| Share Class | | | | Annualized
Expense Ratio | | Beginning
Account Value 7/01/08 | | Ending
Account Value
12/31/08 | | Expenses Paid
During Period (p)
7/01/08-12/31/08 |
| Initial Class | | Actual | | 0.76% | | $1,000.00 | | $841.24 | | $3.52 |
| | Hypothetical (h) | | 0.76% | | $1,000.00 | | $1,021.32 | | $3.86 |
| Service Class | | Actual | | 1.01% | | $1,000.00 | | $840.49 | | $4.67 |
| | Hypothetical (h) | | 1.01% | | $1,000.00 | | $1,020.06 | | $5.13 |
| (h) | 5% class return per year before expenses. |
| (p) | Expenses paid is equal to each class’ annualized expense ratio, as shown above, multiplied by the average account value over the period, multiplied by the number of days in the period, divided by the number of days in the year. |
7
PORTFOLIO OF INVESTMENTS – 12/31/08
The Portfolio of Investments is a complete list of all securities owned by your fund. It is categorized by broad-based asset classes.
| | | | | |
| Issuer | | Shares/Par | | Value ($) |
| | | | | |
| COMMON STOCKS – 58.6% | | | | | |
| Aerospace – 4.1% | | | | | |
| Lockheed Martin Corp. | | 323,490 | | $ | 27,199,038 |
| Northrop Grumman Corp. | | 281,760 | | | 12,690,470 |
| United Technologies Corp. | | 265,220 | | | 14,215,792 |
| | | | | |
| | | | $ | 54,105,300 |
| | | | | |
| Alcoholic Beverages – 0.9% | | | | | |
| Diageo PLC | | 558,632 | | $ | 7,770,867 |
| Heineken N.V. | | 53,470 | | | 1,642,790 |
| Molson Coors Brewing Co. | | 44,040 | | | 2,154,437 |
| | | | | |
| | | | $ | 11,568,094 |
| | | | | |
| Apparel Manufacturers – 0.7% | | | | | |
| NIKE, Inc., “B” | | 189,060 | | $ | 9,642,060 |
| | | | | |
| Automotive – 0.4% | | | | | |
| Johnson Controls, Inc. | | 257,800 | | $ | 4,681,648 |
| | | | | |
| Biotechnology – 0.2% | | | | | |
| Genzyme Corp. (a) | | 44,300 | | $ | 2,940,191 |
| | | | | |
| Broadcasting – 1.3% | | | | | |
| Omnicom Group, Inc. | | 282,620 | | $ | 7,608,130 |
| Walt Disney Co. | | 349,070 | | | 7,920,398 |
| WPP Group PLC | | 343,681 | | | 2,003,400 |
| | | | | |
| | | | $ | 17,531,928 |
| | | | | |
| Brokerage & Asset Managers – 0.6% | | | | | |
| Franklin Resources, Inc. | | 58,420 | | $ | 3,726,028 |
| Invesco Ltd. | | 89,870 | | | 1,297,723 |
| Merrill Lynch & Co., Inc. | | 236,930 | | | 2,757,865 |
| | | | | |
| | | | $ | 7,781,616 |
| | | | | |
| Business Services – 1.3% | | | | | |
| Accenture Ltd. | | 217,690 | | $ | 7,138,055 |
| Automatic Data Processing, Inc. | | 101,260 | | | 3,983,568 |
| Visa, Inc. | | 69,300 | | | 3,634,785 |
| Western Union Co. | | 197,710 | | | 2,835,161 |
| | | | | |
| | | | $ | 17,591,569 |
| | | | | |
| Cable TV – 0.2% | | | | | |
| Time Warner Cable, Inc., “A” (a) | | 148,850 | | $ | 3,192,833 |
| | | | | |
| Chemicals – 1.5% | | | | | |
| 3M Co. | | 141,430 | | $ | 8,137,882 |
| PPG Industries, Inc. | | 269,350 | | | 11,428,521 |
| | | | | |
| | | | $ | 19,566,403 |
| | | | | |
| Computer Software – 1.4% | | | | | |
| Oracle Corp. (a) | | 1,033,870 | | $ | 18,330,515 |
| | | | | |
| Computer Software – Systems – 1.2% | | | | | |
| Hewlett-Packard Co. | | 98,700 | | $ | 3,581,823 |
| International Business Machines Corp. | | 147,000 | | | 12,371,520 |
| | | | | |
| | | | $ | 15,953,343 |
| | | | | |
| Construction – 0.3% | | | | | |
| Sherwin-Williams Co. | | 64,190 | | $ | 3,835,353 |
| | | | | |
| | | | | |
| Issuer | | Shares/Par | | Value ($) |
| | | | | |
| COMMON STOCKS – continued |
| Consumer Goods & Services – 0.9% | | | | | |
| Clorox Co. | | 73,850 | | $ | 4,103,106 |
| Colgate-Palmolive Co. | | 30,290 | | | 2,076,077 |
| Procter & Gamble Co. | | 96,701 | | | 5,978,056 |
| | | | | |
| | | | $ | 12,157,239 |
| | | | | |
| Electrical Equipment – 1.1% | | | | | |
| Danaher Corp. | | 116,290 | | $ | 6,583,177 |
| General Electric Co. | | 79,930 | | | 1,294,866 |
| W.W. Grainger, Inc. | | 86,330 | | | 6,806,257 |
| | | | | |
| | | | $ | 14,684,300 |
| | | | | |
| Electronics – 1.1% | | | | | |
| Agilent Technologies, Inc. (a) | | 121,200 | | $ | 1,894,356 |
| Intel Corp. | | 840,060 | | | 12,315,280 |
| | | | | |
| | | | $ | 14,209,636 |
| | | | | |
| Energy – Independent – 2.5% | | | | | |
| Anadarko Petroleum Corp. | | 93,620 | | $ | 3,609,051 |
| Apache Corp. | | 178,560 | | | 13,308,077 |
| Devon Energy Corp. | | 143,970 | | | 9,460,269 |
| EOG Resources, Inc. | | 51,580 | | | 3,434,196 |
| Occidental Petroleum Corp. | | 35,400 | | | 2,123,646 |
| Ultra Petroleum Corp. (a) | | 25,820 | | | 891,048 |
| | | | | |
| | | | $ | 32,826,287 |
| | | | | |
| Energy – Integrated – 6.3% | | | | | |
| Chevron Corp. | | 189,337 | | $ | 14,005,258 |
| ConocoPhillips | | 63,900 | | | 3,310,020 |
| Exxon Mobil Corp. | | 403,486 | | | 32,210,287 |
| Hess Corp. | | 147,600 | | | 7,917,264 |
| Marathon Oil Corp. | | 175,650 | | | 4,805,784 |
| TOTAL S.A., ADR | | 360,060 | | | 19,911,318 |
| | | | | |
| | | | $ | 82,159,931 |
| | | | | |
| Food & Beverages – 2.9% | | | | | |
| Coca-Cola Co. | | 78,650 | | $ | 3,560,486 |
| General Mills, Inc. | | 34,260 | | | 2,081,295 |
| Groupe Danone | | 36,775 | | | 2,219,554 |
| J.M. Smucker Co. | | 65,131 | | | 2,824,080 |
| Kellogg Co. | | 68,620 | | | 3,008,987 |
| Nestle S.A. | | 337,270 | | | 13,292,679 |
| Pepsi Bottling Group, Inc. | | 11,000 | | | 247,610 |
| PepsiCo, Inc. | | 194,850 | | | 10,671,935 |
| | | | | |
| | | | $ | 37,906,626 |
| | | | | |
| Food & Drug Stores – 1.5% | | | | | |
| CVS Caremark Corp. | | 408,352 | | $ | 11,736,036 |
| Kroger Co. | | 187,580 | | | 4,953,988 |
| Walgreen Co. | | 148,910 | | | 3,673,610 |
| | | | | |
| | | | $ | 20,363,634 |
| | | | | |
| Gaming & Lodging – 0.2% | | | | | |
| Royal Caribbean Cruises Ltd. (l) | | 203,160 | | $ | 2,793,450 |
| | | | | |
8
Portfolio of Investments – continued
| | | | | |
| Issuer | | Shares/Par | | Value ($) |
| | | | | |
| COMMON STOCKS – continued |
| General Merchandise – 0.9% | | | | | |
| Macy’s, Inc. | | 579,270 | | $ | 5,995,445 |
| Target Corp. | | 45,800 | | | 1,581,474 |
| Wal-Mart Stores, Inc. | | 67,380 | | | 3,777,323 |
| | | | | |
| | | | $ | 11,354,242 |
| | | | | |
| Health Maintenance Organizations – 0.5% | | | |
| UnitedHealth Group, Inc. | | 86,750 | | $ | 2,307,550 |
| WellPoint, Inc. (a) | | 87,200 | | | 3,673,736 |
| | | | | |
| | | | $ | 5,981,286 |
| | | | | |
| Insurance – 3.6% | | | | | |
| Allstate Corp. | | 505,460 | | $ | 16,558,870 |
| Aon Corp. | | 32,220 | | | 1,471,810 |
| Chubb Corp. | | 61,080 | | | 3,115,080 |
| Genworth Financial, Inc. | | 178,110 | | | 504,051 |
| MetLife, Inc. | | 584,760 | | | 20,384,734 |
| Prudential Financial, Inc. | | 52,070 | | | 1,575,638 |
| Travelers Cos., Inc. | | 94,750 | | | 4,282,700 |
| | | | | |
| | | | $ | 47,892,883 |
| | | | | |
| Internet – 0.0% | | | | | |
| Google, Inc., “A” (a) | | 1,750 | | $ | 538,388 |
| | | | | |
| Leisure & Toys – 0.2% | | | | | |
| Hasbro, Inc. | | 95,520 | | $ | 2,786,318 |
| | | | | |
| Machinery & Tools – 0.5% | | | | | |
| Eaton Corp. | | 124,120 | | $ | 6,170,005 |
| | | | | |
| Major Banks – 6.5% | | | | | |
| Bank of America Corp. | | 603,880 | | $ | 8,502,630 |
| Bank of New York Mellon Corp. | | 624,085 | | | 17,680,328 |
| Goldman Sachs Group, Inc. | | 153,360 | | | 12,942,050 |
| JPMorgan Chase & Co. | | 696,412 | | | 21,957,870 |
| PNC Financial Services Group, Inc. | | 160,450 | | | 7,862,050 |
| State Street Corp. | | 234,670 | | | 9,229,571 |
| SunTrust Banks, Inc. | | 27,540 | | | 813,532 |
| Wells Fargo & Co. | | 221,340 | | | 6,525,103 |
| | | | | |
| | | | $ | 85,513,134 |
| | | | | |
| Medical Equipment – 0.4% | | | | | |
| Waters Corp. (a) | | 75,900 | | $ | 2,781,735 |
| Zimmer Holdings, Inc. (a) | | 54,680 | | | 2,210,166 |
| | | | | |
| | | | $ | 4,991,901 |
| | | | | |
| Natural Gas – Distribution – 0.2% | | | | | |
| Sempra Energy | | 76,290 | | $ | 3,252,243 |
| | | | | |
| Natural Gas – Pipeline – 0.2% | | | | | |
| Williams Cos., Inc. | | 195,900 | | $ | 2,836,632 |
| | | | | |
| Network & Telecom – 0.2% | | | | | |
| Nokia Corp., ADR | | 136,570 | | $ | 2,130,492 |
| | | | | |
| Oil Services – 0.3% | | | | | |
| Halliburton Co. | | 54,500 | | $ | 990,810 |
| National Oilwell Varco, Inc. (a) | | 73,030 | | | 1,784,853 |
| Noble Corp. | | 44,440 | | | 981,680 |
| | | | | |
| | | | $ | 3,757,343 |
| | | | | |
| | | | | |
| Issuer | | Shares/Par | | Value ($) |
| | | | | |
| COMMON STOCKS – continued |
| Other Banks & Diversified Financials – 0.1% |
| New York Community Bancorp, Inc. | | 71,570 | | $ | 855,977 |
| | | | | |
| Pharmaceuticals – 4.1% | | | | | |
| Abbott Laboratories | | 46,490 | | $ | 2,481,171 |
| GlaxoSmithKline PLC | | 106,860 | | | 1,983,792 |
| Johnson & Johnson | | 229,260 | | | 13,716,626 |
| Merck & Co., Inc. | | 488,450 | | | 14,848,880 |
| Merck KGaA | | 27,260 | | | 2,478,412 |
| Pfizer, Inc. | | 55,340 | | | 980,071 |
| Roche Holding AG | | 10,690 | | | 1,645,551 |
| Wyeth | | 415,520 | | | 15,586,155 |
| | | | | |
| | | | $ | 53,720,658 |
| | | | | |
| Railroad & Shipping – 0.1% | | | | | |
| Burlington Northern Santa Fe Corp. | | 9,090 | | $ | 688,204 |
| | | | | |
| Specialty Chemicals – 0.4% | | | | | |
| Air Products & Chemicals, Inc. | | 111,170 | | $ | 5,588,516 |
| | | | | |
| Specialty Stores – 0.4% | | | | | |
| O’Reilly Automotive, Inc. (a) | | 27,000 | | $ | 829,980 |
| Staples, Inc. | | 241,960 | | | 4,335,923 |
| | | | | |
| | | | $ | 5,165,903 |
| | | | | |
| Telecommunications – Wireless – 0.7% | | | | | |
| America Movil S.A.B. de C.V., “L”, ADR | | 10,410 | | $ | 322,606 |
| Rogers Communications, Inc., “B” | | 134,770 | | | 3,994,519 |
| Vodafone Group PLC | | 2,524,410 | | | 5,081,924 |
| | | | | |
| | | | $ | 9,399,049 |
| | | | | |
| Telephone Services – 2.7% | | | | | |
| AT&T, Inc. | | 949,296 | | $ | 27,054,936 |
| Embarq Corp. | | 185,129 | | | 6,657,239 |
| Verizon Communications, Inc. | | 49,150 | | | 1,666,185 |
| | | | | |
| | | | $ | 35,378,360 |
| | | | | |
| Tobacco – 2.3% | | | | | |
| Altria Group, Inc. | | 90,440 | | $ | 1,362,026 |
| Lorillard, Inc. | | 83,950 | | | 4,730,583 |
| Philip Morris International, Inc. | | 554,580 | | | 24,129,776 |
| | | | | |
| | | | $ | 30,222,385 |
| | | | | |
| Trucking – 0.1% | | | | | |
| United Parcel Service, Inc., “B” | | 35,610 | | $ | 1,964,248 |
| | | | | |
| Utilities – Electric Power – 3.6% | | | | | |
| Allegheny Energy, Inc. | | 80,460 | | $ | 2,724,376 |
| American Electric Power Co., Inc. | | 101,600 | | | 3,381,248 |
| CMS Energy Corp. | | 78,270 | | | 791,310 |
| Dominion Resources, Inc. | | 160,048 | | | 5,736,120 |
| Entergy Corp. | | 41,430 | | | 3,444,076 |
| FPL Group, Inc. | | 183,080 | | | 9,214,416 |
| NRG Energy, Inc. (a) | | 155,410 | | | 3,625,715 |
| PG&E Corp. | | 136,970 | | | 5,302,109 |
| PPL Corp. | | 188,210 | | | 5,776,165 |
| Public Service Enterprise Group, Inc. | | 227,610 | | | 6,639,384 |
| | | | | |
| | | | $ | 46,634,919 |
| | | | | |
Total Common Stocks
(Identified Cost, $869,688,456) | | | | $ | 770,645,042 |
| | | | | |
9
Portfolio of Investments – continued
| | | | | | |
| Issuer | | Shares/Par | | Value ($) |
| | | | | | |
| BONDS – 40.4% | | | | | | |
| Agency – Other – 0.1% | | | | | | |
| Financing Corp., 9.65%, 2018 | | $ | 490,000 | | $ | 759,753 |
| | | | | | |
Asset Backed & Securitized – 2.6% | | | | | | |
| Banc of America Commercial Mortgage, Inc., 5.744%, 2017 | | $ | 800,000 | | $ | 576,430 |
| Bayview Financial Revolving Mortgage Loan Trust, FRN, 1.271%, 2040 (z) | | | 1,850,000 | | | 1,147,000 |
BlackRock Capital Finance LP,
7.75%, 2026 (n) | | | 159,615 | | | 25,538 |
| Chase Commercial Mortgage Securities Corp., 7.543%, 2032 | | | 33,641 | | | 33,546 |
| Citigroup Commercial Mortgage Trust, FRN, 5.7%, 2017 | | | 4,050,000 | | | 3,052,813 |
| Citigroup/Deutsche Bank Commercial Mortgage Trust, 5.322%, 2049 | | | 1,360,000 | | | 949,411 |
| Countrywide Asset-Backed Certificates, FRN, 4.575%, 2035 | | | 10,108 | | | 9,778 |
| Countrywide Asset-Backed Certificates, FRN, 4.823%, 2035 | | | 214,637 | | | 207,729 |
| Countrywide Asset-Backed Certificates, FRN, 5.689%, 2046 | | | 1,120,000 | | | 631,221 |
| Credit Suisse Commercial Mortgage Trust, 5.509%, 2039 | | | 1,449,204 | | | 705,495 |
| Credit Suisse Mortgage Capital Certificate, FRN, 5.695%, 2017 | | | 1,881,580 | | | 1,244,536 |
| GE Commercial Mortgage Corp., FRN, 5.338%, 2044 | | | 1,330,000 | | | 673,851 |
| GMAC Mortgage Corp. Loan Trust, FRN, 5.805%, 2036 | | | 1,316,000 | | | 452,372 |
| Greenwich Capital Commercial Funding Corp., 4.305%, 2042 | | | 1,644,016 | | | 1,555,672 |
| Greenwich Capital Commercial Funding Corp., FRN, 5.317%, 2036 | | | 625,465 | | | 520,351 |
| JPMorgan Chase Commercial Mortgage Securities Corp, 6.007%, 2049 | | | 1,300,000 | | | 918,094 |
| JPMorgan Chase Commercial Mortgage Securities Corp., 4.78%, 2042 | | | 1,620,000 | | | 908,982 |
| JPMorgan Chase Commercial Mortgage Securities Corp., 5.552%, 2045 | | | 1,012,000 | | | 781,345 |
| JPMorgan Chase Commercial Mortgage Securities Corp., FRN, 5.208%, 2041 | | | 1,985,000 | | | 1,675,974 |
| JPMorgan Chase Commercial Mortgage Securities Corp., FRN, 5.475%, 2043 | | | 2,420,000 | | | 1,882,218 |
| JPMorgan Chase Commercial Mortgage Securities Corp., FRN, 5.875%, 2045 | | | 2,420,000 | | | 1,930,571 |
| Merrill Lynch Mortgage Trust, FRN, 5.828%, 2050 | | | 999,000 | | | 175,163 |
| Merrill Lynch/Countrywide Commercial Mortgage Trust, FRN, 5.473%, 2039 | | | 1,140,000 | | | 585,355 |
| Merrill Lynch/Countrywide Commercial Mortgage Trust, FRN, 5.749%, 2050 | | | 1,881,580 | | | 1,335,794 |
| Morgan Stanley Capital I, Inc., FRN, 0.814%, 2030 (i)(n) | | | 12,047,608 | | | 202,522 |
| Multi-Family Capital Access One, Inc., 6.65%, 2024 | | | 159,126 | | | 158,900 |
| Nomura Asset Securities Corp., FRN, 9.768%, 2027 (z) | | | 2,405,886 | | | 2,543,792 |
| | | | | | |
| Issuer | | Shares/Par | | Value ($) |
| | | | | | |
| BONDS – continued | | | | | | |
Asset Backed & Securitized – continued | | | | | | |
| Residential Asset Mortgage Products, Inc., FRN, 4.97%, 2034 | | $ | 931,000 | | $ | 670,344 |
| Residential Funding Mortgage Securities, Inc., FRN, 5.32%, 2035 | | | 1,405,000 | | | 474,851 |
| Spirit Master Funding LLC, 5.05%, 2023 (z) | | | 1,515,708 | | | 1,241,952 |
| Structured Asset Securities Corp., FRN, 4.67%, 2035 | | | 1,564,983 | | | 1,245,542 |
| Wachovia Bank Commercial Mortgage Trust, 4.75%, 2044 | | | 2,500,000 | | | 1,468,474 |
| Wachovia Bank Commercial Mortgage Trust, 5.902%, 2017 | | | 1,300,000 | | | 939,478 |
| Wachovia Bank Commercial Mortgage Trust, FRN, 4.847%, 2041 | | | 2,000,000 | | | 1,606,350 |
| Wachovia Bank Commercial Mortgage Trust, FRN, 5.956%, 2045 | | | 1,660,000 | | | 861,005 |
| Wachovia Bank Commercial Mortgage Trust, FRN, 5.795%, 2045 | | | 766,291 | | | 386,482 |
| | | | | | |
| | | | | $ | 33,778,931 |
| | | | | | |
| Broadcasting – 0.2% | | | | | | |
| CBS Corp., 6.625%, 2011 | | $ | 1,595,000 | | $ | 1,413,460 |
| News America, Inc., 8.5%, 2025 | | | 1,154,000 | | | 1,135,689 |
| | | | | | |
| | | | | $ | 2,549,149 |
| | | | | | |
| Brokerage & Asset Managers – 0.2% | | | | | | |
Lehman Brothers Holdings, Inc.,
6.5%, 2017 (d) | | $ | 1,640,000 | | $ | 164 |
| Merrill Lynch & Co., Inc., 6.15%, 2013 | | | 1,220,000 | | | 1,208,885 |
| Merrill Lynch & Co., Inc., 6.11%, 2037 | | | 1,440,000 | | | 1,294,452 |
| | | | | | |
| | | | | $ | 2,503,501 |
| | | | | | |
| Building – 0.1% | | | | | | |
| CRH America, Inc., 6.95%, 2012 | | $ | 1,847,000 | | $ | 1,486,639 |
| | | | | | |
| Business Services – 0.1% | | | | | | |
| Xerox Corp., 5.5%, 2012 | | $ | 920,000 | | $ | 771,006 |
| | | | | | |
| Cable TV – 0.2% | | | | | | |
| Cox Communications, Inc., 4.625%, 2013 | | $ | 1,167,000 | | $ | 1,011,403 |
| Time Warner Entertainment Co. LP, 8.375%, 2033 | | | 1,330,000 | | | 1,342,142 |
| | | | | | |
| | | | | $ | 2,353,545 |
| | | | | | |
| Chemicals – 0.1% | | | | | | |
| PPG Industries, Inc., 5.75%, 2013 | | $ | 923,000 | | $ | 912,788 |
| | | | | | |
| Conglomerates – 0.1% | | | | | | |
| Kennametal, Inc., 7.2%, 2012 | | $ | 1,780,000 | | $ | 1,729,371 |
| | | | | | |
| Consumer Goods & Services – 0.3% | | | | | | |
| Fortune Brands, Inc., 5.125%, 2011 | | $ | 1,671,000 | | $ | 1,605,006 |
| Western Union Co., 5.4%, 2011 | | | 2,300,000 | | | 2,210,712 |
| | | | | | |
| | | | | $ | 3,815,718 |
| | | | | | |
| Defense Electronics – 0.1% | | | | | | |
| BAE Systems Holdings, Inc., 5.2%, 2015 (n) | | $ | 753,000 | | $ | 700,441 |
| | | | | | |
| Electronics – 0.1% | | | | | | |
| Tyco Electronics Group S.A., 6.55%, 2017 | | $ | 1,492,000 | | $ | 1,253,880 |
| | | | | | |
10
Portfolio of Investments – continued
| | | | | | |
| Issuer | | Shares/Par | | Value ($) |
| | | | | | |
| BONDS – continued | | | | | | |
| Emerging Market Quasi-Sovereign – 0.1% | | | |
| Ras Laffan Liquefied Natural Gas Co. Ltd., 5.832%, 2016 (n) | | $ | 1,130,000 | | $ | 841,229 |
| | | | | | |
| Emerging Market Sovereign – 0.1% | | | | | | |
| State of Israel, 4.625%, 2013 | | $ | 981,000 | | $ | 1,028,197 |
| | | | | | |
| Energy – Independent – 0.2% | | | | | | |
| Nexen, Inc., 5.875%, 2035 | | $ | 358,000 | | $ | 269,534 |
| Ocean Energy, Inc., 7.25%, 2011 | | | 2,246,000 | | | 2,305,943 |
| | | | | | |
| | | | | $ | 2,575,477 |
| | | | | | |
| Energy – Integrated – 0.1% | | | | | | |
| Petro-Canada, 6.05%, 2018 | | $ | 1,794,000 | | $ | 1,478,563 |
| | | | | | |
| Financial Institutions – 0.5% | | | | | | |
| American Express Co., 5.5%, 2016 | | $ | 2,171,000 | | $ | 1,992,025 |
| Capital One Financial Corp., 6.15%, 2016 | | | 1,540,000 | | | 1,083,693 |
General Electric Capital Corp.,
5.45%, 2013 | | | 179,000 | | | 180,282 |
| HSBC Finance Corp., 5.25%, 2011 | | | 1,510,000 | | | 1,463,969 |
| ORIX Corp., 5.48%, 2011 | | | 2,290,000 | | | 1,720,424 |
| | | | | | |
| | | | | $ | 6,440,393 |
| | | | | | |
| Food & Beverages – 0.5% | | | | | | |
| Diageo Finance B.V., 5.5%, 2013 | | $ | 2,560,000 | | $ | 2,545,234 |
Dr. Pepper Snapple Group, Inc.,
6.12%, 2013 (n) | | | 450,000 | | | 443,267 |
Dr. Pepper Snapple Group, Inc.,
6.82%, 2018 (n) | | | 571,000 | | | 563,207 |
| Miller Brewing Co., 5.5%, 2013 (n) | | | 2,985,000 | | | 2,783,169 |
| | | | | | |
| | | | | $ | 6,334,877 |
| | | | | | |
| Food & Drug Stores – 0.1% | | | | | | |
| CVS Caremark Corp., 6.125%, 2016 | | $ | 1,140,000 | | $ | 1,104,470 |
| | | | | | |
| Gaming & Lodging – 0.1% | | | | | | |
| Marriott International, Inc., 6.375%, 2017 | | $ | 1,360,000 | | $ | 948,362 |
| Wyndham Worldwide Corp., 6%, 2016 | | | 1,146,000 | | | 461,939 |
| | | | | | |
| | | | | $ | 1,410,301 |
| | | | | | |
| Insurance – 0.1% | | | | | | |
American International Group, Inc.,
8.25%, 2018 (z) | | $ | 670,000 | | $ | 490,386 |
ING Groep N.V., 5.775% to 2015,
FRN to 2049 | | | 1,405,000 | | | 601,750 |
Metropolitan Life Global Funding,
5.125%, 2013 (n) | | | 590,000 | | | 549,738 |
| | | | | | |
| | | | | $ | 1,641,874 |
| | | | | | |
| Insurance – Property & Casualty – 0.3% | | | | | | |
| Allstate Corp., 6.125%, 2032 | | $ | 1,617,000 | | $ | 1,395,487 |
Chubb Corp., 6.375% to 2017,
FRN to 2067 | | | 2,340,000 | | | 1,451,249 |
| Fund American Cos., Inc., 5.875%, 2013 | | | 1,110,000 | | | 807,846 |
| ZFS Finance USA Trust IV, 5.875% to 2012, FRN to 2032 (n) | | | 500,000 | | | 174,690 |
| ZFS Finance USA Trust V, 6.5% to 2017, FRN to 2037 (n) | | | 2,080,000 | | | 852,800 |
| | | | | | |
| | | | | $ | 4,682,072 |
| | | | | | |
| | | | | | |
| Issuer | | Shares/Par | | Value ($) |
| | | | | | |
| BONDS – continued | | | | | | |
| International Market Quasi-Sovereign – 0.2% | | | |
| Hydro-Quebec, 6.3%, 2011 | | $ | 2,256,000 | | $ | 2,395,615 |
| | | | | | |
| International Market Sovereign – 0.2% | | | |
| Province of Ontario, 5%, 2011 | | $ | 2,280,000 | | $ | 2,396,804 |
| | | | | | |
| Machinery & Tools – 0.1% | | | | | | |
| Atlas Copco AB, 5.6%, 2017 (n) | | $ | 1,760,000 | | $ | 1,653,351 |
| | | | | | |
| Major Banks – 0.9% | | | | | | |
| Bank of America Corp., 5.49%, 2019 | | $ | 729,000 | | $ | 627,843 |
| BNP Paribas, 7.195% to 2037, FRN to 2049 (n) | | | 700,000 | | | 445,001 |
| DBS Group Holdings Ltd., 7.657% to 2011, FRN to 2049 (n) | | | 1,476,000 | | | 1,472,948 |
Goldman Sachs Group, Inc.,
5.625%, 2017 | | | 1,598,000 | | | 1,372,805 |
| Morgan Stanley, 6.75%, 2011 | | | 1,530,000 | | | 1,505,407 |
| Morgan Stanley, 5.75%, 2016 | | | 1,145,000 | | | 962,113 |
| MUFG Capital Finance 1 Ltd., 6.346% to 2016, FRN to 2049 | | | 1,638,000 | | | 1,141,232 |
Natixis S.A., 10% to 2018, FRN to
2049 (n) | | | 1,900,000 | | | 1,011,972 |
| PNC Funding Corp., 5.625%, 2017 | | | 1,180,000 | | | 1,146,096 |
Royal Bank of Scotland Group PLC,
6.99% to 2017, FRN to 2049 (n) | | | 390,000 | | | 182,339 |
UniCredito Italiano Capital Trust II,
9.2% to 2010, FRN to 2049 (n) | | | 1,509,000 | | | 577,316 |
UniCredito Luxembourg Finance S.A.,
6%, 2017 (n) | | | 1,610,000 | | | 1,342,442 |
| Wachovia Corp., 5.25%, 2014 | | | 787,000 | | | 733,102 |
| | | | | | |
| | | | | $ | 12,520,616 |
| | | | | | |
| Medical & Health Technology & Services – 0.2% |
| Cardinal Health, Inc., 5.8%, 2016 | | $ | 856,000 | | $ | 774,404 |
| HCA, Inc., 8.75%, 2010 | | | 135,000 | | | 129,600 |
| Hospira, Inc., 5.55%, 2012 | | | 570,000 | | | 540,057 |
| Hospira, Inc., 6.05%, 2017 | | | 2,020,000 | | | 1,640,680 |
| | | | | | |
| | | | | $ | 3,084,741 |
| | | | | | |
| Metals & Mining – 0.1% | | | | | | |
| ArcelorMittal, 6.125%, 2018 | | $ | 1,820,000 | | $ | 1,246,260 |
| | | | | | |
| Mortgage Backed – 16.6% | | | | | | |
| Fannie Mae, 4.01%, 2013 | | $ | 185,180 | | $ | 183,041 |
| Fannie Mae, 4.589%, 2014 | | | 1,077,410 | | | 1,087,102 |
| Fannie Mae, 4.63%, 2014 | | | 462,769 | | | 467,158 |
| Fannie Mae, 4.84%, 2014 | | | 784,051 | | | 799,427 |
| Fannie Mae, 4.88%, 2014 | | | 313,858 | | | 319,913 |
| Fannie Mae, 4.56%, 2015 | | | 307,444 | | | 308,522 |
| Fannie Mae, 4.7%, 2015 | | | 662,471 | | | 669,184 |
| Fannie Mae, 4.78%, 2015 | | | 439,329 | | | 444,933 |
| Fannie Mae, 4.856%, 2015 | | | 314,112 | | | 316,854 |
| Fannie Mae, 4.921%, 2015 | | | 2,741,945 | | | 2,802,309 |
| Fannie Mae, 4.996%, 2015 | | | 137,807 | | | 141,312 |
| Fannie Mae, 5.1%, 2015 | | | 750,000 | | | 726,907 |
| Fannie Mae, 5.09%, 2016 | | | 460,000 | | | 471,853 |
| Fannie Mae, 5.27%, 2016 | | | 545,000 | | | 564,551 |
| Fannie Mae, 5.5%, 2016-2035 | | | 49,309,728 | | | 50,699,874 |
| Fannie Mae, 5.05%, 2017 | | | 460,000 | | | 470,748 |
11
Portfolio of Investments – continued
| | | | | | |
| Issuer | | Shares/Par | | Value ($) |
| | | | | | |
| BONDS – continued | | | | | | |
| Mortgage Backed – continued | | | | | | |
| Fannie Mae, 6%, 2017-2037 | | $ | 31,976,933 | | $ | 33,043,811 |
| Fannie Mae, 4.5%, 2018-2035 | | | 7,524,522 | | | 7,694,423 |
| Fannie Mae, 5%, 2018-2036 | | | 20,837,438 | | | 21,381,178 |
| Fannie Mae, 5.37%, 2018 | | | 600,000 | | | 579,141 |
| Fannie Mae, 7.5%, 2030-2031 | | | 268,008 | | | 283,884 |
| Fannie Mae, 6.5%, 2031-2037 | | | 11,948,839 | | | 12,446,705 |
| Freddie Mac, 6%, 2016-2037 | | | 16,578,364 | | | 17,124,084 |
| Freddie Mac, 5%, 2017-2035 | | | 18,715,465 | | | 19,193,141 |
| Freddie Mac, 4.5%, 2018-2035 | | | 8,195,178 | | | 8,413,148 |
| Freddie Mac, 5.5%, 2019-2037 | | | 17,319,462 | | | 17,786,847 |
| Freddie Mac, 6.5%, 2034-2037 | | | 4,539,366 | | | 4,722,462 |
| Ginnie Mae, 4.5%, 2033-2034 | | | 1,384,420 | | | 1,400,953 |
| Ginnie Mae, 5%, 2033-2034 | | | 1,462,404 | | | 1,504,389 |
| Ginnie Mae, 5.5%, 2033-2035 | | | 6,244,864 | | | 6,453,363 |
| Ginnie Mae, 6%, 2033-2038 | | | 5,369,084 | | | 5,550,754 |
| | | | | | |
| | | | | $ | 218,051,971 |
| | | | | | |
| Municipals – 0.3% | | | | | | |
California Educational Facilities Authority Rev. (Stanford University), “T-1”,
5%, 2039 | | $ | 765,000 | | $ | 763,761 |
Massachusetts Bay Transportation Authority Sales Tax Rev., “A-1”,
5.25%, 2033 | | | 1,290,000 | | | 1,291,754 |
| Massachusetts Health & Educational Facilities Authority Rev. (Boston College), 5.5%, 2030 | | | 795,000 | | | 791,979 |
| Massachusetts Health & Educational Facilities Authority Rev. (Boston College), 5.5%, 2035 | | | 1,265,000 | | | 1,239,055 |
| | | | | | |
| | | | | $ | 4,086,549 |
| | | | | | |
| Natural Gas – Pipeline – 0.4% | | | | | | |
| CenterPoint Energy, Inc., 7.875%, 2013 | | $ | 1,285,000 | | $ | 1,190,288 |
Enterprise Products Operating LLC,
6.5%, 2019 | | | 966,000 | | | 812,712 |
| Kinder Morgan Energy Partners LP, 6.75%, 2011 | | | 740,000 | | | 719,754 |
Kinder Morgan Energy Partners LP,
7.4%, 2031 | | | 804,000 | | | 689,334 |
| Kinder Morgan Energy Partners LP, 7.75%, 2032 | | | 590,000 | | | 517,033 |
| Spectra Energy Capital LLC, 8%, 2019 | | | 987,000 | | | 1,024,254 |
| | | | | | |
| | | | | $ | 4,953,375 |
| | | | | | |
| Network & Telecom – 0.7% | | | | | | |
| BellSouth Corp., 6.55%, 2034 | | $ | 1,472,000 | | $ | 1,492,607 |
| Deutsche Telekom International Finance B.V., 5.75%, 2016 | | | 1,093,000 | | | 1,046,261 |
| Telecom Italia Capital, 5.25%, 2013 | | | 752,000 | | | 573,400 |
| Telefonica Europe B.V., 7.75%, 2010 | | | 750,000 | | | 761,522 |
| TELUS Corp., 8%, 2011 | | | 2,058,000 | | | 2,046,862 |
| Verizon New York, Inc., 6.875%, 2012 | | | 4,213,000 | | | 4,191,729 |
| | | | | | |
| | | | | $ | 10,112,381 |
| | | | | | |
| | | | | | |
| Issuer | | Shares/Par | | Value ($) |
| | | | | | |
| BONDS – continued | | | | | | |
| Oil Services – 0.1% | | | | | | |
Weatherford International Ltd.,
6.35%, 2017 | | $ | 520,000 | | $ | 443,787 |
| Weatherford International Ltd., 6%, 2018 | | | 1,281,000 | | | 1,075,731 |
| | | | | | |
| | | | | $ | 1,519,518 |
| | | | | | |
| Oils – 0.1% | | | | | | |
| Valero Energy Corp., 6.875%, 2012 | | $ | 1,193,000 | | $ | 1,199,717 |
| | | | | | |
| Other Banks & Diversified Financials – 0.4% |
Nordea Bank AB, 5.424% to 2015,
FRN to 2049 (n) | | $ | 599,000 | | $ | 273,934 |
| UBS Preferred Funding Trust V, 6.243% to 2016, FRN to 2049 | | | 2,370,000 | | | 1,294,314 |
| UFJ Finance Aruba AEC, 6.75%, 2013 | | | 1,624,000 | | | 1,587,294 |
Woori Bank, 6.125% to 2011,
FRN to 2016 (n) | | | 2,715,000 | | | 1,953,714 |
| | | | | | |
| | | | | $ | 5,109,256 |
| | | | | | |
| Pharmaceuticals – 0.2% | | | | | | |
| Allergan, Inc., 5.75%, 2016 | | $ | 1,720,000 | | $ | 1,645,562 |
| GlaxoSmithKline Capital, Inc., 4.85%, 2013 | | | 592,000 | | | 593,810 |
| | | | | | |
| | | | | $ | 2,239,372 |
| | | | | | |
| Pollution Control – 0.1% | | | | | | |
| Waste Management, Inc., 7.375%, 2010 | | $ | 1,341,000 | | $ | 1,358,953 |
| | | | | | |
| Railroad & Shipping – 0.1% | | | | | | |
| CSX Corp., 6.75%, 2011 | | $ | 72,000 | | $ | 71,717 |
| CSX Corp., 7.9%, 2017 | | | 1,350,000 | | | 1,389,473 |
| | | | | | |
| | | | | $ | 1,461,190 |
| | | | | | |
| Real Estate – 0.3% | | | | | | |
| Boston Properties, Inc., REIT, 5%, 2015 | | $ | 369,000 | | $ | 232,361 |
| HRPT Properties Trust, REIT, 6.25%, 2016 | | | 1,945,000 | | | 1,035,996 |
| ProLogis, REIT, 5.75%, 2016 | | | 1,992,000 | | | 993,438 |
Simon Property Group, Inc., REIT,
5.1%, 2015 | | | 1,070,000 | | | 655,937 |
Simon Property Group, Inc., REIT,
5.875%, 2017 | | | 1,131,000 | | | 755,298 |
| Vornado Realty Trust, REIT, 4.75%, 2010 | | | 189,000 | | | 170,059 |
| | | | | | |
| | | | | $ | 3,843,089 |
| | | | | | |
| Retailers – 0.3% | | | | | | |
| Home Depot, Inc., 5.875%, 2036 | | $ | 550,000 | | $ | 431,256 |
| Limited Brands, Inc., 5.25%, 2014 | | | 1,123,000 | | | 647,826 |
| Macy’s Retail Holdings, Inc., 5.35%, 2012 | | | 540,000 | | | 401,097 |
| Wal-Mart Stores, Inc., 5.25%, 2035 | | | 2,241,000 | | | 2,231,279 |
| | | | | | |
| | | | | $ | 3,711,458 |
| | | | | | |
| Telecommunications – Wireless – 0.2% |
| Cingular Wireless LLC, 6.5%, 2011 | | $ | 693,000 | | $ | 695,769 |
| Rogers Communications, Inc., 6.8%, 2018 | | | 1,554,000 | | | 1,570,210 |
| | | | | | |
| | | | | $ | 2,265,979 |
| | | | | | |
| Tobacco – 0.3% | | | | | | |
| Altria Group, Inc., 9.7%, 2018 | | $ | 1,790,000 | | $ | 1,934,686 |
Philip Morris International, Inc.,
4.875%, 2013 | | | 2,350,000 | | | 2,356,726 |
| | | | | | |
| | | | | $ | 4,291,412 |
| | | | | | |
12
Portfolio of Investments – continued
| | | | | | |
| Issuer | | Shares/Par | | Value ($) |
| | | | | | |
| BONDS – continued | | | | | | |
| U.S. Government Agencies – 2.1% | | | | | | |
| Fannie Mae, 6.625%, 2009-2010 | | $ | 9,527,000 | | $ | 10,185,788 |
| Fannie Mae, 6%, 2011 | | | 1,539,000 | | | 1,701,031 |
| Freddie Mac, 5.5%, 2017 | | | 8,500,000 | | | 10,024,195 |
Small Business Administration,
4.77%, 2024 | | | 738,422 | | | 744,321 |
Small Business Administration,
4.99%, 2024 | | | 1,097,874 | | | 1,117,846 |
Small Business Administration,
5.18%, 2024 | | | 1,204,639 | | | 1,237,271 |
Small Business Administration,
5.11%, 2025 | | | 2,478,115 | | | 2,533,200 |
| | | | | | |
| | | | | $ | 27,543,652 |
| | | | | | |
| U.S. Treasury Obligations – 8.8% | | | | | | |
| U.S. Treasury Bonds, 2.375%, 2010 | | $ | 40,351,000 | | $ | 41,575,734 |
| U.S. Treasury Bonds, 2%, 2013 | | | 2,348,000 | | | 2,408,902 |
| U.S. Treasury Bonds, 4.75%, 2017 | | | 2,210,000 | | | 2,642,331 |
| U.S. Treasury Bonds, 8%, 2021 | | | 320,000 | | | 485,200 |
| U.S. Treasury Bonds, 6%, 2026 | | | 4,359,000 | | | 6,083,529 |
| U.S. Treasury Bonds, 6.75%, 2026 | | | 2,451,000 | | | 3,696,797 |
| U.S. Treasury Bonds, 5.375%, 2031 | | | 6,224,000 | | | 8,552,162 |
| U.S. Treasury Bonds, 5%, 2037 | | | 4,690,000 | | | 6,795,369 |
| U.S. Treasury Notes, 1.5%, 2010 | | | 539,000 | | | 547,043 |
| U.S. Treasury Notes, 5.125%, 2011 | | | 1,775,000 | | | 1,964,565 |
| U.S. Treasury Notes, 4.5%, 2012 | | | 1,924,000 | | | 2,130,830 |
| U.S. Treasury Notes, 4.625%, 2012 | | | 1,800,000 | | | 2,017,829 |
| U.S. Treasury Notes, 4.125%, 2012 | | | 8,753,000 | | | 9,680,275 |
| U.S. Treasury Notes, 3.875%, 2013 | | | 6,631,000 | | | 7,387,345 |
| U.S. Treasury Notes, 3.125%, 2013 | | | 5,700,000 | | | 6,150,209 |
| U.S. Treasury Notes, 4.125%, 2015 | | | 4,512,000 | | | 5,174,700 |
| U.S. Treasury Notes, 4.5%, 2015 | | | 868,000 | | | 1,029,394 |
| U.S. Treasury Notes, 5.125%, 2016 | | | 488,000 | | | 590,899 |
| U.S. Treasury Notes, 3.75%, 2018 | | | 6,272,000 | | | 7,100,092 |
| | | | | | |
| | | | | $ | 116,013,205 |
| | | | | | |
| | | | | | |
| Issuer | | Shares/Par | | Value ($) |
| | | | | | |
| BONDS – continued | | | | | | |
| Utilities – Electric Power – 1.4% | | | | | | |
| Bruce Mansfield Unit, 6.85%, 2034 | | $ | 2,580,000 | | $ | 2,199,652 |
| EDP Finance B.V., 6%, 2018 (n) | | | 1,139,000 | | | 945,536 |
Enel Finance International S.A.,
6.25%, 2017 (n) | | | 1,595,000 | | | 1,346,909 |
| Exelon Generation Co. LLC, 6.95%, 2011 | | | 2,652,000 | | | 2,574,294 |
| Exelon Generation Co. LLC, 6.2%, 2017 | | | 930,000 | | | 799,811 |
| FirstEnergy Corp., 6.45%, 2011 | | | 2,246,000 | | | 2,123,045 |
| MidAmerican Energy Holdings Co., 5.875%, 2012 | | | 535,000 | | | 533,669 |
| MidAmerican Funding LLC, 6.927%, 2029 | | | 2,762,000 | | | 2,523,822 |
| Oncor Electric Delivery Co., 7%, 2022 | | | 1,582,000 | | | 1,478,233 |
| PSEG Power LLC, 6.95%, 2012 | | | 1,177,000 | | | 1,161,311 |
| PSEG Power LLC, 5.5%, 2015 | | | 911,000 | | | 814,133 |
System Energy Resources, Inc.,
5.129%, 2014 (z) | | | 716,972 | | | 680,822 |
| Waterford 3 Funding Corp., 8.09%, 2017 | | | 1,948,203 | | | 1,929,578 |
| | | | | | |
| | | | | $ | 19,110,815 |
| | | | | | |
Total Bonds
(Identified Cost, $554,613,921) | | | | | $ | 530,321,454 |
| | | | | | |
|
| MONEY MARKET FUNDS (v) – 0.5% |
| MFS Institutional Money Market Portfolio, 0.37%, at Cost and Net Asset Value | | | 6,582,398 | | $ | 6,582,398 |
| | | | | | |
|
| COLLATERAL FOR SECURITIES LOANED – 0.1% |
| Navigator Securities Lending Prime Portfolio, at Cost and Net Asset Value | | | 785,593 | | $ | 785,593 |
| | | | | | |
Total Investments
(Identified Cost, $1,431,670,368) | | | | | $ | 1,308,334,487 |
| | | | | | |
OTHER ASSETS, LESS
LIABILITIES – 0.4% | | | | | | 5,025,037 |
| | | | | | |
| Net Assets – 100.0% | | | | | $ | 1,313,359,524 |
| | | | | | |
13
Portfolio of Investments – continued
| (a) | | Non-income producing security. |
| (d) | | Non-income producing security – in default. |
| (i) | | Interest only security for which the fund receives interest on notional principal (Par amount). Par amount shown is the notional principal and does not reflect the cost of the security. |
| (l) | | All or a portion of this security is on loan. |
| (n) | | Securities exempt from registration under Rule 144A of the Securities Act of 1933. These securities may be sold in the ordinary course of business in transactions exempt from registration, normally to qualified institutional buyers. At period end, the aggregate value of these securities was $18,342,063, representing 1.4% of net assets. |
| (v) | | Underlying fund that is available only to investment companies managed by MFS. The rate quoted is the annualized seven day yield of the fund at period end. |
| (z) | | Restricted securities are not registered under the Securities Act of 1933 and are subject to legal restrictions on resale. These securities generally may be resold in transactions exempt from registration or to the public if the securities are subsequently registered. Disposal of these securities may involve time-consuming negotiations and prompt sale at an acceptable price may be difficult. The fund holds the following restricted securities: |
| | | | | | |
| Restricted Securities | | Acquisition
Date | | Cost | | Current
Market Value |
| American International Group, Inc., 8.25%, 2018 | | 8/18/08 | | $670,000 | | $490,386 |
| Bayview Financial Revolving Mortgage Loan Trust, FRN, 1.271%, 2040 | | 3/01/06 | | 1,850,000 | | 1,147,000 |
| Nomura Asset Securities Corp., FRN, 9.768%, 2027 | | 7/16/07 | | 2,648,824 | | 2,543,792 |
| Spirit Master Funding LLC, 5.05%, 2023 | | 10/04/05 | | 1,496,170 | | 1,241,952 |
| System Energy Resources, Inc., 5.129%, 2014 | | 4/16/04 | | 716,972 | | 680,822 |
| Total Restricted Securities | | | | | | $6,103,952 |
| % of Net Assets | | | | | | 0.5% |
The following abbreviations are used in this report and are defined:
| ADR | | American Depository Receipt |
| FRN | | Floating Rate Note. Interest rate resets periodically and may not be the rate reported at period end. |
| REIT | | Real Estate Investment Trust |
See Notes to Financial Statements
14
FINANCIAL STATEMENTS | STATEMENT OF ASSETS AND LIABILITIES
This statement represents your fund’s balance sheet, which details the assets and liabilities comprising the total value of the fund.
| | | | | |
At 12/31/08 | | | | | |
Assets | | | | | |
Investments – | | | | | |
Non-affiliated issuers, at value (identified cost, $1,425,087,970) | | $1,301,752,089 | | | |
Underlying funds, at cost and value | | 6,582,398 | | | |
Total investments, at value, including $785,593 of securities on loan (identified cost, $1,431,670,368) | | | | | $1,308,334,487 |
Receivable for investments sold | | $1,747,458 | | | |
Receivable for fund shares sold | | 393,513 | | | |
Interest and dividends receivable | | 6,689,038 | | | |
Other assets | | 61,688 | | | |
Total assets | | | | | $1,317,226,184 |
Liabilities | | | | | |
Payable for investments purchased | | $1,556,001 | | | |
Payable for fund shares reacquired | | 1,197,801 | | | |
Collateral for securities loaned, at value | | 785,593 | | | |
Payable to affiliates | | | | | |
Management fee | | 47,748 | | | |
Distribution fees | | 9,524 | | | |
Administrative services fee | | 4,148 | | | |
Payable for trustees’ compensation | | 650 | | | |
Accrued expenses and other liabilities | | 265,195 | | | |
Total liabilities | | | | | $3,866,660 |
Net assets | | | | | $1,313,359,524 |
Net assets consist of | | | | | |
Paid-in capital | | $1,585,429,067 | | | |
Unrealized appreciation (depreciation) on investments and translation of assets and liabilities in foreign currencies | | (123,383,388 | ) | | |
Accumulated net realized gain (loss) on investments and foreign currency transactions | | (197,381,914 | ) | | |
Undistributed net investment income | | 48,695,759 | | | |
Net assets | | | | | $1,313,359,524 |
Shares of beneficial interest outstanding | | | | | 95,466,921 |
Initial Class shares | | | | | |
Net assets | | $604,842,585 | | | |
Shares outstanding | | 43,739,541 | | | |
Net asset value per share | | | | | $13.83 |
Service Class shares | | | | | |
Net assets | | $708,516,939 | | | |
Shares outstanding | | 51,727,380 | | | |
Net asset value per share | | | | | $13.70 |
See Notes to Financial Statements
15
FINANCIAL STATEMENTS | STATEMENT OF OPERATIONS
This statement describes how much your fund earned in investment income and accrued in expenses. It also describes any gains and/or losses generated by fund operations.
| | | | | | |
| Year ended 12/31/08 | | | | | | |
Net investment income | | | | | | |
Income | | | | | | |
Interest | | $37,156,875 | | | | |
Dividends | | 24,700,823 | | | | |
Dividends from underlying funds | | 15,153 | | | | |
Foreign taxes withheld | | (273,799 | ) | | | |
Total investment income | | | | | $61,599,052 | |
Expenses | | | | | | |
Management fee | | $11,056,996 | | | | |
Distribution fees | | 2,167,716 | | | | |
Administrative services fee | | 532,064 | | | | |
Trustees’ compensation | | 212,107 | | | | |
Custodian fee | | 256,209 | | | | |
Shareholder communications | | 133,687 | | | | |
Auditing fees | | 56,985 | | | | |
Legal fees | | 7,128 | | | | |
Miscellaneous | | 108,213 | | | | |
Total expenses | | | | | $14,531,105 | |
Fees paid indirectly | | (4,413 | ) | | | |
Net expenses | | | | | $14,526,692 | |
Net investment income | | | | | $47,072,360 | |
Realized and unrealized gain (loss) on investments and foreign currency transactions | | | | | | |
Realized gain (loss) (identified cost basis) | | | | | | |
Investment transactions | | $(163,485,424 | ) | | | |
Foreign currency transactions | | (6,495 | ) | | | |
Net realized gain (loss) on investments and foreign currency transactions | | | | | $(163,491,919 | ) |
Change in unrealized appreciation (depreciation) | | | | | | |
Investments | | $(280,613,496 | ) | | | |
Translation of assets and liabilities in foreign currencies | | (47,456 | ) | | | |
Net unrealized gain (loss) on investments and foreign currency translation | | | | | $(280,660,952 | ) |
Net realized and unrealized gain (loss) on investments and foreign currency | | | | | $(444,152,871 | ) |
Change in net assets from operations | | | | | $(397,080,511 | ) |
See Notes to Financial Statements
16
FINANCIAL STATEMENTS | STATEMENTS OF CHANGES IN NET ASSETS
These statements describe the increases and/or decreases in net assets resulting from operations, any distributions, and any shareholder transactions.
| | | | | | |
For years ended 12/31 | | 2008 | | | 2007 | |
Change in net assets | | | | | | |
From operations | | | | | | |
Net investment income | | $47,072,360 | | | $53,874,866 | |
Net realized gain (loss) on investments and foreign currency transactions | | (163,491,919 | ) | | 107,152,964 | |
Net unrealized gain (loss) on investments and foreign currency translation | | (280,660,952 | ) | | (71,785,163 | ) |
Change in net assets from operations | | $(397,080,511 | ) | | $89,242,667 | |
Distributions declared to shareholders | | | | | | |
From net investment income | | | | | | |
Initial Class | | $(28,220,546 | ) | | $(33,943,818 | ) |
Service Class | | (27,580,497 | ) | | (25,872,154 | ) |
From net realized gain on investments | | | | | | |
Initial Class | | (59,583,022 | ) | | (45,756,108 | ) |
Service Class | | (63,338,493 | ) | | (37,667,892 | ) |
Total distributions declared to shareholders | | $(178,722,558 | ) | | $(143,239,972 | ) |
Change in net assets from fund share transactions | | $(119,280,333 | ) | | $(51,310,929 | ) |
Total change in net assets | | $(695,083,402 | ) | | $(105,308,234 | ) |
Net assets | | | | | | |
At beginning of period | | 2,008,442,926 | | | 2,113,751,160 | |
At end of period (including undistributed net investment income of $48,695,759 and
$55,795,978, respectively) | | $1,313,359,524 | | | $2,008,442,926 | |
See Notes to Financial Statements
17
FINANCIAL STATEMENTS | FINANCIAL HIGHLIGHTS
The financial highlights table is intended to help you understand the fund’s financial performance for the past 5 years. Certain information reflects financial results for a single fund share. The total returns in the table represent the rate by which an investor would have earned (or lost) on an investment in the fund share class (assuming reinvestment of all distributions) held for the entire period.
| | | | | | | | | | | | | | | |
| Initial Class | | Years ended 12/31 | |
| | | 2008 | | | 2007 | | | 2006 | | | 2005 | | | 2004 | |
Net asset value, beginning of period | | $19.50 | | | $20.02 | | | $19.10 | | | $19.55 | | | $18.00 | |
| Income (loss) from investment operations | | | | | | | | | | | | | | | |
Net investment income (d) | | $0.49 | | | $0.53 | | | $0.54 | | | $0.48 | | | $0.48 | |
Net realized and unrealized gain (loss) on investments
and foreign currency | | (4.30 | ) | | 0.36 | | | 1.69 | | | 0.07 | | | 1.53 | |
Total from investment operations | | $(3.81 | ) | | $0.89 | | | $2.23 | | | $0.55 | | | $2.01 | |
| Less distributions declared to shareholders | | | | | | | | | | | | | | | |
From net investment income | | $(0.60 | ) | | $(0.60 | ) | | $(0.54 | ) | | $(0.51 | ) | | $(0.46 | ) |
From net realized gain on investments | | (1.26 | ) | | (0.81 | ) | | (0.77 | ) | | (0.49 | ) | | — | |
Total distributions declared to shareholders | | $(1.86 | ) | | $(1.41 | ) | | $(1.31 | ) | | $(1.00 | ) | | $(0.46 | ) |
Net asset value, end of period | | $13.83 | | | $19.50 | | | $20.02 | | | $19.10 | | | $19.55 | |
Total return (%) (k)(s) | | (21.55 | ) | | 4.32 | | | 12.22 | | | 3.02 | | | 11.47 | (b) |
Ratios (%) (to average net assets) and Supplemental data: | | | | | | | | | | | | | | | |
Expenses (f) | | 0.74 | | | 0.70 | | | 0.71 | | | 0.71 | | | 0.70 | |
Net investment income | | 2.93 | | | 2.67 | | | 2.81 | | | 2.52 | | | 2.60 | |
Portfolio turnover | | 62 | | | 60 | | | 48 | | | 42 | | | 67 | |
Net assets at end of period (000 Omitted) | | $604,843 | | | $1,013,465 | | | $1,210,549 | | | $1,370,782 | | | $1,571,550 | |
| |
| Service Class | | Years ended 12/31 | |
| | | 2008 | | | 2007 | | | 2006 | | | 2005 | | | 2004 | |
Net asset value, beginning of period | | $19.33 | | | $19.86 | | | $18.97 | | | $19.43 | | | $17.92 | |
| Income (loss) from investment operations | | | | | | | | | | | | | | | |
Net investment income (d) | | $0.44 | | | $0.48 | | | $0.49 | | | $0.43 | | | $0.43 | |
Net realized and unrealized gain (loss) on investments
and foreign currency | | (4.26 | ) | | 0.36 | | | 1.67 | | | 0.08 | | | 1.51 | |
Total from investment operations | | $(3.82 | ) | | $0.84 | | | $2.16 | | | $0.51 | | | $1.94 | |
| Less distributions declared to shareholders | | | | | | | | | | | | | | | |
From net investment income | | $(0.55 | ) | | $(0.56 | ) | | $(0.50 | ) | | $(0.48 | ) | | $(0.43 | ) |
From net realized gain on investments | | (1.26 | ) | | (0.81 | ) | | (0.77 | ) | | (0.49 | ) | | — | |
Total distributions declared to shareholders | | $(1.81 | ) | | $(1.37 | ) | | $(1.27 | ) | | $(0.97 | ) | | $(0.43 | ) |
Net asset value, end of period | | $13.70 | | | $19.33 | | | $19.86 | | | $18.97 | | | $19.43 | |
Total return (%) (k)(s) | | (21.74 | ) | | 4.07 | | | 11.91 | | | 2.81 | | | 11.14 | (b) |
Ratios (%) (to average net assets) and Supplemental data: | | | | | | | | | | | | | | | |
Expenses (f) | | 0.99 | | | 0.95 | | | 0.96 | | | 0.96 | | | 0.95 | |
Net investment income | | 2.69 | | | 2.42 | | | 2.58 | | | 2.28 | | | 2.39 | |
Portfolio turnover | | 62 | | | 60 | | | 48 | | | 42 | | | 67 | |
Net assets at end of period (000 Omitted) | | $708,517 | | | $994,977 | | | $903,202 | | | $770,453 | | | $548,069 | |
| (b) | The fund’s net asset value and total return calculation include a non-recurring accrual recorded as a result of an administrative proceeding regarding disclosure of brokerage allocation practices in connection with fund sales. The non-recurring accrual did not have a material impact on the net asset value per share based on the shares outstanding on the day the accrual was recorded. |
| (d) | Per share data are based on average shares outstanding. |
| (f) | Ratios do not reflect reductions from fees paid indirectly, if applicable. |
| (k) | The total return does not reflect expenses that apply to separate accounts. Inclusion of these charges would reduce the total return figures for all periods shown. |
| (s) | From time to time the fund may receive proceeds from litigation settlements, without which performance would be lower. |
See Notes to Financial Statements
18
NOTES TO FINANCIAL STATEMENTS
| (1) | | Business and Organization |
MFS Total Return Portfolio (the fund) is a series of MFS Variable Insurance Trust II (the trust). The trust is organized as a Massachusetts business trust and is registered under the Investment Company Act of 1940, as amended, as an open-end management investment company. The shares of the fund are sold to variable accounts established by insurance companies to fund benefits under variable contracts issued by such companies, and qualified retirement and pension plans.
| (2) | | Significant Accounting Policies |
General – The preparation of financial statements in conformity with U.S. generally accepted accounting principles requires management to make estimates and assumptions that affect the reported amounts of assets and liabilities, and disclosure of contingent assets and liabilities at the date of the financial statements and the reported amounts of revenues and expenses during the reporting period. Actual results could differ from those estimates. The fund may invest a significant portion of its assets in mortgage-backed securities. The value of mortgage-backed securities may depend, in part, on the issuer’s or borrower’s credit quality or ability to pay principal and interest when due and may fall if an issuer or borrower defaults on its obligation to pay principal or interest or if the instrument’s credit rating is downgraded by a credit rating agency. U.S. Government securities not supported as to the payment of principal or interest by the U.S. Treasury, such as those issued by Fannie Mae, Freddie Mac, and the Federal Home Loan Banks, are subject to greater credit risk than are U.S. Government securities supported by the U.S. Treasury, such as those issued by Ginnie Mae. The fund can invest in foreign securities, including securities of emerging market issuers. Investments in foreign securities are vulnerable to the effects of changes in the relative values of the local currency and the U.S. dollar and to the effects of changes in each country’s legal, political, and economic environment. The markets of emerging markets countries are generally more volatile than the markets of developed countries with more mature economies. All of the risks of investing in foreign securities previously described are heightened when investing in emerging markets countries.
In March 2008, FASB Statement No. 161, Disclosures about Derivative Instruments and Hedging Activities (the “Standard”) was issued, and is effective for financial statements issued for fiscal years and interim periods beginning after November 15, 2008. This Standard provides enhanced disclosures about the fund’s use of and accounting for derivative instruments and the effect of derivative instruments on the fund’s results of operations and financial position. Management is evaluating the application of the Standard to the fund, and has not at this time determined the impact, if any, resulting from the adoption of this Standard on the fund’s financial statements.
FASB Staff Position (FSP) 133-1 was implemented during the period. FSP 133-1 amends FAS 133 to require sellers of credit derivatives to make disclosures that will enable financial statement users to assess the potential effects of those credit derivatives on an entity’s financial position, financial performance and cash flows. There was no impact from implementing FSP 133-1 as the fund did not hold any of these credit derivatives at period end.
Investment Valuations – Equity securities, including restricted equity securities, are generally valued at the last sale or official closing price as reported by a third party pricing service on the market or exchange on which they are primarily traded. For securities for which there were no sales reported that day, equity securities are generally valued at the last quoted daily bid quotation as reported by a third party pricing service on the market or exchange on which they are primarily traded. For securities held short for which there were no sales reported for the day, the position is generally valued at the last quoted daily ask quotation as reported by a third party pricing service on the market or exchange on which such securities are primarily traded. Debt instruments and floating rate loans (other than short-term instruments), including restricted debt instruments, are generally valued at an evaluated or composite bid as reported by a third party pricing service. Open-end investment companies are generally valued at net asset value per share. Securities and other assets generally valued on the basis of information from a third party pricing service may also be valued at a broker-dealer bid quotation. Values obtained from pricing services can utilize both dealer-supplied valuations and electronic data processing techniques, which take into account factors such as institutional-size trading in similar groups of securities, yield, quality, coupon rate, maturity, type of issue, trading characteristics, and other market data. The values of foreign securities and other assets and liabilities expressed in foreign currencies are converted to U.S. dollars using the mean of bid and asked prices for rates reported by a third party pricing service.
The Board of Trustees has delegated primary responsibility for determining or causing to be determined the value of the fund’s investments (including any fair valuation) to the adviser pursuant to valuation policies and procedures approved by the Board. If the adviser determines that reliable market quotations are not readily available, investments are valued at fair value as determined in good faith by the adviser in accordance with such procedures under the oversight of the Board of Trustees. Under the fund’s valuation policies and procedures, market quotations are not considered to be readily available for most types of debt instruments and floating rate loans and many types of derivatives. These investments are generally valued at fair value based on information from third party pricing services. In addition, investments may be valued at fair value if the adviser determines that an investment’s value has been materially affected by events occurring after the close of the exchange or
19
Notes to Financial Statements – continued
market on which the investment is principally traded (such as foreign exchange or market) and prior to the determination of the fund’s net asset value, or after the halting of trading of a specific security where trading does not resume prior to the close of the exchange or market on which the security is principally traded. Events that occur on a frequent basis after foreign markets close (such as developments in foreign markets and significant movements in the U.S. markets) and prior to the determination of the fund’s net asset value may be deemed to have a material affect on the value of securities traded in foreign markets. Accordingly, the fund’s foreign equity securities may often be valued at fair value. The adviser may rely on third party pricing services or other information (such as the correlation with price movements of similar securities in the same or other markets; the type, cost and investment characteristics of the security; the business and financial condition of the issuer; and trading and other market data) to assist in determining whether to fair value and at what value to fair value an investment. The value of an investment for purposes of calculating the fund’s net asset value can differ depending on the source and method used to determine value. When fair valuation is used, the value of investments used to determine the fund’s net asset value may differ from quoted or published prices for the same investments.
The fund adopted FASB Statement No. 157, Fair Value Measurements (the “Statement”). This Statement provides a single definition of fair value, a hierarchy for measuring fair value and expanded disclosures about fair value measurements.
Various inputs are used in determining the value of the fund’s assets or liabilities carried at market value. These inputs are categorized into three broad levels. Level 1 includes quoted prices in active markets for identical assets or liabilities. Level 2 includes other significant observable market-based inputs (including quoted prices for similar securities, interest rates, prepayment speed, and credit risk). Level 3 includes unobservable inputs, which may include the adviser’s own assumptions in determining the fair value of investments. Other financial instruments are derivative instruments not reflected in total investments, such as futures, forwards, swap contracts and written options. The following is a summary of the levels used as of December 31, 2008 in valuing the fund’s assets or liabilities carried at market value:
| | | | | | | | |
| | | Level 1 | | Level 2 | | Level 3 | | Total |
| Investments in Securities | | $739,894,063 | | $568,440,424 | | $— | | $1,308,334,487 |
| Other Financial Instruments | | $— | | $— | | $— | | $— |
Repurchase Agreements – The fund may enter into repurchase agreements with approved counterparties. Each repurchase agreement is recorded at cost. The fund requires that the securities collateral in a repurchase transaction be transferred to a custodian. The fund monitors, on a daily basis, the value of the collateral to ensure that its value, including accrued interest, is greater than amounts owed to the fund under each such repurchase agreement. The fund and other funds managed by Massachusetts Financial Services Company (MFS), may utilize a joint trading account for the purpose of entering into one or more repurchase agreements.
Foreign Currency Translation – Purchases and sales of foreign investments, income, and expenses are converted into U.S. dollars based upon currency exchange rates prevailing on the respective dates of such transactions or on the reporting date for foreign denominated receivables and payables. Gains and losses attributable to foreign currency exchange rates on sales of securities are recorded for financial statement purposes as net realized gains and losses on investments. Gains and losses attributable to foreign exchange rate movements on receivables, payables, income and expenses are recorded for financial statement purposes as foreign currency transaction gains and losses. That portion of both realized and unrealized gains and losses on investments that results from fluctuations in foreign currency exchange rates is not separately disclosed.
Security Loans – State Street Bank and Trust Company (“State Street”), as lending agent, may loan the securities of the fund to certain qualified institutions (the “Borrowers”) approved by the fund. The loans are collateralized by cash and/or U.S. Treasury and federal agency obligations in an amount typically at least equal to the market value of the securities loaned. State Street provides the fund with indemnification against Borrower default. The fund bears the risk of loss with respect to the investment of cash collateral. On loans collateralized by cash, the cash collateral is invested in a money market fund or short-term securities. A portion of the income generated upon investment of the collateral is remitted to the Borrowers, and the remainder is allocated between the fund and the lending agent. On loans collateralized by U.S. Treasury and/or federal agency obligations, a fee is received from the Borrower, and is allocated between the fund and the lending agent. Income from securities lending is included in interest income on the Statement of Operations. The dividend and interest income earned on the securities loaned is accounted for in the same manner as other dividend and interest income.
Indemnifications – Under the fund’s organizational documents, its officers and trustees may be indemnified against certain liabilities and expenses arising out of the performance of their duties to the fund. Additionally, in the normal course of business, the fund enters into agreements with service providers that may contain indemnification clauses. The fund’s maximum exposure under these agreements is unknown as this would involve future claims that may be made against the fund that have not yet occurred.
Investment Transactions and Income – Investment transactions are recorded on the trade date. Interest income is recorded on the accrual basis. All premium and discount is amortized or accreted for financial statement purposes in accordance with
20
Notes to Financial Statements – continued
U.S. generally accepted accounting principles. Dividends received in cash are recorded on the ex-dividend date. Certain dividends from foreign securities will be recorded when the fund is informed of the dividend if such information is obtained subsequent to the ex-dividend date. Dividend and interest payments received in additional securities are recorded on the ex-dividend or ex-interest date in an amount equal to the value of the security on such date. The fund may receive proceeds from litigation settlements. Any proceeds received from litigation involving portfolio holdings are reflected in the Statement of Operations in realized gain/loss if the security has been disposed of by the fund or in unrealized gain/loss if the security is still held by the fund. Any other proceeds from litigation not related to portfolio holdings are reflected as other income in the Statement of Operations.
Fees Paid Indirectly – The fund’s custody fee may be reduced according to an arrangement that measures the value of cash deposited with the custodian by the fund. This amount, for the year ended December 31, 2008, is shown as a reduction of total expenses on the Statement of Operations.
Tax Matters and Distributions – The fund intends to qualify as a regulated investment company, as defined under Subchapter M of the Internal Revenue Code, and to distribute all of its taxable income, including realized capital gains. As a result, no provision for federal income tax is required. Each of the fund’s federal tax returns for the prior three fiscal years remains subject to examination by the Internal Revenue Service. Foreign taxes, if any, have been accrued by the fund in the accompanying financial statements.
Distributions to shareholders are recorded on the ex-dividend date. Income and capital gain distributions are determined in accordance with income tax regulations, which may differ from U.S. generally accepted accounting principles. Certain capital accounts in the financial statements are periodically adjusted for permanent differences in order to reflect their tax character. These adjustments have no impact on net assets or net asset value per share. Temporary differences which arise from recognizing certain items of income, expense, gain or loss in different periods for financial statement and tax purposes will reverse at some time in the future. Distributions in excess of net investment income or net realized gains are temporary overdistributions for financial statement purposes resulting from differences in the recognition or classification of income or distributions for financial statement and tax purposes.
Book/tax differences primarily relate to amortization and accretion of debt securities and wash sale loss deferrals.
The tax character of distributions declared to shareholders for the last two fiscal years is as follows:
| | | | |
| | | 12/31/08 | | 12/31/07 |
| Ordinary income (including any short-term capital gains) | | $73,730,438 | | $67,080,618 |
| Long-term capital gain | | 104,992,120 | | 76,159,354 |
| Total distributions | | $178,722,558 | | $143,239,972 |
The federal tax cost and the tax basis components of distributable earnings were as follows:
| | | |
| As of 12/31/08 | | | |
| Cost of investments | | $1,484,105,294 | |
| Gross appreciation | | 44,932,532 | |
| Gross depreciation | | (220,703,339 | ) |
| Net unrealized appreciation (depreciation) | | $(175,770,807 | ) |
| Undistributed ordinary income | | 48,695,759 | |
| Capital loss carryforwards | | (144,206,635 | ) |
| Other temporary differences | | (787,860 | ) |
As of December 31, 2008 the fund had capital loss carryforwards available to offset future realized gains. Such losses expire as follows:
Multiple Classes of Shares of Beneficial Interest – The fund offers multiple classes of shares, which differ in their respective distribution fees. The fund’s income, realized and unrealized gain (loss), and common expenses are allocated to shareholders based on the daily net assets of each class. Dividends are declared separately for each class. Differences in per share dividend rates are generally due to differences in separate class expenses.
21
Notes to Financial Statements – continued
| (3) | | Transactions with Affiliates |
Investment Adviser – The fund has an investment advisory agreement with Massachusetts Financial Services Company (MFS) to provide overall investment management and related administrative services and facilities to the fund. The management fee is computed daily and paid monthly at the following annual rates:
| | |
| First $300 million of average daily net assets | | 0.75% |
| Next $700 million of average daily net assets | | 0.675% |
| Average daily net assets in excess of $1 billion | | 0.60% |
The management fee incurred for the year ended December 31, 2008 was equivalent to an annual effective rate of 0.66% of the fund’s average daily net assets.
The investment adviser has agreed in writing to pay a portion of the funds total annual operating expenses, exclusive of interest, taxes, brokerage commissions, and extraordinary expenses, such that total annual operating expenses of the fund do not exceed 1.25% of the fund’s average daily net assets. MFS’ agreement to limit the fund’s operating expense is contained in the investment advisory agreement between MFS and the fund and may not be rescinded without shareholder approval. In addition, the investment advisor has voluntarily agreed to pay a portion of the fund’s total operating expenses, exclusive of interest, taxes, brokerage commissions and extraordinary expenses, such that the total annual operating expenses do not exceed 1.00% of the fund’s average daily net assets attributable to Initial Class shares. This voluntary agreement may be changed or rescinded at any time by MFS. For the year ended December 31, 2008, the fund’s actual operating expenses did not exceed the limit and therefore, the investment advisor did not pay a portion of the fund’s expenses.
Distributor – MFS Fund Distributors, Inc. (MFD), a wholly-owned subsidiary of MFS, is the distributor of shares of the fund. The Trustees have adopted a distribution plan for the Service Class shares pursuant to Rule 12b-1 under the Investment Company Act of 1940.
The fund’s distribution plan provides that the fund will pay MFD distribution fees equal to 0.25% per annum of its average daily net assets attributable to Service Class shares as partial consideration for services performed and expenses incurred by MFD and financial intermediaries in connection with the sale and distribution of the fund’s Service Class shares and the sale and distribution of the variable annuity or variable life insurance contracts investing indirectly in Service Class shares. MFD may subsequently pay all, or a portion, of the distribution fees to financial intermediaries.
Shareholder Servicing Agent – MFS Service Center, Inc. (MFSC), a wholly-owned subsidiary of MFS, has contracted to provide transfer agent and recordkeeping functions in connection with the issuance, transfer, and redemption of each class of shares of the fund under a Shareholder Servicing Agent Agreement. During the year ended December 31, 2008, the fund did not pay MFSC a fee for this service.
Administrator – MFS provides certain financial, legal, shareholder communications, compliance, and other administrative services to the fund. Under an administrative services agreement, the fund partially reimburses MFS the costs incurred to provide these services. The fund is charged an annual fixed amount of $10,000 plus a fee based on average daily net assets.
The administrative services fee incurred for the year ended December 31, 2008 was equivalent to an annual effective rate of 0.0317% of the fund’s average daily net assets.
Trustees’ and Officers’ Compensation – The fund pays compensation to trustees in the form of a retainer, attendance fees, and additional compensation to the Board chairperson. The fund does not pay compensation directly to officers of the fund who are also officers of the investment adviser, all of whom receive remuneration for their services to the fund from MFS. Certain officers of the fund are officers or directors of MFS, MFD, and MFSC.
Other – This fund and certain other MFS funds (the funds) have entered into services agreements (the Agreements) which provide for payment of fees by the funds to Tarantino LLC and Griffin Compliance LLC in return for the provision of services of an Independent Chief Compliance Officer (ICCO) and Assistant ICCO, respectively, for the funds. The ICCO and Assistant ICCO are officers of the funds and the sole members of Tarantino LLC and Griffin Compliance LLC, respectively. The funds can terminate the Agreements with Tarantino LLC and Griffin Compliance LLC at any time under the terms of the Agreements. MFS has agreed to bear all expenses associated with office space, other administrative support, and supplies provided to the ICCO and Assistant ICCO. For the year ended December 31, 2008, the aggregate fees paid by the fund to Tarantino LLC and Griffin Compliance LLC were $16,122 and are included in miscellaneous expense on the Statement of Operations.
The fund may invest in a money market fund managed by MFS which seeks a high level of current income consistent with preservation of capital and liquidity. Income earned on this investment is included in dividends from underlying funds on the Statement of Operations. This money market fund does not pay a management fee to MFS.
22
Notes to Financial Statements – continued
Purchases and sales of investments, other than purchased option transactions and short-term obligations, were as follows:
| | | | |
| | | Purchases | | Sales |
| U.S. Government securities | | $269,022,307 | | $454,588,346 |
| Investments (non-U.S. Government securities) | | $769,587,782 | | $811,963,156 |
| (5) | | Shares of Beneficial Interest |
The fund’s Declaration of Trust permits the Trustees to issue an unlimited number of full and fractional shares of beneficial interest. Transactions in fund shares were as follows:
| | | | | | | | | | | | |
| | | Year ended 12/31/08 | | | Year ended 12/31/07 | |
| | | Shares | | | Amount | | | Shares | | | Amount | |
| Shares sold | | | | | | | | | | | | |
Initial Class | | 598,498 | | | $9,249,450 | | | 413,104 | | | $8,334,688 | |
Service Class | | 2,358,542 | | | 40,099,814 | | | 5,705,441 | | | 112,652,944 | |
| | 2,957,040 | | | $49,349,264 | | | 6,118,545 | | | $120,987,632 | |
| Shares issued to shareholders in reinvestment of distributions | | | | | | | | | | | | |
Initial Class | | 5,025,963 | | | $87,803,568 | | | 4,011,068 | | | $79,699,926 | |
Service Class | | 5,246,335 | | | 90,918,990 | | | 3,220,479 | | | 63,540,046 | |
| | 10,272,298 | | | $178,722,558 | | | 7,231,547 | | | $143,239,972 | |
| Shares reacquired | | | | | | | | | | | | |
Initial Class | | (13,854,343 | ) | | $(227,889,998 | ) | | (12,933,693 | ) | | $(257,546,785 | ) |
Service Class | | (7,348,557 | ) | | (119,462,157 | ) | | (2,937,252 | ) | | (57,991,748 | ) |
| | (21,202,900 | ) | | $(347,352,155 | ) | | (15,870,945 | ) | | $(315,538,533 | ) |
| Net change | | | | | | | | | | | | |
Initial Class | | (8,229,882 | ) | | $(130,836,980 | ) | | (8,509,521 | ) | | $(169,512,171 | ) |
Service Class | | 256,320 | | | 11,556,647 | | | 5,988,668 | | | 118,201,242 | |
| | (7,973,562 | ) | | $(119,280,333 | ) | | (2,520,853 | ) | | $(51,310,929 | ) |
The fund and other funds managed by MFS participate in a $1 billion unsecured committed line of credit provided by a syndication of banks under a credit agreement. In addition, the fund and other funds managed by MFS have established uncommitted borrowing arrangements with certain banks. Borrowings may be made for temporary financing needs. Interest is charged to each fund, based on its borrowings, generally at a rate equal to the Federal Reserve funds rate plus 0.30%. In addition, a commitment fee, based on the average daily, unused portion of the committed line of credit, is allocated among the participating funds at the end of each calendar quarter. For the year ended December 31, 2008, the fund’s commitment fee and interest expense were $8,621 and $0, respectively, and are included in miscellaneous expense on the Statement of Operations.
| (7) | | Transactions in Underlying Funds – Affiliated Issuers |
An affiliated issuer may be considered one in which the fund owns 5% or more of the outstanding voting securities, or a company which is under common control. For the purposes of this report, the fund assumes the following to be affiliated issuers:
| | | | | | | | | |
| Underlying Funds | | Beginning
Shares/Par
Amount | | Acquisitions
Shares/Par
Amount | | Dispositions
Shares/Par
Amount | | | Ending
Shares/Par
Amount |
| MFS Institutional Money Market Portfolio | | — | | 12,705,055 | | (6,122,657 | ) | | 6,582,398 |
| | | | |
| Underlying Funds | | Realized
Gain (Loss) | | Capital Gain
Distributions | | Dividend
Income | | | Ending
Value |
| MFS Institutional Money Market Portfolio | | $— | | $— | | $15,153 | | | $6,582,398 |
23
REPORT OF INDEPENDENT REGISTERED PUBLIC ACCOUNTING FIRM
To the Board of Trustees of MFS Variable Insurance Trust II and the Shareholders of
MFS Total Return Portfolio:
We have audited the accompanying statement of assets and liabilities, including the portfolio of investments, of MFS Total Return Portfolio (the “Fund”) (one of the portfolios comprising MFS Variable Insurance Trust II) as of December 31, 2008, and the related statement of operations for the year then ended, the statements of changes in net assets for each of the two years in the period then ended, and the financial highlights for each of the five years in the period then ended. These financial statements and financial highlights are the responsibility of the Fund’s management. Our responsibility is to express an opinion on these financial statements and financial highlights based on our audits.
We conducted our audits in accordance with the standards of the Public Company Accounting Oversight Board (United States). Those standards require that we plan and perform the audit to obtain reasonable assurance about whether the financial statements and financial highlights are free of material misstatement. The Fund is not required to have, nor were we engaged to perform, an audit of its internal control over financial reporting. Our audits included consideration of internal control over financial reporting as a basis for designing audit procedures that are appropriate in the circumstances, but not for the purpose of expressing an opinion on the effectiveness of the Fund’s internal control over financial reporting. Accordingly, we express no such opinion. An audit also includes examining, on a test basis, evidence supporting the amounts and disclosures in the financial statements, assessing the accounting principles used and significant estimates made by management, as well as evaluating the overall financial statement presentation. Our procedures included confirmation of securities owned as of December 31, 2008, by correspondence with the custodian and brokers; where replies were not received from brokers, we performed other auditing procedures. We believe that our audits provide a reasonable basis for our opinion.
In our opinion, such financial statements and financial highlights present fairly, in all material respects, the financial position of MFS Total Return Portfolio as of December 31, 2008, the results of its operations for the year then ended, the changes in its net assets for each of the two years in the period then ended, and the financial highlights for each of the five years in the period then ended, in conformity with accounting principles generally accepted in the United States of America.
DELOITTE & TOUCHE LLP
Boston, Massachusetts
February 19, 2009
24
TRUSTEES AND OFFICERS – IDENTIFICATION AND BACKGROUND
The Trustees and officers of the Trust, as of February 1, 2009, are listed below, together with their principal occupations during the past five years. (Their titles may have varied during that period.) The address of each Trustee and officer is 500 Boylston Street, Boston, Massachusetts 02116.
| | | | | | |
Name, Date of Birth | | Position(s) Held
with Fund | | Trustee/Officer
Since (1) | | Principal Occupations During the Past Five Years and
Other Directorships (2) |
| INTERESTED TRUSTEE | | | | |
David D. Horn (3) (born 6/07/41) | | Trustee | | April 1986 | | Private investor; Sun Life Assurance Company of Canada, Senior Vice President and General Manager for the United States (until 1997); Director (until March 2004) |
| | |
| INDEPENDENT TRUSTEES | | | | |
J. Kermit Birchfield (born 1/08/40) | | Chairman | | May 1997 | | Consultant; Century Partners, Inc. (investments), Director; Displaytech, Inc. (technology), Director; Dessin Fournir LLC (furniture manufacturer), Director (2005 to present); Intermountain Gas Company, Inc. & Intermountain Industries, Inc. (oil & gas exploration and production), Director; Site Watch LLC (software to monitor oil tanks), Managing Director (2006 to present); Juridica Investments (fund investing in judicial matters), Director (2007 to present); HPSC, Inc. (medical financing), Director (until January 2004) |
| | | |
Robert C. Bishop (born 1/13/43) | | Trustee | | May 2001 | | AutoImmune, Inc. (pharmaceutical product development), Chairman, President and Chief Executive Officer; Caliper Life Sciences Corp. (laboratory analytical instruments), Director; Millipore Corporation (purification/filtration products), Director; Waterstreet Capital (leverage buyouts), Advisory Board (August 2006 to present); Optobionics Corporation (ophthalmic devices), Director (2002 to 2007) |
| | | |
Frederick H. Dulles (born 3/12/42) | | Trustee | | May 2001 | | Ten State International Law PLLC (law firm), Of Counsel (since 2006); Prudential Carolina Real Estate, (real estate), Broker (since 2006); Free Enterprise Foundation, Inc. (research institute), Director & Secretary (until 2008); Disher, Hamrick & Myers Residential, Inc. (real estate) Broker (2005 until 2006); Frederick H. Dulles law practice (until 2006); Ten State Street LLP (law firm), Member (until 2005) |
| | | |
Marcia A. Kean (born 6/30/48) | | Trustee | | April 2005 | | Feinstein Kean Healthcare (consulting), Chief Executive Officer |
| | | |
Ronald G. Steinhart (born 6/15/40) | | Trustee | | May 2001 | | Private investor; Penske Automotive Group (automotive retailer), Director; Animal Health International, Inc. (animal health products), Director (since 2007); Texas Industries (concrete/aggregates/cement), Director (since 2007); Penson Worldwide, Inc. (securities clearance), Director (since 2006); Carreker Corporation (technology consulting) Director (until 2005); Prentiss Properties Trust (real estate investment trust), Director (until 2006) |
| | | |
Haviland Wright (born 7/21/48) | | Trustee | | May 2001 | | Profitability of Hawaii (software), Chief Development Officer (since December 2008); Elixir Technologies Corporation (software) Director (since 2005); Nano Loa Inc. (liquid crystal displays), Director |
| | |
| TRUSTEE EMERITUS | | | | |
Samuel Adams (born 10/19/25) | | Trustee Emeritus | | | | Retired; K&L Gates LLP (law firm), Of Counsel |
| | |
| OFFICERS | | | | |
Maria F. Dwyer (4) (born 12/01/58) | | President | | November 2005 | | Massachusetts Financial Services Company, Executive Vice President and Chief Regulatory Officer (since March 2004) Chief Compliance Officer (since December 2006); Fidelity Management & Research Company, Vice President (prior to March 2004); Fidelity Group of Funds, President and Treasurer (until March 2004) |
| | | |
Christopher R. Bohane (4) (born 1/18/74) | | Assistant Secretary and Assistant Clerk | | July 2005 | | Massachusetts Financial Services Company, Vice President and Senior Counsel |
| | | |
John M. Corcoran (4) (born 4/13/65) | | Treasurer | | October 2008 | | Massachusetts Financial Services Company, Senior Vice President (since October 2008); State Street Bank and Trust (financial services provider), Senior Vice President, (until September 2008) |
| | | |
Ethan D. Corey (4) (born 11/21/63) | | Assistant Secretary and Assistant Clerk | | July 2005 | | Massachusetts Financial Services Company, Senior Vice President and Associate General Counsel (since 2004); Dechert LLP (law firm), Counsel (prior to December 2004) |
| | | |
David L. DiLorenzo (4) (born 8/10/68) | | Assistant Treasurer | | July 2005 | | Massachusetts Financial Services Company, Vice President (since June 2005); JP Morgan Investor Services, Vice President (until June 2005) |
| | | |
Timothy M. Fagan (4) (born 7/10/68) | | Assistant Secretary and Assistant Clerk | | September 2005 | | Massachusetts Financial Services Company, Vice President and Senior Counsel (since September 2005); John Hancock Advisers, LLC, Vice President, Senior Attorney and Chief Compliance Officer (until August 2005) |
| | | |
Mark D. Fischer (4) (born 10/27/70) | | Assistant Treasurer | | July 2005 | | Massachusetts Financial Services Company, Vice President (since May 2005); JP Morgan Investment Management Company, Vice President (until May 2005) |
25
Trustees and Officers – continued
| | | | | | |
Name, Date of Birth | | Position(s) Held
with Fund | | Trustee/Officer
Since (1) | | Principal Occupations During the Past Five Years and
Other Directorships (2) |
Robyn L. Griffin (born 7/04/75) | | Assistant Independent Chief Compliance Officer | | August 2008 | | Griffin Compliance LLC (provider of compliance services), Principal (since August 2008); State Street Corporation (financial services provider), Mutual Fund Administration Assistant Vice President (October 2006 – July 2008); Liberty Mutual Group (insurance), Personal Market Assistant Controller (April 2006 – October 2006); Deloitte & Touche LLP (professional services firm), Senior Manager (prior to April 2006) |
| | | |
Brian E. Langenfeld (4) (born 3/07/73) | | Assistant Secretary and Assistant Clerk | | May 2006 | | Massachusetts Financial Services Company, Vice President and Senior Counsel (since May 2006); John Hancock Advisers, LLC, Assistant Vice President and Counsel (until April 2006) |
| | | |
Ellen Moynihan (4) (born 11/13/57) | | Assistant Treasurer | | May 1997 | | Massachusetts Financial Services Company, Senior Vice President |
| | | |
Susan S. Newton (4) (born 3/07/50) | | Assistant Secretary and Assistant Clerk | | May 2005 | | Massachusetts Financial Services Company, Senior Vice President and Associate General Counsel (since April 2005); John Hancock Advisers, LLC, Senior Vice President, Secretary and Chief Legal Officer (until April 2005) |
| | | |
Susan A. Pereira (4) (born 11/05/70) | | Assistant Secretary and Assistant Clerk | | July 2005 | | Massachusetts Financial Services Company, Vice President and Senior Counsel (since June 2004); Bingham McCutchen LLP (law firm), Associate (until June 2004) |
| | | |
Mark N. Polebaum (4) (born 5/01/52) | | Secretary and Clerk | | February 2006 | | Massachusetts Financial Services Company, Executive Vice President, General Counsel and Secretary (since January 2006); Wilmer Cutler Pickering Hale and Dorr LLP (law firm), Partner (until January 2006) |
| | | |
Frank L. Tarantino (born 3/07/44) | | Independent Chief Compliance Officer | | September 2004 | | Tarantino LLC (provider of compliance services), Principal (since June 2004); CRA Business Strategies Group (consulting services), Executive Vice President (until June 2004) |
| | | |
Richard S. Weitzel (4) (born 7/16/70) | | Assistant Secretary and Assistant Clerk | | October 2007 | | Massachusetts Financial Services Company, Vice President and Assistant General Counsel (since 2004); Massachusetts Department of Business and Technology, General Counsel (until April 2004) |
| | | |
James O. Yost (4) (born 6/12/60) | | Assistant Treasurer | | April 1992 | | Massachusetts Financial Services Company, Senior Vice President |
| (1) | Date first appointed to serve as Trustee/Officer of an MFS fund or a Compass variable account. Each Trustee has served continuously since appointment. |
| (2) | Directorships or trusteeships of companies required to report to the Securities and Exchange Commission (i.e., “public companies”). |
| (3) | “Interested person” of the Trust, within the meaning of the Investment Company Act of 1940 (referred to as the 1940 Act), which is the principal federal law governing investment companies like the Trust, as a result of position with Sun Life of Canada (U.S.). The address of Sun Life of Canada (U.S.) is One Sun Life Executive Park, Wellesley Hills, Massachusetts 02481. |
| (4) | “Interested person” of MFS within the meaning of the 1940 Act. The address of MFS is 500 Boylston Street, Boston, Massachusetts 02116. |
The Trust does not hold annual meetings for the purpose of electing Trustees, and Trustees are not elected for fixed terms. Each Trustee and officer holds office until his or her successor is chosen and qualified, or until his or her earlier death, resignation, retirement or removal.
All Trustees currently serve as Trustees of the Trust and have served in that capacity since originally elected or appointed. All of the Trustees are also Managers of the Compass Variable Accounts. The executive officers of the Trust hold similar offices for the Compass Variable Accounts and other funds in the MFS fund complex. As of January 1, 2009, each Trustee serves as a Trustee or Manager of 35 Accounts/Funds.
The Statement of Additional Information contains further information about the Trustees and is available without charge upon request by calling 1-800-752-7215.
| | |
Investment Adviser
Massachusetts Financial Services Company 500 Boylston Street, Boston, MA 02116-3741 | | Custodian State Street Bank and Trust 1 Lincoln Street, Boston, MA 02111-2900 |
Distributor
MFS Fund Distributors, Inc. 500 Boylston Street, Boston, MA 02116-3741 | | Independent Registered Public Accounting Firm Deloitte & Touche LLP 200 Berkeley Street, Boston, MA 02116 |
Portfolio Managers Nevin Chitkara William Douglas Steven Gorham Richard Hawkins Joshua Marston Michael Roberge Brooks Taylor | | |
26
BOARD REVIEW OF INVESTMENT ADVISORY AGREEMENT
The Investment Company Act of 1940 requires that both the full Board of Trustees and a majority of the non-interested (“independent”) Trustees, voting separately, annually approve the continuation of the investment advisory agreement between MFS Variable Insurance Trust II (the “Trust”) and Massachusetts Financial Services Company (“MFS”) on behalf of the Fund. The Trustees consider matters bearing on the Fund and the advisory arrangements at their meetings throughout the year, including a review of performance data at each regular meeting. In addition, the independent Trustees met in May and again in July 2008 (“contract review meetings”) for the specific purpose of considering whether to approve the continuation of the investment advisory agreement for the Fund. The independent Trustees were assisted in their evaluation of the investment advisory agreement by independent legal counsel, from whom they received separate legal advice and with whom they met separately from MFS management during various contract review meetings. The independent Trustees were also assisted in this process by the Fund’s Independent Chief Compliance Officer, a full-time senior officer appointed by and reporting to the independent Trustees.
In connection with their deliberations, the Trustees, including the independent Trustees, considered such information and factors as they believed, in light of the legal advice furnished to them and their own business judgment, to be relevant. The investment advisory agreement was considered separately for the Fund, although the Trustees also took into account the common interests of all Funds in the Trust in their review. As described below, the Trustees considered the nature, quality, and extent of the various investment advisory, administrative, and shareholder services performed by MFS under the existing investment advisory agreement and other arrangements with the Trust.
In connection with their contract review meetings, the Trustees received and relied upon materials which included, among other items: (i) information provided by Lipper Inc. on the investment performance of the Fund for various time periods ended December 31, 2007, compared to the investment performance of a group of funds with substantially similar investment classifications/objectives (the “Lipper performance universe”), (ii) information provided by Lipper Inc. on the Fund’s advisory fees and other expenses compared to the advisory fees and other expenses of comparable funds identified by Lipper (the “Lipper expense group”), (iii) information provided by MFS on the advisory fees of comparable portfolios of its other clients, including institutional separate account and other clients, (iv) information as to whether expense waivers, reimbursements or fee “breakpoints” are observed for the Fund, (v) information regarding MFS’ financial results and financial condition, including MFS’ and certain of its affiliates’ estimated profitability from services performed for the Fund, (vi) MFS’ views regarding the outlook for the mutual fund industry and its strategic business plans, (vii) descriptions of various functions performed by MFS for the Trust, such as compliance monitoring and portfolio trading practices, and (viii) information regarding the overall organization of MFS, including information about MFS’ senior management and other personnel providing investment advisory, administrative and other services to the Fund. The comparative performance, fee and expense information prepared and provided by Lipper Inc. was not independently verified, and the independent Trustees did not independently verify any information provided to them by MFS.
The Trustees’ conclusion as to the continuation of the investment advisory agreement was based on comprehensive consideration of all information provided to the Trustees and not the result of any single factor. Some of the factors that figured particularly in the Trustees’ deliberations are described below for the Fund, while individual Trustees may have given different weight to various factors and evaluated the information presented as a whole differently than another Trustee. The Trustees recognized that the fee arrangements for the Fund reflect years of review and discussion between the independent Trustees and MFS, that certain aspects of such arrangements may receive greater scrutiny in some years than others, and that the Trustees’ conclusions may be based, in part, on their consideration of these same arrangements during the course of the year and in prior years.
Based on information provided by Lipper Inc., the Trustees compared the Fund’s total return investment performance to the performance of a peer group of funds over various time periods. The Trustees placed particular emphasis on the total return performance of the Fund’s Initial Class shares in comparison to the performance of funds in its Lipper performance universe over the one-, three- and five-year periods. The Trustees did not rely on performance results for more recent periods, including those shown elsewhere in this report.
The Trustees noted the performance of the Fund’s Initial Class shares was in the 4th quintile relative to the other funds in the Lipper Classification Index for the one-year period (the 1st quintile being the best performers and the 5th quintile being the worst performers). The total return performance of the Fund was in the 4th quintile for the three-year period and the 3rd quintile for the five-year period ended December 31, 2007, relative to the Lipper performance universe. Based on the nature and quality of services provided by MFS, the Board of Trustees concluded that the Fund’s performance was adequate.
In the course of their deliberations, the Trustees took into account information provided by MFS during contract review meetings, as well as during investment review meetings conducted with portfolio management personnel during the course of the year.
27
Board Review of Investment Advisory Agreement – continued
In assessing the reasonableness of the Fund’s advisory fee, the Trustees considered, among other information, the Fund’s advisory fee and the total expense ratio of the Fund’s Initial Class shares as a percentage of average daily net assets, compared to the advisory fee and total expense ratios of its peer group of funds based on information provided by Lipper Inc. The Trustees also considered the advisory fees charged by MFS to institutional accounts. In comparing these fees, the Trustees considered the generally broader scope of services provided by MFS to the Trust than those provided to institutional accounts. The Trustees also considered the higher demands placed on MFS’ investment personnel and trading infrastructure as a result of the daily cash in-flows and out-flows of the Fund, and the impact on MFS and related expenses due to the more extensive regulatory regime to which the Fund is subject, compared to institutional accounts.
In considering the fees, the Trustees noted from the Lipper data that the Fund’s effective advisory fee rate and total expense ratio were each above the median of such fees and expenses of funds in the Lipper expense group. In addition, the Trustees noted MFS currently observes an expense limitation for the Fund. The Trustees further concluded that the existing breakpoints were sufficient to allow the Fund to benefit from economies of scale as its assets grow. The Trustees concluded that the fees were reasonable in light of the nature and quality of services provided.
The Trustees also considered information prepared by MFS relating to its costs and profits with respect to the Fund and other investment companies and accounts advised by MFS, as well as MFS’ methodologies used to determine and allocate its costs to the Fund and other accounts and products for purposes of estimating profitability.
After reviewing these and other factors described below, the Trustees concluded that the advisory fees charged to the Fund represent reasonable compensation in light of the nature and quality of the services being provided by MFS.
In addition, the Trustees considered MFS’ resources and related efforts to continue to retain, attract and motivate capable personnel to serve the Fund. The Trustees also considered the financial resources of MFS and its parent, Sun Life Financial Inc. The Trustees further considered any advantages and possible disadvantages of having an adviser which also serves other investment companies as well as institutional accounts.
The Trustees also considered the nature, quality, cost, and extent of administrative, transfer agency, and distribution services provided to the Fund by MFS and its affiliates under agreements and plans other than the investment advisory agreement, including the 12b-1 fees the Fund pays to MFS Fund Distributors, Inc., an affiliate of MFS. The Trustees also considered the nature, extent and quality of certain other services MFS performs or arranges on the Fund’s behalf, which may include securities lending programs, directed expense payment programs, class action recovery programs, and MFS’ interaction with third-party service providers, principally custodians and sub-custodians. The Trustees concluded that the various non-advisory services provided by MFS and its affiliates on behalf of the Fund were satisfactory. The Trustees also considered the benefits to MFS from the use of the Fund’s portfolio brokerage commissions to pay for research and other similar services and various other factors. Additionally, the Trustees considered so-called “fall-out benefits” to MFS such as reputational value derived from serving as investment manager to the Trust, and determined that any such benefits derived by MFS were reasonable and fair.
Based on their evaluation of factors that they deemed to be material, including those factors described above, the Board of Trustees, including a majority of the independent Trustees, concluded that the investment advisory agreement should be continued for an additional one-year period, commencing September 1, 2008.
A discussion regarding the Board’s most recent review and renewal of the fund’s Investment Advisory Agreement with MFS is available by clicking on the fund’s name under “Variable Insurance Portfolios-VIT II” in the “Products and Performance” section of the MFS Web site (mfs.com).
28
PROXY VOTING POLICIES AND INFORMATION
A general description of the MFS funds’ proxy voting policies and procedures is available without charge, upon request, by calling 1-800-225-2606, by visiting the Proxy Voting section of mfs.com or by visiting the SEC’s Web site at http://www.sec.gov.
Information regarding how the fund voted proxies relating to portfolio securities during the most recent twelve-month period ended June 30 is available without charge by visiting the Proxy Voting section of mfs.com or by visiting the SEC’s Web site at http://www.sec.gov.
QUARTERLY PORTFOLIO DISCLOSURE
The fund will file a complete schedule of portfolio holdings with the Securities and Exchange Commission (the Commission) for the first and third quarters of each fiscal year on Form N-Q. The fund’s Form N-Q may be reviewed and copied at the:
Public Reference Room
Securities and Exchange Commission
100 F Street, NE, Room 1580
Washington, D.C. 20549
Information on the operation of the Public Reference Room may be obtained by calling the Commission at 1-800-SEC-0330. The fund’s Form N-Q is available on the EDGAR database on the Commission’s Internet Web site at http://www.sec.gov, and copies of this information may be obtained, upon payment of a duplicating fee, by electronic request at the following e-mail address: publicinfo@sec.gov or by writing the Public Reference Section at the above address.
FEDERAL TAX INFORMATION (unaudited)
The following information is provided pursuant to provisions of the Internal Revenue Code.
The fund designates $104,992,120 as capital gain dividends paid during the fiscal year.
For corporate shareholders, 27.00% of the ordinary income dividends paid during the fiscal year qualify for the corporate dividends received deduction.
29
MFS® PRIVACY NOTICE
Privacy is a concern for every investor today. At MFS Investment Management® and the MFS funds, we take this concern very seriously. We want you to understand our policies about the investment products and services that we offer, and how we protect the nonpublic personal information of investors who have a direct relationship with us and our wholly owned subsidiaries.
Throughout our business relationship, you provide us with personal information. We maintain information and records about you, your investments, and the services you use. Examples of the nonpublic personal information we maintain include
| | Ÿ | | data from investment applications and other forms |
| | Ÿ | | share balances and transactional history with us, our affiliates, or others |
| | Ÿ | | facts from a consumer reporting agency |
We do not disclose any nonpublic personal information about our customers or former customers to anyone, except as permitted by law. We may share nonpublic personal information with third parties or certain of our affiliates in connection with servicing your account or processing your transactions. We may share information with companies or financial institutions that perform marketing services on our behalf or with other financial institutions with which we have joint marketing arrangements, subject to any legal requirements.
Authorization to access your nonpublic personal information is limited to appropriate personnel who provide products, services, or information to you. We maintain physical, electronic, and procedural safeguards to help protect the personal information we collect about you.
If you have any questions about the MFS privacy policy, please call 1-800-225-2606 any business day between 8 a.m. and 8 p.m. Eastern time.
Note: If you own MFS products or receive MFS services in the name of a third party such as a bank or broker-dealer, their privacy policy may apply to you instead of ours.
30

The Registrant has adopted a Code of Ethics pursuant to Section 406 of the Sarbanes-Oxley Act and as defined in Form N-CSR that applies to the Registrant’s principal executive officer and principal financial and accounting officer. The Registrant has not amended any provision in its Code of Ethics (the “Code”) that relates to an element of the Code’s definitions enumerated in paragraph (b) of Item 2 of this Form N-CSR.
A copy of the Code of Ethics is filed as an exhibit to this Form N-CSR.
| ITEM 3. | AUDIT COMMITTEE FINANCIAL EXPERT. |
Messrs. J. Kermit Birchfield, Robert C. Bishop, Ronald G. Steinhart and Haviland Wright, members of the Audit Committee, have been determined by the Board of Trustees in their reasonable business judgment to meet the definition of “audit committee financial expert” as such term is defined in Form N-CSR. In addition, Messrs. J. Kermit Birchfield, Robert C. Bishop, Ronald G. Steinhart and Haviland Wright are “independent” members of the Audit Committee as defined in Form N-CSR.
| ITEM 4. | PRINCIPAL ACCOUNTANT FEES AND SERVICES. |
Items 4(a) through 4(d) and 4(g):
The Board of Trustees has appointed Deloitte & Touche LLP (“Deloitte”) to serve as independent accountants to each series of the Registrant (collectively, the “Funds”). The tables below set forth the audit fees billed to the Funds as well as fees for non-audit services provided to the Funds and/or to the Funds’ investment adviser, Massachusetts Financial Services Company (“MFS”) and to various entities either controlling, controlled by, or under common control with MFS that provide ongoing services to the Funds (“MFS Related Entities”).
For the fiscal years ended December 31, 2008 and 2007, audit fees billed to the Funds by Deloitte were as follows:
| | | | |
| | | Audit Fees |
| | | 2008 | | 2007 |
Fees billed by Deloitte: | | | | |
MFS Blended Research Core Equity Portfolio | | 37,781 | | 34,762 |
MFS Blended Research Growth Portfolio+ | | 37,703 | | 12,600 |
MFS Blended Research Value Portfolio+ | | 37,703 | | 12,600 |
MFS Bond Portfolio | | 50,868 | | 47,319 |
MFS Capital Appreciation Portfolio | | 36,171 | | 34,762 |
MFS Core Equity Portfolio | | 39,785 | | 36,612 |
| | | | |
MFS Emerging Growth Portfolio | | 36,854 | | 35,422 |
MFS Emerging Markets Equity Portfolio | | 39,922 | | 36,744 |
MFS Global Governments Portfolio | | 49,168 | | 47,319 |
MFS Global Growth Portfolio | | 48,816 | | 45,337 |
MFS Global Total Return Portfolio | | 48,816 | | 45,337 |
MFS Government Securities Portfolio | | 43,343 | | 40,049 |
MFS High Yield Portfolio | | 52,424 | | 45,337 |
MFS International Growth Portfolio | | 39,922 | | 36,744 |
MFS International Value Portfolio | | 40,607 | | 37,406 |
MFS Massachusetts Investors Growth Stock Portfolio | | 38,085 | | 36,612 |
MFS Mid Cap Growth Portfolio | | 36,171 | | 34,762 |
MFS Mid Cap Value Portfolio | | 38,907 | | 37,406 |
MFS Money Market Portfolio | | 21,804 | | 20,881 |
MFS New Discovery Portfolio | | 36,171 | | 34,762 |
MFS Research International Portfolio | | 37,871 | | 34,762 |
MFS Research Portfolio | | 36,854 | | 35,422 |
MFS Strategic Income Portfolio | | 37,836 | | 34,762 |
MFS Strategic Value Portfolio | | 38,907 | | 37,406 |
MFS Technology Portfolio | | 36,171 | | 34,762 |
MFS Total Return Portfolio | | 50,868 | | 47,319 |
MFS Utilities Portfolio | | 37,871 | | 34,762 |
MFS Value Portfolio | | 37,871 | | 34,761 |
Total | | 1,125,270 | | 1,007,945 |
For the fiscal years ended December 31, 2008 and 2007, fees billed by Deloitte for audit-related, tax and other services provided to the Funds and for audit-related, tax and other services provided to MFS and MFS Related Entities were as follows:
| | | | | | | | | | | | |
| | | Audit-Related Fees1 | | Tax Fees2 | | All Other Fees4 |
| | | 2008 | | 2007 | | 2008 | | 2007 | | 2008 | | 2007 |
Fees billed by Deloitte: | | | | | | | | | | | | |
To MFS Blended Research Core Equity Portfolio | | 0 | | 0 | | 4,124 | | 3,985 | | 2,815 | | 1,138 |
To MFS Blended Research Growth Portfolio+ | | 0 | | 0 | | 4,776 | | 2,400 | | 2,815 | | 1,138 |
To MFS Blended Research Value Portfolio+ | | 0 | | 0 | | 4,776 | | 2,400 | | 2,815 | | 1,138 |
To MFS Bond Portfolio | | 0 | | 0 | | 4,124 | | 3,985 | | 4,080 | | 1,138 |
To MFS Capital Appreciation Portfolio | | 0 | | 0 | | 4,124 | | 3,985 | | 1,115 | | 1,138 |
To MFS Core Equity Portfolio | | 0 | | 0 | | 4,124 | | 3,985 | | 2,815 | | 1,138 |
| | | | | | | | | | | | |
To MFS Emerging Growth Portfolio | | 0 | | 0 | | 4,124 | | 3,985 | | 1,115 | | 1,138 |
To MFS Emerging Markets Equity Portfolio | | 0 | | 0 | | 4,124 | | 3,985 | | 2,815 | | 1,138 |
To MFS Global Governments Portfolio | | 0 | | 0 | | 4,124 | | 3,985 | | 1,115 | | 1,138 |
To MFS Global Growth Portfolio | | 0 | | 0 | | 4,124 | | 3,985 | | 2,815 | | 1,138 |
To MFS Global Total Return Portfolio | | 0 | | 0 | | 4,124 | | 3,985 | | 2,815 | | 1,138 |
To MFS Government Securities Portfolio | | 0 | | 0 | | 4,124 | | 3,985 | | 2,815 | | 1,138 |
To MFS High Yield Portfolio | | 0 | | 0 | | 4,124 | | 3,985 | | 5,115 | | 1,138 |
To MFS International Growth Portfolio | | 0 | | 0 | | 4,124 | | 3,985 | | 2,815 | | 1,138 |
To MFS International Value Portfolio | | 0 | | 0 | | 4,124 | | 3,985 | | 2,815 | | 1,138 |
To MFS Massachusetts Investors Growth Stock Portfolio | | 0 | | 0 | | 4,124 | | 3,985 | | 1,115 | | 1,138 |
To MFS Mid Cap Growth Portfolio | | 0 | | 0 | | 4,124 | | 3,985 | | 1,115 | | 1,138 |
To MFS Mid Cap Value Portfolio | | 0 | | 0 | | 4,124 | | 3,985 | | 1,115 | | 1,138 |
To MFS Money Market Portfolio | | 0 | | 0 | | 4,124 | | 3,985 | | 1,115 | | 1,138 |
To MFS New Discovery Portfolio | | 0 | | 0 | | 4,124 | | 3,985 | | 1,115 | | 1,138 |
To MFS Research International Portfolio | | 0 | | 0 | | 4,124 | | 3,985 | | 2,815 | | 1,138 |
To MFS Research Portfolio | | 0 | | 0 | | 4,124 | | 3,985 | | 1,115 | | 1,138 |
To MFS Strategic Income Portfolio | | 0 | | 0 | | 4,124 | | 3,985 | | 2,380 | | 1,138 |
To MFS Strategic Value Portfolio | | 0 | | 0 | | 4,124 | | 3,985 | | 1,115 | | 1,138 |
To MFS Technology Portfolio | | 0 | | 0 | | 4,124 | | 3,985 | | 1,115 | | 1,138 |
To MFS Total Return Portfolio | | 0 | | 0 | | 4,124 | | 3,985 | | 2,815 | | 1,138 |
To MFS Utilities Portfolio | | 0 | | 0 | | 4,124 | | 3,985 | | 2,815 | | 1,138 |
To MFS Value Portfolio | | 0 | | 0 | | 4,124 | | 3,985 | | 2,815 | | 1,138 |
Total fees billed by Deloitte To above Funds: | | 0 | | 0 | | 116,776 | | 108,410 | | 63,250 | | 34,140 |
To MFS and MFS Related Entities of MFS Blended Research Core Equity Portfolio* | | 1,256,504 | | 1,189,135 | | 0 | | 0 | | 223,140 | | 366,217 |
| | | | | | | | | | | | |
To MFS and MFS Related Entities of MFS Blended Research Growth Portfolio*+ | | 1,256,504 | | 1,189,135 | | 0 | | 0 | | 223,140 | | 366,217 |
To MFS and MFS Related Entities of MFS Blended Research Value Portfolio*+ | | 1,256,504 | | 1,189,135 | | 0 | | 0 | | 223,140 | | 366,217 |
To MFS and MFS Related Entities of MFS Bond Portfolio* | | 1,256,504 | | 1,189,135 | | 0 | | 0 | | 223,140 | | 366,217 |
To MFS and MFS Related Entities of MFS Capital Appreciation Portfolio* | | 1,256,504 | | 1,189,135 | | 0 | | 0 | | 223,140 | | 366,217 |
To MFS and MFS Related Entities of MFS Core Equity Portfolio* | | 1,256,504 | | 1,189,135 | | 0 | | 0 | | 223,140 | | 366,217 |
To MFS and MFS Related Entities of MFS Emerging Growth Portfolio* | | 1,256,504 | | 1,189,135 | | 0 | | 0 | | 223,140 | | 366,217 |
To MFS and MFS Related Entities of MFS Emerging Markets Equity Portfolio* | | 1,256,504 | | 1,189,135 | | 0 | | 0 | | 223,140 | | 366,217 |
To MFS and MFS Related Entities of MFS Global Governments Portfolio* | | 1,256,504 | | 1,189,135 | | 0 | | 0 | | 223,140 | | 366,217 |
To MFS and MFS Related Entities of MFS Global Growth Portfolio* | | 1,256,504 | | 1,189,135 | | 0 | | 0 | | 223,140 | | 366,217 |
To MFS Global Total Return Portfolio, MFS and MFS Related Entities# | | 1,256,504 | | 1,189,135 | | 0 | | 0 | | 223,140 | | 366,217 |
To MFS and MFS Related Entities of MFS Government Securities Portfolio* | | 1,256,504 | | 1,189,135 | | 0 | | 0 | | 223,140 | | 366,217 |
To MFS and MFS Related Entities of MFS High Yield Portfolio* | | 1,256,504 | | 1,189,135 | | 0 | | 0 | | 223,140 | | 366,217 |
To MFS and MFS Related Entities of MFS International Growth Portfolio* | | 1,256,504 | | 1,189,135 | | 0 | | 0 | | 223,140 | | 366,217 |
To MFS and MFS Related Entities of MFS International Value Portfolio* | | 1,256,504 | | 1,189,135 | | 0 | | 0 | | 223,140 | | 366,217 |
To MFS and MFS Related Entities of MFS Massachusetts Investors Growth Stock Portfolio* | | 1,256,504 | | 1,189,135 | | 0 | | 0 | | 223,140 | | 366,217 |
To MFS and MFS Related Entities of MFS Mid Cap Growth Portfolio* | | 1,256,504 | | 1,189,135 | | 0 | | 0 | | 223,140 | | 366,217 |
| | | | | | | | | | | | |
To MFS and MFS Related Entities of MFS Mid Cap Value Portfolio* | | 1,256,504 | | 1,189,135 | | 0 | | 0 | | 223,140 | | 366,217 |
To MFS and MFS Related Entities of MFS Money Market Portfolio* | | 1,256,504 | | 1,189,135 | | 0 | | 0 | | 223,140 | | 366,217 |
To MFS and MFS Related Entities of MFS New Discovery Portfolio* | | 1,256,504 | | 1,189,135 | | 0 | | 0 | | 223,140 | | 366,217 |
To MFS and MFS Related Entities of MFS Research International Portfolio* | | 1,256,504 | | 1,189,135 | | 0 | | 0 | | 223,140 | | 366,217 |
To MFS and MFS Related Entities of MFS Research Portfolio* | | 1,256,504 | | 1,189,135 | | 0 | | 0 | | 223,140 | | 366,217 |
To MFS and MFS Related Entities of MFS Strategic Income Portfolio* | | 1,256,504 | | 1,189,135 | | 0 | | 0 | | 223,140 | | 366,217 |
To MFS and MFS Related Entities of MFS Strategic Value Portfolio* | | 1,256,504 | | 1,189,135 | | 0 | | 0 | | 223,140 | | 366,217 |
To MFS and MFS Related Entities of MFS Technology Portfolio* | | 1,256,504 | | 1,189,135 | | 0 | | 0 | | 223,140 | | 366,217 |
To MFS and MFS Related Entities of MFS Total Return Portfolio* | | 1,256,504 | | 1,189,135 | | 0 | | 0 | | 223,140 | | 366,217 |
To MFS and MFS Related Entities of MFS Utilities Portfolio* | | 1,256,504 | | 1,189,135 | | 0 | | 0 | | 223,140 | | 366,217 |
To MFS and MFS Related Entities of MFS Value Portfolio* | | 1,256,504 | | 1,189,135 | | 0 | | 0 | | 223,140 | | 366,217 |
Aggregate fees for non-audit services:
| | | | | | |
| | | 2008 | | | | 2007 |
To MFS Blended Research Core Equity Portfolio, MFS and MFS Related Entities# | | 1,536,408 | | | | 1,772,850 |
To MFS Blended Research Growth Portfolio, MFS and MFS Related Entities# | | 1,537,060 | | | | 1,771,265 |
To MFS Blended Research Value Portfolio, MFS and MFS Related Entities# | | 1,537,060 | | | | 1,771,265 |
| | | | | | |
To MFS Bond Portfolio, MFS and MFS Related Entities# | | 1,537,673 | | | | 1,772,850 |
To MFS Capital Appreciation Portfolio, MFS and MFS Related Entities# | | 1,534,708 | | | | 1,772,850 |
To MFS Core Equity Portfolio, MFS and MFS Related Entities# | | 1,536,408 | | | | 1,772,850 |
To MFS Emerging Growth Portfolio, MFS and MFS Related Entities# | | 1,534,708 | | | | 1,772,850 |
To MFS Emerging Markets Equity Portfolio, MFS and MFS Related Entities# | | 1,536,408 | | | | 1,772,850 |
To MFS Global Governments Portfolio, MFS and MFS Related Entities# | | 1,534,708 | | | | 1,772,850 |
To MFS Global Growth Portfolio MFS and MFS Related Entities# | | 1,536,408 | | | | 1,772,850 |
To MFS Global Total Return Portfolio, MFS and MFS Related Entities# | | 1,536,408 | | | | 1,772,850 |
To MFS Government Securities Portfolio, MFS and MFS Related Entities# | | 1,536,408 | | | | 1,772,850 |
To MFS High Yield Portfolio, MFS and MFS Related Entities# | | 1,538,708 | | | | 1,772,850 |
To MFS International Growth Portfolio, MFS and MFS Related Entities# | | 1,536,408 | | | | 1,772,850 |
To MFS International Value Portfolio, MFS and MFS Related Entities# | | 1,536,408 | | | | 1,772,850 |
To MFS Massachusetts Investors Growth Stock Portfolio, MFS and MFS Related Entities# | | 1,534,708 | | | | 1,772,850 |
To MFS Mid Cap Growth Portfolio, MFS and MFS Related Entities# | | 1,534,708 | | | | 1,772,850 |
To MFS Mid Cap Value Portfolio, MFS and MFS Related Entities# | | 1,534,708 | | | | 1,772,850 |
To MFS Money Market Portfolio, MFS and MFS Related Entities# | | 1,534,708 | | | | 1,772,850 |
| | | | | | |
To MFS New Discovery Portfolio, MFS and MFS Related Entities# | | 1,534,708 | | | | 1,772,850 |
To MFS Research International Portfolio, MFS and MFS Related Entities# | | 1,536,408 | | | | 1,772,850 |
To MFS Research Portfolio, MFS and MFS Related Entities# | | 1,534,708 | | | | 1,772,850 |
To MFS Strategic Income Portfolio, MFS and MFS Related Entities# | | 1,535,973 | | | | 1,772,850 |
To MFS Strategic Value Portfolio, MFS and MFS Related Entities# | | 1,534,708 | | | | 1,772,850 |
To MFS Technology Portfolio, MFS and MFS Related Entities# | | 1,534,708 | | | | 1,772,850 |
To MFS Total Return Portfolio, MFS and MFS Related Entities# | | 1,536,408 | | | | 1,772,850 |
To MFS Utilities Portfolio, MFS and MFS Related Entities# | | 1,536,408 | | | | 1,772,850 |
To MFS Value Portfolio, MFS and MFS Related Entities# | | 1,536,408 | | | | 1,772,850 |
| + | This Fund commenced investment operations on December 19, 2007. |
| * | This amount reflects the fees billed to MFS and MFS Related Entities for non-audit services relating directly to the operations and financial reporting of the Funds (portions of which services also related to the operations and financial reporting of other funds within the MFS Funds complex). |
| # | This amount reflects the aggregate fees billed by Deloitte for non-audit services rendered to the Funds and for non-audit services rendered to MFS and the MFS Related Entities. |
1 | The fees included under “Audit-Related Fees” are fees related to assurance and related services that are reasonably related to the performance of the audit or review of financial statements, but not reported under “Audit Fees,” including accounting consultations, agreed-upon procedure reports, attestation reports, comfort letters and internal control reviews. |
2 | The fees included under “Tax Fees” are fees associated with tax compliance, tax advice and tax planning, including services relating to the filing or amendment of federal, state or local income tax returns, regulated investment company qualification reviews and tax distribution and analysis. |
3 | The fees included under “All Other Fees” are fees for products and services provided by Deloitte other than those reported under “Audit Fees,” “Audit-Related Fees” and “Tax Fees”, including fees for services related to sales tax refunds, consultation on internal cost allocations, consultation on allocation of monies pursuant to an administrative proceeding regarding disclosure of brokerage allocation practices in connection with fund sales, and analysis of certain portfolio holdings verses investment styles. |
Item 4(e)(1):
Set forth below are the policies and procedures established by the Audit Committee of the Board of Trustees relating to the pre-approval of audit and non-audit related services:
To the extent required by applicable law, pre-approval by the Audit Committee of the Board is needed for all audit and permissible non-audit services rendered to the Funds and all permissible non-audit services rendered to MFS or MFS Related Entities if the services relate directly to the operations and financial reporting of the Registrant. Pre-approval is currently on an engagement-by-engagement basis. In the event pre-approval of such services is necessary between regular meetings of the Audit Committee and it is not practical to wait to seek pre-approval at the next regular meeting of the Audit Committee, pre-approval of such services may be referred to the Chair of the Audit Committee for approval; provided that the Chair may not pre-approve any individual engagement for such services exceeding $50,000 or multiple engagements for such services in the aggregate exceeding $100,000 in each period between regular meetings of the Audit Committee. Any engagement pre-approved by the Chair between regular meetings of the Audit Committee shall be presented for ratification by the entire Audit Committee at its next regularly scheduled meeting.
Item 4(e)(2):
None, or 0%, of the services relating to the Audit-Related Fees, Tax Fees and All Other Fees paid by the Fund and MFS and MFS Related Entities relating directly to the operations and financial reporting of the Registrant disclosed above were approved by the audit committee pursuant to paragraphs (c)(7)(i)(C) of Rule 2-01 of Regulation S-X (which permits audit committee approval after the start of the engagement with respect to services other than audit, review or attest services, if certain conditions are satisfied).
Item 4(f): Not applicable.
Item 4(h): The Registrant’s Audit Committee has considered whether the provision by a Registrant’s independent registered public accounting firm of non-audit services to MFS and MFS Related Entities that were not pre-approved by the Committee (because such services did not relate directly to the operations and financial reporting of the Registrant) was compatible with maintaining the independence of the independent registered public accounting firm as the Registrant’s principal auditors.
| ITEM 5. | AUDIT COMMITTEE OF LISTED REGISTRANTS. |
Not applicable to the Registrant.
| ITEM 6. | SCHEDULE OF INVESTMENTS |
A schedule of investments of the Registrant is included as part of the report to shareholders of such series under Item 1 of this Form N-CSR.
| ITEM 7. | DISCLOSURE OF PROXY VOTING POLICIES AND PROCEDURES FOR CLOSED-END MANAGEMENT INVESTMENT COMPANIES. |
Not applicable to the Registrant.
| ITEM 8. | PORTFOLIO MANAGERS OF CLOSED-END MANAGEMENT INVESTMENT COMPANIES. |
Not applicable to the Registrant.
| ITEM 9. | PURCHASES OF EQUITY SECURITIES BY CLOSED-END MANAGEMENT INVESTMENT COMPANY AND AFFILIATED PURCHASERS. |
Not applicable to the Registrant.
| ITEM 10. | SUBMISSION OF MATTERS TO A VOTE OF SECURITY HOLDERS. |
There were no material changes to the procedures by which shareholders may send recommendations to the Board for nominees to the Registrant’s Board since the Registrant last provided disclosure as to such procedures in response to the requirements of Item 407 (c)(iv) of Regulation S-K or this Item.
| ITEM 11. | CONTROLS AND PROCEDURES. |
| (a) | Based upon their evaluation of the effectiveness of the registrant’s disclosure controls and procedures (as defined in Rule 30a-3(c) under the Investment Company Act of 1940 (the “Act”)) as conducted within 90 days of the filing date of this report on Form N-CSR, the registrant’s principal financial officer and principal executive officer have concluded that those disclosure controls and procedures provide reasonable assurance that the material information required to be disclosed by the registrant on this report is recorded, processed, summarized and reported within the time periods specified in the Securities and Exchange Commission’s rules and forms. |
| (b) | There were no changes in the registrant’s internal controls over financial reporting (as defined in Rule 30a-3(d) under the Act) that occurred during the second fiscal quarter of the period covered by the report that have materially affected, or are reasonably likely to materially affect, the registrant’s internal control over financial reporting. |
| (a) | File the exhibits listed below as part of this form. Letter or number the exhibits in the sequence indicated. |
| | (1) | Any code of ethics, or amendment thereto, that is the subject of the disclosure required by Item 2, to the extent that the registrant intends to satisfy the Item 2 requirements through filing of an exhibit: Code of Ethics attached hereto. |
| | (2) | A separate certification for each principal executive officer and principal financial officer of the registrant as required by Rule 30a-2 under the Act (17 CFR 270.30a-2): Attached hereto. |
| (b) | If the report is filed under Section 13(a) or 15(d) of the Exchange Act, provide the certifications required by Rule 30a-2(b) under the Act (17 CFR 270.30a-2(b)), Rule 13a-14(b) or Rule 15d-14(b) under the Exchange Act (17 CFR 240.13a-14(b) or 240.15d-14(b)) and Section 1350 of Chapter 63 of Title 18 of the United States Code (18 U.S.C. 1350) as an exhibit. A certification furnished pursuant to this paragraph will not be deemed “filed” for the purposes of Section 18 of the Exchange Act (15 U.S.C. 78r), or otherwise subject to the liability of that section. Such certification will not be deemed to be incorporated by reference into any filing under the Securities Act of 1933 or the Exchange Act, except to the extent that the registrant specifically incorporates it by reference: Attached hereto. |
Notice
A copy of the Amended and Restated Declaration of Trust, as amended, of the Registrant is on file with the Secretary of State of The Commonwealth of Massachusetts and notice is hereby given that this instrument is executed on behalf of the Registrant by an officer of the Registrant as an officer and not individually and the obligations of or arising out of this instrument are not binding upon any of the Trustees or shareholders individually, but are binding only upon the assets and property of the respective constituent series of the Registrant.
SIGNATURES
Pursuant to the requirements of the Securities Exchange Act of 1934 and the Investment Company Act of 1940, the registrant has duly caused this report to be signed on its behalf by the undersigned, thereunto duly authorized.
(Registrant) MFS VARIABLE INSURANCE TRUST II
| | |
| By (Signature and Title)* | | MARIA F. DWYER |
| | Maria F. Dwyer, President |
Date: February 19, 2009
Pursuant to the requirements of the Securities Exchange Act of 1934 and the Investment Company Act of 1940, this report has been signed below by the following persons on behalf of the registrant and in the capacities and on the dates indicated.
| | |
| By (Signature and Title)* | | MARIA F. DWYER |
| | Maria F. Dwyer, President (Principal Executive Officer) |
Date: February 19, 2009
| | |
| By (Signature and Title)* | | JOHN M. CORCORAN |
| | John M. Corcoran, Treasurer (Principal Financial Officer and Accounting Officer) |
Date: February 19, 2009
| * | Print name and title of each signing officer under his or her signature. |